UNITED STATES
SECURITIES AND EXCHANGE COMMISSION
Washington, D.C. 20549
FORM N-CSR
CERTIFIED SHAREHOLDER REPORT OF REGISTERED
MANAGEMENT INVESTMENT COMPANIES
Investment Company Act file number | 811-08243 |
|
Direxion Funds |
(Exact name of registrant as specified in charter) |
|
1301 Avenue of the Americas (6th Ave.), 35th Floor New York , NY | | 10019 |
(Address of principal executive offices) | | (Zip code) |
|
1301 Avenue of the Americas (6th Ave.), 35th Floor New York , NY 10019 |
(Name and address of agent for service) |
|
Registrant’s telephone number, including area code: | 646-572-3390 | |
|
Date of fiscal year end: | August 31, 2015 | |
|
Date of reporting period: | August 31, 2015 | |
| | | | | | | | |
Item 1. Report to Stockholders.

ANNUAL REPORT AUGUST 31, 2015
1301 Avenue of the Americas (6th Ave.), 35th Floor New York, New York 10019 www.direxioninvestments.com
DOMESTIC EQUITY INDEX FUNDS
| Direxion Monthly NASDAQ-100® Bull 2X Fund (DXQLX) | | | | | |
| Direxion Monthly S&P 500® Bull 2X Fund (DXSLX) | | Direxion Monthly S&P 500® Bear 2X Fund (DXSSX) | |
| Direxion Monthly Small Cap Bull 2X Fund (DXRLX) | | Direxion Monthly Small Cap Bear 2X Fund (DXRSX) | |
FIXED INCOME FUNDS
| Direxion Monthly 7-10 Year Treasury Bull 2X Fund (DXKLX) | | Direxion Monthly 7-10 Year Treasury Bear 2X Fund (DXKSX) | |
| Direxion Dynamic HY Bond Fund (PDHYX) | | | | | |
INTERNATIONAL FUNDS
Direxion Monthly China Bull 2X Fund (DXHLX)
Direxion Monthly Emerging Markets Bull 2X Fund (DXELX)
Direxion Monthly Latin America Bull 2X Fund (DXZLX)
SPECIALTY FUNDS
Direxion Monthly Natural Resources Bull 2X Fund (DXCLX)
Letter to Shareholders | | | 4 | | |
| Performance Summary | | | 12 | | |
| Expense Example | | | 24 | | |
| Allocation of Portfolio Holdings | | | 26 | | |
| Schedules of Investments | | | 27 | | |
| Statements of Assets and Liabilities | | | 39 | | |
| Statements of Operations | | | 43 | | |
| Statements of Changes in Net Assets | | | 47 | | |
| Financial Highlights | | | 54 | | |
| Notes to the Financial Statements | | | 56 | | |
Report of Independent Registered Public
Accounting Firm | | | 72 | | |
| Supplemental Information (Unaudited) | | | 73 | | |
Investment Advisory Agreement
Approval (Unaudited) | | | 74 | | |
| Trustees and Officers | | | 77 | | |
Help Preserve the Environment – Go Green!
Go paperless with Direxion e-Delivery – a service allowing shareholders to reduce clutter with full online access to regulatory documents. Begin the preservation process with e-delivery.
With Direxion e-Delivery you can:
• Receive email notifications when your most recent shareholder communications are available for review.
• Access prospectuses, annual reports and semiannual reports online.
It's easy to enroll:
1. Visit www.direxioninvestments.com/edelivery
2. Follow the simple enrollment instructions
If you have questions about Direxion e-Delivery services, contact one of our shareholder representatives at 800-851-0511.


Dear Shareholders,
This Annual Report for the Direxion Funds (the "Funds") covers the period from September 1, 2014 to August 31, 2015 (the "Annual Period").
Fund Operational Review:
The Funds are leveraged and seek to provide a calendar month return of 200% or -200% of the calendar month performance of a particular benchmark ("Leveraged Funds"), with the exception of the Direxion Dynamic HY Bond Fund, which creates investment exposure of 120% of the value of the Fund's assets, rebalancing the Fund's portfolio monthly to maintain the target exposure. The term "calendar month" refers to the period from the close of the markets on the last business day of a given calendar month, until the close of the markets on the last business day of the subsequent calendar month. The Funds seek calendar month leveraged investment results which should not be equated with seeking a leveraged goal for shorter than a calendar month. An investor who purchases shares on a day other than the last business day of a calendar month will generally receive more, or less, than 200% exposure to the target index, depending on the performance of the target index. If a Fund's shares are held through the end of a calendar month or months, the Fund's performance is likely to deviate from the multiple of the benchmark performance for the longer period. Similarly, the return for investors investing for periods less than a calendar month, or for a period different than the calendar month, will likely deviate from the multiple of the benchmark performance for such shorter periods. The Funds are not suitable for all investors and should be utilized only by sophisticated investors who understand leverage risk, consequences of seeking calendar month leverage investment results and intend to actively monitor and manage their investments.
The Funds with the word "Bull" in their name attempt to provide investment results that correlate to 200% of the return of an index or benchmark, meaning the Bull Funds attempt to move in the same direction as the target index or benchmark. The Funds with the word "Bear" in its name attempts to provide investment results that correlate to -200% of the return of an index or benchmark, meaning that a Bear Fund attempts to move in the opposite or inverse direction of the target index or benchmark.
In seeking to achieve each Leveraged Fund's calendar month investment objective, Rafferty Asset Management ("Rafferty" or the "Adviser") uses statistical and quantitative analysis to determine the investments each Fund makes and the techniques it employs. Rafferty relies upon a pre-determined model to generate orders resulting in repositioning each Fund's investments in accordance with its calendar month investment objective. Using this approach, Rafferty determines the type, quantity and mix of investment positions it believes in combination should produce calendar month returns consistent with a Fund's objective. As a consequence, if a Leveraged Fund is performing as designed, the return of the index or benchmark will dictate the return for that Fund. Each Leveraged Fund pursues its investment objective regardless of market conditions and does not take defensive positions.
Each Leveraged Fund has a clearly articulated goal which requires the Fund to seek economic exposure in excess of its net assets. To meet its objectives, each Leveraged Fund invests in some combination of financial instruments so it generates economic exposure consistent with the Fund's investment objective. Financial instruments may include ETFs, stock index futures contracts, options on securities and stock indices and swap agreements. Each Leveraged Fund invests significantly in swap agreements. Rafferty uses these types of investments to produce economically "leveraged" investment results. Leveraging allows Rafferty to generate a greater positive or negative return than what would be generated on the invested capital without leverage, thus changing small market movements into larger changes in the value of the investments of a Fund.
The Funds may use certain investment techniques, including investments in derivatives, which may be considered aggressive. Investments in derivatives in general are subject to market risks that may cause their prices to fluctuate over time. Additionally, such instruments may experience potentially dramatic price changes (losses) and imperfect correlations between the price of the contract and the underlying security or index which will increase the volatility of the Funds and may involve a small investment of cash relative to the magnitude of the risk assumed. The use of derivatives may expose the Funds to additional risks that they would not be subject to if they invested directly in the securities underlying those derivatives. The use of derivatives may result in larger losses or smaller gains than otherwise would be the case.
DIREXION ANNUAL REPORT
4
The discussion below relates to the performance of the Funds for their respective period. The Leveraged Funds seek to provide calendar month returns which are a multiple – positive or negative – of the calendar month performance of a particular benchmark. The performance of the Leveraged Funds for their respective period is important for understanding whether these Funds meet their investment goals. A Leveraged Fund meeting its calendar month investment objective should have performance for the period similar to the performance indicated by models based on the calendar month returns of the relevant benchmark for the period. Direxion maintains models indicating the expected performance of each Fund in light of the path of the relevant benchmark. The models, and a description of how they work, are available on the Direxion website (www.direxioninvestments.com) under Tools/Tracking Center. The models do not take into account the size of a Fund, the Fund's expense ratio or any transaction fees associated with creating a Fund's portfolio. A brief comparison of the actual returns versus the expected returns for each of the Funds in this Annual Report follows.
Fund Performance Review:
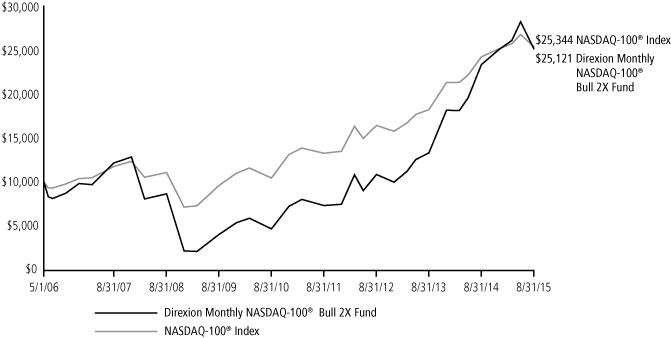
The Direxion Monthly NASDAQ-100® Bull 2X Fund sought to provide 200% of the calendar month return of the NASDAQ-100® Index. The NASDAQ-100® Index is a capitalization-weighted index composed of 100 of the largest non-financial domestic and international companies listed on the National Market tier of the NASDAQ National Market. All companies listed on the index have an average daily trading volume of at least 200,000 shares. The NASDAQ-100 Funds are not sponsored, endorsed, sold, or promoted by the NASDAQ National Market and the NASDAQ National Market makes no representations regarding the advisability of investing in the Fund. For the Annual Period, The NASDAQ-100® Index returned 4.70%. Given the calendar month investment objectives of the Fund and the path dependency of returns for longer periods, the return of the index alone should not generate expectations of performance of the Fund. The Direxion Monthly NASDAQ-100® Bull 2X Fund returned 7.68%, while the model indicated an expected return of 10.34%.
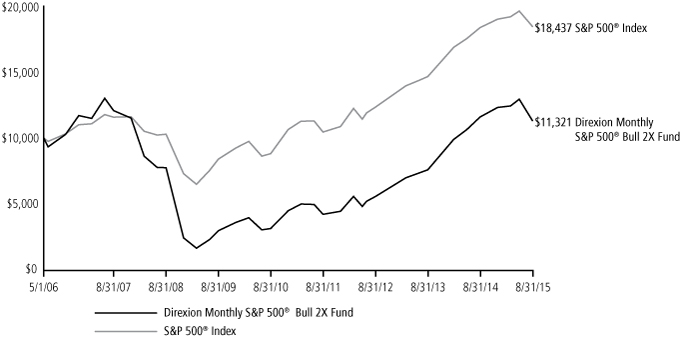
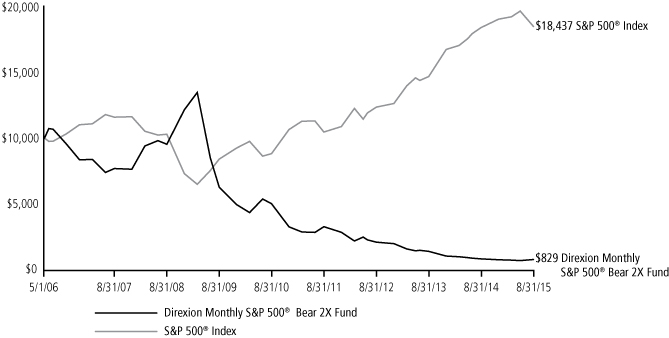
The Direxion Monthly S&P 500® Bull 2X Fund and the Direxion Monthly S&P 500® Bear 2X Fund sought to provide 200% and -200% of the calendar month return of the S&P 500® Index, respectively. The S&P 500® Index is a capitalization-weighted index composed of 500 domestic common stocks. Standard & Poor's® selects the 500 stocks comprising the Index on the basis of market values and industry diversification. Most of the stocks in the Index are issued by the 500 largest companies, in terms of the aggregate market value of their outstanding stock, and generally are listed on the New York Stock Exchange. The companies included in the index have an average market capitalization of more than $39.30 billion dollars and a median market capitalization of $18.11 billion dollars as of June 30, 2015. For the Annual Period, the S&P 500® Index returned 0.48%. Given the calendar month investment objectives of the Funds and the path dependency of returns for longer periods, the return of the Index alone should not generate expectations of performance of the Funds. The Direxion Monthly S&P 500® Bull 2X Fund returned -2.40%, while the model indicated an expected return of -0.13%. The Direxion Monthly S&P 500® Bear 2X Fund returned -5.53%, while the model indicated an expected return of -4.07%.
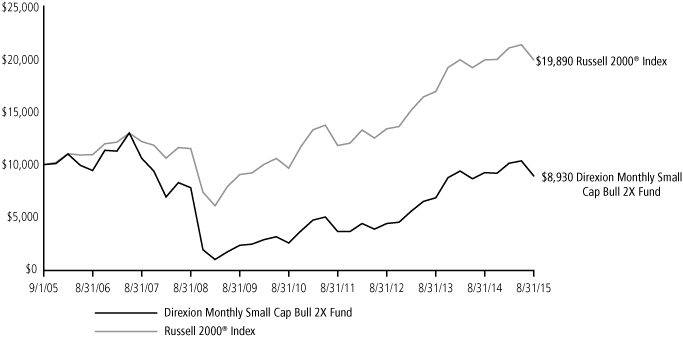
The Direxion Monthly Small Cap Bull 2X Fund and the Direxion Monthly Small Cap Bear 2X Fund sought to provide 200% and -200% of the calendar month return of the Russell 2000® Index. The Russell 2000® Index measures the performance of the small-cap segment of the U.S. equity universe and is comprised of the smallest 2000 companies in the Russell 3000® Index, representing approximately 10% of the total market capitalization of that index. It includes approximately 2000 of the smallest securities based on a combination of their market cap and current index membership. The companies included in the index have an average market capitalization of more than $1.13 billion dollars and a median market capitalization of $818.20 million dollars as of June 30, 2015. For the Annual Period, the Russell 2000® Index returned 0.03%. Given the calendar month investment objectives of the Funds and the path dependency of returns for longer periods, the annual return of the index alone should not generate expectations of annual performance of the Funds. The Direxion Monthly Small Cap Bull 2X Fund returned -3.34%, while the model indicated an expected return of -1.83%. The Direxion Monthly Small Cap Bear 2X Fund returned -8.69%, while the model indicated an expected return of -5.63%.
The Direxion Monthly 7-10 Year Treasury Bull 2X Fund and the Direxion Monthly 7-10 Year Treasury Bear 2X Fund sought to provide 200% and -200% of the calendar month return of the NYSE 7-10 Year Treasury Bond Index. The NYSE 7-10 Year Treasury Bond Index is a multiple-security fixed income index that aims to track the total returns of the intermediate 7 to 10 year maturity range of the U.S. Treasury bond market. The index constituent bonds are weighted by their relative amounts outstanding. For the Annual Period, the NYSE 7-10 Year Treasury Bond Index returned 3.41%. Given the calendar
DIREXION ANNUAL REPORT
5
month investment objectives of the Funds and the path dependency of returns for longer periods, the annual return of the index alone should not generate expectations of annual performance of the Funds. The Direxion Monthly 7-10 Year Treasury Bull 2X Fund returned 4.09%, while the model indicated an expected return of 6.59%. The Direxion Monthly 7-10 Year Treasury Bear 2X Fund returned -9.96%, while the model indicated an expected return of -7.42%
The Direxion Monthly China Bull 2X Fund sought to provide 200% of the calendar month return of the FTSE China 50 Index. The FTSE China 50 Index consists of the 50 largest and most liquid Chinese companies currently trading on the Hong Kong Stock Exchange (SEHK). Securities in the Index are weighted based on the total market value of their shares, so that securities with higher total market values will generally have a higher representation in the Index. Index constituents are screened for liquidity and weightings and are capped to prevent the Index from being overly concentrated in any one stock. As of June 30, 2015, the Index is concentrated in the financial, energy, technology and telecommunication sectors, but this concentration may change in the future based on the Index's methodology and the varying nature of China's economy. The Fund will concentrate its investment (i.e., hold 25% or more of its total assets in the stocks of a particular industry or group of industries) in a particular industry or group of industries to approximately the same extent as the Index is so concentrated. For the Annual Period, the FTSE China 50 Index returned -8.68%. Given the calendar month investment objectives of the Fund and the path dependency of returns for longer periods, the annual return of the index alone should not generate expectations of annual performance of the Fund. The Direxion Monthly China Bull 2X Fund returned -25.05%, while the model indicated an expected return of -23.95%.
The Direxion Monthly Emerging Markets Bull 2X Fund sought to provide 200% of the calendar month return of the MSCI Emerging Markets IndexSM. The MSCI Emerging Markets IndexSM is a free float-adjusted market capitalization index that is designed to measure equity market performance in the global emerging markets. As of June 30, 2015 the Index consisted of the following 25 emerging market country indices: Brazil, Chile, China, Colombia, Czech Republic, Egypt, Greece, Hong Kong, Hungary, India, Indonesia, Malaysia, Malta, Mexico, Peru, Philippines, Poland, Qatar, Russia, South Africa, South Korea, Taiwan, Thailand, Turkey, and UAE. For the Annual Period, the MSCI Emerging Markets IndexSM returned -24.74%. Given the calendar month investment objectives of the Fund and the path dependency of returns for longer periods, the annual return of the index alone should not generate expectations of annual performance of the Fund. The Direxion Monthly Emerging Markets Bull 2X Fund returned -45.54%, while the model indicated an expected return of -43.03%.
The Direxion Monthly Latin America Bull 2X Fund sought to provide 200% of the calendar month return of the S&P® Latin America 40 Index. The S&P Latin America 40 Index is an equity index drawn from five major Latin American markets: Brazil, Mexico, Chile, Colombia, and Peru. It is designed for investors seeking broad market exposure through an index that is efficient to replicate. The index constituents are leading, large, liquid, blue chip companies from the Latin American markets and capturing 70% of their total market capitalization. The index constituents are leading, large, liquid companies from the Latin American markets with an average market capitalization of $20.19 billion and a median market capitalization of $11.75 billion as of June 30, 2015. For the Annual Period, the S&P® Latin America 40 Index returned -40.86%. Given the calendar month investment objectives of the Fund and the path dependency of returns for longer periods, the return of the Index alone should not generate expectations of performance of the Fund. The Direxion Monthly Latin America Bull 2X Fund returned -69.61%, while the model indicated an expected return of -68.31%.
The Direxion Monthly Natural Resources Bull 2X Fund sought to provide 200% of the calendar month return of the S&P North American Natural Resources Sector Index. The Index is a modified-capitalization weighted equity index containing U.S. traded stocks of natural resource related companies in the United States and Canada. The stocks are selected from a universe of U.S. traded stocks that are classified under the GICS® energy and materials sectors, excluding stocks in the chemical and steel sub-industry. The Index rebalances semi-annually, in June and December. As of June 30, 2015, there were 142 index constituents with a median market capitalization of $5.30 billion. For the Annual Period, the S&P North American Natural Resources Sector Index returned -34.00%. Given the calendar month investment objectives of the Fund and the path dependency of returns for longer periods, the annual return of the index alone should not generate expectations of annual performance of the Fund. The Direxion Monthly Natural Resources Bull 2X Fund returned -59.61%, while the model indicated an expected return of -58.39%.
DIREXION ANNUAL REPORT
6
The Dynamic HY Bond Fund sought to maximize total return (income plus capital appreciation) by investing primarily in debt instruments with an emphasis on lower-quality debt. The Fund utilizes investments in high yield Exchange Traded Funds ("ETFs") as a means of obtaining liquid exposure to the domestic high yield debt market, and retains the flexibility to invest in physical bonds as well as derivatives and financial instruments linked to lower rated fixed income securities. Typically, the Fund will have 85-100% of the portfolio invested in such high yield ETFs. The Fund will seek leveraged returns by investing in derivatives, such as futures contracts, forward contracts and swaps, which can include swaps on debt instruments, ETFs and mutual funds. Leveraging generates returns that are more pronounced, both positively and negatively, than what would be generated on the invested capital without leverage, thus changing small market movements into larger changes in the value of the investments. The Dynamic HY Bond Fund returned -7.75% during the period.
The last quarter of 2014 was marked by volatility and uncertainty in the high yield markets, with a slight feeling of hopeful bullishness behind steady economic growth, a rebound in crude prices and the ongoing demand for yield. For this period, the iBoxx Liquid High Yield Index fell -2.72% and the Barclays High Yield Index fell -3.59%, while the domestic broad market, as measured by the S&P 500, gained 3.45% on a total return basis. High yield debt issuance has been on a somewhat steady downtrend since 2012, with that trend continuing in 2015. The high yield space started 2015 with lessened volatility and positive returns; by the end of May, the BofA Merrill Lynch U.S. High Yield (H0A0) Index had returned a steady 4.06%. This was ahead of most major asset classes. The strong early performance was largely due to the oversold conditions at year end 2014, but the continued upside was not surprising with the 6.26% rebound in crude prices since the start of 2015 through the end of May 2015. Unfortunately June, July, and August marked three straight months of negative returns for the high yield asset class. Despite the selloff, however, the high yield asset class outperformed other risky assets, as the S&P 500 fell -5.92% over the final three months of the Annual Period. The last portion of the Annual Period was marked by uncertainty, as the Chinese Yuan devaluation and the resulting correction in Chinese equity markets headlined views of the potential slowdown in global economic growth. Crude prices fell -20.23% from June to August, and volatility has returned. Headwinds remain for the asset class with concerns over the global economy and the looming lift from zero rates from the Federal Reserve.
Factors Affecting Fund Performance:
Benchmark Performance: The calendar month performance of each Fund's benchmark index, and the factors and market conditions implicitly affecting that index, are the primary factors driving Fund performance. Given the calendar month goals, the series of calendar month index returns are most important. The market conditions affecting the benchmark indexes during the past year are described below.
Leverage: Each Fund seeks calendar month investment results (before fees and expenses) of either 200% (for the Bull Funds) or -200% (for the Bear Funds) of the performance of its respective underlying index. The use of leverage magnifies a Fund's gains or losses and increases the investment's risk and volatility.
Volatility and Compounding: The goal of leveraged funds is to provide a multiple of the calendar month returns of an underlying index. Over periods longer or shorter than a calendar month, a Fund should not be expected to provide its respective multiple of the return of the underlying index. Due to the effects of compounding – a universal mathematical concept applying to all investments – returns of the Funds over longer periods will differ from the Fund's calendar month stated goal. Periods of high-volatility lacking a clear trend hurt a Fund's performance, while trending low-volatility markets enhance a Fund's performance.
Cost of Financing: In order to attain leveraged exposure, a Bull Fund incurs a cost of LIBOR1 plus a spread, and a Bear Fund receives LIBOR minus a spread as applied to the borrowed portion of the Fund's exposure. Financing costs create a drag on a Bull Fund's performance. Because LIBOR is very low, a Bear Fund receives a negligible amount of financing, or in the case of hard-to-borrow shares, might pay to finance its short position.
1 London Inter-Bank Offer Rate. The interest rate that the banks charge each other for loans (usually in Eurodollars). This rate is applicable to the short-term international interbank market, and applies to very large loans borrowed for anywhere from one day to five years.
DIREXION ANNUAL REPORT
7
Equity Dividends: A Bull Fund's performance is positively impacted by equity and index dividends, as the Funds receive those payments. A Bear Fund's performance is negatively impacted, as they are obligated to pay the dividends.
Fees, Expenses, and Transaction Costs: Fees and expenses are listed in each Fund's prospectus and may be larger than many traditional index funds' fees, causing a greater negative impact on Fund performance. Transactions costs are not included in the expense ratio of the Funds. Transaction costs can be higher due to the Fund's use of leverage, significant purchase and redemption activity by Fund shareholders; or trading securities that are comparatively less liquid.
Market Conditions Affecting Fund Performance:
A general review of economic conditions, market events and index performance for the period is described below.
Index Performance:
Over the Annual Period, Rafferty managed Funds of four different categories of indexes – broad market, international, natural resources and fixed income.
Rafferty managed five Funds benchmarked to broad equity market indexes; the index returns for the Annual Period are below. Broad based equity markets weathered several spikes in volatility over the Annual Period to end up being down only slightly. After closing below its 200-day moving average in October for the first time in nearly two years, the S&P Index rose to record highs. Fueled by surprising news of a Japanese stimulus program, U.S. markets staged a massive rally into December before giving back some of its gains. Also notable early on in the period, was the Federal Reserve Bank bringing an end to its Quantitative Easing program, citing improvements in the labor market and strengthening economic indicators. Concerns over global growth along with declining oil prices led to another spike in volatility which persisted through year end and was coupled with choppy market performance into the New Year. Strong economic data out of Europe along with allayed fears of Greek default were enough to send U.S. equity markets back into record-breaking mode into early March. Q2 2015 through the summer saw equity markets trading within a defined range amid uncertainty both abroad and at home. Positive factors like strong earnings and jobs numbers in the U.S. were muted by uncertainty over Greece, Oil and signs of a slowdown in Chinese markets. August brought about a massive spike in volatility as nearly two thirds of the stocks in the S&P 500 index entered correction territory. Weakness in markets abroad, specifically emerging markets, along with soft Chinese manufacturing data brought about a sharp selloff in U.S. stocks. At the end of the Annual Period, a strong rebound on the heels of positive Oil performance and continued signs of U.S. economic strength brought equity markets back to levels near where the period began.
S&P 500® Index | | | 0.48 | % | |
Russell 2000® Index | | | 0.03 | % | |
NASDAQ-100® Index | | | 4.70 | % | |
Rafferty managed three Funds benchmarked to an international index; the index returns for the Annual Period are below. Over the course of the annual period, emerging market stocks, as measured by the MSCI Emerging Markets IndexSM, lost -24.74%. Latin American stocks, as measured by the S&P Latin America 40 Index, dropped -40.86%. Chinese stocks, as measured by the FTSE China 50 TR Index, fell -8.68%. Over the last year, we have seen poor fundamental performances in major global markets, specifically major LATAM, Asian and EMEA Emerging Markets. It seems major geopolitical tensions from Russia-Ukraine and ISIS, combined with a sustained period of low commodity prices have taken its toll on emerging and international markets. Over the last six months, the Chinese market has fallen dramatically, led by a surprise currency devaluation, slowing industrial activity and the PBOC's inability to adapt its policies. Expectations for the first Federal Reserve's first rate hike have been pushed back yet again, from September 2015 to early 2016.
MSCI Emerging Markets IndexSM | | | -24.74 | % | |
FTSE China 50 Index | | | -8.68 | % | |
S&P® Latin America 40 Index | | | -40.86 | % | |
DIREXION ANNUAL REPORT
8
Rafferty managed one Fund benchmarked to a natural resources index; the index returns for the Annual Period are below. Commodities, as measured by the S&P North American Natural Resources Sector Index, lost -34% during the Annual Period. Commodities generally have an inverse relationship to a strengthening dollar, which continued to be the case throughout the period, especially from October of 2014 through March of 2015. Commodities saw further weakness in the second half of the annual period, declining -16% from June of 2015 through August of 2015. This decline can be attributed to a slowing global and Chinese economy. Chinese stock suffered greatly from June through August, the CSI 300 Index, a composition of 300 A-Share stocks, saw declines of -30%. If Chinese growth continues to slow, the demand for global commodities will weaken. Volatility was strong in commodities throughout August of 2015, bouncing off the lows of the year on the 25th to climb almost 12% through the end of the period.
S&P North American Natural Resources Sector Index | | | -34.00 | % | |
Rafferty managed two Funds benchmarked to a fixed income index; the index returns for the Annual Period are below. Fixed Income markets began, and ended, the Annual Period amid an environment of uncertainty over potential Federal Reserve Bank interest rate hikes. Returns for the period were positive to a tune of 3.41% as measured by the NYSE 7-10 Year Treasury Bond Index (AXSVTN Index). Prices rose early in the period after commentary from Chairwoman Yellen that the Federal Reserve would remain patient with regard to any potential rise in interest rates. Weakness in crude oil prices was a favorable contributing factor for fixed income markets as it helped to contain any rise in inflation. Into the New Year, renewed concerns over an uptick in inflation weighed on treasury markets as the probability of an interest rate increase became more likely. The ever-present interest rate hike fears and global growth concerns on the heels of a January rally for bonds made conditions ripe for a selloff in February. The March rebound could be attributed again to further commentary from the Federal Reserve after its two-day policy meeting that boosted confidence in a continued zero interest rate environment. April through June 2015 saw treasury yields rise on strong US economic data and a correction in European bond markets, particularly long duration German bonds. Summer months saw continued indecision from investors with treasury prices trending upward albeit in a hectic fashion. Period-end saw a selloff in bond prices amid a rebound in oil prices and a decision by China to lower is benchmark interest rate.
NYSE Current 7-10 Year Treasury Bond Index | | | 3.41 | % | |
Index Volatility:
In the last four months of 2014, the CBOE Volatility Index, which reflects a market estimate for future volatility, rose 60.27% as the S&P 500 gained 3.45% on a total return basis. While the VIX Index steadily returned to a calmer level of 15.29 by the end of March of 2015, the price action in broad domestic equity indexes preached caution. The VIX Index continued to remain calm through the end of July, falling -20.73% as the S&P 500 chopped higher (gaining 2.38% on a total return basis) and commodities fell (the Bloomberg Commodity Index fell -6.46%). With the central banks in the midst of its first rate hike since 2006 and concerns over global economic growth, uncertainty was evident, yet seemingly normal. On Friday, August 21st, and Monday, August 24th, the S&P 500 fell 6.98% to 1,893.21 while the VIX Index rose to 40.74 in two trading days. Declines in Asian and European stock markets, and in oil and other commodities, caused a rush into safety assets such as U.S. Treasury bonds, as well as a 91.79% increase in the VIX Index. It is worth mentioning that there was no real change in the outlook for interest rates in the U.S., and no real change in the outlook for corporate profits or economic growth compared to a week prior, when the S&P 500 closed at the week (8/17/2015) at 2,102.44 and the VIX Index closed at 13.02. The volatility story starts with China (the Shanghai Composite has fallen -31.69%), but has rippled into emerging markets, oil/commodity prices, and domestic equities. The volatility of each Index used as a benchmark for the Funds is below:
Benchmark | | One-Year Return
Period Ended
August 31, 2015 | | Annualized Volatility | |
S&P 500® Index | | | 0.48 | % | | | 14.21 | % | |
Russell 2000® Index | | | 0.03 | % | | | 16.15 | % | |
DIREXION ANNUAL REPORT
9
Benchmark | | One-Year Return
Period Ended
August 31, 2015 | | Annualized Volatility | |
NASDAQ-100® Index | | | 4.70 | % | | | 16.67 | % | |
MSCI Emerging Markets IndexSM | | | -24.74 | % | | | 19.32 | % | |
FTSE China 50 Index | | | -8.68 | % | | | 28.31 | % | |
S&P® Latin America 40 Index | | | -40.86 | % | | | 28.47 | % | |
S&P North American Natural Resources Sector Index | | | -34.00 | % | | | 24.52 | % | |
NYSE Current 7-10 Year Treasury Bond Index | | | 3.41 | % | | | 6.30 | % | |
As always, we thank you for using the Direxion Funds and we look forward to our mutual success.
Regards,

| |  | |
Eric Falkeis | | Patrick Rudnick | |
Principal Executive Officer | | Principal Financial Officer | |
The performance data quoted represents past performance; past performance does not guarantee future results. The investment return and principal value of an investment will fluctuate and an investor's shares, when redeemed, may be worth more or less than their original cost. Current performance may be higher or lower than the performance data quoted. To obtain performance data current to the most recent month-end, please call toll-free, 1.800.851.0511, or visit www.direxioninvestments.com.
An investment in the Funds involves risk, including the possible loss of principal. The Funds are non-diversified and include risks associated with concentration risk which results from the Funds' investments in a particular industry or sector and can increase volatility over time. Active and frequent trading associated with a regular rebalance of the fund can cause the price to fluctuate, therefore impacting its performance compared to other investment vehicles. The Funds are leveraged and include risks associated with being leveraged which include the potential to create a greater negative return had the Fund not employed leverage. For other risks including correlation, compounding, market volatility and specific risks regarding each sector, please read the prospectus. An investment in any of the Direxion Funds is subject to a number of risks that could affect the value of its shares. It is important that investors closely review and understand these risks before making an investment.
An investor should consider the investment objectives, risks, charges and expenses of the Direxion Funds carefully before investing. The prospectus contains this and other information about the Direxion Funds. To obtain a prospectus, please call the Direxion Funds at 1-800-851-0511 or visit www.direxioninvestments.com. The prospectus should be read carefully before investing.
There is no guarantee the Funds will achieve their objective. Investing in funds that track an index may be more volatile than investing in broadly diversified funds. The use of leverage by a Fund means the Funds are riskier than alternatives which do not use leverage.
The views in this report were those of the Adviser as of August 31, 2015 and may not reflect their views on the date this report is first published or anytime thereafter. These views are intended to assist shareholders of the Fund in understanding their investments in the Fund and do not constitute investment advice.
DIREXION ANNUAL REPORT
10
The total annual fund operating expense ratios of the Direxion Monthly S&P 500® Bull 2X Fund, Direxion Monthly S&P 500® Bear 2X Fund, Direxion Monthly Small Cap Bull 2X Fund, Direxion Monthly Small Cap Bear 2X Fund, Direxion Monthly NASDAQ-100® Bull 2X Fund, Direxion Monthly Emerging Markets Bull 2X Fund, Direxion Monthly China Bull 2X Fund, Direxion Monthly Latin America Bull 2X Fund, Direxion Monthly Natural Resources Bull 2X Fund, Direxion Monthly 7-10 Year Treasury Bull 2X Fund and Direxion Monthly 7-10 Year Treasury Bear 2X Fund are 1.35%, respectively. The total annual fund operating expense ratio of the Dynamic HY Bond Fund is 1.67%.*
The Standard & Poor's 500® Index (S&P 500® Index) is an unmanaged index of 500 U.S. stocks and gives a broad look at how 500 of the largest companies in aggregate market value have performed.
The Russell 2000® Index measures the performance of the small-cap segment of the U.S. equity universe and is comprised of the smallest 2000 companies in the Russell 3000® Index.
The NASDAQ-100® Index is a capitalization-weighted index composed of 100 of the largest non-financial domestic and international companies listed on the Global Market tier of the NASDAQ Global Market® .
The MSCI Emerging Markets IndexSM is a free float-adjusted market capitalization index that is designed to measure equity market performance in the global emerging markets.
The S&P® Latin America 40 Index includes highly liquid securities from major economic sectors of the Mexican and South American equity markets.
The FTSE China 50 Index consists of 50 of the largest and most liquid companies available to international investors traded on the Hong Kong Stock Exchange.
The S&P North American Natural Resources Index provides a benchmark that represents U.S. traded securities that are classified under the GICS® energy and materials sector excluding the chemicals industry; and steel sub-industry.
The NYSE 7-10 Year Treasury Bond Index is a multi-security index that includes all qualified U.S. Treasury bonds that have a maturity of 7 to 10 years at issuance.
Please note that you cannot invest directly in an index, although you may invest in the underlying securities represented in the index. Index returns are adjusted to reflect the reinvestment of dividends on securities in the index but do not reflect the expenses of the Fund.
Distributed by: Rafferty Capital Markets, LLC
* The total annual fund operating expense ratio of the Dynamic HY Bond Fund includes Acquired Fund Fees and Expenses, indirect fees and expenses that the Fund incurs that are required to be disclosed. Without Acquired Fund Fees and Expenses, total annual fund operating expense ratio would be 1.35%.
DIREXION ANNUAL REPORT
11
Direxion Monthly NASDAQ-100® Bull 2X Fund
Performance Summary
May 1, 20061 - August 31, 2015 (Unaudited)
Investment Objective: Seeks monthly investment results, before fees and expenses, of 200% of the price performance of the NASDAQ-100® Index.
| | | Average Annual Total Return2 | |
| | | 1 Year | | 3 Year | | 5 Year | | Since Inception | |
Direxion Monthly NASDAQ-100®
Bull 2X Fund | | | 7.68 | % | | | 32.18 | % | | | 39.73 | % | | | 10.37 | % | |
NASDAQ-100® Index | | | 4.70 | % | | | 15.53 | % | | | 19.32 | % | | | 10.48 | % | |
The Fund seeks calendar month leveraged investment results, which should not be equated with seeking a leveraged goal for shorter than a calendar month. An investor who purchases shares on a day other than the last business day of a calendar month will generally receive more, or less, than 200% exposure to the target index, depending on the performance of the target index.
This chart illustrates the performance of a hypothetical $10,000 investment made at the Fund's inception, and is not intended to imply any future performance. The returns shown do not reflect the deduction of taxes that a shareholder would pay on fund distributions or the redemption of fund shares. The performance of the NASDAQ-100® Index does not reflect the deduction of fees associated with a mutual fund, such as investment management fees. Investors cannot invest directly in an index, although they can invest in its underlying securities.
The performance data shown represents past performance and does not guarantee future results.
Market Exposure2
Investment Type | | Percent of
Net Assets | |
Swap Contracts | | | 200.0 | % | |
Total Exposure | | | 200.0 | % | |
"Market Exposure" includes the value of total investments (including the contract value of any derivatives) and excludes any short-term investments and cash equivalents divided by Net Assets.
1 Commencement of operations.
2 As of August 31, 2015.
DIREXION ANNUAL REPORT
12
Direxion Monthly S&P 500® Bull 2X Fund
Performance Summary
May 1, 20061 - August 31, 2015 (Unaudited)
Investment Objective: Seeks monthly investment results, before fees and expenses, of 200% of the price performance of the S&P 500® Index.
| | | Average Annual Total Return2 | |
| | | 1 Year | | 3 Year | | 5 Year | | Since Inception | |
Direxion Monthly S&P 500®
Bull 2X Fund | | | (2.40 | )% | | | 26.51 | % | | | 29.00 | % | | | 1.34 | % | |
S&P 500® Index | | | 0.48 | % | | | 14.31 | % | | | 15.87 | % | | | 6.77 | % | |
The Fund seeks calendar month leveraged investment results, which should not be equated with seeking a leveraged goal for shorter than a calendar month. An investor who purchases shares on a day other than the last business day of a calendar month will generally receive more, or less, than 200% exposure to the target index, depending on the performance of the target index.
This chart illustrates the performance of a hypothetical $10,000 investment made at the Fund's inception, and is not intended to imply any future performance. The returns shown do not reflect the deduction of taxes that a shareholder would pay on fund distributions or the redemption of fund shares. The performance of the S&P 500® Index does not reflect the deduction of fees associated with a mutual fund, such as investment management fees. Investors cannot invest directly in an index, although they can invest in its underlying securities.
The performance data shown represents past performance and does not guarantee future results.
Market Exposure2
Investment Type | | Percent of
Net Assets | |
Swap Contracts | | | 200.1 | % | |
Total Exposure | | | 200.1 | % | |
"Market Exposure" includes the value of total investments (including the contract value of any derivatives) and excludes any short-term investments and cash equivalents divided by Net Assets.
1 Commencement of operations.
2 As of August 31, 2015.
DIREXION ANNUAL REPORT
13
Direxion Monthly S&P 500® Bear 2X Fund
Performance Summary
May 1, 20061 - August 31, 2015 (Unaudited)
Investment Objective: Seeks monthly investment results, before fees and expenses, of 200% of the inverse of the price performance of the S&P 500® Index.
| | | Average Annual Total Return2 | |
| | | 1 Year | | 3 Year | | 5 Year | | Since Inception | |
Direxion Monthly S&P 500®
Bear 2X Fund | | | (5.53 | )% | | | (27.09 | )% | | | (30.31 | )% | | | (23.41 | )% | |
S&P 500® Index | | | 0.48 | % | | | 14.31 | % | | | 15.87 | % | | | 6.77 | % | |
The Fund seeks calendar month leveraged investment results, which should not be equated with seeking a leveraged goal for shorter than a calendar month. An investor who purchases shares on a day other than the last business day of a calendar month will generally receive more, or less, than -200% exposure to the target index, depending on the performance of the target index.
This chart illustrates the performance of a hypothetical $10,000 investment made at the Fund's inception, and is not intended to imply any future performance. The returns shown do not reflect the deduction of taxes that a shareholder would pay on fund distributions or the redemption of fund shares. The performance of the S&P 500® Index does not reflect the deduction of fees associated with a mutual fund, such as investment management fees. Investors cannot invest directly in an index, although they can invest in its underlying securities.
The performance data shown represents past performance and does not guarantee future results.
Market Exposure2
Investment Type | | Percent of
Net Assets | |
Swap Contracts | | | (206.8 | )% | |
Total Exposure | | | (206.8 | )% | |
"Market Exposure" includes the value of total investments (including the contract value of any derivatives) and excludes any short-term investments and cash equivalents divided by Net Assets.
1 Commencement of operations.
2 As of August 31, 2015.
DIREXION ANNUAL REPORT
14
Direxion Monthly Small Cap Bull 2X Fund
Performance Summary
September 1, 2005 - August 31, 2015 (Unaudited)
Investment Objective: Seeks monthly investment results, before fees and expenses, of 200% of the price performance of the Russell 2000® Index.
| | | Average Annual Total Return1 | |
| | | 1 Year | | 3 Years | | 5 Years | | 10 Years | |
Direxion Monthly Small Cap
Bull 2X Fund | | | (3.34 | )% | | | 26.23 | % | | | 28.04 | % | | | (1.13 | )% | |
Russell 2000® Index | | | 0.03 | % | | | 14.12 | % | | | 15.55 | % | | | 7.12 | % | |
The Fund seeks calendar month leveraged investment results. An investor who purchases shares on a day other than the last business day of the calendar month will generally receive more, or less, than 200% exposure to its index. Other factors such as fees and expenses, high portfolio turnover, transaction costs, significant purchases and redemption activity by Fund shareholders and/or a temporary lack of liquidity in the markets for the securities held by the Fund may also cause the Fund's investment results to vary from its stated objective.
This chart illustrates the performance of a hypothetical $10,000 investment made ten years ago, and is not intended to imply any future performance. The returns shown do not reflect the deduction of taxes that a shareholder would pay on fund distributions or the redemption of fund shares. The performance of the Russell 2000® Index does not reflect the deduction of fees associated with a mutual fund, such as investment management fees. Investors cannot invest directly in an index, although they can invest in its underlying securities. During the period shown, Rafferty Asset Management, LLC waived and/or reimbursed fees for various expenses. Had these waivers and/or reimbursements not been in effect, performance would have been lower.
The performance data shown represents past performance and does not guarantee future results.
Market Exposure1
Investment Type | | Percent of
Net Assets | |
Swap Contracts | | | 200.0 | % | |
Total Exposure | | | 200.0 | % | |
"Market Exposure" includes the value of total investments (including the contract value of any derivatives) and excludes any short-term investments and cash equivalents divided by Net Assets.
1 As of August 31, 2015.
DIREXION ANNUAL REPORT
15
Direxion Monthly Small Cap Bear 2X Fund
Performance Summary
September 1, 2005 - August 31, 2015 (Unaudited)
Investment Objective: Seeks monthly investment results, before fees and expenses, of 200% of the inverse of the price performance of the Russell 2000® Index.

| | | Average Annual Total Return1 | |
| | | 1 Year | | 3 Years | | 5 Years | | 10 Years | |
Direxion Monthly Small Cap
Bear 2X Fund | | | (8.69 | )% | | | (29.72 | )% | | | (33.80 | )% | | | (30.42 | )% | |
Russell 2000® Index | | | 0.03 | % | | | 14.12 | % | | | 15.55 | % | | | 7.12 | % | |
The Fund seeks calendar month leveraged investment results. An investor who purchases shares on a day other than the last business day of the calendar month will generally receive more, or less, than -200% exposure to its index. Other factors such as fees and expenses, high portfolio turnover, transaction costs, significant purchases and redemption activity by Fund shareholders and/or a temporary lack of liquidity in the markets for the securities held by the Fund may also cause the Fund's investment results to vary from its stated objective.
This chart illustrates the performance of a hypothetical $10,000 investment made ten years ago, and is not intended to imply any future performance. The returns shown do not reflect the deduction of taxes that a shareholder would pay on fund distributions or the redemption of fund shares. The performance of the Russell 2000® Index does not reflect the deduction of fees associated with a mutual fund, such as investment management fees. Investors cannot invest directly in an index, although they can invest in its underlying securities. During the period shown, Rafferty Asset Management, LLC waived and/or reimbursed fees for various expenses. Had these waivers and/or reimbursements not been in effect, performance would have been lower.
The performance data shown represents past performance and does not guarantee future results.
Market Exposure1
Investment Type | | Percent of
Net Assets | |
Swap Contracts | | | (200.0 | )% | |
Total Exposure | | | (200.0 | )% | |
"Market Exposure" includes the value of total investments (including the contract value of any derivatives) and excludes any short-term investments and cash equivalents divided by Net Assets.
1 As of August 31, 2015.
DIREXION ANNUAL REPORT
16
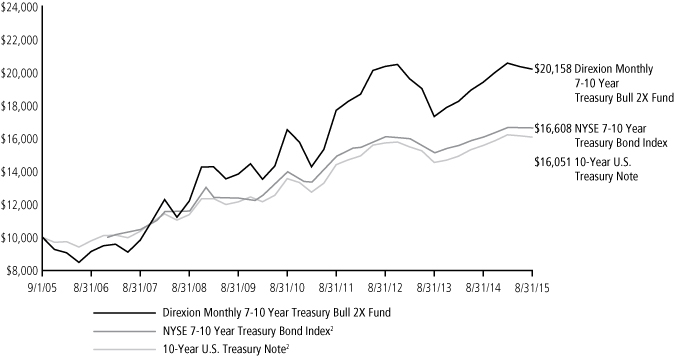
Direxion Monthly 7-10 Year Treasury Bull 2X Fund
Performance Summary
September 1, 2005 - August 31, 2015 (Unaudited)
Investment Objective: The Direxion Monthly 7-10 Year Treasury Bull 2X Fund seeks monthly investment results, before fees and expenses, of 200% of the calendar month performance of the NYSE 7-10 Year Treasury Bond Index.
| | | Average Annual Total Return1 | |
| | | 1 Year | | 3 Years | | 5 Years | | 10 Years | |
Direxion Monthly 7-10 Year
Treasury Bull 2X Fund | | | 4.09 | % | | | (0.27 | )% | | | 4.08 | % | | | 7.26 | % | |
NYSE 7-10 Year
Treasury Bond Index2 | | | 3.41 | % | | | 1.08 | % | | | 3.54 | % | | | N/A | | |
10-Year U.S. Treasury Note2 | | | 3.24 | % | | | 0.74 | % | | | 3.45 | % | | | 4.85 | % | |
The Fund seeks calendar month leveraged investment results. An investor who purchases shares on a day other than the last business day of the calendar month will generally receive more, or less, than 200% exposure to its index. Other factors such as fees and expenses, high portfolio turnover, transaction costs, significant purchases and redemption activity by Fund shareholders and/or a temporary lack of liquidity in the markets for the securities held by the Fund may also cause the Fund's investment results to vary from its stated objective.
This chart illustrates the performance of a hypothetical $10,000 investment made ten years ago, and is not intended to imply any future performance. The returns shown do not reflect the deduction of taxes that a shareholder would pay on fund distributions or the redemption of fund shares. The performance of the NYSE 7-10 Year Treasury Bond Index does not reflect the deduction of fees associated with a mutual fund, such as investment management fees. Investors cannot invest directly in an index, although they can invest in its underlying securities. During the period shown, Rafferty Asset Management, LLC waived and/or reimbursed fees for various expenses. Had these waivers and/or reimbursements not been in effect, performance would have been lower.
The performance data shown represents past performance and does not guarantee future results.
Market Exposure1
Investment Type | | Percent of
Net Assets | |
Swap Contracts | | | 200.0 | % | |
Total Exposure | | | 200.0 | % | |
"Market Exposure" includes the value of total investments (including the contract value of any derivatives) and excludes any short-term investments and cash equivalents divided by Net Assets.
1 As of August 31, 2015.
2 On April 14, 2013, the Fund began tracking the NYSE 7-10 Year Treasury Bond Index as the benchmark. The NYSE 7-10 Year Treasury Bond Index commenced operations on December 29, 2006. The average annual return for the period from December 29, 2006 to August 31, 2015 was 6.02%.
DIREXION ANNUAL REPORT
17
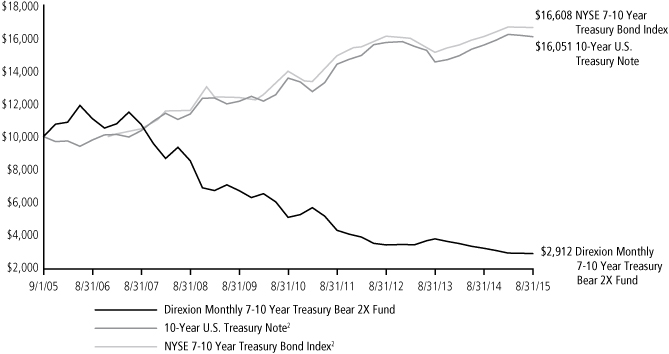
Direxion Monthly 7-10 Year Treasury Bear 2X Fund
Performance Summary
September 1, 2005 - August 31, 2015 (Unaudited)
Investment Objective: The Direxion Monthly 7-10 Year Treasury Bear 2X Fund seeks monthly investment results, before fees and expenses, of 200% of the inverse of the calendar month performance of the NYSE 7-10 Year Treasury Bond Index.
| | | Average Annual Total Return1 | |
| | | 1 Year | | 3 Years | | 5 Years | | 10 Years | |
Direxion Monthly 7-10 Year
Treasury Bear 2X Fund | | | (9.96 | )% | | | (5.40 | )% | | | (10.63 | )% | | | (11.61 | )% | |
NYSE 7-10 Year
Treasury Bond Index2 | | | 3.41 | % | | | 1.08 | % | | | 3.54 | % | | | N/A | | |
10-Year U.S. Treasury Note2 | | | 3.24 | % | | | 0.74 | % | | | 3.45 | % | | | 4.85 | % | |
The Fund seeks calendar month leveraged investment results. An investor who purchases shares on a day other than the last business day of the calendar month will generally receive more, or less, than -200% exposure to its index. Other factors such as fees and expenses, high portfolio turnover, transaction costs, significant purchases and redemption activity by Fund shareholders and/or a temporary lack of liquidity in the markets for the securities held by the Fund may also cause the Fund's investment results to vary from its stated objective.
This chart illustrates the performance of a hypothetical $10,000 investment made ten years ago, and is not intended to imply any future performance. The returns shown do not reflect the deduction of taxes that a shareholder would pay on fund distributions or the redemption of fund shares. The performance of the NYSE 7-10 Year Treasury Bond Index does not reflect the deduction of fees associated with a mutual fund, such as investment management fees. Investors cannot invest directly in an index, although they can invest in its underlying securities. During the period shown, Rafferty Asset Management, LLC waived and/or reimbursed fees for various expenses. Had these waivers and/or reimbursements not been in effect, performance would have been lower.
The performance data shown represents past performance and does not guarantee future results.
Market Exposure1
Investment Type | | Percent of
Net Assets | |
Swap Contracts | | | (200.0 | )% | |
Total Exposure | | | (200.0 | )% | |
"Market Exposure" includes the value of total investments (including the contract value of any derivatives) and excludes any short-term investments and cash equivalent6s divided by Net Assets.
1 As of August 31, 2015.
2 On April 14, 2013, the Fund began tracking the NYSE 7-10 Year Treasury Bond Index as the benchmark. The NYSE 7-10 Year Treasury Bond Index commenced operations on December 29, 2006. The average annual return for the period from December 29, 2006 to August 31, 2015 was 6.02%.
DIREXION ANNUAL REPORT
18
Direxion Dynamic HY Bond Fund
Performance Summary
September 1, 2005 - August 31, 2015 (Unaudited)
Investment Objective: Seeks to maximize total return by investing primarily in high-yield debt instruments, commonly referred to as "junk bonds", and derivatives of such instruments.

| | | Average Annual Total Return1 | |
| | | 1 Year | | 3 Year | | 5 Year | | 10 Year | |
Direxion Dynamic HY Bond Fund | | | (7.75 | )% | | | 1.07 | % | | | 3.38 | % | | | 2.03 | % | |
Barclays Capital U.S. Corporate
High-Yield Bond Index | | | (2.93 | )% | | | 4.91 | % | | | 7.34 | % | | | 7.43 | % | |
Lipper High-Yield Bond Fund Index | | | (2.50 | )% | | | 4.98 | % | | | 7.01 | % | | | 6.12 | % | |
This chart illustrates the performance of a hypothetical $10,000 investment made ten years ago, and is not intended to imply any future performance. The returns shown do not reflect the deduction of taxes that a shareholder would pay on fund distributions or the redemption of fund shares. The performance of the Barclays Capital U.S. Corporate High-Yield Bond Index and the Lipper High-Yield Bond Fund Index does not reflect the deduction of fees associated with a mutual fund, such as investment management fees. Investors cannot invest directly in an index, although they can invest in its underlying securities. During the period shown, Rafferty Asset Management, LLC waived and/or reimbursed fees for various expenses. Had these waivers and/or reimbursements not been in effect, performance would have been lower.
The performance data shown represents past performance and does not guarantee future results.
Market Exposure1
Investment Type | | Percent of
Net Assets | |
Investment Companies | | | 69.9 | % | |
Swap Contract | | | 50.0 | % | |
Total Exposure | | | 119.9 | % | |
"Market Exposure" includes the value of total investments (including the contract value of any derivatives) and excludes any short-term investments and cash equivalents divided by Net Assets.
1 As of August 31, 2015.
DIREXION ANNUAL REPORT
19
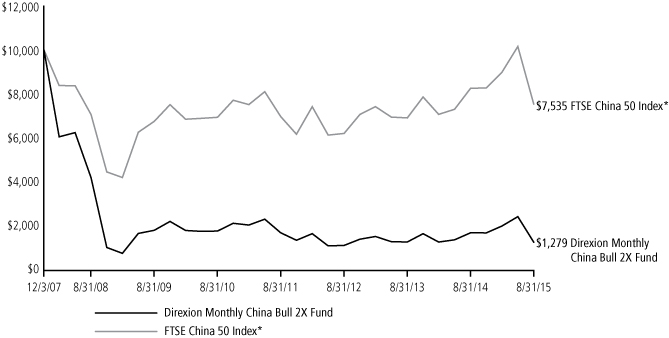
Direxion Monthly China Bull 2X Fund
Performance Summary
December 3, 20071 - August 31, 2015 (Unaudited)
Investment Objective: Seeks monthly investment results, before fees and expenses, of 200% of the price performance of the FTSE China 50 Index.
| | | Average Annual Total Return2 | |
| | | 1 Year | | 3 Year | | 5 Year | | Since Inception | |
Direxion Monthly China
Bull 2X Fund | | | (25.05 | )% | | | 4.11 | % | | | (6.44 | )% | | | (23.32 | )% | |
FTSE China 50 Index* | | | (8.68 | )% | | | 6.67 | % | | | 1.66 | % | | | (3.59 | )% | |
The Fund seeks calendar month leveraged investment results. An investor who purchases shares on a day other than the last business day of the calendar month will generally receive more, or less, than 200% exposure to its index. Other factors such as fees and expenses, high portfolio turnover, transaction costs, significant purchases and redemption activity by Fund shareholders and/or a temporary lack of liquidity in the markets for the securities held by the Fund may also cause the Fund's investment results to vary from its stated objective.
This chart illustrates the performance of a hypothetical $10,000 investment made on the Fund's inception, and is not intended to imply any future performance. The returns shown do not reflect the deduction of taxes that a shareholder would pay on fund distributions or the redemption of fund shares. The performance of the FTSE China 50 Index does not reflect the deduction of fees associated with a mutual fund, such as investment management fees. Investors cannot invest directly in an index, although they can invest in its underlying securities. During the period shown, Rafferty Asset Management, LLC waived and/or reimbursed fees for various expenses. Had these waivers and/or reimbursements not been in effect, performance would have been lower.
The performance data shown represents past performance and does not guarantee future results.
Market Exposure2
Investment Type | | Percent of
Net Assets | |
Swap Contracts | | | 200.1 | % | |
Total Exposure | | | 200.1 | % | |
"Market Exposure" includes the value of total investments (including the contract value of any derivatives) and excludes any short-term investments and cash equivalents divided by Net Assets.
* Effective September 22, 2014, the underlying index of the Direxion Monthly China Bull 2X Fund changed its methodology, and as consequence, was renamed the FTSE China 50 Index.
1 Commencement of operations.
2 As of August 31, 2015.
DIREXION ANNUAL REPORT
20
Direxion Monthly Emerging Markets Bull 2X Fund
Performance Summary
November 1, 20051 - August 31, 2015 (Unaudited)
Investment Objective: Seeks monthly investment results, before fees and expenses, of 200% of the price performance of the MSCI Emerging Markets Index.

| | | Average Annual Total Return2 | |
| | | 1 Year | | 3 Year | | 5 Year | | Since Inception | |
Direxion Monthly Emerging
Markets Bull 2X Fund | | | (45.54 | )% | | | (11.91 | )% | | | (10.91 | )% | | | (7.77 | )% | |
MSCI Emerging Markets IndexSM | | | (24.74 | )% | | | (4.75 | )% | | | (3.33 | )% | | | 2.76 | % | |
The Fund seeks calendar month leveraged investment results. An investor who purchases shares on a day other than the last business day of the calendar month will generally receive more, or less, than 200% exposure to its index. Other factors such as fees and expenses, high portfolio turnover, transaction costs, significant purchases and redemption activity by Fund shareholders and/or a temporary lack of liquidity in the markets for the securities held by the Fund may also cause the Fund's investment results to vary from its stated objective.
This chart illustrates the performance of a hypothetical $10,000 investment made on the Fund's inception, and is not intended to imply any future performance. The returns shown do not reflect the deduction of taxes that a shareholder would pay on fund distributions or the redemption of fund shares. The performance of the MSCI Emerging Markets IndexSM does not reflect the deduction of fees associated with a mutual fund, such as investment management fees. Investors cannot invest directly in an index, although they can invest in its underlying securities. During the period shown, Rafferty Asset Management, LLC waived and/or reimbursed fees for various expenses. Had these waivers and/or reimbursements not been in effect, performance would have been lower.
The performance data shown represents past performance and does not guarantee future results.
Market Exposure2
Investment Type | | Percent of
Net Assets | |
Swap Contracts | | | 200.0 | % | |
Total Exposure | | | 200.0 | % | |
"Market Exposure" includes the value of total investments (including the contract value of any derivatives) and excludes any short-term investments and cash equivalents divided by Net Assets.
1 Commencement of operations.
2 As of August 31, 2015.
DIREXION ANNUAL REPORT
21
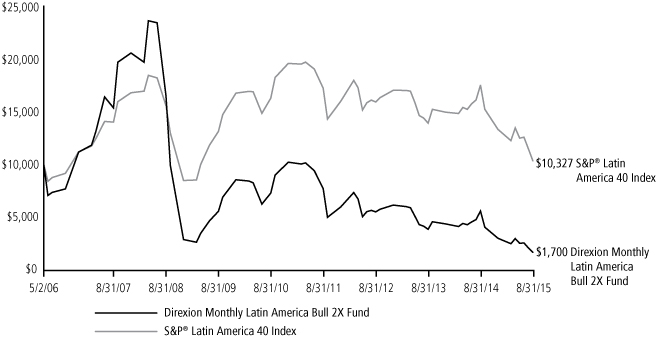
Direxion Monthly Latin America Bull 2X Fund
Performance Summary
May 2, 20061 - August 31, 2015 (Unaudited)
Investment Objective: Seeks monthly investment results, before fees and expenses, of 200% of the price performance of the S&P® Latin America 40 Index.
| | | Average Annual Total Return2 | |
| | | 1 Year | | 3 Year | | 5 Year | | Since Inception | |
Direxion Monthly Latin America
Bull 2X Fund | | | (69.61 | )% | | | (32.45 | )% | | | (25.26 | )% | | | (17.29 | )% | |
S&P® Latin America 40 Index | | | (40.86 | )% | | | (13.35 | )% | | | (8.65 | )% | | | 0.34 | % | |
The Fund seeks calendar month leveraged investment results, which should not be equated with seeking a leveraged goal for shorter than a calendar month. An investor who purchases shares on a day other than the last business day of a calendar month will generally receive more, or less, than 200% exposure to the target index, depending on the performance of the target index.
This chart illustrates the performance of a hypothetical $10,000 investment made at the Fund's inception, and is not intended to imply any future performance. The returns shown do not reflect the deduction of taxes that a shareholder would pay on fund distributions or the redemption of fund shares. The performance of the S&P® Latin America 40 Index does not reflect the deduction of fees associated with a mutual fund, such as investment management fees. Investors cannot invest directly in an index, although they can invest in its underlying securities.
The performance data shown represents past performance and does not guarantee future results.
Market Exposure2
Investment Type | | Percent of
Net Assets | |
Swap Contracts | | | 202.0 | % | |
Total Exposure | | | 202.0 | % | |
"Market Exposure" includes the value of total investments (including the contract value of any derivatives) and excludes any short-term investments and cash equivalents divided by Net Assets.
1 Commencement of operations.
2 As of August 31, 2015.
DIREXION ANNUAL REPORT
22
Direxion Monthly Natural Resources Bull 2X Fund
Performance Summary
September 1, 2005 - August 31, 2015 (Unaudited)
Investment Objective: Seeks monthly investment results, before fees and expenses, of 200% of the price performance of the S&P North American Natural Resources Sector Index.

| | | Average Annual Total Return1 | |
| | | 1 Year | | 3 Years | | 5 Years | | 10 Years | |
Direxion Monthly Natural
Resources Bull 2X Fund | | | (59.61 | )% | | | (12.45 | )% | | | (6.76 | )% | | | (5.96 | )% | |
S&P North American Natural
Resources Sector Index | | | (34.00 | )% | | | (3.74 | )% | | | 2.12 | % | | | 2.86 | % | |
The Fund seeks calendar month leveraged investment results. An investor who purchases shares on a day other than the last business day of the calendar month will generally receive more or less, than 200% exposure to its index. Other factors such as fees and expenses, high portfolio turnover, transaction costs, significant purchases and redemption activity by Fund shareholders and/or a temporary lack of liquidity in the markets for the securities held by the Fund may also cause the Fund's investment results to vary from its stated objective.
This chart illustrates the performance of a hypothetical $10,000 investment made ten years ago, and is not intended to imply any future performance. The returns shown do not reflect the deduction of taxes that a shareholder would pay on fund distributions or the redemption of fund shares. The performance of the S&P North American Natural Resources Sector Index does not reflect the deduction of fees associated with a mutual fund, such as investment management fees. Investors cannot invest directly in an index, although they can invest in its underlying securities. During the period shown, Rafferty Asset Management, LLC waived and/or reimbursed fees for various expenses. Had these waivers and/or reimbursements not been in effect, performance would have been lower.
The performance data shown represents past performance and does not guarantee future results.
Market Exposure1
Investment Type | | Percent of
Net Assets | |
Swap Contracts | | | 200.4 | % | |
Total Exposure | | | 200.4 | % | |
"Market Exposure" includes the value of total investments (including the contract value of any derivatives) and excludes any short-term investments and cash equivalents divided by Net Assets.
1 As of August 31, 2015.
DIREXION ANNUAL REPORT
23
Expense Example
August 31, 2015 (Unaudited)
As a shareholder of a mutual fund, you incur two types of costs: (1) transaction costs, including sales charges (loads) on purchase payments, reinvested dividends, or other distributions; redemption fees and exchange fees; and (2) ongoing costs, including management fees; distribution and/or service fees; and other fund expenses. This example is intended to help you understand your ongoing costs (in dollars) of investing in a fund and to compare costs with the ongoing costs of investing in other mutual funds.
The example is based on an investment of $1,000 invested at the beginning of the period and held the entire period (March 1, 2015 — August 31, 2015).
Actual expenses
The first line under each Fund in the following table provides information about actual account values and actual expenses. You may use the information in this line, together with the amount you invested, to estimate the expenses that you paid over the period. Simply divide your account value by $1,000 (for example, an $8,600 account value divided by $1,000 = 8.6), then multiply the result by the number in the first line for your Fund under the heading entitled "Expenses Paid During Period" to estimate the expenses you paid on your account during this period.
Hypothetical example for comparison purposes
The second line of the following table provides information about hypothetical account values and hypothetical expenses based on each Fund's actual expense ratio and an assumed rate of return of 5% per year before expenses, which is not the Fund's actual return. The hypothetical account values and expenses may not be used to estimate the actual ending account balance or expenses you paid for the period. You may use this information to compare the ongoing costs of investing in your Fund and other funds. To do so, compare this 5% hypothetical example with the 5% hypothetical examples that appear in the shareholder reports of the other funds.
Please note that the expenses shown in the table are meant to highlight your ongoing costs only and do not reflect any transactional costs, such as wire transfers, returned checks or stop payment orders. Therefore, the second line under each Fund in the table is useful in comparing ongoing Fund costs only, and will not help you determine the relative costs of owning different funds. In addition, if these transactional costs were included, your costs would have been higher.
DIREXION ANNUAL REPORT
24
Expense Example Table
August 31, 2015 (Unaudited)
| | | Expense
Ratio1 | | Beginning
Account Value
March 1, 2015 | | Ending
Account Value
August 31, 2015 | | Expenses
Paid During
Period2 | |
Direxion Monthly NASDAQ-100® Bull 2X Fund | |
Based on actual fund return | | | 1.35 | % | | $ | 1,000.00 | | | $ | 917.00 | | | $ | 6.52 | | |
Based on hypothetical 5% return | | | 1.35 | % | | | 1,000.00 | | | | 1,018.40 | | | | 6.87 | | |
Direxion Monthly S&P 500® Bull 2X Fund | |
Based on actual fund return | | | 1.35 | % | | | 1,000.00 | | | | 880.10 | | | | 6.40 | | |
Based on hypothetical 5% return | | | 1.35 | % | | | 1,000.00 | | | | 1,018.40 | | | | 6.87 | | |
Direxion Monthly S&P 500® Bear 2X Fund | |
Based on actual fund return | | | 1.35 | % | | | 1,000.00 | | | | 1,090.70 | | | | 7.11 | | |
Based on hypothetical 5% return | | | 1.35 | % | | | 1,000.00 | | | | 1,018.40 | | | | 6.87 | | |
Direxion Monthly Small Cap Bull 2X Fund | |
Based on actual fund return | | | 1.35 | % | | | 1,000.00 | | | | 881.90 | | | | 6.40 | | |
Based on hypothetical 5% return | | | 1.35 | % | | | 1,000.00 | | | | 1,018.40 | | | | 6.87 | | |
Direxion Monthly Small Cap Bear 2X Fund | |
Based on actual fund return | | | 1.35 | % | | | 1,000.00 | | | | 1,078.50 | | | | 7.07 | | |
Based on hypothetical 5% return | | | 1.35 | % | | | 1,000.00 | | | | 1,018.40 | | | | 6.87 | | |
Direxion Monthly 7-10 Year Treasury Bull 2X Fund | |
Based on actual fund return | | | 1.35 | % | | | 1,000.00 | | | | 982.30 | | | | 6.75 | | |
Based on hypothetical 5% return | | | 1.35 | % | | | 1,000.00 | | | | 1,018.40 | | | | 6.87 | | |
Direxion Monthly 7-10 Year Treasury Bear 2X Fund | |
Based on actual fund return | | | 1.35 | % | | | 1,000.00 | | | | 989.50 | | | | 6.77 | | |
Based on hypothetical 5% return | | | 1.35 | % | | | 1,000.00 | | | | 1,018.40 | | | | 6.87 | | |
Direxion Dynamic HY Bond Fund | |
Based on actual fund return | | | 1.35 | % | | | 1,000.00 | | | | 946.30 | | | | 6.62 | | |
Based on hypothetical 5% return | | | 1.35 | % | | | 1,000.00 | | | | 1,018.40 | | | | 6.87 | | |
Direxion Monthly China Bull 2X Fund | |
Based on actual fund return | | | 1.35 | % | | | 1,000.00 | | | | 635.30 | | | | 5.56 | | |
Based on hypothetical 5% return | | | 1.35 | % | | | 1,000.00 | | | | 1,018.40 | | | | 6.87 | | |
Direxion Monthly Emerging Markets Bull 2X Fund | |
Based on actual fund return | | | 1.35 | % | | | 1,000.00 | | | | 672.00 | | | | 5.69 | | |
Based on hypothetical 5% return | | | 1.35 | % | | | 1,000.00 | | | | 1,018.40 | | | | 6.87 | | |
Direxion Monthly Latin America Bull 2X Fund | |
Based on actual fund return | | | 1.35 | % | | | 1,000.00 | | | | 569.60 | | | | 5.34 | | |
Based on hypothetical 5% return | | | 1.35 | % | | | 1,000.00 | | | | 1,018.40 | | | | 6.87 | | |
Direxion Monthly Natural Resources Bull 2X Fund | |
Based on actual fund return | | | 1.35 | % | | | 1,000.00 | | | | 665.60 | | | | 5.67 | | |
Based on hypothetical 5% return | | | 1.35 | % | | | 1,000.00 | | | | 1,018.40 | | | | 6.87 | | |
1 Annualized.
2 Expenses are equal to the Fund's annualized expense ratio, multiplied by the average account value over the period, multiplied by the number of days in the period of March 1, 2015 to August 31, 2015, then divided by 365.
DIREXION ANNUAL REPORT
25
Allocation of Portfolio Holdings
August 31, 2015 (Unaudited)
| | | Cash* | | Investment
Companies | | Swaps | | Total | �� |
Direxion Monthly NASDAQ-100® Bull 2X Fund | | | 100 | % | | | — | | | | — | | | | 100 | % | |
Direxion Monthly S&P 500® Bull 2X Fund | | | 100 | % | | | — | | | | — | | | | 100 | % | |
Direxion Monthly S&P 500® Bear 2X Fund | | | 106 | % | | | — | | | | (6 | )% | | | 100 | % | |
Direxion Monthly Small Cap Bull 2X Fund | | | 108 | % | | | — | | | | (8 | )% | | | 100 | % | |
Direxion Monthly Small Cap Bear 2X Fund | | | 108 | % | | | — | | | | (8 | )% | | | 100 | % | |
Direxion Monthly 7-10 Year Treasury Bull 2X Fund | | | 100 | % | | | — | | | | 0 | %** | | | 100 | % | |
Direxion Monthly 7-10 Year Treasury Bear 2X Fund | | | 102 | % | | | — | | | | (2 | )% | | | 100 | % | |
Direxion Dynamic HY Bond Fund | | | 30 | % | | | 70 | % | | | 0 | %** | | | 100 | % | |
Direxion Monthly China Bull 2X Fund | | | 100 | % | | | — | | | | 0 | %** | | | 100 | % | |
Direxion Monthly Emerging Markets Bull 2X Fund | | | 120 | % | | | — | | | | (20 | )% | | | 100 | % | |
Direxion Monthly Latin America Bull 2X Fund | | | 147 | % | | | — | | | | (47 | )% | | | 100 | % | |
Direxion Monthly Natural Resources Bull 2X Fund | | | 138 | % | | | — | | | | (38 | )% | | | 100 | % | |
Allocation of Portfolio Holdings reflects percentages of net assets.
* Cash and other assets less liabilities.
** Percentage is less than 0.5%.
DIREXION ANNUAL REPORT
26
Direxion Monthly NASDAQ-100® Bull 2X Fund
| | | | | Fair Value | |
No reportable investments. | |
| | | TOTAL INVESTMENTS
(Cost $—) - 0.0% | | $ | — | | |
| | | Other Assets in Excess of
Liabilities - 100.0% (a) | | | 116,172,305 | | |
| | | TOTAL NET ASSETS - 100.0% | | $ | 116,172,305 | | |
Percentages are stated as a percent of net assets.
(a) $40,880,000 of cash is pledged as collateral for swap contracts.
Long Equity Swap Contracts
August 31, 2015
Counterparty | | Reference Index | | Number of
Contracts | | Notional
Amount | | Interest
Rate
Received/
(Paid) | | Termination
Date | | Unrealized
Appreciation/
(Depreciation) | |
Bank of America Merrill Lynch | | NASDAQ-100® Index | | | 54,354 | | | $ | 232,340,739 | | | | (0.551 | )% | | 10/26/2016 | | $ | — | | |
The accompanying notes are an integral part of these financial statements.
DIREXION ANNUAL REPORT
27
Direxion Monthly S&P 500® Bull 2X Fund
| | | | | Fair Value | |
No reportable investments. | |
| | | TOTAL INVESTMENTS
(Cost $—) - 0.0% | | $ | — | | |
| | | Other Assets in Excess of
Liabilities - 100.0% (a) | | | 43,329,245 | | |
| | | TOTAL NET ASSETS - 100.0% | | $ | 43,329,245 | | |
Percentages are stated as a percent of net assets.
(a) $14,140,000 of cash is pledged as collateral for swap contracts.
Long Equity Swap Contracts
August 31, 2015
Counterparty | | Reference Index | | Number of
Contracts | | Notional
Amount | | Interest
Rate
Received/
(Paid) | | Termination
Date | | Unrealized
Appreciation/
(Depreciation) | |
Bank of America Merrill Lynch | | S&P 500® Index | | | 43,972 | | | $ | 86,720,699 | | | | (0.401 | )% | | 10/26/2016 | | $ | — | | |
The accompanying notes are an integral part of these financial statements.
DIREXION ANNUAL REPORT
28
Direxion Monthly S&P 500® Bear 2X Fund
| | | | | Fair Value | |
No reportable investments. | |
| | | TOTAL INVESTMENTS
(Cost $—) - 0.0% | | $ | — | | |
| | | Other Assets in Excess of
Liabilities - 100.0% (a) | | | 9,065,706 | | |
| | | TOTAL NET ASSETS - 100.0% | | $ | 9,065,706 | | |
Percentages are stated as a percent of net assets.
(a) $2,110,000 of cash is pledged as collateral for swap contracts.
Short Equity Swap Contracts
August 31, 2015
Counterparty | | Reference Index | | Number of
Contracts | | Notional
Amount | | Interest
Rate
Received/
(Paid) | | Termination
Date | | Unrealized
Appreciation/
(Depreciation) | |
Credit Suisse International | | S&P 500® Index | | | 9,504 | | | $ | 18,192,052 | | | | 0.052 | % | | 9/26/2016 | | $ | (557,364 | ) | |
The accompanying notes are an integral part of these financial statements.
DIREXION ANNUAL REPORT
29
Direxion Monthly Small Cap Bull 2X Fund
| | | | | Fair Value | |
No reportable investments. | |
| | | TOTAL INVESTMENTS
(Cost $—) - 0.0% | | $ | — | | |
| | | Other Assets in Excess of
Liabilities - 100.0% (a) | | | 15,324,524 | | |
| | | TOTAL NET ASSETS - 100.0% | | $ | 15,324,524 | | |
Percentages are stated as a percent of net assets.
(a) $5,920,000 of cash is pledged as collateral for swap contracts.
Long Equity Swap Contracts
August 31, 2015
Counterparty | | Reference Index | | Number of
Contracts | | Notional
Amount | | Interest
Rate
Received/
(Paid) | | Termination
Date | | Unrealized
Appreciation/
(Depreciation) | |
Credit Suisse International | | Russell 2000® Index | | | 26,433 | | | $ | 31,930,799 | | | | (0.032 | )% | | 8/22/2016 | | $ | (1,256,737 | ) | |
The accompanying notes are an integral part of these financial statements.
DIREXION ANNUAL REPORT
30
Direxion Monthly Small Cap Bear 2X Fund
| | | | | Fair Value | |
No reportable investments. | |
| | | TOTAL INVESTMENTS
(Cost $—) - 0.0% | | $ | — | | |
| | | Other Assets in Excess of
Liabilities - 100.0% (a) | | | 7,575,605 | | |
| | | TOTAL NET ASSETS - 100.0% | | $ | 7,575,605 | | |
Percentages are stated as a percent of net assets.
(a) $1,850,000 of cash is pledged as collateral for swap contracts.
Short Equity Swap Contracts
August 31, 2015
Counterparty | | Reference Index | | Number of
Contracts | | Notional
Amount | | Interest
Rate
Received/
(Paid) | | Termination
Date | | Unrealized
Appreciation/
(Depreciation) | |
Credit Suisse International | | Russell 2000® Index | | | 13,070 | | | $ | 14,521,412 | | | | (1.048 | )% | | 9/26/2016 | | $ | (639,489 | ) | |
The accompanying notes are an integral part of these financial statements.
DIREXION ANNUAL REPORT
31
Direxion Monthly 7-10 Year Treasury Bull 2X Fund
| | | | | Fair Value | |
No reportable investments. | |
| | | TOTAL INVESTMENTS
(Cost $—) - 0.0% | | $ | — | | |
| | | Other Assets in Excess of
Liabilities - 100.0% (a) | | | 69,849,768 | | |
| | | TOTAL NET ASSETS - 100.0% | | $ | 69,849,768 | | |
Percentages are stated as a percent of net assets.
(a) $20,400,000 of cash is pledged as collateral for swap contracts.
Long Equity Swap Contracts
August 31, 2015
Counterparty | | Reference Entity | | Number of
Contracts | | Notional
Amount | | Interest
Rate
Received/
(Paid) | | Termination
Date | | Unrealized
Appreciation/
(Depreciation) | |
Credit Suisse International | | iShares 7-10 Year Treasury Bond ETF | | | 1,313,545 | | | $ | 139,961,572 | | | | (0.427 | )% | | 2/16/2016 | | $ | (226,452 | ) | |
The accompanying notes are an integral part of these financial statements.
DIREXION ANNUAL REPORT
32
Direxion Monthly 7-10 Year Treasury Bear 2X Fund
| | | | | Fair Value | |
No reportable investments. | |
| | | TOTAL INVESTMENTS
(Cost $—) - 0.0% | | $ | — | | |
| | | Other Assets in Excess of
Liabilities - 100.0% (a) | | | 19,935,137 | | |
| | | TOTAL NET ASSETS - 100.0% | | $ | 19,935,137 | | |
Percentages are stated as a percent of net assets.
(a) $6,510,000 of cash is pledged as collateral for swap contracts.
Short Equity Swap Contracts
August 31, 2015
Counterparty | | Reference Entity | | Number of
Contracts | | Notional
Amount | | Interest
Rate
Received/
(Paid) | | Termination
Date | | Unrealized
Appreciation/
(Depreciation) | |
Credit Suisse International | | iShares 7-10 Year Treasury Bond ETF | | | 374,887 | | | $ | 39,521,519 | | | | (0.548 | )% | | 4/11/2016 | | $ | (429,856 | ) | |
The accompanying notes are an integral part of these financial statements.
DIREXION ANNUAL REPORT
33
Direxion Dynamic HY Bond Fund
Shares | | | | Fair Value | |
INVESTMENT COMPANIES - 69.9% | |
| | 11,569 | | | iShares iBoxx $ High Yield
Corporate Bond ETF | | $ | 997,710 | | |
| | 27,079 | | | SPDR Barclays High Yield Bond ETF | | | 1,002,194 | | �� |
| | | TOTAL INVESTMENT COMPANIES
(Cost $2,000,093) | | $ | 1,999,904 | | |
| | | TOTAL INVESTMENTS
(Cost $2,000,093) - 69.9% | | $ | 1,999,904 | | |
| | | Other Assets in Excess of
Liabilities - 30.1% (a) | | | 859,220 | | |
| | | TOTAL NET ASSETS - 100.0% | | $ | 2,859,124 | | |
Percentages are stated as a percent of net assets.
(a) $94,715 of cash is pledged as collateral for swap contracts.
Long Equity Swap Contracts
August 31, 2015
Counterparty | | Reference Entity | | Number of
Contracts | | Notional
Amount | | Interest
Rate
Received/
(Paid) | | Termination
Date | | Unrealized
Appreciation/
(Depreciation) | |
Credit Suisse Capital, LLC | | iShares iBoxx $ High Yield
Corporate Bond ETF | | | 8,278 | | | $ | 713,715 | | | | (0.102 | )% | | 4/18/2016 | | $ | 394 | | |
Credit Suisse Capital, LLC | | SPDR Barclays High Yield Bond ETF | | | 19,328 | | | | 716,122 | | | | (0.102 | )% | | 4/18/2016 | | | (548 | ) | |
| | | | | | | $ | 1,429,837 | | | | | | | $ | (154 | ) | |
The accompanying notes are an integral part of these financial statements.
DIREXION ANNUAL REPORT
34
Direxion Monthly China Bull 2X Fund
| | | | | Fair Value | |
No reportable investments. | |
| | | TOTAL INVESTMENTS
(Cost $—) - 0.0% | | $ | — | | |
| | | Other Assets in Excess of
Liabilities - 100.0% (a) | | | 5,510,083 | | |
| | | TOTAL NET ASSETS - 100.0% | | $ | 5,510,083 | | |
Percentages are stated as a percent of net assets.
(a) $5,390,000 of cash is pledged as collateral for swap contracts.
Long Equity Swap Contracts
August 31, 2015
Counterparty | | Reference Entity | | Number of
Contracts | | Notional
Amount | | Interest
Rate
Received/
(Paid) | | Termination
Date | | Unrealized
Appreciation/
(Depreciation) | |
Credit Suisse International | | iShares China Large-Cap ETF | | | 307,053 | | | $ | 11,027,376 | | | | 0.298 | % | | 6/27/2016 | | $ | (1,103 | ) | |
The accompanying notes are an integral part of these financial statements.
DIREXION ANNUAL REPORT
35
Direxion Monthly Emerging Markets Bull 2X Fund
| | | | | Fair Value | |
No reportable investments. | |
| | | TOTAL INVESTMENTS
(Cost $—) - 0.0% | | $ | — | | |
| | | Other Assets in Excess of
Liabilities - 100.0% (a) | | | 2,776,603 | | |
| | | TOTAL NET ASSETS - 100.0% | | $ | 2,776,603 | | |
Percentages are stated as a percent of net assets.
(a) $2,430,000 of cash is pledged as collateral for swap contracts.
Long Equity Swap Contracts
August 31, 2015
Counterparty | | Reference Entity | | Number of
Contracts | | Notional
Amount | | Interest
Rate
Received/
(Paid) | | Termination
Date | | Unrealized
Appreciation/
(Depreciation) | |
Bank of America Merrill Lynch | | iShares MSCI Emerging
Markets ETF | | | 20,696 | | | $ | 832,290 | | | | (1.050 | )% | | 7/20/2016 | | $ | (123,161 | ) | |
Bank of America Merrill Lynch | | iShares MSCI Emerging
Markets ETF | | | 43,216 | | | | 1,709,750 | | | | (1.050 | )% | | 8/17/2016 | | | (243,503 | ) | |
Bank of America Merrill Lynch | | iShares MSCI Emerging
Markets ETF | | | 82,854 | | | | 3,001,405 | | | | (1.050 | )% | | 9/21/2016 | | | (199,584 | ) | |
Bank of America Merrill Lynch | | iShares MSCI Emerging
Markets ETF | | | 17,363 | | | | 579,610 | | | | (1.047
(1.049)% | )% - | | 10/19/2016 | | | 7,863 | | |
| | | | | | | $ | 6,123,055 | | | | | | | $ | (558,385 | ) | |
The accompanying notes are an integral part of these financial statements.
DIREXION ANNUAL REPORT
36
Direxion Monthly Latin America Bull 2X Fund
| | | | | Fair Value | |
No reportable investments. | |
| | | TOTAL INVESTMENTS
(Cost $—) - 0.0% | | $ | — | | |
| | | Other Assets in Excess of
Liabilities - 100.0% (a) | | | 4,897,498 | | |
| | | TOTAL NET ASSETS - 100.0% | | $ | 4,897,498 | | |
Percentages are stated as a percent of net assets.
(a) $6,044,150 of cash is pledged as collateral for swap contracts.
Long Equity Swap Contracts
August 31, 2015
Counterparty | | Reference Entity | | Number of
Contracts | | Notional
Amount | | Interest
Rate
Received/
(Paid) | | Termination
Date | | Unrealized
Appreciation/
(Depreciation) | |
Bank of America Merrill Lynch | | iShares Latin America 40 ETF | | | 177,411 | | | $ | 5,813,341 | | | | (1.150 | )% | | 6/15/2016 | | $ | (1,418,619 | ) | |
Bank of America Merrill Lynch | | iShares Latin America 40 ETF | | | 62,657 | | | | 1,907,086 | | | | (1.150 | )% | | 7/20/2016 | | | (357,106 | ) | |
Bank of America Merrill Lynch | | iShares Latin America 40 ETF | | | 68,347 | | | | 2,042,510 | | | | (1.150 | )% | | 8/17/2016 | | | (367,181 | ) | |
Bank of America Merrill Lynch | | iShares Latin America 40 ETF | | | 74,441 | | | | 1,996,551 | | | | (1.150 | )% | | 9/21/2016 | | | (174,503 | ) | |
Bank of America Merrill Lynch | | iShares Latin America 40 ETF | | | 4,562 | | | | 114,105 | | | | (1.149 | )% | | 10/19/2016 | | | (2,336 | ) | |
Bank of America Merrill Lynch | |
iShares Latin America 40 ETF | | | 16,298 | | | | 376,104 | | | | (1.147
(1.149)% | )% - | | 10/19/2016 | | | 23,149 | | |
| | | | | | | $ | 12,249,697 | | | | | | | $ | (2,296,596 | ) | |
The accompanying notes are an integral part of these financial statements.
DIREXION ANNUAL REPORT
37
Direxion Monthly Natural Resources Bull 2X Fund
| | | | | Fair Value | |
No reportable investments. | |
| | | TOTAL INVESTMENTS
(Cost $—) - 0.0% | | $ | — | | |
| | | Other Assets in Excess of
Liabilities - 100.0% (a) | | | 5,433,367 | | |
| | | TOTAL NET ASSETS - 100.0% | | $ | 5,433,367 | | |
Percentages are stated as a percent of net assets.
(a) $5,920,000 of cash is pledged as collateral for swap contracts.
Long Equity Swap Contracts
August 31, 2015
Counterparty | | Reference Index | | Number of
Contracts | | Notional
Amount | | Interest
Rate
Received/
(Paid) | | Termination
Date | | Unrealized
Appreciation/
(Depreciation) | |
Bank of America Merrill Lynch | | S&P North American Natural
Resources Sector Index | | | 22,206 | | | $ | 5,342,488 | | | | (0.587
(0.629)% | )% - | | 3/16/2016 | | $ | (1,040,592 | ) | |
Bank of America Merrill Lynch | | S&P North American Natural
Resources Sector Index | | | 6,362 | | | | 1,469,584 | | | | (0.581 | )% | | 4/20/2016 | | | (240,148 | ) | |
Bank of America Merrill Lynch | | S&P North American Natural
Resources Sector Index | | | 934 | | | | 215,696 | | | | (0.587 | )% | | 5/18/2016 | | | (35,413 | ) | |
Bank of America Merrill Lynch | | S&P North American Natural
Resources Sector Index | | | 7,841 | | | | 1,893,241 | | | | (0.629 | )% | | 6/15/2016 | | | (381,597 | ) | |
Bank of America Merrill Lynch | | S&P North American Natural
Resources Sector Index | | | 9,876 | | | | 2,237,870 | | | | (0.581 | )% | | 7/20/2016 | | | (340,985 | ) | |
Bank of America Merrill Lynch | | S&P North American Natural
Resources Sector Index | | | 874 | | | | 190,269 | | | | (0.587 | )% | | 8/17/2016 | | | (22,527 | ) | |
Bank of America Merrill Lynch | | S&P North American Natural
Resources Sector Index | | | 6,042 | | | | 1,202,243 | | | | (0.629 | )% | | 9/21/2016 | | | (44,518 | ) | |
Bank of America Merrill Lynch | | S&P North American Natural
Resources Sector Index | | | 2,837 | | | | 500,780 | | | | (0.624
(0.632)% | )% - | | 10/19/2016 | | | 41,534 | | |
| | | | | | | $ | 13,052,171 | | | | | | | $ | (2,064,246 | ) | |
The accompanying notes are an integral part of these financial statements.
DIREXION ANNUAL REPORT
38
Statements of Assets & Liabilities
August 31, 2015
| | | Direxion Monthly
NASDAQ-100® Bull
2X Fund | | Direxion Monthly
S&P 500® Bull
2X Fund | | Direxion Monthly
S&P 500® Bear
2X Fund | |
Assets: | |
Cash | | $ | 88,952,594 | | | $ | 33,697,923 | | | $ | 7,160,007 | | |
Receivable for Fund shares sold | | | 1,936,323 | | | | 402,353 | | | | 587,479 | | |
Deposits at broker for swaps | | | 40,880,000 | | | | 14,140,000 | | | | 2,110,000 | | |
Dividends and interest receivable | | | 1,258 | | | | 354 | | | | 87 | | |
Total Assets | | | 131,770,175 | | | | 48,240,630 | | | | 9,857,573 | | |
Liabilities: | |
Payable for Fund shares redeemed | | | 808,636 | | | | 160,247 | | | | 223,344 | | |
Due to broker for swaps | | | 14,594,403 | | | | 4,701,774 | | | | — | | |
Unrealized depreciation on swaps | | | — | | | | — | | | | 557,364 | | |
Accrued investment advisory fees | | | 108,228 | | | | 27,425 | | | | 6,192 | | |
Accrued operating services fees | | | 50,507 | | | | 12,798 | | | | 2,890 | | |
Accrued distribution expenses | | | 36,077 | | | | 9,141 | | | | 2,064 | | |
Other liabilities | | | 19 | | | | — | | | | 13 | | |
Total Liabilities | | | 15,597,870 | | | | 4,911,385 | | | | 791,867 | | |
Net Assets | | $ | 116,172,305 | | | $ | 43,329,245 | | | $ | 9,065,706 | | |
Net Assets Consist of: | |
Capital stock | | $ | 119,901,204 | | | $ | 44,398,405 | | | $ | 67,529,899 | | |
Accumulated net investment loss | | | — | | | | (519,509 | ) | | | (108,403 | ) | |
Undistributed (Accumulated) net realized gain (loss) | | | (3,728,899 | ) | | | (549,651 | ) | | | (57,798,426 | ) | |
Net unrealized appreciation (depreciation) on: | |
Swaps | | | — | | | | — | | | | (557,364 | ) | |
Total Net Assets | | $ | 116,172,305 | | | $ | 43,329,245 | | | $ | 9,065,706 | | |
Calculation of Net Asset Value Per Share: | |
Net assets | | $ | 116,172,305 | | | $ | 43,329,245 | | | $ | 9,065,706 | | |
Shares outstanding (unlimited shares of beneficial
interest authorized, no par value) | | | 2,128,020 | | | | 522,992 | | | | 293,307 | | |
Net asset value, redemption price and offering
price per share | | $ | 54.59 | | | $ | 82.85 | | | $ | 30.91 | | |
Cost of Investments | | $ | — | | | $ | — | | | $ | — | | |
The accompanying notes are an integral part of these financial statements.
DIREXION ANNUAL REPORT
39
Statements of Assets & Liabilities
August 31, 2015
| | | Direxion Monthly
Small Cap Bull
2X Fund | | Direxion Monthly
Small Cap Bear
2X Fund | | Direxion Monthly
7-10 Year Treasury
Bull 2X Fund | | Direxion Monthly
7-10 Year Treasury
Bear 2X Fund | |
Assets: | |
Cash | | $ | 11,528,031 | | | $ | 6,830,131 | | | $ | 45,452,324 | | | $ | 13,942,224 | | |
Receivable for Fund shares sold | | | 272,245 | | | | 46,948 | | | | 4,508,276 | | | | 2,765 | | |
Deposits at broker for swaps | | | 5,920,000 | | | | 1,850,000 | | | | 20,400,000 | | | | 6,510,000 | | |
Due from broker for swaps | | | — | | | | — | | | | 830 | | | | — | | |
Dividends and interest receivable | | | 162 | | | | 82 | | | | 377 | | | | 160 | | |
Total Assets | | | 17,720,438 | | | | 8,727,161 | | | | 70,361,807 | | | | 20,455,149 | | |
Liabilities: | |
Payable for Fund shares redeemed | | | 27,005 | | | | 501,879 | | | | 239,962 | | | | 29,760 | | |
Due to broker for swaps | | | 1,090,542 | | | | 295 | | | | — | | | | 36,251 | | |
Unrealized depreciation on swaps | | | 1,256,737 | | | | 639,489 | | | | 226,452 | | | | 429,856 | | |
Accrued investment advisory fees | | | 12,017 | | | | 5,489 | | | | 25,304 | | | | 13,414 | | |
Accrued operating services fees | | | 5,608 | | | | 2,561 | | | | 11,808 | | | | 6,260 | | |
Accrued distribution expenses | | | 4,005 | | | | 1,830 | | | | 8,434 | | | | 4,471 | | |
Other liabilities | | | — | | | | 13 | | | | 79 | | | | — | | |
Total Liabilities | | | 2,395,914 | | | | 1,151,556 | | | | 512,039 | | | | 520,012 | | |
Net Assets | | $ | 15,324,524 | | | $ | 7,575,605 | | | $ | 69,849,768 | | | $ | 19,935,137 | | |
Net Assets Consist of: | |
Capital stock | | $ | 18,805,173 | | | $ | 59,373,046 | | | $ | 80,609,884 | | | $ | 44,633,884 | | |
Accumulated net investment loss | | | (425,002 | ) | | | (80,328 | ) | | | (353,588 | ) | | | (128,219 | ) | |
Accumulated net realized loss | | | (1,798,910 | ) | | | (51,077,624 | ) | | | (10,180,076 | ) | | | (24,140,672 | ) | |
Net unrealized appreciation
(depreciation) on: | |
Swaps | | | (1,256,737 | ) | | | (639,489 | ) | | | (226,452 | ) | | | (429,856 | ) | |
Total Net Assets | | $ | 15,324,524 | | | $ | 7,575,605 | | | $ | 69,849,768 | | | $ | 19,935,137 | | |
Calculation of Net Asset Value Per
Share: | |
Net assets | | $ | 15,324,524 | | | $ | 7,575,605 | | | $ | 69,849,768 | | | $ | 19,935,137 | | |
Shares outstanding (unlimited shares
of beneficial interest authorized,
no par value) | | | 337,723 | | | | 219,789 | | | | 2,033,010 | | | | 603,841 | | |
Net asset value, redemption price
and offering price per share | | $ | 45.38 | | | $ | 34.47 | | | $ | 34.36 | | | $ | 33.01 | | |
Cost of Investments | | $ | — | | | $ | — | | | $ | — | | | $ | — | | |
The accompanying notes are an integral part of these financial statements.
DIREXION ANNUAL REPORT
40
Statements of Assets & Liabilities
August 31, 2015
| | | Direxion Dynamic
HY Bond Fund | | Direxion Monthly
China Bull 2X Fund | | Direxion Monthly
Emerging Markets
Bull 2X Fund | | Direxion Monthly
Latin America Bull
2X Fund | |
Assets: | |
Investments, at fair value (Note 2) | | $ | 1,999,904 | | | $ | — | | | $ | — | | | $ | — | | |
Cash | | | 374,818 | | | | 2,008,797 | | | | 1,105,671 | | | | 1,556,402 | | |
Receivable for Fund shares sold | | | 649,804 | | | | 92,260 | | | | 39,164 | | | | 60,432 | | |
Deposits at broker for swaps | | | 94,715 | | | | 5,390,000 | | | | 2,430,000 | | | | 6,044,150 | | |
Unrealized appreciation on swaps | | | 394 | | | | — | | | | 7,863 | | | | 23,149 | | |
Receivable for investments sold | | | 290,891 | | | | — | | | | — | | | | — | | |
Dividends and interest receivable | | | 7 | | | | 32 | | | | 12 | | | | 20 | | |
Total Assets | | | 3,410,533 | | | | 7,491,089 | | | | 3,582,710 | | | | 7,684,153 | | |
Liabilities: | |
Payable for Fund shares redeemed | | | 413,883 | | | | 22,598 | | | | 71,844 | | | | 59,870 | | |
Payable for investment purchased | | | 132,201 | | | | — | | | | — | | | | — | | |
Due to broker for swaps | | | 2,798 | | | | 1,949,498 | | | | 164,479 | | | | 401,043 | | |
Unrealized depreciation on swaps | | | 548 | | | | 1,103 | | | | 566,248 | | | | 2,319,745 | | |
Accrued investment advisory fees | | | 1,100 | | | | 4,337 | | | | 1,964 | | | | 3,331 | | |
Accrued operating services fees | | | 513 | | | | 2,024 | | | | 917 | | | | 1,555 | | |
Accrued distribution expenses | | | 366 | | | | 1,446 | | | | 655 | | | | 1,111 | | |
Total Liabilities | | | 551,409 | | | | 1,981,006 | | | | 806,107 | | | | 2,786,655 | | |
Net Assets | | $ | 2,859,124 | | | $ | 5,510,083 | | | $ | 2,776,603 | | | $ | 4,897,498 | | |
Net Assets Consist of: | |
Capital stock | | $ | 19,348,812 | | | $ | 21,914,861 | | | $ | 57,371,234 | | | $ | 193,598,560 | | |
Undistributed (Accumulated)
net investment income (loss) | | | 180,235 | | | | (80,671 | ) | | | (61,317 | ) | | | (64,544 | ) | |
Accumulated net realized loss | | | (16,669,580 | ) | | | (16,323,004 | ) | | | (53,974,929 | ) | | | (186,339,922 | ) | |
Net unrealized appreciation
(depreciation) on: | |
Investments | | | (189 | ) | | | — | | | | — | | | | — | | |
Swaps | | | (154 | ) | | | (1,103 | ) | | | (558,385 | ) | | | (2,296,596 | ) | |
Total Net Assets | | $ | 2,859,124 | | | $ | 5,510,083 | | | $ | 2,776,603 | | | $ | 4,897,498 | | |
Calculation of Net Asset Value Per
Share: | |
Net assets | | $ | 2,859,124 | | | $ | 5,510,083 | | | $ | 2,776,603 | | | $ | 4,897,498 | | |
Shares outstanding (unlimited shares
of beneficial interest authorized,
no par value) | | | 219,253 | | | | 179,462 | | | | 90,183 | | | | 430,702 | | |
Net asset value, redemption price
and offering price per share | | $ | 13.0403 | | | $ | 30.70 | | | $ | 30.79 | | | $ | 11.37 | | |
Cost of Investments | | $ | 2,000,093 | | | $ | — | | | $ | — | | | $ | — | | |
The accompanying notes are an integral part of these financial statements.
DIREXION ANNUAL REPORT
41
Statements of Assets & Liabilities
August 31, 2015
| | | Direxion Monthly Natural
Resources Bull 2X Fund | |
Assets: | |
Cash | | $ | 1,798,530 | | |
Receivable for Fund shares sold | | | 16,200 | | |
Deposits at broker for swaps | | | 5,920,000 | | |
Unrealized appreciation on swaps | | | 41,534 | | |
Dividends and interest receivable | | | 21 | | |
Total Assets | | | 7,776,285 | | |
Liabilities: | |
Payable for Fund shares redeemed | | | 24,551 | | |
Due to broker for swaps | | | 206,454 | | |
Unrealized depreciation on swaps | | | 2,105,780 | | |
Accrued investment advisory fees | | | 3,407 | | |
Accrued operating services fees | | | 1,590 | | |
Accrued distribution expenses | | | 1,136 | | |
Total Liabilities | | | 2,342,918 | | |
Net Assets | | $ | 5,433,367 | | |
Net Assets Consist of: | |
Capital stock | | $ | 35,377,877 | | |
Accumulated net investment loss | | | (58,552 | ) | |
Accumulated net realized loss | | | (27,821,712 | ) | |
Net unrealized appreciation (depreciation) on: | |
Swaps | | | (2,064,246 | ) | |
Total Net Assets | | $ | 5,433,367 | | |
Calculation of Net Asset Value Per Share: | |
Net assets | | $ | 5,433,367 | | |
Shares outstanding (unlimited shares of beneficial interest authorized, no par value) | | | 174,852 | | |
Net asset value, redemption price and offering price per share | | $ | 31.07 | | |
Cost of Investments | | $ | — | | |
The accompanying notes are an integral part of these financial statements.
DIREXION ANNUAL REPORT
42
Statements of Operations
For the Year Ended August 31, 2015
| | | Direxion Monthly
NASDAQ-100® Bull
2X Fund | | Direxion Monthly
S&P 500® Bull
2X Fund | | Direxion Monthly
S&P 500® Bear
2X Fund | |
Investment Income: | |
Interest income | | $ | 29,455 | | | $ | 7,488 | | | $ | 1,675 | | |
Total investment income | | | 29,455 | | | | 7,488 | | | | 1,675 | | |
Expenses: | |
Investment advisory fees | | | 1,313,515 | | | | 405,275 | | | | 84,551 | | |
Operating services fees | | | 612,973 | | | | 189,128 | | | | 39,458 | | |
Distribution expenses | | | 437,838 | | | | 135,092 | | | | 28,183 | | |
Total expenses | | | 2,364,326 | | | | 729,495 | | | | 152,192 | | |
Net investment loss | | | (2,334,871 | ) | | | (722,007 | ) | | | (150,517 | ) | |
Realized and unrealized gain (loss)
on investments: | |
Net realized gain (loss) on: | |
Swaps | | | 5,901,619 | | | | (33,117 | ) | | | (946,460 | ) | |
| | | | 5,901,619 | | | | (33,117 | ) | | | (946,460 | ) | |
Change in net unrealized appreciation
(depreciation) on: | |
Swaps | | | (14,550,792 | ) | | | (1,025,319 | ) | | | (217,548 | ) | |
| | | | (14,550,792 | ) | | | (1,025,319 | ) | | | (217,548 | ) | |
Net realized and unrealized (loss)
on investments | | | (8,649,173 | ) | | | (1,058,436 | ) | | | (1,164,008 | ) | |
Net decrease in net assets resulting
from operations | | $ | (10,984,044 | ) | | $ | (1,780,443 | ) | | $ | (1,314,525 | ) | |
The accompanying notes are an integral part of these financial statements.
DIREXION ANNUAL REPORT
43
Statements of Operations
For the Year Ended August 31, 2015
| | | Direxion Monthly
Small Cap Bull
2X Fund | | Direxion Monthly
Small Cap Bear
2X Fund | | Direxion Monthly
7-10 Year Treasury
Bull 2X Fund | | Direxion Monthly
7-10 Year Treasury
Bear 2X Fund | |
Investment Income: | |
Interest income | | $ | 5,023 | | | $ | 1,814 | | | $ | 8,261 | | | $ | 1,490 | | |
Total investment income | | | 5,023 | | | | 1,814 | | | | 8,261 | | | | 1,490 | | |
Expenses: | |
Investment advisory fees | | | 312,253 | | | | 77,808 | | | | 383,137 | | | | 95,574 | | |
Operating services fees | | | 145,718 | | | | 36,311 | | | | 178,797 | | | | 44,601 | | |
Distribution expenses | | | 104,085 | | | | 25,936 | | | | 127,712 | | | | 31,858 | | |
Total expenses before
reimbursement and excise taxes | | | 562,056 | | | | 140,055 | | | | 689,646 | | | | 172,033 | | |
Excise taxes | | | — | | | | 10 | | | | — | | | | 1 | | |
Less: Reimbursement of expenses
from Adviser | | | — | | | | — | | | | (18,902 | ) | | | — | | |
Total expenses | | | 562,056 | | | | 140,065 | | | | 670,744 | | | | 172,034 | | |
Net investment loss | | | (557,033 | ) | | | (138,251 | ) | | | (662,483 | ) | | | (170,544 | ) | |
Realized and unrealized gain
(loss) on investments: | |
Net realized gain (loss) on: | |
Swaps | | | 945,451 | | | | (1,481,878 | ) | | | 3,176,488 | | | | (775,504 | ) | |
| | | | 945,451 | | | | (1,481,878 | ) | | | 3,176,488 | | | | (775,504 | ) | |
Change in net unrealized appreciation
(depreciation) on: | |
Swaps | | | (1,737,143 | ) | | | 518,450 | | | | (1,008,961 | ) | | | (165,641 | ) | |
| | | | (1,737,143 | ) | | | 518,450 | | | | (1,008,961 | ) | | | (165,641 | ) | |
Net realized and unrealized
gain (loss) on investments | | | (791,692 | ) | | | (963,428 | ) | | | 2,167,527 | | | | (941,145 | ) | |
Net increase (decrease) in net assets
resulting from operations | | $ | (1,348,725 | ) | | $ | (1,101,679 | ) | | $ | 1,505,044 | | | $ | (1,111,689 | ) | |
The accompanying notes are an integral part of these financial statements.
DIREXION ANNUAL REPORT
44
Statements of Operations
For the Year Ended August 31, 2015
| | | Direxion Dynamic
HY Bond Fund | | Direxion Monthly
China Bull 2X Fund | | Direxion Monthly
Emerging Markets
Bull 2X Fund | | Direxion Monthly
Latin America Bull
2X Fund | |
Investment Income: | |
Dividend income | | $ | 4,253,490 | | | $ | — | | | $ | — | | | $ | — | | |
Interest income | | | 2,421 | | | | 662 | | | | 1,707 | | | | 1,996 | | |
Total investment income | | | 4,255,911 | | | | 662 | | | | 1,707 | | | | 1,996 | | |
Expenses: | |
Investment advisory fees | | | 795,515 | | | | 58,639 | | | | 84,113 | | | | 65,155 | | |
Operating services fees | | | 371,240 | | | | 27,365 | | | | 39,253 | | | | 30,406 | | |
Distribution expenses | | | 265,171 | | | | 19,546 | | | | 28,038 | | | | 21,718 | | |
Total expenses before
reimbursement | | | 1,431,926 | | | | 105,550 | | | | 151,404 | | | | 117,279 | | |
Less: Reimbursement of expenses
from Adviser | | | (135 | ) | | | — | | | | — | | | | — | | |
Total expenses | | | 1,431,791 | | | | 105,550 | | | | 151,404 | | | | 117,279 | | |
Net investment income (loss) | | | 2,824,120 | | | | (104,888 | ) | | | (149,697 | ) | | | (115,283 | ) | |
Realized and unrealized gain
(loss) on investments: | |
Net realized gain (loss) on: | |
Investments | | | (3,208,329 | ) | | | — | | | | — | | | | — | | |
Swaps | | | 723,363 | | | | (4,961,461 | ) | | | (15,146,925 | ) | | | (8,157,143 | ) | |
| | | | (2,484,966 | ) | | | (4,961,461 | ) | | | (15,146,925 | ) | | | (8,157,143 | ) | |
Change in net unrealized appreciation
(depreciation) on: | |
Investments | | | (172,531 | ) | | | — | | | | — | | | | — | | |
Swaps | | | (329 | ) | | | 58,015 | | | | (519,778 | ) | | | (2,841,310 | ) | |
| | | | (172,860 | ) | | | 58,015 | | | | (519,778 | ) | | | (2,841,310 | ) | |
Net realized and unrealized (loss)
on investments | | | (2,657,826 | ) | | | (4,903,446 | ) | | | (15,666,703 | ) | | | (10,998,453 | ) | |
Net increase (decrease) in net assets
resulting from operations | | $ | 166,294 | | | $ | (5,008,334 | ) | | $ | (15,816,400 | ) | | $ | (11,113,736 | ) | |
The accompanying notes are an integral part of these financial statements.
DIREXION ANNUAL REPORT
45
Statements of Operations
For the Year Ended August 31, 2015
| | | Direxion Monthly
Natural Resources
Bull 2X Fund | |
Investment Income: | |
Interest income | | $ | 1,514 | | |
Total investment income | | | 1,514 | | |
Expenses: | |
Investment advisory fees | | | 53,362 | | |
Operating services fees | | | 24,902 | | |
Distribution expenses | | | 17,787 | | |
Total expenses | | | 96,051 | | |
Net investment loss | | | (94,537 | ) | |
Realized and unrealized gain (loss) on investments: | |
Net realized gain (loss) on: | |
Swaps | | | (5,048,486 | ) | |
| | | | (5,048,486 | ) | |
Change in net unrealized appreciation (depreciation) on: | |
Swaps | | | (1,753,957 | ) | |
| | | | (1,753,957 | ) | |
Net realized and unrealized (loss) on investments | | | (6,802,443 | ) | |
Net decrease in net assets resulting from operations | | $ | (6,896,980 | ) | |
The accompanying notes are an integral part of these financial statements.
DIREXION ANNUAL REPORT
46
Statements of Changes in Net Assets
| | | Direxion Monthly
NASDAQ-100® Bull 2X Fund | |
| | | Year Ended
August 31, 2015 | | Year Ended
August 31, 2014 | |
Increase (Decrease) in net assets from: | |
Operations: | |
Net investment loss | | $ | (2,334,871 | ) | | $ | (1,935,410 | ) | |
Net realized gain on investments | | | 5,901,619 | | | | 14,687,142 | | |
Change in net unrealized appreciation (depreciation) of investments | | | (14,550,792 | ) | | | 15,538,493 | | |
Net increase (decrease) in net assets resulting from operations | | | (10,984,044 | ) | | | 28,290,225 | | |
Distributions to shareholders: | |
Net realized gains | | | (2,798,329 | ) | | | — | | |
Total distributions to shareholders | | | (2,798,329 | ) | | | — | | |
Capital share transactions: | |
Net increase (decrease) in net assets resulting from
net change capital share transactions(a) | | | (159,404,286 | ) | | | 236,554,245 | | |
Total increase (decrease) in net assets | | | (173,186,659 | ) | | | 264,844,470 | | |
Net assets: | |
Beginning of year | | | 289,358,964 | | | | 24,514,494 | | |
End of year | | $ | 116,172,305 | | | $ | 289,358,964 | | |
Undistributed (accumulated) net investment loss, end of year | | $ | — | | | $ | — | | |
(a) Summary of capital share transactions is as follows:
| | | Direxion Monthly NASDAQ-100® Bull 2X Fund | |
| | | Year Ended
August 31, 2015 | | Year Ended
August 31, 2014 | |
| | | Shares | | Value | | Shares | | Value | |
Shares sold | | | 13,677,903 | | | $ | 760,360,238 | | | | 21,393,704 | | | $ | 880,465,872 | | |
Shares issued in reinvestment of distributions | | | 54,862 | | | | 2,774,372 | | | | — | | | | — | | |
Shares redeemed | | | (17,242,086 | ) | | | (922,538,896 | ) | | | (16,592,073 | ) | | | (643,911,627 | ) | |
Net increase (decrease) | | | (3,509,321 | ) | | $ | (159,404,286 | ) | | | 4,801,631 | | | $ | 236,554,245 | | |
The accompanying notes are an integral part of these financial statements.
DIREXION ANNUAL REPORT
47
Statements of Changes in Net Assets
| | | Direxion Monthly
S&P 500® Bull 2X Fund | | Direxion Monthly
S&P 500® Bear 2X Fund | |
| | | Year Ended
August 31, 2015 | | Year Ended
August 31, 2014 | | Year Ended
August 31, 2015 | | Year Ended
August 31, 2014 | |
Increase (Decrease) in net assets from: | |
Operations: | |
Net investment loss | | $ | (722,007 | ) | | $ | (507,466 | ) | | $ | (150,517 | ) | | $ | (88,566 | ) | |
Net realized gain (loss) on investments | | | (33,117 | ) | | | 13,156,548 | | | | (946,460 | ) | | | (3,262,193 | ) | |
Change in net unrealized appreciation
(depreciation) of investments | | | (1,025,319 | ) | | | 2,435,726 | | | | (217,548 | ) | | | (417,577 | ) | |
Net increase (decrease) in net assets
resulting from operations | | | (1,780,443 | ) | | | 15,084,808 | | | | (1,314,525 | ) | | | (3,768,336 | ) | |
Distributions to shareholders: | |
Net realized gains | | | (2,119,047 | ) | | | (2,154,462 | ) | | | — | | | | — | | |
Total distributions to shareholders | | | (2,119,047 | ) | | | (2,154,462 | ) | | | — | | | | — | | |
Capital share transactions: | |
Net increase (decrease) in net assets resulting
from net change capital share transactions(a) | | | 7,409,230 | | | | (5,117,693 | ) | | | 3,915,975 | | | | 2,377,877 | | |
Total increase (decrease) in net assets | | | 3,509,740 | | | | 7,812,653 | | | | 2,601,450 | | | | (1,390,459 | ) | |
Net assets: | |
Beginning of year | | | 39,819,505 | | | | 32,006,852 | | | | 6,464,256 | | | | 7,854,715 | | |
End of year | | $ | 43,329,245 | | | $ | 39,819,505 | | | $ | 9,065,706 | | | $ | 6,464,256 | | |
Undistributed (accumulated) net
investment loss, end of year | | $ | (519,509 | ) | | $ | — | | | $ | (108,403 | ) | | $ | (59,715 | ) | |
(a) Summary of capital share transactions is as follows:
| | | Direxion Monthly S&P 500® Bull 2X Fund | |
| | | Year Ended
August 31, 2015 | | Year Ended
August 31, 2014 | |
| | | Shares | | Value | | Shares | | Value | |
Shares sold | | | 3,462,446 | | | $ | 312,356,524 | | | | 2,138,072 | | | $ | 162,955,007 | | |
Shares issued in reinvestment of distributions | | | 23,703 | | | | 1,955,730 | | | | 30,402 | | | | 2,108,993 | | |
Shares redeemed | | | (3,412,355 | ) | | | (306,903,024 | ) | | | (2,240,344 | ) | | | (170,181,693 | ) | |
Net increase (decrease) | | | 73,794 | | | $ | 7,409,230 | | | | (71,870 | ) | | $ | (5,117,693 | ) | |
| | | Direxion Monthly S&P 500® Bear 2X Fund | |
| | | Year Ended
August 31, 2015 | | Year Ended
August 31, 2014 | |
| | | Shares | | Value | | Shares | | Value | |
Shares sold | | | 3,150,905 | | | $ | 94,324,948 | | | | 1,956,747 | | | $ | 76,954,279 | | |
Shares redeemed | | | (3,055,183 | ) | | | (90,408,973 | ) | | | (1,905,085 | ) | | | (74,576,402 | ) | |
Net increase | | | 95,722 | | | $ | 3,915,975 | | | | 51,662 | | | $ | 2,377,877 | | |
The accompanying notes are an integral part of these financial statements.
DIREXION ANNUAL REPORT
48
Statements of Changes in Net Assets
| | | Direxion Monthly
Small Cap Bull 2X Fund | | Direxion Monthly
Small Cap Bear 2X Fund | |
| | | Year Ended
August 31, 2015 | | Year Ended
August 31, 2014 | | Year Ended
August 31, 2015 | | Year Ended
August 31, 2014 | |
Increase (Decrease) in net assets from: | |
Operations: | |
Net investment loss | | $ | (557,033 | ) | | $ | (255,169 | ) | | $ | (138,251 | ) | | $ | (250,920 | ) | |
Net realized gain (loss) on investments | | | 945,451 | | | | 3,994,748 | | | | (1,481,878 | ) | | | (9,383,003 | ) | |
Change in net unrealized appreciation
(depreciation) of investments | | | (1,737,143 | ) | | | 1,252,755 | | | | 518,450 | | | | (452,535 | ) | |
Net increase (decrease) in net assets
resulting from operations | | | (1,348,725 | ) | | | 4,992,334 | | | | (1,101,679 | ) | | | (10,086,458 | ) | |
Distributions to shareholders: | |
Net realized gains | | | (2,191 | ) | | | (331,257 | ) | | | — | | | | — | | |
Total distributions to shareholders | | | (2,191 | ) | | | (331,257 | ) | | | — | | | | — | | |
Capital share transactions: | |
Net increase (decrease) in net assets resulting
from net change capital share transactions(a) | | | (8,591,043 | ) | | | 5,258,321 | | | | (6,862,484 | ) | | | 8,039,393 | | |
Total increase (decrease) in net assets | | | (9,941,959 | ) | | | 9,919,398 | | | | (7,964,163 | ) | | | (2,047,065 | ) | |
Net assets: | |
Beginning of year | | | 25,266,483 | | | | 15,347,085 | | | | 15,539,768 | | | | 17,586,833 | | |
End of year | | $ | 15,324,524 | | | $ | 25,266,483 | | | $ | 7,575,605 | | | $ | 15,539,768 | | |
Undistributed (accumulated) net
investment loss, end of year | | $ | (425,002 | ) | | $ | — | | | $ | (80,328 | ) | | $ | (192,705 | ) | |
(a) Summary of capital share transactions is as follows:
| | | Direxion Monthly Small Cap Bull 2X Fund | |
| | | Year Ended
August 31, 2015 | | Year Ended
August 31, 2014 | |
| | | Shares | | Value | | Shares | | Value | |
Shares sold | | | 8,412,299 | | | $ | 417,328,234 | | | | 2,227,445 | | | $ | 99,319,975 | | |
Shares issued in reinvestment of distributions | | | 48 | | | | 2,120 | | | | 7,495 | | | | 320,109 | | |
Shares redeemed | | | (8,612,801 | ) | | | (425,921,397 | ) | | | (2,129,983 | ) | | | (94,381,763 | ) | |
Net increase (decrease) | | | (200,454 | ) | | $ | (8,591,043 | ) | | | 104,957 | | | $ | 5,258,321 | | |
| | | Direxion Monthly Small Cap Bear 2X Fund | |
| | | Year Ended
August 31, 2015 | | Year Ended
August 31, 2014 | |
| | | Shares | | Value | | Shares | | Value | |
Shares sold | | | 992,281 | | | $ | 34,065,338 | | | | 3,205,769 | | | $ | 137,912,976 | | |
Shares redeemed | | | (1,184,090 | ) | | | (40,927,822 | ) | | | (3,101,812 | ) | | | (129,873,583 | ) | |
Net increase (decrease) | | | (191,809 | ) | | $ | (6,862,484 | ) | | | 103,957 | | | $ | 8,039,393 | | |
The accompanying notes are an integral part of these financial statements.
DIREXION ANNUAL REPORT
49
Statements of Changes in Net Assets
| | | Direxion Monthly
7-10 Year Treasury Bull 2X Fund | | Direxion Monthly
7-10 Year Treasury Bear 2X Fund | |
| | | Year Ended
August 31, 2015 | | Year Ended
August 31, 2014 | | Year Ended
August 31, 2015 | | Year Ended
August 31, 2014 | |
Increase (Decrease) in net assets from: | |
Operations: | |
Net investment loss | | $ | (662,483 | ) | | $ | (276,819 | ) | | $ | (170,544 | ) | | $ | (132,655 | ) | |
Net realized gain (loss) on investments | | | 3,176,488 | | | | 1,656,931 | | | | (775,504 | ) | | | (1,111,138 | ) | |
Change in net unrealized appreciation
(depreciation) of investments | | | (1,008,961 | ) | | | 983,215 | | | | (165,641 | ) | | | (409,004 | ) | |
Net increase (decrease) in net assets
resulting from operations | | | 1,505,044 | | | | 2,363,327 | | | | (1,111,689 | ) | | | (1,652,797 | ) | |
Distributions to shareholders: | |
Total distributions to shareholders | | | — | | | | — | | | | — | | | | — | | |
Capital share transactions: | |
Net increase (decrease) in net assets resulting
from net change capital share transactions(a) | | | 46,109,244 | | | | (3,665,142 | ) | | | 13,037,274 | | | | (366,796 | ) | |
Total increase (decrease) in net assets | | | 47,614,288 | | | | (1,301,815 | ) | | | 11,925,585 | | | | (2,019,593 | ) | |
Net assets: | |
Beginning of year | | | 22,235,480 | | | | 23,537,295 | | | | 8,009,552 | | | | 10,029,145 | | |
End of year | | $ | 69,849,768 | | | $ | 22,235,480 | | | $ | 19,935,137 | | | $ | 8,009,552 | | |
Undistributed (accumulated) net
investment loss, end of year | | $ | (353,588 | ) | | $ | (178,823 | ) | | $ | (128,219 | ) | | $ | (134,727 | ) | |
(a) Summary of capital share transactions is as follows:
| | | Direxion Monthly 7-10 Year Treasury Bull 2X Fund | |
| | | Year Ended
August 31, 2015 | | Year Ended
August 31, 2014 | |
| | | Shares | | Value | | Shares | | Value | |
Shares sold | | | 17,936,641 | | | $ | 611,877,170 | | | | 2,630,075 | | | $ | 81,508,250 | | |
Shares redeemed | | | (16,577,248 | ) | | | (565,767,926 | ) | | | (2,754,949 | ) | | | (85,173,392 | ) | |
Net increase (decrease) | | | 1,359,393 | | | $ | 46,109,244 | | | | (124,874 | ) | | $ | (3,665,142 | ) | |
| | | Direxion Monthly 7-10 Year Treasury Bear 2X Fund | |
| | | Year Ended
August 31, 2015 | | Year Ended
August 31, 2014 | |
| | | Shares | | Value | | Shares | | Value | |
Shares sold | | | 4,104,900 | | | $ | 139,053,695 | | | | 1,193,886 | | | $ | 48,023,458 | | |
Shares redeemed | | | (3,719,530 | ) | | | (126,016,421 | ) | | | (1,207,923 | ) | | | (48,390,254 | ) | |
Net increase (decrease) | | | 385,370 | | | $ | 13,037,274 | | | | (14,037 | ) | | $ | (366,796 | ) | |
The accompanying notes are an integral part of these financial statements.
DIREXION ANNUAL REPORT
50
Statements of Changes in Net Assets
| | | Direxion Dynamic
HY Bond Fund | | Direxion Monthly
China Bull 2X Fund | |
| | | Year Ended
August 31, 2015 | | Year Ended
August 31, 2014 | | Year Ended
August 31, 2015 | | Year Ended
August 31, 2014 | |
Increase (Decrease) in net assets from: | |
Operations: | |
Net investment income (loss) | | $ | 2,824,120 | | | $ | 433,992 | | | $ | (104,888 | ) | | $ | (76,878 | ) | |
Net realized gain (loss) on investments | | | (2,484,966 | ) | | | 315,795 | | | | (4,961,461 | ) | | | (331,542 | ) | |
Change in net unrealized appreciation
(depreciation) of investments | | | (172,860 | ) | | | 98,590 | | | | 58,015 | | | | 56,742 | | |
Net increase (decrease) in net assets
resulting from operations | | | 166,294 | | | | 848,377 | | | | (5,008,334 | ) | | | (351,678 | ) | |
Distributions to shareholders: | |
Net investment income: | | | (2,647,444 | ) | | | (460,737 | ) | | | — | | | | — | | |
Total distributions to shareholders | | | (2,647,444 | ) | | | (460,737 | ) | | | — | | | | — | | |
Capital share transactions: | |
Net increase (decrease) in net assets resulting
from net change capital share transactions(a) | | | (2,457,262 | ) | | | (8,659,848 | ) | | | 4,740,526 | | | | 1,845,460 | | |
Total increase (decrease) in net assets | | | (4,938,412 | ) | | | (8,272,208 | ) | | | (267,808 | ) | | | 1,493,782 | | |
Net assets: | |
Beginning of year | | | 7,797,536 | | | | 16,069,744 | | | | 5,777,891 | | | | 4,284,109 | | |
End of year | | $ | 2,859,124 | | | $ | 7,797,536 | | | $ | 5,510,083 | | | $ | 5,777,891 | | |
Undistributed (accumulated) net
investment income (loss), end of year | | $ | 180,235 | | | $ | 3,559 | | | $ | (80,671 | ) | | $ | (37,322 | ) | |
(a) Summary of capital share transactions is as follows:
| | | Direxion Dynamic HY Bond Fund | |
| | | Year Ended
August 31, 2015 | | Year Ended
August 31, 2014 | |
| | | Shares | | Value | | Shares | | Value | |
Shares sold | | | 41,481,029 | | | $ | 574,226,258 | | | | 9,519,510 | | | $ | 134,285,871 | | |
Shares issued in reinvestment of distributions | | | 147,206 | | | | 2,047,128 | | | | 31,613 | | | | 447,603 | | |
Shares redeemed | | | (41,947,472 | ) | | | (578,730,648 | ) | | | (10,191,968 | ) | | | (143,393,322 | ) | |
Net decrease | | | (319,237 | ) | | $ | (2,457,262 | ) | | | (640,845 | ) | | $ | (8,659,848 | ) | |
| | | Direxion Monthly China Bull 2X Fund | |
| | | Year Ended
August 31, 2015 | | Year Ended
August 31, 2014 | |
| | | Shares | | Value | | Shares | | Value | |
Shares sold | | | 2,353,410 | | | $ | 113,190,270 | | | | 1,705,547 | | | $ | 61,734,793 | | |
Shares redeemed | | | (2,315,022 | ) | | | (108,449,744 | ) | | | (1,702,755 | ) | | | (59,889,333 | ) | |
Net increase | | | 38,388 | | | $ | 4,740,526 | | | | 2,792 | | | $ | 1,845,460 | | |
The accompanying notes are an integral part of these financial statements.
DIREXION ANNUAL REPORT
51
Statements of Changes in Net Assets
| | | Direxion Monthly
Emerging Markets Bull 2X Fund | | Direxion Monthly
Latin America Bull 2X Fund | |
| | | Year Ended
August 31, 2015 | | Year Ended
August 31, 2014 | | Year Ended
August 31, 2015 | | Year Ended
August 31, 2014 | |
Increase (Decrease) in net assets from: | |
Operations: | |
Net investment loss | | $ | (149,697 | ) | | $ | (208,901 | ) | | $ | (115,283 | ) | | $ | (181,079 | ) | |
Net realized (loss) on investments | | | (15,146,925 | ) | | | (2,175,643 | ) | | | (8,157,143 | ) | | | (945,008 | ) | |
Change in net unrealized appreciation
(depreciation) of investments | | | (519,778 | ) | | | 147,862 | | | | (2,841,310 | ) | | | 6,365,290 | | |
Net increase (decrease) in net assets
resulting from operations | | | (15,816,400 | ) | | | (2,236,682 | ) | | | (11,113,736 | ) | | | 5,239,203 | | |
Distributions to shareholders: | |
Total distributions to shareholders | | | — | | | | — | | | | — | | | | — | | |
Capital share transactions: | |
Net increase (decrease) in net assets resulting
from net change capital share transactions(a) | | | (13,763,877 | ) | | | 29,364,161 | | | | (2,039,186 | ) | | | (544,291 | ) | |
Total increase (decrease) in net assets | | | (29,580,277 | ) | | | 27,127,479 | | | | (13,152,922 | ) | | | 4,694,912 | | |
Net assets: | |
Beginning of year | | | 32,356,880 | | | | 5,229,401 | | | | 18,050,420 | | | | 13,355,508 | | |
End of year | | $ | 2,776,603 | | | $ | 32,356,880 | | | $ | 4,897,498 | | | $ | 18,050,420 | | |
Undistributed (accumulated) net
investment loss, end of year | | $ | (61,317 | ) | | $ | (110,246 | ) | | $ | (64,544 | ) | | $ | (116,043 | ) | |
(a) Summary of capital share transactions is as follows:
| | | Direxion Monthly Emerging Markets Bull 2X Fund | |
| | | Year Ended
August 31, 2015 | | Year Ended
August 31, 2014 | |
| | | Shares | | Value | | Shares | | Value | |
Shares sold | | | 3,879,648 | | | $ | 185,441,518 | | | | 2,969,835 | | | $ | 153,300,621 | | |
Shares redeemed | | | (4,361,699 | ) | | | (199,205,395 | ) | | | (2,524,025 | ) | | | (123,936,460 | ) | |
Net increase (decrease) | | | (482,051 | ) | | $ | (13,763,877 | ) | | | 445,810 | | | $ | 29,364,161 | | |
| | | Direxion Monthly Latin America Bull 2X Fund | |
| | | Year Ended
August 31, 2015 | | Year Ended
August 31, 2014 | |
| | | Shares | | Value | | Shares | | Value | |
Shares sold | | | 1,147,424 | | | $ | 23,673,217 | | | | 649,266 | | | $ | 19,270,515 | | |
Shares redeemed | | | (1,199,288 | ) | | | (25,712,403 | ) | | | (682,270 | ) | | | (19,814,806 | ) | |
Net decrease | | | (51,864 | ) | | $ | (2,039,186 | ) | | | (33,004 | ) | | $ | (544,291 | ) | |
The accompanying notes are an integral part of these financial statements.
DIREXION ANNUAL REPORT
52
Statements of Changes in Net Assets
| | | Direxion Monthly
Natural Resources Bull 2X Fund | |
| | | Year Ended
August 31, 2015 | | Year Ended
August 31, 2014 | |
Increase (Decrease) in net assets from: | |
Operations: | |
Net investment loss | | $ | (94,537 | ) | | $ | (136,168 | ) | |
Net realized gain (loss) on investments | | | (5,048,486 | ) | | | 4,266,469 | | |
Change in net unrealized (depreciation) of investments | | | (1,753,957 | ) | | | (276,564 | ) | |
Net increase (decrease) in net assets resulting from operations | | | (6,896,980 | ) | | | 3,853,737 | | |
Distributions to shareholders: | |
Total distributions to shareholders | | | — | | | | — | | |
Capital share transactions: | |
Net increase (decrease) in net assets resulting from
net change capital share transactions(a) | | | (269,080 | ) | | | 476,347 | | |
Total increase (decrease) in net assets | | | (7,166,060 | ) | | | 4,330,084 | | |
Net assets: | |
Beginning of year | | | 12,599,427 | | | | 8,269,343 | | |
End of year | | $ | 5,433,367 | | | $ | 12,599,427 | | |
Undistributed (accumulated) net investment loss, end of year | | $ | (58,552 | ) | | $ | (94,506 | ) | |
(a) Summary of capital share transactions is as follows:
| | | Direxion Monthly Natural Resources Bull 2X Fund | |
| | | Year Ended
August 31, 2015 | | Year Ended
August 31, 2014 | |
| | | Shares | | Value | | Shares | | Value | |
Shares sold | | | 218,507 | | | $ | 10,152,393 | | | | 372,574 | | | $ | 23,787,456 | | |
Shares redeemed | | | (207,455 | ) | | | (10,421,473 | ) | | | (370,185 | ) | | | (23,311,109 | ) | |
Net increase (decrease) | | | 11,052 | | | $ | (269,080 | ) | | | 2,389 | | | $ | 476,347 | | |
The accompanying notes are an integral part of these financial statements.
DIREXION ANNUAL REPORT
53
Financial Highlights
August 31, 2015
| | | | | RATIOS TO AVERAGE NET ASSETS3 | | | |
| | | Net Asset
Value,
Beginning
of Year/
Period | | Net
Investment
Loss1 | | Net Realized
and Unrealized
Gain (Loss)
on Investments | | Net Increase
(Decrease) in
Net Asset
Value Resulting
from Operations | | Dividends
from Net
Investment
Income | | Distributions
from
Realized
Capital Gains | | Return of
Capital
Distribution | | Total
Distributions | | Net
Asset
Value,
End of
Year/
Period | | Total
Return2 | | Net
Assets,
End of
Year/
Period
(,000) | | Total
Expenses | | Net
Expenses | | Net Investment
(Loss)
after Expense
Reimbursement/
Recoupment | | Portfolio
Turnover
Rate4 | |
Direxion Monthly NASDAQ-100® Bull 2X Fund | |
Year ended August 31, 2015 | | $ | 51.33 | | | $ | (0.74 | ) | | $ | 4.63 | | | $ | 3.89 | | | $ | — | | | $ | (0.63 | ) | | $ | — | | | $ | (0.63 | ) | | $ | 54.59 | | | | 7.68 | % | | $ | 116,172 | | | | 1.35 | % | | | 1.35 | % | | | (1.33 | )% | | | 0 | % | |
Year ended August 31, 2014 | | | 29.33 | | | | (0.56 | ) | | | 22.56 | | | | 22.00 | | | | — | | | | — | | | | — | | | | — | | | | 51.33 | | | | 74.98 | % | | | 289,359 | | | | 1.35 | % | | | 1.35 | % | | | (1.33 | )% | | | 0 | % | |
Year ended August 31, 2013 | | | 23.93 | | | | (0.46 | ) | | | 5.86 | | | | 5.40 | | | | — | | | | — | | | | — | | | | — | | | | 29.33 | | | | 22.56 | % | | | 24,514 | | | | 1.90 | % | | | 1.90 | % | | | (1.85 | )% | | | 0 | % | |
Period ended August 31, 20125 | | | 23.28 | | | | (0.13 | ) | | | 0.78 | | | | 0.65 | | | | — | | | | — | | | | — | | | | — | | | | 23.93 | | | | 2.81 | % | | | 26,412 | | | | 1.90 | % | | | 1.90 | % | | | (1.83 | )% | | | 0 | % | |
Year ended April 30, 2012 | | | 18.68 | | | | (0.34 | ) | | | 4.94 | | | | 4.60 | | | | — | | | | — | | | | — | | | | — | | | | 23.28 | | | | 24.60 | % | | | 29,241 | | | | 1.90 | % | | | 1.90 | % | | | (1.87 | )% | | | 0 | % | |
Year ended April 30, 2011 | | | 13.57 | | | | (0.26 | ) | | | 5.37 | | | | 5.11 | | | | — | | | | — | | | | — | | | | — | | | | 18.68 | | | | 37.69 | % | | | 21,400 | | | | 1.90 | % | | | 1.90 | % | | | (1.80 | )% | | | 0 | % | |
Direxion Monthly S&P 500® Bull 2X Fund | |
Year ended August 31, 2015 | | | 88.65 | | | | (1.22 | ) | | | (0.92 | ) | | | (2.14 | ) | | | — | | | | (3.66 | ) | | | — | | | | (3.66 | ) | | | 82.85 | | | | (2.40 | )% | | | 43,329 | | | | 1.35 | % | | | 1.35 | % | | | (1.34 | )% | | | 0 | % | |
Year ended August 31, 2014 | | | 61.43 | | | | (1.02 | ) | | | 32.15 | | | | 31.13 | | | | — | | | | (3.91 | ) | | | — | | | | (3.91 | ) | | | 88.65 | | | | 52.45 | % | | | 39,820 | | | | 1.35 | % | | | 1.35 | % | | | (1.33 | )% | | | 0 | % | |
Year ended August 31, 2013 | | | 46.79 | | | | (1.01 | ) | | | 17.38 | | | | 16.37 | | | | — | | | | (1.73 | ) | | | — | | | | (1.73 | ) | | | 61.43 | | | | 36.05 | % | | | 32,007 | | | | 1.90 | % | | | 1.90 | % | | | (1.85 | )% | | | 0 | % | |
Period ended August 31, 20125 | | | 46.15 | | | | (0.27 | ) | | | 0.91 | | | | 0.64 | | | | — | | | | — | | | | — | | | | — | | | | 46.79 | | | | 1.39 | % | | | 15,531 | | | | 1.90 | % | | | 1.90 | % | | | (1.83 | )% | | | 0 | % | |
Year ended April 30, 2012 | | | 49.48 | | | | (0.89 | ) | | | 2.06 | | | | 1.17 | | | | — | | | | (4.50 | ) | | | — | | | | (4.50 | ) | | | 46.15 | | | | 3.94 | % | | | 19,710 | | | | 2.11 | % | | | 2.11 | % | | | (2.09 | )% | | | 0 | % | |
Year ended April 30, 2011 | | | 38.25 | | | | (0.69 | ) | | | 11.92 | | | | 11.23 | | | | — | | | | — | | | | — | | | | — | | | | 49.48 | | | | 29.36 | % | | | 20,235 | | | | 1.90 | % | | | 1.90 | % | | | (1.81 | )% | | | 0 | % | |
Direxion Monthly S&P 500® Bear 2X Fund | |
Year ended August 31, 2015 | | | 32.72 | | | | (0.39 | ) | | | (1.42 | ) | | | (1.81 | ) | | | — | | | | — | | | | — | | | | — | | | | 30.91 | | | | (5.53 | )% | | | 9,066 | | | | 1.35 | % | | | 1.35 | % | | | (1.34 | )% | | | 0 | % | |
Year ended August 31, 2014 | | | 53.84 | | | | (0.53 | ) | | | (20.59 | ) | | | (21.12 | ) | | | — | | | | — | | | | — | | | | — | | | | 32.72 | | | | (39.23 | )% | | | 6,464 | | | | 1.35 | % | | | 1.35 | % | | | (1.33 | )% | | | 0 | % | |
Year ended August 31, 2013 | | | 79.76 | | | | (1.20 | ) | | | (24.72 | ) | | | (25.92 | ) | | | — | | | | — | | | | — | | | | — | | | | 53.84 | | | | (32.50 | )% | | | 7,855 | | | | 1.90 | % | | | 1.90 | % | | | (1.84 | )% | | | 0 | % | |
Period ended August 31, 20125 | | | 84.08 | | | | (0.56 | ) | | | (3.76 | ) | | | (4.32 | ) | | | — | | | | — | | | | — | | | | — | | | | 79.76 | | | | (5.14 | )% | | | 10,981 | | | | 1.90 | % | | | 1.90 | % | | | (1.83 | )% | | | 0 | % | |
Year ended April 30, 2012 | | | 101.88 | | | | (2.04 | ) | | | (15.76 | ) | | | (17.80 | ) | | | — | | | | — | | | | — | | | | — | | | | 84.08 | | | | (17.47 | )% | | | 13,316 | | | | 1.90 | % | | | 1.90 | % | | | (1.88 | )% | | | 0 | % | |
Year ended April 30, 2011 | | | 157.72 | | | | (2.72 | ) | | | (53.12 | ) | | | (55.84 | ) | | | — | | | | — | | | | — | | | | — | | | | 101.88 | | | | (35.40 | )% | | | 9,865 | | | | 1.90 | % | | | 1.90 | % | | | (1.79 | )% | | | 0 | % | |
Direxion Monthly Small Cap Bull 2X Fund | |
Year ended August 31, 2015 | | | 46.95 | | | | (0.67 | ) | | | (0.90 | ) | | | (1.57 | ) | | | — | | | | (0.00 | )6 | | | — | | | | (0.00 | )6 | | | 45.38 | | | | (3.34 | )% | | | 15,325 | | | | 1.35 | % | | | 1.35 | % | | | (1.34 | )% | | | 0 | % | |
Year ended August 31, 2014 | | | 35.43 | | | | (0.59 | ) | | | 12.76 | | | | 12.17 | | | | — | | | | (0.65 | ) | | | — | | | | (0.65 | ) | | | 46.95 | | | | 34.56 | % | | | 25,266 | | | | 1.35 | % | | | 1.35 | % | | | (1.33 | )% | | | 0 | % | |
Year ended August 31, 2013 | | | 22.91 | | | | (0.56 | ) | | | 13.08 | | | | 12.52 | | | | — | | | | — | | | | — | | | | — | | | | 35.43 | | | | 54.63 | % | | | 15,347 | | | | 1.90 | % | | | 1.90 | % | | | (1.86 | )% | | | 0 | % | |
Year ended August 31, 2012 | | | 18.99 | | | | (0.38 | ) | | | 4.30 | | | | 3.92 | | | | — | | | | — | | | | — | | | | — | | | | 22.91 | | | | 20.67 | % | | | 7,080 | | | | 1.90 | % | | | 1.90 | % | | | (1.86 | )% | | | 0 | % | |
Year ended August 31, 2011 | | | 13.39 | | | | (0.40 | ) | | | 6.00 | | | | 5.60 | | | | — | | | | — | | | | — | | | | — | | | | 18.99 | | | | 41.78 | % | | | 9,005 | | | | 1.90 | % | | | 1.90 | % | | | (1.84 | )% | | | 0 | % | |
Direxion Monthly Small Cap Bear 2X Fund | |
Year ended August 31, 2015 | | | 37.75 | | | | (0.46 | ) | | | (2.82 | ) | | | (3.28 | ) | | | — | | | | — | | | | — | | | | — | | | | 34.47 | | | | (8.69 | )% | | | 7,576 | | | | 1.35 | % | | | 1.35 | % | | | (1.33 | )% | | | 0 | % | |
Year ended August 31, 2014 | | | 57.20 | | | | (0.58 | ) | | | (18.87 | ) | | | (19.45 | ) | | | — | | | | — | | | | — | | | | — | | | | 37.75 | | | | (34.00 | )% | | | 15,540 | | | | 1.35 | % | | | 1.35 | % | | | (1.33 | )% | | | 0 | % | |
Year ended August 31, 2013 | | | 99.32 | | | | (1.43 | ) | | | (40.69 | ) | | | (42.12 | ) | | | — | | | | — | | | | — | | | | — | | | | 57.20 | | | | (42.41 | )% | | | 17,587 | | | | 1.90 | % | | | 1.90 | % | | | (1.84 | )% | | | 0 | % | |
Year ended August 31, 2012 | | | 155.22 | | | | (2.08 | ) | | | (53.82 | ) | | | (55.90 | ) | | | — | | | | — | | | | — | | | | — | | | | 99.32 | | | | (36.01 | )% | | | 23,040 | | | | 1.90 | % | | | 1.90 | % | | | (1.85 | )% | | | 0 | % | |
Year ended August 31, 2011 | | | 270.92 | | | | (2.86 | ) | | | (112.84 | ) | | | (115.70 | ) | | | — | | | | — | | | | — | | | | — | | | | 155.22 | | | | (42.71 | )% | | | 7,840 | | | | 1.90 | % | | | 1.88 | % | | | (1.80 | )%7 | | | 0 | % | |
Direxion Monthly 7-10 Year Treasury Bull 2X Fund | |
Year ended August 31, 2015 | | | 33.01 | | | | (0.46 | ) | | | 1.81 | | | | 1.35 | | | | — | | | | — | | | | — | | | | — | | | | 34.36 | | | | 4.09 | % | | | 69,850 | | | | 1.35 | % | | | 1.31 | % | | | (1.30 | )%8 | | | 0 | % | |
Year ended August 31, 2014 | | | 29.48 | | | | (0.41 | ) | | | 3.94 | | | | 3.53 | | | | — | | | | — | | | | — | | | | — | | | | 33.01 | | | | 11.97 | % | | | 22,235 | | | | 1.35 | % | | | 1.35 | % | | | (1.33 | )% | | | 0 | % | |
Year ended August 31, 2013 | | | 35.97 | | | | (0.41 | ) | | | (4.79 | ) | | | (5.20 | ) | | | — | | | | (1.29 | ) | | | — | | | | (1.29 | ) | | | 29.48 | | | | (14.89 | )% | | | 23,537 | | | | 1.90 | % | | | 1.83 | % | | | (1.24 | )%9 | | | 1,286 | % | |
Year ended August 31, 2012 | | | 31.31 | | | | (0.64 | ) | | | 5.34 | | | | 4.70 | | | | — | | | | (0.04 | ) | | | — | | | | (0.04 | ) | | | 35.97 | | | | 15.02 | % | | | 38,220 | | | | 1.90 | % | | | 1.90 | % | | | (1.85 | )% | | | 0 | % | |
Year ended August 31, 2011 | | | 31.57 | | | | (0.51 | ) | | | 2.29 | | | | 1.78 | | | | — | | | | (2.04 | ) | | | — | | | | (2.04 | ) | | | 31.31 | | | | 7.07 | % | | | 32,413 | | | | 1.90 | % | | | 1.90 | % | | | (1.83 | )% | | | 0 | % | |
1 Net investment income (loss) per share represents net investment income (loss) divided by the daily average shares of beneficial interest outstanding throughout each period.
2 All returns reflect reinvested dividends, if any, but do not reflect the impact of taxes. Total return calculated for a period of less than one year is not annualized.
3 For periods less than one year, these ratios are annualized.
4 Portfolio turnover is not annualized and is calculated without regard to short-term securities having a maturity of less than one year. Investments in swaps and futures contracts and repurchase agreements are deemed short-term securities.
5 Represents the period from May 1, 2012 to August 31, 2012.
6 Amount is less than $0.01 per share.
7 Net investment income (loss) ratio before expense reimbursement/recoupment for the year ended August 31, 2011 was (1.82)%.
8 Net investment income (loss) ratio before expense reimbursement/recoupment for the year ended August 31, 2015 was (1.34)%.
9 Net investment income (loss) ratio before expense reimbursement/recoupment for the year ended August 31, 2013 was (1.31)%.
The accompanying notes are an integral part of these financial statements.
DIREXION ANNUAL REPORT
54
Financial Highlights
August 31, 2015
| | | | | RATIOS TO AVERAGE NET ASSETS3 | | | |
| | | Net Asset
Value,
Beginning
of Year/
Period | | Net
Investment
Income
(Loss)1 | | Net Realized
and Unrealized
Gain (Loss)
on Investments | | Net Increase
(Decrease) in
Net Asset
Value Resulting
from Operations | | Dividends
from Net
Investment
Income | | Distributions
from
Realized
Capital Gains | | Return of
Capital
Distribution | | Total
Distributions | | Net
Asset
Value,
End of
Year/
Period | | Total
Return2 | | Net
Assets,
End of
Year/
Period
(,000) | | Total
Expenses | | Net
Expenses | | Net Investment
Income (Loss)
after Expense
Reimbursement/
Recoupment | | Portfolio
Turnover
Rate4 | |
Direxion Monthly 7-10 Year Treasury Bear 2X Fund | |
Year ended August 31, 2015 | | $ | 36.66 | | | $ | (0.46 | ) | | $ | (3.19 | ) | | $ | (3.65 | ) | | $ | — | | | $ | — | | | $ | — | | | $ | — | | | $ | 33.01 | | | | (9.96 | )% | | $ | 19,935 | | | | 1.35 | % | | | 1.35 | % | | | (1.34 | )% | | | 0 | % | |
Year ended August 31, 2014 | | | 43.12 | | | | (0.53 | ) | | | (5.93 | ) | | | (6.46 | ) | | | — | | | | — | | | | — | | | | — | | | | 36.66 | | | | (14.98 | )% | | | 8,010 | | | | 1.35 | % | | | 1.35 | % | | | (1.33 | )% | | | 0 | % | |
Year ended August 31, 2013 | | | 38.92 | | | | (0.77 | ) | | | 4.97 | | | | 4.20 | | | | — | | | | — | | | | — | | | | — | | | | 43.12 | | | | 10.79 | % | | | 10,029 | | | | 1.90 | % | | | 1.90 | % | | | (1.85 | )% | | | 0 | % | |
Year ended August 31, 2012 | | | 49.00 | | | | (0.84 | ) | | | (9.24 | ) | | | (10.08 | ) | | | — | | | | — | | | | — | | | | — | | | | 38.92 | | | | (20.57 | )% | | | 10,286 | | | | 1.90 | % | | | 1.90 | % | | | (1.86 | )% | | | 0 | % | |
Year ended August 31, 2011 | | | 57.89 | | | | (1.12 | ) | | | (7.77 | ) | | | (8.89 | ) | | | — | | | | — | | | | — | | | | — | | | | 49.00 | | | | (15.36 | )% | | | 17,034 | | | | 1.90 | % | | | 1.90 | % | | | (1.83 | )% | | | 0 | % | |
Direxion Dynamic HY Bond Fund | |
Year ended August 31, 2015 | | | 14.4804 | | | | 0.3726 | | | | (1.4837 | ) | | | (1.1111 | ) | | | (0.3290 | ) | | | — | | | | — | | | | (0.3290 | ) | | | 13.0403 | | | | (7.75 | )% | | | 2,859 | | | | 1.35 | % | | | 1.35 | % | | | 2.66 | %5 | | | 554 | % | |
Year ended August 31, 2014 | | | 13.6261 | | | | 0.3516 | | | | 0.9679 | | | | 1.3195 | | | | (0.4652 | ) | | | — | | | | — | | | | (0.4652 | ) | | | 14.4804 | | | | 9.83 | % | | | 7,798 | | | | 1.35 | % | | | 1.35 | % | | | 2.43 | %5 | | | 739 | % | |
Year ended August 31, 2013 | | | 14.5824 | | | | 0.6594 | | | | (0.3732 | ) | | | 0.2862 | | | | (1.2425 | ) | | | — | | | | — | | | | (1.2425 | ) | | | 13.6261 | | | | 1.91 | % | | | 16,070 | | | | 1.75 | % | | | 1.60 | % | | | 4.52 | %5 | | | 862 | % | |
Year ended August 31, 2012 | | | 13.93 | | | | 0.6559 | | | | 0.4901 | | | | 1.1460 | | | | (0.4936 | ) | | | — | | | | — | | | | (0.4936 | ) | | | 14.58246 | | | | 8.41 | % | | | 85,077 | | | | 1.75 | % | | | 1.60 | % | | | 4.64 | %5 | | | 508 | % | |
Year ended August 31, 2011 | | | 14.07 | | | | 0.35 | | | | 0.41 | | | | 0.76 | | | | (0.90 | ) | | | — | | | | — | | | | (0.90 | ) | | | 13.93 | | | | 5.48 | % | | | 5,552 | | | | 1.86 | % | | | 1.84 | % | | | 2.34 | %5 | | | 995 | % | |
Direxion Monthly China Bull 2X Fund | |
Year ended August 31, 2015 | | | 40.96 | | | | (0.64 | ) | | | (9.62 | ) | | | (10.26 | ) | | | — | | | | — | | | | — | | | | — | | | | 30.70 | | | | (25.05 | )% | | | 5,510 | | | | 1.35 | % | | | 1.35 | % | | | (1.34 | )% | | | 0 | % | |
Year ended August 31, 2014 | | | 30.98 | | | | (0.46 | ) | | | 10.44 | | | | 9.98 | | | | — | | | | — | | | | — | | | | — | | | | 40.96 | | | | 32.21 | % | | | 5,778 | | | | 1.35 | % | | | 1.35 | % | | | (1.34 | )% | | | 0 | % | |
Year ended August 31, 2013 | | | 27.21 | | | | (0.67 | ) | | | 4.44 | | | | 3.77 | | | | — | | | | — | | | | — | | | | — | | | | 30.98 | | | | 13.86 | % | | | 4,284 | | | | 1.90 | % | | | 1.90 | % | | | (1.86 | )% | | | 0 | % | |
Year ended August 31, 2012 | | | 40.98 | | | | (0.60 | ) | | | (13.17 | ) | | | (13.77 | ) | | | — | | | | — | | | | — | | | | — | | | | 27.21 | | | | (33.60 | )% | | | 5,576 | | | | 1.90 | % | | | 1.90 | % | | | (1.87 | )% | | | 0 | % | |
Year ended August 31, 2011 | | | 42.85 | | | | (0.93 | ) | | | (0.94 | ) | | | (1.87 | ) | | | — | | | | — | | | | — | | | | — | | | | 40.98 | | | | (4.36 | )% | | | 6,947 | | | | 1.90 | % | | | 1.90 | % | | | (1.83 | )% | | | 0 | % | |
Direxion Monthly Emerging Markets Bull 2X Fund | |
Year ended August 31, 2015 | | | 56.54 | | | | (0.64 | ) | | | (25.11 | ) | | | (25.75 | ) | | | — | | | | — | | | | — | | | | — | | | | 30.79 | | | | (45.54 | )% | | | 2,777 | | | | 1.35 | % | | | 1.35 | % | | | (1.33 | )% | | | 0 | % | |
Year ended August 31, 2014 | | | 41.36 | | | | (0.67 | ) | | | 15.85 | | | | 15.18 | | | | — | | | | — | | | | — | | | | — | | | | 56.54 | | | | 36.70 | % | | | 32,357 | | | | 1.35 | % | | | 1.35 | % | | | (1.33 | )% | | | 0 | % | |
Year ended August 31, 2013 | | | 45.04 | | | | (0.97 | ) | | | (2.71 | ) | | | (3.68 | ) | | | — | | | | — | | | | — | | | | — | | | | 41.36 | | | | (8.17 | )% | | | 5,229 | | | | 1.90 | % | | | 1.89 | % | | | (1.84 | )%7 | | | 0 | % | |
Year ended August 31, 2012 | | | 59.49 | | | | (0.90 | ) | | | (13.55 | ) | | | (14.45 | ) | | | — | | | | — | | | | — | | | | — | | | | 45.04 | | | | (24.29 | )% | | | 38,012 | | | | 1.90 | % | | | 1.90 | % | | | (1.87 | )% | | | 0 | % | |
Year ended August 31, 2011 | | | 54.87 | | | | (1.34 | ) | | | 5.96 | | | | 4.62 | | | | — | | | | — | | | | — | | | | — | | | | 59.49 | | | | 8.42 | % | | | 17,916 | | | | 1.90 | % | | | 1.90 | % | | | (1.84 | )% | | | 0 | % | |
Direxion Monthly Latin America Bull 2X Fund | |
Year ended August 31, 2015 | | | 37.41 | | | | (0.28 | ) | | | (25.76 | ) | | | (26.04 | ) | | | — | | | | — | | | | — | | | | — | | | | 11.37 | | | | (69.61 | )% | | | 4,897 | | | | 1.35 | % | | | 1.35 | % | | | (1.33 | )% | | | 0 | % | |
Year ended August 31, 2014 | | | 25.90 | | | | (0.39 | ) | | | 11.90 | | | | 11.51 | | | | — | | | | — | | | | — | | | | — | | | | 37.41 | | | | 44.44 | % | | | 18,050 | | | | 1.35 | % | | | 1.35 | % | | | (1.33 | )% | | | 0 | % | |
Year ended August 31, 2013 | | | 36.88 | | | | (0.69 | ) | | | (10.29 | ) | | | (10.98 | ) | | | — | | | | — | | | | — | | | | — | | | | 25.90 | | | | (29.77 | )% | | | 13,356 | | | | 1.90 | % | | | 1.90 | % | | | (1.85 | )% | | | 0 | % | |
Period ended August 31, 20128 | | | 44.97 | | | | (0.23 | ) | | | (7.86 | ) | | | (8.09 | ) | | | — | | | | — | | | | — | | | | — | | | | 36.88 | | | | (17.99 | )% | | | 27,130 | | | | 1.90 | % | | | 1.90 | % | | | (1.81 | )% | | | 0 | % | |
Year ended April 30, 2012 | | | 67.74 | | | | (0.91 | ) | | | (21.86 | ) | | | (22.77 | ) | | | — | | | | — | | | | — | | | | — | | | | 44.97 | | | | (33.61 | )% | | | 34,340 | | | | 1.90 | % | | | 1.90 | % | | | (1.87 | )% | | | 0 | % | |
Year ended April 30, 2011 | | | 55.20 | | | | (1.02 | ) | | | 13.56 | | | | 12.54 | | | | — | | | | — | | | | — | | | | — | | | | 67.74 | | | | 22.72 | % | | | 68,349 | | | | 1.90 | % | | | 1.90 | % | | | (1.79 | )% | | | 0 | % | |
Direxion Monthly Natural Resources Bull 2X Fund | |
Year ended August 31, 2015 | | | 76.92 | | | | (0.63 | ) | | | (45.22 | ) | | | (45.85 | ) | | | — | | | | — | | | | — | | | | — | | | | 31.07 | | | | (59.61 | )% | | | 5,433 | | | | 1.35 | % | | | 1.35 | % | | | (1.33 | )% | | | 0 | % | |
Year ended August 31, 2014 | | | 51.23 | | | | (0.85 | ) | | | 26.54 | | | | 25.69 | | | | — | | | | — | | | | — | | | | — | | | | 76.92 | | | | 50.15 | % | | | 12,599 | | | | 1.35 | % | | | 1.35 | % | | | (1.34 | )% | | | 0 | % | |
Year ended August 31, 2013 | | | 46.29 | | | | (0.96 | ) | | | 5.90 | | | | 4.94 | | | | — | | | | — | | | | — | | | | — | | | | 51.23 | | | | 10.67 | % | | | 8,269 | | | | 1.90 | % | | | 1.90 | % | | | (1.86 | )% | | | 0 | % | |
Year ended August 31, 2012 | | | 63.99 | | | | (0.96 | ) | | | (16.74 | ) | | | (17.70 | ) | | | — | | | | — | | | | — | | | | — | | | | 46.29 | | | | (27.66 | )% | | | 14,702 | | | | 1.90 | % | | | 1.90 | % | | | (1.86 | )% | | | 0 | % | |
Year ended August 31, 2011 | | | 44.09 | | | | (1.32 | ) | | | 21.22 | | | | 19.90 | | | | — | | | | — | | | | — | | | | — | | | | 63.99 | | | | 45.13 | % | | | 27,019 | | | | 1.90 | % | | | 1.90 | % | | | (1.84 | )% | | | 0 | % | |
1 Net investment income (loss) per share represents net investment income (loss) divided by the daily average shares of beneficial interest outstanding throughout each period.
2 All returns reflect reinvested dividends, if any, but do not reflect the impact of taxes. Total return calculated for a period of less than one year is not annualized.
3 For periods less than one year, these ratios are annualized.
4 Portfolio turnover is not annualized and is calculated without regard to short-term securities having a maturity of less than one year. Investments in swaps and futures contracts and repurchase agreements are deemed short-term securities.
5 Net investment income (loss) ratio before expense reimbursement/recoupment for the years ended August 31, 2015, 2014, 2013, 2012 and 2011 were 2.66%, 2.43%, 4.37%, 4.49% and 2.32%, respectively.
6 Effective September 15, 2011, the Direxion Dynamic HY Bond Fund began calculating its NAV to four digits.
7 Net investments income (loss) before interest on short positions for the year ended August 31, 2013 was (1.85)%.
8 Represents the period from May 1, 2012 to August 31, 2012.
The accompanying notes are an integral part of these financial statements.
DIREXION ANNUAL REPORT
55
Direxion Funds
NOTES TO THE FINANCIAL STATEMENTS
August 31, 2015
1. ORGANIZATION
Direxion Funds (the "Trust") was organized as a Massachusetts Business Trust on June 6, 1997, and is registered under the Investment Company Act of 1940, as amended (the "1940 Act"), as an open-end management investment company issuing its shares in series, each series representing a distinct portfolio with its own investment objective and policies. The Trust currently has 16 series, of which 12 are included in this report: Direxion Monthly NASDAQ-100® Bull 2X Fund, Direxion Monthly S&P 500® Bull 2X Fund, Direxion Monthly S&P 500® Bear 2X Fund, Direxion Monthly Small Cap Bull 2X Fund, Direxion Monthly Small Cap Bear 2X Fund, Direxion Monthly 7-10 Year Treasury Bull 2X Fund, Direxion Monthly 7-10 Year Treasury Bear 2X Fund, Direxion Dynamic HY Bond Fund, Direxion Monthly China Bull 2X Fund, Direxion Monthly Emerging Markets Bull 2X Fund, Direxion Monthly Latin America Bull 2X Fund, and Direxion Monthly Natural Resources Bull 2X Fund (each a "Fund" and collectively, the "Funds"). Each Fund is a non-diversified series of the Trust pursuant to the 1940 Act. The 12 Funds included in this report offer only Investor Class shares.
With the exception of the Direxion Dynamic HY Bond Fund, the Funds' investment objectives are to seek monthly investment results, before fees and expenses, that correspond to the calendar month performance of a particular index or benchmark. The Funds with the word "Bull" in their name attempt to provide investment results that correlate positively to the return of an index or benchmark. The Funds with the word "Bear" in their name attempt to provide investment results that correlate negatively to the return of an index or benchmark.
Fund | | Index or Benchmark | | Monthly Target | |
Direxion Monthly NASDAQ-100® Bull 2X Fund | | NASDAQ-100® Index | | | 200 | % | |
Direxion Monthly S&P 500® Bull 2X Fund | | S&P 500® Index | | | 200 | % | |
Direxion Monthly S&P 500® Bear 2X Fund | | | | | -200 | % | |
Direxion Monthly Small Cap Bull 2X Fund | | Russell 2000® Index | | | 200 | % | |
Direxion Monthly Small Cap Bear 2X Fund | | | | | -200 | % | |
Direxion Monthly 7-10 Year Treasury Bull 2X Fund | | NYSE 7-10 Year Treasury Bond Index | | | 200 | % | |
Direxion Monthly 7-10 Year Treasury Bear 2X Fund | | | | | -200 | % | |
Direxion Monthly China Bull 2X Fund | | FTSE China 50 Index* | | | 200 | % | |
Direxion Monthly Emerging Markets Bull 2X Fund | | MSCI Emerging Markets IndexSM | | | 200 | % | |
Direxion Monthly Latin America Bull 2X Fund | | S&P® Latin America 40 Index | | | 200 | % | |
Direxion Monthly Natural Resources Bull 2X Fund | | S&P North American Natural Resources Sector Index | | | 200 | % | |
* Effective September 22, 2014, the underlying index of the Direxion Monthly China Bull 2X Fund changed its methodology, and as consequence, was renamed the FTSE China 50 Index.
The Direxion Dynamic HY Bond Fund seeks to maximize total return (income plus capital appreciation) by investing primarily in high-yield debt instruments, commonly referred to as "junk bonds," and derivatives of such instruments, including derivatives that isolate the credit component of such junk bonds and do not provide general interest rate exposure. The Fund will seek leveraged returns by investing in derivatives, such as futures contracts, forward contracts and swaps, which can include swaps on debt instruments, ETFs and mutual funds. In utilizing this leverage strategy, the Fund will take positions in leveraged instruments that create targeted investment exposure of 120% of the value of the Fund's assets, rebalancing the Fund's portfolio monthly to maintain the target exposure. Leveraging generates returns that are more pronounced, both positively and negatively, than what would be generated on the invested capital without leverage, thus changing small market movements into larger changes in the value of the investments.
2. SIGNIFICANT ACCOUNTING POLICIES
The following is a summary of significant accounting policies consistently followed by the Funds in the preparation of their financial statements. These policies are in conformity with U.S. generally accepted accounting principles ("GAAP").
DIREXION ANNUAL REPORT
56
a) Investment Valuation – The Net Asset Value ("NAV") of each Fund is determined daily, Monday through Friday, as of the close of regular trading on the New York Stock Exchange ("NYSE"), each day the NYSE is open for business. The value of all portfolio securities and other assets held by a Fund will be determined as of the time a Fund calculates its NAV, 4:00 p.m. Eastern Time ("Valuation Time"). On days that the Securities Industry and Financial Markets Association ("SIFMA") recommends that the bond markets close all day, the Direxion Monthly 7-10 Year Treasury Bull 2X Fund, Direxion Monthly 7-10 Year Treasury Bear 2X Fund and the Direxion Dynamic HY Bond Fund (the "Fixed Income Funds") do not calculate their NAVs even if the NYSE is open for business. Similarly, on days that SIFMA recommends that the bond markets close early, each of the Fixed Income Funds calculates its NAV as of the time of the recommended close, usually 2:00 p.m. Eastern Time, rather than the close of regular trading on the NYSE. Equity securities, exchange-traded funds and over-the-counter securities are valued at their last sales price or, if not available, at the average of the last bid and ask prices. Securities primarily traded on the NASDAQ National Market are valued using the NASDAQ Official Closing Price. Investments in open-end mutual funds are valued at their respective quoted NAV on the valuation date. Futures contracts are valued at the settlement price established on the exchange on which they are traded, if that settlement price reflects trading prior to the Valuation Time. If the settlement price established by the exchange reflects trading after the Valuation Time, then the last sales price prior to Valuation Time will be used. Swap contracts are valued using the closing price of the underlying reference entity or the closing value of the underlying reference index. Short-term debt securities with an original maturity of 60 days or less and money market securities are valued using the amortized cost method. Other debt securities are valued by using the mean prices provided by the Funds' pricing service or, if such prices are unavailable, by a matrix pricing method. Securities for which reliable market quotations are not readily available, the Funds' pricing service does not provide a valuation for such securities, the Funds' pricing service provides valuation that in the judgment of Rafferty Asset Management, LLC (the "Adviser") does not represent fair value, or the Fund or Adviser believes the market price is stale, are fair valued as determined by the Adviser under the supervision of the Board of Trustees. Additionally, the Adviser will monitor developments in the marketplace for significant events that may affect the value of those securities whose closing prices were established before the Valuation Time.
b) Repurchase Agreements – Each Fund may enter into repurchase agreements with institutions that are members of the Federal Reserve System or securities dealers who are members of a national securities exchange or are primary dealers in U.S. government securities. In connection with transactions in repurchase agreements, it is the Trust's policy that the Fund receives, as collateral, cash and/or securities (primarily U.S. government securities) whose fair value, including accrued interest, at all times will be at least equal to 100% of the amount invested by the Fund in each repurchase agreement, including accrued interest. If the seller defaults, and the value of the collateral declines, realization of the collateral by the Fund may be delayed or limited. Certain Funds invested in repurchase agreements during the year ended August 31, 2015; however, these Funds were not invested in repurchase agreements at August 31, 2015.
c) Swap Contracts – Each Fund may enter into equity swap contacts. Standard equity swap contracts are between two parties that agree to exchange the returns (or differentials in rates of return) earned or realized on particular predetermined investments or instruments. The gross amount to be exchanged is calculated with respect to a "notional amount" (i.e. the return on or increase in value of a particular dollar amount invested in a "basket" of securities representing a particular index or industry sector). A Fund enters into master netting agreements with the counterparty. These agreements calculate the obligations of the parties on a "net basis". Consequently, a Fund's current obligations under a swap agreement generally will be equal to the net amount to be paid or received under the agreement based on the relative value of the positions held by each party. A Fund's obligations are accrued daily and offset by any amounts owed to the Fund. However, a Fund does not offset the fair value amounts of the swap contract and the related collateral on the Statement of Assets and Liabilities arising from swap contracts executed with the same counterparty under such master netting agreements.
In a "long" equity swap agreement, the counterparty will generally agree to pay the Fund the amount, if any, by which the notional amount of the swap contract would have increased in value if the Fund had been invested in the particular securities, plus dividends that would have been received on those securities. The Fund will agree to pay the counterparty a floating rate of interest on the notional amount of the swap contract plus the amount, if any, by which the notional amount would have decreased in value had it been invested in such securities plus, in certain instances, commissions or trading spreads on the notional amounts. Thus, the return on the swap contract should be the gain or loss on the notional amount plus dividends on the securities less the interest paid by the Fund on the notional amount. In certain instances, market factors such as the interest rate environment and the demand to borrow the securities underlying the swap agreement can cause a scenario in which the counterparty will pay the Fund interest. Payments may be made at the conclusion of the contract or periodically during its term. Swap contracts do not include the delivery of securities. The net amount of the excess, if any, of the Fund's obligations over its entitlement with respect to each swap is accrued on a daily basis and an amount of
DIREXION ANNUAL REPORT
57
cash or liquid assets, having an aggregate net asset value at least equal to such accrued excess is maintained in a segregated account. Until a swap contract is settled in cash, the gain or loss on the notional amount plus dividends on the securities less the interest paid by the Fund on the notional amount are recorded as "unrealized appreciation or depreciation on swaps" and when cash is exchanged, the gain or loss is recorded as "realized gains or losses on swaps."
Accounting Standards Update No. 2011-11 "Disclosures about Offsetting Assets and Liabilities" ("ASU 2011-11") requires entities to disclose (i) gross and net information about both instruments and transactions eligible for offset in the financial statements, and (ii) instruments and transactions subject to an agreement similar to a master netting agreement. ASU 2011-11 is limited in scope to the following financial instruments, to the extent they are offset in the financial statements or subject to an enforceable master netting arrangement or similar agreement: (i) recognized derivative instruments accounted for under ASC 815 (Derivatives and Hedging).
In order to better define its contractual rights and to secure rights that will help a Fund mitigate its counterparty risk , a Fund may enter into an International Swaps and Derivatives Association, Inc. Master Agreement ("ISDA Master Agreement") or similar agreement with its counterparties. An ISDA Master Agreement is a bilateral agreement between a Fund and a counterparty that governs over-the-counter derivatives ("OTC"), including swap contracts, and typically contains, among other things, collateral posting terms, netting and rights of set-off provisions in the event of a default and/or termination event. Under an ISDA Master Agreement, a Fund may, under certain circumstances, offset with the counterparty certain derivative financial instruments' payables and receivables to create a single net payment. The provisions of the ISDA Master Agreement typically permit a single net payment in the event of a default (close-out netting) or similar event, including the bankruptcy or insolvency of the counterparty.
Collateral requirements generally differ by type of derivative. Collateral terms are contract specific for OTC derivatives (e.g. swaps). Generally, for transactions traded under an ISDA Master Agreement, the collateral requirements are calculated by netting the marked-to-market amount for each transaction under such agreement and comparing that amount to the value of any collateral currently pledged by a Fund and the counterparty. Generally, the amount of collateral due from or to the counterparty must exceed a minimum transfer amount threshold before a transfer is required to be made. To the extent amounts due to a Fund from its derivatives counterparties are not fully collateralized, contractually or otherwise, the Fund bears the risk of loss from counterparty non-performance.
For financial reporting purposes, the Funds elect to not offset assets and liabilities subject to an ISDA Master Agreement, if any, in the Statements of Assets and Liabilities. Therefore, all qualifying transactions are presented on a gross basis in the Statements of Assets and Liabilities. As of August 31, 2015, the impact of netting of assets and liabilities and the offsetting of collateral pledged or received based on contractual netting/set-off provisions in the ISDA Master Agreement are detailed in the following pages.
In the event of the counterparty's default, bankruptcy or any other event for which the counterparty cannot meet its obligations, a Fund bears the risk of loss equal to the amount of the daily appreciation owed to the Fund. This obligation represents the daily gain accrued to the Fund from the close of business day prior to this event to the day on which this event occurs and the counterparty can no longer meet its obligations. A Fund will enter into swap agreements only with large, well-capitalized and established financial institutions. The creditworthiness of each of the firms that is a party to a swap agreement is monitored by the Adviser. Shareholders may obtain swap counterparty financial statements at www.sec.gov. Swap contracts are subject to credit risk. Credit risk occurs when the financial condition of an issuer of a security or instrument may cause it to default or become unable to pay interest or principal due on the security. The counterparty to a swap contract might default on its obligations. In addition, the Funds have agreements with certain counterparties with which it trades swap contracts that contain credit risk-related contingent features that could be triggered subject to certain circumstances. Such circumstances include agreed upon net asset value and performance-based thresholds. The maximum exposure to the Funds in regard to potential counterparty default and credit-risk related contingent features at August 31, 2015 is detailed in the following table. If such credit risk-related contingencies were triggered the counterparties would have the option to terminate any positions open under the master netting agreement.
DIREXION ANNUAL REPORT
58
Description: Swap Contract
Counterparty: Bank of America Merrill Lynch
| | | Assets:
Gross Amounts not
offset in the Statement
of Asset and Liabilities | | Liabilities:
Gross Amounts not
offset in the Statement
of Asset and Liabilities | |
Fund Name | | Gross
Amounts of
Recognized
Assets | | Financial
Instruments | | Collateral
Received1 | | Net Amount | | Gross
Amounts of
Recognized
Liabilities | | Financial
Instruments | | Collateral
Pledged1 | | Net Amount2 | |
Direxion Monthly
Emerging
Markets
Bull 2X Fund | | $ | 7,863 | | | $ | — | | | $ | — | | | $ | 7,863 | | | $ | 566,248 | | | $ | 7,863 | | | $ | 558,385 | | | $ | — | | |
Direxion Monthly
Latin America
Bull 2X Fund | | | 23,149 | | | | — | | | | — | | | | 23,149 | | | | 2,319,745 | | | | 23,149 | | | | 2,296,596 | | | | — | | |
Direxion Monthly
Natural
Resources
Bull 2X Fund | | | 41,534 | | | | — | | | | — | | | | 41,534 | | | | 2,105,780 | | | | 41,534 | | | | 2,064,246 | | | | — | | |
1 The amount of collateral shown has been limited such that the net amount cannot be less than zero.
2 The amount shown is the maximum credit exposure of the Fund for the corresponding counterparty.
Description: Swap Contract
Counterparty: Credit Suisse Capital, LLC
| | | Assets:
Gross Amounts not
offset in the Statement
of Asset and Liabilities | | Liabilities:
Gross Amounts not
offset in the Statement
of Asset and Liabilities | |
Fund Name | | Gross
Amounts of
Recognized
Assets | | Financial
Instruments | | Collateral
Received1 | | Net Amount | | Gross
Amounts of
Recognized
Liabilities | | Financial
Instruments | | Collateral
Pledged1 | | Net Amount2 | |
Direxion Dynamic
HY Bond Fund | | $ | 394 | | | $ | — | | | $ | — | | | $ | 394 | | | $ | 548 | | | $ | 394 | | | $ | 154 | | | $ | — | | |
1 The amount of collateral shown has been limited such that the net amount cannot be less than zero.
2 The amount shown is the maximum credit exposure of the Fund for the corresponding counterparty.
Description: Swap Contract
Counterparty: Credit Suisse International
| | | Assets:
Gross Amounts not
offset in the Statement
of Asset and Liabilities | | Liabilities:
Gross Amounts not
offset in the Statement
of Asset and Liabilities | |
Fund Name | | Gross
Amounts of
Recognized
Assets | | Financial
Instruments | | Collateral
Received1 | | Net Amount | | Gross
Amounts of
Recognized
Liabilities | | Financial
Instruments | | Collateral
Pledged1 | | Net Amount2 | |
Direxion Monthy
S&P 500®
Bear 2X Fund | | $ | — | | | $ | — | | | $ | — | | | $ | — | | | $ | 557,364 | | | $ | — | | | $ | 557,364 | | | $ | — | | |
Direxion Monthly
Small Cap
Bull 2X Fund | | | — | | | | — | | | | — | | | | — | | | | 1,256,737 | | | | — | | | | 1,256,737 | | | | — | | |
DIREXION ANNUAL REPORT
59
| | | Assets:
Gross Amounts not
offset in the Statement
of Asset and Liabilities | | Liabilities:
Gross Amounts not
offset in the Statement
of Asset and Liabilities | |
Fund Name | | Gross
Amounts of
Recognized
Assets | | Financial
Instruments | | Collateral
Received1 | | Net Amount | | Gross
Amounts of
Recognized
Liabilities | | Financial
Instruments | | Collateral
Pledged1 | | Net Amount2 | |
Direxion Monthly
Small Cap
Bear 2X Fund | | $ | — | | | $ | — | | | $ | — | | | $ | — | | | $ | 639,489 | | | $ | — | | | $ | 639,489 | | | $ | — | | |
Direxion Monthly
7-10 Year
Treasury
Bull 2X Fund | | | — | | | | — | | | | — | | | | — | | | | 226,452 | | | | — | | | | 226,452 | | | | — | | |
Direxion Monthly
7-10 Year
Treasury
Bear 2X Fund | | | — | | | | — | | | | — | | | | — | | | | 429,856 | | | | — | | | | 429,856 | | | | — | | |
Direxion Monthly
China
Bull 2X Fund | | | — | | | | — | | | | — | | | | — | | | | 1,103 | | | | — | | | | 1,103 | | | | — | | |
1 The amount of collateral shown has been limited such that the net amount cannot be less than zero.
2 The amount shown is the maximum credit exposure of the Fund for the corresponding counterparty.
d) Short Positions – The Direxion Monthly Small Cap Bear 2X Fund, Direxion Monthly 7-10 Year Treasury Bear 2X Fund, Direxion Dynamic HY Bond Fund, and Direxion Monthly S&P 500® Bear 2X Fund may engage in short sale transactions. The Direxion Monthly Small Cap Bull 2X Fund can only engage in short sales "against the box." In this instance a security can only be sold short if a long position is held on the same security. For financial statement purposes, an amount equal to the settlement amount is included in the Statements of Assets and Liabilities as an asset and an equivalent liability. The amount of the liability is subsequently marked-to-market to reflect the current value of the short position. Subsequent fluctuations in the market prices of short securities may require purchasing the securities at prices which may differ from the market value reflected on the Statements of Assets and Liabilities. The Fund is liable to the buyer for any dividends payable on securities while those securities are in a short position. As collateral for its short positions, the Fund is required under the 1940 Act to segregate assets consisting of cash, cash equivalents or liquid securities equal to the market value of the securities sold short. This collateral is required to be adjusted daily. The Funds held no securities sold short during the year ended August 31, 2015.
e) Futures Contracts and Options on Futures Contracts – Each Fund may purchase and sell futures contracts and options on such futures contracts. A Fund may use futures contracts to gain exposure to, or hedge against changes in the values of equities, interest rates or foreign currencies. Upon entering into a contract, the Fund deposits and maintains as collateral such initial margin as required by the exchange on which the transaction is effected. Pursuant to the contract, the Fund agrees to receive from or pay to the broker an amount of cash equal to the daily fluctuation in value of the contract. Such receipts or payments are known as "variation margin" and are recorded by the Fund as unrealized gains and losses. When the contract is closed, the Fund records a realized gain or loss equal to the difference between the value of the contract at the time it was opened and the value at the time it was closed. As collateral for futures contracts, the Fund is required under the 1940 Act to maintain assets consisting of cash, cash equivalents or liquid securities. This collateral is required to be adjusted daily to reflect the market value of the purchase obligation for long futures contracts or the market value of the instrument underlying the contract, but not less than the market price at which the futures contract was established, for short futures contracts. The Funds were not invested in futures contracts during the year ended August 31, 2015.
f) Risks of Futures Contracts, Options on Futures Contracts and Short Positions – The risks inherent in the use of futures contracts, options on futures contracts and short positions include 1) adverse changes in the value of such instruments; 2) imperfect correlation between the price of futures contracts and options thereon and movements in the price of the underlying securities, index or futures contracts; 3) the possible absence of a liquid secondary market for any particular instrument at any time; 4) the possible need to defer closing out certain positions to avoid adverse tax consequences; and 5) the possible nonperformance by the counterparty under the terms of the contract. The Funds designate cash, cash
DIREXION ANNUAL REPORT
60
equivalents and liquid securities as collateral for futures contracts, options on futures contracts and short positions. The Funds were not invested in any type of options during the year ended August 31, 2015.
g) Risks of Investing in Foreign Securities – Investments in foreign securities involve greater risks than investing in domestic securities. As a result, a Fund's returns and net asset values may be affected to a large degree by fluctuations in currency exchange rates, political, diplomatic or economic conditions and regulatory requirements in other countries. The laws and accounting, auditing, and financial reporting standards in foreign countries may require less disclosure as required in the U.S., and there may be less public information available about foreign companies. Investments in foreign emerging markets present a greater risk than investing in foreign issuers in general. The risk of political or social upheaval is greater in emerging markets. In addition, there may be risks of an economy's dependence on revenues from particular commodities, currency transfer restrictions, a limited number of buyers for such securities and delays and disruptions in securities settlement procedures.
h) Investment Transactions – Investment transactions are recorded on trade date. The Funds determine the gain or loss realized from investment transactions by comparing the identified cost, which is the same basis used for federal income tax purposes, with the net sales proceeds.
i) Investments in Other Investment Companies – The Funds may invest a significant portion of their assets in other investment companies. The financial statements of these investment companies can be found at www.sec.gov.
j) Federal Income Taxes – Each Fund intends to comply with the requirements of Subchapter M of the Internal Revenue Code necessary to qualify as a regulated investment company and to make the requisite distributions of income and capital gains to its shareholders sufficient to relieve it from all or substantially all Federal income taxes and excise taxes. No provision for Federal income taxes has been made.
k) Income and Expenses – Dividend income is recorded on the ex-dividend date. Interest income, including amortization of premium and discount, is recognized on an accrual basis. Expenses are charged to the Funds daily. Expenses are computed based on each Fund's respective average daily net assets. For additional discussion on expenses, refer to Note 4.
l) Distributions to Shareholders – Each Fund pays dividends from net investment income and distributes net realized capital gains, if any, at least annually. Income and capital gain distributions are determined in accordance with income tax regulations, which may differ from GAAP. Certain Funds also utilize earnings and profits distributed to shareholders on redemptions of shares as part of the dividends paid deduction. Distributions to shareholders are recorded on the ex-dividend date.
The tax character of distributions during the years ended August 31, 2015 and August 31, 2014, were as follows:
| | | Direxion Monthly
NASDAQ-100® Bull 2X Fund | | Direxion Monthly S&P 500®
Bull 2X Fund | |
| | | Year Ended
August 31, 2015 | | Year Ended
August 31, 2014 | | Year Ended
August 31, 2015 | | Year Ended
August 31, 2014 | |
Distributions paid from: | |
Ordinary Income | | $ | 2,798,329 | | | $ | — | | | $ | 2,119,047 | | | $ | 2,131,249 | | |
Long-Term Capital Gains | | | — | | | | — | | | | — | | | | 23,213 | | |
Return of Capital | | | — | | | | — | | | | — | | | | — | | |
Total Distributions paid | | $ | 2,798,329 | | | $ | — | | | $ | 2,119,047 | | | $ | 2,154,462 | | |
| | | Direxion Monthly
S&P 500® Bear 2X Fund | | Direxion Monthly
Small Cap Bull 2X Fund | |
| | | Year Ended
August 31, 2015 | | Year Ended
August 31, 2014 | | Year Ended
August 31, 2015 | | Year Ended
August 31, 2014 | |
Distributions paid from: | |
Ordinary Income | | $ | — | | | $ | — | | | $ | 2,191 | | | $ | 331,257 | | |
Long-Term Capital Gains | | | — | | | | — | | | | — | | | | — | | |
Return of Capital | | | — | | | | — | | | | — | | | | — | | |
Total Distributions paid | | $ | — | | | $ | — | | | $ | 2,191 | | | $ | 331,257 | | |
DIREXION ANNUAL REPORT
61
| | | Direxion Monthly
Small Cap Bear 2X Fund | | Direxion Monthly
7-10 Year Treasury Bull 2X Fund | |
| | | Year Ended
August 31, 2015 | | Year Ended
August 31, 2014 | | Year Ended
August 31, 2015 | | Year Ended
August 31, 2014 | |
Distributions paid from: | |
Ordinary Income | | $ | — | | | $ | — | | | $ | — | | | $ | — | | |
Long-Term Capital Gains | | | — | | | | — | | | | — | | | | — | | |
Return of Capital | | | — | | | | — | | | | — | | | | — | | |
Total Distributions paid | | $ | — | | | $ | — | | | $ | — | | | $ | — | | |
| | | Direxion Monthly
7-10 Year Treasury Bear 2X Fund | | Direxion Dynamic
HY Bond Fund | |
| | | Year Ended
August 31, 2015 | | Year Ended
August 31, 2014 | | Year Ended
August 31, 2015 | | Year Ended
August 31, 2014 | |
Distributions paid from: | |
Ordinary Income | | $ | — | | | $ | — | | | $ | 2,647,444 | | | $ | 460,737 | | |
Long-Term Capital Gains | | | — | | | | — | | | | — | | | | — | | |
Return of Capital | | | — | | | | — | | | | — | | | | — | | |
Total Distributions paid | | $ | — | | | $ | — | | | $ | 2,647,444 | | | $ | 460,737 | | |
| | | Direxion Monthly
China Bull 2X Fund | | Direxion Monthly
Emerging Markets Bull 2X Fund | |
| | | Year Ended
August 31, 2015 | | Year Ended
August 31, 2014 | | Year Ended
August 31, 2015 | | Year Ended
August 31, 2014 | |
Distributions paid from: | |
Ordinary Income | | $ | — | | | $ | — | | | $ | — | | | $ | — | | |
Long-Term Capital Gains | | | — | | | | — | | | | — | | | | — | | |
Return of Capital | | | — | | | | — | | | | — | | | | — | | |
Total Distributions paid | | $ | — | | | $ | — | | | $ | — | | | $ | — | | |
| | | Direxion Monthly
Latin America Bull 2X Fund | | Direxion Monthly
Natural Resources Bull 2X Fund | |
| | | Year Ended
August 31, 2015 | | Year Ended
August 31, 2014 | | Year Ended
August 31, 2015 | | Year Ended
August 31, 2014 | |
Distributions paid from: | |
Ordinary Income | | $ | — | | | $ | — | | | $ | — | | | $ | — | | |
Long-Term Capital Gains | | | — | | | | — | | | | — | | | | — | | |
Return of Capital | | | — | | | | — | | | | — | | | | — | | |
Total Distributions paid | | $ | — | | | $ | — | | | $ | — | | | $ | — | | |
The Funds are designating as long-term capital gain dividends, pursuant to Internal Revenue Code Section 852(b)(3), the amount necessary to reduce the earnings and profits of the Fund related to net capital gain to zero for the tax year ended August 31, 2015. To the extent necessary to fully distribute such capital gains, the Funds also designate earnings and profits distributed to shareholders on the redemption of shares.
As of August 31, 2015, the components of accumulated earnings/losses of the Funds on a tax basis were as follows:
| | | Direxion Monthly
NASDAQ-100®
Bull 2X Fund | | Direxion Monthly
S&P 500® Bull
2X Fund | | Direxion Monthly
S&P 500® Bear
2X Fund | |
Tax cost of investments | | $ | — | | | $ | — | | | $ | — | | |
Gross unrealized appreciation | | | — | | | | — | | | | — | | |
Gross unrealized depreciation | | | — | | | | — | | | | — | | |
Net unrealized appreciation/(depreciation) | | $ | — | | | $ | — | | | $ | — | | |
Undistributed ordinary income (loss) | | | — | | | | — | | | | — | | |
Undistributed capital gain (loss) | | | — | | | | — | | | | — | | |
Total distributable earnings (losses) | | | — | | | | — | | | | — | | |
Other accumulated earnings (losses) | | | (3,728,899 | ) | | | (1,069,160 | ) | | | (58,464,193 | ) | |
Total accumulated earnings (losses) | | $ | (3,728,899 | ) | | $ | (1,069,160 | ) | | $ | (58,464,193 | ) | |
DIREXION ANNUAL REPORT
62
| | Direxion Monthly
Small Cap Bull
2X Fund | | Direxion Monthly
Small Cap Bear
2X Fund | | Direxion Monthly
7-10 Year
Treasury Bull
2X Fund | |
Tax cost of investments | | $ | — | | | $ | — | | | $ | — | | |
Gross unrealized appreciation | | | — | | | | — | | | | — | | |
Gross unrealized depreciation | | | — | | | | — | | | | — | | |
Net unrealized appreciation/(depreciation) | | $ | — | | | $ | — | | | $ | — | | |
Undistributed ordinary income (loss) | | | — | | | | — | | | | — | | |
Undistributed capital gain (loss) | | | — | | | | — | | | | — | | |
Total distributable earnings (losses) | | | — | | | | — | | | | — | | |
Other accumulated earnings (losses) | | | (3,480,649 | ) | | | (51,797,441 | ) | | | (10,760,116 | ) | |
Total accumulated earnings (losses) | | $ | (3,480,649 | ) | | $ | (51,797,441 | ) | | $ | (10,760,116 | ) | |
| | | Direxion Monthly
7-10 Year
Treasury Bear
2X Fund | | Direxion Dynamic
HY Bond Fund | | Direxion Monthly
China Bull
2X Fund | |
Tax cost of investments | | $ | — | | | $ | 2,085,878 | | | $ | — | | |
Gross unrealized appreciation | | | — | | | | 11,606 | | | | — | | |
Gross unrealized depreciation | | | — | | | | (97,580 | ) | | | — | | |
Net unrealized appreciation/(depreciation) | | $ | — | | | $ | (85,974 | ) | | $ | — | | |
Undistributed ordinary income (loss) | | | — | | | | 180,235 | | | | — | | |
Undistributed capital gain (loss) | | | — | | | | — | | | | — | | |
Total distributable earnings (losses) | | | — | | | | 180,235 | | | | — | | |
Other accumulated earnings (losses) | | | (24,698,747 | ) | | | (16,583,949 | ) | | | (16,404,778 | ) | |
Total accumulated earnings (losses) | | $ | (24,698,747 | ) | | $ | (16,489,688 | ) | | $ | (16,404,778 | ) | |
| | Direxion Monthly
Emerging Markets
Bull 2X Fund | | Direxion Monthly
Latin America
Bull 2X Fund | | Direxion Monthly
Natural
Resources
Bull 2X Fund | |
Tax cost of investments | | $ | — | | | $ | — | | | $ | — | | |
Gross unrealized appreciation | | | — | | | | — | | | | — | | |
Gross unrealized depreciation | | | — | | | | — | | | | — | | |
Net unrealized appreciation/(depreciation) | | $ | — | | | $ | — | | | $ | — | | |
Undistributed ordinary income (loss) | | | — | | | | — | | | | — | | |
Undistributed capital gain (loss) | | | — | | | | — | | | | — | | |
Total distributable earnings (losses) | | | — | | | | — | | | | — | | |
Other accumulated earnings (losses) | | | (54,594,631 | ) | | | (188,701,062 | ) | | | (29,944,510 | ) | |
Total accumulated earnings (losses) | | $ | (54,594,631 | ) | | $ | (188,701,062 | ) | | $ | (29,944,510 | ) | |
The difference between book cost of investments and tax cost of investments is attributable primarily to the tax deferral of losses on wash sales. Other accumulated gain/(loss) is generally comprised of capital loss carryforwards, qualified late year loss deferrals and/or unrealized gain/(loss) on derivative positions.
On the Statements of Assets and Liabilities, the following adjustments were made for permanent tax differences between accounting for net investment income/(loss) and realized gain and losses under GAAP and tax reporting:
| | Net Investment
Income/(Loss) | | Net Realized
Gain (Loss) | | Capital Stock | |
Direxion Monthly NASDAQ-100® Bull 2X Fund | | $ | 2,334,871 | | | $ | (7,332,342 | ) | | $ | 4,997,471 | | |
Direxion Monthly S&P 500® Bull 2X Fund | | | 202,498 | | | | (202,495 | ) | | | (3 | ) | |
Direxion Monthly S&P 500® Bear 2X Fund | | | 101,829 | | | | — | | | | (101,829 | ) | |
Direxion Monthly Small Cap Bull 2X Fund | | | 132,031 | | | | 4 | | | | (132,035 | ) | |
Direxion Monthly Small Cap Bear 2X Fund | | | 250,628 | | | | 5,310,686 | | | | (5,561,314 | ) | |
DIREXION ANNUAL REPORT
63
| | | Net Investment
Income | | Realized
Gain (Loss) | | Capital Stock | |
Direxion Monthly 7-10 Year Treasury Bull 2X Fund | | $ | 487,718 | | | $ | — | | | $ | (487,718 | ) | |
Direxion Monthly 7-10 Year Treasury Bear 2X Fund | | | 177,052 | | | | — | | | | (177,052 | ) | |
Direxion Dynamic HY Bond Fund | | | — | | | | — | | | | — | | |
Direxion Monthly China Bull 2X Fund | | | 61,539 | | | | — | | | | (61,539 | ) | |
Direxion Monthly Emerging Markets Bull 2X Fund | | | 198,626 | | | | — | | | | (198,626 | ) | |
Direxion Monthly Latin America Bull 2X Fund | | | 166,782 | | | | — | | | | (166,782 | ) | |
Direxion Monthly Natural Resources Bull 2X Fund | | | 130,491 | | | | — | | | | (130,491 | ) | |
Net investment income/(loss) and realized gains and losses for Federal income tax purposes may differ from those reported on the financial statements because of permanent book-to-tax differences. GAAP requires that permanent differences in net investment income/(loss) and realized gains and losses due to differences between financial reporting and tax reporting be reclassified between various components of net assets. The permanent differences primarily relate to net operating losses, expired capital loss carryforwards, excise taxes, distribution reclasses, and utilization of earnings and profits distributed to shareholders on redemption of shares.
In order to meet certain excise tax distribution requirements, the Funds are required to measure and distribute annually net capital gains realized during a twelve month period ending October 31 and net investment income earned during a twelve month period ending December 31. In connection with this, the Funds are permitted for tax purposes to defer into their next fiscal year qualified late year losses. Qualified late year capital losses are any net capital losses incurred between November 1 and the end of their fiscal year, August 31, 2015. Qualified late year ordinary losses are generally losses incurred between January 1 and the end of their fiscal year, August 31, 2015.
At August 31, 2015, the following Funds deferred, on a tax basis, qualified late year losses of:
| | Late Year
Ordinary Losses | | Post-October
Capital Losses | |
Direxion Monthly NASDAQ-100® Bull 2X Fund | | $ | — | | | $ | — | | |
Direxion Monthly S&P 500® Bull 2X Fund | | | 519,509 | | | | 549,651 | | |
Direxion Monthly S&P 500® Bear 2X Fund | | | 108,403 | | | | 628,041 | | |
Direxion Monthly Small Cap Bull 2X Fund | | | 425,002 | | | | — | | |
Direxion Monthly Small Cap Bear 2X Fund | | | 80,328 | | | | 2,349,804 | | |
Direxion Monthly 7-10 Year Treasury Bull 2X Fund | | | 353,588 | | | | 689,525 | | |
Direxion Monthly 7-10 Year Treasury Bear 2X Fund | | | 128,219 | | | | 259,436 | | |
Direxion Dynamic HY Bond Fund | | | — | | | | — | | |
Direxion Monthly China Bull 2X Fund | | | 80,671 | | | | 6,511,520 | | |
Direxion Monthly Emerging Markets Bull 2X Fund | | | 61,317 | | | | 6,656,769 | | |
Direxion Monthly Latin America Bull 2X Fund | | | 64,544 | | | | 4,108,974 | | |
Direxion Monthly Natural Resources Bull 2X Fund | | | 58,552 | | | | 1,119,662 | | |
Under the Regulated Investment Company Modernization Act of 2010, net capital losses recognized for tax years beginning after December 22, 2010 may be carried forward indefinitely, and their character is retained as short-term and/or long-term. Previous law limited the carry forward of capital losses to the eight tax years following the year the capital loss was realized. If a Fund has capital losses that are subject to current law and also has capital losses subject to prior law, the losses realized under current law will be utilized to offset capital gains before any of the losses governed by prior law can be used. As a result of these ordering rules, capital losses realized under previous law may be more likely to expire unused. Capital losses realized under current law will carry forward retaining their classification as long-term or short-term losses; as compared to under prior law in which all capital losses were carried forward as short-term capital losses.
At August 31, 2015 the following Funds had capital loss carryforwards on a tax basis of:
| | | 8/31/16 | | 8/31/17 | | 8/31/18 | | 8/31/19 | | Unlimited ST | | Unlimited LT | |
Direxion Monthly NASDAQ-100®
Bull 2X Fund | | $ | — | | | $ | — | | | $ | — | | | $ | — | | | $ | — | | | $ | — | | |
Direxion Monthly S&P 500® Bull 2X Fund | | | — | | | | — | | | | — | | | | — | | | | — | | | | — | | |
Direxion Monthly S&P 500® Bear 2X Fund | | | — | | | | (18,781,801 | ) | | | (4,649,215 | ) | | | — | | | | (28,531,126 | ) | | | — | | |
Direxion Monthly Small Cap Bull 2X Fund | | | — | | | | — | | | | — | | | | — | | | | — | | | | (207,928 | ) | |
DIREXION ANNUAL REPORT
64
| | | 8/31/16 | | 8/31/17 | | 8/31/18 | | 8/31/19 | | Unlimited ST | | Unlimited LT | |
Direxion Monthly Small Cap Bear 2X Fund | | $ | (6,570,886 | ) | | $ | — | | | $ | (3,873,693 | ) | | $ | (5,087,146 | ) | | $ | (30,668,918 | ) | | $ | — | | |
Direxion Monthly 7-10 Year Treasury
Bull 2X Fund | | | — | | | | — | | | | — | | | | — | | | | (6,189,350 | ) | | | (506,862 | ) | |
Direxion Monthly 7-10 Year Treasury
Bear 2X Fund | | | (941,855 | ) | | | (2,717,991 | ) | | | (1,976,123 | ) | | | — | | | | (17,103,460 | ) | | | — | | |
Direxion Dynamic HY Bond Fund | | | — | | | | — | | | | — | | | | — | | | | (16,256,133 | ) | | | (258,640 | ) | |
Direxion Monthly China Bull 2X Fund | | | — | | | | (1,208,734 | ) | | | — | | | | — | | | | (1,607,853 | ) | | | (6,994,897 | ) | |
Direxion Monthly Emerging Markets
Bull 2X Fund | | | — | | | | (6,688,903 | ) | | | (1,727,140 | ) | | | — | | | | (10,230,936 | ) | | | (25,730,098 | ) | |
Direxion Monthly Latin America
Bull 2X Fund | | | (148,741,363 | ) | | | — | | | | — | | | | — | | | | (6,970,105 | ) | | | (17,431,844 | ) | |
Direxion Monthly Natural Resources
Bull 2X Fund | | | — | | | | — | | | | (9,895,898 | ) | | | — | | | | (3,835,774 | ) | | | (9,272,235 | ) | |
The Direxion Monthly Small Cap Bear 2X Fund had $5,310,686 of capital losses expire on 8/31/2015.
To the extent that the Funds realize future net capital gains, those gains will be offset by any unused capital loss carryover.
The Funds follow authoritative financial reporting rules regarding recognition and measurement of tax positions taken or expected to be taken on a tax return. The Funds have reviewed all open tax years and concluded that there is no effect to the Funds' financial positions or results of operations and no tax liability resulting from unrecognized tax benefits relating to uncertain income tax position take or expected to be taken on a tax return. Open tax years are those years that are open for examination by the relevant income taxing authority. As of August 31, 2015, open Federal and state income tax years include the tax years ended August 31, 2012, August 31, 2013, August 31, 2014 and August 31, 2015. The Funds have no examination in progress. The Funds are also not aware of any tax positions for which it is reasonably possible that the total amounts of unrecognized tax expense will significantly change in the next twelve months.
m) Guarantees and Indemnifications – In the ordinary course of business, the Funds enter into contracts that contain a variety of indemnification provisions pursuant to which the Funds agree to indemnify third parties upon occurrence of specified events. The Funds' maximum exposure relating to these indemnification agreements is unknown. However, the Funds have not had prior claims or losses in connection with these provisions and believe the risk of loss is remote.
n) Use of Estimates – The preparation of financial statements in conformity with GAAP requires management to make estimates and assumptions that affect the reported amounts of assets and liabilities and disclosure of contingent assets and liabilities at the date of the financial statements and the reported amounts of revenues and expenses during the reporting period. Actual results could differ from those estimates.
3. INVESTMENT TRANSACTIONS
During the year ended August 31, 2015, the aggregate purchases and sales of investments (excluding short-term investments, swaps and futures contracts) in the Direxion Dynamic HY Bond Fund were $ 394,136,952 and $ 394,216,955, respectively. There were no purchases and sales as defined above in any of the other Funds.
There were no purchases or sales of long-term U.S. Government securities in the Funds during the year ended August 31, 2015.
4. INVESTMENT ADVISORY AND OTHER AGREEMENTS
Investment Advisory Agreement: The Funds have entered into an investment advisory agreement with the Adviser. The Adviser earns a fee, computed daily and payable monthly, applied to each Fund's average daily net assets at the annual rates presented below:
Direxion Monthly NASDAQ-100® Bull 2X Fund | | | 0.75 | % | |
Direxion Monthly S&P 500® Bull 2X Fund | | | 0.75 | % | |
Direxion Monthly S&P 500® Bear 2X Fund | | | 0.75 | % | |
Direxion Monthly Small Cap Bull 2X Fund | | | 0.75 | % | |
DIREXION ANNUAL REPORT
65
Direxion Monthly Small Cap Bear 2X Fund | | | 0.75 | % | |
Direxion Monthly 7-10 Year Treasury Bull 2X Fund | | | 0.75 | % | |
Direxion Monthly 7-10 Year Treasury Bear 2X Fund | | | 0.75 | % | |
Direxion Dynamic HY Bond Fund | | | 0.75 | % | |
Direxion Monthly China Bull 2X Fund | | | 0.75 | % | |
Direxion Monthly Emerging Markets Bull 2X Fund | | | 0.75 | % | |
Direxion Monthly Latin America Bull 2X Fund | | | 0.75 | % | |
Direxion Monthly Natural Resources Bull 2X Fund | | | 0.75 | % | |
Operating Services Agreement: The Funds have entered into an Operating Services Agreement (the "Agreement") with the Adviser. Under the Agreement, the Adviser will be responsible for all expenses of the Trust except the following: management fees, distribution and/or service fees, acquired fund fees, taxes, leverage interest, dividends or interest on short positions, other interest expenses, brokerage commission and other extraordinary expenses outside the typical day-to-day operations of the Funds through September 1, 2017.
In consideration for the services rendered pursuant to the Agreement, the Funds will pay to the Adviser, as compensation for the services provided by the Adviser under the Agreement, a monthly fee. The monthly fee is calculated on an annualized basis on the daily average net assets of each Fund and the below amount:
Direxion Monthly NASDAQ-100® Bull 2X Fund | | | 0.35 | % | |
Direxion Monthly S&P 500® Bull 2X Fund | | | 0.35 | % | |
Direxion Monthly S&P 500 Bear® 2X Fund | | | 0.35 | % | |
Direxion Monthly Small Cap Bull 2X Fund | | | 0.35 | % | |
Direxion Monthly Small Cap Bear 2X Fund | | | 0.35 | % | |
Direxion Monthly 7-10 Year Treasury Bull 2X Fund | | | 0.35 | % | |
Direxion Monthly 7-10 Year Treasury Bear 2X Fund | | | 0.35 | % | |
Direxion Dynamic HY Bond Fund | | | 0.35 | % | |
Direxion Monthly China Bull 2X Fund | | | 0.35 | % | |
Direxion Monthly Emerging Markets Bull 2X Fund | | | 0.35 | % | |
Direxion Monthly Latin America Bull 2X Fund | | | 0.35 | % | |
Direxion Monthly Natural Resources Bull 2X Fund | | | 0.35 | % | |
Distribution Expenses: Shares of the Funds are subject to an annual 12b-1 fee of up to 1.00% of a Fund's average daily net assets. Each Fund currently pays a 12b-1 fee of 0.25% of the Fund's average daily net assets.
Rafferty Capital Markets, LLC (the "Distributor") serves as principal underwriter of the Funds and acts as the Funds' distributor in a continuous public offering of the Funds' shares. The Distributor is an affiliate of the Adviser.
5. VALUATION MEASUREMENTS
The Funds follow authoritative fair valuation accounting standards, which establish an authoritative definition of fair value and set out a hierarchy for measuring fair value. These standards require additional disclosures about the various inputs and valuation techniques used to develop the measurements of fair value and a discussion in changes in valuation techniques and related inputs during the period. These inputs are summarized in the three broad levels below:
Level 1 – Quoted prices in active markets for identical securities
Level 2 – Evaluated price based on other significant observable inputs (including quoted prices for similar securities, interest rates, prepayment speeds, credit risk, etc.)
Level 3 – Significant unobservable inputs (including the Fund's own assumptions in determining fair value of investments)
The inputs or methodology used for valuing securities are not an indication of the credit risk associated with investing in those securities.
DIREXION ANNUAL REPORT
66
The follow is a summary of the inputs used to value the Funds' securities as of August 31, 2015:
| | | Direxion Monthly NASDAQ-100® Bull 2X Fund | |
Asset Class | | Level 1 | | Level 2 | | Level 3 | | Total | |
Other Financial Instruments* | | $ | — | | | $ | — | | | $ | — | | | $ | — | | |
| | | Direxion Monthly S&P 500® Bull 2X Fund | |
Asset Class | | Level 1 | | Level 2 | | Level 3 | | Total | |
Other Financial Instruments* | | $ | — | | | $ | — | | | $ | — | | | $ | — | | |
| | | Direxion Monthly S&P 500® Bear 2X Fund | |
Asset Class | | Level 1 | | Level 2 | | Level 3 | | Total | |
Other Financial Instruments* | | $ | — | | | $ | (557,364 | ) | | $ | — | | | $ | (557,364 | ) | |
| | | Direxion Monthly Small Cap Bull 2X Fund | |
Asset Class | | Level 1 | | Level 2 | | Level 3 | | Total | |
Other Financial Instruments* | | $ | — | | | $ | (1,256,737 | ) | | $ | — | | | $ | (1,256,737 | ) | |
| | | Direxion Monthly Small Cap Bear 2X Fund | |
Asset Class | | Level 1 | | Level 2 | | Level 3 | | Total | |
Other Financial Instruments* | | $ | — | | | $ | (639,489 | ) | | $ | — | | | $ | (639,489 | ) | |
| | | Direxion Monthly 7-10 Year Treasury Bull 2X Fund | |
Asset Class | | Level 1 | | Level 2 | | Level 3 | | Total | |
Other Financial Instruments* | | $ | — | | | $ | (226,452 | ) | | $ | — | | | $ | (226,452 | ) | |
| | | Direxion Monthly 7-10 Year Treasury Bear 2X Fund | |
Asset Class | | Level 1 | | Level 2 | | Level 3 | | Total | |
Other Financial Instruments* | | $ | — | | | $ | (429,856 | ) | | $ | — | | | $ | (429,856 | ) | |
| | | Direxion Dynamic HY Bond Fund | |
Asset Class | | Level 1 | | Level 2 | | Level 3 | | Total | |
Investment Companies – Fixed Income | | $ | 1,999,904 | | | $ | — | | | $ | — | | | $ | 1,999,904 | | |
Other Financial Instruments* | | | — | | | | (154 | ) | | | — | | | | (154 | ) | |
| | | Direxion Monthly China Bull 2X Fund | |
Asset Class | | Level 1 | | Level 2 | | Level 3 | | Total | |
Other Financial Instruments* | | | | $ | (1,103 | ) | | $ | — | | | $ | (1,103 | ) | |
| | | Direxion Monthly Emerging Markets Bull 2X Fund | |
Asset Class | | Level 1 | | Level 2 | | Level 3 | | Total | |
Other Financial Instruments* | | $ | — | | | $ | (558,385 | ) | | $ | — | | | $ | (558,385 | ) | |
| | | Direxion Monthly Latin America Bull 2X Fund | |
Asset Class | | Level 1 | | Level 2 | | Level 3 | | Total | |
Other Financial Instruments* | | $ | — | | | $ | (2,296,596 | ) | | $ | — | | | $ | (2,296,596 | ) | |
| | | Direxion Monthly Natural Resources Bull 2X Fund | |
Asset Class | | Level 1 | | Level 2 | | Level 3 | | Total | |
Other Financial Instruments* | | $ | — | | | $ | (2,064,246 | ) | | $ | — | | | $ | (2,064,246 | ) | |
For further detail on each asset class, see Schedules of Investments.
* Other financial instruments include swap contracts, which are valued at the net unrealized appreciation (depreciation) on the instrument.
The Funds also follow authoritative accounting standards, which require additional disclosure regarding fair value measurements. Specifically, these standards require reporting entities to disclose a) the input and valuation techniques used to measure fair value for both recurring and nonrecurring fair value measurements, for Level 2 or Level 3 positions, b) transfers between all levels (including Level 1 and Level 2) on a gross basis (i.e. transfers out must be disclosed separately from transfers in) as well as the reason(s) for the transfers, and c) purchases and sales on a gross basis in the Level 3 rollforward rather than as one net number. Additionally, reporting entities are required to disclose quantitative information about unobservable inputs used in the fair value measurements categorized within Level 3 of the fair value hierarchy.
DIREXION ANNUAL REPORT
67
There were no transfers between Level 1 and Level 2 securities during the year ended August 31, 2015. There were no Level 3 securities held by the Funds during the year ended August 31, 2015. It is the Funds' policy to recognize transfers into Level 3 at the value as of the beginning of the period, if applicable.
6. ADDITIONAL DISCLOSURES ABOUT DERIVATIVE INSTRUMENTS
The Funds follow authoritative standards of accounting for derivative instruments, which establish disclosure requirements for derivative instruments. These standards improve financial reporting for derivative instruments by requiring enhanced disclosures that enables investors to understand how and why a fund uses derivatives instruments, how a fund accounts for derivative instruments and how derivative instruments affect a fund's financial position and results of operations.
The Funds use derivative instruments as part of their principal investment strategy to achieve their investment objective. For additional discussion on the risks associated with derivative instruments refer to Note 2. As of August 31, 2015, the Funds were invested in swap contracts.
At August 31, 2015, the fair value of derivatives instruments, by primary risk, were as follows:
| Asset Derivatives1 | |
| | | | | Interest Rate Risk | | Commodities Risk | | Equity Risk | | Credit Risk | | Total | |
Direxion Dynamic HY
Bond Fund | | Swap contracts | | $ | — | | | $ | — | | | $ | — | | | $ | 394 | | | $ | 394 | | |
Direxion Monthly
Emerging Markets
Bull 2X Fund | | Swap contracts | | | — | | | | — | | | | 7,863 | | | | — | | | | 7,863 | | |
Direxion Monthly
Latin America
Bull 2X Fund | | Swap contracts | | | — | | | | — | | | | 23,149 | | | | — | | | | 23,149 | | |
Direxion Monthly
Natural Resources
Bull 2X Fund | | Swap contracts | | | — | | | | 41,534 | | | | — | | | | — | | | | 41,534 | | |
1 Statements of Assets and Liabilities location: Unrealized appreciation on swaps.
| Liability Derivatives1 | |
| | | | | Interest Rate Risk | | Commodities Risk | | Equity Risk | | Credit Risk | | Total | |
Direxion Monthly
S&P 500® Bear
2X Fund | | Swap contracts | | $ | — | | | $ | — | | | $ | 557,364 | | | $ | — | | | $ | 557,364 | | |
Direxion Monthly
Small Cap
Bull 2X Fund | | Swap contracts | | | — | | | | — | | | | 1,256,737 | | | | — | | | | 1,256,737 | | |
Direxion Monthly
Small Cap Bear
2X Fund | | Swap contracts | | | — | | | | — | | | | 639,489 | | | | — | | | | 639,489 | | |
Direxion Monthly
7-10 Year Treasury
Bull 2X Fund | | Swap contracts | | | 226,452 | | | | — | | | | — | | | | — | | | | 226,452 | | |
Direxion Monthly
7-10 Year Treasury
Bear 2X Fund | | Swap contracts | | | 429,856 | | | | — | | | | — | | | | — | | | | 429,856 | | |
Direxion Dynamic
HY Bond Fund | | Swap contracts | | | — | | | | — | | | | — | | | | 548 | | | | 548 | | |
DIREXION ANNUAL REPORT
68
| Liability Derivatives1 | |
| | | | | Interest Rate Risk | | Commodities Risk | | Equity Risk | | Credit Risk | | Total | |
Direxion Monthly
China Bull
2X Fund | | Swap contracts | | $ | — | | | $ | — | | | $ | 1,103 | | | $ | — | | | $ | 1,103 | | |
Direxion Monthly
Emerging Markets
Bull 2X Fund | | Swap contracts | | | — | | | | — | | | | 566,248 | | | | — | | | | 566,248 | | |
Direxion Monthly
Latin America
Bull 2X Fund | | Swap contracts | | | — | | | | — | | | | 2,319,745 | | | | — | | | | 2,319,745 | | |
Direxion Monthly
Natural Resources
Bull 2X Fund | | Swap contracts | | | — | | | | 2,105,780 | | | | — | | | | — | | | | 2,105,780 | | |
1 Statements of Assets and Liabilities location: Unrealized depreciation on swaps.
Transactions in derivative instruments during the year ended August 31, 2015, by primary risk, were as follows:
| | | | | Interest Rate Risk | | Commodities Risk | | Equity Risk | | Credit Risk | | Total | |
Direxion Monthly
NASDAQ-100®
Bull 2X Fund | | Net Realized gain (loss)1
Swap contracts | | $ | — | | | $ | — | | | $ | 5,901,619 | | | $ | — | | | $ | 5,901,619 | | |
| | | Change in net unrealized
appreciation (depreciation)2
Swap contracts | | | — | | | | — | | | | (14,550,792 | ) | | | — | | | | (14,550,792 | ) | |
Direxion Monthly
S&P 500® Bull
2X Fund | | Net Realized gain (loss)1
Swap contracts | | | — | | | | — | | | | (33,117 | ) | | | — | | | | (33,117 | ) | |
| | | Change in net unrealized
appreciation (depreciation)2
Swap contracts | | | — | | | | — | | | | (1,025,319 | ) | | | — | | | | (1,025,319 | ) | |
Direxion Monthly
S&P 500® Bear
2X Fund | | Net Realized gain (loss)1
Swap contracts | | | — | | | | — | | | | (946,460 | ) | | | — | | | | (946,460 | ) | |
| | | Change in net unrealized
appreciation (depreciation)2
Swap contracts | | | — | | | | — | | | | (217,548 | ) | | | — | | | | (214,548 | ) | |
Direxion Monthly
Small Cap Bull
2X Fund | | Net Realized gain (loss)1
Swap contracts | | |
— | | | |
— | | | |
945,451 | | | |
— | | | |
945,451 | | |
| | | Change in net unrealized
appreciation (depreciation)2
Swap contracts | | | — | | | | — | | | | (1,737,143 | ) | | | — | | | | (1,737,143 | ) | |
Direxion Monthly
Small Cap Bear
2X Fund | | Net Realized gain (loss)1
Swap contracts | | | — | | | | — | | | | (1,481,878 | ) | | | — | | | | (1,481,878 | ) | |
| | | Change in net unrealized
appreciation (depreciation)2
Swap contracts | | | — | | | | — | | | | 518,450 | | | | — | | | | 518,450 | | |
DIREXION ANNUAL REPORT
69
| | | | | Interest Rate Risk | | Commodities Risk | | Equity Risk | | Credit Risk | | Total | |
Direxion Monthly
7-10 Year Treasury Net Realized gain (loss)1
Bull 2X Fund | |
Swap contracts | | $ | 3,176,488 | | | $ | — | | | $ | — | | | $ | — | | | $ | 3,176,488 | | |
| | | Change in net unrealized
appreciation (depreciation)2
Swap contracts | | | (1,008,961 | ) | | | — | | | | — | | | | — | | | | (1,008,961 | ) | |
Direxion Monthly
7-10 Year Treasury
Bear 2X Fund | | Net Realized gain (loss)1
Swap contracts | | | (775,504 | ) | | | — | | | | — | | | | — | | | | (775,504 | ) | |
| | | Change in net unrealized
appreciation (depreciation)2
Swap contracts | | | (165,641 | ) | | | — | | | | — | | | | — | | | | (165,641 | ) | |
Direxion Dynamic
HY Bond Fund | | Net Realized gain (loss)1
Swap contracts | | | | | | | — | | | | — | | | | 723,363 | | | | 723,363 | | |
| | | Change in net unrealized
appreciation (depreciation)2
Swap contracts | | | | | | | — | | | | — | | | | (329 | ) | | | (329 | ) | |
Direxion Monthly
China Bull
2X Fund | | Net Realized gain (loss)1
Swap contracts | | | — | | | | — | | | | (4,961,461 | ) | | | — | | | | (4,961,461 | ) | |
| | | Change in net unrealized
appreciation (depreciation)2
Swap contracts | | | — | | | | — | | | | 58,015 | | | | — | | | | 58,015 | | |
Direxion Monthly
Emerging Markets
Bull 2X Fund | | Net Realized gain (loss)1
Swap contracts | | | — | | | | — | | | | (15,146,925 | ) | | | — | | | | (15,146,925 | ) | |
| | | Change in net unrealized
appreciation (depreciation)2
Swap contracts | | | — | | | | — | | | | (519,778 | ) | | | — | | | | (519,778 | ) | |
Direxion Monthly
Latin America
Bull 2X Fund | | Net Realized gain (loss)1
Swap contracts | | | — | | | | — | | | | (8,157,143 | ) | | | — | | | | (8,157,143 | ) | |
| | | Change in net unrealized
appreciation (depreciation)2
Swap contracts | | | — | | | | — | | | | (2,841,310 | ) | | | — | | | | (2,841,310 | ) | |
Direxion Monthly
Natural Resources
Bull 2X Fund | | Net Realized gain (loss)1
Swap contracts | | | — | | | | (5,048,486 | ) | | | — | | | | — | | | | (5,048,486 | ) | |
| | | Change in net unrealized
appreciation (depreciation)2
Swap contracts | | | — | | | | (1,753,957 | ) | | | — | | | | — | | | | (1,753,957 | ) | |
1 Statements of Operations location: Net realized gain (loss) on swaps.
2 Statements of Operations location: Change in net unrealized appreciation (depreciation) on swaps.
DIREXION ANNUAL REPORT
70
For the year ended August 31, 2015, the average quarterly volume of the derivatives held by each of the Funds was as follows:
| | | Quarterly Average Gross Notional Amounts | |
| | | Long Equity Swap
Contracts | | Short Equity Swap
Contracts | |
Direxion Monthly NASDAQ-100® Bull 2X Fund | | $ | 416,275,857 | | | $ | — | | |
Direxion Monthly S&P 500® Bull 2X Fund | | | 105,486,473 | | | | — | | |
Direxion Monthly S&P 500® Bear 2X Fund | | | — | | | | 20,805,298 | | |
Direxion Monthly Small Cap Bull 2X Fund | | | 52,940,745 | | | | — | | |
Direxion Monthly Small Cap Bear 2X Fund | | | — | | | | 20,510,605 | | |
Direxion Monthly 7-10 Year Treasury Bull 2X Fund | | | 194,133,003 | | | | — | | |
Direxion Monthly 7-10 Year Treasury Bear 2X Fund | | | — | | | | 30,229,532 | | |
Direxion Dynamic HY Bond Fund | | | 52,197,035 | | | | — | | |
Direxion Monthly China Bull 2X Fund | | | 16,316,579 | | | | — | | |
Direxion Monthly Emerging Markets Bull 2X Fund | | | 26,871,435 | | | | — | | |
Direxion Monthly Latin America Bull 2X Fund | | | 21,064,252 | | | | — | | |
Direxion Monthly Natural Resources Bull 2X Fund | | | 16,488,028 | | | | — | | |
The Funds, with the exception of the Direxion Dynamic HY Bond Fund, utilize this volume of derivatives to obtain leverage in order to meet the investment objectives of 200% (or -200%) calendar month performance of their respective indices. Direxion Dynamic HY Bond Fund utilizes the volume of derivatives to obtain leverage in order to meet its investment objective of 120% calendar month performance of its index.
7. SUBSEQUENT EVENTS
The Direxion Dynamic HY Bond Fund paid an income distribution to the Investor Class in the amount of $0.085 per share, with a record date of September 15, 2015 and ex-date and payable date of September 16, 2015. The Direxion Dynamic HY Bond Fund also paid an income distribution to the Investor Class in the amount of $0.383 per share, with a record date of October 15, 2015 and ex-date and payable date of October 16, 2015.
The Funds follow authoritative standards for accounting for and disclosure of events that occur after the Statements of Assets and Liabilities date but before the financial statements are issued or are available to be issued. These standards require the Funds to recognize in the financial statements the effects of all recognized subsequent events that provide additional evidence about conditions that existed at the date of the Statements of Assets and Liabilities. For nonrecognized subsequent events that must be disclosed to keep the financial statements from being misleading, the Funds are required to disclose the nature of the event as well as an estimate of its financial effect, or a statement that such an estimate cannot be made. The Funds have evaluated subsequent events through the issuance of the Funds' financial statements and have determined there is no impact to the Funds' financial statements.
DIREXION ANNUAL REPORT
71
Direxion Funds
Report of Independent Registered Public Accounting Firm
The Board of Trustees and Shareholders of Direxion Funds
We have audited the accompanying statements of assets and liabilities, including the schedules of investments, of Direxion Monthly NASDAQ-100® Bull 2X Fund, Direxion Monthly S&P 500® Bull 2X Fund, Direxion Monthly S&P 500® Bear 2X Fund, Direxion Monthly Small Cap Bull 2X Fund, Direxion Monthly Small Cap Bear 2X Fund, Direxion Monthly 7-10 Year Treasury Bull 2X Fund, Direxion Monthly 7-10 Year Treasury Bear 2X Fund, Direxion Dynamic HY Bond Fund, Direxion Monthly China Bull 2X Fund, Direxion Monthly Emerging Markets Bull 2X Fund, Direxion Monthly Latin America Bull 2X Fund, and Direxion Monthly Natural Resources Bull 2X Fund ((twelve of the series of Direxion Funds) (the "Funds")) as of August 31, 2015, and the related statements of operations for the year then ended, the statements of changes in net assets for the two years in the period then ended and the financial highlights for each of the periods indicated therein. These financial statements and financial highlights are the responsibility of the Funds' management. Our responsibility is to express an opinion on these financial statements and financial highlights based on our audits.
We conducted our audits in accordance with the standards of the Public Company Accounting Oversight Board (United States). Those standards require that we plan and perform the audits to obtain reasonable assurance about whether the financial statements and financial highlights are free of material misstatement. We were not engaged to perform an audit of the Funds' internal control over financial reporting. Our audits included consideration of internal control over financial reporting as a basis for designing audit procedures that are appropriate in the circumstances, but not for the purpose of expressing an opinion on the effectiveness of the Funds' internal control over financial reporting. Accordingly, we express no such opinion. An audit also includes examining, on a test basis, evidence supporting the amounts and disclosures in the financial statements and financial highlights, assessing the accounting principles used and significant estimates made by management, and evaluating the overall financial statement presentation. Our procedures included confirmation of securities owned as of August 31, 2015, by correspondence with the custodian and brokers. We believe that our audits provide a reasonable basis for our opinion.
In our opinion, the financial statements and financial highlights referred to above present fairly, in all material respects, the financial position of each of the respective Funds constituting the Direxion Funds at August 31, 2015, the results of their operations for the year then ended, the changes in their net assets for each of the two years in the period then ended, and the financial highlights for each of the periods indicated therein, in conformity with U.S. generally accepted accounting principles.
New York, New York
October 28, 2015
DIREXION ANNUAL REPORT
72
Direxion Funds
Supplemental Information (Unaudited)
For the year ended August 31, 2015, certain dividends paid by the Funds may be subject to a maximum rate of 15%, as provided for by the Jobs and Growth Tax Relief Reconciliation Act of 2003. The amount of dividends declared from ordinary income designated as qualified income was 0.00% for each of the Funds.
For corporate shareholders, the amount of ordinary income distributions qualifying for the corporate dividends received deduction for the year ended August 31, 2015 was 0.00% for each of the Funds.
Householding
In an effort to decrease costs, the Funds intend to reduce the number of duplicate prospectuses, Annual and Semi-Annual Reports, proxy statements and other similar documents you receive by sending only one copy of each to those addresses shared by two or more accounts and to shareholders we reasonably believe are from the same family or household. Householding begins once you have signed your account application. After such time, if you would like to discontinue householding for your accounts, please call toll-free at (800) 851-0511 to request individual copies of these documents. Once the Funds receive notice to stop householding, we will begin sending individual copies thirty days after receiving your request. This policy does not apply to account statements.
DIREXION ANNUAL REPORT
73
Direxion Funds
Investment Advisory Agreement Approval (Unaudited)
The Board of Trustees (the "Board") of the Direxion Funds (the "Direxion Trust") is required under the Investment Company Act of 1940, as amended (the "1940 Act"), to annually approve the renewal of the Investment Advisory Agreement (the "Agreement") between Rafferty Asset Management ("Rafferty") and the Direxion Funds (the "Direxion Trust"), on behalf of the Direxion Monthly S&P 500® Bull 2X Fund, Direxion Monthly S&P 500® Bear 2X Fund, Direxion Monthly NASDAQ-100® Bull 2X Fund, Direxion Monthly Small Cap Bull 2X Fund, Direxion Monthly Small Cap Bear 2X Fund, Direxion Monthly Emerging Markets Bull 2X Fund, Direxion Monthly China Bull 2X Fund, Direxion Monthly Latin America Bull 2X Fund, Direxion Monthly Natural Resources Bull 2X Fund (formerly Direxion Monthly Commodity Bull 2X Fund), Direxion Monthly 7-10 Year Treasury Bull 2X Fund (formerly Direxion Monthly 10 Year Note Bull 2X Fund), Direxion Monthly 7-10 Year Treasury Bear 2X Fund (formerly Direxion Monthly 10 Year Note Bear 2X Fund) (collectively, the "Leveraged Index Funds") and the Direxion Dynamic HY Bond Fund (the "Dynamic Fund"), each a series of the Direxion Trust. Each series of the Direxion Trust is referred to herein as a "Fund" and collectively as the "Funds." Below is a summary of certain factors the Board, including the trustees who are not "interested persons" as defined in the 1940 Act, considered at its August 13, 2015 Board meeting when approving the renewal of the Investment Advisory Agreement for each Fund.
The Board did not identify any particular information that was most relevant to its consideration to approve the Agreement and each Trustee may have afforded different weight to the various factors. In addition, the Board noted that the Trustees have considered various reports and information provided throughout the year at regular Board meetings and otherwise, and that the Independent Board members had met separately on August 5, 2015, to consider these specific contract renewals. In considering whether to renew the Agreement, the Board evaluated all information on a Fund-by-Fund basis and their determinations were made separately for each Fund. The Board requested, and Rafferty provided, information regarding these matters.
In each instance, the Board considered, among others, the following factors, to the extent applicable: (1) the nature, extent, and quality of the services provided; (2) the investment performance of the Fund; (3) the profitability of the advisory business to Rafferty; (4) the extent to which economies of scale have been taken into account in setting fee schedules; (5) whether fee levels reflect these economies of scale, if any, for the benefit of Fund shareholders; (6) comparisons of services and fees with contracts entered into by Rafferty with other clients, if any; and (7) other benefits derived or anticipated to be derived and identified by Rafferty from its relationship with the Funds. In addition to being advised by independent legal counsel, the Board retained an independent consultant's services to evaluate certain information provided to the Board.
Nature, Extent and Quality of Services Provided. The Board reviewed the nature, extent and quality of the services provided or to be provided under the Agreement by Rafferty. The Board noted that Rafferty has provided services to the Direxion Trust since its inception and has developed an expertise in managing the Funds in the Direxion Trust, particularly those using a leveraged strategy. The Board focused on the quality of personnel and operations at Rafferty and the systems and processes required to manage the leveraged and non-leveraged Funds effectively and noted that these processes may not be present at other investment advisers. In particular, the Board considered the following:
• the investment objective of each Fund and the extent of Rafferty's success in achieving the investment objective of each Fund;
• that the investment objectives of the Leveraged Index Funds require monthly rebalancing and the utilization of complex financial instruments that are not typical of traditional index tracking mutual funds;
• the level of attention required by Rafferty due to the frequent and large trading activity in the Dynamic and Leveraged Index Funds; and
• the size and experience of Rafferty's portfolio management staff and the staff's relevant experience and specific expertise required to manage the Funds.
The Board also considered Rafferty's representation that it has the financial resources and appropriate staffing to manage the Funds and meet its expense reimbursement obligations, if any. The Board considered that Rafferty oversees all aspects of the operation of the Funds, including oversight of the Funds' service providers and provides compliance services to the Funds.
Based on its review and other considerations, the Board determined that with respect to each Fund, in the exercise of its business judgment, the nature, extent and quality of the services provided by Rafferty to the Funds under the Agreement, were fair and reasonable, and benefited shareholders.
DIREXION ANNUAL REPORT
74
Direxion Funds
Investment Advisory Agreement Approval (Unaudited)
Performance of the Funds. The Board considered relative performance information for each Fund. The Board utilized performance reports provided to the Board in anticipation of the meeting, as well as performance reports provided at regular Board meetings throughout the year. The Board evaluated the performance of each Leveraged Index Fund relative to performance models for the month-end, quarter ended and one-year for the periods ended June 30, 2015 and the one-year period ended June 30, 2014. The Board also evaluated the performance of the Dynamic Fund relative to: (1) its benchmark index for year-to-date, one-year, three-year and five-year periods ended June 30, 2015; and (2) the average performance of the relevant peer fund universe for year-to-date, one-year, three-year and five-year periods ended June 30, 2015.
Leveraged Index Funds: The Board considered Rafferty's explanation that because the investment objective of the Leveraged Index Funds is to seek investment results that correlate to the performance of an underlying index, the performance of the Leveraged Index Funds is more appropriately compared to returns generated by an investment model that takes into account the leverage and compounding impact of each Leveraged Index Fund's investment strategy, rather than to the return of market indices. The Board noted that the correlation of each Leveraged Index Fund to the investment model during the applicable periods was within expected ranges. Rafferty discussed that any variations in return relative to the models were due to a combination of factors, including fund expenses and the impact of cash flows into and out of a Fund. The Board further noted that, given the nature of the Leveraged Index Funds' investment objectives, the correlation of a Leveraged Index Fund's performance to the performance of an investment model provided more meaningful information than a Leveraged Index Fund's total return.
Dynamic Fund: The Board considered the performance of the Dynamic Fund versus the performance information provided by Morningstar, Inc. ("Morningstar") for a peer group of funds it selected (the "Morningstar Peer Group"). The Board also considered that as of June 30, 2015, the Dynamic Fund underperformed the average of its relevant Morningstar Peer Group for the year-to-date, one-year, three-year and five-year periods. The Board noted that, as of September 2013, the Board approved a change in the Dynamic Fund's investment strategy to allow the Dynamic Fund to take positions in derivative instruments in order to create leverage. The Board noted Rafferty's representation that the Fund does not limit how often investors may buy or sell shares of the Fund and that the Fund may, at times, experience large shareholder redemptions.
Costs of Services Provided to the Funds and Profits Realized. The Board considered the fairness and reasonableness of the advisory fees payable to Rafferty under the Agreement given the investment advisory services provided, the costs of these services, the profitability of Rafferty and the comparability to advisory fees and total expenses of other mutual funds that offer strategies similar in nature to the Funds. The Board discussed the methodology used to prepare the comparative fee information for each Fund and noted that there are few fund complexes that have funds with substantially similar investment objectives and operations.
The Board reviewed information that was prepared by USBancorp Fund Services, LLC at the direction of Rafferty, using data from Morningstar that compared the advisory fee rates paid by each Fund to other funds with investment objectives similar to each Fund. The Board also noted that an independent consultant retained by the Board reviewed the methodology utilized to select the peer funds included in each Fund's peer group. The comparison reports provided to the Board included the advisory fee and net and gross total expense ratios, less any Rule 12b-1 fees and shareholder services fees for each Fund and funds included in its respective peer group.
For the Leveraged Index Funds, the Board considered that the Funds' total expense ratios are generally lower than, or equal to, those of their competitors, and the Funds' advisory fees for those Leveraged Index Funds that provide 200% (or 200% of the inverse) exposure to their benchmarks, are generally the same as, or lower than, the fees for those of their competitors.
The Board considered the selection of peer funds and the Morningstar category used for the Dynamic Fund in the comparison information provided. The Board considered that the Fund's actual advisory fee rate and total expense ratio were both higher than the respective medians of the Fund's peer group. The Board considered Rafferty's explanation that although the Fund's fees were higher than other funds in its peer group, the Fund has certain differences than other high yield bond funds contained in its peer group, because it is designed to be actively traded by its shareholders. Additionally, the Board considered that the Fund is the only leveraged high yield fund in its peer group, which may lead to higher expenses.
DIREXION ANNUAL REPORT
75
Direxion Funds
Investment Advisory Agreement Approval (Unaudited)
The Board also considered that Rafferty contractually agreed to limit the total expenses of each Fund (subject to certain exclusions) for the upcoming fiscal years by agreeing to pay certain expenses of the Funds under the Operating Services Agreement.
The Board received information regarding the profitability of Rafferty. The Board considered the profitability of Rafferty's advisory business on a Fund-by-Fund basis. The Board reviewed the costs related to managing the advisory business, including regulatory compliance and other costs. The Board concluded that, in the exercise of its business judgment, the advisory fee rates for each Fund were fair and reasonable given the services provided by Rafferty.
Economies of Scale. The Board also considered Rafferty's representation that it believes that asset levels at this time are not sufficient to achieve economies of scale and do not warrant the addition of breakpoints. Rafferty noted that it was continuing to work on its sales and marketing efforts to raise additional assets. Based on these and other considerations, the Board determined that, in the exercise of its business judgment, any addition of breakpoints was not necessary at this time.
Other Benefits. The Board considered any indirect or "fall-out" benefits that Rafferty or its affiliates may derive from their relationship to the Funds. Such benefits may include Rafferty's ability to leverage its investment management personnel or infrastructure to manage other accounts. The Board also considered that Rafferty's overall business with brokerage firms helps to lower commission rates and provide better execution for Fund portfolio transactions. Based on these and other considerations, the Board determined that, in the exercise of its business judgment, the benefits to Rafferty were fair and reasonable.
Conclusion. Based on, but not limited to, the above considerations and determinations, the Board, including the Independent Trustees, determined that the Agreement for the Funds was fair and reasonable in light of the nature, extent and quality of the services to be performed, fees, expenses and such other matters as the Board considered relevant in the exercise of its business judgment and that the continuation of the Agreement was in the best interests of the shareholders of the Funds. On this basis, the Board unanimously voted in favor of the continuance of the Agreement.
DIREXION ANNUAL REPORT
76
Direxion Funds
Trustees and Officers
Interested Trustees
Name, Address and
Age | | Position(s)
Held with
Fund | | Term of Office
and Length of
Time Served | | Principal Occupation(s)
During Past Five Years | | # of Portfolios
in Direxion
Family of
Investment
Companies
Overseen
by Trustee(3) | | Other Trusteeships/
Directorships Held by
Trustee During Past
Five Years | |
Daniel D. O'Neill(1)
Age: 47 | |
Chairman of the Board of Trustees | |
Lifetime of Trust until removal or resignation; Since 2008 | |
Managing Director of Rafferty, 1999-present. | | |
140 | | |
None. | |
Eric W. Falkeis(2)
Age: 41 | |
Trustee | |
Lifetime of Trust until removal or resignation; Since 2014 | |
Chief Operating Officer, since April 2014, Rafferty Asset Management, LLC; formerly, President Rafferty Asset Management, LLC, March 2013 – April 2014; formerly, Senior Vice President, USBFS, September 2007 – March 2013; Chief Financial Officer, USBFS, April 2006 – March 2013; Vice President, USBFS, 1997-2007; formerly, Chief Financial Officer, Quasar Distributors, LLC (2000-2003). | | |
140 | | |
Trustee,
Professionally
Managed Portfolios
(45 Funds) | |
Independent Trustees
Name, Address and
Age | | Position(s)
Held with
Fund | | Term of Office
and Length of
Time Served | | Principal Occupation(s)
During Past Five Years | | # of Portfolios
in Direxion
Family of
Investment
Companies
Overseen
by Trustee(3) | | Other Trusteeships/
Directorships Held by
Trustee During Past
Five Years | |
Gerald E. Shanley III
Age: 71 | |
Trustee | |
Lifetime of Trust until removal or resignation; Since 2008 | |
Retired, Since 2002; Business Consultant, 1985-present; Trustee of Trust Under Will of Charles S. Payson, 1987-present; C.P.A., 1979-present. | | |
140 | | |
None. | |
(1) Mr. O'Neill is affiliated with Rafferty. Mr. O'Neill is the Managing Director of Rafferty and owns a beneficial interest in Rafferty.
(2) Mr. Falkeis is affiliated with Rafferty. Mr. Falkeis is the Chief Operating Officer of Rafferty.
(3) The Direxion Family of Investment Companies consists of the Direxion Shares ETF Trust which, as of the date of this report, offers for sale to the public 74 of the 121 funds registered with the SEC, the Direxion Funds which, as of the date of this report, offers for sale to the public 16 funds registered with the SEC and the Direxion Insurance Trust which, as of the date of this report, offers for sale to the public 3 funds registered with the SEC.
DIREXION ANNUAL REPORT
77
Direxion Funds
Trustees and Officers
Name, Address and
Age | | Position(s)
Held with
Fund | | Term of Office
and Length of
Time Served | | Principal Occupation(s)
During Past Five Years | | # of Portfolios
in Direxion
Family of
Investment
Companies
Overseen
by Trustee(1) | | Other Trusteeships/
Directorships Held by
Trustee During Past
Five Years | |
John A. Weisser
Age: 73 | |
Trustee | |
Lifetime of Trust until removal or resignation; Since 2008 | |
Retired, Since 1995; Salomon Brothers, Inc., 1971-1995, most recently as Managing Director. | | |
140 | | |
Director, The MainStay Funds Trust (39 Funds), The MainStay Funds (12 Funds), MainStay VP Fund Series (29 Funds), Mainstay Defined Term Municipal Opportunities Fund (1 Fund); Private Advisors Alternative Strategy Fund (1 Fund); Private Advisors Alternative Strategies Master Fund (1 Fund). | |
David L. Driscoll
Age: 46 | |
Trustee | |
Lifetime of Trust until removal or resignation; Since 2014 | |
Partner, King Associates, LLP, since 2004; Board Advisor, University Common Real Estate, since 2012; Principal, Grey Oaks LLP since 2003; Member, Kendrick LLC, since 2006. | | |
140 | | |
None. | |
Jacob C. Gaffey
Age: 67 | |
Trustee | |
Lifetime of Trust until removal or resignation; Since 2014 | |
Managing Director of Loomis & Co. since 2012; Partner, Bay Capital Advisors, LLC 2008-2012. | | |
140 | | |
Director, Costa, Inc. (formerly A.T.
Cross, Inc.). | |
(1) The Direxion Family of Investment Companies consists of the Direxion Shares ETF Trust which, as of the date of this report, offers for sale to the public 74 of the 121 funds registered with the SEC, the Direxion Funds which, as of the date of this report, offers for sale to the public 16 funds registered with the SEC and the Direxion Insurance Trust which, as of the date of this report, offers for sale to the public 3 funds registered with the SEC.
DIREXION ANNUAL REPORT
78
Direxion Funds
Trustees and Officers
Principal Officers of the Trust
The officers of the Trust conduct and supervise its daily business. Unless otherwise noted, an individual's business address is 1301 Avenue of the Americas, 35th Floor, New York, New York 10019. As of the date of this report, the officers of the Trust, their ages, their business address and their principal occupations during the past five years are as follows:
Name, Address and
Age | | Position(s)
Held with
Fund | | Term of Office
and Length of
Time Served | | Principal Occupation(s)
During Past Five Years | | # of Portfolios
in the Direxion
Family of
Investment
Companies
Overseen
by Trustee(3) | | Other Trusteeships/
Directorships Held by
Trustee During Past
Five Years | |
Daniel D. O'Neill(1)
Age: 47 | |
Chief Executive Officer and Chief Investment Officer | |
One Year; Since 2008 | |
Managing Director of Rafferty, 1999-present. | | |
140 | | |
N/A | |
Eric W. Falkeis(2)
Age: 41 | |
Principal Executive Officer | |
One Year; Since 2014 | |
Chief Operating Officer, since April 2014, Rafferty Asset Management, LLC; formerly, President, Rafferty Asset Management, LLC, March 2013 – April 2014; formerly, Senior Vice President, USBFS, September 2007 – March 2013; Chief Financial Officer, USBFS, April 2006 – March 2013; Vice President, USBFS, 1997-2007; formerly, Chief Financial Officer, Quasar Distributors, LLC (2000-2003). | | |
140 | | |
Trustee, Professionally Managed Portfolios (45 Funds) | |
Patrick J. Rudnick
Age: 42 | |
Principal Financial Officer and Assistant Secretary | |
One Year; Since 2010 | |
Senior Vice President and Principal Financial Officer, Rafferty Asset Management, LLC, since March 2013; formerly Vice President, USBFS (2006-2013); formerly, Manager, PricewaterhouseCoopers LLP (1999-2006). | |
N/A | |
N/A | |
(1) Mr. O'Neill serves as Chairman of the Board of Trustees of the Direxion Funds, Direxion Insurance Trust and Direxion Shares ETF Trust.
(2) Mr. Falkeis serves as a Trustee of the Direxion Funds, Direxion Insurance Trust and Direxion Shares ETF Trust.
(3) The Direxion Family of Investment Companies consists of the Direxion Shares ETF Trust which, as of the date of this report, offers for sale to the public 74 of the 121 funds registered with the SEC, the Direxion Funds which, as of the date of this report, offers for sale to the public 16 funds registered with the SEC and the Direxion Insurance Trust which, as of the date of this report, offers for sale to the public 3 funds registered with the SEC.
DIREXION ANNUAL REPORT
79
Direxion Funds
Trustees and Officers
Name, Address and
Age | | Position(s)
Held with
Fund | | Term of Office
and Length of
Time Served | | Principal Occupation(s)
During Past Five Years | | # of Portfolios
in the Direxion
Family of
Investment
Companies
Overseen
by Trustee(1) | | Other Trusteeships/
Directorships Held by
Trustee During Past
Five Years | |
Angela Brickl
Age: 39 | |
Chief Compliance Officer
Secretary | |
One Year; Since 2012
One Year; Since 2011 | |
General Counsel and Chief Compliance Officer, Rafferty Asset Management, LLC, since October 2010; Summer Associate at Skadden, Arps, Slate, Meagher & Flom, LLP, May – August 2009; Summer Associate at Foley & Lardner, LLP May – August 2008; Vice President USBFS November 2003 – August 2007. | |
N/A | |
N/A | |
(1) The Direxion Family of Investment Companies consists of the Direxion Shares ETF Trust which, as of the date of this report, offers for sale to the public 74 of the 121 funds registered with the SEC, the Direxion Funds which, as of the date of this report, offers for sale to the public 16 funds registered with the SEC and the Direxion Insurance Trust which, as of the date of this report, offers for sale to the public 3 funds registered with the SEC.
DIREXION ANNUAL REPORT
80
THIS PAGE INTENTIONALLY LEFT BLANK
81
THIS PAGE INTENTIONALLY LEFT BLANK
82
At the Direxion Funds, we are committed to protecting your privacy. To open and service your Direxion accounts, we collect and maintain certain nonpublic personal information about you, such as your address, phone number, social security number, purchases, sales, account balances, bank account information and other personal financial information. We collect this information from the following sources:
• Account applications or other forms on which you provide information,
• Mail, e-mail, the telephone and our website, and
• Your transactions and account inquiries with us.
We safeguard the personal information that you have entrusted to us in the following ways:
• As a general policy, only those employees who maintain your account and respond to your requests for additional services have access to your account information.
• We maintain physical, electronic, and procedural safeguards to insure the security of your personal information and to prevent unauthorized access to your information.
We do not disclose any nonpublic personal information about you or our former shareholders to anyone, except as permitted or required by law. In the course of conducting business and maintaining your account we may share shareholder information, as allowed by law, with our affiliated companies and with other service providers, including financial intermediaries, custodians, transfer agents and marketing consultants. Those companies are contractually bound to use that information only for the services for which we hired them. They are not permitted to use or share our shareholders' nonpublic personal information for any other purpose. There also may be times when we provide information to federal, state or local authorities as required by law.
In the event that you hold fund shares of Direxion through a financial intermediary, including, but not limited to, a broker-dealer, bank, or trust company, the privacy policy of your financial intermediary would govern how your nonpublic personal information would be shared with nonaffiliated third parties.
For questions about our policy, please contact us at (800) 851-0511.
This page is not a part of the Annual Report.
DIREXION ANNUAL REPORT

ANNUAL REPORT AUGUST 31, 2015
1301 Avenue of the Americas (6th Ave.), 35th Floor New York, New York 10019 (800) 851-0511 www.direxioninvestments.com
Investment Adviser
Rafferty Asset Management, LLC
1301 Avenue of the Americas (6th Ave.), 35th Floor
New York, NY 10019
Administrator, Transfer Agent, Dividend Paying Agent & Shareholding Servicing Agent
U.S. Bancorp Fund Services, LLC
P.O. Box 1993
Milwaukee, WI 53201-1993
Custodian
U.S. Bank, N.A.
1555 RiverCenter Dr., Suite 302
Milwaukee, WI 53212
Independent Registered Public Accounting Firm
Ernst & Young LLP
5 Times Square
New York, NY 10036
Distributor
Rafferty Capital Markets, LLC
1010 Franklin Ave., 3rd Floor
Garden City, NY 11530
The Trust's Proxy Voting Policies are available without charge by calling 1-800-851-0511, or by accessing the SEC's website, at www.sec.gov.
The actual voting records relating to portfolio securities during the most recent period ended June 30 (starting with the year ended June 30, 2005) is available without charge by calling 1-800-851-0511 or by accessing the SEC's website at www.sec.gov.
The Trust files complete schedules of portfolio holdings with the SEC on Form N-Q. The Form N-Q is available without change, upon request, by calling 1-800-851-0511, or by accessing the SEC's website, at www.sec.gov.
This report has been prepared for shareholders and may be distributed to others only if preceded or accompanied by a current prospectus.

Annual
Report
Direxion Hilton
Tactical Income Fund
(formerly Hilton Yield Plus Fund)
AUGUST 31, 2015
TICKERS:
CLASS A - HCYAX | INSTITUTIONAL CLASS - HCYIX | CLASS C - HCYCX


1301 Avenue of the Americas (6th Avenue), 35th Floor | New York, New York 10019 | (800) 851-0511
www.direxioninvestments.com
Letter to Shareholders | | | 4 | | |
| Performance Summary | | | 8 | | |
| Expense Example | | | 9 | | |
| Allocation of Portfolio Holdings | | | 10 | | |
| Schedule of Investments | | | 11 | | |
| Financial Statements | | | 13 | | |
| Financial Highlights | | | 16 | | |
| Notes to the Financial Statements | | | 17 | | |
Report of Independent Registered Public
Accounting Firm | | | 22 | | |
| Supplemental Information (Unaudited) | | | 23 | | |
Investment Advisory and Subadvisory
Agreement Approvals (Unaudited) | | | 24 | | |
| Trustees and Officers | | | 26 | | |
Help Preserve the Environment – Go Green!
Go paperless with Direxion e-Delivery – a service allowing shareholders to reduce clutter with full online access to regulatory documents. Begin the preservation process with e-delivery.
With Direxion e-Delivery you can:
• Receive email notifications when your most recent shareholder communications are available for review.
• Access prospectuses, annual reports and semiannual reports online.
It's easy to enroll:
1. Visit www.direxioninvestments.com/edelivery
2. Follow the simple enrollment instructions
If you have questions about Direxion e-Delivery services, contact one of our shareholder representatives at 800-851-0511.


Dear Shareholders,
This Annual Report is for the Direxion Hilton Tactical Income Fund (the "Fund"), and covers the period from September 1, 2014 to August 31, 2015 (the "Annual Period"). The Fund was formerly known as the Hilton Yield Plus Fund and was formerly a series of the Managed Portfolio Series Trust. On December 5, 2014, the assets of the Hilton Yield Plus Fund were transferred to the Fund in a tax-free reorganization approved by the shareholders. Prior to the reorganization, Hilton Capital Management, LLC ("Hilton" or the "Subadviser") served as the Hilton Yield Plus Fund's Adviser. Subsequent to the reorganization, Rafferty Asset Management, LLC ("Rafferty") serves as Adviser and Hilton serves as the Fund's Subadviser. The Fund offers an Institutional Class, Class A and Class C shares.
Fund & Market Commentary:
The Institutional Class posted a return of -4.25% and the Class A returned -4.53% for the Annual Period, while the Class C returned -3.46% from June 2, 2015 (commencement date of this class) through the end of the Annual Period. The Fund's benchmark, a blend of 60% Barclays U.S. Intermediate Government/Credit Index and 40% S&P 500® Total Return Index, returned 1.22% for the Annual Period.
The Fund's 30-day SEC Yield at August 31, 2015 was 3.62%, 3.18% and 2.62% for the Institutional Class, Class A and Class C, respectively. Assets under management in the Fund grew by 70% during the Annual Period (approximately $35MM to $60MM).
During the Annual Period the Fund increased its cash position from 6% to 14%, increased exposure to fixed income from 35% to 44% and decreased equity exposure from 58% to 42%. Within the equity exposure, the Fund's exposure to the energy sector was taken down from 22% to 5%.
For the Fund, the top overall contributor to performance was exposure to preferred stocks in a very volatile interest rate environment, where long-term rates spiked. The top individual contributor to the overall portfolio was Sterling Bancorp. Sterling benefited during the period from an accretive acquisition as well as announced merger with Hudson Valley Holding Corp. The merger combines two strong, successful banks to form an institution with approximately $11.2 billion in assets, $6.9 billion in gross loans and over $8.4 billion in deposits, serving the dynamic metropolitan region comprising New York City, Westchester County, the Hudson Valley, Long Island and New Jersey. Sterling Bancorp represented 2% of the overall portfolio's holdings at Period end.
Though exposure to the Energy sector was taken down by liquidating and trimming exposure to Master Limited Partnerships ("MLPs") over the Annual Period, it remained as the largest detractor to overall performance, as global factors including oversupply, waning demand from China, a strengthening dollar and the potential entry of Iranian supply back into the global market all led to extreme volatility in oil prices. The Fund maintains positions in two well vetted core MLP holdings after bringing MLP exposure down to among the lowest levels in the history of the strategy.
As the Subadviser looks ahead, some of the factors influencing the firms thematic view are 1) Global easing of monetary policy dominating the investment landscape and its follow on effect on domestic interest rates, dollar strength and import/export competition; 2) Continued volatility within energy markets viewed through the lens of a constantly changing geo-political landscape, including Iranian nuclear negotiations, Chinese consumption in the face of a stock market crisis, and, in addition, domestic supply considerations; and 3) The continued uncertainty and debate around the timing of a forthcoming interest rate hike in the United States, and the resultant volatility in the interest rate curve, be it data driven or sentiment driven. As Hilton continues to monitor and navigate among these themes, we remain optimistic about the prospects for the strategy.
DIREXION ANNUAL REPORT
4
Principal Investment Strategy:
The Fund pursues its investment objective by utilizing an investment strategy that employs a disciplined approach to balancing fixed income investments with historically higher income producing equity securities, with a focus on minimizing absolute risk and volatility. The Subadviser attempts to mitigate portfolio risk and volatility by creating a diversified portfolio of income producing securities that also offer the potential for capital appreciation. These securities may include common and preferred stocks of any capitalization, MLPs, real estate investment trusts ("REITs"), and a variety of debt instruments of any maturity, including corporate bonds, exchange-traded notes ("ETNs"), municipal bonds, and securities issued, backed or otherwise guaranteed by the U.S. government, or its agencies, including securities issued by U.S. government sponsored entities.
MLPs are publicly traded partnerships primarily engaged in the transportation, storage, processing, refining, marketing, exploration, production, and mining of minerals and natural resources. MLPs trade on national securities exchanges exactly like the shares of a corporation, without entity level taxation. MLPs typically distribute income quarterly and have the potential for capital appreciation to the extent that they experience growth in cash flow or earnings or increases in valuations. The Fund intends to continue to qualify as a regulated investment company under Subchapter M of the Internal Revenue Code of 1986, as amended. Consistent with that intention, the Fund shall invest no more than 25% of its total assets in securities of MLPs.
REITs are corporations or trusts that invest primarily in fee or leasehold ownership of real estate, mortgages or shares issued by other REITs, and that receive favorable tax treatment provided they meet certain conditions, including the requirement that they distribute at least 90% of their taxable income.
ETNs are debt obligations of investment banks, which are traded on exchanges and whose returns are linked to the performance of market indices.
The Subadviser's investment process begins by looking at various global macro-economic factors such as fiscal/monetary policy, interest rates, geo-political risks, inflation, commodity pricing, government policies and general business conditions. The Subadviser scans a broad array of possible income-producing opportunities across the capital structure and then analyzes company-specific fundamental research to understand a company's dividend policy, relative value and balance sheet. Investments are selected for the Fund's portfolio that demonstrate stable and consistent cash flow, strong underlying asset value, competitive advantages and management teams with demonstrable positive track records.
The Subadviser has a two tier approach to managing the Fund's fixed income portfolio. First, it considers a long-term strategic investment view. Second, it buys and sells fixed income securities opportunistically in response to short-term market, economic, political, or other developments. The objective of the Subadviser's fixed income portfolio strategy is to generate higher income than would be expected from traditional intermediate term fixed income investments such as U.S. government bonds. As a result, the Fund may invest up to 30% in high yield debt or "junk bonds" (higher-risk, lower-rated fixed income securities such as those rated lower than BBB- by Standard & Poor's Rating Service, Inc. ("S&P") or lower than Baa3 by Moody's Investors Service, Inc. ("Moody's")) or, if unrated, determined by the Subadviser to be of comparable quality. The Fund invests in fixed income securities of any duration. Duration measures the sensitivity of the price of a fixed income investment to a 1% change in interest rates. For example, a five-year duration means the investment will decrease in value by 5% if interest rates rise 1%.
In addition, the Fund may invest in other investment companies, including exchange-traded funds ("ETFs"), to the extent permitted by the Investment Company Act of 1940.
The Subadviser's investment team has the flexibility to change the Fund's asset allocation to reflect its outlook on market conditions and may reallocate the Fund's investments between asset classes in an attempt to improve the Fund's total return and reduce volatility. Volatility in the markets provides the Subadviser with the opportunity to benefit from perceived pricing dislocations that may occur during periods of market distress. The Fund's portfolio managers make asset allocation adjustments based on a combination of bottom-up/top-down fundamental analysis and relative value analysis among capital market instruments within the target asset classes.
DIREXION ANNUAL REPORT
5
At the discretion of the Subadviser, the Fund may invest its assets in cash, cash equivalents, and high-quality, short-term debt securities and money market instruments for (i) temporary defensive purposes in response to adverse market, economic or political conditions and (ii) to retain flexibility in meeting redemptions and paying expenses. Such investments may result in the Fund not achieving its investment objective.
As always, we thank you for using the Direxion Funds and we look forward to our mutual success.
Regards,

| | 
| | 
| |
William J. Garvey | | Craig O'Neill | | Alex Oxenham | |
Hilton Capital Management, LLC | | Hilton Capital Management, LLC | | Hilton Capital Management, LLC | |
The performance data quoted represents past performance; past performance does not guarantee future results. The investment return and principal value of an investment will fluctuate and an investor's shares, when redeemed, may be worth more or less than their original cost. Current performance may be higher or lower than the performance data quoted. For the most recent month-end performance information, please visit www.direxioninvestments.com or call 800.851.0511.
An investor should consider the investment objectives, risks, charges, and expenses of the Direxion Funds carefully before investing. The prospectus and summary prospectus contain this and other information about Direxion Funds. To obtain a prospectus or summary prospectus, please contact Direxion Investments at 800.851.0511 or visit www.direxioninvestments.com.The prospectus or summary prospectus should be read carefully before investing.
Mutual fund investing involves risk. Principal loss is possible. The Fund's strategy of investing in dividend-paying stocks involves the risk that such stocks may fall out of favor with investors and underperform the market. In addition, there is the possibility that such companies could reduce or eliminate the payment of dividends in the future or the anticipated acceleration of dividends could not occur. The Fund may invest in foreign securities and American Depositary Receipts which involve political, economic and currency risks, greater volatility and differences in accounting methods. Medium- and small-capitalization companies tend to have limited liquidity and greater price volatility than large-capitalization companies. Investments in REIT securities involve risks such as declines in the value of real estate and increased susceptibility to adverse economic regulatory expenses. The Fund may invest in MLPs which can be negatively influenced when interest rates rise. These investments also entail many of the general tax risks of investing in a partnership.
There is always the risk that an MLP will fail to qualify for favorable tax treatments. Investments in debt securities typically decrease in value when interest rates rise. This risk is usually greater for longer-term debt securities. Investment by the Fund in lower-rated and nonrated securities presents a greater risk of loss to principal and interest than higher-rated securities. Income from municipal securities may be subject to state and local taxes and a portion of income may be subject to the federal alternative minimum tax for certain investors. Federal income tax rules will apply to any capital gains distributions. Because the funds invest in ETFs and ETNs, they are subject to additional risks that do not apply to conventional mutual funds. ETF risk includes the risks that the
DIREXION ANNUAL REPORT
6
market price of the shares may trade at a discount to its net asset value ("NAV"), an active secondary trading market may not develop or be maintained, or trading may be halted by the exchange in which they trade, which may impact a Fund's ability to sell its shares. ETN risk includes the risks that the value of an ETN may be influenced by time to maturity, level of supply and demand for the ETN, volatility and lack of liquidity in the underlying securities markets, changes in the applicable interest rates, changes in the issuer's credit rating and economic, legal, political or geographic events that affect the referenced index. In addition, ETNs are unsecured debt of the issuer and would lose value if the issuer goes bankrupt.
The total annual fund operating expense ratio of the Direxion Hilton Tactical Income Fund Class A Shares is 1.47%.*
Barclay's U.S. Intermediate Government/Credit Index is a market value weighted performance benchmark for government and corporate fixed-rate debt issues (rated Baa/BBB or higher) with maturities between one and ten years.
The S&P 500® Index is one of the most commonly used benchmarks for the overall U.S. Stock Market. It is a market value weighted index and each stock's weight is proportionate to its market value.
Please note that you cannot invest directly in an index, although you may invest in the underlying securities represented in the index. Index returns are adjusted to reflect the reinvestment of dividends on securities in the index but do not reflect the expenses of the Fund.
Distributed by: Rafferty Capital Markets, LLC
* Rafferty Asset Management, LLC ("Rafferty" or "Adviser") has entered into an Operating Services Agreement with the Fund. Under this Operating Service Agreement, Rafferty has contractually agreed, in exchange for an annualized fee of 0.15% of the average daily net assets of each class of the Fund, to pay all expenses of the Fund as long as Rafferty is the adviser to the Fund, other than the following: management fees, distribution and/or service fees, acquired fund fees and expenses, taxes, leverage interest, dividends or interest on short positions, other interest expenses, brokerage commissions, expenses incurred in connection with any merger or reorganization and extraordinary expenses such as litigation or other expenses outside the typical day-to-day operations of the Fund.
DIREXION ANNUAL REPORT
7
Direxion Hilton Tactical Income Fund
Performance Summary (Unaudited)
Investment Objective: Primarily seeks income with a secondary investment objective of capital appreciation consistent with the preservation of capital.
Class A3

Institutional Class
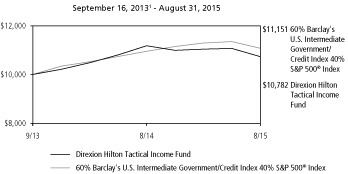
Class C

These charts illustrate the performance of a hypothetical $10,000 investment made on the inception date of each Fund class, and is not intended to imply any future performance. The returns shown do not reflect the deduction or taxes that a shareholder would pay on fund distributions or the redemption of fund shares. The performance of the Barclay's U.S. Intermediate Government/Credit and S&P 500® Index, the Fund's benchmark, does not reflect the deduction of fees associated with a mutual fund, such as investment management fees. Investors cannot invest directly in an index, although they can invest in its underlying securities. During the period shown, Rafferty Asset Management, LLC waived and/or reimbursed fees for various expenses. Had these waivers and/or reimbursements not been in effect, performance would have been lower.
An up-front sales charge of 5.50% is associated with the purchase of Class A shares of the Fund effective on June 1, 2015.
The Fund may impose a 1.00% redemption fee on Class A and Institutional Class shares redeemed (through sales or exchanges) within 30 days of the date of purchase. Performance data does not reflect the redemption fee. If reflected, total returns would be reduced.
The Fund imposes a 1.00% contingent deferred sales charge of the net amount of the redemption of Class C shares if redeemed within 12 months of purchase.
The performance data shown represents past performance and does not guarantee future results.
| | | Average Annual Total Return2 | |
| | | 1 Year | | Since Inception | |
Direxion Hilton Tactical Income
Fund – Class A3 | | | (4.53 | %) | | | 3.61 | % | |
60% Barclay's U.S. Intermediate
Government/Credit Index
40% S&P 500® Index4 | | | 1.22 | % | | | 5.73 | % | |
| | Average Annual Total Return2 | |
| | | 1 Year | | Since Inception | |
Direxion Hilton Tactical Income
Fund – Institutional Class | | | (4.25 | %) | | | 3.92 | % | |
60% Barclay's U.S. Intermediate
Government/Credit Index
40% S&P 500® Index4 | | | 1.22 | % | | | 5.73 | % | |
| | Total Return2 | |
| | | Since Inception | |
Direxion Hilton Tactical Income Fund – Class C5 | | | (3.46 | %) | |
60% Barclay's U.S. Intermediate Government/
Credit Index 40% S&P 500® Index4 | | | (2.29 | %) | |
1 Commencement of operations.
2 As of August 31, 2015.
3 On June 1, 2015, the Class A shares converted from Investor Class shares. Effective on June 1, 2015, purchases of Class A shares are charged an up-front sales charge of 5.50%. Prior to June 1, 2015, this up-front sales charge was not charged. The returns presented do not take into account this up-front sales charge.
4 The 60% Barclay's U.S. Intermediate Government/Credit Index 40% S&P 500® Index is a blended benchmark consisting of 60% of the Barclay's U.S. Intermediate Government/Credit Index and 40% of the S&P 500® Index.
5 This return does not include the contingent deferred sales charge. Had this sales charge been included, the since inception total return would be (4.43%).
DIREXION ANNUAL REPORT
8
August 31, 2015 (Unaudited)
As a shareholder of a mutual fund, you incur two types of costs: (1) transaction costs, including sales charges (loads) on purchase payments, reinvested dividends, or other distributions; redemption fees and exchange fees; and (2) ongoing costs, including management fees; distribution and/or service fees; and other fund expenses. This example is intended to help you understand your ongoing costs (in dollars) of investing in a fund and to compare costs with the ongoing costs of investing in other mutual funds.
The example is based on an investment of $1,000 invested at the beginning of the period and held for the entire period (March 1, 2015 – August 31, 2015).
Actual expenses
The first line of the table below provides information about actual account values and actual expenses. You may use the information in this line, together with the amount you invested, to estimate the expense that you paid over the period. Simply divide your account value by $1,000 (for example, an $8,600 account value divided by $1,000 = 8.6), then multiply the result by the number in the first line under the heading entitled "Expenses Paid During Period" to estimate the expenses you paid on your account during this period.
Hypothetical example for comparison purposes
The second line of the table below provides information about hypothetical account values and hypothetical expenses based on the Fund's actual expense ratio and an assumed rate of return of 5% per year before expenses, which is not the Fund's actual return. The hypothetical account values and expenses may not be used to estimate the actual ending account balance or expenses you paid for the period. You may use this information to compare the ongoing costs of investing in the Fund and other funds. To do so, compare this 5% hypothetical example with the 5% hypothetical examples that appear in the shareholder reports of the other funds.
Please note that the expenses shown in the table are meant to highlight your ongoing costs only and do not reflect any transactional costs, such as wire transfers, returned checks or stop payment orders. Therefore, the second line of the table is useful in comparing ongoing costs only, and will not help you determine the relative costs of owning different funds. In addition, if these transactional costs were included, your costs would have been higher.
Expense Example Table
August 31, 2015 (Unaudited)
| | | Expense
Ratio1 | | Beginning
Account Value
March 1, 2015 | | Ending
Account Value
August 31, 2015 | | Expenses
Paid During
Period2 | |
Direxion Hilton Tactical Income Fund Class A | |
Based on actual fund return | | | 1.30 | % | | $ | 1,000.00 | | | $ | 969.00 | | | $ | 6.45 | | |
Based on hypothetical 5% return | | | 1.30 | % | | | 1,000.00 | | | | 1,018.65 | | | | 6.61 | | |
Direxion Hilton Tactical Income Fund Institutional Class | |
Based on actual fund return | | | 1.05 | % | | | 1,000.00 | | | | 970.30 | | | | 5.21 | | |
Based on hypothetical 5% return | | | 1.05 | % | | | 1,000.00 | | | | 1,019.91 | | | | 5.35 | | |
Direxion Hilton Tactical Income Fund Class C3 | |
Based on actual fund return | | | 2.05 | % | | | 1,000.00 | | | | 965.40 | | | | 4.97 | | |
Based on hypothetical 5% return | | | 2.05 | % | | | 1,000.00 | | | | 1,007.27 | | | | 5.07 | | |
1 Annualized.
2 Expenses are equal to the Fund's annualized expense ratio, multiplied by the average account value over the period, multiplied by the number of days in the period of March 1, 2015 to August 31, 2015, then divided by 365.
3 Expenses are equal to the Fund's annualized expense ratio, multiplied by the average account value over the period from June 2, 2015 (commencement of operations) to August 31, 2015, multiplied by the number of days since commencement of operations, then divided by 365.
DIREXION ANNUAL REPORT
9
Allocation of Portfolio Holdings
August 31, 2015 (Unaudited)
Stock | | Stock | | Common
Funds | | Master
Preferred
Partnerships | | Closed-End
Bonds | | Asset-
Limited
Securities | | Corporate
Bonds | | Convertible
Backed
Stock | | Exchange-
Convertible
Funds | | Preferred
Cash* | | Traded
Total | |
Direxion Hilton
Tactical Income
Fund 31% | | | 26 | % | | | 8 | % | | | 8 | % | | | 5 | % | | | 3 | % | | | 3 | % | | | 1 | % | | | 1 | % | | | 14 | % | | | 100 | % | |
Allocation of Portfolio Holdings reflects percentages of net assets.
* Cash and other assets less liabilities.
DIREXION ANNUAL REPORT
10
Direxion Hilton Tactical Income Fund
Shares | | | | Fair Value | |
COMMON STOCKS - 30.9% | | | |
Consumer Discretionary - 1.9% | | | |
| | 12,250 | | | McDonald's Corp. | | $ | 1,163,995 | | |
Consumer Staples - 9.0% | | | |
| | 10,500 | | | Constellation Brands, Inc. | | | 1,344,000 | | |
| | 11,350 | | | CVS Health Corp. | | | 1,162,240 | | |
| | 19,500 | | | Tootsie Roll Industries, Inc. | | | 606,060 | | |
| | 51,000 | | | Vector Group Ltd. | | | 1,215,330 | | |
| | 16,800 | | | Wal-Mart Stores, Inc. | | | 1,087,464 | | |
| | | 5,415,094 | | |
Financials - 14.1% | | | |
| | 51,000 | | | Bluerock Resident Growth,
Inc. Class A - REIT | | | 572,730 | | |
| | 24,000 | | | Bryn Mawr Bank Corp. | | | 712,320 | | |
| | 36,500 | | | Federated Investors, Inc., Class B | | | 1,131,500 | | |
| | 60,000 | | | Gramercy Property Trust,
Inc. - REIT | | | 1,326,600 | | |
| | 20,000 | | | Heritage Commerce Corp. | | | 211,600 | | |
| | 34,750 | | | Heritage Financial Corp. | | | 615,770 | | |
| | 87,710 | | | Sterling Bancorp | | | 1,230,571 | | |
| | 10,350 | | | Westwood Holdings Group, Inc. | | | 574,529 | | |
| | 149,000 | | | Winthrop Realty Trust - REIT | | | 2,133,680 | | |
| | | 8,509,300 | | |
Health Care - 3.9% | | | |
| | 12,000 | | | Novartis International AG - ADR | | | 1,166,640 | | |
| | 37,100 | | | Pfizer, Inc. | | | 1,195,362 | | |
| | | 2,362,002 | | |
Industrials - 2.0% | | | |
| | 30,000 | | | Republic Services, Inc. | | | 1,229,400 | | |
| | | | | TOTAL COMMON STOCKS
(Cost $18,921,681) | | $ | 18,679,791 | | |
PREFERRED STOCKS - 26.2% | | | |
Consumer Discretionary - 1.6% | | | |
| | 37,000 | | | M/I Homes, Inc., Series A | | $ | 962,000 | | |
Financials - 24.6% | | | |
| | 10,000 | | | AG Mortgage Investment Trust,
Inc., Series A | | | 243,500 | | |
| | 30,000 | | | Apollo Residential Mortgage,
Inc., Series A | | | 715,200 | | |
| | 30,000 | | | Ares Capital Corp. | | | 764,400 | | |
| | 12,000 | | | Arlington Asset Investment Corp. | | | 272,760 | | |
| | 35,000 | | | Bank of America Corp., Series H | | | 664,300 | | |
| | 11,600 | | | Boston Private Financial
Holdings, Inc. | | | 288,840 | | |
| | 47,000 | | | Colony Financial, Inc., Series A | | | 1,241,740 | | |
| | 50,000 | | | Countrywide Capital IV, Series A | | | 1,275,500 | | |
| | 45,000 | | | Countrywide Capital V, Series B | | | 1,147,500 | | |
| | 24,000 | | | Customers Bancorp, Inc. | | | 610,104 | | |
| | 15,000 | | | CYS Investments, Inc., Series A | | | 342,750 | | |
| | 13,000 | | | Dynex Capital, Inc., Series B | | | 299,455 | | |
| | 34,121 | | | HCI Group, Inc. | | | 875,886 | | |
| | 48,500 | | | Iberiabank Corp. (a) | | | 1,212,500 | | |
| | 27,300 | | | National General Holdings Corp. | | | 675,129 | | |
| | 31,013 | | | RAIT Financial Trust - REIT | | | 708,957 | | |
| | 24,000 | | | Saratoga Investment Corp. | | | 600,000 | | |
Shares | | | | Fair Value | |
Financials (continued) | | | |
| | 44,000 | | | State Street Corp. | | $ | 1,118,040 | | |
| | 25,000 | | | Valley National Bancorp (a) | | | 638,750 | | |
| | 47,500 | | | Wintrust Financial Corp. (a) | | | 1,209,825 | | |
| | | 14,905,136 | | |
| | | | | TOTAL PREFERRED STOCKS
(Cost $15,933,274) | | $ | 15,867,136 | | |
CLOSED-END FUNDS - 8.5% | | | |
| | 140,970 | | | Alpine Total Dynamic Dividend
Fund | | $ | 1,127,760 | | |
| | 54,000 | | | Nuveen Mortgage Opportunity
Term Fund | | | 1,211,220 | | |
| | 115,275 | | | Medley Capital Corp. | | | 954,477 | | |
| | 66,305 | | | PIMCO Dynamic Income Fund | | | 1,851,899 | | |
| | | | | TOTAL CLOSED-END FUNDS
(Cost $5,714,187) | | $ | 5,145,356 | | |
MASTER LIMITED PARTNERSHIPS - 7.5% | | | |
Consumer Discretionary - 2.0% | | | |
| | 45,050 | | | StoneMor Partners L.P. | | $ | 1,232,568 | | |
Energy - 5.5% | | | |
| | 58,475 | | | Enterprise Products Partners L.P. | | | 1,643,732 | | |
| | 23,700 | | | Magellan Midstream Partners, L.P. | | | 1,672,509 | | |
| | | 3,316,241 | | |
| | | | | TOTAL MASTER LIMITED
PARTNERSHIPS
(Cost $4,881,051) | | $ | 4,548,809 | | |
CORPORATE BONDS - 5.5% | | | |
Consumer Discretionary - 1.7% | | | |
| | | | | Amazon.com, Inc. | | | | | |
| | 500,000 | | | 3.30%, 12/05/2021 | | $ | 510,512 | | |
| | 500,000 | | | 3.80%, 12/05/2024 | | | 501,284 | | |
| | | 1,011,796 | | |
Financials - 1.0% | | | |
| | | | | Customers Bancorp, Inc. | | | | | |
| | 23,000 | | | 6.38%, 07/31/2018 | | | 606,740 | | |
Health Care - 1.5% | | | |
| | | | | AbbVie, Inc. | | | | | |
| | 925,000 | | | 2.90%, 11/06/2022 | | | 894,535 | | |
Information Technology - 1.3% | | | |
| | | | | Google, Inc. | | | | | |
| | 800,000 | | | 3.38%, 02/25/2024 | | | 815,959 | | |
| | | | | TOTAL CORPORATE BONDS
(Cost $3,323,649) | | $ | 3,329,030 | | |
ASSET-BACKED SECURITIES - 3.3% | | | |
| | | | | Invitation Homes Trust
2014-SFR1 B | | | | | |
| | 1,000,000 | | | 1.68%, 06/17/2031 (b) | | $ | 990,503 | | |
| | | | | Tricon American Homes Trust
2015-SFR1 C | | | | | |
| | 1,000,000 | | | 2.09%, 05/19/2032 (b) | | | 985,902 | | |
| | | | | TOTAL ASSET-BACKED
SECURITIES
(Cost $1,997,813) | | $ | 1,976,405 | | |
The accompanying notes are an integral part of these financial statements.
DIREXION ANNUAL REPORT
11
Direxion Hilton Tactical Income Fund
Shares | | | | Fair Value | |
CONVERTIBLE BONDS - 2.5% | | | |
Financials - 2.5% | | | |
| | | | | Colony Financial, Inc. | | | | | |
| | 750,000 | | | 3.88%, 01/15/2021 | | $ | 740,156 | | |
| | | | | HCI Group, Inc. | | | | | |
| | 850,000 | | | 3.88%, 03/15/2019 | | | 788,906 | | |
| | | | | TOTAL CONVERTIBLE BONDS
(Cost $1,596,787) | | $ | 1,529,062 | | |
CONVERTIBLE PREFERRED STOCKS - 1.4% | | | |
Financials - 1.4% | | | |
| | 36,000 | | | Wheeler Real Estate Investment
Trust, Series B | | $ | 834,120 | | |
| | | | | TOTAL CONVERTIBLE
PREFERRED STOCKS
(Cost $885,757) | | $ | 834,120 | | |
EXCHANGE-TRADED FUNDS - 0.5% | | | |
| | 13,730 | | | ProShares Short S&P 500 Fund (a) | | $ | 302,746 | | |
| | | | | TOTAL EXCHANGE-
TRADED FUNDS
(Cost $293,477) | | $ | 302,746 | | |
| | | | | TOTAL INVESTMENTS - 86.3%
(Cost $53,547,676) | | $ | 52,212,455 | | |
| | | | | Other Assets and
Liabilities, Net - 13.7% | | | 8,270,644 | | |
| | | | | TOTAL NET ASSETS - 100.0% | | $ | 60,483,099 | | |
Percentages are stated as a percent of net assets.
(a) Non-income producing security.
(b) Security purchased within the terms of a private placement memorandum, exempt from registration under Rule 144A of the Securities Act of 1933, as amended, and may be sold only to dealers in that program or other "qualified institutional buyers." As of August 31, 2015, the value of this investment was $1,976,405 or 3.3% of total net assets.
ADR - American Depositary Receipt
REIT - Real Estate Investment Trust
The Global Industry Classification Standard (GICS®) was developed by and/or is the exclusive property of MSCI, Inc. and Standard & Poor's Financial Services LLP ("S&P"). GICS is a service mark of MSCI and S&P and has been licensed for use by U.S. Bancorp Fund Services, LLC.
The accompanying notes are an integral part of these financial statements.
DIREXION ANNUAL REPORT
12
Statement of Assets & Liabilities
| | | Direxion Hilton
Tactical Income
Fund | |
Assets: | |
Investments, at fair value (Note 2) | | $ | 52,212,455 | | |
Cash | | | 7,414,513 | | |
Receivable for Fund shares sold | | | 470,173 | | |
Investment securities sold | | | 813,110 | | |
Dividends and interest receivable | | | 186,231 | | |
Total Assets | | | 61,096,482 | | |
Liabilities: | |
Fund shares redeemed | | | 32,577 | | |
Payable for investment securities purchased | | | 524,208 | | |
Accrued investment advisory fees | | | 46,309 | | |
Accrued distribution expenses | | | 2,544 | | |
Accrued operating services fees | | | 7,718 | | |
Other liabilities | | | 27 | | |
Total Liabilities | | | 613,383 | | |
Net Assets | | $ | 60,483,099 | | |
Net Assets Consist of: | |
Capital stock | | $ | 62,857,568 | | |
Undistributed net investment income | | | 7,732 | | |
Accumulated net realized loss | | | (1,046,980 | ) | |
Net unrealized depreciation on investments | | | (1,335,221 | ) | |
Net Assets | | $ | 60,483,099 | | |
Cost of Investments | | $ | 53,547,676 | | |
Calculation of Net Asset Value Per Share: | |
Class A Shares: | |
Net assets | | $ | 3,521,010 | | |
Shares outstanding (unlimited shares of beneficial interest authorized, par value) | | | 234,792 | | |
Net asset value, redemption price and offering price per share | | $ | 15.00 | | |
Institutional Class Shares: | |
Net assets | | $ | 55,752,299 | | |
Shares outstanding (unlimited shares of beneficial interest authorized, par value) | | | 3,713,076 | | |
Net asset value, redemption price and offering price per share | | $ | 15.02 | | |
Class C Shares: | |
Net assets | | $ | 1,209,790 | | |
Shares outstanding (unlimited shares of beneficial interest authorized, par value) | | | 80,726 | | |
Net asset value, redemption price and offering price per share | | $ | 14.99 | | |
The accompanying notes are an integral part of these financial statements.
DIREXION ANNUAL REPORT
13
For the Year Ended August 31, 2015
| | | Direxion Hilton
Tactical Income
Fund | |
Investment Income: | |
Dividend income (net of withholding tax of $3,841) | | $ | 1,962,767 | | |
Interest income | | | 161,637 | | |
Total investment income | | | 2,124,404 | | |
Expenses: | |
Investment advisory fees | | | 440,668 | | |
Operating services fees | | | 57,503 | | |
Distribution and Shareholder Service Fees – Class A | | | 7,622 | | |
Distribution and Shareholder Service Fees – Class C | | | 1,908 | | |
Fund administration & accounting fees | | | 24,176 | | |
Transfer agent fees | | | 12,672 | | |
Federal & state registration fees | | | 944 | | |
Audit fees | | | 3,680 | | |
Legal fees | | | 3,056 | | |
Compliance fees | | | 3,168 | | |
Trustee fees | | | 2,752 | | |
Custody fees | | | 2,080 | | |
Miscellaneous expense | | | 1,152 | | |
Insurance expense | | | 432 | | |
Blue sky expense | | | 9,568 | | |
Postage & printing fees | | | 1,344 | | |
Total expenses | | | 572,725 | | |
Less: Reimbursement of expenses from Subadviser | | | (34,818 | ) | |
Net expenses | | | 537,907 | | |
Net investment income | | | 1,586,497 | | |
Realized and unrealized gain (loss) on investments: | |
Net realized loss on investments | | | (1,144,807 | ) | |
Change in net unrealized appreciation (depreciation) on investments | | | (2,753,338 | ) | |
Net realized and unrealized loss on investments | | | (3,898,145 | ) | |
Net decrease in net assets resulting from operations | | $ | (2,311,648 | ) | |
The accompanying notes are an integral part of these financial statements.
DIREXION ANNUAL REPORT
14
Statements of Changes in Net Assets
| | Direxion Hilton Tactical Income Fund | |
| | | Year Ended
August 31, 2015 | | September 16, 20131
through
August 31, 2014 | |
Increase (decrease) in net assets from: | |
Operations: | |
Net investment income | | $ | 1,586,497 | | | $ | 411,499 | | |
Net realized gain (loss) on investments | | | (1,144,807 | ) | | | 382,374 | | |
Change in net unrealized appreciation (depreciation) on investments | | | (2,753,338 | ) | | | 1,418,117 | | |
Net increase (decrease) in net assets resulting from operations | | | (2,311,648 | ) | | | 2,211,990 | | |
Distributions to shareholders: | |
Net investment income: | |
Class A Shares4 | | | (22,542 | ) | | | — | | |
Institutional Class Shares | | | (1,434,439 | ) | | | (358,491 | ) | |
Investor Class Shares3 | | | (64,696 | ) | | | (9,817 | ) | |
Class C Shares5 | | | (3,681 | ) | | | — | | |
Net realized gains: | |
Institutional Class Shares | | | (332,535 | ) | | | (23,120 | ) | |
Investor Class Shares3 | | | (24,764 | ) | | | (726 | ) | |
Return of capital: | |
Class A Shares4 | | | (11,796 | ) | | | — | | |
Institutional Class Shares | | | (444,859 | ) | | | — | | |
Investor Class Shares3 | | | (15,806 | ) | | | — | | |
Class C Shares5 | | | (1,927 | ) | | | — | | |
Total distributions to shareholders | | | (2,357,045 | ) | | | (392,154 | ) | |
Capital share transactions: | |
Total increase in net assets from net change in capital
share transactions(a) | | | 29,445,621 | | | | 33,886,335 | | |
Total increase in net assets | | | 24,776,928 | | | | 35,706,171 | | |
Net assets: | |
Beginning of year/period | | | 35,706,171 | | | | — | | |
End of year/period | | $ | 60,483,099 | | | $ | 35,706,171 | | |
Undistributed net investment income, end of year/period | | $ | 7,732 | | | $ | 44,897 | | |
(a) Summary of capital share transactions is as follows:
| | | Direxion Hilton Tactical Income Fund | |
| | | Year Ended
August 31, 2015 | | September 16, 20131
through
August 31, 2014 | |
| | | Shares | | Value | | Shares | | Value | |
Shares issued in connection with reorganization2 | |
Investor Class Shares | | | 167,556 | | | $ | 2,685,938 | | | | — | | | $ | — | | |
Institutional Class Shares | | | 2,532,557 | | | | 40,657,675 | | | | — | | | | — | | |
Shares sold | |
Investor Class Shares3 | | | 209,840 | | | | 3,310,332 | | | | 74,669 | | | | 1,180,900 | | |
Class A Shares4 | | | 57,266 | | | | 880,027 | | | | — | | | | — | | |
Institutional Class Shares | | | 1,757,339 | | | | 27,824,288 | | | | 2,108,424 | | | | 32,996,493 | | |
Class C Shares5 | | | 80,456 | | | | 1,242,518 | | | | — | | | | — | | |
Shares converted2 | |
Investor Class Shares | | | (196,081 | ) | | | (3,074,546 | ) | | | — | | | | — | | |
Class A Shares | | | 196,081 | | | | 3,074,546 | | | | — | | | | — | | |
Shares issued in reinvestment of distributions | |
Class A Shares4 | | | 1,919 | | | | 29,638 | | | | — | | | | — | | |
Institutional Class Shares | | | 126,566 | | | | 1,964,889 | | | | 19,746 | | | | 312,238 | | |
Investor Class Shares3 | | | 6,221 | | | | 96,433 | | | | 283 | | | | 4,483 | | |
Class C Shares5 | | | 270 | | | | 4,153 | | | | — | | | | — | | |
Shares redeemed | |
Class A Shares4 | | | (20,474 | ) | | | (317,464 | ) | | | — | | | | — | | |
Institutional Class Shares | | | (2,794,031 | ) | | | (44,774,435 | ) | | | (37,525 | ) | | | (595,779 | ) | |
Investor Class Shares3 | | | (261,759 | ) | | | (4,158,371 | ) | | | (729 | ) | | | (12,000 | ) | |
Class C Shares5 | | | — | | | | — | | | | — | | | | — | | |
Net increase | | | 1,863,726 | | | $ | 29,445,621 | | | | 2,164,868 | | | $ | 33,886,335 | | |
1 Commencement of operations.
2 See Note 1 in the Notes to the Financial Statements.
3 For the period from September 1, 2014 to May 31,2015.
4 For the period from June 1, 2015 to August 31, 2015.
5 For the period from June 2, 2015 to August 31, 2015.
The accompanying notes are an integral part of these financial statements.
DIREXION ANNUAL REPORT
15
| | | | RATIOS TO AVERAGE NET ASSETS3 | | | |
| | Net Asset
Value,
Beginning
of Year/
Period | | Net
Investment
Income1 | | Net Realized
and Unrealized
Gain (Loss)
on Investments | | Net Increase
(Decrease) in
Net Asset
Value Resulting
from Operations | | Dividends
from Net
Investment
Income | | Distributions
from
Realized
Capital Gains | | Return
of Capital
Distribution | | Total
Distributions | | Redemption
Fees Paid to
Fund | | Net
Asset
Value,
End of
Year/
Period | | Total
Return2 | | Net
Assets,
End of
Year/
Period
(,000) | | Total
Expenses | | Net
Expenses | | Net Investment
Income
after Expense
Reimbursement/
Recoupment | | Portfolio
Turnover
Rate4 | |
Direxion Hilton Tactical Income Fund | |
Class A Shares | |
June 1, 20159 to August 31, 2015 | | $ | 15.68 | | | $ | 0.10 | | | $ | (0.62 | ) | | $ | (0.52 | ) | | $ | (0.10 | ) | | $ | — | | | $ | (0.06 | ) | | $ | (0.16 | ) | | $ | — | | | $ | 15.00 | | | | (3.31 | %) | | $ | 3,521 | | | | 1.30 | % | | | 1.30 | % | | | 2.47 | % | | | 35 | %8 | |
Investor Class Shares | |
September 1, 2014 to May 31, 201510 | | | 16.47 | | | | 0.40 | | | | (0.62 | ) | | | (0.22 | ) | | | (0.35 | ) | | | (0.13 | ) | | | (0.09 | ) | | | (0.57 | ) | | | — | | | | 15.68 | | | | (1.26 | %) | | | 3,075 | | | | 1.46 | % | | | 1.37 | % | | | 3.40 | %5 | | | 35 | %8 | |
September 16, 20139 to August 31, 2014 | | | 15.00 | | | | 0.32 | | | | 1.50 | | | | 1.82 | | | | (0.32 | ) | | | (0.03 | ) | | | — | | | | (0.35 | ) | | | — | | | | 16.47 | | | | 12.26 | % | | | 1,223 | | | | 2.72 | % | | | 1.60 | % | | | 2.27 | %5 | | | 58 | % | |
Institutional Class Shares | |
Year ended August 31, 2015 | | | 16.49 | | | | 0.52 | | | | (1.21 | ) | | | (0.69 | ) | | | (0.50 | ) | | | (0.13 | ) | | | (0.15 | ) | | | (0.78 | ) | | | —7 | | | | 15.02 | | | | (4.25 | %) | | | 55,752 | | | | 1.17 | % | | | 1.09 | % | | | 3.29 | %6 | | | 35 | %8 | |
September 16, 20139 to August 31, 2014 | | | 15.00 | | | | 0.37 | | | | 1.50 | | | | 1.87 | | | | (0.35 | ) | | | (0.03 | ) | | | — | | | | (0.38 | ) | | | —7 | | | | 16.49 | | | | 12.61 | % | | | 34,483 | | | | 2.52 | % | | | 1.25 | % | | | 2.63 | %6 | | | 58 | % | |
Class C Shares | |
June 2, 20159 to August 31, 2015 | | | 15.62 | | | | 0.08 | | | | (0.62 | ) | | | (0.54 | ) | | | (0.05 | ) | | | — | | | | (0.04 | ) | | | (0.09 | ) | | | — | | | | 14.99 | | | | (3.46 | %) | | | 1,210 | | | | 2.05 | % | | | 2.05 | % | | | 2.17 | % | | | 35 | %8 | |
1 Net investment income (loss) per share represents net investment income (loss) divided by the daily average shares of beneficial interest outstanding throughout each period.
2 All returns reflect reinvested dividends, if any, but do not reflect the impact of taxes. Total return for a period of less than one year is not annualized.
3 For periods of less than one year, these ratios are annualized.
4 Portfolio turnover is not annualized and is calculated without regard to short-term securities having a maturity of less than one year. Investments in options, swaps, forward contracts, futures contracts and repurchase agreements are deemed short-term securities.
5 Net investment income (loss) ratio before expense reimbursement for the period from September 1, 2014 to May 31, 2015 and the period from September 16, 2013 to August 31, 2014 were 3.31% and 1.15%, respectively.
6 Net investment income (loss) ratio before expense reimbursement for the year ended August 31, 2015 and the period from September 16, 2013 to August 31, 2014 were 3.21% and 1.36%, respectively.
7 Amount is less than $0.005.
8 Portfolio turnover excludes the purchase and sales of the Hilton Yield Plus Fund prior to the reorganization on December 5, 2014. If these transactions were included, portfolio turnover would have been higher.
9 Commencement of operations.
10 The Investor Class Shares were converted to Class A shares on June 1, 2015.
The accompanying notes are an integral part of these financial statements.
DIREXION ANNUAL REPORT
16
NOTES TO THE FINANCIAL STATEMENTS
1. ORGANIZATION
Direxion Funds (the "Trust") was organized as a Massachusetts Business Trust on June 6, 1997, and is registered under the Investment Company Act of 1940, as amended (the "1940 Act"), as an open-end management investment company issuing its shares in series, each series representing a distinct portfolio with its own investment objective and policies. The Trust currently has 16 series, of which one is included in this report: the Direxion Hilton Tactical Income Fund (the "Fund"). The Fund is a diversified series of the Trust pursuant to 1940 Act. The Fund was formerly known as the Hilton Yield Plus Fund (the "Predecessor Fund") and was formerly a series of Managed Portfolio Series Trust, which commenced operations on September 16, 2013. On December 5, 2014, substantially all of the assets of the Predecessor Fund, were transferred to the Fund in a tax-free reorganization, which was approved by shareholders of the Predecessor Fund (the "Reorganization). Hilton Capital Management, LLC ("Hilton") previously served as the investment adviser to the Predecessor Fund. After the Reorganization, Rafferty Capital Management, LLC serves as the Fund's investment adviser ("Rafferty" or "Adviser") and Hilton serves as the Fund's subadviser ("Subadviser"). The Fund currently offers Class A, Institutional, and Class C shares. On June 1, 2015, the Fund converted all outstanding Investor Class shares to Class A shares. On June 2, 2015, the Fund began selling Class C shares. Class A and Class C shares are made available through registered investment advisers, financial planners, broker-dealer or other financial intermediaries. Institutional Class shares are made available through investment advisers, banks, trust companies or authorized representatives without a sales charge.
The Fund primarily seeks income with a secondary investment objective of capital appreciation consistent with the preservation of capital. The Fund pursues its investment objective by utilizing an investment strategy that employs a disciplined approach to balancing fixed income investments with historically higher income producing equity securities, with a focus on minimizing absolute risk and volatility. The Subadviser attempts to mitigate portfolio risk and volatility by creating a diversified portfolio of income producing securities that also offer the potential for capital appreciation. These securities may include common and preferred stocks of any capitalization, master limited partnerships ("MLPs"), real estate investment trusts ("REITS"), and a variety of debt instruments of any maturity, including corporate bonds, exchange-traded notes, municipal bonds, and securities issued, backed or otherwise guaranteed by the U.S. Government or its agencies.
2. SIGNIFICANT ACCOUNTING POLICIES
The following is a summary of significant accounting policies consistently followed by the Fund in the preparation of its financial statements. These policies are in conformity with U.S. generally accepted accounting principles ("GAAP").
a) Investment Valuation – The Net Asset Value ("NAV") of the Fund is determined daily, Monday through Friday, as of the close of regular trading on the New York Stock Exchange ("NYSE"), each day the NYSE is open for business. The value of all portfolio securities and other assets held by the Fund will be determined as of the time the Fund calculates its NAV, 4:00 p.m. Eastern Time ("Valuation Time"). Equity securities, including common stocks, preferred stocks, exchange-traded funds, closed-end funds, MLPs and REITs and over-the-counter securities are valued at their last sales price or, if not available, at the average of the last bid and ask prices. Securities primarily traded on the NASDAQ National Market are valued using the NASDAQ Official Closing Price. Investments in open-end mutual funds, including money market funds, are valued at their respective quoted NAV on the valuation date. Asset-backed securities, convertible bonds and corporate bonds are valued using the mean between the closing bid and ask prices furnished by an independent pricing service. Securities for which reliable market quotations are not readily available, the Fund's pricing service does not provide a valuation for such securities, the Fund's pricing service provides valuation that in the judgment of the Adviser does not represent fair value, or the Fund or Adviser believes the market price is stale, are fair valued as determined by the Adviser under the supervision of the Board of Trustees. Additionally, the Adviser will monitor developments in the marketplace for significant events that may affect the value of those securities whose closing prices were established before the Valuation Time.
b) Investment Transactions – Investment transactions are recorded on trade date. The Fund determines the gain or loss realized from investment transactions by comparing the identified cost, which is the same basis used for federal income tax purposes, with the net sales proceeds.
DIREXION ANNUAL REPORT
17
c) Federal Income Taxes – The Fund intends to comply with the requirements of Subchapter M of the Internal Revenue Code necessary to qualify as a regulated investment company and to make the requisite distributions of income and capital gains to its shareholders sufficient to relieve it from all or substantially all Federal income taxes and excise taxes. No provision for Federal income taxes has been made.
d) Income and Expenses – Dividend income is recorded on the ex-dividend date. Interest income, including amortization of premium and discount, and dividends received from money market funds, is recognized on an accrual basis. Discounts and premiums on securities purchased are amortized over the expected life of the respective securities. Expenses are computed based on the Fund's respective average daily net assets. Other than class specific expenses, income and expenses are allocated to each class of shares based upon relative net assets. For an additional discussion on expenses, refer to Note 4.
e) Distributions to Shareholders – The Fund will make distributions of net investment income, if any, monthly. The Fund will also distribute net realized capital gains, if any, annually. Income and capital gain distributions are determined in accordance with income tax regulations, which may differ from GAAP. Distributions to shareholders are recorded on the ex-dividend date.
The tax character of distributions during the year ended August 31, 2015 and the period ended August 31, 2014, were as follows:
| | | Direxion Hilton Tactical Income Fund | |
| | | Year Ended
August 31, 2015 | | Period of
September 16, 20131
to August 31, 2014 | |
Distributions paid from: | |
Ordinary Income | | $ | 1,872,884 | | | $ | 392,154 | | |
Long-Term Capital Gains | | | 9,773 | | | | — | | |
Return of Capital | | | 474,388 | | | | |
Total Distributions paid | | $ | 2,357,045 | | | $ | 392,154 | | |
1 Commencement of operations.
The Fund is designating as long-term capital gain dividends, pursuant to Internal Revenue Code 852(b)(3), the amount necessary to reduce the earnings and profits of the Fund related to net capital gain to zero for the tax year ended August 31, 2015. To the extent necessary to fully distribute such capital gains, the Fund is also designating earnings and profits distributed to shareholders on the redemption of shares.
As of August 31, 2015, the components of accumulated earnings/losses of the Fund on a tax basis were as follows:
| | | Direxion Hilton
Tactical Income
Fund | |
Tax cost of investments | | $ | 53,551,602 | | |
Gross unrealized appreciation | | | 1,001,438 | | |
Gross unrealized depreciation | | | (2,340,585 | ) | |
Net unrealized appreciation/(depreciation) | | $ | (1,339,147 | ) | |
Undistributed ordinary income | | | — | | |
Undistributed long-term capital gain | | | — | | |
Total distributable earnings | | | — | | |
Other accumulated gain/(loss) | | | (1,035,322 | ) | |
Total accumulated earnings/(losses) | | $ | (2,374,469 | ) | |
The difference between book cost of investments and tax cost of investments is attributable primarily to the tax deferral of losses on wash sales adjustments, return of capital on securities and publicly traded partnership investments.
DIREXION ANNUAL REPORT
18
On the Statement of Assets and Liabilities, the following adjustments were made for permanent tax differences between accounting for net investment income and realized gain and losses under GAAP and tax reporting:
Net Investment
Income/(Loss) | | Realized Gain (Loss) | | Capital Stock | |
| $ | (98,304 | ) | | $ | 98,304 | | | $ | — | | |
Net investment income and realized gains and losses for federal income tax purposes may differ from that reported on the financial statements because of permanent book-to-tax differences. GAAP requires that permanent differences in net investment income and realized gains and losses due to differences between financial reporting and tax reporting be reclassified between various components of net assets. The permanent differences primarily relate to distribution reclasses and publicly traded partnership adjustments.
In order to meet certain excise tax distribution requirements, the Fund is required to measure and distribute annually net capital gains realized during a twelve-month period ending October 31 and net investment income earned during a twelve month period ending December 31. In connection with this, the Fund is permitted for tax purposes to defer into its next fiscal year qualified late year losses. Qualified late year capital losses are any net capital losses incurred between November 1 and the end of its fiscal year, August 31, 2015. Qualified late year ordinary losses are generally losses incurred between January 1 and the end of its fiscal year, August 31, 2015. For the year ended August 31, 2015, the Fund did not defer any qualified late year losses.
Under the Regulated Investment Company Modernization Act of 2010, net capital losses recognized for tax years beginning after December 22, 2010 may be carried forward indefinitely, and their character is retained as short-term and/or long-term. As of August 31, 2015, the Fund had unlimited short-term capital loss carryforwards on a tax basis of $1,035,322.
The Fund follows authoritative financial reporting rules regarding recognition and measurement of tax positions taken or expected to be taken on a tax return. The Fund has reviewed all open tax years and concluded that there is no effect to the Fund's financial positions or results of operations and no tax liability resulting from unrecognized tax benefits relating to uncertain income tax position taken or expected to be taken on a tax return. Open tax years are those years that are open for examination by the relevant income taxing authority. As of August 31, 2015, open Federal and state income tax years include the tax years ended August 31, 2014 and August 31, 2015. The Fund has no examination in progress. The Fund is also not aware of any tax positions for which it is reasonably possible that the total amounts of unrecognized tax expense will significantly change in the next twelve months.
f) Use of Estimates – The preparation of financial statements in conformity with GAAP requires management to make estimates and assumptions that affect the reported amounts of assets and liabilities and disclosure of contingent assets and liabilities at the date of the financial statements and the reported amounts of revenues and expenses during the reporting period. Actual results could differ from those estimates.
3. INVESTMENT TRANSACTIONS
During the period of December 6, 2014 to August 31, 2015 (the period following the reorganization of the Hilton Yield Plus Fund), the aggregate purchases and sales of investments (excluding short-term investments) in the Direxion Hilton Tactical Income Fund were $35,156,738 and $18,552,101, respectively. There were no purchases or sales of long-term U.S. Government securities in the Fund during the period ended August 31, 2015.
4. INVESTMENT ADVISORY FEE AND OTHER AGREEMENTS
Investment Advisory Agreement: Effective December 5, 2014, the Fund entered into an investment advisory agreement with the Adviser. The Adviser earns a fee, computed daily and payable monthly, applied to the Fund's average daily net assets at an annual rate of 0.90%.
DIREXION ANNUAL REPORT
19
In addition, the Adviser has entered into a sub-advisory agreement with Hilton, whereby the Subadviser will provide investment management and asset allocation advice to the Fund. The Adviser pays, out of the management fees it receives from the Fund, a fee for these sub-advisory services.
Prior to the Reorganization, Hilton had entered into an investment advisory agreement with Managed Portfolio Series, whereby Hilton earned, on a monthly basis, an advisory fee equal to 0.95% of the Predecessor Fund's average daily net assets. In addition, Hilton contractually agreed to waive a portion of its entire advisory fee and/or reimburse the Predecessor Fund for its expenses to ensure that the total annual operating expenses for the Predecessor Fund did not exceed 1.60% and 1.25% of average daily net assets of the Investor Class and Institutional Class shares, respectively.
Expenses waived and/or reimbursed by Hilton were subject to recoupment by Hilton. However, after the Reorganization, Hilton relinquished the ability to recoup those expenses. After the Reorganization, neither the Adviser nor Hilton waives and/or reimburses expenses of the Fund.
Operating Services Agreement: Effective December 5, 2014, the Fund entered into an Operating Services Agreement (the "Agreement") with the Adviser. Under this Agreement, the Adviser has contractually agreed, in exchange for an annualized fee of 0.15% of the average daily net assets of each class of the Fund, to pay all expenses of the Fund as long as Rafferty is the adviser of the Fund, other than the following: management fees, distribution and/or service fees, acquired fund fees and expenses, taxes, leverage interest, dividends or interest on short positions, other interest expenses, brokerage commissions, expenses incurred in connection with any merger or reorganization and extraordinary expenses such as litigation or other expenses outside the typical day-to-day operations of the Fund at least through September 1, 2017.
Distribution Expenses: Shares of the Fund are subject to an annual 12b-1 fee of up to 1.00% of the Fund's average daily net assets. The Class A shares of the Fund currently pay 0.25% of its average daily net assets. The Class C shares of the Fund currently pay a 12b-1 fee of 1.00% of the Fund's Class C average daily net assets. The Institutional Class shares of the Fund do not pay a 12b-1 fee. Prior to the Reorganization, the Predecessor Fund charged the same distribution expenses and additionally charged a 0.10% shareholder servicing fee on the average daily net assets of the Investor Class shares. The Fund does not charge a shareholder service fee.
Rafferty Capital Markets, LLC (the "Distributor") serves as principal underwriter of the Fund and acts as the Fund's distributor in a continuous public offering of the Fund's shares. The Distributor is an affiliate of the Adviser.
5. VALUATION MEASUREMENTS
The Fund follows authoritative fair valuation accounting standards, which establish an authoritative definition of fair value and set out a hierarchy for measuring fair value. These standards require additional disclosures about the various inputs and valuation techniques used to develop the measurements of fair value and a discussion of changes in valuation techniques and related inputs during the period. These inputs are summarized in the three broad levels listed below:
Level 1 – Quoted prices in active markets for identical securities
Level 2 – Evaluated price based on other significant observable inputs (including quoted prices for similar securities, interest rates, prepayment speeds, credit risk, etc.)
Level 3 – Significant unobservable inputs including the Fund's own assumptions about the assumptions in determining fair value of investments
To the extent that equity securities are actively traded and valuation adjustments are not applied, they are categorized in Level 1 of the fair value hierarchy. If the market for a particular security is not active, and the mean price is used, these securities are categorized in Level 2 of the fair value hierarchy. Asset-backed securities, convertible bonds and corporate bonds are generally categorized in Level 2 of the fair value hierarchy. Investments in other mutual funds are categorized as Level 1 in the hierarchy.
The inputs or methodology used for valuing securities are not an indication of the risk associated with investing in those financial instruments.
DIREXION ANNUAL REPORT
20
The following is a summary of the inputs used to value the Fund's securities as of August 31, 2015:
| | | Level 1 | | Level 2 | | Level 3 | | Total | |
Common Stocks | | $ | 18,679,791 | | | $ | — | | | $ | — | | | $ | 18,679,791 | | |
Preferred Stocks | | | 14,091,795 | | | | 1,775,341 | | | | — | | | | 15,867,136 | | |
Closed-End Funds | | | 5,145,356 | | | | — | | | | — | | | | 5,145,356 | | |
Master Limited Partnerships | | | 4,548,809 | | | | — | | | | — | | | | 4,548,809 | | |
Corporate Bonds | | | — | | | | 3,329,030 | | | | — | | | | 3,329,030 | | |
Asset-Backed Securities | | | — | | | | 1,976,405 | | | | — | | | | 1,976,405 | | |
Convertible Bonds | | | — | | | | 1,529,062 | | | | — | | | | 1,529,062 | | |
Convertible Perferred Stocks | | | 834,120 | | | | — | | | | — | | | | 834,120 | | |
Exchange-Traded Funds | | | 302,746 | | | | — | | | | — | | | | 302,746 | | |
Total Investments in Securities | | $ | 44,209,357 | | | $ | 8,003,098 | | | $ | — | | | $ | 52,212,455 | | |
For further detail on each asset class, see Schedule of Investments.
The Fund follows authoritative accounting standards, which require additional disclosure regarding fair value measurements. Specifically, these standards require reporting entities to disclose a) the input and valuation techniques used to measure fair value for both recurring and nonrecurring fair value measurements, for Level 2 or Level 3 positions, b) transfers between all levels (including Level 1 and Level 2) on a gross basis (i.e. transfers out must be disclosed separately from transfers in) as well as the reasons(s) for the transfers, and c) purchases and sales on a gross basis in the Level 3 rollforward rather than as one net number. Additionally, reporting entities are required to disclose quantitative information about unobservable inputs used in the fair value measurements categorized within Level 3 of the fair value hierarchy.
There were no transfers between Level 1 and Level 2 securities. There were no Level 3 securities held by the Fund during the year ended August 31, 2015. It is the Fund's policy to recognize transfers into Level 3 at the value as of the beginning of the period, if applicable.
6. SUBSEQUENT EVENTS
The Fund paid an income distribution to Class A in the amount of $0.055 per share, to the Institutional Class in the amount of $0.0584 per share, and to Class C in the amount of $0.0454 per share, with a record date of August 31, 2015 and ex-date and payable date of September 1, 2015.
The Fund paid an income distribution to Class A in the amount of $0.055 per share, to the Institutional Class in the amount of $0.0584 per share, and to Class C in the amount of $0.0454 per share, with a record date of September 30, 2015 and ex-date and payable date of October 1, 2015.
The Fund follows authoritative standards of accounting for and disclosure of events that occur after the Statement of Assets and Liabilities date but before the financial statements are issued or are available to be issued. These standards require the Fund to recognize in the financial statements the effects of all recognized subsequent events that provide additional evidence about conditions that existed at the date of the Statement of Assets and Liabilities. For nonrecognized subsequent events that must be disclosed to keep the financial statements from being misleading, the Fund is required to disclose the nature of the event as well as an estimate of its financial effect, or a statement that such an estimate cannot be made. The Fund has evaluated subsequent events through the issuance of the Fund's financial statements and has determined there is no impact to the Fund's financial statements.
DIREXION ANNUAL REPORT
21
Report of Independent Registered Public Accounting Firm
The Board of Trustees and Shareholders of Direxion Hilton Tactical Income Fund
We have audited the accompanying statement of assets and liabilities, including the schedule of investments, of Direxion Hilton Tactical Income Fund (formerly Hilton Yield Plus Fund) ((one of the series of the Direxion Funds) (the "Fund")) as of August 31, 2015, and the related statement of operations for the year then ended, the statement of changes in net assets for the two periods in the period then ended and the financial highlights for each of the periods indicated therein. These financial statements and financial highlights are the responsibility of the Fund's management. Our responsibility is to express an opinion on these financial statements and financial highlights based on our audits.
We conducted our audits in accordance with the standards of the Public Company Accounting Oversight Board (United States). Those standards require that we plan and perform the audits to obtain reasonable assurance about whether the financial statements and financial highlights are free of material misstatement. We were not engaged to perform an audit of the Fund's internal control over financial reporting. Our audits included consideration of internal control over financial reporting as a basis for designing audit procedures that are appropriate in the circumstances, but not for the purpose of expressing an opinion on the effectiveness of the Funds' internal control over financial reporting. Accordingly, we express no such opinion. An audit also includes examining, on a test basis, evidence supporting the amounts and disclosures in the financial statements and financial highlights, assessing the accounting principles used and significant estimates made by management, and evaluating the overall financial statement presentation. Our procedures included confirmation of securities owned as of August 31, 2015, by correspondence with the custodian and brokers. We believe that our audits provide a reasonable basis for our opinion.
In our opinion, the financial statements and financial highlights referred to above present fairly, in all material respects, the financial position of Direxion Hilton Tactical Income Fund (one of the series of the Direxion Funds) at August 31, 2015, the results of its operations for the year then ended, the changes in its net assets for each of the two periods in the period then ended, and the financial highlights for each of the periods indicated therein, in conformity with U.S. generally accepted accounting principles.
New York, New York
October 28, 2015
DIREXION ANNUAL REPORT
22
Supplemental Information (Unaudited)
For the year ended August 31, 2015, certain dividends paid by the Funds may be subject to a maximum rate of 15%, as provided for by the Jobs and Growth Tax Relief Reconciliation Act of 2003. The amount of dividends declared from ordinary income designated as qualified income was 65.58% for the Fund.
For corporate shareholders, the amount of ordinary income distributions qualifying for the corporate dividends received deduction for the year ended August 31, 2015 was 66.12% for the Fund.
The percentage of taxable ordinary income distributions that are designated as short-term capital gain distributions under Internal Revenue Section 871(k)(2)(C) was 14.97% for the Fund.
Householding
In an effort to decrease costs, the Funds intend to reduce the number of duplicate prospectuses, Annual and Semi-Annual Reports, proxy statements and other similar documents you receive by sending only one copy of each to those addresses shared by two or more accounts and to shareholders we reasonably believe are from the same family or household. Householding begins once you have signed your account application. After such time, if you would like to discontinue householding for your accounts, please call toll-free at (800) 851-0511 to request individual copies of these documents. Once the Funds receive notice to stop householding, we will begin sending individual copies thirty days after receiving your request. This policy does not apply to account statements.
Shareholder Meeting Results
A special meeting of the Hilton Yield Plus Fund's (the "Predecessor Fund") shareholders was held on December 3, 2014. The matter voted upon at the meeting was the approval of an Agreement and Plan of Reorganization providing for the sale of all of the assets of the Predecessor Fund to, and the assumption of all of the liabilities of the Predecessor Fund by, the Direxion Hilton Tactical Income Fund (the "New Fund"), a newly-created series of the Direxion Funds, in exchange for the New Fund's shares, which would be distributed pro rata by the Predecessor Fund to the holders of its shares in complete liquidation of the Predecessor Fund. The number of votes cast for, against or withheld, the number of abstentions, and the number of broker non-votes (if any) with respect to the matter, is set forth below:
Shares Voted "For": | | | 1,272,459 | | |
Shares Voted "Against": | | | — | | |
Abstentions: | | | 8,777 | | |
Broker Non-Votes: | | | — | | |
DIREXION ANNUAL REPORT
23
Investment Advisory and Subadvisory Agreement Approvals (Unaudited)
The Board of Trustees (the "Board") of the Direxion Funds (the "Direxion Trust") is required under the Investment Company Act of 1940, as amended (the "1940 Act"), to annually approve the renewal of the Investment Advisory Agreement (the "Agreement") between Rafferty Asset Management ("Rafferty") and the Direxion Trust and the Subadvisory Agreement (the "Subadvisory Agreement", and collectively, the "Agreements") between Rafferty and Hilton Capital Management, LLC ("Hilton") on behalf of the Direxion Hilton Tactical Income Fund (the "Fund"), a series of the Direxion Trust.
Below is a summary of the certain factors the Board, including the trustees who are not "interested persons" as defined in the 1940 Act, considered at its August 13, 2015 Board meeting when approving the renewal of the Investment Advisory Agreement for the Fund.
The Board did not identify any particular information that was most relevant to its consideration to approve the Agreements and each Trustee may have afforded different weight to the various factors. In addition, the Board noted that the Trustees have considered various reports and information provided throughout the year at regular Board meetings and otherwise, and that the Independent Board members had met separately on August 5, 2015, to consider these specific contract renewals. In considering whether to renew the Agreements, the Board requested, and Rafferty provided, information regarding these matters.
The Board considered, among others, the following factors, to the extent applicable: (1) the nature, extent, and quality of the services provided; (2) the investment performance of the Fund; (3) the profitability of the advisory business to Rafferty, and the profitability of the advisory business to Hilton; (4) the extent to which economies of scale have been taken into account in setting fee schedules; (5) whether fee levels reflect these economies of scale, if any, for the benefit of Fund shareholders; (6) comparisons of services and fees with contracts entered into by Rafferty and with Hilton, with other clients (such as other institutional investors), if any; and (7) other benefits derived or anticipated to be derived and identified by Rafferty or Hilton from its relationship with the Fund. In addition to being advised by independent legal counsel, the Board retained an independent consultant's services to evaluate certain information provided to the Board.
Nature, Extent and Quality of Services Provided. The Board reviewed the nature, extent and quality of the services provided, or to be provided, under the Agreements by Rafferty and Hilton. The Board noted that Rafferty has provided services to the Direxion Trust since its inception. The Board considered Rafferty's marketing and distribution efforts, including offering additional investment options to shareholders through the creation of new share classes of the Fund.
The Board focused on the quality of personnel and operations at Rafferty and the systems and processes required to manage the Fund effectively and noted that these processes may not be present at other investment advisers. In particular the Board considered: (1) Rafferty and Hilton's success in achieving the Fund's investment objective; (2) the size and experience of Rafferty and Hilton's portfolio management staff; and (3) the respective portfolio management staff's relevant experience and specific expertise required to manage the Fund.
The Board also considered Rafferty's representation that it has the financial resources and appropriate staffing to manage the Fund and meet its expense reimbursement obligations. The Board considered that Rafferty oversees all aspects of the operation of the Fund, including oversight of the Fund's service providers and Hilton, and provides compliance services to the Fund.
The Board considered the nature, extent and quality of the services to be provided under the Subadvisory Agreement by Hilton, noting that such services will include, but are not limited to, the following: (1) investing the Fund's assets consistent with the Fund's investment objective and investment policies; (2) determining the portfolio securities to be purchased, sold or otherwise disposed of and the timing of such transactions; (3) maintaining the required books and records for transactions affected by Hilton on behalf of the Fund; and (4) selecting broker-dealers to execute orders on behalf of the Fund. The Board also noted the credentials and experience of Hilton's portfolio management personnel and the processes required to provide services to the Fund. The Board also considered Hilton's assets under management, its capitalization and its affiliation with Rafferty.
Based on its review and other considerations, the Board determined that, in the exercise of its business judgment, the nature, extent and quality of the services provided by Rafferty to the Fund under the Agreement, and by Hilton under the Subadvisory Agreement, were fair and reasonable, and benefited shareholders.
DIREXION ANNUAL REPORT
24
Investment Advisory and Subadvisory Agreement Approvals (Unaudited)
Performance of the Fund. The Board considered relative performance information for the Fund. The Board utilized performance reports provided to the Board in anticipation of the meeting, as well as performance reports provided at regular Board meetings throughout the year. The Board evaluated the performance of the Fund relative to: (1) its benchmark index for year-to-date, and one-year periods ended June 30, 2015; and (2) the average performance of the relevant peer fund universe for the year-to-date and one-year periods ended June 30, 2015. The Board noted the Fund's Class A shares outperformed the peer group median return for the one-year period ended June 30, 2015 and slightly underperformed the peer group median return for the year-to-date period ended June 30, 2015.
Costs of Services Provided to the Fund and Profits Realized. The Board considered the fairness and reasonableness of the advisory fees payable to Rafferty under the Agreement and Hilton under the Subadvisory Agreement, given the investment advisory and subadvisory services provided, the costs of these services, the profitability of Rafferty and Hilton and the comparability to advisory fees and total expenses of other mutual funds that offer strategies similar in nature to the Fund. The Board discussed the methodology used to prepare the comparative fee information for the Fund.
The Board reviewed information that was prepared by USBancorp Fund Services, LLC at the direction of Rafferty, using data from Morningstar, Inc. ("Morningstar") that compared the advisory fee rates paid by the Fund to other funds with investment objectives similar to the Fund. The Board also noted that an independent consultant retained by the Board reviewed the methodology utilized to select the peer funds included in the Fund's peer group. The comparison reports provided to the Board included the advisory fee and net and gross total expense ratios, less any Rule 12b-1 fees and shareholder services fees for the Fund and each peer group fund. The Board also considered that Rafferty contractually agreed to limit the total expenses of the Fund (subject to certain exclusions) for the upcoming fiscal years for the Fund by agreeing to pay certain expenses of the Fund under the Operating Services Agreement.
The Board also considered the services provided by Hilton pursuant to the Subadvisory Agreement, as well as the fees payable to Hilton and noted that the subadvisory fees are not paid directly by the Fund, but rather, are payable by Rafferty to Hilton. The Board also noted Hilton's representation that it is financially sound and has the resources to perform their duties under the Subadvisory Agreement.
The Board received information regarding costs of the advisory and other services that Rafferty provides to the Fund and subadvisory services that Hilton provides to the Fund as well as the profitability of both Rafferty and Hilton. The Board considered the profitability of Rafferty's advisory business and Hilton's subadvisory business. The Board reviewed the costs related to managing the advisory business, including regulatory compliance and other costs.
The Board concluded that, in the exercise of its business judgment, the advisory fee rates for the Fund were fair and reasonable given the services provided by Rafferty and Hilton.
Economies of Scale. The Board also considered Rafferty's representation that it believes that asset levels at this time are not sufficient to achieve economies of scale by Rafferty and Hilton and do not warrant the addition of breakpoints. Rafferty noted that it was continuing to work on its sales and marketing efforts to raise additional assets. Based on these and other considerations, the Board determined that, in the exercise of its business judgment, any addition of breakpoints was not necessary at this time.
Other Benefits. The Board considered any indirect or "fall-out" benefits that Rafferty or its affiliates may derive from their relationship to the Fund. Such benefits may include Rafferty's ability to leverage its investment management personnel or infrastructure to manage other accounts. In addition, the Board considered that Hilton benefits from increased recognition in the marketplace due to the co-branded Fund. Based on these and other considerations, the Board determined that, in the exercise of its business judgment, the benefits to Rafferty were fair and reasonable.
Conclusion. Based on, but not limited to, the above considerations and determinations, the Board, including the Independent Trustees, determined that the Agreements for the Fund were fair and reasonable in light of the nature, extent and quality of the services to be performed, fees, expenses and such other matters as the Board considered relevant in the exercise of its business judgment and that the continuation of the Agreements were in the best interests of the shareholders of the Fund. On this basis, the Board unanimously voted in favor of the continuance of the Agreements.
DIREXION ANNUAL REPORT
25
The business affairs of the Fund are managed by or under the direction of the Board of Trustees. Information pertaining to the Trustees and Officers of the Fund is set below. The report includes additional information about the Fund's Trustees and Officers and is available without charge, upon request by calling 1-800-851-0511.
Interested Trustees
Name, Address and
Age | | Position(s)
Held with
Fund | | Term of Office
and Length of
Time Served | | Principal Occupation(s)
During Past Five Years | | # of Portfolios
in Direxion
Family of
Investment
Companies
Overseen
by Trustee(3) | | Other Trusteeships/
Directorships Held by
Trustee During Past
Five Years | |
Daniel D. O'Neill(1)
Age: 47 | |
Chairman of the Board of Trustees | |
Lifetime of Trust until removal or resignation; Since 2008 | |
Managing Director of Rafferty, 1999-present. | | |
140 | | |
None. | |
Eric W. Falkeis(2)
Age: 41 | |
Trustee | |
Lifetime of Trust until removal or resignation; Since 2014 | |
Chief Operating Officer, since April 2014, Rafferty Asset Management, LLC; formerly, President Rafferty Asset Management, LLC, March 2013 – April 2014; formerly, Senior Vice President, USBFS, September 2007 – March 2013; Chief Financial Officer, USBFS, April 2006 – March 2013; Vice President, USBFS, 1997-2007; formerly, Chief Financial Officer, Quasar Distributors, LLC (2000-2003). | | |
140 | | |
Trustee,
Professionally
Managed Portfolios
(45 Funds). | |
Independent Trustees
Name, Address and
Age | | Position(s)
Held with
Fund | | Term of Office
and Length of
Time Served | | Principal Occupation(s)
During Past Five Years | | # of Portfolios
in Direxion
Family of
Investment
Companies
Overseen
by Trustee(3) | | Other Trusteeships/
Directorships Held by
Trustee During Past
Five Years | |
Gerald E. Shanley III
Age: 71 | |
Trustee | |
Lifetime of Trust until removal or resignation; Since 2008 | |
Retired, Since 2002; Business Consultant, 1985-present; Trustee of Trust Under Will of Charles S. Payson, 1987-present; C.P.A., 1979-present. | | |
140 | | |
None. | |
(1) Mr. O'Neill is affiliated with Rafferty. Mr. O'Neill is the Managing Director of Rafferty and owns a beneficial interest in Rafferty.
(2) Mr. Falkeis is affiliated with Rafferty. Mr. Falkeis is the Chief Operating Officer of Rafferty.
(3) The Direxion Family of Investment Companies consists of the Direxion Shares ETF Trust which, as of the date of this Report, offers for sale to the public 74 of the 121 funds registered with the SEC, the Direxion Funds which, as of the date of this Report, offers for sale to the public 16 funds registered with the SEC and the Direxion Insurance Trust which, as of the date of this Report, offers for sale to the public 3 funds registered with the SEC.
DIREXION ANNUAL REPORT
26
Name, Address and
Age | | Position(s)
Held with
Fund | | Term of Office
and Length of
Time Served | | Principal Occupation(s)
During Past Five Years | | # of Portfolios
in Direxion
Family of
Investment
Companies
Overseen
by Trustee(1) | | Other Trusteeships/
Directorships Held by
Trustee During Past
Five Years | |
John A. Weisser
Age: 73 | |
Trustee | |
Lifetime of Trust until removal or resignation; Since 2008 | |
Retired, Since 1995; Salomon Brothers, Inc., 1971-1995, most recently as Managing Director. | |
140 | |
Director, The MainStay Funds Trust (39 Funds), The MainStay Funds (12 Funds), MainStay VP Fund Series (29 Funds), Mainstay Defined Term Municipal Opportunities Fund (1 Fund); Private Advisors Alternative Strategy Fund (1 Fund); Private Advisors Alternative Strategies Master Fund (1 Fund). | |
David L. Driscoll
Age: 46 | |
Trustee | |
Lifetime of Trust until removal or resignation; Since 2014 | |
Partner, King Associates, LLP, since 2004; Board Advisor, University Common Real Estate, since 2012; Principal, Grey Oaks LLP since 2003; Member, Kendrick LLC, since 2006. | |
140 | |
None. | |
Jacob C. Gaffey
Age: 67 | |
Trustee | |
Lifetime of Trust until removal or resignation; Since 2014 | |
Managing Director of Loomis & Co. since 2012; Partner, Bay Capital Advisors, LLC 2008 – 2012. | |
140 | |
Director, Costa, Inc.
(formerly A.T.
Cross, Inc.). | |
(1) The Direxion Family of Investment Companies consists of the Direxion Shares ETF Trust which, as of the date of this Report, offers for sale to the public 74 of the 121 funds registered with the SEC, the Direxion Funds which, as of the date of this Report, offers for sale to the public 16 funds registered with the SEC and the Direxion Insurance Trust which, as of the date of this Report, offers for sale to the public 3 funds registered with the SEC.
DIREXION ANNUAL REPORT
27
The officers of the Trust conduct and supervise its daily business. Unless otherwise noted, an individual's business address is 1301 Avenue of the Americas, 35th Floor, New York, New York 10019. As of the date of this report, the officers of the Trust, their ages, their business address and their principal occupations during the past five years are as follows:
Principal Officers of the Trust
Name, Address and
Age | | Position(s)
Held with
Fund | | Term of Office
and Length of
Time Served | | Principal Occupation(s)
During Past Five Years | | # of Portfolios
in Direxion
Family of
Investment
Companies
Overseen
by Trustee(3) | | Other Trusteeships/
Directorships Held by
Trustee During Past
Five Years | |
Daniel D. O'Neill(1)
Age: 47 | |
Chief Executive Officer and Chief Investment Officer | |
One Year; Since 2008 | |
Managing Director of Rafferty, 1999-present. | |
140 | |
N/A | |
Eric W. Falkeis(2)
Age: 41 | |
Principal Executive Officer | |
One Year; Since 2014 | |
Chief Operating Officer, since April 2014, Rafferty Asset Management, LLC; formerly, President, Rafferty Asset Management, LLC, March 2013 – April 2014; formerly, Senior Vice President, USBFS, September 2007 – March 2013; Chief Financial Officer, USBFS, April 2006 – March 2013; Vice President, USBFS, 1997-2007; formerly, Chief Financial Officer, Quasar Distributors, LLC (2000-2003). | |
140 | |
Trustee,
Professionally
Managed Portfolios
(45 Funds). | |
Patrick J. Rudnick
Age: 42 | |
Principal Financial Officer and Assistant Secretary | |
One Year; Since 2010 | |
Senior Vice President and Principal Financial Officer, Rafferty Asset Management, LLC, since March 2013; formerly Vice President, USBFS (2006-2013); formerly, Manager, PricewaterhouseCoopers LLP (1999-2006). | |
N/A | |
N/A | |
(1) Mr. O'Neill serves as Chairman of the Board of Trustees of the Direxion Funds, Direxion Insurance Trust and Direxion Shares ETF Trust.
(2) Mr. Falkeis serves as a Trustee of the Direxion Funds, Direxion Insurance Trust and Direxion Shares ETF Trust.
(3) The Direxion Family of Investment Companies consists of the Direxion Shares ETF Trust which, as of the date of this Report, offers for sale to the public 74 of the 121 funds registered with the SEC, the Direxion Funds which, as of the date of this Report, offers for sale to the public 16 funds registered with the SEC and the Direxion Insurance Trust which, as of the date of this Report, offers for sale to the public 3 funds registered with the SEC.
DIREXION ANNUAL REPORT
28
Name, Address and
Age | | Position(s)
Held with
Fund | | Term of Office
and Length of
Time Served | | Principal Occupation(s)
During Past Five Years | | # of Portfolios
in Direxion
Family of
Investment
Companies
Overseen
by Trustee(1) | | Other Trusteeships/
Directorships Held by
Trustee During Past
Five Years | |
Angela Brickl
Age: 39 | |
Chief Compliance Officer
Secretary | |
One Year; Since 2012
One Year; Since 2011 | |
General Counsel and Chief Compliance Officer, Rafferty Asset Management, LLC, since October 2010; Summer Associate at Skadden, Arps, Slate, Meagher & Flom, LLP, May – August 2009; Summer Associate at Foley & Lardner, LLP May – August 2008; Vice President USBFS November 2003 – August 2007. | |
N/A | |
N/A | |
(1) The Direxion Family of Investment Companies consists of the Direxion Shares ETF Trust which, as of the date of this Report, offers for sale to the public 74 of the 121 funds registered with the SEC, the Direxion Funds which, as of the date of this Report, offers for sale to the public 16 funds registered with the SEC and the Direxion Insurance Trust which, as of the date of this Report, offers for sale to the public 3 funds registered with the SEC.
DIREXION ANNUAL REPORT
29
THIS PAGE INTENTIONALLY LEFT BLANK
30
At the Direxion Funds, we are committed to protecting your privacy. To open and service your Direxion accounts, we collect and maintain certain nonpublic personal information about you, such as your address, phone number, social security number, purchases, sales, account balances, bank account information and other personal financial information. We collect this information from the following sources:
• Account applications or other forms on which you provide information,
• Mail, e-mail, the telephone and our website, and
• Your transactions and account inquiries with us.
We safeguard the personal information that you have entrusted to us in the following ways:
• As a general policy, only those employees who maintain your account and respond to your requests for additional services have access to your account information.
• We maintain physical, electronic, and procedural safeguards to insure the security of your personal information and to prevent unauthorized access to your information.
We do not disclose any nonpublic personal information about you or our former shareholders to anyone, except as permitted or required by law. In the course of conducting business and maintaining your account we may share shareholder information, as allowed by law, with our affiliated companies and with other service providers, including financial intermediaries, custodians, transfer agents and marketing consultants. Those companies are contractually bound to use that information only for the services for which we hired them. They are not permitted to use or share our shareholders' nonpublic personal information for any other purpose. There also may be times when we provide information to federal, state or local authorities as required by law.
In the event that you hold fund shares of Direxion through a financial intermediary, including, but not limited to, a broker-dealer, bank, or trust company, the privacy policy of your financial intermediary would govern how your nonpublic personal information would be shared with nonaffiliated third parties.
For questions about our policy, please contact us at (800) 851-0511.
This page is not a part of the Annual Report.
DIREXION ANNUAL REPORT
Investment Advisor
Rafferty Asset Management, LLC
1301 Avenue of the Americas
35th Floor
New York, NY 10019
Sub-Advisor
Hilton Capital Management, LLC
1010 Franklin Avenue
Garden City, NY 11530
Administrator, Transfer Agent, Dividend Paying
Agent & Shareholding Servicing Agent
U.S. Bancorp Fund Services, LLC
P.O. Box 1993
Milwaukee, WI 53201-1993
Custodian
U.S. Bank, N.A.
1555 RiverCenter Dr., Suite 302
Milwaukee, WI 53212
Independent Registered Public Accounting Firm
Ernst & Young LLP
5 Times Square
New York, NY 10036
Distributor
Rafferty Capital Markets, LLC
1010 Franklin Ave., 3rd Floor
Garden City, NY 11530
The Trust's Proxy Voting Policies are available without charge by calling 1-800-850-0511, or by accessing the SEC's website at www.sec.gov.
The actual voting records relating to portfolio securities during the most recent period ended June 30 (starting with the year ended June 30, 2005) is available without charge by calling 1-800-850-0511, or by accessing the SEC's website at www.sec.gov.
The Trust files complete schedules of portfolio holdings with SEC on Form N-Q. The Form N-Q is available without charge by calling 1-800-850-0511, or by accessing the SEC's website at www.sec.gov.
This report has been prepared for shareholders and may be distributed to others only if preceded or accompanied by a current prospectus.

1301 Avenue of the Americas (6th Avenue), 35th Floor | New York, New York 10019 | (800) 851-0511
www.direxioninvestments.com
Item 2. Code of Ethics.
The registrant has adopted a code of ethics that applies to the registrant’s principal executive officer and principal financial officer. The registrant has not made any amendments to its code of ethics during the period covered by this report. The registrant has not granted any waivers from any provisions of the code of ethics during the period covered by this report. A copy of the registrant’s Code of Ethics is filed herewith.
Item 3. Audit Committee Financial Expert.
The registrant’s board of trustees has determined that there is at least one audit committee financial expert serving on its audit committee. Gerald E. Shanley III is the “audit committee financial expert” and is considered to be “independent” as each term is defined in Item 3 of Form N-CSR.
Item 4. Principal Accountant Fees and Services.
The registrant has engaged its principal accountant to perform audit services, audit-related services, tax services and other services during the past fiscal year. “Audit services” refer to performing an audit of the registrant’s annual financial statements or services that are normally provided by the accountant in connection with statutory and regulatory filings or engagements for the fiscal year. “Audit-related services” refer to the assurance and related services by the principal accountant that are reasonably related to the performance of the audit. “Tax services” refer to professional services rendered by the principal accountant for tax compliance, tax advice, and tax planning, including assessment of ASC 740 for the Funds and additional tax research. There were no “Other services” provided by the principal accountant. The following table details the aggregate fees billed or expected to be billed for each of the last fiscal year for audit fees, audit-related fees, tax fees and other fees by the principal accountant. The table presents aggregate fees billed to the registrant and reflected in the financial statements of the report to shareholders.
| | FYE 8/31/2015 | | FYE 8/31/2014 | |
Audit Fees | | $ | 302,750 | | $ | 292,500 | |
Audit-Related Fees | | — | | — | |
Tax Fees | | $ | 74,490 | | $ | 77,745 | |
All Other Fees | | — | | — | |
The audit committee has adopted pre-approval policies and procedures that require the audit committee to pre-approve all audit and non-audit services of the registrant, including services provided to any entity affiliated with the registrant.
The percentages of fees billed by Ernst & Young LLP applicable to non-audit services pursuant to waiver of pre-approval requirement were as follows:
| | FYE 8/31/2015 | | FYE 8/31/2014 | |
Audit-Related Fees | | 0 | % | 0 | % |
Tax Fees | | 0 | % | 0 | % |
All Other Fees | | 0 | % | 0 | % |
All of the principal accountant’s hours spent on auditing the registrant’s financial statements were attributed to work performed by full-time permanent employees of the principal accountant. (If more than 50 percent of the accountant’s hours were spent to audit the registrant’s financial statements for the fiscal year, state how many hours were attributed to work performed by persons other than the principal accountant’s full-time, permanent employees.)
The following table indicates the non-audit fees, other than the tax services as noted above, billed or expected to be billed by the registrant’s accountant for services to the registrant and to the registrant’s investment adviser (and any other controlling entity, etc.—not sub-adviser) for the last year. The audit committee of the board of trustees has considered whether the provision of non-audit services that were rendered to the registrant’s investment adviser is compatible with maintaining the principal accountant’s independence and has concluded that the provision of such non-audit services by the accountant has not compromised the accountant’s independence.
Non-Audit Related Fees | | FYE 8/31/2015 | | FYE 8/31/2014 | |
Registrant | | None | | None | |
Registrant’s Investment Adviser | | None | | None | |
Item 5. Audit Committee of Listed Registrants.
Not applicable to registrants who are not listed issuers (as defined in Rule 10A-3 under the Securities Exchange Act of 1934).
Item 6. Schedule of Investments.
Schedule of Investments is included as part of the report to shareholders filed under Item 1 of this Form.
Item 7. Disclosure of Proxy Voting Policies and Procedures for Closed-End Management Investment Companies.
Not applicable to open-end investment companies.
Item 8. Portfolio Managers of Closed-End Management Investment Companies.
Not applicable to open-end investment companies.
Item 9. Purchases of Equity Securities by Closed-End Management Investment Company and Affiliated Purchasers.
Not applicable to open-end investment companies.
Item 10. Submission of Matters to a Vote of Security Holders.
There have been no material changes to the procedures by which shareholders may recommend nominees to the registrant’s board of directors/trustees.
Item 11. Controls and Procedures.
(a) The Registrant’s Principal Executive Officer and Principal Financial Officer have reviewed the Registrant’s disclosure controls and procedures (as defined in Rule 30a-3(c) under the Investment Company Act of 1940 (the “Act”)) as of a date within 90 days of the filing of this
report, as required by Rule 30a-3(b) under the Act and Rules 13a-15(b) or 15d-15(b) under the Securities Exchange Act of 1934. Based on their review, such officers have concluded that the disclosure controls and procedures are effective in ensuring that information required to be disclosed in this report is appropriately recorded, processed, summarized and reported and made known to them by others within the Registrant and by the Registrant’s service provider.
(b) There were no changes in the Registrant’s internal control over financial reporting (as defined in Rule 30a-3(d) under the Act) that occurred during the second fiscal quarter of the period covered by this report that has materially affected, or is reasonably likely to materially affect, the Registrant’s internal control over financial reporting.
Item 12. Exhibits.
(a) (1) Any code of ethics or amendment thereto, that is subject of the disclosure required by Item 2, to the extent that the registrant intends to satisfy Item 2 requirements through filing an exhibit. Filed herewith.
(2) Certifications pursuant to Section 302 of the Sarbanes-Oxley Act of 2002. Filed herewith.
(3) Any written solicitation to purchase securities under Rule 23c-1 under the Act sent or given during the period covered by the report by or on behalf of the registrant to 10 or more persons. Not applicable to open-end investment companies.
(b) Certification pursuant to Section 906 of the Sarbanes-Oxley Act of 2002. Furnished herewith.
SIGNATURES
Pursuant to the requirements of the Securities Exchange Act of 1934 and the Investment Company Act of 1940, the registrant has duly caused this report to be signed on its behalf by the undersigned, thereunto duly authorized.
(Registrant) | Direxion Funds | |
| |
| | |
By (Signature and Title) | /s/ Eric W. Falkeis | |
| Eric W. Falkeis, Principal Executive Officer | |
| |
Date | 11/4/15 | |
| | | | |
Pursuant to the requirements of the Securities Exchange Act of 1934 and the Investment Company Act of 1940, this report has been signed below by the following persons on behalf of the registrant and in the capacities and on the dates indicated.
By (Signature and Title) | /s/ Eric W. Falkeis | |
| Eric W. Falkeis, Principal Executive Officer | |
| |
Date | 11/4/15 | |
| | | |
By (Signature and Title) | /s/ Patrick J. Rudnick | |
| Patrick J. Rudnick, Principal Financial Officer | |
| |
Date | 11/4/15 | |
| | | |