UNITED STATES
SECURITIES AND EXCHANGE COMMISSION
Washington, D.C. 20549
FORM N-CSR
CERTIFIED SHAREHOLDER REPORT OF REGISTERED
MANAGEMENT INVESTMENT COMPANIES
Investment Company Act file number | 811-08243 |
|
Direxion Funds |
(Exact name of registrant as specified in charter) |
|
1301 Avenue of the Americas (6th Ave.), 28th Floor
New York, NY | | 10019 |
(Address of principal executive offices) | | (Zip code) |
|
1301 Avenue of the Americas (6th Ave.), 28th Floor
New York, NY 10019 |
(Name and address of agent for service) |
|
Registrant’s telephone number, including area code: | 1-800-851-0511 | |
|
Date of fiscal year end: | October 31, 2019 | |
|
Date of reporting period: | October 31, 2019 | |
| | | | | | | | |
Form N-CSR is to be used by management investment companies to file reports with the Commission not later than 10 days after the transmission to stockholders of any report that is required to be transmitted to stockholders under Rule 30e-1 under the Investment Company Act of 1940 (17 CFR 270.30e-1). The Commission may use the information provided on Form N-CSR in its regulatory, disclosure review, inspection, and policymaking roles.
A registrant is required to disclose the information specified by Form N-CSR, and the Commission will make this information public. A registrant is not required to respond to the collection of information contained in Form N-CSR unless the Form displays a currently valid Office of Management and Budget (“OMB”) control number. Please direct comments concerning the accuracy of the information collection burden estimate and any suggestions for reducing the burden to Secretary, Securities and Exchange Commission, 450 Fifth Street, NW, Washington, DC 20549-0609. The OMB has reviewed this collection of information under the clearance requirements of 44 U.S.C. § 3507.
Item 1. Report to Stockholders.
[Insert full text of annual report here]

ANNUAL REPORT OCTOBER 31, 2019
1301 Avenue of the Americas (6th Ave.), 28th Floor New York, New York 10019 www.direxioninvestments.com
Direxion Indexed Commodity & Income Strategy Fund (Consolidated)
You can find a Fund's prospectus, reports to shareholders, and other information about the Fund online at http://www.direxioninvestments.com/regulatory-documents. You can also get this information at no cost by calling (800) 851-0511 or by sending an email request to info@direxionfunds.com.
IMPORTANT NOTE: Beginning on January 1, 2021, as permitted by regulations adopted by the Securities and Exchange Commission, paper copies of the Fund's annual and semi-annual shareholder reports will no longer be sent by mail, unless you specifically request paper copies of the shareholder reports from your financial intermediary such as a broker-dealer or bank. Instead, annual and semi-annual shareholder reports will be available on a website, and you will be notified by mail each time a report is posted and provided with a website link to access the report.
You may elect to receive all future annual and semi-annual shareholder reports in paper, free of charge. To elect to continue receive paper copies of shareholder reports through the mail or to otherwise change your delivery method, contact your financial intermediary or follow the instructions included with this disclosure. Your election to receive shareholder reports in paper will apply to all funds that you hold through the financial intermediary. If you already elected to receive shareholder reports electronically, you will not be affected by this change and you need not take any action.
Letter to Shareholders (Unaudited) | | | 4 | | |
Performance Summary (Unaudited) | | | 7 | | |
Expense Example (Unaudited) | | | 8 | | |
Allocation of Portfolio Holdings (Unaudited) | | | 9 | | |
Consolidated Schedule of Investments | | | 10 | | |
Consolidated Statement of Assets and
Liabilities | | | 11 | | |
Consolidated Statement of Operations | | | 12 | | |
Consolidated Statement of Changes in
Net Assets | | | 13 | | |
Consolidated Financial Highlights | | | 14 | | |
Notes to the Consolidated Financial
Statements | | | 15 | | |
Report of Independent Registered Public
Accounting Firm | | | 21 | | |
| Supplemental Information (Unaudited) | | | 22 | | |
Board Review of Investment Advisory
Agreement (Unaudited) | | | 23 | | |
| Trustees and Officers (Unaudited) | | | 26 | | |
Help Preserve the Environment – Go Green!
Go paperless with Direxion e-Delivery – a service allowing shareholders to reduce clutter with full online access to regulatory documents. Begin the preservation process with e-delivery.
With Direxion e-Delivery you can:
• Receive email notifications when your most recent shareholder communications are available for review.
• Access prospectuses, annual reports and semi-annual reports online.
It's easy to enroll:
1. Visit www.direxioninvestments.com/edelivery
2. Follow the simple enrollment instructions
If you have questions about Direxion e-Delivery services, contact one of our shareholder representatives at 800-851-0511.


LETTER TO SHAREHOLDERS (UNAUDITED)
Dear Shareholders,
This Annual Report for the Direxion Funds covers the period from November 1, 2018 to October 31, 2019 (the "Annual Period").
Market Review:
U.S. equities entered the Annual Period amid continued concerns over global trade and weakness in the technology sector, leading equity markets lower for the first part of November 2018. A strengthening dollar, along with adjusted language by the Federal Reserve amid slowing global growth, led to a positive monthly return for the S&P 500 Index during November. Volatility returned in Q4 2018, coming to a head in December, as equity stocks sold off precipitously during the month amidst continued trade tensions with China that led to concerns of a broader global economic slowdown. Commentary from the Federal Reserve, citing expected continued growth and further rate increases, came on the back of its decision to raise rates in December. While the rate increase was expected, the lack of more dovish language behind it was not, and thusly compounded the move in equities to the downside. A change of tone from the Federal Reserve towards rate flexibility in January 2019 proved a boon to both U.S. and international equities, as emerging markets specifically saw an increased appetite for risk. The topic of tariffs was a key daily market driver during January 2019. Through February, U.K. equities struggled on ever-present Brexit concerns, while Asian equities gained on trade deal progress. Stocks continued to perform well through March and into April, with both the NASDAQ-100 Index and S&P 500 Index hitting all-time highs. Strong earnings from communication and financial sector stocks helped drive the domestic market higher through April, while developed and emerging country stocks lagged by comparison due to lingering concerns surrounding U.S.-China trade tensions and political uncertainties. During May, U.S. threats of tariffs on Mexican and Chinese goods sent the U.S. market reeling, only to be assuaged the following month by subsequent progress in Chinese trade talks and an indefinite suspension of Mexican tariffs shortly before the implementation deadline. Mid-summer brought a stronger U.S. dollar, which proved to be a headwind for emerging markets, while U.S. equities were bolstered by a strong start to Q2 2019 earnings and an expected 25 basis point rate cut by the Federal Reserve. The onset of August brought the first inverted treasury yield curve since 2007, and whispers of a recession along with it. U.S. trade tariffs on $300 billion of Chinese goods took effect in September, as another 25 basis point rate cut from the Federal Reserve proved underwhelming without language supporting long-term monetary easing. The end of the Annual Period saw risk appetites return, with progress made on a U.S.-China trade deal in what was referred to as "phase one" of a larger deal to come. The trade deal news also benefitted emerging markets, which saw a boost from a weaker U.S. Dollar and global central bank easing.
The fixed income market began the Annual Period with a peak in the two to ten-year yield curve spread of approximately 30 basis points. With trade rhetoric and Federal Reserve policy pending in the background, the front end of the curve began moving into a slight inversion. A major tailwind for the bond market occurred in December 2019 when the Federal Reserve decided to hike rates by 25 basis points. As investors became fearful of an economic slowdown and a drawn out trade war, bond markets rallied, driving yields lower. To begin the year, the Federal Reserve came forth with a neutral policy stance, leaving trade war rhetoric as the ultimate catalyst for price action in the bond markets. With fear of a recession lurking, the continued rally in the bond market spurred the decline in broad equity benchmarks. The Federal Reserve responded to market concerns by implementing a much anticipated rate cut in July. Not too long after, talks of tariff increases dragged the two to ten-year yield curve into negative territory. Further rate cuts, and increased trade optimism from the delay in tariffs, led to a slight sell off in bonds. The Annual Period finished with an average curve spread of approximately ten basis points.
Fund Performance Review:
The Direxion Indexed Commodity & Income Strategy Fund (the "Fund") seeks investment results, before fees and expenses, that track the performance of the Auspice Broad Commodity Index. The Auspice Broad Commodity Index attempts to capture upward trends in the commodity markets while minimizing risk during downward trends. The index uses a quantitative methodology to track either long or flat positions in a diversified portfolio of 12 different commodity futures
DIREXION ANNUAL REPORT
4
contracts, or "components", covering energy, metals, and agriculture. The index incorporates dynamic risk management and contract rolling methods. During the Annual Period, the Auspice Broad Commodity Index returned -5.00%, while the Fund's Institutional Class Shares returned -3.78%.
The Fund began the Annual Period long 4 of 12 possible commodity components, with upside performance driven by natural gas. But, those gains were offset by slumping crude oil. The Fund continued to struggle through December, and finished 2018 long gold, natural gas and sugar. A continued appreciation in price for the Fund's largest holding, sugar, helped drive positive fund performance from January through mid-February 2019. The Fund added a copper position in late February, which helped mitigate negative returns, as copper outperformed the other four commodity components through March. Through April, the Fund increased the amount of commodity components to 7 out of a possible 12. Commodities slid during the month of May, returning a period-worst. As a result, the Fund reduced exposure to flat in copper, crude and heating oil, resulting in June being the best performing month of the period due to the surging price of gold, which was the Fund's largest position at the time. Through the end of the Annual Period, the Fund's performance was relatively flat, finishing the period long only 3 of 12 commodities – gold, silver and wheat.
As always, we thank you for using the Direxion Funds and we look forward to our mutual success.
Regards,

| |
Patrick Rudnick
Principal Executive Officer
Principal Financial Officer | |
The performance data quoted represents past performance. Past performance does not guarantee future results. The investment return and principal value of an investment will fluctuate. An investor's shares, when redeemed, may be worth more or less than their original cost. Current performance may be lower or higher than the performance quoted. Returns for performance under one year are cumulative, not annualized. For the most recent month-end performance please visit the funds website at direxion.com.
An investment in the Fund involves risk, including the possible loss of principal. The Fund is non-diversified and includes risk associated with concentration risk which results from the Fund's investments in a particular industry or sector and can increase volatility over time. Investing in a fund that invests in specific industries or geographic regions may be more volatile than investing in a broadly diversified fund. Active and frequent trading associated with a regular rebalance of the Fund can cause the price to fluctuate, therefore impacting its performance compared to other investment vehicles. Commodities are subject to significant volatility and entail a high degree of risk. Leverage by the Fund can accelerate the velocity of potential losses. Risks of the Fund include Leverage Risk, Market Risk, Liquidity Risk, Derivatives Risk, Commodity-Linked Derivatives Risk, Futures Strategy Risk, Counterparty Risk, Other Investment Companies (Including ETFs) Risk, Subsidiary Investment Risk, Interest Rate Risk, Index Correlation/Tracking Risk, and Tax Risk. Please see the summary and full prospectuses for a more complete description of these and other risks of the Fund.
An investor should carefully consider a Fund's investment objective, risks, charges, and expenses before investing. A Fund's prospectus and summary prospectus contain this and other information about the Direxion Funds. To obtain a prospectus and summary prospectus call 646-759-0278 or visit our website at direxion.com. A Fund's prospectus and summary prospectus should be read carefully before investing.
DIREXION ANNUAL REPORT
5
Please note that you cannot invest directly in an index, although you may invest in the underlying securities represented in the index. Index returns are adjusted to reflect the reinvestment of dividends on securities in the index, but do not reflect the expenses of the Fund.
The views in this report were those of the Adviser as of October 31, 2019 and may not reflect their views on the date this report is first published or anytime thereafter. These views are intended to assist shareholders of the Fund in understanding their investments in the Fund and do not constitute investment advice.
Distributed by: Rafferty Capital Markets, LLC
DIREXION ANNUAL REPORT
6
Direxion Indexed Commodity & Income Strategy Fund (Consolidated)
Performance Summary (Unaudited)
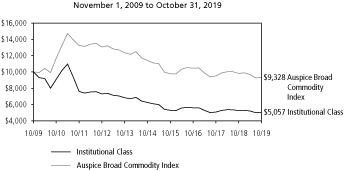
Investment Objective: Seeks investment results that track the performance of the Auspice Broad Commodity Index.
Institutional Class
Investor Class
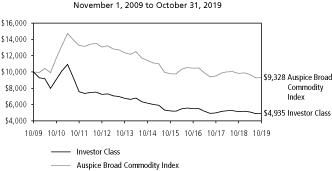
These charts illustrate the performance of a hypothetical $10,000 investment made ten years ago in each share class of the Fund, and is not intended to imply any future performance. The returns shown do not reflect the deduction or taxes that a shareholder would pay on fund distributions or the redemption of fund shares. The performance of the Auspice Broad Commodity Index, the Fund's benchmark, does not reflect the deduction of fees associated with a mutual fund, such as investment management fees. Investors cannot invest directly in an index, although they can invest in its underlying securities. During the period shown, Rafferty Asset Management, LLC waived and/or reimbursed fees for various expenses. Had these waivers and/or reimbursement not been in effect, performance would have been lower.
The Fund may impose a 1.00% redemption fee on Institutional Class and Investor Class shares redeemed (through sales or exchanges) within 30 days of the date of purchase. Performance data does not reflect the redemption fee. If reflected, total returns would be reduced.
The performance data shown represents past performance and does not guarantee future results.
| | | Average Annual Total Return1 | |
| | | 1 Year | | 3 Years | | 5 Years | | 10 Years | |
Institutional Class | | | (3.78 | )% | | | (3.34 | )% | | | (4.16 | )% | | | (6.59 | )% | |
Investor Class | | | (4.11 | )% | | | (3.57 | )% | | | (4.39 | )% | | | (6.33 | )% | |
Auspice Broad
Commodity Index | | | (5.00 | )% | | | (3.73 | )% | | | (3.95 | )% | | | (0.69 | )% | |
Market Exposure
Investment Type | | Percent of
Net Assets | |
Futures Contracts | | | 33.3 | % | |
Total Exposure | | | 33.3 | % | |
"Market Exposure" includes the value of total investments (including the contract value of any derivatives) and excludes any short-term investments and cash equivalents divided by net assets.
1 As of October 31, 2019.
DIREXION ANNUAL REPORT
7
Expense Example (Unaudited)
October 31, 2019
As a shareholder of a mutual fund, you incur two types of costs: (1) transaction costs, including sales charges (loads) on purchase payments, reinvested dividends, or other distributions; redemption fees; and exchange fees; and (2) ongoing costs, including management fees; distribution and/or service fees; and other fund expenses. This example is intended to help you understand your ongoing costs (in dollars) of investing in a fund and to compare costs with the ongoing costs of investing in other mutual funds.
The example is based on an investment of $1,000 invested at the beginning of the period and held the entire period (May 1, 2019 – October 31, 2019).
Actual Expenses
The first line of the table below provides information about actual account values and actual expenses. You may use the information in this line, together with the amount you invested, to estimate the expenses that you paid over the period. Simply divide your account value by $1,000 (for example, an $8,600 account value divided by $1,000 = 8.6), then multiply the result by the number in the first line under the heading entitled "Expenses Paid During Period" to estimate the expenses you paid on your account during this period.
Hypothetical Example for Comparison Purposes
The second line of the table below provides information about hypothetical account values and hypothetical expenses based on the Fund's actual expense ratio and an assumed rate of return of 5% per year before expenses, which is not the Fund's actual return. The hypothetical account values and expenses may not be used to estimate the actual ending account balance or expenses you paid for the period. You may use this information to compare the ongoing costs of investing in the Fund and other funds. To do so, compare this 5% hypothetical example with the 5% hypothetical examples that appear in the shareholder reports of the other funds.
Please note that the expenses shown in the table are meant to highlight your ongoing costs only and do not reflect any transactional costs, such as wire transfers, redemption fees, sales charges (loads), returned checks or stop payment orders. Therefore, the second line of the table is useful in comparing ongoing costs only and will not help you determine the relative costs of owning different funds. In addition, if these transactional costs were included, your costs would have been higher.
Expense Example (Unaudited)
October 31, 2019
| | | Annualized
Expense
Ratio | | Beginning
Account Value
May 1, 2019 | | Ending
Account Value
October 31, 2019 | | Expenses
Paid During
Period* | |
Direxion Indexed Commodity & Income Strategy Fund
Institutional Class | |
Based on actual fund return | | | 1.01 | % | | $ | 1,000.00 | | | $ | 969.90 | | | $ | 5.01 | | |
Based on hypothetical 5% return | | | 1.01 | % | | | 1,000.00 | | | | 1,020.11 | | | | 5.14 | | |
Direxion Indexed Commodity & Income Strategy Fund
Investor Class | |
Based on actual fund return | | | 1.26 | % | | | 1,000.00 | | | | 968.10 | | | | 6.25 | | |
Based on hypothetical 5% return | | | 1.26 | % | | | 1,000.00 | | | | 1,018.85 | | | | 6.41 | | |
* Expenses are equal to the Fund's annualized expense ratio, multiplied by the average account value over the period, multiplied by 184 days (the number of days in the period of May 1, 2019 to October 31, 2019), then divided by 365.
DIREXION ANNUAL REPORT
8
Allocation of Portfolio Holdings (Unaudited)
October 31, 2019
| | | Cash* | | Futures | | Total | |
Direxion Indexed Commodity & Income Strategy Fund (Consolidated) | | | 99 | % | | | 1 | % | | | 100 | % | |
Allocation of Portfolio Holdings reflects percentages of net assets.
* Cash, cash equivalents and other assets less liabilities.
DIREXION ANNUAL REPORT
9
Direxion Indexed Commodity & Income Strategy Fund
Consolidated Schedule of Investments
October 31, 2019
| | | | | Fair Value | |
No reportable investments. | | | |
| | | TOTAL INVESTMENTS
(Cost $—) - 0.0% | | $ | — | | |
| | | Other Assets in Excess of
Liabilities - 100.0% (a) | | | 10,520,910 | | |
| | | TOTAL NET ASSETS - 100.0% | | $ | 10,520,910 | | |
Percentages are stated as a percent of net assets.
(a) $165,385 of cash is pledged as collateral for futures contracts.
Long Futures Contracts
October 31, 2019
Reference Entity | | Expiration
Date | | Number of
Contracts | | Notional
Amount | | Variation
Margin
Receivable/
(Payable), net | | Unrealized
Appreciation
(Depreciation) | |
Gold | | 2/26/2020 | | | 12 | | | $ | 1,826,160 | | | $ | 21,600 | | | $ | 195 | | |
Silver | | 12/27/2019 | | | 11 | | | | 993,685 | | | | 11,000 | | | | 41,319 | | |
Wheat | | 12/13/2019 | | | 27 | | | | 686,813 | | | | (675 | ) | | | 44,224 | | |
| | | | | | | $ | 3,506,658 | | | $ | 31,925 | | | $ | 85,738 | | |
All futures contracts held by Direxion CTS Fund. See Note 1 in Consolidated Notes to the Financial Statements.
The accompanying notes are an integral part of these financial statements.
DIREXION ANNUAL REPORT
10
Consolidated Statement of Assets and Liabilities
October 31, 2019
| | | Direxion Indexed
Commodity &
Income Strategy
Fund | |
Assets: | |
Cash and cash equivalents | | $ | 10,340,879 | | |
Receivable for Fund shares sold | | | 313 | | |
Deposit at broker for futures contracts | | | 165,385 | | |
Receivable for variation margin, net | | | 31,925 | | |
Interest receivable | | | 16,145 | | |
Prepaid expenses and other assets | | | 12,792 | | |
Total Assets | | | 10,567,439 | | |
Liabilities: | |
Payable for Fund shares redeemed | | | 33,674 | | |
Due to broker for futures contracts | | | 2,770 | | |
Due to Adviser, net (Note 4) | | | 1,841 | | |
Accrued distribution expenses | | | 528 | | |
Accrued expenses and other liabilities | | | 7,716 | | |
Total Liabilities | | | 46,529 | | |
Net Assets | | $ | 10,520,910 | | |
Net Assets Consist of: | |
Capital stock | | $ | 9,542,216 | | |
Total distributable earnings | | | 978,694 | | |
Total Net Assets | | $ | 10,520,910 | | |
Cost of Investments | | $ | — | | |
Institutional Class: | |
Net assets | | $ | 7,480,979 | | |
Shares outstanding (unlimited shares of beneficial interest authorized, no par value) | | | 597,621 | | |
Net asset value, redemption price and offering price per share | | $ | 12.52 | | |
Investor Class: | |
Net assets | | $ | 3,039,931 | | |
Shares outstanding (unlimited shares of beneficial interest authorized, no par value) | | | 246,057 | | |
Net asset value, redemption price and offering price per share | | $ | 12.35 | | |
The accompanying notes are an integral part of these financial statements.
DIREXION ANNUAL REPORT
11
Consolidated Statement of Operations
For the Year Ended October 31, 2019
| | | Direxion Indexed
Commodity &
Income Strategy
Fund | |
Investment Income: | |
Interest income | | $ | 322,635 | | |
Total investment income | | | 322,635 | | |
Expenses: | |
Investment advisory fees (Note 4) | | | 125,204 | | |
State registration fees | | | 38,158 | | |
Licensing fees | | | 37,544 | | |
Professional fees | | | 21,205 | | |
Accounting fees | | | 15,988 | | |
Distribution expenses — Investor Class (Note 4) | | | 9,043 | | |
Report to shareholders | | | 5,491 | | |
Trustees' fees | | | 4,305 | | |
Management service fees | | | 3,760 | | |
Other | | | 3,445 | | |
Administration fees | | | 2,373 | | |
Insurance fees | | | 1,579 | | |
Total expenses | | | 268,095 | | |
Less: Reimbursement of expenses from Adviser (Note 4) | | | (110,279 | ) | |
Net Expenses | | | 157,816 | | |
Net investment income | | | 164,819 | | |
Realized and unrealized gain (loss) on investments: | |
Net realized loss on: | |
Futures contracts | | | (1,235,568 | ) | |
| | | | (1,235,568 | ) | |
Change in net unrealized appreciation (depreciation) on: | | | |
Futures contracts | | | 408,494 | | |
| | | | 408,494 | | |
Net realized and unrealized loss on investments | | | (827,074 | ) | |
Net decrease in net assets resulting from operations | | $ | (662,255 | ) | |
The accompanying notes are an integral part of these financial statements.
DIREXION ANNUAL REPORT
12
Consolidated Statement of Changes in Net Assets
| | | Direxion Indexed Commodity &
Income Strategy Fund | |
| | | Year Ended
October 31, 2019 | | Year Ended
October 31, 2018 | |
Increase (Decrease) in net assets from: | |
Operations: | |
Net investment income | | $ | 164,819 | | | $ | 78,989 | | |
Net realized gain (loss) | | | (1,235,568 | ) | | | 1,957,223 | | |
Change in net unrealized appreciation (depreciation) | | | 408,494 | | | | (1,165,105 | ) | |
Net increase (decrease) in net assets resulting from operations | | | (662,255 | ) | | | 871,107 | | |
Distributions to shareholders: | |
Net distributions to shareholders | |
Institutional Class Shares | | | (493,878 | ) | | | — | | |
Investor Class Shares | | | (184,592 | ) | | | — | | |
Total distributions to shareholders | | | (678,470 | ) | | | — | | |
Capital share transactions: | |
Total decrease in net assets from capital share transactions(a) | | | (7,400,116 | ) | | | (24,350,457 | ) | |
Total decrease in net assets | | | (8,740,841 | ) | | | (23,479,350 | ) | |
Net assets: | |
Beginning of year | | | 19,261,751 | | | | 42,741,101 | | |
End of year | | $ | 10,520,910 | | | $ | 19,261,751 | | |
(a) Summary of capital share transactions is as follows:
| | | Direxion Indexed Commodity &
Income Strategy Fund | |
| | | Year Ended
October 31, 2019 | | Year/Period Ended
October 31, 2018 | |
| | | Shares | | Value | | Shares | | Value | |
Shares sold | |
Institutional Class Shares | | | 482,533 | | | $ | 6,606,206 | | | | 3,033,777 | | | $ | 42,861,414 | | |
Investor Class Shares(b) | | | 58,637 | | | | 785,894 | | | | 22,138 | | | | 305,866 | | |
Class A Shares(c) | | | — | | | | — | | | | 56,695 | | | | 765,411 | | |
Class C Shares(c) | | | — | | | | — | | | | 933 | | | | 11,885 | | |
Shares issued in reinvestment of distributions | |
Institutional Class Shares | | | 37,761 | | | | 470,120 | | | | — | | | | — | | |
Investor Class Shares(b) | | | 13,765 | | | | 169,171 | | | | — | | | | — | | |
Shares redeemed | |
Institutional Class Shares | | | (1,012,696 | ) | | | (13,756,640 | ) | | | (4,598,157 | ) | | | (64,012,533 | ) | |
Investor Class Shares(b) | | | (126,173 | ) | | | (1,674,867 | ) | | | (30,023 | ) | | | (417,031 | ) | |
Class A Shares(c) | | | — | | | | — | | | | (248,234 | ) | | | (3,386,259 | ) | |
Class C Shares(c) | | | — | | | | — | | | | (36,983 | ) | | | (479,210 | ) | |
Shares converted(d) | |
Investor Class Shares(b) | | | — | | | | — | | | | 55,526 | | | | 770,704 | | |
Class C Shares(c) | | | — | | | | — | | | | (58,475 | ) | | | (770,704 | ) | |
Shares redesignated(d) | |
Investor Class Shares(b) | | | — | | | | — | | | | 252,187 | | | | 3,500,357 | | |
Class A Shares(c) | | | — | | | | — | | | | (252,187 | ) | | | (3,500,357 | ) | |
Net decrease | | | (546,173 | ) | | $ | (7,400,116 | ) | | | (1,802,803 | ) | | $ | (24,350,457 | ) | |
(b) Year/Period ended October 31, 2018 amounts represents the period from June 30, 2018 to October 31, 2018.
(c) Year/Period ended October 31, 2018 amounts represent the period from November 1, 2017 to June 29, 2018.
(d) See Note 1 in the Notes to the Consolidated Financial Statements.
The accompanying notes are an integral part of these financial statements.
DIREXION ANNUAL REPORT
13
Consolidated Financial Highlights
October 31, 2019
| | | | | RATIOS TO AVERAGE NET ASSETS3 | | | |
| | | Net Asset
Value,
Beginning
of Year/
Period | | Net
Investment
Income
(Loss)1 | | Net Realized
and Unrealized
Gain (Loss)
on Investments | | Net Increase
(Decrease) in
Net Asset
Value Resulting
from Operations | | Dividends
from Net
Investment
Income | | Distributions
from
Realized
Capital Gains | | Return of
Capital
Distribution | | Total
Distributions | | Redemption
Fees Paid
to Fund | | Net
Asset
Value,
End of
Year/
Period | | Total
Return2 | | Net
Assets,
End of
Year/
Period
(,000) | | Total
Expenses | | Net
Expenses4 | | Net Investment
Income (Loss)
After Expense
Reimbursement | | Portfolio
Turnover
Rate5 | |
Direxion Indexed Commodity & Income Strategy Fund | |
Institutional Class Shares | |
Year ended October 31, 2019 | | $ | 13.90 | | | $ | 0.16 | | | $ | (0.69 | ) | | $ | (0.53 | ) | | $ | (0.85 | ) | | $ | — | | | $ | — | | | $ | (0.85 | ) | | $ | 0.006 | | | $ | 12.52 | | | | (3.78 | )% | | $ | 7,481 | | | | 1.76 | % | | | 1.01 | % | | | 1.18 | % | | | 0 | % | |
Year ended October 31, 2018 | | $ | 13.44 | | | | 0.07 | | | | 0.39 | | | | 0.46 | | | | — | | | | — | | | | — | | | | — | | | | 0.006 | | | $ | 13.90 | | | | 3.42 | % | | $ | 15,157 | | | | 1.65 | % | | | 1.01 | % | | | 0.49 | % | | | 0 | % | |
Year ended October 31, 2017 | | $ | 15.66 | | | | (0.06 | ) | | | (1.39 | ) | | | (1.45 | ) | | | (0.77 | ) | | | — | | | | — | | | | (0.77 | ) | | | 0.006 | | | $ | 13.44 | | | | (9.25 | )% | | $ | 35,662 | | | | 1.05 | % | | | 1.05 | % | | | (0.43 | )% | | | 0 | % | |
Year ended October 31, 2016 | | $ | 14.81 | | | | (0.12 | ) | | | 0.97 | | | | 0.85 | | | | — | | | | — | | | | — | | | | — | | | | 0.006 | | | $ | 15.66 | | | | 5.74 | % | | $ | 43,477 | | | | 1.01 | % | | | 1.01 | % | | | (0.77 | )% | | | 0 | % | |
Year ended October 31, 2015 | | $ | 17.48 | | | | (0.16 | ) | | | (2.51 | ) | | | (2.67 | ) | | | — | | | | — | | | | — | | | | — | | | | 0.006 | | | $ | 14.81 | | | | (15.27 | )% | | $ | 39,002 | | | | 1.01 | % | | | 1.01 | % | | | (0.99 | )% | | | 0 | % | |
Year ended October 31, 2014 | | $ | 19.12 | | | | (0.18 | ) | | | (1.46 | ) | | | (1.64 | ) | | | — | | | | — | | | | — | | | | — | | | | 0.006 | | | $ | 17.48 | | | | (8.58 | )% | | $ | 46,602 | | | | 1.01 | % | | | 1.01 | % | | | (0.99 | )% | | | 0 | % | |
Investor Class Shares | |
Year ended October 31, 2019 | | $ | 13.69 | | | | 0.12 | | | | (0.69 | ) | | | (0.57 | ) | | | (0.77 | ) | | | — | | | | — | | | | (0.77 | ) | | | — | | | $ | 12.35 | | | | (4.11 | )% | | $ | 3,040 | | | | 2.01 | % | | | 1.26 | % | | | 0.93 | % | | | 0 | % | |
June 30, 20187,8 to October 31, 2018 | | $ | 13.88 | | | | 0.03 | | | | (0.22 | ) | | | (0.19 | ) | | | — | | | | — | | | | — | | | | — | | | | 0.006 | | | $ | 13.69 | | | | (1.37 | )% | | $ | 4,105 | | | | 1.93 | % | | | 1.26 | % | | | 0.58 | % | | | 0 | % | |
Class A Shares | |
November 1, 2017 to June 29, 20187 | | $ | 13.26 | | | | 0.006 | | | | 0.62 | | | | 0.62 | | | | — | | | | — | | | | — | | | | — | | | | 0.006 | | | $ | 13.88 | | | | 4.68 | % | | $ | 3,500 | | | | 1.94 | % | | | 1.26 | % | | | 0.01 | % | | | 0 | % | |
Year ended October 31, 2017 | | $ | 15.42 | | | | (0.12 | ) | | | (1.34 | ) | | | (1.46 | ) | | | (0.70 | ) | | | — | | | | — | | | | (0.70 | ) | | | 0.006 | | | $ | 13.26 | | | | (9.49 | )% | | $ | 5,883 | | | | 1.31 | % | | | 1.31 | % | | | (0.78 | )% | | | 0 | % | |
Year ended October 31, 2016 | | $ | 14.63 | | | | (0.16 | ) | | | 0.95 | | | | 0.79 | | | | — | | | | — | | | | — | | | | — | | | | 0.006 | | | $ | 15.42 | | | | 5.40 | % | | $ | 19,799 | | | | 1.26 | % | | | 1.26 | % | | | (1.01 | )% | | | 0 | % | |
Year ended October 31, 2015 | | $ | 17.29 | | | | (0.20 | ) | | | (2.46 | ) | | | (2.66 | ) | | | — | | | | — | | | | — | | | | — | | | | 0.006 | | | $ | 14.63 | | | | (15.38 | )% | | $ | 8,499 | | | | 1.26 | % | | | 1.26 | % | | | (1.24 | )% | | | 0 | % | |
Year ended October 31, 2014 | | $ | 18.96 | | | | (0.23 | ) | | | (1.44 | ) | | | (1.67 | ) | | | — | | | | — | | | | — | | | | — | | | | 0.006 | | | $ | 17.29 | | | | (8.81 | )% | | $ | 11,477 | | | | 1.26 | % | | | 1.26 | % | | | (1.23 | )% | | | 0 | % | |
Year ended October 31, 2013 | | $ | 20.32 | | | | (0.24 | ) | | | (1.12 | ) | | | (1.36 | ) | | | — | | | | — | | | | — | | | | — | | | | 0.006 | | | $ | 18.96 | | | | (6.69 | )% | | $ | 39,656 | | | | 1.26 | % | | | 1.26 | % | | | (1.20 | )% | | | 0 | % | |
Class C Shares | |
November 1, 2017 to June 29, 20188 | | $ | 12.65 | | | | (0.06 | ) | | | 0.59 | | | | 0.53 | | | | — | | | | — | | | | — | | | | — | | | | — | | | $ | 13.18 | | | | 4.19 | % | | $ | 770 | | | | 2.68 | % | | | 2.01 | % | | | (0.72 | )% | | | 0 | % | |
Year ended October 31, 2017 | | $ | 14.73 | | | | (0.20 | ) | | | (1.30 | ) | | | (1.50 | ) | | | (0.58 | ) | | | — | | | | — | | | | (0.58 | ) | | | — | | | $ | 12.65 | | | | (10.21 | )% | | $ | 1,195 | | | | 2.05 | % | | | 2.05 | % | | | (1.43 | )% | | | 0 | % | |
Year ended October 31, 2016 | | $ | 14.07 | | | | (0.26 | ) | | | 0.92 | | | | 0.66 | | | | — | | | | — | | | | — | | | | — | | | | — | | | $ | 14.73 | | | | 4.69 | % | | $ | 1,786 | | | | 2.01 | % | | | 2.01 | % | | | (1.79 | )% | | | 0 | % | |
Year ended October 31, 2015 | | $ | 16.76 | | | | (0.31 | ) | | | (2.38 | ) | | | (2.69 | ) | | | — | | | | — | | | | — | | | | — | | | | — | | | $ | 14.07 | | | | (16.05 | )% | | $ | 2,137 | | | | 2.01 | % | | | 2.01 | % | | | (1.99 | )% | | | 0 | % | |
Year ended October 31, 2014 | | $ | 18.52 | | | | (0.36 | ) | | | (1.40 | ) | | | (1.76 | ) | | | — | | | | — | | | | — | | | | — | | | | — | | | $ | 16.76 | | | | (9.50 | )% | | $ | 4,046 | | | | 2.01 | % | | | 2.01 | % | | | (1.98 | )% | | | 0 | % | |
Year ended October 31, 2013 | | $ | 20.00 | | | | (0.38 | ) | | | (1.10 | ) | | | (1.48 | ) | | | — | | | | — | | | | — | | | | — | | | | — | | | $ | 18.52 | | | | (7.40 | )% | | $ | 4,629 | | | | 2.01 | % | | | 2.01 | % | | | (1.95 | )% | | | 0 | % | |
1 Net investment income (loss) per share represents net investment income (loss) divided by the daily average shares of beneficial interest outstanding throughout each year/period.
2 All returns reflect reinvested dividends, if any, but do not reflect the impact of taxes. Total return for a period of less than one year is not annualized.
3 For periods of less than one year, these ratios are annualized.
4 Net expenses include the effects of any reimbursements or recoupments by the Adviser.
5 Portfolio turnover is not annualized and is calculated without regard to short-term securities having a maturity of less than one year. Investments in futures contracts are deemed short-term securities.
6 Amount is less than $0.005.
7 Class A Shares were redesignated as Investor Class Shares on June 30, 2018.
8 Class C Shares were converted to Investor Class Shares on June 30, 2018.
The accompanying notes are an integral part of these financial statements.
DIREXION ANNUAL REPORT
14
Direxion Funds
Notes to the Consolidated Financial Statements
October 31, 2019
1. ORGANIZATION
Direxion Funds (the "Trust") was organized as a Massachusetts Business Trust on June 6, 1997 and is registered under the Investment Company Act of 1940, as amended (the "1940 Act"), as an open-end management investment company issuing its shares in series, each series representing a distinct portfolio with its own investment objective and policies. The Trust currently has 15 series, of which one is included in this report: Direxion Indexed Commodity & Income Strategy Fund (the "Fund"). The Fund is a non-diversified series of the Trust pursuant to the 1940 Act. The Fund was formerly known as Direxion Indexed Commodity Strategy Fund. On June 30, 2018, the Fund redesignated the Fund's outstanding Class A shares as Investor Class shares and converted all of the Fund's outstanding Class C shares to Investor Class shares. This redesignation and conversion were tax-free events for shareholders. As a result, after this redesignation and conversion, the Fund currently offers Investor and Institutional Class shares. Institutional Class shares are made available through investment advisers, banks, trust companies or authorized representatives without a sales charge.
Rafferty Asset Management, LLC (the "Adviser") has registered as a commodity pool operator ("CPO") and the Fund is considered a commodity pool under the Commodity Exchange Act (the "CEA"). Accordingly, the Adviser is subject to registration and regulation as a CPO under the CEA and must comply with various regulatory requirements under the CEA, and the rules and regulations of the Commodity Futures Trading Commission and the National Futures Association, including investor protection requirements, antifraud provisions, disclosure requirements and reporting and recordkeeping requirements.
The Fund is managed to track the performance of the Auspice Broad Commodity Index. The Auspice Broad Commodity Index is a long/flat commodities index. A long/flat approach allows the Fund to attempt to take advantage of higher commodity prices, and at the same time shift into a cash position of an individual commodity that shows a downward trend in price. The Fund primarily invests in commodity and financial futures contracts directly and/or indirectly through its wholly-owned subsidiary, Direxion CTS Fund ("CTS Fund"), to track the returns of the Auspice Broad Commodity Index within the limitation of the U.S. federal tax requirements applicable to regulated investment companies.
The Trust has evaluated the structure, objective and activities of the Fund and determined that they meet the characteristics of an investment company. As such, these financial statements have applied the guidance as set forth in the Accounting Standards Codifications ("ASC") 946, Financial Services Investment Companies.
2. SIGNIFICANT ACCOUNTING POLICIES
The following is a summary of significant accounting policies consistently followed by the Fund in the preparation of their financial statements. These policies are in conformity with U.S. generally accepted accounting principles ("GAAP").
a) Cash Equivalents – The Fund considers investments in the U.S. Bank Money Market Deposit Account, a U.S. dollar-denominated deposit account offered through U.S. Bank, to be cash equivalents. The Fund is exposed to the credit risk of U.S. Bank through these holdings of cash equivalents. These cash equivalents are presented on the Statement of Assets and Liabilities as "Cash equivalents" and were classified as Level 1 assets as of October 31, 2019.
b) Investment Valuation – The Net Asset Value ("NAV") per share of the Fund is determined daily, as of the close of regular trading on the New York Stock Exchange ("NYSE") (normally at 4:00 p.m. Eastern Time ("Valuation Time")), each day the NYSE is open for business. Equity securities and ETFs are valued at their last sales price or, if not available, at the average of the last bid and ask prices. Investments in open-end mutual funds are valued at their respective quoted NAVs on the valuation date. Futures are valued at the settlement price established on the exchange on which they are traded if that settlement price reflects trading prior to the Valuation Time. If the settlement price established by the exchange reflects trading after the Valuation Time, then the last sales price prior to the Valuation Time will be used. Over-the-counter securities are valued at the average of the last bid and ask prices. Securities primarily traded on the NASDAQ National Market are valued using the NASDAQ Official Closing Price. Short term debt securities with a remaining maturity of 60 days or less at time of purchase and money market securities are valued using the amortized cost method. Other debt securities are valued by using the
DIREXION ANNUAL REPORT
15
mean prices provided by the Fund's pricing service or, if such services are unavailable, by a pricing matrix method. Securities or swap contracts are fair valued as determined by the Adviser under the supervision of the Board of Trustees (the "Board") in the following scenarios: a) reliable market quotations are not readily available; b) the Fund's pricing service does not provide a valuation for such securities; c) the Fund's pricing service provides valuation that in the judgment of the Adviser does not represent fair value; or d) the Fund or Adviser believes the market price is stale. Additionally, the Adviser will monitor developments in the marketplace for significant events that may affect the value of those securities whose closing prices were established before the Valuation Time.
c) Futures Contracts and Options on Futures Contracts – The Fund may purchase and sell futures contracts and options on futures contracts. A Fund may use futures contracts to gain exposure to, or hedge against changes in the values of commodities, equities, interest rates or foreign currencies. Upon entering into a contract, the Fund deposits and maintains as collateral such initial margin as required by the exchange on which the transaction is affected. Pursuant to the contract, the Fund agrees to receive from or pay to the broker an amount of cash equal to the daily fluctuation in value of the contract. Such receipts or payments are known as "variation margin" and are recorded by the Fund as unrealized gains and losses. When the contract is closed, the Fund records a realized gain or loss equal to the difference between the value of the contract at the time it was opened and the value at the time it was closed. As collateral for futures contracts, the Fund is required under the 1940 Act to maintain assets consisting of cash, cash equivalents or liquid securities. This collateral is required to be adjusted daily to reflect the market value of the purchase obligation for long futures contracts or the market value of the instrument underlying the contract, but not less than the market price at which the futures contract was established, for short futures contracts. The Fund was invested in futures contracts during the year ended October 31, 2019, as shown in the Schedule of Investments.
d) Risks of Options, Futures Contracts, Options on Futures Contracts and Short Positions – The risks inherent in the use of options, futures contracts, options on futures contracts and short positions include 1) adverse changes in the fair value of such instruments; 2) imperfect correlation between the price of options and futures contracts and options thereon and movements in the price of the underlying securities, index or futures contracts; 3) the possible absence of a liquid secondary market for any particular instrument at any time; 4) the possible need to defer closing out certain positions to avoid adverse tax consequences; and 5) the possible non-performance by the counterparty under the terms of the contract. The Fund designates cash, cash equivalents and liquid securities as collateral for written options, futures contracts, options on futures contracts and short positions. The Fund was not invested in any type of options during the year ended October 31, 2019.
e) Basis for Consolidation – The Fund may invest up to 25% of its total assets in the CTS Fund. The CTS Fund, which is organized under the laws of the Cayman Islands, is wholly-owned and controlled by the Fund. The CTS Fund acts as an investment vehicle to facilitate entering into certain investments for the Fund consistent with the Fund's investment objectives and policies specified in its prospectus and statement of additional information. As of October 31, 2019, the net assets of the Fund were $10,520,910, of which $1,450,776, or approximately 13.8%, represented the Fund's ownership of all issued shares and voting rights of the CTS Fund. All intercompany balances, revenues and expenses have been eliminated in consolidation.
f) Risks of Investing Commodity-Linked Derivatives – The Fund, through its investment in its subsidiary, may hold commodity-linked derivatives. Commodity-linked derivatives provide exposure, which may include long and/or short exposure, to the investment returns of physical commodities that trade in the commodities markets without investing directly in physical commodities. The value of a commodity-linked derivative investment typically is based upon the price movements of a physical commodity (such as heating oil, precious metals, livestock, or agricultural products), a commodity futures contract or commodity index, or some other readily measurable economic variable. The value of commodity-linked derivative instruments may be affected by changes in overall market movements, volatility of the underlying benchmark, changes in interest rates, or factors affecting a particular industry or commodity, such as drought, floods, weather, livestock disease, embargoes, tariffs and international economic, political and regulatory developments. The value of commodity-linked derivatives will rise or fall in response to changes in the underlying commodity or related index. Investments in commodity-linked derivatives may be subject to greater volatility than non-derivative based investments. A highly liquid secondary market may not exist for certain commodity-linked derivatives, and there can be no assurance that one will develop. Commodity-linked derivatives were held during the year ended October 31, 2019.
g) Investment Transactions – Investment transactions are recorded on trade date. The Fund determines the gain or loss realized from investment transactions by comparing the identified cost, which is the same basis used for U.S. federal income tax purposes, with the net sales proceeds.
DIREXION ANNUAL REPORT
16
h) Investments in Other Investment Companies – The Fund may invest in another ETF or mutual fund collectively defined as "investment companies". As a result, Fund shareholders indirectly bear the Fund's proportionate share of fees and expenses paid by shareholders of the other investment company, in addition to the fees and expenses Fund shareholders bear in connection with the Fund's own operations. These costs are disclosed in the Fund's prospectus as Acquired Fund Fees and Expenses. Shareholders may obtain the financial statements of these investment companies at www.sec.gov.
i) Federal Income Taxes – The Fund intends to make the requisite distributions of income and capital gains to comply with the requirements of Subchapter M of the Internal Revenue Code necessary to qualify as a regulated investment company. Therefore, no provision for U.S. federal income taxes has been made. The Fund may be subject to a nondeductible 4% U.S. excise tax calculated as a percentage of certain undistributed amounts of net investment income and net capital gains.
j) Income and Expenses – Dividend income is recorded on the ex-dividend date. Interest income, including amortization of premiums and discounts, and dividends received from money market funds, recognized on an accrual basis. Expenses are charged to the Fund daily. Expenses are computed based on the Fund's respective average daily net assets. For an additional discussion on expenses, refer to Note 4. Income and expenses are allocated to each class of shares based upon relative net assets.
k) Distributions to Shareholders – The Fund pays dividends from net investment income and distributes net realized capital gains, if any, at least annually. Income and capital gain distributions are determined in accordance with U.S. Federal income tax regulations, which may differ from GAAP.
The tax character of distributions during the year ended October 31, 2019 was all ordinary income. There were no distributions made during the year ended October 31, 2018.
As of October 31, 2019, the components of distributable earnings of the Fund on a tax basis were as follows:
Tax cost of investments | | $ | — | | |
Gross unrealized appreciation | | | 844,066 | | |
Gross unrealized depreciation | | | — | | |
Net unrealized appreciation/(depreciation) | | $ | 844,066 | | |
Undistributed ordinary income | | $ | 134,628 | | |
Undistributed long-term capital gain | | | — | | |
Total distributable earnings | | | 134,628 | | |
Other accumulated gain/(loss) | | | — | | |
Total accumulated earnings/(loss) | | $ | 978,694 | | |
The difference between book cost of investments and tax cost of investments is attributable primarily to the investment in the subsidiary.
On the Statement of Assets and Liabilities, the following adjustments were made for permanent tax differences between accounting for net investment income (loss) and net realized gains and losses under GAAP and tax reporting:
Total Distributable
Earnings (Loss) | | Capital Stock | |
| $ | 1,205,377 | | | $ | (1,205,377 | ) | |
GAAP requires that certain components of net assets relating to permanent differences be reclassified between financial and tax reporting. These reclassifications have no effect on net assets or net asset value per share. For the year ended October 31, 2019, the permanent differences primarily relate to investments in the subsidiary.
In order to meet certain U.S. excise tax distribution requirements, the Fund is required to measure and distribute annually net capital gains realized during a twelve month period ending October 31 and net investment income earned during a twelve month period ending December 31. In connection with this, the Fund is permitted for tax purposes to defer into its next fiscal year qualified late year losses. Qualified late year ordinary losses are generally losses incurred between January 1 and the end of its fiscal year, October 31, 2019. For the year ended October 31, 2019, the Fund did not defer any qualified late year losses.
DIREXION ANNUAL REPORT
17
Under the Regulated Investment Company Modernization Act of 2010, net capital losses recognized for tax years beginning after December 22, 2010, may be carried forward indefinitely, and their character is retained as short-term and/or long-term. As of October 31, 2019, the Fund had no unlimited short-term or long-term capital loss carryforwards.
The Fund follows authoritative financial reporting rules regarding recognition and measurement of tax positions taken or expected to be taken on a tax return. The Fund has reviewed all open tax years and concluded that there is no effect to the Fund's financial position or results of operations and no tax liability resulting from unrecognized tax benefits relating to uncertain income tax position taken or expected to be taken on a tax return. The Fund recognizes interest and penalties, if any, related to unrecognized tax benefits as income tax expense on the Statements of Operations. During this period, the Funds did not incur any interest or penalties. Open tax years are those years that are open for examination by the relevant income taxing authority. As of October 31, 2019, open U.S. Federal and state income tax years include the tax years ended October 31, 2016 through October 31, 2019. The Fund has no examinations in progress. The Fund is also not aware of any tax positions for which it is reasonably possible that the total amounts of unrecognized tax expense will significantly change in the next twelve months.
l) Guarantees and Indemnifications – In the ordinary course of business, the Fund enters into contracts that contain a variety of indemnification provisions pursuant to which the Fund agrees to indemnify third parties upon the occurrence of specified events. The Fund's maximum exposure relating to these indemnification agreements is unknown. However, the Fund has not had prior claims or losses in connection with these provisions and believe the risk of loss is remote.
m) Use of Estimates – The preparation of financial statements in conformity with GAAP requires management to make estimates and assumptions that affect the reported amounts of assets and liabilities and disclosure of contingent assets and liabilities at the date of the financial statements and the reported amounts of revenues and expenses during the reporting period. Actual results could differ from those estimates.
3. INVESTMENT TRANSACTIONS
During the year ended October 31, 2019, there were no purchases and sales of investments (excluding short-term investments and futures contracts).
The Fund had no purchases or sales of long-term U.S. Government securities for the year ended October 31, 2019.
4. INVESTMENT ADVISORY AND OTHER AGREEMENTS
Investment Advisory Fees: The Fund has entered into an investment advisory agreement with the Adviser. The Adviser earns a fee, computed daily and payable monthly, applied to the Fund's average daily net assets at the annual rates of 0.85%.
Management Services Agreement: The Fund has entered into a Management Services Agreement with the Adviser. Under the Management Services Agreement, the Fund pays the Adviser a management service fees of 0.026% on the first $10,000,000,000 of the Fund's daily net assets and 0.024% on assets in excess of $10,000,000,000.
Operating Expense Limitation Agreement: The Fund is responsible for its own operating expenses. Under the Operating Expense Limitation Agreement, the Adviser has contractually agreed to cap all or a portion of the expenses for each Share Class of the Fund based on an annual rate of 1.26% for Investor Class Shares and 1.01% for Institutional Class Shares applied to the Fund's average daily net assets.
Any expense cap is subject to recoupment by the Adviser within the following three years only if overall expenses fall below the lesser of this percentage limitation and any percentage limitation in place at the time. This agreement may be terminated or revised at any time with the consent of the Board of Trustees.
DIREXION ANNUAL REPORT
18
The table below presents amounts that the Adviser recouped, waived and the amounts available for potential recoupments by the Adviser.
Expenses | | Expenses | | Potential Recoupment Amounts Expiring: | | Total Potential | |
| Recouped | | Reimbursed | | October 31, 2021 | | October 31, 2022 | | Recoupment Amount | |
| $ | — | | | $ | 110,279 | | | $ | 134,763 | | | $ | 110,279 | | | $ | 245,042 | | |
The net amount payable arising from the Investment Advisory Agreement, Management Services Agreement and waiver of any expenses as of October 31, 2019 is presented on the Statement of Assets and Liabilities as Due to investment adviser, net.
Distribution Expenses: Shares of the Fund are subject to an annual 12b-1 fee of up to 1.00% of the Fund's average daily net assets. The Investor Class of the Fund currently charges a 12b-1 fee of 0.25% of its respective class average daily net assets to pay sales, distribution, and other fees for the sale of its shares and for services provided to investors. The Institutional Class shares of the Fund does not charge a 12b-1 fee. The Fund does not charge a shareholder service fee.
Rafferty Capital Markets, LLC (the "Distributor") serves as principal underwriter of the Fund and acts as the Fund's distributor in a continuous public offering of the Fund's shares. The Distributor is an affiliate of the Adviser.
5. VALUATION MEASUREMENTS
The Fund follows authoritative fair valuation accounting standards, which establish an authoritative definition of fair value and set out a hierarchy for measuring fair value. These standards require additional disclosures about the various inputs and valuation techniques used to develop the measurements of fair value and a discussion in changes in valuation techniques and related inputs during the period. These inputs are summarized in the three broad levels below:
Level 1 – Quoted prices in active markets for identical securities
Level 2 – Evaluated price based on other significant observable inputs (including quoted prices for similar securities, interest rates, prepayment speeds, credit risk, etc.)
Level 3 – Significant unobservable inputs (including the Fund's own assumptions in determining fair value of investments)
The inputs or methodology used for valuing investments are not an indication of the credit risk associated with investing in those financial instruments.
The follow is a summary of the inputs used to value the Fund's investments as of October 31, 2019:
| | | Asset Class | |
| | | Level 1 | |
Fund | | Investment
Companies | | Short Term
Investments | | Cash
Equivalents | | Futures
Contracts* | |
Direxion Indexed Commodity & Income Strategy Fund | | $ | — | | | $ | — | | | $ | 9,086,496 | | | $ | 85,738 | | |
For further detail on each asset class, see the Schedule of Investments.
* Futures contracts are valued at the unrealized appreciation/(depreciation).
The Fund follows authoritative accounting standards, which require additional disclosure regarding fair value measurements. Specifically, these standards require reporting entities to disclose a) the input and valuation techniques used to measure fair value for both recurring and nonrecurring fair value measurements, for Level 2 or Level 3 positions, b) transfers between all levels on a gross basis (i.e. transfers out must be disclosed separately from transfers in) as well as the reason(s) for the transfers and c) purchases and sales on a gross basis in the Level 3 rollforward rather than as one net number. Additionally, reporting entities are required to disclose quantitative information about unobservable inputs used in the fair value measurements categorized within Level 3 of the fair value hierarchy.
There were no Level 3 securities held by the Fund during the year ended October 31, 2019.
DIREXION ANNUAL REPORT
19
6. ADDITIONAL DISCLOSURES ABOUT DERIVATIVE INSTRUMENTS
The Fund follows authoritative standards of accounting for derivative instruments, which establish disclosure requirements for derivative instruments. These standards improve financial reporting for derivative instruments by requiring enhanced disclosures that enable investors to understand how and why a fund uses derivatives instruments, how derivatives instruments are accounted for and how derivative instruments affect a fund's financial position and results of operations.
The Fund uses derivative instruments as part of its principal investment strategy to achieve its investment objective. For additional discussion on the risks associated with derivative instruments refer to Note 2. As of October 31, 2019, the Fund was invested in futures contracts.
At October 31, 2019, the fair value of derivatives instruments, by primary risk, were as follows:
Asset Derivatives | |
| | | Commodity
Risk | | Credit
Risk | | Currency
Risk | | Equity
Risk | | Interest Rate
Risk | | Total | |
Futures contracts* | | $ | 85,738 | | | $ | — | | | $ | — | | | $ | — | | | $ | — | | | $ | 85,738 | | |
* Cumulative appreciation (depreciation) of futures contracts as reported in the Schedules of Investments.
Only current day's variation margin, if any, is reported within the Statements of Assets and Liabilities.
Transactions in derivative instruments during the year ended October 31, 2019, by primary risk, were as follows:
| | | Commodity
Risk | | Credit
Risk | | Currency
Risk | | Equity
Risk | | Interest Rate
Risk | | Total | |
Net realized gain (loss)1 | |
Futures contracts | | $ | (1,235,568 | ) | | $ | — | | | $ | — | | | $ | — | | | $ | — | | | $ | (1,235,568 | ) | |
Change in net unrealized
appreciation (depreciation)2 | |
Futures contracts | | | 408,494 | | | | — | | | | — | | | | — | | | | — | | | | 408,494 | | |
1 Statements of Operations location: Net realized gain (loss) on futures contracts.
2 Statements of Operations location: Change in net unrealized appreciation (depreciation) on futures contracts.
For the year ended October 31, 2019, the average volume of derivatives held by the Fund was $8,332,290. This amount represents the quarterly average gross notional amount of long futures contracts held by the Fund. The Fund uses future contracts to meet its investment objective of seeking results that track the performance of the Auspice Broad Commodity Index.
7. SUBSEQUENT EVENTS
Management has performed an evaluation of subsequent events through the date the financial statements were issued and has determined that no items require recognition or disclosure besides those noted below.
The Board of Trustees of the Trust has elected Kathleen M. Berkery as a Trustee of the Trust effective November 26, 2019.
DIREXION ANNUAL REPORT
20
Report of Independent Registered Public Accounting Firm
To the Shareholders and the Board of Trustees of Direxion Indexed Commodity & Income Strategy Fund
Opinion on the Financial Statements
We have audited the accompanying consolidated statement of assets and liabilities of Direxion Indexed Commodity & Income Strategy Fund (formerly Direxion Indexed Commodity Strategy Fund (the "Fund")) (one of the funds constituting Direxion Funds ("the Trust")), including the consolidated schedule of investments, as of October 31, 2019, and the related consolidated statement of operations for the year then ended, the consolidated statement of changes in net assets for the two years in the period then ended, the consolidated financial highlights for each of the five years in the period then ended and the related notes (collectively referred to as the "financial statements"). In our opinion, the financial statements present fairly, in all material respects, the consolidated financial position of the Fund (one of the funds constituting the Direxion Funds) at October 31, 2019, the consolidated results of its operations for the year then ended, the consolidated changes in its net assets for each of the two years in the period then ended and its consolidated financial highlights for each of the five years in the period then ended, in conformity with U.S. generally accepted accounting principles.
Basis for Opinion
These financial statements are the responsibility of the Trust's management. Our responsibility is to express an opinion on the Fund's financial statements based on our audits. We are a public accounting firm registered with the Public Company Accounting Oversight Board (United States) ("PCAOB") and are required to be independent with respect to the Trust in accordance with the U.S. federal securities laws and the applicable rules and regulations of the Securities and Exchange Commission and the PCAOB.
We conducted our audits in accordance with the standards of the PCAOB. Those standards require that we plan and perform the audit to obtain reasonable assurance about whether the financial statements are free of material misstatement, whether due to error or fraud. The Trust is not required to have, nor were we engaged to perform, an audit of the Trust's internal control over financial reporting. As part of our audits we are required to obtain an understanding of internal control over financial reporting but not for the purpose of expressing an opinion on the effectiveness of the Trust's internal control over financial reporting. Accordingly, we express no such opinion.
Our audits included performing procedures to assess the risks of material misstatement of the financial statements, whether due to error or fraud, and performing procedures that respond to those risks. Such procedures included examining, on a test basis, evidence regarding the amounts and disclosures in the financial statements. Our procedures included confirmation of securities owned as of October 31, 2019, by correspondence with the custodian and brokers. Our audits also included evaluating the accounting principles used and significant estimates made by management, as well as evaluating the overall presentation of the financial statements. We believe that our audits provide a reasonable basis for our opinion.
We have served as the auditor of one or more of the Direxion investment companies since 2001.
Minneapolis, Minnesota
December 20, 2019
DIREXION ANNUAL REPORT
21
Supplemental Information (Unaudited)
For the period ended October 31, 2019, certain dividends paid by the Fund may be subject to a maximum rate of 15%, as provided for by the Jobs and Growth Tax Relief Reconciliation Act of 2003. The percentage of dividends declared from ordinary income designated as qualified income was 0%.
For corporate shareholders, the percent of ordinary income distributions qualifying for the corporate dividends received deduction for the period ended October 31, 2019 was 0%.
Householding
In an effort to decrease costs, the Fund intend to reduce the number of duplicate prospectuses, Annual and Semi-Annual Reports, proxy statements and other similar documents you receive by sending only one copy of each to those addresses shared by two or more accounts and to shareholders we reasonably believe are from the same family or household. Householding begins once you have signed your account application. After such time, if you would like to discontinue householding for your accounts, please call toll-free at (800) 851-0511 to request individual copies of these documents. Once the Fund receive notice to stop householding, we will begin sending individual copies thirty days after receiving your request. This policy does not apply to account statements.
DIREXION ANNUAL REPORT
22
Board Review of Investment Advisory Agreement (Unaudited)
Consistent with the Investment Company Act of 1940, as amended (the "1940 Act"), the Board of Trustees (the "Board") of the Direxion Funds (the "Direxion Trust") annually considers the renewal of the Investment Advisory Agreement (the "Advisory Agreement") between Rafferty Asset Management, LLC (the "Adviser" or "Rafferty") and the Direxion Trust, on behalf of the Direxion Indexed Commodity & Income Strategy Fund (the "Fund"), along with its wholly-owned subsidiary, the Direxion CTS Fund. The Agreement is initially approved for a two-year period and must be renewed yearly thereafter to remain in effect.
At an in-person meeting held on August 27, 2019, following such consideration, the Board, including the trustees who are not "interested persons" of the Trust as defined in the 1940 Act (the "Independent Trustees"), unanimously approved the renewal of the Advisory Agreement on behalf of the Fund. The Independent Trustees had previously considered information pertaining to the renewal of the Agreement outside the presence of the Adviser's representatives and Fund management in executive sessions held on August 13, 2019 and August 27, 2019. The Board, including the Independent Trustees, determined that the terms of the Agreement for the Fund were fair and reasonable and in the best interests of shareholders.
In considering whether to renew the Agreement, the Board requested, and Adviser provided, information that the Board and Adviser believed to be reasonably necessary to evaluate the Agreement. Among other information, the Board obtained and reviewed the following:
• Detailed information regarding the advisory services provided by the Adviser for the Fund;
• The investment objective of the Fund, which requires utilization of complex financial instruments that is not typical of traditional index tracking mutual funds;
• The Adviser's Form ADV;
• Biographies of the employees primarily responsible for providing investment advisory services at the Adviser;
• Information regarding each component of the contractual fee rates for the prior fiscal year;
• Information regarding advisory fees paid to, and/or waived by, the Adviser for the prior fiscal years;
• Information regarding fees paid to the Adviser for the prior fiscal years and an evaluation of services provided per the Management Services Agreement;
• Performance information for prior periods;
• Comparative industry fee data;
• Information regarding the financial condition of the Adviser;
• Information regarding how the Adviser monitor the Fund's compliance with regulatory requirements and Trust procedures.
The Board considered that they had also received information relevant to their consideration throughout the year at regular Board meetings in connection with their oversight of the Fund, including information bearing on the Fund's service provider arrangements and performance results. In addition, the Board received a memorandum from counsel regarding its responsibilities with respect to the approval of the Agreement and participated in a question and answer session with representatives of the Adviser. The Board carefully evaluated the relevant information and the Independent Trustees were advised by legal counsel with respect to their deliberations.
The Board did not identify any particular information that was most relevant to its consideration to approve the Agreement, and each Trustee may have afforded different weight or importance to different factors. The Board considered, among other matters, the following factors to the extent applicable: (1) the nature, extent, and quality of the services provided; (2) the investment performance of the Fund; (3) the profitability of the Fund and the advisory business to the Adviser; (4) the extent to which economies of scale might be realized as the Fund grows; (5) whether fee levels reflect these economies of scale, if any, for the benefit of the Fund's shareholders; (6) comparisons of services and fees under other contracts entered into by the Adviser with comparable clients (such as institutional investors), if any; and (7) other benefits derived or anticipated to be derived and identified by Adviser from its relationship with the Fund.
DIREXION ANNUAL REPORT
23
Board Review of Investment Advisory Agreement (Unaudited)
Nature, Extent and Quality of Services Provided. The Board reviewed, among other things, the Adviser's business, assets under management, financial resources and capitalization, quality and quantity of personnel, experience, the variety and complexity of its investment strategies, brokerage practices, and the adequacy of its compliance systems and processes. The Board reviewed the scope of services to be provided by the Adviser under the Agreement and noted there would be no significant differences between the scope of services provided by the Adviser in the past year and those to be provided in the upcoming year. The Board also considered the Adviser's representation to the Board that it would continue to provide investment and related services that are of materially the same quality as the services that have been provided to the Fund in the past and that those services remain appropriate in scope and extent in light of the Fund's operations, the competitive landscape of the investment company business and investor needs. The Board focused on the quality of the Adviser's personnel and operations and the systems and processes required to manage the Fund effectively, and noted that these systems and processes may not be present at other investment advisers. In particular the Board considered: (1) the Adviser's success in achieving the Fund's investment objective; (2) information regarding the Adviser's management of derivatives trading on behalf of the Fund, including the selection of swap counterparties and the negotiation of favorable derivatives contract terms; (3) the Adviser's ability to manage the Fund in a tax efficient manner; and (4) the size, professional experience and skills of the Adviser's portfolio management staff and the Adviser's ability to recruit, train and retain personnel with the relevant experience and expertise necessary to manage the Fund. The Board considered that the Adviser oversees all aspects of the operation of the Fund, including oversight of the Fund's service providers, and provides compliance services to the Fund.
Comparison of Advisory Services and Fees. The Board considered the fairness and reasonableness of the investment advisory fee rate payable to the Adviser by the Fund in light of the investment advisory services provided by the Adviser. The Board further considered the fairness and reasonableness of the investment advisory fee rate payable to the Adviser by the Fund in light of fee rates paid by other investment companies offering strategies similar in nature to the Fund. In this regard, the Board reviewed information prepared by the Adviser, using data provided by Morningstar, Inc. ("Morningstar"), to compare the Fund's actual advisory fees, operating service fees, and gross and net total expenses with those of other funds with common key characteristics, such as asset size, investment objective or industry focus ("Peer Group"). The Board noted that an independent consultant reviewed the Peer Group selection methodology and the Peer Group for the Fund.
The Board noted that the comparison reports included the advisory fee and net and gross total expense ratios, less any Rule 12b-1 fees and shareholder services fees, for the Fund and each Peer Group fund. The Board considered that the Adviser had agreed to limit the total expenses of the Fund (subject to certain exclusions) for the next year by contractually agreeing to pay certain expenses of the Funds under a separate Operating Expense Limitation Agreement. The Board noted that the Fund's advisory fee rate and the net expense ratio, less Rule 12b-1 fees, were equal to, or less than, its Peer Group median and average.
Performance of the Fund. The Board noted that for the period ended June 30, 2019, the Fund outperformed its peers for the one-year and five-year periods but underperformed its peers for the remaining periods.
Costs of Services Provided to the Fund and Profits Realized by the Adviser. The Board reviewed information about the profitability of the Adviser based on the fee rates payable under the Agreement. This included a review of information regarding the direct revenue received by the Adviser and ancillary revenue, if any, received by the Adviser and/or its affiliates in connection with the services they provided to the Fund. The Board considered information regarding the Adviser's profit margin as reflected in the Adviser's profitability analysis, as well as information provided by the Adviser concerning the methodology used to allocate various expenses. The Board also considered the significant drivers of cost for the Adviser including, but not limited to, intellectual capital, regulatory compliance, and entrepreneurial risk. The Board further considered a report on other investment advisers' profitability, which was compiled using publicly available information. The Board recognized that it is difficult to compare profitability among investment advisory firms because certain information is not publicly available. Further, to the extent such information is available, it is affected by numerous factors, including the nature of a firm's fund shareholder base, the structure of the adviser and its tax status, the types of funds it manages, its business mix, assumptions regarding allocations and the reporting of operating profits and net income net (rather than gross) of distribution and marketing expenses.
DIREXION ANNUAL REPORT
24
Board Review of Investment Advisory Agreement (Unaudited)
Economies of Scale. The Board considered the absence of breakpoints in the Adviser's fee schedule and reviewed information regarding the extent to which economies of scale or other efficiencies may result from increases in the Fund's net assets. In light of the relatively small size of the Fund, the Board concluded that the Fund has not yet achieved sufficient asset levels to realize meaningful economies of scale. The Board noted that it will continue to monitor fees and expenses as the Fund grows in size and assess whether fee breakpoints may be warranted.
Other Benefits. The Board considered indirect and "fall-out" benefits that the Adviser or its affiliates may derive from their relationship to the Fund. Such benefits may include the Adviser's ability to leverage its investment management personnel or infrastructure to manage other accounts. In this regard, the Board noted that the Fund pays a management services fee to the Adviser pursuant to the Management Services Agreement.
Conclusion. Based on, but not limited to, the above considerations and determinations, the Board, including the Independent Trustees, determined that the Agreement for the Fund was fair and reasonable in light of the nature, extent and quality of the services to be performed, the fee rates to be paid, the Adviser's expenses and such other matters as the Board considered relevant in the exercise of its business judgment. Accordingly, the Board concluded that the continuation of the Agreement was in the best interests of the shareholders of the Fund. On this basis, the Board unanimously voted in favor of the renewal of the Agreement.
DIREXION ANNUAL REPORT
25
Trustees and Officers (Unaudited)
The business affairs of the Fund are managed by or under the direction of the Board of Trustees. Information pertaining to the Trustees and Officers of the Fund is set below. The report includes additional information about the Fund's Trustees and Officers and is available without charge, upon request by calling 1-800-851-0511.
Interested Trustee
Name, Address and
Age | | Position(s)
Held with
Fund | | Term of Office
and Length of
Time Served | | Principal Occupation(s)
During Past Five Years | | # of Portfolios
in Direxion
Family of
Investment
Companies
Overseen
by Trustee(2) | | Other Trusteeships/
Directorships Held by
Trustee During Past
Five Years | |
Daniel D. O'Neill(1)
Age: 51 | |
Chairman of the Board of Trustees | |
Lifetime of Trust until removal or resignation; Since 2014 | |
Managing Director of Rafferty Asset Management, LLC, January 1999 – January 2019; Direxion Advisors, LLC, November 2017 – January 2019. | |
142 | |
None. | |
Independent Trustees
Name, Address and
Age | | Position(s)
Held with
Fund | | Term of Office
and Length of
Time Served | | Principal Occupation(s)
During Past Five Years | | # of Portfolios
in Direxion
Family of
Investment
Companies
Overseen
by Trustee(2) | | Other Trusteeships/
Directorships Held by
Trustee During Past
Five Years | |
Gerald E. Shanley III
Age: 76 | |
Trustee | |
Lifetime of Trust until removal or resignation; Since 1997 | |
Retired, Since 2002; Business Consultant, 1985 – present; Trustee of Trust Under Will of Charles S. Payson, 1987 – present; C.P.A., 1979 – present. | |
142 | |
None. | |
John A. Weisser
Age: 78 | |
Trustee | |
Lifetime of Trust until removal or resignation; Since 2007 | |
Retired, since 1995; Salomon Brothers, Inc., 1971 – 1995, most recently as Managing Director. | |
142 | |
Director until December 2016, The MainStay Funds Trust, The MainStay Funds, MainStay VP Fund Series, Mainstay Defined Term Municipal Opportunities Fund; Private Advisors Alternative Strategy Fund; Private Advisors Alternative Strategies Master Fund. | |
(1) Mr. O'Neill is affiliated with Rafferty and Direxion. Mr. O'Neill owns a beneficial interest in Rafferty.
(2) The Direxion Family of Investment Companies consists of the Direxion Shares ETF Trust which, as of the date of this report, offers for sale to the public 90 of the 127 funds registered with the SEC, the Direxion Funds which, as of the date of this report, offers for sale to the public 15 funds registered with the SEC and the Direxion Insurance Trust which, as of the date of this report, does not have any funds registered with the SEC.
DIREXION ANNUAL REPORT
26
Trustees and Officers (Unaudited)
Name, Address and
Age | | Position(s)
Held with
Fund | | Term of Office
and Length of
Time Served | | Principal Occupation(s)
During Past Five Years | | # of Portfolios
in Direxion
Family of
Investment
Companies
Overseen
by Trustee(2) | | Other Trusteeships/
Directorships Held by
Trustee During Past
Five Years | |
David L. Driscoll
Age: 50 | |
Trustee | |
Lifetime of Trust until removal or resignation; Since 2014 | |
Partner, King Associates, LLP, since 2004; Board Advisor, University Common Real Estate, since 2012; Principal, Grey Oaks LLP since 2003; Member, Kendrick LLC, since 2006. | |
142 | |
None. | |
Jacob C. Gaffey
Age: 71 | |
Trustee | |
Lifetime of Trust until removal or resignation; Since 2014 | |
Managing Director of Loomis & Co. since 2012; Partner, Bay Capital Advisors, LLC 2008 – 2012. | |
142 | |
None. | |
Henry W. Mulholland
Age: 56 | |
Trustee | |
Lifetime of Trust until removal or resignation; Since 2017 | |
Grove Hill Partners LLC, since 2016 as Managing Partner; Bank of America Merrill Lynch, 1990 – 2015, most recently as Managing Director and Head of Equities for Americas. | |
142 | |
None. | |
(1) Mr. O'Neill is affiliated with Rafferty and Direxion. Mr. O'Neill owns a beneficial interest in Rafferty.
(2) The Direxion Family of Investment Companies consists of the Direxion Shares ETF Trust which, as of the date of this report, offers for sale to the public 90 of the 127 funds registered with the SEC, the Direxion Funds which, as of the date of this report, offers for sale to the public 15 funds registered with the SEC and the Direxion Insurance Trust which, as of the date of this report, does not have any funds registered with the SEC.
DIREXION ANNUAL REPORT
27
Trustees and Officers (Unaudited)
Principal Officers of the Trust
The officers of the Trust conduct and supervise its daily business. Unless otherwise noted, an individual's business address is 1301 Avenue of the Americas, 28th Floor, New York, New York 10019. As of the date of this report, the officers of the Trust, their ages, their business address and their principal occupations during the past five years are as follows:
Name, Address and
Age | | Position(s)
Held with
Fund | | Term of Office
and Length of
Time Served | | Principal Occupation(s)
During Past Five Years | | # of Portfolios
in the Direxion
Family of
Investment
Companies
Overseen
by Trustee(1) | | Other Trusteeships/
Directorships Held by
Trustee During Past
Five Years | |
Robert D. Nestor
Age: 50 | |
President | |
One Year; Since 2018 | |
President, Rafferty Asset Management, LLC and Direxion Advisors, LLC, since April 2018; Blackrock, Inc. (May 2007 – April 2018), most recently as Managing Director. | |
N/A | |
N/A | |
Patrick J. Rudnick
Age: 46 | |
Principal Executive Officer
Principal Financial Officer | |
One Year;
Since 2018
One Year;
Since 2010 | |
Senior Vice President, since March 2013, Rafferty Asset Management, LLC; Senior Vice President, since November 2017, Direxion Advisors, LLC. | |
N/A | |
N/A | |
Angela Brickl
Age: 43 | |
Chief Compliance Officer
Secretary | |
One Year;
Since 2018
One Year;
Since 2011 | |
General Counsel, Rafferty Asset Management LLC, since October 2010 and Direxion Advisors, LLC, since November 2017; Chief Compliance Officer, Rafferty Asset Management, LLC, since September 2012 and Direxion Advisors, LLC, since November 2017. | |
N/A | |
N/A | |
(1) The Direxion Family of Investment Companies consists of the Direxion Shares ETF Trust which, as of the date of this report, offers for sale to the public 90 of the 127 funds registered with the SEC, the Direxion Funds which, as of the date of this report, offers for sale to the public 15 funds registered with the SEC and the Direxion Insurance Trust which, as of the date of this report, does not have any funds registered with the SEC.
DIREXION ANNUAL REPORT
28

ANNUAL REPORT OCTOBER 31, 2019
1301 Avenue of the Americas (6th Ave.), 28th Floor New York, New York 10019 (800) 851-0511 www.direxioninvestments.com
Investment Adviser
Rafferty Asset Management, LLC
1301 Avenue of the Americas (6th Ave.), 28th Floor
New York, NY 10019
Administrator, Transfer Agent, Dividend Paying Agent & Shareholding Servicing Agent
U.S. Bancorp Fund Services, LLC
P.O. Box 1993
Milwaukee, WI 53201-1993
Custodian
U.S. Bank, N.A.
1555 RiverCenter Dr., Suite 302
Milwaukee, WI 53212
Independent Registered Public Accounting Firm
Ernst & Young LLP
220 South 6th Street
Minneapolis, MN 55402
Distributor
Rafferty Capital Markets, LLC
1010 Franklin Ave., 3rd Floor
Garden City, NY 11530
The Trust's Proxy Voting Policies are available without charge by calling 1-800-851-0511, or by accessing the SEC's website, at www.sec.gov.
The actual voting records relating to portfolio securities during the most recent period ended June 30 (starting with the year ended June 30, 2005) is available without charge by calling 1-800-851-0511 or by accessing the SEC's website at www.sec.gov.
The Trust files complete schedule of portfolio holdings with the SEC for its first and third fiscal quarters on Part F of Form N-PORT. The Funds' Part F of Form N-PORT (and Form N-Q prior to April 30, 2019) is available on the SEC's website at www.sec.gov.
This report has been prepared for shareholders and may be distributed to others only if preceded or accompanied by a current prospectus.
THIS PAGE INTENTIONALLY LEFT BLANK
30
At the Direxion Funds, we are committed to protecting your privacy. To open and service your Direxion accounts, we collect and maintain certain nonpublic personal information about you, such as your address, phone number, social security number, purchases, sales, account balances, bank account information and other personal financial information. We collect this information from the following sources:
• Account applications or other forms on which you provide information,
• Mail, e-mail, the telephone and our website, and
• Your transactions and account inquiries with us.
We safeguard the personal information that you have entrusted to us in the following ways:
• As a general policy, only those employees who maintain your account and respond to your requests for additional services have access to your account information.
• We maintain physical, electronic, and procedural safeguards to insure the security of your personal information and to prevent unauthorized access to your information.
We do not disclose any nonpublic personal information about you or our former shareholders to anyone, except as permitted or required by law. In the course of conducting business and maintaining your account we may share shareholder information, as allowed by law, with our affiliated companies and with other service providers, including financial intermediaries, custodians, transfer agents and marketing consultants. Those companies are contractually bound to use that information only for the services for which we hired them. They are not permitted to use or share our shareholders' nonpublic personal information for any other purpose. There also may be times when we provide information to federal, state or local authorities as required by law.
In the event that you hold fund shares of Direxion through a financial intermediary, including, but not limited to, a broker-dealer, bank, or trust company, the privacy policy of your financial intermediary would govern how your nonpublic personal information would be shared with nonaffiliated third parties.
For questions about our policy, please contact us at (800) 851-0511.
This page is not a part of the Annual Report.
DIREXION ANNUAL REPORT

Item 2. Code of Ethics.
The registrant has adopted a code of ethics that applies to the registrant’s principal executive officer and principal financial officer. The registrant has not made any amendments to its code of ethics during the period covered by this report. The registrant has not granted any waivers from any provisions of the code of ethics during the period covered by this report. A copy of the registrant’s Code of Ethics is filed herewith.
Item 3. Audit Committee Financial Expert.
The registrant’s board of trustees has determined that there is at least one audit committee financial expert serving on its audit committee. Gerald E. Shanley III is the “audit committee financial expert” and is considered to be “independent” as each term is defined in Item 3 of Form N-CSR.
Item 4. Principal Accountant Fees and Services.
The registrant has engaged its principal accountant to perform audit services, audit-related services, tax services and other services during the past fiscal year. “Audit services” refer to performing an audit of the registrant’s annual financial statements or services that are normally provided by the accountant in connection with statutory and regulatory filings or engagements for the fiscal year. “Audit-related services” refer to the assurance and related services by the principal accountant that are reasonably related to the performance of the audit. “Tax services” refer to professional services rendered by the principal accountant for tax compliance, tax advice, and tax planning, including assessment of ASC 740 for the Funds and additional tax research. There were no “Other services” provided by the principal accountant. The following table details the aggregate fees billed or expected to be billed for each of the last fiscal year for audit fees, audit-related fees, tax fees and other fees by the principal accountant. The table presents aggregate fees billed to the registrant and reflected in the financial statements of the report to shareholders.
| | FYE 10/31/2019 | | FYE 10/31/2018 | |
Audit Fees | | $ | 26,305 | | $ | 26,305 | |
Audit-Related Fees | | — | | — | |
Tax Fees | | 6,374 | | 12,500 | |
All Other Fees | | — | | — | |
| | | | | | | |
The audit committee has adopted pre-approval policies and procedures that require the audit committee to pre-approve all audit and non-audit services of the registrant, including services provided to any entity affiliated with the registrant.
The percentages of fees billed by Ernst & Young LLP applicable to non-audit services pursuant to waiver of pre-approval requirement were as follows:
| | FYE 10/31/2019 | | FYE 10/31/2018 | |
Audit-Related Fees | | 0 | % | 0 | % |
Tax Fees | | 0 | % | 0 | % |
All Other Fees | | 0 | % | 0 | % |
All of the principal accountant’s hours spent on auditing the registrant’s financial statements were attributed to work performed by full-time permanent employees of the principal accountant. (If more than 50 percent of the accountant’s hours were spent to audit the registrant’s financial statements for the fiscal year, state how many hours were attributed to work performed by persons other than the principal accountant’s full-time, permanent employees.)
The following table indicates the non-audit fees, other than the tax services as noted above, billed or expected to be billed by the registrant’s accountant for services to the registrant and to the registrant’s investment adviser (and any other controlling entity, etc.—not sub-adviser) for the last year. The audit committee of the board of trustees has considered whether the provision of non-audit services that were rendered to the registrant’s investment adviser is compatible with maintaining the principal accountant’s independence and has concluded that the provision of such non-audit services by the accountant has not compromised the accountant’s independence.
Non-Audit Related Fees | | FYE 10/31/2019 | | FYE 10/31/2018 | |
Registrant | | None | | None | |
Registrant’s Investment Adviser | | None | | None | |
Item 5. Audit Committee of Listed Registrants.
Not applicable to registrants who are not listed issuers (as defined in Rule 10A-3 under the Securities Exchange Act of 1934).
Item 6. Schedule of Investments.
Schedule of Investments is included as part of the report to shareholders filed under Item 1 of this Form.
Item 7. Disclosure of Proxy Voting Policies and Procedures for Closed-End Management Investment Companies.
Not applicable to open-end investment companies.
Item 8. Portfolio Managers of Closed-End Management Investment Companies.
Not applicable to open-end investment companies.
Item 9. Purchases of Equity Securities by Closed-End Management Investment Company and Affiliated Purchasers.
Not applicable to open-end investment companies.
Item 10. Submission of Matters to a Vote of Security Holders.
There have been no material changes to the procedures by which shareholders may recommend nominees to the registrant’s board of directors/trustees.
Item 11. Controls and Procedures.
(a) The Registrant’s President and Principal Financial Officer have reviewed the Registrant’s disclosure controls and procedures (as defined in Rule 30a-3(c) under the Investment Company Act of 1940 (the “Act”)) as of a date within 90 days of the filing of this report, as required by Rule 30a-3(b) under the Act and Rules 13a-15(b) or 15d-15(b) under the Securities Exchange Act of 1934. Based on their review, such officers have concluded that the disclosure controls and procedures are effective in ensuring that information required to be disclosed in this report is appropriately recorded, processed, summarized and reported and made known to them by others within the Registrant and by the Registrant’s service provider.
(b) There were no changes in the Registrant’s internal control over financial reporting (as defined in Rule 30a-3(d) under the Act) that occurred during the second fiscal half-year of the period covered by this report that has materially affected, or is reasonably likely to materially affect, the Registrant’s internal control over financial reporting.
Item 12. Disclosure of Securities Lending Activities for Closed-End Management Investment Companies.
Not applicable to open-end investment companies.
Item 13. Exhibits.
(a) (1) Any code of ethics or amendment thereto, that is subject of the disclosure required by Item 2, to the extent that the registrant intends to satisfy Item 2 requirements through filing an exhibit. Filed herewith.
(2) Certifications pursuant to Section 302 of the Sarbanes-Oxley Act of 2002. Filed herewith.
(3) Any written solicitation to purchase securities under Rule 23c-1 under the Act sent or given during the period covered by the report by or on behalf of the registrant to 10 or more persons. Not applicable to open-end investment companies.
(4) Change in the registrant’s independent public accountant. There was no change in the registrant’s independent public accountant for the period covered by this report.
(b) Certification pursuant to Section 906 of the Sarbanes-Oxley Act of 2002. Furnished herewith.
SIGNATURES
Pursuant to the requirements of the Securities Exchange Act of 1934 and the Investment Company Act of 1940, the registrant has duly caused this report to be signed on its behalf by the undersigned, thereunto duly authorized.
(Registrant) | Direxion Funds | |
| | |
By (Signature and Title) | /s/ | Patrick J. Rudnick | |
| | Patrick J. Rudnick, Principal Executive Officer | |
| | |
Date | 12/30/19 | |
| | | | | |
Pursuant to the requirements of the Securities Exchange Act of 1934 and the Investment Company Act of 1940, this report has been signed below by the following persons on behalf of the registrant and in the capacities and on the dates indicated.
By (Signature and Title) | /s/ | Patrick J. Rudnick | |
| | Patrick J. Rudnick, Principal Executive Officer | |
| | |
Date | 12/30/19 | |
| | |
By (Signature and Title) | /s/ | Patrick J. Rudnick | |
| | Patrick J. Rudnick, Principal Financial Officer | |
| | |
Date | 12/30/19 | |
| | | | |