UNITED STATES
SECURITIES AND EXCHANGE COMMISSION
Washington, D.C. 20549
FORM N-CSR
CERTIFIED SHAREHOLDER REPORT OF REGISTERED
MANAGEMENT INVESTMENT COMPANIES
Investment Company Act file number 811-08243
Direxion Funds
(Exact name of registrant as specified in charter)
1301 Avenue of the Americas (6th Ave.), 28th Floor
New York , NY 10019
(Address of principal executive offices) (Zip code)
1301 Avenue of the Americas (6th Ave.), 28th Floor
New York , NY 10019
(Address of agent for service)
1-800-851-0511
Registrant's telephone number, including area code
Date of fiscal year end: August 31, 2022
Date of reporting period: August 31, 2022
Item 1. Report to Stockholders.
(a)

DIREXION FUNDS
ANNUAL REPORT AUGUST 31, 2022
1301 Avenue of the Americas (6th Ave.), 28th Floor New York, New York 10019 www.direxioninvestments.com
1.2X BULL FUND
Direxion Monthly High Yield Bull 1.2X Fund (DXHYX)
1.25X BULL FUND
Direxion Monthly NASDAQ-100® Bull 1.25X Fund (DXNLX)
| 1.75X BULL FUNDS | | 1.75X BEAR FUNDS | |
Direxion Monthly NASDAQ-100® Bull 1.75X Fund (DXQLX)
(formerly Direxion Monthly NASDAQ-100® Bull 2X Fund (DXQLX)) | | | |
Direxion Monthly S&P 500® Bull 1.75X Fund (DXSLX)
(formerly Direxion Monthly S&P 500® Bull 2X Fund (DXSLX)) | | Direxion Monthly S&P 500® Bear 1.75X Fund (DXSSX)
(formerly Direxion Monthly S&P 500® Bear 2X Fund (DXSSX)) | |
Direxion Monthly Small Cap Bull 1.75X Fund (DXRLX)
(formerly Direxion Monthly Small Cap Bull 2X Fund (DXRLX)) | | Direxion Monthly Small Cap Bear 1.75X Fund (DXRSX)
(formerly Direxion Monthly Small Cap Bear 2X Fund (DXRSX)) | |
Direxion Monthly 7-10 Year Treasury Bull 1.75X Fund (DXKLX)
(formerly Direxion Monthly 7-10 Year Treasury Bull 2X Fund (DXKLX)) | | Direxion Monthly 7-10 Year Treasury Bear 1.75X Fund (DXKSX)
(formerly Direxion Monthly 7-10 Year Treasury Bear 2X Fund (DXKSX)) | |
You can find a Fund's prospectus, reports to shareholders, and other information about the Fund online at http://www.direxioninvestments.com/regulatory-documents. You can also get this information at no cost by calling (800) 851-0511 or by sending an email request to info@direxionfunds.com.
IMPORTANT NOTE: Beginning on January 1, 2021, as permitted by regulations adopted by the Securities and Exchange Commission, paper copies of the Funds' annual and semi-annual shareholder reports will no longer be sent by mail, unless you specifically request paper copies of the shareholder reports from your financial intermediary such as a broker-dealer or bank. Instead, annual and semi-annual shareholder reports will be available on a website, and you will be notified by mail each time a report is posted and provided with a website link to access the report.
You may elect to receive all future annual and semi-annual shareholder reports in paper, free of charge. To elect to continue receive paper copies of shareholder reports through the mail or to otherwise change your delivery method, contact your financial intermediary or follow the instructions included with this disclosure. Your election to receive shareholder reports in paper will apply to all funds that you hold through the financial intermediary. If you already elected to receive shareholder reports electronically, you will not be affected by this change and you need not take any action.
Letter to Shareholders (Unaudited) | | | 4 | | |
Performance Summary (Unaudited) | | | 10 | | |
| Expense Example (Unaudited) | | | 19 | | |
| Allocation of Portfolio Holdings (Unaudited) | | | 21 | | |
| Schedules of Investments | | | 22 | | |
| Statements of Assets and Liabilities | | | 31 | | |
| Statements of Operations | | | 34 | | |
| Statements of Changes in Net Assets | | | 37 | | |
| Financial Highlights | | | 42 | | |
| Notes to the Financial Statements | | | 44 | | |
Report of Independent Registered Public
Accounting Firm | | | 58 | | |
| Supplemental Information (Unaudited) | | | 59 | | |
Investment Advisory Agreement
Approval (Unaudited) | | | 62 | | |
| Trustees and Officers (Unaudited) | | | 65 | | |
Help Preserve the Environment – Go Green!
Go paperless with Direxion e-Delivery – a service allowing shareholders to reduce clutter with full online access to regulatory documents. Begin the preservation process with e-delivery.
With Direxion e-Delivery you can:
• Receive email notifications when your most recent shareholder communications are available for review.
• Access prospectuses, annual reports and semi-annual reports online.
It's easy to enroll:
1. Visit www.direxioninvestments.com/edelivery
2. Follow the simple enrollment instructions
If you have questions about Direxion e-Delivery services, contact one of our shareholder representatives at 800-851-0511.


Letter to Shareholders (Unaudited)
Dear Shareholders,
This Annual Report for the Direxion Monthly Leveraged Mutual Funds (each a "Fund" and collectively the "Funds") covers the period from September 1, 2021 to August 31, 2022 (the "Annual Period").
Market Review:
Signs of broad-based inflation began in the fall of 2021, leading to a steep drop in global equity markets in September. At the time, most experts predicted that inflation levels were transitory, quelling investor concerns temporarily. Equity markets began to pick up through December, ending the year on a high. However, it soon became clear the widespread inflation was not going anywhere and the Federal Reserve announced an acceleration of monetary policy that was implemented through a series of interest rate hikes to combat inflation, and it is unclear when these hikes will be reduced. Simultaneously, the highly contagious Covid-19 Omicron variant spread across the world and, despite high vaccination rates, breakthrough infections were at an all-time high. However, by the end of the Annual Period, Covid was far less of a concern for investors. Just as markets were looking up again, with the S&P 500 posting its first monthly gain in March 2022, Russia invaded Ukraine, and its effects rippled across equity markets, as energy prices surged and fears of wider-spread conflict grew. In response, the United States and other western nations imposed extreme economic sanctions on Russia. Markets were very volatile on the heels of the Russian invasion, and the first two quarters of 2022 saw a shrinking U.S. GDP. June earnings reports were surprisingly strong despite a mid-month S&P low. Despite these numbers, July was a strong month, but this positive sentiment did not last long. A hawkish speech from Federal Reserve Chair, Jerome Powell, in August negatively impacted markets around the world. Investors are pivoting towards more risk-off investments in an attempt to navigate historic inflation levels, geopolitical conflict and high interest rates, although traditional safe haven investments, such as commodities, are less appealing than they have been in the past.
The U.S. bond market was in consistent decline for the majority of the Annual Period, oftentimes diverging from trends in the equities markets. September saw increases in intermediate and long-term yields, with treasuries and international bonds experiencing the worst performance as concerns over rising interest rates and inflation began. As inflation worsened and proved to be less transitory than initially predicted, central banks around the world pivoted towards more hawkish policies. In December, the Federal Reserve announced there would be three to four rate hikes throughout 2022, as well as a tapering of U.S. treasury asset purchases. In late February, the Russian invasion of Ukraine rippled through the global financial system, including fixed income markets. The U.S. Treasury yield curve started to flatten as the 10 - 20 year bond spread grew. By the end of the Annual Period, the yield curve was inverted as U.S. Treasury rates moved higher, especially for shorter term bonds. While bonds have typically been considered a way to hedge a portfolio against equities, this strategy does not hold true in the current market environment for the most part.
Factors Affecting Direxion Fund Performance:
Benchmark Performance: The calendar month performance of each Fund's underlying index, and the factors and market conditions implicitly affecting that index, are the primary factors driving Fund performance. Given the Funds' calendar month investment objective, the Funds' calendar month index returns are most important. The market conditions affecting the Funds' underlying indexes during the past year are described below.
Leverage: Each Fund seeks calendar month investment results (before fees and expenses) of either 120%, 125% or 175% (for the Bull Funds) or -175% (for the Bear Funds) of the performance of its respective underlying index. The use of leverage magnifies a Fund's gains or losses and increases the investment's risk and volatility.
Volatility and Compounding: A leveraged Fund's investment objective is to provide a multiple, or inverse multiple, of the calendar month returns of an underlying index. Over periods longer or shorter than a calendar month, a Fund should not be expected to provide its respective multiple of the return of the underlying index. Due to the effects of compounding – a universal mathematical concept that applies to all leveraged investments – returns of the Funds over longer periods will
DIREXION ANNUAL REPORT
4
differ from the Funds' calendar month stated investment objective. Periods of high-volatility lacking a clear trend hurt a Fund's performance, while trending low-volatility markets should enhance a Fund's performance.
Cost of Financing: In order to attain leveraged exposure, a Bull Fund incurs a cost of SOFR1 plus or minus a spread, and a Bear Fund receives SOFR plus or minus a spread as applied to the borrowed portion of the Fund's exposure. Financing costs create a drag on a Bull Fund's performance. Because SOFR is very low, a Bear Fund receives a negligible amount of financing, or in the case of hard-to-borrow shares, might pay to finance its short position.
Equity Dividends: A Bull Fund's performance is positively impacted by equity and index dividends, as the Funds receive those payments. A Bear Fund's performance is negatively impacted, as they are obligated to pay the dividends.
Fees, Expenses, and Transaction Costs: Fees and expenses are listed in each Fund's prospectus and may be larger than many traditional index funds' fees, causing a greater negative impact on Fund performance. Transaction costs are not included in the expense ratio of the Funds. Transaction costs can be higher due to a Fund's use of leverage, significant purchase and redemption activity by Fund shareholders, or trading securities that are comparatively less liquid.
Fund Operational Review:
The Funds are leveraged and seek to provide a calendar month return of 120%, 125%, 175% or -175% of the calendar month performance of a particular underlying index. The term "calendar month" refers to the period from the close of the markets on the last business day of a given calendar month, until the close of the markets on the last business day of the subsequent calendar month. The Funds seek calendar month leveraged investment results which should not be equated with seeking a leveraged goal for shorter than a calendar month. An investor who purchases shares on a day other than the last business day of a calendar month will generally receive more, or less, than the target exposure to the underlying index, depending on the performance of the underlying index. If a Fund's shares are held through the end of a calendar month or months, the Fund's performance is likely to deviate from the multiple of the underlying index performance for the longer period. Similarly, the return for investors investing for periods less than a calendar month, or for a period different than one calendar month, will likely deviate from the multiple of the underlying index performance for such shorter periods. The Funds are not suitable for all investors and should be utilized only by sophisticated investors who understand the risks associated with the use of leverage, the consequences of seeking calendar month leveraged investment results, for a Bear Fund, understand the risks of shorting, and intend to actively monitor and manage their investments.
The Funds with the word "Bull" in their name attempt to provide investment results that correlate to 120%, 125% or 175% of the return of an underlying index, meaning the Bull Funds attempt to move in the same direction as the underlying index. The Funds with the word "Bear" in their name attempt to provide investment results that correlate to -175% of the return of an underlying index, meaning that Bear Funds attempt to move in the opposite or inverse direction of the underlying index.
In seeking to achieve each Fund's calendar month investment objective, Rafferty Asset Management ("Rafferty" or the "Adviser"), uses a statistical and quantitative analysis to determine each Fund's investments and the techniques to employ. Rafferty relies upon a pre-determined model to determine the appropriate repositioning of each Fund's investments in accordance with its calendar month investment objective. Using this analysis, Rafferty determines the type, quantity and mix of investment positions it believes in combination should produce calendar month returns consistent with a Fund's investment objective. In general, if a Fund is performing as designed, the return of the underlying index will dictate the return for that Fund. Generally, each Fund pursues its investment objective regardless of market conditions and does not take defensive positions.
Each Fund has a clearly articulated goal which requires the Fund to seek economic exposure in excess of its net assets. Therefore, each Fund invests in some combination of financial instruments that provide economic exposure consistent with
1 Secured Overnight Financing Rate (SOFR): benchmark interest rate for dollar-denominated derivatives and loans that is replacing the London interbank offered rate (LIBOR). SOFR is based on transactions in the Treasury repurchase market and is seen as preferable to LIBOR since it is based on data from observable transactions rather than on estimated borrowing rates.
DIREXION ANNUAL REPORT
5
the Fund's investment objective. Financial instruments may include swap agreements, exchange-traded funds ("ETFs"), swaps on ETFs, futures contracts, forward contracts, reverse repurchase agreements, options, and other financial instruments. Each Fund invests significantly in swap agreements. Rafferty uses these types of investments to produce economically "leveraged" investment results. Leveraging allows Rafferty to generate a greater positive or negative return than what would be generated on the invested capital without leverage, thus changing small market movements into larger changes in the value of the investments of a Fund.
Each Fund's investments in derivatives may pose risks in addition to, and greater than, those associated with directly investing in securities or other investments, including risk related to the market, leverage, imperfect monthly correlations with underlying investments or a Fund's other portfolio holdings, higher price volatility, lack of availability, counterparty risk, liquidity, valuation and legal restrictions. The use of derivatives is a highly specialized activity that involves investment techniques and risks different from those associated with ordinary portfolio securities transactions. The use of derivatives may result in larger losses or smaller gains than directly investing in, or shorting, securities. When a Fund uses derivatives, there may be imperfect correlation between the value of the reference assets and the derivative, which may prevent the Fund from achieving its investment objective. Because derivatives often require only a limited initial investment, the use of derivatives may expose the Fund to losses in excess of those amounts initially invested.
Each Fund may use a combination of swaps on its respective underlying index and swaps on an ETF whose investment objective is to track the performance of the same, or a substantially similar index to achieve its investment objective. The reference ETF may not closely track the performance of the underlying index due to fees and other costs borne by the ETF and other factors. Thus, to the extent that a Fund invests in swaps that use an ETF as a reference asset, the Fund may be subject to greater correlation risk and may not achieve as high a degree of correlation with the underlying index as it would if the Fund used swaps that utilized the underlying index as the reference asset. Any financing, borrowing or other costs associated with using derivatives may also reduce the Fund's return.
The discussion below relates to the performance of the Funds for their respective period. The Funds seek to provide calendar month returns which are a multiple – positive or negative – of the calendar month performance of a particular underlying index. The performance of the Funds for their respective period is important for understanding whether these Funds meet their investment objectives. A Fund meeting its calendar month investment objective should have performance for the period similar to the performance indicated by models based on the calendar month returns of the relevant underlying index for the period. A brief comparison of the actual returns versus the expected returns for each of the Funds in this Annual Report follows.
Fund Performance Review:
The Direxion Monthly High Yield Bull 1.2X Fund seeks to provide 120% of the calendar month return of the Solactive High Yield Beta Index. The Solactive High Yield Beta Index is a rules-based, systematic strategy index that provides exposure to an equal-weighted portfolio of three high-yield ETFs. The allocation to each U.S. High Yield Corporate Bond ETF is adjusted on a monthly basis. The index is calculated and distributed by Solactive AG and is calculated and published in U.S. Dollars. For the Annual Period, the Solactive High Yield Beta Index returned -10.12%. Given the calendar month investment objectives of the Fund and the path dependency of returns for longer periods, the return of the index alone should not generate expectations of performance of the Fund. The Direxion Monthly High Yield Bull 1.2X Fund returned -14.45%, while the model indicated an expected return of -12.16%.
The Direxion Monthly NASDAQ-100® Bull 1.25X Fund seeks to provide 125% of the calendar month return of the NASDAQ-100® Index. The NASDAQ-100® Index includes 100 of the largest domestic and international non-financial companies listed on the NASDAQ Stock Market® based on market capitalization. All companies listed on the index have an average daily trading volume of at least 200,000 shares. For the Annual Period, the NASDAQ-100® Index returned -20.63%. Given the calendar month investment objectives of the Fund and the path dependency of returns for longer periods, the return of the index alone should not generate expectations of performance of the Fund. The Direxion Monthly NASDAQ-100® Bull 1.25X Fund returned -27.50%, while the model indicated an expected return of -25.90%.
DIREXION ANNUAL REPORT
6
Prior to August 1, 2022, the Direxion Monthly NASDAQ-100® Bull 1.75X Fund pursued an investment objective which sought to provide 200% of the calendar month return of the NASDAQ-100® Index, under the prior name of the Direxion Monthly NASDAQ-100® Bull 2X Fund. The NASDAQ-100® Index includes 100 of the largest domestic and international non-financial companies listed on the NASDAQ Stock Market® based on market capitalization. All companies listed on the index have an average daily trading volume of at least 200,000 shares. From September 1, 2021 until July 31, 2022, the NASDAQ-100® Index returned -16.36%. Given the calendar month investment objectives of the Fund and the path dependency of returns for longer periods, the return of the index alone should not generate expectations of performance of the Fund. During this period, the Direxion Monthly NASDAQ-100® Bull 1.75X Fund returned -36.44%, while the model indicated an expected return of -34.68%. From August 1, 2022 until August 31, 2022, the NASDAQ-100® Index returned -5.11%. Given the calendar month investment objectives of the Fund and the path dependency of returns for longer periods, the return of the index alone should not generate expectations of performance of the Fund. During this period, the Direxion Monthly NASDAQ-100® Bull 1.75X Fund returned -9.29%, while the model indicated an expected return of -8.94%.
Prior to August 1, 2022, the Direxion Monthly S&P 500® Bull 1.75X Fund and the Direxion Monthly S&P 500® Bear 1.75X Fund sought to provide 200% and -200% of the calendar month return of the S&P 500® Index, respectively, under the prior names of the Direxion Monthly S&P 500® Bull 2X Fund and the Direxion Monthly S&P 500® Bear 2X Fund. Standard & Poor's® selects the stocks comprising the S&P 500® Index on the basis of market capitalization, financial viability of the company and the public float, liquidity and price of a company's shares outstanding. The index is a float-adjusted, market capitalization-weighted index. From September 1, 2021 until July 31, 2022, the S&P 500® Index returned -7.45%. Given the calendar month investment objectives of the Funds and the path dependency of returns for longer periods, the return of the index alone should not generate expectations of performance of the Funds. During this period, the Direxion Monthly S&P 500® Bull 1.75X Fund returned -19.79%, while the model indicated an expected return of -17.56%. The Direxion Monthly S&P 500® Bear 1.75X Fund returned 4.44%, while the model indicated an expected return of 4.43%. From August 1, 2022 until August 31, 2022, the S&P 500® Index returned -4.08%. Given the calendar month investment objectives of the Funds and the path dependency of returns for longer periods, the return of the index alone should not generate expectations of performance of the Funds. The Direxion Monthly S&P 500® Bull 1.75X Fund returned -7.48%, while the model indicated an expected return of -7.14%. The Direxion Monthly S&P 500® Bear 1.75X Fund returned 7.62%, while the model indicated an expected return of 7.14%.
Prior to August 1, 2022, the Direxion Monthly Small Cap Bull 1.75X Fund and the Direxion Monthly Small Cap Bear 1.75X Fund sought to provide 200% and -200% of the calendar month return of the Russell 2000® Index, respectively, under the prior names of the Direxion Monthly Small Cap Bull 2X Fund and the Direxion Monthly Small Cap Bear 2X Fund. The Russell 2000® Index measures the performance of approximately 2,000 small-capitalization companies in the Russell 3000® Index, based on a combination of their market capitalization and current index membership. From September 1, 2021 until July 31, 2022, the Russell 2000® Index returned -16.17%. Given the calendar month investment objectives of the Funds and the path dependency of returns for longer periods, the return of the index alone should not generate expectations of annual performance of the Funds. During this period, the Direxion Monthly Small Cap Bull 1.75X Fund returned -34.65%, while the model indicated an expected return of -32.87%. The Direxion Monthly Small Cap Bear 1.75X Fund returned 24.79%, while the model indicated an expected return of 25.60%. From August 1, 2022 until August 31, 2022, the Russell 2000® Index returned -2.05%. Given the calendar month investment objectives of the Funds and the path dependency of returns for longer periods, the return of the index alone should not generate expectations of performance of the Funds. The Direxion Monthly Small Cap Bull 1.75X Fund returned -3.86%, while the model indicated an expected return of -3.58%. The Direxion Monthly Small Cap Bear 1.75X Fund returned 4.03%, while the model indicated an expected return of 3.58%.
Prior to August 1, 2022, the Direxion Monthly 7-10 Year Treasury Bull 1.75X Fund and the Direxion Monthly 7-10 Year Treasury Bear 1.75X Fund sought to provide 200% and -200% of the calendar month return of the ICE U.S. Treasury 7-10 Year Bond Index, respectively, under the prior names of the Direxion Monthly 7-10 Year Treasury Bull 2X Fund and the Direxion Monthly 7-10 Year Treasury Bear 2X Fund. The ICE U.S. Treasury 7-10 Year Bond Index is a market value weighted index that includes publicly issued U.S. Treasury securities that have a remaining maturity of greater than seven years and less than or equal to ten years. Eligible securities must be fixed rate, denominated in U.S. Dollars, and have $300 million or more of outstanding face value, excluding amounts held by the Federal Reserve. Securities excluded from the index are
DIREXION ANNUAL REPORT
7
zero-coupon STRIPS, inflation-linked securities, floating-rate notes, cash management and Treasury bills, and any government agency debt that is issued with or without a government guarantee. From September 1, 2021 until July 31, 2022, the ICE U.S. Treasury 7-10 Year Bond Index returned -9.20%. Given the calendar month investment objectives of the Funds and the path dependency of returns for longer periods, the return of the index alone should not generate expectations of performance of the Funds. During this period, the Direxion Monthly 7-10 Year Treasury Bull 1.75X Fund returned -20.08%, while the model indicated an expected return of -18.01%. The Direxion Monthly 7-10 Year Treasury Bear 1.75X Fund returned 18.96%, while the model indicated an expected return of 19.38%. From August 1, 2022 until August 31, 2022, the ICE U.S. Treasury 7-10 Year Bond Index returned -3.83%. Given the calendar month investment objectives of the Funds and the path dependency of returns for longer periods, the return of the index alone should not generate expectations of performance of the Funds. The Direxion Monthly 7-10 Year Treasury Bull 1.75X Fund returned -7.09%, while the model indicated an expected return of -6.72%. The Direxion Monthly 7-10 Year Treasury Bear 1.75X Fund returned 6.97%, while the model indicated an expected return of 6.72%.
Index Volatility:
The Annual Period was extremely volatile, leaving investors without a clear strategy and there was no clear sector winner. Typically defensive stocks were not immune to the volatility, and the market cycles were moving unpredictably. The VIX Index, a measure of volatility and market sentiment, averaged 23.57 during the Annual Period, with a high of 36.45 in early March 2022, whereas the average for the previous five years was 20.32.
Index | | Return | | Volatility | |
Solactive High Yield Beta Index | | | -10.12 | % | | | 9.37 | % | |
NASDAQ-100® Index1 | | | -20.63 | % | | | 28.93 | % | |
NASDAQ-100® Index2 | | | -16.36 | % | | | 29.29 | % | |
NASDAQ-100® Index3 | | | -5.11 | % | | | 25.59 | % | |
S&P 500® Index2 | | | -7.45 | % | | | 21.25 | % | |
S&P 500® Index3 | | | -4.08 | % | | | 19.44 | % | |
Russell 2000® Index2 | | | -16.17 | % | | | 26.14 | % | |
Russell 2000® Index3 | | | -2.05 | % | | | 23.62 | % | |
ICE U.S. Treasury 7-10 Year Bond Index2 | | | -9.20 | % | | | 8.37 | % | |
ICE U.S. Treasury 7-10 Year Bond Index3 | | | -3.83 | % | | | 9.49 | % | |
1 September 1, 2021 through August 31, 2022
2 September 1, 2021 through July 31, 2022
3 August 1, 2022 through August 31, 2022
As always, we thank you for using the Direxion Funds and we look forward to our mutual success.
Regards,

| | 
| |
Patrick Rudnick | | Corey Noltner | |
Principal Executive Officer | | Principal Financial Officer | |
DIREXION ANNUAL REPORT
8
Investing in the Direxion Funds may be more volatile than investing in broadly diversified funds. The use of leverage by a Fund increases the risk to the Fund. The Direxion Funds are not suitable for all investors and should be utilized only by sophisticated investors who understand leverage risk, consequences of seeking monthly leveraged, or monthly inverse leveraged, investment results and intend to actively monitor and manage their investment. The Direxion Funds are not designed to track their respective underlying indices over a period of time longer than one calendar month.
An investment in each Fund involves risk, including the possible loss of principal. Each Fund is non-diversified and includes risks associated with concentration which results from a Fund's investment in a particular industry, sector, or geographic region, which can result in increased volatility. The use of derivatives such as futures contracts and swaps are subject to market risks that may cause their price to fluctuate over time. Each Fund does not attempt to, and should not be expected to, provide returns which are a multiple, or inverse multiple, of the return of its underlying index for periods other than a full calendar month. For other risks including correlation, compounding, market volatility and specific risks regarding each sector, please read the prospectus. An investment in any of the Direxion Funds is subject to a number of risks that could affect the value of its shares. It is important that investors closely review and understand these risks before making an investment.
Distributed by: Foreside Fund Services, LLC
DIREXION ANNUAL REPORT
9
Direxion Monthly High Yield Bull 1.2X Fund
Performance Summary (Unaudited)
February 17, 20161 - August 31, 2022
Investment Objective: Seeks monthly investment results, before fees and expenses, of 120% of the price performance of the Solactive High Yield Beta Index.

| | | Average Annual Total Return2 | |
| | | 1 Year | | 3 Years | | 5 Years | | Since Inception | |
Direxion Monthly High Yield
Bull 1.2X Fund | | | -14.45 | % | | | -2.68 | % | | | -0.41 | % | | | 3.51 | % | |
Solactive High Yield Beta Index | | | -10.12 | % | | | -0.15 | % | | | 1.59 | % | | | 4.75 | % | |
The Fund seeks calendar month leveraged investment results, which should not be equated with seeking a leveraged goal for shorter than a calendar month. An investor who purchases shares on a day other than the last business day of the calendar month will generally receive more, or less, than 120% exposure to its index. Other factors such as fees and expenses, high portfolio turnover, transaction costs, significant purchases and redemption activity by Fund shareholders and/or a temporary lack of liquidity in the markets for the securities held by the Fund may also cause the Fund's investment results to vary from its stated objective.
This chart illustrates the performance of a hypothetical $10,000 investment made on the Fund's inception, and is not intended to imply any future performance. The returns shown do not reflect the deduction of taxes that a shareholder would pay on fund distributions or the redemption of fund shares. The performance of the Solactive High Yield Beta Index does not reflect the deduction of fees associated with a mutual fund, such as investment management fees. Investors cannot invest directly in an index, although they can invest in its underlying securities.
The performance data quoted represents past performance. Past performance does not guarantee future results. The investment return and principal value of an investment will fluctuate. An investor's shares, when redeemed, may be worth more or less than their original cost. Current performance may be lower or higher than the performance quoted. Returns for performance under one year are cumulative, not annualized. The gross expense ratio, per the prospectus dated December 29, 2021 is 1.71%.
Market Exposure
The Fund seeks exposure of 120% of its NAV through a combination of equities and derivatives. "Market Exposure" includes the value of total investments (including the contract value of any derivatives) and excludes any short-term investments and cash equivalents divided by Net Assets.
1 Commencement of operations.
2 As of August 31, 2022.
DIREXION ANNUAL REPORT
10
Direxion Monthly NASDAQ-100® Bull 1.25X Fund
Performance Summary (Unaudited)
March 31, 20161 - August 31, 2022
Investment Objective: Seeks monthly investment results, before fees and expenses, of 125% of the price performance of the NASDAQ-100® Index.

| | | Average Annual Total Return2 | |
| | | 1 Year | | 3 Years | | 5 Years | | Since Inception | |
Direxion Monthly NASDAQ-100®
Bull 1.25X Fund | | | -27.50 | % | | | 18.96 | % | | | 17.16 | % | | | 19.58 | % | |
NASDAQ-100® Index | | | -20.63 | % | | | 17.82 | % | | | 16.50 | % | | | 18.15 | % | |
The Fund seeks calendar month leveraged investment results, which should not be equated with seeking a leveraged goal for shorter than a calendar month. An investor who purchases shares on a day other than the last business day of a calendar month will generally receive more, or less, than 125% exposure to the target index. Other factors such as fees and expenses, high portfolio turnover, transaction costs, significant purchases and redemption activity by Fund shareholders and/or a temporary lack of liquidity in the markets for the securities held by the Fund may also cause the Fund's investment results to vary from its stated objective.
This chart illustrates the performance of a hypothetical $10,000 investment made at the Fund's inception, and is not intended to imply any future performance. The returns shown do not reflect the deduction of taxes that a shareholder would pay on fund distributions or the redemption of fund shares. The performance of the NASDAQ-100® Index does not reflect the deduction of fees associated with a mutual fund, such as investment management fees. Investors cannot invest directly in an index, although they can invest in its underlying securities. During the period shown, Rafferty Asset Management, LLC waived and/or reimbursed fees for various expenses. Had these waivers and/or reimbursements not been in effect, performance would have been lower.
The performance data quoted represents past performance. Past performance does not guarantee future results. The investment return and principal value of an investment will fluctuate. An investor's shares, when redeemed, may be worth more or less than their original cost. Current performance may be lower or higher than the performance quoted. Returns for performance under one year are cumulative, not annualized. The gross expense ratio, per the prospectus dated December 29, 2021 is 1.52%.
Market Exposure
The Fund seeks exposure of 125% of its NAV through a combination of equities and derivatives. "Market Exposure" includes the value of total investments (including the contract value of any derivatives) and excludes any short-term investments and cash equivalents divided by Net Assets.
1 Commencement of operations.
2 As of August 31, 2022.
DIREXION ANNUAL REPORT
11
Direxion Monthly NASDAQ-100® Bull 1.75X Fund
Performance Summary (Unaudited)
September 1, 2012 - August 31, 2022
Investment Objective: Seeks monthly investment results, before fees and expenses, of 175% of the price performance of the NASDAQ-100® Index.

| | | Average Annual Total Return1 | |
| | | 1 Year | | 3 Years | | 5 Years | | 10 Years | |
Direxion Monthly NASDAQ-100®
Bull 1.75X Fund | | | -42.34 | % | | | 28.47 | % | | | 25.54 | % | | | 29.68 | % | |
NASDAQ-100® Index | | | -20.63 | % | | | 17.82 | % | | | 16.50 | % | | | 17.33 | % | |
The Fund seeks calendar month leveraged investment results, which should not be equated with seeking a leveraged goal for shorter than a calendar month. An investor who purchases shares on a day other than the last business day of the calendar month will generally receive more, or less, than 175% exposure to its index. Other factors such as fees and expenses, high portfolio turnover, transaction costs, significant purchases and redemption activity by Fund shareholders and/or a temporary lack of liquidity in the markets for the securities held by the Fund may also cause the Fund's investment results to vary from its stated objective.
This chart illustrates the performance of a hypothetical $10,000 investment made ten years ago, and is not intended to imply any future performance. The returns shown do not reflect the deduction of taxes that a shareholder would pay on fund distributions or the redemption of fund shares. The performance of the NASDAQ-100® Index does not reflect the deduction of fees associated with a mutual fund, such as investment management fees. Investors cannot invest directly in an index, although they can invest in its underlying securities. During the period shown, Rafferty Asset Management, LLC waived and/or reimbursed fees for various expenses. Had these waivers and/or reimbursements not been in effect, performance would have been lower.
The performance data quoted represents past performance. Past performance does not guarantee future results. The investment return and principal value of an investment will fluctuate. An investor's shares, when redeemed, may be worth more or less than their original cost. Current performance may be lower or higher than the performance quoted. Returns for performance under one year are cumulative, not annualized. The gross expense ratio, per the prospectus dated December 29, 2021 is 1.40%.
Market Exposure
The Fund seeks exposure of 175% of its NAV through a combination of equities and derivatives. "Market Exposure" includes the value of total investments (including the contract value of any derivatives) and excludes any short-term investments and cash equivalents divided by Net Assets.
1 As of August 31, 2022.
DIREXION ANNUAL REPORT
12
Direxion Monthly S&P 500® Bull 1.75X Fund
Performance Summary (Unaudited)
September 1, 2012 - August 31, 2022
Investment Objective: Seeks monthly investment results, before fees and expenses, of 175% of the price performance of the S&P 500® Index.

| | | Average Annual Total Return1 | |
| | | 1 Year | | 3 Years | | 5 Years | | 10 Years | |
Direxion Monthly S&P 500®
Bull 1.75X Fund | | | -25.79 | % | | | 18.33 | % | | | 16.98 | % | | | 21.51 | % | |
S&P 500® Index | | | -11.23 | % | | | 12.39 | % | | | 11.82 | % | | | 13.08 | % | |
The Fund seeks calendar month leveraged investment results, which should not be equated with seeking a leveraged goal for shorter than a calendar month. An investor who purchases shares on a day other than the last business day of the calendar month will generally receive more, or less, than 175% exposure to its index. Other factors such as fees and expenses, high portfolio turnover, transaction costs, significant purchases and redemption activity by Fund shareholders and/or a temporary lack of liquidity in the markets for the securities held by the Fund may also cause the Fund's investment results to vary from its stated objective.
This chart illustrates the performance of a hypothetical $10,000 investment made ten years ago, and is not intended to imply any future performance. The returns shown do not reflect the deduction of taxes that a shareholder would pay on fund distributions or the redemption of fund shares. The performance of the S&P 500® Index does not reflect the deduction of fees associated with a mutual fund, such as investment management fee. Investors cannot invest directly in an index, although they can invest in its underlying securities. During the period shown, Rafferty Asset Management, LLC waived and/or reimbursed fees for various expenses. Had these waivers and/or reimbursements not been in effect, performance would have been lower.
The performance data quoted represents past performance. Past performance does not guarantee future results. The investment return and principal value of an investment will fluctuate. An investor's shares, when redeemed, may be worth more or less than their original cost. Current performance may be lower or higher than the performance quoted. Returns for performance under one year are cumulative, not annualized. The gross expense ratio, per the prospectus dated December 29, 2021 is 1.38%.
Market Exposure
The Fund seeks exposure of 175% of its NAV through a combination of equities and derivatives. "Market Exposure" includes the value of total investments (including the contract value of any derivatives) and excludes any short-term investments and cash equivalents divided by Net Assets.
1 As of August 31, 2022.
DIREXION ANNUAL REPORT
13
Direxion Monthly S&P 500® Bear 1.75X Fund
Performance Summary (Unaudited)
September 1, 2012 - August 31, 2022
Investment Objective: Seeks monthly investment results, before fees and expenses, of 175% of the inverse of the price performance of the S&P 500® Index.

| | | Average Annual Total Return1 | |
| | | 1 Year | | 3 Years | | 5 Years | | 10 Years | |
Direxion Monthly S&P 500®
Bear 1.75X Fund | | | 12.40 | % | | | -29.39 | % | | | -25.86 | % | | | -26.29 | % | |
S&P 500® Index | | | -11.23 | % | | | 12.39 | % | | | 11.82 | % | | | 13.08 | % | |
The Fund seeks calendar month leveraged investment results, which should not be equated with seeking a leveraged goal for shorter than a calendar month. An investor who purchases shares on a day other than the last business day of the calendar month will generally receive more, or less, than -175% exposure to its index. Other factors such as fees and expenses, high portfolio turnover, transaction costs, significant purchases and redemption activity by Fund shareholders and/or a temporary lack of liquidity in the markets for the securities held by the Fund may also cause the Fund's investment results to vary from its stated objective.
This chart illustrates the performance of a hypothetical $10,000 investment made ten years ago, and is not intended to imply any future performance. The returns shown do not reflect the deduction of taxes that a shareholder would pay on fund distributions or the redemption of fund shares. The performance of the S&P 500® Index does not reflect the deduction of fees associated with a mutual fund, such as investment management fee. Investors cannot invest directly in an index, although they can invest in its underlying securities. During the period shown, Rafferty Asset Management, LLC waived and/or reimbursed fees for various expenses. Had these waivers and/or reimbursements not been in effect, performance would have been lower.
The performance data quoted represents past performance. Past performance does not guarantee future results. The investment return and principal value of an investment will fluctuate. An investor's shares, when redeemed, may be worth more or less than their original cost. Current performance may be lower or higher than the performance quoted. Returns for performance under one year are cumulative, not annualized. The gross expense ratio, per the prospectus dated December 29, 2021 is 1.99%.
Market Exposure
The Fund seeks exposure of -175% of its NAV through derivatives. "Market Exposure" includes the value of total investments (including the contract value of any derivatives) and excludes any short-term investments and cash equivalents divided by Net Assets.
1 As of August 31, 2022.
DIREXION ANNUAL REPORT
14
Direxion Monthly Small Cap Bull 1.75X Fund
Performance Summary (Unaudited)
September 1, 2012 - August 31, 2022
Investment Objective: Seeks monthly investment results, before fees and expenses, of 175% of the price performance of the Russell 2000® Index.

| | | Average Annual Total Return1 | |
| | | 1 Year | | 3 Years | | 5 Years | | 10 Years | |
Direxion Monthly Small Cap
Bull 1.75X Fund | | | -37.17 | % | | | 7.20 | % | | | 4.64 | % | | | 13.67 | % | |
Russell 2000® Index | | | -17.88 | % | | | 8.59 | % | | | 6.95 | % | | | 10.01 | % | |
The Fund seeks calendar month leveraged investment results, which should not be equated with seeking a leveraged goal for shorter than a calendar month. An investor who purchases shares on a day other than the last business day of the calendar month will generally receive more, or less, than 175% exposure to its index. Other factors such as fees and expenses, high portfolio turnover, transaction costs, significant purchases and redemption activity by Fund shareholders and/or a temporary lack of liquidity in the markets for the securities held by the Fund may also cause the Fund's investment results to vary from its stated objective.
This chart illustrates the performance of a hypothetical $10,000 investment made ten years ago, and is not intended to imply any future performance. The returns shown do not reflect the deduction of taxes that a shareholder would pay on fund distributions or the redemption of fund shares. The performance of the Russell 2000® Index does not reflect the deduction of fees associated with a mutual fund, such as investment management fees. Investors cannot invest directly in an index, although they can invest in its underlying securities. During the period shown, Rafferty Asset Management, LLC waived and/or reimbursed fees for various expenses. Had these waivers and/or reimbursements not been in effect, performance would have been lower.
The performance data quoted represents past performance. Past performance does not guarantee future results. The investment return and principal value of an investment will fluctuate. An investor's shares, when redeemed, may be worth more or less than their original cost. Current performance may be lower or higher than the performance quoted. Returns for performance under one year are cumulative, not annualized. The gross expense ratio, per the prospectus dated December 29, 2021 is 1.58%.
Market Exposure
The Fund seeks exposure of 175% of its NAV through a combination of equities and derivatives. "Market Exposure" includes the value of total investments (including the contract value of any derivatives) and excludes any short-term investments and cash equivalents divided by Net Assets.
1 As of August 31, 2022.
DIREXION ANNUAL REPORT
15
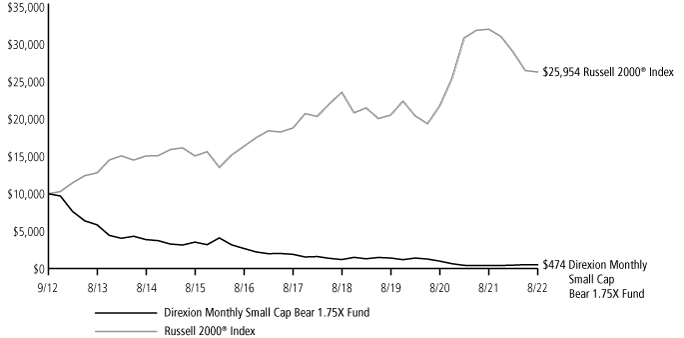
Direxion Monthly Small Cap Bear 1.75X Fund
Performance Summary (Unaudited)
September 1, 2012 - August 31, 2022
Investment Objective: Seeks monthly investment results, before fees and expenses, of 175% of the inverse of the price performance of the Russell 2000® Index.
| | | Average Annual Total Return1 | |
| | | 1 Year | | 3 Years | | 5 Years | | 10 Years | |
Direxion Monthly Small Cap
Bear 1.75X Fund | | | 29.83 | % | | | -29.76 | % | | | -24.86 | % | | | -26.28 | % | |
Russell 2000® Index | | | -17.88 | % | | | 8.59 | % | | | 6.95 | % | | | 10.01 | % | |
The Fund seeks calendar month leveraged investment results, which should not be equated with seeking a leveraged goal for shorter than a calendar month. An investor who purchases shares on a day other than the last business day of the calendar month will generally receive more, or less, than -175% exposure to its index. Other factors such as fees and expenses, high portfolio turnover, transaction costs, significant purchases and redemption activity by Fund shareholders and/or a temporary lack of liquidity in the markets for the securities held by the Fund may also cause the Fund's investment results to vary from its stated objective.
This chart illustrates the performance of a hypothetical $10,000 investment made ten years ago, and is not intended to imply any future performance. The returns shown do not reflect the deduction of taxes that a shareholder would pay on fund distributions or the redemption of fund shares. The performance of the Russell 2000® Index does not reflect the deduction of fees associated with a mutual fund, such as investment management fees. Investors cannot invest directly in an index, although they can invest in its underlying securities. During the period shown, Rafferty Asset Management, LLC waived and/or reimbursed fees for various expenses. Had these waivers and/or reimbursements not been in effect, performance would have been lower.
The performance data quoted represents past performance. Past performance does not guarantee future results. The investment return and principal value of an investment will fluctuate. An investor's shares, when redeemed, may be worth more or less than their original cost. Current performance may be lower or higher than the performance quoted. Returns for performance under one year are cumulative, not annualized. The gross expense ratio, per the prospectus dated December 29, 2021 is 2.16%.
Market Exposure
The Fund seeks exposure of -175% of its NAV through derivatives. "Market Exposure" includes the value of total investments (including the contract value of any derivatives) and excludes any short-term investments and cash equivalents divided by Net Assets.
1 As of August 31, 2022.
DIREXION ANNUAL REPORT
16
Direxion Monthly 7-10 Year Treasury Bull 1.75X Fund
Performance Summary (Unaudited)
September 1, 2012 - August 31, 2022
Investment Objective: The Direxion Monthly 7-10 Year Treasury Bull 1.75X Fund seeks monthly investment results, before fees and expenses, of 175% of the calendar month performance of the ICE U.S. Treasury 7-10 Year Bond Index.

| | | Average Annual Total Return1 | |
| | | 1 Year | | 3 Years | | 5 Years | | 10 Years | |
Direxion Monthly 7-10 Year
Treasury Bull 1.75X Fund | | | -25.74 | % | | | -8.42 | % | | | -2.76 | % | | | -1.00 | % | |
ICE U.S. Treasury 7-10 Year
Bond Index | | | -12.47 | % | | | -2.61 | % | | | 0.37 | % | | | 1.07 | % | |
The Fund seeks calendar month leveraged investment results, which should not be equated with seeking a leveraged goal for shorter than a calendar month. An investor who purchases shares on a day other than the last business day of the calendar month will generally receive more, or less, than 175% exposure to its index. Other factors such as fees and expenses, high portfolio turnover, transaction costs, significant purchases and redemption activity by Fund shareholders and/or a temporary lack of liquidity in the markets for the securities held by the Fund may also cause the Fund's investment results to vary from its stated objective.
This chart illustrates the performance of a hypothetical $10,000 investment made ten years ago, and is not intended to imply any future performance. The returns shown do not reflect the deduction of taxes that a shareholder would pay on fund distributions or the redemption of fund shares. The performance of the ICE U.S. Treasury 7-10 Year Bond Index does not reflect the deduction of fees associated with a mutual fund, such as investment management fees. Investors cannot invest directly in an index, although they can invest in its underlying securities. During the period shown, Rafferty Asset Management, LLC waived and/or reimbursed fees for various expenses. Had these waivers and/or reimbursements not been in effect, performance would have been lower.
The performance data quoted represents past performance. Past performance does not guarantee future results. The investment return and principal value of an investment will fluctuate. An investor's shares, when redeemed, may be worth more or less than their original cost. Current performance may be lower or higher than the performance quoted. Returns for performance under one year are cumulative, not annualized. The gross expense ratio, per the prospectus dated December 29, 2021 is 1.57%.
Market Exposure
The Fund seeks exposure of 175% of its NAV through a combination of equities and derivatives. "Market Exposure" includes the value of total investments (including the contract value of any derivatives) and excludes any short-term investments and cash equivalents divided by Net Assets.
1 As of August 31, 2022.
DIREXION ANNUAL REPORT
17
Direxion Monthly 7-10 Year Treasury Bear 1.75X Fund
Performance Summary (Unaudited)
September 1, 2012 - August 31, 2022
Investment Objective: The Direxion Monthly 7-10 Year Treasury Bear 1.75X Fund seeks monthly investment results, before fees and expenses, of 175% of the inverse of the calendar month performance of the ICE U.S. Treasury 7-10 Year Bond Index.

| | | Average Annual Total Return1 | |
| | | 1 Year | | 3 Years | | 5 Years | | 10 Years | |
Direxion Monthly 7-10 Year
Treasury Bear 1.75X Fund | | | 27.26 | % | | | 4.30 | % | | | -0.51 | % | | | -3.39 | % | |
ICE U.S. Treasury 7-10 Year
Bond Index | | | -12.47 | % | | | -2.61 | % | | | 0.37 | % | | | 1.07 | % | |
The Fund seeks calendar month leveraged investment results, which should not be equated with seeking a leveraged goal for shorter than a calendar month. An investor who purchases shares on a day other than the last business day of the calendar month will generally receive more, or less, than -175% exposure to its index. Other factors such as fees and expenses, high portfolio turnover, transaction costs, significant purchases and redemption activity by Fund shareholders and/or a temporary lack of liquidity in the markets for the securities held by the Fund may also cause the Fund's investment results to vary from its stated objective.
This chart illustrates the performance of a hypothetical $10,000 investment made ten years ago, and is not intended to imply any future performance. The returns shown do not reflect the deduction of taxes that a shareholder would pay on fund distributions or the redemption of fund shares. The performance of the ICE U.S. Treasury 7-10 Year Bond Index does not reflect the deduction of fees associated with a mutual fund, such as investment management fees. Investors cannot invest directly in an index, although they can invest in its underlying securities. During the period shown, Rafferty Asset Management, LLC waived and/or reimbursed fees for various expenses. Had these waivers and/or reimbursements not been in effect, performance would have been lower.
The performance data quoted represents past performance. Past performance does not guarantee future results. The investment return and principal value of an investment will fluctuate. An investor's shares, when redeemed, may be worth more or less than their original cost. Current performance may be lower or higher than the performance quoted. Returns for performance under one year are cumulative, not annualized. The gross expense ratio, per the prospectus dated December 29, 2021 is 2.61%.
Market Exposure
The Fund seeks exposure of -175% of its NAV through derivatives. "Market Exposure" includes the value of total investments (including the contract value of any derivatives) and excludes any short-term investments and cash equivalents divided by Net Assets.
1 As of August 31, 2022.
DIREXION ANNUAL REPORT
18
Expense Example (Unaudited)
August 31, 2022
As a shareholder of a mutual fund, you incur two types of costs: (1) transaction costs, including sales charges (loads) on purchase payments, reinvested dividends, or other distributions; redemption fees and exchange fees; and (2) ongoing costs, including management fees; distribution and/or service fees; and other fund expenses. This example is intended to help you understand your ongoing costs (in dollars) of investing in a fund and to compare costs with the ongoing costs of investing in other mutual funds.
The example is based on an investment of $1,000 invested at the beginning of the period and held the entire period (March 1, 2022 – August 31, 2022).
Actual expenses
The first line under each Fund in the following table provides information about actual account values and actual expenses. You may use the information in this line, together with the amount you invested, to estimate the expenses that you paid over the period. Simply divide your account value by $1,000 (for example, an $8,600 account value divided by $1,000 = 8.6), then multiply the result by the number in the first line for your Fund under the heading entitled "Expenses Paid During Period" to estimate the expenses you paid on your account during this period.
Hypothetical example for comparison purposes
The second line under each Fund in the following table provides information about hypothetical account values and hypothetical expenses based on each Fund's actual expense ratio and an assumed rate of return of 5% per year before expenses, which is not the Fund's actual return. The hypothetical account values and expenses may not be used to estimate the actual ending account balance or expenses you paid for the period. You may use this information to compare the ongoing costs of investing in your Fund and other funds. To do so, compare this 5% hypothetical example with the 5% hypothetical examples that appear in the shareholder reports of the other funds.
Please note that the expenses shown in the table are meant to highlight your ongoing costs only and do not reflect any transactional costs, such as wire transfers, returned checks or stop payment orders. Therefore, the second line under each Fund in the table is useful in comparing ongoing Fund costs only, and will not help you determine the relative costs of owning different funds. In addition, if these transactional costs were included, your costs would have been higher.
DIREXION ANNUAL REPORT
19
Expense Example (Unaudited)
August 31, 2022
| | | Annualized
Expense
Ratio | | Beginning
Account Value
March 1, 2022 | | Ending
Account Value
August 31, 2022 | | Expenses
Paid During
Period* | |
Direxion Monthly High Yield Bull 1.2X Fund | |
Based on actual fund return | | | 1.36 | % | | $ | 1,000.00 | | | $ | 891.90 | | | $ | 6.49 | | |
Based on hypothetical 5% return | | | 1.36 | % | | | 1,000.00 | | | | 1,018.35 | | | | 6.92 | | |
Direxion Monthly NASDAQ-100 Bull 1.25X Fund | |
Based on actual fund return | | | 0.78 | % | | | 1,000.00 | | | | 821.60 | | | | 3.58 | | |
Based on hypothetical 5% return | | | 0.78 | % | | | 1,000.00 | | | | 1,021.27 | | | | 3.97 | | |
Direxion Monthly NASDAQ-100 Bull 1.75X Fund | |
Based on actual fund return | | | 1.35 | % | | | 1,000.00 | | | | 709.10 | | | | 5.82 | | |
Based on hypothetical 5% return | | | 1.35 | % | | | 1,000.00 | | | | 1,018.40 | | | | 6.87 | | |
Direxion Monthly S&P 500 Bull 1.75X Fund | |
Based on actual fund return | | | 1.37 | % | | | 1,000.00 | | | | 803.00 | | | | 6.23 | | |
Based on hypothetical 5% return | | | 1.37 | % | | | 1,000.00 | | | | 1,018.30 | | | | 6.97 | | |
Direxion Monthly S&P 500 Bear 1.75X Fund | |
Based on actual fund return | | | 1.36 | % | | | 1,000.00 | | | | 1,112.90 | | | | 7.24 | | |
Based on hypothetical 5% return | | | 1.36 | % | | | 1,000.00 | | | | 1,018.35 | | | | 6.92 | | |
Direxion Monthly Small Cap Bull 1.75X Fund | |
Based on actual fund return | | | 1.36 | % | | | 1,000.00 | | | | 789.20 | | | | 6.13 | | |
Based on hypothetical 5% return | | | 1.36 | % | | | 1,000.00 | | | | 1,018.35 | | | | 6.92 | | |
Direxion Monthly Small Cap Bear 1.75X Fund | |
Based on actual fund return | | | 1.36 | % | | | 1,000.00 | | | | 1,118.30 | | | | 7.26 | | |
Based on hypothetical 5% return | | | 1.36 | % | | | 1,000.00 | | | | 1,018.35 | | | | 6.92 | | |
Direxion Monthly 7-10 Year Treasury Bull 1.75X Fund | |
Based on actual fund return | | | 1.36 | % | | | 1,000.00 | | | | 813.20 | | | | 6.22 | | |
Based on hypothetical 5% return | | | 1.36 | % | | | 1,000.00 | | | | 1,018.35 | | | | 6.92 | | |
Direxion Monthly 7-10 Year Treasury Bear 1.75X Fund | |
Based on actual fund return | | | 1.39 | % | | | 1,000.00 | | | | 1,187.60 | | | | 7.66 | | |
Based on hypothetical 5% return | | | 1.39 | % | | | 1,000.00 | | | | 1,018.20 | | | | 7.07 | | |
* Expenses are equal to the Fund's annualized expense ratio, multiplied by the average account value over the period, multiplied by 184 days (the number of days in the period of March 1, 2022 to August 31, 2022), then divided by 365.
DIREXION ANNUAL REPORT
20
Allocation of Portfolio Holdings (Unaudited)
August 31, 2022
| | | Cash* | | Investment
Companies | | Swaps | | Total | |
Direxion Monthly High Yield Bull 1.2X Fund | | | 19 | % | | | 81 | % | | | 0 | %** | | | 100 | % | |
Direxion Monthly NASDAQ-100® Bull 1.25X Fund | | | 57 | % | | | 51 | % | | | (8 | )% | | | 100 | % | |
Direxion Monthly NASDAQ-100® Bull 1.75X Fund | | | 97 | % | | | 23 | % | | | (20 | )% | | | 100 | % | |
Direxion Monthly S&P 500® Bull 1.75X Fund | | | 53 | % | | | 53 | % | | | (6 | )% | | | 100 | % | |
Direxion Monthly S&P 500® Bear 1.75X Fund | | | 96 | % | | | — | | | | 4 | % | | | 100 | % | |
Direxion Monthly Small Cap Bull 1.75X Fund | | | 69 | % | | | 39 | % | | | (8 | )% | | | 100 | % | |
Direxion Monthly Small Cap Bear 1.75X Fund | | | 99 | % | | | — | | | | 1 | % | | | 100 | % | |
Direxion Monthly 7-10 Year Treasury Bull 1.75X Fund | | | 46 | % | | | 55 | % | | | (1 | )% | | | 100 | % | |
Direxion Monthly 7-10 Year Treasury Bear 1.75X Fund | | | 99 | % | | | — | | | | 1 | % | | | 100 | % | |
Allocation of Portfolio Holdings reflects percentages of net assets.
* Cash and other assets less liabilities.
** Percentage is less than 0.5%.
DIREXION ANNUAL REPORT
21
Direxion Monthly High Yield Bull 1.2X Fund
Schedule of Investments
August 31, 2022
Shares | | | | Fair Value | |
INVESTMENT COMPANIES - 80.5% | | | |
| | 102,668 | | | iShares iBoxx High Yield
Corporate Bond ETF (a) | | $ | 7,651,846 | | |
| | 83,277 | | | SPDR Bloomberg High
Yield Bond ETF (a) | | | 7,652,323 | | |
| | | | | TOTAL INVESTMENT COMPANIES
(Cost $15,180,759) | | $ | 15,304,169 | | |
SHORT TERM INVESTMENTS - 12.9% | | | |
Money Market Funds - 12.9% | | | |
| | 2,460,000 | | | Fidelity Investments Money
Market Funds Government
Portfolio Institutional
Class, 2.06% (b)(c) | | $ | 2,460,000 | | |
| | | | | TOTAL SHORT TERM
INVESTMENTS
(Cost $2,460,000) | | $ | 2,460,000 | | |
| | | | | TOTAL INVESTMENTS
(Cost $17,640,759) - 93.4% | | $ | 17,764,169 | | |
| | | | | Other Assets in Excess of
Liabilities - 6.6% | | | 1,238,202 | | |
| | | | | TOTAL NET ASSETS - 100.0% | | $ | 19,002,371 | | |
Percentages are stated as a percent of net assets.
The geographic location of all investments is United States unless otherwise indicated.
(a) Shareholders may obtain the financial statements of these investment companies at www.sec.gov.
(b) Represents annualized seven-day yield at August 31, 2022.
(c) All or a portion of these securities have been segregated as collateral for swap contracts. Total value of securities segregated amounted to $2,460,000.
Long Total Return Swap Contracts
August 31, 2022
Terms of Payments
to be Received at
Termination | | Terms of Payments
to be Paid at
Termination | | Counterparty | | Termination
Date | | Contracts | | Notional
Amount | | Unrealized
Appreciation | |
Total return of PIMCO
0-5 Year High Yield
Corporate Bond Index ETF | |
3.2800% representing
1 month SOFR rate + spread | | Credit Suisse
International | | 12/13/2022 | | | 85,160 | | | $ | 7,555,567 | | | $ | 92,320 | | |
The accompanying notes are an integral part of these financial statements.
DIREXION ANNUAL REPORT
22
Direxion Monthly NASDAQ-100® Bull 1.25X Fund
Schedule of Investments
August 31, 2022
Shares | | | | Fair Value | |
INVESTMENT COMPANIES - 51.0% | | | |
| | 12,410 | | | Invesco QQQ Trust Series 1 (a) | | $ | 3,713,941 | | |
| | | | | TOTAL INVESTMENT COMPANIES
(Cost $3,938,397) | | $ | 3,713,941 | | |
SHORT TERM INVESTMENTS - 20.2% | | | |
Money Market Funds - 20.2% | | | |
| | 410,000 | | | Fidelity Investments Money
Market Funds Government
Portfolio Institutional
Class, 2.06% (b)(c) | | $ | 410,000 | | |
| | 814,326 | | | Goldman Sachs Financial
Square Treasury Instruments
Fund Institutional Shares,
2.02% (b)(c) | | | 814,326 | | |
| | 250,000 | | | Invesco Government & Agency
Portfolio Institutional
Shares, 2.24% (b)(c) | | | 250,000 | | |
| | | �� | | TOTAL SHORT TERM
INVESTMENTS
(Cost $1,474,326) | | $ | 1,474,326 | | |
| | | | | TOTAL INVESTMENTS
(Cost $5,412,723) - 71.2% | | $ | 5,188,267 | | |
| | | | | Other Assets in Excess of
Liabilities - 28.8% | | | 2,093,066 | | |
| | | | | TOTAL NET ASSETS - 100.0% | | $ | 7,281,333 | | |
Percentages are stated as a percent of net assets.
The geographic location of all investments is United States unless otherwise indicated.
(a) Shareholders may obtain the financial statements of these investment companies at www.sec.gov.
(b) Represents annualized seven-day yield at August 31, 2022.
(c) All or a portion of these securities have been segregated as collateral for swap contracts. Total value of securities segregated amounted to $1,474,326.
Long Total Return Swap Contracts
August 31, 2022
Terms of Payments
to be Received at
Termination | | Terms of Payments
to be Paid at
Termination | | Counterparty | | Termination
Date | | Contracts | | Notional
Amount | | Unrealized
Depreciation | |
Total return of
NASDAQ-100® Index | | 2.7800% representing
1 month SOFR rate + spread | | UBS Securities LLC | | 12/9/2022 | | | 80 | | | $ | 1,061,349 | | | $ | (80,651 | ) | |
Total return of
NASDAQ-100® Index | | 2.7800% representing
1 month SOFR rate + spread | | Bank of America
Merrill Lynch | | 12/12/2022 | | | 241 | | | | 3,237,014 | | | | (290,115 | ) | |
Total return of
NASDAQ-100® Index | | 2.9300% representing
1 month SOFR rate + spread | | Credit Suisse
International | | 12/13/2022 | | | 118 | | | | 1,646,678 | | | | (205,810 | ) | |
| | | | | | | | | | | $ | 5,945,041 | | | $ | (576,576 | ) | |
The accompanying notes are an integral part of these financial statements.
DIREXION ANNUAL REPORT
23
Direxion Monthly NASDAQ-100® Bull 1.75X Fund
Schedule of Investments
August 31, 2022
Shares | | | | Fair Value | |
INVESTMENT COMPANIES - 22.9% | | | |
| | 209,420 | | | Invesco QQQ Trust Series 1 (a) | | $ | 62,673,123 | | |
| | | | | TOTAL INVESTMENT
COMPANIES
(Cost $47,422,967) | | $ | 62,673,123 | | |
SHORT TERM INVESTMENTS - 42.1% | | | |
Money Market Funds - 42.1% | | | |
| | 67,850,000 | | | Fidelity Investments Money
Market Funds Government
Portfolio Institutional
Class, 2.06% (b)(c) | | $ | 67,850,000 | | |
| | 18,131,368 | | | Goldman Sachs Financial
Square Treasury Instruments
Fund Institutional Shares,
2.02% (b)(c) | | | 18,131,368 | | |
| | 29,190,000 | | | Invesco Government & Agency
Portfolio Institutional
Shares, 2.24% (b)(c) | | | 29,190,000 | | |
| | | | | TOTAL SHORT TERM
INVESTMENTS
(Cost $115,171,368) | | $ | 115,171,368 | | |
| | | | | TOTAL INVESTMENTS
(Cost $162,594,335) - 65.0% | | $ | 177,844,491 | | |
| | | | | Other Assets in Excess of
Liabilities - 35.0% | | | 95,578,804 | | |
| | | | | TOTAL NET ASSETS - 100.0% | | $ | 273,423,295 | | |
Percentages are stated as a percent of net assets.
The geographic location of all investments is United States unless otherwise indicated.
(a) Shareholders may obtain the financial statements of these investment companies at www.sec.gov.
(b) Represents annualized seven-day yield at August 31, 2022.
(c) All or a portion of these securities have been segregated as collateral for swap contracts. Total value of securities segregated amounted to $115,171,368.
Long Total Return Swap Contracts
August 31, 2022
Terms of Payments
to be Received at
Termination | | Terms of Payments
to be Paid at
Termination | | Counterparty | | Termination
Date | | Contracts | | Notional
Amount | | Unrealized
Depreciation | |
Total return of
NASDAQ-100® Index | | 2.7800% representing
1 month SOFR rate + spread | | UBS Securities LLC | | 12/9/2022 | | | 8,005 | | | $ | 110,979,367 | | | $ | (13,101,012 | ) | |
Total return of
NASDAQ-100® Index | | 2.7800% representing
1 month SOFR rate + spread | | Bank of America
Merrill Lynch | | 12/12/2022 | | | 4,400 | | | | 56,745,559 | | | | (2,906,561 | ) | |
Total return of
NASDAQ-100® Index | | 2.9300% representing
1 month SOFR rate + spread | | Credit Suisse
International | | 12/13/2022 | | | 21,482 | | | | 301,504,381 | | | | (39,215,714 | ) | |
| | | | | | | | | | | $ | 469,229,307 | | | $ | (55,223,287 | ) | |
The accompanying notes are an integral part of these financial statements.
DIREXION ANNUAL REPORT
24
Direxion Monthly S&P 500® Bull 1.75X Fund
Schedule of Investments
August 31, 2022
Shares | | | | Fair Value | |
INVESTMENT COMPANIES - 53.2% | | | |
| | 115,000 | | | iShares Core S&P 500 ETF (a) | | $ | 45,675,700 | | |
| | | | | TOTAL INVESTMENT COMPANIES
(Cost $45,412,055) | | $ | 45,675,700 | | |
SHORT TERM INVESTMENTS - 25.6% | | | |
Money Market Funds - 25.6% | | | |
| | 10,540,000 | | | Fidelity Investments Money
Market Funds Government
Portfolio Institutional
Class, 2.06% (b)(c) | | $ | 10,540,000 | | |
| | 5,880,000 | | | Goldman Sachs Financial
Square Treasury Instruments
Fund Institutional
Shares, 2.02% (b)(c) | | | 5,880,000 | | |
| | 5,530,000 | | | Invesco Government & Agency
Portfolio Institutional
Shares, 2.24% (b)(c) | | | 5,530,000 | | |
| | | | | TOTAL SHORT TERM
INVESTMENTS
(Cost $21,950,000) | | $ | 21,950,000 | | |
| | | | | TOTAL INVESTMENTS
(Cost $67,362,055) - 78.8% | | $ | 67,625,700 | | |
| | | | | Other Assets in Excess of
Liabilities - 21.2% | | | 18,246,036 | | |
| | | | | TOTAL NET ASSETS - 100.0% | | $ | 85,871,736 | | |
Percentages are stated as a percent of net assets.
The geographic location of all investments is United States unless otherwise indicated.
(a) Shareholders may obtain the financial statements of these investment companies at www.sec.gov.
(b) Represents annualized seven-day yield at August 31, 2022.
(c) All or a portion of these securities have been segregated as collateral for swap contracts. Total value of securities segregated amounted to $21,950,000.
Long Total Return Swap Contracts
August 31, 2022
Terms of Payments
to be Received at
Termination | | Terms of Payments
to be Paid at
Termination | | Counterparty | | Termination
Date | | Contracts | | Notional
Amount | | Unrealized
Appreciation
(Depreciation) | |
Total return of
S&P 500® Index | | 2.8500% representing
1 month SOFR rate + spread | | UBS Securities LLC | | 12/9/2022 | | | 5,338 | | | $ | 23,292,310 | | | $ | (2,194,917 | ) | |
Total return of
S&P 500® Index | | 2.8600% representing
1 month SOFR rate + spread | | Credit Suisse
International | | 12/12/2022 | | | 13,433 | | | | 57,226,060 | | | | (4,120,279 | ) | |
Total return of
S&P 500® Index | | 2.7300% representing
1 month SOFR rate + spread | | Bank of America
Merrill Lynch | | 12/12/2022 | | | 7,687 | | | | 29,379,492 | | | | 989,254 | | |
| | | | | | | | | | | $ | 109,897,862 | | | $ | (5,325,942 | ) | |
The accompanying notes are an integral part of these financial statements.
DIREXION ANNUAL REPORT
25
Direxion Monthly S&P 500® Bear 1.75X Fund
Schedule of Investments
August 31, 2022
Shares | | | | Fair Value | |
SHORT TERM INVESTMENTS - 16.8% | |
Money Market Funds - 16.8% | |
| | 2,070,000 | | | Fidelity Investments Money
Market Funds Government
Portfolio Institutional
Class, 2.06% (a)(b) | | $ | 2,070,000 | | |
| | | TOTAL SHORT TERM
INVESTMENTS
(Cost $2,070,000) | | $ | 2,070,000 | | |
| | | TOTAL INVESTMENTS
(Cost $2,070,000) - 16.8% | | $ | 2,070,000 | | |
| | | Other Assets in Excess of
Liabilities - 83.2% | | | 10,229,153 | | |
| | | TOTAL NET ASSETS - 100.0% | | $ | 12,299,153 | | |
Percentages are stated as a percent of net assets.
The geographic location of all investments is United States unless otherwise indicated.
(a) Represents annualized seven-day yield at August 31, 2022.
(b) All or a portion of these securities have been segregated as collateral for swap contracts. Total value of securities segregated amounted to $2,070,000.
Short Total Return Swap Contracts
August 31, 2022
Terms of Payments
to be Received at
Termination | | Terms of Payments
to be Paid at
Termination | | Counterparty | | Termination
Date | | Contracts | | Notional
Amount | | Unrealized
Appreciation | |
2.6100% representing
1 month SOFR rate + spread | | Total return of
S&P 500® Index | | Credit Suisse
International | | 12/8/2022 | | | 5,453 | | | $ | 22,084,755 | | | $ | 527,011 | | |
The accompanying notes are an integral part of these financial statements.
DIREXION ANNUAL REPORT
26
Direxion Monthly Small Cap Bull 1.75X Fund
Schedule of Investments
August 31, 2022
Shares | | | | Fair Value | |
INVESTMENT COMPANIES - 39.0% | | | |
| | 22,500 | | | iShares Russell 2000 ETF (a) | | $ | 4,128,750 | | |
| | | | | TOTAL INVESTMENT COMPANIES
(Cost $3,963,228) | | $ | 4,128,750 | | |
SHORT TERM INVESTMENTS - 22.5% | | | |
Money Market Funds - 22.5% | | | |
| | 1,870,000 | | | Fidelity Investments Money
Market Funds Government
Portfolio Institutional
Class, 2.06% (b)(c) | | $ | 1,870,000 | | |
| | 265,888 | | | Goldman Sachs Financial
Square Treasury Instruments
Fund Institutional
Shares, 2.02% (b)(c) | | | 265,888 | | |
| | 240,000 | | | Invesco Government & Agency
Portfolio Institutional
Shares, 2.24% (b)(c) | | | 240,000 | | |
| | | | | TOTAL SHORT TERM
INVESTMENTS
(Cost $2,375,888) | | $ | 2,375,888 | | |
| | | | | TOTAL INVESTMENTS
(Cost $6,339,116) - 61.5% | | $ | 6,504,638 | | |
| | | | | Other Assets in Excess of
Liabilities - 38.5% | | | 4,072,323 | | |
| | | | | TOTAL NET ASSETS - 100.0% | | $ | 10,576,961 | | |
Percentages are stated as a percent of net assets.
The geographic location of all investments is United States unless otherwise indicated.
(a) Shareholders may obtain the financial statements of these investment companies at www.sec.gov.
(b) Represents annualized seven-day yield at August 31, 2022.
(c) All or a portion of these securities have been segregated as collateral for swap contracts. Total value of securities segregated amounted to $2,375,888.
Long Total Return Swap Contracts
August 31, 2022
Terms of Payments
to be Received at
Termination | | Terms of Payments
to be Paid at
Termination | | Counterparty | | Termination
Date | | Contracts | | Notional
Amount | | Unrealized
Appreciation
(Depreciation) | |
Total return of
Russell 2000® Index | | 2.8300% representing
1 month SOFR rate + spread | | UBS Securities LLC | | 12/9/2022 | | | 646 | | | $ | 1,312,937 | | | $ | (123,630 | ) | |
Total return of
Russell 2000® Index | | 2.6500% representing
1 month SOFR rate + spread | | Credit Suisse
International | | 12/12/2022 | | | 6,355 | | | | 12,508,965 | | | | (799,439 | ) | |
Total return of
Russell 2000® Index | | 2.0300% representing
1 month SOFR rate + spread | | Bank of America
Merrill Lynch | | 12/12/2022 | | | 799 | | | | 1,376,130 | | | | 96,868 | | |
| | | | | | | | | | | $ | 15,198,032 | | | $ | (826,201 | ) | |
The accompanying notes are an integral part of these financial statements.
DIREXION ANNUAL REPORT
27
Direxion Monthly Small Cap Bear 1.75X Fund
Schedule of Investments
August 31, 2022
Shares | | | | Fair Value | |
SHORT TERM INVESTMENTS - 33.4% | |
Money Market Funds - 33.4% | |
| | 1,790,000 | | | Fidelity Investments Money
Market Funds Government
Portfolio Institutional
Class, 2.06% (a)(b) | | $ | 1,790,000 | | |
| | | TOTAL SHORT TERM
INVESTMENTS
(Cost $1,790,000) | | $ | 1,790,000 | | |
| | | TOTAL INVESTMENTS
(Cost $1,790,000) - 33.4% | | $ | 1,790,000 | | |
| | | Other Assets in Excess of
Liabilities - 66.6% | | | 3,569,375 | | |
| | | TOTAL NET ASSETS - 100.0% | | $ | 5,359,375 | | |
Percentages are stated as a percent of net assets.
The geographic location of all investments is United States unless otherwise indicated.
(a) Represents annualized seven-day yield at August 31, 2022.
(b) All or a portion of these securities have been segregated as collateral for swap contracts. Total value of securities segregated amounted to $1,790,000.
Short Total Return Swap Contracts
August 31, 2022
Terms of Payments
to be Received at
Termination | | Terms of Payments
to be Paid at
Termination | | Counterparty | | Termination
Date | | Contracts | | Notional
Amount | | Unrealized
Appreciation | |
2.4500% representing
1 month SOFR rate + spread | | Total return of
Russell 2000® Index | | Credit Suisse
International | | 12/8/2022 | | | 5,060 | | | $ | 9,401,352 | | | $ | 77,483 | | |
The accompanying notes are an integral part of these financial statements.
DIREXION ANNUAL REPORT
28
Direxion Monthly 7-10 Year Treasury Bull 1.75X Fund
Schedule of Investments
August 31, 2022
Shares | | | | Fair Value | |
INVESTMENT COMPANIES - 54.9% | | | |
| | 28,000 | | | iShares 7-10 Year Treasury Bond
ETF (a) | | $ | 2,826,320 | | |
| | | | | TOTAL INVESTMENT COMPANIES
(Cost $2,868,852) | | $ | 2,826,320 | | |
SHORT TERM INVESTMENTS - 27.1% | | | |
Money Market Funds - 27.1% | | | |
| | 160,000 | | | Fidelity Investments Money
Market Funds Government
Portfolio Institutional
Class, 2.06% (b)(c) | | $ | 160,000 | | |
| | 675,861 | | | Goldman Sachs Financial
Square Treasury Instruments
Fund Institutional
Shares, 2.02% (b)(c) | | | 675,861 | | |
| | 560,000 | | | Invesco Government & Agency
Portfolio Institutional
Shares, 2.24% (b)(c) | | | 560,000 | | |
| | | | | TOTAL SHORT TERM
INVESTMENTS
(Cost $1,395,861) | | $ | 1,395,861 | | |
| | | | | TOTAL INVESTMENTS
(Cost $4,264,713) - 82.0% | | $ | 4,222,181 | | |
| | | | | Other Assets in Excess of
Liabilities - 18.0% | | | 924,202 | | |
| | | | | TOTAL NET ASSETS - 100.0% | | $ | 5,146,383 | | |
Percentages are stated as a percent of net assets.
The geographic location of all investments is United States unless otherwise indicated.
(a) Shareholders may obtain the financial statements of these investment companies at www.sec.gov.
(b) Represents annualized seven-day yield at August 31, 2022.
(c) All or a portion of these securities have been segregated as collateral for swap contracts. Total value of securities segregated amounted to $1,395,861.
Long Total Return Swap Contracts
August 31, 2022
Terms of Payments
to be Received at
Termination | | Terms of Payments
to be Paid at
Termination | | Counterparty | | Termination
Date | | Contracts | | Notional
Amount | | Unrealized
Depreciation | |
Total return of
iShares 7-10 Year
Treasury Bond ETF | | 2.4300% representing
1 month SOFR rate + spread | | Bank of America
Merrill Lynch | | 12/12/2022 | | | 33,000 | | | $ | 3,359,654 | | | $ | (32,993 | ) | |
Total return of
iShares 7-10 Year
Treasury Bond ETF | | 2.8300% representing
1 month SOFR rate + spread | | UBS Securities LLC | | 12/14/2022 | | | 28,244 | | | | 2,887,789 | | | | (40,862 | ) | |
| | | | | | | | | | | $ | 6,247,443 | | | $ | (73,855 | ) | |
The accompanying notes are an integral part of these financial statements.
DIREXION ANNUAL REPORT
29
Direxion Monthly 7-10 Year Treasury Bear 1.75X Fund
Schedule of Investments
August 31, 2022
Shares | | | | Fair Value | |
SHORT TERM INVESTMENTS - 25.3% | |
Money Market Funds - 25.3% | |
| | 670,000 | | | Invesco Government & Agency
Portfolio Institutional
Shares, 2.24% (a)(b) | | $ | 670,000 | | |
| | | TOTAL SHORT TERM
INVESTMENTS
(Cost $670,000) | | $ | 670,000 | | |
| | | TOTAL INVESTMENTS
(Cost $670,000) - 25.3% | | $ | 670,000 | | |
| | | Other Assets in Excess of
Liabilities - 74.7% | | | 1,980,408 | | |
| | | TOTAL NET ASSETS - 100.0% | | $ | 2,650,408 | | |
Percentages are stated as a percent of net assets.
The geographic location of all investments is United States unless otherwise indicated.
(a) Represents annualized seven-day yield at August 31, 2022.
(b) All or a portion of these securities have been segregated as collateral for swap contracts. Total value of securities segregated amounted to $670,000.
Short Total Return Swap Contracts
August 31, 2022
Terms of Payments
to be Received at
Termination | | Terms of Payments
to be Paid at
Termination | | Counterparty | | Termination
Date | | Contracts | | Notional
Amount | | Unrealized
Appreciation | |
1.3800% representing
1 month SOFR rate + spread
| | Total return of
iShares 7-10 Year
Treasury Bond ETF | | UBS Securities LLC | | 12/14/2022 | | | 45,427 | | | $ | 4,606,569 | | | $ | 22,296 | | |
The accompanying notes are an integral part of these financial statements.
DIREXION ANNUAL REPORT
30
Statements of Assets & Liabilities
August 31, 2022
| | | Direxion Monthly
High Yield Bull
1.2X Fund | | Direxion Monthly
NASDAQ-100
Bull 1.25X Fund | | Direxion Monthly
NASDAQ-100
Bull 1.75X Fund | |
Assets: | |
Investments, at fair value (Note 2) | | $ | 17,764,169 | | | $ | 5,188,267 | | | $ | 177,844,491 | | |
Cash equivalents | | | 5,716,013 | | | | 2,711,151 | | | | 154,221,005 | | |
Receivable for Fund shares sold | | | 9,551 | | | | — | | | | 1,244,407 | | |
Due from broker for swap contracts | | | 33,071 | | | | 1,026 | | | | 97,249 | | |
Receivable for Investment securities sold | | | 16,366,342 | | | | — | | | | — | | |
Unrealized appreciation on swap contracts | | | 92,320 | | | | — | | | | — | | |
Dividends and interest receivable | | | 28,035 | | | | 7,739 | | | | 464,055 | | |
Prepaid expenses and other assets | | | 13,822 | | | | 14,248 | | | | 29,844 | | |
Total Assets | | | 40,023,323 | | | | 7,922,431 | | | | 333,901,051 | | |
Liabilities: | |
Payable for Fund shares redeemed | | | 20,541,182 | | | | 4,700 | | | | 1,140,254 | | |
Due to broker for swap contracts | | | 65,244 | | | | 35,065 | | | | 3,370,352 | | |
Deposits from broker for swap contracts | | | 270,000 | | | | — | | | | — | | |
Unrealized depreciation on swap contracts | | | — | | | | 576,576 | | | | 55,223,287 | | |
Due to Adviser, net (Note 4) | | | 53,842 | | | | 2,522 | | | | 275,676 | | |
Accrued distribution expenses | | | 15,556 | | | | 1,711 | | | | 67,015 | | |
Accrued expenses and other liabilities | | | 75,128 | | | | 20,524 | | | | 401,172 | | |
Total Liabilities | | | 21,020,952 | | | | 641,098 | | | | 60,477,756 | | |
Net Assets | | $ | 19,002,371 | | | $ | 7,281,333 | | | $ | 273,423,295 | | |
Net Assets Consist of: | |
Capital stock | | $ | 47,254,117 | | | $ | 13,355,204 | | | $ | 401,781,694 | | |
Total distributable loss | | | (28,251,746 | ) | | | (6,073,871 | ) | | | (128,358,399 | ) | |
Net Assets | | $ | 19,002,371 | | | $ | 7,281,333 | | | $ | 273,423,295 | | |
Calculation of Net Asset Value Per Share: | |
Net assets | | $ | 19,002,371 | | | $ | 7,281,333 | | | $ | 273,423,295 | | |
Shares outstanding (unlimited shares of beneficial interest
authorized, no par value) | | | 1,134,044 | | | | 164,553 | | | | 6,463,510 | | |
Net asset value, redemption price and offering price
per share | | $ | 16.7563 | | | $ | 44.2492 | | | $ | 42.3026 | | |
Cost of Investments | | $ | 17,640,759 | | | $ | 5,412,723 | | | $ | 162,594,335 | | |
The accompanying notes are an integral part of these financial statements.
DIREXION ANNUAL REPORT
31
Statements of Assets & Liabilities
August 31, 2022
| | | Direxion Monthly
S&P 500 Bull
1.75X Fund | | Direxion Monthly
S&P 500 Bear
1.75X Fund | | Direxion Monthly
Small Cap Bull
1.75X Fund | |
Assets: | |
Investments, at fair value (Note 2) | | $ | 67,625,700 | | | $ | 2,070,000 | | | $ | 6,504,638 | | |
Cash equivalents | | | 25,345,297 | | | | 9,883,750 | | | | 5,065,877 | | |
Receivable for Fund shares sold | | | 74,202 | | | | 318,550 | | | | 23,449 | | |
Due from broker for swap contracts | | | 74,991 | | | | — | | | | 2,147 | | |
Unrealized appreciation on swap contracts | | | 989,254 | | | | 527,011 | | | | 96,868 | | |
Dividends and interest receivable | | | 83,176 | | | | 16,458 | | | | 11,557 | | |
Prepaid expenses and other assets | | | 46,953 | | | | 18,925 | | | | 10,748 | | |
Total Assets | | | 94,239,573 | | | | 12,834,694 | | | | 11,715,284 | | |
Liabilities: | |
Payable for Fund shares redeemed | | | 54,609 | | | | 132,961 | | | | 18,128 | | |
Due to broker for swap contracts | | | 559,360 | | | | — | | | | 33,136 | | |
Deposits from broker for swap contracts | | | 1,230,000 | | | | 380,000 | | | | 130,000 | | |
Unrealized depreciation on swap contracts | | | 6,315,196 | | | | — | | | | 923,069 | | |
Due to Adviser, net (Note 4) | | | 77,110 | | | | 3,301 | | | | 7,752 | | |
Accrued distribution expenses | | | 20,345 | | | | 2,006 | | | | 2,330 | | |
Accrued expenses and other liabilities | | | 111,217 | | | | 17,273 | | | | 23,908 | | |
Total Liabilities | | | 8,367,837 | | | | 535,541 | | | | 1,138,323 | | |
Net Assets | | $ | 85,871,736 | | | $ | 12,299,153 | | | $ | 10,576,961 | | |
Net Assets Consist of: | |
Capital stock | | $ | 98,325,071 | | | $ | 71,130,464 | | | $ | 18,196,248 | | |
Total distributable loss | | | (12,453,335 | ) | | | (58,831,311 | ) | | | (7,619,287 | ) | |
Net Assets | | $ | 85,871,736 | | | $ | 12,299,153 | | | $ | 10,576,961 | | |
Calculation of Net Asset Value Per Share: | |
Net assets | | $ | 85,871,736 | | | $ | 12,299,153 | | | $ | 10,576,961 | | |
Shares outstanding (unlimited shares of beneficial interest
authorized, no par value) | | | 2,095,647 | | | | 3,289,342 | | | | 147,098 | | |
Net asset value, redemption price and offering price
per share | | $ | 40.9762 | | | $ | 3.7391 | | | $ | 71.9042 | | |
Cost of Investments | | $ | 67,362,055 | | | $ | 2,070,000 | | | $ | 6,339,116 | | |
The accompanying notes are an integral part of these financial statements.
DIREXION ANNUAL REPORT
32
Statements of Assets & Liabilities
August 31, 2022
| | | Direxion Monthly
Small Cap Bear
1.75X Fund | | Direxion Monthly
7-10 Year Treasury
Bull 1.75X Fund | | Direxion Monthly
7-10 Year Treasury
Bear 1.75X Fund | |
Assets: | |
Investments, at fair value (Note 2) | | $ | 1,790,000 | | | $ | 4,222,181 | | | $ | 670,000 | | |
Cash equivalents | | | 3,405,868 | | | | 1,032,276 | | | | 2,012,945 | | |
Receivable for Fund shares sold | | | 161,123 | | | | 2,547 | | | | 32,000 | | |
Due from Adviser, net (Note 4) | | | 93 | | | | — | | | | 1,392 | | |
Due from broker for swap contracts | | | — | | | | 1,384 | | | | — | | |
Unrealized appreciation on swap contracts | | | 77,483 | | | | — | | | | 22,296 | | |
Dividends and interest receivable | | | 8,125 | | | | 6,477 | | | | 5,227 | | |
Prepaid expenses and other assets | | | 5,757 | | | | 10,379 | | | | 10,586 | | |
Total Assets | | | 5,448,449 | | | | 5,275,244 | | | | 2,754,446 | | |
Liabilities: | |
Payable for Fund shares redeemed | | | 71,948 | | | | 5,634 | | | | 68,692 | | |
Due to broker for swap contracts | | | — | | | | 5,817 | | | | — | | |
Unrealized depreciation on swap contracts | | | — | | | | 73,855 | | | | — | | |
Due to Adviser, net (Note 4) | | | — | | | | 1,678 | | | | — | | |
Accrued distribution expenses | | | 941 | | | | 1,456 | | | | 676 | | |
Accrued expenses and other liabilities | | | 16,185 | | | | 40,421 | | | | 34,670 | | |
Total Liabilities | | | 89,074 | | | | 128,861 | | | | 104,038 | | |
Net Assets | | $ | 5,359,375 | | | $ | 5,146,383 | | | $ | 2,650,408 | | |
Net Assets Consist of: | |
Capital stock | | $ | 55,911,026 | | | $ | 11,301,922 | | | $ | 22,879,992 | | |
Total distributable loss | | | (50,551,651 | ) | | | (6,155,539 | ) | | | (20,229,584 | ) | |
Net Assets | | $ | 5,359,375 | | | $ | 5,146,383 | | | $ | 2,650,408 | | |
Calculation of Net Asset Value Per Share: | |
Net assets | | $ | 5,359,375 | | | $ | 5,146,383 | | | $ | 2,650,408 | | |
Shares outstanding (unlimited shares of beneficial interest
authorized, no par value) | | | 1,154,584 | | | | 184,584 | | | | 97,188 | | |
Net asset value, redemption price and offering price
per share | | $ | 4.6418 | | | $ | 27.8810 | | | $ | 27.2709 | | |
Cost of Investments | | $ | 1,790,000 | | | $ | 4,264,713 | | | $ | 670,000 | | |
The accompanying notes are an integral part of these financial statements.
DIREXION ANNUAL REPORT
33
Statements of Operations
For the Year Ended August 31, 2022
| | | Direxion Monthly
High Yield Bull
1.2X Fund | | Direxion Monthly
NASDAQ-100
Bull 1.25X Fund | | Direxion Monthly
NASDAQ-100
Bull 1.75X Fund | |
Investment Income: | |
Dividend income | | $ | 1,591,476 | | | $ | 3,659 | | | $ | 297,133 | | |
Interest income | | | 55,213 | | | | 21,021 | | | | 1,223,518 | | |
Total investment income | | | 1,646,689 | | | | 24,680 | | | | 1,520,651 | | |
Expenses: | |
Investment advisory fees (Note 4) | | | 318,099 | | | | 94,556 | | | | 3,294,725 | | |
Distribution expenses (Note 4) | | | 106,033 | | | | 31,519 | | | | 1,098,242 | | |
Accounting fees | | | 45,137 | | | | 13,417 | | | | 467,513 | | |
Professional fees | | | 28,985 | | | | 15,644 | | | | 206,743 | | |
State registration fees | | | 27,145 | | | | 21,063 | | | | 63,737 | | |
Trustees' fees | | | 13,343 | | | | 3,955 | | | | 137,962 | | |
Management service fees (Note 4) | | | 10,434 | | | | 3,106 | | | | 108,263 | | |
Report to shareholders | | | 8,173 | | | | 2,429 | | | | 84,648 | | |
Licensing fees | | | 6,599 | | | | 7,565 | | | | 175,648 | | |
Insurance fees | | | 5,638 | | | | 1,672 | | | | 58,309 | | |
Administration fees | | | 5,245 | | | | 1,544 | | | | 53,874 | | |
Interest expense | | | 1,379 | | | | 365 | | | | 37,917 | | |
Other | | | 6,938 | | | | 1,958 | | | | 68,328 | | |
Excise taxes | | | — | | | | 24,670 | | | | — | | |
Total expenses | | | 583,148 | | | | 223,463 | | | | 5,855,909 | | |
Recoupment of expenses of Adviser (Note 4) | | | 15,396 | | | | — | | | | 84,473 | | |
Less: Reimbursement of expenses from Adviser (Note 4) | | | (24,428 | ) | | | (53,475 | ) | | | (77,085 | ) | |
Net expenses | | | 574,116 | | | | 169,988 | | | | 5,863,297 | | |
Net investment income (loss) | | | 1,072,573 | | | | (145,308 | ) | | | (4,342,646 | ) | |
Realized and unrealized loss on investments: | |
Net realized loss on:
Investments | | | (4,472,093 | ) | | | — | | | | — | | |
Swap contracts | | | (1,898,954 | ) | | | (429,248 | ) | | | (12,286,486 | ) | |
| | | | (6,371,047 | ) | | | (429,248 | ) | | | (12,286,486 | ) | |
Capital gain distributions from regulated investment companies | | | 25 | | | | 7 | | | | 476 | | |
Change in net unrealized depreciation on: | |
Investments | | | (2,304,073 | ) | | | (241,506 | ) | | | (12,210,136 | ) | |
Swap contracts | | | (10,022 | ) | | | (2,232,714 | ) | | | (198,521,457 | ) | |
| | | | (2,314,095 | ) | | | (2,474,220 | ) | | | (210,731,593 | ) | |
Net realized and unrealized loss | | | (8,685,117 | ) | | | (2,903,461 | ) | | | (223,017,603 | ) | |
Net decrease in net assets resulting from operations | | $ | (7,612,544 | ) | | $ | (3,048,769 | ) | | $ | (227,360,249 | ) | |
The accompanying notes are an integral part of these financial statements.
DIREXION ANNUAL REPORT
34
Statements of Operations
For the Year Ended August 31, 2022
| | | Direxion Monthly
S&P 500 Bull
1.75X Fund | | Direxion Monthly
S&P 500 Bear
1.75X Fund | | Direxion Monthly
Small Cap Bull
1.75X Fund | |
Investment Income: | |
Dividend income | | $ | 245,630 | | | $ | — | | | $ | 24,923 | | |
Interest income | | | 207,124 | | | | 37,083 | | | | 27,028 | | |
Total investment income | | | 452,754 | | | | 37,083 | | | | 51,951 | | |
Expenses: | |
Investment advisory fees (Note 4) | | | 846,645 | | | | 54,271 | | | | 113,206 | | |
Distribution expenses (Note 4) | | | 282,215 | | | | 18,090 | | | | 37,736 | | |
Accounting fees | | | 120,137 | | | | 7,701 | | | | 16,064 | | |
State registration fees | | | 64,971 | | | | 21,681 | | | | 29,349 | | |
Professional fees | | | 60,526 | | | | 13,265 | | | | 16,755 | | |
Trustees' fees | | | 35,448 | | | | 2,273 | | | | 4,736 | | |
Management service fees (Note 4) | | | 27,842 | | | | 1,788 | | | | 3,717 | | |
Licensing fees | | | 22,653 | | | | 15,001 | | | | 10,566 | | |
Report to shareholders | | | 21,752 | | | | 1,394 | | | | 2,908 | | |
Insurance fees | | | 14,981 | | | | 960 | | | | 2,002 | | |
Administration fees | | | 13,859 | | | | 896 | | | | 1,851 | | |
Interest expense | | | 12,486 | | | | 207 | | | | 667 | | |
Other | | | 17,334 | | | | 1,075 | | | | 2,323 | | |
Total expenses | | | 1,540,849 | | | | 138,602 | | | | 241,880 | | |
Recoupment of expenses of Adviser (Note 4) | | | 35,941 | | | | — | | | | 550 | | |
Less: Reimbursement of expenses from Adviser (Note 4) | | | (40,440 | ) | | | (40,678 | ) | | | (38,003 | ) | |
Net expenses | | | 1,536,350 | | | | 97,924 | | | | 204,427 | | |
Net investment loss | | | (1,083,596 | ) | | | (60,841 | ) | | | (152,476 | ) | |
Realized and unrealized gain (loss) on investments: | |
Net realized loss on:
Investments | | | — | | | | — | | | | (73,488 | ) | |
Swap contracts | | | (136,594 | ) | | | (409,600 | ) | | | (6,203,832 | ) | |
| | | | (136,594 | ) | | | (409,600 | ) | | | (6,277,320 | ) | |
Capital gain distributions from regulated investment companies | | | 97 | | | | 6 | | | | 40 | | |
Change in net unrealized appreciation (depreciation) on: | |
Investments | | | (3,253,156 | ) | | | — | | | | (343,714 | ) | |
Swap contracts | | | (25,829,967 | ) | | | 1,245,977 | | | | (445,973 | ) | |
| | | | (29,083,123 | ) | | | 1,245,977 | | | | (789,687 | ) | |
Net realized and unrealized gain (loss) | | | (29,219,620 | ) | | | 836,383 | | | | (7,066,967 | ) | |
Net increase (decrease) in net assets resulting
from operations | | $ | (30,303,216 | ) | | $ | 775,542 | | | $ | (7,219,443 | ) | |
The accompanying notes are an integral part of these financial statements.
DIREXION ANNUAL REPORT
35
Statements of Operations
For the Year Ended August 31, 2022
| | | Direxion Monthly
Small Cap Bear
1.75X Fund | | Direxion Monthly
7-10 Year Treasury
Bull 1.75X Fund | | Direxion Monthly
7-10 Year Treasury
Bear 1.75X Fund | |
Investment Income: | |
Dividend income | | $ | — | | | $ | 64,657 | | | $ | — | | |
Interest income | | | 21,766 | | | | 15,440 | | | | 19,656 | | |
Total investment income | | | 21,766 | | | | 80,097 | | | | 19,656 | | |
Expenses: | |
Investment advisory fees (Note 4) | | | 34,012 | | | | 103,339 | | | | 38,827 | | |
State registration fees | | | 30,804 | | | | 22,635 | | | | 19,547 | | |
Professional fees | | | 12,031 | | | | 16,217 | | | | 12,359 | | |
Distribution expenses (Note 4) | | | 11,337 | | | | 34,446 | | | | 12,942 | | |
Accounting fees | | | 4,826 | | | | 14,663 | | | | 5,509 | | |
Licensing fees | | | 3,174 | | | | 21,776 | | | | 21,776 | | |
Trustees' fees | | | 1,430 | | | | 4,333 | | | | 1,634 | | |
Management service fees (Note 4) | | | 1,121 | | | | 3,387 | | | | 1,275 | | |
Report to shareholders | | | 874 | | | | 2,655 | | | | 998 | | |
Insurance fees | | | 604 | | | | 1,831 | | | | 691 | | |
Administration fees | | | 561 | | | | 1,686 | | | | 641 | | |
Interest expense | | | 179 | | | | 275 | | | | 1,110 | | |
Other | | | 626 | | | | 2,377 | | | | 705 | | |
Total expenses | | | 101,579 | | | | 229,620 | | | | 118,014 | | |
Less: Reimbursement of expenses from Adviser (Note 4) | | | (40,158 | ) | | | (43,334 | ) | | | (46,998 | ) | |
Net expenses | | | 61,421 | | | | 186,286 | | | | 71,016 | | |
Net investment loss | | | (39,655 | ) | | | (106,189 | ) | | | (51,360 | ) | |
Realized and unrealized gain (loss) on investments: | |
Net realized gain (loss) on:
Investments | | | — | | | | (147,806 | ) | | | — | | |
Swap contracts | | | 190,128 | | | | (2,857,669 | ) | | | 510,729 | | |
| | | | 190,128 | | | | (3,005,475 | ) | | | 510,729 | | |
Capital gain distributions from regulated investment companies | | | 12 | | | | 30 | | | | 5 | | |
Change in net unrealized appreciation (depreciation) on: | |
Investments | | | — | | | | (461,132 | ) | | | — | | |
Swap contracts | | | 143,374 | | | | (358,638 | ) | | | 478,207 | | |
| | | | 143,374 | | | | (819,770 | ) | | | 478,207 | | |
Net realized and unrealized gain (loss) | | | 333,514 | | | | (3,825,215 | ) | | | 988,941 | | |
Net increase (decrease) in net assets resulting
from operations | | $ | 293,859 | | | $ | (3,931,404 | ) | | $ | 937,581 | | |
The accompanying notes are an integral part of these financial statements.
DIREXION ANNUAL REPORT
36
Statements of Changes in Net Assets
| | | Direxion Monthly
High Yield Bull 1.2X Fund | | Direxion Monthly
NASDAQ-100 Bull 1.25X Fund | |
| | | Year Ended
August 31, 2022 | | Year Ended
August 31, 2021 | | Year Ended
August 31, 2022 | | Year Ended
August 31, 2021 | |
Increase (Decrease) in net assets from: | |
Operations: | |
Net investment income (loss) | | $ | 1,072,573 | | | $ | 1,451,221 | | | $ | (145,308 | ) | | $ | (219,279 | ) | |
Net realized gain (loss) | | | (6,371,047 | ) | | | 1,552,636 | | | | (429,248 | ) | | | 6,616,201 | | |
Capital gain distributions from
regulated investment companies | | | 25 | | | | — | | | | 7 | | | | — | | |
Change in net unrealized appreciation
(depreciation) | | | (2,314,095 | ) | | | 1,040,108 | | | | (2,474,220 | ) | | | 760,825 | | |
Net increase (decrease) in net assets
resulting from operations | | | (7,612,544 | ) | | | 4,043,965 | | | | (3,048,769 | ) | | | 7,157,747 | | |
Distributions to shareholders: | |
Net distributions to shareholders | | | (1,072,598 | ) | | | (1,451,221 | ) | | | (1,121,123 | ) | | | (1,489,592 | ) | |
Return of capital | | | (25,379 | ) | | | (39,771 | ) | | | — | | | | — | | |
Total distributions | | | (1,097,977 | ) | | | (1,490,992 | ) | | | (1,121,123 | ) | | | (1,489,592 | ) | |
Capital share transactions: | |
Net increase (decrease) in net
assets resulting from net
change capital share transactions(a) | | | (63,611,438 | ) | | | 14,670,895 | | | | (9,488,754 | ) | | | 1,090,944 | | |
Total increase (decrease) in net assets | | | (72,321,959 | ) | | | 17,223,868 | | | | (13,658,646 | ) | | | 6,759,099 | | |
Net assets: | |
Beginning of year | | | 91,324,330 | | | | 74,100,462 | | | | 20,939,979 | | | | 14,180,880 | | |
End of year | | $ | 19,002,371 | | | $ | 91,324,330 | | | $ | 7,281,333 | | | $ | 20,939,979 | | |
(a) Summary of capital share transactions is as follows:
| | | Direxion Monthly High Yield Bull 1.2X Fund | |
| | | Year Ended
August 31, 2022 | | Year Ended
August 31, 2021 | |
| | | Shares | | Value | | Shares | | Value | |
Shares sold | | | 65,364,368 | | | $ | 1,265,332,487 | | | | 45,095,019 | | | $ | 941,711,163 | | |
Shares issued in reinvestment of distributions | | | 50,719 | | | | 955,739 | | | | 61,875 | | | | 1,305,925 | | |
Shares redeemed | | | (68,514,147 | ) | | | (1,329,899,664 | ) | | | (44,566,016 | ) | | | (928,346,193 | ) | |
Net increase (decrease) | | | (3,099,060 | ) | | $ | (63,611,438 | ) | | | 590,878 | | | $ | 14,670,895 | | |
| | | Direxion Monthly NASDAQ-100 Bull 1.25X Fund | |
| | | Year Ended
August 31, 2022 | | Year Ended
August 31, 2021 | |
| | | Shares | | Value | | Shares | | Value | |
Shares sold | | | 1,065,226 | | | $ | 65,986,672 | | | | 3,776,487 | | | $ | 201,907,198 | | |
Shares issued in reinvestment of distributions | | | 17,405 | | | | 1,121,123 | | | | 30,005 | | | | 1,489,593 | | |
Shares redeemed | | | (1,237,489 | ) | | | (76,596,549 | ) | | | (3,756,706 | ) | | | (202,305,847 | ) | |
Net increase (decrease) | | | (154,858 | ) | | $ | (9,488,754 | ) | | | 49,786 | | | $ | 1,090,944 | | |
The accompanying notes are an integral part of these financial statements.
DIREXION ANNUAL REPORT
37
Statements of Changes in Net Assets
| | | Direxion Monthly
NASDAQ-100 Bull 1.75X Fund | | Direxion Monthly
S&P 500 Bull 1.75X Fund | |
| | | Year Ended
August 31, 2022 | | Year Ended
August 31, 2021 | | Year Ended
August 31, 2022 | | Year Ended
August 31, 2021 | |
Increase (Decrease) in net assets from: | |
Operations: | |
Net investment loss | | $ | (4,342,646 | ) | | $ | (5,668,895 | ) | | $ | (1,083,596 | ) | | $ | (1,293,520 | ) | |
Net realized gain (loss) | | | (12,286,486 | ) | | | 240,620,662 | | | | (136,594 | ) | | | 34,630,369 | | |
Capital gain distributions from
regulated investment companies | | | 476 | | | | — | | | | 97 | | | | — | | |
Change in net unrealized appreciation
(depreciation) | | | (210,731,593 | ) | | | (27,407,117 | ) | | | (29,083,123 | ) | | | 21,595,222 | | |
Net increase (decrease) in net assets
resulting from operations | | | (227,360,249 | ) | | | 207,544,650 | | | | (30,303,216 | ) | | | 54,932,071 | | |
Distributions to shareholders: | |
Net distributions to shareholders | | | (65,443,199 | ) | | | (41,497,965 | ) | | | (10,832,010 | ) | | | (1,789,361 | ) | |
Total distributions | | | (65,443,199 | ) | | | (41,497,965 | ) | | | (10,832,010 | ) | | | (1,789,361 | ) | |
Capital share transactions: | |
Net increase (decrease) in net
assets resulting from net
change capital share transactions(a) | | | (29,097,368 | ) | | | 1,704,938 | | | | 2,042,935 | | | | (21,598,016 | ) | |
Total increase (decrease) in net assets | | | (321,900,816 | ) | | | 167,751,623 | | | | (39,092,291 | ) | | | 31,544,694 | | |
Net assets: | |
Beginning of year | | | 595,324,111 | | | | 427,572,488 | | | | 124,964,027 | | | | 93,419,333 | | |
End of year | | $ | 273,423,295 | | | $ | 595,324,111 | | | $ | 85,871,736 | | | $ | 124,964,027 | | |
(a) Summary of capital share transactions is as follows:
| | | Direxion Monthly NASDAQ-100 Bull 1.75X Fund | |
| | | Year Ended
August 31, 2022 | | Year Ended
August 31, 2021 | |
| | | Shares | | Value | | Shares | | Value | |
Shares sold | | | 5,943,806 | | | $ | 396,980,772 | | | | 11,960,615 | | | $ | 720,058,705 | | |
Shares issued in reinvestment of distributions | | | 816,074 | | | | 64,938,722 | | | | 780,527 | | | | 41,179,977 | | |
Shares redeemed | | | (7,558,298 | ) | | | (491,016,862 | ) | | | (12,940,009 | ) | | | (759,533,744 | ) | |
Net increase (decrease) | | | (798,418 | ) | | $ | (29,097,368 | ) | | | (198,867 | ) | | $ | 1,704,938 | | |
| | | Direxion Monthly S&P 500 Bull 1.75X Fund | |
| | | Year Ended
August 31, 2022 | | Year Ended
August 31, 2021 | |
| | | Shares | | Value | | Shares | | Value | |
Shares sold | | | 6,506,652 | | | $ | 336,165,445 | | | | 5,823,352 | | | $ | 256,649,269 | | |
Shares issued in reinvestment of distributions | | | 180,659 | | | | 10,750,672 | | | | 45,175 | | | | 1,780,830 | | |
Shares redeemed | | | (6,685,803 | ) | | | (344,873,182 | ) | | | (6,299,058 | ) | | | (280,028,115 | ) | |
Net increase (decrease) | | | 1,508 | | | $ | 2,042,935 | | | | (430,531 | ) | | $ | (21,598,016 | ) | |
The accompanying notes are an integral part of these financial statements.
DIREXION ANNUAL REPORT
38
Statements of Changes in Net Assets
| | | Direxion Monthly
S&P 500 Bear 1.75X Fund | | Direxion Monthly
Small Cap Bull 1.75X Fund | |
| | | Year Ended
August 31, 2022 | | Year Ended
August 31, 2021 | | Year Ended
August 31, 2022 | | Year Ended
August 31, 2021 | |
Increase (Decrease) in net assets from: | |
Operations: | |
Net investment loss | | $ | (60,841 | ) | | $ | (108,066 | ) | | $ | (152,476 | ) | | $ | (271,856 | ) | |
Net realized gain (loss) | | | (409,600 | ) | | | (3,974,640 | ) | | | (6,277,320 | ) | | | 10,450,901 | | |
Capital gain distributions from
regulated investment companies | | | 6 | | | | — | | | | 40 | | | | — | | |
Change in net unrealized appreciation
(depreciation) | | | 1,245,977 | | | | (592,700 | ) | | | (789,687 | ) | | | 388,553 | | |
Net increase (decrease) in net assets
resulting from operations | | | 775,542 | | | | (4,675,406 | ) | | | (7,219,443 | ) | | | 10,567,598 | | |
Distributions to shareholders: | |
Net distributions to shareholders | | | — | | | | — | | | | (174,006 | ) | | | — | | |
Total distributions | | | — | | | | — | | | | (174,006 | ) | | | — | | |
Capital share transactions: | |
Net increase (decrease) in net
assets resulting from net
change capital share transactions(a) | | | 5,713,022 | | | | 718,122 | | | | (5,543,394 | ) | | | (1,015,568 | ) | |
Total increase (decrease) in net assets | | | 6,488,564 | | | | (3,957,284 | ) | | | (12,936,843 | ) | | | 9,552,030 | | |
Net assets: | |
Beginning of year | | | 5,810,589 | | | | 9,767,873 | | | | 23,513,804 | | | | 13,961,774 | | |
End of year | | $ | 12,299,153 | | | $ | 5,810,589 | | | $ | 10,576,961 | | | $ | 23,513,804 | | |
(a) Summary of capital share transactions is as follows:
| | | Direxion Monthly S&P 500 Bear 1.75X Fund | |
| | | Year Ended
August 31, 2022 | | Year Ended
August 31, 2021 | |
| | | Shares | | Value | | Shares | | Value | |
Shares sold | | | 12,010,082 | | | $ | 42,610,582 | | | | 5,313,462 | | | $ | 26,267,692 | | |
Shares redeemed | | | (10,467,432 | ) | | | (36,897,560 | ) | | | (5,140,993 | ) | | | (25,549,570 | ) | |
Net increase | | | 1,542,650 | | | $ | 5,713,022 | | | | 172,469 | | | $ | 718,122 | | |
| | | Direxion Monthly Small Cap Bull 1.75X Fund | |
| | | Year Ended
August 31, 2022 | | Year Ended
August 31, 2021 | |
| | | Shares | | Value | | Shares | | Value | |
Shares sold | | | 422,525 | | | $ | 40,924,205 | | | | 764,221 | | | $ | 74,998,544 | | |
Shares issued in reinvestment of distributions | | | 1,596 | | | | 171,822 | | | | — | | | | — | | |
Shares redeemed | | | (480,726 | ) | | | (46,639,421 | ) | | | (805,891 | ) | | | (76,014,112 | ) | |
Net decrease | | | (56,605 | ) | | $ | (5,543,394 | ) | | | (41,670 | ) | | $ | (1,015,568 | ) | |
The accompanying notes are an integral part of these financial statements.
DIREXION ANNUAL REPORT
39
Statements of Changes in Net Assets
| | | Direxion Monthly
Small Cap Bear 1.75X Fund | | Direxion Monthly
7-10 Year Treasury Bull 1.75X Fund | |
| | | Year Ended
August 31, 2022 | | Year Ended
August 31, 2021 | | Year Ended
August 31, 2022 | | Year Ended
August 31, 2021 | |
Increase (Decrease) in net assets from: | |
Operations: | |
Net investment loss | | $ | (39,655 | ) | | $ | (76,438 | ) | | $ | (106,189 | ) | | $ | (316,115 | ) | |
Net realized gain (loss) | | | 190,128 | | | | (5,056,568 | ) | | | (3,005,475 | ) | | | (2,946,832 | ) | |
Capital gain distributions from
regulated investment companies | | | 12 | | | | — | | | | 30 | | | | — | | |
Change in net unrealized appreciation
(depreciation) | | | 143,374 | | | | (128,547 | ) | | | (819,770 | ) | | | 50,970 | | |
Net increase (decrease) in net assets
resulting from operations | | | 293,859 | | | | (5,261,553 | ) | | | (3,931,404 | ) | | | (3,211,977 | ) | |
Distributions to shareholders: | |
Net distributions to shareholders | | | — | | | | — | | | | — | | | | (859,289 | ) | |
Total distributions | | | — | | | | — | | | | — | | | | (859,289 | ) | |
Capital share transactions: | |
Net increase (decrease) in net
assets resulting from net
change capital share transactions(a) | | | 2,501,797 | | | | 3,478,029 | | | | (16,286,689 | ) | | | (20,209,237 | ) | |
Total increase (decrease) in net assets | | | 2,795,656 | | | | (1,783,524 | ) | | | (20,218,093 | ) | | | (24,280,503 | ) | |
Net assets: | |
Beginning of year | | | 2,563,719 | | | | 4,347,243 | | | | 25,364,476 | | | | 49,644,979 | | |
End of year | | $ | 5,359,375 | | | $ | 2,563,719 | | | $ | 5,146,383 | | | $ | 25,364,476 | | |
(a) Summary of capital share transactions is as follows:
| | | Direxion Monthly Small Cap Bear 1.75X Fund | |
| | | Year Ended
August 31, 2022 | | Year Ended
August 31, 2021 | |
| | | Shares | | Value | | Shares | | Value | |
Shares sold | | | 13,910,680 | | | $ | 54,563,818 | | | | 26,159,964 | | | $ | 137,715,123 | | |
Shares redeemed | | | (13,473,170 | ) | | | (52,062,021 | ) | | | (25,906,796 | ) | | | (134,237,094 | ) | |
Net increase | | | 437,510 | | | $ | 2,501,797 | | | | 253,168 | | | $ | 3,478,029 | | |
| | | Direxion Monthly 7-10 Year Treasury Bull 1.75X Fund | |
| | | Year Ended
August 31, 2022 | | Year Ended
August 31, 2021 | |
| | | Shares | | Value | | Shares | | Value | |
Shares sold | | | 1,875,817 | | | $ | 62,638,945 | | | | 3,620,260 | | | $ | 139,032,890 | | |
Shares issued in reinvestment of distributions | | | — | | | | — | | | | 21,478 | | | | 856,209 | | |
Shares redeemed | | | (2,366,823 | ) | | | (78,925,634 | ) | | | (4,144,153 | ) | | | (160,098,336 | ) | |
Net decrease | | | (491,006 | ) | | $ | (16,286,689 | ) | | | (502,415 | ) | | $ | (20,209,237 | ) | |
The accompanying notes are an integral part of these financial statements.
DIREXION ANNUAL REPORT
40
Statements of Changes in Net Assets
| | | Direxion Monthly
7-10 Year Treasury Bear 1.75X Fund | |
| | | Year Ended
August 31, 2022 | | Year Ended
August 31, 2021 | |
Increase (Decrease) in net assets from: | |
Operations: | |
Net investment loss | | $ | (51,360 | ) | | $ | (53,974 | ) | |
Net realized gain | | | 510,729 | | | | 73,757 | | |
Capital gain distributions from regulated investment companies | | | 5 | | | | — | | |
Change in net unrealized appreciation (depreciation) | | | 478,207 | | | | (465,432 | ) | |
Net increase (decrease) in net assets resulting from operations | | | 937,581 | | | | (445,649 | ) | |
Net distributions to shareholders | | | — | | | | — | | |
Capital share transactions: | |
Net increase (decrease) in net assets resulting from net change capital share
transactions(a) | | | (7,560,441 | ) | | | 8,381,488 | | |
Total increase (decrease) in net assets | | | (6,622,860 | ) | | | 7,935,839 | | |
Net assets: | |
Beginning of year | | | 9,273,268 | | | | 1,337,429 | | |
End of year | | $ | 2,650,408 | | | $ | 9,273,268 | | |
(a) Summary of capital share transactions is as follows:
| | | Direxion Monthly 7-10 Year Treasury Bear 1.75X Fund | |
| | | Year Ended
August 31, 2022 | | Year Ended
August 31, 2021 | |
| | | Shares | | Value | | Shares | | Value | |
Shares sold | | | 482,280 | | | $ | 11,710,372 | | | | 792,298 | | | $ | 17,441,980 | | |
Shares redeemed | | | (817,839 | ) | | | (19,270,813 | ) | | | (424,309 | ) | | | (9,060,492 | ) | |
Net increase (decrease) | | | (335,559 | ) | | $ | (7,560,441 | ) | | | 367,989 | | | $ | 8,381,488 | | |
The accompanying notes are an integral part of these financial statements.
DIREXION ANNUAL REPORT
41
Financial Highlights
August 31, 2022
| | | | | RATIOS TO AVERAGE NET ASSETS7 | | | |
| | | Net Asset
Value,
Beginning
of Year | | Net
Investment
Income
(Loss)1,2 | | Net
Investment
Income
(Loss)1,3 | | Net Realized
and Unrealized
Gain (Loss)
on Investments4 | | Net Increase
(Decrease) in
Net Asset
Value Resulting
from Operations | | Dividends
from Net
Investment
Income | | Distributions
from
Realized
Capital Gains | | Return of
Capital
Distribution | | Total
Distributions | | Net
Asset
Value,
End of
Year | | Total
Return5 | | Net
Assets,
End of
Year/
Period
(,000) | | Total
Expenses2 | | Net
Expenses2,6 | | Net Investment
Income (Loss)
after Expense
Reimbursement/
Recoupment2 | | Total
Expenses3 | | Net
Expenses3,6 | | Net Investment
Income (Loss)
after Expense
Reimbursement/
Recoupment3 | | Portfolio
Turnover
Rate8 | |
Direxion Monthly High Yield Bull 1.2X Fund | | | | | |
Year ended August 31, 2022 | | $ | 21.5738 | | | $ | 0.5016 | | | $ | 0.5022 | | | $ | (3.4969 | ) | | $ | (2.9953 | ) | | $ | (1.7801 | ) | | $ | — | | | $ | (0.0421 | ) | | $ | (1.8222 | ) | | $ | 16.7563 | | | | -14.45 | % | | $ | 19,002 | | | | 1.37 | % | | | 1.35 | % | | | 2.53 | % | | | 1.37 | % | | | 1.35 | % | | | 2.53 | % | | | 2,768 | % | |
Year ended August 31, 2021 | | | 20.3448 | | | | 0.4224 | | | | 0.4224 | | | | 1.2803 | | | | 1.7027 | | | | (0.4611 | ) | | | — | | | | (0.0126 | ) | | | (0.4737 | ) | | | 21.5738 | | | | 8.46 | % | | | 91,324 | | | | 1.33 | % | | | 1.35 | % | | | 2.00 | % | | | 1.33 | % | | | 1.35 | % | | | 2.00 | % | | | 1,181 | % | |
Year ended August 31, 2020 | | | 22.0134 | | | | 0.6235 | | | | 0.6237 | | | | (0.8951 | ) | | | (0.2716 | ) | | | (1.3765 | ) | | | — | | | | (0.0205 | ) | | | (1.3970 | ) | | | 20.3448 | | | | -0.66 | % | | | 74,100 | | | | 1.38 | % | | | 1.35 | % | | | 2.93 | % | | | 1.38 | % | | | 1.35 | % | | | 2.93 | % | | | 1,713 | % | |
Year ended August 31, 2019 | | | 23.5163 | | | | 0.9793 | | | | 0.9824 | | | | (0.1176 | ) | | | 0.8617 | | | | (2.2150 | ) | | | — | | | | (0.1496 | ) | | | (2.3646 | ) | | | 22.0134 | | | | 4.44 | % | | | 135,046 | | | | 1.40 | % | | | 1.37 | % | | | 4.39 | % | | | 1.38 | % | | | 1.35 | % | | | 4.41 | % | | | 1,488 | % | |
Year ended August 31, 2018 | | | 24.1461 | | | | 0.6932 | | | | 0.6936 | | | | (0.2775 | ) | | | 0.4157 | | | | (0.9561 | ) | | | (0.0894 | ) | | | | | (1.0455 | ) | | | 23.5163 | | | | 1.79 | % | | | 305,351 | | | | 1.33 | % | | | 1.33 | % | | | 2.93 | % | | | 1.33 | % | | | 1.33 | % | | | 2.93 | % | | | 1,218 | % | |
Direxion Monthly NASDAQ-100 Bull 1.25X Fund | | | | | |
Year ended August 31, 2022 | | | 65.5581 | | | | (0.6681 | ) | | | (0.5530 | ) | | | (15.8640 | ) | | | (16.5321 | ) | | | — | | | | (4.7768 | ) | | | — | | | | (4.7768 | ) | | | 44.2492 | | | | -27.50 | % | | | 7,281 | | | | 1.77 | % | | | 1.35 | % | | | (1.15 | )% | | | 1.57 | % | | | 1.15 | % | | | (0.95 | )% | | | 0 | % | |
Year ended August 31, 2021 | | | 52.5948 | | | | (0.6135 | ) | | | (0.6118 | ) | | | 17.6713 | | | | 17.0578 | | | | — | | | | (4.0945 | ) | | | — | | | | (4.0945 | ) | | | 65.5581 | | | | 34.93 | % | | | 20,940 | | | | 1.50 | % | | | 1.15 | % | | | (1.13 | )% | | | 1.50 | % | | | 1.15 | % | | | (1.13 | )% | | | 0 | % | |
Year ended August 31, 2020 | | | 32.4749 | | | | (0.1129 | ) | | | (0.0921 | ) | | | 22.5010 | | | | 22.3881 | | | | (2.2682 | ) | | | — | | | | — | | | | (2.2682 | ) | | | 52.5948 | | | | 72.08 | % | | | 14,181 | | | | 1.67 | % | | | 1.20 | % | | | (0.29 | )% | | | 1.62 | % | | | 1.15 | % | | | (0.24 | )% | | | 6,825 | % | |
Year ended August 31, 2019 | | | 33.1531 | | | | 0.3204 | | | | 0.3284 | | | | (0.8901 | ) | | | (0.5697 | ) | | | (0.1085 | ) | | | — | | | | — | | | | (0.1085 | ) | | | 32.4749 | | | | -1.67 | % | | | 17,314 | | | | 1.62 | % | | | 1.18 | % | | | 1.03 | % | | | 1.59 | % | | | 1.15 | % | | | 1.06 | % | | | 0 | % | |
Year ended August 31, 2018 | | | 28.5477 | | | | 0.0854 | | | | 0.0941 | | | | 8.8391 | | | | 8.9245 | | | | — | | | | (4.3191 | ) | | | — | | | | (4.3191 | ) | | | 33.1531 | | | | 33.39 | % | | | 2,295 | | | | 1.52 | % | | | 1.18 | % | | | 0.27 | % | | | 1.49 | % | | | 1.15 | % | | | 0.30 | % | | | 0 | % | |
Direxion Monthly NASDAQ-100 Bull 1.75X Fund | | | | | |
Year ended August 31, 2022 | | | 81.9788 | | | | (0.6215 | ) | | | (0.6161 | ) | | | (29.7191 | ) | | | (30.3406 | ) | | | — | | | | (9.3356 | ) | | | — | | | | (9.3356 | ) | | | 42.3026 | | | | -42.34 | % | | | 273,423 | | | | 1.33 | % | | | 1.34 | % | | | (0.99 | )% | | | 1.32 | % | | | 1.33 | % | | | (0.98 | )% | | | 0 | % | |
Year ended August 31, 2021 | | | 57.3092 | | | | (0.7967 | ) | | | (0.7894 | ) | | | 31.5245 | | | | 30.7278 | | | | — | | | | (6.0582 | ) | | | — | | | | (6.0582 | ) | | | 81.9788 | | | | 59.47 | % | | | 595,324 | | | | 1.33 | % | | | 1.36 | % | | | (1.29 | )% | | | 1.32 | % | | | 1.35 | % | | | (1.28 | )% | | | 0 | % | |
Year ended August 31, 2020 | | | 24.9700 | | | | (0.2361 | ) | | | (0.2205 | ) | | | 32.7351 | | | | 32.4990 | | | | (0.1598 | ) | | | — | | | | — | | | | (0.1598 | ) | | | 57.3092 | | | | 130.64 | % | | | 427,572 | | | | 1.42 | % | | | 1.40 | % | | | (0.71 | )% | | | 1.37 | % | | | 1.35 | % | | | (0.66 | )% | | | 124 | % | |
Year ended August 31, 2019 | | | 29.6100 | | | | 0.1400 | | | | 0.2200 | | | | (2.3400 | ) | | | (2.2000 | ) | | | — | | | | (2.4400 | ) | | | — | | | | (2.4400 | ) | | | 24.9700 | | | | -6.42 | % | | | 181,532 | | | | 1.69 | % | | | 1.66 | % | | | 0.59 | % | | | 1.38 | % | | | 1.35 | % | | | 0.90 | % | | | 0 | % | |
Year ended August 31, 2018 | | | 19.9200 | | | | (0.0400 | ) | | | 0.0100 | | | | 10.9500 | | | | 10.9100 | | | | — | | | | (1.2200 | ) | | | — | | | | (1.2200 | ) | | | 29.6100 | | | | 57.13 | % | | | 290,584 | | | | 1.57 | % | | | 1.55 | % | | | (0.16 | )% | | | 1.37 | % | | | 1.35 | % | | | 0.04 | % | | | 0 | % | |
Direxion Monthly S&P 500 Bull 1.75X Fund | | | | | |
Year ended August 31, 2022 | | | 59.6732 | | | | (0.5001 | ) | | | (0.4943 | ) | | | (13.3945 | ) | | | (13.8946 | ) | | | — | | | | (4.8024 | ) | | | — | | | | (4.8024 | ) | | | 40.9762 | | | | -25.79 | % | | | 85,872 | | | | 1.36 | % | | | 1.36 | % | | | (0.96 | )% | | | 1.35 | % | | | 1.35 | % | | | (0.95 | )% | | | 0 | % | |
Year ended August 31, 2021 | | | 37.0026 | | | | (0.5495 | ) | | | (0.5476 | ) | | | 23.9343 | | | | 23.3848 | | | | — | | | | (0.7142 | ) | | | — | | | | (0.7142 | ) | | | 59.6732 | | | | 64.19 | % | | | 124,964 | | | | 1.33 | % | | | 1.35 | % | | | (1.22 | )% | | | 1.33 | % | | | 1.35 | % | | | (1.22 | )% | | | 0 | % | |
Year ended August 31, 2020 | | | 27.4400 | | | | (0.0608 | ) | | | (0.0555 | ) | | | 9.9095 | | | | 9.8487 | | | | (0.2861 | ) | | | — | | | | — | | | | (0.2861 | ) | | | 37.0026 | | | | 36.00 | % | | | 93,419 | | | | 1.42 | % | | | 1.37 | % | | | (0.21 | )% | | | 1.40 | % | | | 1.35 | % | | | (0.19 | )% | | | 221 | % | |
Year ended August 31, 2019 | | | 31.6400 | | | | 0.1800 | | | | 0.2600 | | | | (1.3400 | ) | | | (1.1600 | ) | | | (0.0000 | )9 | | | (3.0400 | ) | | | — | | | | (3.0400 | ) | | | 27.4400 | | | | -2.70 | % | | | 60,598 | | | | 1.68 | % | | | 1.64 | % | | | 0.65 | % | | | 1.39 | % | | | 1.35 | % | | | 0.94 | % | | | 0 | % | |
Year ended August 31, 2018 | | | 24.9400 | | | | 0.00009 | | | | 0.0100 | | | | 8.6000 | | | | 8.6000 | | | | — | | | | (1.9000 | ) | | | — | | | | (1.9000 | ) | | | 31.6400 | | | | 35.87 | % | | | 115,024 | | | | 1.41 | % | | | 1.39 | % | | | 0.01 | % | | | 1.37 | % | | | 1.35 | % | | | 0.05 | % | | | 0 | % | |
Direxion Monthly S&P 500 Bear 1.75X Fund | | | | | |
Year ended August 31, 2022 | | | 3.3266 | | | | (0.0287 | ) | | | (0.0287 | ) | | | 0.4412 | | | | 0.4125 | | | | — | | | | — | | | | — | | | | — | | | | 3.7391 | | | | 12.40 | % | | | 12,299 | | | | 1.91 | % | | | 1.35 | % | | | (0.84 | )% | | | 1.91 | % | | | 1.35 | % | | | (0.84 | )% | | | 0 | % | |
Year ended August 31, 2021 | | | 6.2049 | | | | (0.0625 | ) | | | (0.0625 | ) | | | (2.8158 | ) | | | (2.8783 | ) | | | — | | | | — | | | | — | | | | — | | | | 3.3266 | | | | -46.39 | % | | | 5,811 | | | | 1.95 | % | | | 1.35 | % | | | (1.33 | )% | | | 1.95 | % | | | 1.35 | % | | | (1.33 | )% | | | 0 | % | |
Year ended August 31, 2020 | | | 10.7300 | | | | (0.0413 | ) | | | (0.0408 | ) | | | (4.3918 | ) | | | (4.4331 | ) | | | (0.0920 | ) | | | — | | | | — | | | | (0.0920 | ) | | | 6.2049 | | | | -41.58 | % | | | 9,768 | | | | 1.81 | % | | | 1.36 | % | | | (0.45 | )% | | | 1.80 | % | | | 1.35 | % | | | (0.44 | )% | | | 0 | % | |
Year ended August 31, 2019 | | | 11.8300 | | | | 0.1100 | | | | 0.1200 | | | | (1.2100 | ) | | | (1.1000 | ) | | | — | | | | — | | | | — | | | | — | | | | 10.7300 | | | | -9.30 | % | | | 10,913 | | | | 1.94 | % | | | 1.37 | % | | | 0.95 | % | | | 1.92 | % | | | 1.35 | % | | | 0.97 | % | | | 0 | % | |
Year ended August 31, 2018 | | | 16.8600 | | | | 0.00009 | | | | 0.00009 | | | | (5.0300 | ) | | | (5.0300 | ) | | | — | | | | — | | | | — | | | | — | | | | 11.8300 | | | | -29.83 | % | | | 6,117 | | | | 1.92 | % | | | 1.35 | % | | | 0.03 | % | | | 1.92 | % | | | 1.35 | % | | | 0.03 | % | | | 0 | % | |
Direxion Monthly Small Cap Bull 1.75X Fund | | | | | |
Year ended August 31, 2022 | | | 115.4318 | | | | (0.9595 | ) | | | (0.9553 | ) | | | (41.6395 | ) | | | (42.5990 | ) | | | — | | | | (0.9286 | ) | | | — | | | | (0.9286 | ) | | | 71.9042 | | | | -37.17 | % | | | 10,577 | | | | 1.60 | % | | | 1.35 | % | | | (1.01 | )% | | | 1.60 | % | | | 1.35 | % | | | (1.01 | )% | | | 33 | % | |
Year ended August 31, 2021 | | | 56.9002 | | | | (1.2566 | ) | | | (1.2558 | ) | | | 59.7882 | | | | 58.5316 | | | | — | | | | — | | | | — | | | | — | | | | 115.4318 | | | | 102.87 | % | | | 23,514 | | | | 1.54 | % | | | 1.35 | % | | | (1.28 | )% | | | 1.54 | % | | | 1.35 | % | | | (1.28 | )% | | | 0 | % | |
Year ended August 31, 2020 | | | 59.3800 | | | | (0.1257 | ) | | | (0.1100 | ) | | | (1.7271 | ) | | | (1.8528 | ) | | | (0.6270 | ) | | | — | | | | — | | | | (0.6270 | ) | | | 56.9002 | | | | -3.35 | % | | | 13,962 | | | | 1.66 | % | | | 1.38 | % | | | (0.22 | )% | | | 1.63 | % | | | 1.35 | % | | | (0.19 | )% | | | 172 | % | |
Year ended August 31, 2019 | | | 97.0400 | | | | 0.6100 | | | | 0.6700 | | | | (31.5200 | ) | | | (30.9100 | ) | | | (0.0700 | ) | | | (6.6800 | ) | | | — | | | | (6.7500 | ) | | | 59.3800 | | | | -32.04 | % | | | 13,647 | | | | 1.65 | % | | | 1.43 | % | | | 0.86 | % | | | 1.57 | % | | | 1.35 | % | | | 0.94 | % | | | 0 | % | |
Year ended August 31, 2018 | | | 64.7700 | | | | 0.0400 | | | | 0.0600 | | | | 32.2300 | | | | 32.2700 | | | | — | | | | — | | | | — | | | | — | | | | 97.0400 | | | | 49.82 | % | | | 25,160 | | | | 1.58 | % | | | 1.37 | % | | | 0.05 | % | | | 1.56 | % | | | 1.35 | % | | | 0.07 | % | | | 0 | % | |
Direxion Monthly Small Cap Bear 1.75X Fund | | | | | |
Year ended August 31, 2022 | | | 3.5753 | | | | (0.0366 | ) | | | (0.0365 | ) | | | 1.1031 | | | | 1.0665 | | | | — | | | | — | | | | — | | | | — | | | | 4.6418 | | | | 29.83 | % | | | 5,359 | | | | 2.24 | % | | | 1.35 | % | | | (0.87 | )% | | | 2.24 | % | | | 1.35 | % | | | (0.87 | )% | | | 0 | % | |
Year ended August 31, 2021 | | | 9.3710 | | | | (0.0684 | ) | | | (0.0683 | ) | | | (5.7273 | ) | | | (5.7957 | ) | | | — | | | | — | | | | — | | | | — | | | | 3.5753 | | | | -61.85 | % | | | 2,564 | | | | 2.12 | % | | | 1.35 | % | | | (1.33 | )% | | | 2.12 | % | | | 1.35 | % | | | (1.33 | )% | | | 0 | % | |
Year ended August 31, 2020 | | | 13.5900 | | | | (0.0569 | ) | | | (0.0545 | ) | | | (3.9990 | ) | | | (4.0559 | ) | | | (0.1631 | ) | | | — | | | | — | | | | (0.1631 | ) | | | 9.3710 | | | | -30.03 | % | | | 4,347 | | | | 1.94 | % | | | 1.37 | % | | | (0.42 | )% | | | 1.92 | % | | | 1.35 | % | | | (0.40 | )% | | | 0 | % | |
Year ended August 31, 2019 | | | 11.5700 | | | | 0.1100 | | | | 0.1100 | | | | 1.9100 | | | | 2.0200 | | | | — | | | | — | | | | — | | | | — | | | | 13.5900 | | | | 17.46 | % | | | 9,597 | | | | 1.92 | % | | | 1.39 | % | | | 0.76 | % | | | 1.88 | % | | | 1.35 | % | | | 0.80 | % | | | 0 | % | |
Year ended August 31, 2018 | | | 18.4100 | | | | 0.0100 | | | | 0.0100 | | | | (6.8500 | ) | | | (6.8400 | ) | | | — | | | | — | | | | — | | | | — | | | | 11.5700 | | | | -37.15 | % | | | 4,295 | | | | 2.06 | % | | | 1.35 | % | | | 0.04 | % | | | 2.06 | % | | | 1.35 | % | | | 0.04 | % | | | 0 | % | |
The accompanying notes are an integral part of these financial statements.
DIREXION ANNUAL REPORT
42
Financial Highlights
August 31, 2022
| | | | | RATIOS TO AVERAGE NET ASSETS7 | | | |
| | | Net Asset
Value,
Beginning
of Year | | Net
Investment
Income
(Loss)1,2 | | Net
Investment
Income
(Loss)1,3 | | Net Realized
and Unrealized
Gain (Loss)
on Investments4 | | Net Increase
(Decrease) in
Net Asset
Value Resulting
from Operations | | Dividends
from Net
Investment
Income | | Distributions
from
Realized
Capital Gains | | Return of
Capital
Distribution | | Total
Distributions | | Net
Asset
Value,
End of
Year | | Total
Return5 | | Net
Assets,
End of
Year/
Period
(,000) | | Total
Expenses2 | | Net
Expenses2,6 | | Net Investment
Income (Loss)
after Expense
Reimbursement/
Recoupment2 | | Total
Expenses3 | | Net
Expenses3,6 | | Net Investment
Income (Loss)
after Expense
Reimbursement/
Recoupment3 | | Portfolio
Turnover
Rate8 | |
Direxion Monthly 7-10 Year Treasury Bull 1.75X Fund | |
Year ended August 31, 2022 | | $ | 37.5442 | | | $ | (0.2642 | ) | | $ | (0.2636 | ) | | $ | (9.3990 | ) | | $ | (9.6632 | ) | | $ | — | | | $ | — | | | $ | — | | | $ | — | | | $ | 27.8810 | | | | -25.74 | % | | $ | 5,146 | | | | 1.66 | % | | | 1.35 | % | | | (0.77 | )% | | | 1.66 | % | | | 1.35 | % | | | (0.77 | )% | | | 144 | % | |
Year ended August 31, 2021 | | | 42.1433 | | | | (0.4026 | ) | | | (0.4024 | ) | | | (2.9204 | ) | | | (3.3230 | ) | | | — | | | | (1.2761 | ) | | | — | | | | (1.2761 | ) | | | 37.5442 | | | | -8.06 | % | | | 25,364 | | | | 1.44 | % | | | 1.35 | % | | | (1.04 | )% | | | 1.44 | % | | | 1.35 | % | | | (1.04 | )% | | | 0 | % | |
Year ended August 31, 2020 | | | 40.7800 | | | | (0.2072 | ) | | | (0.2050 | ) | | | 4.7203 | | | | 4.5131 | | | | (0.4677 | ) | | | (2.6821 | ) | | | — | | | | (3.1498 | ) | | | 42.1433 | | | | 12.49 | % | | | 49,645 | | | | 1.49 | % | | | 1.36 | % | | | (0.51 | )% | | | 1.48 | % | | | 1.35 | % | | | (0.50 | )% | | | 74 | % | |
Year ended August 31, 2019 | | | 32.9200 | | | | 0.3000 | | | | 0.3100 | | | | 7.5600 | | | | 7.8600 | | | | — | | | | — | | | | — | | | | — | | | | 40.7800 | | | | 23.88 | % | | | 47,172 | | | | 1.56 | % | | | 1.39 | % | | | 0.83 | % | | | 1.52 | % | | | 1.35 | % | | | 0.87 | % | | | 0 | % | |
Year ended August 31, 2018 | | | 36.0200 | | | | (0.0100 | ) | | | (0.0100 | ) | | | (3.0900 | ) | | | (3.1000 | ) | | | — | | | | — | | | | — | | | | — | | | | 32.9200 | | | | -8.61 | % | | | 9,232 | | | | 1.85 | % | | | 1.35 | % | | | (0.04 | )% | | | 1.85 | % | | | 1.35 | % | | | (0.04 | )% | | | 0 | % | |
Direxion Monthly 7-10 Year Treasury Bear 1.75X Fund | |
Year ended August 31, 2022 | | | 21.4288 | | | | (0.2380 | ) | | | (0.2328 | ) | | | 6.0801 | | | | 5.8421 | | | | — | | | | — | | | | — | | | | — | | | | 27.2709 | | | | 27.26 | % | | | 2,650 | | | | 2.28 | % | | | 1.37 | % | | | (0.99 | )% | | | 2.26 | % | | | 1.35 | % | | | (0.97 | )% | | | 0 | % | |
Year ended August 31, 2021 | | | 20.6527 | | | | (0.2934 | ) | | | (0.2934 | ) | | | 1.0695 | | | | 0.7761 | | | | — | | | | — | | | | — | | | | — | | | | 21.4288 | | | | 3.76 | % | | | 9,273 | | | | 2.57 | % | | | 1.35 | % | | | (1.34 | )% | | | 2.57 | % | | | 1.35 | % | | | (1.34 | )% | | | 0 | % | |
Year ended August 31, 2020 | | | 24.3400 | | | | (0.0606 | ) | | | (0.0606 | ) | | | (3.3051 | ) | | | (3.3657 | ) | | | (0.3216 | ) | | | — | | | | — | | | | (0.3216 | ) | | | 20.6527 | | | | -14.07 | % | | | 1,337 | | | | 4.34 | % | | | 1.35 | % | | | (0.26 | )% | | | 4.34 | % | | | 1.35 | % | | | (0.26 | )% | | | 0 | % | |
Year ended August 31, 2019 | | | 30.5600 | | | | 0.2600 | | | | 0.2600 | | | | (6.4800 | ) | | | (6.2200 | ) | | | — | | | | — | | | | — | | | | — | | | | 24.3400 | | | | -20.35 | % | | | 2,332 | | | | 3.54 | % | | | 1.35 | % | | | 0.89 | % | | | 3.54 | % | | | 1.35 | % | | | 0.89 | % | | | 0 | % | |
Year ended August 31, 2018 | | | 28.3400 | | | | (0.0200 | ) | | | (0.0200 | ) | | | 2.2400 | | | | 2.2200 | | | | — | | | | — | | | | — | | | | — | | | | 30.5600 | | | | 7.83 | % | | | 2,975 | | | | 2.30 | % | | | 1.35 | % | | | (0.07 | )% | | | 2.30 | % | | | 1.35 | % | | | (0.07 | )% | | | 0 | % | |
1 Net investment income (loss) per share represents net investment income (loss) divided by the daily average shares of beneficial interest outstanding throughout each year.
2 Includes interest expense and extraordinary expense which is comprised of excise tax expense.
3 Excludes interest expense and extraordinary expense which is comprised of excise tax expense.
4 Due to the timing of sales and redemptions of capital shares, the net realized and unrealized gain (loss) per share will not equal the Fund's changes in net realized and unrealized gain (loss) on investments, futures and swaps for the period.
5 Total return is calculated assuming an initial investment made at the net asset value at the beginning of the period, reinvestment of all dividends and distributions at the net asset value during the period and redemption on the last day of the period. Total return calculated for a period of less than one year is not annualized. The total return would have been lower if certain expenses had not been reimbursed by the investment adviser.
6 Net expenses include effects of any reimbursement or recoupment.
7 For periods less than one year, these ratios are annualized.
8 Portfolio turnover is not annualized and does not include effects of turnover of the swap or future contracts portfolio. Short-term securities with maturities less than or equal to 365 days are also excluded from portfolio turnover calculation.
9 Amount is less than $0.01 per share.
The accompanying notes are an integral part of these financial statements.
DIREXION ANNUAL REPORT
43
Direxion Funds
Notes to the Financial Statements
August 31, 2022
1. ORGANIZATION
Direxion Funds (the "Trust") was organized as a Massachusetts Business Trust on June 6, 1997 and is registered under the Investment Company Act of 1940, as amended (the "1940 Act"), as an open-end management investment company issuing its shares in series, each series representing a distinct portfolio with its own investment objective and policies. The Trust currently has 10 series, of which 9 are included in this report: Direxion Monthly High Yield Bull 1.2X Fund, Direxion Monthly NASDAQ-100® Bull 1.25X Fund, Direxion Monthly NASDAQ-100® Bull 1.75X Fund1 (formerly Direxion Monthly NASDAQ-100® Bull 2X Fund), Direxion Monthly S&P 500® Bull 1.75X Fund1 (formerly Direxion Monthly S&P 500® Bull 2X Fund), Direxion Monthly S&P 500® Bear 1.75X Fund1 (formerly Direxion Monthly S&P 500® Bear 2X Fund), Direxion Monthly Small Cap Bull 1.75X Fund1 (formerly Direxion Monthly Small Cap Bull 2X Fund), Direxion Monthly Small Cap Bear 1.75X Fund1 (formerly Direxion Monthly Small Cap Bear 2X Fund), Direxion Monthly 7-10 Year Treasury Bull 1.75X Fund1 (formerly Direxion Monthly 7-10 Year Treasury Bull 2X Fund) and Direxion Monthly 7-10 Year Treasury Bear 1.75X Fund1 (formerly Direxion Monthly 7-10 Year Treasury Bear 2X Fund) (each a "Fund" and collectively, the "Funds"). Each Fund is a non-diversified series of the Trust pursuant to the 1940 Act. The 9 Funds included in this report offer only Investor Class shares.
Rafferty Asset Management, LLC (the "Adviser") has registered as a commodity pool operator ("CPO") and the Funds are considered commodity pools under the Commodity Exchange Act (the "CEA"). Accordingly, the Advisor is subject to registration and regulation as a CPO under the CEA and must comply with various regulatory requirements under the CEA and the rules and regulations of the Commodity Futures Trading Commission and the National Futures Association, including investor protection requirements, antifraud provisions, disclosure requirements and reporting and recordkeeping requirements.
The Funds' investment objectives are to seek monthly investment results, before fees and expenses that correspond to the calendar month performance of a particular index or benchmark. The Funds with the word "Bull" in their name attempt to provide investment results that correlate positively to the return of an index or benchmark. The Funds with the word "Bear" in their name attempt to provide investment results that correlate negatively to the return of an index or benchmark.
Fund | | Index or Benchmark | | Monthly Target | |
Direxion Monthly High Yield Bull 1.2X Fund | | Solactive High Yield Beta Index | | | 120 | % | |
Direxion Monthly NASDAQ-100® Bull 1.25X Fund | | NASDAQ-100® Index | | | 125 | % | |
Direxion Monthly NASDAQ-100® Bull 1.75X Fund | | NASDAQ-100® Index | | | 175 | % | |
Direxion Monthly S&P 500® Bull 1.75X Fund | | S&P 500® Index | | | 175 | % | |
Direxion Monthly S&P 500® Bear 1.75X Fund | | | | | -175 | % | |
Direxion Monthly Small Cap Bull 1.75X Fund | | Russell 2000® Index | | | 175 | % | |
Direxion Monthly Small Cap Bear 1.75X Fund | | | | | -175 | % | |
Direxion Monthly 7-10 Year Treasury Bull 1.75X Fund | | ICE U.S. Treasury 7-10 Year Bond Index | | | 175 | % | |
Direxion Monthly 7-10 Year Treasury Bear 1.75X Fund | | | | | -175 | % | |
1 Effective August 1, 2022, these Funds' new investment objective and strategy changed to seek daily leveraged, or daily inverse leveraged, investment results, before fees and expenses, of 175% or -175%, as applicable, of the performance of their underlying index. Prior to August 1, 2022, the investment objective and strategy were 200% or -200%.
The Trust has evaluated the structure, objective and activities of the Funds and determined that they meet the characteristics of an investment company. As such, these financial statements have applied the guidance as set forth in the Accounting Standards Codifications ("ASC") 946, Financial Services – Investment Companies.
2. SIGNIFICANT ACCOUNTING POLICIES
The following is a summary of significant accounting policies consistently followed by the Funds in the preparation of their financial statements. These policies are in conformity with U.S. generally accepted accounting principles ("GAAP").
DIREXION ANNUAL REPORT
44
a) Cash Equivalents – The Funds consider investments in the U.S Bank Money Market Deposit Account, a U.S. dollar-denominated deposit account offered through U.S. Bank, to be cash equivalents. The Funds are exposed to the credit risk of U.S. Bank through these holdings of cash equivalents. These cash equivalents are presented on the Statements of Assets and Liabilities as "Cash equivalents" and were classified as Level 1 assets as of August 31, 2022.
b) Investment Valuation – The Net Asset Value ("NAV") of each Fund is determined daily, Monday through Friday, as of the close of regular trading on the New York Stock Exchange ("NYSE"), each day the NYSE is open for business. The value of all portfolio securities and other assets held by a Fund will be determined as of the time a Fund calculates its NAV, 4:00 p.m. Eastern Time ("Valuation Time"). On days that the Securities Industry and Financial Markets Association ("SIFMA") recommends that the bond markets close all day, the Direxion High Yield Bull 1.2X Fund, Direxion Monthly 7-10 Year Treasury Bull 1.75X Fund and the Direxion Monthly 7-10 Year Treasury Bear 1.75X Fund (the "Fixed Income Funds") do not calculate their NAVs even if the NYSE is open for business. Similarly, on days that SIFMA recommends that the bond markets close early, each of the Fixed Income Funds calculates its NAV as of the time of the recommended close, usually 2:00 p.m. Eastern Time, rather than the close of regular trading on the NYSE. Equity securities, exchange-traded funds ("ETFs") and over-the-counter securities are valued at their last sales price or, if not available, at the average of the last bid and ask prices. Securities primarily traded on the NASDAQ National Market are valued using the NASDAQ Official Closing Price. Swap contracts are valued using the closing price of the underlying reference entity or the closing value of the underlying reference index. Short-term debt securities with an original maturity of 60 days or less are valued using the amortized cost method. Investments in open-end mutual funds, including money market funds, are valued at their respective quoted NAV on the valuation date.
Other debt securities are valued by using the mean prices provided by the Funds' pricing service or, if such prices are unavailable, by a matrix pricing method. Securities for which reliable market quotations are not readily available, the Funds' pricing service does not provide a valuation for such securities, the Funds' pricing service provides valuation that in the judgment of the Adviser does not represent fair value, or the Fund or Adviser believes the market price is stale, are fair valued as determined by the Adviser under the supervision of the Board of Trustees. Additionally, the Adviser will monitor developments in the marketplace for significant events that may affect the value of those securities whose closing prices were established before the Valuation Time.
c) Swap Contracts – Each Fund may enter into equity swap contacts. Standard equity swap contracts are between two parties that agree to exchange the returns (or differentials in rates of return) earned or realized on particular predetermined investments or instruments. The gross amount to be exchanged is calculated with respect to a "notional amount" (i.e. the return on or increase in value of a particular dollar amount invested in a "basket" of securities representing a particular index or industry sector). A Fund enters into master netting agreements with the counterparty. These agreements calculate the obligations of the parties on a "net basis". Consequently, a Fund's current obligations under a swap agreement generally will be equal to the net amount to be paid or received under the agreement based on the relative value of the positions held by each party. A Fund's obligations are accrued daily and offset by any amounts owed to the Fund. However, a Fund does not offset the fair value amounts of the swap contract and the related collateral on the Statement of Assets and Liabilities arising from swap contracts executed with the same counterparty under such master netting agreements.
In a "long" equity swap agreement, the counterparty will generally agree to pay the Fund the amount, if any, by which the notional amount of the swap contract would have increased in value if the Fund had been invested in the particular securities, plus dividends that would have been received on those securities. The Fund will agree to pay the counterparty a floating rate of interest on the notional amount of the swap contract plus the amount, if any, by which the notional amount would have decreased in value had it been invested in such securities plus, in certain instances, commissions or trading spreads on the notional amounts. Thus, the return on the swap contract should be the gain or loss on the notional amount plus dividends on the securities less the interest paid by the Fund on the notional amount. In certain instances, market factors such as the interest rate environment and the demand to borrow the securities underlying the swap agreement can cause a scenario in which the counterparty will pay the Fund interest. Payments may be made at the conclusion of the contract or periodically during its term. Swap contracts do not include the delivery of securities. The net amount of the excess, if any, of the Fund's obligations over its entitlement with respect to each swap is accrued on a daily basis and an amount of cash or liquid assets, having an aggregate net asset value at least equal to such accrued excess is maintained in a segregated account. Until a swap contract is settled in cash, the gain or loss on the notional amount plus dividends on the securities less the interest paid by the Fund on the notional amount are recorded as "unrealized appreciation or depreciation on swaps" and when cash is exchanged, the gain or loss is recorded as "realized gains or losses on swaps."
DIREXION ANNUAL REPORT
45
Each Fund may enter into swap contracts that provide the opposite return of the underlying benchmark or security ("short" the index or security). The operations are similar to that of the swaps disclosed above except that the counterparty pays interest to the Fund on the notional amount outstanding and the dividends on the underlying securities reduce the return of the swap. However, in certain instances, market factors such as the interest rate environment and the demand to borrow the securities underlying the swap agreement can cause a scenario in which the Fund will pay the counterparty interest. These amounts are netted with any unrealized appreciation or depreciation to determine the value of the swap. The Funds will typically enter into equity swap agreements to obtain leverage in order to meet their objectives.
Accounting Standards Update No. 2013-01 "Disclosures about Offsetting Assets and Liabilities" ("ASU 2013-01"), requires entities to disclose (i) gross and net information about both instruments and transactions eligible for offset in the financial statements, and (ii) instruments and transactions subject to an agreement similar to a master netting agreement. ASU 2013-01 is limited in scope to the following financial instruments, to the extent they are offset in the financial statements or subject to an enforceable master netting arrangement or similar agreement: (i) recognized derivative instruments accounted for under ASC 815 (Derivatives and Hedging).
In order to better define its contractual rights and to secure rights that will help a Fund mitigate its counterparty risk , a Fund may enter into an International Swaps and Derivatives Association, Inc. Master Agreement ("ISDA Master Agreement") or similar agreement with its counterparties. An ISDA Master Agreement is a bilateral agreement between a Fund and a counterparty that governs over-the-counter derivatives ("OTC"), including swap contracts, and typically contains, among other things, collateral posting terms, netting and rights of set-off provisions in the event of a default and/or termination event. Under an ISDA Master Agreement, a Fund may, under certain circumstances, offset with the counterparty certain derivative financial instruments' payables and receivables to create a single net payment. The provisions of the ISDA Master Agreement typically permit a single net payment in the event of a default (close-out netting) or similar event, including the bankruptcy or insolvency of the counterparty.
Collateral requirements generally differ by type of derivative. Collateral terms are contract specific for OTC derivatives (e.g. swaps). Generally, for transactions traded under an ISDA Master Agreement, the collateral requirements are calculated by netting the marked-to-market amount for each transaction under such agreement and comparing that amount to the value of any collateral currently pledged by a Fund and the counterparty. Generally, the amount of collateral due from or to the counterparty must exceed a minimum transfer amount threshold before a transfer is required to be made. To the extent amounts due to a Fund from its derivatives counterparties are not fully collateralized, contractually or otherwise, the Fund bears the risk of loss from counterparty non-performance.
For financial reporting purposes, the Funds elect to not offset assets and liabilities subject to an ISDA Master Agreement, if any, in the Statements of Assets and Liabilities. Therefore, all qualifying transactions are presented on a gross basis in the Statements of Assets and Liabilities. As of August 31, 2022, the impact of netting of assets and liabilities and the offsetting of collateral pledged or received based on contractual netting/set-off provisions in the ISDA Master Agreement are detailed in the following pages.
In the event of the counterparty's default, bankruptcy or any other event for which the counterparty cannot meet its obligations, a Fund bears the risk of loss equal to the amount of the daily appreciation owed to the Fund. This obligation represents the daily gain accrued to the Fund from the close of business day prior to this event to the day on which this event occurs and the counterparty can no longer meet its obligations. A Fund will enter into swap agreements only with large, well-capitalized and established financial institutions. The creditworthiness of each of the firms that is a party to a swap agreement is monitored by the Adviser. Shareholders may obtain swap counterparty financial statements at www.sec.gov. Swap contracts are subject to credit risk. Credit risk occurs when the financial condition of an issuer of a security or instrument may cause it to default or become unable to pay interest or principal due on the security. The counterparty to a swap contract might default on its obligations. In addition, the Funds have agreements with certain counterparties with which it trades swap contracts that contain credit risk-related contingent features that could be triggered subject to certain circumstances. Such circumstances include agreed upon net asset value and performance-based thresholds. The maximum exposure to the Funds in regard to potential counterparty default and credit-risk related contingent features at August 31, 2022 is detailed in the following table. If such credit risk-related contingencies were triggered the counterparties would have the option to terminate any positions open under the master netting agreement.
DIREXION ANNUAL REPORT
46
Description: Swap Contract
Counterparty: Bank of America Merrill Lynch
| | | | | Assets: | | | | | | Liabilities: | | | |
| | | | | Gross Amounts not
offset in the Statement
of Asset and Liabilities | |
| |
| | Gross Amounts not
offset in the Statement
of Asset and Liabilities | | | |
Fund Name | | Gross
Amounts of
Recognized
Assets | | Financial
Instruments | | Collateral
Received | | Net
Amount2 | | Gross
Amounts of
Recognized
Liabilities | | Financial
Instruments | | Collateral
Pledged | | Net
Amount | |
Direxion Monthly
NASDAQ-100®
Bull 1.25X
Fund | | $ | — | | | $ | — | | | $ | — | | | $ | — | | | $ | 290,115 | | | $ | — | | | $ | 290,1151 | | | $ | — | | |
Direxion Monthly
NASDAQ-100®
Bull 1.75X
Fund | | | — | | | | — | | | | — | | | | — | | | | 2,906,561 | | | | — | | | | 2,906,5611 | | | | — | | |
Direxion Monthly
S&P 500® Bull
1.75X Fund | | | 989,254 | | | | — | | | | 989,2541 | | | | — | | | | — | | | | — | | | | — | | | | — | | |
Direxion Monthly
Small Cap Bull
1.75X Fund | | | 96,868 | | | | — | | | | 96,8681 | | | | — | | | | — | | | | — | | | | — | | | | — | | |
Direxion Monthly
7-10 Year
Treasury Bull
1.75X Fund | | | — | | | | — | | | | — | | | | — | | | | 32,993 | | | | — | | | | 32,9931 | | | | — | | |
1 The amount of collateral shown has been limited such that the net amount cannot be less than zero.
2 The amount shown is the maximum credit exposure of the Fund for the corresponding counterparty.
Description: Swap Contract
Counterparty: Credit Suisse International
| | | | | Assets: | | | | | | Liabilities: | | | |
| | | | | Gross Amounts not
offset in the Statement
of Asset and Liabilities | |
| |
| | Gross Amounts not
offset in the Statement
of Asset and Liabilities | | | |
Fund Name | | Gross
Amounts of
Recognized
Assets | | Financial
Instruments | | Collateral
Received | | Net
Amount2 | | Gross
Amounts of
Recognized
Liabilities | | Financial
Instruments | | Collateral
Pledged | | Net
Amount | |
Direxion Monthly
High Yield Bull
1.2X Fund | | $ | 92,320 | | | $ | — | | | $ | 92,3201 | | | $ | — | | | $ | — | | | $ | — | | | $ | — | | | $ | — | | |
Direxion Monthly
NASDAQ-100®
Bull 1.25X
Fund | | | — | | | | — | | | | — | | | | — | | | | 205,810 | | | | — | | | | 205,8101 | | | | — | | |
Direxion Monthly
NASDAQ-100®
Bull 1.75X
Fund | | | — | | | | — | | | | — | | | | — | | | | 39,215,714 | | | | — | | | | 39,215,7141 | | | | — | | |
Direxion Monthly
S&P 500® Bull
1.75X Fund | | | — | | | | — | | | | — | | | | — | | | | 4,120,279 | | | | — | | | | 4,120,2791 | | | | — | | |
DIREXION ANNUAL REPORT
47
| | | | | Assets: | | | | | | Liabilities: | | | |
| | | | | Gross Amounts not
offset in the Statement
of Asset and Liabilities | |
| |
| | Gross Amounts not
offset in the Statement
of Asset and Liabilities | | | |
Fund Name | | Gross
Amounts of
Recognized
Assets | | Financial
Instruments | | Collateral
Received | | Net
Amount2 | | Gross
Amounts of
Recognized
Liabilities | | Financial
Instruments | | Collateral
Pledged | | Net
Amount | |
Direxion Monthly
S&P 500® Bear
1.75X Fund | | $ | 527,011 | | | $ | — | | | $ | 380,000 | | | $ | 147,011 | | | $ | — | | | $ | — | | | $ | — | | | $ | — | | |
Direxion Monthly
Small Cap Bull
1.75X Fund | | | — | | | | — | | | | — | | | | — | | | | 799,439 | | | | — | | | | 799,4391 | | | | — | | |
Direxion Monthly
Small Cap Bear
1.75X Fund | | | 77,483 | | | | — | | | | — | | | | 77,483 | | | | — | | | | — | | | | — | | | | — | | |
1 The amount of collateral shown has been limited such that the net amount cannot be less than zero.
2 The amount shown is the maximum credit exposure of the Fund for the corresponding counterparty.
Description: Swap Contract
Counterparty: UBS Securities LLC
| | | | | Assets: | | | | | | Liabilities: | | | |
| | | | | Gross Amounts not
offset in the Statement
of Asset and Liabilities | |
| |
| | Gross Amounts not
offset in the Statement
of Asset and Liabilities | | | |
Fund Name | | Gross
Amounts of
Recognized
Assets | | Financial
Instruments | | Collateral
Received | | Net
Amount2 | | Gross
Amounts of
Recognized
Liabilities | | Financial
Instruments | | Collateral
Pledged | | Net
Amount | |
Direxion Monthly
NASDAQ-100®
Bull 1.25X
Fund | | $ | — | | | $ | — | | | $ | — | | | $ | — | | | $ | 80,651 | | | $ | — | | | $ | 80,6511 | | | $ | — | | |
Direxion Monthly
NASDAQ-100®
Bull 1.75X
Fund | | | — | | | | — | | | | — | | | | — | | | | 13,101,012 | | | | — | | | | 13,101,0121 | | | | — | | |
Direxion Monthly
S&P 500® Bull
1.75X Fund | | | — | | | | — | | | | — | | | | — | | | | 2,194,917 | | | | — | | | | 2,194,9171 | | | | — | | |
Direxion Monthly
Small Cap Bull
1.75X Fund | | | — | | | | — | | | | — | | | | — | | | | 123,630 | | | | — | | | | 123,6301 | | | | — | | |
Direxion Monthly
7-10 Year
Treasury Bull
1.75X Fund | | | — | | | | — | | | | — | | | | — | | | | 40,862 | | | | — | | | | 40,8621 | | | | — | | |
Direxion Monthly
7-10 Year
Treasury Bear
1.75X Fund | | | 22,296 | | | | — | | | | — | | | | 22,296 | | | | — | | | | — | | | | — | | | | — | | |
1 The amount of collateral shown has been limited such that the net amount cannot be less than zero.
2 The amount shown is the maximum credit exposure of the Fund for the corresponding counterparty.
DIREXION ANNUAL REPORT
48
d) Investment Transactions – Investment transactions are recorded on trade date. The Funds determine the gain or loss realized from investment transactions by comparing the identified cost, which is the same basis used for federal income tax purposes, with the net sales proceeds.
e) Investments in Other Investment Companies – A Fund may invest in another ETF or mutual fund collectively defined as "investment companies". As a result, Fund shareholders indirectly bear the Fund's proportionate share of fees and expenses paid by shareholders of the other investment company, in addition to the fees and expenses Fund shareholders bear in connection with the Fund's own operations. These costs are disclosed in the Fund's prospectus as Acquired Fund Fees and Expenses. Shareholders may obtain the financial statements of these investment companies at www.sec.gov.
f) Federal Income Taxes – Each Fund intends to comply with the requirements of Subchapter M of the Internal Revenue Code of 1986, as amended, necessary to qualify as a regulated investment company and to make the requisite distributions of income and capital gains to its shareholders sufficient to relieve it from all or substantially all Federal income taxes and excise taxes. No provision for Federal income taxes has been made in the Funds' financial statements.
g) Income and Expenses – Dividend income is recorded on the ex-dividend date. Interest income, including amortization of premium and discount, is recognized on an accrual basis. Expenses are charged to the Funds daily. Expenses are computed based on each Fund's respective average daily net assets. For additional discussion on expenses, refer to Note 4.
h) Distributions to Shareholders – Each Fund pays dividends from net investment income and distributes net realized capital gains, if any, at least annually. Income and capital gain distributions are determined in accordance with income tax regulations, which may differ from GAAP. Certain Funds also utilize earnings and profits distributed to shareholders on redemptions of shares as part of the dividends paid deduction. Distributions to shareholders are recorded on the ex-dividend date.
The tax character of distributions during the years ended August 31, 2022 and August 31, 2021 were as follows:
| | | Year Ended
August 31, 2022 | | Year Ended
August 31, 2021 | |
| | | Distributions Paid From: | | Distributions Paid From: | |
Funds | | Ordinary
Income | | Long Term
Capital Gains | | Return
of Capital | | Ordinary
Income | | Long Term
Capital Gains | | Return
of Capital | |
Direxion Monthly High Yield
Bull 1.2X Fund | | $ | 1,072,598 | | | $ | — | | | $ | 25,379 | | | $ | 1,451,221 | | | $ | — | | | $ | 39,771 | | |
Direxion Monthly NASDAQ-100®
Bull 1.25X Fund | | | 1,121,123 | | | | — | | | | — | | | | 1,489,592 | | | | — | | | | — | | |
Direxion Monthly NASDAQ-100®
Bull 1.75X Fund | | | 65,443,199 | | | | — | | | | — | | | | 41,497,965 | | | | — | | | | — | | |
Direxion Monthly S&P 500®
Bull 1.75X Fund | | | 10,832,010 | | | | — | | | | — | | | | 1,789,361 | | | | — | | | | — | | |
Direxion Monthly S&P 500®
Bear 1.75X Fund | | | — | | | | — | | | | — | | | | — | | | | — | | | | — | | |
Direxion Monthly Small Cap
Bull 1.75X Fund | | | 174,006 | | | | — | | | | — | | | | — | | | | — | | | | — | | |
Direxion Monthly Small Cap
Bear 1.75X Fund | | | — | | | | — | | | | — | | | | — | | | | — | | | | — | | |
Direxion Monthly 7-10 Year Treasury
Bull 1.75X Fund | | | — | | | | — | | | | — | | | | 859,289 | | | | — | | | | — | | |
Direxion Monthly 7-10 Year Treasury
Bear 1.75X Fund | | | — | | | | — | | | | — | | | | — | | | | — | | | | — | | |
DIREXION ANNUAL REPORT
49
As of August 31, 2022, the components of accumulated earnings/losses of the Funds on a tax basis were as follows:
| | | Direxion Monthly
High Yield
Bull 1.2X Fund | | Direxion Monthly
NASDAQ-100®
Bull 1.25X Fund | | Direxion Monthly
NASDAQ-100®
Bull 1.75X Fund | |
Tax cost of investments | | $ | 26,435,478 | | | $ | 5,905,845 | | | $ | 250,979,603 | | |
Gross unrealized appreciation | | | 223,515 | | | | 9,788 | | | | 16,211,886 | | |
Gross unrealized depreciation | | | (8,802,504 | ) | | | (1,303,942 | ) | | | (144,570,285 | ) | |
Net unrealized appreciation/(depreciation) | | $ | (8,578,989 | ) | | $ | (1,294,154 | ) | | $ | (128,358,399 | ) | |
Undistributed ordinary income (loss) | | | — | | | | — | | | | — | | |
Undistributed capital gain (loss) | | | — | | | | — | | | | — | | |
Total distributable earnings (losses) | | | — | | | | — | | | | — | | |
Other accumulated earnings (losses) | | | (19,672,757 | ) | | | (4,779,717 | ) | | | — | | |
Total accumulated earnings (losses) | | $ | (28,251,746 | ) | | $ | (6,073,871 | ) | | $ | (128,358,399 | ) | |
| | | Direxion Monthly
S&P 500®
Bull 1.75X Fund | | Direxion Monthly
S&P 500®
Bear 1.75X Fund | | Direxion Monthly
Small Cap
Bull 1.75X Fund | |
Tax cost of investments | | $ | 74,753,093 | | | $ | 2,468,233 | | | $ | 6,898,129 | | |
Gross unrealized appreciation | | | 3,318,925 | | | | 527,011 | | | | 330,375 | | |
Gross unrealized depreciation | | | (15,772,260 | ) | | | (398,233 | ) | | | (1,550,066 | ) | |
Net unrealized appreciation/(depreciation) | | $ | (12,453,335 | ) | | $ | 128,778 | | | $ | (1,219,691 | ) | |
Undistributed ordinary income (loss) | | | — | | | | — | | | | — | | |
Undistributed capital gain (loss) | | | — | | | | — | | | | — | | |
Total distributable earnings (losses) | | | — | | | | — | | | | — | | |
Other accumulated earnings (losses) | | | — | | | | (58,960,089 | ) | | | (6,399,596 | ) | |
Total accumulated earnings (losses) | | $ | (12,453,335 | ) | | $ | (58,831,311 | ) | | $ | (7,619,287 | ) | |
| | | Direxion Monthly
Small Cap
Bear 1.75X Fund | | Direxion Monthly
7-10 Year Treasury
Bull 1.75X Fund | | Direxion Monthly
7-10 Year Treasury
Bear 1.75X Fund | |
Tax cost of investments | | $ | 1,866,223 | | | $ | 4,958,961 | | | $ | 696,660 | | |
Gross unrealized appreciation | | | 77,483 | | | | — | | | | — | | |
Gross unrealized depreciation | | | (76,223 | ) | | | (810,636 | ) | | | (4,364 | ) | |
Net unrealized appreciation/(depreciation) | | $ | 1,260 | | | $ | (810,636 | ) | | $ | (4,364 | ) | |
Undistributed ordinary income (loss) | | | — | | | | — | | | | — | | |
Undistributed capital gain (loss) | | | — | | | | — | | | | — | | |
Total distributable earnings (losses) | | | — | | | | — | | | | — | | |
Other accumulated earnings (losses) | | | (50,552,911 | ) | | | (5,344,903 | ) | | | (20,225,220 | ) | |
Total accumulated earnings (losses) | | $ | (50,551,651 | ) | | $ | (6,155,539 | ) | | $ | (20,229,584 | ) | |
The difference between book cost of investments and tax cost of investments is attributable primarily to the tax deferral of losses on wash sales. Other accumulated gain/(loss) is generally comprised of capital loss carryforwards and qualified late year loss deferrals.
On the Statements of Assets and Liabilities, the following adjustments were made for permanent tax differences between accounting for total distributable earnings and capital stock under GAAP and tax reporting:
| | | Total Distributable
Earnings/(Loss) | | Capital Stock | |
Direxion Monthly High Yield Bull 1.2X Fund | | $ | — | | | $ | — | | |
Direxion Monthly NASDAQ-100® Bull 1.25X Fund | | | (4,195,985 | ) | | | 4,195,985 | | |
Direxion Monthly NASDAQ-100® Bull 1.75X Fund | | | (67,196,023 | ) | | | 67,196,023 | | |
Direxion Monthly S&P 500® Bull 1.75X Fund | | | (4,761,120 | ) | | | 4,761,120 | | |
Direxion Monthly S&P 500® Bear 1.75X Fund | | | 97,463 | | | | (97,463 | ) | |
DIREXION ANNUAL REPORT
50
| | | Total Distributable
Earnings/(Loss) | | Capital Stock | |
Direxion Monthly Small Cap Bull 1.75X Fund | | $ | — | | | $ | — | | |
Direxion Monthly Small Cap Bear 1.75X Fund | | | 63,494 | | | | (63,494 | ) | |
Direxion Monthly 7-10 Year Treasury Bull 1.75X Fund | | | 240,711 | | | | (240,711 | ) | |
Direxion Monthly 7-10 Year Treasury Bear 1.75X Fund | | | 77,646 | | | | (77,646 | ) | |
GAAP requires that certain components of net assets relating to permanent differences be reclassified between financial and tax reporting. These reclassifications have no effect on net assets or net asset value per share. For the year ended August 31, 2022, the permanent differences primarily relate to net operating losses, nondeductible excise taxes, and utilization of earnings and profits distributed to shareholders on redemption of shares.
In order to meet certain excise tax distribution requirements, the Funds are required to measure and distribute annually net capital gains realized during a twelve month period ending October 31 and net investment income earned during a twelve month period ending December 31. In connection with this, the Funds are permitted for tax purposes to defer into their next fiscal year qualified late year losses. Qualified late year capital losses are any net capital losses incurred between November 1 and the end of the fiscal year, August 31, 2022. Qualified late year ordinary losses are generally losses incurred between January 1 and the end of their fiscal year, August 31, 2022.
At August 31, 2022, the following Funds deferred, on a tax basis, qualified late year losses of:
| | | Late Year
Ordinary Losses | | Post-October
Capital Losses | |
Direxion Monthly High Yield Bull 1.2X Fund | | $ | — | | | $ | — | | |
Direxion Monthly NASDAQ-100® Bull 1.25X Fund | | | 35,613 | | | | 1,319,896 | | |
Direxion Monthly NASDAQ-100® Bull 1.75X Fund | | | — | | | | — | | |
Direxion Monthly S&P 500® Bull 1.75X Fund | | | — | | | | — | | |
Direxion Monthly S&P 500® Bear 1.75X Fund | | | 30,516 | | | | — | | |
Direxion Monthly Small Cap Bull 1.75X Fund | | | 64,058 | | | | 6,335,538 | | |
Direxion Monthly Small Cap Bear 1.75X Fund | | | 18,322 | | | | — | | |
Direxion Monthly 7-10 Year Treasury Bull 1.75X Fund | | | 44,182 | | | | — | | |
Direxion Monthly 7-10 Year Treasury Bear 1.75X Fund | | | 21,319 | | | | — | | |
Under the Regulated Investment Company Modernization Act of 2010, net capital losses recognized for tax years beginning after December 22, 2010 may be carried forward indefinitely, and their character is retained as short-term and/or long-term.
At August 31, 2022, the following Funds had capital loss carryforwards on a tax basis of:
| | | Unlimited ST | | Unlimited LT | | Annual
Limitation | |
Direxion Monthly High Yield Bull 1.2X Fund | | $ | 12,297,233 | | | $ | 7,375,524 | | | $ | — | | |
Direxion Monthly NASDAQ-100® Bull 1.25X Fund | | | — | | | | — | | | | 926 | | |
Direxion Monthly NASDAQ-100® Bull 1.75X Fund | | | — | | | | — | | | | — | | |
Direxion Monthly S&P 500® Bull 1.75X Fund | | | — | | | | — | | | | — | | |
Direxion Monthly S&P 500® Bear 1.75X Fund | | | 58,929,573 | | | | — | | | | — | | |
Direxion Monthly Small Cap Bull 1.75X Fund | | | — | | | | — | | | | — | | |
Direxion Monthly Small Cap Bear 1.75X Fund | | | 50,534,589 | | | | — | | | | — | | |
Direxion Monthly 7-10 Year Treasury Bull 1.75X Fund | | | 5,199,353 | | | | 101,368 | | | | — | | |
Direxion Monthly 7-10 Year Treasury Bear 1.75X Fund | | | 20,203,901 | | | | — | | | | — | | |
Capital Loss Utilized: | |
Direxion Monthly NASDAQ-100® Bull 1.25X Fund | | | 926 | | | | | | |
Direxion Monthly Small Cap Bear 1.75X Fund | | | 201,639 | | | | | | |
Direxion Monthly 7-10 Year Treasury Bear 1.75X Fund | | | 430,585 | | | | | | |
DIREXION ANNUAL REPORT
51
In accordance with Sections 381-384 of the Internal Revenue Code, a portion of certain Fund's losses have been subjected to an annual limitation. Direxion Monthly NASDAQ-100® Bull 1.25X Fund has $3,424,208 of capital losses that are subject to an annual limitation.
To the extent that the Funds realize future net capital gains, those gains will be offset by any unused capital loss carryover.
The Funds follow authoritative financial reporting rules regarding recognition and measurement of tax positions taken or expected to be taken on a tax return. The Funds have reviewed all open tax years and concluded that there is no effect to the Funds' financial positions or results of operations and no tax liability resulting from unrecognized tax benefits relating to uncertain income tax positions taken or expected to be taken on a tax return. The Funds recognize interest and penalties, if any, related to unrecognized tax benefits as income tax expense in the Statement of Operations. During this period, the Funds did not incur any interest or penalties. Open tax years are those years that are open for examination by the relevant income taxing authority. As of August 31, 2022, open Federal and state income tax years include the tax years ended August 31, 2019 through August 31, 2022. The Funds have no examination in progress. The Funds are also not aware of any tax positions for which it is reasonably possible that the total amounts of unrecognized tax expense will significantly change in the next twelve months.
i) Guarantees and Indemnifications – In the ordinary course of business, the Funds enter into contracts that contain a variety of indemnification provisions pursuant to which the Funds agree to indemnify third parties upon occurrence of specified events. The Funds' maximum exposure relating to these indemnification agreements is unknown. However, the Funds have not had prior claims or losses in connection with these provisions and believe the risk of loss is remote.
j) Use of Estimates – The preparation of financial statements in conformity with GAAP requires management to make estimates and assumptions that affect the reported amounts of assets and liabilities and disclosure of contingent assets and liabilities at the date of the financial statements and the reported amounts of revenues and expenses during the reporting period. Actual results could differ from those estimates.
3. INVESTMENT TRANSACTIONS
The table below presents each Fund's investment transactions during the year ended August 31, 2022. Purchases represent the aggregate purchases of investments excluding short-term investment purchases and swap contracts. Sales represent the aggregate sales of investments excluding proceeds from short-term investments and swap contracts.
Funds | | Purchases | | Sales | |
Direxion Monthly High Yield Bull 1.2X Fund | | $ | 906,919,495 | | | $ | 957,954,801 | | |
Direxion Monthly NASDAQ-100® Bull 1.25X Fund | | | 3,921,251 | | | | — | | |
Direxion Monthly NASDAQ-100® Bull 1.75X Fund | | | 21,910,630 | | | | — | | |
Direxion Monthly S&P 500® Bull 1.75X Fund | | | 39,400,946 | | | | — | | |
Direxion Monthly S&P 500® Bear 1.75X Fund | | | — | | | | — | | |
Direxion Monthly Small Cap Bull 1.75X Fund | | | 3,942,729 | | | | 865,257 | | |
Direxion Monthly Small Cap Bear 1.75X Fund | | | — | | | | — | | |
Direxion Monthly 7-10 Year Treasury Bull 1.75X Fund | | | 8,556,967 | | | | 16,838,709 | | |
Direxion Monthly 7-10 Year Treasury Bear 1.75X Fund | | | — | | | | — | | |
There were no purchases or sales of long-term U.S. Government securities in the Funds during the year ended August 31, 2022.
4. INVESTMENT ADVISORY AND OTHER AGREEMENTS
Investment Advisory Agreement: The Funds have entered into an investment advisory agreement with the Adviser. The Adviser earns a fee, computed daily and payable monthly, applied to each Fund's average daily net assets at the annual rate of 0.75%.
Management Services Agreement: The Funds have entered into a Management Services Agreement with the Adviser. Under the Management Services Agreement, the Funds pays the Adviser a management service fees of 0.026% on the first $10,000,000,000 of the Fund's daily net assets and 0.024% on assets in excess of $10,000,000,000.
DIREXION ANNUAL REPORT
52
Operating Expense Limitation Agreement: Each Fund is responsible for its own operating expenses. Under the Operating Expense Limitation Agreement, the Adviser has contractually agreed to cap all or a portion of the expenses for each Fund based on the annual rates listed below applied to each Fund's average daily net assets.
Direxion Monthly High Yield Bull 1.2X Fund | | | 1.35 | % | |
Direxion Monthly NASDAQ-100® Bull 1.25X Fund | | | 1.15 | % | |
Direxion Monthly NASDAQ-100® Bull 1.75X Fund | | | 1.35 | % | |
Direxion Monthly S&P 500® Bull 1.75X Fund | | | 1.35 | % | |
Direxion Monthly S&P 500® Bear 1.75X Fund | | | 1.35 | % | |
Direxion Monthly Small Cap Bull 1.75X Fund | | | 1.35 | % | |
Direxion Monthly Small Cap Bear 1.75X Fund | | | 1.35 | % | |
Direxion Monthly 7-10 Year Treasury Bull 1.75X Fund | | | 1.35 | % | |
Direxion Monthly 7-10 Year Treasury Bear 1.75X Fund | | | 1.35 | % | |
Any expense cap is subject to recoupment by the Adviser within the following three years only if overall expenses fall below the lesser of this percentage limitation and any percentage limitation in place at the time. This agreement may be terminated or revised at any time with the consent of the Board of Trustees.
The table below presents amounts that the Adviser recouped, waived and the amounts available for potential recoupments by the Adviser.
| | | | | | | Potential Recoupment
Amounts Expiring: | | Total Potential | |
Funds | | Expenses
Recouped | | Expenses
Reimbursed | | August 31,
2023 | | August 31,
2024 | | August 31,
2025 | | Recoupment
Amount | |
Direxion Monthly High Yield
Bull 1.2X Fund | | $ | 15,396 | | | $ | 24,428 | | | $ | 16,583 | | | $ | 8,249 | | | $ | 24,428 | | | $ | 49,260 | | |
Direxion Monthly NASDAQ-100®
Bull 1.25X Fund | | | — | | | | 53,475 | | | | 68,362 | | | | 67,022 | | | | 53,475 | | | | 188,859 | | |
Direxion Monthly NASDAQ-100®
Bull 1.75X Fund | | | 84,473 | | | | 77,085 | | | | — | | | | — | | | | 8,377 | | | | 8,377 | | |
Direxion Monthly S&P 500®
Bull 1.75X Fund | | | 35,941 | | | | 40,440 | | | | 34,814 | | | | 7,319 | | | | 40,440 | | | | 82,573 | | |
Direxion Monthly S&P 500®
Bear 1.75X Fund | | | — | | | | 40,678 | | | | 49,489 | | | | 48,970 | | | | 40,678 | | | | 139,137 | | |
Direxion Monthly Small Cap
Bull 1.75X Fund | | | 550 | | | | 38,003 | | | | 39,849 | | | | 40,407 | | | | 38,003 | | | | 118,259 | | |
Direxion Monthly Small Cap
Bear 1.75X Fund | | | — | | | | 40,158 | | | | 46,068 | | | | 44,525 | | | | 40,158 | | | | 130,751 | | |
Direxion Monthly 7-10 Year Treasury
Bull 1.75X Fund | | | — | | | | 43,334 | | | | 79,080 | | | | 35,897 | | | | 43,334 | | | | 158,311 | | |
Direxion Monthly 7-10 Year Treasury
Bear 1.75X Fund | | | — | | | | 46,998 | | | | 52,430 | | | | 49,028 | | | | 46,998 | | | | 148,456 | | |
The net amounts receivable (payable) arising from the Investment Advisory Agreement, Management Services Agreement and waiver of any expenses as of August 31, 2022 is presented on the Statements of Assets and Liabilities as Due from (to) Adviser, net.
Distribution Expenses: Shares of the Funds are subject to an annual 12b-1 fee of up to 1.00% of a Fund's average daily net assets. Each Fund currently pays a 12b-1 fee of 0.25% of the respective Fund's average daily net assets.
Foreside Fund Services, LLC (the "Distributor") serves as principal underwriter of the Funds and acts as the Funds' distributor in a continuous public offering of the Funds' shares. The Distributor is an affiliate of the Adviser.
5. VALUATION MEASUREMENTS
The Funds follow authoritative fair valuation accounting standards, which establish an authoritative definition of fair value and set out a hierarchy for measuring fair value. These standards require additional disclosures about the various inputs
DIREXION ANNUAL REPORT
53
and valuation techniques used to develop the measurements of fair value and a discussion in changes in valuation techniques and related inputs during the period. These inputs are summarized in the three broad levels below:
Level 1 – Quoted prices in active markets for identical securities
Level 2 – Evaluated price based on other significant observable inputs (including quoted prices for similar securities in active markets, quoted prices for identical or similar securities in inactive markets, interest rates, prepayment speeds, credit risk, etc.)
Level 3 – Significant unobservable inputs (including the Fund's own assumptions in determining fair value of investments)
The inputs or methodology used for valuing securities are not an indication of the credit risk associated with investing in those securities.
The follow is a summary of the inputs used to value the Funds' securities as of August 31, 2022.
| | | Asset Class | | Liability Class | |
| | | Level 1 | | Level 2 | | Level 2 | |
Funds | | Investment
Companies | | Short Term
Investments | | Cash
Equivalents | | Total Return
Swap Contracts* | | Total Return
Swap Contracts* | |
Direxion Monthly High Yield
Bull 1.2X Fund | | $ | 15,304,169 | | | $ | 2,460,000 | | | $ | 5,716,013 | | | $ | 92,320 | | | $ | — | | |
Direxion Monthly NASDAQ-100®
Bull 1.25X Fund | | | 3,713,941 | | | | 1,474,326 | | | | 2,711,151 | | | | — | | | | (576,576 | ) | |
Direxion Monthly NASDAQ-100®
Bull 1.75X Fund | | | 62,673,123 | | | | 115,171,368 | | | | 154,221,005 | | | | — | | | | (55,223,287 | ) | |
Direxion Monthly S&P 500®
Bull 1.75X Fund | | | 45,675,700 | | | | 21,950,000 | | | | 25,345,297 | | | | 989,254 | | | | (6,315,196 | ) | |
Direxion Monthly S&P 500®
Bear 1.75X Fund | | | — | | | | 2,070,000 | | | | 9,883,750 | | | | 527,011 | | | | — | | |
Direxion Monthly Small Cap
Bull 1.75X Fund | | | 4,128,750 | | | | 2,375,888 | | | | 5,065,877 | | | | 96,868 | | | | (923,069 | ) | |
Direxion Monthly Small Cap
Bear 1.75X Fund | | | — | | | | 1,790,000 | | | | 3,405,868 | | | | 77,483 | | | | — | | |
Direxion Monthly 7-10 Year Treasury
Bull 1.75X Fund | | | 2,826,320 | | | | 1,395,861 | | | | 1,032,276 | | | | — | | | | (73,855 | ) | |
Direxion Monthly 7-10 Year Treasury
Bear 1.75X Fund | | | — | | | | 670,000 | | | | 2,012,945 | | | | 22,296 | | | | — | | |
For further information regarding each asset class, see each Fund's Schedule of Investments.
* Total return swap contracts are valued at the unrealized appreciation/(depreciation).
The Funds also follow authoritative accounting standards, which require additional disclosure regarding fair value measurements. Specifically, these standards require reporting entities to disclose a) the input and valuation techniques used to measure fair value for both recurring and nonrecurring fair value measurements, for Level 2 or Level 3 positions, b) transfers between all levels on a gross basis (i.e. transfers out must be disclosed separately from transfers in) as well as the reason(s) for the transfers, and c) purchases and sales on a gross basis in the Level 3 rollforward rather than as one net number. Additionally, reporting entities are required to disclose quantitative information about unobservable inputs used in the fair value measurements categorized within Level 3 of the fair value hierarchy.
6. ADDITIONAL DISCLOSURES ABOUT DERIVATIVE INSTRUMENTS
The Funds follow authoritative standards of accounting for derivative instruments, which establish disclosure requirements for derivative instruments. These standards improve financial reporting for derivative instruments by requiring enhanced disclosures that enables investors to understand how and why a fund uses derivatives instruments, how a fund accounts for derivative instruments and how derivative instruments affect a fund's financial position and results of operations.
DIREXION ANNUAL REPORT
54
The Funds use derivative instruments as part of their principal investment strategy to achieve their investment objective. For additional discussion on the risks associated with derivative instruments refer to Note 2. As of August 31, 2022, the Funds were invested in swap contracts.
At August 31, 2022, the fair value of derivative instruments, by primary risk, were as follows:
| | | Asset Derivatives1 | |
Fund | | Credit Risk | | Equity Risk | | Interest Rate Risk | | Total | |
Direxion Monthly High Yield Bull 1.2X Fund | | $ | 92,320 | | | $ | — | | | $ | — | | | $ | 92,320 | | |
Direxion Monthly S&P 500® Bull 1.75X Fund | | | — | | | | 989,254 | | | | — | | | | 989,254 | | |
Direxion Monthly S&P 500® Bear 1.75X Fund | | | — | | | | 527,011 | | | | — | | | | 527,011 | | |
Direxion Monthly Small Cap Bull 1.75X Fund | | | — | | | | 96,868 | | | | — | | | | 96,868 | | |
Direxion Monthly Small Cap Bear 1.75X Fund | | | — | | | | 77,483 | | | | — | | | | 77,483 | | |
Direxion Monthly 7-10 Year Treasury Bear 1.75X Fund | | | — | | | | — | | | | 22,296 | | | | 22,296 | | |
1 Statements of Assets and Liabilities location: Unrealized appreciation on swap contracts.
| | | Liability Derivatives2 | |
Fund | | Credit Risk | | Equity Risk | | Interest Rate Risk | | Total | |
Direxion Monthly NASDAQ-100® Bull 1.25X Fund | | $ | — | | | $ | 576,576 | | | $ | — | | | $ | 576,576 | | |
Direxion Monthly NASDAQ-100® Bull 1.75X Fund | | | — | | | | 55,223,287 | | | | — | | | | 55,223,287 | | |
Direxion Monthly S&P 500® Bull 1.75X Fund | | | — | | | | 6,315,196 | | | | — | | | | 6,315,196 | | |
Direxion Monthly Small Cap Bull 1.75X Fund | | | — | | | | 923,069 | | | | — | | | | 923,069 | | |
Direxion Monthly 7-10 Year Treasury Bull 1.75X Fund | | | — | | | | — | | | | 73,855 | | | | 73,855 | | |
2 Statements of Assets and Liabilities location: Unrealized depreciation on swap contracts.
Transactions in derivative instruments during the year ended August 31, 2022, by primary risk, were as follows:
| | | | | Net Realized Gain (Loss)1 | | Net Unrealized
Appreciation (Depreciation)2 | |
Fund | | | | Credit
Risk | | Equity
Risk | | Interest
Rate Risk | | Credit
Risk | | Equity
Risk | | Interest
Rate Risk | |
Direxion Monthly High Yield
Bull 1.2X Fund | | Swap Contracts | | $ | (1,898,954 | ) | | $ | — | | | $ | — | | | $ | (10,022 | ) | | $ | — | | | $ | — | | |
Direxion Monthly
NASDAQ-100®
Bull 1.25X Fund | | Swap Contracts | | | — | | | | (429,248 | ) | | | — | | | | — | | | | (2,232,714 | ) | | | — | | |
Direxion Monthly
NASDAQ-100®
Bull 1.75X Fund | | Swap Contracts | | | — | | | | (12,286,486 | ) | | | — | | | | — | | | | (198,521,457 | ) | | | — | | |
Direxion Monthly S&P 500®
Bull 1.75X Fund | | Swap Contracts | | | — | | | | (136,594 | ) | | | — | | | | — | | | | (25,829,967 | ) | | | — | | |
Direxion Monthly S&P 500®
Bear 1.75X Fund | | Swap Contracts | | | — | | | | (409,600 | ) | | | — | | | | — | | | | 1,245,977 | | | | — | | |
Direxion Monthly Small Cap
Bull 1.75X Fund | | Swap Contracts | | | — | | | | (6,203,832 | ) | | | — | | | | — | | | | (445,973 | ) | | | — | | |
Direxion Monthly Small Cap
Bear 1.75X Fund | | Swap Contracts | | | — | | | | 190,128 | | | | — | | | | — | | | | 143,374 | | | | — | | |
DIREXION ANNUAL REPORT
55
| | | | | Net Realized Gain (Loss)1 | | Net Unrealized
Appreciation (Depreciation)2 | |
Fund | | | | Credit
Risk | | Equity
Risk | | Interest
Rate Risk | | Credit
Risk | | Equity
Risk | | Interest
Rate Risk | |
Direxion Monthly
7-10 Year Treasury
Bull 1.75X Fund | | Swap Contracts | | $ | — | | | $ | — | | | $ | (2,857,669 | ) | | $ | — | | | $ | — | | | $ | (358,638 | ) | |
Direxion Monthly
7-10 Year Treasury
Bear 1.75X Fund | | Swap Contracts | | | — | | | | — | | | | 510,729 | | | | — | | | | — | | | | 478,207 | | |
1 Statements of Operations location: Net realized gain (loss) on swap contracts.
2 Statements of Operations location: Change in net unrealized appreciation (depreciation) on swap contracts.
For the year ended August 31, 2022, the average quarterly volume of the derivatives held by each of the Funds was as follows:
| | Quarterly Average Gross
Notional Amounts | |
| | | Long Equity Swap
Contracts | | Short Equity Swap
Contracts | |
Direxion Monthly High Yield Bull 1.2X Fund | | $ | 17,558,503 | | | $ | — | | |
Direxion Monthly NASDAQ-100® Bull 1.25X Fund | | | 14,857,198 | | | | — | | |
Direxion Monthly NASDAQ-100® Bull 1.75X Fund | | | 790,723,221 | | | | — | | |
Direxion Monthly S&P 500® Bull 1.75X Fund | | | 188,848,963 | | | | — | | |
Direxion Monthly S&P 500® Bear 1.75X Fund | | | — | | | | 15,233,103 | | |
Direxion Monthly Small Cap Bull 1.75X Fund | | | 29,702,527 | | | | — | | |
Direxion Monthly Small Cap Bear 1.75X Fund | | | — | | | | 12,600,071 | | |
Direxion Monthly 7-10 Year Treasury Bull 1.75X Fund | | | 21,506,171 | | | | — | | |
Direxion Monthly 7-10 Year Treasury Bear 1.75X Fund | | | — | | | | 9,183,138 | | |
The Funds utilize this volume of derivatives to obtain leverage to meet the investment objectives of 120%, 125%, 175%, and -175% calendar month performance of their respective indices.
7. MARKET DISRUPTION RISK
Geopolitical and other events, including public health crises and natural disasters, have recently led to increased market volatility and significant market losses. Significant market volatility and market downturns may limit the Fund's ability to sell securities and obtain short exposure to securities, and the Fund's sales and short exposures may exacerbate the market volatility and downturn. Under such circumstances, the Fund may have difficulty achieving its investment objective for one or more trading days, which may adversely impact the Fund's returns on those days and periods inclusive of those days. Alternatively, the Fund may incur higher costs (including swap financing costs) in order to achieve its investment objective and may be forced to purchase and sell securities (including shares of ETFs) at market prices that do not represent their fair value (including in the case of an ETF, its net asset value) or at times that result in differences between the price the Fund receives for the security or the value of the swap exposure and the market closing price of the security or the market closing value of the swap exposure. Under those circumstances, the Fund's ability to track its Index is likely to be adversely affected. The Fund may also incur additional tracking error due to the use of futures contracts or other securities that are not perfectly correlated to the Fund's Index.
The recent pandemic spread of the novel coronavirus known as COVID-19 has proven to be a market disrupting event. The impact of this virus, like other pandemics that may arise in the future, has negatively affected and may continue to negatively affect the economies of many nations, companies and the global securities and commodities markets, including by reducing liquidity in the markets. Adverse effects may be more pronounced for developing or emerging market countries that have less established health care systems. How long such events will last and whether they will continue or recur cannot be predicted.
DIREXION ANNUAL REPORT
56
8. SUBSEQUENT EVENTS
Management has performed an evaluation of subsequent events through the date the financial statements were issued and has determined that no items require recognition or disclosure besides those noted below.
The Direxion Monthly High Yield Bull 1.2X Fund paid an income distribution in the amount of $0.1962 per share with a record date of September 15, 2022 and ex-date and payable date of September 16, 2022.
The Direxion Monthly High Yield Bull 1.2X Fund paid an income distribution in the amount of $0.0030 per share with a record date of October 17, 2022 and ex-date and payable date of October 18, 2022.
DIREXION ANNUAL REPORT
57
Direxion Funds
Report of Independent Registered Public Accounting Firm
To the Shareholders of Direxion Monthly High Yield Bull 1.2X Fund, Direxion Monthly NASDAQ-100® Bull 1.25X Fund, Direxion Monthly NASDAQ-100® Bull 1.75X Fund (formerly Direxion Monthly NASDAQ-100® Bull 2X Fund), Direxion Monthly S&P 500® Bull 1.75X Fund (formerly Direxion Monthly S&P 500® Bull 2X Fund), Direxion Monthly S&P 500® Bear 1.75X Fund (formerly Direxion Monthly S&P 500® Bear 2X Fund), Direxion Monthly Small Cap Bull 1.75X Fund (formerly Direxion Monthly Small Cap Bull 2X Fund), Direxion Monthly Small Cap Bear 1.75X Fund (formerly Direxion Monthly Small Cap Bear 2X Fund), Direxion Monthly 7-10 Year Treasury Bull 1.75X Fund (formerly Direxion Monthly 7-10 Year Treasury Bull 2X Fund) and Direxion Monthly 7-10 Year Treasury Bear 1.75X Fund (formerly Direxion Monthly 7-10 Year Treasury Bear 2X Fund) and the Board of Trustees of Direxion Funds
Opinion on the Financial Statements
We have audited the accompanying statements of assets and liabilities of Direxion Monthly High Yield Bull 1.2X Fund, Direxion Monthly NASDAQ-100® Bull 1.25X Fund, Direxion Monthly NASDAQ-100® Bull 1.75X Fund (formerly Direxion Monthly NASDAQ-100® Bull 2X Fund), Direxion Monthly S&P 500® Bull 1.75X Fund (formerly Direxion Monthly S&P 500® Bull 2X Fund), Direxion Monthly S&P 500�� Bear 1.75X Fund (formerly Direxion Monthly S&P 500® Bear 2X Fund), Direxion Monthly Small Cap Bull 1.75X Fund (formerly Direxion Monthly Small Cap Bull 2X Fund), Direxion Monthly Small Cap Bear 1.75X Fund (formerly Direxion Monthly Small Cap Bear 2X Fund), Direxion Monthly 7-10 Year Treasury Bull 1.75X Fund (formerly Direxion Monthly 7-10 Year Treasury Bull 2X Fund) and Direxion Monthly 7-10 Year Treasury Bear 1.75X Fund (formerly Direxion Monthly 7-10 Year Treasury Bear 2X Fund) (collectively referred to as the "Funds"), (9 of the funds constituting Direxion Funds) (the "Trust")), including the schedules of investments, as of August 31, 2022, and the related statements of operations for the year then ended, the statements of changes in net assets for each of the two years in the period then ended, the financial highlights for each of the five years in the period then ended and the related notes (collectively referred to as the "financial statements"). In our opinion, the financial statements present fairly, in all material respects, the financial position of each of the Funds (9 of the funds constituting Direxion Funds) at August 31, 2022, the results of their operations for the year then ended, the changes in their net assets for each of the two years in the period then ended and their financial highlights for each of the five years in the period then ended, in conformity with U.S. generally accepted accounting principles.
Basis for Opinion
These financial statements are the responsibility of the Trust's management. Our responsibility is to express an opinion on each of the Funds' financial statements based on our audits. We are a public accounting firm registered with the Public Company Accounting Oversight Board (United States) ("PCAOB") and are required to be independent with respect to the Trust in accordance with the U.S. federal securities laws and the applicable rules and regulations of the Securities and Exchange Commission and the PCAOB.
We conducted our audits in accordance with the standards of the PCAOB. Those standards require that we plan and perform the audit to obtain reasonable assurance about whether the financial statements are free of material misstatement, whether due to error or fraud. The Trust is not required to have, nor were we engaged to perform, an audit of the Trust's internal control over financial reporting. As part of our audits we are required to obtain an understanding of internal control over financial reporting but not for the purpose of expressing an opinion on the effectiveness of the Trust's internal control over financial reporting. Accordingly, we express no such opinion.
Our audits included performing procedures to assess the risks of material misstatement of the financial statements, whether due to error or fraud, and performing procedures that respond to those risks. Such procedures included examining, on a test basis, evidence regarding the amounts and disclosures in the financial statements. Our procedures included confirmation of securities owned as of August 31, 2022, by correspondence with the custodian and brokers; when replies were not received from brokers, we performed other auditing procedures. Our audits also included evaluating the accounting principles used and significant estimates made by management, as well as evaluating the overall presentation of the financial statements. We believe that our audits provide a reasonable basis for our opinion.
We have served as the auditor of one or more of the Direxion investment companies since 2001.
Minneapolis, Minnesota
October 26, 2022
DIREXION ANNUAL REPORT
58
Direxion Funds
Supplemental Information (Unaudited)
For the year ended August 31, 2022, certain dividends paid by the Funds may be subject to a maximum rate of 15%, as provided for by the Jobs and Growth Tax Relief Reconciliation Act of 2003. The amount of dividends declared from ordinary income designated as qualified income was 0% for each of the Funds.
The Funds are designating as long-term capital gain dividends, pursuant to Internal Revenue Code Section 852(b)(3), the amount necessary to reduce the earnings and profits of the Funds related to net capital gain to zero for the tax year ending August 31, 2022. To the extent necessary to fully distribute such capital gain, the Funds also designate earnings and profits distributed to shareholders on the redemption of shares.
For corporate shareholders, the amount of ordinary income distributions qualifying for the corporate dividends received deduction for the year ended August 31, 2022 was 0% for each of the Funds.
Results of Shareholder Meeting
A Special Meeting of Shareholders of the Direxion Funds Trust took place on March 11, 2022 for the purpose of electing Trustees to the Board of Trustees (the "Proposal"). All Trust shareholders of record, in the aggregate across all series of the Trust, were entitled to attend or submit proxies. As of the record date, December 3, 2021, the Trust had 25,555,289 shares outstanding. The results of the voting for the proposal were as follows:
Proposal: To approve the election of the Trustees to the Board of Trustees of the Trust to serve until his or her successor is elected and qualified.
| | For Votes | | Votes Withheld | |
David L. Driscoll | | | 10,618,753 | | | | 1,022,274 | | |
Jacob C. Gaffey | | | 10,619,736 | | | | 1,021,291 | | |
Henry W. Mulholland | | | 10,659,144 | | | | 981,883 | | |
Kathleen M. Berkery | | | 10,556,293 | | | | 1,084,734 | | |
Carlyle Peake | | | 10,657,444 | | | | 983,583 | | |
Mary Jo Collins | | | 10,555,908 | | | | 1,085,119 | | |
Angela Brickl | | | 10,558,967 | | | | 1,082,060 | | |
Daniel D. O'Neill | | | 10,616,233 | | | | 1,024,794 | | |
Accordingly, effective March 11, 2022, the Board of Trustees of the Direxion Funds Trust consists of the following individuals, each of whom have been elected by shareholders:
David L. Driscoll, Independent Trustee
Jacob C. Gaffey, Independent Trustee
Henry W. Mulholland, Independent Trustee
Kathleen M. Berkery, Independent Trustee
Carlyle Peake, Independent Trustee
Mary Jo Collins, Independent Trustee
Angela Brickl, Interested Trustee
Daniel D. O'Neill, Interested Trustee
DIREXION ANNUAL REPORT
59
Direxion Funds
Supplemental Information (Unaudited)
Effective September 30, 2022, the following table under "Interested Trustees" in each SAI is replaced in its entirety as indicated below.
Name, Address and
Age | | Position(s)
Held with
Fund | | Term of Office
and Length of
Time Served | | Principal Occupation(s)
During Past Five Years | | # of Portfolios
in Direxion
Family of
Investment
Companies
Overseen
by Trustee(3) | | Other Trusteeships/
Directorships Held by
Trustee During Past
Five Years | |
Daniel D. O'Neill(1)
Age: 54 | |
Chairman of the Board of Trustees | |
Lifetime of Trust until removal or resignation; Since 2008 | |
Chief Executive Officer, Rafferty Asset Management, LLC, from 2021 – September 2022; Managing Director, Rafferty Asset Management, LLC, January 1999 –
January 2019. | | |
149 | | |
None. | |
Angela Brickl(2)
Age: 46 | |
Trustee | |
Lifetime of Trust until removal or resignation; Since 2022 | |
President, Rafferty Asset Management, LLC, from September 2022; Chief Operating Officer, Rafferty Asset Management, LLC, May 2021 – September 2022; General Counsel, Rafferty Asset Management LLC, since October 2010; Chief Compliance Officer, Rafferty Asset Management, LLC, since September 2012. | | |
149 | | |
None. | |
(1) Mr. O'Neill is affiliated with Rafferty because he serves as an officer of, and owns a beneficial interest in, Rafferty.
(2) Ms. Brickl is affiliated with Rafferty because she serves as an officer of Rafferty.
(3) The Direxion Family of Investment Companies consists of the Direxion Shares ETF Trust which, as of the date of this SAI, offers for sale to the public 94 of the 139 funds registered with the SEC and the Direxion Funds which, as of the date of this Supplement, offers for sale to the public 10 funds registered with the SEC.
DIREXION ANNUAL REPORT
60
Direxion Funds
Supplemental Information (Unaudited)
Effective September 30, 2022, the following table under "Principal Officers of the Trust" in each SAI is replaced in its entirety as indicated below.
Name, Address and
Age | | Position(s)
Held with
Fund | | Term of Office
and Length of
Time Served | | Principal Occupation(s)
During Past Five Years | | # of Portfolios
in the Direxion
Family of
Investment
Companies
Overseen
by Trustee(2) | | Other Trusteeships/
Directorships Held by
Trustee During Past
Five Years | |
Angela Brickl(1)
Age: 46 | |
President
Chief Compliance
Officer | |
One Year;
Since 2022
One Year;
Since 2018 | |
President, Rafferty Asset Management, LLC, from September 2022; Chief Operating Officer, Rafferty Asset Management, LLC, May 2021 – September 2022; General Counsel, Rafferty Asset Management LLC, since October 2010; Chief Compliance Officer, Rafferty Asset Management, LLC, since September 2012. | |
N/A | |
N/A | |
Patrick J. Rudnick
Age: 49 | |
Principal Executive Officer | |
One Year;
Since 2018 | |
Senior Vice President, Rafferty Asset Management, LLC, since March 2013. | |
N/A | |
N/A | |
Corey Noltner
Age: 33 | |
Principal Financial Officer | |
One Year;
Since 2021 | |
Senior Business Analyst, Rafferty Asset Management, LLC, since 2015. | |
N/A | |
N/A | |
Alyssa Sherman
Age: 33 | |
Secretary | |
One Year;
Since 2022 | |
Associate General Counsel, Rafferty Asset Management, LLC, since April 2021; Associate, K&L Gates LLP, September 2015 –
March 2021. | |
N/A | |
N/A | |
(1) Ms. Brickl serves on the Board of Trustees of the Direxion Funds and Direxion Shares ETF Trust.
(2) The Direxion Family of Investment Companies consists of the Direxion Shares ETF Trust which, as of the date of this SAI, offers for sale to the public 94 of the 139 funds registered with the SEC and the Direxion Funds which, as of the date of this Supplement, offers for sale to the public 10 funds registered with the SEC.
Householding
In an effort to decrease costs, the Funds intend to reduce the number of duplicate prospectuses, Annual and Semi-Annual Reports, proxy statements and other similar documents you receive by sending only one copy of each to those addresses shared by two or more accounts and to shareholders we reasonably believe are from the same family or household. Householding begins once you have signed your account application. After such time, if you would like to discontinue householding for your accounts, please call toll-free at (800) 851-0511 to request individual copies of these documents. Once the Funds receive notice to stop householding, we will begin sending individual copies thirty days after receiving your request. This policy does not apply to account statements.
DIREXION ANNUAL REPORT
61
Direxion Funds
Investment Advisory Agreement Approval (Unaudited)
Consistent with the Investment Company Act of 1940, as amended (the "1940 Act"), the Board of Trustees (the "Board") of the Direxion Funds (the "Trust") annually considers the renewal of the Amended & Restated Investment Advisory Agreement (the "Agreement") between Rafferty Asset Management, LLC (the "Adviser") and the Trust, on behalf of the Direxion Monthly S&P 500® Bull 1.75X Fund, Direxion Monthly S&P 500® Bear 1.75X Fund, Direxion Monthly NASDAQ-100® Bull 1.75X Fund, Direxion Monthly Small Cap Bull 1.75X Fund, Direxion Monthly Small Cap Bear 1.75X Fund, Direxion Monthly 7-10 Year Treasury Bull 1.75X Fund, Direxion Monthly 7-10 Year Treasury Bear 1.75X Fund, Direxion Monthly NASDAQ-100® Bull 1.25X Fund and the Direxion Monthly High Yield Bull 1.2X Fund, each a series of the Trust. Each series of the Trust is referred to herein as a "Fund" and collectively as the "Funds." The Funds seek monthly investment results, before fees and expenses, of a multiple or an inverse multiple of an underlying index.
At a meeting held on August 18, 2022, the Board, including the trustees who are not "interested persons" of the Trust as defined in the 1940 Act (the "Independent Trustees"), unanimously approved the renewal of the Agreement, on behalf of the Funds. The Independent Trustees had previously considered information pertaining to the renewal of the Agreement outside the presence of the Adviser's representatives and Fund management in executive sessions held on August 4, 2022 and August 18, 2022. The Board, including the Independent Trustees, determined that the terms of the Agreement for each Fund were fair and reasonable and in the best interests of each Fund's shareholders.
In considering whether to renew the Agreement, the Board requested, and the Adviser provided, information that the Board and Adviser reasonably believed to be necessary to evaluate the Agreement. Among other information, the Board obtained and reviewed the following:
• Detailed information regarding the advisory services provided by the Adviser to each Fund;
• The investment objectives of the Funds, which require monthly rebalancing and the utilization of complex financial instruments that are not typical of traditional index tracking mutual funds;
• The level of attention required by the Adviser due to the frequent and large trading activity in the various Funds;
• The Adviser's Form ADV;
• Information about the professional qualifications of those employees primarily responsible for providing investment advisory services to the Funds;
• Information regarding each component of the contractual fee rates for the prior fiscal year and the contractual fee limitations provided by the Operating Expense Limitation Agreement;
• Information regarding advisory fees earned and waivers/reimbursements made by the Adviser in connection with providing services to the Funds for the prior fiscal year;
• Information regarding fees paid to the Adviser under, and an evaluation of, the Management Services Agreement;
• Performance information;
• Comparative industry fee data, including peer group comparisons and an assessment by an independent consultant of the appropriateness of such peer groups and of the consistency of the methodology applied by the Adviser to identify each Fund's peer group;
• Information regarding the costs investors would incur if they sought to implement independently the Funds' strategies within their personal portfolios;
• Information regarding the financial condition and profitability of the Adviser; and
• Information regarding how the Adviser monitors the Funds' compliance with regulatory requirements and Trust procedures.
The Board considered that, with respect to each Fund, it had also received information relevant to its consideration since the Fund's inception and, most recently, throughout the past year at regular Board meetings in connection with its oversight of the Funds, including information bearing on the Funds' service provider arrangements, as arranged and overseen by the Adviser, and performance results. The Board also received a memorandum from legal counsel regarding its responsibilities with respect to the approval of the Agreement and participated in a question and answer session with representatives of the Adviser. The Board carefully evaluated the relevant information and the Independent Trustees were advised by legal counsel with respect to its deliberations.
The Board did not identify any particular information that was most relevant to its consideration to approve the Agreement, and each Trustee may have afforded different weight or importance to different factors. For each Fund, the Board considered,
DIREXION ANNUAL REPORT
62
Direxion Funds
Investment Advisory Agreement Approval (Unaudited)
among other matters, the following factors to the extent applicable: (1) the nature, extent, and quality of the services provided; (2) the investment performance; (3) the profitability of the Fund and the advisory business to the Adviser; (4) the extent to which economies of scale might be realized as the Fund grows and whether fee levels reflect these economies of scale, if any, for the benefit of the Fund's shareholders; (5) comparisons of services and fees under other contracts entered into by Adviser, with comparable clients (such as institutional investors), if any; and (6) other benefits derived or anticipated to be derived and identified by Adviser from its relationship with each Fund.
Nature, Extent and Quality of Services Provided. The Board reviewed, among other things, the Adviser's business, assets under management, financial resources and capitalization, quality and quantity of personnel, experience, the variety and complexity of its investment strategies, brokerage practices, and the adequacy of its compliance systems and processes. The Board reviewed the scope of services to be provided by the Adviser under the Agreement and noted there would be no significant differences between the scope of services provided by the Adviser in the past year and those to be provided in the upcoming year. The Board also considered the Adviser's representation to the Board that it would continue to provide investment and related services that are of materially the same quality as the services that have been provided to the Funds in the past, and it considered that those services remain appropriate in scope and extent in light of the Funds' operations, the competitive landscape of the investment company business and investor needs.
The Board focused on the quality of the Adviser's personnel and operations and the systems and processes required to manage the Funds effectively, and noted that these systems and processes have been enhanced over time and may not be present at other investment advisers. In particular the Board considered, as applicable: (1) the Adviser's success in achieving each Fund's monthly leveraged investment objective, including its ability to adapt to changes in certain Funds' stated leverage amount; (2) the techniques the Adviser uses in managing leverage, which include developing index optimization and representative sampling investment strategies for certain Funds as well as specialized skills for trading complex financial instruments; (3) information regarding the Adviser's management of derivatives trading on behalf of the Funds, including the selection of swap counterparties and the negotiation of favorable derivatives contract terms; (4) the Adviser's ability to manage certain Funds in a tax efficient manner, which is more challenging for leveraged than non-leveraged funds; and (5) the size, professional experience and skills of the Adviser's portfolio management, trading, risk, compliance and legal staff as well as the Adviser's ability to recruit, train and retain personnel with the experience and expertise necessary to operate the Funds. The Board considered that the Adviser oversees all aspects of the operation of the Funds, including oversight of the Funds' service providers, and provides compliance services to the Funds.
Comparison of Advisory Services and Fees. The Board considered the fairness and reasonableness of the investment advisory fee rate payable to the Adviser by the Funds in light of the investment advisory services provided by the Adviser. In this regard, the Board also considered the ability of investors to achieve independently the investment objective of the Funds and the costs to investors of seeking to do so by utilizing a margin account or other means. The Board reviewed information provided by the Adviser comparing the hypothetical cost for shareholders to replicate the Funds' leveraged or inverse investment strategies by means other than through an investment in a Fund. The Board noted that an independent consultant had reviewed such cost comparison information and determined that the methodology used to calculate it was comprehensive and reflected a sound and objective approach to measuring the cost comparison. The Board concluded that an investor would need to devote significant time to managing his or her portfolio in order to implement independently any Fund's investment strategy and that seeking to do so would be more expensive than investing in a Fund in many cases,even cost-prohibitive in certain cases. From this perspective, the Board noted the cost effectiveness for investors of investing in the Funds to achieve certain investment objectives.
The Board further considered the fairness and reasonableness of the investment advisory fee rate payable to the Adviser by each Fund in light of fee rates paid by other registered investment companies offering strategies similar in nature to the Fund. In this regard, the Board reviewed information prepared by the Adviser, using data provided by Morningstar, Inc., to compare the Funds' contractual advisory fees, expense limitation levels, and gross and net total expenses with those of other funds with common key characteristics, such as asset size, investment objective or industry focus ("Peer Group"). The Board noted the difficulty in compiling broad and diverse Peer Groups because, by design, certain Funds are unique and, therefore, few (if any) fund complexes have funds with substantially similar investment objectives and operations. The Board also noted that an independent consultant had reviewed the Adviser's peer selection methodology and resulting Peer Groups and determined that the methodology was reasonable and well within industry standards and resulted in valid Peer Groups for the Funds.
DIREXION ANNUAL REPORT
63
Direxion Funds
Investment Advisory Agreement Approval (Unaudited)
The Board noted that the Peer Group reports included the contractual advisory fee and net and gross total expense ratios, less any Rule 12b-1 fees, for each Fund and each Peer Group fund. The Board considered that the Adviser had agreed to limit the total expenses of the Funds (subject to certain exclusions) for the next year by contractually agreeing to pay certain expenses of the Funds under an Operating Expense Limitation Agreement. The Board also noted that currently all of the Funds were operating above the expense cap established by the applicable Operating Expense Limitation Agreement and enjoying the benefit of waivers and/or reimbursements by the Adviser.
Performance of the Funds. The Board focused on the correlation of each Fund's return to the model performance return for the periods ending June 30, 2022 and June 30, 2021. In this regard, the Board considered each Fund's monthly returns versus model returns ("Tracking Difference"), the standard deviation of the Tracking Differences ("Statistical Tracking Error"), and a tracking error analysis provided by the Adviser. The Board also reviewed the total return of each Fund for the one-year period ended June 30, 2022. The Board considered reports provided to it in anticipation of the meeting, as well as performance reports provided at regular Board meetings throughout the year. The Board noted that the correlation of returns for each Fund to its target model performance was generally within expected ranges during the reviewed periods. The Board considered that, given the investment objectives of the Funds, the correlation of each such Fund's performance with the model performance and Tracking Difference, including the Statistical Tracking Error, were more meaningful indicia of the quality of the Adviser's management than a Fund's total return.
Costs of Services Provided to the Funds and Profits Realized by the Adviser. The Board reviewed information about the profitability of the Adviser based on the fee rates payable under the Agreement. The Board considered the profitability of each Fund and the overall profitability of the Adviser, as reflected in the Adviser's profitability analysis, as well as information provided by the Adviser concerning the methodology used to allocate various expenses. The Board also considered the significant drivers of cost for the Adviser including, but not limited to, intellectual capital, the dedication of personnel resources to monthly portfolio management activities (including rebalancing of the Funds), regulatory compliance, and entrepreneurial risk. The Board further considered a report on other investment advisers' profitability, which was compiled using publicly available information. The Board recognized that it is difficult to evaluate the relative profitability of investment advisory firms, including the Adviser, because many such firms are closely held and do not make such information publicly available. To the extent such information is available, it is typically only available for publicly held investment advisers who are required to provide such information in various SEC filings. In addition, the Board recognized that such reported information is affected by numerous factors, including the nature of a reporting party's fund shareholder base, the structure of the adviser, the types of funds it manages, its business mix, assumptions regarding allocations and the reporting of operating profits and net income net (rather than gross) of distribution and marketing expenses.
Economies of Scale. The Board considered the absence of breakpoints in the Adviser's fee schedule and reviewed information regarding the extent to which economies of scale or other efficiencies may result from increases in the Funds' net assets. In light of the relatively small size of many of the Funds and the fact that the size of individual Funds in the complex often increase and decrease significantly due to the unlimited trading that is permitted by most of the Funds, the Board concluded that the Funds have not yet achieved sufficient asset levels to realize economies of scale. The Board noted that it will continue to monitor fees and expenses as the Funds grow in size and assess whether fee breakpoints may be warranted.
Other Benefits. The Board considered indirect and "fall-out" benefits that the Adviser or its affiliates may derive from the relationship to the Funds. Such benefits may include the Adviser's ability to leverage its investment management personnel or infrastructure to manage other accounts. In this regard, the Board noted that the Funds pay a management services fee to the Adviser.
Conclusion. Based on, but not limited to, the above considerations, the Board, including the Independent Trustees, determined that the Agreement for the Funds is fair and reasonable in light of the nature, extent and quality of the services to be performed, the fee rates to be paid, the Adviser's expenses and such other matters as the Board considered relevant in the exercise of its business judgment. Accordingly, the Board concluded that the continuation of the Agreement was in the best interests of the shareholders of the Funds. On this basis, the Board unanimously voted in favor of the renewal of the Agreement.
DIREXION ANNUAL REPORT
64
Direxion Funds
Trustees and Officers (Unaudited)
The business affairs of the Funds are managed by or under the direction of the Board of Trustees. Information pertaining to the Trustees and Officers of the Funds is set below. The report includes additional information about the Funds' Trustees and Officers and is available without charge, upon request by calling 1-800-851-0511.
Interested Trustees
Name, Address and
Age | | Position(s)
Held with
Fund | | Term of Office
and Length of
Time Served | | Principal Occupation(s)
During Past Five Years | | # of Portfolios
in Direxion
Family of
Investment
Companies
Overseen
by Trustee(3) | | Other Trusteeships/
Directorships Held by
Trustee During Past
Five Years | |
Daniel D. O'Neill(1)
Age: 54 | |
Chairman of the Board of Trustees | |
Lifetime of Trust until removal or resignation; Since 2014 | |
Chief Executive Officer, Rafferty Asset Management, LLC, since 2021; Managing Director, Rafferty Asset Management, LLC, January 1999 – January 2019. | | |
149 | | |
None. | |
Angela Brickl(2)
Age: 46 | |
Trustee | |
Lifetime of the Trust until removal of resignation; Since 2022 | |
Chief Operating Officer, Rafferty Asset Management, LLC since May 2021; General Counsel, Rafferty Asset Management LLC, since October 2010; Chief Compliance Officer, Rafferty Asset Management, LLC, since September 2012. | | |
149 | | |
None. | |
Independent Trustees
Name, Address and
Age | | Position(s)
Held with
Fund | | Term of Office
and Length of
Time Served | | Principal Occupation(s)
During Past Five Years | | # of Portfolios
in Direxion
Family of
Investment
Companies
Overseen
by Trustee(3) | | Other Trusteeships/
Directorships Held by
Trustee During Past
Five Years | |
David L. Driscoll
Age: 53 | |
Trustee | |
Lifetime of Trust until removal or resignation; Since 2014 | |
Partner, King Associates, LLP, since 2004; Board Advisor, University Common Real Estate, since 2012; Principal, Grey Oaks LLP since 2003; Member, Kendrick LLC, since 2006. | | |
149 | | |
None. | |
(1) Mr. O'Neill is affiliated with Rafferty and Direxion. Mr. O'Neill owns a beneficial interest in Rafferty.
(2) Ms. Brickl is affiliated with Rafferty because she serves as an officer of Rafferty.
(3) The Direxion Family of Investment Companies consists of the Direxion Shares ETF Trust which, as of the date of this report, offers for sale to the public 88 of the 139 funds registered with the SEC, the Direxion Funds which, as of the date of this report, offers for sale to the public 10 funds registered with the SEC and the Direxion Insurance Trust which, as of the date of this report, does not have any funds registered with the SEC.
DIREXION ANNUAL REPORT
65
Direxion Funds
Trustees and Officers (Unaudited)
Name, Address and
Age | | Position(s)
Held with
Fund | | Term of Office
and Length of
Time Served | | Principal Occupation(s)
During Past Five Years | | # of Portfolios
in Direxion
Family of
Investment
Companies
Overseen
by Trustee(3) | | Other Trusteeships/
Directorships Held by
Trustee During Past
Five Years | |
Jacob C. Gaffey
Age: 74 | |
Trustee | |
Lifetime of Trust until removal or resignation; Since 2014 | |
Managing Director,
Loomis & Co., 2012 – 2019. | |
149 | |
None. | |
Henry W. Mulholland
Age: 59 | |
Trustee | |
Lifetime of Trust until removal or resignation; Since 2017 | |
Managing Partner, Grove Hill Partners LLC, since 2016. | |
149 | |
None. | |
Kathleen M. Berkery
Age: 55 | |
Trustee | |
Lifetime of Trust until removal or resignation; Since 2019 | |
Chief Financial Officer, Student Sponsor Partners, since November 2021; Senior Manager – Trusts & Estates, Rynkar, Vail & Barrett, LLC, since 2018; Financial Advisor, Lee, Nolan & Koroghlian Life Planning Group, 2010 – 2017. | |
149 | |
None. | |
Carlyle Peake
Age: 50 | |
Trustee | |
Lifetime of Trust until removal or resignation; Since 2022 | |
Head of US & LATAM Debt Syndicate, BBVA Securities, Inc., since 2011. | |
149 | |
None. | |
Mary Jo Collins
Age: 66 | |
Trustee | |
Lifetime of Trust until removal or resignation; Since 2022 | |
Managing Director, Imperial Capital LLC, since 2020; Director, Royal Bank of Canada, 2014 – 2020. | |
149 | |
None. | |
(3) The Direxion Family of Investment Companies consists of the Direxion Shares ETF Trust which, as of the date of this report, offers for sale to the public 88 of the 139 funds registered with the SEC, the Direxion Funds which, as of the date of this report, offers for sale to the public 10 funds registered with the SEC and the Direxion Insurance Trust which, as of the date of this report, does not have any funds registered with the SEC.
DIREXION ANNUAL REPORT
66
Direxion Funds
Trustees and Officers (Unaudited)
The officers of the Trust conduct and supervise its daily business. Unless otherwise noted, an individual's business address is 1301 Avenue of the Americas, 28th Floor, New York, New York 10019. As of the date of this report, the officers of the Trust, their ages, their business address and their principal occupations during the past five years are as follows:
Principal Officers of the Trust
Name, Address and
Age | | Position(s)
Held with
Fund | | Term of Office
and Length of
Time Served | | Principal Occupation(s)
During Past Five Years | | # of Portfolios
in the Direxion
Family of
Investment
Companies
Overseen
by Trustee(3) | | Other Trusteeships/
Directorships Held by
Trustee During Past
Five Years | |
Daniel D. O'Neill(1)
Age: 54 | |
Chief Executive Officer | |
One Year; Since 2021 | |
Chief Executive Officer, Rafferty Asset Management, LLC, since 2021; Managing Director, Rafferty Asset Management, LLC, January 1999 – January 2019. | |
N/A | |
N/A | |
Patrick J. Rudnick
Age: 49 | |
Principal Executive Officer | |
One Year; Since 2018 | |
Senior Vice President, since March 2013, Rafferty Asset Management, LLC. | |
N/A | |
N/A | |
Angela Brickl(2)
Age: 46 | |
Chief Compliance Officer | |
One Year; Since 2018 | |
Chief Operating Officer, Rafferty Asset Management, LLC, since May 2021; General Counsel, Rafferty Asset Management LLC, since October 2010; Chief Compliance Officer, Rafferty Asset Management, LLC, since September 2012. | |
N/A | |
N/A | |
Corey Noltner
Age: 33 | |
Principal Financial Officer | |
One Year; Since 2021 | |
Senior Business Analyst, Rafferty Asset Management, LLC, Since 2015. | |
N/A | |
N/A | |
Alyssa Sherman
Age: 33 | |
Secretary | |
One Year; Since 2022 | |
Associate General Counsel, Rafferty Asset Management, LLC, since April 2021; Associate, K&L Gates LLP, September 2015 –
March 2021. | |
N/A | |
N/A | |
(1) Mr. O'Neill serves as Chairman of the Board of Trustees of the Direxion Funds, Direxion Insurance Trust and Direxion Shares ETF Trust.
(2) Ms. Brickl serves on the Board of Trustees of the Direxion Funds, Direxion Insurance Trust and Direxion Shares ETF Trust.
(3) The Direxion Family of Investment Companies consists of the Direxion Shares ETF Trust which, as of the date of this report, offers for sale to the public 88 of the 139 funds registered with the SEC, the Direxion Funds which, as of the date of this report, offers for sale to the public 10 funds registered with the SEC and the Direxion Insurance Trust which, as of the date of this report, does not have any funds registered with the SEC.
DIREXION ANNUAL REPORT
67
At the Direxion Funds, we are committed to protecting your privacy. To open and service your Direxion accounts, we collect and maintain certain nonpublic personal information about you, such as your address, phone number, social security number, purchases, sales, account balances, bank account information and other personal financial information. We collect this information from the following sources:
• Account applications or other forms on which you provide information,
• Mail, e-mail, the telephone and our website, and
• Your transactions and account inquiries with us.
We safeguard the personal information that you have entrusted to us in the following ways:
• As a general policy, only those employees who maintain your account and respond to your requests for additional services have access to your account information.
• We maintain physical, electronic, and procedural safeguards to insure the security of your personal information and to prevent unauthorized access to your information.
We do not disclose any nonpublic personal information about you or our former shareholders to anyone, except as permitted or required by law. In the course of conducting business and maintaining your account we may share shareholder information, as allowed by law, with our affiliated companies and with other service providers, including financial intermediaries, custodians, transfer agents and marketing consultants. Those companies are contractually bound to use that information only for the services for which we hired them. They are not permitted to use or share our shareholders' nonpublic personal information for any other purpose. There also may be times when we provide information to federal, state or local authorities as required by law.
In the event that you hold fund shares of Direxion through a financial intermediary, including, but not limited to, a broker-dealer, bank, or trust company, the privacy policy of your financial intermediary would govern how your nonpublic personal information would be shared with nonaffiliated third parties.
For questions about our policy, please contact us at (800) 851-0511.
This page is not a part of the Annual Report.
DIREXION ANNUAL REPORT

ANNUAL REPORT AUGUST 31, 2022
1301 Avenue of the Americas (6th Ave.), 28th Floor New York, New York 10019 (800) 851-0511 www.direxioninvestments.com
Investment Adviser
Rafferty Asset Management, LLC
1301 Avenue of the Americas (6th Ave.), 28th Floor
New York, NY 10019
Administrator, Transfer Agent, Dividend Paying Agent & Shareholding Servicing Agent
U.S. Bancorp Fund Services, LLC
P.O. Box 1993
Milwaukee, WI 53201-1993
Custodian
U.S. Bank, N.A.
1555 RiverCenter Dr., Suite 302
Milwaukee, WI 53212
Independent Registered Public Accounting Firm
Ernst & Young LLP
700 Nicollet Mall, Suite 500
Minneapolis, MN 55402
Distributor
Foreside Fund Services, LLC
3 Canal Plaza, Suite 100
Portland, Maine 04101
The Trust's Proxy Voting Policies are available without charge by calling 1-800-851-0511, or by accessing the SEC's website, at www.sec.gov.
The actual voting records relating to portfolio securities during the most recent period ended June 30 is available without charge by calling 1-800-851-0511 or by accessing the SEC's website at www.sec.gov.
The Trust files complete schedule of portfolio holdings with the SEC for its first and third fiscal quarters on Part F of Form N-PORT. The Funds' Part F of Form N-PORT (and Form N-Q prior to February 28, 2019) is available on the SEC's website at www.sec.gov.
This report has been prepared for shareholders and may be distributed to others only if preceded or accompanied by a current prospectus.
Annual
Report
Hilton Tactical Income Fund
AUGUST 31, 2022

TICKERS:
INVESTOR CLASS - HCYAX | INSTITUTIONAL CLASS - HCYIX
1301 Avenue of the Americas (6th Avenue), 28th Floor | New York, New York 10019 | (800) 851-0511
www.direxioninvestments.com


Letter to Shareholders (Unaudited) | | | 4 | | |
Performance Summary (Unaudited) | | | 8 | | |
Expense Example (Unaudited) | | | 9 | | |
Allocation of Portfolio Holdings (Unaudited) | | | 10 | | |
Schedule of Investments | | | 11 | | |
Statement of Assets and Liabilities | | | 13 | | |
Statement of Operations | | | 14 | | |
Statements of Changes in Net Assets | | | 15 | | |
Financial Highlights | | | 16 | | |
Notes to the Financial Statements | | | 17 | | |
Report of Independent Registered Public
Accounting Firm | | | 23 | | |
| Supplemental Information (Unaudited) | | | 24 | | |
Investment Advisory and Subadvisory
Agreement Approvals (Unaudited) | | | 28 | | |
| Trustees and Officers (Unaudited) | | | 31 | | |
You can find the Fund's prospectus, reports to shareholders, and other information about the Fund online at http://www.direxioninvestments.com/regulatory-documents. You can also get this information at no cost by calling (800) 851-0511 or by sending an email request to info@direxionfunds.com. | |
IMPORTANT NOTE: Beginning on January 1, 2021, as permitted by regulations adopted by the Securities and Exchange Commission, paper copies of the Fund's annual and semi-annual shareholder reports will no longer be sent by mail, unless you specifically request paper copies of the shareholder reports from your financial intermediary such as a broker-dealer or bank. Instead, annual and semi-annual shareholder reports will be available on a website, and you will be notified by mail each time a report is posted and provided with a website link to access the report. | |
You may elect to receive all future annual and semi-annual shareholder reports in paper, free of charge. To elect to continue receive paper copies of shareholder reports through the mail or to otherwise change your delivery method, contact your financial intermediary or follow the instructions included with this disclosure. Your election to receive shareholder reports in paper will apply to all funds that you hold through the financial intermediary. If you already elected to receive shareholder reports electronically, you will not be affected by this change and you need not take any action. | |
Help Preserve the Environment – Go Green!
Go paperless with Direxion e-Delivery – a service allowing shareholders to reduce clutter with full online access to regulatory documents. Begin the preservation process with e-delivery.
With Direxion e-Delivery you can:
• Receive email notifications when your most recent shareholder communications are available for review.
• Access prospectuses, annual reports and semi-annual reports online.
It's easy to enroll:
1. Visit www.direxioninvestments.com/edelivery
2. Follow the simple enrollment instructions
If you have questions about Direxion e-Delivery services, contact one of our shareholder representatives at 800-851-0511.


Letter to Shareholders (Unaudited)
Dear Shareholders,
This Annual Report is for the Hilton Tactical Income Fund (the "Fund") and covers the period from September 1, 2021 to August 31, 2022 (the "Annual Period"). Rafferty Asset Management, LLC serves as adviser to the Fund (the "Adviser") and Hilton Capital Management, LLC serves as the Fund's subadviser (the "Subadviser"). The Fund offers an Institutional Class and Investor Class.
Fund & Market Commentary:
The Institutional Class posted a return of -7.13% and the Investor Class -7.41% during the Annual Period. The Fund's benchmark, a blend of 60% of the Bloomberg U.S. Intermediate Government/Credit Bond Index and 40% S&P 500® Index, returned -9.08% for the Annual Period.
The Fund's 30-day SEC Yield at August 31, 2022 was 2.16% and 1.90% for the Institutional Class and Investor Class, respectively.
During the Annual Period, the Fund was very active adjusting the portfolio allocation to best suit the ever-changing market and economic conditions. The Annual Period was marked by an extremely volatile environment in both equities and fixed income. The 4th quarter of 2021 saw a continuation of the market expansion following the Covid reopening and U.S. economic stimulus. Overall economic conditions were still strong, and the employment environment was robust with more job openings than unemployed workers. Corporate profits were still growing while forecasting continued growth. From the start of 2022, the picture changed dramatically. The onset of high and sticky inflation, further stoked by the Russian invasion of Ukraine, accelerated the need for central banks throughout the world, and particularly the U.S. Federal Reserve, to cool off the economy. The end of Zero Interest Rate policy was about to begin, and the ramifications throughout the U.S. economy, and world economy, started to materialize. Beginning in March 2022, the U.S. Federal Reserve raised the Fed Funds rate four times, for a total of 2.25%, through the end of August, 2022 — a pace not seen in 50 years. The tightening actions have led to a surge in the U.S. Dollar, with its strength having a ripple effect across all markets. The higher borrowing costs, associated with higher interest rates, have put pressure on corporate earnings in a short period of time. The equity and credit markets are just digesting this, and Q3 2022 earnings should begin to reflect higher costs and tighter margins.
Fortunately, the Fund was ahead of most of these events, and was able to reposition the composition of the Fund to lessen the effects of this new environment. As long-term investors in the Fund know, the Portfolio Management team has the ability to adjust up, or down, its equity and fixed income exposure. Also, within equities it can shift from sector to sector to fit the global macro-outlook. The Fund may also shift the credit and duration exposure on the fixed income side to mirror that outlook. Coming into the Annual Period, the Fund was overweight equities, with a 52% weighting when compared to the historical 40%. Throughout the Annual Period, the Fund continuously reduced that exposure, with a 33.6% weighting at Period-end. Conversely, the fixed income weight was increased from 35% to 62.7%. Breaking down those allocations further, on the equity side, the Fund underweighted the exposure to Consumer Discretionary, Financials, Industrials, Materials and Technology. The Fund overweighted the exposure to Consumer Staples, REITs, Healthcare and Utilities, historically sectors that perform better as the economy slows and possibly nears a recession. On the fixed income side, where there has been record losses the first three quarters of 2022, the Fund drastically reduced its credit exposure and shortened duration to miss some of the interest rate-induced pain. The yield on the 10-year US Treasury went from 1.31% to 3.19% over the Annual Period, a move few investors have seen. The cash weighting in the portfolio has been reduced significantly during the Annual Period, as well, to take advantage of higher rates on very short-term bonds. The Fund started the Period at 12.4%, ending at 3.7%. All position adjustments have been made in an attempt to adjust the portfolio for a continuing trend, while giving the Portfolio Management team the flexibility to pivot to a more aggressive stance when the macro-outlook begins to improve. Thank you for your investment and continued support of our investment process.
DIREXION ANNUAL REPORT
4
Principal Investment Strategy:
The Hilton Tactical Income Fund primarily seeks income, with a secondary investment objective of capital appreciation consistent with the preservation of capital. The Fund employs a disciplined approach to balancing fixed income investments, with historically higher income producing equity investments, focusing on minimizing absolute risk and volatility. The Subadviser generally seeks to mitigate portfolio risk and volatility by creating a diversified portfolio of income producing securities that also offer the potential for capital appreciation but may also invest in options to attempt to hedge volatility and portfolio risks. The securities in which the Fund may invest include domestic and foreign, including emerging markets, common and preferred stocks of any market capitalization, closed-end funds and exchanged traded-funds ("ETFs"), master limited partnerships ("MLPs"), real estate investment trusts ("REITs"), and a variety of debt instruments of any maturity, including corporate bonds, exchanged-traded notes ("ETNs"), municipal bonds, and securities issued, backed or otherwise guaranteed by the U.S. government, or its agencies, including securities issued by U.S. government sponsored entities.
MLPs are publicly traded partnerships primarily engaged in the transportation, storage, processing, refining, marketing, exploration, production, and mining of minerals and natural resources. The Fund intends to continue to qualify as a regulated investment company under Subchapter M of the Internal Revenue Code of 1986, as amended. Consistent with that intention, the Fund shall invest no more than 25% of its total assets in securities of MLPs.
REITs are corporations or trusts that invest primarily in fee or leasehold ownership of real estate, mortgages or shares issued by other REITs, and that receive favorable tax treatment provided they meet certain conditions, including the requirement that they distribute at least 90% of their taxable income.
The Subadviser's investment process begins by looking at various global macro-economic factors such as fiscal/monetary policy, interest rates, geo-political risks, inflation, commodity pricing, government policies and general business conditions. For the Fund's equity portfolio, the Subadviser reviews a broad array of possible income-producing investments and then analyzes company-specific fundamental research to understand a company's dividend policy, relative value and balance sheet. Investments are selected for the Fund's portfolio that demonstrate stable and consistent cash flow, strong underlying asset value, competitive advantages and management teams with demonstrable positive track records.
The Subadviser has a two-tier approach to managing the Fund's fixed income portfolio. First, it considers a long-term strategic investment view. Second, it buys and sells fixed income securities opportunistically in response to short-term market, economic, political, or other developments. The objective of the Subadviser's fixed income portfolio strategy is to generate higher income than would be expected from traditional intermediate-term fixed income investments such as U.S. government bonds. As a result, the Fund may invest up to 30% in high yield debt or "junk bonds" (higher-risk, lower-rated fixed income securities such as those rated lower than BBB- by Standard & Poor's Rating Service, Inc. or lower than Baa3 by Moody's Investors Service, Inc. or, if unrated, determined by the Subadviser to be of comparable quality). The Fund may invest in fixed income securities of any duration and may include foreign bonds that meet the Subadviser's investment criteria. Duration measures the sensitivity of the price of a fixed income investment to a 1% change in interest rates. For example, a five-year duration means the investment will decrease in value by 5% if interest rates rise 1%.
The Subadviser's investment team has the flexibility to change the Fund's asset allocation to reflect its outlook on market conditions and may reallocate the Fund's investments between asset classes in an attempt to improve the Fund's total return and reduce volatility. Volatility in the markets provides the Subadviser with the opportunity to benefit from perceived pricing dislocations that may occur during periods of market distress. The Subadviser make asset allocation adjustments based on a combination of bottom-up/top-down fundamental analysis and relative value analysis among capital market instruments within the target asset classes.
At the discretion of the Subadviser, the Fund may invest its assets in cash, cash equivalents, and high-quality, short-term debt securities and money market instruments for (i) temporary defensive purposes in response to adverse market, economic or political conditions and (ii) cash flow flexibility. Taking a temporary defensive position may result in the Fund not achieving its investment objective.
DIREXION ANNUAL REPORT
5
As always, we thank you for using the Hilton Tactical Income Fund and we look forward to our mutual success.
Regards,

| | 
| | 
| |
William J. Garvey | | Craig O'Neill | | Alex Oxenham | |
Hilton Capital Management, LLC | | Hilton Capital Management, LLC | | Hilton Capital Management, LLC | |
Risks of the Fund – Mutual fund investing involves risk. Principal loss is possible. The Fund's strategy of investing in dividend-paying stocks involves the risk that such stocks may fall out favor with investors and underperform the market. In addition, there is the possibility that such companies could reduce or eliminate the payment of dividends in the future or the anticipated acceleration of dividends could not occur. The Fund may invest in foreign securities and ADR's which involve political, economic and currency risks, greater volatility and differences in accounting methods. Medium- and small- capitalization companies tend to have limited liquidity and greater price volatility than large-capitalization companies. The Fund is also subject to Market Disruption Risk.
Investments in REIT securities involve risks such as declines in the value of real estate and increased susceptibility to adverse economic regulatory expenses. The fund may invest in MLP's which can be negatively influenced when interest rates rise. These investments also entail many of the general tax risks of investing in a partnership. There is always the risk that an MLP will fail to qualify for favorable tax treatments. Investments in debt securities typically decrease in value when interest rates rise. This risk is usually greater for longer-term debt securities. Investment by the Fund in lower-rated and nonrated securities presents a greater risk of loss to principal and interest than higher-rated securities. Income from municipal securities may be subject to state and local taxes and a portion of income may be subject to the federal alternative minimum tax for certain investors. Federal income tax rules will apply to any capital gains distributions. Because the funds invest in ETFs and ETN's, they are subject to additional risks that do not apply to conventional mutual funds. ETF risk includes the risks that the market price of the shares may trade at a discount to its net asset value ("NAV"), an active secondary trading market may not develop or be maintained, or trading may be halted by the exchange in which they trade, which may impact a Fund's ability to sell its shares. ETN risk includes the risks that the value of an ETN may be influenced by time to maturity, level of supply and demand for the ETN, volatility and lack of liquidity in the underlying securities' markets, changes in the applicable interest rates, changes in the issuer's credit rating and economic, legal, political or geographic events that affect the referenced index. In addition, ETNs are unsecured debt of the issuer and would lose value if the issuer goes bankrupt. Please read the prospectus for a more complete description of these and other risks of the Fund.
Index Descriptions – Please note that you cannot invest directly in an index, although you may invest in the underlying securities represented in the index. Index returns are adjusted to reflect the reinvestment of dividends on securities in the index but do not reflect the expenses of the Fund.
DIREXION ANNUAL REPORT
6
The Bloomberg Intermediate US Government/Credit Bond Index is a broad-based flagship benchmark that measures the non-securitized component of the Bloomberg US Aggregate Bond Index with less than 10 years to maturity. The index includes investment grade, US dollar-denominated, fixed-rate treasuries, government-related and corporate securities.
The S&P 500® Index is one of the most commonly used benchmarks for the overall U.S. Stock Market. It is a market value weighted index and each stock's weight is proportionate to its market value.
Distributed by: Foreside Fund Services, LLC
DIREXION ANNUAL REPORT
7
Hilton Tactical Income Fund
Performance Summary (Unaudited)
September 16, 20131 - August 31, 2022
Investment Objective: Primarily seeks income with a secondary investment objective of capital appreciation consistent with the preservation of capital.
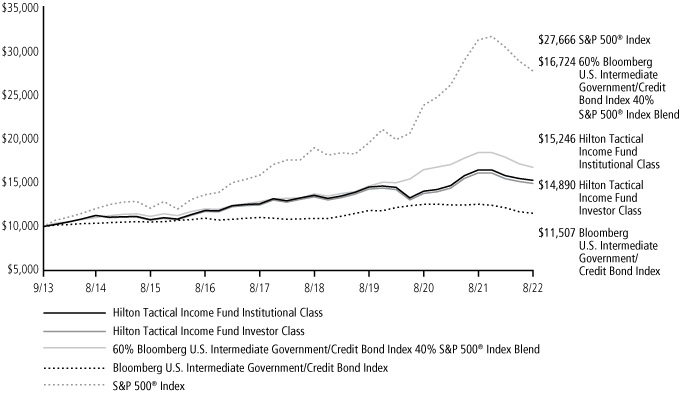
| | | Average Annual Total Return2 | |
| | | 1 Year | | 3 Years | | 5 Years | | Since Inception | |
Hilton Tactical Income Fund – Institutional Class | | | -7.13 | % | | | 1.73 | % | | | 3.93 | % | | | 4.82 | % | |
Hilton Tactical Income Fund – Investor Class | | | -7.41 | % | | | 1.48 | % | | | 3.67 | % | | | 4.55 | % | |
60% Bloomberg U.S. Intermediate Government/Credit Bond Index
40% S&P 500® Index Blend | | | -9.08 | % | | | 4.66 | % | | | 5.47 | % | | | 5.91 | % | |
Bloomberg U.S. Intermediate Government/Credit Bond Index | | | -8.20 | % | | | -0.87 | % | | | 0.84 | % | | | 1.58 | % | |
S&P 500® Index | | | -11.23 | % | | | 12.39 | % | | | 11.82 | % | | | 12.03 | % | |
This chart illustrates the performance of a hypothetical $10,000 investment made on the inception date of each share class of the Fund, and is not intended to imply any future performance. The returns shown do not reflect the deduction or taxes that a shareholder would pay on fund distributions or the redemption of fund shares. The performance of the Bloomberg U.S. Intermediate Government/Credit Bond Index and S&P 500® Index, the Fund's benchmark, does not reflect the deduction of fees associated with a mutual fund, such as investment management fees. Investors cannot invest directly in an index, although they can invest in its underlying securities. During the period shown, Rafferty Asset Management, LLC waived and/or reimbursed fees for various expenses. Had these waivers and/or reimbursements not been in effect, performance would have been lower.
The Fund may impose a 1.00% redemption fee on Institutional Class shares and Investor Class shares redeemed (through sales or exchanges) within 30 days of the date of purchase. Performance data does not reflect the redemption fee. If reflected, total returns would be reduced.
On June 30, 2018, the Fund's Class A shares were redesignated as Investor Class shares. For the period from June 1, 2015 through June 29, 2018, purchases of the former Class A shares were charged an up-front sales charge of 5.50%. For the period from September 16, 2013 (fund inception) to June 1, 2015 and for the period June 30, 2018 to August 31, 2018, this up-front sales charge was not charged. The effect of this sales charge is not reflected in the total return presented in the above table.
The performance data quoted represents past performance. Past performance does not guarantee future results. The investment return and principal value of an investment will fluctuate. An investor's shares, when redeemed, may be worth more or less than their original cost. Current performance may be lower or higher than the performance quoted. Returns for performance under one year are cumulative, not annualized. The gross expense ratio, per the prospectus dated December 29, 2021 is 1.46% and 1.21% for the Investor and Institutional Shares, respectively.
1 Commencement of operations.
2 As of August 31, 2022.
DIREXION ANNUAL REPORT
8
Expense Example (Unaudited)
August 31, 2022
As a shareholder of a mutual fund, you incur two types of costs: (1) transaction costs, including sales charges (loads) on purchase payments, reinvested dividends, or other distributions; redemption fees and exchange fees; and (2) ongoing costs, including management fees; distribution and/or service fees; and other fund expenses. This example is intended to help you understand your ongoing costs (in dollars) of investing in a fund and to compare costs with the ongoing costs of investing in other mutual funds.
The example is based on an investment of $1,000 invested at the beginning of the period and held for the entire period (March 1, 2022 – August 31, 2022).
Actual expenses
The first line of the table below provides information about actual account values and actual expenses. You may use the information in this line, together with the amount you invested, to estimate the expense that you paid over the period. Simply divide your account value by $1,000 (for example, an $8,600 account value divided by $1,000 = 8.6), then multiply the result by the number in the first line under the heading entitled "Expenses Paid During Period" to estimate the expenses you paid on your account during this period.
Hypothetical example for comparison purposes
The second line of the table below provides information about hypothetical account values and hypothetical expenses based on the Fund's actual expense ratio and an assumed rate of return of 5% per year before expenses, which is not the Fund's actual return. The hypothetical account values and expenses may not be used to estimate the actual ending account balance or expenses you paid for the period. You may use this information to compare the ongoing costs of investing in the Fund and other funds. To do so, compare this 5% hypothetical example with the 5% hypothetical examples that appear in the shareholder reports of the other funds.
Please note that the expenses shown in the table are meant to highlight your ongoing costs only and do not reflect any transactional costs, such as wire transfers, returned checks or stop payment orders. Therefore, the second line of the table is useful in comparing ongoing costs only, and will not help you determine the relative costs of owning different funds. In addition, if these transactional costs were included, your costs would have been higher.
Expense Example Table (Unaudited)
August 31, 2022
| | | Annualized
Expense
Ratio | | Beginning
Account Value
March 1, 2022 | | Ending
Account Value
August 31, 2022 | | Expenses
Paid During
Period* | |
Hilton Tactical Income Fund Institutional Class | |
Based on actual fund return | | | 0.87 | % | | $ | 1,000.00 | | | $ | 966.40 | | | $ | 4.31 | | |
Based on hypothetical 5% return | | | 0.87 | % | | | 1,000.00 | | | | 1,020.82 | | | | 4.43 | | |
Hilton Tactical Income Fund Investor Class | |
Based on actual fund return | | | 1.12 | % | | | 1,000.00 | | | | 965.20 | | | | 5.55 | | |
Based on hypothetical 5% return | | | 1.12 | % | | | 1,000.00 | | | | 1,019.56 | | | | 5.70 | | |
* Expenses are equal to the Fund's annualized expense ratio, multiplied by the average account value over the period, multiplied by 184 days (the number of days in the period of March 1, 2022 to August 31, 2022), then divided by 365.
DIREXION ANNUAL REPORT
9
Allocation of Portfolio Holdings (Unaudited)
August 31, 2022
| | | U.S.
Government
Obligations | | Common
Stock | | Corporate
Bonds | | Investment
Companies | | Preferred
Stocks | | Cash* | | Total | |
Hilton Tactical Income Fund | | | 43 | % | | | 29 | % | | | 12 | % | | | 9 | % | | | 3 | % | | | 4 | % | | | 100 | % | |
Allocation of Portfolio Holdings reflects percentages of net assets.
* Cash and other assets less liabilities.
DIREXION ANNUAL REPORT
10
Hilton Tactical Income Fund
Schedule of Investments
August 31, 2022
Shares/
Principal | | | | Fair Value | |
U.S. GOVERNMENT OBLIGATIONS - 43.5% | | | |
| | | | | U.S. Treasury Note | | | | | |
| | 3,675,000 | | | 2.00%, 04/30/2024 | | $ | 3,590,590 | | |
| | 3,335,000 | | | 2.50%, 05/15/2024 | | | 3,283,672 | | |
| | 5,505,000 | | | 3.00%, 06/30/2024 | | | 5,460,164 | | |
| | 8,640,000 | | | 2.00%, 02/15/2025 | | | 8,347,050 | | |
| | 3,585,000 | | | 2.63%, 03/31/2025 | | | 3,512,320 | | |
| | 8,595,000 | | | 2.88%, 04/30/2025 | | | 8,464,061 | | |
| | 1,790,000 | | | 2.00%, 11/15/2026 | | | 1,692,739 | | |
| | 11,180,000 | | | 1.75%, 12/31/2026 | | | 10,464,654 | | |
| | 2,405,000 | | | 2.75%, 04/30/2027 | | | 2,344,828 | | |
| | 2,085,000 | | | 3.25%, 06/30/2027 | | | 2,078,729 | | |
| | 1,955,000 | | | 1.25%, 03/31/2028 | | | 1,749,114 | | |
| | 1,185,000 | | | 3.25%, 06/30/2029 | | | 1,183,426 | | |
| | | | | TOTAL U.S. GOVERNMENT
OBLIGATIONS
(Cost $54,184,639) | | $ | 52,171,347 | | |
COMMON STOCKS - 28.5% | | | |
Auto Components - 1.1% | | | |
| | 7,780 | | | Advance Auto Parts, Inc. | | $ | 1,312,019 | | |
Beverages - 2.9% | | | |
| | 13,155 | | | PepsiCo, Inc. | | | 2,266,212 | | |
| | 19,695 | | | The Coca-Cola Co. | | | 1,215,378 | | |
| | | | 3,481,590 | | |
Capital Markets - 0.5% | | | |
| | 8,440 | | | Ares Management Corp. | | | 625,742 | | |
Commercial Services & Supplies - 1.8% | | | |
| | 14,740 | | | Republic Services, Inc. | | | 2,103,693 | | |
Communications Equipment - 1.2% | | | |
| | 32,230 | | | Cisco Systems, Inc. | | | 1,441,326 | | |
Equity REITs - 3.5% | | | |
| | 6,600 | | | Alexandria Real Estate Equities, Inc. | | | 1,012,440 | | |
| | 9,145 | | | Crown Castle International Corp. | | | 1,562,240 | | |
| | 42,265 | | | Four Corners Property Trust, Inc. | | | 1,136,506 | | |
| | 5,300 | | | The Blackstone Group, Inc. | | | 497,882 | | |
| | | | 4,209,068 | | |
Food & Staples Retailing - 1.2% | | | |
| | 10,015 | | | Wal-Mart Stores, Inc. | | | 1,327,488 | | |
Health Care Equipment & Supplies - 0.5% | | | |
| | 5,320 | | | Zimmer Biomet Holdings, Inc. | | | 565,622 | | |
Health Care Providers & Services - 2.7% | | | |
| | 17,065 | | | CVS Health Corp. | | | 1,674,930 | | |
| | 3,070 | | | UnitedHealth Group, Inc. | | | 1,594,343 | | |
| | | | 3,269,273 | | |
Hotels, Restaurants & Leisure - 0.9% | | | |
| | 4,500 | | | McDonald's Corp. | | | 1,135,260 | | |
Household Products - 0.9% | | | |
| | 14,435 | | | Colgate-Palmolive Co. | | | 1,128,961 | | |
IT Services - 2.7% | | | |
| | 3,680 | | | Accenture PLC (Ireland) | | | 1,061,533 | | |
| | 12,725 | | | Booz Allen Hamilton Holding Corp. | | | 1,217,782 | | |
| | 9,095 | | | Thomson Reuters Corp. (Canada) | | | 1,000,632 | | |
| | | | 3,279,947 | | |
Shares/
Principal | | | | Fair Value | |
Mortgage REITs - 1.5% | | | |
| | 3,055 | | | AvalonBay Communities, Inc. | | $ | 613,780 | | |
| | 49,745 | | | Starwood Property Trust, Inc. | | | 1,140,653 | | |
| | | | 1,754,433 | | |
Multiline Retail - 1.0% | | | |
| | 5,195 | | | Dollar General Corp. | | | 1,233,397 | | |
Pharmaceuticals - 2.1% | | | |
| | 23,310 | | | AstraZeneca PLC (United Kingdom) | | | 1,454,078 | | |
| | 16,190 | | | Bristol-Myers Squibb Co. | | | 1,091,368 | | |
| | | | 2,545,446 | | |
Software - 1.8% | | | |
| | 8,485 | | | Microsoft Corp. | | | 2,218,573 | | |
Technology Hardware, Storage & Peripherals - 2.2% | | | |
| | 16,960 | | | Apple, Inc. | | | 2,666,451 | | |
| | | | | TOTAL COMMON STOCKS
(Cost $28,090,206) | | $ | 34,298,289 | | |
CORPORATE BONDS - 12.3% | | | |
Aerospace & Defense - 0.5% | | | |
| | | | | Lockheed Martin Corp. | | | | | |
| | 615,000 | | | 3.55%, 01/15/2026 | | $ | 610,996 | | |
Biotechnology - 1.3% | | | |
| | | | | AbbVie, Inc. | | | | | |
| | 1,085,000 | | | 2.90%, 11/06/2022 | | | 1,084,254 | | |
| | | | | Amgen, Inc. | | | | | |
| | 510,000 | | | 2.60%, 08/19/2026 | | | 483,508 | | |
| | | | 1,567,762 | | |
Capital Markets - 1.7% | | | |
| | | | | B Riley Financial, Inc. | | | | | |
| | 13,570 | | | 6.50%, 09/30/2026 | | | 329,344 | | |
| | | | | BlackRock, Inc. | | | | | |
| | 490,000 | | | 3.50%, 03/18/2024 | | | 489,132 | | |
| | | | | Fidus Investment Corp. | | | | | |
| | 200,000 | | | 3.50%, 11/15/2026 | | | 178,055 | | |
| | | | | Gladstone Investment Corp. | | | | | |
| | 11,335 | | | 5.00%, 05/01/2026 | | | 271,133 | | |
| | | | | Ready Capital Corp. | | | | | |
| | 11,500 | | | 5.75%, 02/15/2026 | | | 270,250 | | |
| | | | | The Charles Schwab Corp. | | | | | |
| | 400,000 | | | 3.50%, 11/15/2026 | | | 406,599 | | |
| | | | 1,944,513 | | |
Chemicals - 0.4% | | | |
| | | | | Air Products & Chemicals, Inc. | | | | | |
| | 450,000 | | | 3.35%, 07/31/2024 | | | 446,933 | | |
Communications Equipment - 0.7% | | | |
| | | | | Cisco Systems, Inc. | | | | | |
| | 885,000 | | | 3.63%, 03/04/2024 | | | 887,847 | | |
Consumer Finance - 0.5% | | | |
| | | | | American Express Co. | | | | | |
| | 610,000 | | | 3.38%, 05/03/2024 | | | 603,543 | | |
Household Products - 0.3% | | | |
| | | | | Colgate-Palmolive Co. | | | | | |
| | 305,000 | | | 3.10%, 08/15/2025 | | | 300,205 | | |
The accompanying notes are an integral part of these financial statements.
DIREXION ANNUAL REPORT
11
Hilton Tactical Income Fund
Schedule of Investments
August 31, 2022
Shares/
Principal | | | | Fair Value | |
Interactive Media & Services - 0.3% | | | |
| | | | | Alphabet, Inc. | | | | | |
| | 400,000 | | | 3.38%, 02/25/2024 | | $ | 399,529 | | |
Internet & Direct Marketing Retail - 0.6% | | | |
| | | | | Amazon.com, Inc. | | | | | |
| | 780,000 | | | 2.80%, 08/22/2024 | | | 770,904 | | |
IT Services - 1.4% | | | |
| | | | | Equinix, Inc. | | | | | |
| | 765,000 | | | 2.63%, 11/18/2024 | | | 737,215 | | |
| | | | | Fiserv, Inc. | | | | | |
| | 610,000 | | | 2.75%, 07/01/2024 | | | 595,282 | | |
| | | | | PayPal Holdings, Inc. | | | | | |
| | 350,000 | | | 3.90%, 06/01/2027 | | | 346,225 | | |
| | | | 1,678,722 | | |
Pharmaceuticals - 1.3% | | | |
| | | | | Bristol-Myers Squibb Co. | | | | | |
| | 720,000 | | | 2.90%, 07/26/2024 | | | 709,106 | | |
| | | | | GlaxoSmithKline Capital PLC
(United Kingdom) | | | | | |
| | 610,000 | | | 2.85%, 05/08/2022 | | | 604,539 | | |
| | | | | Merck & Co, Inc. | | | | | |
| | 180,000 | | | 2.90%, 03/07/2024 | | | 178,432 | | |
| | | | 1,492,077 | | |
Semiconductors & Semiconductor Equipment - 0.5% | | | |
| | | | | Intel Corp. | | | | | |
| | 620,000 | | | 3.40%, 03/25/2025 | | | 613,066 | | |
Software - 2.1% | | | |
| | | | | Microsoft Corp. | | | | | |
| | 950,000 | | | 3.13%, 11/03/2025 | | | 933,548 | | |
| | | | | Oracle Corp. | | | | | |
| | 680,000 | | | 2.50%, 10/15/2022 | | | 679,306 | | |
| | | | | Oracle Corp. | | | | | |
| | 345,000 | | | 2.88%, 03/25/2031 | | | 287,029 | | |
| | | | | salesforce.com, Inc. | | | | | |
| | 580,000 | | | 3.25%, 04/11/2023 | | | 579,026 | | |
| | | | 2,478,909 | | |
Technology Hardware, Storage & Peripherals - 0.7% | | | |
| | | | | Apple, Inc. | | | | | |
| | 880,000 | | | 3.20%, 05/13/2025 | | | 869,263 | | |
| | | | | TOTAL CORPORATE BONDS
(Cost $14,887,866) | | $ | 14,664,269 | | |
Shares/
Principal | | | | Fair Value | |
INVESTMENT COMPANIES - 8.9% | | | |
| | 29,315 | | | Ares Capital Corp. | | $ | 575,747 | | |
| | 8,725 | | | Energy Select Sector SPDR Fund | | | 702,362 | | |
| | 24,985 | | | Janus Henderson AAA CLO ETF | | | 1,232,760 | | |
| | 63,860 | | | Utilities Select Sector SPDR Fund | | | 4,747,352 | | |
| | 45,485 | | | Vanguard Short-Term
Corporate Bond ETF | | | 3,459,134 | | |
| | | | | TOTAL INVESTMENT COMPANIES
(Cost $10,456,309) | | $ | 10,717,355 | | |
PREFERRED STOCKS - 3.1% | | | |
Banks - 1.4% | | | |
| | | | | Bank of America Corp. | | | | | |
| | 26,180 | | | 5.00%, 09/17/2024 | | $ | 577,531 | | |
| | | | | Pinnacle Financial Partners, Inc. | | | | | |
| | 18,390 | | | 6.75%, 09/01/2025 | | | 466,738 | | |
| | | | | Wells Fargo & Co. | | | | | |
| | 13,725 | | | 4.25%, 09/15/2026 | | | 249,246 | | |
| | | | | Wintrust Financial Corp. | | | | | |
| | 15,505 | | | 6.88%, 07/15/2025 | | | 400,804 | | |
| | | | 1,694,319 | | |
Capital Markets - 0.9% | | | |
| | | | | Arbor Realty Trust, Inc. | | | | | |
| | 10,000 | | | 6.25%, 08/11/2026 | | | 205,000 | | |
| | | | | Atlantic Union Bankshares Corp. | | | | | |
| | 18,250 | | | 6.88%, 09/01/2025 | | | 462,638 | | |
| | | | | WesBanco, Inc. | | | | | |
| | 17,560 | | | 6.75%, 11/15/2025 | | | 459,896 | | |
| | | | 1,127,534 | | |
Equity REITs - 0.3% | | | |
| | | | | Gladstone Commercial Corp. | | | | | |
| | 15,915 | | | 6.63%, 10/31/2024 | | | 400,899 | | |
Insurance - 0.5% | | | |
| | | | | The Allstate Corp. | | | | | |
| | 25,050 | | | 5.10%, 10/15/2024 | | | 554,357 | | |
| | | | | TOTAL PREFERRED STOCKS
(Cost $3,890,581) | | $ | 3,777,109 | | |
| | | | | TOTAL INVESTMENTS - 96.3%
(Cost $111,509,601) | | $ | 115,628,369 | | |
| | | | | Other Assets in Excess of
Liabilities - 3.7% | | | 4,422,702 | | |
| | | | | TOTAL NET ASSETS - 100.0% | | $ | 120,051,071 | | |
Percentages are stated as a percent of net assets.
The geographic location of all investments is United States unless otherwise indicated.
REIT - Real Estate Investment Trust
The Global Industry Classification Standard (GICS®) was developed by and/or is the exclusive property of MSCI, Inc. and Standard & Poor's Financial Services LLP ("S&P"). GICS is a service mark of MSCI and S&P and has been licensed for use by U.S. Bank Global Fund Services, LLC.
The accompanying notes are an integral part of these financial statements.
DIREXION ANNUAL REPORT
12
Statement of Assets and Liabilities
August 31, 2022
| | | Hilton Tactical
Income Fund | |
Assets: | |
Investments, at fair value (Note 2) | | $ | 115,628,369 | | |
Cash | | | 4,020,079 | | |
Receivable for Fund shares sold | | | 108,554 | | |
Dividends, interest and reclaims receivable | | | 495,816 | | |
Prepaid expenses and other assets | | | 28,967 | | |
Total Assets | | | 120,281,785 | | |
Liabilities: | |
Payable for Fund shares redeemed | | | 20,496 | | |
Due to Adviser, net (Note 4) | | | 80,554 | | |
Accrued distribution expenses | | | 3,922 | | |
Accrued expenses and other liabilities | | | 125,742 | | |
Total Liabilities | | | 230,714 | | |
Net Assets | | $ | 120,051,071 | | |
Net Assets Consist of: | |
Capital stock | | $ | 116,758,104 | | |
Total distributable earnings | | | 3,292,967 | | |
Net Assets | | $ | 120,051,071 | | |
Cost of Investments | | $ | 111,509,601 | | |
Calculation of Net Asset Value Per Share: | |
Institutional Class Shares: | |
Net assets | | $ | 102,016,267 | | |
Shares outstanding (unlimited shares of beneficial interest authorized, par value) | | | 6,102,126 | | |
Net asset value, redemption price and offering price per share | | $ | 16.72 | | |
Investor Class Shares: | |
Net assets | | $ | 18,034,804 | | |
Shares outstanding (unlimited shares of beneficial interest authorized, par value) | | | 1,080,993 | | |
Net asset value, redemption price and offering price per share | | $ | 16.68 | | |
The accompanying notes are an integral part of these financial statements.
DIREXION ANNUAL REPORT
13
Statement of Operations
For the Year Ended August 31, 2022
| | | Hilton Tactical
Income Fund | |
Investment Income: | |
Dividend income (net of withholding tax of $2,747) | | $ | 1,666,556 | | |
Interest income | | | 824,048 | | |
Total investment income | | | 2,490,604 | | |
Expenses: | |
Investment advisory fees (Note 4) | | | 964,291 | | |
Accounting fees | | | 129,902 | | |
Professional fees | | | 64,631 | | |
Distribution expenses – Investor Class (Note 4) | | | 48,465 | | |
Trustees' fees | | | 38,387 | | |
State registration fees | | | 35,975 | | |
Management service fees (Note 4) | | | 30,131 | | |
Reports to shareholders | | | 23,520 | | |
Insurance fees | | | 16,219 | | |
Administration fees | | | 15,052 | | |
Other | | | 15,680 | | |
Total expenses | | | 1,382,253 | | |
Less: Reimbursement of expenses from Adviser (Note 4) | | | (271,847 | ) | |
Net expenses | | | 1,110,406 | | |
Net investment income | | | 1,380,198 | | |
Realized and unrealized gain on investments: | |
Net realized gain on: | |
Investments | | | 2,424,798 | | |
| | | 2,424,798 | | |
Capital gain distributions from regulated investment companies | | | 9,049 | | |
Change in net unrealized depreciation on: | |
Investments | | | (13,005,199 | ) | |
| | | (13,005,199 | ) | |
Net realized and unrealized loss | | | (10,571,352 | ) | |
Net decrease in net assets resulting from operations | | $ | (9,191,154 | ) | |
The accompanying notes are an integral part of these financial statements.
DIREXION ANNUAL REPORT
14
Statement of Changes in Net Assets
| | | Hilton Tactical Income Fund | |
| | | Year Ended
August 31, 2022 | | Year Ended
August 31, 2021 | |
Increase (decrease) in net assets from: | |
Operations: | |
Net investment income | | $ | 1,380,198 | | | $ | 1,525,040 | | |
Net realized gain | | | 2,424,798 | | | | 9,536,028 | | |
Capital gain distributions from regulated investment companies | | | 9,049 | | | | — | | |
Change in net unrealized appreciation (depreciation) | | | (13,005,199 | ) | | | 6,298,535 | | |
Net increase (decrease) in net assets resulting from operations | | | (9,191,154 | ) | | | 17,359,603 | | |
Distributions to shareholders: | |
Net distributions to shareholders | |
Institutional Class Shares | | | (2,849,161 | ) | | | (1,456,461 | ) | |
Investor Class Shares | | | (495,261 | ) | | | (237,299 | ) | |
Return of capital | |
Institutional Class Shares | | | — | | | | (1,231,086 | ) | |
Investor Class Shares | | | — | | | | (200,579 | ) | |
Total distributions to shareholders | | | (3,344,422 | ) | | | (3,125,425 | ) | |
Capital share transactions: | |
Total increase (decrease) in net assets from net change in capital share transactions(a) | | | 8,382,811 | | | | 8,831,480 | | |
Total increase (decrease) in net assets | | | (4,152,765 | ) | | | 23,065,658 | | |
Net assets: | |
Beginning of year | | | 124,203,836 | | | | 101,138,178 | | |
End of year | | $ | 120,051,071 | | | $ | 124,203,836 | | |
(a) Summary of capital share transactions is as follows:
| | | Hilton Tactical Income Fund | |
| | | Year Ended
August 31, 2022 | | Year Ended
August 31, 2021 | |
| | | Shares | | Value | | Shares | | Value | |
Shares sold | |
Institutional Class Shares | | | 1,512,836 | | | $ | 26,524,832 | | | | 1,694,155 | | | $ | 28,940,947 | | |
Investor Class Shares | | | 200,535 | | | | 3,562,210 | | | | 366,002 | | | | 6,213,185 | | |
Shares issued in reinvestment of distributions | |
Institutional Class Shares | | | 154,317 | | | | 2,733,343 | | | | 148,776 | | | | 2,522,136 | | |
Investor Class Shares | | | 25,621 | | | | 453,465 | | | | 24,081 | | | | 409,222 | | |
Shares redeemed | |
Institutional Class Shares | | | (1,185,145 | ) | | | (20,739,964 | ) | | | (1,625,330 | ) | | | (27,302,200 | ) | |
Investor Class Shares | | | (236,106 | ) | | | (4,151,075 | ) | | | (114,561 | ) | | | (1,951,810 | ) | |
Net increase | | | 472,058 | | | $ | 8,382,811 | | | | 493,123 | | | $ | 8,831,480 | | |
The accompanying notes are an integral part of these financial statements.
DIREXION ANNUAL REPORT
15
Financial Highlights
August 31, 2022
| | | | | RATIOS TO AVERAGE NET ASSETS3 | | | |
| | | Net Asset
Value,
Beginning
of Year/
Period | | Net
Investment
Income1 | | Net Realized
and Unrealized
Gain (Loss)
on Investments | | Net Increase
(Decrease) in
Net Asset
Value Resulting
from Operations | | Dividends
from Net
Investment
Income | | Distributions
from
Realized
Capital Gains | | Return of
Capital
Distribution | | Total
Distributions | | Redemption
Fees Paid to
Fund | | Net
Asset
Value,
End of
Year/
Period | | Total
Return2 | | Net
Assets,
End of
Year/
Period
(,000) | | Total
Expenses | | Net
Expenses4 | | Net Investment
Income
after Expense
Reimbursement | | Portfolio
Turnover
Rate5 | |
Hilton Tactical Income Fund | |
Institutional Class Shares | |
Year ended August 31, 2022 | | $ | 18.51 | | | $ | 0.21 | | | $ | (1.51 | ) | | $ | (1.30 | ) | | $ | (0.49 | ) | | $ | — | | | $ | — | | | $ | (0.49 | ) | | $ | —6 | | | $ | 16.72 | | | | -7.13 | % | | $ | 102,016 | | | | 1.09 | % | | | 0.87 | % | | | 1.17 | % | | | 103 | % | |
Year ended August 31, 2021 | | | 16.27 | | | | 0.25 | | | | 2.49 | | | | 2.74 | | | | (0.27 | ) | | | — | | | | (0.23 | ) | | | (0.50 | ) | | | —6 | | | | 18.51 | | | | 17.19 | % | | | 104,044 | | | | 1.10 | % | | | 0.87 | % | | | 1.45 | % | | | 112 | % | |
Year ended August 31, 2020 | | | 17.41 | | | | 0.40 | | | | (0.97 | ) | | | (0.57 | ) | | | (0.27 | ) | | | — | | | | (0.30 | ) | | | (0.57 | ) | | | —6 | | | | 16.27 | | | | -3.26 | % | | | 87,894 | | | | 1.18 | % | | | 0.93 | % | | | 2.40 | % | | | 101 | % | |
Year ended August 31, 2019 | | | 16.95 | | | | 0.46 | | | | 0.66 | | | | 1.12 | | | | (0.47 | ) | | | (0.19 | ) | | | — | | | | (0.66 | ) | | | —6 | | | | 17.41 | | | | 6.92 | % | | | 126,052 | | | | 1.26 | % | | | 0.98 | % | | | 2.74 | % | | | 63 | % | |
Year ended August 31, 2018 | | | 16.22 | | | | 0.44 | | | | 0.79 | | | | 1.23 | | | | (0.50 | ) | | | — | | | | — | | | | (0.50 | ) | | | —6 | | | | 16.95 | | | | 7.73 | % | | | 99,807 | | | | 1.26 | % | | | 1.00 | % | | | 2.65 | % | | | 64 | % | |
Investor Class Shares | |
Year ended August 31, 2022 | | | 18.48 | | | | 0.16 | | | | (1.51 | ) | | | (1.35 | ) | | | (0.45 | ) | | | — | | | | — | | | | (0.45 | ) | | | —6 | | | | 16.68 | | | | -7.41 | % | | | 18,035 | | | | 1.34 | % | | | 1.12 | % | | | 0.92 | % | | | 103 | % | |
Year ended August 31, 2021 | | | 16.24 | | | | 0.20 | | | | 2.50 | | | | 2.70 | | | | (0.25 | ) | | | — | | | | (0.21 | ) | | | (0.46 | ) | | | —6 | | | | 18.48 | | | | 16.94 | % | | | 20,160 | | | | 1.34 | % | | | 1.12 | % | | | 1.18 | % | | | 112 | % | |
Year ended August 31, 2020 | | | 17.38 | | | | 0.34 | | | | (0.95 | ) | | | (0.61 | ) | | | (0.25 | ) | | | — | | | | (0.28 | ) | | | (0.53 | ) | | | —6 | | | | 16.24 | | | | -3.49 | % | | | 13,244 | | | | 1.42 | % | | | 1.18 | % | | | 2.06 | % | | | 101 | % | |
Year ended August 31, 2019 | | | 16.93 | | | | 0.41 | | | | 0.66 | | | | 1.07 | | | | (0.43 | ) | | | (0.19 | ) | | | — | | | | (0.62 | ) | | | — | | | | 17.38 | | | | 6.61 | % | | | 16,439 | | | | 1.51 | % | | | 1.23 | % | | | 2.44 | % | | | 63 | % | |
June 30, 20187 to August 31, 2018 | | | 16.51 | | | | 0.05 | | | | 0.41 | | | | 0.46 | | | | (0.04 | ) | | | — | | | | — | | | | (0.04 | ) | | | — | | | | 16.93 | | | | 2.78 | % | | | 8,300 | | | | 1.58 | % | | | 1.23 | % | | | 1.84 | % | | | 64 | % | |
September 1, 2017 to June 29, 20187,8 | | | 16.20 | | | | 0.35 | | | | 0.39 | | | | 0.74 | | | | (0.43 | ) | | | — | | | | — | | | | (0.43 | ) | | | — | | | | 16.51 | | | | 4.57 | % | | | 5,415 | | | | 1.49 | % | | | 1.26 | % | | | 2.53 | % | | | 64 | % | |
1 Net investment income per share represents net investment income divided by the daily average shares of beneficial interest outstanding throughout each year/period.
2 All returns reflect reinvested dividends, if any, but do not reflect the impact of taxes. Total return for a period of less than one year is not annualized.
3 For periods of less than one year, these ratios are annualized.
4 Net expenses include effects of any reimbursement.
5 Portfolio turnover rate is not annualized and is calculated without regard to short-term securities having a maturity of less than one year.
6 Amount is less than $0.005.
7 Class A Shares were redesignated as Investor Class Shares on June 30, 2018.
8 For the period from June 1, 2015 to June 29, 2018, this share class was referred to as Class A Shares.
The accompanying notes are an integral part of these financial statements.
DIREXION ANNUAL REPORT
16
Direxion Funds
Notes to the Financial Statements
August 31, 2022
1. ORGANIZATION
Direxion Funds (the "Trust") was organized as a Massachusetts Business Trust on June 6, 1997, and is registered under the Investment Company Act of 1940, as amended (the "1940 Act"), as an open-end management investment company issuing its shares in series, each series representing a distinct portfolio with its own investment objective and policies. The Trust currently has 10 series, of which one is included in this report: the Hilton Tactical Income Fund (the "Fund"). The Fund is a diversified series of the Trust pursuant to the 1940 Act. On June 30, 2018, the Fund redesignated all of the Fund's outstanding Class A shares as Investor Class shares and converted all of the Fund's outstanding Class C shares to Investor Class shares. This conversion and redesignation were tax-free events for shareholders. As a result, after this conversion and redesignation, the Fund currently offers Investor Class and Institutional Class shares. Institutional Class shares are made available through investment advisers, banks, trust companies or authorized representatives without a sales charge.
The Fund primarily seeks income with a secondary investment objective of capital appreciation consistent with the preservation of capital. The Fund pursues its investment objective by utilizing an investment strategy that employs a disciplined approach to balancing fixed income investments with historically higher income producing equity securities, with a focus on minimizing absolute risk and volatility. The Subadviser attempts to mitigate portfolio risk and volatility by creating a diversified portfolio of income producing securities that also offer the potential for capital appreciation. These securities may include common and preferred stocks of any capitalization, master limited partnerships ("MLPs"), real estate investment trusts ("REITs"), and a variety of debt instruments of any maturity, including corporate bonds, exchange-traded notes, municipal bonds, and securities issued, backed or otherwise guaranteed by the U.S. Government or its agencies.
The Trust has evaluated the structure, objective and activities of the Fund and determined that it meets the characteristics of an investment company. As such, these financial statements have applied the guidance as set forth in the Accounting Standards Codifications ("ASC") 946, Financial Services Investment Companies.
2. SIGNIFICANT ACCOUNTING POLICIES
The following is a summary of significant accounting policies consistently followed by the Fund in the preparation of its financial statements. These policies are in conformity with U.S. generally accepted accounting principles ("GAAP").
a) Investment Valuation – The Net Asset Value ("NAV") of the Fund is determined daily, Monday through Friday, as of the close of regular trading on the New York Stock Exchange ("NYSE"), each day the NYSE is open for business. The value of all portfolio securities and other assets held by the Fund will be determined as of the time the Fund calculates its NAV, 4:00 p.m. Eastern Time ("Valuation Time"). Equity securities, including common stocks, preferred stocks, exchange-traded funds, closed-end funds, MLPs and REITs and over-the-counter securities are valued at their last sales price or, if not available, at the average of the last bid and ask prices. Securities primarily traded on the NASDAQ National Market are valued using the NASDAQ Official Closing Price. Investments in open-end mutual funds, including money market funds, are valued at their respective quoted NAV on the valuation date. Asset-backed securities, convertible bonds and corporate bonds are valued using the mean between the closing bid and ask price furnished by an independent pricing service. Securities for which reliable market quotations are not readily available, the Fund's pricing service does not provide a valuation for such securities, the Fund's pricing service provides valuation that in the judgment of the Adviser does not represent fair value, or the Fund or Adviser believes the market price is stale, are fair valued as determined by the Adviser under the supervision of the Board of Trustees. Additionally, the Adviser will monitor developments in the marketplace for significant events that may affect the value of those securities whose closing prices were established before the Valuation Time.
b) Investment Transactions – Investment transactions are recorded on trade date. The Fund determines the gain or loss realized from investment transactions by comparing the identified cost, which is the same basis used for federal income tax purposes, with the net sales proceeds.
DIREXION ANNUAL REPORT
17
c) Federal Income Taxes – The Fund intends to comply with the requirements of Subchapter M of the Internal Revenue Code of 1986, as amended, necessary to qualify as a regulated investment company and to make the requisite distributions of income and capital gains to its shareholders sufficient to relieve it from all or substantially all Federal income taxes and excise taxes. No provision for Federal income taxes has been made.
d) Income and Expenses – Dividend income is recorded on the ex-dividend date. Distributions received from the Fund's investments in investment companies and REITs are accounted for based on the tax character of the distribution and can be comprised of ordinary income, capital gains and return of capital, as applicable. Interest income, including amortization of premium and discount, and dividends received from money market funds, is recognized on an accrual basis. Discounts and premiums on securities purchased are amortized over the expected life of the respective securities. Expenses are computed based on the Fund's respective average daily net assets. Other than class specific expenses, income and expenses are allocated to each class of shares based upon relative net assets. For an additional discussion on expenses, refer to Note 4.
e) Foreign Currency – Certain assets, such as receivables for foreign dividends and foreign tax reclaims, denominated in foreign currencies are translated into U.S. Dollar amounts at the date of valuation. Foreign dividend income denominated in foreign currencies is translated into U.S. Dollar amounts on the respective dates of such transactions. Realized gains or losses on foreign currency exchange are presented on the Statement of Operations as realized gain or loss on foreign currency and arise from the difference between the amounts of foreign dividends recorded on the Fund's books, and the U.S. dollar equivalent of the amounts actually received. Net unrealized foreign currency exchange gains and losses are presented on the Statement of Operations as unrealized appreciation or deprecation on foreign receivables and arise from changes in the value of foreign tax reclaim receivables resulting from changes in the exchange rate.
f) Risks of Investing in Foreign Securities – Investment in foreign securities involve greater risk than investing in domestic securities. As a result, a Fund's returns and net asset values may be affected to a large degree by fluctuations in currency exchange rates, political, diplomatic or economic conditions and regulatory requirements in other countries. The laws and accounting, auditing, and financial reporting standards in foreign countries may require less disclosure than required in the U.S., and there may be less public information available about foreign companies. Investments in foreign emerging markets present a greater risk than investing in foreign issuers in general. The risk of political or social upheaval is greater in emerging markets. In addition, there may be risks of an economy's dependence on revenues from particular commodities, currency transfer restrictions, a limited number of buyers for such securities and delays and disruptions in securities settlement procedures.
g) Distributions to Shareholders – The Fund will make distributions of net investment income, if any, monthly. The Fund will also distribute net realized capital gains, if any, annually. Income and capital gain distributions are determined in accordance with income tax regulations, which may differ from GAAP. Distributions to shareholders are recorded on the ex-dividend date.
The tax character of distributions during the years ended August 31, 2022 and August 31, 2021, were as follows:
| | | Year Ended
August 31, 2022 | | Year Ended
August 31, 2021 | |
Distributions paid from: | |
Ordinary Income | | $ | 1,462,178 | | | $ | 1,693,760 | | |
Long-Term Capital Gains | | | 1,882,244 | | | | — | | |
Return of Capital | | | — | | | | 1,431,665 | | |
Total Distributions paid | | $ | 3,344,422 | | | $ | 3,125,425 | | |
The Fund is designating as long-term capital gain dividends, pursuant to Internal Revenue Code 852(b)(3), the amount necessary to reduce the earnings and profits of the Fund related to net capital gain to zero for the tax year ended August 31, 2022. To the extent necessary to fully distribute such capital gains, the Fund is also designating earnings and profits distributed to shareholders on the redemption of shares.
DIREXION ANNUAL REPORT
18
As of August 31, 2022, the components of accumulated earnings/losses of the Fund on a tax basis were as follows:
Tax cost of investments | | $ | 111,589,351 | | |
Gross unrealized appreciation | | | 7,767,488 | | |
Gross unrealized depreciation | | | (3,728,470 | ) | |
Net unrealized appreciation/(depreciation) | | $ | 4,039,018 | | |
Undistributed ordinary income | | | — | | |
Undistributed long-term capital gain | | | — | | |
Total distributable earnings | | | — | | |
Other accumulated gain/(loss) | | | (746,051 | ) | |
Total accumulated earnings/(losses) | | $ | 3,292,967 | | |
The difference between book cost of investments and tax cost of investments is attributable primarily to the tax deferral of losses on wash sales.
On the Statement of Assets and Liabilities, the following adjustments were made for permanent tax differences between accounting total distributable earnings and capital stock under GAAP and tax reporting:
Total
Distributable
Earnings/(Loss) | | Capital Stock | |
| $ | 101,439 | | | $ | (101,439 | ) | |
GAAP requires that certain components of net assets relating to permanent differences be reclassified between financial and tax reporting. These reclassifications have no effect on net assets or net asset value per share. For the year ended August 31, 2022, the permanent differences primarily relate to prior year return of capital distributions to shareholders.
In order to meet certain excise tax distribution requirements, the Fund is required to measure and distribute annually net capital gains realized during a twelve-month period ending October 31 and net investment income earned during a twelve month period ending December 31. In connection with this, the Fund is permitted for tax purposes to defer into its next fiscal year qualified late year losses. Qualified late year capital losses are any net capital losses incurred between November 1 and the end of its fiscal year, August 31, 2022. Qualified late year ordinary losses are generally losses incurred between January 1 and the end of its fiscal year, August 31, 2022. For the year ended August 31, 2022, the Fund deferred $746,051 of qualified late year losses.
Under the Regulated Investment Company Modernization Act of 2010, net capital losses recognized for tax years beginning after December 22, 2010 may be carried forward indefinitely, and their character is retained as short-term and/or long-term. As of August 31, 2022, the Fund had no short-term and long-term capital loss carryforwards on a tax basis. The Fund utilized $1,319,989 of prior year capital losses.
The Fund follows authoritative financial reporting rules regarding recognition and measurement of tax positions taken or expected to be taken on a tax return. The Fund has reviewed all open tax years and concluded that there is no effect to the Fund's financial positions or results of operations and no tax liability resulting from unrecognized tax benefits relating to uncertain income tax position taken or expected to be taken on a tax return. The Fund recognizes interest and penalties, if any, related to unrecognized tax benefits as income tax expense in the Statement of Operations. During this period, the Fund did not incur any interest or penalties. Open tax years are those years that are open for examination by the relevant income taxing authority. As of August 31, 2022, open Federal and state income tax years include the tax years ended August 31, 2019 through August 31, 2022. The Fund has no examination in progress. The Fund is also not aware of any tax positions for which it is reasonably possible that the total amounts of unrecognized tax expense will significantly change in the next twelve months.
h) Use of Estimates – The preparation of financial statements in conformity with GAAP requires management to make estimates and assumptions that affect the reported amounts of assets and liabilities and disclosure of contingent assets and liabilities at the date of the financial statements and the reported amounts of revenues and expenses during the reporting period. Actual results could differ from those estimates.
DIREXION ANNUAL REPORT
19
3. INVESTMENT TRANSACTIONS
During the year ended August 31, 2022, the aggregate purchases and sales of investments (excluding short-term investments) in the Fund were $131,468,510 and $113,398,630 respectively.
Of the aggregate purchases and sales of investments in the Fund during the year ended August 31, 2022, $72,113,273 were purchases of long-term U.S. Government securities and $21,467,323 were sales of long-term U.S. Government securities.
4. INVESTMENT ADVISORY FEE AND OTHER AGREEMENTS
Investment Advisory Agreement: The Fund has entered into an investment advisory agreement with the Adviser. The Adviser earns a fee, computed daily and payable monthly, applied to the Fund's average daily net assets at an annual rate of 0.79%.
In addition, the Adviser has entered into a sub-advisory agreement with Hilton, whereby the Subadviser will provide investment management and asset allocation advice to the Fund. The Adviser pays, out of the management fees it receives from the Fund, a fee for these sub-advisory services.
Management Services Agreement: The Fund has entered into a Management Services Agreement with the Adviser. Under the Management Services Agreement, the Fund pays the Adviser a management service fees of 0.026% on the first $10,000,000,000 of the Fund's daily net assets and 0.024% on assets in excess of $10,000,000,000.
Operating Expense Limitation Agreement: The Fund is responsible for its own operating expenses. Under the Operating Expense Limitation Agreement, the Adviser has contractually agreed to cap all or a portion of the expenses for each Share Class based on an annual rate of 1.12% for Investor Class Shares and 0.87% for Institutional Class Shares applied to the average daily net assets of each respective Share Class.
Any expense cap is subject to reimbursement by the Fund within the following three years only if overall expenses fall below the lesser of this percentage limitation and any percentage limitation in place at the time. This agreement may be terminated or revised at any time with the consent of the Board of Trustees.
The table below presents amounts that the Adviser recouped, waived and the amounts available for potential recoupments by the Adviser.
| | | | | Potential Recoupment
Amounts Expiring: | | Total Potential | |
Expenses
Recouped | | Expenses
Reimbursed | | August 31,
2023 | | August 31,
2024 | | August 31,
2025 | | Recoupment
Amount | |
| $ | — | | | $ | 271,847 | | | $ | 375,561 | | | $ | 244,114 | | | $ | 271,847 | | | $ | 891,522 | | |
The net amount payable arising from the Investment Advisory Agreement, Management Services Agreement and waiver of any expenses as of August 31, 2022 is presented on the Statement of Assets and Liabilities as Due to Adviser, net.
Distribution Expenses: Shares of the Fund are subject to an annual 12b-1 fee of up to 1.00% of the Fund's average daily net assets. The Investor Class shares of the Fund currently pays 0.25% of its average daily net assets. The Institutional Class shares of the Fund do not pay a 12b-1 fee. The Fund does not charge a shareholder service fee.
Foreside Fund Services, LLC (the "Distributor") serves as principal underwriter of the Fund and acts as the Fund's distributor in a continuous public offering of the Fund's shares. The Distributor is an affiliate of the Adviser.
5. VALUATION MEASUREMENTS
The Fund follows authoritative fair valuation accounting standards, which establish an authoritative definition of fair value and set out a hierarchy for measuring fair value. These standards require additional disclosures about the various inputs
DIREXION ANNUAL REPORT
20
and valuation techniques used to develop the measurements of fair value and a discussion of changes in valuation techniques and related inputs during the period. These inputs are summarized in the three broad levels listed below:
Level 1 – Quoted prices in active markets for identical securities
Level 2 – Evaluated price based on other significant observable inputs (including quoted prices for similar securities in active markets, quoted prices for identical or similar securities in inactive markets, interest rates, prepayment speeds, credit risk, etc.)
Level 3 – Significant unobservable inputs including the Fund's own assumptions about the assumptions in determining fair value of investments
To the extent that equity securities are actively traded and valuation adjustments are not applied, they are categorized in Level 1 of the fair value hierarchy. If the market for a particular security is not active, and the mean price is used, these securities are categorized in Level 2 of the fair value hierarchy. Asset-backed securities, convertible bonds and corporate bonds are generally categorized in Level 2 of the fair value hierarchy. Investments in other mutual funds are categorized as Level 1 in the hierarchy.
The inputs or methodology used for valuing securities are not an indication of the risk associated with investing in those financial instruments.
The following is a summary of the inputs used to value the Fund's securities as of August 31, 2022:
| | | Level 1 | | Level 2 | | Level 3 | | Total | |
U.S. Government Obligations | | $ | 52,171,347 | | | $ | — | | | $ | — | | | $ | 52,171,347 | | |
Common Stocks | | | 34,298,289 | | | | — | | | | — | | | | 34,298,289 | | |
Corporate Bonds | | | — | | | | 14,664,269 | | | | — | | | | 14,664,269 | | |
Investment Companies | | | 10,717,355 | | | | — | | | | — | | | | 10,717,355 | | |
Preferred Stocks | | | 3,777,109 | | | | — | | | | — | | | | 3,777,109 | | |
For further detail on each asset class, see Schedule of Investments.
The Fund follows authoritative accounting standards, which require additional disclosure regarding fair value measurements. Specifically, these standards require reporting entities to disclose a) the input and valuation techniques used to measure fair value for both recurring and nonrecurring fair value measurements, for Level 2 or Level 3 positions, b) transfers between all levels (including Level 1 and Level 2) on a gross basis (i.e. transfers out must be disclosed separately from transfers in) as well as the reasons(s) for the transfers, and c) purchases and sales on a gross basis in the Level 3 rollforward rather than as one net number. Additionally, reporting entities are required to disclose quantitative information about unobservable inputs used in the fair value measurements categorized within Level 3 of the fair value hierarchy.
6. MARKET DISRUPTION RISK
Geopolitical and other events, including public health crises and natural disasters, have recently led to increased market volatility and significant market losses. Significant market volatility and market downturns may limit the Fund's ability to sell securities and the Fund's sales may exacerbate the market volatility and downturn. Under such circumstances, the Fund may have difficulty achieving its investment objective. Alternatively, the Fund may incur higher costs in order to achieve its investment objective and may be forced to purchase and sell securities (including shares of ETFs) at market prices that do not represent their fair value (including in the case of an ETF, its net asset value) or at times that result in differences between the price the Fund receives for the security and the market closing price of the security.
The recent pandemic spread of the novel coronavirus known as COVID-19 has proven to be a market disrupting event. The impact of this virus, like other pandemics that may arise in the future, has negatively affected and may continue to negatively affect the economies of many nations, companies and the global securities and commodities markets, including by reducing liquidity in the markets. Adverse effects may be more pronounced for developing or emerging market countries that have less established health care systems. How long such events will last and whether they will continue or recur cannot be predicted.
DIREXION ANNUAL REPORT
21
7. SUBSEQUENT EVENTS
Management has performed an evaluation of subsequent events through the date of the financial statements were issued and has determined that no items require recognition or disclosure besides those noted below.
The Fund paid an income distribution to the Investor Class in the amount of $0.0376 per share, and to the Institutional Class in the amount of $0.0410 per share, with a record date of August 31, 2022 and ex-date and payable date of September 1, 2022.
The Fund paid an income distribution to the Investor Class in the amount of $0.0376 per share, and to the Institutional Class in the amount of $0.0410 per share, with a record date of September 30, 2022 and ex-date and payable date of October 3, 2022.
DIREXION ANNUAL REPORT
22
Direxion Funds
Report of Independent Registered Public Accounting Firm
To the Shareholders of Hilton Tactical Income Fund and the Board of Trustees of Direxion Funds
Opinion on the Financial Statements
We have audited the accompanying statement of assets and liabilities of Hilton Tactical Income Fund (the "Fund") (one of the funds constituting Direxion Funds (the "Trust")), including the schedule of investments, as of August 31, 2022, and the related statement of operations for the year then ended, the statements of changes in net assets for each of the two years in the period then ended, the financial highlights for each of the five years in the period then ended and the related notes (collectively referred to as the "financial statements"). In our opinion, the financial statements present fairly, in all material respects, the financial position of the Fund (one of the funds constituting Direxion Funds) at August 31, 2022, the results of its operations for the year then ended, the changes in its net assets for each of the two years in the period then ended and its financial highlights for each of the five years in the period then ended, in conformity with U.S. generally accepted accounting principles.
Basis for Opinion
These financial statements are the responsibility of the Trust's management. Our responsibility is to express an opinion on the Fund's financial statements based on our audits. We are a public accounting firm registered with the Public Company Accounting Oversight Board (United States) ("PCAOB") and are required to be independent with respect to the Fund in accordance with the U.S. federal securities laws and the applicable rules and regulations of the Securities and Exchange Commission and the PCAOB.
We conducted our audits in accordance with the standards of the PCAOB. Those standards require that we plan and perform the audit to obtain reasonable assurance about whether the financial statements are free of material misstatement, whether due to error or fraud. The Trust is not required to have, nor were we engaged to perform, an audit of the Trust's internal control over financial reporting. As part of our audits we are required to obtain an understanding of internal control over financial reporting but not for the purpose of expressing an opinion on the effectiveness of the Trust's internal control over financial reporting. Accordingly, we express no such opinion.
Our audits included performing procedures to assess the risks of material misstatement of the financial statements, whether due to error or fraud, and performing procedures that respond to those risks. Such procedures included examining, on a test basis, evidence regarding the amounts and disclosures in the financial statements. Our procedures included confirmation of securities owned as of August 31, 2022, by correspondence with the custodian. Our audits also included evaluating the accounting principles used and significant estimates made by management, as well as evaluating the overall presentation of the financial statements. We believe that our audits provide a reasonable basis for our opinion.
We have served as the auditor of one or more of the Direxion investment companies since 2001.
Minneapolis, Minnesota
October 26, 2022
DIREXION ANNUAL REPORT
23
Direxion Funds
Supplemental Information (Unaudited)
For the year ended August 31, 2022, certain dividends paid by the Funds may be subject to a maximum rate of 15%, as provided for by the Jobs and Growth Tax Relief Reconciliation Act of 2003. The amount of dividends declared from ordinary income designated as qualified income was 73.36% for the Fund.
For corporate shareholders, the amount of ordinary income distributions qualifying for the corporate dividends received deduction for the year ended August 31, 2022 was 55.56% for the Fund.
The percentage of taxable ordinary income distributions that are designated as short-term capital gain distributions under Internal Revenue Section 871(k)(2)(C) was 0.00% for the Fund.
Results of Shareholder Meeting
A Special Meeting of Shareholders of the Direxion Funds Trust took place on March 11, 2022 for the purpose of electing Trustees to the Board of Trustees (the "Proposal"). All Trust shareholders of record, in the aggregate across all series of the Trust, were entitled to attend or submit proxies. As of the record date, December 3, 2021, the Trust had 25,555,289 shares outstanding. The results of the voting for the proposal were as follows:
Proposal: To approve the election of the Trustees to the Board of Trustees of the Trust to serve until his or her successor is elected and qualified.
| | For Votes | | Votes Withheld | |
David L. Driscoll | | | 10,618,753 | | | | 1,022,274 | | |
Jacob C. Gaffey | | | 10,619,736 | | | | 1,021,291 | | |
Henry W. Mulholland | | | 10,659,144 | | | | 981,883 | | |
Kathleen M. Berkery | | | 10,556,293 | | | | 1,084,734 | | |
Carlyle Peake | | | 10,657,444 | | | | 983,583 | | |
Mary Jo Collins | | | 10,555,908 | | | | 1,085,119 | | |
Angela Brickl | | | 10,558,967 | | | | 1,082,060 | | |
Daniel D. O'Neill | | | 10,616,233 | | | | 1,024,794 | | |
Accordingly, effective March 11, 2022, the Board of Trustees of the Direxion Funds Trust consists of the following individuals, each of whom have been elected by shareholders:
David L. Driscoll, Independent Trustee
Jacob C. Gaffey, Independent Trustee
Henry W. Mulholland, Independent Trustee
Kathleen M. Berkery, Independent Trustee
Carlyle Peake, Independent Trustee
Mary Jo Collins, Independent Trustee
Angela Brickl, Interested Trustee
Daniel D. O'Neill, Interested Trustee
DIREXION ANNUAL REPORT
24
Direxion Funds
Supplemental Information (Unaudited)
Effective September 30, 2022, the following table under "Interested Trustees" in each SAI is replaced in its entirety as indicated below.
Name, Address and
Age | | Position(s)
Held with
Fund | | Term of Office
and Length of
Time Served | | Principal Occupation(s)
During Past Five Years | | # of Portfolios
in Direxion
Family of
Investment
Companies
Overseen
by Trustee(3) | | Other Trusteeships/
Directorships Held by
Trustee During Past
Five Years | |
Daniel D. O'Neill(1)
Age: 54 | |
Chairman of the Board of Trustees | |
Lifetime of Trust until removal or resignation; Since 2008 | |
Chief Executive Officer, Rafferty Asset Management, LLC, from 2021 – September 2022; Managing Director, Rafferty Asset Management, LLC, January 1999 – January 2019. | | |
149 | | |
None. | |
Angela Brickl(2)
Age: 46 | |
Trustee | |
Lifetime of Trust until removal or resignation; Since 2022 | |
President, Rafferty Asset Management, LLC, from September 2022; Chief Operating Officer, Rafferty Asset Management, LLC, May 2021 – September 2022; General Counsel, Rafferty Asset Management LLC, since October 2010; Chief Compliance Officer, Rafferty Asset Management, LLC, since September 2012. | | |
149 | | |
None. | |
(1) Mr. O'Neill is affiliated with Rafferty because he serves as an officer of, and owns a beneficial interest in, Rafferty.
(2) Ms. Brickl is affiliated with Rafferty because she serves as an officer of Rafferty.
(3) The Direxion Family of Investment Companies consists of the Direxion Shares ETF Trust which, as of the date of this SAI, offers for sale to the public 94 of the 139 funds registered with the SEC and the Direxion Funds which, as of the date of this Supplement, offers for sale to the public 10 funds registered with the SEC.
DIREXION ANNUAL REPORT
25
Direxion Funds
Supplemental Information (Unaudited)
Effective September 30, 2022, the following table under "Principal Officers of the Trust" in each SAI is replaced in its entirety as indicated below.
Name, Address and
Age | | Position(s)
Held with
Fund | | Term of Office
and Length of
Time Served | | Principal Occupation(s)
During Past Five Years | | # of Portfolios
in the Direxion
Family of
Investment
Companies
Overseen
by Trustee(2) | | Other Trusteeships/
Directorships Held by
Trustee During Past
Five Years | |
Angela Brickl(1)
Age: 46 | |
President
Chief Compliance Officer | |
One Year; Since 2022
One Year; Since 2018 | |
President, Rafferty Asset Management, LLC, from September 2022; Chief Operating Officer, Rafferty Asset Management, LLC, May 2021 – September 2022; General Counsel, Rafferty Asset Management LLC, since October 2010; Chief Compliance Officer, Rafferty Asset Management, LLC, since September 2012. | |
N/A | |
N/A | |
Patrick J. Rudnick
Age: 49 | |
Principal Executive Officer | |
One Year; Since 2018 | |
Senior Vice President, Rafferty Asset Management, LLC, since March 2013. | |
N/A | |
N/A | |
Corey Noltner
Age: 33 | |
Principal Financial Officer | |
One Year; Since 2021 | |
Senior Business
Analyst, Rafferty Asset Management, LLC, since 2015. | |
N/A | |
N/A | |
Alyssa Sherman
Age: 33 | |
Secretary | |
One Year; Since 2022 | |
Associate General Counsel, Rafferty Asset Management, LLC, since April 2021; Associate, K&L Gates LLP, September 2015 – March 2021. | |
N/A | |
N/A | |
(1) Ms. Brickl serves on the Board of Trustees of the Direxion Funds and Direxion Shares ETF Trust.
(2) The Direxion Family of Investment Companies consists of the Direxion Shares ETF Trust which, as of the date of this SAI, offers for sale to the public 94 of the 139 funds registered with the SEC and the Direxion Funds which, as of the date of this Supplement, offers for sale to the public 10 funds registered with the SEC.
DIREXION ANNUAL REPORT
26
Direxion Funds
Supplemental Information (Unaudited)
Householding
In an effort to decrease costs, the Funds intend to reduce the number of duplicate prospectuses, Annual and Semi-Annual Reports, proxy statements and other similar documents you receive by sending only one copy of each to those addresses shared by two or more accounts and to shareholders we reasonably believe are from the same family or household. Householding begins once you have signed your account application. After such time, if you would like to discontinue householding for your accounts, please call toll-free at (800) 851-0511 to request individual copies of these documents. Once the Funds receive notice to stop householding, we will begin sending individual copies thirty days after receiving your request. This policy does not apply to account statements.
DIREXION ANNUAL REPORT
27
Direxion Funds
Investment Advisory and Subadvisory Agreement Approvals (Unaudited)
Consistent with the Investment Company Act of 1940, as amended (the "1940 Act"), the Board of Trustees (the "Board") of the Direxion Funds (the "Trust") annually considers the renewal of the Amended & Restated Investment Advisory Agreement (the "Advisory Agreement") between Rafferty Asset Management, LLC (the "Adviser") and the Trust and the Subadvisory Agreement (the "Subadvisory Agreement" and collectively with the Advisory Agreement, the "Agreements") between the Adviser and Hilton Capital Management, LLC (the "Subadviser") on behalf of the Hilton Tactical Income Fund (the "Fund"), a series of the Trust.
At a meeting held on August 18, 2022, the Board, including the trustees who are not "interested persons" of the Trust, as defined in the 1940 Act (the "Independent Trustees"), unanimously approved the renewal of the Advisory Agreement between the Trust and the Adviser and the Subadvisory Agreement between the Adviser and Subadviser, on behalf of the Fund. The Independent Trustees had previously considered information pertaining to the renewal of the Agreements outside the presence of representatives of the Adviser and Subadviser and Fund management in executive sessions held on August 4, 2022 and August 18, 2022.
In considering whether to renew the Agreements, the Board requested, and the Adviser and Subadviser provided, information that the Board, Adviser, and Subadviser reasonably believed to be necessary to evaluate the Agreements. Among other information, the Board obtained and reviewed the following:
• Detailed information regarding the advisory services provided by the Adviser and Subadviser to the Fund;
• The Adviser's and Subadviser's Form ADV;
• Information about the professional qualifications of those employees primarily responsible for providing investment advisory services to the Fund;
• Information regarding each component of the contractual fee rates for the prior fiscal year, including the contractual fee limitation provided by the Operating Expense Limitation Agreement;
• Information regarding advisory fees earned by the Adviser and Subadviser and waivers/reimbursements made by the Adviser in connection with providing services to the Fund;
• Information regarding fees paid to the Adviser under, and an evaluation of, the Management Services Agreement;
• Performance information;
• Comparative industry fee and performance data, including a peer group comparison and an assessment by an independent consultant of the appropriateness of such peer group and of the consistency of the methodology applied by the Adviser to identify the Fund's peer group;
• Information regarding the financial condition and profitability of both the Adviser and Subadviser; and
• Information regarding how the Adviser monitors the Fund's compliance with regulatory requirements and Trust procedures.
The Board considered that it had also received information relevant to its consideration since the Fund's inception and, most recently, throughout the past year at regular Board meetings in connection with its oversight of the Fund, including information bearing on the Fund's service provider arrangements, as arranged and overseen by the Adviser, and performance results. The Board received a memorandum from counsel regarding the responsibilities of the Board with respect to the approval of the Agreements and participated in a question and answer session with representatives of the Adviser. The Board also reflected on the Subadviser's annual presentation to the Board, at which the Trustees met with various members of the Subadviser's portfolio management team. The Board carefully evaluated the relevant information and the Independent Trustees were advised by legal counsel with respect to its deliberations.
The Board did not identify any particular information that was most relevant to its considerations in approving the Agreements and each Trustee may have afforded different weight to the various factors. The Board considered, among others, the following factors to the extent applicable: (1) the nature, extent, and quality of the services provided; (2) the investment performance of the Fund; (3) the profitability of the advisory business to the Adviser, and the profitability of the advisory business to the Subadviser; (4) the extent to which economies of scale might be realized as the Fund grows and whether fee levels reflect these economies of scale, if any, for the benefit of Fund shareholders; (5) comparisons of services and fees with contracts entered into by the Adviser and by the Subadviser, with other clients (such as other institutional
DIREXION ANNUAL REPORT
28
Direxion Funds
Investment Advisory and Subadvisory Agreement Approvals (Unaudited)
investors), if any; and (6) other benefits derived or anticipated to be derived and identified by the Adviser or Subadviser from its relationship with the Fund.
Nature, Extent and Quality of Services Provided. The Board reviewed, among other things, the Adviser's and the Subadviser's business, assets under management, financial resources and capitalization, quality and quantity of personnel, experience, the complexity of the Fund's investment strategy, relevant brokerage practices, and the adequacy of their compliance systems and processes. The Board reviewed the scope of services to be provided by the Adviser and Subadviser under the Agreements and noted that there would be no significant differences between the scope of services provided by the Adviser and the Subadviser in the past year and those to be provided in the upcoming year. The Board also considered the Adviser's and Subadviser's representations that they would continue to provide investment and related services that are of materially the same quality as the services that have been provided to the Fund in the past, and whether those services remain appropriate in scope and extent in light of the Fund's operations, the competitive landscape of the investment company business and investor needs.
The Board reviewed the quality of the Adviser's and Subadviser's personnel and operations and the systems and processes required to manage the Fund effectively, and noted that these systems and processes have been enhanced over time. In particular, the Board considered: (1) the Adviser's and Subadviser's success in achieving the Fund's investment objective; (2) the size and experience of the Adviser's and Subadviser's portfolio management staff; and (3) the portfolio management staff's credentials and expertise specific to the Fund's investment objective and strategies, and (4) the Subadviser's ability to recruit, train and retain personnel with the relevant experience to manage the Fund.
In considering the nature, extent and quality of the services to be provided under the Subadvisory Agreement by the Subadviser, the Board noted that such services include, but are not limited to, the following: (1) investing the Fund's assets consistent with the Fund's investment objective and policies; (2) determining the portfolio securities to be purchased, sold or otherwise disposed of and the timing of such transactions; (3) maintaining the required books and records for transactions affected by Subadviser on behalf of the Fund; and (4) selecting broker-dealers to execute orders on behalf of the Fund. The Board also considered the Subadviser's affiliation with the Adviser.
The Board considered that the Adviser oversees the operation of the Fund, including oversight of the Subadviser and the Fund's other service providers, and provides compliance services to the Fund. With regard to compliance services in particular, the Board noted that it annually reviews each of the Adviser's and Subadviser's compliance programs as it pertains to the Fund. In addition, the Board noted that the Adviser conducts compliance reviews of the Fund's holdings, service providers and other operations.
Comparison of Advisory Services and Fees. The Board considered the fairness and reasonableness of the investment advisory fee rate payable to the Adviser by the Fund and the subadvisory fee rate payable to the Subadviser by the Adviser in light of the investment advisory services provided by both the Adviser and the Subadviser. The Board reviewed information prepared by the Adviser, using data provided by Morningstar, Inc. to compare the Fund's gross and net advisory fees, expense cap, and gross and net total expenses with those of other funds with common key characteristics, such as asset size or investment objective ("Peer Group"). The Board noted that an independent consultant had reviewed the Adviser's peer selection methodology and resulting peers and determined that it was reasonable and well within industry standards. The Board considered that the Adviser had agreed to limit the total expenses of the Fund (subject to certain exclusions) for the next fiscal year by contractually agreeing to pay certain expenses of the Fund under an Operating Expense Limitation Agreement.
Performance of the Fund. The Board considered the performance information for the Fund and compared it to the returns of funds included in the Peer Group, focusing on the year-to-date and one-year performance of the Fund and of the Peer Group. The Board considered performance reports received in anticipation of the meeting, as well as performance reports provided at regular Board meetings throughout the year. The Board evaluated the performance of the Fund relative to: (1) returns of its benchmark index for the year-to-date, one-year, three-year and five-year periods ended May 31, 2022; and (2) returns of the Peer Group for the year-to-date, one-year, three-year and five-year periods ended May 31, 2022. The Board also evaluated the since inception performance information for the period ended June 30, 2022 as provided by the Subadviser. The Board noted that the same Peer Group was used to evaluate both performance and the advisory fees paid by the Fund.
DIREXION ANNUAL REPORT
29
Direxion Funds
Investment Advisory and Subadvisory Agreement Approvals (Unaudited)
Costs of Services Provided to the Fund and Profits Realized by the Adviser. The Board reviewed information about the profitability of the Adviser and Subadviser based on the fee rates payable under the Agreements. The Board considered information regarding the Adviser's and Subadviser's profit margin as reflected in profitability analyses, as well as information provided by the Adviser concerning the methodology used to allocate various expenses. The Board also considered the significant drivers of cost for the Adviser including, but not limited to, intellectual capital, regulatory compliance, and entrepreneurial risk. The Adviser also provided the Board a report on other investment advisers' profitability, which was compiled using publicly available information. However, the Board recognized that it is difficult to evaluate the relative profitability of investment advisory firms, including the Adviser and Subadviser, because many such firms are closely held and do not make such information publicly available. To the extent such information is available, it is typically only available for publicly held investment advisers who are required to provide such information in various SEC filings. In addition, the Board recognized that such reported information is affected by numerous factors, including the nature of a reporting party's shareholder base, the structure of the particular advisor, the types of funds it manages, its business mix, assumptions regarding allocations and the reporting of operating profits and net income (rather than gross) net of distribution and marketing expenses.
Economies of Scale. The Board considered the absence of breakpoints in the Adviser's fee schedule and reviewed information regarding the extent to which economies of scale or other efficiencies may result from increases in the Fund's net assets. In light of the relatively small size of the Fund, the Board concluded that the Fund has not yet achieved sufficient asset levels to realize economies of scale. The Board noted that it will continue to monitor fees and expenses as the Fund grows in size and assess whether fee breakpoints may be warranted.
Other Benefits. The Board considered any indirect or "fall-out" benefits that the Adviser or its affiliates may derive from their relationship to the Fund. Such benefits include the Adviser's ability to leverage its investment management personnel or infrastructure to manage other accounts. In this regard, the Board noted that the Fund pays a management services fee to the Adviser. In addition, the Board considered that the Subadviser benefits from increased recognition in the marketplace due to the co-branded Fund.
Conclusion. Based on, but not limited to, the above considerations, the Board, including the Independent Trustees, determined that the Agreements for the Fund were fair and reasonable in light of the nature, extent and quality of the services to be performed, the fee rate to be paid, the Adviser's and Subadviser's expenses and such other matters as the Board considered relevant in the exercise of its business judgment. Accordingly, the Board concluded that the continuation of the Agreements were in the best interests of the shareholders of the Fund. On this basis, the Board unanimously voted in favor of the renewal of the Agreements.
DIREXION ANNUAL REPORT
30
Direxion Funds
Trustees and Officers (Unaudited)
The business affairs of the Fund are managed by or under the direction of the Board of Trustees. Information pertaining to the Trustees and Officers of the Fund is set below. The report includes additional information about the Fund's Trustees and Officers and is available without charge, upon request by calling 1-800-851-0511.
Interested Trustees
Name, Address and
Age | | Position(s)
Held with
Fund | | Term of Office
and Length of
Time Served | | Principal Occupation(s)
During Past Five Years | | # of Portfolios
in Direxion
Family of
Investment
Companies
Overseen
by Trustee(3) | | Other Trusteeships/
Directorships Held by
Trustee During Past
Five Years | |
Daniel D. O'Neill(1)
Age: 54 | |
Chairman of the Board of Trustees | |
Lifetime of Trust until removal or resignation;
Since 2014 | |
Chief Executive Officer, Rafferty Asset Management, LLC, since 2021; Managing Director, Rafferty Asset Management, LLC, January 1999 – January 2019. | | |
149 | | |
None. | |
Angela Brickl(2)
Age: 46 | |
Trustee
| |
Lifetime of the Trust until removal of resignation; Since 2022 | |
Chief Operating Officer, Rafferty Asset Management, LLC since May 2021; General Counsel, Rafferty Asset Management LLC, since October 2010; Chief Compliance Officer, Rafferty Asset Management, LLC, since September 2012. | | |
149 | | |
None. | |
Independent Trustees
Name, Address and
Age | | Position(s)
Held with
Fund | | Term of Office
and Length of
Time Served | | Principal Occupation(s)
During Past Five Years | | # of Portfolios
in Direxion
Family of
Investment
Companies
Overseen
by Trustee(3) | | Other Trusteeships/
Directorships Held by
Trustee During Past
Five Years | |
David L. Driscoll
Age: 53 | |
Trustee | |
Lifetime of Trust until removal or resignation; Since 2014 | |
Partner, King Associates, LLP, since 2004; Board Advisor, University Common Real Estate, since 2012; Principal, Grey Oaks LLP since 2003; Member, Kendrick LLC, since 2006. | | |
149 | | |
None. | |
(1) Mr. O'Neill is affiliated with Rafferty and Direxion. Mr. O'Neill owns a beneficial interest in Rafferty.
(2) Ms. Brickl is affiliated with Rafferty because she serves as an officer of Rafferty.
(3) The Direxion Family of Investment Companies consists of the Direxion Shares ETF Trust which, as of the date of this report, offers for sale to the public 88 of the 139 funds registered with the SEC, the Direxion Funds which, as of the date of this report, offers for sale to the public 10 funds registered with the SEC and the Direxion Insurance Trust which, as of the date of this report, does not have any funds registered with the SEC.
DIREXION ANNUAL REPORT
31
Direxion Funds
Trustees and Officers (Unaudited)
Name, Address and
Age | | Position(s)
Held with
Fund | | Term of Office
and Length of
Time Served | | Principal Occupation(s)
During Past Five Years | | # of Portfolios
in Direxion
Family of
Investment
Companies
Overseen
by Trustee(3) | | Other Trusteeships/
Directorships Held by
Trustee During Past
Five Years | |
Jacob C. Gaffey
Age: 74 | |
Trustee | |
Lifetime of Trust until removal or resignation; Since 2014 | |
Managing Director, Loomis & Co., 2012 – 2019. | | |
149 | | |
None. | |
Henry W. Mulholland
Age: 59 | |
Trustee | |
Lifetime of Trust until removal or resignation; Since 2017 | |
Managing Partner, Grove Hill Partners LLC, since 2016. | | |
149 | | |
None. | |
Kathleen M. Berkery
Age: 55 | |
Trustee | |
Lifetime of Trust until removal or resignation; Since 2019 | |
Chief Financial Officer, Student Sponsor Partners, since November 2021; Senior Manager – Trusts & Estates, Rynkar, Vail & Barrett, LLC, since 2018; Financial Advisor, Lee, Nolan & Koroghlian Life Planning Group, 2010 – 2017. | | |
149 | | |
None. | |
Carlyle Peake
Age: 50 | |
Trustee | |
Lifetime of Trust until removal or resignation; Since 2022 | |
Head of US & LATAM Debt Syndicate, BBVA Securities, Inc., since 2011. | | |
149 | | |
None. | |
Mary Jo Collins
Age: 66 | |
Trustee | |
Lifetime of Trust until removal or resignation; Since 2022 | |
Managing Director, Imperial Capital LLC, since 2020; Director, Royal Bank of Canada, 2014 – 2020. | | |
149 | | |
None. | |
(3) The Direxion Family of Investment Companies consists of the Direxion Shares ETF Trust which, as of the date of this report, offers for sale to the public 88 of the 139 funds registered with the SEC, the Direxion Funds which, as of the date of this report, offers for sale to the public 10 funds registered with the SEC and the Direxion Insurance Trust which, as of the date of this report, does not have any funds registered with the SEC.
DIREXION ANNUAL REPORT
32
Direxion Funds
Trustees and Officers (Unaudited)
The officers of the Trust conduct and supervise its daily business. Unless otherwise noted, an individual's business address is 1301 Avenue of the Americas, 28th Floor, New York, New York 10019. As of the date of this report, the officers of the Trust, their ages, their business address and their principal occupations during the past five years are as follows:
Principal Officers of the Trust
Name, Address and
Age | | Position(s)
Held with
Fund | | Term of Office
and Length of
Time Served | | Principal Occupation(s)
During Past Five Years | | # of Portfolios
in the Direxion
Family of
Investment
Companies
Overseen
by Trustee(3) | | Other Trusteeships/
Directorships Held by
Trustee During Past
Five Years | |
Daniel D. O'Neill(1)
Age: 54 | |
Chief Executive Officer | |
One Year;
Since 2021 | |
Chief Executive Officer, Rafferty Asset Management, LLC, since 2021; Managing Director, Rafferty Asset Management, LLC, January 1999 – January 2019. | |
N/A | |
N/A | |
Patrick J. Rudnick
Age: 49 | |
Principal Executive Officer | |
One Year;
Since 2018 | |
Senior Vice President, since March 2013, Rafferty Asset Management, LLC. | |
N/A | |
N/A | |
Angela Brickl(2)
Age: 46 | |
Chief Compliance Officer | |
One Year;
Since 2018 | |
Chief Operating Officer, Rafferty Asset Management, LLC, since May 2021; General Counsel, Rafferty
Asset Management LLC, since October 2010; Chief Compliance Officer, Rafferty Asset Management, LLC, since September 2012. | |
N/A | |
N/A | |
Corey Noltner
Age: 33 | |
Principal Financial Officer | |
One Year;
Since 2021 | |
Senior Business Analyst, Rafferty Asset Management, LLC, Since 2015. | |
N/A | |
N/A | |
Alyssa Sherman
Age: 33 | |
Secretary | |
One Year;
Since 2022 | |
Associate General Counsel, Rafferty Asset Management, LLC, since April 2021; Associate, K&L Gates LLP, September 2015 – March 2021. | |
N/A | |
N/A | |
(1) Mr. O'Neill serves as Chairman of the Board of Trustees of the Direxion Funds, Direxion Insurance Trust and Direxion Shares ETF Trust.
(2) Ms. Brickl serves on the Board of Trustees of the Direxion Funds, Direxion Insurance Trust and Direxion Shares ETF Trust.
(3) The Direxion Family of Investment Companies consists of the Direxion Shares ETF Trust which, as of the date of this report, offers for sale to the public 88 of the 139 funds registered with the SEC, the Direxion Funds which, as of the date of this report, offers for sale to the public 10 funds registered with the SEC and the Direxion Insurance Trust which, as of the date of this report, does not have any funds registered with the SEC.
DIREXION ANNUAL REPORT
33
THIS PAGE INTENTIONALLY LEFT BLANK
DIREXION ANNUAL REPORT
34
At the Direxion Funds, we are committed to protecting your privacy. To open and service your Direxion accounts, we collect and maintain certain nonpublic personal information about you, such as your address, phone number, social security number, purchases, sales, account balances, bank account information and other personal financial information. We collect this information from the following sources:
• Account applications or other forms on which you provide information,
• Mail, e-mail, the telephone and our website, and
• Your transactions and account inquiries with us.
We safeguard the personal information that you have entrusted to us in the following ways:
• As a general policy, only those employees who maintain your account and respond to your requests for additional services have access to your account information.
• We maintain physical, electronic, and procedural safeguards to insure the security of your personal information and to prevent unauthorized access to your information.
We do not disclose any nonpublic personal information about you or our former shareholders to anyone, except as permitted or required by law. In the course of conducting business and maintaining your account we may share shareholder information, as allowed by law, with our affiliated companies and with other service providers, including financial intermediaries, custodians, transfer agents and marketing consultants. Those companies are contractually bound to use that information only for the services for which we hired them. They are not permitted to use or share our shareholders' nonpublic personal information for any other purpose. There also may be times when we provide information to federal, state or local authorities as required by law.
In the event that you hold fund shares of Direxion through a financial intermediary, including, but not limited to, a broker-dealer, bank, or trust company, the privacy policy of your financial intermediary would govern how your nonpublic personal information would be shared with nonaffiliated third parties.
For questions about our policy, please contact us at (800) 851-0511.
This page is not a part of the Annual Report.
DIREXION ANNUAL REPORT
Investment Advisor
Rafferty Asset Management, LLC
1301 Avenue of the Americas
28th Floor
New York, NY 10019
Sub-Advisor
Hilton Capital Management, LLC
1010 Franklin Avenue
Garden City, NY 11530
Administrator, Transfer Agent, Dividend Paying
Agent & Shareholding Servicing Agent
U.S. Bancorp Fund Services, LLC
P.O. Box 1993
Milwaukee, WI 53201-1993
Custodian
U.S. Bank, N.A.
1555 RiverCenter Dr., Suite 302
Milwaukee, WI 53212
Independent Registered Public Accounting Firm
Ernst & Young LLP
700 Nicollet Mall, Suite 500
Minneapolis, MN 55402
Distributor
Foreside Fund Services, LLC
3 Canal Plaza, Suite 100
Portland, Maine 04101
The Trust's Proxy Voting Policies are available without charge by calling 1-800-850-0511, or by accessing the SEC's website at www.sec.gov.
The actual voting records relating to portfolio securities during the most recent period ended June 30 is available without charge by calling 1-800-850-0511, or by accessing the SEC's website at www.sec.gov.
The Trust files complete schedule of portfolio holdings with the SEC for its first and third fiscal quarters on Part F of Form N-PORT. The Fund's Part F of Form N-PORT (and Form N-Q prior to February 28, 2019) is available on the SEC's website at www.sec.gov.
This report has been prepared for shareholders and may be distributed to others only if preceded or accompanied by a current prospectus.

1301 Avenue of the Americas (6th Avenue), 28th Floor | New York, New York 10019 | (800) 851-0511
www.direxioninvestments.com
(b) Not applicable
Item 2. Code of Ethics.
The registrant has adopted a code of ethics that applies to the registrant’s principal executive officer and principal financial officer. The registrant has not made any amendments to its code of ethics during the period covered by this report. The registrant has not granted any waivers from any provisions of the code of ethics during the period covered by this report. A copy of the registrant’s Code of Ethics is filed herewith.
Item 3. Audit Committee Financial Expert.
The registrant’s board of trustees has determined that there is at least one audit committee financial expert serving on its audit committee. Gerald E. Shanley III is the “audit committee financial expert” and is considered to be “independent” as each term is defined in Item 3 of Form N-CSR.
Item 4. Principal Accountant Fees and Services.
The registrant has engaged its principal accountant to perform audit services, audit-related services, tax services and other services during the past two fiscal years. “Audit services” refer to performing an audit of the registrant's annual financial statements or services that are normally provided by the accountant in connection with statutory and regulatory filings or engagements for those fiscal years. “Audit-related services” refer to the assurance and related services by the principal accountant that are reasonably related to the performance of the audit. “Tax services” refer to professional services rendered by the principal accountant for tax compliance, tax advice, and tax planning. The following table details the aggregate fees billed or expected to be billed for each of the last two fiscal years for audit fees, audit-related fees, tax fees and other fees by the principal accountant.
| | | FYE 8/31/2022 | | | FYE 8/31/2021 | |
| (a) Audit Fees | | $ | 268,600 | | | $ | 309,665 | |
| (b) Audit-Related Fees | | $ | 0 | | | $ | 0 | |
| (c) Tax Fees | | $ | 79,560 | | | $ | 89,238 | |
| (d) All Other Fees | | $ | 0 | | | $ | 0 | |
(e)(1) The audit committee has adopted pre-approval policies and procedures that require the audit committee to pre-approve all audit and non-audit services of the registrant, including services provided to any entity affiliated with the registrant.
(e)(2) The percentages of fees billed by Ernst & Young LLP applicable to non-audit services pursuant to waiver of pre-approval requirement were as follows:
| | | FYE 8/31/2022 | | | FYE 8/31/2021 | |
| Audit-Related Fees | | | 0 | % | | | 0 | % |
| Tax Fees | | | 0 | % | | | 0 | % |
| All Other Fees | | | 0 | % | | | 0 | % |
(f) All of the principal accountant’s hours spent on auditing the registrant’s financial statements were attributed to work performed by full-time permanent employees of the principal accountant.
(g) The following table indicates the non-audit fees billed or expected to be billed by the registrant’s accountant for services to the registrant and to the registrant’s investment adviser (and any other controlling entity, etc.—not sub-adviser) for the last two years.
| Non-Audit Related Fees | | | FYE 8/31/2022 | | | | FYE 8/31/2021 | |
| Registrant | | | None | | | | None | |
| Registrant’s Investment Adviser | | | None | | | | None | |
(h) The audit committee of the board of trustees has considered whether the provision of non-audit services that were rendered to the registrant's investment adviser is compatible with maintaining the principal accountant's independence and has concluded that the provision of such non-audit services by the accountant has not compromised the accountant’s independence.
(i) Not applicable
(j) Not applicable
Item 5. Audit Committee of Listed Registrants.
Not applicable to registrants who are not listed issuers (as defined in Rule 10A-3 under the Securities Exchange Act of 1934).
Item 6. Schedule of Investments.
| (a) | Schedule of Investments is included as part of the report to shareholders filed under Item 1 of this Form. |
Item 7. Disclosure of Proxy Voting Policies and Procedures for Closed-End Management Investment Companies.
Not applicable to open-end investment companies.
Item 8. Portfolio Managers of Closed-End Management Investment Companies.
Not applicable to open-end investment companies.
Item 9. Purchases of Equity Securities by Closed-End Management Investment Company and Affiliated Purchasers.
Not applicable to open-end investment companies.
Item 10. Submission of Matters to a Vote of Security Holders.
There have been no material changes to the procedures by which shareholders may recommend nominees to the registrant’s board of directors/trustees.
Item 11. Controls and Procedures.
| (a) | The Registrant’s Principal Executive Officer and Principal Financial Officer have reviewed the Registrant's disclosure controls and procedures (as defined in Rule 30a-3(c) under the Investment Company Act of 1940 (the “Act”)) as of a date within 90 days of the filing of this report, as required by Rule 30a-3(b) under the Act and Rules 13a-15(b) or 15d-15(b) under the Securities Exchange Act of 1934. Based on their review, such officers have concluded that the disclosure controls and procedures are effective in ensuring that information required to be disclosed in this report is appropriately recorded, processed, summarized and reported and made known to them by others within the Registrant and by the Registrant’s service provider. |
| (b) | There were no changes in the Registrant's internal control over financial reporting (as defined in Rule 30a-3(d) under the Act) that occurred during the second fiscal half-year of the period covered by this report that has materially affected, or is reasonably likely to materially affect, the Registrant's internal control over financial reporting. |
Item 12. Disclosure of Securities Lending Activities for Closed-End Management Investment Companies
Not applicable to open-end investment companies.
Item 13. Exhibits.
(2) A separate certification for each principal executive officer and principal financial officer pursuant to Section 302 of the Sarbanes-Oxley Act of 2002. Filed herewith.
(3) Any written solicitation to purchase securities under Rule 23c-1 under the Act sent or given during the period covered by the report by or on behalf of the registrant to 10 or more persons. Not applicable to open-end investment companies.
(4) Change in the registrant’s independent public accountant. There was no change in the registrant’s independent public accountant for the period covered by this report.
SIGNATURES
Pursuant to the requirements of the Securities Exchange Act of 1934 and the Investment Company Act of 1940, the registrant has duly caused this report to be signed on its behalf by the undersigned, thereunto duly authorized.
| | (Registrant) | Direxion Funds |
| | By (Signature and Title) | /s/ Patrick J. Rudnick |
| | | Patrick J. Rudnick, Principal Executive Officer |
Pursuant to the requirements of the Securities Exchange Act of 1934 and the Investment Company Act of 1940, this report has been signed below by the following persons on behalf of the registrant and in the capacities and on the dates indicated.
| | By (Signature and Title) | /s/ Patrick J. Rudnick |
| | | Patrick J. Rudnick, Principal Executive Officer |
| | By (Signature and Title) | /s/ Corey Noltner |
| | | Corey Noltner, Principal Financial Officer |