UNITED STATES
SECURITIES AND EXCHANGE COMMISSION
Washington, D.C. 20549
FORM N-CSR
CERTIFIED SHAREHOLDER REPORT OF REGISTERED
MANAGEMENT INVESTMENT COMPANIES
Investment Company Act file number 811-08243
Direxion Funds
(Exact name of registrant as specified in charter)
1301 Avenue of the Americas (6th Ave.), 28th Floor
New York, NY 10019
(Address of principal executive offices) (Zip code)
Direxion Funds
1301 Avenue of the Americas (6th Ave.), 28th Floor
New York, NY 10019
(Name and address of agent for service)
1-800-851-0511
Registrant’s telephone number, including area code
Date of fiscal year end: August 31, 2024
Date of reporting period: August 31, 2024
Item 1. Reports to Stockholders.
| (a) | A copy of the reports transmitted to shareholders pursuant to Rule 30e-1 under the Investment Company Act of 1940, as amended (“Act”), is filed herewith. |
| | |
| Direxion Monthly High Yield Bull 1.2X Fund | |
| Investor | DXHYX |
| Annual Shareholder Report | August 31, 2024 |
This annual shareholder report contains important information about the Direxion Monthly High Yield Bull 1.2X Fund for the period of September 1, 2023, to August 31, 2024. You can find additional information about the Fund at https://connect.rightprospectus.com/Direxion. You can also request this information by contacting us at 866-476-7523.
WHAT WERE THE FUND COSTS FOR THE PAST YEAR? (based on a hypothetical $10,000 investment)
| | |
| Costs of a $10,000 investment | Costs paid as a percentage of a $10,000 investment |
| Direxion Monthly High Yield Bull 1.2X Fund | $142 | 1.35% |
HOW DID THE FUND PERFORM LAST YEAR AND WHAT AFFECTED ITS PERFORMANCE?
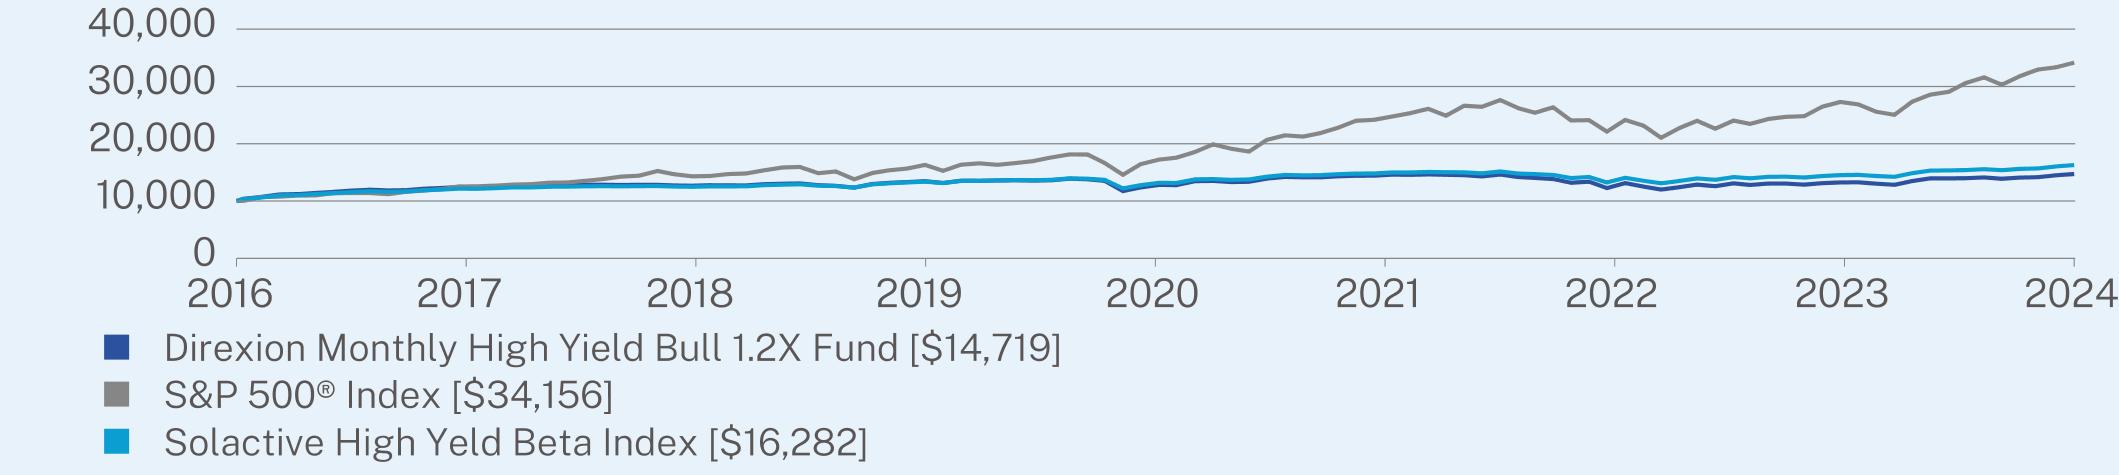
The Direxion Monthly High Yield Bull 1.2X Fund seeks to provide 120% of the calendar month return of the Solactive High Yield Beta Index. The Solactive High Yield Beta Index is a rules-based, systematic strategy index that provides exposure to an equal-weighted portfolio of three high-yield ETFs. The allocation to each U.S. High Yield Corporate Bond ETF is adjusted on a monthly basis. The index is calculated and distributed by Solactive AG and is calculated and published in U.S. Dollars. To determine if the Fund has met its monthly investment goals, the Advisor, Rafferty Asset Management, LLC, maintains models which indicate the expected performance of the Fund as compared to the underlying index. The models do not take into account the expense ratio or any transaction or trading fees associated with creating or maintaining the Fund’s portfolio. Deviation from the model may be due to a combination of asset fluctuation, expenses, transaction costs, including swap contract related costs and underlying volatility. For the Annual Period, the Solactive High Yield Beta Index returned 11.74%. For the same period, the Direxion Monthly High Yield Bull 1.2X Fund returned 10.90%, while the model indicated an expected return of 14.20%. Given the calendar month investment objective of the Fund and the path dependency of returns for longer periods, the return of the index alone should not generate expectations of performance of the Fund.
HOW DID THE FUND PERFORM FOR THE PAST 10 YEARS?*
The $10,000 chart reflects a hypothetical $10,000 investment in the Fund. The chart uses total return NAV performance and assumes reinvestment of dividends and capital gains. Fund expenses, including 12b-1 fees, management fees and other expenses were deducted.
CUMULATIVE PERFORMANCE (Initial Investment of $10,000)
| Direxion Monthly High Yield Bull 1.2X Fund | PAGE 1 | TSR-AR-254939127 |
ANNUAL AVERAGE TOTAL RETURN (%)
| | | |
| | 1 Year | 5 Year | Since Inception
(02/17/2016) |
Direxion Monthly High Yield Bull 1.2X Fund | 10.90 | 1.61 | 4.63 |
S&P 500® Index | 27.14 | 15.92 | 15.48 |
Solactive High Yeld Beta Index | 11.74 | 3.66 | 5.88 |
Visit https://connect.rightprospectus.com/Direxion for more recent performance information.
| * | The Fund’s past performance is not a good predictor of how the Fund will perform in the future. The graph and table do not reflect the deduction of taxes that a shareholder would pay on Fund distributions or redemption of Fund shares. |
KEY FUND STATISTICS (as of August 31, 2024)
| |
Net Assets | $59,327,502 |
Number of Holdings | 4 |
Net Advisory Fee | $338,703 |
Portfolio Turnover | 869% |
WHAT DID THE FUND INVEST IN? (as of August 31, 2024)
| |
Market Exposure | |
Investment Companies | 80.0% |
Total Return Swap Contracts | 40.0% |
Total (as % of net assets) | 120.0% |
| |
Constituents of Index | (%) |
iShares iBoxx $ High Yield Corporate Bond ETF | 33.4% |
PIMCO 0-5 Year High Yield Corporate Bond Index ETF | 33.3% |
SPDR Bloomberg High Yield Bond ETF | 33.3% |
For additional information about the Fund; including its prospectus, financial information, holdings and proxy information, scan the QR code or visit https://connect.rightprospectus.com/Direxion
The Fund is distributed by ALPS Distributors, Inc..
HOUSEHOLDING
To reduce Fund expenses, only one copy of most shareholder documents may be mailed to shareholders with multiple accounts at the same address (Householding). If you would prefer that your Rafferty Asset Management, LLC documents not be householded, please contact Rafferty Asset Management, LLC at 866-476-7523, or contact your financial intermediary. Your instructions will typically be effective within 30 days of receipt by Rafferty Asset Management, LLC or your financial intermediary.
| Direxion Monthly High Yield Bull 1.2X Fund | PAGE 2 | TSR-AR-254939127 |
118291278613017135921350214645125271327114719114001325115857163201990026102231712686634156115731251312853136011383115067135421457016282
| | |
| Direxion Monthly NASDAQ-100® Bull 1.25X Fund | |
| Investor | DXNLX |
| Annual Shareholder Report | August 31, 2024 |
This annual shareholder report contains important information about the Direxion Monthly NASDAQ-100® Bull 1.25X Fund for the period of September 1, 2023, to August 31, 2024. You can find additional information about the Fund at https://connect.rightprospectus.com/Direxion. You can also request this information by contacting us at 866-476-7523.
WHAT WERE THE FUND COSTS FOR THE PAST YEAR? (based on a hypothetical $10,000 investment)
| | |
| Costs of a $10,000 investment | Costs paid as a percentage of a $10,000 investment |
| Direxion Monthly NASDAQ-100® Bull 1.25X Fund | $132 | 1.15% |
HOW DID THE FUND PERFORM LAST YEAR AND WHAT AFFECTED ITS PERFORMANCE?
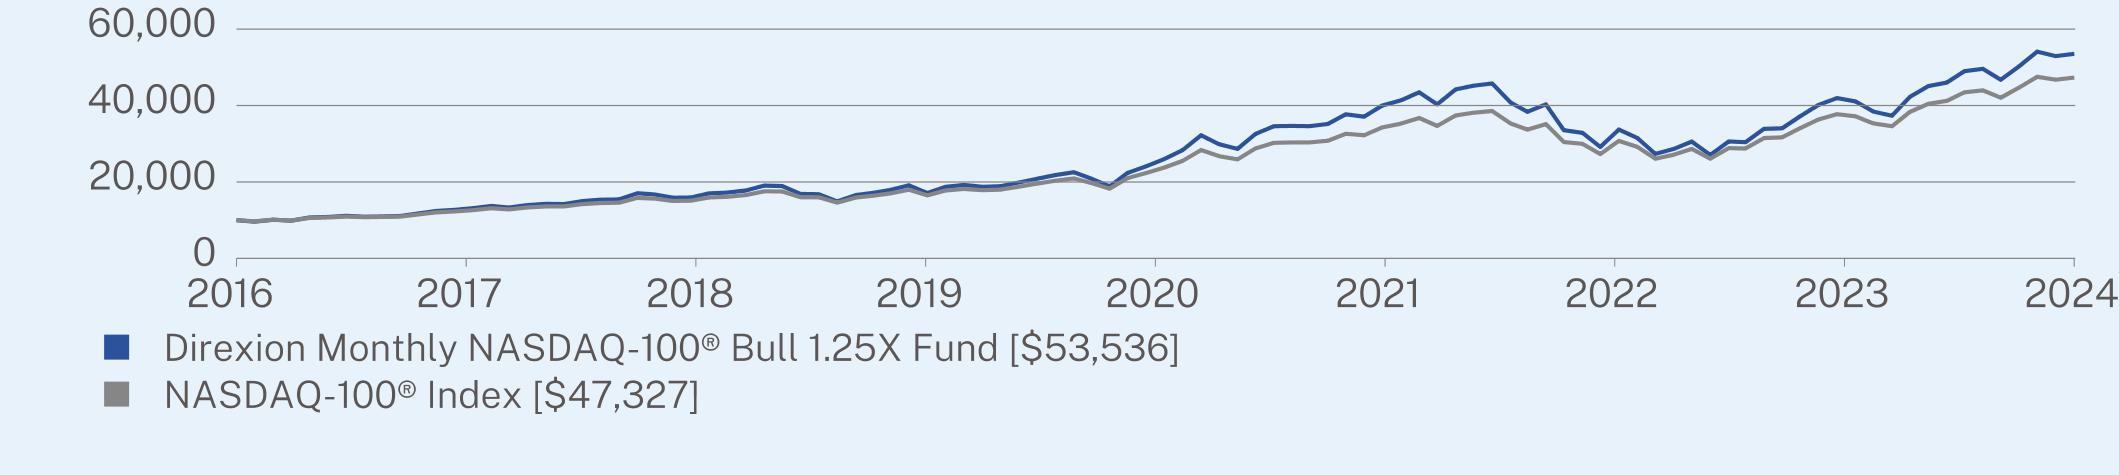
The Direxion Monthly NASDAQ-100® Bull 1.25X Fund seeks to provide 125% of the calendar month return of the NASDAQ-100® Index. The NASDAQ-100® Index includes 100 of the largest domestic and international non-financial companies listed on the NASDAQ Stock Market® based on market capitalization. All companies listed on the index have an average daily trading volume of at least 200,000 shares. To determine if the Fund has met its monthly investment goals, the Advisor, Rafferty Asset Management, LLC, maintains models which indicate the expected performance of the Fund as compared to the underlying index. The models do not take into account the expense ratio or any transaction or trading fees associated with creating or maintaining the Fund’s portfolio. Deviation from the model may be due to a combination of asset fluctuation, expenses, transaction costs, including swap contract related costs and underlying volatility. For the Annual Period, the NASDAQ-100® Index returned 27.30%. For the same period, the Direxion Monthly NASDAQ-100® Bull 1.25X Fund returned 30.30%, while the model indicated an expected return of 34.61%. Given the calendar month investment objective of the Fund and the path dependency of returns for longer periods, the return of the index alone should not generate expectations of performance of the Fund.
HOW DID THE FUND PERFORM FOR THE PAST 10 YEARS?*
The $10,000 chart reflects a hypothetical $10,000 investment in the Fund. The chart uses total return NAV performance and assumes reinvestment of dividends and capital gains. Fund expenses, including 12b-1 fees, management fees and other expenses were deducted.
CUMULATIVE PERFORMANCE (Initial Investment of $10,000)
| Direxion Monthly NASDAQ-100® Bull 1.25X Fund | PAGE 1 | TSR-AR-25460D101 |
ANNUAL AVERAGE TOTAL RETURN (%)
| | | |
| | 1 Year | 5 Year | Since Inception
(03/31/2016) |
Direxion Monthly NASDAQ-100® Bull 1.25X Fund | 30.30 | 23.38 | 22.05 |
NASDAQ-100® Index | 27.30 | 21.55 | 20.28 |
Visit https://connect.rightprospectus.com/Direxion for more recent performance information.
| * | The Fund’s past performance is not a good predictor of how the Fund will perform in the future. The graph and table do not reflect the deduction of taxes that a shareholder would pay on Fund distributions or redemption of Fund shares. |
KEY FUND STATISTICS (as of August 31, 2024)
| |
Net Assets | $12,831,117 |
Number of Holdings | 5 |
Net Advisory Fee | $75,452 |
Portfolio Turnover | 1,132% |
WHAT DID THE FUND INVEST IN? (as of August 31, 2024)
| |
Market Exposure | |
Total Return Swap Contracts | 82.1% |
Investment Companies | 42.9% |
Total (as % of net assets) | 125.0% |
| |
Index Composition | (%) |
Information Technology | 50.9% |
Communication Services | 15.5% |
Consumer Discretionary | 12.4% |
Health Care | 6.4% |
Consumer Staples | 6.3% |
Industrials | 4.5% |
Materials | 1.5% |
Utilities | 1.3% |
Financials | 0.5% |
Energy | 0.5% |
Real Estate | 0.2% |
| |
Top 10 Constituents of Index | (%) |
Apple, Inc. | 9.3% |
Microsoft Corp. | 8.1% |
NVIDIA Corp. | 7.7% |
Broadcom, Inc. | 5.0% |
Meta Platforms, Inc. Class A | 4.8% |
Amazon.com, Inc. | 4.7% |
Costco Wholesale Corp. | 2.7% |
Tesla, Inc. | 2.6% |
Alphabet Inc. Class A | 2.5% |
Alphabet Inc. Class C | 2.4% |
For additional information about the Fund; including its prospectus, financial information, holdings and proxy information, scan the QR code or visit https://connect.rightprospectus.com/Direxion
The Fund is distributed by ALPS Distributors, Inc..
HOUSEHOLDING
To reduce Fund expenses, only one copy of most shareholder documents may be mailed to shareholders with multiple accounts at the same address (Householding). If you would prefer that your Rafferty Asset Management, LLC documents not be householded, please contact Rafferty Asset Management, LLC at 866-476-7523, or contact your financial intermediary. Your instructions will typically be effective within 30 days of receipt by Rafferty Asset Management, LLC or your financial intermediary.
| Direxion Monthly NASDAQ-100® Bull 1.25X Fund | PAGE 2 | TSR-AR-25460D101 |
108331427419039187223221643468315154108553536107051359617557178372836136755291723717747327
| | |
| Direxion Monthly NASDAQ-100® Bull 1.75X Fund | |
| Investor | DXQLX |
| Annual Shareholder Report | August 31, 2024 |
This annual shareholder report contains important information about the Direxion Monthly NASDAQ-100® Bull 1.75X Fund for the period of September 1, 2023, to August 31, 2024. You can find additional information about the Fund at https://connect.rightprospectus.com/Direxion. You can also request this information by contacting us at 866-476-7523.
WHAT WERE THE FUND COSTS FOR THE PAST YEAR? (based on a hypothetical $10,000 investment)
| | |
| Costs of a $10,000 investment | Costs paid as a percentage of a $10,000 investment |
| Direxion Monthly NASDAQ-100® Bull 1.75X Fund | $162 | 1.35% |
HOW DID THE FUND PERFORM LAST YEAR AND WHAT AFFECTED ITS PERFORMANCE?
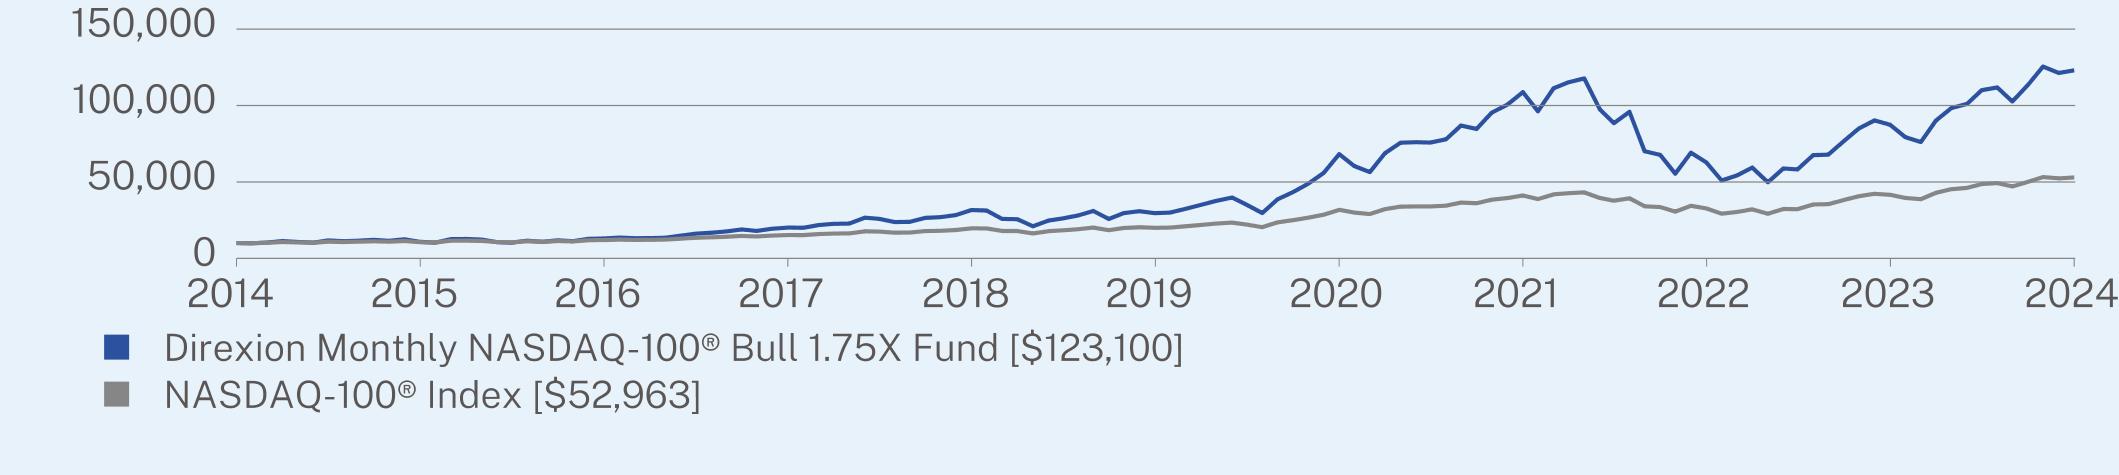
The Direxion Monthly NASDAQ-100® Bull 1.75X Fund seeks to provide 175% of the calendar month return of the NASDAQ-100® Index. The NASDAQ-100® Index includes 100 of the largest domestic and international non-financial companies listed on the NASDAQ Stock Market® based on market capitalization. All companies listed on the index have an average daily trading volume of at least 200,000 shares. To determine if the Fund has met its monthly investment goals, the Advisor, Rafferty Asset Management, LLC, maintains models which indicate the expected performance of the Fund as compared to the underlying index. The models do not take into account the expense ratio or any transaction or trading fees associated with creating or maintaining the Fund’s portfolio. Deviation from the model may be due to a combination of asset fluctuation, expenses, transaction costs, including swap contract related costs and underlying volatility. For the Annual Period, the NASDAQ-100® Index returned 27.30%. For the same period, the Direxion Monthly NASDAQ-100® Bull 1.75X Fund returned 40.74%, while the model indicated an expected return of 49.73%. Given the calendar month investment objective of the Fund and the path dependency of returns for longer periods, the return of the index alone should not generate expectations of performance of the Fund.
HOW DID THE FUND PERFORM FOR THE PAST 10 YEARS?*
The $10,000 chart reflects a hypothetical $10,000 investment in the Fund. The chart uses total return NAV performance and assumes reinvestment of dividends and capital gains. Fund expenses, including 12b-1 fees, management fees and other expenses were deducted.
CUMULATIVE PERFORMANCE (Initial Investment of $10,000)
| Direxion Monthly NASDAQ-100® Bull 1.75X Fund | PAGE 1 | TSR-AR-254939200 |
ANNUAL AVERAGE TOTAL RETURN (%)
| | | |
| | 1 Year | 5 Year | 10 Year |
Direxion Monthly NASDAQ-100® Bull 1.75X Fund | 40.74 | 33.00 | 28.54 |
NASDAQ-100® Index | 27.30 | 21.55 | 18.14 |
Visit https://connect.rightprospectus.com/Direxion for more recent performance information.
| * | The Fund’s past performance is not a good predictor of how the Fund will perform in the future. The graph and table do not reflect the deduction of taxes that a shareholder would pay on Fund distributions or redemption of Fund shares. |
KEY FUND STATISTICS (as of August 31, 2024)
| |
Net Assets | $445,946,122 |
Number of Holdings | 5 |
Net Advisory Fee | $3,049,715 |
Portfolio Turnover | 12% |
WHAT DID THE FUND INVEST IN? (as of August 31, 2024)
| |
Market Exposure | |
Total Return Swap Contracts | 118.4% |
Investment Companies | 56.6% |
Total (as % of net assets) | 175.0% |
| |
Index Composition | (%) |
Information Technology | 50.9% |
Communication Services | 15.5% |
Consumer Discretionary | 12.4% |
Health Care | 6.4% |
Consumer Staples | 6.3% |
Industrials | 4.5% |
Materials | 1.5% |
Utilities | 1.3% |
Financials | 0.5% |
Energy | 0.5% |
Real Estate | 0.2% |
| |
Top 10 Constituents of Index | (%) |
Apple, Inc. | 9.3% |
Microsoft Corp. | 8.1% |
NVIDIA Corp. | 7.7% |
Broadcom, Inc. | 5.0% |
Meta Platforms, Inc. Class A | 4.8% |
Amazon.com, Inc. | 4.7% |
Costco Wholesale Corp. | 2.7% |
Tesla, Inc. | 2.6% |
Alphabet Inc. Class A | 2.5% |
Alphabet Inc. Class C | 2.4% |
For additional information about the Fund; including its prospectus, financial information, holdings and proxy information, scan the QR code or visit https://connect.rightprospectus.com/Direxion
The Fund is distributed by ALPS Distributors, Inc..
HOUSEHOLDING
To reduce Fund expenses, only one copy of most shareholder documents may be mailed to shareholders with multiple accounts at the same address (Householding). If you would prefer that your Rafferty Asset Management, LLC documents not be householded, please contact Rafferty Asset Management, LLC at 866-476-7523, or contact your financial intermediary. Your instructions will typically be effective within 30 days of receipt by Rafferty Asset Management, LLC or your financial intermediary.
| Direxion Monthly NASDAQ-100® Bull 1.75X Fund | PAGE 2 | TSR-AR-254939200 |
1000010770130192012031614295846823410881362736874671231001000010595119801521519648199623173841132326464160452963
| | |
| Direxion Monthly S&P 500® Bull 1.75X Fund | |
| Investor | DXSLX |
| Annual Shareholder Report | August 31, 2024 |
This annual shareholder report contains important information about the Direxion Monthly S&P 500® Bull 1.75X Fund for the period of September 1, 2023, to August 31, 2024. You can find additional information about the Fund at https://connect.rightprospectus.com/Direxion. You can also request this information by contacting us at 866-476-7523.
WHAT WERE THE FUND COSTS FOR THE PAST YEAR? (based on a hypothetical $10,000 investment)
| | |
| Costs of a $10,000 investment | Costs paid as a percentage of a $10,000 investment |
| Direxion Monthly S&P 500® Bull 1.75X Fund | $163 | 1.35% |
HOW DID THE FUND PERFORM LAST YEAR AND WHAT AFFECTED ITS PERFORMANCE?
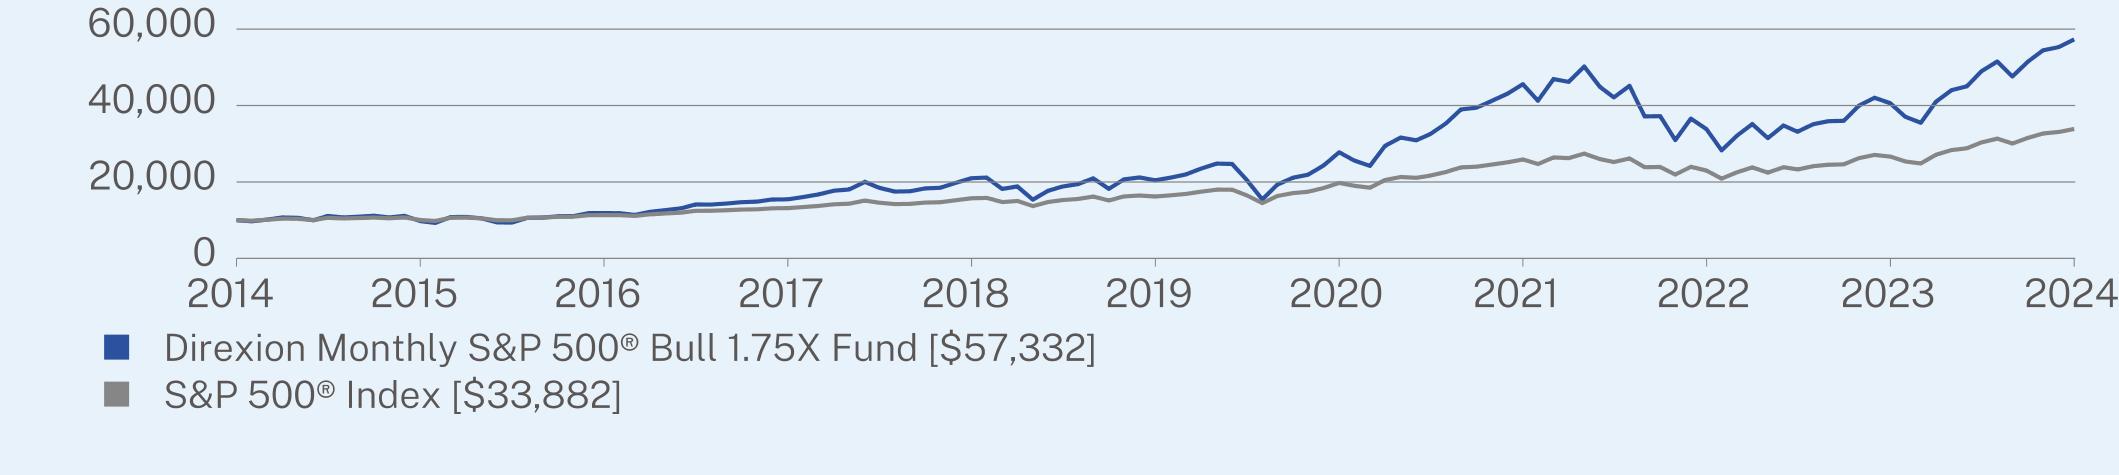
The Direxion Monthly S&P 500® Bull 1.75X Fund seeks to provide 175% calendar month return of the S&P 500® Index. Standard & Poor’s® selects the stocks comprising the S&P 500® Index on the basis of market capitalization, financial viability of the company and the public float, liquidity and price of a company’s shares outstanding. The index is a float-adjusted, market capitalization-weighted index. To determine if the Fund has met its monthly investment goals, the Advisor, Rafferty Asset Management, LLC, maintains models which indicate the expected performance of the Fund as compared to the underlying index. The models do not take into account the expense ratio or any transaction or trading fees associated with creating or maintaining the Fund’s portfolio. Deviation from the model may be due to a combination of asset fluctuation, expenses, transaction costs, including swap contract related costs and underlying volatility. For the Annual Period, the S&P 500® Index returned 27.14%. For the same period, the Direxion Monthly S&P 500® Bull 1.75X Fund returned 41.07%, while the model indicated an expected return of 50.06%. Given the calendar month investment objective of the Fund and the path dependency of returns for longer periods, the return of the index alone should not generate expectations of performance of the Fund.
HOW DID THE FUND PERFORM FOR THE PAST 10 YEARS?*
The $10,000 chart reflects a hypothetical $10,000 investment in the Fund. The chart uses total return NAV performance and assumes reinvestment of dividends and capital gains. Fund expenses, including 12b-1 fees, management fees and other expenses were deducted.
CUMULATIVE PERFORMANCE (Initial Investment of $10,000)
| Direxion Monthly S&P 500® Bull 1.75X Fund | PAGE 1 | TSR-AR-254939705 |
ANNUAL AVERAGE TOTAL RETURN (%)
| | | |
| | 1 Year | 5 Year | 10 Year |
Direxion Monthly S&P 500® Bull 1.75X Fund | 41.07 | 22.93 | 19.08 |
S&P 500® Index | 27.14 | 15.92 | 12.98 |
Visit https://connect.rightprospectus.com/Direxion for more recent performance information.
| * | The Fund’s past performance is not a good predictor of how the Fund will perform in the future. The graph and table do not reflect the deduction of taxes that a shareholder would pay on Fund distributions or redemption of Fund shares. |
KEY FUND STATISTICS (as of August 31, 2024)
| |
Net Assets | $119,743,099 |
Number of Holdings | 5 |
Net Advisory Fee | $795,565 |
Portfolio Turnover | 0% |
WHAT DID THE FUND INVEST IN? (as of August 31, 2024)
| |
Market Exposure | |
Total Return Swap Contracts | 120.7% |
Investment Companies | 54.3% |
Total (as % of net assets) | 175.0% |
| |
Index Composition | (%) |
Information Technology | 31.0% |
Financials | 13.3% |
Health Care | 12.2% |
Consumer Discretionary | 9.7% |
Communication Services | 8.8% |
Industrials | 8.5% |
Consumer Staples | 6.0% |
Energy | 3.5% |
Utilities | 2.4% |
Real Estate | 2.4% |
Materials | 2.2% |
| |
Top 10 Constituents of Index | (%) |
Apple, Inc. | 7.0% |
Microsoft Corp. | 6.5% |
NVIDIA Corp. | 6.2% |
Amazon.com, Inc. | 3.5% |
Meta Platforms, Inc. Class A | 2.4% |
Alphabet Inc. Class A | 2.0% |
Berkshire Hathaway Inc. Class B | 1.8% |
Alphabet Inc. Class C | 1.7% |
Eli Lilly and Company | 1.6% |
Broadcom, Inc. | 1.5% |
For additional information about the Fund; including its prospectus, financial information, holdings and proxy information, scan the QR code or visit https://connect.rightprospectus.com/Direxion
The Fund is distributed by ALPS Distributors, Inc..
HOUSEHOLDING
To reduce Fund expenses, only one copy of most shareholder documents may be mailed to shareholders with multiple accounts at the same address (Householding). If you would prefer that your Rafferty Asset Management, LLC documents not be householded, please contact Rafferty Asset Management, LLC at 866-476-7523, or contact your financial intermediary. Your instructions will typically be effective within 30 days of receipt by Rafferty Asset Management, LLC or your financial intermediary.
| Direxion Monthly S&P 500® Bull 1.75X Fund | PAGE 2 | TSR-AR-254939705 |
1000097621185115446209862042027770455963383640641573321000010048113091314515730161891974025893229862665033882
| | |
| Direxion Monthly Small Cap Bull 1.75X Fund | |
| Investor | DXRLX |
| Annual Shareholder Report | August 31, 2024 |
This annual shareholder report contains important information about the Direxion Monthly Small Cap Bull 1.75X Fund for the period of September 1, 2023, to August 31, 2024. You can find additional information about the Fund at https://connect.rightprospectus.com/Direxion. You can also request this information by contacting us at 866-476-7523.
WHAT WERE THE FUND COSTS FOR THE PAST YEAR? (based on a hypothetical $10,000 investment)
| | |
| Costs of a $10,000 investment | Costs paid as a percentage of a $10,000 investment |
| Direxion Monthly Small Cap Bull 1.75X Fund | $150 | 1.35% |
HOW DID THE FUND PERFORM LAST YEAR AND WHAT AFFECTED ITS PERFORMANCE?
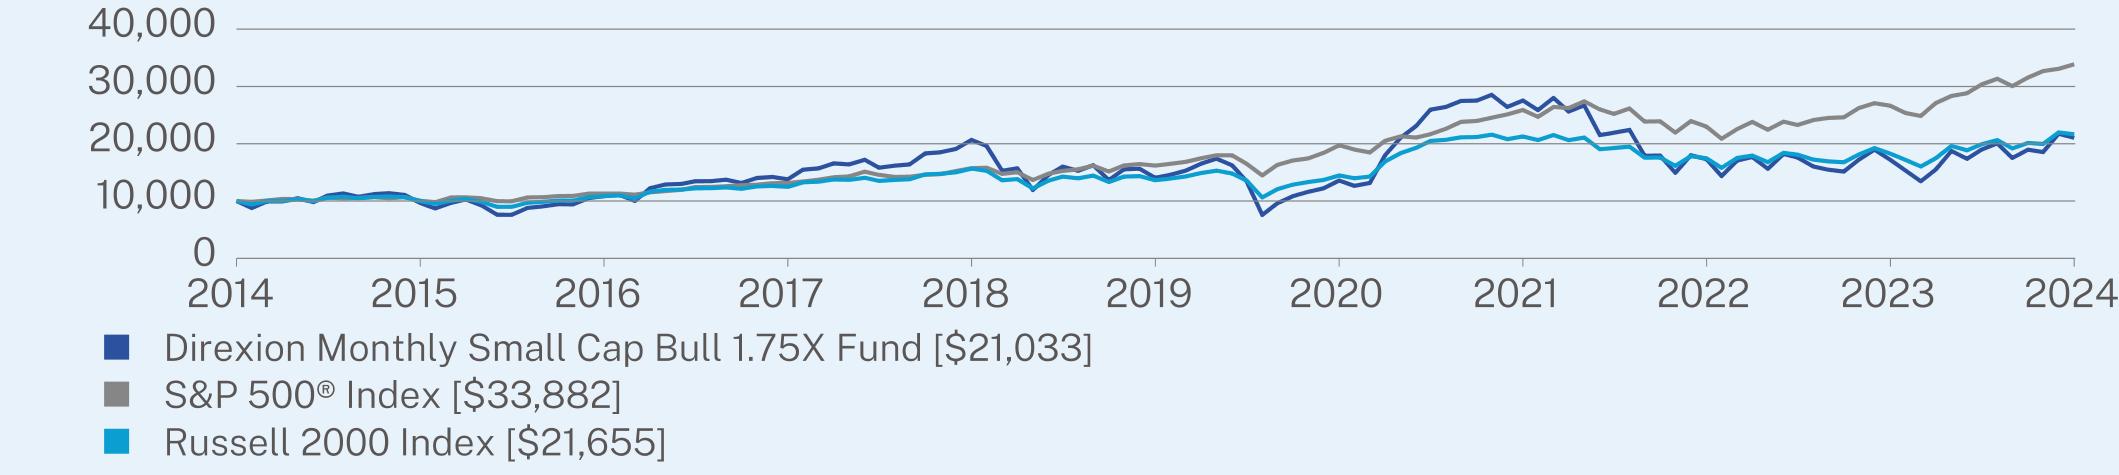
The Direxion Monthly Small Cap Bull 1.75X Fund seeks to provide 175% of the calendar month return of the Russell 2000® Index. The Russell 2000® Index measures the performance of approximately 2,000 small-capitalization companies in the Russell 3000® Index, based on a combination of their market capitalization and current index membership. To determine if the Fund has met its monthly investment goals, the Advisor, Rafferty Asset Management, LLC, maintains models which indicate the expected performance of the Fund as compared to the underlying index. The models do not take into account the expense ratio or any transaction or trading fees associated with creating or maintaining the Fund’s portfolio. Deviation from the model may be due to a combination of asset fluctuation, expenses, transaction costs, including swap contract related costs and underlying volatility. For the Annual Period, the Russell 2000® Index returned 18.47%. For the same period, the Direxion Monthly Small Cap Bull 1.75X Fund returned 22.18%, while the model indicated an expected return of 30.10%. Given the calendar month investment objective of the Fund and the path dependency of returns for longer periods, the return of the index alone should not generate expectations of annual performance of the Fund.
HOW DID THE FUND PERFORM FOR THE PAST 10 YEARS?*
The $10,000 chart reflects a hypothetical $10,000 investment in the Fund. The chart uses total return NAV performance and assumes reinvestment of dividends and capital gains. Fund expenses, including 12b-1 fees, management fees and other expenses were deducted.
CUMULATIVE PERFORMANCE (Initial Investment of $10,000)
| Direxion Monthly Small Cap Bull 1.75X Fund | PAGE 1 | TSR-AR-254939838 |
ANNUAL AVERAGE TOTAL RETURN (%)
| | | |
| | 1 Year | 5 Year | 10 Year |
Direxion Monthly Small Cap Bull 1.75X Fund | 22.18 | 8.41 | 7.72 |
S&P 500® Index | 27.14 | 15.92 | 12.98 |
Russell 2000 Index | 18.47 | 9.68 | 8.03 |
Visit https://connect.rightprospectus.com/Direxion for more recent performance information.
| * | The Fund’s past performance is not a good predictor of how the Fund will perform in the future. The graph and table do not reflect the deduction of taxes that a shareholder would pay on Fund distributions or redemption of Fund shares. |
KEY FUND STATISTICS (as of August 31, 2024)
| |
Net Assets | $14,732,664 |
Number of Holdings | 5 |
Net Advisory Fee | $87,982 |
Portfolio Turnover | 35% |
WHAT DID THE FUND INVEST IN? (as of August 31, 2024)
| |
Market Exposure | |
Total Return Swap Contracts | 119.5% |
Investment Companies | 55.5% |
Total (as % of net assets) | 175.0% |
| |
Index Composition | (%) |
Financials | 18.4% |
Health Care | 17.7% |
Industrials | 16.9% |
Information Technology | 12.7% |
Consumer Discretionary | 9.7% |
Real Estate | 6.3% |
Energy | 5.7% |
Materials | 4.4% |
Consumer Staples | 2.8% |
Utilities | 2.8% |
Communication Services | 2.6% |
| |
Top 10 Constituents of Index | (%) |
FTAI Aviation Ltd. | 0.5% |
Insmed, Inc. | 0.5% |
Sprouts Farmers Market, Inc. | 0.4% |
Fabrinet | 0.3% |
Vaxcyte, Inc. | 0.3% |
Fluor Corp. | 0.3% |
The Ensign Group, Inc. | 0.3% |
Mueller Industries, Inc. | 0.3% |
Halozyme Therapeutics, Inc. | 0.3% |
Applied Industrial Technologies, Inc. | 0.3% |
For additional information about the Fund; including its prospectus, financial information, holdings and proxy information, scan the QR code or visit https://connect.rightprospectus.com/Direxion
The Fund is distributed by ALPS Distributors, Inc..
HOUSEHOLDING
To reduce Fund expenses, only one copy of most shareholder documents may be mailed to shareholders with multiple accounts at the same address (Householding). If you would prefer that your Rafferty Asset Management, LLC documents not be householded, please contact Rafferty Asset Management, LLC at 866-476-7523, or contact your financial intermediary. Your instructions will typically be effective within 30 days of receipt by Rafferty Asset Management, LLC or your financial intermediary.
| Direxion Monthly Small Cap Bull 1.75X Fund | PAGE 2 | TSR-AR-254939838 |
10000966610874137962067014048135772754317305172142103310000100481130913145157301618919740258932298626650338821000010003108621248315659136401446121270174661827821655
| | |
| Direxion Monthly 7-10 Year Treasury Bull 1.75X Fund | |
| Investor | DXKLX |
| Annual Shareholder Report | August 31, 2024 |
This annual shareholder report contains important information about the Direxion Monthly 7-10 Year Treasury Bull 1.75X Fund for the period of September 1, 2023, to August 31, 2024. You can find additional information about the Fund at https://connect.rightprospectus.com/Direxion. You can also request this information by contacting us at 866-476-7523.
WHAT WERE THE FUND COSTS FOR THE PAST YEAR? (based on a hypothetical $10,000 investment)
| | |
| Costs of a $10,000 investment | Costs paid as a percentage of a $10,000 investment |
| Direxion Monthly 7-10 Year Treasury Bull 1.75X Fund | $137 | 1.35% |
HOW DID THE FUND PERFORM LAST YEAR AND WHAT AFFECTED ITS PERFORMANCE?
The Direxion Monthly 7-10 Year Treasury Bull 1.75X Fund seeks to provide 175% of the calendar month return of the ICE U.S. Treasury 7-10 Year Bond Index, respectively. The ICE U.S. Treasury 7-10 Year Bond Index is a market value weighted index that includes publicly issued U.S. Treasury securities that have a remaining maturity of greater than seven years and less than or equal to ten years. Eligible securities must be fixed rate, denominated in U.S. Dollars, and have $300 million or more of outstanding face value, excluding amounts held by the Federal Reserve. Securities excluded from the index are zero-coupon STRIPS, inflation-linked securities, floating-rate notes, cash management and Treasury bills, and any government agency debt that is issued with or without a government guarantee. To determine if the Fund has met its monthly investment goals, the Advisor, Rafferty Asset Management, LLC, maintains models which indicate the expected performance of the Fund as compared to the underlying index. The models do not take into account the expense ratio or any transaction or trading fees associated with creating or maintaining the Fund’s portfolio. Deviation from the model may be due to a combination of asset fluctuation, expenses, transaction costs, including swap contract related costs and underlying volatility. For the Annual Period, the ICE U.S. Treasury 7-10 Year Bond Index returned 6.09%. For the same period, the Direxion Monthly 7-10 Year Treasury Bull 1.75X Fund returned 3.09%, while the model indicated an expected return of 10.33%. Given the calendar month investment objective of the Fund and the path dependency of returns for longer periods, the return of the index alone should not generate expectations of performance of the Fund.
HOW DID THE FUND PERFORM FOR THE PAST 10 YEARS?*
The $10,000 chart reflects a hypothetical $10,000 investment in the Fund. The chart uses total return NAV performance and assumes reinvestment of dividends and capital gains. Fund expenses, including 12b-1 fees, management fees and other expenses were deducted.
CUMULATIVE PERFORMANCE (Initial Investment of $10,000)
| Direxion Monthly 7-10 Year Treasury Bull 1.75X Fund | PAGE 1 | TSR-AR-254939689 |
ANNUAL AVERAGE TOTAL RETURN (%)
| | | |
| | 1 Year | 5 Year | 10 Year |
Direxion Monthly 7-10 Year Treasury Bull 1.75X Fund | 3.09 | -6.93 | -1.47 |
Bloomberg U.S. Aggregate Bond Index | 7.30 | -0.04 | 1.64 |
Bloomberg Intermediate Government/Credit Index | 7.11 | 0.96 | 1.80 |
ICE US Treasury 7-10 Year Bond Index | 6.09 | -1.17 | 1.28 |
Visit https://connect.rightprospectus.com/Direxion for more recent performance information.
| * | The Fund’s past performance is not a good predictor of how the Fund will perform in the future. The graph and table do not reflect the deduction of taxes that a shareholder would pay on Fund distributions or redemption of Fund shares. |
KEY FUND STATISTICS (as of August 31, 2024)
| |
Net Assets | $12,598,043 |
Number of Holdings | 5 |
Net Advisory Fee | $72,728 |
Portfolio Turnover | 399% |
WHAT DID THE FUND INVEST IN? (as of August 31, 2024)
| |
Market Exposure | |
Total Return Swap Contracts | 110.5% |
Investment Companies | 64.5% |
Total (as % of net assets) | 175.0% |
| |
Top 10 Constituents of Index | (%) |
United States 10 Year Treasury Note | |
4.375%, 2034-05-15 | 9.2% |
4.000%, 2034-02-15 | 8.8% |
4.500%, 2033-11-15 | 8.8% |
3.875%, 2033-08-15 | 7.9% |
4.125%, 2032-11-15 | 7.4% |
3.500%, 2033-02-15 | 7.0% |
1.250%, 2031-08-15 | 7.0% |
2.875%, 2032-05-15 | 7.0% |
3.375%, 2033-05-15 | 7.0% |
1.375%, 2031-11-15 | 6.9% |
For additional information about the Fund; including its prospectus, financial information, holdings and proxy information, scan the QR code or visit https://connect.rightprospectus.com/Direxion
The Fund is distributed by ALPS Distributors, Inc..
HOUSEHOLDING
To reduce Fund expenses, only one copy of most shareholder documents may be mailed to shareholders with multiple accounts at the same address (Householding). If you would prefer that your Rafferty Asset Management, LLC documents not be householded, please contact Rafferty Asset Management, LLC at 866-476-7523, or contact your financial intermediary. Your instructions will typically be effective within 30 days of receipt by Rafferty Asset Management, LLC or your financial intermediary.
| Direxion Monthly 7-10 Year Treasury Bull 1.75X Fund | PAGE 2 | TSR-AR-254939689 |
100001040911572109129973123541389812777948883668625100001015610761108141070111789125531254211098109651176510000101471056110647105391139512073120931110111162119561000010355110901092110588120411307412706111221070011352
| | |
| Direxion Monthly 7-10 Year Treasury Bear 1.75X Fund | |
| Investor | DXKSX |
| Annual Shareholder Report | August 31, 2024 |
This annual shareholder report contains important information about the Direxion Monthly 7-10 Year Treasury Bear 1.75X Fund for the period of September 1, 2023, to August 31, 2024. You can find additional information about the Fund at https://connect.rightprospectus.com/Direxion. You can also request this information by contacting us at 866-476-7523.
WHAT WERE THE FUND COSTS FOR THE PAST YEAR? (based on a hypothetical $10,000 investment)
| | |
| Costs of a $10,000 investment | Costs paid as a percentage of a $10,000 investment |
| Direxion Monthly 7-10 Year Treasury Bear 1.75X Fund | $135 | 1.35% |
HOW DID THE FUND PERFORM LAST YEAR AND WHAT AFFECTED ITS PERFORMANCE?
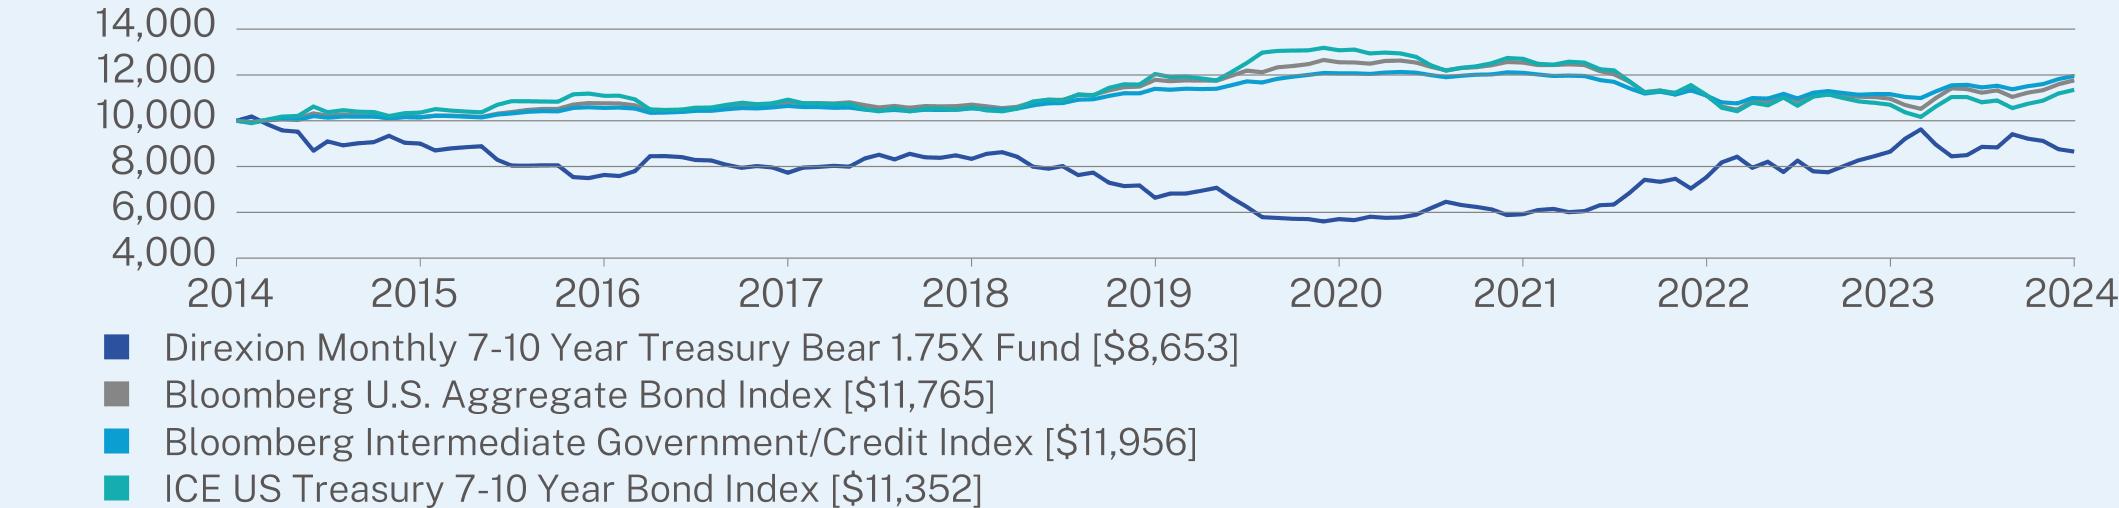
The Direxion Monthly 7-10 Year Treasury Bear 1.75X Fund seeks to provide -175% of the calendar month return of the ICE U.S. Treasury 7-10 Year Bond Index, respectively. The ICE U.S. Treasury 7-10 Year Bond Index is a market value weighted index that includes publicly issued U.S. Treasury securities that have a remaining maturity of greater than seven years and less than or equal to ten years. Eligible securities must be fixed rate, denominated in U.S. Dollars, and have $300 million or more of outstanding face value, excluding amounts held by the Federal Reserve. Securities excluded from the index are zero-coupon STRIPS, inflation-linked securities, floating-rate notes, cash management and Treasury bills, and any government agency debt that is issued with or without a government guarantee. To determine if the Fund has met its monthly investment goals, the Advisor, Rafferty Asset Management, LLC, maintains models which indicate the expected performance of the Fund as compared to the underlying index. The models do not take into account the expense ratio or any transaction or trading fees associated with creating or maintaining the Fund’s portfolio. Deviation from the model may be due to a combination of asset fluctuation, expenses, transaction costs, including swap contract related costs and underlying volatility. For the Annual Period, the ICE U.S. Treasury 7-10 Year Bond Index returned 6.09%. For the same period, the Direxion Monthly 7-10 Year Treasury Bear 1.75X Fund returned 0.02%, while the model indicated an expected return of -11.49%. Given the calendar month investment objective of the Fund and the path dependency of returns for longer periods, the return of the index alone should not generate expectations of performance of the Fund.
HOW DID THE FUND PERFORM FOR THE PAST 10 YEARS?*
The $10,000 chart reflects a hypothetical $10,000 investment in the Fund. The chart uses total return NAV performance and assumes reinvestment of dividends and capital gains. Fund expenses, including 12b-1 fees, management fees and other expenses were deducted.
CUMULATIVE PERFORMANCE (Initial Investment of $10,000)
| Direxion Monthly 7-10 Year Treasury Bear 1.75X Fund | PAGE 1 | TSR-AR-254939184 |
ANNUAL AVERAGE TOTAL RETURN (%)
| | | |
| | 1 Year | 5 Year | 10 Year |
Direxion Monthly 7-10 Year Treasury Bear 1.75X Fund | 0.02 | 5.44 | -1.44 |
Bloomberg U.S. Aggregate Bond Index | 7.30 | -0.04 | 1.64 |
Bloomberg Intermediate Government/Credit Index | 7.11 | 0.96 | 1.80 |
ICE US Treasury 7-10 Year Bond Index | 6.09 | -1.17 | 1.28 |
Visit https://connect.rightprospectus.com/Direxion for more recent performance information.
| * | The Fund’s past performance is not a good predictor of how the Fund will perform in the future. The graph and table do not reflect the deduction of taxes that a shareholder would pay on Fund distributions or redemption of Fund shares. |
KEY FUND STATISTICS (as of August 31, 2024)
| |
Net Assets | $3,187,559 |
Number of Holdings | 4 |
Net Advisory Fee | $39,042 |
Portfolio Turnover | 0% |
WHAT DID THE FUND INVEST IN? (as of August 31, 2024)
| |
Market Exposure | (%) |
Total Return Swap Contracts | -175.0% |
Total (as % of net assets) | -175.0% |
| |
Top 10 Constituents of Index | (%) |
United States 10 Year Treasury Note | |
4.375%, 2034-05-15 | 9.2% |
4.000%, 2034-02-15 | 8.8% |
4.500%, 2033-11-15 | 8.8% |
3.875%, 2033-08-15 | 7.9% |
4.125%, 2032-11-15 | 7.4% |
3.500%, 2033-02-15 | 7.0% |
1.250%, 2031-08-15 | 7.0% |
2.875%, 2032-05-15 | 7.0% |
3.375%, 2033-05-15 | 7.0% |
1.375%, 2031-11-15 | 6.9% |
For additional information about the Fund; including its prospectus, financial information, holdings and proxy information, scan the QR code or visit https://connect.rightprospectus.com/Direxion
The Fund is distributed by ALPS Distributors, Inc..
HOUSEHOLDING
To reduce Fund expenses, only one copy of most shareholder documents may be mailed to shareholders with multiple accounts at the same address (Householding). If you would prefer that your Rafferty Asset Management, LLC documents not be householded, please contact Rafferty Asset Management, LLC at 866-476-7523, or contact your financial intermediary. Your instructions will typically be effective within 30 days of receipt by Rafferty Asset Management, LLC or your financial intermediary.
| Direxion Monthly 7-10 Year Treasury Bear 1.75X Fund | PAGE 2 | TSR-AR-254939184 |
100009004763577318336663957055920753486518653100001015610761108141070111789125531254211098109651176510000101471056110647105391139512073120931110111162119561000010355110901092110588120411307412706111221070011352
| | |
| Hilton Tactical Income Fund | |
| Institutional Class | HCYIX |
| Annual Shareholder Report | August 31, 2024 |
This annual shareholder report contains important information about the Hilton Tactical Income Fund for the period of September 1, 2023, to August 31, 2024. You can find additional information about the Fund at https://connect.rightprospectus.com/Direxion. You can also request this information by contacting us at 866-476-7523.
WHAT WERE THE FUND COSTS FOR THE PAST YEAR? (based on a hypothetical $10,000 investment)
| | |
| Costs of a $10,000 investment | Costs paid as a percentage of a $10,000 investment |
| Hilton Tactical Income Fund Institutional Class | $93 | 0.87% |
HOW DID THE FUND PERFORM LAST YEAR AND WHAT AFFECTED ITS PERFORMANCE?
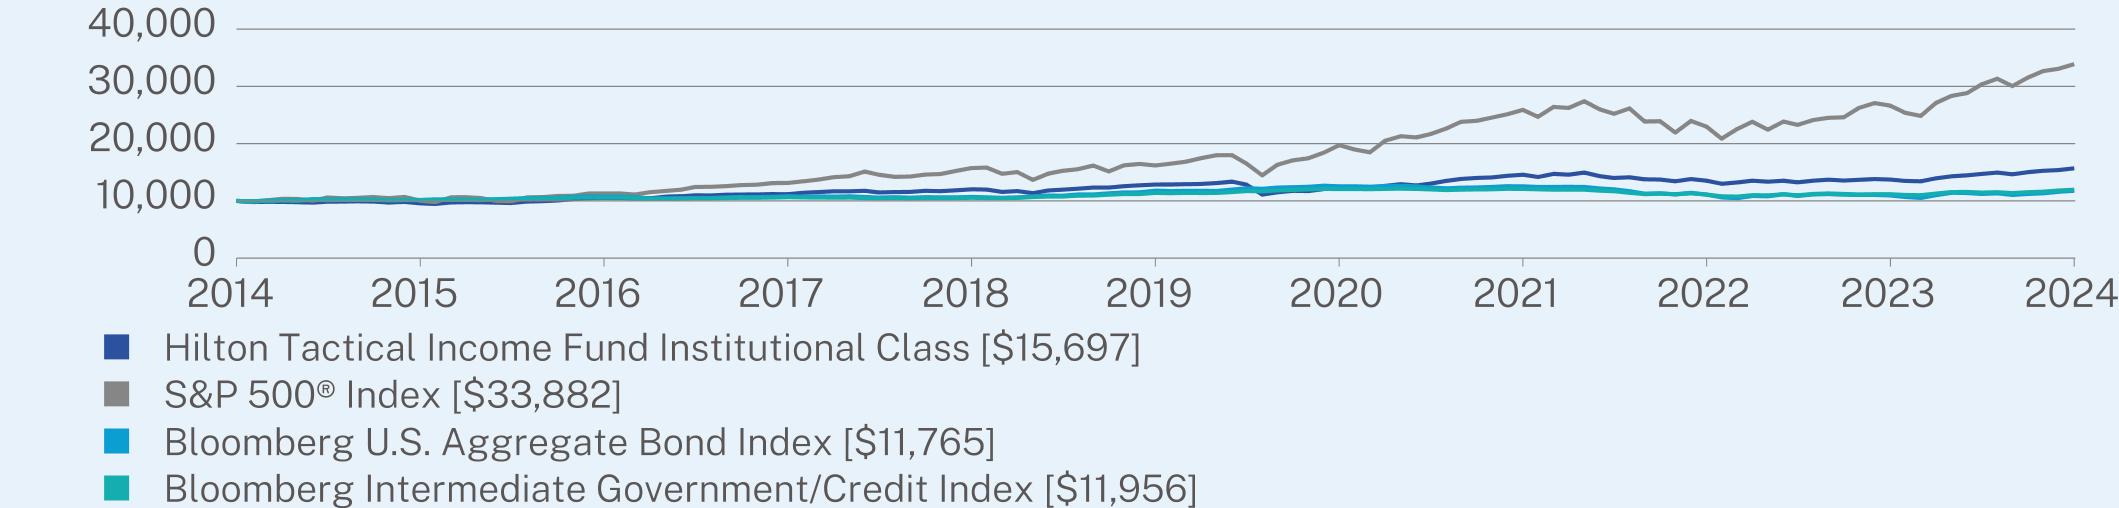
The Hilton Tactical Income Fund primarily seeks income with a secondary investment objective of capital appreciation consistent with the preservation of capital. The Fund utilizes a disciplined approach to balancing fixed income investments with historically higher income producing equity investments, with a focus on minimizing risk and volatility. For the Annual Period the Institutional Class returned 14.38% while the Fund’s benchmark, a blend of 60% of the Bloomberg Intermediate U.S. Government/Credit Index and 40% S&P 500® Index, returned 15.12% for the same period.
Over the course of the Annual Period, the portfolio management team pivoted the portfolio to a more aggressive allocation in which several factors led to that realignment. Long-time investors will note the “neutral” allocation is 40% in equities and 60% in fixed income. The three main factors in that decision came from the macro-outlook at Hilton Capital. First, there was the consistent moderating of the inflation readings. That, coupled with a softening in the labor markets, justified the Federal Reserve’s pivot from a tightening cycle to an easing cycle. As of the end of the Annual Period, the Federal Reserve has not initiated any interest rate cuts, but has signaled they are coming. The federal funds markets are pricing in three to four cuts in 2024, and a total of ten cuts by the end of 2025. The second factor in the allocation changes was the resilience of corporate earnings. In the latter half of the Annual Period, earnings for the S&P 500 grew at an 8% and 10% pace and are projecting overall growth of 10% for 2024 and 12% for 2025. Very optimistic growth numbers, which to date have been met. The third factor influencing position changes came from overall gross domestic product (GDP) growth. In the middle of 2023, there were still questions if the economy was in for a hard landing and possible recession after historic rate hikes. By the beginning of 2024 those fears were lessened, GDP growth did contract from post-Covid highs, but still hovered in the 1.5% to 2.5% range for most of the Annual Period. Those factors gave the portfolio management team the green light to be a bit more “risk-on” in the portfolio.
One of the key characteristics of the Tactical Income strategy is the ability of the portfolio management team to tactically adjust the risk characteristics in the portfolio to match the macro-outlook and corresponding market outlook. They achieve that by increasing, or decreasing, the allocation to equity securities, as well as increasing or decreasing the credit profile of the fixed income securities in the portfolio. In the Annual Period the overall exposure to equities increased from 40.6% to 45.2% and had a high near 48%. The sectors with the largest increases were REITs, financials and industrials, while the portfolio management team trimmed communications services, energy and technology. On the fixed income side is where the portfolio management team expressed an even more optimistic outlook by adding more credit risk to the portfolio. The portfolio management team had come into the Annual Period with 33% of the portfolio in US treasuries, mostly in short duration, which served very well through the Federal Reserve’s hiking cycle. By the end of the Annual Period, as the Federal Reserve pivoted to a future easing cycle, the portfolio management team lowered that treasury allocation to 8%, or a drop 25%. That was reallocated to several asset classes of fixed income. The portfolio management team added a mortgage-backed securities position of 8%, increased the allocation to corporate bonds by 6%, added to collateralized loan obligations by 3% and increased the preferred position by 2.6%. At the end of the Annual Period, the fund held 2.7% in cash, 52.1% in Fixed Income and 45.2% in Equities.
| Hilton Tactical Income Fund | PAGE 1 | TSR-AR-254939168 |
| |
Top Contributors |
| ↑ | JPMorgan Nasdaq Equity Premium Income ETF |
| ↑ | Communication Services Select Sector SPDR ETF |
| ↑ | Microsoft Corp |
| ↑ | Taiwan Semiconductor Manufacturing Co Ltd |
| ↑ | Eli Lilly and Company |
| |
Top Detractors |
| ↓ | Cisco Systems Inc |
| ↓ | Becton Dickinson and Company |
| ↓ | Nike, Inc. Class B |
| ↓ | Energy Select Sector SPDR Fund |
| ↓ | Zimmer Biomet Holdings, Inc. |
HOW DID THE FUND PERFORM FOR THE PAST 10 YEARS?*
The $10,000 chart reflects a hypothetical $10,000 investment in the Fund. The chart uses total return NAV performance and assumes reinvestment of dividends and capital gains. Fund expenses, including 12b-1 fees, management fees and other expenses were deducted.
CUMULATIVE PERFORMANCE (Initial Investment of $10,000)
ANNUAL AVERAGE TOTAL RETURN (%)
| | | |
| | 1 Year | 5 Year | 10 Year |
Hilton Tactical Income Fund Institutional Class | 14.38 | 4.07 | 4.61 |
S&P 500® Index | 27.14 | 15.92 | 12.98 |
Bloomberg U.S. Aggregate Bond Index | 7.30 | -0.04 | 1.64 |
Bloomberg Intermediate Government/Credit Index | 7.11 | 0.96 | 1.80 |
Visit https://connect.rightprospectus.com/Direxion for more recent performance information.
| * | The Fund’s past performance is not a good predictor of how the Fund will perform in the future. The graph and table do not reflect the deduction of taxes that a shareholder would pay on Fund distributions or redemption of Fund shares. |
KEY FUND STATISTICS (as of August 31, 2024)
| |
Net Assets | $123,469,214 |
Number of Holdings | 105 |
Net Advisory Fee | $934,600 |
Portfolio Turnover | 83% |
Distribution Yield | 3.21% |
| Hilton Tactical Income Fund | PAGE 2 | TSR-AR-254939168 |
WHAT DID THE FUND INVEST IN? (as of August 31, 2024)
| |
Top 10 Holdings | (%) |
Janus Henderson AAA CLO ETF | 6.5% |
iShares MBS ETF | 5.5% |
JPMorgan Nasdaq Equity Premium Income ETF | 4.0% |
United States 10 Year Treasury Note, 4.125%, 2027-09-30 | 3.7% |
iShares Preferred & Income Securities ETF | 3.5% |
SPDR Blackstone Senior Loan ETF | 3.4% |
United States 10 Year Treasury Note, 5.500%, 2028-08-15 | 3.0% |
Simplify MBS ETF | 3.0% |
Alerian MLP ETF | 2.2% |
Microsoft Corp. | 2.2% |
| |
Security Type | (%) |
Common Stocks | 35.6% |
Investment Companies | 34.5% |
Corporate Bonds | 19.5% |
U.S. Government Obligations | 6.7% |
Preferred Stocks | 1.0% |
Cash & Other | 2.7% |
| |
Market Exposure | |
Fixed Income | 52.1% |
Equity | 45.2% |
Other | 2.7% |
Total (as % of net assets) | 100.0% |
For additional information about the Fund; including its prospectus, financial information, holdings and proxy information, scan the QR code or visit https://connect.rightprospectus.com/Direxion
The Fund is distributed by ALPS Distributors, Inc..
HOUSEHOLDING
To reduce Fund expenses, only one copy of most shareholder documents may be mailed to shareholders with multiple accounts at the same address (Householding). If you would prefer that your Rafferty Asset Management, LLC documents not be householded, please contact Rafferty Asset Management, LLC at 866-476-7523, or contact your financial intermediary. Your instructions will typically be effective within 30 days of receipt by Rafferty Asset Management, LLC or your financial intermediary.
| Hilton Tactical Income Fund | PAGE 3 | TSR-AR-254939168 |
100009575104931116412027128591244014578135381372415697100001004811309131451573016189197402589322986266503388210000101561076110814107011178912553125421109810965117651000010147105611064710539113951207312093111011116211956
| | |
| Hilton Tactical Income Fund | |
| Investor Class | HCYAX |
| Annual Shareholder Report | August 31, 2024 |
This annual shareholder report contains important information about the Hilton Tactical Income Fund for the period of September 1, 2023, to August 31, 2024. You can find additional information about the Fund at https://connect.rightprospectus.com/Direxion. You can also request this information by contacting us at 866-476-7523.
WHAT WERE THE FUND COSTS FOR THE PAST YEAR? (based on a hypothetical $10,000 investment)
| | |
| Costs of a $10,000 investment | Costs paid as a percentage of a $10,000 investment |
| Hilton Tactical Income Fund Investor Class | $120 | 1.12% |
HOW DID THE FUND PERFORM LAST YEAR AND WHAT AFFECTED ITS PERFORMANCE?
The Hilton Tactical Income Fund primarily seeks income with a secondary investment objective of capital appreciation consistent with the preservation of capital. The Fund utilizes a disciplined approach to balancing fixed income investments with historically higher income producing equity investments, with a focus on minimizing risk and volatility. For the Annual Period the Investor Class returned 14.12% while the Fund’s benchmark, a blend of 60% of the Bloomberg Intermediate U.S. Government/Credit Index and 40% S&P 500® Index, returned 15.12% for the same period.
Over the course of the Annual Period, the portfolio management team pivoted the portfolio to a more aggressive allocation in which several factors led to that realignment. Long-time investors will note the “neutral” allocation is 40% in equities and 60% in fixed income. The three main factors in that decision came from the macro-outlook at Hilton Capital. First, there was the consistent moderating of the inflation readings. That, coupled with a softening in the labor markets, justified the Federal Reserve’s pivot from a tightening cycle to an easing cycle. As of the end of the Annual Period, the Federal Reserve has not initiated any interest rate cuts, but has signaled they are coming. The federal funds markets are pricing in three to four cuts in 2024, and a total of ten cuts by the end of 2025. The second factor in the allocation changes was the resilience of corporate earnings. In the latter half of the Annual Period, earnings for the S&P 500 grew at an 8% and 10% pace and are projecting overall growth of 10% for 2024 and 12% for 2025. Very optimistic growth numbers, which to date have been met. The third factor influencing position changes came from overall gross domestic product (GDP) growth. In the middle of 2023, there were still questions if the economy was in for a hard landing and possible recession after historic rate hikes. By the beginning of 2024 those fears were lessened, GDP growth did contract from post-Covid highs, but still hovered in the 1.5% to 2.5% range for most of the Annual Period. Those factors gave the portfolio management team the green light to be a bit more “risk-on” in the portfolio.
One of the key characteristics of the Tactical Income strategy is the ability of the portfolio management team to tactically adjust the risk characteristics in the portfolio to match the macro-outlook and corresponding market outlook. They achieve that by increasing, or decreasing, the allocation to equity securities, as well as increasing or decreasing the credit profile of the fixed income securities in the portfolio. In the Annual Period the overall exposure to equities increased from 40.6% to 45.2% and had a high near 48%. The sectors with the largest increases were REITs, financials and industrials, while the portfolio management team trimmed communications services, energy and technology. On the fixed income side is where the portfolio management team expressed an even more optimistic outlook by adding more credit risk to the portfolio. The portfolio management team had come into the Annual Period with 33% of the portfolio in US treasuries, mostly in short duration, which served very well through the Federal Reserve’s hiking cycle. By the end of the Annual Period, as the Federal Reserve pivoted to a future easing cycle, the portfolio management team lowered that treasury allocation to 8%, or a drop 25%. That was reallocated to several asset classes of fixed income. The portfolio management team added a mortgage-backed securities position of 8%, increased the allocation to corporate bonds by 6%, added to collateralized loan obligations by 3% and increased the preferred position by 2.6%. At the end of the Annual Period, the fund held 2.7% in cash, 52.1% in Fixed Income and 45.2% in Equities.
| Hilton Tactical Income Fund | PAGE 1 | TSR-AR-254939176 |
| |
Top Contributors |
| ↑ | JPMorgan Nasdaq Equity Premium Income ETF |
| ↑ | Communication Services Select Sector SPDR ETF |
| ↑ | Microsoft Corp |
| ↑ | Taiwan Semiconductor Manufacturing Co Ltd |
| ↑ | Eli Lilly and Company |
| |
Top Detractors |
| ↓ | Cisco Systems Inc |
| ↓ | Becton Dickinson and Company |
| ↓ | Nike, Inc. Class B |
| ↓ | Energy Select Sector SPDR Fund |
| ↓ | Zimmer Biomet Holdings, Inc. |
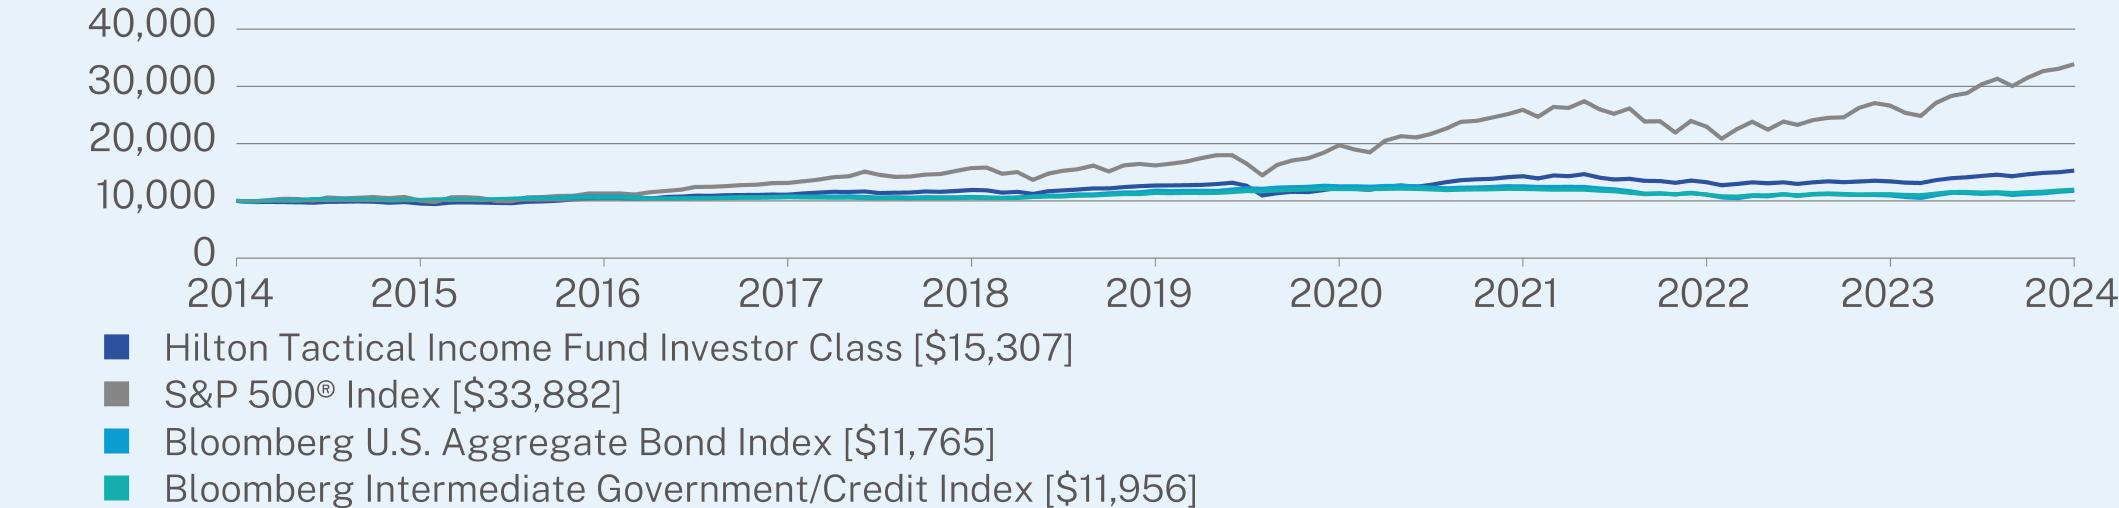
HOW DID THE FUND PERFORM FOR THE PAST 10 YEARS?*
The $10,000 chart reflects a hypothetical $10,000 investment in the Fund. The chart uses total return NAV performance and assumes reinvestment of dividends and capital gains. Fund expenses, including 12b-1 fees, management fees and other expenses were deducted.
CUMULATIVE PERFORMANCE (Initial Investment of $10,000)
ANNUAL AVERAGE TOTAL RETURN (%)
| | | |
| | 1 Year | 5 Year | 10 Year |
Hilton Tactical Income Fund Investor Class | 14.12 | 3.81 | 4.35 |
S&P 500® Index | 27.14 | 15.92 | 12.98 |
Bloomberg U.S. Aggregate Bond Index | 7.30 | -0.04 | 1.64 |
Bloomberg Intermediate Government/Credit Index | 7.11 | 0.96 | 1.80 |
Visit https://connect.rightprospectus.com/Direxion for more recent performance information.
| * | The Fund’s past performance is not a good predictor of how the Fund will perform in the future. The graph and table do not reflect the deduction of taxes that a shareholder would pay on Fund distributions or redemption of Fund shares. |
KEY FUND STATISTICS (as of August 31, 2024)
| |
Net Assets | $123,469,214 |
Number of Holdings | 105 |
Net Advisory Fee | $934,600 |
Portfolio Turnover | 83% |
Distribution Yield | 2.98% |
| Hilton Tactical Income Fund | PAGE 2 | TSR-AR-254939176 |
WHAT DID THE FUND INVEST IN? (as of August 31, 2024)
| |
Top 10 Holdings | (%) |
Janus Henderson AAA CLO ETF | 6.5% |
iShares MBS ETF | 5.5% |
JPMorgan Nasdaq Equity Premium Income ETF | 4.0% |
United States 10 Year Treasury Note, 4.125%, 2027-09-30 | 3.7% |
iShares Preferred & Income Securities ETF | 3.5% |
SPDR Blackstone Senior Loan ETF | 3.4% |
United States 10 Year Treasury Note, 5.500%, 2028-08-15 | 3.0% |
Simplify MBS ETF | 3.0% |
Alerian MLP ETF | 2.2% |
Microsoft Corp. | 2.2% |
| |
Security Type | (%) |
Common Stocks | 35.6% |
Investment Companies | 34.5% |
Corporate Bonds | 19.5% |
U.S. Government Obligations | 6.7% |
Preferred Stocks | 1.0% |
Cash & Other | 2.7% |
| |
Market Exposure | |
Fixed Income | 52.1% |
Equity | 45.2% |
Other | 2.7% |
Total (as % of net assets) | 100.0% |
For additional information about the Fund; including its prospectus, financial information, holdings and proxy information, scan the QR code or visit https://connect.rightprospectus.com/Direxion
The Fund is distributed by ALPS Distributors, Inc..
HOUSEHOLDING
To reduce Fund expenses, only one copy of most shareholder documents may be mailed to shareholders with multiple accounts at the same address (Householding). If you would prefer that your Rafferty Asset Management, LLC documents not be householded, please contact Rafferty Asset Management, LLC at 866-476-7523, or contact your financial intermediary. Your instructions will typically be effective within 30 days of receipt by Rafferty Asset Management, LLC or your financial intermediary.
| Hilton Tactical Income Fund | PAGE 3 | TSR-AR-254939176 |
100009547104371107811906126941225114326132641341315307100001004811309131451573016189197402589322986266503388210000101561076110814107011178912553125421109810965117651000010147105611064710539113951207312093111011116211956
Item 2. Code of Ethics.
The registrant has adopted a code of ethics that applies to the registrant’s principal executive officer and principal financial officer. The registrant has not made any substantive amendments to its code of ethics during the period covered by this report. The registrant has not granted any waivers from any provisions of the code of ethics during the period covered by this report.
A copy of the registrant’s Code of Ethics is filed herewith.
Item 3. Audit Committee Financial Expert.
The registrant’s board of trustees has determined that there is at least one audit committee financial expert serving on its audit committee. Kathleen Berkery is the “audit committee financial expert” and is considered to be “independent” as each term is defined in Item 3 of Form N-CSR.
Item 4. Principal Accountant Fees and Services.
The registrant has engaged its principal accountant to perform audit services, audit-related services, tax services and other services during the past two fiscal years. “Audit services” refer to performing an audit of the registrant’s annual financial statements or services that are normally provided by the accountant in connection with statutory and regulatory filings or engagements for those fiscal years. “Audit-related services” refer to the assurance and related services by the principal accountant that are reasonably related to the performance of the audit. “Tax services” refer to professional services rendered by the principal accountant for tax compliance, tax advice, and tax planning. The following table details the aggregate fees billed or expected to be billed for each of the last two fiscal years for audit fees, audit-related fees, tax fees and other fees by the principal accountant.
| | FYE 8/31/2024 | FYE 8/31/2023 |
| (a) Audit Fees | $227,400 | $223,600 |
| (b) Audit-Related Fees | $0 | $0 |
| (c) Tax Fees | $57,368 | $68,950 |
| (d) All Other Fees | $0 | $0 |
(e)(1) The audit committee has adopted pre-approval policies and procedures that require the audit committee to pre-approve all audit and non-audit services of the registrant, including services provided to any entity affiliated with the registrant.
(e)(2) The percentage of fees billed by Ernst & Young LLP to non-audit services pursuant to waiver of pre-approval requirement were as follows:
| | FYE 8/31/2024 | FYE 8/31/2023 |
| Audit-Related Fees | 0% | 0% |
| Tax Fees | 0% | 0% |
| All Other Fees | 0% | 0% |
(f) All of the principal accountant’s hours spent on auditing the registrant’s financial statements were attributed to work performed by full-time permanent employees of the principal accountant.
(g) The following table indicates the non-audit fees billed or expected to be billed by the registrant’s accountant for services to the registrant and to the registrant’s investment adviser (and any other controlling entity, etc.—not sub-adviser) for the last two years.
| Non-Audit Related Fees | FYE 8/31/2024 | FYE 8/31/2023 |
| Registrant | NONE | NONE |
| Registrant’s Investment Adviser | NONE | NONE |
(h) Because no non-audit services were rendered, the audit committee of the board of trustees did not consider whether the provision of non-audit services that were rendered to the registrant’s investment adviser is compatible with maintaining the principal accountant’s independence, and has concluded that the provision of such non-audit services by the accountant has not compromised the accountant’s independence.
(i) Not applicable.
(j) Not applicable.
Item 5. Audit Committee of Listed Registrants.
Not applicable to registrants who are not listed issuers (as defined in Rule 10A-3 under the Securities Exchange Act of 1934).
Item 6. Investments.
| (a) | Schedule of Investments is included as part of the report to shareholders filed under Item 7(a) of this Form. |
Item 7. Financial Statements and Financial Highlights for Open-End Investment Companies.
| (a) | The registrant’s Financial Statements are filed herewith. |
TABLE OF CONTENTS
Direxion Monthly High Yield Bull 1.2X Fund
Schedule of Investments
August 31, 2024
| | | | | | | |
| | | INVESTMENT COMPANIES — 79.9%
| | | |
298,661 | | | iShares iBoxx High Yield Corporate Bond ETF(a) | | | $23,695,764 |
244,720 | | | SPDR Bloomberg High Yield Bond ETF(a) | | | 23,693,790 |
| | | TOTAL INVESTMENT COMPANIES
(Cost $45,703,159) | | | 47,389,554 |
| | | SHORT TERM INVESTMENTS — 3.8%
| | | |
| | | Money Market Funds — 3.8%
| | | |
2,260,000 | | | Invesco Government & Agency Portfolio Institutional Shares, 5.18%(b)(c) | | | 2,260,000 |
| | | TOTAL SHORT TERM INVESTMENTS
(Cost $2,260,000) | | | 2,260,000 |
| | | TOTAL INVESTMENTS
(Cost $47,963,159) — 83.7% | | | $49,649,554 |
| | | Other Assets in Excess of Liabilities — 16.3% | | | 9,677,948 |
| | | TOTAL NET ASSETS — 100.0% | | | $59,327,502 |
| | | | | | | |
Percentages are stated as a percent of net assets.
The geographic location of all investments is United States unless otherwise indicated.
(a)
| Shareholders may obtain the financial statements of these investment companies at www.sec.gov. |
(b)
| Represents annualized seven-day yield at August 31, 2024. |
(c)
| All or a portion of these securities have been segregated as collateral for swap contracts. Total value of securities segregated amounted to $2,260,000. |
Long Total Return Swap Contracts
August 31, 2024
| | | | | | | | | | | | | | | | | | | |
Total return of PIMCO 0-5 Year High Yield Corporate Bond Index ETF | | | 5.8500% representing
1 month SOFR
rate + spread | | | UBS Securities
LLC | | | 10/9/2024 | | | 250,691 | | | $23,121,265 | | | $657,564 |
| | | | | | | | | | | | | | | | | | | |
The accompanying notes are an integral part of these financial statements.
TABLE OF CONTENTS
Direxion Monthly NASDAQ-100® Bull 1.25X Fund
Schedule of Investments
August 31, 2024
| | | | | | | |
| | | INVESTMENT COMPANIES — 43.0%
| | | |
11,573 | | | Invesco QQQ Trust Series 1(a) | | | $5,511,873 |
| | | TOTAL INVESTMENT COMPANIES
(Cost $4,923,943) | | | 5,511,873 |
| | | SHORT TERM INVESTMENTS — 8.4%
| |
| | | Money Market Funds — 8.4%
| | | |
664,081 | | | Goldman Sachs Financial Square Treasury Instruments Fund Institutional Shares,
5.12%(b)(c) | | | 664,081 |
410,000 | | | Invesco Government & Agency Portfolio Institutional Shares, 5.18%(b)(c) | | | 410,000 |
| | | TOTAL SHORT TERM INVESTMENTS
(Cost $1,074,081) | | | 1,074,081 |
| | | TOTAL INVESTMENTS
(Cost $5,998,024) — 51.4% | | | $6,585,954 |
| | | Other Assets in Excess of Liabilities — 48.6% | | | 6,245,163 |
| | | TOTAL NET ASSETS — 100.0% | | | $12,831,117 |
| | | | | | | |
Percentages are stated as a percent of net assets.
The geographic location of all investments is United States unless otherwise indicated.
(a)
| Shareholders may obtain the financial statements of these investment companies at www.sec.gov.
|
(b)
| Represents annualized seven-day yield at August 31, 2024.
|
(c)
| All or a portion of these securities have been segregated as collateral for swap contracts. Total value of securities segregated amounted to $1,074,081. |
Long Total Return Swap Contracts
August 31, 2024
| | | | | | | | | | | | | | | | | | | |
Total return of
NASDAQ-100® Index | | | 6.1000% representing
1 month SOFR
rate + spread | | | Bank of America
Merrill Lynch | | | 12/11/2024 | | | 385 | | | $7,436,571 | | | $ 84,972 |
Total return of
NASDAQ-100® Index | | | 6.1500% representing
1 month SOFR
rate + spread | | | UBS Securities
LLC | | | 12/17/2024 | | | 153 | | | 2,952,416 | | | 453 |
| | | | | | | | | | | | | | | $10,388,987 | | | $85,425 |
| | | | | | | | | | | | | | | | | | | |
.
The accompanying notes are an integral part of these financial statements.
TABLE OF CONTENTS
Direxion Monthly NASDAQ-100® Bull 1.75X Fund
Schedule of Investments
August 31, 2024
| | | | | | | |
| | | INVESTMENT COMPANIES — 56.6%
| | | |
529,737 | | | Invesco QQQ Trust Series 1(a) | | | $252,297,841 |
| | | TOTAL INVESTMENT COMPANIES
(Cost $163,072,788) | | | 252,297,841 |
| | | SHORT TERM INVESTMENTS — 15.9%
| | | |
| | | Money Market Funds — 15.9%
| | | |
66,371,830 | | | Goldman Sachs Financial Square Treasury Instruments Fund Institutional Shares,
5.12%(b)(c) | | | 66,371,830 |
4,510,000 | | | Invesco Government & Agency Portfolio Institutional Shares, 5.18%(b)(c) | | | 4,510,000 |
| | | TOTAL SHORT TERM INVESTMENTS
(Cost $70,881,830) | | | 70,881,830 |
| | | TOTAL INVESTMENTS
(Cost $233,954,618) — 72.5% | | | $ 323,179,671 |
| | | Other Assets in Excess of Liabilities — 27.5% | | | 122,766,451 |
| | | TOTAL NET ASSETS — 100.0% | | | $445,946,122 |
| | | | | | | |
Percentages are stated as a percent of net assets.
The geographic location of all investments is United States unless otherwise indicated.
(a)
| Shareholders may obtain the financial statements of these investment companies at www.sec.gov.
|
(b)
| Represents annualized seven-day yield at August 31, 2024.
|
(c)
| All or a portion of these securities have been segregated as collateral for swap contracts. Total value of securities segregated amounted to $70,881,830. |
Long Total Return Swap Contracts
August 31, 2024
| | | | | | | | | | | | | | | | | | | |
Total return of
NASDAQ-100® Index | | | 6.1000 % representing
1 month SOFR
rate + spread | | | Bank of America
Merrill Lynch | | | 12/11/2024 | | | 13,500 | | | $ 274,507,489 | | | $ (12,104,576) |
Total return of
NASDAQ-100® Index | | | 6.1500 % representing
1 month SOFR
rate + spread | | | UBS Securities
LLC | | | 12/17/2024 | | | 13,492 | | | 223,459,496 | | | 32,323,572 |
| | | | | | | | | | | | | | | $497,966,985 | | | $20,218,996 |
| | | | | | | | | | | | | | | | | | | |
The accompanying notes are an integral part of these financial statements.
TABLE OF CONTENTS
Direxion Monthly S&P 500® Bull 1.75X Fund
Schedule of Investments
August 31, 2024
| | | | | | | |
| | | INVESTMENT COMPANIES — 54.4%
| | | |
114,865 | | | iShares Core S&P 500 ETF(a) | | | $65,099,739 |
| | | TOTAL INVESTMENT COMPANIES
(Cost $46,873,946) | | | 65,099,739 |
| | | SHORT TERM INVESTMENTS — 18.0%
| | | |
| | | Money Market Funds — 18.0%
| | | |
16,040,000 | | | Goldman Sachs Financial Square Treasury Instruments Fund Institutional Shares, 5.12%(b)(c) | | | 16,040,000 |
5,530,000 | | | Invesco Government & Agency Portfolio Institutional Shares, 5.18%(b)(c) | | | 5,530,000 |
| | | TOTAL SHORT TERM INVESTMENTS
(Cost $21,570,000) | | | 21,570,000 |
| | | TOTAL INVESTMENTS
(Cost $68,443,946) — 72.4% | | | $86,669,739 |
| | | Other Assets in Excess of Liabilities — 27.6% | | | 33,073,360 |
| | | TOTAL NET ASSETS — 100.0% | | | $119,743,099 |
| | | | | | | |
Percentages are stated as a percent of net assets.
The geographic location of all investments is United States unless otherwise indicated.
(a)
| Shareholders may obtain the financial statements of these investment companies at www.sec.gov.
|
(b)
| Represents annualized seven-day yield at August 31, 2024.
|
(c)
| All or a portion of these securities have been segregated as collateral for swap contracts. Total value of securities segregated amounted to $21,570,000. |
Long Total Return Swap Contracts
August 31, 2024
| | | | | | | | | | | | | | | | | | | |
Total return of S&P 500® Index | | | 6.1000% representing
1 month SOFR
rate + spread | | | Bank of America
Merrill Lynch | | | 12/11/2024 | | | 14,337 | | | $75,748,106 | | | $ 4,354,760 |
Total return of S&P 500® Index | | | 6.1400% representing
1 month SOFR
rate + spread | | | UBS Securities
LLC | | | 12/17/2024 | | | 11,251 | | | 59,234,848 | | | 3,463,345 |
| | | | | | | | | | | | | | | $134,982,954 | | | $7,818,105 |
| | | | | | | | | | | | | | | | | | | |
The accompanying notes are an integral part of these financial statements.
TABLE OF CONTENTS
Direxion Monthly Small Cap Bull 1.75X Fund
Schedule of Investments
August 31, 2024
| | | | | | | |
| | | INVESTMENT COMPANIES — 55.5%
| | | |
37,156 | | | iShares Russell 2000 ETF(a) | | | $8,177,293 |
| | | TOTAL INVESTMENT COMPANIES
(Cost $7,014,112) | | | 8,177,293 |
| | | SHORT TERM INVESTMENTS — 30.0%
| | | |
| | | Money Market Funds — 30.0%
| | | |
1,451,941 | | | Goldman Sachs Financial Square Treasury Instruments Fund Institutional Shares,
5.12%(b)(c) | | | 1,451,941 |
2,970,000 | | | Invesco Government & Agency Portfolio Institutional Shares, 5.18%(b)(c) | | | 2,970,000 |
| | | TOTAL SHORT TERM INVESTMENTS
(Cost $4,421,941) | | | 4,421,941 |
| | | TOTAL INVESTMENTS
(Cost $11,436,053) — 85.5% | | | $ 12,599,234 |
| | | Other Assets in Excess of Liabilities — 14.5% | | | 2,133,430 |
| | | TOTAL NET ASSETS — 100.0% | | | $14,732,664 |
| | | | | | | |
Percentages are stated as a percent of net assets.
The geographic location of all investments is United States unless otherwise indicated.
(a)
| Shareholders may obtain the financial statements of these investment companies at www.sec.gov.
|
(b)
| Represents annualized seven-day yield at August 31, 2024.
|
(c)
| All or a portion of these securities have been segregated as collateral for swap contracts. Total value of securities segregated amounted to $4,421,941. |
Long Total Return Swap Contracts
August 31, 2024
| | | | | | | | | | | | | | | | | | | |
Total return of Russell 2000® Index | | | 5.9500 % representing
1 month SOFR
rate + spread | | | Bank of America
Merrill Lynch | | | 12/11/2024 | | | 3,408 | | | $6,481,487 | | | $891,433 |
Total return of Russell 2000® Index | | | 5.9500 % representing
1 month SOFR
rate + spread | | | UBS Securities
LLC | | | 12/17/2024 | | | 4,534 | | | 9,879,650 | | | 125,854 |
| | | | | | | | | | | | | | | $16,361,137 | | | $ 1,017,287 |
| | | | | | | | | | | | | | | | | | | |
The accompanying notes are an integral part of these financial statements.
TABLE OF CONTENTS
Direxion Monthly 7-10 Year Treasury Bull 1.75X Fund
Schedule of Investments
August 31, 2024
| | | | | | | |
| | | INVESTMENT COMPANIES — 64.5%
| | | |
83,755 | | | iShares 7-10 Year Treasury Bond ETF(a) | | | $8,130,098 |
| | | TOTAL INVESTMENT COMPANIES
(Cost $8,004,670) | | | 8,130,098 |
| | | SHORT TERM INVESTMENTS — 18.0%
| | | |
| | | Money Market Funds — 18.0%
| | | |
1,560,000 | | | Goldman Sachs Financial Square Treasury Instruments Fund Institutional Shares,
5.12%(b)(c) | | | 1,560,000 |
701,472 | | | Invesco Government & Agency Portfolio Institutional Shares, 5.18%(b)(c) | | | 701,472 |
| | | TOTAL SHORT TERM INVESTMENTS
(Cost $2,261,472) | | | 2,261,472 |
| | | TOTAL INVESTMENTS
(Cost $10,266,142) — 82.5% | | | $ 10,391,570 |
| | | Other Assets in Excess of Liabilities — 17.5% | | | 2,206,473 |
| | | TOTAL NET ASSETS — 100.0%
| | | $12,598,043 |
| | | | | | | |
Percentages are stated as a percent of net assets.
The geographic location of all investments is United States unless otherwise indicated.
(a)
| Shareholders may obtain the financial statements of these investment companies at www.sec.gov.
|
(b)
| Represents annualized seven-day yield at August 31, 2024.
|
(c)
| All or a portion of these securities have been segregated as collateral for swap contracts. Total value of securities segregated amounted to $2,261,472. |
Long Total Return Swap Contracts
August 31, 2024
| | | | | | | | | | | | | | | | | | | |
Total return of iShares
7-10 Year Treasury Bond
ETF | | | 5.9500% representing
1 month SOFR
rate + spread | | | Bank of America
Merrill Lynch | | | 12/11/2024 | | | 80,886 | | | $7,784,953 | | | $34,263 |
Total return of iShares
7-10 Year Treasury Bond
ETF | | | 6.1300% representing
1 month SOFR
rate + spread | | | UBS Securities
LLC | | | 12/17/2024 | | | 62,557 | | | 5,883,277 | | | 148,759 |
| | | | | | | | | | | | | | | $13,668,230 | | | $183,022 |
| | | | | | | | | | | | | | | | | | | |
The accompanying notes are an integral part of these financial statements.
TABLE OF CONTENTS
Direxion Monthly 7-10 Year Treasury Bear 1.75X Fund
Schedule of Investments
August 31, 2024
| | | | | | | |
| | | SHORT TERM INVESTMENTS — 48.3%
| | | |
| | | Money Market Funds — 48.3%
| | | |
1,360,000 | | | Goldman Sachs Financial Square Treasury Instruments Fund Institutional Shares,
5.12%(a)(b) | | | $1,360,000 |
180,000 | | | Invesco Government & Agency Portfolio Institutional Shares, 5.18%(a)(b) | | | 180,000 |
| | | TOTAL SHORT TERM INVESTMENTS
(Cost $1,540,000) | | | 1,540,000 |
| | | TOTAL INVESTMENTS
(Cost $1,540,000) — 48.3% | | | $1,540,000 |
| | | Other Assets in Excess of Liabilities — 51.7% | | | 1,647,559 |
| | | TOTAL NET ASSETS — 100.0% | | | $3,187,559 |
| | | | | | | |
Percentages are stated as a percent of net assets.
The geographic location of all investments is United States unless otherwise indicated.
(a)
| Represents annualized seven-day yield at August 31, 2024.
|
(b)
| All or a portion of these securities have been segregated as collateral for swap contracts. Total value of securities segregated amounted to $1,540,000. |
Short Total Return Swap Contracts
August 31, 2024
| | | | | | | | | | | | | | | | | | | |
5.7500 % representing 1 month SOFR rate + spread | | | Total return of iShares
7-10 Year Treasury
Bond ETF | | | Bank of America
Merrill Lynch | | | 12/11/2024 | | | 49,756 | | | $4,681,340 | | | $(105,975) |
5.4500 % representing 1 month SOFR rate + spread | | | Total return of iShares
7-10 Year Treasury
Bond ETF | | | UBS Securities
LLC | | | 12/17/2024 | | | 7,667 | | | 734,233 | | | (3,105) |
| | | | | | | | | | | | | | | $5,415,573 | | | $(109,080) |
| | | | | | | | | | | | | | | | | | | |
The accompanying notes are an integral part of these financial statements.
TABLE OF CONTENTS
Statements of Assets & Liabilities
August 31, 2024
| | | | | | | | | | |
Assets:
| | | | | | | | | |
Investments, at fair value (Note 2) | | | $49,649,554 | | | $6,585,954 | | | $323,179,671 |
Cash | | | 3,150,000 | | | — | | | 290,000 |
Cash equivalents | | | 164,263 | | | 2,859,701 | | | 102,143,762 |
Receivable for Fund shares sold | | | 9,363,359 | | | 3,329,734 | | | 148,571 |
Due from Custodian | | | 3,876,825 | | | — | | | — |
Unrealized appreciation on swap contracts | | | 657,564 | | | 85,425 | | | 32,323,572 |
Dividends and interest receivable | | | 42,327 | | | 16,244 | | | 765,567 |
Prepaid expenses and other assets | | | 49,941 | | | 38,168 | | | 39,658 |
Total assets | | | 66,953,833 | | | 12,915,226 | | | 458,890,801 |
Liabilities:
| | | | | | | | | |
Payable for Fund shares redeemed | | | 88,849 | | | 5,400 | | | 220,805 |
Payable for investments purchased | | | 7,458,819 | | | — | | | — |
Deposits from broker for swap contracts | | | — | | | 50,000 | | | — |
Unrealized depreciation on swap contracts | | | — | | | — | | | 12,104,576 |
Due to Adviser, net (Note 4) | | | 7,816 | | | 15,259 | | | 258,471 |
Accrued distribution expenses | | | 11,114 | | | 1,646 | | | 90,899 |
Accrued expenses and other liabilities | | | 59,733 | | | 11,804 | | | 269,928 |
Total liabilities | | | 7,626,331 | | | 84,109 | | | 12,944,679 |
Net Assets | | | $59,327,502 | | | $12,831,117 | | | $445,946,122 |
Net Assets Consist of:
| | | | | | | | | |
Capital stock | | | $91,825,890 | | | $13,989,292 | | | $342,525,255 |
Total distributable earnings (loss) | | | (32,498,388) | | | (1,158,175) | | | 103,420,867 |
Net assets | | | $59,327,502 | | | $12,831,117 | | | $445,946,122 |
Calculation of Net Asset Value Per Share:
| | | | | | | | | |
Net assets | | | $59,327,502 | | | $12,831,117 | | | $445,946,122 |
Shares outstanding (unlimited shares of beneficial interest authorized, no par value) | | | 3,388,798 | | | 171,072 | | | 5,397,621 |
Net asset value, redemption price and offering price per share | | | $17.5069 | | | $75.0042 | | | $82.6190 |
Cost of Investments | | | $47,963,159 | | | $5,998,024 | | | $233,954,618 |
| | | | | | | | | | |
The accompanying notes are an integral part of these financial statements.
TABLE OF CONTENTS
Statements of Assets & Liabilities
August 31, 2024 (Continued)
| | | | | | | |
Assets:
| | | | | | |
Investments, at fair value (Note 2) | | | $86,669,739 | | | $12,599,234 |
Cash equivalents | | | 28,962,001 | | | 1,864,371 |
Receivable for Fund shares sold | | | 6,530 | | | 54,834 |
Due from broker for swap contracts | | | — | | | 1,296 |
Unrealized appreciation on swap contracts | | | 7,818,105 | | | 1,017,287 |
Dividends and interest receivable | | | 217,150 | | | 25,984 |
Prepaid expenses and other assets | | | 21,305 | | | 13,331 |
Total assets | | | 123,694,830 | | | 15,576,337 |
Liabilities:
| | | | | | |
Payable for Fund shares redeemed | | | 184,507 | | | 5,040 |
Deposits from broker for swap contracts | | | 3,580,000 | | | 800,000 |
Due to Adviser, net (Note 4) | | | 71,079 | | | 20,137 |
Accrued distribution expenses | | | 24,218 | | | 2,881 |
Accrued expenses and other liabilities | | | 91,927 | | | 15,615 |
Total liabilities | | | 3,951,731 | | | 843,673 |
Net Assets | | | $119,743,099 | | | $14,732,664 |
Net Assets Consist of:
| | | | | | |
Capital stock | | | $83,658,115 | | | $20,971,373 |
Total distributable earnings (loss) | | | 36,084,984 | | | (6,238,709) |
Net assets | | | $119,743,099 | | | $14,732,664 |
Calculation of Net Asset Value Per Share:
| | | | | | |
Net assets | | | $119,743,099 | | | $14,732,664 |
Shares outstanding (unlimited shares of beneficial interest authorized, no par value) | | | 1,736,083 | | | 169,817 |
Net asset value, redemption price and offering price per share | | | $68.9731 | | | $86.7561 |
Cost of Investments | | | $68,443,946 | | | $11,436,053 |
| | | | | | | |
The accompanying notes are an integral part of these financial statements.
TABLE OF CONTENTS
Statements of Assets & Liabilities
August 31, 2024 (Continued)
| | | | | | | |
Assets:
| | | | | | |
Investments, at fair value (Note 2) | | | $10,391,570 | | | $1,540,000 |
Cash equivalents | | | 2,136,408 | | | 1,884,743 |
Receivable for Fund shares sold | | | 16,617 | | | 2,891 |
Unrealized appreciation on swap contracts | | | 183,022 | | | — |
Dividends and interest receivable | | | 26,212 | | | 14,697 |
Prepaid expenses and other assets | | | 11,105 | | | 15,066 |
Total assets | | | 12,764,934 | | | 3,457,397 |
Liabilities:
| | | | | | |
Payable for Fund shares redeemed | | | 17,231 | | | 101,114 |
Due to broker for swap contracts | | | — | | | 11,605 |
Deposits from broker for swap contracts | | | 110,000 | | | — |
Unrealized depreciation on swap contracts | | | — | | | 109,080 |
Due to Adviser, net (Note 4) | | | 16,358 | | | 30,027 |
Accrued distribution expenses | | | 2,868 | | | 675 |
Accrued expenses and other liabilities | | | 20,434 | | | 17,337 |
Total liabilities | | | 166,891 | | | 269,838 |
Net Assets | | | $ 12,598,043 | | | $3,187,559 |
Net Assets Consist of:
| | | | | | |
Capital stock | | | $18,990,114 | | | $21,409,255 |
Total distributable loss | | | (6,392,071) | | | (18,221,696) |
Net assets | | | $12,598,043 | | | $3,187,559 |
Calculation of Net Asset Value Per Share:
| | | | | | |
Net assets | | | $12,598,043 | | | $3,187,559 |
Shares outstanding (unlimited shares of beneficial interest authorized, no par value) | | | 502,207 | | | 116,551 |
Net asset value, redemption price and offering price per share | | | $25.0854 | | | $27.3490 |
Cost of Investments | | | $ 10,266,142 | | | $1,540,000 |
| | | | | | | |
The accompanying notes are an integral part of these financial statements.
TABLE OF CONTENTS
Statements of Operations
For the Year Ended August 31, 2024
| | | | | | | | | | |
Investment Income:
| | | | | | | | | |
Dividend income | | | $2,096,512 | | | $29,286 | | | $1,453,036 |
Interest income | | | 499,696 | | | 286,961 | | | 8,930,540 |
Total investment income | | | 2,596,208 | | | 316,247 | | | 10,383,576 |
Expenses:
|
Investment advisory fees (Note 4) | | | 338,703 | | | 75,452 | | | 3,049,715 |
Distribution expenses (Note 4) | | | 112,901 | | | 25,151 | | | 1,016,572 |
State registration fees | | | 74,016 | | | 46,622 | | | 53,805 |
Accounting fees | | | 48,328 | | | 10,785 | | | 435,150 |
Professional fees | | | 42,442 | | | 6,218 | | | 318,421 |
Management service fees (Note 4) | | | 11,076 | | | 2,468 | | | 99,750 |
Report to shareholders | | | 7,919 | | | 1,764 | | | 71,302 |
Licensing fees | | | 7,377 | | | 6,036 | | | 162,651 |
Insurance fees | | | 7,326 | | | 1,638 | | | 66,051 |
Administration fees | | | 4,992 | | | 1,137 | | | 45,278 |
Trustees’ fees | | | 4,895 | | | 737 | | | 45,418 |
Regulatory reporting fees | | | 3,817 | | | 854 | | | 34,196 |
Interest expense | | | — | | | 10,108 | | | 361,833 |
Other | | | 1,900 | | | 423 | | | 17,112 |
Total expenses | | | 665,692 | | | 189,393 | | | 5,777,254 |
Recoupment of expenses of Adviser (Note 4) | | | 537 | | | 10,161 | | | 79,716 |
Less: Reimbursement of expenses from Adviser (Note 4) | | | (56,563) | | | (73,753) | | | (27,107) |
Net expenses | | | 609,666 | | | 125,801 | | | 5,829,863 |
Net investment income | | | 1,986,542 | | | 190,446 | | | 4,553,713 |
Realized and unrealized gain (loss) on investments:
| | | | | | | | | |
Net realized gain (loss) on:
| | | | | | | | | |
Investments | | | (84,713) | | | 970,345 | | | (736,782) |
Swap contracts | | | (74,980) | | | 2,086,774 | | | 121,142,250 |
| | | (159,693) | | | 3,057,119 | | | 120,405,468 |
Change in net unrealized appreciation (depreciation) on:
| | | | | | | | | |
Investments | | | 1,275,752 | | | 161,088 | | | 47,438,098 |
Swap contracts | | | 479,831 | | | (339,923) | | | (34,938,361) |
| | | 1,755,583 | | | (178,835) | | | 12,499,737 |
Net realized and unrealized gain | | | 1,595,890 | | | 2,878,284 | | | 132,905,205 |
Net increase in net assets resulting from operations | | | $ 3,582,432 | | | $3,068,730 | | | $137,458,918 |
| | | | | | | | | | |
The accompanying notes are an integral part of these financial statements.
TABLE OF CONTENTS
Statements of Operations
For the Year Ended August 31, 2024 (Continued)
| | | | | | | |
Investment Income:
| | | | | | |
Dividend income | | | $726,108 | | | $80,953 |
Interest income | | | 2,694,518 | | | 293,574 |
Total investment income | | | 3,420,626 | | | 374,527 |
Expenses:
| | | | | | |
Investment advisory fees (Note 4) | | | 795,565 | | | 87,982 |
Distribution expenses (Note 4) | | | 265,189 | | | 29,327 |
Interest expense | | | 194,234 | | | 18,129 |
Accounting fees | | | 113,515 | | | 12,563 |
Professional fees | | | 85,178 | | | 8,117 |
State registration fees | | | 30,888 | | | 20,438 |
Management service fees (Note 4) | | | 26,018 | | | 2,878 |
Licensing fees | | | 21,215 | | | 8,211 |
Report to shareholders | | | 18,600 | | | 2,057 |
Insurance fees | | | 17,221 | | | 1,918 |
Trustees’ fees | | | 13,480 | | | 1,214 |
Administration fees | | | 11,782 | | | 1,322 |
Regulatory reporting fees | | | 8,921 | | | 992 |
Other | | | 4,464 | | | 494 |
Total expenses | | | 1,606,270 | | | 195,642 |
Recoupment of expenses of Adviser (Note 4) | | | 31,166 | | | 11,213 |
Less: Reimbursement of expenses from Adviser (Note 4) | | | (11,184) | | | (30,359) |
Net expenses | | | 1,626,252 | | | 176,496 |
Net investment income | | | 1,794,374 | | | 198,031 |
Realized and unrealized gain (loss) on investments:
| | | | | | |
Net realized gain (loss) on:
| | | | | | |
Investments | | | — | | | (100,941) |
Swap contracts | | | 16,443,614 | | | 257,594 |
| | | 16,443,614 | | | 156,653 |
Change in net unrealized appreciation on:
| | | | | | |
Investments | | | 12,436,892 | | | 827,178 |
Swap contracts | | | 6,116,669 | | | 783,886 |
| | | 18,553,561 | | | 1,611,064 |
Net realized and unrealized gain | | | 34,997,175 | | | 1,767,717 |
Net increase in net assets resulting from operations | | | $ 36,791,549 | | | $1,965,748 |
| | | | | | | |
The accompanying notes are an integral part of these financial statements.
TABLE OF CONTENTS
Statements of Operations
For the Year Ended August 31, 2024 (Continued)
| | | | | | | |
Investment Income:
| | | | | | |
Dividend income | | | $158,046 | | | $— |
Interest income | | | 247,395 | | | 264,020 |
Total investment income | | | 405,441 | | | 264,020 |
Expenses:
| | | | | | |
Investment advisory fees (Note 4) | | | 72,728 | | | 39,042 |
State registration fees | | | 27,195 | | | 17,254 |
Distribution expenses (Note 4) | | | 24,243 | | | 13,014 |
Accounting fees | | | 10,377 | | | 5,571 |
Licensing fees | | | 10,000 | | | 10,000 |
Professional fees | | | 5,074 | | | 2,853 |
Interest expense | | | 4,069 | | | 4,459 |
Management service fees (Note 4) | | | 2,380 | | | 1,278 |
Report to shareholders | | | 1,700 | | | 913 |
Insurance fees | | | 1,579 | | | 850 |
Administration fees | | | 1,099 | | | 592 |
Regulatory reporting fees | | | 820 | | | 443 |
Trustees’ fees | | | 263 | | | 665 |
Other | | | 408 | | | 219 |
Excise taxes | | | — | | | 5,954 |
Total expenses | | | 161,935 | | | 103,107 |
Recoupment of expenses of Adviser (Note 4) | | | 7,473 | | | 27,935 |
Less: Reimbursement of expenses from Adviser (Note 4) | | | (34,429) | | | (50,354) |
Net expenses | | | 134,979 | | | 80,688 |
Net investment income | | | 270,462 | | | 183,332 |
Realized and unrealized gain (loss) on investments:
| | | | | | |
Net realized gain on:
| | | | | | |
Investments | | | 216,317 | | | — |
Swap contracts | | | 372,643 | | | 2,004,720 |
| | | 588,960 | | | 2,004,720 |
Change in net unrealized appreciation (depreciation) on:
| | | | | | |
Investments | | | 156,120 | | | — |
Swap contracts | | | 259,086 | | | (993,909) |
| | | 415,206 | | | (993,909) |
Net realized and unrealized gain | | | 1,004,166 | | | 1,010,811 |
Net increase in net assets resulting from operations | | | $ 1,274,628 | | | $1,194,143 |
| | | | | | | |
The accompanying notes are an integral part of these financial statements.
TABLE OF CONTENTS
Statements of Changes in Net Assets
| | | | | | | |
Increase (Decrease) in net assets from:
| | | | | | | | | |
Operations:
| | | | | | | | | | | | |
Net investment income | | | $1,986,542 | | | $1,687,487 | | | $190,446 | | | $63,576 |
Net realized gain (loss) | | | (159,693) | | | (6,215,178) | | | 3,057,119 | | | 158,131 |
Change in net unrealized appreciation (depreciation) | | | 1,755,583 | | | 372,646 | | | (178,835) | | | 1,653,222 |
Net increase (decrease) in net assets resulting from operations | | | 3,582,432 | | | (4,155,045) | | | 3,068,730 | | | 1,874,929 |
Distributions to shareholders:
| | | | | | | | | | | | |
Net distributions to shareholders | | | (1,988,496) | | | (1,685,533) | | | (27,963) | | | — |
Return of capital | | | (10,456) | | | — | | | — | | | — |
Total distributions | | | (1,998,952) | | | (1,685,533) | | | (27,963) | | | — |
Capital share transactions:
| | | | | | | | | | | | |
Net increase (decrease) in net assets resulting from net change capital share
transactions(a) | | | 34,686,689 | | | 9,895,540 | | | (4,202,315) | | | 4,836,403 |
Total increase (decrease) in net assets | | | 36,270,169 | | | 4,054,962 | | | (1,161,548) | | | 6,711,332 |
Net assets:
| | | | | | | | | | | | |
Beginning of year | | | 23,057,333 | | | 19,002,371 | | | 13,992,665 | | | 7,281,333 |
End of year | | | $ 59,327,502 | | | $23,057,333 | | | $12,831,117 | | | $13,992,665 |
| | | | | | | | | | | | | |
(a)
| Summary of capital share transactions is as follows: |
| | | | |
Shares sold | | | 28,277,483 | | | $477,777,941 | | | 60,123,271 | | | $1,000,428,146 |
Shares issued in reinvestment of distributions | | | 118,046 | | | 1,996,814 | | | 91,144 | | | 1,517,787 |
Shares redeemed | | | (26,404,358) | | | (445,088,066) | | | (59,950,832) | | | (992,050,393) |
Net increase | | | 1,991,171 | | | $34,686,689 | | | 263,583 | | | $9,895,540 |
| | | | | | | | | | | | | |
| | | | |
Shares sold | | | 2,355,415 | | | $152,975,024 | | | 1,307,169 | | | $68,241,341 |
Shares issued in reinvestment of distributions | | | 444 | | | 27,460 | | | — | | | — |
Shares redeemed | | | (2,427,343) | | | (157,204,799) | | | (1,229,166) | | | (63,404,938) |
Net increase (decrease) | | | (71,484) | | | $(4,202,315) | | | 78,003 | | | $4,836,403 |
| | | | | | | | | | | | | |
The accompanying notes are an integral part of these financial statements.
TABLE OF CONTENTS
Statements of Changes in Net Assets(Continued)
| | | | | | | |
Increase (Decrease) in net assets from:
| | | | | | | | | |
Operations:
| | | | | | | | | | | | |
Net investment income | | | $4,553,713 | | | $3,665,616 | | | $1,794,374 | | | $1,196,374 |
Net realized gain (loss) | | | 120,405,468 | | | (42,597,095) | | | 16,443,614 | | | (805,864) |
Change in net unrealized appreciation | | | 12,499,737 | | | 136,917,443 | | | 18,553,561 | | | 12,552,634 |
Net increase in net assets resulting from operations | | | 137,458,918 | | | 97,985,964 | | | 36,791,549 | | | 12,943,144 |
Distributions to shareholders:
| | | | | | | | | | | | |
Net distributions to shareholders | | | (1,780,224) | | | — | | | (660,881) | | | — |
Total distributions | | | (1,780,224) | | | — | | | (660,881) | | | — |
Capital share transactions:
| | | | | | | | | | | | |
Net increase (decrease) in net assets resulting from net change capital share
transactions(a) | | | (50,433,734) | | | (10,708,097) | | | 424,011 | | | (15,626,460) |
Total increase in net assets | | | 85,244,960 | | | 87,277,867 | | | 36,554,679 | | | (2,683,316) |
Net assets:
| | | | | | | | | | | | |
Beginning of year | | | 360,701,162 | | | 273,423,295 | | | 83,188,420 | | | 85,871,736 |
End of year | | | $ 445,946,122 | | | $360,701,162 | | | $119,743,099 | | | $83,188,420 |
| | | | | | | | | | | | | |
(a)
| Summary of capital share transactions is as follows: |
| | | | |
Shares sold | | | 3,312,227 | | | $222,602,612 | | | 3,644,115 | | | $169,708,594 |
Shares issued in reinvestment of distributions | | | 27,394 | | | 1,755,621 | | | — | | | — |
Shares redeemed | | | (4,057,707) | | | (274,791,967) | | | (3,991,918) | | | (180,416,691) |
Net decrease | | | (718,086) | | | $(50,433,734) | | | (347,803) | | | $(10,708,097) |
| | | | | | | | | | | | | |
| | | | |
Shares sold | | | 1,869,628 | | | $103,338,165 | | | 2,599,212 | | | $109,860,274 |
Shares issued in reinvestment of distributions | | | 12,472 | | | 653,887 | | | — | | | — |
Shares redeemed | | | (1,836,234) | | | (103,568,041) | | | (3,004,642) | | | (125,486,734) |
Net increase (decrease) | | | 45,866 | | | $424,011 | | | (405,430) | | | $(15,626,460) |
| | | | | | | | | | | | | |
The accompanying notes are an integral part of these financial statements.
TABLE OF CONTENTS
Statements of Changes in Net Assets(Continued)
| | | | | | | |
Increase (Decrease) in net assets from:
| | | | | | | | | |
Operations:
| | | | | | | | | | | | |
Net investment income | | | $198,031 | | | $147,156 | | | $270,462 | | | $241,230 |
Net realized gain (loss) | | | 156,653 | | | (1,879,311) | | | 588,960 | | | (1,564,973) |
Change in net unrealized appreciation | | | 1,611,064 | | | 1,230,083 | | | 415,206 | | | 9,631 |
Net increase (decrease) in net assets resulting from operations | | | 1,965,748 | | | (502,072) | | | 1,274,628 | | | (1,314,112) |
Distributions to shareholders:
| | | | | | | | | | | | |
Net distributions to shareholders | | | (83,098) | | | — | | | (197,048) | | | — |
Total distributions | | | (83,098) | | | — | | | (197,048) | | | — |
Capital share transactions:
| | | | | | | | | | | | |
Net increase (decrease) in net assets resulting from net change capital share
transactions(a) | | | 1,833,126 | | | 941,999 | | | 7,987,183 | | | (298,991) |
Total increase (decrease) in net assets | | | 3,715,776 | | | 439,927 | | | 9,064,763 | | | (1,613,103) |
Net assets:
| | | | | | | | | | | | |
Beginning of year | | | 11,016,888 | | | 10,576,961 | | | 3,533,280 | | | 5,146,383 |
End of year | | | $ 14,732,664 | | | $11,016,888 | | | $12,598,043 | | | $3,533,280 |
| | | | | | | | | | | | | |
(a)
| Summary of capital share transactions is as follows: |
| | | | |
Shares sold | | | 397,835 | | | $30,115,593 | | | 511,153 | | | $36,072,300 |
Shares issued in reinvestment of distributions | | | 1,064 | | | 81,290 | | | — | | | — |
Shares redeemed | | | (383,106) | | | (28,363,757) | | | (504,227) | | | (35,130,301) |
Net increase | | | 15,793 | | | $1,833,126 | | | 6,926 | | | $941,999 |
| | | | | | | | | | | | | |
| | | | |
Shares sold | | | 2,545,623 | | | $60,606,664 | | | 2,049,343 | | | $54,161,102 |
Shares issued in reinvestment of distributions | | | 7,889 | | | 196,150 | | | — | | | — |
Shares redeemed | | | (2,195,024) | | | (52,815,631) | | | (2,090,208) | | | (54,460,093) |
Net increase (decrease) | | | 358,488 | | | $7,987,183 | | | (40,865) | | | $(298,991) |
| | | | | | | | | | | | | |
The accompanying notes are an integral part of these financial statements.
TABLE OF CONTENTS
Statements of Changes in Net Assets(Continued)
| | | | |
Increase (Decrease) in net assets from:
| | | | | | |
Operations:
| | | | | | |
Net investment income | | | $183,332 | | | $176,280 |
Net realized gain | | | 2,004,720 | | | 13,771 |
Change in net unrealized appreciation (depreciation) | | | (993,909) | | | 862,533 |
Net increase in net assets resulting from operations | | | 1,194,143 | | | 1,052,584 |
Distributions to shareholders:
| | | | | | |
Net distributions to shareholders | | | (238,839) | | | — |
Total distributions | | | (238,839) | | | — |
Capital share transactions:
| | | | | | |
Net increase (decrease) in net assets resulting from net change capital share transactions(a) | | | (12,918,300) | | | 11,447,563 |
Total increase (decrease) in net assets | | | (11,962,996) | | | 12,500,147 |
Net assets:
| | | | | | |
Beginning of year | | | 15,150,555 | | | 2,650,408 |
End of year | | | $3,187,559 | | | $15,150,555 |
| | | | | | | |
(a)
| Summary of capital share transactions is as follows: |
| | | | |
Shares sold | | | 392,109 | | | $11,531,459 | | | 768,876 | | | $22,628,693 |
Shares issued in reinvestment of distributions | | | 7,997 | | | 235,949 | | | — | | | — |
Shares redeemed | | | (767,328) | | | (24,685,708) | | | (382,291) | | | (11,181,130) |
Net increase (decrease) | | | (367,222) | | | $(12,918,300) | | | 386,585 | | | $11,447,563 |
| | | | | | | | | | | | | |
The accompanying notes are an integral part of these financial statements.
TABLE OF CONTENTS
Financial Highlights
August 31, 2024
| | | | | | | | | | | | | | | | | | | | | | | | | | | | | | | | | | | | | | | | | | | |
Direxion Monthly High Yield Bull 1.2X Fund
|
Year ended August 31, 2024 | | | $16.4975 | | | $0.7467 | | | $0.7467 | | | $1.0064 | | | $1.7531 | | | (0.7398) | | | — | | | (0.0039) | | | $(0.7437) | | | $17.5069 | | | 10.90% | | | $59,328 | | | 1.47% | | | 1.35% | | | 4.40% | | | 1.47% | | | 1.35% | | | 4.40% | | | 869% |
Year ended August 31, 2023 | | | 16.7563 | | | 0.9404 | | | 0.9406 | | | 0.0116 | | | 0.9520 | | | (1.2108) | | | — | | | — | | | (1.2108) | | | 16.4975 | | | 5.94% | | | 23,057 | | | 1.49% | | | 1.35% | | | 5.65% | | | 1.49% | | | 1.35% | | | 5.65% | | | 2,720% |
Year ended August 31, 2022 | | | 21.5738 | | | 0.5016 | | | 0.5022 | | | (3.4969) | | | (2.9953) | | | (1.7801) | | | — | | | (0.0421) | | | (1.8222) | | | 16.7563 | | | -14.45% | | | 19,002 | | | 1.37% | | | 1.35% | | | 2.53% | | | 1.37% | | | 1.35% | | | 2.53% | | | 2,768% |
Year ended August 31, 2021 | | | 20.3448 | | | 0.4224 | | | 0.4224 | | | 1.2803 | | | 1.7027 | | | (0.4611) | | | — | | | (0.0126) | | | (0.4737) | | | 21.5738 | | | 8.46% | | | 91,324 | | | 1.33% | | | 1.35% | | | 2.00% | | | 1.33% | | | 1.35% | | | 2.00% | | | 1,181% |
Year ended August 31, 2020 | | | 22.0134 | | | 0.6235 | | | 0.6237 | | | (0.8951) | | | (0.2716) | | | (1.3765) | | | — | | | (0.0205) | | | (1.3970) | | | 20.3448 | | | -0.66% | | | 74,100 | | | 1.38% | | | 1.35% | | | 2.93% | | | 1.38% | | | 1.35% | | | 2.93% | | | 1,713% |
Direxion Monthly NASDAQ-100 Bull 1.25X Fund
|
Year ended August 31, 2024 | | | 57.6884 | | | 1.2256 | | | 1.2907 | | | 16.2254 | | | 17.4510 | | | (0.1352) | | | — | | | — | | | (0.1352) | | | 75.0042 | | | 30.30% | | | 12,831 | | | 1.88% | | | 1.25% | | | 1.89% | | | 1.78% | | | 1.15% | | | 1.99% | | | 1,132% |
Year ended August 31, 2023 | | | 44.2492 | | | 0.7267 | | | 0.7471 | | | 12.7125 | | | 13.4392 | | | — | | | — | | | — | | | — | | | 57.6884 | | | 30.37% | | | 13,993 | | | 2.30% | | | 1.19% | | | 1.47% | | | 2.26% | | | 1.15% | | | 1.51% | | | 1,037% |
Year ended August 31, 2022 | | | 65.5581 | | | (0.6681) | | | (0.5530) | | | (15.8640) | | | (16.5321) | | | — | | | (4.7768) | | | — | | | (4.7768) | | | 44.2492 | | | -27.50% | | | 7,281 | | | 1.77% | | | 1.35% | | | (1.15)% | | | 1.57% | | | 1.15% | | | (0.95)% | | | 0% |
Year ended August 31, 2021 | | | 52.5948 | | | (0.6135) | | | (0.6118) | | | 17.6713 | | | 17.0578 | | | — | | | (4.0945) | | | — | | | (4.0945) | | | 65.5581 | | | 34.93% | | | 20,940 | | | 1.50% | | | 1.15% | | | (1.13)% | | | 1.50% | | | 1.15% | | | (1.13)% | | | 0% |
Year ended August 31, 2020 | | | 32.4749 | | | (0.1129) | | | (0.0921) | | | 22.5010 | | | 22.3881 | | | (2.2682) | | | — | | | — | | | (2.2682) | | | 52.5948 | | | 72.08% | | | 14,181 | | | 1.67% | | | 1.20% | | | (0.29)% | | | 1.62% | | | 1.15% | | | (0.24)% | | | 6,825% |
Direxion Monthly NASDAQ-100 Bull 1.75X Fund
|
Year ended August 31, 2024 | | | 58.9795 | | | 0.7786 | | | 0.8405 | | | 23.1612 | | | 23.9398 | | | (0.3003) | | | — | | | — | | | (0.3003) | | | 82.6190 | | | 40.74% | | | 445,946 | | | 1.42% | | | 1.44% | | | 1.12% | | | 1.33% | | | 1.35% | | | 1.21% | | | 12% |
Year ended August 31, 2023 | | | 42.3026 | | | 0.5854 | | | 0.6099 | | | 16.0915 | | | 16.6769 | | | — | | | — | | | — | | | — | | | 58.9795 | | | 39.42% | | | 360,701 | | | 1.43% | | | 1.41% | | | 1.32% | | | 1.37% | | | 1.35% | | | 1.38% | | | 0% |
Year ended August 31, 2022 | | | 81.9788 | | | (0.6215) | | | (0.6161) | | | (29.7191) | | | (30.3406) | | | — | | | (9.3356) | | | — | | | (9.3356) | | | 42.3026 | | | -42.34% | | | 273,423 | | | 1.33% | | | 1.34% | | | (0.99)% | | | 1.32% | | | 1.33% | | | (0.98)% | | | 0% |
Year ended August 31, 2021 | | | 57.3092 | | | (0.7967) | | | (0.7894) | | | 31.5245 | | | 30.7278 | | | — | | | (6.0582) | | | — | | | (6.0582) | | | 81.9788 | | | 59.47% | | | 595,324 | | | 1.33% | | | 1.36% | | | (1.29)% | | | 1.32% | | | 1.35% | | | (1.28)% | | | 0% |
Year ended August 31, 2020 | | | 24.9700 | | | (0.2361) | | | (0.2205) | | | 32.7351 | | | 32.4990 | | | (0.1598) | | | — | | | — | | | (0.1598) | | | 57.3092 | | | 130.64% | | | 427,572 | | | 1.42% | | | 1.40% | | | (0.71)% | | | 1.37% | | | 1.35% | | | (0.66)% | | | 124% |
Direxion Monthly S&P 500 Bull 1.75X Fund
|
Year ended August 31, 2024 | | | 49.2176 | | | 0.9614 | | | 1.0654 | | | 19.1414 | | | 20.1028 | | | (0.3473) | | | — | | | — | | | (0.3473) | | | 68.9731 | | | 41.07% | | | 119,743 | | | 1.51% | | | 1.53% | | | 1.69% | | | 1.33% | | | 1.35% | | | 1.87% | | | 0% |
Year ended August 31, 2023 | | | 40.9762 | | | 0.6496 | | | 0.6780 | | | 7.5918 | | | 8.2414 | | | — | | | — | | | — | | | — | | | 49.2176 | | | 20.11% | | | 83,188 | | | 1.51% | | | 1.42% | | | 1.54% | | | 1.44% | | | 1.35% | | | 1.61% | | | 0% |
Year ended August 31, 2022 | | | 59.6732 | | | (0.5001) | | | (0.4943) | | | (13.3945) | | | (13.8946) | | | — | | | (4.8024) | | | — | | | (4.8024) | | | 40.9762 | | | -25.79% | | | 85,872 | | | 1.36% | | | 1.36% | | | (0.96)% | | | 1.35% | | | 1.35% | | | (0.95)% | | | 0% |
Year ended August 31, 2021 | | | 37.0026 | | | (0.5495) | | | (0.5476) | | | 23.9343 | | | 23.3848 | | | — | | | (0.7142) | | | — | | | (0.7142) | | | 59.6732 | | | 64.19% | | | 124,964 | | | 1.33% | | | 1.35% | | | (1.22)% | | | 1.33% | | | 1.35% | | | (1.22)% | | | 0% |
Year ended August 31, 2020 | | | 27.4400 | | | (0.0608) | | | (0.0555) | | | 9.9095 | | | 9.8487 | | | (0.2861) | | | — | | | — | | | (0.2861) | | | 37.0026 | | | 36.00% | | | 93,419 | | | 1.42% | | | 1.37% | | | (0.21)% | | | 1.40% | | | 1.35% | | | (0.19)% | | | 221% |
Direxion Monthly Small Cap Bull 1.75X Fund
|
Year ended August 31, 2024 | | | 71.5271 | | | 1.2453 | | | 1.3593 | | | 14.5452 | | | 15.7905 | | | (0.5615) | | | — | | | — | | | (0.5615) | | | 86.7561 | | | 22.18% | | | 14,733 | | | 1.66% | | | 1.50% | | | 1.69% | | | 1.51% | | | 1.35% | | | 1.84% | | | 35% |
Year ended August 31, 2023 | | | 71.9042 | | | 1.0664 | | | 1.1045 | | | (1.4435) | | | (0.3771) | | | — | | | — | | | — | | | — | | | 71.5271 | | | -0.52% | | | 11,017 | | | 1.78% | | | 1.41% | | | 1.54% | | | 1.72% | | | 1.35% | | | 1.60% | | | 24% |
Year ended August 31, 2022 | | | 115.4318 | | | (0.9595) | | | (0.9553) | | | (41.6395) | | | (42.5990) | | | — | | | (0.9286) | | | — | | | (0.9286) | | | 71.9042 | | | -37.17% | | | 10,577 | | | 1.60% | | | 1.35% | | | (1.01)% | | | 1.60% | | | 1.35% | | | (1.01)% | | | 33% |
Year ended August 31, 2021 | | | 56.9002 | | | (1.2566) | | | (1.2558) | | | 59.7882 | | | 58.5316 | | | — | | | — | | | — | | | — | | | 115.4318 | | | 102.87% | | | 23,514 | | | 1.54% | | | 1.35% | | | (1.28)% | | | 1.54% | | | 1.35% | | | (1.28)% | | | 0% |
Year ended August 31, 2020 | | | 59.3800 | | | (0.1257) | | | (0.1100) | | | (1.7271) | | | (1.8528) | | | (0.6270) | | | — | | | — | | | (0.6270) | | | 56.9002 | | | -3.35% | | | 13,962 | | | 1.66% | | | 1.38% | | | (0.22)% | | | 1.63% | | | 1.35% | | | (0.19)% | | | 172% |
Direxion Monthly 7-10 Year Treasury Bull 1.75X Fund
|
Year ended August 31, 2024 | | | 24.5846 | | | 0.6733 | | | 0.6835 | | | 0.0842 | | | 0.7575 | | | (0.2567) | | | — | | | — | | | (0.2567) | | | 25.0854 | | | 3.09% | | | 12,598 | | | 1.67% | | | 1.39% | | | 2.79% | | | 1.63% | | | 1.35% | | | 2.83% | | | 399% |
Year ended August 31, 2023 | | | 27.8810 | | | 0.5610 | | | 0.5662 | | | (3.8574) | | | (3.2964) | | | — | | | — | | | — | | | — | | | 24.5846 | | | -11.82% | | | 3,533 | | | 1.73% | | | 1.37% | | | 2.13% | | | 1.71% | | | 1.35% | | | 2.15% | | | 351% |
Year ended August 31, 2022 | | | 37.5442 | | | (0.2642) | | | (0.2636) | | | (9.3990) | | | (9.6632) | | | — | | | — | | | — | | | — | | | 27.8810 | | | -25.74% | | | 5,146 | | | 1.66% | | | 1.35% | | | (0.77)% | | | 1.66% | | | 1.35% | | | (0.77)% | | | 144% |
Year ended August 31, 2021 | | | 42.1433 | | | (0.4026) | | | (0.4024) | | | (2.9204) | | | (3.3230) | | | — | | | (1.2761) | | | — | | | (1.2761) | | | 37.5442 | | | -8.06% | | | 25,364 | | | 1.44% | | | 1.35% | | | (1.04)% | | | 1.44% | | | 1.35% | | | (1.04)% | | | 0% |
Year ended August 31, 2020 | | | 40.7800 | | | (0.2072) | | | (0.2050) | | | 4.7203 | | | 4.5131 | | | (0.4677) | | | (2.6821) | | | — | | | (3.1498) | | | 42.1433 | | | 12.49% | | | 49,645 | | | 1.49% | | | 1.36% | | | (0.51)% | | | 1.48% | | | 1.35% | | | (0.50)% | | | 74% |
| | | | | | | | | | | | | | | | | | | | | | | | | | | | | | | | | | | | | | | | | | | | | | | | | | | | | | | | | | |
The accompanying notes are an integral part of these financial statements.
TABLE OF CONTENTS
Financial Highlights
August 31, 2024(Continued)
| | | | | | | | | | | | | | | | | | | | | | | | | | | | | | | | | | | | | | | | | | | |
Direxion Monthly 7-10 Year Treasury Bear 1.75X Fund
|
Year ended August 31, 2024 | | | $31.3175 | | | $1.0803 | | | $1.1416 | | | $(0.9376) | | | $0.1427 | | | (4.1112) | | | — | | | — | | | $(4.1112) | | | $27.3490 | | | 0.02% | | | $3,188 | | | 1.98% | | | 1.55% | | | 3.52% | | | 1.78% | | | 1.35% | | | 3.72% | | | 0% |
Year ended August 31, 2023 | | | 27.2709 | | | 0.8986 | | | 0.9183 | | | 3.1480 | | | 4.0466 | | | — | | | — | | | — | | | — | | | 31.3175 | | | 14.84% | | | 15,151 | | | 2.16% | | | 1.42% | | | 2.99% | | | 2.09% | | | 1.35% | | | 3.06% | | | 0% |
Year ended August 31, 2022 | | | 21.4288 | | | (0.2380) | | | (0.2328) | | | 6.0801 | | | 5.8421 | | | — | | | — | | | — | | | — | | | 27.2709 | | | 27.26% | | | 2,650 | | | 2.28% | | | 1.37% | | | (0.99)% | | | 2.26% | | | 1.35% | | | (0.97)% | | | 0% |
Year ended August 31, 2021 | | | 20.6527 | | | (0.2934) | | | (0.2934) | | | 1.0695 | | | 0.7761 | | | — | | | — | | | — | | | — | | | 21.4288 | | | 3.76% | | | 9,273 | | | 2.57% | | | 1.35% | | | (1.34)% | | | 2.57% | | | 1.35% | | | (1.34)% | | | 0% |
Year ended August 31, 2020 | | | 24.3400 | | | (0.0606) | | | (0.0606) | | | (3.3051) | | | (3.3657) | | | (0.3216) | | | — | | | — | | | (0.3216) | | | 20.6527 | | | -14.07% | | | 1,337 | | | 4.34% | | | 1.35% | | | (0.26)% | | | 4.34% | | | 1.35% | | | (0.26)% | | | 0% |
| | | | | | | | | | | | | | | | | | | | | | | | | | | | | | | | | | | | | | | | | | | | | | | | | | | | | | | | | | |
1
| Net investment income (loss) per share represents net investment income (loss) divided by the daily average shares of beneficial interest outstanding throughout each year. |
2
| Includes interest expense and extraordinary expense which is comprised of excise tax expense. |
3
| Excludes interest expense and extraordinary expense which is comprised of excise tax expense. |
4
| Due to the timing of sales and redemptions of capital shares, the net realized and unrealized gain (loss) per share will not equal the Fund's changes in net realized and unrealized gain (loss) on investments, futures and swaps for the period. |
5
| Total return is calculated assuming an initial investment made at the net asset value at the beginning of the period, reinvestment of all dividends and distributions at the net asset value during the period and redemption on the last day of the period. Total return calculated for a period of less than one year is not annualized. The total return would have been lower if certain expenses had not been reimbursed by the investment adviser. |
6
| Net expenses include effects of any reimbursement or recoupment. |
7
| Portfolio turnover is not annualized and does not include effects of turnover of the swap or future contracts portfolio. Short-term securities with maturities less than or equal to 366 days are also excluded from portfolio turnover calculation. |
The accompanying notes are an integral part of these financial statements.
TABLE OF CONTENTS
Direxion Funds
Notes to the Financial Statements
August 31, 2024
1. ORGANIZATION
Direxion Funds (the “Trust”) was organized as a Massachusetts Business Trust on June 6, 1997 and is registered under the Investment Company Act of 1940, as amended (the “1940 Act”), as an open-end management investment company issuing its shares in series, each series representing a distinct portfolio with its own investment objective and policies. The Trust currently has eight series, of which seven are included in this report: Direxion Monthly High Yield Bull 1.2X Fund, Direxion Monthly NASDAQ-100® Bull 1.25X Fund, Direxion Monthly NASDAQ-100® Bull 1.75X Fund, Direxion Monthly S&P 500® Bull 1.75X Fund, Direxion Monthly Small Cap Bull 1.75X Fund, Direxion Monthly 7-10 Year Treasury Bull 1.75X Fund and Direxion Monthly 7-10 Year Treasury Bear 1.75X Fund (each a “Fund” and collectively, the “Funds”). Each Fund is a non-diversified series of the Trust pursuant to the 1940 Act. The seven Funds included in this report offer only Investor Class shares.
Rafferty Asset Management, LLC (the “Adviser”) has registered as a commodity pool operator (“CPO”) and the Funds are considered commodity pools under the Commodity Exchange Act (the “CEA”). Accordingly, the Advisor is subject to registration and regulation as a CPO under the CEA and must comply with various regulatory requirements under the CEA and the rules and regulations of the Commodity Futures Trading Commission and the National Futures Association, including investor protection requirements, antifraud provisions, disclosure requirements and reporting and recordkeeping requirements.
The Funds’ investment objectives are to seek monthly investment results, before fees and expenses that correspond to the calendar month performance of a particular index or benchmark. The Funds with the word “Bull” in their name attempt to provide investment results that correlate positively to the return of an index or benchmark. The Fund with the word “Bear” in its name attempts to provide investment results that correlate negatively to the return of an index or benchmark.
| | | | | | | |
Direxion Monthly High Yield Bull 1.2X Fund | | | Solactive High Yield Beta Index | | | 120% |
Direxion Monthly NASDAQ-100® Bull 1.25X Fund | | | NASDAQ-100® Index | | | 125% |
Direxion Monthly NASDAQ-100® Bull 1.75X Fund | | | NASDAQ-100® Index | | | 175% |
Direxion Monthly S&P 500® Bull 1.75X Fund | | | S&P 500® Index | | | 175% |
Direxion Monthly Small Cap Bull 1.75X Fund | | | Russell 2000® Index | | | 175% |
Direxion Monthly 7-10 Year Treasury Bull 1.75X Fund | | | ICE U.S. Treasury 7-10 Year Bond Index | | | 175% |
Direxion Monthly 7-10 Year Treasury Bear 1.75X Fund | | | −175% |
| | | | | | | |
The Trust has evaluated the structure, objective and activities of the Funds and determined that they meet the characteristics of an investment company. As such, these financial statements have applied the guidance as set forth in the Accounting Standards Codifications (“ASC”) 946, “Financial Services - Investment Companies”.
2. SIGNIFICANT ACCOUNTING POLICIES
The following is a summary of significant accounting policies consistently followed by the Funds in the preparation of their financial statements. These policies are in conformity with U.S. generally accepted accounting principles (“GAAP”).
a) Cash Equivalents – The Funds consider investments in the U.S Bank Money Market Deposit Account, a U.S. dollar-denominated deposit account offered through U.S. Bank, to be a cash equivalent. The Funds are exposed to the credit risk of U.S. Bank through the holding of this cash equivalent. This cash equivalent is presented on the Statements of Assets and Liabilities as “Cash equivalents” and were classified as Level 1 assets as of August 31, 2024.
b) Investment Valuation – The Net Asset Value (“NAV”) of each Fund is determined daily, Monday through Friday, as of the close of regular trading on the New York Stock Exchange (“NYSE”), each day the NYSE is open for business. The value of all portfolio securities and other assets held by a Fund will be determined as of the time a Fund calculates its NAV, 4:00 p.m. Eastern Time (“Valuation Time”). On days that the Securities Industry and Financial Markets Association (“SIFMA”) recommends that the bond markets close all day, the Direxion High Yield Bull 1.2X Fund, Direxion Monthly 7-10 Year Treasury Bull 1.75X Fund and the Direxion Monthly 7-10 Year Treasury Bear 1.75X
TABLE OF CONTENTS
Direxion Funds
Notes to the Financial Statements
August 31, 2024(Continued)
Fund (the “Fixed Income Funds”) do not calculate their NAVs even if the NYSE is open for business. Similarly, on days that SIFMA recommends that the bond markets close early, each of the Fixed Income Funds calculates its NAV as of the time of the recommended close, usually 2:00 p.m. Eastern Time, rather than the close of regular trading on the NYSE. Equity securities, exchange-traded funds (“ETFs”) and over-the-counter securities are valued at their last sales price or, if not available, at the average of the last bid and ask prices. Securities primarily traded on the NASDAQ National Market are valued using the NASDAQ Official Closing Price. Swap contracts are valued using the closing price of the underlying reference entity or the closing value of the underlying reference index. Short-term debt securities with an original maturity of 60 days or less are valued using the amortized cost method. Investments in open-end mutual funds, including money market funds, are valued at their respective quoted NAV on the valuation date.
Securities for which reliable market quotations are not readily available, the Funds’ pricing service does not provide a valuation for such securities, the Funds’ pricing service provides valuation that in the judgment of the Adviser does not represent fair value, or the Fund or Adviser believes the market price is stale, are fair valued as determined by the Adviser under the supervision of the Board of Trustees. Additionally, the Adviser will monitor developments in the marketplace for significant events that may affect the value of those securities whose closing prices were established before the Valuation Time.
c) Swap Contracts – Each Fund may enter into equity swap contacts. Standard equity swap contracts are between two parties that agree to exchange the returns (or differentials in rates of return) earned or realized on particular predetermined investments or instruments. The gross amount to be exchanged is calculated with respect to a “notional amount” (i.e. the return on or increase in value of a particular dollar amount invested in a “basket” of securities representing a particular index or industry sector). A Fund enters into master netting agreements with the counterparty. These agreements calculate the obligations of the parties on a “net basis”. Consequently, a Fund’s current obligations under a swap agreement generally will be equal to the net amount to be paid or received under the agreement based on the relative value of the positions held by each party. A Fund’s obligations are accrued daily and offset by any amounts owed to the Fund. However, a Fund does not offset the fair value amounts of the swap contract and the related collateral on the Statement of Assets and Liabilities arising from swap contracts executed with the same counterparty under such master netting agreements.
In a “long” equity swap agreement, the counterparty will generally agree to pay the Fund the amount, if any, by which the notional amount of the swap contract would have increased in value if the Fund had been invested in the particular securities, plus dividends that would have been received on those securities. The Fund will agree to pay the counterparty a floating rate of interest on the notional amount of the swap contract plus the amount, if any, by which the notional amount would have decreased in value had it been invested in such securities plus, in certain instances, commissions or trading spreads on the notional amounts. Thus, the return on the swap contract should be the gain or loss on the notional amount plus dividends on the securities less the interest paid by the Fund on the notional amount. In certain instances, market factors such as the interest rate environment and the demand to borrow the securities underlying the swap agreement can cause a scenario in which the counterparty will pay the Fund interest. Payments may be made at the conclusion of the contract or periodically during its term. Swap contracts do not include the delivery of securities. The net amount of the excess, if any, of the Fund’s obligations over its entitlement with respect to each swap is accrued on a daily basis and an amount of cash or liquid assets, having an aggregate net asset value at least equal to such accrued excess is maintained in a segregated account. Until a swap contract is settled in cash, the gain or loss on the notional amount plus dividends on the securities less the interest paid by the Fund on the notional amount are recorded as “unrealized appreciation or depreciation on swaps” and when cash is exchanged, the gain or loss is recorded as “realized gains or losses on swaps.”
Each Fund may enter into swap contracts that provide the opposite return of the underlying benchmark or security (“short” the index or security). The operations are similar to that of the swaps disclosed above except that the counterparty pays interest to the Fund on the notional amount outstanding and the dividends on the underlying securities reduce the return of the swap. However, in certain instances, market factors such as the interest rate environment and the demand to borrow the securities underlying the swap agreement can cause a scenario in which the Fund will pay the counterparty interest. These amounts are netted with any unrealized appreciation or depreciation to determine the value of the swap. The Funds will typically enter into equity swap agreements to obtain leverage in order to meet their objectives.
TABLE OF CONTENTS
Direxion Funds
Notes to the Financial Statements
August 31, 2024(Continued)
Accounting Standards Update No. 2013-01 “Disclosures about Offsetting Assets and Liabilities” (“ASU 2013-01”), requires entities to disclose (i) gross and net information about both instruments and transactions eligible for offset in the financial statements, and (ii) instruments and transactions subject to an agreement similar to a master netting agreement. ASU 2013-01 is limited in scope to the following financial instruments, to the extent they are offset in the financial statements or subject to an enforceable master netting arrangement or similar agreement: (i) recognized derivative instruments accounted for under ASC 815 (Derivatives and Hedging).
In order to better define its contractual rights and to secure rights that will help a Fund mitigate its counterparty risk, a Fund may enter into an International Swaps and Derivatives Association, Inc. Master Agreement (“ISDA Master Agreement”) or similar agreement with its counterparties. An ISDA Master Agreement is a bilateral agreement between a Fund and a counterparty that governs over-the-counter derivatives (“OTC”), including swap contracts, and typically contains, among other things, collateral posting terms, netting and rights of set-off provisions in the event of a default and/or termination event. Under an ISDA Master Agreement, a Fund may, under certain circumstances, offset with the counterparty certain derivative financial instruments’ payables and receivables to create a single net payment. The provisions of the ISDA Master Agreement typically permit a single net payment in the event of a default (close-out netting) or similar event, including the bankruptcy or insolvency of the counterparty.
Collateral requirements generally differ by type of derivative. Collateral terms are contract specific for OTC derivatives (e.g. swaps). Generally, for transactions traded under an ISDA Master Agreement, the collateral requirements are calculated by netting the marked-to-market amount for each transaction under such agreement and comparing that amount to the value of any collateral currently pledged by a Fund and the counterparty. Generally, the amount of collateral due from or to the counterparty must exceed a minimum transfer amount threshold before a transfer is required to be made. To the extent amounts due to a Fund from its derivatives counterparties are not fully collateralized, contractually, or otherwise, the Fund bears the risk of loss from counterparty non-performance.
For financial reporting purposes, the Funds elect to not offset assets and liabilities subject to an ISDA Master Agreement, if any, in the Statements of Assets and Liabilities. Therefore, all qualifying transactions are presented on a gross basis in the Statements of Assets and Liabilities. As of August 31, 2024, the impact of netting of assets and liabilities and the offsetting of collateral pledged or received based on contractual netting/set-off provisions in the ISDA Master Agreement are detailed in the following pages.
In the event of the counterparty’s default, bankruptcy, or any other event for which the counterparty cannot meet its obligations, a Fund bears the risk of loss equal to the amount of the daily appreciation owed to the Fund. This obligation represents the daily gain accrued to the Fund from the close of business day prior to this event to the day on which this event occurs and the counterparty can no longer meet its obligations. A Fund will enter into swap agreements only with large, well-capitalized and established financial institutions. The creditworthiness of each of the firms that is a party to a swap agreement is monitored by the Adviser. Shareholders may obtain swap counterparty financial statements at www.sec.gov. Swap contracts are subject to credit risk. Credit risk occurs when the financial condition of an issuer of a security or instrument may cause it to default or become unable to pay interest or principal due on the security. The counterparty to a swap contract might default on its obligations. In addition, the Funds have agreements with certain counterparties with which it trades swap contracts that contain credit risk-related contingent features that could be triggered subject to certain circumstances. Such circumstances include agreed upon net asset value and performance-based thresholds. The maximum exposure to the Funds in regard to potential counterparty default and credit-risk related contingent features at August 31, 2024 is detailed in the following table. If such credit risk-related contingencies were triggered the counterparties would have the option to terminate any positions open under the master netting agreement.
TABLE OF CONTENTS
Direxion Funds
Notes to the Financial Statements
August 31, 2024(Continued)
Description: Swap Contract
Counterparty: Bank of America Merrill Lynch
| | | | | | | |
Direxion Monthly NASDAQ-100® Bull 1.25X Fund | | | $84,972 | | | $ — | | | $50,000 | | | $34,972 | | | $— | | | $ — | | | $— | | | $— |
Direxion Monthly NASDAQ-100® Bull 1.75X Fund | | | — | | | — | | | — | | | — | | | 12,104,576 | | | — | | | — | | | 12,104,576 |
Direxion Monthly S&P 500® Bull 1.75X Fund | | | 4,354,760 | | | — | | | 3,580,000 | | | 774,760 | | | — | | | — | | | — | | | — |
Direxion Monthly Small Cap Bull 1.75X Fund | | | 891,433 | | | — | | | 800,000 | | | 91,433 | | | — | | | — | | | — | | | — |
Direxion Monthly 7-10 Year Treasury Bull 1.75X Fund | | | 34,263 | | | — | | | 34,2631 | | | — | | | — | | | — | | | — | | | — |
Direxion Monthly 7-10 Year Treasury Bear 1.75X Fund | | | — | | | — | | | — | | | — | | | 105,975 | | | — | | | 105,9751 | | | — |
| | | | | | | | | | | | | | | | | | | | | | | | | |
1
| The amount of collateral shown has been limited such that the net amount cannot be less than zero.
|
2
| The amount shown is the maximum credit exposure of the Fund for the corresponding counterparty. |
Description: Swap Contract
Counterparty: UBS Securities LLC
| | | | | | | |
Direxion Monthly High Yield Bull 1.2X Fund | | | $657,564 | | | $ — | | | $— | | | $657,564 | | | $— | | | $ — | | | $— | | | $ — |
Direxion Monthly NASDAQ-100® Bull 1.25X Fund | | | 453 | | | — | | | — | | | 453 | | | — | | | — | | | — | | | — |
Direxion Monthly NASDAQ-100® Bull 1.75X Fund | | | 32,323,572 | | | — | | | — | | | 32,323,572 | | | — | | | — | | | — | | | — |
Direxion Monthly S&P 500® Bull 1.75X Fund | | | 3,463,345 | | | — | | | — | | | 3,463,345 | | | — | | | — | | | — | | | — |
Direxion Monthly Small Cap Bull 1.75X Fund | | | 125,854 | | | — | | | — | | | 125,854 | | | — | | | — | | | — | | | — |
Direxion Monthly 7-10 Year Treasury Bull 1.75X Fund | | | 148,759 | | | — | | | 110,000 | | | 38,759 | | | — | | | — | | | — | | | — |
Direxion Monthly 7-10 Year Treasury Bear 1.75X Fund | | | — | | | — | | | — | | | — | | | 3,105 | | | — | | | 3,1051 | | | — |
| | | | | | | | | | | | | | | | | | | | | | | | | |
1
| The amount of collateral shown has been limited such that the net amount cannot be less than zero.
|
2
| The amount shown is the maximum credit exposure of the Fund for the corresponding counterparty. The amounts are further offset by a netting arrangement with counterparty in which the variation margin and initial margin are offset daily. |
TABLE OF CONTENTS
Direxion Funds
Notes to the Financial Statements
August 31, 2024(Continued)
d) Investment Transactions – Investment transactions are recorded on trade date. The Funds determine the gain or loss realized from investment transactions by comparing the identified cost, which is the same basis used for federal income tax purposes, with the net sales proceeds.
e) Investments in Other Investment Companies – A Fund may invest in another ETF or mutual fund, collectively defined as “investment companies”. As a result, Fund shareholders indirectly bear the Fund’s proportionate share of fees and expenses paid by shareholders of the other investment company, in addition to the fees and expenses Fund shareholders bear in connection with the Fund’s own operations. These costs are disclosed in the Fund’s prospectus as Acquired Fund Fees and Expenses. Shareholders may obtain the financial statements of these investment companies at www.sec.gov.
f) Federal Income Taxes – Each Fund intends to comply with the requirements of Subchapter M of the Internal Revenue Code of 1986, as amended, necessary to qualify as a regulated investment company and to make the requisite distributions of income and capital gains to its shareholders sufficient to relieve it from all or substantially all Federal income taxes and excise taxes. No provision for Federal income taxes has been made in the Funds’ financial statements.
g) Income and Expenses – Dividend income is recorded on the ex-dividend date. Interest income is recognized on an accrual basis. Expenses are charged to the Funds daily. Expenses are computed based on each Fund’s respective average daily net assets. For additional discussion on expenses, refer to Note 4.
h) Distributions to Shareholders – Each Fund pays dividends from net investment income and distributes net realized capital gains, if any, at least annually. Income and capital gain distributions are determined in accordance with income tax regulations, which may differ from GAAP. Certain Funds also utilize earnings and profits distributed to shareholders on redemptions of shares as part of the dividends paid deduction. Distributions to shareholders are recorded on the ex-dividend date.
The tax character of distributions during the years ended August 31, 2024 and August 31, 2023, were as follows:
| | | | | | | |
Direxion Monthly High Yield Bull 1.2X Fund | | | $1,988,496 | | | $ — | | | $10,456 | | | $1,685,533 | | | $ — | | | $ — |
Direxion Monthly NASDAQ-100® Bull 1.25X Fund | | | 27,963 | | | — | | | — | | | — | | | — | | | — |
Direxion Monthly NASDAQ-100® Bull 1.75X Fund | | | 1,780,224 | | | — | | | — | | | — | | | — | | | — |
Direxion Monthly S&P 500® Bull 1.75X Fund | | | 660,881 | | | — | | | — | | | — | | | — | | | — |
Direxion Monthly Small Cap Bull 1.75X Fund | | | 83,098 | | | — | | | — | | | — | | | — | | | — |
Direxion Monthly 7-10 Year Treasury Bull 1.75X Fund | | | 197,048 | | | — | | | — | | | — | | | — | | | — |
Direxion Monthly 7-10 Year Treasury Bear 1.75X Fund | | | 238,839 | | | — | | | — | | | — | | | — | | | — |
| | | | | | | | | | | | | | | | | | | |
TABLE OF CONTENTS
Direxion Funds
Notes to the Financial Statements
August 31, 2024(Continued)
As of August 31, 2024, the components of accumulated earnings/losses of the Funds on a tax basis were as follows:
| | | | | | | | | | |
Tax cost of investments | | | $50,996,903 | | | $6,943,064 | | | $235,429,796 |
Gross unrealized appreciation | | | 2,344,728 | | | 703,379 | | | 121,595,632 |
Gross unrealized depreciation | | | (3,034,513) | | | (975,064) | | | (13,626,761) |
Net unrealized appreciation/(depreciation) | | | $(689,785) | | | $(271,685) | | | $107,968,871 |
Undistributed ordinary income (loss) | | | — | | | 2,535,866 | | | 4,553,713 |
Undistributed capital gain (loss) | | | — | | | — | | | — |
Total distributable earnings (losses) | | | — | | | 2,535,866 | | | 4,553,713 |
Other accumulated earnings (losses) | | | (31,808,603) | | | (3,422,356) | | | (9,101,717) |
Total accumulated earnings (losses) | | | $(32,498,388) | | | $(1,158,175) | | | $103,420,867 |
| | | | | | | | | | |
| | | | | | | | | | |
Tax cost of investments | | | $70,072,733 | | | $12,056,303 | |
Gross unrealized appreciation | | | 26,043,898 | | | 2,192,081 | |
Gross unrealized depreciation | | | (1,628,787) | | | (631,863) | |
Net unrealized appreciation/(depreciation) | | | $24,415,111 | | | $1,560,218 | |
Undistributed ordinary income (loss) | | | 11,669,873 | | | 198,031 | |
Undistributed capital gain (loss) | | | — | | | — | |
Total distributable earnings (losses) | | | 11,669,873 | | | 198,031 | |
Other accumulated earnings (losses) | | | — | | | (7,996,958) | |
Total accumulated earnings (losses) | | | $36,084,984 | | | $(6,238,709) | |
| | | | | | | | |
| | | | | | | | | | |
Tax cost of investments | | | $10,474,937 | | | $1,575,040 | |
Gross unrealized appreciation | | | 342,470 | | | — | |
Gross unrealized depreciation | | | (242,815) | | | (144,120) | |
Net unrealized appreciation/(depreciation) | | | $99,655 | | | $(144,120) | |
Undistributed ordinary income (loss) | | | 270,462 | | | 99,454 | |
Undistributed capital gain (loss) | | | — | | | — | |
Total distributable earnings (losses) | | | 270,462 | | | 99,454 | |
Other accumulated earnings (losses) | | | (6,762,188) | | | (18,177,030) | |
Total accumulated earnings (losses) | | | $(6,392,071) | | | $(18,221,696) | |
| | | | | | | | |
The difference between book cost of investments and tax cost of investments is attributable primarily to the tax deferral of losses on wash sales. Other accumulated gain/(loss) is generally comprised of capital loss carryforwards.
TABLE OF CONTENTS
Direxion Funds
Notes to the Financial Statements
August 31, 2024(Continued)
GAAP requires that certain components of net assets relating to permanent differences be reclassified between financial and tax reporting. These reclassifications have no effect on net assets or net asset value per share. For the year ended August 31, 2024, no adjustments were made for permanent tax differences.
In order to meet certain excise tax distribution requirements, the Funds are required to measure and distribute annually net capital gains realized during a twelve-month period ending October 31 and net investment income earned during a twelve month period ending December 31. In connection with this, the Funds are permitted for tax purposes to defer into their next fiscal year qualified late year losses. Qualified late year capital losses are any net capital losses incurred between November 1 and the end of the fiscal year, August 31, 2024. Qualified late year ordinary losses are generally losses incurred between January 1 and the end of their fiscal year, August 31, 2024.
At August 31, 2024, no Funds deferred, on a tax basis, qualified late year losses.
Under the Regulated Investment Company Modernization Act of 2010, net capital losses recognized for tax years beginning after December 22, 2010 may be carried forward indefinitely, and their character is retained as short-term and/or long-term.
At August 31, 2024, the following Funds had capital loss carryforwards on a tax basis of:
| | | | | | | | | | |
Direxion Monthly High Yield Bull 1.2X Fund | | | $19,563,586 | | | $12,245,017 | | | $ — |
Direxion Monthly NASDAQ-100® Bull 1.25X Fund | | | — | | | — | | | 926 |
Direxion Monthly NASDAQ-100® Bull 1.75X Fund | | | 9,101,717 | | | — | | | — |
Direxion Monthly S&P 500® Bull 1.75X Fund | | | — | | | — | | | — |
Direxion Monthly Small Cap Bull 1.75X Fund | | | 7,945,259 | | | 51,699 | | | — |
Direxion Monthly 7-10 Year Treasury Bull 1.75X Fund | | | 6,441,547 | | | 320,641 | | | — |
Direxion Monthly 7-10 Year Treasury Bear 1.75X Fund | | | 18,177,030 | | | — | | | — |
Capital Loss Utilized:
| | | | |
Direxion Monthly NASDAQ-100® Bull 1.25X Fund | | | 1,370,736 | |
Direxion Monthly NASDAQ-100® Bull 1.75X Fund | | | 118,896,554 | |
Direxion Monthly S&P 500® Bull 1.75X Fund | | | 7,982,228 | |
Direxion Monthly Small Cap Bull 1.75X Fund | | | 322,241 | |
Direxion Monthly 7-10 Year Treasury Bull 1.75X Fund | | | 544,002 | |
Direxion Monthly 7-10 Year Treasury Bear 1.75X Fund | | | 2,017,870 | |
| | | | | |
In accordance with Sections 381-384 of the Internal Revenue Code, a portion of certain Fund’s losses have been subjected to an annual limitation. Direxion Monthly NASDAQ-100® Bull 1.25X Fund has $3,422,356 of capital losses that are subject to an annual limitation.
To the extent that a Fund realizes future net capital gains, those gains will be offset by any unused capital loss carryover.
The Funds follow authoritative financial reporting rules regarding recognition and measurement of tax positions taken or expected to be taken on a tax return. The Funds have reviewed all open tax years and concluded that there is no effect to the Funds’ financial positions or results of operations and no tax liability resulting from unrecognized tax benefits relating to uncertain income tax positions taken or expected to be taken on a tax return. The Funds recognize interest and penalties, if any, related to unrecognized tax benefits as income tax expense in the Statement of Operations. During this period, the Funds did not incur any interest or penalties. Open tax years are those years that are open for examination by the relevant income taxing authority. As of August 31, 2024, open Federal and state income tax years include the tax years ended August 31, 2021 through August 31, 2024. The Funds have no examination in progress. The Funds are also not aware of any tax positions for which it is reasonably possible that the total amounts of unrecognized tax expense will significantly change in the next twelve months.
TABLE OF CONTENTS
Direxion Funds
Notes to the Financial Statements
August 31, 2024(Continued)
i) Guarantees and Indemnifications – In the ordinary course of business, the Funds enter into contracts that contain a variety of indemnification provisions pursuant to which the Funds agree to indemnify third parties upon occurrence of specified events. The Funds’ maximum exposure relating to these indemnification agreements is unknown. However, the Funds have not had prior claims or losses in connection with these provisions and believe the risk of loss is remote.
j) Use of Estimates – The preparation of financial statements in conformity with GAAP requires management to make estimates and assumptions that affect the reported amounts of assets and liabilities and disclosure of contingent assets and liabilities at the date of the financial statements and the reported amounts of revenues and expenses during the reporting period. Actual results could differ from those estimates.
3. INVESTMENT TRANSACTIONS
The table below presents each Fund’s investment transactions during the year ended August 31, 2024. Purchases represent the aggregate purchases of investments excluding short-term investment purchases and swap contracts. Sales represent the aggregate sales of investments excluding proceeds from short-term investments and swap contracts.
| | | | | | | |
Direxion Monthly High Yield Bull 1.2X Fund | | | $329,536,390 | | | $301,763,389 |
Direxion Monthly NASDAQ-100® Bull 1.25X Fund | | | 51,762,024 | | | 53,176,171 |
Direxion Monthly NASDAQ-100® Bull 1.75X Fund | | | 43,536,963 | | | 24,750,656 |
Direxion Monthly S&P 500® Bull 1.75X Fund | | | 12,192,361 | | | — |
Direxion Monthly Small Cap Bull 1.75X Fund | | | 3,900,437 | | | 2,155,967 |
Direxion Monthly 7-10 Year Treasury Bull 1.75X Fund | | | 25,436,372 | | | 19,372,123 |
Direxion Monthly 7-10 Year Treasury Bear 1.75X Fund | | | — | | | — |
| | | | | | | |
There were no purchases or sales of long-term U.S. Government securities in the Funds during the year ended August 31, 2024.
4. INVESTMENT ADVISORY AND OTHER AGREEMENTS
Investment Advisory Agreement: The Funds have entered into an investment advisory agreement with the Adviser. The Adviser earns a fee, computed daily and payable monthly, applied to each Fund’s average daily net assets at the annual rate of 0.75%.
Management Services Agreement: The Funds have entered into a Management Services Agreement with the Adviser. Under the Management Services Agreement, the Funds pays the Adviser a management service fees of 0.026% on the first $10,000,000,000 of the Fund’s daily net assets and 0.024% on assets in excess of $10,000,000,000.
Operating Expense Limitation Agreement: Each Fund is responsible for its own operating expenses. Under the Operating Expense Limitation Agreement, the Adviser has contractually agreed to cap all or a portion of the expenses for each Fund based on the annual rates listed below applied to each Fund’s average daily net assets.
| | | | |
Direxion Monthly High Yield Bull 1.2X Fund | | | 1.35% |
Direxion Monthly NASDAQ-100® Bull 1.25X Fund | | | 1.15% |
Direxion Monthly NASDAQ-100® Bull 1.75X Fund | | | 1.35% |
Direxion Monthly S&P 500® Bull 1.75X Fund | | | 1.35% |
Direxion Monthly Small Cap Bull 1.75X Fund | | | 1.35% |
Direxion Monthly 7-10 Year Treasury Bull 1.75X Fund | | | 1.35% |
Direxion Monthly 7-10 Year Treasury Bear 1.75X Fund | | | 1.35% |
| | | | |
Any expense cap is subject to recoupment by the Adviser within the following three years only if overall expenses fall below the lesser of this percentage limitation and any percentage limitation in place at the time. This agreement may be terminated or revised at any time with the consent of the Board of Trustees.
TABLE OF CONTENTS
Direxion Funds
Notes to the Financial Statements
August 31, 2024(Continued)
The table below presents amounts that the Adviser recouped, waived and the amounts available for potential recoupments by the Adviser.
| | | | | | | | | | | | | |
Direxion Monthly High Yield Bull 1.2X Fund | | | $537 | | | $56,563 | | | $— | | | $74,568 | | | $56,563 | | | $131,131 |
Direxion Monthly NASDAQ-100® Bull 1.25X Fund | | | 10,161 | | | 73,753 | | | 44,209 | | | 47,888 | | | 73,753 | | | 165,850 |
Direxion Monthly NASDAQ-100® Bull 1.75X Fund | | | 79,716 | | | 27,107 | | | — | | | — | | | 23,134 | | | 23,134 |
Direxion Monthly S&P 500® Bull 1.75X Fund | | | 31,166 | | | 11,184 | | | — | | | 83,329 | | | 11,184 | | | 94,513 |
Direxion Monthly Small Cap Bull 1.75X Fund | | | 11,213 | | | 30,359 | | | 29,254 | | | 35,917 | | | 30,359 | | | 95,530 |
Direxion Monthly 7-10 Year Treasury Bull 1.75X Fund | | | 7,473 | | | 34,429 | | | 35,861 | | | 40,584 | | | 34,429 | | | 110,874 |
Direxion Monthly 7-10 Year Treasury Bear 1.75X Fund | | | 27,935 | | | 50,354 | | | 23,383 | | | 43,617 | | | 50,354 | | | 117,354 |
| | | | | | | | | | | | | | | | | | | |
The net amounts receivable (payable) arising from the Investment Advisory Agreement, Management Services Agreement and waiver of any expenses as of August 31, 2024 is presented on the Statements of Assets and Liabilities as Due from (to) Adviser, net.
Distribution Expenses: Shares of the Funds are subject to an annual 12b-1 fee of up to 1.00% of a Fund’s average daily net assets. Each Fund currently pays a 12b-1 fee of 0.25% of the respective Fund’s average daily net assets.
Foreside Fund Services, LLC (the “Distributor”) serves as principal underwriter of the Funds and acts as the Funds’ distributor in a continuous public offering of the Funds’ shares. The Distributor is an affiliate of the Adviser.
5. VALUATION MEASUREMENTS
The Funds follow authoritative fair valuation accounting standards, which establish an authoritative definition of fair value and set out a hierarchy for measuring fair value. These standards require additional disclosures about the various inputs and valuation techniques used to develop the measurements of fair value and a discussion in changes in valuation techniques and related inputs during the period. These inputs are summarized in the three broad levels below:
Level 1 –
Quoted prices in active markets for identical securities
Level 2 –
Evaluated price based on other significant observable inputs (including quoted prices for similar securities in active markets, quoted prices for identical or similar securities in inactive markets, interest rates, prepayment speeds, credit risk, etc.)
Level 3 –
Significant unobservable inputs (including the Fund’s own assumptions in determining fair value of investments)
The inputs or methodology used for valuing securities are not an indication of the credit risk associated with investing in those securities.
TABLE OF CONTENTS
Direxion Funds
Notes to the Financial Statements
August 31, 2024(Continued)
The follow is a summary of the inputs used to value the Funds’ securities as of August 31, 2024.
| | | | | | | |
Direxion Monthly High Yield Bull 1.2X Fund | | | $47,389,554 | | | $2,260,000 | | | $164,263 | | | $657,564 | | | $— |
Direxion Monthly NASDAQ-100® Bull 1.25X Fund | | | 5,511,873 | | | 1,074,081 | | | 2,859,701 | | | 85,425 | | | — |
Direxion Monthly NASDAQ-100® Bull 1.75X Fund | | | 252,297,841 | | | 70,881,830 | | | 102,143,762 | | | 32,323,572 | | | (12,104,576) |
Direxion Monthly S&P 500® Bull 1.75X Fund | | | 65,099,739 | | | 21,570,000 | | | 28,962,001 | | | 7,818,105 | | | — |
Direxion Monthly Small Cap Bull 1.75X Fund | | | 8,177,293 | | | 4,421,941 | | | 1,864,371 | | | 1,017,287 | | | — |
Direxion Monthly 7-10 Year Treasury Bull 1.75X Fund | | | 8,130,098 | | | 2,261,472 | | | 2,136,408 | | | 183,022 | | | — |
Direxion Monthly 7-10 Year Treasury Bear 1.75X Fund | | | — | | | 1,540,000 | | | 1,884,743 | | | — | | | (109,080) |
| | | | | | | | | | | | | | | | |
For further information regarding each asset class, see each Fund’s Schedule of Investments.
*
| Total return swap contracts are valued at the unrealized appreciation/(depreciation). |
The Funds also follow authoritative accounting standards, which require additional disclosure regarding fair value measurements. Specifically, these standards require reporting entities to disclose a) the input and valuation techniques used to measure fair value for both recurring and nonrecurring fair value measurements, for Level 2 or Level 3 positions, b) transfers between all levels on a gross basis (i.e. transfers out must be disclosed separately from transfers in) as well as the reason(s) for the transfers, and c) purchases and sales on a gross basis in the Level 3 rollforward rather than as one net number. Additionally, reporting entities are required to disclose quantitative information about unobservable inputs used in the fair value measurements categorized within Level 3 of the fair value hierarchy.
6. ADDITIONAL DISCLOSURES ABOUT DERIVATIVE INSTRUMENTS
The Funds follow authoritative standards of accounting for derivative instruments, which establish disclosure requirements for derivative instruments. These standards improve financial reporting for derivative instruments by requiring enhanced disclosures that enables investors to understand how and why a fund uses derivatives instruments, how a fund accounts for derivative instruments and how derivative instruments affect a fund’s financial position and results of operations.
The Funds use derivative instruments as part of their principal investment strategy to achieve their investment objective. For additional discussion on the risks associated with derivative instruments refer to Note 2. As of August 31, 2024, the Funds were invested in swap contracts.
At August 31, 2024, the fair value of derivative instruments, by primary risk, were as follows:
| | | | |
Direxion Monthly High Yield Bull 1.2X Fund | | | $657,564 | | | $— | | | $— | | | $657,564 |
Direxion Monthly NASDAQ-100® Bull 1.25X Fund | | | — | | | 85,425 | | | — | | | 85,425 |
Direxion Monthly NASDAQ-100® Bull 1.75X Fund | | | — | | | 32,323,572 | | | — | | | 32,323,572 |
Direxion Monthly S&P 500® Bull 1.75X Fund | | | — | | | 7,818,105 | | | — | | | 7,818,105 |
Direxion Monthly Small Cap Bull 1.75X Fund | | | — | | | 1,017,287 | | | — | | | 1,017,287 |
Direxion Monthly 7-10 Year Treasury Bull 1.75X Fund | | | — | | | — | | | 183,022 | | | 183,022 |
| | | | | | | | | | | | | |
1
| Statements of Assets and Liabilities location: Unrealized appreciation on swap contracts. |
TABLE OF CONTENTS
Direxion Funds
Notes to the Financial Statements
August 31, 2024(Continued)
| | | | |
Direxion Monthly NASDAQ-100® Bull 1.75X Fund | | | $ — | | | $12,104,576 | | | $— | | | $12,104,576 |
Direxion Monthly 7-10 Year Treasury Bear 1.75X Fund | | | — | | | — | | | 109,080 | | | 109,080 |
| | | | | | | | | | | | | |
2
| Statements of Assets and Liabilities location: Unrealized depreciation on swap contracts. |
Transactions in derivative instruments during the year ended August 31, 2024, by primary risk, were as follows:
| | | | | | | | | | |
Direxion Monthly High Yield Bull 1.2X Fund | | | Swap Contracts | | | $(74,980) | | | $— | | | $— | | | $479,831 | | | $— | | | $— |
Direxion Monthly NASDAQ-100® Bull 1.25X Fund | | | Swap Contracts | | | — | | | 2,086,774 | | | — | | | — | | | (339,923) | | | — |
Direxion Monthly NASDAQ-100® Bull 1.75X Fund | | | Swap Contracts | | | — | | | 121,142,250 | | | — | | | — | | | (34,938,361) | | | — |
Direxion Monthly S&P 500® Bull 1.75X Fund | | | Swap Contracts | | | — | | | 16,443,614 | | | — | | | — | | | 6,116,669 | | | — |
Direxion Monthly Small Cap Bull 1.75X Fund | | | Swap Contracts | | | — | | | 257,594 | | | — | | | — | | | 783,886 | | | — |
Direxion Monthly 7-10 Year Treasury Bull 1.75X Fund | | | Swap Contracts | | | — | | | — | | | 372,643 | | | — | | | — | | | 259,086 |
Direxion Monthly 7-10 Year Treasury Bear 1.75X Fund | | | Swap Contracts | | | — | | | — | | | 2,004,720 | | | — | | | — | | | (993,909) |
| | | | | | | | | | | | | | | | | | | | | | |
1
| Statements of Operations location: Net realized gain (loss) on swap contracts.
|
2
| Statements of Operations location: Change in net unrealized appreciation (depreciation) on swap contracts. |
For the year ended August 31, 2024, the average quarterly volume of the derivatives held by each of the Funds was as follows:
| | | | |
Direxion Monthly High Yield Bull 1.2X Fund | | | $17,805,906 | | | $— |
Direxion Monthly NASDAQ-100® Bull 1.25X Fund | | | 7,395,891 | | | — |
Direxion Monthly NASDAQ-100® Bull 1.75X Fund | | | 448,585,047 | | | — |
Direxion Monthly S&P 500® Bull 1.75X Fund | | | 122,174,861 | | | — |
Direxion Monthly Small Cap Bull 1.75X Fund | | | 14,520,288 | | | — |
Direxion Monthly 7-10 Year Treasury Bull 1.75X Fund | | | 10,409,576 | | | — |
Direxion Monthly 7-10 Year Treasury Bear 1.75X Fund | | | — | | | 10,588,025 |
| | | | | | | |
The Funds utilize this volume of derivatives to obtain leverage to meet the investment objectives of 120%, 125%, 175%, and -175% calendar month performance of their respective indices.
TABLE OF CONTENTS
Direxion Funds
Notes to the Financial Statements
August 31, 2024(Continued)
7. SUBSEQUENT EVENTS
Management has performed an evaluation of subsequent events through the date the financial statements were issued and has determined that no items require recognition or disclosure besides those noted below.
Direxion Monthly High Yield Bull 1.2X Fund paid an income distribution in the amount of $0.0732 per share, with a record date of September 16, 2024 and ex-date and payable date of September 17, 2024.
Direxion Monthly High Yield Bull 1.2X Fund paid an income distribution in the amount of $0.0816 per share, with a record date of October 15, 2024 and ex-date and payable date of October 16, 2024.
At a meeting held on June 27, 2024, the Board of Trustees of the Trust approved a change in distributor of each series of the Trust from Foreside Fund Services, LLC to ALPS Distributors, Inc., effective on September 9, 2024.
TABLE OF CONTENTS
Report of Independent Registered Public Accounting Firm
To the Shareholders of Direxion Monthly High Yield Bull 1.2X Fund, Direxion Monthly NASDAQ-100® Bull 1.25X Fund, Direxion Monthly NASDAQ-100® Bull 1.75X Fund, Direxion Monthly S&P 500® Bull 1.75X Fund, Direxion Monthly Small Cap Bull 1.75X Fund, Direxion Monthly 7-10 Year Treasury Bull 1.75X Fund and Direxion Monthly 7-10 Year Treasury Bear 1.75X Fund and the Board of Trustees of Direxion Funds
Opinion on the Financial Statements
We have audited the accompanying statements of assets and liabilities of Direxion Monthly High Yield Bull 1.2X Fund, Direxion Monthly NASDAQ-100® Bull 1.25X Fund, Direxion Monthly NASDAQ-100® Bull 1.75X Fund, Direxion Monthly S&P 500® Bull 1.75X Fund, Direxion Monthly Small Cap Bull 1.75X Fund, Direxion Monthly 7-10 Year Treasury Bull 1.75X Fund and Direxion Monthly 7-10 Year Treasury Bear 1.75X Fund (collectively referred to as the “Funds”), (7 of the funds constituting Direxion Funds) (collectively referred to as the “Trust”)), including the schedules of investments, as of August 31, 2024, and the related statements of operations for the year then ended, the statements of changes in net assets for each of the two years in the period then ended, the financial highlights for each of the five years in the period then ended and the related notes (collectively referred to as the “financial statements”). In our opinion, the financial statements present fairly, in all material respects, the financial position of each of the Funds (7 of the funds constituting Direxion Funds) at August 31, 2024, the results of their operations for the year then ended, the changes in their net assets for each of the two years in the period then ended and their financial highlights for each of the five years in the period then ended, in conformity with U.S. generally accepted accounting principles.
Basis for Opinion
These financial statements are the responsibility of the Trust’s management. Our responsibility is to express an opinion on each of the Funds’ financial statements based on our audits. We are a public accounting firm registered with the Public Company Accounting Oversight Board (United States) (“PCAOB”) and are required to be independent with respect to the Trust in accordance with the U.S. federal securities laws and the applicable rules and regulations of the Securities and Exchange Commission and the PCAOB.
We conducted our audits in accordance with the standards of the PCAOB. Those standards require that we plan and perform the audit to obtain reasonable assurance about whether the financial statements are free of material misstatement, whether due to error or fraud. The Trust is not required to have, nor were we engaged to perform, an audit of the Trust’s internal control over financial reporting. As part of our audits, we are required to obtain an understanding of internal control over financial reporting but not for the purpose of expressing an opinion on the effectiveness of the Trust’s internal control over financial reporting. Accordingly, we express no such opinion.
Our audits included performing procedures to assess the risks of material misstatement of the financial statements, whether due to error or fraud, and performing procedures that respond to those risks. Such procedures included examining, on a test basis, evidence regarding the amounts and disclosures in the financial statements. Our procedures included confirmation of securities owned as of August 31, 2024, by correspondence with the custodian and brokers; when replies were not received from brokers, we performed other auditing procedures. Our audits also included evaluating the accounting principles used and significant estimates made by management, as well as evaluating the overall presentation of the financial statements. We believe that our audits provide a reasonable basis for our opinion.
We have served as the auditor of one or more of the Direxion investment companies since 2001.
Minneapolis, Minnesota
October 25, 2024
TABLE OF CONTENTS
Basis for Approval of Investment Advisory Agreement (Unaudited)
Investment Advisory Agreement Approval
Consistent with the Investment Company Act of 1940, as amended (the “1940 Act”), the Board of Trustees (the “Board”) of the Direxion Funds (the “Trust”) annually considers the renewal of the Amended & Restated Investment Advisory Agreement (the “Agreement”) between Rafferty Asset Management, LLC (the “Adviser”) and the Trust, on behalf of the Direxion Monthly S&P 500® Bull 1.75X Fund, Direxion Monthly NASDAQ-100® Bull 1.75X Fund, Direxion Monthly Small Cap Bull 1.75X Fund, Direxion Monthly 7-10 Year Treasury Bull 1.75X Fund, Direxion Monthly 7-10 Year Treasury Bear 1.75X Fund, Direxion Monthly NASDAQ-100® Bull 1.25X Fund and the Direxion Monthly High Yield Bull 1.2X Fund, each a series of the Trust. Each series of the Trust is referred to herein as a “Fund” and collectively as the “Funds.” The Funds seek monthly investment results, before fees and expenses, of a multiple or an inverse multiple of an underlying index.
At a meeting held on August 22, 2024, the Board, including those members of the Board (“Trustees”) who are not “interested persons” of the Trust as defined in the 1940 Act (the “Independent Trustees”), approved the renewal of the Agreement, on behalf of the Funds. The Independent Trustees had previously considered information pertaining to the renewal of the Agreement outside the presence of the Adviser’s representatives and Fund management in executive sessions held on August 8, 2024 and August 22, 2024. The Board, including the Independent Trustees, determined that the terms of the Agreement for each Fund were fair and reasonable and that the renewal of the Agreement would be in the best interests of each Fund’s shareholders.
In considering whether to renew the Agreement, the Board requested, and the Adviser provided, information that the Board and Adviser reasonably believed to be necessary to evaluate the Agreement. Among other information, the Board obtained and reviewed the following:
| • | Information regarding the advisory services provided by the Adviser to each Fund; |
| • | The investment objectives of each Fund, which require monthly rebalancing of between 1.25 and 1.75 times the amount of each Fund’s net assets and the utilization of complex financial instruments that are not typical of traditional index tracking mutual funds; |
| • | The level of attention required by the Adviser due to the trading activity of the Funds; |
| • | Information about the professional qualifications of the Adviser’s management team and those employees primarily responsible for providing investment advisory services to the Funds; |
| • | Information regarding each Fund’s contractual fee rate for the prior fiscal year and the contractual fee cap provided by the Operating Expense Limitation Agreement; |
| • | Information regarding advisory fees earned and waivers/reimbursements made by the Adviser in connection with providing services to each Fund for the prior two fiscal years and fiscal year to date; |
| • | Information regarding the services provided by and the fees paid to the Adviser under the Management Services Agreement for the prior year as separate and distinct from the fees paid and the services provided under the Agreement; |
| • | Fund performance information, including the Funds’ tracking error relative to their underlying index both on a statistical and model basis; |
| • | Comparative industry fee data, including peer group comparisons; |
| • | Information regarding the costs investors would incur if they sought to implement independently the Funds’ strategies within their personal portfolios; |
| • | Information regarding the consolidated financial condition and profitability of the Adviser, including how economies of scale are shared with the Funds through reimbursements and waivers; and |
| • | Information regarding how the Adviser monitors the Funds’ compliance with regulatory requirements and Trust procedures. |
The Board considered that, with respect to each Fund, it had also received information relevant to its consideration since the Fund’s inception and, most recently, throughout the past year at executive sessions and regular Board meetings
TABLE OF CONTENTS
Basis for Approval of Investment Advisory Agreement (Unaudited)(Continued)
in connection with its routine oversight of the Funds, including information bearing on the Fund’s performance. In this regard, the Trustees noted that they receive at least quarterly reports on the Funds’ performance and information bearing on the Adviser’s and Funds’ regulatory compliance. The Board received a memorandum from legal counsel regarding its responsibilities with respect to the approval of the Agreement and participated in a question-and-answer session with representatives of the Adviser. The Board carefully evaluated the relevant information, and the Independent Trustees were advised by independent legal counsel with respect to their deliberations.
For each Fund, the Board considered, among other matters, the following factors to the extent applicable: (1) the nature, extent, and quality of the services provided by the Adviser; (2) the investment performance; (3) the profitability of the Fund and the advisory business to the Adviser; (4) the extent to which economies of scale might be realized as the Fund grows and to which the advisory fee rate reflects these economies of scale for the benefit of the Fund’s shareholders; (5) how the Agreement compares in terms of services and fees with contracts entered into by Adviser’s competitors with Peer Funds (as defined below); and (6) other benefits derived or anticipated to be derived and identified by Adviser from its relationship with the Fund. The Board did not identify any particular information that was determinative to its approval of the Agreement, and each Trustee may have afforded different weight to different factors.
Nature, Extent and Quality of Services Provided. The Board reviewed, among other things, the Adviser’s business, assets under management, financial resources and capitalization, quality and quantity of personnel, experience, the variety and complexity of its investment strategies, brokerage practices, and the adequacy of its risk and compliance systems and processes. The Board reviewed the scope of services to be provided by the Adviser under the Agreement and noted there would be no significant differences between the scope of services provided by the Adviser in the past year and those to be provided in the upcoming year. The Board also considered the Adviser’s representation to the Board that it would continue to provide services that are of materially the same quality as the services that have been provided to the Funds in the past, and it considered that those services remain appropriate in scope and extent in light of the Funds’ operations and the competitive and regulatory landscape.
The Board focused on the quality of the Adviser’s personnel, operations, systems and processes required to manage the Funds effectively, and noted that these systems and processes have been consistently enhanced over time and may not be present at other investment advisers. In particular the Board considered, as applicable: (1) the Adviser’s success in achieving each Fund’s monthly leveraged investment objective, including its ability to adapt to changes in the level of assets under management and changes in certain Funds’ stated leverage amount; (2) the techniques the Adviser uses in managing leverage, which include developing index optimization and representative sampling investment strategies for certain Funds as well as specialized agreements and skills for trading and monitoring complex financial instruments; (3) information regarding the Adviser’s management, including risk management, of derivatives trading on behalf of the Funds, including the selection of swap counterparties and the negotiation of favorable derivatives contract terms; (4) the Adviser’s ability to manage certain Funds in a tax efficient manner; and (5) the Adviser’s adherence to the Funds’ compliance policies and procedures; and (6) the size, professional experience and skills of the Adviser’s portfolio management, trading, risk, compliance and legal staff as well as the Adviser’s ability to recruit, train and retain personnel with the experience and expertise necessary to operate the Funds. The Board considered that the Adviser oversees all aspects of the operation of the Funds.
Comparison of Advisory Services and Fees. The Board considered the fairness and reasonableness of the investment advisory fee rate payable to the Adviser by the Funds in light of the investment advisory services provided by the Adviser. In this regard, the Board considered the ability of investors to achieve independently the investment objective of the Funds and the costs to investors of seeking to do so by utilizing a margin account or other means. The Board reviewed information provided by the Adviser comparing the hypothetical cost for shareholders to replicate the Funds’ leveraged and inverse investment strategies by means other than through an investment in a Fund. The Board noted that in past years an independent consultant (the “Consultant”) had reviewed such cost comparison information and determined the methodology used to be unbiased and to constitute a sound and objective approach to doing a cost comparison analysis. The Board concluded that an investor would need to devote significant time to managing his or her portfolio in order to implement independently any Fund’s investment strategy and that seeking to do so would be more expensive than investing in a Fund in many cases, even cost-prohibitive in certain cases. From this perspective, the Board noted the cost effectiveness for investors of investing and trading in the Funds to achieve certain investment objectives.
The Board further considered the fairness and reasonableness of the investment advisory fee rate payable to the Adviser by each Fund in light of fee rates paid by other registered investment companies offering strategies similar in
TABLE OF CONTENTS
Basis for Approval of Investment Advisory Agreement (Unaudited)(Continued)
nature to the Funds. In this regard, the Board reviewed information prepared by the Adviser, using data provided by Morningstar, Inc., to compare the Funds’ contractual advisory fees, expense caps, and gross and net expense ratios with those of other funds that have a similar asset size, investment objective and, if applicable, industry focus (“Peer Group”). The Board considered that in past years the Consultant had reviewed the Adviser’s Peer Group selection methodology and each then-operational Fund’s resulting Peer Group, and determined that the methodology was reasonable, well-documented, transparent, repeatable and well within industry standards. The Board noted the historical difficulty in compiling broad and diverse Peer Groups because, by design, certain Funds are unique and, therefore, few (if any) fund complexes have funds with substantially similar investment objectives and operations.
The Board noted that the Peer Group reports included the contractual advisory fee and net and gross expense ratios, less any Rule 12b-1 fees, for each Fund and each fund in its Peer Group (“Peer Funds”). The Board considered that the Adviser had agreed to limit the total expenses of the Funds (subject to certain exclusions) for the next year by contractually agreeing to pay certain expenses of the Funds under an Operating Expense Limitation Agreement. The Board also noted that currently all of the Funds were operating above the expense cap established by the applicable Operating Expense Limitation Agreement and enjoying the benefit of waivers and/or reimbursements by the Adviser.
Performance of the Funds. In evaluating the performance of the Funds, the Board considered the extent to which the Funds tracked, as applicable, the monthly leveraged or inverse performance of their underlying index. To evaluate the Funds’ tracking of their underlying indices, the Trustees reviewed two measures of tracking error – namely, the correlation of each Fund’s returns to model performance returns for the periods ending June 30, 2024 and June 30, 2023 (“Tracking Difference”), and the standard deviation of the Tracking Differences (“Statistical Tracking Error”). They also reviewed tracking error analysis provided by the Adviser. The Board noted that each Fund’s Tracking Difference was generally within expected ranges, particularly in light of higher interest rates, which contributed significantly to larger Tracking Differences. The Board considered that, given the investment objectives of the Funds, the Funds’ Tracking Difference and the Statistical Tracking Error were more meaningful indicia of the quality of the Adviser’s management than a Fund’s total return. The Board considered the total return of each Fund for the one-year period ended June 30, 2024 and the level of any absolute returns of the Funds. The Board considered reports provided to it in anticipation of the meeting, as well as performance reports provided at regular Board meetings throughout the year.
Costs of Services Provided to the Funds and Profits Realized by the Adviser. The Board reviewed information about the profitability of the Funds to the Adviser based on the fee rates paid under the Agreement. The Board considered the profitability of each Fund to the Adviser and the overall profitability of the Adviser, as reflected in the Adviser’s profitability analysis. In reviewing these materials, the Board considered information provided by the Adviser concerning the methodology it used to allocate various expenses. The Board considered that the Consultant had previously reviewed the profitability information provided by the Adviser and concluded that the Adviser’s methodology for assessing and presenting its profitability annually is transparent and consistent year to year. The Board considered that the Consultant had characterized the materials requested by and provided to the Board as extensive, thoughtful and robust, and providing a reasonable basis for the Board’s deliberations. Against this background, the Board considered that, for the 2024 contract review process, the materials presented by the Adviser to the Board, including the Adviser’s methodology and presentation of profitability, were consistent with the materials evaluated by the Consultant.
In order to assess the reasonableness of the profitability of each Fund to the Adviser, the Board considered the significant drivers of cost for the Adviser including, but not limited to, its acceptance of entrepreneurial risk, its expenditure of intellectual capital, its dedication of personnel resources to monthly portfolio management activities (including rebalancing of the Funds), regulatory compliance and risk mitigation. The Board also reviewed a report provided by the Adviser on the profitability of publicly-held financial services firms with material asset management businesses. In weighing this information, which was compiled by the Adviser using SEC filings and other publicly available documents, the Board considered that, according to the Consultant, the profitability of closely held advisers, such as the Adviser, can vary significantly from the profitability of diversified financial services companies, such as those included in the Adviser’s materials. The Board recognized that it is difficult to evaluate the relative profitability of investment advisory firms, including the Adviser, because many such firms are closely held and do not make such information publicly available. To the extent such information is available for publicly held investment advisers by virtue of their being required to disclose it in various SEC filings, the Board recognized that such reported information is affected by numerous factors that may be unique to the reporting adviser, including the nature of a reporting party’s investor and fund shareholder base, the structure of the adviser, the types of funds it manages, its business mix,
TABLE OF CONTENTS
Basis for Approval of Investment Advisory Agreement (Unaudited)(Continued)
assumptions regarding allocations and the reporting of operating profits and net income (net rather than gross income of distribution and marketing expenses). For these reasons, the Board recognized that it is difficult to assess the reasonableness of the Adviser’s profitability by comparing it to the profitability of publicly reporting investment advisory firms.
Economies of Scale. The Board considered the Adviser’s advisory fee schedule for each Fund as set forth in the Agreement and noted the absence of breakpoints in the fee schedule. The Board accordingly considered the extent to which economies of scale or other efficiencies may result from increases in the Funds’ net assets and not be shared with Fund shareholders. The Board noted that, in prior years, it had reviewed a report from the Consultant that examined the Adviser’s approach to sharing economies of scale, to the extent available, with the Funds. The Board noted the report’s finding that breakpoints are not ubiquitous in the industry and that it is even less common for funds to reach the asset level where breakpoints reduce the fees charged to funds. The Board also noted the report’s finding that smaller funds may benefit more from expense caps, such as those employed by the Funds, than breakpoints. In light of the relatively small size of many of the Funds and the fact that the size of individual Funds in the complex often increase and decrease significantly due to the unlimited trading that is permitted by the Funds, the Board concluded that the Funds have not yet achieved sufficient asset levels to benefit from economies of scale. The Board noted that it will continue to monitor fees and expenses as the Funds grow in size and assess whether fee breakpoints may be warranted.
Other Benefits. The Board considered indirect and “fall-out” benefits that the Adviser or its affiliates may derive from the relationship to the Funds. In this regard, the Board noted that the Funds pay a fee to the Adviser under the Management Services Agreement and such payment is a fall-out benefit. Other benefits to the Adviser of the Funds include that the Adviser may leverage its personnel and infrastructure to manage other accounts and may leverage its relationships in the financial services industry, which are a function of its activities on behalf of the Funds, to build relationships in the industry for itself and its affiliates, which may benefit business lines that are not related to the Funds.
Conclusion. Based on, but not limited to, the above considerations, the Board, including the Independent Trustees, determined that the Agreement for the Funds is fair and reasonable in light of the nature, extent and quality of the services to be performed, the fee rates to be paid, the Adviser’s expenses and profitability and such other matters as the Board considered relevant in the exercise of its business judgment. Accordingly, the Board concluded that the continuation of the Agreement was in the best interests of the Funds and their shareholders. On this basis, the Board voted in favor of the renewal of the Agreement with respect to each Fund.
TABLE OF CONTENTS
SUPPLEMENTAL INFORMATION (UNAUDITED)
FEDERAL TAX INFORMATION
For the year ended August 31, 2024, certain dividends paid by the Funds may be subject to a maximum rate of 15%, as provided for by the Jobs and Growth Tax Relief Reconciliation Act of 2003. The amount of dividends declared from ordinary income designated as qualified income was 0% for each of the Funds.
The Funds are designating as long-term capital gain dividends, pursuant to Internal Revenue Code Section 852(b)(3), the amount necessary to reduce the earnings and profits of the Funds related to net capital gain to zero for the tax year ending August 31, 2024. To the extent necessary to fully distribute such capital gain, the Funds also designate earnings and profits distributed to shareholders on the redemption of shares.
For corporate shareholders, the amount of ordinary income distributions qualifying for the corporate dividends received deduction for the year ended August 31, 2024 was 0% for each of the Funds.
PROXY VOTING POLICIES AND PROCEDURES AND QUARTERLY PORTFOLIO HOLDINGS
The Trust’s Proxy Voting Policies are available without charge by calling 1-800-850-0511, or by accessing the SEC’s website at www.sec.gov.
The actual voting records relating to portfolio securities during the most recent period ended June 30 is available without charge by calling 1-800-850-0511, or by accessing the SEC’s website at www.sec.gov.
The Trust files complete schedule of portfolio holdings with the SEC for its first and third fiscal quarters on Part F of Form N-PORT. The Fund’s Part F of Form N-PORT (and Form N-Q prior to February 28, 2019) is available on the SEC’s website at www.sec.gov.
This report has been prepared for shareholders and may be distributed to others only if preceded or accompanied by a current prospectus.
TABLE OF CONTENTS
Hilton Tactical Income Fund
Schedule of Investments
August 31, 2024
| | | | | | | |
| | | COMMON STOCKS — 35.6%
| | | |
| | | Banks — 2.1%
| | | |
9,300 | | | Bank of America Corp. | | | $ 378,975 |
3,050 | | | Cullen/Frost Bankers, Inc. | | | 342,302 |
3,990 | | | JPMorgan Chase & Co. | | | 896,952 |
17,100 | | | Wells Fargo & Co. | | | 999,837 |
| | | | | | 2,618,066 |
| | | Beverages — 1.8%
| | | |
5,770 | | | PepsiCo, Inc. | | | 997,518 |
17,015 | | | The Coca-Cola Co. | | | 1,233,077 |
| | | | | | 2,230,595 |
| | | Biotechnology — 0.6%
| | | |
2,015 | | | Amgen, Inc. | | | 672,667 |
| | | Building Products — 0.5%
| | | |
8,795 | | | Carrier Global Corp. | | | 640,100 |
| | | Capital Markets — 2.8%
| | | |
7,305 | | | Ares Management Corp. | | | 1,069,452 |
4,535 | | | Blackstone, Inc. | | | 645,602 |
31,890 | | | Blue Owl Capital, Inc. | | | 562,540 |
2,255 | | | The Goldman Sachs Group Inc. | | | 1,150,614 |
| | | | | | 3,428,208 |
| | | Chemicals — 0.4%
| | | |
4,800 | | | LyondellBasell Industries NV (Netherlands) | | | 473,760 |
| | | Commercial Services & Supplies — 1.2%
| | | |
7,145 | | | Republic Services, Inc. | | | 1,487,660 |
| | | Consumer Staples Distribution & Retail — 1.6%
| | | |
3,995 | | | Target Corp. | | | 613,712 |
17,165 | | | Walmart, Inc. | | | 1,325,653 |
| | | | | | 1,939,365 |
| | | Electrical Equipment — 0.4%
| | | |
8,710 | | | Schneider Electric SE (France) | | | 442,120 |
| | | Financial Services — 0.7%
| | | |
7,835 | | | Apollo Global Management, Inc. | | | 906,745 |
| | | Food Products — 0.4%
| | | |
6,275 | | | McCormick & Co., Inc. | | | 502,188 |
| | | Health Care Providers & Services — 1.4%
| | | |
1,520 | | | UnitedHealth Group, Inc. | | | 897,104 |
5,495 | | | Quest Diagnostics, Inc. | | | 862,550 |
| | | | | | 1,759,654 |
| | | Health Care REITs — 0.3%
| | | |
17,245 | | | American Healthcare REIT, Inc. | | | 360,938 |
| | | | | | | |
The accompanying notes are an integral part of these financial statements.
TABLE OF CONTENTS
Hilton Tactical Income Fund
Schedule of Investments
August 31, 2024(Continued)
| | | | | | | |
| | | COMMON STOCKS — (Continued)
| | | |
| | | Hotels, Restaurants & Leisure — 1.3%
| | | |
3,365 | | | Darden Restaurants, Inc. | | | $ 532,175 |
3,875 | | | McDonald’s Corp. | | | 1,118,557 |
| | | | | | 1,650,732 |
| | | Industrial Conglomerates — 0.3%
| | | |
1,725 | | | Honeywell International, Inc. | | | 358,645 |
| | | Industrial REITs — 0.8%
| | | |
7,240 | | | Prologis, Inc. | | | 925,417 |
| | | Interactive Media & Services — 1.8%
| | | |
13,580 | | | Alphabet, Inc. | | | 2,242,194 |
| | | IT Services — 3.0%
| | | |
3,170 | | | Accenture PLC (Ireland) | | | 1,083,982 |
8,335 | | | Booz Allen Hamilton Holding Corp. | | | 1,323,431 |
7,590 | | | Thomson Reuters Corp. | | | 1,299,256 |
| | | | | | 3,706,669 |
| | | Pharmaceuticals — 2.9%
| | | |
16,855 | | | AstraZeneca PLC (United Kingdom) | | | 1,476,835 |
1,645 | | | Eli Lilly & Co. | | | 1,579,233 |
4,535 | | | Merck & Co., Inc. | | | 537,171 |
| | | | | | 3,593,239 |
| | | Residential REITs — 1.1%
| | | |
5,880 | | | AvalonBay Communities, Inc. | | | 1,327,292 |
| | | Semiconductors & Semiconductor Equipment — 1.6%
| | | |
2,025 | | | Applied Materials, Inc. | | | 475,551 |
3,605 | | | Broadcom, Inc. | | | 586,966 |
5,580 | | | Taiwan Semiconductor Manufacturing Co Ltd. (China) | | | 958,086 |
| | | | | | 2,020,603 |
| | | Software — 2.7%
| | | |
6,350 | | | Microsoft Corp. | | | 2,648,839 |
5,190 | | | Oracle Corp. | | | 733,295 |
| | | | | | 3,382,134 |
| | | Specialized REITs — 1.1%
| | | |
3,945 | | | Public Storage | | | 1,355,975 |
| | | Specialty Retail — 2.5%
| | | |
3,105 | | | The Home Depot, Inc. | | | 1,144,193 |
8,460 | | | The TJX Companies, Inc. | | | 992,104 |
3,675 | | | Tractor Supply Co. | | | 983,246 |
| | | | | | 3,119,543 |
| | | Technology Hardware, Storage & Peripherals — 2.0%
| | | |
10,670 | | | Apple, Inc. | | | 2,443,430 |
| | | | | | | |
The accompanying notes are an integral part of these financial statements.
TABLE OF CONTENTS
Hilton Tactical Income Fund
Schedule of Investments
August 31, 2024(Continued)
| | | | | | | |
| | | COMMON STOCKS — (Continued)
| | | |
| | | Trading Companies & Distributors — 0.3%
| | | |
3,695 | | | ITOCHU Corp. (Japan) | | | $ 390,857 |
| | | TOTAL COMMON STOCKS
(Cost $30,764,430) | | | $43,978,796 |
| | | INVESTMENT COMPANIES — 34.5%
| | | |
57,890 | | | Alerian MLP ETF(a) | | | $2,739,934 |
34,225 | | | Ares Capital Corp.(a) | | | 721,463 |
5,510 | | | Communication Services Select Sector SPDR Fund(a) | | | 481,133 |
18,130 | | | FS KKR Capital Corp.(a) | | | 366,770 |
70,755 | | | iShares MBS ETF(a) | | | 6,738,706 |
132,285 | | | iShares Preferred & Income Securities ETF(a) | | | 4,280,743 |
156,905 | | | Janus Henderson AAA CLO ETF (a) | | | 7,988,034 |
91,265 | | | JPMorgan Nasdaq Equity Premium Income ETF(a) | | | 4,935,611 |
71,640 | | | Simplify MBS ETF(a) | | | 3,675,132 |
100,535 | | | SPDR Blackstone Senior Loan ETF(a) | | | 4,207,390 |
33,515 | | | Utilities Select Sector SPDR Fund(a) | | | 2,556,859 |
27,965 | | | Vanguard Short-Term Corporate Bond ETF(a) | | | 2,206,718 |
28,325 | | | Vanguard Short-Term Treasury ETF(a) | | | 1,664,660 |
| | | TOTAL INVESTMENT COMPANIES
(Cost $40,602,438) | | | $42,563,153 |
| | | CORPORATE BONDS — 19.5%
| | | |
| | | Aerospace & Defense — 0.9%
| | | |
605,000 | | | Lockheed Martin Corp.
5.10%, 11/15/2027 | | | $622,104 |
570,000 | | | Raytheon Technologies Corp.
4.13%, 11/16/2028 | | | 562,973 |
| | | | | | 1,185,077 |
| | | Banks — 0.4%
| | | |
460,000 | | | The PNC Financial Services Group, Inc.
5.35%, 12/02/2028 | | | 472,778 |
| | | Biotechnology — 0.4%
| | | |
505,000 | | | AbbVie, Inc.
4.80%, 03/15/2029 | | | 516,059 |
| | | Broadline Retail — 0.7%
| | | |
835,000 | | | Amazon.com, Inc.
4.65%, 12/01/2029 | | | 856,926 |
| | | Building Products — 0.5%
| | | |
590,000 | | | Lennox International, Inc.
5.50%, 09/15/2028 | | | 609,358 |
| | | Capital Markets — 1.9%
| | | |
710,000 | | | Ares Capital Corp.
7.00%, 01/15/2027 | | | 736,686 |
| | | | | | | |
The accompanying notes are an integral part of these financial statements.
TABLE OF CONTENTS
Hilton Tactical Income Fund
Schedule of Investments
August 31, 2024(Continued)
| | | | | | | |
| | | CORPORATE BONDS — (Continued)
| | | |
| | | Capital Markets — (Continued)
| | | |
200,000 | | | Ares Management Corp.
6.38%, 11/10/2028 | | | $ 213,500 |
300,000 | | | Blackstone Secured Lending Fund
5.88%, 11/15/2027 | | | 303,327 |
590,000 | | | Nasdaq, Inc.
5.35%, 06/28/2028 | | | 609,587 |
535,000 | | | The Goldman Sachs Group, Inc.
5.28%, 03/18/2027 | | | 539,242 |
| | | | | | 2,402,342 |
| | | Communications Equipment — 0.6%
| | | |
790,000 | | | Cisco Systems, Inc.
4.80%, 02/26/2027 | | | 802,913 |
| | | Consumer Finance — 1.5%
| | | |
895,000 | | | American Express Co.
5.10%, 02/16/2028 | | | 906,936 |
895,000 | | | Toyota Motor Credit Corp.
4.63%, 01/12/2028 | | | 904,707 |
| | | | | | 1,811,643 |
| | | Consumer Staples Distribution & Retail — 1.1%
| | | |
615,000 | | | The Kroger Co.
4.65%, 09/15/2029 | | | 615,119 |
765,000 | | | Walmart, Inc.
3.95%, 09/09/2027 | | | 766,436 |
| | | | | | 1,381,555 |
| | | Entertainment — 0.5%
| | | |
550,000 | | | Netflix, Inc.
5.88%, 11/15/2028 | | | 582,296 |
| | | Financial Services — 0.9%
| | | |
200,000 | | | Athene Holding Ltd.
4.13%, 01/12/2028 | | | 196,127 |
525,000 | | | John Deere Capital Corp.
4.15%, 09/15/2027 | | | 525,322 |
420,000 | | | Mastercard, Inc.
4.88%, 03/09/2028 | | | 431,561 |
| | | | | | 1,153,010 |
| | | Household Products — 0.4%
| | | |
570,000 | | | The Procter & Gamble Company
3.95%, 01/26/2028 | | | 568,661 |
| | | Industrial REITs — 0.7%
| | | |
830,000 | | | Prologis LP
4.88%, 06/15/2028 | | | 844,923 |
| | | | | | | |
The accompanying notes are an integral part of these financial statements.
TABLE OF CONTENTS
Hilton Tactical Income Fund
Schedule of Investments
August 31, 2024(Continued)
| | | | | | | |
| | | CORPORATE BONDS — (Continued)
| | | |
| | | Insurance — 0.5%
| | | |
585,000 | | | Marsh & McLennan Cos, Inc.
4.38%, 03/15/2029 | | | $ 587,158 |
| | | Interactive Media & Services — 0.5%
| | | |
600,000 | | | Meta Platforms, Inc.
3.50%, 08/15/2027 | | | 591,171 |
| | | IT Services — 0.3%
| | | |
330,000 | | | PayPal Holdings, Inc.
3.90%, 06/01/2027 | | | 327,423 |
| | | Life Sciences Tools & Services — 0.6%
| | | |
760,000 | | | Thermo Fisher Scientific, Inc.
5.00%, 01/31/2029 | | | 781,482 |
| | | Media — 0.4%
| | | |
475,000 | | | Comcast Corp.
4.15%, 10/15/2028 | | | 471,665 |
| | | Oil, Gas & Consumable Fuels — 0.5%
| | | |
590,000 | | | The Williams Cos., Inc.
5.30%, 08/15/2028 | | | 605,269 |
| | | Pharmaceuticals — 1.6%
| | | |
950,000 | | | AstraZeneca Finance LLC
4.80%, 02/26/2027 | | | 963,099 |
585,000 | | | Merck & Co, Inc.
4.05%, 05/17/2028 | | | 585,452 |
455,000 | | | Pfizer, Inc.
3.60%, 09/15/2028 | | | 445,563 |
| | | | | | 1,994,114 |
| | | Retail REITs — 0.5%
| | | |
570,000 | | | Realty Income Corp.
4.85%, 03/15/2030 | | | 578,212 |
| | | Semiconductors & Semiconductor Equipment — 1.8%
| | | |
615,000 | | | Broadcom, Inc.
5.05%, 07/12/2029 | | | 627,132 |
590,000 | | | Microchip Technology, Inc.
5.05%, 03/15/2029 | | | 601,784 |
950,000 | | | Texas Instruments, Inc.
4.60%, 02/15/2028 | | | 964,158 |
| | | | | | 2,193,074 |
| | | Software — 0.7%
| | | |
570,000 | | | Intuit, Inc.
5.13%, 09/15/2028 | | | 589,147 |
310,000 | | | Oracle Corp.
2.88%, 03/25/2031 | | | 277,812 |
| | | | | | 866,959 |
| | | | | | | |
The accompanying notes are an integral part of these financial statements.
TABLE OF CONTENTS
Hilton Tactical Income Fund
Schedule of Investments
August 31, 2024(Continued)
| | | | | | | |
| | | CORPORATE BONDS — (Continued)
| | | |
| | | Specialized REITs — 0.5%
| | | |
555,000 | | | Extra Space Storage LP
5.70%, 04/01/2028 | | | $ 573,215 |
| | | Specialty Retail — 0.4%
| | | |
485,000 | | | The Home Depot, Inc.
4.88%, 06/25/2027 | | | 494,442 |
| | | Technology Hardware, Storage & Peripherals — 0.7%
| | | |
830,000 | | | Apple, Inc.
4.00%, 05/10/2028 | | | 833,079 |
| | | TOTAL CORPORATE BONDS
(Cost $23,686,997) | | | $24,084,804 |
| | | U.S. GOVERNMENT OBLIGATIONS — 6.7%
| | | |
| | | U.S. Treasury Note
| | | |
4,535,000 | | | 4.13%, 09/30/2027 | | | $4,581,236 |
3,460,000 | | | 5.50%, 08/15/2028 | | | 3,693,144 |
| | | TOTAL U.S. GOVERNMENT OBLIGATIONS
(Cost $8,052,339) | | | $8,274,380 |
| | | PREFERRED STOCKS — 1.0%
| | | |
| | | Banks — 0.5%
| | | |
11,000 | | | Pinnacle Financial Partners, Inc.
6.75%, 09/01/2173 | | | $265,430 |
13,500 | | | Wintrust Financial Corp.
6.88%, 10/15/2172 | | | 337,500 |
| | | | | | 602,930 |
| | | Capital Markets — 0.4%
| | | |
9,400 | | | Atlantic Union Bankshares Corp.
6.88%, 09/03/2173 | | | 228,420 |
9,800 | | | WesBanco, Inc.
6.75%, 08/15/2173 | | | 242,550 |
| | | | | | 470,970 |
| | | Financial Services — 0.1%
| | | |
6,500 | | | Apollo Global Management, Inc.
7.63%, 09/15/2053 | | | 171,535 |
| | | TOTAL PREFERRED STOCKS
(Cost $1,281,362) | | | $1,245,435 |
| | | Total Investments — 97.3%
(Cost $104,387,566) | | | $120,146,568 |
| | | Other Assets in Excess of Liabilities — 2.7% | | | 3,322,646 |
| | | Total Net Assets — 100.0% | | | $123,469,214 |
| | | | | | | |
The accompanying notes are an integral part of these financial statements.
TABLE OF CONTENTS
Hilton Tactical Income Fund
Schedule of Investments
August 31, 2024(Continued)
Percentages are stated as a percent of net assets.
The geographic location of all investments is United States unless otherwise indicated.
(a)
| Shareholders may obtain the financial statements of these investment companies at www.sec.gov. |
REIT - Real Estate Investment Trust
The Global Industry Classification Standard (GICS®) was developed by and/or is the exclusive property of MSCI, Inc. and Standard & Poor’s Financial Services LLP (“S&P”).
GICS is a service mark of MSCI and S&P and has been licensed for use by U.S. Bank Global Fund Services, LLC.
The accompanying notes are an integral part of these financial statements.
TABLE OF CONTENTS
Hilton Tactical Income Fund
Statement of Assets and Liabilities
August 31, 2024
| | | | |
ASSETS:
| | | |
Investments, at fair value (Note 2) | | | $120,146,568 |
Cash | | | 2,211,404 |
Receivable for Fund shares sold | | | 152,551 |
Receivable for investments sold | | | 830,072 |
Dividends, interest and reclaims receivable | | | 467,754 |
Prepaid expenses and other assets | | | 11,624 |
Total Assets | | | 123,819,973 |
LIABILITIES:
| | | |
Payable for Fund shares redeemed | | | 198,547 |
Payable for investment securities purchased | | | 26,009 |
Due to Adviser, net (Note 4) | | | 58,224 |
Accrued distribution expenses | | | 3,867 |
Accrued expenses and other liabilities | | | 64,112 |
Total Liabilities | | | 350,759 |
NET ASSETS | | | $123,469,214 |
Net Assets Consist of:
| | | |
Capital stock | | | $109,683,593 |
Total distributable earnings | | | 13,785,621 |
Net Assets | | | $123,469,214 |
Cost of Investments | | | $104,387,566 |
CALCULATION OF NET ASSET VALUE PER SHARE:
| | | |
Institutional Class Shares:
| | | |
Net assets | | | $105,245,108 |
Shares outstanding (unlimited shares of beneficial interest authorized, par value) | | | 5,792,139 |
Net asset value, redemption price and offering price per share | | | $18.17 |
Investor Class Shares:
| | | |
Net assets | | | $18,224,106 |
Shares outstanding (unlimited shares of beneficial interest authorized, par value) | | | 1,005,124 |
Net asset value, redemption price and offering price per share | | | $18.13 |
| | | | |
The accompanying notes are an integral part of these financial statements.
TABLE OF CONTENTS
Hilton Tactical Income Fund
Statement of Operations
For the Year Ended August 31, 2024
| | | | |
Investment Income:
| | | |
Dividend income (net of withholding tax of $7,931) | | | $2,817,233 |
Interest income | | | 2,023,053 |
Total investment income | | | 4,840,286 |
Expenses:
| | | |
Investment advisory fees (Note 4) | | | 934,600 |
Accounting fees | | | 126,602 |
Professional fees | | | 97,709 |
State registration fees | | | 40,961 |
Distribution expenses – Investor Class (Note 4) | | | 40,431 |
Management service fees (Note 4) | | | 29,025 |
Reports to shareholders | | | 20,745 |
Insurance fees | | | 19,235 |
Trustees’ fees | | | 19,001 |
Administration fees | | | 13,221 |
Other | | | 4,979 |
Total expenses | | | 1,346,509 |
Less: Reimbursement of expenses from Adviser (Note 4) | | | (276,835) |
Net expenses | | | 1,069,674 |
Net investment income | | | 3,770,612 |
Realized and unrealized gain on investments:
| | | |
Net realized gain on:
| | | |
Investments | | | 3,458,503 |
| | | 3,458,503 |
Change in net unrealized appreciation on:
| | | |
Investments | | | 8,694,468 |
| | | 8,694,468 |
Net realized and unrealized gain | | | 12,152,971 |
Net increase in net assets resulting from operations | | | $15,923,583 |
| | | | |
The accompanying notes are an integral part of these financial statements.
TABLE OF CONTENTS
Hilton Tactical Income Fund
Statement of Changes in Net Assets
| | | | |
Increase (decrease) in net assets from:
| | | | | | |
Operations:
| | | | | | |
Net investment income | | | $3,770,612 | | | $3,039,532 |
Net realized gain (loss) | | | 3,458,503 | | | (4,608,223) |
Change in net unrealized appreciation | | | 8,694,468 | | | 2,945,766 |
Net increase in net assets resulting from operations | | | 15,923,583 | | | 1,377,075 |
Distributions to shareholders:
| | | | | | |
Net distributions to shareholders
| | | | | | |
Institutional Class Shares | | | (3,290,752) | | | (2,651,675) |
Investor Class Shares | | | (482,957) | | | (385,717) |
Return of capital
| | | | | | |
Institutional Class Shares | | | (194,020) | | | (421,269) |
Investor Class Shares | | | (28,475) | | | (61,278) |
Total distributions to shareholders | | | (3,996,204) | | | (3,519,939) |
Capital share transactions:
| | | | | | |
Total decrease in net assets from net change in capital share transactions(a) | | | (3,480,242) | | | (2,886,130) |
Total increase (decrease) in net assets | | | 8,447,137 | | | (5,028,994) |
Net assets:
| | | | | | |
Beginning of year | | | 115,022,077 | | | 120,051,071 |
End of year | | | $123,469,214 | | | $115,022,077 |
| | | | | | | |
(a)
| Summary of capital share transactions is as follows: |
| | |
Shares sold
| | | | | | | | | | | | |
Institutional Class Shares | | | 1,306,238 | | | $22,346,230 | | | 1,426,279 | | | $23,375,516 |
Investor Class Shares | | | 292,770 | | | 5,015,714 | | | 221,521 | | | 3,586,339 |
Shares issued in reinvestment of distributions
| | | | | | | | | | | | |
Institutional Class Shares | | | 197,044 | | | 3,352,625 | | | 179,281 | | | 2,937,929 |
Investor Class Shares | | | 26,704 | | | 455,015 | | | 24,055 | | | 393,464 |
Shares redeemed
| | | | | | | | | | | | |
Institutional Class Shares | | | (1,838,397) | | | (31,455,923) | | | (1,580,432) | | | (25,764,913) |
Investor Class Shares | | | (186,869) | | | (3,193,903) | | | (454,050) | | | (7,414,465) |
Net decrease | | | (202,510) | | | $(3,480,242) | | | (183,346) | | | $(2,886,130) |
| | | | | | | | | | | | | |
The accompanying notes are an integral part of these financial statements.
TABLE OF CONTENTS
Financial Highlights
August 31, 2024
| | | | | | | | | | |
Hilton Tactical Income Fund
| | | | | | | | | | | | | | | | | | | | | | | | | | | | | | | | | | | | | | | | | | | | | | | | |
Institutional Class Shares
| | | | | | | | | | | | | | | | | | | | | | | | | | | | | | | | | | | | | | | | | | | | | | | | |
Year ended August 31, 2024 | | | $16.44 | | | $0.55 | | | $1.76 | | | $2.31 | | | $(0.55) | | | $ — | | | $(0.03) | | | $(0.58) | | | $ —5 | | | $18.17 | | | 14.38% | | | $105,245 | | | 1.10% | | | 0.87% | | | 3.22% | | | 83% |
Year ended August 31, 2023 | | | 16.72 | | | 0.43 | | | (0.21) | | | 0.22 | | | (0.43) | | | — | | | (0.07) | | | (0.50) | | | —5 | | | 16.44 | | | 1.37% | | | 100,711 | | | 1.15% | | | 0.87% | | | 2.65% | | | 93% |
Year ended August 31, 2022 | | | 18.51 | | | 0.21 | | | (1.51) | | | (1.30) | | | (0.49) | | | — | | | — | | | (0.49) | | | —5 | | | 16.72 | | | −7.13% | | | 102,016 | | | 1.09% | | | 0.87% | | | 1.17% | | | 103% |
Year ended August 31, 2021 | | | 16.27 | | | 0.25 | | | 2.49 | | | 2.74 | | | (0.27) | | | — | | | (0.23) | | | (0.50) | | | —5 | | | 18.51 | | | 17.19% | | | 104,044 | | | 1.10% | | | 0.87% | | | 1.45% | | | 112% |
Year ended August 31, 2020 | | | 17.41 | | | 0.40 | | | (0.97) | | | (0.57) | | | (0.27) | | | — | | | (0.30) | | | (0.57) | | | —5 | | | 16.27 | | | −3.26% | | | 87,894 | | | 1.18% | | | 0.93% | | | 2.40% | | | 101% |
Investor Class Shares
| | | | | | | | | | | | | | | | | | | | | | | | | | | | | | | | | | | | | | | | | | | | | | | | |
Year ended August 31, 2024 | | | 16.40 | | | 0.51 | | | 1.76 | | | 2.27 | | | (0.51) | | | — | | | (0.03) | | | (0.54) | | | —5 | | | 18.13 | | | 14.12% | | | 18,224 | | | 1.35% | | | 1.12% | | | 2.98% | | | 83% |
Year ended August 31, 2023 | | | 16.68 | | | 0.39 | | | (0.21) | | | 0.18 | | | (0.40) | | | — | | | (0.06) | | | (0.46) | | | —5 | | | 16.40 | | | 1.12% | | | 14,311 | | | 1.40% | | | 1.12% | | | 2.38% | | | 93% |
Year ended August 31, 2022 | | | 18.48 | | | 0.16 | | | (1.51) | | | (1.35) | | | (0.45) | | | — | | | — | | | (0.45) | | | —5 | | | 16.68 | | | −7.41% | | | 18,035 | | | 1.34% | | | 1.12% | | | 0.92% | | | 103% |
Year ended August 31, 2021 | | | 16.24 | | | 0.20 | | | 2.50 | | | 2.70 | | | (0.25) | | | — | | | (0.21) | | | (0.46) | | | —5 | | | 18.48 | | | 16.94% | | | 20,160 | | | 1.34% | | | 1.12% | | | 1.18% | | | 112% |
Year ended August 31, 2020 | | | 17.38 | | | 0.34 | | | (0.95) | | | (0.61) | | | (0.25) | | | — | | | (0.28) | | | (0.53) | | | —5 | | | 16.24 | | | −3.49% | | | 13,244 | | | 1.42% | | | 1.18% | | | 2.06% | | | 101% |
| | | | | | | | | | | | | | | | | | | | | | | | | | | | | | | | | | | | | | | | | | | | | | | | | |
1
| Net investment income per share represents net investment income divided by the daily average shares of benefiicial interest outstanding throughout each year. |
2
| All returns reflect reinvested dividends, if any, but do not reflect the impact of taxes. Total return for a period of less than one year is not annualized. |
3
| Net expenses include effects of any reimbursement. |
4
| Portfolio turnover rate is not annualized and is calculated without regard to short-term securities have a maturity of less than one year. |
5
| Amount is less than $0.005. Redemption Fees Paid to Fund are included in the Statement of Changes in Net Assets “Shares redeemed” for each share class. |
The accompanying notes are an integral part of these financial statements.
TABLE OF CONTENTS
Direxion Funds
NOTES TO THE FINANCIAL STATEMENTS
August 31, 2024
1. ORGANIZATION
Direxion Funds (the “Trust”) was organized as a Massachusetts Business Trust on June 6, 1997, and is registered under the Investment Company Act of 1940, as amended (the “1940 Act”), as an open-end management investment company issuing its shares in series, each series representing a distinct portfolio with its own investment objective and policies. The Trust currently has eight series, of which one is included in this report: the Hilton Tactical Income Fund (the “Fund”). The Fund is a diversified series of the Trust pursuant to the 1940 Act. The Fund currently offers Investor Class and Institutional Class shares. Institutional Class shares are made available through investment advisers, banks, trust companies or authorized representatives without a sales charge. Rafferty Asset Management, LLC serves as adviser to the Fund (the “Adviser”) and Hilton Capital Management, LLC serves as the Fund’s subadviser (the “Subadviser”).
The Fund primarily seeks income with a secondary investment objective of capital appreciation consistent with the preservation of capital. The Fund pursues its investment objective by utilizing an investment strategy that employs a disciplined approach to balancing fixed income investments with historically higher income producing equity securities, with a focus on minimizing absolute risk and volatility. The Subadviser attempts to mitigate portfolio risk and volatility by creating a diversified portfolio of income producing securities that also offer the potential for capital appreciation. These securities may include common and preferred stocks of any capitalization, master limited partnerships (“MLPs”), real estate investment trusts (“REITs”), and a variety of debt instruments of any maturity, including corporate bonds, exchange-traded notes, municipal bonds, and securities issued, backed, or otherwise guaranteed by the U.S. Government or its agencies.
The Trust has evaluated the structure, objective and activities of the Fund and determined that it meets the characteristics of an investment company. As such, these financial statements have applied the guidance as set forth in the Accounting Standards Codifications (“ASC”) 946, “Financial Services - Investment Companies”.
2. SIGNIFICANT ACCOUNTING POLICIES
The following is a summary of significant accounting policies consistently followed by the Fund in the preparation of its financial statements. These policies are in conformity with U.S. generally accepted accounting principles (“GAAP”).
a) Investment Valuation – The Net Asset Value (“NAV”) of the Fund is determined daily, Monday through Friday, as of the close of regular trading on the New York Stock Exchange (“NYSE”), each day the NYSE is open for business. The value of all portfolio securities and other assets held by the Fund will be determined as of the time the Fund calculates its NAV, 4:00 p.m. Eastern Time (“Valuation Time”). Equity securities, including common stocks, preferred stocks, exchange-traded funds, closed-end funds, MLPs and REITs and over-the-counter securities are valued at their last sales price or, if not available, at the average of the last bid and ask prices. Securities primarily traded on the NASDAQ National Market are valued using the NASDAQ Official Closing Price. Investments in open-end mutual funds, including money market funds, are valued at their respective quoted NAV on the valuation date. Asset-backed securities, convertible bonds and corporate bonds are valued using the mean between the closing bid and ask price furnished by an independent pricing service. Securities for which reliable market quotations are not readily available, the Fund’s pricing service does not provide a valuation for such securities, the Fund’s pricing service provides valuation that in the judgment of the Adviser does not represent fair value, or the Fund or Adviser believes the market price is stale, are fair valued as determined by the Adviser under the supervision of the Board of Trustees. Additionally, the Adviser will monitor developments in the marketplace for significant events that may affect the value of those securities whose closing prices were established before the Valuation Time.
b) Investment Transactions – Investment transactions are recorded on trade date. The Fund determines the gain or loss realized from investment transactions by comparing the identified cost, which is the same basis used for federal income tax purposes, with the net sales proceeds.
c) Federal Income Taxes – The Fund intends to comply with the requirements of Subchapter M of the Internal Revenue Code of 1986, as amended, necessary to qualify as a regulated investment company and to make the requisite distributions of income and capital gains to its shareholders sufficient to relieve it from all or substantially all Federal income taxes and excise taxes. No provision for Federal income taxes has been made.
TABLE OF CONTENTS
Direxion Funds
NOTES TO THE FINANCIAL STATEMENTS
August 31, 2024(Continued)
d) Income and Expenses – Dividend income is recorded on the ex-dividend date. Distributions received from the Fund’s investments in investment companies and REITs are accounted for based on the tax character of the distribution and can be comprised of ordinary income, capital gains and return of capital, as applicable. Interest income, including amortization of premium and discount, and dividends received from money market funds, is recognized on an accrual basis. Discounts and premiums on securities purchased are amortized over the expected life of the respective securities. Expenses are computed based on the Fund’s respective average daily net assets. Other than class specific expenses, income and expenses are allocated to each class of shares based upon relative net assets. For an additional discussion on expenses, refer to Note 4.
e) Foreign Currency – Certain assets, such as receivables for foreign dividends and foreign tax reclaims, denominated in foreign currencies are translated into U.S. Dollar amounts at the date of valuation. Foreign dividend income denominated in foreign currencies is translated into U.S. Dollar amounts on the respective dates of such transactions. Realized gains or losses on foreign currency exchange are presented on the Statement of Operations as realized gain or loss on foreign currency and arise from the difference between the amounts of foreign dividends recorded on the Fund’s books, and the U.S. dollar equivalent of the amounts actually received. Net unrealized foreign currency exchange gains and losses are presented on the Statement of Operations as unrealized appreciation or deprecation on foreign receivables and arise from changes in the value of foreign tax reclaim receivables resulting from changes in the exchange rate.
f) Risks of Investing in Foreign Securities – Investment in foreign securities involve greater risk than investing in domestic securities. As a result, a Fund’s returns and net asset values may be affected to a large degree by fluctuations in currency exchange rates, political, diplomatic, or economic conditions and regulatory requirements in other countries. The laws and accounting, auditing, and financial reporting standards in foreign countries may require less disclosure than required in the U.S., and there may be less public information available about foreign companies. Investments in foreign emerging markets present a greater risk than investing in foreign issuers in general. The risk of political or social upheaval is greater in emerging markets. In addition, there may be risks of an economy’s dependence on revenues from particular commodities, currency transfer restrictions, a limited number of buyers for such securities and delays and disruptions in securities settlement procedures.
g) Distributions to Shareholders – The Fund will make distributions of net investment income, if any, monthly. The Fund will also distribute net realized capital gains, if any, annually. Income and capital gain distributions are determined in accordance with income tax regulations, which may differ from GAAP. Distributions to shareholders are recorded on the ex-dividend date.
The tax character of distributions during the years ended August 31, 2024 and August 31, 2023, were as follows:
| | | | |
Distributions paid from:
| | | | | | |
Ordinary Income | | | $3,773,709 | | | $3,037,392 |
Return of Capital | | | 222,495 | | | 482,547 |
Total Distributions paid | | | $3,996,204 | | | $3,519,939 |
| | | | | | | |
The Fund is designating as long-term capital gain dividends, pursuant to Internal Revenue Code 852(b)(3), the amount necessary to reduce the earnings and profits of the Fund related to net capital gain to zero for the tax year ended August 31, 2024. To the extent necessary to fully distribute such capital gains, the Fund is also designating earnings and profits distributed to shareholders on the redemption of shares.
TABLE OF CONTENTS
Direxion Funds
NOTES TO THE FINANCIAL STATEMENTS
August 31, 2024(Continued)
As of August 31, 2024, the components of accumulated earnings/losses of the Fund on a tax basis were as follows:
| | | | |
Tax cost of investments | | | $104,430,381 |
Gross unrealized appreciation | | | 15,939,176 |
Gross unrealized depreciation | | | (222,989) |
Net unrealized appreciation/(depreciation) | | | $15,716,187 |
Undistributed ordinary income | | | — |
Undistributed long-term capital gain | | | — |
Total distributable earnings | | | — |
Other accumulated gain/(loss) | | | (1,930,566) |
Total accumulated earnings/(losses) | | | $13,785,621 |
| | | | |
The difference between book cost of investments and tax cost of investments is attributable primarily to the tax deferral of losses on wash sales.
On the Statement of Assets and Liabilities, the following adjustments were made for permanent tax differences between accounting total distributable earnings and capital stock under GAAP and tax reporting:
GAAP requires that certain components of net assets relating to permanent differences be reclassified between financial and tax reporting. These reclassifications have no effect on net assets or net asset value per share. For the year ended August 31, 2024, the permanent differences primarily relate to prior year return of capital distributions to shareholders.
In order to meet certain excise tax distribution requirements, the Fund is required to measure and distribute annually net capital gains realized during a twelve-month period ending October 31 and net investment income earned during a twelve-month period ending December 31. In connection with this, the Fund is permitted for tax purposes to defer into its next fiscal year qualified late year losses. Qualified late year capital losses are any net capital losses incurred between November 1 and the end of its fiscal year, August 31, 2024. Qualified late year ordinary losses are generally losses incurred between January 1 and the end of its fiscal year, August 31, 2024. For the year ended August 31, 2024, the Fund deferred $0 of qualified late year losses.
Under the Regulated Investment Company Modernization Act of 2010, net capital losses recognized for tax years beginning after December 22, 2010, may be carried forward indefinitely, and their character is retained as short-term and/or long-term. As of August 31, 2024, the Fund had short-term and long-term capital loss carryforwards on a tax basis of $1,930,566 and $0, respectively. The Fund utilized $3,413,142 of prior year capital losses.
The Fund follows authoritative financial reporting rules regarding recognition and measurement of tax positions taken or expected to be taken on a tax return. The Fund has reviewed all open tax years and concluded that there is no effect to the Fund’s financial positions or results of operations and no tax liability resulting from unrecognized tax benefits relating to uncertain income tax position taken or expected to be taken on a tax return. The Fund recognizes interest and penalties, if any, related to unrecognized tax benefits as income tax expense in the Statement of Operations. During this period, the Fund did not incur any interest or penalties. Open tax years are those years that are open for examination by the relevant income taxing authority. As of August 31, 2024, open Federal and state income tax years include the tax years ended August 31, 2021 through August 31, 2024. The Fund has no examination in progress. The Fund is also not aware of any tax positions for which it is reasonably possible that the total amounts of unrecognized tax expense will significantly change in the next twelve months.
h) Use of Estimates – The preparation of financial statements in conformity with GAAP requires management to make estimates and assumptions that affect the reported amounts of assets and liabilities and disclosure of contingent
TABLE OF CONTENTS
Direxion Funds
NOTES TO THE FINANCIAL STATEMENTS
August 31, 2024(Continued)
assets and liabilities at the date of the financial statements and the reported amounts of revenues and expenses during the reporting period. Actual results could differ from those estimates.
3. INVESTMENT TRANSACTIONS
During the year ended August 31, 2024, the aggregate purchases and sales of investments (excluding short-term investments) in the Fund were $95,751,984 and $98,684,496 respectively.
Of the aggregate purchases and sales of investments in the Fund during the year ended August 31, 2024, $12,457,587 were purchases of long-term U.S. Government securities and $42,727,181 were sales of long-term U.S. Government securities.
4. INVESTMENT ADVISORY FEE AND OTHER AGREEMENTS
Investment Advisory Agreement: The Fund has entered into an investment advisory agreement with the Adviser. The Adviser earns a fee, computed daily and payable monthly, applied to the Fund’s average daily net assets at an annual rate of 0.79%.
In addition, the Adviser has entered into a sub-advisory agreement with Hilton, whereby the Subadviser will provide investment management and asset allocation advice to the Fund. The Adviser pays, out of the investment advisory fees it receives from the Fund, a fee for these sub-advisory services.
Management Services Agreement: The Fund has entered into a Management Services Agreement with the Adviser. Under the Management Services Agreement, the Fund pays the Adviser a management service fees of 0.026% on the first $10,000,000,000 of the Fund’s daily net assets and 0.024% on assets in excess of $10,000,000,000.
Operating Expense Limitation Agreement: The Fund is responsible for its own operating expenses. Under the Operating Expense Limitation Agreement, the Adviser has contractually agreed to cap all or a portion of the expenses for each Share Class based on an annual rate of 1.12% for Investor Class Shares and 0.87% for Institutional Class Shares applied to the average daily net assets of each respective Share Class.
Any expense cap is subject to reimbursement by the Fund within the following three years only if overall expenses fall below the lesser of this percentage limitation and any percentage limitation in place at the time. This agreement may be terminated or revised at any time with the consent of the Board of Trustees.
The table below presents amounts that the Subadviser recouped, waived and the amounts available for potential recoupments by the Subadviser.
| | | | | | | | | | |
$ — | | | $276,835 | | | $271,847 | | | $322,570 | | | $276,835 | | | $871,252 |
| | | | | | | | | | | | | | | | |
The net amount payable arising from the Investment Advisory Agreement, Management Services Agreement and waiver of any expenses as of August 31, 2024, is presented on the Statement of Assets and Liabilities as Due to Adviser, net.
Distribution Expenses: Shares of the Fund are subject to an annual 12b-1 fee of up to 1.00% of the Fund’s average daily net assets. The Investor Class shares of the Fund currently pays 0.25% of its average daily net assets. The Institutional Class shares of the Fund do not pay a 12b-1 fee. The Fund does not charge a shareholder service fee.
Foreside Fund Services, LLC (the “Distributor”) serves as principal underwriter of the Fund and acts as the Fund’s distributor in a continuous public offering of the Fund’s shares. The Distributor is an affiliate of the Adviser.
TABLE OF CONTENTS
Direxion Funds
NOTES TO THE FINANCIAL STATEMENTS
August 31, 2024(Continued)
5. VALUATION MEASUREMENTS
The Fund follows authoritative fair valuation accounting standards, which establish an authoritative definition of fair value and set out a hierarchy for measuring fair value. These standards require additional disclosures about the various inputs and valuation techniques used to develop the measurements of fair value and a discussion of changes in valuation techniques and related inputs during the period. These inputs are summarized in the three broad levels listed below:
Level 1 –
| Quoted prices in active markets for identical securities |
Level 2 –
| Evaluated price based on other significant observable inputs (including quoted prices for similar securities in active markets, quoted prices for identical or similar securities in inactive markets, interest rates, prepayment speeds, credit risk, etc.) |
Level 3 –
| Significant unobservable inputs including the Fund’s own assumptions about the assumptions in determining fair value of investments |
To the extent that equity securities are actively traded and valuation adjustments are not applied, they are categorized in Level 1 of the fair value hierarchy. If the market for a particular security is not active, and the mean price is used, these securities are categorized in Level 2 of the fair value hierarchy. Asset-backed securities, convertible bonds and corporate bonds are generally categorized in Level 2 of the fair value hierarchy. Investments in other mutual funds are categorized as Level 1 in the hierarchy.
The inputs or methodology used for valuing securities are not an indication of the risk associated with investing in those financial instruments.
The following is a summary of the inputs used to value the Fund’s securities as of August 31, 2024:
| | | | | | | | | | | | | |
Common Stocks | | | $43,978,796 | | | $ — | | | $ — | | | $43,978,796 |
Investment Companies | | | 42,563,153 | | | — | | | — | | | 42,563,153 |
Corporate Bonds | | | — | | | 24,084,804 | | | — | | | 24,084,804 |
U.S. Government Obligations | | | 8,274,380 | | | — | | | — | | | 8,274,380 |
Preferred Stocks | | | 1,245,435 | | | — | | | — | | | 1,245,435 |
| | | | | | | | | | | | | |
For further detail on each asset class, see Schedule of Investments.
The Fund follows authoritative accounting standards, which require additional disclosure regarding fair value measurements. Specifically, these standards require reporting entities to disclose a) the input and valuation techniques used to measure fair value for both recurring and nonrecurring fair value measurements, for Level 2 or Level 3 positions, b) transfers between all levels (including Level 1 and Level 2) on a gross basis (i.e. transfers out must be disclosed separately from transfers in) as well as the reasons(s) for the transfers, and c) purchases and sales on a gross basis in the Level 3 rollforward rather than as one net number. Additionally, reporting entities are required to disclose quantitative information about unobservable inputs used in the fair value measurements categorized within Level 3 of the fair value hierarchy.
6. SUBSEQUENT EVENTS
Management has performed an evaluation of subsequent events through the date of the financial statements were issued and has determined that no items require recognition or disclosure besides those noted below.
The Fund paid an income distribution with a record date of August 30, 2024 and ex-date and payable date of September 3, 2024 to its Investor Class shareholders in the amount of $0.0512 per share and to its Institutional Class shareholders in the amount of $0.0550 per share.
TABLE OF CONTENTS
Direxion Funds
NOTES TO THE FINANCIAL STATEMENTS
August 31, 2024(Continued)
The Fund paid an income distribution with a record date of September 30, 2024 and ex-date and payable date of October 1, 2024 to its Investor Class shareholders in the amount of $0.0512 per share and to its Institutional Class shareholders in the amount of $0.0550 per share.
At a meeting held on June 27, 2024, the Board of Trustees of the Trust approved a change in distributor of each series of the Trust from Foreside Fund Services, LLC to ALPS Distributors, Inc., effective on September 9, 2024.
TABLE OF CONTENTS
Report of Independent Registered Public Accounting Firm
To the Shareholders of Hilton Tactical Income Fund and the Board of Trustees of Direxion Funds
Opinion on the Financial Statements
We have audited the accompanying statement of assets and liabilities of Hilton Tactical Income Fund (the “Fund”) (one of the funds constituting Direxion Funds (the “Trust”)), including the schedule of investments, as of August 31, 2024, and the related statement of operations for the year then ended, the statements of changes in net assets for each of the two years in the period then ended, the financial highlights for each of the five years in the period then ended and the related notes (collectively referred to as the “financial statements”). In our opinion, the financial statements present fairly, in all material respects, the financial position of the Fund (one of the funds constituting Direxion Funds) at August 31, 2024, the results of its operations for the year then ended, the changes in its net assets for each of the two years in the period then ended and its financial highlights for each of the five years in the period then ended, in conformity with U.S. generally accepted accounting principles.
Basis for Opinion
These financial statements are the responsibility of the Trust’s management. Our responsibility is to express an opinion on the Fund’s financial statements based on our audits. We are a public accounting firm registered with the Public Company Accounting Oversight Board (United States) (“PCAOB”) and are required to be independent with respect to the Fund in accordance with the U.S. federal securities laws and the applicable rules and regulations of the Securities and Exchange Commission and the PCAOB.
We conducted our audits in accordance with the standards of the PCAOB. Those standards require that we plan and perform the audit to obtain reasonable assurance about whether the financial statements are free of material misstatement, whether due to error or fraud. The Trust is not required to have, nor were we engaged to perform, an audit of the Trust’s internal control over financial reporting. As part of our audits, we are required to obtain an understanding of internal control over financial reporting but not for the purpose of expressing an opinion on the effectiveness of the Trust’s internal control over financial reporting. Accordingly, we express no such opinion.
Our audits included performing procedures to assess the risks of material misstatement of the financial statements, whether due to error or fraud, and performing procedures that respond to those risks. Such procedures included examining, on a test basis, evidence regarding the amounts and disclosures in the financial statements. Our procedures included confirmation of securities owned as of August 31, 2024, by correspondence with the custodian. Our audits also included evaluating the accounting principles used and significant estimates made by management, as well as evaluating the overall presentation of the financial statements. We believe that our audits provide a reasonable basis for our opinion.
We have served as the auditor of one or more of the Direxion investment companies since 2001.
Minneapolis, Minnesota
October 25, 2024
TABLE OF CONTENTS
Basis for Approval of Investment Advisory AND SUBADVISORY Agreement
(Unaudited)
Investment Advisory and Subadvisory Agreements Approvals
Consistent with the Investment Company Act of 1940, as amended (the “1940 Act”), the Board of Trustees (the “Board” or “Trustees”) of the Direxion Funds (the “Trust”) annually considers the renewal of the Amended & Restated Investment Advisory Agreement (the “Advisory Agreement”) between Rafferty Asset Management, LLC (the “Adviser”) and the Trust and the Subadvisory Agreement between the Adviser and Hilton Capital Management, LLC (the “Subadviser”) (the “Subadvisory Agreement” and collectively with the Advisory Agreement, the “Agreements”) on behalf of the Hilton Tactical Income Fund (the “Fund”), a series of the Trust.
At a meeting held on August 22, 2024, the Board, including the Trustees who are not “interested persons” of the Trust, as defined in the 1940 Act (the “Independent Trustees”), approved the renewal of the Advisory Agreement between the Trust and the Adviser and the Subadvisory Agreement between the Adviser and Subadviser, on behalf of the Fund. The Independent Trustees had previously considered information pertaining to the renewal of the Agreements outside the presence of representatives of the Adviser and Subadviser and Fund management in executive sessions held on August 8, 2024 and August 22, 2024.
In considering whether to renew the Agreements, the Board requested, and the Adviser and Subadviser provided, information that the Board, Adviser, and Subadviser reasonably believed to be necessary to evaluate the Agreements. Among other information, the Board obtained and reviewed the following:
| • | Information regarding the advisory services provided by the Adviser and Subadviser to the Fund; |
| • | Information about the professional qualifications of the Adviser’s and Subadviser’s management teams and those employees primarily responsible for providing investment advisory services to the Fund; |
| • | Information regarding the Fund’s contractual fee rate for the prior year, including the contractual fee cap provided by the Operating Expense Limitation Agreement; |
| • | Information regarding advisory fees earned by the Adviser and Subadviser and waivers/reimbursements made by the Adviser in connection with providing services to the Fund for the prior two fiscal years and fiscal year to date; |
| • | Information regarding services provided by and the fees paid to the Adviser under the Management Services Agreement; |
| • | Fund performance information, including relative to a benchmark index; |
| • | Industry fee and performance data for a comparable group of funds having a similar asset size, investment objective principal strategy (“Peer Group,” and each such fund a “Peer Fund”); |
| • | The Adviser’s and Subadviser’s Form ADV; |
| • | Information regarding the financial condition and profitability of both the Adviser and Subadviser, including how economies of scale are shared with the Fund through reimbursements and waivers, and assessments by an independent consultant (the “Consultant”) of the appropriateness of the Adviser’s methodology for calculating profitability and presenting profitability metrics, and considerations related to the evaluation of industry profit margins; and |
| • | Information regarding how the Adviser monitors the Subadviser’s and Fund’s compliance with regulatory requirements and Trust policies and procedures. |
The Board considered that it had also received information relevant to its consideration since the Fund’s inception and, most recently, throughout the past year at executive sessions and regular Board meetings in connection with its routine oversight of the Fund. In this regard, the Trustees noted that they receive at least quarterly reports on the Fund’s performance and information bearing on the Adviser’s, Subadviser’s, and Fund’s regulatory compliance. The Board received a memorandum from counsel regarding the responsibilities of the Board with respect to the approval of the Agreements and participated in a question-and-answer session with representatives of the Adviser. The Board considered the Subadviser’s annual presentation to the Board, at which the Trustees meet with various members of the Subadviser’s portfolio management team. The Board carefully evaluated the relevant information and the Independent Trustees were advised by independent legal counsel with respect to their deliberations.
TABLE OF CONTENTS
Basis for Approval of Investment Advisory AND SUBADVISORY Agreement
(Unaudited)(Continued)
The Board considered, among others, the following factors to the extent applicable: (1) the nature, extent, and quality of the services provided by the Adviser and Subadviser; (2) the investment performance of the Fund; (3) the profitability of the advisory business to the Adviser, and the profitability of the advisory business to the Subadviser; (4) the extent to which economies of scale might be realized as the Fund grows and to which the advisory fee rate reflects any economies of scale for the benefit of the Fund’s shareholders; (5) how the Agreements compare in terms of services and fees with contracts entered into by the Peer Group and how the Subadvisory Agreement compares in terms of services and fees with contracts entered into by the Subadviser with other clients (such as other institutional investors); and (6) other benefits derived or anticipated that may be derived by the Adviser or Subadviser from its relationship with the Fund. The Board did not identify any particular information that was determinative to its approval of the Agreements, and each Trustee may have afforded different weight to different factors.
Nature, Extent and Quality of Services Provided. The Board reviewed, among other things, the Adviser’s and the Subadviser’s business, assets under management, financial resources and capitalization, the experience, quality and quantity of personnel, the complexity of the Fund’s investment strategy, and the adequacy of the Adviser’s and Subadviser’s risk and compliance systems and processes. In reviewing the quality of the Adviser’s and Subadviser’s personnel, operations, systems, and processes, the Board noted that their systems and processes have been consistently enhanced over time.
The Board reviewed the scope of services provided by the Adviser and Subadviser under the Agreements and noted that there would be no significant differences between the scope of services provided in the past year and those to be provided in the upcoming year. The Board also considered the Adviser’s and Subadviser’s representations that they would continue to provide services that are of materially the same quality as the services that have been provided to the Fund in the past. The Board considered whether those services remain appropriate in scope in light of the Fund’s operations and the competitive and regulatory landscape.
In considering the nature, extent and quality of the services to be provided under the Subadvisory Agreement by the Subadviser, the Board noted that such services include, but are not limited to, the following: (1) investing the Fund’s assets consistent with the Fund’s investment objective and policies; (2) determining the portfolio securities to be purchased, sold or otherwise disposed of and the timing of such transactions; (3) adhering to the Fund’s compliance policies and procedures; (4) maintaining the required books and records for transactions affected by Subadviser on behalf of the Fund; and (5) selecting broker-dealers to execute orders and obtaining best execution on behalf of the Fund. In evaluating the Subadviser, the Board considered the size and experience of the Subadviser’s portfolio management staff, the portfolio management staff’s credentials and expertise as relevant to the Fund’s investment objective and strategies, and the Subadviser’s ability to recruit, train and retain high-quality investment personnel. The Board also considered the Subadviser’s affiliation with the Adviser.
The Board considered that the Adviser oversees the operation of the Fund, including the Subadviser. With regard to compliance services in particular, the Board noted that it annually considers each of the Adviser’s and Subadviser’s compliance program as it pertains to the Fund. In addition, the Board noted that the Adviser conducts quarterly compliance reviews of the Subadviser, has regular contact with the Subadviser and monitors the Fund’s holdings and the Subadviser’s operations.
Comparison of Advisory Services and Fees. The Board considered the fairness and reasonableness of the investment advisory fee rate payable to the Adviser by the Fund and the subadvisory fee rate payable to the Subadviser by the Adviser in light of the investment advisory services provided by them. The Board considered the investment advisory fee rate payable to the Adviser by the Fund in light of fee rates paid by Peer Funds. In this regard, the Board reviewed information prepared by the Adviser, using data provided by Morningstar, Inc., to compare the Fund’s contractual advisory fee rate, expense cap, and gross and net expense ratio with those of Peer Funds. The Board considered that in past years the Consultant had reviewed the Adviser’s Peer Group selection methodology and the Fund’s resulting Peer Group, and determined that the methodology was reasonable, well-documented, transparent, repeatable and well within industry standards. The Board considered that the Adviser had agreed to limit the total expenses of the Fund (subject to certain exclusions) for the next year by contractually agreeing to pay certain expenses of the Fund under an Operating Expense Limitation Agreement. The Board also noted that currently the Fund was operating above the expense cap established by the applicable Operating Expense Limitation Agreement and enjoying the benefit of waivers and/or reimbursements by the Adviser.
TABLE OF CONTENTS
Basis for Approval of Investment Advisory AND SUBADVISORY Agreement
(Unaudited)(Continued)
Performance of the Fund. The Board considered the performance information for the Fund and compared it to the returns of funds included in the Peer Group. The Board considered performance reports received in anticipation of the meeting, as well as performance reports provided at regular Board meetings throughout the year. The Board evaluated the performance of the Fund relative to: (1) returns of its benchmark index for the year-to-date, one-year, three-year and five-year periods ended June 30, 2024; and (2) returns of the Peer Group for the year-to-date, one-year, three-year and five-year periods ended June 30, 2024. The Board also evaluated the Fund’s since inception performance information for the period ended June 30, 2024. The Board noted that the Fund is underperforming its benchmark for one-year, three-year, five-year and ten-year periods, although it outperformed its benchmark for the year-to-date period. The Board noted that the same Peer Group was used to evaluate both performance and the advisory fees paid by the Fund.
Costs of Services Provided to the Fund and Profits Realized by the Adviser and Subadviser. The Board reviewed information about the profitability of the Fund to the Adviser and Subadviser based on the fee rates payable under the Agreements. The Board considered information regarding the Adviser’s and Subadviser’s profit margin as reflected in their profitability analyses. In reviewing these materials, the Board considered information provided by the Adviser concerning the methodology used to allocate various expenses. The Board considered that the Consultant had previously reviewed the profitability information provided by the Adviser and concluded that the Adviser’s methodology for assessing and presenting profitability annually is transparent and consistent year to year. The Board considered that the Consultant had characterized the materials requested by and provided to the Board as extensive, thoughtful and robust, and providing a reasonable basis for the Board’s deliberations. Against this background, the Board considered that, for the 2024 contract review process, the materials presented by the Adviser to the Board, including the Adviser’s methodology and presentation of profitability, were consistent with the materials evaluated by the Consultant.
In order to assess the reasonableness of the profitability of the Fund and the Trust to the Adviser, the Board considered the significant drivers of cost for the Adviser including, but not limited to, their acceptance of entrepreneurial risk, their expenditure of intellectual capital, regulatory compliance and risk mitigation. The Board considered a report provided by the Adviser on the profitability of publicly-held financial services firms with material asset management businesses. In weighing this information, which was compiled by the Adviser using SEC filings and other publicly available documents, the Board considered that, according to the Consultant, the profitability of closely held advisers, such as the Adviser, can vary significantly from the profitability of diversified financial services companies, such as those included in the Adviser’s materials, because many such firms are closely held and do not make such information publicly available. To the extent such information is available for publicly held investment advisers by virtue of their being required to disclose it in various SEC filings, the Board recognized that such reported information is affected by numerous factors that may be unique to the reporting adviser, including the nature of a reporting party’s investor and shareholder base, the structure of the particular advisor, the types of funds it manages, its business mix, assumptions regarding allocations and the reporting of operating profits and net income (net rather than gross income net of distribution and marketing expenses). For these reasons, the Board recognized that it is difficult to assess the reasonableness of the Subadviser’s and Adviser’s profitability by comparing it to the profitability of publicly reporting investment advisory firms.
Economies of Scale. The Board considered the Adviser’s fee rate schedule for the Fund and noted the absence of breakpoints in the schedule. The Board accordingly considered the extent to which economies of scale or other efficiencies may result from increases in the Fund’s net assets and be shared with Fund shareholders. The Board reviewed a report from the Consultant that examined the Adviser’s approach to sharing economies of scale, to the extent available, with the Fund. The Board noted the report’s finding that breakpoints are not ubiquitous in the industry and that it is even less common for funds to reach the asset level where breakpoints reduce the fees charged to funds. The Board also noted the report’s finding that smaller funds may benefit more from expense caps, such as that employed by the Fund. In light of the relatively small size of the Fund, the Board concluded that the Fund has not yet achieved a sufficient asset level to realize an economy of scale, but that it would be appropriate to continue to monitor fees and expenses as the Fund grows in size and assess whether breakpoints may be warranted.
Other Benefits. The Board considered any indirect or “fall-out” benefits that the Adviser or Subadviser may derive from their relationship to the Fund. In this regard, the Board noted that the Fund pays a fee to the Adviser under the Management Services Agreement and such payment is a fall-out benefit. Other benefits to the Adviser and Subadviser of the Fund include that the Adviser and Subadviser may leverage their personnel and infrastructure to
TABLE OF CONTENTS
Basis for Approval of Investment Advisory AND SUBADVISORY Agreement
(Unaudited)(Continued)
manage other accounts and may leverage their relationships with the financial services industry, which are a function (in part) of their activities on behalf of the Fund, to build relationships in the industry for themselves and their affiliates, which may benefit business lines that are not related to the Fund.
Conclusion. Based on, but not limited to, the above considerations, the Board, including the Independent Trustees, determined that the Agreements for the Fund were fair and reasonable in light of the nature, extent and quality of the services to be performed, the fee rate to be paid, the Adviser’s and Subadviser’s expenses and profitability, and such other matters as the Board considered relevant in the exercise of its business judgment. Accordingly, the Board concluded that the continuation of the Agreements was in the best interests of the Fund and its shareholders. On this basis, the Board voted in favor of the renewal of the Agreements.
TABLE OF CONTENTS
Supplemental Information (Unaudited)
FEDERAL TAX INFORMATION
For the year ended August 31, 2024, certain dividends paid by the Fund may be subject to a maximum tax rate of 15%, as provided for by the Jobs and Growth Tax Relief Reconciliation Act of 2003. The percentage of dividends declared from ordinary income designated as qualified income was 26.90% for the Fund.
For corporate shareholders, the percent of ordinary income distributions qualifying for the corporate dividends received deduction for the year ended August 31, 2024 was 17.82% for the Fund.
The percentage of taxable ordinary income distributions that are designated as short-term capital gain distributions under Internal Revenue Section 871(k)(2)(C) was 0.00% for the Fund.
PROXY VOTING POLICIES AND PROCEDURES AND QUARTERLY PORTFOLIO HOLDINGS
The Trust’s Proxy Voting Policies are available without charge by calling 1-800-850-0511, or by accessing the SEC's website at www.sec.gov.
The actual voting records relating to portfolio securities during the most recent period ended June 30 is available without charge by calling 1-800-850-0511, or by accessing the SEC's website at www.sec.gov.
The Trust files complete schedule of portfolio holdings with the SEC for its first and third fiscal quarters on Part F of Form N-PORT. The Fund's Part F of Form N-PORT (and Form N-Q prior to February 28, 2019) is available on the SEC's website at www.sec.gov.
This report has been prepared for shareholders and may be distributed to others only if preceded or accompanied by a current prospectus.
| (b) | Financial Highlights are included within the financial statements filed under Item 7(a) of this Form. |
Item 8. Changes in and Disagreements with Accountants for Open-End Investment Companies.
There were no changes in or disagreements with accountants during the period covered by this report.
Item 9. Proxy Disclosure for Open-End Investment Companies.
There were no matters submitted to a vote of shareholders during the period covered by this report.
Item 10. Remuneration Paid to Directors, Officers, and Others of Open-End Investment Companies.
For the fiscal year ended August 31, 2024 , the aggregate remuneration the Registrant paid the directors, all members of any advisory board and any officers are included as part of the Financial Statements and Financial Highlights for Open-End Management Investment Companies filed under Item 7(a) of this Form.
Item 11. Statement Regarding Basis for Approval of Investment Advisory Contract.
See Item 7(a).
Item 12. Disclosure of Proxy Voting Policies and Procedures for Closed-End Management Investment Companies.
Not applicable to open-end investment companies.
Item 13. Portfolio Managers of Closed-End Management Investment Companies.
Not applicable to open-end investment companies.
Item 14. Purchases of Equity Securities by Closed-End Management Investment Company and Affiliated Purchasers.
Not applicable to open-end investment companies.
Item 15. Submission of Matters to a Vote of Security Holders.
There have been no material changes to the procedures by which shareholders may recommend nominees to the registrant’s board of trustees.
Item 16. Controls and Procedures.
| (a) | The Registrant’s Principal Executive Officer and Principal Financial Officer have reviewed the Registrant’s disclosure controls and procedures (as defined in Rule 30a-3(c) under the Investment Company Act of 1940 (the “Act”)) as of a date within 90 days of the filing of this report, as required by Rule 30a-3(b) under the Act and Rules 13a-15(b) or 15d-15(b) under the Securities Exchange Act of 1934. Based on their review, such officers have concluded that the disclosure controls and procedures are effective in ensuring that information required to be disclosed in this report is appropriately recorded, processed, summarized and reported and made known to them by others within the Registrant and by the Registrant’s service provider. |
| (b) | There were no changes in the Registrant’s internal control over financial reporting (as defined in Rule 30a-3(d) under the Act) that occurred during the period covered by this report that have materially affected, or are reasonably likely to materially affect, the Registrant’s internal control over financial reporting. |
Item 17. Disclosure of Securities Lending Activities for Closed-End Management Investment Companies
Not applicable to open-end investment companies.
Item 18. Recovery of Erroneously Awarded Compensation.
Not applicable.
Item 19. Exhibits.
(2) Not applicable.
(3) A separate certification for each principal executive officer and principal financial officer of the registrant as required by Rule 30a-2(a) under the Investment Company Act of 1940 (17 CFR 270.30a2(a)). Filed herewith.
(4) Not applicable.
(5) Not applicable.
SIGNATURES
Pursuant to the requirements of the Securities Exchange Act of 1934 and the Investment Company Act of 1940, the registrant has duly caused this report to be signed on its behalf by the undersigned, thereunto duly authorized.
| | (Registrant) | Direxion Funds |
| | By (Signature and Title) | /s/ Patrick J. Rudnick |
| | | Patrick J. Rudnick, Principal Executive Officer |
Pursuant to the requirements of the Securities Exchange Act of 1934 and the Investment Company Act of 1940, this report has been signed below by the following persons on behalf of the registrant and in the capacities and on the dates indicated.
| | By (Signature and Title) | /s/ Patrick J. Rudnick |
| | | Patrick J. Rudnick, Principal Executive Officer |
| | By (Signature and Title) | /s/ Corey Noltner |
| | | Corey Noltner, Principal Financial Officer |