OMB APPROVAL
OMB Number: 3235-0570
Expires: August 31, 2010
Estimated average burden hours per response...18.9
UNITED STATES SECURITIES AND EXCHANGE COMMISSION
Washington, DC 20549
FORM N-CSR
CERTIFIED SHAREHOLDER REPORT OF REGISTERED
MANAGEMENT INVESTMENT COMPANIES
Investment Company Act file number 811-08261
MEMBERS Mutual Funds
(Exact name of registrant as specified in charter)
550 Science Drive, Madison, WI 53711
(Address of principal executive offices)(Zip code)
Pamela M. Krill
Madison/Mosaic Legal and Compliance Department
550 Science Drive
Madison, WI 53711
(Name and address of agent for service)
Registrant's telephone number, including area code: 608-274-0300
Date of fiscal year end: October 31
Date of reporting period: October 31, 2009
Form N-CSR is to be used by management investment companies to file reports with the Commission not later than 10 days after the transmission to stockholders of any report that is required to be transmitted to stockholders under Rule 30e-1 under the Investment Company Act of 1940 (17 CFR 270.30e-1). The Commission may use the information provided on Form N-CSR in its regulatory, disclosure review, inspoection, and policymaking roles.
A registrant is required to disclose the information specified by Form N-CSR, and the Commission will make this information public. A registrant is not required to respond to the collection of information contained in Form N-CSR unless the Form displays a currently valid Office of Management and Budget ("OMB") control number. Please direct comments concerning the accuracy of the information collection burden estimate and any suggestions for reducing the burden to Secretary, Securities and Exchange Commission, 100 F Street, NE, Washington, DC 20549-0609. The OMB has reviewed this collection of information under the clearance requirements of 44 U.S.C. s 3507.
Item 1. Report to Shareholders.
MEMBERS(R) Mutual Funds
Annual Reprt
October 31, 2009
Conservative Allocation Fund
Moderate Allocation Fund
Aggressive Allocation Fund
Cash Reserves Fund
Bond Fund
High Income Fund
Diversified Income Fund
Large Cap Value Fund
Large Cap Growth Fund
Mid Cap Value Fund
Mid Cap Growth Fund
Small Cap Value Fund
Small Cap Growth Fund
International Stock Fund
This material is for reporting purposes only and shall not be used in connection with a solicitation, offer or any proposed sale of securitis unless preceded or accompanied by a prospectus.
Table of Contents
| | Page |
Management’s Discussion of Fund Performance | |
Economic Overview
| 2
|
Outlook
| 2
|
Conservative Allocation Fund
| 2
|
Moderate Allocation Fund
| 4
|
Aggressive Allocation Fund
| 5
|
Bond Fund
| 7
|
High Income Fund
| 8
|
Diversified Income Fund
| 10
|
Large Cap Value Fund
| 11
|
Large Cap Growth Fund
| 13
|
Mid Cap Value Fund
| 14
|
Mid Cap Growth Fund
| 16
|
Small Cap Value Fund
| 18
|
Small Cap Growth Fund
| 20
|
International Stock Fund
| 22
|
Notes to Management’s Discussion of Fund Performance
| 25
|
Portfolios of Investments | |
Conservative Allocation Fund
| 28
|
Moderate Allocation Fund
| 29
|
Aggressive Allocation Fund
| 30
|
Cash Reserves Fund
| 31
|
Bond Fund
| 32
|
High Income Fund
| 35
|
Diversified Income Fund
| 40
|
Large Cap Value Fund
| 44
|
Large Cap Growth Fund
| 46
|
Mid Cap Value Fund
| 48
|
Mid Cap Growth Fund
| 50
|
Small Cap Value Fund
| 52
|
Small Cap Growth Fund
| 54
|
International Stock Fund
| 57
|
Financial Statements | |
Statements of Assets and Liabilities
| 60
|
Statements of Operations
| 64
|
Statements of Changes in Net Assets
| 68
|
Financial Highlights
| 74
|
Notes to Financial Statements
| 95
|
Report of Independent Registered Public Accounting Firm
| 109
|
Other Information
| 110
|
Trustees and Officers
| 114
|
Nondeposit investment products are not federally insured, involve investment risk, may lose value and are not obligations of or guaranteed by any financial institution. For more complete information about MEMBERS Mutual Funds, including charges and expenses, request a prospectus from your financial advisor or from MEMBERS Mutual Funds, P.O. Box 8390, Boston, MA 02266-8390. Consider the investment objectives, risks, and charges and expenses of any fund carefully before investing. The prospectus contains this and other information about the investment company. For more current performance information, please call 1-800-877-6089 or visit our website at www.membersfunds.com. Current performance may be lower or higher than the performance data quoted within. Past performance does not guarantee future results. Nothing in this report represents a recommendation of a security by the investment adviser. Portfolio holdings may have changed since the date of this report.
1
Management’s Discussion of Fund Performance
ECONOMIC OVERVIEW
As the period began on November 1, 2008, we were in the midst of a worldwide financial crisis that was creating sell-offs in virtually every asset class, other than the most secure assets issued or insured by the federal government. Banks were unwilling to lend to each other and the general market mood was characterized by fear. Concerned with a possible meltdown of the U.S. financial system, Congress continued government-sponsored “bailouts” in an attempt to aid banking balance sheets and get credit flowing again.
As our one-year period got underway, we witnessed continued unrest in the financial sector and a realization that the credit problems would not be confined to just a few financial institutions. As the credit crisis spread across the economy it became clear that we were in the midst of what could prove to be the worst recession of our times. Conditions appeared to worsen in early 2009. By the beginning of March, talk about another depression and the collapse of the global financial system was widespread and the broad stock indices were down close to 25% on top of the record-setting losses of 2008. Then sentiment shifted, in the mysterious way that is characteristic of investor psychology, and money began to flow into stocks and riskier bonds. To get a sense of the gyrations, the S&P 500, considered a proxy for the overall stock market, rose 15.9% in the second quarter, and continued to rally in the third quarter of 2009, tacking on another 15.6%, to create one of the steepest rebounds in market history.
This rally, at least at first, was not so much driven by positive news as it was by diminishing worry. In other words, investors who were once worried about the collapse of the global financial system and another great depression were beginning to believe that the economic problems were deep, but not fathomless. By the latter part of the period, some of the important economic indicators showed signs of bottoming and other problem areas showed decreasing losses, even as other economic data, such as unemployment, remained in troubling territory. These positive signs, however modest, were eagerly noted by investors looking for hints of recovery and the period ended with a market characterized by stronger performance of higher-risk investments.
OUTLOOK
We are investing with the belief that over a full market cycle, holding the highest quality securities within our applicable investment objectives and guidelines will provide the best results with the least volatility. While we are getting early economic data and leading indicators suggesting improvement in the general economy, the indicators are improving from extremely low levels. We are also concerned that we could eventually hit an inflationary problem that develops directly from current monetary and fiscal policy, although we don’t see this as an immediate threat.
The biggest risks we see right now are associated with the economy. Despite all the chatter about the improving economic data, we remain concerned that small improvements from a level of deep trouble may produce undeserved optimism. Consumer spending is still muted and with unemployment remaining high, and credit difficult to come by, it seems unlikely that we will see a consumer-driven rally anytime soon. Risky assets are clearly priced for solid and significant economic improvement and this strikes us as a time to be diligent by seeking to invest in securities that have the best possible fundamentals.
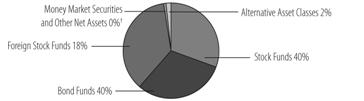
CONSERVATIVE ALLOCATION FUND
How did the Fund perform for the period November 1, 2008 – October 31, 2009?
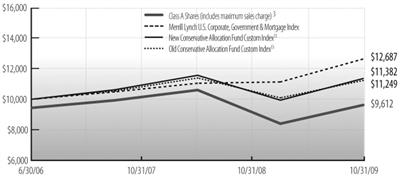
For the trailing year ended October 31, 2009, the MEMBERS Conservative Allocation Fund returned 14.91% (Class A shares at net asset value), outperforming the New Conservative Allocation Custom Fund Index return of 14.57% and underperforming the Morningstar Conservative Allocation category average return of 15.92%. Bonds make up the largest portion of the Fund, and our higher quality positioning held the Fund’s performance back relative to its peers as lower quality issues outperformed substantially.
2
Management’s Discussion of Fund Performance
CONSERVATIVE ALLOCATION FUND (continued)
What significant changes did you make to the portfolio since November 1, 2008?
During the late fall of 2008, we trimmed roughly 5% from the equity allocation of the Fund. The lower equity weight added to relative returns through the first quarter of 2009 as markets continued to decline, but was then a detriment to performance during the market rally.
To capitalize on what we viewed as an opportunity in corporate bonds, we added Dodge & Cox Income Fund to the portfolio in early 2009. At the time, the Fund held nearly 50% of its portfolio in corporate bonds. This move proved to be beneficial as corporate bond spreads have narrowed tremendously in 2009, resulting in double digit returns for investment grade bonds.
Recently, we have been trimming back risk and moving the portfolio even higher in quality. We have sold our dedicated mid cap position, and are lowering our international equity position. Given the number of headwinds facing the U.S. consumer and economy, we anticipate the markets will level off from their torrid advance since March and volatility will remain elevated for some time. Looking ahead, our focus will be on risk management and striving for more consistent returns through higher quality investments.
What were the strongest contributors to Fund performance?
Our allocation to corporate bonds, specifically below-investment-grade bonds, was the single greatest contributor to performance. MEMBERS High Income Fund Class Y, a below-investment grade fund, returned 29.4% over the trailing year. Positions in both international stocks and bonds also contributed significantly as measured by returns in Oppenheimer International Bond Fund Class Y which returned 26.1% and MEMBERS International Stock Fund Class Y which returned 23.3%. Finally, Dodge & Cox Income Fund returned 22.4%, bolstered by its corporate bond positions.
What were the largest constraints on performance?
Our largest position, MEMBERS Bond Fund Class Y was the greatest detractor, returning 10.3% since October 31, 2008. It’s very rare that a double digit return on a bond fund would be considered a detriment to performance, but 2009 was anything but ordinary. Throughout the year, the Fund stayed true to the high quality allocation that protected investors so well in 2008. However, so far 2009 has proven to be a risk taker’s market and lower quality bonds have outperformed higher quality issues by a very wide margin. Our modest position in Nakoma Absolute Return Fund which returned -9.3% was the other notable detractor.
Cumulative Performance of $10,000 Investment Since Inception1,2
3
Management’s Discussion of Fund Performance
CONSERVATIVE ALLOCATION FUND (continued)
Average Annual Total Return through October 31, 20092 |
| | % Return Without Sales Charge | % Return After Sales Charge6 |
| | 1 Year | Since
6/30/06
Inception7 | Since
2/29/08
Inception8 | 1 Year | Since
Inception |
Class A Shares 3 | 14.91%
| 0.59%
| —
| 8.31%
| (1.18)%7 |
Class B Shares4 | 14.09
| (0.15)
| —
| 9.59
| (1.00)7 |
Class C Shares5 | 14.21
| —
| (4.56)%
| 13.21
| (4.56)8 |
Merrill Lynch U.S. Corporate, Government & Mortgage Index | 13.74
| 7.38
| 6.15
| NA
| NA
|
New Conservative Allocation Fund Custom Index13 | 14.57
| 3.95
| 0.07
| NA
| NA
|
Old Conservative Allocation Fund Custom Index13 | 11.45
| 3.58
| 0.03
| NA
| NA
|
See accompanying Notes to Management’s Discussion of Fund Performance.
MODERATE ALLOCATION FUND
How did the Fund perform for the period November 1, 2008 – October 31, 2009?
For the trailing year ended October 31, 2009, the MEMBERS Moderate Allocation Fund returned 14.12% (Class A shares at net asset value), underperforming the New Moderate Allocation Custom benchmark return of 16.22% and the Morningstar Moderate Allocation category average return of 15.73%. High quality bonds underperformed riskier bonds, and this was a drag on relative performance as the Fund retained its high-quality bond bias. Additionally, value stocks underperformed the market in general, which was compounded by the manner in which our selected value instrument, MEMBERS Large Cap Value, underperformed its peers.
What significant changes did you make to the portfolio since November 1, 2008?
During the late fall of 2008, we trimmed roughly 5% from the equity allocation of the Fund. The lower equity weight added to relative returns through the first quarter of 2009 as markets continued to decline, but was then a detriment to performance during the market rally.
To capitalize on what we viewed as an opportunity in corporate bonds, we added Dodge & Cox Income Fund to the portfolio in early 2009. At the time, the Fund held nearly 50% of its portfolio in corporate bonds. This move proved to be beneficial as corporate bond spreads have narrowed tremendously in 2009, resulting in double digit returns for investment grade bonds.
Recently, we have been trimming back risk and moving the portfolio even higher in quality. We have reduced our mid cap positions, and lowered our international equity weight. Given the number of headwinds facing the U.S. consumer and economy, we anticipate the markets will level off from their torrid advance since March and volatility will remain elevated for some time. Looking ahead, our focus will be on risk management and striving for more consistent returns through higher quality investments.
What were the strongest contributors to Fund performance?
Our allocation to corporate bonds, specifically below-investment-grade bonds, was the single greatest contributor to performance. MEMBERS High Income Fund Class Y, a below-investment grade fund, returned 29.4% over the trailing year. Positions in both international stocks and bonds also contributed significantly as measured by returns in Oppenheimer International Bond Fund Class Y which returned 26.1% and MEMBERS International Stock Fund Class Y which returned 23.3%. Bolstered by corporate bonds, Dodge & Cox Income Fund returned 22.4%, and other notable contributors were MEMBERS Mid Cap Growth Fund Class Y and MEMBERS Large Cap Growth Fund Class Y which returned 21.7% and 19.3%, respectively.
4
Management’s Discussion of Fund Performance
MODERATE ALLOCATION FUND (continued)
What were the largest constraints on performance?
MEMBERS Bond Fund Class Y and MEMBERS Large Cap Value Fund Class Y which returned 10.3% and 2.2%, respectively, were the greatest detractors. It’s very rare that a double digit return on a bond fund would be considered a detriment to performance, but 2009 was anything but ordinary. Throughout the year the Fund stayed true to the high quality allocation that protected investors so well in 2008. However, so far 2009 has proven to be a risk taker’s market and lower quality bonds have outperformed higher quality issues by a very wide margin. MEMBERS Large Cap Value Fund Class Y was challenged by heavy losses in the financial sector early in the year, however financials have boosted performance since the rally took hold in March. Other notable detractors were Nakoma Absolute Return Fund and Gateway Fund Class Y which returned -9.3% and 1.1%, respectively.
Cumulative Performance of $10,000 Investment Since Inception1,2

Average Annual Total Return through October 31, 20092 |
| | % Return Without Sales Charge | % Return After Sales Charge6 |
| | 1 Year | Since
6/30/06
Inception7 | Since
2/29/08
Inception8 | 1 Year | Since
Inception |
Class A Shares3 | 14.12%
| (2.30)%
| —
| 7.54%
| (4.01)%7 |
Class B Shares4 | 13.20
| (3.01)
| —
| 8.70
| (3.86)7 |
Class C Shares5 | 13.20
| —
| (10.41)%
| 12.20
| (10.41)8 |
S&P 500 Index13 | 9.80
| (3.91)
| (13.21)
| NA
| NA
|
Russell 1000¨ Index13 | 11.20
| (3.86)
| (13.20)
| NA
| NA
|
New Moderate Allocation Fund Custom Index13 | 16.22
| 1.62
| (4.07)
| NA
| NA
|
Old Moderate Allocation Fund Custom Index13 | 13.59
| 0.92
| (4.61)
| NA
| NA
|
See accompanying Notes to Management’s Discussion of Fund Performance.
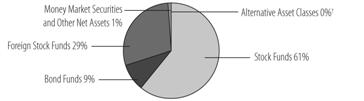
AGGRESSIVE ALLOCATION FUND
How did the Fund perform for the period November 1, 2008 – October 31, 2009?
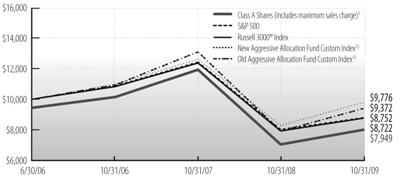
For the trailing year ended October 31, 2009, the MEMBERS Aggressive Allocation Fund returned 14.00% (Class A shares at net asset value), underperforming the New Aggressive Allocation Custom benchmark return of 18.64% and outperforming the Morningstar Large Blend category average return of 11.86%. The Fund’s gains in performance from exposure to international
5
Management’s Discussion of Fund Performance
AGGRESSIVE ALLOCATION FUND (continued)
stocks and high yield bonds were offset by underperformance in large and small cap value stocks relative to the index. However, the gains more than offset the detractions when compared to the peer group.
What significant changes did you make to the portfolio since November 1, 2008?
During the late fall of 2008, we trimmed roughly 15% from the equity allocation of the Fund and initiated a fixed income allocation. The lower equity weight added to relative returns through the first quarter of 2009 as markets continued to decline, but was then a detriment to performance during the market rally.
Recently, we have been trimming back risk and moving the portfolio even higher in quality. We have reduced our mid cap positions, and lowered our international equity weight. Given the number of headwinds facing the U.S. consumer and economy, we anticipate the markets will level off from their torrid advance since March and volatility will remain elevated for some time. In turn, moving forward our focus will be on risk management and striving for more consistent returns through higher quality investments.
What were the strongest contributors to Fund performance?
The strongest contributors to performance came from Laudus International MarketMasters Fund which returned 33.8% over the period, MEMBERS High Income Fund Class Y which returned 29.4%, MEMBERS International Stock Fund Class Y which returned 23.3%, MEMBERS Mid Cap Growth Fund Class Y which returned 21.7%, and MEMBERS Large Cap Growth Fund Class Y which returned 19.3%. International equities have rallied stronger than domestic stocks since the rally began in March, benefiting from a heightened appetite for risk and the corresponding decline in the U.S. dollar.
What were the largest constraints on performance?
MEMBERS Large Cap Value Fund Class Y, which returned 2.2%, was the largest detractor from performance. The Fund experienced heavy losses from the financial sector through the fall and into early 2009. Smaller caps also experienced large losses during the downturn. MEMBERS Small Cap Growth Fund Class Y and MEMBERS Small Cap Value Fund Class Y returned -3.3% and 13.5% respectively, and held down performance. The other notable detractor was Gateway Fund Class Y, which returned 1.1% for the period.
Cumulative Performance of $10,000 Investment Since Inception1,2
6
Management’s Discussion of Fund Performance
AGGRESSIVE ALLOCATION FUND (continued)
Average Annual Total Return through October 31, 20092 |
| | % Return Without Sales Charge | % Return After Sales Charge6 |
| | 1 Year | Since
6/30/06
Inception7 | Since
2/29/08
Inception8 | 1 Year | Since
Inception |
Class A Shares3 | 14.00%
| (4.97)%
| —
| 7.40%
| (6.64)%7 |
Class B Shares4 | 13.06
| (5.69)
| —
| 8.56
| (6.52)7 |
Class C Shares5 | 13.20
| —
| (15.59)%
| 12.20
| (15.59)8 |
S&P 500 Index13 | 9.80
| (3.91)
| (13.21)
| NA
| NA
|
Russell 3000¨ Index13 | 10.83
| (4.01)
| (13.04)
| NA
| NA
|
New Aggressive Allocation Fund Custom Index13 | 18.64
| (0.68)
| (8.35)
| NA
| NA
|
Old Aggressive Allocation Fund Custom Index13 | 19.20
| (1.92)
| (10.92)
| NA
| NA
|
See accompanying Notes to Management’s Discussion of Fund Performance.
BOND FUND
How did the Fund perform for the period November 1, 2008 – October 31, 2009?
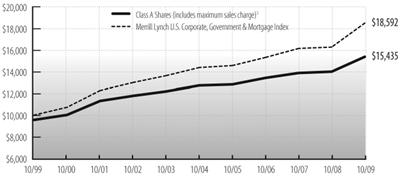
For the trailing year ended October 31, 2009, the MEMBERS Bond Fund returned 9.91% (Class A shares at net asset value) compared to 13.74% returned by the Merrill Lynch U.S. Corporate, Government & Mortgage Index and 17.86% returned by the Morningstar Intermediate-Term Bond category average for the same period.
What were the strongest contributors to Fund performance?
Positive contributions to performance for the period included the Fund’s holdings in a small amount of out-of-index asset classes. These asset classes included asset-backed and commercial mortgage-backed securities, which outperformed the overall index and contributed positively to performance.
What were the largest constraints on performance?
One of the primary reasons for the negative performance relative to the index and peer group was the Fund’s higher quality bias. Throughout the period, the Fund remained overweight relative to the index in Treasury debt and underweight mortgage-backed and corporate debt compared to the index. Mortgage-backed and corporate debt outperformed Treasuries over the period, so our quality bias hurt performance with respect to these sectors.
From a macroeconomic perspective, yield curve posture was negative as interest rates declined over the period and the Fund was generally short duration – implying cash flows were reinvested at lower absolute interest rates. It should be noted, however, that the entire drop in interest rates occurred during the final two months of 2008 and rates have trended upward since such that the Fund’s yield curve posture was accretive to performance during 2009 calendar year-to-date. Relative to the Morningstar peer group, a lower allocation to investment grade and high yield corporate debt was the primary driver of the Fund’s overall underperformance for the period.
How is the Fund positioned going forward?
We continue to believe that the “green shoots” are not self sustaining and the government stimulus will be unsustainable. Additionally, we believe many of the problems which caused the financial and economic crisis have been papered over, not resolved. Because we believe a bond fund is first and foremost about providing a foundation for any investment strategy and preserving capital, a very conservative posture will be maintained going forward given our perspective noted in the comments above.
7
Management’s Discussion of Fund Performance
BOND FUND (continued)
Cumulative Performance of $10,000 Investment Since Inception1,2
Average Annual Total Return through October 31, 20092 |
| | % Return Without Sales Charge | % Return After Sales Charge6 |
| | 1 Year | 3 Years | 5 Years | 10 Years | Since
6/30/06
Inception | 1 Year | 3 Years | 5 Years | 10 Years |
Class A Shares3 | 9.91%
| 4.67%
| 3.88%
| 4.92%
| —
| 4.93%
| 3.06%
| 2.92%
| 4.44%
|
Class B Shares4 | 9.20
| 3.92
| 3.12
| 4.14
| —
| 4.70
| 2.83
| 2.77
| 4.14
|
Class Y Shares9 | 10.30
| —
| —
| —
| 5.77%
| —
| —
| —
| —
|
Merrill Lynch U.S. Corporate,
Government & Mortgage Index | 13.74
| 6.53
| 5.19
| 6.40
| 7.38
| NA
| NA
| NA
| NA
|
See accompanying Notes to Management’s Discussion of Fund Performance.
HIGH INCOME FUND
After experiencing one of the worst financial crises on record in 2008, the U.S. financial markets have roared back over the first 10 months of 2009. During the rebound, the high yield sector has been the superstar performer as it has significantly outpaced every U.S. equity and fixed income sector. For example, for the 12 month period ended October 31, 2009, the Merrill Lynch High Yield Index gained 48.8%, the S&P 500 gained 9.8% and Merrill Lynch Investment Grade Index gained 30.8%. One key driver of the strong performance for high yield has been that the default environment has improved dramatically. This positive development has been due to a combination of robust capital markets and an improvement in the economic outlook. Portfolio managers have drastically reduced their estimates for defaults in 2009 and 2010. Most strategists now estimate a 13% default rate in 2009, while the default rate for 2010 is expected to plunge to 5%. This represents a considerable improvement in the default outlook year-over-year and a much faster decline to the long-term average than experienced during either the early 1990s or early 2000 default cycles. The improvement in the default outlook has resulted in a dramatic decrease in yield spreads, or risk premiums, which has caused bonds prices to gap up significantly over the past 12 months.
How did the Fund perform for the period November 1, 2008 – October 31, 2009?
For the trailing year ended October 31, 2009, the MEMBERS High Income Fund returned 28.98% (Class A shares at net asset value), underperforming the Merrill Lynch U.S. High Yield Master II Constrained Index return of 49.54% and the Morningstar High Yield Bond category average return of 35.58%. Although the Fund’s returns were substantial and exceeded nearly every major equity index, they lagged the return of the index.
8
Management’s Discussion of Fund Performance
HIGH INCOME FUND (continued)
What were the strongest contributors and largest constraints to Fund performance?
The primary driver contributing to the Fund’s performance variance from the index has been its limited weighting in deep discount and lower-rated securities. For example, during the 12 months ended October 31, 2009, bonds priced below $70, which had an average weighting of 26% in the index, contributed over 36% of the total index return, as compared to the Fund’s average of 4.4% weighting in this stressed sector. Over the latter half of the reporting period, we have been an active participant in the new issue calendar as this segment of the high yield universe provides credit structures that are significantly better than many of the legacy issues that came to market in 2006-2008.
Augmenting our new issue purchases have been significant purchases on the secondary market. Also, we have attempted to selectively add issuers that, despite having somewhat weaker credit profiles than our average portfolio holding, we believe still have the flexibility to withstand a protracted period of economic weakness. Although we have incrementally added some lower quality issuers to the portfolio during the past 12 months, the overall credit quality for the portfolio remains strong with an average B/B2 rating. Furthermore, as of October 31, 2009, the Fund had approximately 87% of its holdings with a ratio of cash-flow to cash-interest expense greater than 2x. The portfolio’s top industry weightings are healthcare, support-services, telecom, utilities, and oil and gas, all of which positively contributed to performance. Notable sectors in which the Fund is not invested are the homebuilding, banking, and real estate sectors.
How is the Fund positioned going forward?
Although the high yield bond market’s recent performance has exceeded all expectations, our outlook for 2010 remains favorable. Our constructive outlook for high yield is predicated on continued robust demand from investors seeking high current income in the face of low yields from alternative investments; a continued shift in allocations to credit-driven strategies; expectations for sharply declining default rates in 2010 as many of the sickest companies have already collapsed; and attractive spreads in excess of 750 basis points relative to 10-year Treasuries which represents a compelling risk premium.
Cumulative Performance of $10,000 Investment Since Inception1,2

9
Management’s Discussion of Fund Performance
HIGH INCOME FUND (continued)
Average Annual Total Return through October 31, 20092 |
| | % Return Without Sales Charge | % Return After Sales Charge6 |
| | 1 Year | 3 Years | 5 Years | 10 Years | Since
6/30/06
Inception | 1 Year | 3 Years | 5 Years | 10 Years |
Class A Shares3 | 28.98%
| 4.31%
| 4.80%
| 5.16%
| —
| 23.23%
| 2.70%
| 3.83%
| 4.68%
|
Class B Shares4 | 28.08
| 3.51
| 4.03
| 4.38
| —
| 23.58
| 2.50
| 3.72
| 4.38
|
Class Y Shares9 | 29.35
| —
| —
| —
| 5.53%
| —
| —
| —
| —
|
Merrill Lynch U.S. High Yield
Master II Constrained Index | 49.54
| 5.67
| 6.07
| 6.43
| 6.84
| NA
| NA
| NA
| NA
|
See accompanying Notes to Management’s Discussion of Fund Performance.
DIVERSIFIED INCOME FUND
How did the Fund perform for the period November 1, 2008 – October 31, 2009?
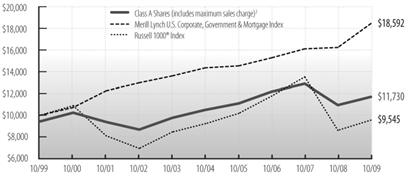
For the trailing year ended October 31, 2009, the MEMBERS Diversified Income Fund returned 7.07% (Class A shares at net asset value), compared to the Merrill Lynch U.S. Corporate, Government & Mortgage Index return of 13.74%, the Russell 1000® Index return of 11.20%, and the Morningstar Moderate Allocation category average return of 15.73%. Overall underperformance was due primarily to stock selection within the financial sector as described below, and additionally, dividend yielding stocks lagged the Russell 1000® Index for the period.
During the period, U.S. stocks experienced a cascade of dividend reductions, unlike anything seen since the depression of the 1930s. For the equity portion of the Fund, we chose to protect the Fund’s income stream in a move that turned out to be more costly relative to index returns than we anticipated. We replaced many of our financial stocks that reduced their dividend payouts with higher yielding stocks. The financial stocks we sold subsequently rebounded sharply in price, and accounted for approximately 7 points of the 12.6 points by which the equity portion trailed the Russell 1000® Index returns.
What were the strongest contributors to Fund performance?
The Fund’s strongest stock contributors for the twelve month period included pharmaceutical company Wyeth which was recently acquired by Pfizer, consumer products manufacturer Procter & Gamble, Intel, United Parcel Service, and industrial products provider Tyco International. For the Fund’s bond segment, positive contributions to performance for the period included the Fund’s significant overweight position relative to the index in credit.
What were the largest constraints on performance?
Detracting from performance within the Fund’s equity segment included holdings in JPMorgan Chase, Bank of America, U.S. Bancorp, General Electric and PNC Financial, all of which were sold during the period except for U.S. Bancorp. In addition, relative to the Russell 1000® Index, we held a much smaller position in technology stocks, due to their low dividend yields. This accounted for nearly 3 points of the 12.6 point lag versus Russell 1000® Index returns. This type of lag will occur occasionally when technology stocks appreciate sharply, as they did during the fiscal year, rising over 31%. Our large lag in the financial sector is something that has not occurred before and we do not anticipate it will happen again, given that the flood of dividend reductions seem likely to only happen in extreme circumstances and infrequently, such as the 1930s and 2008-09. The bond segment of the Fund held a modest underweight position relative to the index in mortgage-backed securities which hurt performance, but not to nearly the extent that the overweight position in credit helped.
10
Management’s Discussion of Fund Performance
DIVERSIFIED INCOME FUND (continued)
How is the Fund positioned going forward?
We have been adding to what we believe are the most attractive, high-yielding stocks. These are predominantly “Blue Chip” companies which as a group lagged during the period ended October 30, 2009. We believe they generally have solid fundamentals, international exposure, and appear to us to be undervalued. Given the number of headwinds facing the U.S. consumer and economy, we anticipate that the markets will level off from their torrid advance since March and that volatility will remain elevated for some time. In turn, moving forward our focus will be on risk management and striving for more consistent returns through higher quality investments.
Cumulative Performance of $10,000 Investment Since Inception1,2
Average Annual Total Return through October 31, 20092 |
| | % Return Without Sales Charge | % Return After Sales Charge6 |
| | 1 Year | 3 Years | 5 Years | 10 Years | 1 Year | 3 Years | 5 Years | 10 Years |
Class A Shares3 | 7.07%
| (1.36)%
| 2.22%
| 2.21%
| 0.86%
| (3.30)%
| 1.02%
| 1.60%
|
Class B Shares4 | 6.24
| (2.12)
| 1.45
| 1.45
| 1.74
| (3.07)
| 1.13
| 1.45
|
Russell 1000® Index | 11.20
| (6.84)
| 0.71
| (0.46)
| NA
| NA
| NA
| NA
|
Merrill Lynch U.S. Corporate,
Government & Mortgage Index | 13.74
| 6.53
| 5.19
| 6.40
| NA
| NA
| NA
| NA
|
See accompanying Notes to Management’s Discussion of Fund Performance.
LARGE CAP VALUE FUND
How did the Fund perform for the period November 1, 2008 – October 31, 2009?
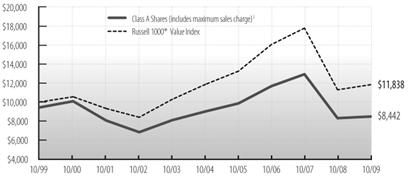
For the trailing year ended October 31, 2009, the MEMBERS Large Cap Value Fund returned 2.08% (Class A shares at net asset value) compared with the Russell 1000® Value Index return of 4.78% and the Morningstar Large Value category average return of 9.52%. Nearly half of the Fund’s overall underperformance was due to allocation and stock selection within the consumer sectors. Additional relative underperformance within the health care and telecomm sectors detracted, as did the Fund’s cash holding which hurt the Fund in a rising market. Though several of the Fund’s individual stocks total returns were disappointing as discussed below, the Fund’s underperformance was a widespread cumulative effect of many securities, thus as a whole the Fund underperformed.
11
Management’s Discussion of Fund Performance
LARGE CAP VALUE FUND (continued)
What significant changes did you make to the portfolio since November 1, 2008?
The focus of the fund was narrowed to our favorite holdings which resulted in fewer stocks, dropping the portfolio holdings to approximately 60 stocks from 135 held as of October 31, 2008. During this process, we assessed our holdings and other candidates on their stock price upside and downside potential, as well as level of risk, and purchased those with the best overall potential. We considered valuation, financial leverage, return on capital, and expected future stability of business operations. Overall portfolio diversification was taken into account, though we did find better value in energy and health care, so our weighting rose in those sectors.
What were the strongest contributors to Fund performance?
The strongest contributors to performance relative to the index included our overweight positions relative to the index in mining company Freeport-McMoran Copper, biotechnology research tool developer Life Technologies, financial services company Prudential Financials, and investment management company Blackrock Inc., as the stocks outperformed. In addition, owning out-of-index Noble Corp contributed to performance.
What were the largest constraints on performance?
Detracting from performance was the Fund’s underweight position within the consumer discretionary sector, as the sector outperformed. Individual stock holdings which hurt performance included Citigroup which dropped nearly 70% for the period and was subsequently sold, and out-of-index oil and gas drilling equipment and service company Weatherford International. Also detracting was the Fund’s overweight position relative to the index in Bank of New York Mellon which had a depressed stock price over investors’ concerns about profitability in the current low interest rate environment. We continue to hold Weatherford International as we believe it is undervalued and should continue to gain market share, and Bank of New York Mellon as we believe the stock is undervalued and has a sustainable global competitive advantage. Also hurting performance was not owning Ford Motor Co. which shot up 219.6% for the period, and holding cash which averaged a bit under a modest 2% for the period, but was still detractive in a rising market.
Cumulative Performance of $10,000 Investment Since Inception1,2
12
Management’s Discussion of Fund Performance
LARGE CAP VALUE FUND (continued)
Average Annual Total Return through October 31, 20092 |
| | % Return Without Sales Charge | % Return After Sales Charge6 |
| | 1 Year | 3 Years | 5 Years | 10 Years | Since
6/30/06
Inception | 1 Year | 3 Years | 5 Years | 10 Years |
Class A Shares3 | 2.08%
| (10.27)%
| (1.23)%
| (1.09)%
| —
| (3.82)%
| (12.02)%
| (2.39)%
| (1.68)%
|
Class B Shares4 | 1.23
| (10.94)
| (1.97)
| (1.84)
| —
| (3.25)
| (11.96)
| (2.35)
| (1.84)
|
Class Y Shares9 | 2.24
| —
| —
| —
| (6.43)%
| —
| —
| —
| —
|
Russell 1000® Value Index | 4.78
| (9.79)
| (0.05)
| 1.70
| (6.30)
| NA
| NA
| NA
| NA
|
See accompanying Notes to Management’s Discussion of Fund Performance.
LARGE CAP GROWTH FUND
How did the Fund perform for the period November 1, 2008 – October 31, 2009?
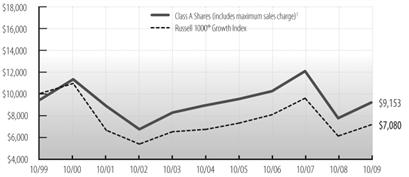
The MEMBERS Large Cap Growth Fund had strong absolute as well as relative results for the period. On an absolute basis, positive gains of 18.99% (Class A shares at net asset value) were achieved. The Fund beat the 17.51% return for the Russell 1000® Growth index by 148 basis points, and also beat the 15.35% return for the Morningstar Large Growth category average return by 364 basis points. The Fund had a very solid year of performance despite very unstable market conditions. Our philosophy and process kept us open-minded during the periods of high market volatility experienced this year. It helped us continue to refresh the Fund with attractive stocks as stock prices moved in response to recessionary forces and attempts to avert financial collapse. We tended to take positions in companies with strong balance sheets, that generate excess cash flow, and that have intrinsic factors leading to growth in earnings or cash flow, as higher quality companies tend to have more resources to weather a financial calamity. These stocks were ultimately recognized by the market during the period and are reflected in the Fund’s relative outperformance.
What significant changes did you make to the portfolio since November 1, 2008?
Over time, we have reduced the number of holdings in the Fund to approximately 65 from approximately 100, as we gained more conviction on our best ideas due to more clarity in the stability of economic conditions. The Fund continues to have a bias towards quality growth companies and remains well diversified.
What were the strongest contributors to Fund performance?
The largest contributors to performance included the Fund’s holdings within the healthcare sector, energy sector, and financials sector. Healthcare was an area of focus since incipient policy reform created heightened uncertainty about future operating conditions, causing other investors to step back from the sector and creating what we thought were attractive stock price entry points. On an individual basis, the Fund’s significant holding in Genentech within the healthcare sector materially added to performance. The Fund’s emphasis in the energy sector, due to our anticipation in a rise in oil prices as a result of decreased drilling productivity and potential supply disruption, aided results throughout the period. Within this sector, Petrohawk Energy Corp., a high growth natural gas producer, was a strong contributor to performance.
What were the largest constraints on performance?
Specific holdings in consumer related areas and materials detracted from Fund performance for the reporting period. Yum! Brands Inc, the quick-service restaurant company which operates Pizza Hut, Taco Bell, and KFC, disappointed for the period. However, we believe its strong growth in China will separate it from competitors.
13
Management’s Discussion of Fund Performance
LARGE CAP GROWTH FUND (continued)
How is the Fund positioned going forward?
We expect overall market volatility to increase as questions develop about the sustainability of the recovery. Also, we believe it is likely the market will narrow rather than broaden and stock selection will become increasingly important. The recovery will be questioned because the economic problems are structural rather than merely cyclical. While we do not think “it is different this time,” we do think it is foreign enough to all living participants to feel that way and believe this is especially true for policy makers. Since there is no playbook for answers, we believe there will be more false steps along the path to prosperity.
Notwithstanding, some companies will thrive in the “new normal” economy. Our bias is that investors will gravitate towards those companies which continue to demonstrate superiority. We envision bouts of broad speculative moves such as last quarter, to be followed by sharp sell offs in companies which do not meet expectations. Serially, investors will gravitate towards those that don’t disappoint. Our portfolio is positioned to take advantage of that expected market environment.
Cumulative Performance of $10,000 Investment Since Inception1,2
Average Annual Total Return through October 31, 20092 |
| | % Return Without Sales Charge | % Return After Sales Charge6 |
| | 1 Year | 3 Years | 5 Years | 10 Years | Since
6/30/06
Inception | 1 Year | 3 Years | 5 Years | 10 Years |
Class A Shares3 | 18.99%
| (3.59)%
| 0.57%
| (0.29)%
| —
| 12.10%
| (5.48)%
| (0.62)%
| (0.88)%
|
Class B Shares4 | 18.06
| (4.31)
| (0.18)
| (1.02)
| —
| 13.56
| (5.44)
| (0.58)
| (1.02)
|
Class Y Shares9 | 19.26
| —
| —
| —
| (0.94)%
| —
| —
| —
| —
|
Russell 1000® Growth Index | 17.51
| (4.05)
| 1.27
| (3.39)
| (1.59)
| NA
| NA
| NA
| NA
|
See accompanying Notes to Management’s Discussion of Fund Performance.
MID CAP VALUE FUND
How did the Fund perform for the period November 1, 2008 - October 31, 2009?
For the trailing year ended October 31, 2009, the MEMBERS Mid Cap Value Fund gained 11.74% (Class A shares at net asset
value) compared with the Russell MidCap® Value Index return of 14.52% and the Morningstar Mid-Cap Value category average return of 17.86%.
14
Management’s Discussion of Fund Performance
MID CAP VALUE FUND (continued)
What significant changes did you make to the portfolio since November 1, 2008?
Wellington Management’s small/mid cap value investment team was removed from managing approximately 20% of the Fund’s assets on July 1, 2009. Livia Asher of Madison Asset Management remains the lead portfolio manager of the Fund. Subsequently, the number of individual stock holdings was reduced and concentrated into a “best ideas” portfolio comprised of roughly 70 stocks, down from roughly 230. The Fund moved away from a more defensive posture and reduced its weight in the utilities sector and reduced the underweight position in financial stocks, and moved towards higher quality stocks with greater long-term appreciation potential. Post the market trough in March 2009, higher beta stocks outperformed. That trade appears to be waning in favor of superior company fundamentals and the portfolio has been tilted in that direction.
What were the strongest contributors to Fund performance?
Greatest contribution came from stock selection within the healthcare and materials sectors. Within healthcare, the Fund benefitted from owning biotechnology research tools developer Life Technologies Corp. and health care and related benefit provider CIGNA Corp. Within the materials sector, the overweight in the exploration, mining, and producer of mineral resources Freeport McMoRan Copper & Gold, Inc., that gained 150%, was a large contributor. More broadly, the greatest individual contribution came from owning out of benchmark investment manager BlackRock, Inc., as its price increased by approximately 70%. Also adding to performance relative to the index were stocks that were not owned. Here, avoiding airline stocks as they declined 50-60% on average, proved positive as did not owning several index banking names such as Huntington Bancshares Inc. and Synovus Financial Corp., which fell by 60-80% during the period.
For the small/mid cap portion of the Fund that was subadvised by Wellington Management Company through June 30, 2009, top relative contributors overall included O’Reilly Automotive, Inc. and Stage Stores, Inc. within the consumer discretionary sector. Delphi Financial Group, Inc., an insurance company specializing in life & disability and excess workers compensation was a key individual contributor in financials, while Herbalife, LTD. and Hormel Foods Corp. were strong performers in consumer staples.
What were the largest constraints on performance?
Stock selection within the consumer discretionary and industrials sectors had the largest negative impact on performance. Within industrials, our defensive position in business information and technology solution provider Dun & Bradstreet Corp. proved not to be as it missed earnings. In addition, not owning several index media stocks, such as Virgin Media Inc., Liberty Media Corp., and Discovery Communications Inc., that surged during the period also detracted from performance. Several index names were also subject to takeovers and not owning several of those, Sun Microsystems Inc. and Coca-Cola Enterprises, for example, proved negative. Finally, the Fund’s avoidance of poor quality stocks during the market’s snapback such as Ford Motor Corp., Hartford Financial Services Group Inc., and Genworth Financial, all of which gained well in excess of 100%, added to the underperformance.
For the small/mid-cap portion of the Fund that was subadvised by Wellington Management Company through June 30, 2009, detractors from relative performance included Webster Financial Corp., International Bancshares Corp., and MB Financial, Inc. in the financials sector. Shares of Arbitron, Inc. (consumer discretionary), the leading provider of media audience rating services for the radio industry, were also relatively weak.
For the period, the stock selection within the consumer discretionary and industrial sectors which had the greatest detraction on performance, along with the Fund’s avoidance of several index names that produced high returns, could not be overcome by the strong stock selection within health care and materials, and not owning several declining index names. This resulted in the Fund underperforming both the index and peer group.
15
Management’s Discussion of Fund Performance
MID CAP VALUE FUND (continued)
How is the Fund positioned going forward?
The Fund used the period of compressed valuations to upgrade the quality of the stocks held in the portfolio. Stocks have been added that appear to have competitive advantages relative to peers and as the economy gains its footing, we believe those stocks will outperform in the longer-term. The Fund’s recent underperformance has resulted from avoidance of the “junk” trade. That phase of the cycle appears to be ending, and we expect earnings and revenues to take center stage.
Cumulative Performance of $10,000 Investment Since Inception1,2

Average Annual Total Return through October 31, 20092 |
| | % Return Without Sales Charge | % Return After Sales Charge6 |
| | 1 Year | 3 Years | 5 Years | Since
2/28/01
Inception10 | Since
6/30/06
Inception | 1 Year | 3 Years | 5 Years | Since
Inception10 |
Class A Shares3 | 11.74%
| (8.87)%
| 0.34%
| 2.76%
| —
| 5.28%
| (10.66)%
| (0.85)%
| 2.06%
|
Class B Shares4 | 11.01
| (9.58)
| (0.44)
| 1.96
| —
| 6.51
| (10.34)
| (0.71)
| 1.96
|
Class Y Shares9 | 12.12
| —
| —
| —
| (5.57)%
| —
| —
| —
| —
|
Russell Midcap® Value Index | 14.52
| (8.39)
| 2.05
| 5.42
| (5.44)
| NA
| NA
| NA
| NA
|
See accompanying Notes to Management’s Discussion of Fund Performance.
MID CAP GROWTH FUND
How did the Fund perform for the period November 1, 2008 – October 31, 2009?
For the trailing year ended October 31, 2009, the MEMBERS Mid Cap Growth Fund returned 21.03% (Class A shares at net asset value), compared to the Russell Midcap® Growth Index return of 22.48% and the Morningstar Mid-Cap Growth category average return of 16.23%.
Stock selection in the consumer discretionary, information technology, and financial sectors contributed the most to relative performance versus the Russell Midcap® Growth Index. In addition, an overweight position in the energy and information technology sectors along with under weights to the utilities and telecommunication services sectors were also positive contributors to relative returns. However, these positive results were more than offset by weak stock selection in the health care, telecommunication services, and industrial sectors, which resulted in slight underperformance compared to the Russell Midcap®
16
Management’s Discussion of Fund Performance
MID CAP GROWTH FUND (continued)
Growth Index. Despite modestly underperforming the index, we were pleased to outperform the Morningstar Mid-Cap Growth peer category average return by almost 5%.
What significant changes did you make to the portfolio since November 1, 2008?
Rich Eisinger, head of Madison’s mid-cap equity team, became the portfolio manager of the Fund mid-year. Rich and his team replaced Wellington Management’s mid-cap growth investment team on July 1, 2009.
Subsequently, as the year progressed, we increased our exposure to the financial sector, particularly in insurance, and now maintain an overweight position. New insurance purchases in the year included Odyssey Re, specialty insurer Markel and property & casualty insurer RLI. Top active positions include Brookfield Asset Management and diversified holding company Leucadia. We expect to maintain an overweight position relative to the index in financials as we believe long-term prospects are excellent and valuations are attractive.
After maintaining an overweight position relative to the index in the technology sector for most of the year, we reduced our technology exposure and now have an underweight position. Our technology holdings generated very strong returns in the first eight months of the fund year. With valuations less attractive, we felt it prudent to reduce exposure and rotate into other sectors with better return prospects.
What were the strongest contributors to Fund performance?
Key individual contributors to relative performance in the consumer discretionary sector were apparel companies True Religion, Aeropostale and the Buckle. Global online travel company Priceline.com and specialty retailer of automotive aftermarket parts O’Reilly Automotive were also strong contributors. In information technology, networking solutions supplier Brocade Communication Systems, network storage equipment manufacturer NetApp, and Akamai Technologies, a provider of services for accelerating the delivery of content and application over the Internet, were strong relative performers.
What were the largest constraints on performance?
Detractors from relative performance in industrials included asset-light freight transportation management company Hub Group, and Terex, a global manufacturer of construction machinery. Huntington Bancshares (financials), Hercules Offshore (energy), and NII Holdings (telecommunication services) were also relatively weak.
How is the Fund positioned going forward?
As we enter the 2010 fund year, we remain cautiously optimistic about further market gains. Many leading economic indicators are signaling the end of the recession and problematic areas such as home prices appear to be stabilizing.
Although the mood is more upbeat, economic support has come mainly from inventory destocking and government stimulus. The sustainability of the economic recovery will be largely dependent on a resurgence in consumer demand beyond short term fixes such as “Cash for Clunkers.” High unemployment rates, stagnant personal income growth and a growing savings rate leave us questioning the strength of a consumer rebound. While we remain optimistic about the prospect for a sustained economic recovery, we believe it may unfold at a slower pace than many currently expect.
17
Management’s Discussion of Fund Performance
MID CAP GROWTH FUND (continued)
Cumulative Performance of $10,000 Investment Since Inception1,2

Average Annual Total Return through October 31, 20092 |
| | % Return Without Sales Charge | % Return After Sales Charge6 |
| | 1 Year | 3 Years | 5 Years | Since
2/29/00
Inception11 | Since
6/30/06
Inception | 1 Year | 3 Years | 5 Years | Since
Inception11 |
Class A Shares3 | 21.03%
| (7.36)%
| 0.64%
| (6.94)%
| —
| 14.06%
| (9.16)%
| (0.53)%
| (7.51)%
|
Class B Shares4 | 20.10
| (8.09)
| (0.15)
| (7.64)
| —
| 15.60
| (9.17)
| (0.55)
| (7.64)
|
Class Y Shares9 | 21.65
| —
| —
| —
| (4.34)%
| —
| —
| —
| —
|
Russell Midcap® Growth Index | 22.48
| (5.61)
| 2.22
| (3.19)
| (3.67)
| NA
| NA
| NA
| NA
|
See accompanying Notes to Management’s Discussion of Fund Performance.
SMALL CAP VALUE FUND
How did the Fund perform for the period November 1, 2008 – October 31, 2009?
For the trailing year ended October 31, 2009, the MEMBERS Small Cap Value Fund returned 13.30% (Class A shares at net asset value), outperforming the Russell 2000® Value Index, which returned 1.96%, and the Morningstar Small Value category average return of 11.22%.
Equity markets posted strong positive returns for the one year ended October 31, 2009 following a weak start. Mid cap stocks (18.2%) outperformed small (6.5%) and large cap stocks (9.8%), as measured by the S&P MidCap 400, Russell 2000® and S&P 500 Indices, respectively. Growth stocks (11.3%) outpaced Value stocks (1.9%), as measured by the Russell 2000® Growth and Russell 2000® Value Indices. Within the Russell 2000® Value index, sector returns were mixed. Materials, information technology, and consumer discretionary posted double-digit gains and were the strongest positive performers. Financials, energy, and utilities trailed and were the only three sectors to post negative returns.
Overall outperformance was a result of stock selection which drove favorable relative returns in the financials, industrials, and consumer staples sectors and more than offset less favorable results in materials, consumer discretionary, and information technology. In addition, sector allocation, a residual of our bottom-up stock selection, was additive due to the Fund’s underweight to financials and overweight to consumer discretionary, while an underweight to the strong-performing information technology sector detracted from relative returns.
18
Management’s Discussion of Fund Performance
SMALL CAP VALUE FUND (continued)
What significant changes did you make to the portfolio since November 1, 2008?
The small cap value investment approach emphasizes individual stock selection; sector weights are a residual of the process. We do, however, carefully consider diversification across economic sectors to limit risk. Based on bottom-up stock decisions, the Fund’s overweight to the consumer staples sector increased and the underweight to financials and information technology narrowed, while overweight positions to the consumer discretionary and industrials sectors decreased.
What were the strongest contributors to Fund performance?
Key individual contributors to relative performance were Carlisle (industrials), Stage Stores (consumer discretionary), and Delphi Financial Group (financials). Diversified global manufacturer Carlisle posted better-than-expected second quarter results. Specialty department store operator Stage Stores announced a narrower-than-expected first quarter loss as the company succeeded at managing inventories and costs in a difficult retail environment. Life & Disability and workers compensation insurance provider Delphi benefited as its investment portfolio stabilized in a more favorable environment. As of the end of the period, we continued to hold all three securities.
What were the largest constraints on performance?
Detractors from relative performance during the period included Penn Virginia (energy), Modine Manufacturing (consumer discretionary), and Webster Financial (financials). Early in the year, oil and gas exploration and production company Penn Virginia announced disappointing drilling results and lowered its production growth target. Modine Manufacturing, which makes heating and cooling systems for vehicles and industrial applications, suffered from investor concerns over the impact of declining levels of auto sales on a company with a balance sheet levered to more robust auto production. Connecticut-based banking and investment services company Webster Financial was negatively impacted by significant writedowns on its investment portfolio and larger-than expected losses on loans. We continued to hold Penn Virginia and Webster Financial, but eliminated Modine Manufacturing.
How is the Fund positioned going forward?
Based on our two- to three-year time horizon, we continue to find attractively valued investment opportunities in a volatile environment.
Cumulative Performance of $10,000 Investment Since Inception1,2

19
Management’s Discussion of Fund Performance
SMALL CAP VALUE FUND (continued)
Average Annual Total Return through October 31, 20092 |
| | % Return Without Sales Charge | % Return After Sales Charge6 |
| | 1 Year | Since
12/27/06
Inception12 | Since
1/9/07
Inception | 1 Year | Since
12/27/06
Inception12 |
Class A Shares 3 | 13.30%
| (5.75)%
| —
| 6.85%
| (7.69)%
|
Class B Shares4 | 12.98
| (6.23)
| —
| 8.48
| (7.38)
|
Class Y Shares9 | 13.53
| —
| (4.96)%
| —
| —
|
Russell 2000¨ Value Index | 1.96
| (11.93)
| (11.56)
| NA
| NA
|
See accompanying Notes to Management’s Discussion of Fund Performance.
SMALL CAP GROWTH FUND
How did the Fund perform for the period November 1, 2008 – October 31, 2009?
For the trailing year ended October 31, 2009 the MEMBERS Small Cap Growth Fund returned -3.36% (Class A shares at net asset value) which lagged the Russell 2000® Growth Index return of 11.34% and the Morningstar Small Growth category average return of 13.17%. The period included a recession and some of the most volatile markets witnessed in the last 20 years. These markets caused tremendous disruptions to quantitative processes and risk models alike. The first quarter of 2009 contained the inflection point of March 9, and the Fund did not keep pace following this rapid shift in market drivers. The portfolio was further disadvantaged during the second quarter of 2009 by a rally in poorer quality securities. Although market returns for the second quarter were impressive, the underlying fundamentals were not; consequently, the rally was labeled as a ‘dash to trash’ in which the Fund did not participate. Also detracting from performance in the early third quarter of 2009 was the relatively larger weighted average market cap versus the index in the quarter. As a result, the Fund significantly underperformed over the past year.
The majority of the Fund’s performance shortfall was due to stock selection in each sector, although sector allocation was a detractor as well, most notably in information technology, consumer discretionary, and healthcare. Information technology was a strong performing sector for the index, returning close to 30% for the period. The Fund was underweight this sector which detracted from performance, but the larger shortfall came from stock selection in this sector. Consumer discretionary index names which were not held in the Fund cost the Fund relative performance, as did the Fund’s underweight position in this sector which returned 32% for the period. Additionally, within the healthcare sector, the Fund saw similar results of performance shortfall due to benchmark names which performed well, but were not held in the Fund.
What significant changes did you make to the portfolio since November 1, 2008?
There were no significant changes to the portfolio investment process during the twelve month period. The portfolio was recently rebalanced which left the largest active sector weights unchanged; healthcare at an approximate 8% underweight relative to the index and industrials at a rough 6% overweight.
What were the strongest contributors to Fund performance?
The strongest contributing sectors to overall Fund performance for the past twelve months were materials, utilities, telecommunication services, consumer staples and finance. The top five contributors from a security standpoint were clinical software developer and marketer Allscripts-Misys Healthcare Solutions Inc., men’s attire retailer Men’s Wearhouse Inc., predictive analytics software provider SPSS Inc which was acquired by IBM in October 2009, business consulting and staffing service provider MPS Group Inc., and digital entertainment technology provider Rovi Corporation.
20
Management’s Discussion of Fund Performance
SMALL CAP GROWTH FUND (continued)
What were the largest constraints on performance?
The largest detractors from performance from a security standpoint were semiconductor designer and manufacturer Microsemi Corporation and MKS Instruments within the information technology sector, oil and natural gas producer Penn Virginia, rail industry technology and service provider Wabtec Corporation, air transportation service provider UAL Corp, and behavioral health service provider Psychiatric Solutions Inc. Within the consumer discretionary sector, not holding strong performers Cheesecake Factory, J Crew, and Bally Technologies were a few names that were costly. Similarly within the healthcare sector, the omission of Human Genome, Dendreon, Corp, and Medarex Inc were costly to Fund performance as these stocks also performed well during the period.
Additional Comments
The Funds’ board of trustees approved the removal of Paradigm Asset Management as the Fund’s subadviser, along with the merger of the Small Cap Growth Fund with and into the Small Cap Value Fund which was completed November 30, 2009. Wellington Management will continue as the subadviser to the merged fund, which is now named the MEMBERS Small
Cap Fund.
Cumulative Performance of $10,000 Investment Since Inception1,2

Average Annual Total Return through October 31, 20092 |
| | % Return Without Sales Charge | % Return After Sales Charge6 |
| | 1 Year | Since
12/27/06
Inception12 | Since
1/9/07
Inception | 1 Year | Since
12/27/06
Inception12 |
Class A Shares 3 | (3.36)%
| (15.88)%
| —
| (8.90)%
| (17.61)%
|
Class B Shares4 | (4.06)
| (16.52)
| —
| (8.38)
| (17.55)
|
Class Y Shares9 | (3.34)
| —
| (15.44)%
| —
| —
|
Russell 2000¨ Growth Index | 11.34
| (7.91)
| (7.66)
| NA
| NA
|
See accompanying Notes to Management’s Discussion of Fund Performance.
21
Management’s Discussion of Fund Performance
INTERNATIONAL STOCK FUND
How did the Fund perform for the period November 1, 2008 – October 31, 2009?
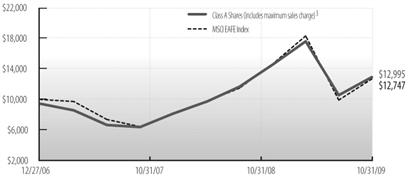
For the trailing year ended October 31, 2009, the MEMBERS International Stock Fund returned 22.82% (Class A shares at net asset value), compared to the MSCI EAFE Index which returned 28.41% and the Morningstar Foreign Large Blend category average return of 25.04%.
Over the period, international equity markets experienced two very different periods. The first part of the period was characterized by a continuation of the prior market declines, followed by a sharp rally from early March through mid-October. In the first segment, the credit crisis and world recession were front and center and traditionally defensive sectors, such as health care, utilities, telecom services and consumer staples, outperformed on a relative basis. The second segment witnessed strong sector rotation into financials and cyclical sectors, such as industrials, materials, and information technology, as investors anticipated better times in both credit markets and the economy. However, while global stocks have risen significantly, they remain well below the peak reached in October of 2007. International small-cap stocks also experienced a down period followed by a sharply positive period over the year. Small-caps performed strongly in 2009, posting only two negative monthly performances thus far this year. Shares in the developing world began 2009 with a period of considerable weakness caused by pessimistic sentiment over the outlook for global financial institutions, but ended the quarter with a significant rebound due to value hunting by investors, who were following some signs of improvement in the credit markets. From the start of the second quarter of 2009 through the end of the third quarter, emerging markets equities experienced an extraordinary recovery. With the exception of brief periods of respite in June and August, emerging markets stocks rose very strongly throughout the six-month period, as credit and global equity markets as well as investor sentiment demonstrated significant signs of improvement. The developing world took a break in October, ending the period with a flat monthly performance. For the year in total, The MSCI Emerging Markets Index increased by over 64%, as shares in Asia and Latin America performed better than those in Europe. Every sector and most countries in the Index rose during the year. Commodity prices remained generally buoyant, with crude oil reaching more than $80 per barrel and gold moving above $1,000 per ounce by the end of the period.
What significant changes did you make to the portfolio since November 1, 2008?
Over the last year, the Fund transitioned to a less defensive position than in the recent past, as long-term opportunities appeared during this tumultuous period. The Fund’s exposure to financials has changed dramatically, moving from an underweight at the end of February 2009 to an overweight by the end of October 2009. During the period, we added to our positions in several insurance and investment banking companies—QBE Insurance Group, Tokio Marine, Credit Suisse Group, and Nomura—that were trading at very low valuations given their sustainable return on equity. There were also unique opportunities in the banks segment, where Barclays, for example, was trading over 60% lower than its February 2007 highs.
Furthermore, the Fund was able to capitalize on the recent period by investing in companies that were trading at close to all-time historical valuation lows, including Hong Kong-based retailer Esprit, pharmaceuticals company Novo Nordisk, and automation-focused Fanuc.
Additionally, the Fund increased exposure to emerging markets. Notable additions within the asset class included Brazilian credit card payment processing company VisaNet, Banco do Brasil, Industrial & Commercial Bank of China (ICBC), Russian energy company Lukoil, and Mexican media company Grupo Televisa.
What were the strongest contributors to Fund performance?
Stock selection in the financials sector contributed to returns over the period. Positions in Prudential, Allianz, QBE Insurance Group, Nomura, Credit Suisse Group, ICBC, and BNP Paribas all added to performance. An underweight position relative to the
22
Management’s Discussion of Fund Performance
INTERNATIONAL STOCK FUND (continued)
index and stock selection in the consumer discretionary sector also added to returns, as positions in automaker Daimler and in media companies WPP and Informa performed strongly. A position in Banco do Brasil, a Brazilian bank, performed well as loan growth recovered, asset quality deterioration seemed to approach a bottom, and the local currency strengthened. Bank Mandiri, Indonesia’s leading financial company, performed well on the expectation that slowing inflation will lead to rate cuts. Shares of Telekomunikasi Indonesia, an Indonesian telecommunication services company, were up on the back of improving domestic usage, which also helped returns over the period.
What were the largest constraints on performance?
During the 12-month period, the Fund underperformed a very strong MSCI EAFE Index. High exposure and stock selection in consumer staples detracted from relative returns. Japan Tobacco, Imperial Tobacco Group, Diageo, and Heineken suffered from sector rotation. High exposure and stock selection in the health care sector also detracted from returns over the year, as did an underweight position relative to the index in the materials sector. Stock selection in the industrials sector also hurt performance, notably in capital goods company BAE Systems, which fell due to uncertain prospects in governmental defense spending. Exposure to small-cap stocks also detracted from the fund’s returns over the period. Shares of Satyam Computer Services, an Indian software company, were weak due to investor concerns over an alleged fraud. Prime Minister Putin’s attack on Mechel, a coking coal company, caused the shares to fall sharply due to the resultant forced selling by local speculative investors. Evraz Group, a Russian steel company, saw its stock suffer from sharply lower steel prices before we sold the position in April.
Our disadvantage to the benchmarks can be attributed to the Fund’s sector allocations, as well as poor stock selection within consumer staples as several stocks suffered from sector rotation, which could not be overcome by strong stock selection within the financial and consumer discretionary sectors.
How is the Fund positioned going forward?
While the global economy’s rate of decline is slowing, and some leading indicators have begun to rebound, the world continues to face numerous credit and growth challenges, including high unemployment, rising taxes, and bad debts; a slowdown in consumer spending and capital expenditures; continued deleveraging; and the imbalances caused by increasing public debt. We feel the stocks currently held within the Fund are, on average, competitively strong, with good management teams and robust balance sheets. This strength is complemented by attractive valuations and strong, sustainable financial productivity. We believe this leaves the Fund well positioned for the period ahead. We still remain reasonably optimistic about emerging markets in the medium and long term, but are concerned, and therefore neutral, in the short term. Valuations have increased considerably due to a dramatic change in investor attitudes—from deeply bearish six to nine months ago, when we were bullish about the outlook, to widely enthusiastic now. We would therefore advise investors not to be aggressive in emerging markets at this time.
23
Management’s Discussion of Fund Performance
INTERNATIONAL STOCK FUND (continued)
Cumulative Performance of $10,000 Investment Since Inception1,2
Average Annual Total Return through October 31, 20092 |
| | % Return Without Sales Charge | % Return After Sales Charge6 |
| | 1 Year | 3 Years | 5 Years | 10 Years | Since
6/30/06
Inception | 1 Year | 3 Years | 5 Years | 10 Years |
Class A Shares3 | 22.82%
| (3.93)%
| 6.03%
| 3.26%
| —
| 15.71%
| (5.82)%
| 4.79%
| 2.65%
|
Class B Shares4 | 21.91
| (4.68)
| 5.23
| 2.49
| —
| 17.41
| (5.50)
| 4.93
| 2.49
|
Class Y Shares9 | 23.25
| —
| —
| —
| (1.18)%
| —
| —
| —
| —
|
MSCI EAFE Index | 28.41
| (4.74)
| 5.59
| 2.46
| (0.99)
| NA
| NA
| NA
| NA
|
See accompanying Notes to Management’s Discussion of Fund Performance.
24
Notes to Management’s Discussion of Fund Performance
NA Not Applicable. Index returns do not reflect sales charges, fees or expenses.
1 This chart compares a $10,000 investment made in the fund to a $10,000 investment made in the index.
2 Fund returns are calculated after fund expenses have been subtracted and assume that dividends and capital gains are reinvested in additional shares of the fund. Returns do not reflect the deduction of taxes that a shareholder would pay on fund distributions or the redemption of fund shares. Investment return and principal value will fluctuate, so an investor’s shares, when redeemed, may be worth more or less than when purchased. Further information relating to the fund’s performance is contained in the Prospectus and elsewhere in this report. The fund’s past performance is not indicative of future performance. Current performance may be lower or higher than the performance data cited. For fund performance data current to the most recent month-end, please call 1-800-877-6089 or visit www.membersfunds.com. Indices are unmanaged and investors cannot invest in them directly. Index returns do not reflect fees or expenses.
3 Maximum sales charge is 5.75% for class A shares for the Conservative, Moderate and Aggressive Allocation Funds and the Diversified Income, Large Cap Value, Large Cap Growth, Mid Cap Value, Mid Cap Growth, Small Cap Value, Small Cap Growth and International Stock Funds. The maximum sales charge is 4.50% for the Bond and High Income Fund class A shares.
4 Maximum contingent deferred sales charge (CDSC) is 4.50% for class B shares, which is reduced after 12 months and eliminated after six years.
5 Maximum contingent deferred sales charge (CDSC) is 1% for class C shares, which is eliminated after one year.
6 Assumes maximum applicable sales charge.
7 The Conservative, Moderate and Aggressive Allocation Funds’ class A and B Shares commenced investment operations on June 30, 2006.
8 The Conservative, Moderate and Aggressive Allocation Funds’ class C Shares commenced investment operations on February 29, 2008.
9 Class Y Shares are only available for purchase by MEMBERS Funds and other affiliated asset allocation funds, in managed account programs, and to certain other investors as described in the current Prospectus. The Bond, High Income, Large Cap Value, Large Cap Growth, Mid Cap Value, Mid Cap Growth and International Stock Funds’ class Y shares commenced investment operations on June 30, 2006. The Small Cap Value and Small Cap Growth Funds’ class Y shares commenced investment operations on January 9, 2007.
10 The Mid Cap Value Fund class A and B shares commenced investment operations on February 28, 2001.
11 The Mid Cap Growth Fund class A and B shares commenced investment operations on February 29, 2000.
12 The Small Cap Value and Small Cap Growth Funds’ Class Y shares commenced investment operations on January 9, 2007.
13 In February 2009, the Target Allocation Funds changed their customized benchmarks from the Old Allocation Custom Fund Indices to the New Allocation Custom Fund Indices. Additionally, the Moderate and Aggressive Allocation Funds changed their broad-based securities market index to the S&P 500 Index, replacing the Russell 1000® and Russell 3000® Indices, respectively. In February 2010, the former indices will no longer be shown.
Source of Morningstar category peer group returns: Morningstar Direct; The Morningstar Average Peer Returns represents the average annual composite performance of all mutual funds listed in each fund category by Morningstar.
© 2009 Morningstar, Inc. All Rights Reserved. The information contained herein: (1) is proprietary to Morningstar and/or its content providers; (2) may not be copied or distributed; and (3) is not warranted to be accurate, complete or timely. Neither Morningstar nor its content providers are responsible for any damages or losses arising from any use of this information.
25
Notes to Management’s Discussion of Fund Performance
BENCHMARK DESCRIPTIONS
Allocation Fund Indexes
The New Conservative Allocation Fund Custom Index consists of 65% Merrill Lynch U.S. Corporate, Government and Mortgage Index, 30% Russell 3000® Index and 5% MSCI EAFE Index. See market indexes descriptions below.
The Old Conservative Allocation Fund Custom Index consists of 55% Merrill Lynch U.S. Corporate, Government & Mortgage Index, 30% Russell 1000® Index, and 15% 90-Day U.S. Treasury Bills. See market indexes descriptions below.
The New Moderate Allocation Fund Custom Index consists of 40% Merrill Lynch U.S. Corporate, Government and Mortgage Index, 45% Russell 3000® Index and 15% MSCI EAFE Index. See market indexes descriptions below.
The Old Moderate Allocation Fund Custom Index consists of 50% Russell 3000® Index, 30% Merrill Lynch U.S. Corporate, Government & Mortgage Index, 10% MSCI EAFE Index and 10% 90-Day U.S. Treasury Bills. See market indexes descriptions below.
The New Aggressive Allocation Fund Custom Index consists of 15% Merrill Lynch U.S. Corporate, Government and Mortgage Index, 55% Russell 3000® Index and 30% MSCI EAFE Index. See market indexes descriptions below.
The Old Aggressive Allocation Fund Custom Index consists of 55% Russell 1000® Index, 22% MSCI EAFE Index and 15% Russell 2000® Index and 8% MSCI Emerging Markets Index. See market indexes descriptions below.
Market Indexes
The Merrill Lynch U.S. Corporate, Government & Mortgage Index is a broad-based measure of the total rate of return performance of the U.S. investment-grade bond markets. The index is a capitalization-weighted aggregation of outstanding U.S. treasury, agency and supranational mortgage pass-through, and investment-grade corporate bonds meeting specified selection criteria.
The Merrill Lynch U.S. High Yield Master II Constrained Index tracks the performance of below investment grade U.S. dollar denominated corporate bonds publicly issued in the U.S. domestic market, but limits any individual issuer to a maximum weighting of 2%.
The MSCI EAFE (Europe, Australasia & Far East) Index is a free float-adjusted market capitalization index that is designed to measure developed market equity performance, excluding the U.S. and Canada.
The MSCI Emerging Markets Index is a free-float adjusted market capitalization index that measures equity performance in global emerging markets.
The Russell 1000¨ Index is a large-cap market index which measures the performance of the 1,000 largest companies in the Russell 3000® Index (see definition below).
The Russell 1000¨ Growth Index is a large-cap market index which measures the performance of those Russell 1000 companies with higher price-to-book ratios and higher forecasted growth values.
The Russell 1000¨ Value Index is a large-cap market index which measures the performance of those Russell 1000 companies with lower price-to-book ratios and lower forecasted growth values.
The Russell 2000¨ Index is a small-cap market index which measures the performance of the smallest 2,000 companies in the Russell 3000® Index (see definition below.)
26
Notes to Management’s Discussion of Fund Performance
The Russell 2000¨ Growth Index is a small-cap market index which measures the performance of those Russell 2000 companies with higher price-to-book ratios and higher forecasted growth values.
The Russell 2000¨ Value Index is a small-cap market index which measures the performance of those Russell 2000 companies with lower price-to-book ratios and lower forecasted growth values.
The Russell 3000¨ Index measures the performance of the 3,000 largest U.S. companies based on total market capitalization, which represents 98% of the investable U.S. equity market.
The Russell Midcap¨ Growth Index is a mid-cap market index which measures the performance of those Russell Midcap companies with higher price-to-book ratios and higher forecasted growth values.
The Russell Midcap¨ Value Index is a mid-cap market index which measures the performance of those Russell Midcap companies with lower price-to-book ratios and lower forecasted growth values.
The S&P 500 Index is a large-cap market index which measures the performance of a representative sample of 500 leading companies in leading industries in the U.S.
27
Conservative Allocation Fund Portfolio of Investments
Portfolio Allocation as a Percentage of Net Assets
as of October 31, 2009
Portfolio Holdings as a Percentage of Total Market Value
as of October 31, 2009
MEMBERS Bond Fund Class Y
| 26%
|
Dodge & Cox Income Fund
| 20%
|
MEMBERS High Income Fund Class Y
| 13%
|
MEMBERS Large Cap Growth Fund Class Y
| 9%
|
MEMBERS International Stock Fund Class Y
| 9%
|
MEMBERS Large Cap Value Fund Class Y
| 7%
|
Fairholme Fund
| 6%
|
Oppenheimer International Bond Fund
| 5%
|
Nakoma Absolute Return Fund Class Y
| 4%
|
SSgA Prime Money Market Fund
| 1%
|
Shares | | Value (Note 2) |
INVESTMENT COMPANIES - 99.38%
| |
| | Alternative Asset Class Funds - 3.64%
| |
66,045
| Nakoma Absolute Return Fund *
| $1,345,330
|
| | Bond Funds - 63.58%
| |
571,490
| Dodge & Cox Income Fund
| 7,417,941
|
934,413
| MEMBERS Bond Fund, Class Y (R)
| 9,446,915
|
709,172
| MEMBERS High Income Fund, Class Y (R)
| 4,715,994
|
289,587
| Oppenheimer International Bond Fund, Class Y
| 1,893,897
|
| | | 23,474,747
|
| | Foreign Stock Funds - 8.72%
| |
323,539
| MEMBERS International Stock Fund, Class Y (R)
| 3,219,216
|
| | Money Market Funds - 0.33%
| |
122,890
| SSgA Prime Money Market Fund
| 122,890
|
| | | |
Shares | | Value (Note 2) |
| | Stock Funds - 23.11%
| |
82,090
| Fairholme Fund
| $2,262,408
|
264,567
| MEMBERS Large Cap Growth Fund, Class Y (R)
| 3,500,225
|
261,669
| MEMBERS Large Cap Value Fund, Class Y (R)
| 2,768,459
|
| | | 8,531,092
|
| | Total Investment Companies - 99.38%
( Cost $36,936,025** )
| 36,693,275
|
NET OTHER ASSETS AND LIABILITIES - 0.62%
| 230,717
|
TOTAL NET ASSETS - 100.00%
| $36,923,992
|
*
| Non-income producing.
|
**
| Aggregate cost for Federal tax purposes was $38,251,190.
|
(R)
| Affiliated Company (see Note 10).
|
See accompanying Notes to Financial Statements.
28
Moderate Allocation Fund Portfolio of Investments
Portfolio Allocation as a Percentage of Net Assets
as of October 31, 2009
Portfolio Holdings as a Percentage of Total Market Value
as of October 31, 2009
MEMBERS International Stock Fund Class Y
| 16%
|
MEMBERS Bond Fund Class Y
| 15%
|
MEMBERS Large Cap Growth Fund Class Y
| 13%
|
Dodge & Cox Income Fund
| 13%
|
MEMBERS High Income Fund Class Y
| 9%
|
MEMBERS Large Cap Value Fund Class Y
| 9%
|
Fairholme Fund
| 6%
|
Gateway Fund Class Y
| 4%
|
Oppenheimer International Bond Fund
| 3%
|
MEMBERS Mid Cap Growth Fund Class Y
| 3%
|
MEMBERS Small Cap Value Fund Class Y
| 3%
|
Nakoma Absolute Return Fund
| 2%
|
MEMBERS Small Cap Growth Fund Class Y
| 2%
|
Principal International Emerging Markets Fund
| 2%
|
PIMCO Commodity RealReturn Strategy Fund
| 0%† |
SSgA Prime Money Market Fund
| 0%† |
† Rounds to 0%
Shares | | Value (Note 2) |
INVESTMENT COMPANIES - 100.05%
| |
| | Alternative Asset Class Funds - 2.30%
| |
90,045
| Nakoma Absolute Return Fund *
| $1,834,225
|
23,640
| PIMCO Commodity RealReturn Strategy Fund, Institutional Class
| 190,772
|
| | | 2,024,997
|
| | Bond Funds - 39.95%
| |
855,610
| Dodge & Cox Income Fund
| 11,105,814
|
1,304,545
| MEMBERS Bond Fund, Class Y (R)
| 13,188,947
|
1,236,623
| MEMBERS High Income Fund, Class Y (R)
| 8,223,542
|
399,651
| Oppenheimer International Bond Fund, Class Y
| 2,613,719
|
| | | 35,132,022
|
| | Foreign Stock Funds - 17.40%
| |
1,399,914
| MEMBERS International Stock Fund, Class Y (R)
| 13,929,147
|
66,343
| Principal International Emerging Markets Fund, Institutional Class
| 1,370,639
|
| | | 15,299,786
|
| | Money Market Funds - 0.21%
| |
184,492
| SSgA Prime Money Market Fund
| 184,492
|
| | | |
Shares | | Value (Note 2) |
| | Stock Funds - 40.19%
| |
193,731
| Fairholme Fund
| $5,339,216
|
160,659
| Gateway Fund, Class Y
| 3,939,352
|
855,788
| MEMBERS Large Cap Growth Fund, Class Y (R)
| 11,322,077
|
746,352
| MEMBERS Large Cap Value Fund, Class Y (R)
| 7,896,399
|
500,218
| MEMBERS Mid Cap Growth Fund, Class Y (R) *
| 2,501,088
|
307,346
| MEMBERS Small Cap Growth Fund,
Class Y (R) *
| 1,865,592
|
302,264
| MEMBERS Small Cap Value Fund, Class Y (R)
| 2,484,607
|
| | | 35,348,331
|
| | Total Investment Companies - 100.05%
( Cost $94,292,130** ) | 87,989,628
|
NET OTHER ASSETS AND LIABILITIES - (0.05)%
| (43,251)
|
TOTAL NET ASSETS - 100.00%
| $87,946,377
|
*
| Non-income producing.
|
**
| Aggregate cost for Federal tax purposes was $97,372,131.
|
(R)
| Affiliated Company (see Note 10).
|
See accompanying Notes to Financial Statements.
29
Aggressive Allocation Fund Portfolio of Investments
Portfolio Allocation as a Percentage of Net Assets
as of October 31, 2009
Portfolio Holdings as a Percentage of Total Market Value
as of October 31, 2009
MEMBERS International Stock Fund Class Y
| 19%
|
MEMBERS Large Cap Growth Fund Class Y
| 16%
|
MEMBERS Large Cap Value Fund Class Y
| 11%
|
Victory Special Value Fund
| 8%
|
Laudus International MarketMasters Fund, Select Shares
| 7%
|
MEMBERS High Income Fund Class Y
| 6%
|
MEMBERS Mid Cap Growth Fund Class Y
| 6%
|
Gateway Fund Class Y
| 6%
|
Fairholme Fund
| 5%
|
MEMBERS Small Cap Value Fund Class Y
| 5%
|
MEMBERS Small Cap Growth Fund Class Y
| 4%
|
MEMBERS Bond Fund Class Y
| 3%
|
Principal International Emerging Markets Fund
| 3%
|
SSgA Prime Money Market Fund
| 1%
|
PIMCO Commodity RealReturn Strategy Fund
| 0%† |
† Rounds to 0%
Shares | | Value (Note 2) |
INVESTMENT COMPANIES - 100.00%
| |
| | Alternative Asset Class Funds - 0.18%
| |
6,577
| PIMCO Commodity RealReturn Strategy Fund, Institutional Class
| $ 53,073
|
| | Bond Funds - 9.39%
| |
95,067
| MEMBERS Bond Fund, Class Y (R)
| 961,130
|
276,834
| MEMBERS High Income Fund, Class Y (R)
| 1,840,948
|
| | | 2,802,078
|
| | Foreign Stock Funds - 28.86%
| |
134,862
| Laudus International MarketMasters Fund
| 2,029,667
|
573,860
| MEMBERS International Stock Fund, Class Y (R)
| 5,709,904
|
42,211
| Principal International Emerging Markets Fund, Institutional Class
| 872,075
|
| | | 8,611,646
|
| | Money Market Funds - 0.38%
| |
115,239
| SSgA Prime Money Market Fund
| 115,239
|
| | | |
Shares | | Value (Note 2) |
| | Stock Funds - 61.19%
| |
57,340
| Fairholme Fund
| $1,580,290
|
72,451
| Gateway Fund, Class Y
| 1,776,492
|
361,678
| MEMBERS Large Cap Growth Fund, Class Y (R)
| 4,785,002
|
321,461
| MEMBERS Large Cap Value Fund, Class Y (R)
| 3,401,060
|
357,423
| MEMBERS Mid Cap Growth Fund, Class Y (R)*
| 1,787,116
|
188,982
| MEMBERS Small Cap Growth Fund,
Class Y (R)*
| 1,147,123
|
169,339
| MEMBERS Small Cap Value Fund, Class Y (R)
| 1,391,968
|
194,920
| Victory Special Value Fund, Class I
| 2,391,663
|
| | | 18,260,714
|
| | Total Investment Companies - 100.00%
( Cost $33,271,329 ) | 29,842,750
|
NET OTHER ASSETS AND LIABILITIES - 0.00%
| 68
|
TOTAL NET ASSETS - 100.00%
| $29,842,818
|
*
| Non-income producing.
|
**
| Aggregate cost for Federal tax purposes was $34,746,213.
|
(R)
| Affiliated Company (see Note 10).
|
See accompanying Notes to Financial Statements.
30
Cash Reserves Fund Portfolio of Investments
Portfolio Allocation as a Percentage of Net Assets
as of October 31, 2009
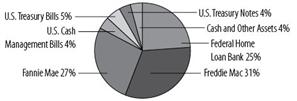
|
Par Value | | Value (Note 2) |
U.S. GOVERNMENT AND AGENCY
OBLIGATIONS - 96.16%
| |
| | Fannie Mae - 26.53%
| |
650,000
| 0.760%, due 11/02/09 (A)
| 649,986
|
750,000
| 0.134%, due 12/09/09 (A)
| 749,894
|
615,000
| 4.625%, due 12/15/09
| 618,125
|
700,000
| 0.100%, due 12/17/09 (A)
| 699,911
|
750,000
| 0.110%, due 12/23/09 (A)
| 749,881
|
750,000
| 0.120%, due 12/30/09 (A)
| 749,852
|
275,000
| 3.100%, due 02/04/10
| 277,084
|
| | | 4,494,733
|
| | Federal Home Loan Bank - 24.53%
| |
$ 580,000
| 0.170%, due 11/04/09 (A)
| $ 579,992
|
625,000
| 0.313%, due 11/06/09 (A)
| 624,990
|
500,000
| 0.155%, due 11/25/09 (A)
| 499,948
|
750,000
| 0.100%, due 11/27/09 (A)
| 749,946
|
450,000
| 0.120%, due 12/04/09 (A)
| 449,951
|
750,000
| 0.110%, due 01/22/10 (A)
| 749,812
|
500,000
| 0.870%, due 01/26/10
| 500,755
|
| | | 4,155,394
|
| | Freddie Mac - 31.52% (A)
| |
250,000
| 0.160%, due 11/02/09
| 249,999
|
660,000
| 0.100%, due 11/04/09
| 659,995
|
500,000
| 0.145%, due 11/09/09
| 499,984
|
381,000
| 0.100%, due 11/16/09
| 380,984
|
650,000
| 0.120%, due 11/23/09
| 649,952
|
650,000
| 0.090%, due 12/21/09
| 649,919
|
500,000
| 0.100%, due 01/04/10
| 499,911
|
781,000
| 0.120%, due 01/06/10
| 780,828
|
269,000
| 0.130%, due 01/20/10
| 268,922
|
700,000
| 0.165%, due 03/30/10
| 699,522
|
| | | 5,340,016
|
Par Value | | Value (Note 2) |
| | U.S. Cash Management Bills - 4.42% (A)
| |
$ 750,000
| 0.420%, due 04/01/10
| $ 748,680
|
| | U.S. Treasury Bills - 4.72% (A)
| |
800,000
| 0.297%, due 11/19/09
| 799,881
|
| | U.S. Treasury Notes - 4.44%
| |
750,000
| 3.125%, due 11/30/09
| 751,767
|
| | Total U.S. Government and Agency
Obligations ( Cost $16,290,471 ) | 16,290,471
|
Shares | | |
INVESTMENT COMPANY - 3.73%
| |
631,774
| SSgA U.S. Treasury Money Market Fund
| 631,774
|
| | Total Investment Company
( Cost $631,774 ) | 631,774
|
TOTAL INVESTMENTS - 99.89% ( Cost $16,922,245** ) | 16,922,245
|
NET OTHER ASSETS AND LIABILITIES - 0.11%
| 18,009
|
TOTAL NET ASSETS - 100.00%
| $16,940,254
|
**
| Aggregate cost for Federal tax purposes was $16,922,245.
|
(A)
| Rate noted represents annualized yield at time of purchase.
|
See accompanying Notes to Financial Statements.
31
Bond Fund Portfolio of Investments
Portfolio Allocation as a Percentage of Net Assets
as of October 31, 2009
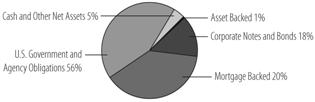
|
Par Value | | Value (Note 2) |
ASSET BACKED - 1.07%
| |
$ 64,040
| ABSC Long Beach Home Equity Loan Trust,
Series 2000-LB1, Class AF5 (M), 8.550%,
due 09/21/30 | $ 59,727
|
670,000
| Chase Issuance Trust, Series 2007-A17, Class A,
5.120%, due 10/15/14 | 726,658
|
1,500,000
| New Century Home Equity Loan Trust, Series 2003-5, Class AI5 (G), 5.500%, due 11/25/33
| 1,357,948
|
| | Total Asset Backed ( Cost $2,228,862 )
| 2,144,333
|
CORPORATE NOTES AND BONDS - 18.15%
| |
| | Consumer Discretionary - 1.87%
| |
750,000
| American Association of Retired Persons (C),
7.500%, due 05/01/31 | 814,664
|
215,000
| DR Horton, Inc., 5.250%, due 02/15/15
| 198,606
|
575,000
| Erac USA Finance Co. (C), 6.700%, due 06/01/34
| 517,065
|
1,000,000
| McDonald’s Corp.. 5.000%, due 02/01/19
| 1,057,547
|
1,000,000
| Time Warner Cable, Inc.. 8.250%, due 02/14/14
| 1,172,829
|
| | | 3,760,711
|
| | Consumer Staples - 2.05%
| |
1,000,000
| Campbell Soup Co.. 4.500%, due 02/15/19
| 1,019,719
|
215,000
| PepsiCo, Inc./NC. 4.650%, due 02/15/13
| 230,943
|
1,000,000
| PepsiCo, Inc./NC, 7.900%, due 11/01/18
| 1,256,747
|
1,000,000
| Walgreen Co., 5.250%, due 01/15/19
| 1,076,197
|
525,000
| WM Wrigley Jr. Co., 4.300%, due 07/15/10
| 530,250
|
| | | 4,113,856
|
| | Energy - 0.82%
| |
240,000
| Hess Corp.. 7.875%, due 10/01/29
| 282,830
|
850,000
| Transocean, Inc.. 6.000%, due 03/15/18
| 921,235
|
450,000
| Valero Energy Corp.. 7.500%, due 04/15/32
| 445,637
|
| | | 1,649,702
|
| | Financials - 3.94%
| |
500,000
| American General Finance Corp., Series H,
4.625%, due 09/01/10 | 465,488
|
215,000
| Bank of America Corp., 5.750%, due 12/01/17
| 218,614
|
Par Value | | Value (Note 2) |
$ 420,000
| Bear Stearns Cos. LLC/The,
7.250%, due 02/01/18
| $ 480,402
|
1,250,000
| Caterpillar Financial Services Corp..,
7.050%, due 10/01/18 | 1,447,687
|
290,000
| General Electric Global Insurance Holding Corp.,
7.000%, due 02/15/26 | 277,870
|
330,000
| General Electric Global Insurance Holding Corp.,
7.750%, due 06/15/30 | 336,847
|
750,000
| Goldman Sachs Group, Inc./The, 5.700%, due 09/01/12
| 813,866
|
490,000
| HCP, Inc., 6.700%, due 01/30/18
| 486,877
|
520,000
| Lehman Brothers Holdings, Inc. (E),
5.750%, due 01/03/17 | 52
|
530,000
| Merrill Lynch & Co., Inc., 6.150%, due 04/25/13
| 568,136
|
270,000
| Simon Property Group L.P., 5.875%, due 03/01/17
| 275,135
|
440,000
| SLM Corp., 5.125%, due 08/27/12
| 391,778
|
800,000
| Textron Financial Corp., 6.000%, due 11/20/09
| 800,018
|
250,000
| UBS AG/Stamford Branch, 5.750%, due 04/25/18
| 254,960
|
500,000
| US Bank NA/Cincinnati, OH, 6.300%, due 02/04/14
| 561,135
|
485,000
| Wells Fargo & Co., 5.250%, due 10/23/12
| 520,514
|
| | | 7,899,379
|
| | Health Care - 0.84%
| |
500,000
| Eli Lilly & Co., 6.570%, due 01/01/16
| 553,680
|
325,000
| Genentech, Inc., 5.250%, due 07/15/35
| 320,910
|
500,000
| Merck & Co., Inc./NJ, 5.750%, due 11/15/36
| 535,875
|
230,000
| Wyeth, 6.500%, due 02/01/34
| 266,012
|
| | | 1,676,477
|
| | Industrials - 1.98%
| |
240,000
| Boeing Co./The, 8.625%, due 11/15/31
| 319,687
|
285,000
| Burlington Northern Santa Fe Corp., 8.125%, due 04/15/20
| 339,577
|
800,000
| General Electric Co., 5.000%, due 02/01/13
| 851,891
|
See accompanying Notes to Financial Statements.
32
Bond Fund Portfolio of Investments
Par Value | | Value (Note 2) |
CORPORATE NOTES AND BONDS (continued) | |
| | Industrials (continued) | |
$1,000,000
| Honeywell International, Inc., 3.875%,
due 02/15/14
| $1,043,460
|
270,000
| Lockheed Martin Corp., 7.650%, due 05/01/16
| 326,868
|
359,000
| Norfolk Southern Corp., 5.590%, due 05/17/25
| 361,757
|
390,000
| Norfolk Southern Corp., 7.050%, due 05/01/37
| 475,431
|
235,000
| Waste Management, Inc., 7.125%, due 12/15/17
| 260,679
|
| | | 3,979,350
|
| | Information Technology - 1.13%
| |
400,000
| Cisco Systems, Inc., 5.500%, due 02/22/16
| 439,629
|
1,000,000
| Hewlett-Packard Co., 6.125%, due 03/01/14
| 1,124,957
|
660,000
| Xerox Corp., 6.875%, due 08/15/11
| 703,376
|
| | | 2,267,962
|
| | Materials - 0.45%
| |
105,000
| EI Du Pont de Nemours & Co., 5.000%,
due 01/15/13
| 113,499
|
325,000
| Westvaco Corp., 8.200%, due 01/15/30
| 325,439
|
500,000
| Weyerhaeuser Co., 7.375%, due 03/15/32
| 458,734
|
| | | 897,672
|
| | Telecommunication Services - 3.47%
| |
1,500,000
| AT&T, Inc., 4.850%, due 02/15/14
| 1,601,984
|
1,500,000
| Cellco PartnershipVerizon Wireless Capital LLC (C), 8.500%, due 11/15/18
| 1,868,824
|
525,000
| Comcast Cable Communications Holdings, Inc.,
9.455%, due 11/15/22 | 670,076
|
775,000
| New Cingular Wireless Services, Inc., 7.875%, due 03/01/11
| 839,541
|
455,000
| Rogers Communications, Inc. (D), 6.250%, due 06/15/13
| 496,480
|
265,000
| Sprint Nextel Corp., 6.000%, due 12/01/16
| 227,900
|
1,000,000
| Verizon Communications, Inc., 8.750%, due 11/01/18
| 1,248,961
|
| | | 6,953,766
|
| | Utilities - 1.60%
| |
500,000
| Energy East Corp., 8.050%, due 11/15/10
| 530,958
|
535,000
| Interstate Power & Light Co., 6.250%,
due 07/15/39
| 590,314
|
250,000
| Progress Energy, Inc., 7.750%, due 03/01/31
| 309,684
|
650,000
| Sierra Pacific Power Co., Series M, 6.000%, due 05/15/16
| 697,337
|
215,000
| Virginia Electric and Power Co., 5.100%,
due 11/30/12
| 233,354
|
750,000
| Wisconsin Electric Power Co.
| |
| | 6.500%, due 06/01/28
| 837,856
|
| | | 3,199,503
|
| | Total Corporate Notes and Bonds
( Cost $34,553,005 ) | 36,398,378
|
Par Value | | Value (Note 2) |
MORTGAGE BACKED - 19.92%
| |
| | Fannie Mae - 17.73%
|
$ 554,812
| 4.000%, due 04/01/15 Pool # 255719
| $ 570,340
|
409,770
| 5.500%, due 04/01/16 Pool # 745444
| 431,322
|
29,736
| 6.000%, due 05/01/16 Pool # 582558
| 32,124
|
352,924
| 5.500%, due 02/01/18 Pool # 673194
| 380,052
|
549,460
| 5.000%, due 05/01/20 Pool # 813965
| 583,795
|
659,350
| 4.500%, due 09/01/20 Pool # 835465
| 693,043
|
55,497
| 6.000%, due 05/01/21 Pool # 253847
| 60,021
|
2,498,230
| 4.500%, due 04/01/23 Pool # 974401
| 2,600,905
|
1,697,406
| 4.500%, due 06/01/23 Pool # 984075
| 1,767,168
|
27,986
| 7.000%, due 12/01/29 Pool # 762813
| 31,005
|
52,237
| 7.000%, due 11/01/31 Pool # 607515
| 57,823
|
250,300
| 6.500%, due 03/01/32 Pool # 631377
| 271,227
|
2,229
| 7.000%, due 04/01/32 Pool # 641518
| 2,458
|
30,922
| 7.000%, due 05/01/32 Pool # 644591
| 34,229
|
634,469
| 6.500%, due 06/01/32 Pool # 545691
| 687,517
|
247,274
| 6.000%, due 12/01/32 Pool # 676552
| 265,756
|
1,300,959
| 5.500%, due 04/01/33 Pool # 690206
| 1,376,395
|
712,860
| 5.000%, due 10/01/33 Pool # 254903
| 741,916
|
1,001,645
| 5.500%, due 11/01/33 Pool # 555880
| 1,059,726
|
107,724
| 5.000%, due 05/01/34 Pool # 775604
| 112,031
|
293,498
| 5.000%, due 05/01/34 Pool # 780890
| 305,232
|
167,714
| 5.000%, due 06/01/34 Pool # 255230
| 174,419
|
1,350,354
| 5.500%, due 06/01/34 Pool # 780384
| 1,427,388
|
17,412
| 7.000%, due 07/01/34 Pool # 792636
| 19,118
|
235,061
| 5.500%, due 08/01/34 Pool # 793647
| 248,471
|
1,312,664
| 5.500%, due 03/01/35 Pool # 815976
| 1,386,522
|
554,037
| 5.500%, due 07/01/35 Pool # 825283
| 585,210
|
700,454
| 5.000%, due 08/01/35 Pool # 829670
| 728,019
|
345,938
| 5.500%, due 08/01/35 Pool # 826872
| 365,403
|
555,828
| 5.000%, due 09/01/35 Pool # 820347
| 577,702
|
554,607
| 5.000%, due 09/01/35 Pool # 835699
| 576,432
|
700,679
| 5.000%, due 10/01/35 Pool # 797669
| 728,253
|
817,268
| 5.500%, due 10/01/35 Pool # 836912
| 863,253
|
641,547
| 5.000%, due 11/01/35 Pool # 844504
| 666,794
|
733,292
| 5.000%, due 11/01/35 Pool # 844809
| 762,149
|
737,334
| 5.000%, due 12/01/35 Pool # 850561
| 766,351
|
894,955
| 6.000%, due 07/01/36 Pool # 870749
| 953,455
|
723,684
| 6.000%, due 11/01/36 Pool # 902510
| 777,338
|
681,655
| 5.500%, due 02/01/37 Pool # 905140
| 718,837
|
604,348
| 5.500%, due 05/01/37 Pool # 899323
| 637,125
|
986,494
| 5.500%, due 05/01/37 Pool # 928292
| 1,039,997
|
855,331
| 6.000%, due 10/01/37 Pool # 947563
| 910,439
|
1,832,802
| 6.500%, due 12/01/37 Pool # 889072
| 1,970,292
|
2,002,153
| 5.000%, due 04/01/38 Pool # 257160
| 2,078,642
|
910,639
| 5.500%, due 07/01/38 Pool # 986805
| 959,885
|
1,103,039
| 5.500%, due 07/01/38 Pool # 986973
| 1,162,690
|
See accompanying Notes to Financial Statements.
33
Bond Fund Portfolio of Investments
Par Value | | Value (Note 2) |
MORTGAGE BACKED (continued) | |
| | Fannie Mae (continued) | |
$1,179,573
| 5.000%, due 08/01/38 Pool # 988934
| $1,224,637
|
1,118,287
| 6.500%, due 08/01/38 Pool # 987711
| 1,202,113
|
| | | 35,575,019
|
| | Freddie Mac - 2.14%
|
415,564
| 5.000%, due 05/01/18 Pool # E96322
| 444,980
|
4,743
| 8.000%, due 06/01/30 Pool # C01005
| 5,397
|
8,434
| 7.000%, due 03/01/31 Pool # C48133
| 9,301
|
106,439
| 6.500%, due 01/01/32 Pool # C62333
| 115,371
|
1,736,939
| 5.000%, due 07/01/33 Pool # A11325
| 1,807,465
|
162,897
| 6.000%, due 10/01/34 Pool # A28439
| 174,308
|
137,019
| 6.000%, due 10/01/34 Pool # A28598
| 146,617
|
162,970
| 5.000%, due 04/01/35 Pool # A32315
| 169,307
|
141,521
| 5.000%, due 04/01/35 Pool # A32316
| 147,024
|
1,213,613
| 5.500%, due 11/01/37 Pool # A68787
| 1,279,244
|
| | | 4,299,014
|
| | Ginnie Mae - 0.05%
| |
16,282
| 8.000%, due 10/20/15 Pool # 002995
| 17,573
|
42,056
| 6.500%, due 02/20/29 Pool # 002714
| 45,574
|
23,717
| 6.500%, due 04/20/31 Pool # 003068
| 25,676
|
| | | 88,823
|
| | Total Mortgage Backed
( Cost $37,745,211 )
| 39,962,856
|
U.S. GOVERNMENT AND
AGENCY OBLIGATIONS - 56.30%
| |
| | Federal Farm Credit Bank - 0.28%
| |
500,000
| 5.875%, due 10/03/16
| 571,386
|
| | Freddie Mac - 1.59%
| |
2,500,000
| 4.875%, due 11/15/13
| 2,762,825
|
400,000
| 4.500%, due 01/15/14
| 436,300
|
| | | 3,199,125
|
| | Fannie Mae - 0.60%
| |
1,095,000
| 4.625%, due 10/15/14
| 1,197,433
|
| | U.S. Treasury Bills - 4.30% (A)
| |
3,500,000
| 0.320%, due 12/17/09
| 3,498,571
|
120,000
| 0.324%, due 12/17/09
| 119,950
|
5,000,000
| 0.095%, due 12/24/09
| 4,999,305
|
| | | 8,617,826
|
| | U.S. Treasury Bonds - 4.75%
| |
2,905,000
| 6.625%, due 02/15/27
| 3,791,025
|
5,500,000
| 4.500%, due 05/15/38
| 5,744,920
|
| | | 9,535,945
|
Par Value | | Value (Note 2) |
| | U.S. Treasury Notes - 44.78%
| |
$21,000,000
| 0.875%, due 01/31/11
| $21,100,086
|
3,100,000
| 0.875%, due 02/28/11
| 3,114,167
|
2,000,000
| 1.000%, due 07/31/11
| 2,009,532
|
5,000,000
| 1.750%, due 11/15/11
| 5,082,420
|
4,000,000
| 1.125%, due 12/15/11
| 4,011,876
|
4,975,000
| 1.375%, due 02/15/12
| 5,007,646
|
1,000,000
| 4.625%, due 02/29/12
| 1,081,406
|
1,200,000
| 4.500%, due 03/31/12
| 1,295,626
|
688,000
| 1.375%, due 05/15/12
| 691,010
|
7,425,000
| 3.125%, due 08/31/13
| 7,780,004
|
8,850,000
| 4.000%, due 02/15/14
| 9,573,903
|
8,360,000
| 4.250%, due 08/15/14
| 9,136,569
|
2,000,000
| 2.375%, due 09/30/14
| 2,007,960
|
5,500,000
| 4.250%, due 08/15/15
| 5,992,421
|
4,300,000
| 4.250%, due 11/15/17
| 4,621,494
|
7,700,000
| 2.750%, due 02/15/19
| 7,317,402
|
| | | 89,823,522
|
| | Total U.S. Government and Agency Obligations ( Cost $110,429,535 )
| 112,945,237
|
| | | |
Shares | | |
INVESTMENT COMPANY - 3.77%
| |
7,566,106
| SSgA Prime Money Market Fund
| 7,566,106
|
| | Total Investment Company
( Cost $7,566,106 ) | 7,566,106
|
TOTAL INVESTMENTS - 99.21% ( Cost $192,522,719** ) | 199,016,910
|
NET OTHER ASSETS AND LIABILITIES - 0.79%
| 1,590,169
|
TOTAL NET ASSETS - 100.00%
| $200,607,079
|
**
| Aggregate cost for Federal tax purposes was $192,530,017.
|
(A)
| Rate noted represents annualized yield at time of purchase.
|
(C)
| Security sold within terms of a private placement memorandum exempt from registration under section 144A of the Securities Act of 1933, as amended, and may be sold only to dealers in that program or other “qualified institutional investors.” The securities have been determined to be liquid under guidelines established by the Board of Trustees.
|
(D)
| Notes and bonds, issued by foreign entities, denominated in U.S. dollars. The aggregate of these securities is 0.60% of total net assets.
|
(E)
| In default. Issuer is bankrupt.
|
(G)
| Floating rate or variable rate note. Rate shown is as of October 31, 2009.
|
(M)
| Stated interest rate is contingent upon sufficient collateral market value. If collateral market value falls below a stated level, the issuer will either initiate a clean-up call or increase the stated interest rate.
|
| |
| |
See accompanying Notes to Financial Statements.
34
High Income Fund Portfolio of Investments
Industry Allocation as a Percentage of Net Assets
as of October 31, 2009
Health Care
| 9%
| | Consumer Products
| 3%
| | Apparel/Textiles
| 1%
|
Support Services
| 8%
| | Food and Drug Retailers
| 3%
| | Beverage/Food
| 1%
|
Telecommunications
| 8%
| | General Industrial and Manufacturing
| 3%
| | Environmental
| 1%
|
Oil and Gas
| 7%
| | Packaging
| 3%
| | Forestry/Paper
| 1%
|
Utilities
| 7%
| | Technology
| 3%
| | Transportation
| 1%
|
Cash and Other Net Assets
| 6%
| | Building Materials
| 2%
| | Hotels
| 1%
|
Media -Diversified and Services
| 6%
| | Chemicals
| 2%
| | Restaurants
| 0%† |
Non Food and Drug Retailers
| 5%
| | Leisure and Entertainment
| 2%
| | Steel
| 0%† |
Automotive
| 4%
| | Media - Broadcasting
| 2%
| | Investment Management
| 0%† |
Gaming
| 4%
| | Metals and Mining
| 2%
| | | |
Media - Cable
| 4%
| | Aerospace/Defense
| 1%
| | † Rounds to 0%
| |
Par Value | | Value (Note 2) |
CORPORATE NOTES AND BONDS - 94.39%
| |
| | Aerospace/Defense - 1.55%
| |
$ 750,000
| Alliant Techsystems, Inc., 6.750%, due 04/01/16
| $ 736,875
|
500,000
| Moog, Inc., 7.250%, due 06/15/18
| 482,500
|
500,000
| TransDigm, Inc., 7.750%, due 07/15/14
| 502,500
|
| | | 1,721,875
|
| | Apparel/Textiles - 0.55%
| |
400,000
| Iconix Brand Group, Inc. (P), 1.875%,
due 06/30/12
| 346,000
|
250,000
| Levi Strauss & Co., 9.750%, due 01/15/15
| 261,250
|
| | | 607,250
|
| | Automotive - 4.03%
| |
250,000
| ArvinMeritor, Inc., 8.750%, due 03/01/12
| 245,000
|
250,000
| ArvinMeritor, Inc., 8.125%, due 09/15/15
| 218,125
|
250,000
| ArvinMeritor, Inc. (P), 4.625%, due 03/01/26
| 185,312
|
750,000
| Ford Motor Credit Co. LLC, 7.800%,
due 06/01/12
| 734,378
|
500,000
| Ford Motor Credit Co. LLC, 7.500%,
due 08/01/12
| 486,927
|
1,000,000
| Ford Motor Credit Co. LLC, 8.000%,
due 06/01/14
| 972,294
|
500,000
| Goodyear Tire & Rubber Co./The, 10.500%, due 05/15/16
| 541,250
|
500,000
| KAR Holdings, Inc., 8.750%, due 05/01/14
| 505,625
|
250,000
| Tenneco, Inc., 8.625%, due 11/15/14
| 235,625
|
350,000
| Tenneco, Inc., 8.125%, due 11/15/15
| 343,000
|
| | | 4,467,536
|
| | Beverage/Food - 1.06%
| |
150,000
| B&G Foods, Inc., 8.000%, due 10/01/11
| 152,250
|
400,000
| Constellation Brands, Inc., 7.250%,
due 05/15/17
| 401,000
|
Par Value | | Value (Note 2) |
$ 125,000
| Michael Foods, Inc., 8.000%, due 11/15/13
| $ 127,188
|
200,000
| NBTY, Inc., 7.125%, due 10/01/15
| 195,500
|
300,000
| Pinnacle Foods Finance LLC/Pinnacle Foods Finance Corp., 9.250%, due 04/01/15
| 303,000
|
| | | 1,178,938
|
| | Building Materials - 1.59%
| |
500,000
| Masco Corp., 6.125%, due 10/03/16
| 479,558
|
250,000
| Owens Corning, Inc., 9.000%, due 06/15/19
| 271,222
|
500,000
| USG Corp. (C), 9.750%, due 08/01/14
| 525,000
|
500,000
| USG Corp., 9.500%, due 01/15/18
| 491,250
|
| | | 1,767,030
|
| | Chemicals - 1.63%
| |
750,000
| Ashland, Inc. (C), 9.125%, due 06/01/17
| 810,000
|
600,000
| Huntsman International LLC. 7.875%,
due 11/15/14
| 564,000
|
500,000
| Huntsman International LLC (C), 5.500%,
due 06/30/16
| 432,500
|
| | | 1,806,500
|
| | Consumer Products - 2.80%
| |
250,000
| ACCO Brands Corp. (C), 10.625%,
due 03/15/15
| 271,875
|
500,000
| ACCO Brands Corp., 7.625%, due 08/15/15
| 452,500
|
500,000
| Brunswick Corp./DE (C), 11.250%,
due 11/01/16
| 540,000
|
135,000
| Da-Lite Screen Co., Inc., 9.500%, due 05/15/11
| 129,094
|
500,000
| Jarden Corp., 8.000%, due 05/01/16
| 515,000
|
250,000
| Jarden Corp., 7.500%, due 05/01/17
| 246,250
|
300,000
| Leslie’s Poolmart, 7.750%, due 02/01/13
| 300,000
|
400,000
| Sealy Mattress Co., 8.250%, due 06/15/14
| 388,000
|
250,000
| Visant Holding Corp., 8.750%, due 12/01/13
| 255,625
|
| | | 3,098,344
|
See accompanying Notes to Financial Statements.
High Income Fund Portfolio of Investments
Par Value | | Value (Note 2) |
CORPORATE NOTES AND BONDS (continued) | |
| | Environmental - 1.14%
| |
$ 350,000
| Casella Waste Systems, Inc., 9.750%,
due 02/01/13
| $ 334,250
|
200,000
| Covanta Holding Corp. (P), 1.000%,
due 02/01/27
| 180,750
|
500,000
| Waste Services, Inc., 9.500%, due 04/15/14
| 502,500
|
250,000
| WCA Waste Corp., 9.250%, due 06/15/14
| 247,500
|
| | | 1,265,000
|
| | Food & Drug Retailers - 3.26%
| |
850,000
| Ingles Markets, Inc., 8.875%, due 05/15/17
| 871,250
|
250,000
| Rite Aid Corp., 8.625%, due 03/01/15
| 205,000
|
350,000
| Rite Aid Corp., 7.500%, due 03/01/17
| 313,250
|
300,000
| Rite Aid Corp., 9.500%, due 06/15/17
| 244,500
|
450,000
| Stater Brothers Holdings, 8.125%,
due 06/15/12
| 452,250
|
250,000
| Stater Brothers Holdings, 7.750%,
due 04/15/15
| 246,875
|
750,000
| SUPERVALU, Inc.. 8.000%, due 05/01/16
| 763,125
|
500,000
| Tops Markets LLC (C), 10.125%, due 10/15/15
| 511,250
|
| | | 3,607,500
|
| | Forestry/Paper - 0.94%
| |
250,000
| Georgia-Pacific LLC (C). 7.125%, due 01/15/17
| 252,500
|
500,000
| Graphic Packaging International, Inc. (C), 9.500%, due 06/15/17
| 525,000
|
250,000
| Rock-Tenn Co. (C), 9.250%, due 03/15/16
| 267,500
|
| | | 1,045,000
|
| | Gaming - 3.76%
| |
500,000
| American Casino & Entertainment Properties LLC (C), 11.000%, due 06/15/14
| 440,000
|
500,000
| Ameristar Casinos, Inc. (C), 9.250%,
due 06/01/14
| 520,000
|
500,000
| Boyd Gaming Corp.. 6.750%, due 04/15/14
| 452,500
|
195,000
| Global Cash Access, Inc./Global Cash Finance Corp., 8.750%, due 03/15/12
| 194,025
|
750,000
| Isle of Capri Casinos, Inc., 7.000%,
due 03/01/14
| 669,375
|
500,000
| MGM Mirage, 8.375%, due 02/01/11
| 456,250
|
250,000
| MGM Mirage, 5.875%, due 02/27/14
| 182,500
|
150,000
| Penn National Gaming, Inc., 6.750%,
due 03/01/15
| 143,250
|
323,000
| Pinnacle Entertainment, Inc., 8.250%,
due 03/15/12
| 323,000
|
300,000
| Pinnacle Entertainment, Inc. (C), 8.625%,
due 08/01/17
| 298,875
|
500,000
| Scientific Games Corp. (C), 7.875%,
due 06/15/16
| 490,000
|
| | | 4,169,775
|
Par Value | | Value (Note 2) |
| | General Industrial &
Manufacturing - 2.88%
| |
$ 750,000
| Baldor Electric Co., 8.625%, due 02/15/17
| $ 772,500
|
750,000
| General Cable Corp. (P), 1.000%, due 10/15/12
| 703,125
|
750,000
| SPX Corp., 7.625%, due 12/15/14
| 772,500
|
500,000
| Terex Corp., 8.000%, due 11/15/17
| 461,250
|
650,000
| Trinity Industries, Inc. (P), 3.875%,
due 06/01/36
| 476,937
|
| | | 3,186,312
|
| | Health Care - 9.39%
| |
300,000
| Accellent, Inc., 10.500%, due 12/01/13
| 294,000
|
500,000
| Biomet, Inc., 10.000%, due 10/15/17
| 540,625
|
1,000,000
| Biomet, Inc., 11.625%, due 10/15/17
| 1,096,250
|
1,000,000
| DaVita, Inc., 7.250%, due 03/15/15
| 987,500
|
500,000
| DJO Finance LLC/DJO Finance Corp., 10.875%, due 11/15/14
| 521,250
|
750,000
| HCA, Inc./DE, 6.300%, due 10/01/12
| 735,000
|
500,000
| HCA, Inc./DE, 6.250%, due 02/15/13
| 483,750
|
500,000
| HCA, Inc./DE, 6.750%, due 07/15/13
| 486,250
|
250,000
| HCA, Inc./DE, 5.750%, due 03/15/14
| 232,500
|
350,000
| HCA, Inc./DE, 6.500%, due 02/15/16
| 326,375
|
200,000
| HCA, Inc./DE, 9.250%, due 11/15/16
| 209,000
|
500,000
| Hologic, Inc. (P), 2.000%, due 12/15/37
| 405,625
|
500,000
| Omega Healthcare Investors, Inc., REIT (N), 7.000%, due 04/01/14
| 488,750
|
500,000
| Omnicare, Inc., 6.875%, due 12/15/15
| 473,750
|
1,000,000
| Psychiatric Solutions, Inc., Series I, 7.750%, due 07/15/15
| 985,000
|
400,000
| Service Corp. International/US, 7.375%,
due 10/01/14
| 400,000
|
500,000
| Service Corp. International/US, 6.750%,
due 04/01/16
| 488,750
|
250,000
| Service Corp. International/US, 7.625%,
due 10/01/18
| 248,125
|
250,000
| Universal Hospital Services, Inc. (G), 4.635%, due 06/01/15
| 210,000
|
760,000
| Vanguard Health Holding Co. II LLC, 9.000%, due 10/01/14
| 790,400
|
| | | 10,402,900
|
| | Hotels - 0.62%
| |
750,000
| Wyndham Worldwide Corp., 6.000%,
due 12/01/16
| 682,771
|
| | Investment Management - 0.21%
| |
150,000
| Nuveen Investments, Inc., 5.000%,
due 09/15/10
| 146,250
|
100,000
| Nuveen Investments, Inc. (C), 10.500%,
due 11/15/15
| 88,500
|
| | | 234,750
|
See accompanying Notes to Financial Statements.
36
High Income Fund Portfolio of Investments
Par Value | | Value (Note 2) |
CORPORATE NOTES AND BONDS (continued) | |
| | Leisure & Entertainment - 1.60%
| |
$ 750,000
| Cinemark USA, Inc. (C), 8.625%, due 06/15/19
| $ 776,250
|
250,000
| Speedway Motorsports, Inc., 6.750%,
due 06/01/13
| 246,250
|
250,000
| Universal City Development Partners, Ltd. (C)(H), 8.875%, due 11/15/15
| 247,500
|
500,000
| Universal City Development Partners, Ltd. (C)(H), 10.875%, due 11/15/16
| 500,000
|
| | | 1,770,000
|
| | Media - Broadcasting - 1.61%
| |
500,000
| Allbritton Communications Co., 7.750%,
due 12/15/12
| 472,500
|
375,000
| Lamar Media Corp., 7.250%, due 01/01/13
| 368,438
|
500,000
| Lamar Media Corp., Series C, 6.625%,
due 08/15/15
| 472,500
|
500,000
| LIN Television Corp., 6.500%, due 05/15/13
| 468,750
|
| | | 1,782,188
|
| | Media - Cable - 4.28%
| |
1,250,000
| DISH DBS Corp., .625%, due 10/01/14
| 1,218,750
|
500,000
| Mediacom Broadband LLC/Mediacom Broadband Corp., 8.500%, due 10/15/15
| 505,000
|
500,000
| Mediacom LLC/Mediacom Capital Corp. (C), 9.125%, due 08/15/19
| 516,250
|
500,000
| Viasat, Inc. (C), 8.875%, due 09/15/16
| 507,500
|
750,000
| Videotron Ltee (D), 6.875%, due 01/15/14
| 750,000
|
700,000
| Virgin Media Finance PLC (D), 9.125%,
due 08/15/16
| 721,000
|
250,000
| Virgin Media Finance PLC, Series 1, 9.500%, due 08/15/16
| 264,375
|
250,000
| Virgin Media, Inc. (C)(P), 6.500%,
due 11/15/16
| 264,375
|
| | | 4,747,250
|
| | Media - Diversified & Services - 5.87%
| |
400,000
| Hughes Network Systems LLC/HNS Finance Corp., 9.500%, due 04/15/14
| 407,000
|
1,000,000
| Intelsat Bermuda, Ltd. (C)(D). 11.250%,
due 02/04/17
| 995,000
|
300,000
| Intelsat Jackson Holdings, Ltd. (D). 11.250%, due 06/15/16
| 319,500
|
350,000
| Intelsat, Ltd. (D), 7.625%, due 04/15/12
| 339,500
|
600,000
| Intelsat, Ltd. (D), 6.500%, due 11/01/13
| 552,000
|
500,000
| Interpublic Group of Cos., Inc., 10.000%,
due 07/15/17
| 537,500
|
250,000
| Interpublic Group of Cos., Inc. (P), 4.250%, due 03/15/23
| 240,938
|
500,000
| Liberty Media LLC (P), 3.125%, due 03/30/23
| 492,500
|
200,000
| Nielsen Finance LLC/Nielsen Finance Co., 11.625%, due 02/01/14
| 213,500
|
Par Value | | Value (Note 2) |
$1,000,000
| Nielsen Finance LLC/Nielsen Finance Co., 10.000%, due 08/01/14
| $1,030,000
|
500,000
| Nielsen Finance LLC/Nielsen Finance Co. (B), 0.000%, due 08/01/16
| 433,125
|
650,000
| Telesat Canada/Telesat LLC, 11.000%,
due 11/01/15
| 705,250
|
250,000
| WMG Acquisition Corp.. 7.375%,
due 04/15/14
| 237,500
|
| | | 6,503,313
|
| | Metals and Mining - 2.01%
| |
500,000
| Arch Coal, Inc. (C), 8.750%, due 08/01/16
| 512,500
|
450,000
| Arch Western Finance LLC, 6.750%,
due 07/01/13
| 434,250
|
500,000
| Massey Energy Co., 6.875%, due 12/15/13
| 493,750
|
250,000
| Massey Energy Co. (P), 3.250%, due 08/01/15
| 200,625
|
500,000
| Teck Resources, Ltd. (D), 10.750%,
due 05/15/19
| 582,500
|
| | | 2,223,625
|
| | Non Food & Drug Retailers - 5.51%
| |
250,000
| Burlington Coat Factory Warehouse Corp.. 11.125%, due 04/15/14
| 258,125
|
250,000
| Ltd. Brands, Inc., 6.900%, due 07/15/17
| 238,125
|
750,000
| Ltd. Brands, Inc. (C), 8.500%, due 06/15/19
| 787,500
|
1,500,000
| Michaels Stores, Inc., 11.375%, due 11/01/16
| 1,451,250
|
500,000
| Pantry, Inc./The, 7.750%, due 02/15/14
| 472,500
|
750,000
| QVC, Inc. (C), 7.500%, due 10/01/19
| 750,000
|
300,000
| Sally Holdings LLC/Sally Capital, Inc., 9.250%, due 11/15/14
| 312,000
|
200,000
| Sonic Automotive, Inc., Series B, 8.625%,
due 08/15/13
| 194,000
|
500,000
| Toys R US, Inc., 7.625%, due 08/01/11
| 500,000
|
500,000
| Toys R US, Inc., 7.875%, due 04/15/13
| 486,250
|
200,000
| Toys R US, Inc., 7.375%, due 10/15/18
| 178,000
|
500,000
| Yankee Acquisition Corp./MA, Series B, 8.500%, due 02/15/15
| 477,500
|
| | | 6,105,250
|
| | Oil & Gas - 7.14%
| |
500,000
| Cal Dive International, Inc. (P),
3.250%, due 12/15/25
| 433,125
|
616,000
| Chesapeake Energy Corp., 6.875%,
due 01/15/16
| 594,440
|
250,000
| Chesapeake Energy Corp., 6.500%,
due 08/15/17
| 234,375
|
150,000
| Cimarex Energy Co., 7.125%, due 05/01/17
| 144,750
|
400,000
| Complete Production Services, Inc., 8.000%, due 12/15/16
| 379,000
|
250,000
| Continental Resources, Inc./OK (C), 8.250%, due 10/01/19
| 256,875
|
See accompanying Notes to Financial Statements.
37
High Income Fund Portfolio of Investments
Par Value | | Value (Note 2) |
CORPORATE NOTES AND BONDS (continued) | |
| | Oil & Gas (continued) | |
$ 500,000
| Denbury Resources, Inc., 9.750%,
due 03/01/16
| $ 536,250
|
200,000
| Encore Acquisition Co., 6.000%, due 07/15/15
| 187,000
|
365,000
| EXCO Resources, Inc., 7.250%, due 01/15/11
| 363,175
|
350,000
| Helix Energy Solutions Group, Inc. (C),
9.500%, due 01/15/16
| 359,625
|
250,000
| Key Energy Services, Inc., 8.375%,
due 12/01/14
| 244,062
|
250,000
| Mariner Energy, Inc., 7.500%, due 04/15/13
| 243,750
|
250,000
| Mariner Energy, Inc., 8.000%, due 05/15/17
| 235,000
|
500,000
| Petroplus Finance, Ltd. (C)(D), 6.750%,
due 05/01/14
| 467,500
|
500,000
| Petroplus Finance, Ltd. (C)(D), 7.000%,
due 05/01/17
| 452,500
|
500,000
| Pioneer Natural Resources Co., 6.650%,
due 03/15/17
| 478,070
|
500,000
| Plains Exploration & Production Co., 10.000%, due 03/01/16
| 535,000
|
250,000
| Range Resources Corp., 6.375%, due 03/15/15
| 245,000
|
500,000
| Range Resources Corp., 7.250%, due 05/01/18
| 500,000
|
750,000
| Tesoro Corp./Texas, 9.750%, due 06/01/19
| 770,625
|
| | | 7,910,434
|
| | Packaging - 2.95%
| |
500,000
| Ball Corp. (N), 6.625%, due 03/15/18
| 491,250
|
1,000,000
| Crown Americas LLC/Crown Americas Capital Corp. II (C), 7.625%, due 05/15/17
| 1,025,000
|
500,000
| Graham Packaging Co., L.P./GPC Capital Corp. I, 9.875%, due 10/15/14
| 510,000
|
250,000
| Greif, Inc., 6.750%, due 02/01/17
| 245,000
|
1,000,000
| Reynolds Group DL Escrow, Inc./Reynolds Group Escrow LLC (C)(H), 7.750%,
due 10/15/16
| 995,000
|
| | | 3,266,250
|
| | Restaurants - 0.48%
| |
500,000
| Wendy’s/Arby’s Restaurants LLC (C),
10.000%, due 07/15/16
| 530,000
|
| | Steel - 0.32%
| |
350,000
| Steel Dynamics, Inc., 7.375%, due 11/01/12
| 351,312
|
| | Support Services - 8.17%
| |
250,000
| Affinion Group, Inc., 10.125%, due 10/15/13
| 256,250
|
750,000
| Affinion Group, Inc., 11.500%, due 10/15/15
| 783,750
|
1,000,000
| ARAMARK Corp., 8.500%, due 02/01/15
| 1,010,000
|
500,000
| Avis Budget Car Rental LLC/Avis Budget Finance, Inc., 7.625%, due 05/15/14
| 450,000
|
100,000
| Cardtronics, Inc., 9.250%, due 08/15/13
| 101,500
|
200,000
| Corrections Corp. of America, 6.250%,
due 03/15/13
| 199,000
|
Par Value | | Value (Note 2) |
$ 52,000
| Education Management LLC/Education Management Finance Corp., 10.250%,
due 06/01/16
| $ 56,680
|
500,000
| FTI Consulting, Inc., 7.750%, due 10/01/16
| 502,500
|
250,000
| Hertz Corp./The, 8.875%, due 01/01/14
| 253,125
|
250,000
| Hertz Corp./The, 10.500%, due 01/01/16
| 260,625
|
700,000
| Iron Mountain, Inc., 7.750%, due 01/15/15
| 708,750
|
350,000
| Mac-Gray Corp., 7.625%, due 08/15/15
| 345,625
|
500,000
| NASDAQ OMX Group, Inc./The (P), 2.500%, due 08/15/13
| 439,375
|
1,000,000
| RSC Equipment Rental, Inc., 9.500%,
due 12/01/14
| 987,500
|
750,000
| ServiceMaster Co./The, PIK (C), 10.750%,
due 07/15/15
| 746,250
|
450,000
| United Rentals North America, Inc.,
7.750%, due 11/15/13
| 411,750
|
250,000
| United Rentals North America, Inc. (C), 10.875%, due 06/15/16
| 271,250
|
750,000
| West Corp., 9.500%, due 10/15/14
| 750,000
|
500,000
| West Corp., 11.000%, due 10/15/16
| 512,500
|
| | | 9,046,430
|
| | Technology - 2.82%
| |
600,000
| Sanmina-SCI Corp., 8.125%, due 03/01/16
| 573,000
|
1,100,000
| Sungard Data Systems, Inc., 9.125%,
due 08/15/13
| 1,119,250
|
500,000
| Sungard Data Systems, Inc. (C), 10.625%,
due 05/15/15
| 538,750
|
400,000
| Sungard Data Systems, Inc., 10.250%,
due 08/15/15
| 412,500
|
500,000
| Syniverse Technologies, Inc., Series B,
7.750%, due 08/15/13
| 477,500
|
| | | 3,121,000
|
| | Telecommunications - 7.80%
| |
250,000
| Centennial Communications Corp.,
10.000%, due 01/01/13
| 263,437
|
650,000
| Cincinnati Bell, Inc., 8.375%, due 01/15/14
| 646,750
|
250,000
| Cincinnati Bell Telephone Co. LLC, 6.300%, due 12/01/28
| 190,000
|
700,000
| Frontier Communications Corp., 6.625%,
due 03/15/15
| 670,250
|
500,000
| GeoEye, Inc. (C), 9.625%, due 10/01/15
| 516,250
|
50,000
| Level 3 Communications, Inc. (P), 5.250%, due 12/15/11
| 45,375
|
450,000
| Level 3 Communications, Inc. (P), 3.500%, due 06/15/12
| 377,438
|
500,000
| Nordic Telephone Co. Holdings ApS (C)(D), 8.875%, due 05/01/16
| 520,000
|
385,000
| Qwest Communications International, Inc., 7.500%, due 02/15/14
| 377,300
|
See accompanying Notes to Financial Statements.
38
High Income Fund Portfolio of Investments
Par Value | | Value (Note 2) |
CORPORATE NOTES AND BONDS (continued) | |
| | Telecommunications (continued) | |
$ 350,000
| Qwest Communications International, Inc., Series B, 7.500%, due 02/15/14
| $ 343,000
|
250,000
| Qwest Communications International, Inc. (C), 8.000%, due 10/01/15
| 248,125
|
500,000
| SBA Communications Corp. (P), 1.875%,
due 05/01/13
| 471,250
|
1,000,000
| Sprint Nextel Corp., 8.375%, due 08/15/17
| 965,000
|
750,000
| Time Warner Telecom Holdings, Inc.,
9.250%, due 02/15/14
| 772,500
|
1,500,000
| Wind Acquisition Finance S.A. (C)(D), 11.750%, due 07/15/17
| 1,695,000
|
300,000
| Windstream Corp., 8.625%, due 08/01/16
| 308,250
|
250,000
| Windstream Corp., 7.000%, due 03/15/19
| 237,188
|
| | | 8,647,113
|
| | Transportation - 0.90%
| |
250,000
| Bristow Group, Inc., 7.500%, due 09/15/17
| 240,625
|
300,000
| Gulfmark Offshore, Inc., 7.750%,
due 07/15/14
| 292,500
|
500,000
| Hornbeck Offshore Services, Inc., Series B, 6.125%, due 12/01/14
| 462,500
|
| | | 995,625
|
| | Utilities - 7.52%
| |
500,000
| AES Corp./The, 8.000%, due 10/15/17
| 502,500
|
250,000
| AES Corp./The, 8.000%, due 06/01/20
| 250,000
|
400,000
| Calpine Corp. (C), 7.250%, due 10/15/17
| 377,000
|
750,000
| Edison Mission Energy, 7.200%, due 05/15/19
| 598,125
|
250,000
| El Paso Corp., 7.000%, due 06/15/17
| 250,090
|
1,000,000
| El Paso Corp., 7.250%, due 06/01/18
| 998,531
|
500,000
| Ferrellgas Partners L.P. (C), 9.125%,
due 10/01/17
| 522,500
|
400,000
| Ferrellgas Partners L.P./Ferrellgas Partners Finance Corp., 8.750%, due 06/15/12
| 400,000
|
1,000,000
| Inergy L.P./Inergy Finance Corp., 6.875%,
due 12/15/14
| 970,000
|
500,000
| MarkWest Energy Partners L.P./MarkWest Energy Finance Corp., Series B, 8.750%,
due 04/15/18
| 511,250
|
730,000
| Mirant Americas Generation LLC, 8.300%, due 05/01/11
| 742,775
|
750,000
| Mirant Americas Generation LLC, 8.500%, due 10/01/21
| 667,500
|
750,000
| NRG Energy, Inc., 7.375%, due 02/01/16
| 745,312
|
Par Value | | Value (Note 2) |
$ 250,000
| NRG Energy, Inc., 7.375%, due 01/15/17
| $ 247,500
|
250,000
| RRI Energy, Inc., 7.875%, due 06/15/17
| 245,000
|
300,000
| Williams Partners L.P./Williams Partners Finance Corp., 7.250%, due 02/01/17
| 298,422
|
| | | 8,326,505
|
| | Total Corporate Notes and Bonds
( Cost $98,369,561 )
| 104,567,776
|
CERTIFICATE OF DEPOSIT - 0.32%
| |
352,864
| State Street Eurodollar, 0.010%, due 11/02/09
| 352,864
|
| | Total Certificate of Deposit
( Cost $352,864 )
| 352,864
|
Shares | | |
INVESTMENT COMPANY - 4.49%
| |
4,977,999
| SSgA Prime Money Market Fund (N)
| 4,977,999
|
| | Total Investment Company
( Cost $4,977,999 )
| 4,977,999
|
TOTAL INVESTMENTS - 99.20%
( Cost $103,700,424** ) | 109,898,639
|
NET OTHER ASSETS AND LIABILITIES - 0.80%
| 890,599
|
TOTAL NET ASSETS - 100.00%
| $110,789,238
|
**
| Aggregate cost for Federal tax purposes was $103,757,454.
|
(B)
| Represents a security with a specified coupon until a predetermined date, at which time the stated rate is adjusted to a new contract rate.
|
(C)
| Security sold within terms of a private placement memorandum exempt from registration under section 144A of the Securities Act of 1933, as amended, and may be sold only to dealers in that program or other “qualified institutional investors.” The securities have been determined to be liquid under guidelines established by the Board of Trustees.
|
(D)
| Notes and bonds, issued by foreign entities, denominated in U.S. dollars. The aggregate of these securities is 6.67% of total net assets.
|
(G)
| Floating rate or variable rate note. Rate shown is as of October 31, 2009.
|
(H)
| Security purchased on a delayed delivery or when-issued basis. Rate shown is at issue date.
|
(N)
| Security segregated for forward or when-issued purchase commitments outstanding as of October 31, 2009
|
(P)
| Convertible.
|
PIK
| Payment in Kind.
|
PLC
| Public Limited Company.
|
REIT
| Real Estate Investment Trust.
|
See accompanying Notes to Financial Statements.
39
Diversified Income Fund Portfolio of Investments
Portfolio Allocation as a Percentage of Net Assets
as of October 31, 2009

|
Shares | | Value (Note 2) |
COMMON STOCKS - 42.63%
| |
| | Consumer Discretionary - 2.27%
| |
11,300
| Darden Restaurants, Inc.
| $ 342,503
|
8,300
| Genuine Parts Co.
| 290,417
|
16,700
| McDonald’s Corp.
| 978,787
|
5,900
| VF Corp.
| 419,136
|
| | | 2,030,843
|
| | Consumer Staples - 6.62%
| |
35,000
| Altria Group, Inc.
| 633,850
|
12,000
| Avon Products, Inc.
| 384,600
|
20,500
| Coca-Cola Co./The
| 1,092,855
|
10,200
| Kimberly-Clark Corp.
| 623,832
|
25,051
| Kraft Foods, Inc., Class A
| 689,403
|
10,000
| PepsiCo, Inc./NC
| 605,500
|
27,500
| Philip Morris International, Inc.
| 1,302,400
|
22,000
| Sysco Corp.
| 581,900
|
| | | 5,914,340
|
| | Energy - 4.00%
| |
25,800
| Chevron Corp.
| 1,974,732
|
19,300
| ConocoPhillips
| 968,474
|
12,500
| Marathon Oil Corp.
| 399,625
|
12,200
| Williams Cos., Inc./The
| 229,970
|
| | | 3,572,801
|
| | Financials - 5.07%
| |
8,000
| Aflac, Inc.
| 331,920
|
23,500
| Bank of New York Mellon Corp./The
| 626,510
|
14,500
| Morgan Stanley
| 465,740
|
13,800
| NYSE Euronext
| 356,730
|
8,500
| Travelers Cos., Inc./The
| 423,215
|
23,500
| US Bancorp
| 545,670
|
49,000
| Wells Fargo & Co.
| 1,348,480
|
15,900
| Willis Group Holdings, Ltd.
| 429,300
|
| | | 4,527,565
|
Shares | | Value (Note 2) |
| | Health Care - 6.12%
| |
29,200
| Johnson & Johnson
| $1,724,260
|
40,500
| Merck & Co., Inc./NJ
| 1,252,665
|
12,300
| Novartis AG, ADR
| 638,985
|
108,962
| Pfizer, Inc.
| 1,855,623
|
| | | 5,471,533
|
| | Industrials - 8.36%
| |
12,000
| 3M Co.
| 882,840
|
17,200
| Boeing Co./The
| 822,160
|
8,900
| Deere & Co.
| 405,395
|
26,000
| Emerson Electric Co.
| 981,500
|
25,700
| Honeywell International, Inc.
| 922,373
|
10,700
| Lockheed Martin Corp.
| 736,053
|
10,000
| Norfolk Southern Corp.
| 466,200
|
11,400
| Tyco International, Ltd.
| 382,470
|
6,800
| United Parcel Service, Inc., Class B
| 365,024
|
12,200
| United Technologies Corp.
| 749,690
|
25,300
| Waste Management, Inc.
| 755,964
|
| | | 7,469,669
|
| | Information Technology - 2.67%
| |
12,300
| Automatic Data Processing, Inc.
| 489,540
|
60,900
| Intel Corp.
| 1,163,799
|
18,000
| Maxim Integrated Products, Inc.
| 300,060
|
15,300
| Paychex, Inc.
| 434,673
|
| | | 2,388,072
|
| | Materials - 1.19%
| |
24,000
| EI Du Pont de Nemours & Co.
| 763,680
|
7,400
| Nucor Corp.
| 294,890
|
| | | 1,058,570
|
| | Telecommunication Services - 3.39%
| |
67,092
| AT&T, Inc.
| 1,722,252
|
6,000
| CenturyTel, Inc.
| 194,760
|
37,500
| Verizon Communications, Inc.
| 1,109,625
|
| | | 3,026,637
|
See accompanying Notes to Financial Statements.
40
Diversified Income Fund Portfolio of Investments
Shares | | Value (Note 2) |
COMMON STOCKS (continued) | |
| | Utilities - 2.94%
| |
8,200
| Consolidated Edison, Inc.
| $ 333,576
|
26,000
| Duke Energy Corp.
| 411,320
|
10,500
| Exelon Corp.
| 493,080
|
11,500
| FirstEnergy Corp.
| 497,720
|
8,500
| Progress Energy, Inc.
| 319,005
|
18,200
| Southern Co.
| 567,658
|
| | | 2,622,359
|
| | Total Common Stocks
( Cost $37,739,135 )
| 38,082,389
|
Par Value | | |
ASSET BACKED - 1.26%
| |
$ 98,971
| ABSC Long Beach Home Equity Loan Trust, Series 2000-LB1, Class AF5 (M), 8.550%,
due 09/21/30
| 92,306
|
525,000
| Carmax Auto Owner Trust, Series 2007-2,
Class B, 5.370%, due 03/15/13
| 529,843
|
465,000
| Chase Issuance Trust, Series 2007-A17, Class A, 5.120%, due 10/15/14
| 504,322
|
| | Total Asset Backed
( Cost $1,091,896 )
| 1,126,471
|
CORPORATE NOTES AND BONDS - 20.65%
| |
| | Consumer Discretionary - 1.79%
| |
750,000
| American Association of Retired Persons (C), 7.500%, due 05/01/31
| 814,664
|
130,000
| DR Horton, Inc., 5.250%, due 02/15/15
| 120,087
|
325,000
| Erac USA Finance Co. (C), 6.700%,
due 06/01/34
| 292,254
|
400,000
| Royal Caribbean Cruises, Ltd. (D),
7.250%, due 06/15/16
| 372,000
|
| | | 1,599,005
|
| | Consumer Staples - 0.89%
| |
475,000
| Kraft Foods, Inc., 6.500%, due 11/01/31
| 487,365
|
310,000
| WM Wrigley Jr. Co., 4.300%, due 07/15/10
| 313,100
|
| | | 800,465
|
| | Energy - 1.26%
| |
500,000
| Chesapeake Energy Corp., 6.375%,
due 06/15/15
| 476,250
|
150,000
| Hess Corp., 7.875%, due 10/01/29
| 176,769
|
400,000
| Transocean, Inc., 7.500%, due 04/15/31
| 469,683
|
| | | 1,122,702
|
| | Financials - 6.06%
| |
500,000
| American General Finance Corp., Series H, 4.625%, due 09/01/10
| 465,488
|
250,000
| Bear Stearns Cos. LLC/The, 7.250%,
due 02/01/18
| 285,954
|
Par Value | | Value (Note 2) |
$ 210,000
| General Electric Global Insurance Holding Corp., 7.000%, due 02/15/26
| $ 201,216
|
205,000
| General Electric Global Insurance Holding Corp., 7.750%, due 06/15/30
| 209,253
|
335,000
| HCP, Inc.. 6.700%, due 01/30/18
| 332,865
|
410,000
| Lehman Brothers Holdings, Inc. (E),
5.750%, due 01/03/17
| 41
|
315,000
| Merrill Lynch & Co., Inc., 6.150%, due 04/25/13
| 337,666
|
600,000
| National Rural Utilities Cooperative Finance Corp., Series C, 7.250%, due 03/01/12
| 666,692
|
600,000
| Nationwide Health Properties, Inc., Series D, 8.250%, due 07/01/12
| 640,658
|
760,000
| Nissan Motor Acceptance Corp. (C),
5.625%, due 03/14/11
| 779,434
|
140,000
| Simon Property Group L.P., 5.875%,
due 03/01/17
| 142,662
|
355,000
| SLM Corp., 5.125%, due 08/27/12
| 316,094
|
120,000
| Textron Financial Corp., 6.000%, due 11/20/09
| 120,003
|
500,000
| US Bank NA/Cincinnati, OH, 6.300%,
due 02/04/14
| 561,135
|
330,000
| Wells Fargo & Co., 5.250%, due 10/23/12
| 354,164
|
| | | 5,413,325
|
| | Health Care - 2.34%
| |
1,050,000
| Amgen, Inc., 5.850%, due 06/01/17
| 1,155,449
|
300,000
| Eli Lilly & Co., 6.570%, due 01/01/16
| 332,208
|
195,000
| Genentech, Inc., 5.250%, due 07/15/35
| 192,546
|
220,000
| Merck & Co., Inc./NJ, 5.750%, due 11/15/36
| 235,785
|
150,000
| Wyeth, 6.500%, due 02/01/34
| 173,486
|
| | | 2,089,474
|
| | Industrials - 1.27%
| |
150,000
| Boeing Co./The, 8.625%, due 11/15/31
| 199,804
|
175,000
| Burlington Northern Santa Fe Corp.,
8.125%, due 04/15/20
| 208,512
|
239,000
| Norfolk Southern Corp., 5.590%, due 05/17/25
| 240,836
|
260,000
| Norfolk Southern Corp., 7.050%, due 05/01/37
| 316,954
|
150,000
| Waste Management, Inc., 7.125%,
due 12/15/17
| 166,391
|
| | | 1,132,497
|
| | Information Technology - 0.29%
| |
240,000
| Cisco Systems, Inc., 5.500%, due 02/22/16
| 263,778
|
| | Materials - 0.20%
| |
175,000
| Westvaco Corp., 8.200%, due 01/15/30
| 175,236
|
| | Telecommunication Services - 1.16%
| |
415,000
| Comcast Cable Communications Holdings, Inc., 9.455%, due 11/15/22
| 529,679
|
315,000
| Rogers Communications, Inc. (D), 6.250%, due 06/15/13
| 343,717
|
190,000
| Sprint Nextel Corp., 6.000%, due 12/01/16
| 163,400
|
| | | 1,036,796
|
See accompanying Notes to Financial Statements.
41
Diversified Income Fund Portfolio of Investments
Par Value | | Value (Note 2) |
CORPORATE NOTES AND BONDS (continued) | |
| | Utilities - 5.39%
| |
$ 500,000
| Energy East Corp., 8.050%, due 11/15/10
| $ 530,958
|
175,000
| Interstate Power & Light Co., 6.250%,
due 07/15/39
| 193,093
|
1,000,000
| MidAmerican Energy Co., 5.650%,
due 07/15/12
| 1,086,814
|
400,000
| Nevada Power Co., Series R, 6.750%,
due 07/01/37
| 438,136
|
350,000
| Progress Energy, Inc., 7.750%, due 03/01/31
| 433,557
|
126,000
| Sierra Pacific Power Co., Series M,
6.000%, due 05/15/16
| 135,176
|
500,000
| Southwestern Electric Power Co., Series E, 5.550%, due 01/15/17
| 510,594
|
600,000
| Westar Energy, Inc., 6.000%, due 07/01/14
| 649,471
|
750,000
| Wisconsin Electric Power Co., 6.500%,
due 06/01/28
| 837,856
|
| | | 4,815,655
|
| | Total Corporate Notes and Bonds
( Cost $18,254,631 )
| 18,448,933
|
MORTGAGE BACKED - 17.87%
| |
| | Fannie Mae - 15.66%
| |
199,386
| 4.000%, due 04/01/15 Pool # 255719
| 204,966
|
261,333
| 5.500%, due 04/01/16 Pool # 745444
| 275,078
|
44,604
| 6.000%, due 05/01/16 Pool # 582558
| 48,186
|
463,765
| 5.000%, due 12/01/17 Pool # 672243
| 495,354
|
449,558
| 5.000%, due 05/01/20 Pool # 813965
| 477,651
|
659,350
| 4.500%, due 09/01/20 Pool # 835465
| 693,043
|
77,696
| 6.000%, due 05/01/21 Pool # 253847
| 84,029
|
17,809
| 7.000%, due 12/01/29 Pool # 762813
| 19,730
|
52,237
| 7.000%, due 11/01/31 Pool # 607515
| 57,823
|
49,476
| 7.000%, due 05/01/32 Pool # 644591
| 54,767
|
304,545
| 6.500%, due 06/01/32 Pool # 545691
| 330,008
|
470,415
| 5.500%, due 10/01/33 Pool # 254904
| 497,692
|
18,093
| 5.000%, due 05/01/34 Pool # 782214
| 18,816
|
410,405
| 5.000%, due 06/01/34 Pool # 255230
| 426,813
|
10,945
| 7.000%, due 07/01/34 Pool # 792636
| 12,017
|
143,775
| 5.500%, due 08/01/34 Pool # 793647
| 151,978
|
319,819
| 5.500%, due 03/01/35 Pool # 810075
| 337,814
|
805,756
| 5.500%, due 03/01/35 Pool # 815976
| 851,093
|
407,241
| 5.000%, due 08/01/35 Pool # 829670
| 423,267
|
331,547
| 5.000%, due 09/01/35 Pool # 820347
| 344,594
|
345,214
| 5.000%, due 09/01/35 Pool # 835699
| 358,800
|
636,981
| 5.000%, due 10/01/35 Pool # 797669
| 662,049
|
449,083
| 5.000%, due 11/01/35 Pool # 844504
| 466,756
|
466,640
| 5.000%, due 11/01/35 Pool # 844809
| 485,004
|
448,812
| 5.000%, due 12/01/35 Pool # 850561
| 466,474
|
Par Value | | Value (Note 2) |
$ 151,137
| 5.500%, due 02/01/36 Pool # 851330
| $ 159,641
|
590,377
| 5.500%, due 09/01/36 Pool # 831820
| 622,581
|
388,942
| 6.000%, due 09/01/36 Pool # 831741
| 414,366
|
147,480
| 5.500%, due 10/01/36 Pool # 896340
| 155,525
|
581,711
| 5.500%, due 10/01/36 Pool # 901723
| 613,442
|
568,849
| 6.000%, due 11/01/36 Pool # 902510
| 611,024
|
632,209
| 5.500%, due 12/01/36 Pool # 902853
| 666,695
|
618,571
| 5.500%, due 12/01/36 Pool # 903059
| 652,312
|
494,000
| 5.500%, due 12/01/36 Pool # 907512
| 520,946
|
669,737
| 5.500%, due 12/01/36 Pool # 907635
| 706,270
|
582,230
| 6.000%, due 12/01/36 Pool # 903002
| 620,288
|
| | | 13,986,892
|
| | Freddie Mac - 2.08%
| |
8,775
| 8.000%, due 06/01/30 Pool # C01005
| 9,984
|
159,658
| 6.500%, due 01/01/32 Pool # C62333
| 173,057
|
1,240,671
| 5.000%, due 07/01/33 Pool # A11325
| 1,291,046
|
95,737
| 6.000%, due 10/01/34 Pool # A28439
| 102,444
|
80,529
| 6.000%, due 10/01/34 Pool # A28598
| 86,170
|
107,560
| 5.000%, due 04/01/35 Pool # A32315
| 111,743
|
80,106
| 5.000%, due 04/01/35 Pool # A32316
| 83,221
|
| | | 1,857,665
|
| | Ginnie Mae - 0.13%
| |
10,650
| 8.000%, due 10/20/15 Pool # 002995
| 11,494
|
58,879
| 6.500%, due 02/20/29 Pool # 002714
| 63,804
|
39,529
| 6.500%, due 04/20/31 Pool # 003068
| 42,793
|
| | | 118,091
|
| | Total Mortgage Backed
( Cost $15,080,418 )
| 15,962,648
|
U.S. GOVERNMENT AND AGENCY OBLIGATIONS - 15.16%
|
| | Federal Farm Credit Bank - 1.28%
| |
1,000,000
| 5.875%, due 10/03/16
| 1,142,773
|
| | Fannie Mae - 0.60%
| |
500,000
| 5.250%, due 08/01/12
| 534,750
|
| | U.S. Treasury Bills - 0.91% (A)
| |
810,000
| 0.325%, due 12/17/09
| 809,664
|
| | U.S. Treasury Bonds - 1.25%
| |
860,000
| 6.625%, due 02/15/27
| 1,122,300
|
| | U.S. Treasury Notes - 11.12%
| |
30,000
| 4.500%, due 11/15/10
| 31,269
|
225,000
| 0.875%, due 02/28/11
| 226,028
|
320,000
| 4.875%, due 04/30/11
| 340,350
|
2,100,000
| 4.625%, due 12/31/11
| 2,262,586
|
375,000
| 1.375%, due 05/15/12
| 376,641
|
290,000
| 3.125%, due 08/31/13
| 303,865
|
1,150,000
| 4.000%, due 02/15/14
| 1,244,067
|
See accompanying Notes to Financial Statements.
42
Diversified Income Fund Portfolio of Investments
Par Value | | Value (Note 2) |
U.S. GOVERNMENT AND AGENCY
OBLIGATIONS (continued) | |
| | U.S. Treasury Notes (continued) | |
$1,575,000
| 4.250%, due 08/15/14
| $1,721,303
|
2,000,000
| 4.250%, due 11/15/14
| 2,183,750
|
60,000
| 4.250%, due 08/15/15
| 65,372
|
1,100,000
| 4.250%, due 11/15/17
| 1,182,243
|
| | | 9,937,474
|
| | Total U.S. Government and Agency Obligations ( Cost $13,058,350 )
| 13,546,961
|
Shares | | |
INVESTMENT COMPANY - 1.86%
| |
1,661,647
| SSgA Prime Money Market Fund
| 1,661,647
|
| | Total Investment Company
( Cost $1,661,647 )
| 1,661,647
|
TOTAL INVESTMENTS - 99.43% ( Cost $86,886,077** ) | 88,829,049
|
NET OTHER ASSETS AND LIABILITIES - 0.57%
| 506,819
|
TOTAL NET ASSETS - 100.00%
| $89,335,868
|
**
| Aggregate cost for Federal tax purposes was $87,063,586.
|
(A)
| Rate noted represents annualized yield at time of purchase.
|
(C)
| Security sold within terms of a private placement memorandum exempt from registration under section 144A of the Securities Act of 1933, as amended, and may be sold only to dealers in that program or other “qualified institutional investors.” The securities have been determined to be liquid under guidelines established by the Board of Trustees.
|
(D)
| Notes and bonds, issued by foreign entities, denominated in U.S. dollars. The aggregate of these securities is 0.80% of total net assets.
|
(E)
| In default. Issuer is bankrupt.
|
(M)
| Stated interest rate is contingent upon sufficient collateral market value. If collateral market value falls below a stated level, the issuer will either initiate a clean-up call or increase the stated interest rate.
|
ADR
| American Depositary Receipt.
|
See accompanying Notes to Financial Statements.
43
Large Cap Value Fund Portfolio of Investments
Sector Allocation as a Percentage of Net Assets
as of October 31, 2009

|
Shares | | Value (Note 2) |
COMMON STOCKS - 97.45%
| |
| | Consumer Discretionary - 7.42%
| |
22,000
| AutoZone, Inc. *
| $2,976,820
|
26,000
| ITT Educational Services, Inc. *
| 2,349,100
|
37,410
| Jarden Corp.
| 1,024,660
|
47,000
| Lowe’s Cos., Inc.
| 919,790
|
61,700
| Omnicom Group, Inc.
| 2,115,076
|
47,700
| Walt Disney Co./The
| 1,305,549
|
| | | 10,690,995
|
| | Consumer Staples - 5.13%
| |
25,000
| Diageo PLC, ADR
| 1,625,500
|
23,300
| PepsiCo, Inc./NC
| 1,410,815
|
26,000
| Procter & Gamble Co./The
| 1,508,000
|
57,300
| Wal-Mart Stores, Inc.
| 2,846,664
|
| | | 7,390,979
|
| | Energy - 20.92%
| |
94,566
| Chevron Corp.
| 7,238,082
|
95,700
| ConocoPhillips
| 4,802,226
|
54,000
| Devon Energy Corp.
| 3,494,340
|
94,900
| Noble Corp.
| 3,866,226
|
46,000
| Occidental Petroleum Corp.
| 3,490,480
|
125,500
| Weatherford International, Ltd. *
| 2,200,015
|
77,000
| Williams Cos., Inc./The
| 1,451,450
|
86,500
| XTO Energy, Inc.
| 3,594,940
|
| | | 30,137,759
|
| | Financials - 22.51%
| |
33,800
| Aflac, Inc.
| 1,402,362
|
33,500
| American Express Co.
| 1,167,140
|
21,100
| Arch Capital Group, Ltd. *
| 1,421,507
|
334,784
| Bank of America Corp.
| 4,881,151
|
96,300
| Bank of New York Mellon Corp./The
| 2,567,358
|
14,100
| Goldman Sachs Group, Inc./The
| 2,399,397
|
126,268
| JPMorgan Chase & Co.
| 5,274,214
|
235,000
| Keycorp
| 1,266,650
|
Shares | | Value (Note 2) |
49,300
| Morgan Stanley
| $1,583,516
|
19,846
| Simon Property Group, Inc., REIT
| 1,347,345
|
28,500
| State Street Corp.
| 1,196,430
|
69,700
| US Bancorp
| 1,618,434
|
123,300
| Wells Fargo & Co.
| 3,393,216
|
57,000
| Willis Group Holdings, Ltd.
| 1,539,000
|
55,000
| WR Berkley Corp.
| 1,359,600
|
| | | 32,417,320
|
| | Health Care - 11.80%
| |
30,000
| Baxter International, Inc.
| 1,621,800
|
18,800
| CR Bard, Inc.
| 1,411,316
|
60,100
| Johnson & Johnson
| 3,548,905
|
59,300
| Merck & Co., Inc./NJ
| 1,834,149
|
301,340
| Pfizer, Inc.
| 5,131,820
|
132,800
| UnitedHealth Group, Inc.
| 3,446,160
|
| | | 16,994,150
|
| | Industrials - 9.55%
| |
51,700
| Deere & Co.
| 2,354,935
|
138,600
| General Electric Co.
| 1,976,436
|
40,000
| Lockheed Martin Corp.
| 2,751,600
|
50,000
| Norfolk Southern Corp.
| 2,331,000
|
34,600
| United Technologies Corp.
| 2,126,170
|
74,300
| Waste Management, Inc.
| 2,220,084
|
| | | 13,760,225
|
| | Information Technology - 6.95%
| |
107,047
| EMC Corp./Massachusetts *
| 1,763,064
|
112,300
| Intel Corp.
| 2,146,053
|
27,000
| International Business Machines Corp.
| 3,256,470
|
84,900
| Maxim Integrated Products, Inc.
| 1,415,283
|
67,900
| Oracle Corp.
| 1,432,690
|
| | | 10,013,560
|
| | Materials - 3.38%
| |
47,600
| EI Du Pont de Nemours & Co.
| 1,514,632
|
27,823
| Freeport-McMoRan Copper & Gold, Inc. *
| 2,041,095
|
See accompanying Notes to Financial Statements.
44
Large Cap Value Fund Portfolio of Investments
Shares | | Value (Note 2) |
COMMON STOCKS (continued) | |
| | Materials (continued) | |
32,900
| Nucor Corp.
| $1,311,065
|
| | | 4,866,792
|
| | Telecommunication Services - 5.03%
| |
181,032
| AT&T, Inc.
| 4,647,091
|
87,620
| Verizon Communications, Inc.
| 2,592,676
|
| | | 7,239,767
|
| | Utilities - 4.76%
| |
90,000
| Edison International
| 2,863,800
|
59,000
| Exelon Corp.
| 2,770,640
|
30,658
| Questar Corp.
| 1,221,415
|
| | | 6,855,855
|
| | Total Common Stocks
( Cost $144,344,169 )
| 140,367,402
|
INVESTMENT COMPANY - 3.73%
| |
5,373,225
| SSgA Prime Money Market Fund
| 5,373,225
|
| | Total Investment Company
( Cost $5,373,225 )
| 5,373,225
|
TOTAL INVESTMENTS - 101.18% ( Cost $149,717,394** ) | 145,740,627
|
NET OTHER ASSETS AND LIABILITIES - (1.18)%
| (1,694,687)
|
TOTAL NET ASSETS - 100.00%
| $144,045,940
|
*
| Non-income producing.
|
**
| Aggregate cost for Federal tax purposes was $150,149,937.
|
ADR
| American Depositary Receipt.
|
PLC
| Public Limited Company.
|
REIT
| Real Estate Investment Trust.
|
See accompanying Notes to Financial Statements.
45
Large Cap Growth Fund Portfolio of Investments
Sector Allocation as a Percentage of Net Assets
as of October 31, 2009
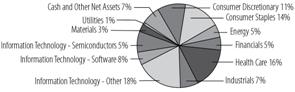
|
Shares | | Value (Note 2) |
COMMON STOCKS - 93.09%
| |
| | Consumer Discretionary - 10.85%
| |
9,300
| Amazon.com, Inc. *
| $1,104,933
|
7,900
| AutoZone, Inc. *
| 1,068,949
|
27,000
| ITT Educational Services, Inc. *
| 2,439,450
|
9,100
| Kohl’s Corp. *
| 520,702
|
12,800
| Mastercard, Inc., Class A
| 2,803,456
|
29,100
| McDonald’s Corp.
| 1,705,551
|
12,200
| TJX Cos., Inc.
| 455,670
|
73,000
| Visa, Inc., Class A
| 5,530,480
|
57,500
| Yum! Brands, Inc.
| 1,894,625
|
| | | 17,523,816
|
| | Consumer Staples - 13.98%
| |
20,200
| Colgate-Palmolive Co.
| 1,588,326
|
31,900
| Diageo PLC, ADR
| 2,074,138
|
62,625
| Kellogg Co.
| 3,227,692
|
33,000
| Lorillard, Inc.
| 2,564,760
|
75,000
| PepsiCo, Inc./NC
| 4,541,250
|
62,700
| Walgreen Co.
| 2,371,941
|
124,800
| Wal-Mart Stores, Inc.
| 6,200,064
|
| | | 22,568,171
|
| | Energy - 5.50%
| |
20,000
| Cameron International Corp. *
| 739,400
|
6,200
| Diamond Offshore Drilling, Inc.
| 590,550
|
108,500
| PetroHawk Energy Corp. *
| 2,551,920
|
17,500
| Range Resources Corp.
| 875,875
|
43,100
| Southwestern Energy Co. *
| 1,878,298
|
127,600
| Weatherford International, Ltd. *
| 2,236,828
|
| | | 8,872,871
|
| | Financials - 5.17%
| |
13,600
| Aflac, Inc.
| 564,264
|
174,712
| Axis Capital Holdings, Ltd.
| 5,047,430
|
19,700
| IntercontinentalExchange, Inc. *
| 1,973,743
|
18,000
| State Street Corp.
| 755,640
|
| | | 8,341,077
|
Shares | | Value (Note 2) |
| | Health Care - 16.17%
| |
9,800
| Allergan, Inc./United States
| $ 551,250
|
13,300
| Celgene Corp. *
| 678,965
|
57,100
| Gilead Sciences, Inc. *
| 2,429,605
|
52,600
| HMS Holdings Corp. *
| 2,258,118
|
2,600
| Intuitive Surgical, Inc. *
| 640,510
|
121,405
| Johnson & Johnson
| 7,168,965
|
30,200
| Medco Health Solutions, Inc. *
| 1,694,824
|
67,700
| Roche Holding AG, ADR
| 2,701,230
|
73,300
| St. Jude Medical, Inc. *
| 2,498,064
|
211,465
| UnitedHealth Group, Inc.
| 5,487,517
|
| | | 26,109,048
|
| | Industrials - 6.80%
| |
86,900
| ABB, Ltd., ADR *
| 1,610,257
|
48,000
| Boeing Co./The
| 2,294,400
|
12,500
| Deere & Co.
| 569,375
|
65,500
| Honeywell International, Inc.
| 2,350,795
|
48,100
| ITT Corp.
| 2,438,670
|
38,000
| Raytheon Co.
| 1,720,640
|
| | | 10,984,137
|
| | Information Technology -Other - 18.14%
| |
29,100
| Apple, Inc. *
| 5,485,350
|
208,000
| Cisco Systems, Inc. *
| 4,752,800
|
52,300
| Corning, Inc.
| 764,103
|
105,700
| EMC Corp./Massachusetts *
| 1,740,879
|
12,908
| Google, Inc., Class A *
| 6,920,237
|
53,500
| International Business Machines Corp.
| 6,452,635
|
27,900
| Paychex, Inc.
| 792,639
|
57,400
| QUALCOMM, Inc.
| 2,376,934
|
| | | 29,285,577
|
| | Information Technology -
Semiconductors - 4.85%
| |
10,000
| Altera Corp.
| 197,900
|
226,500
| Intel Corp.
| 4,328,415
|
38,600
| Novellus Systems, Inc. *
| 794,388
|
See accompanying Notes to Financial Statements.
46
Large Cap Growth Fund Portfolio of Investments
Shares | | Value (Note 2) |
COMMON STOCKS (continued) | |
| | Information Technology - Semiconductors (continued) | |
55,500
| Texas Instruments, Inc.
| $1,301,475
|
42,600
| Varian Semiconductor Equipment
Associates, Inc. *
| 1,209,414
|
| | | 7,831,592
|
| | Information Technology -
Software - 7.71%
| |
14,600
| BMC Software, Inc. *
| 542,536
|
20,600
| Citrix Systems, Inc. *
| 757,256
|
273,300
| Microsoft Corp.
| 7,578,609
|
122,500
| Oracle Corp.
| 2,584,750
|
17,300
| Salesforce.com, Inc. *
| 981,775
|
| | | 12,444,926
|
| | Materials - 2.87%
| |
22,100
| Agnico-Eagle Mines, Ltd.
| 1,183,013
|
55,300
| Ecolab, Inc.
| 2,430,988
|
25,793
| Nucor Corp.
| 1,027,851
|
| | | 4,641,852
|
| | Utilities - 1.05%
| |
34,600
| FPL Group, Inc.
| 1,698,860
|
| | Total Common Stocks
( Cost $137,041,339 )
| 150,301,927
|
| | | |
Par Value | | |
CERTIFICATE OF DEPOSIT - 2.97%
| |
$4,787,164
| State Street Eurodollar, 0.010%, due 11/02/09
| 4,787,164
|
| | Total Certificate of Deposit
( Cost $4,787,164 )
| 4,787,164
|
Shares | | |
INVESTMENT COMPANIES - 6.13%
| |
54,300
| iShares Russell 1000, Growth Index Fund ETF
| 2,482,596
|
7,418,030
| SSgA Prime Money Market Fund
| 7,418,030
|
| | Total Investment Companies
( Cost $9,483,172 )
| 9,900,626
|
TOTAL INVESTMENTS - 102.19% ( Cost $151,311,675** ) | 164,989,717
|
NET OTHER ASSETS AND LIABILITIES - (2.19)%
| (3,536,807)
|
TOTAL NET ASSETS - 100.00%
| $161,452,910
|
*
| Non-income producing.
|
**
| Aggregate cost for Federal tax purposes was $154,026,114.
|
ADR
| American Depositary Receipt.
|
ETF
| Exchange Traded Fund.
|
PLC
| Public Limited Company.
|
See accompanying Notes to Financial Statements.
47
Mid Cap Value Fund Portfolio of Investments
Sector Allocation as a Percentage of Net Assets
as of October 31, 2009
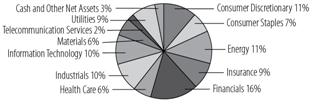
|
Shares | | Value (Note 2) |
COMMON STOCKS - 96.88%
| |
| | Consumer Discretionary - 11.22%
| |
4,500
| AutoZone, Inc. *
| $ 608,895
|
10,695
| Choice Hotels International, Inc.
| 318,925
|
5,029
| ITT Educational Services, Inc. *
| 454,370
|
20,800
| Jack in the Box, Inc. *
| 390,208
|
10,685
| Jarden Corp.
| 292,662
|
8,000
| Omnicom Group, Inc.
| 274,240
|
26,470
| Pulte Homes, Inc.
| 238,495
|
13,885
| TJX Cos., Inc.
| 518,605
|
3,700
| VF Corp.
| 262,848
|
| | | 3,359,248
|
| | Consumer Staples - 6.78%
| |
6,100
| Bunge, Ltd.
| 348,066
|
15,671
| ConAgra Foods, Inc.
| 329,091
|
8,900
| Kellogg Co.
| 458,706
|
6,500
| Molson Coors Brewing Co., Class B
| 318,305
|
11,586
| Wal-Mart Stores, Inc.
| 575,593
|
| | | 2,029,761
|
| | Energy - 10.77%
| |
51,349
| El Paso Corp.
| 503,734
|
25,270
| Forest Oil Corp. *
| 495,292
|
17,485
| Noble Corp.
| 712,339
|
10,670
| Noble Energy, Inc.
| 700,272
|
20,370
| PetroHawk Energy Corp. *
| 479,102
|
23,771
| Tesoro Corp.
| 336,122
|
| | | 3,226,861
|
| | Financials - 16.28%
| |
5,985
| Ameriprise Financial, Inc.
| 207,500
|
30,170
| Annaly Capital Management, Inc., REIT
| 510,175
|
14,445
| Associated Banc-Corp.
| 185,040
|
6,683
| AvalonBay Communities, Inc., REIT
| 459,657
|
2,585
| BlackRock, Inc.
| 559,627
|
36,756
| Fifth Third Bancorp
| 328,599
|
59,400
| Host Hotels & Resorts, Inc., REIT
| 600,534
|
Shares | | Value (Note 2) |
12,485
| JPMorgan Chase & Co.
| $ 521,499
|
48,841
| Keycorp
| 263,253
|
11,785
| State Street Corp.
| 494,734
|
15,785
| SunTrust Banks, Inc.
| 301,651
|
7,465
| Vornado Realty Trust, REIT
| 444,615
|
| | | 4,876,884
|
| | Health Care - 5.55%
| |
14,586
| CIGNA Corp.
| 406,074
|
5,700
| CR Bard, Inc.
| 427,899
|
4,800
| Laboratory Corp. of America Holdings *
| 330,672
|
10,539
| Life Technologies Corp. *
| 497,125
|
| | | 1,661,770
|
| | Industrials - 10.17%
| |
5,786
| Danaher Corp.
| 394,779
|
7,485
| ITT Corp.
| 379,489
|
5,900
| L-3 Communications Holdings, Inc.
| 426,511
|
8,500
| Norfolk Southern Corp.
| 396,270
|
18,585
| Quanta Services, Inc. *
| 394,002
|
7,600
| Raytheon Co.
| 344,128
|
11,251
| Republic Services, Inc.
| 291,513
|
12,485
| Tyco International, Ltd.
| 418,872
|
| | | 3,045,564
|
| | Information Technology - 9.62%
| |
5,987
| Affiliated Computer Services, Inc., Class A *
| 311,863
|
14,185
| Arrow Electronics, Inc. *
| 359,448
|
65,841
| Brocade Communications Systems, Inc. *
| 564,916
|
10,885
| KLA-Tencor Corp.
| 353,871
|
29,500
| Maxim Integrated Products, Inc.
| 491,765
|
58,156
| Micron Technology, Inc. *
| 394,879
|
18,386
| Synopsys, Inc. *
| 404,492
|
| | | 2,881,234
|
| | Insurance - 8.80%
| |
11,785
| AON Corp.
| 453,840
|
11,600
| Arch Capital Group, Ltd. *
| 781,492
|
13,785
| Assurant, Inc.
| 412,585
|
See accompanying Notes to Financial Statements.
48
Mid Cap Value Fund Portfolio of Investments
Shares | | Value (Note 2) |
COMMON STOCKS (continued) | |
| | Insurance (continued) | |
12,685
| Axis Capital Holdings, Ltd.
| $ 366,470
|
31,161
| Unum Group
| 621,662
|
| | | 2,636,049
|
| | Materials - 6.51%
| |
10,900
| Ecolab, Inc.
| $ 479,164
|
8,773
| FMC Corp.
| 448,300
|
2,635
| Freeport-McMoRan Copper & Gold, Inc. *
| 193,303
|
6,100
| Nucor Corp.
| 243,085
|
15,585
| Pactiv Corp. *
| 359,858
|
6,185
| Weyerhaeuser Co.
| 224,763
|
| | | 1,948,473
|
| | Telecommunication Services - 2.36%
| |
8,509
| CenturyTel, Inc.
| 276,202
|
14,286
| Crown Castle International Corp. *
| 431,723
|
| | | 707,925
|
| | Utilities - 8.82%
| |
14,785
| Edison International
| 470,458
|
12,600
| NRG Energy, Inc. *
| 289,674
|
7,985
| Oneok, Inc.
| 289,137
|
12,685
| Progress Energy, Inc.
| 476,068
|
13,286
| Sempra Energy
| 683,565
|
22,971
| Xcel Energy, Inc.
| 433,233
|
| | | 2,642,135
|
| | Total Common Stocks
( Cost $28,414,912 )
| 29,015,904
|
INVESTMENT COMPANY - 2.82%
| |
845,247
| SSgA Prime Money Market Fund
| 845,247
|
| | Total Investment Company
( Cost $845,247 )
| 845,247
|
TOTAL INVESTMENTS - 99.70%
( Cost $29,260,159** ) | 29,861,151
|
NET OTHER ASSETS AND LIABILITIES - 0.30%
| 90,640
|
TOTAL NET ASSETS - 100.00%
| $29,951,791
|
*
| Non-income producing.
|
**
| Aggregate cost for Federal tax purposes was $30,192,619.
|
REIT
| Real Estate Investment Trust
|
See accompanying Notes to Financial Statements.
49
Mid Cap Growth Fund Portfolio of Investments
Sector Allocation as a Percentage of Net Assets
as of October 31, 2009
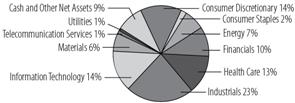
|
Shares | | Value (Note 2) |
COMMON STOCKS - 91.21%
| |
| | Consumer Discretionary - 14.54%
| |
5,490
| AutoZone, Inc. *
| $ 742,852
|
19,312
| Bed Bath & Beyond, Inc. *
| 679,976
|
25,729
| Carmax, Inc. *
| 506,090
|
32,120
| Interactive Data Corp.
| 844,756
|
5,900
| ITT Educational Services, Inc. *
| 533,065
|
44,700
| Jack in the Box, Inc. *
| 838,572
|
12,458
| Morningstar, Inc. *
| 635,607
|
7,736
| Sears Holdings Corp. *
| 524,965
|
13,546
| Tiffany & Co.
| 532,222
|
20,292
| Yum! Brands, Inc.
| 668,621
|
| | | 6,506,726
|
| | Consumer Staples - 1.81%
| |
16,547
| Brown-Forman Corp., Class B
| 807,659
|
| | Energy - 7.01%
| |
9,400
| EOG Resources, Inc.
| 767,604
|
22,695
| Noble Corp.
| 924,594
|
12,491
| Range Resources Corp.
| 625,174
|
18,865
| Southwestern Energy Co. *
| 822,137
|
| | | 3,139,509
|
| | Financials - 10.39%
| |
16,187
| Aflac, Inc.
| 671,599
|
42,655
| Brookfield Asset Management, Inc., Class A
| 891,490
|
36,304
| Leucadia National Corp. *
| 815,751
|
2,375
| Markel Corp. *
| 766,412
|
15,542
| RLI Corp.
| 777,100
|
41,590
| SEI Investments Co.
| 726,577
|
| | | 4,648,929
|
| | Health Care - 12.79%
| |
11,772
| Covance, Inc. *
| 608,377
|
10,200
| CR Bard, Inc.
| 765,714
|
16,943
| DENTSPLY International, Inc.
| 558,441
|
12,884
| Idexx Laboratories, Inc. *
| 658,630
|
Shares | | Value (Note 2) |
11,261
| Laboratory Corp. of America Holdings *
| $ 775,770
|
16,900
| St. Jude Medical, Inc. *
| 575,952
|
10,479
| Techne Corp.
| 655,042
|
13,859
| Varian Medical Systems, Inc. *
| 567,942
|
10,652
| Zimmer Holdings, Inc. *
| 559,976
|
| | | 5,725,844
|
| | Industrials - 23.14%
| |
22,655
| Aecom Technology Corp. *
| 571,812
|
21,579
| Copart, Inc. *
| 694,196
|
44,587
| Covanta Holding Corp. *
| 766,005
|
21,945
| Expeditors International of Washington, Inc.
| 707,068
|
18,637
| Fastenal Co.
| 642,977
|
7,364
| Flowserve Corp.
| 723,218
|
20,963
| IDEX Corp.
| 595,978
|
16,200
| Jacobs Engineering Group, Inc. *
| 685,098
|
23,031
| Kaydon Corp.
| 805,855
|
23,715
| Kirby Corp. *
| 801,567
|
34,205
| Knight Transportation, Inc.
| 548,648
|
14,915
| Middleby Corp. *
| 675,799
|
34,022
| Ritchie Bros Auctioneers, Inc.
| 745,762
|
20,644
| Wabtec Corp./DE
| 758,874
|
21,231
| Waste Management, Inc.
| 634,382
|
| | | 10,357,239
|
| | Information Technology - 13.65%
| |
18,135
| Amphenol Corp., Class A
| 727,576
|
12,300
| BMC Software, Inc. *
| 457,068
|
76,600
| Brocade Communications Systems, Inc. *
| 657,228
|
14,162
| Concur Technologies, Inc. *
| 504,733
|
11,923
| Factset Research Systems, Inc.
| 763,668
|
20,196
| FLIR Systems, Inc. *
| 561,651
|
12,100
| Mantech International Corp., Class A *
| 530,706
|
40,700
| Maxim Integrated Products, Inc.
| 678,469
|
36,805
| Novellus Systems, Inc. *
| 757,447
|
16,934
| Teradata Corp. *
| 472,120
|
| | | 6,110,666
|
See accompanying Notes to Financial Statements.
50
Mid Cap Growth Fund Portfolio of Investments
Shares | | Value (Note 2) |
COMMON STOCKS (continued) | |
| | Materials - 5.83%
| |
17,900
| Cliffs Natural Resources, Inc.
| $ 636,703
|
15,390
| Ecolab, Inc.
| 676,545
|
8,551
| Martin Marietta Materials, Inc.
| 712,469
|
23,052
| Valspar Corp.
| 584,829
|
| | | 2,610,546
|
| | Telecommunication Services - 0.77%
| |
5,504
| Millicom International Cellular S.A. *
| 344,881
|
| | Utilities - 1.28%
| |
13,672
| EQT Corp.
| 572,310
|
| | Total Common Stocks
( Cost $35,970,043 )
| 40,824,309
|
INVESTMENT COMPANIES - 5.65%
| |
8,201
| iShares COMEX Gold Trust ETF *
| 841,997
|
1,687,907
| SSgA Prime Money Market Fund
| 1,687,907
|
| | Total Investment Companies
( Cost $2,444,088 )
| 2,529,904
|
TOTAL INVESTMENTS - 96.86%
( Cost $38,414,131** ) | 43,354,213
|
NET OTHER ASSETS AND LIABILITIES - 3.14%
| 1,403,630
|
TOTAL NET ASSETS - 100.00%
| $44,757,843
|
*
| Non-income producing.
|
**
| Aggregate cost for Federal tax purposes was $38,636,437.
|
ETF
| Exchange Traded Fund.
|
See accompanying Notes to Financial Statements.
51
Small Cap Value Fund Portfolio of Investments
Sector Allocation as a Percentage of Net Assets
as of October 31, 2009

|
Shares | | Value (Note 2) |
COMMON STOCKS - 97.08%
| |
| | Consumer Discretionary - 17.22%
| |
18,700
| Arbitron, Inc.
| $ 405,416
|
3,200
| Bally Technologies, Inc. *
| 126,048
|
25,400
| Cato Corp./The, Class A
| 500,634
|
8,800
| CEC Entertainment, Inc. *
| 257,048
|
9,800
| Choice Hotels International, Inc.
| 292,236
|
11,000
| Dress Barn, Inc. *
| 198,550
|
19,200
| Helen of Troy, Ltd. *
| 438,528
|
9,400
| Hibbett Sports, Inc. *
| 176,156
|
7,600
| Matthews International Corp., Class A
| 279,148
|
23,300
| Sonic Corp. *
| 217,855
|
39,300
| Stage Stores, Inc.
| 463,740
|
8,100
| Tempur-Pedic International, Inc. *
| 156,897
|
5,700
| Unifirst Corp./MA
| 239,799
|
| | | 3,752,055
|
| | Consumer Staples - 5.09%
| |
9,500
| Casey’s General Stores, Inc.
| 299,535
|
13,600
| Herbalife, Ltd.
| 457,640
|
14,600
| Lance, Inc.
| 352,152
|
| | | 1,109,327
|
| | Energy - 4.75%
| |
14,300
| Penn Virginia Corp.
| 289,575
|
2,600
| SEACOR Holdings, Inc. *
| 211,302
|
6,400
| St. Mary Land & Exploration Co.
| 218,240
|
5,600
| Whiting Petroleum Corp. *
| 315,840
|
| | | 1,034,957
|
| | Financials - 21.80%
| |
9,497
| Acadia Realty Trust, REIT
| 151,002
|
700
| Alleghany Corp. *
| 175,000
|
8,100
| American Campus Communities, Inc., REIT
| 218,862
|
33,500
| Ares Capital Corp.
| 349,740
|
10,700
| Assured Guaranty, Ltd.
| 177,406
|
4,800
| Credit Acceptance Corp. *
| 164,976
|
Shares | | Value (Note 2) |
20,500
| Delphi Financial Group, Inc., Class A
| $ 444,850
|
20,900
| DiamondRock Hospitality Co., REIT *
| 159,049
|
7,100
| Financial Federal Corp.
| 144,982
|
20,390
| First Busey Corp.
| 78,909
|
26,200
| First Midwest Bancorp, Inc./IL
| 272,480
|
16,920
| International Bancshares Corp.
| 251,262
|
5,400
| Mack-Cali Realty Corp., REIT
| 167,130
|
15,700
| MB Financial, Inc.
| 280,716
|
14,500
| NewAlliance Bancshares, Inc.
| 160,660
|
11,300
| Platinum Underwriters Holdings, Ltd.
| 404,201
|
14,200
| Realty Income Corp., REIT
| 329,156
|
4,900
| Reinsurance Group of America, Inc.
| 225,890
|
7,489
| Validus Holdings, Ltd.
| 189,472
|
21,000
| Webster Financial Corp.
| 237,510
|
3,500
| Westamerica Bancorporation
| 167,300
|
| | | 4,750,553
|
| | Health Care - 7.84%
| |
12,000
| Amsurg Corp. *
| 252,840
|
12,400
| Centene Corp. *
| 221,092
|
10,200
| Charles River Laboratories
| |
| | International, Inc. *
| 372,504
|
6,100
| Corvel Corp. *
| 173,850
|
9,900
| ICON PLC, ADR *
| 244,530
|
6,400
| ICU Medical, Inc. *
| 224,000
|
22,000
| Universal American Corp./NY *
| 220,000
|
| | | 1,708,816
|
| | Industrials - 20.44%
| |
38,600
| ACCO Brands Corp. *
| 233,916
|
7,000
| Acuity Brands, Inc.
| 221,620
|
22,100
| Albany International Corp., Class A
| 368,186
|
26,900
| Belden, Inc.
| 617,355
|
24,227
| Bowne & Co., Inc.
| 158,202
|
23,500
| Carlisle Cos., Inc.
| 729,440
|
3,400
| ESCO Technologies, Inc. *
| 133,552
|
14,100
| GATX Corp.
| 383,238
|
See accompanying Notes to Financial Statements.
52
Small Cap Value Fund Portfolio of Investments
Shares | | Value (Note 2) |
COMMON STOCKS (continued) | |
| | Industrials (continued) | |
11,400
| Genesee & Wyoming, Inc., Class A *
| $ 330,714
|
7,200
| Kirby Corp. *
| 243,360
|
15,400
| Mueller Industries, Inc.
| 364,364
|
7,100
| Sterling Construction Co., Inc. *
| 114,523
|
10,400
| United Stationers, Inc. *
| 490,256
|
7,500
| Vitran Corp., Inc. *
| 64,200
|
| | | 4,452,926
|
| | Information Technology - 9.61%
| |
4,400
| Coherent, Inc. *
| 110,572
|
13,000
| Diebold, Inc.
| 393,120
|
19,800
| Electronics for Imaging, Inc. *
| 230,868
|
9,600
| MAXIMUS, Inc.
| 444,096
|
3,700
| MTS Systems Corp.
| 98,050
|
24,100
| NAM TAI Electronics, Inc.
| 133,755
|
18,100
| Websense, Inc. *
| 290,686
|
13,400
| Xyratex, Ltd. *
| 140,030
|
10,100
| Zebra Technologies Corp., Class A *
| 252,500
|
| | | 2,093,677
|
| | Materials - 4.77%
| |
8,300
| Aptargroup, Inc.
| 293,073
|
6,400
| Deltic Timber Corp.
| 272,000
|
27,800
| Zep, Inc.
| 475,380
|
| | | 1,040,453
|
| | Utilities - 5.56%
| |
9,600
| Atmos Energy Corp.
| 267,360
|
4,550
| New Jersey Resources Corp.
| 160,160
|
11,200
| Unisource Energy Corp.
| 323,456
|
14,000
| Westar Energy, Inc.
| 268,100
|
5,800
| WGL Holdings, Inc.
| 191,748
|
| | | 1,210,824
|
| | Total Common Stocks
( Cost $20,739,344 )
| 21,153,588
|
Shares | | Value (Note 2) |
INVESTMENT COMPANY - 3.16%
| |
688,502
| SSgA Prime Money Market Fund
| $688,502
|
| | Total Investment Company (Cost $688,502 )
| 688,502
|
TOTAL INVESTMENTS - 100.24%
( Cost $21,427,846** ) | 21,842,090
|
NET OTHER ASSETS AND LIABILITIES - (0.24)%
| (51,948)
|
TOTAL NET ASSETS - 100.00%
| $21,790,142
|
*
| Non-income producing.
|
**
| Aggregate cost for Federal tax purposes was $21,872,073.
|
ADR
| American Depositary Receipt.
|
PLC
| Public Limited Company.
|
REIT
| Real Estate Investment Trust.
|
See accompanying Notes to Financial Statements.
53
Small Cap Growth Fund Portfolio of Investments
Sector Allocation as a Percentage of Net Assets
as of October 31, 2009

|
Shares | | Value (Note 2) |
COMMON STOCKS - 98.40%
| |
| | Consumer Discretionary - 12.53%
| |
4,300
| Aaron’s, Inc.
| $ 107,715
|
4,000
| Aeropostale, Inc. *
| 150,120
|
800
| Carter’s, Inc. *
| 18,880
|
2,600
| Chico’s FAS, Inc. *
| 31,070
|
4,000
| CKE Restaurants, Inc.
| 35,000
|
3,800
| CROCS, Inc. *
| 23,104
|
2,000
| DineEquity, Inc. *
| 42,320
|
7,900
| Drew Industries, Inc. *
| 151,206
|
2,100
| Gaylord Entertainment Co. *
| 31,563
|
3,100
| Gymboree Corp. *
| 131,967
|
6,100
| JOS A Bank Clothiers, Inc. *
| 249,978
|
600
| Life Time Fitness, Inc. *
| 12,930
|
2,200
| Maidenform Brands, Inc. *
| 30,888
|
10,100
| Men’s Wearhouse, Inc./The
| 234,017
|
3,100
| Meritage Homes Corp. *
| 56,544
|
6,800
| PF Chang’s China Bistro, Inc. *
| 198,492
|
3,300
| Pinnacle Entertainment, Inc. *
| 27,885
|
600
| Red Robin Gourmet Burgers, Inc. *
| 10,026
|
11,700
| Spartan Motors, Inc.
| 58,383
|
2,600
| Tempur-Pedic International, Inc. *
| 50,362
|
600
| Valassis Communications, Inc. *
| 10,938
|
5,700
| WMS Industries, Inc. *
| 227,886
|
3,200
| Zumiez, Inc. *
| 43,104
|
| | | 1,934,378
|
| | Consumer Staples - 3.42%
| |
600
| Coca-Cola Bottling Co. Consolidated
| 26,946
|
700
| Flowers Foods, Inc.
| 16,352
|
950
| Green Mountain Coffee Roasters, Inc. *
| 63,222
|
300
| Ralcorp Holdings, Inc. *
| 16,110
|
5,400
| Ruddick Corp.
| 144,288
|
7,100
| United Natural Foods, Inc. *
| 171,181
|
8,100
| Winn-Dixie Stores, Inc. *
| 89,829
|
| | | 527,928
|
Shares | | Value (Note 2) |
| | Energy - 7.07%
| |
3,700
| Atwood Oceanics, Inc. *
| $ 131,313
|
3,800
| CARBO Ceramics, Inc.
| 221,882
|
11,600
| Carrizo Oil & Gas, Inc. *
| 268,888
|
800
| Dril-Quip, Inc. *
| 38,872
|
1,100
| GMX Resources, Inc. *
| 14,003
|
7,600
| Hercules Offshore, Inc. *
| 38,988
|
2,500
| Matrix Service Co. *
| 22,175
|
5,300
| Penn Virginia Corp.
| 107,325
|
4,000
| Petroleum Development Corp. *
| 66,800
|
9,400
| RPC, Inc.
| 87,890
|
3,400
| Stone Energy Corp. *
| 52,122
|
3,900
| Superior Well Services, Inc. *
| 41,379
|
| | | 1,091,637
|
| | Financials - 8.60%
| |
400
| Cohen & Steers, Inc.
| 7,732
|
900
| East West Bancorp, Inc.
| 8,127
|
5,200
| eHealth, Inc. *
| 73,996
|
2,800
| GAMCO Investors, Inc., Class A
| 118,132
|
400
| Greenhill & Co., Inc.
| 34,492
|
2,400
| Hancock Holding Co.
| 87,048
|
4,700
| Highwoods Properties, Inc., REIT
| 129,344
|
4,900
| KBW, Inc. *
| 137,200
|
5,900
| Knight Capital Group, Inc., Class A *
| 99,415
|
12,900
| Omega Healthcare Investors, Inc., REIT
| 195,564
|
4,100
| Potlatch Corp., REIT
| 114,431
|
2,200
| Stifel Financial Corp. *
| 114,312
|
2,200
| SVB Financial Group *
| 90,750
|
37
| Teton Advisors, Inc. (L)(T)*
| –
|
3,100
| Tower Group, Inc.
| 76,198
|
1,600
| World Acceptance Corp. *
| 40,144
|
| | | 1,326,885
|
| | Health Care - 15.20%
| |
900
| Abaxis, Inc. *
| 20,538
|
1,500
| Acorda Therapeutics, Inc. *
| 32,595
|
See accompanying Notes to Financial Statements.
54
Small Cap Growth Fund Portfolio of Investments
Shares | | Value (Note 2) |
COMMON STOCKS (continued) | |
| | Health Care (continued) | |
11,000
| Alkermes, Inc. *
| $ 87,670
|
14,000
| Allscripts-Misys Healthcare Solutions, Inc. *
| 273,000
|
700
| AMAG Pharmaceuticals, Inc. *
| 26,446
|
11,200
| American Medical Systems Holdings, Inc. *
| 172,704
|
14,600
| AMN Healthcare Services, Inc. *
| 121,472
|
1,900
| Amylin Pharmaceuticals, Inc. *
| 20,976
|
1,500
| Analogic Corp.
| 56,010
|
28,100
| Arena Pharmaceuticals, Inc. *
| 99,193
|
1,300
| BioCryst Pharmaceuticals, Inc. *
| 11,609
|
3,500
| Centene Corp. *
| 62,405
|
2,300
| Cepheid, Inc. *
| 30,521
|
600
| Chemed Corp.
| 27,192
|
6,200
| Cubist Pharmaceuticals, Inc. *
| 105,028
|
1,800
| Dendreon Corp. *
| 45,486
|
7,100
| Emeritus Corp. *
| 132,486
|
8,200
| ev3, Inc. *
| 96,596
|
1,100
| Incyte Corp., Ltd. *
| 6,479
|
1,900
| Landauer, Inc.
| 98,401
|
3,900
| MAP Pharmaceuticals, Inc. *
| 32,058
|
7,100
| Medicines Co./The *
| 51,049
|
600
| Medicis Pharmaceutical Corp., Class A
| 12,702
|
400
| Myriad Genetics, Inc. *
| 9,712
|
1,775
| Myriad Pharmaceuticals, Inc. *
| 9,798
|
1,900
| National Healthcare Corp.
| 68,343
|
2,300
| Novavax, Inc. *
| 8,832
|
900
| Orexigen Therapeutics, Inc. *
| 5,814
|
500
| OSI Pharmaceuticals, Inc. *
| 16,110
|
6,500
| PSS World Medical, Inc. *
| 131,430
|
1,500
| Psychiatric Solutions, Inc. *
| 30,960
|
4,000
| Regeneron Pharmaceuticals, Inc. *
| 62,800
|
2,200
| Theravance, Inc. *
| 30,734
|
800
| United Therapeutics Corp. *
| 34,032
|
5,800
| Valeant Pharmaceuticals International *
| 170,520
|
600
| Vanda Pharmaceuticals, Inc. *
| 6,120
|
5,600
| Viropharma, Inc. *
| 42,224
|
1,900
| West Pharmaceutical Services, Inc.
| 74,993
|
1,200
| XenoPort, Inc. *
| 20,052
|
| | | 2,345,090
|
| | Industrials - 21.42%
| |
8,000
| AAR Corp. *
| 156,880
|
6,000
| Actuant Corp., Class A
| 93,660
|
2,300
| Advanced Battery Technologies, Inc. *
| 7,728
|
1,000
| Beacon Roofing Supply, Inc. *
| 14,360
|
3,600
| Bucyrus International, Inc.
| 159,912
|
1,900
| Deluxe Corp.
| 27,037
|
700
| EMCOR Group, Inc. *
| 16,534
|
Shares | | Value (Note 2) |
28,200
| EnergySolutions, Inc.
| $ 235,188
|
1,500
| EnerNOC, Inc. *
| 43,095
|
900
| Esterline Technologies Corp. *
| 37,899
|
3,400
| Franklin Electric Co., Inc.
| 92,752
|
9,000
| GeoEye, Inc. *
| 228,330
|
500
| GrafTech International, Ltd. *
| 6,750
|
8,700
| Heartland Express, Inc.
| 118,320
|
2,700
| Herman Miller, Inc.
| 41,715
|
15,000
| Hexcel Corp. *
| 165,000
|
1,900
| ICF International, Inc. *
| 54,435
|
7,000
| Korn/Ferry International *
| 111,720
|
600
| Lindsay Corp.
| 19,698
|
16,900
| MasTec, Inc. *
| 199,420
|
5,300
| Mcgrath Rentcorp
| 104,675
|
2,100
| Middleby Corp. *
| 95,151
|
4,000
| Mine Safety Appliances Co.
| 101,960
|
4,500
| Moog, Inc., Class A *
| 112,365
|
14,800
| MPS Group, Inc. *
| 200,096
|
900
| Multi-Color Corp.
| 11,943
|
7,300
| Old Dominion Freight Line, Inc. *
| 189,727
|
1,000
| Orbital Sciences Corp. *
| 12,880
|
2,500
| RBC Bearings, Inc. *
| 53,775
|
5,600
| Resources Connection, Inc. *
| 96,712
|
2,100
| Rollins, Inc.
| 37,968
|
3,400
| SYKES Enterprises, Inc. *
| 80,716
|
2,300
| Triumph Group, Inc.
| 107,663
|
2,800
| United Stationers, Inc. *
| 131,992
|
1,900
| Valmont Industries, Inc.
| 137,313
|
| | | 3,305,369
|
| | Information Technology - Other - 22.42% | |
5,800
| Adtran, Inc.
| 133,632
|
10,300
| Advanced Energy Industries, Inc. *
| 125,763
|
3,500
| Advent Software, Inc. *
| 133,770
|
3,900
| Anixter International, Inc. *
| 163,215
|
3,700
| ANSYS, Inc. *
| 150,146
|
14,700
| Benchmark Electronics, Inc. *
| 246,960
|
600
| CommScope, Inc. *
| 16,212
|
7,500
| Concur Technologies, Inc. *
| 267,300
|
5,000
| CSG Systems International, Inc. *
| 81,700
|
1,700
| Cymer, Inc. *
| 58,208
|
700
| DealerTrack Holdings, Inc. *
| 11,536
|
6,800
| EPIQ Systems, Inc. *
| 85,748
|
1,900
| Equinix, Inc. *
| 162,108
|
1,800
| Factset Research Systems, Inc.
| 115,290
|
12,500
| Harmonic, Inc. *
| 65,625
|
4,600
| j2 Global Communications, Inc. *
| 94,070
|
5,700
| Littelfuse, Inc. *
| 157,092
|
2,200
| MAXIMUS, Inc.
| 101,772
|
See accompanying Notes to Financial Statements.
55
Small Cap Growth Fund Portfolio of Investments
Shares | | Value (Note 2) |
COMMON STOCKS (continued) | |
| | Information Technology -
Other (continued) | |
1,600
| Mentor Graphics Corp. *
| $ 11,680
|
700
| Micros Systems, Inc. *
| 18,844
|
5,500
| Novatel Wireless, Inc. *
| 49,060
|
900
| NVE Corp. *
| 33,660
|
2,100
| Plexus Corp. *
| 53,130
|
6,600
| Polycom, Inc. *
| 141,702
|
6,000
| Progress Software Corp. *
| 138,600
|
3,700
| Quest Software, Inc. *
| 62,049
|
900
| RightNow Technologies, Inc. *
| 13,734
|
6,700
| Scansource, Inc. *
| 170,113
|
4,600
| Smith Micro Software, Inc. *
| 41,768
|
800
| STEC, Inc. *
| 17,056
|
3,100
| Sybase, Inc. *
| 122,636
|
2,100
| Synaptics, Inc. *
| 47,250
|
1,800
| THQ, Inc. *
| 9,414
|
1,900
| TNS, Inc. *
| 53,694
|
700
| TTM Technologies, Inc. *
| 7,119
|
22,300
| Valueclick, Inc. *
| 219,432
|
2,000
| VeriFone Holdings, Inc. *
| 26,600
|
1,800
| Viasat, Inc. *
| 52,470
|
| | | 3,460,158
|
| | Information Technology - Semiconductors - 5.46% | |
800
| Cypress Semiconductor Corp. *
| 6,744
|
12,200
| IXYS Corp. *
| 81,740
|
9,000
| MKS Instruments, Inc. *
| 140,760
|
6,400
| Netlogic Microsystems, Inc. *
| 243,264
|
6,700
| PMC - Sierra, Inc. *
| 57,084
|
8,300
| Ultratech, Inc. *
| 107,236
|
6,500
| Varian Semiconductor Equipment
Associates, Inc. *
| 184,535
|
900
| Veeco Instruments, Inc. *
| 21,915
|
| | | 843,278
|
Shares | | Value (Note 2) |
| | Materials - 1.71%
| |
5,600
| Allied Nevada Gold Corp. *
| $ 53,480
|
2,800
| Deltic Timber Corp.
| 119,000
|
600
| Haynes International, Inc. *
| 16,992
|
4,200
| LSB Industries, Inc. *
| 52,080
|
700
| Solutia, Inc. *
| 7,700
|
700
| WR Grace & Co. *
| 15,323
|
| | | 264,575
|
| | Telecommunication Services - 0.56%
| |
11,500
| Premiere Global Services, Inc. *
| 85,905
|
| | Total Common Stocks
( Cost $14,013,475 )
| 15,185,203
|
INVESTMENT COMPANY - 1.67%
| |
257,450
| SSgA Prime Money Market Fund
| 257,450
|
| | Total Investment Company
( Cost $257,450 )
| 257,450
|
TOTAL INVESTMENTS - 100.07%
( Cost $14,270,925** ) | 15,442,653
|
NET OTHER ASSETS AND LIABILITIES - (0.07)%
| (10,013)
|
TOTAL NET ASSETS - 100.00%
| $15,432,640
|
*
| Non-income producing.
|
**
| Aggregate cost for Federal tax purposes was $14,335,247.
|
(L)
| Security valued at fair value using methods determined in good faith by or at the discretion of the Board of Trustees (see Note 2).
|
(T)
| Illiquid security.
|
REIT
| Real Estate Investment Trust.
|
See accompanying Notes to Financial Statements.
56
International Stock Fund Portfolio of Investments
Geographical Allocation as a Percentage of Net Assets
as of October 31, 2009
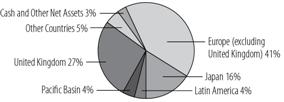
|
Shares | | Value (Note 2) |
COMMON STOCKS - 96.69%
| |
| | Australia - 1.09%
| |
26,314
| ABC Learning Centres, Ltd. (L)(T)*
| $ –
|
79,900
| QBE Insurance Group, Ltd.
| 1,614,320
|
| | Belgium - 2.04%
| |
64,233
| Anheuser-Busch InBev N.V.
| 3,026,482
|
| | Brazil - 2.90%
| |
123,200
| Banco do Brasil S.A.
| 1,991,503
|
250,100
| Companhia Brasileira de Meios de Pagamento
| 2,314,480
|
| | | 4,305,983
|
| | Canada - 1.36%
| |
63,900
| TELUS Corp.
| 2,016,302
|
| | China - 1.34%
| |
2,501,900
| Industrial & Commercial Bank of China
| 1,989,965
|
| | Denmark - 1.00%
| |
23,700
| Novo Nordisk A/S, B Shares
| 1,477,730
|
| | France - 8.73%
| |
48,798
| BNP Paribas
| 3,680,480
|
26,032
| Groupe Danone S.A.
| 1,568,157
|
56,749
| Sanofi-Aventis S.A.
| 4,158,656
|
59,331
| Total S.A.
| 3,542,090
|
| | | 12,949,383
|
| | Germany - 8.34%
| |
22,368
| Allianz SE
| 2,570,159
|
21,600
| Bayerische Motoren Werke AG
| 1,058,131
|
61,000
| Daimler AG
| 2,977,282
|
12,288
| Merck KGaA
| 1,158,710
|
28,000
| SAP AG
| 1,268,567
|
36,974
| Siemens AG
| 3,340,314
|
| | | 12,373,163
|
| | Hong Kong - 2.58%
| |
414,620
| Esprit Holdings, Ltd.
| 2,716,871
|
197,000
| Kerry Properties, Ltd.
| 1,109,681
|
| | | 3,826,552
|
Shares | | Value (Note 2) |
| | India - 0.62%
| |
849,800
| Idea Cellular, Ltd. *
| $ 918,612
|
| | Ireland - 1.33%
| |
80,940
| CRH PLC
| 1,979,194
|
| | Italy - 0.99%
| |
61,900
| Atlantia SpA
| 1,468,659
|
| | Japan - 15.72%
| |
16,600
| Benesse Holdings, Inc.
| 732,100
|
100,100
| Canon, Inc.
| 3,735,381
|
50,640
| Daito Trust Construction Co., Ltd.
| 2,105,360
|
15,800
| Fanuc, Ltd.
| 1,319,723
|
47,100
| Honda Motor Co., Ltd.
| 1,449,322
|
90,600
| HOYA Corp.
| 1,973,128
|
169
| INPEX Corp.
| 1,375,070
|
337
| KDDI Corp.
| 1,780,712
|
6,700
| Keyence Corp.
| 1,321,962
|
93,000
| Kubota Corp.
| 717,454
|
96,800
| Mitsubishi Corp.
| 2,056,393
|
112,000
| Mitsubishi Estate Co., Ltd.
| 1,691,076
|
234,500
| Nomura Holdings, Inc.
| 1,631,802
|
31,000
| Secom Co., Ltd.
| 1,441,738
|
| | | 23,331,221
|
| | Mexico - 0.92%
| |
70,600
| Grupo Televisa S.A., ADR
| 1,366,816
|
| | Netherlands - 1.58%
| |
88,438
| TNT N.V.
| 2,349,168
|
| | Norway - 1.03%
| |
125,600
| Aker Solutions ASA
| 1,523,186
|
| | Russia - 1.00%
| |
25,700
| Lukoil OAO, ADR
| 1,484,948
|
| | Singapore - 0.90%
| |
643,300
| Singapore Telecommunications, Ltd.
| 1,335,651
|
See accompanying Notes to Financial Statements.
57
International Stock Fund Portfolio of Investments
Shares | | Value (Note 2) |
COMMON STOCKS (continued) | |
| | Spain - 3.15%
| |
118,000
| Banco Bilbao Vizcaya Argentaria S.A.
| $2,119,069
|
158,004
| Banco Santander S.A.
| 2,549,894
|
| | | 4,668,963
|
| | Sweden - 1.23%
| |
170,460
| Telefonaktiebolaget LM Ericsson,
| |
| | B Shares
| 1,827,504
|
| | Switzerland - 11.55%
| |
68,724
| Credit Suisse Group AG
| 3,676,747
|
26,700
| Julius Baer Group, Ltd.
| 1,006,741
|
48,470
| Nestle S.A.
| 2,256,758
|
44,085
| Novartis AG
| 2,303,320
|
17,047
| Roche Holding AG
| 2,735,702
|
116,300
| UBS AG *
| 1,950,738
|
14,027
| Zurich Financial Services AG
| 3,216,392
|
| | | 17,146,398
|
| | Turkey - 0.72%
| |
160,500
| Turkcell Iletisim Hizmet AS
| 1,064,365
|
| | | |
| | United Kingdom - 26.57%
| |
404,415
| BAE Systems PLC
| 2,090,139
|
439,100
| Barclays PLC *
| 2,307,330
|
121,851
| BG Group PLC
| 2,109,705
|
352,752
| BP PLC
| 3,336,501
|
241,600
| British Airways PLC *
| 720,186
|
45,384
| British American Tobacco PLC
| 1,455,350
|
881,202
| BT Group PLC
| 1,889,455
|
23,808
| Cairn Energy PLC *
| 1,033,775
|
315,583
| HSBC Holdings PLC
| 3,504,530
|
1
| IG Group Holdings PLC
| 5
|
226,556
| Informa PLC
| 1,091,500
|
301,106
| International Power PLC
| 1,258,798
|
1,470,800
| Lloyds Banking Group PLC *
| 2,089,743
|
230,807
| Prudential PLC
| 2,103,289
|
267,820
| QinetiQ Group PLC
| 720,942
|
90,900
| Standard Chartered PLC
| 2,241,818
|
293,795
| Tesco PLC
| 1,969,054
|
113,300
| Unilever PLC
| 3,405,969
|
1,171,864
| Vodafone Group PLC
| 2,603,955
|
177,663
| WPP PLC
| 1,600,161
|
132,200
| Xstrata PLC *
| 1,901,767
|
| | | 39,433,972
|
| | Total Common Stocks
( Cost $136,506,069 )
| 143,478,537
|
| | | |
Shares | | Value (Note 2) |
INVESTMENT COMPANY - 1.23%
| |
| | United States - 1.23%
| |
1,820,360
| SSgA Prime Money Market Fund
| $1,820,360
|
| | Total Investment Company
( Cost $1,820,360 )
| 1,820,360
|
TOTAL INVESTMENTS - 97.92%
( Cost $138,326,429** ) | 145,298,897
|
NET OTHER ASSETS AND LIABILITIES - 2.08%
| 3,091,291
|
TOTAL NET ASSETS - 100.00%
| $148,390,188
|
*
| Non-income producing.
|
**
| Aggregate cost for Federal tax purposes was $140,284,532.
|
(L)
| Security valued at fair value using methods determined in good faith by or at the discretion of the Board of Trustees (see Note 2).
|
(T)
| Illiquid security.
|
ADR
| American Depositary Receipt.
|
PLC
| Public Limited Company.
|
See accompanying Notes to Financial Statements.
58
International Stock Fund Portfolio of Investments
OTHER INFORMATION:
|
Industry Concentration
|
| | % of Net Assets
|
Commercial Banks
| 15.8%
|
Oil, Gas & Consumable Fuels
| 8.7%
|
Pharmaceuticals
| 8.0%
|
Insurance
| 6.4%
|
Capital Markets
| 4.9%
|
Food Products
| 4.9%
|
Wireless Telecommunication Services
| 4.5%
|
Automobiles
| 3.7%
|
Commercial Services & Supplies
| 3.5%
|
Diversified Telecommunication Services
| 3.4%
|
Net Other Assets & Liabilities
| 3.3%
|
Real Estate Management & Development
| 3.3%
|
Electrical Equipment
| 3.2%
|
Distributors
| 3.2%
|
Media
| 2.7%
|
Office Electronics
| 2.5%
|
Electronic Equipment & Instruments
| 2.2%
|
Beverages
| 2.0%
|
| | % of Net Assets
|
Air Freight & Logistics
| 1.6%
|
Aerospace & Defense
| 1.4%
|
Machinery
| 1.4%
|
Construction Materials
| 1.3%
|
Food & Staples Retailing
| 1.3%
|
Metals & Mining
| 1.3%
|
Communications Equipment
| 1.2%
|
Construction & Engineering
| 1.0%
|
Tobacco
| 1.0%
|
Software
| 0.9%
|
Electric Utilities
| 0.9%
|
Industrial Conglomerates
| 0.5%
|
Diversified Financial Services*
| 0.0%
|
| | 100.0%
|
*Rounds to 0.0%
| |
See accompanying Notes to Financial Statements.
59
Statements of Assets and Liabilities as of October 31, 2009
| | Conservative Allocation
Fund | Moderate Allocation
Fund | Aggressive Allocation
Fund |
Assets: | | | |
Investments:
| | | |
Investments at cost
| | | |
Unaffiliated issuers
| $12,615,336
| $27,089,399
| $9,726,884
|
Affiliated issuers4
| 24,320,689
| 67,202,731
| 23,544,445
|
Net unrealized appreciation (depreciation)
| | | |
Unaffiliated issuers
| 427,130
| (511,171)
| (908,385)
|
Affiliated issuers4
| (669,880)
| (5,791,331)
| (2,520,194)
|
Total investments at value
| 36,693,275
| 87,989,628
| 29,842,750
|
Receivables:
| | | |
Investments sold
| –
| –
| 2,293
|
Fund shares sold
| 475,576
| 115,621
| 31,503
|
Dividends and interest
| 6
| 7
| 6
|
Due from Adviser
| –
| –
| 818
|
Other assets
| 1,715
| –
| 240
|
Total assets
| 37,170,572
| 88,105,256
| 29,877,610
|
Liabilities: | | | |
Payables:
| | | |
Investments purchased
| 207,148
| 20,291
| –
|
Fund shares repurchased
| 13,282
| 72,071
| 12,023
|
Advisory agreement fees
| 6,158
| 15,181
| 5,217
|
Service agreement fees
| 358
| 11,388
| –
|
Distribution fees – Class B
| 3,935
| 13,122
| 4,920
|
Distribution fees – Class C
| 2,163
| 2,010
| 271
|
Shareholder servicing fees
| 7,697
| 18,977
| 6,522
|
Accrued expenses and other payables
| 5,839
| 5,839
| 5,839
|
Total liabilities
| 246,580
| 158,879
| 34,792
|
Net Assets
| $36,923,992
| $87,946,377
| $29,842,818
|
Net Assets consist of: | | | |
Paid-in capital
| $40,837,078
| $107,259,618
| $38,088,716
|
Accumulated undistributed net investment income
| 88,494
| 653,157
| 137,731
|
Accumulated net realized loss on investments sold and foreign currency related transactions
| (3,758,830)
| (13,663,896)
| (4,955,050)
|
Net unrealized depreciation of investments (including appreciation (depreciation) of foreign currency related transactions)
| (242,750)
| (6,302,502)
| (3,428,579)
|
Net Assets
| $36,923,992
| $87,946,377
| $29,842,818
|
Class A Shares: | | | |
Net Assets
| $27,224,878
| $64,631,041
| $21,855,279
|
Shares of beneficial interest outstanding
| 2,915,161
| 7,369,075
| 2,692,474
|
Net Asset Value and redemption price per share1
| $ 9.34
| $ 8.77
| $ 8.12
|
Sales charge of offering price2
| 0.57
| 0.54
| 0.50
|
Maximum offering price per share
| $ 9.91
| $ 9.31
| $ 8.62
|
Class B Shares: | | | |
Net Assets
| $6,287,075
| $20,221,546
| $7,517,879
|
Shares of beneficial interest outstanding
| 672,847
| 2,319,916
| 934,073
|
Net Asset Value and redemption price per share1
| $ 9.34
| $ 8.72
| $ 8.05
|
Class C Shares3: | | | |
Net Assets
| $3,412,039
| $3,093,790
| $ 469,660
|
Shares of beneficial interest outstanding
| 364,968
| 354,616
| 58,283
|
Net Asset Value and redemption price per share1
| $ 9.35
| $ 8.72
| $ 8.06
|
1 | If applicable, redemption price per share may be reduced by a contingent deferred sales charge and/or redemption fee.
|
2 | Sales charge of offering price is 5.75% for the Conservative Allocation, Moderate Allocation, Aggressive Allocation Funds.
|
3 | Class C shares commenced investment operations on February 29, 2008.
|
4 | See Note 10 for information on affiliated issuers.
|
See accompanying Notes to Financial Statements.
60
Statements of Assets and Liabilities as of October 31, 2009
| | Cash
Reserves
Fund | Bond
Fund | High
Income
Fund |
Assets: | | | |
Investments:
| | | |
Investments at cost
| | | |
Unaffiliated issuers
| $16,922,245
| $192,522,719
| $103,700,424
|
Net unrealized appreciation
| | | |
Unaffiliated issuers
| –
| 6,494,191
| 6,198,215
|
Total investments at value
| 16,922,245
| 199,016,910
| 109,898,639
|
Receivables:
| | | |
Investments sold
| –
| –
| 922,120
|
Fund shares sold
| 22,562
| 219,313
| 227,158
|
Dividends and interest
| 23,915
| 1,553,681
| 2,274,968
|
Due from Adviser
| 7,478
| –
| –
|
Total assets
| 16,976,200
| 200,789,904
| 113,322,885
|
Liabilities: | | | |
Bank overdrafts
| –
| 6,848
| 38,336
|
Payables:
| | | |
Investments purchased
| –
| –
| 2,381,661
|
Fund shares repurchased
| 27,226
| 50,805
| 35,936
|
Advisory agreement fees
| –
| 84,864
| 51,342
|
Service agreement fees
| –
| 17,515
| 8,800
|
Distribution fees – Class B
| 2,114
| 6,006
| 3,014
|
Shareholder servicing fees
| –
| 11,343
| 6,438
|
Accrued expenses and other payables
| 6,606
| 5,444
| 8,120
|
Total liabilities
| 35,946
| 182,825
| 2,533,647
|
Net Assets
| $16,940,254
| $200,607,079
| $110,789,238
|
Net Assets consist of: | | | |
Paid-in capital
| $16,940,254
| $195,487,072
| $114,508,538
|
Accumulated undistributed net investment income (loss)
| –
| 35,221
| 68,947
|
Accumulated net realized gain (loss) on investments sold and foreign currency related transactions
| –
| (1,409,405)
| (9,986,462)
|
Net unrealized appreciation of investments (including appreciation (depreciation) of foreign currency related transactions)
| –
| 6,494,191
| 6,198,215
|
Net Assets
| $16,940,254
| $200,607,079
| $110,789,238
|
Class A Shares: | | | |
Net Assets
| $13,690,192
| $44,098,862
| $25,683,876
|
Shares of beneficial interest outstanding
| 13,692,501
| 4,360,717
| 3,856,852
|
Net Asset Value and redemption price per share1
| $1.00
| $10.11
| $6.66
|
Sales charge of offering price2
| –
| 0.48
| 0.31
|
Maximum offering price per share
| $1.00
| $ 10.59
| $6.97
|
Class B Shares: | | | |
Net Assets
| $3,250,062
| $9,363,263
| $4,711,522
|
Shares of beneficial interest outstanding
| 3,252,863
| 925,580
| 699,008
|
Net Asset Value and redemption price per share1
| $ 1.00
| $ 10.12
| $ 6.74
|
Class Y Shares3: | | | |
Net Assets
| | $147,144,954
| $80,393,840
|
Shares of beneficial interest outstanding
| | 14,557,358
| 12,092,338
|
Net Asset Value and redemption price per share1
| | $ 10.11
| $ 6.65
|
1 | If applicable, redemption price per share may be reduced by a contingent deferred sales charge and/or redemption fee.
|
2 | Sales charge of offering price is 5.75% for the Cash Reserves Fund; and 4.50% for the Bond and High Income Funds.
|
3 | The Cash Reserves Fund does not have Class Y shares.
|
See accompanying Notes to Financial Statements.
61
Statements of Assets and Liabilities as of October 31, 2009
| | Diversified
Income Fund | Large Cap
Value Fund | Large Cap
Growth Fund |
Assets: | | | |
Investments:
| | | |
Investments at cost
| | | |
Unaffiliated issuers
| $86,886,077
| $149,717,394
| $151,311,675
|
Net unrealized appreciation (depreciation)
| | | |
Unaffiliated issuers
| 1,942,972
| (3,976,767)
| 13,678,042
|
Total investments at value
| 88,829,049
| 145,740,627
| 164,989,717
|
Foreign currency (cost of $131,021)(Note 2)
| –
| –
| –
|
Receivables:
| | | |
Investments sold
| –
| 2,437,503
| 2,965,611
|
Fund shares sold
| 16,382
| 279,574
| 281,634
|
Dividends and interest
| 667,538
| 260,503
| 81,250
|
Due from Adviser
| –
| –
| –
|
Other assets
| 456
| –
| –
|
Total assets
| 89,513,425
| 148,718,207
| 168,318,212
|
Liabilities: | | | |
Payables:
| | | |
Investments purchased
| –
| 4,482,516
| 6,691,165
|
Fund shares repurchased
| 74,244
| 59,155
| 25,573
|
Advisory agreement fees
| 50,048
| 67,903
| 104,597
|
Service agreement fees
| 6,826
| 35,278
| 18,724
|
Distribution fees – Class B
| 11,845
| 6,400
| 6,334
|
Shareholder servicing fees
| 22,709
| 14,097
| 11,991
|
Dividend payable
| 5,062
| –
| –
|
Accrued expenses and other payables
| 6,823
| 6,918
| 6,918
|
Total liabilities
| 177,557
| 4,672,267
| 6,865,302
|
Net Assets
| $89,335,868
| $144,045,940
| $161,452,910
|
Net Assets consist of: | | | |
Paid-in capital
| $105,649,682
| $176,114,421
| $184,973,715
|
Accumulated undistributed net investment income (loss)
| (4,780)
| 1,884,254
| 665,507
|
Accumulated net realized loss on investments sold and foreign currency related transactions
| (18,252,006)
| (29,975,968)
| (37,864,354)
|
Net unrealized appreciation (depreciation) of investments (including appreciation (depreciation) of foreign currency related transactions)
| 1,942,972
| (3,976,767)
| 13,678,042
|
Net Assets
| $89,335,868
| $144,045,940
| $161,452,910
|
Class A Shares: | | | |
Net Assets
| $71,014,012
| $54,241,720
| $45,397,813
|
Shares of beneficial interest outstanding
| 6,982,862
| 5,133,025
| 3,452,347
|
Net Asset Value and redemption price per share1
| $ 10.17
| $ 10.57
| $ 13.15
|
Sales charge of offering price2
| 0.62
| 0.64
| 0.80
|
Maximum offering price per share
| $ 10.79
| $ 11.21
| $ 13.95
|
Class B Shares: | | | |
Net Assets
| $18,321,856
| $9,637,504
| $9,665,516
|
Shares of beneficial interest outstanding
| 1,792,683
| 928,387
| 794,863
|
Net Asset Value and redemption price per share1
| $ 10.22
| $ 10.38
| $ 12.16
|
Class Y Shares3: | | | |
Net Assets
| | $80,166,716
| $106,389,581
|
Shares of beneficial interest outstanding
| | 7,577,445
| 8,040,179
|
Net Asset Value and redemption price per share1
| | $ 10.58
| $ 13.23
|
1 | If applicable, redemption price per share may be reduced by a contingent deferred sales charge and/or redemption fee.
|
2 | Sales charge of offering price is 5.75% for the Diversified Income, Large Cap Value, Large Cap Growth, Mid Cap Value, Mid Cap Growth, Small Cap Value, Small Cap Growth, and International Stock Funds.
|
3 | The Diversified Income Fund does not have Class Y shares.
|
See accompanying Notes to Financial Statements.
62
Statements of Assets and Liabilities as of October 31, 2009
Mid Cap
Value Fund | Mid Cap
Growth Fund | Small Cap
Value Fund | Small Cap
Growth Fund | International
Stock Fund |
| | | | | |
| | | | | |
| | | | | |
$29,260,159
| $38,414,131
| $21,427,846
| $14,270,925
| $138,326,429
|
| | | | | |
600,992
| 4,940,082
| 414,244
| 1,171,728
| 6,972,468
|
29,861,151
| 43,354,213
| 21,842,090
| 15,442,653
| 145,298,897
|
–
| –
| –
| –
| 130,613
|
| | | | | |
575,980
| 1,540,692
| 49,533
| –
| 3,288,639
|
6,417
| 52,323
| 13,125
| 131
| 153,125
|
35,711
| 12,334
| 13,509
| 6,182
| 294,462
|
3,325
| –
| 3,634
| 4,943
| –
|
552
| –
| –
| –
| 97,407
|
30,483,136
| 44,959,562
| 21,921,891
| 15,453,909
| 149,263,143
|
| | | | | |
–
| –
| –
| –
| –
|
| | | | | |
478,625
| 145,182
| 105,010
| –
| 656,055
|
10,102
| 5,067
| –
| –
| 33,931
|
25,442
| 29,619
| 19,383
| 14,147
| 136,612
|
–
| 7,562
| –
| –
| 27,320
|
3,701
| 2,823
| 67
| 51
| 3,381
|
6,294
| 4,732
| 310
| 92
| 6,194
|
7,181
| 6,734
| 6,979
| 6,979
| 9,462
|
531,345
| 201,719
| 131,749
| 21,269
| 872,955
|
$29,951,791
| $44,757,843
| $21,790,142
| $15,432,640
| $148,390,188
|
| | | | | |
$44,601,539
| $62,101,187
| $24,833,343
| $24,794,951
| $163,586,985
|
139,340
| –
| 47,176
| –
| 2,151,328
|
(15,390,080)
| (22,283,426)
| (3,504,621)
| (10,534,039)
| (24,326,387)
|
| | | | | |
600,992
| 4,940,082
| 414,244
| 1,171,728
| 6,978,262
|
$29,951,791
| $44,757,843
| $21,790,142
| $15,432,640
| $148,390,188
|
| | | | | |
$22,692,601
| $17,138,329
| $1,301,521
| $ 314,403
| $23,094,237
|
2,686,142
| 3,462,017
| 157,938
| 52,089
| 2,324,303
|
$ 8.45
| $ 4.95
| $ 8.24
| $ 6.04
| $ 9.94
|
0.52
| 0.30
| 0.50
| 0.37
| 0.61
|
$ 8.97
| $ 5.25
| $ 8.74
| $ 6.41
| $ 10.55
|
| | | | | |
$5,497,868
| $4,230,789
| $ 100,014
| $ 74,394
| $5,108,527
|
690,162
| 919,006
| 12,234
| 12,588
| 523,211
|
$ 7.97
| $ 4.60
| $ 8.18
| $ 5.91
| $ 9.76
|
| | | | | |
$1,761,322
| $23,388,725
| $20,388,607
| $15,043,843
| $120,187,424
|
205,633
| 4,681,547
| 2,480,225
| 2,476,475
| 12,082,908
|
$ 8.57
| $ 5.00
| $ 8.22
| $ 6.07
| $ 9.95
|
See accompanying Notes to Financial Statements.
63
Statements of Operations for the Year Ended October 31, 2009
| | Conservative Allocation
Fund | Moderate Allocation
Fund | Aggressive Allocation
Fund |
Investment Income: | | | |
Interest
| $ 511
| $ 490
| $ 556
|
Dividends
| | | |
Unaffiliated issuers
| 373,959
| 582,416
| 122,814
|
Affiliated issuers1
| 682,494
| 1,361,546
| 301,781
|
Total investment income
| 1,056,964
| 1,944,452
| 425,151
|
Expenses: | | | |
Advisory agreement fees
| 60,116
| 147,366
| 47,392
|
Service agreement fees
| 125,483
| 222,303
| 141,830
|
Audit fees
| 16,670
| 16,670
| 16,670
|
Trustees’ fees
| 5,617
| 9,741
| 4,872
|
Distribution fees – Class B
| 41,155
| 133,569
| 48,035
|
Distribution fees – Class C
| 18,758
| 18,041
| 2,025
|
Shareholder servicing fees – Class A
| 55,173
| 133,671
| 42,554
|
Shareholder servicing fees – Class B
| 13,718
| 44,523
| 16,012
|
Shareholder servicing fees – Class C
| 6,253
| 6,014
| 675
|
Total expenses before reimbursement
| 342,943
| 731,898
| 320,065
|
Less reimbursement
| (72,625)
| (64,506)
| (104,132)
|
Total expenses net of reimbursement
| 270,318
| 667,392
| 215,933
|
Net Investment Income (Loss)
| 786,646
| 1,277,060
| 209,218
|
Net Realized and Unrealized Gain (Loss) on Investments | | | |
Net realized loss on investments (including net realized loss on foreign currency related transactions)
| | | |
Unaffiliated issuers
| (1,750,635)
| (6,761,769)
| (2,341,563)
|
Affiliated issuers1
| (762,957)
| (1,791,526)
| (677,524)
|
Capital gain distributions received from underlying funds
| | | |
Unaffiliated issuers
| 95,539
| 154,973
| 20,160
|
Affiliated issuers1
| 63,581
| 265,243
| 105,611
|
Net change in unrealized appreciation on investments (including a net unrealized appreciation on foreign currency related transactions)
| 5,774,390
| 16,999,492
| 6,383,193
|
Net Realized and Unrealized Gain on Investments
| 3,419,918
| 8,866,413
| 3,489,877
|
Net Increase in Net Assets from Operations
| $4,206,564
| $10,143,473
| $3,699,095
|
1 | See Note 10 for information on affiliated issuers.
|
See accompanying Notes to Financial Statements.
64
Statements of Operations for the Year Ended October 31, 2009
| | Cash
Reserves
Fund | Bond
Fund | High
Income
Fund |
Investment Income: | | | |
Interest
| $85,117
| $7,250,972
| $7,670,874
|
Securities lending income (loss)
| –
| (1,224)
| 844
|
Total investment income
| 85,117
| 7,249,748
| 7,671,718
|
Expenses: | | | |
Advisory agreement fees
| 84,389
| 920,501
| 479,986
|
Service agreement fees
| 63,085
| 304,227
| 183,219
|
Audit fees
| 16,650
| 17,811
| 23,165
|
Trustees’ fees
| 5,104
| 21,825
| 10,217
|
Distribution fees – Class B
| 34,472
| 93,769
| 37,286
|
Shareholder servicing fees – Class A
| –
| 103,192
| 52,916
|
Shareholder servicing fees – Class B
| –
| 31,256
| 12,429
|
Total expenses before reimbursement/waiver
| 203,700
| 1,492,581
| 799,218
|
Less reimbursement/waiver1
| (130,328)
| (67,712)
| (42,061)
|
Total expenses net of reimbursement/waiver
| 73,372
| 1,424,869
| 757,157
|
Net Investment Income
| 11,745
| 5,824,879
| 6,914,561
|
Net Realized and Unrealized Gain (Loss) on Investments | | | |
Net realized loss on investments (including net realized gain (loss) on foreign currency related transactions)
| | | |
Unaffiliated issuers
| –
| (867,253)
| (2,161,856)
|
Net change in unrealized appreciation on investments (including a net unrealized appreciation (depreciation) on foreign currency related transactions)
| –
| 12,348,829
| 18,740,825
|
Net Realized and Unrealized Gain on Investments
| –
| 11,481,576
| 16,578,969
|
Net Increase in Net Assets from Operations
| $ 1,745
| $17,306,455
| $23,493,530
|
1 | Waiver includes advisory agreement fees of $45,611 and distribution fees of $31, 526 for the Cash Reserves Fund.
|
See accompanying Notes to Financial Statements.
65
Statements of Operations for the Year Ended October 31, 2009
| | Diversified
Income Fund | Large Cap
Value Fund | Large Cap
Growth Fund |
Investment Income: | | | |
Interest
| $2,922,844
| $ 4,489
| $ 3,708
|
Dividends
| | | |
Unaffiliated issuers
| 1,592,247
| 3,826,891
| 2,088,771
|
Less: Foreign taxes withheld
| (342)
| (47)
| (111)
|
Securities lending income
| 1,185
| 2,848
| 2,567
|
Total investment income
| 4,515,934
| 3,844,181
| 2,114,935
|
Expenses: | | | |
Advisory agreement fees
| 574,699
| 676,140
| 994,038
|
Service agreement fees
| 299,523
| 443,825
| 374,784
|
Audit fees
| 19,972
| 19,908
| 19,908
|
Trustees’ fees
| 11,796
| 15,043
| 15,115
|
Distribution fees – Class B
| 158,848
| 79,858
| 77,483
|
Shareholder servicing fees – Class A
| 168,089
| 126,237
| 98,745
|
Shareholder servicing fees – Class B
| 52,949
| 26,619
| 25,828
|
Total expenses before reimbursement
| 1,285,876
| 1,387,630
| 1,605,901
|
Less reimbursement
| (154,461)
| (5,566)
| (144,730)
|
Total expenses net of reimbursement
| 1,131,415
| 1,382,064
| 1,461,171
|
Net Investment Income (Loss)
| 3,384,519
| 2,462,117
| 653,764
|
Net Realized and Unrealized Gain (Loss) on Investments | | | |
Net realized loss on investments (including net realized gain (loss) on foreign currency related transactions)1 | | | |
Unaffiliated issuers
| (14,421,210)
| (19,479,396)
| (18,703,861)
|
Net change in unrealized appreciation on investments (including a net unrealized appreciation (depreciation) on foreign currency related transactions)2
| 16,427,702
| 21,040,702
| 42,903,330
|
Net Realized and Unrealized Gain on Investments
| 2,006,492
| 1,561,306
| 24,199,469
|
Net Increase in Net Assets from Operations
| $5,391,011
| $4,023,423
| $24,853,233
|
1 | Includes foreign capital gains taxes paid of $16,476 for the International Stock Fund.
|
2 | Net of deferred foreign capital gains taxes of $1,967 for the International Stock Fund.
|
See accompanying Notes to Financial Statements.
66
Statements of Operations for the Year Ended October 31, 2009
Mid Cap
Value Fund | Mid Cap
Growth Fund | Small Cap
Value Fund | Small Cap
Growth Fund | International
Stock Fund |
| | | | | |
$ 6,634
| $ 6,260
| $ 3,937
| $ 2,604
| $ 30,129
|
| | | | | |
745,484
| 289,445
| 343,611
| 110,970
| 4,523,262
|
(375)
| (2,080)
| –
| –
| (381,832)
|
591
| 629
| –
| –
| 507
|
752,334
| 294,254
| 347,548
| 113,574
| 4,172,066
|
| | | | | |
272,767
| 279,988
| 172,143
| 133,995
| 1,280,031
|
157,849
| 182,006
| 82,089
| 77,785
| 477,914
|
20,696
| 19,356
| 20,092
| 20,092
| 27,541
|
5,394
| 5,696
| 4,293
| 3,979
| 14,412
|
45,752
| 30,602
| 573
| 417
| 37,766
|
49,525
| 36,404
| 2,489
| 745
| 48,300
|
15,250
| 10,201
| 191
| 139
| 12,589
|
567,233
| 564,253
| 281,870
| 237,152
| 1,898,553
|
(126,516)
| (57,730)
| (63,438)
| (68,358)
| (154,143)
|
440,717
| 506,523
| 218,432
| 168,794
| 1,744,410
|
311,617
| (212,269)
| 129,116
| (55,220)
| 2,427,656
|
| | | | | |
| | | | | |
| |
(9,236,966)
| (12,037,896)
| (1,830,712)
| (6,258,063)
| (22,836,035)
|
| | | | | |
11,981,862
| 20,149,167
| 4,873,179
| 6,223,052
| 49,194,079
|
2,744,896
| 8,111,271
| 3,042,467
| (35,011)
| 26,358,044
|
$3,056,513
| $7,899,002
| $3,171,583
| $(90,231)
| $28,785,700
|
See accompanying Notes to Financial Statements.
67
Statements of Changes in Net Assets
| | Conservative Allocation Fund
|
Year Ended October 31, | 2009
| 2008
|
Net Assets at beginning of period
| $27,457,417
| $20,175,979
|
Increase (decrease) in net assets from operations: | | |
Net investment income (loss)
| 786,646
| 688,461
|
Net realized loss
| (2,354,472)
| (1,310,854)
|
Net change in unrealized appreciation (depreciation)
| 5,774,390
| (6,508,819)
|
Net increase (decrease) in net assets from operations
| 4,206,564
| (7,131,212)
|
Distributions to shareholders from: | | |
Net investment income
| | |
Class A
| (1,001,065)
| (399,196)
|
Class B
| (191,959)
| (77,260)
|
Class C
| (83,851)
| –
|
Net realized gains
| | |
Class A
| –
| (49,980)
|
Class B
| –
| (13,959)
|
Total distributions
| (1,276,875)
| (540,395)
|
Capital Stock transactions: | | |
Class A Shares | | |
Shares sold
| 9,874,441
| 15,611,812
|
Issued to shareholders in reinvestment of distributions
| 991,489
| 444,548
|
Shares redeemed
| (5,565,678)
| (6,646,140)
|
Net increase from capital stock transactions
| 5,300,252
| 9,410,220
|
Class B Shares | | |
Shares sold
| 2,290,041
| 4,473,474
|
Issued to shareholders in reinvestment of distributions
| 189,510
| 89,168
|
Shares redeemed
| (2,216,154)
| (1,688,492)
|
Net increase from capital stock transactions
| 263,397
| 2,874,150
|
Class C Shares1 | | |
Shares sold
| 1,633,492
| 2,945,126
|
Issued to shareholders in reinvestment of distributions
| 83,576
| –
|
Shares redeemed
| (743,831)
| (276,451)
|
Net increase from capital stock transactions
| 973,237
| 2,668,675
|
Total increase (decrease) in net assets
| 9,466,575
| 7,281,438
|
Net Assets at end of period
| $36,923,992
| $27,457,417
|
Undistributed net investment income
| $ 88,494
| $ 541,525
|
Capital Share transactions: | | |
Class A Shares | | |
Shares sold
| 1,145,414
| 1,506,343
|
Issued to shareholders in reinvestment of distributions
| 116,698
| 41,781
|
Shares redeemed
| (663,437)
| (669,741)
|
Net increase from capital stock transactions
| 598,675
| 878,383
|
Class B Shares | | |
Shares sold
| 263,886
| 436,991
|
Issued to shareholders in reinvestment of distributions
| 22,362
| 8,372
|
Shares redeemed
| (262,599)
| (173,117)
|
Net increase from capital stock transactions
| 23,649
| 272,246
|
Class C Shares1 | | |
Shares sold
| 185,898
| 288,170
|
Issued to shareholders in reinvestment of distributions
| 9,841
| –
|
Shares redeemed
| (89,769)
| (29,172)
|
Net increase from capital stock transactions
| 105,970
| 258,998
|
1 | Class C shares commenced investment operations on February 29, 2008.
|
See accompanying Notes to Financial Statements.
68
Statements of Changes in Net Assets
Moderate Allocation Fund
| Aggressive Allocation Fund
|
2009
| 2008
| 2009
| 2008
|
$70,203,036
| $76,137,458
| $21,254,380
| $26,058,356
|
| | | | |
1,277,060
| 982,885
| 209,218
| (40,895)
|
(8,133,079)
| (5,126,914)
| (2,893,316)
| (1,831,708)
|
16,999,492
| (27,654,200)
| 6,383,193
| (12,109,445)
|
10,143,473
| (31,798,229)
| 3,699,095
| (13,982,048)
|
| | | | |
| | | | |
(983,056)
| (878,404)
| (76,578)
| (205,602)
|
(218,911)
| (161,220)
| –
| (26,790)
|
(23,963)
| –
| –
| –
|
| | | | |
–
| (377,095)
| –
| (151,810)
|
–
| (135,542)
| –
| (60,949)
|
(1,225,930)
| (1,552,261)
| (76,578)
| (445,151)
|
| | | | |
| | | | |
17,769,059
| 35,265,296
| 6,876,110
| 11,668,989
|
978,110
| 1,249,257
| 76,555
| 357,240
|
(10,972,268)
| (18,328,636)
| (2,722,016)
| (5,648,103)
|
7,774,901
| 18,185,917
| 4,230,649
| 6,378,126
|
| | | | |
5,580,531
| 10,912,216
| 1,963,764
| 4,238,934
|
217,667
| 294,553
| –
| 87,324
|
(5,354,642)
| (4,891,467)
| (1,431,446)
| (1,409,196)
|
443,556
| 6,315,302
| 532,318
| 2,917,062
|
| | | | |
1,233,059
| 3,234,664
| 283,975
| 457,990
|
19,723
| –
| –
| –
|
(645,441)
| (319,815)
| (81,021)
| (129,955)
|
607,341
| 2,914,849
| 202,954
| 328,035
|
17,743,341
| (5,934,422)
| 8,588,438
| (4,803,976)
|
$87,946,377
| $70,203,036
| $29,842,818
| $21,254,380
|
$ 653,157
| $ 557,239
| $ 137,731
| $ –
|
| | | | |
| | | | |
2,270,585
| 3,363,454
| 982,720
| 1,108,171
|
129,038
| 111,940
| 11,358
| 30,559
|
(1,445,643)
| (1,825,199)
| (392,225)
| (549,883)
|
953,980
| 1,650,195
| 601,853
| 588,847
|
| | | | |
718,101
| 1,049,059
| 294,040
| 403,281
|
28,716
| 26,370
| –
| 7,470
|
(700,659)
| (489,243)
| (209,811)
| (141,655)
|
46,158
| 586,186
| 84,229
| 269,096
|
| | | | |
162,462
| 309,434
| 37,993
| 45,361
|
2,599
| –
| –
| –
|
(85,898)
| (33,981)
| (11,902)
| (13,169)
|
79,163
| 275,453
| 26,091
| 32,192
|
See accompanying Notes to Financial Statements.
69
Statements of Changes in Net Assets
| | Cash Reserves Fund
| Bond Fund
|
Year Ended October 31, | 2009
| 2008
| 2009
| 2008
|
Net Assets at beginning of period
| $19,993,920
| $15,273,440
| $158,865,643
| $116,319,967
|
Increase (decrease) in net assets from operations: | | | | |
Net investment income (loss)
| 11,745
| 345,262
| 5,824,879
| 5,390,588
|
Net realized loss
| –
| 4,965
| (867,253)
| 624,098
|
Net change in unrealized appreciation (depreciation)
| –
| –
| 12,348,829
| (5,684,534)
|
Net increase (decrease) in net assets from operations
| 11,745
| 350,227
| 17,306,455
| 330,152
|
Distributions to shareholders from: | | | | |
Net investment income
| | | | |
Class A
| (11,307)
| (303,598)
| (1,241,362)
| (1,896,994)
|
Class B
| (1,184)
| (46,606)
| (291,620)
| (715,960)
|
Class Y1
| –
| –
| (4,227,238)
| (2,751,642)
|
Net realized gains
| | | | |
Class A
| –
| (125)
| –
| –
|
Class B
| –
| (27)
| –
| –
|
Class Y1
| –
| –
| –
| –
|
Total distributions
| (12,491)
| (350,356)
| (5,760,220)
| (5,364,596)
|
Capital Stock transactions: | | | | |
Class A Shares | | | | |
Shares sold
| 15,542,671
| 15,638,721
| 11,176,349
| 10,394,745
|
Issued to shareholders in reinvestment of distributions
| 10,817
| 293,901
| 1,148,936
| 1,768,098
|
Shares redeemed
| (17,202,306)
| (13,087,180)
| (8,718,615)
| (28,507,600)
|
Net increase (decrease) from capital stock transactions
| (1,648,818)
| 2,845,442
| 3,606,670
| (16,344,757)
|
Class B Shares
| | | | |
Shares sold
| 3,595,448
| 5,279,879
| 1,331,858
| 1,593,685
|
Issued to shareholders in reinvestment of distributions
| 406
| 44,083
| 276,664
| 656,046
|
Shares redeemed
| (4,999,956)
| (3,448,795)
| (9,093,553)
| (12,342,849)
|
Net increase (decrease) from capital stock transactions
| (1,404,102)
| 1,875,167
| (7,485,031)
| (10,093,118)
|
Class Y Shares1 | | | | |
Shares sold
| –
| –
| 42,940,604
| 79,997,820
|
Issued to shareholders in reinvestment of distributions
| –
| –
| 4,227,238
| 2,751,681
|
Shares redeemed
| –
| –
| (13,094,280)
| (8,731,506)
|
Net increase from capital stock transactions
| –
| –
| 34,073,562
| 74,017,995
|
Total increase (decrease) in net assets
| (3,053,666)
| 4,720,480
| 41,741,436
| 42,545,676
|
Net Assets at end of period
| $16,940,254
| $19,993,920
| $200,607,079
| $158,865,643
|
Undistributed (distribution in excess of) net investment income
| $ –
| $ –
| $ 35,221
| $ 5
|
Capital Share transactions: | | | | |
Class A Shares | | | | |
Shares sold
| 15,542,671
| 15,638,721
| 1,126,923
| 1,058,004
|
Issued to shareholders in reinvestment of distributions
| 10,817
| 293,901
| 115,519
| 179,862
|
Shares redeemed
| (17,202,305)
| (13,087,180)
| (879,526)
| (2,892,596)
|
Net increase (decrease) from capital stock transactions
| (1,648,817)
| 2,845,442
| 362,916
| (1,654,730)
|
Class B Shares | | | | |
Shares sold
| 3,595,448
| 5,279,879
| 134,267
| 161,874
|
Issued to shareholders in reinvestment of distributions
| 406
| 44,083
| 27,853
| 66,715
|
Shares redeemed
| (4,999,956)
| (3,448,795)
| (918,307)
| (1,256,678)
|
Net increase (decrease) from capital stock transactions
| (1,404,102)
| 1,875,167
| (756,187)
| (1,028,089)
|
Class Y Shares1 | | | | |
Shares sold
| –
| –
| 4,352,678
| 8,163,090
|
Issued to shareholders in reinvestment of distributions
| –
| –
| 425,037
| 281,914
|
Shares redeemed
| –
| –
| (1,311,135)
| (888,752)
|
Net increase from capital stock transactions
| –
| –
| 3,466,580
| 7,556,252
|
1 | The Cash Reserves and Diversified Income Funds do not have Class Y shares.
|
See accompanying Notes to Financial Statements.
70
Statements of Changes in Net Assets
High Income Fund
| Diversified Income Fund
| Large Cap Value Fund
| Large Cap Growth Fund
|
2009
| 2008
| 2009
| 2008
| 2009
| 2008
| 2009
| 2008
|
$56,777,753
| $68,980,447
| $98,250,592
| $147,834,569
| $127,895,631
| $207,452,538
| $122,320,504
| $157,211,269
|
| | | | | | | | |
6,914,561
| 4,848,528
| 3,384,519
| 4,602,628
| 2,462,117
| 2,952,457
| 653,764
| 339,034
|
(2,161,856)
| (4,598,445)
| (14,421,210)
| (3,745,402)
| (19,479,396)
| (9,823,899)
| (18,703,861)
| (17,320,713)
|
18,740,825
| (12,227,122)
| 16,427,702
| (20,987,228)
| 21,040,702
| (65,248,186)
| 42,903,330
| (50,815,871)
|
23,493,530
| (11,977,039)
| 5,391,011
| (20,130,002)
| 4,023,423
| (72,119,628)
| 24,853,233
| (67,797,550)
|
| | | | | | | | |
| | | | | | | | |
(1,626,719)
| (2,322,208)
| (2,888,214)
| (3,364,864)
| (1,200,577)
| (1,320,422)
| (58,214)
| –
|
(334,392)
| (560,090)
| (777,732)
| (1,207,464)
| (204,938)
| (174,455)
| –
| –
|
(4,952,607)
| (2,742,238)
| –
| –
| (1,409,386)
| (758,013)
| (278,337)
| –
|
| | | | | | | | |
–
| –
| –
| (6,854,069)
| –
| (660,475)
| –
| –
|
–
| –
| –
| (4,074,977)
| –
| (233,526)
| –
| –
|
–
| –
| –
| –
| –
| (313,669)
| –
| –
|
(6,913,718)
| (5,624,536)
| (3,665,946)
| (15,501,374)
| (2,814,901)
| (3,460,560)
| (336,551)
| –
|
| | | | | | | | |
| | | | | | | | |
7,675,232
| 3,558,947
| 10,812,642
| 15,917,465
| 6,138,032
| 13,194,066
| 6,947,131
| 13,364,526
|
1,309,344
| 1,974,564
| 2,816,920
| 10,047,835
| 1,184,777
| 1,958,639
| 57,588
| –
|
(4,956,777)
| (16,819,361)
| (14,420,396)
| (22,432,868)
| (10,339,002)
| (34,236,926)
| (7,200,938)
| (19,439,625)
|
4,027,799
| (11,285,850)
| (790,834)
| 3,532,432
| (3,016,193)
| (19,084,221)
| (196,219)
| (6,075,099)
|
| | | | | | | | |
416,638
| 330,561
| 1,333,130
| 1,418,958
| 619,912
| 995,506
| 952,928
| 1,519,308
|
272,825
| 461,391
| 763,172
| 5,200,379
| 202,297
| 402,492
| –
| –
|
(2,686,435)
| (5,189,553)
| (11,945,257)
| (24,104,370)
| (5,458,245)
| (17,723,909)
| (6,239,507)
| (14,275,116)
|
(1,996,972)
| (4,397,601)
| (9,848,955)
| (17,485,033)
| (4,636,036)
| (16,325,911)
| (5,286,579)
| (12,755,808)
|
| | | | | | | | |
33,447,327
| 29,114,432
| –
| –
| 29,078,385
| 60,649,483
| 25,528,207
| 76,318,986
|
4,952,607
| 2,742,238
| –
| –
| 1,409,386
| 1,071,682
| 278,337
| –
|
(2,999,088)
| (10,774,338)
| –
| –
| (7,893,755)
| (30,287,752)
| (5,708,022)
| (24,581,294)
|
35,400,846
| 21,082,332
| –
| –
| 22,594,016
| 31,433,413
| 20,098,522
| 51,737,692
|
54,011,485
| (12,202,694)
| (8,914,724)
| (49,583,977)
| 16,150,309
| (79,556,907)
| 39,132,406
| (34,890,765)
|
$110,789,238
| $56,777,753
| $89,335,868
| $98,250,592
| $144,045,940
| $127,895,631
| $161,452,910
| $122,320,504
|
$ 8,947
| $ 9,973
| $ 4,780)
| $310,574
| $1,884,254
| $2,275,325
| $ 5,507
| $ 6,379
|
| | | | | | | | |
| | | | | | | | |
1,266,566
| 518,275
| 1,134,694
| 1,378,193
| 650,460
| 911,422
| 621,666
| 874,317
|
213,932
| 291,267
| 295,353
| 854,496
| 125,639
| 122,876
| 5,713
| –
|
(823,867)
| (2,494,034)
| (1,515,443)
| (1,981,722)
| (1,119,652)
| (2,440,255)
| (656,271)
| (1,318,504)
|
656,631
| (1,684,492)
| (85,396)
| 250,967
| (343,553)
| (1,405,957)
| (28,892)
| (444,187)
|
| | | | | | | | |
67,990
| 47,766
| 139,456
| 122,707
| 67,117
| 71,453
| 85,350
| 108,812
|
44,515
| 67,970
| 79,929
| 437,633
| 21,706
| 25,539
| –
| –
|
(449,316)
| (754,578)
| (1,252,310)
| (2,080,560)
| (599,944)
| (1,255,090)
| (609,413)
| (1,008,447)
|
(336,811)
| (638,842)
| (1,032,925)
| (1,520,220)
| (511,121)
| (1,158,098)
| (524,063)
| (899,635)
|
| | | | | | | | |
5,834,491
| 4,239,511
| –
| –
| 3,079,972
| 4,309,888
| 2,215,241
| 5,011,289
|
807,800
| 411,895
| –
| –
| 149,616
| 67,274
| 27,504
| –
|
(509,611)
| (1,586,155)
| –
| –
| (816,317)
| (2,045,540)
| (504,960)
| (1,735,170)
|
6,132,680
| 3,065,251
| –
| –
| 2,413,271
| 2,331,622
| 1,737,785
| 3,276,119
|
See accompanying Notes to Financial Statements.
71
Statements of Changes in Net Assets
| | Mid Cap Value Fund
| Mid Cap Growth Fund
|
Year Ended October 31, | 2009
| 2008
| 2009
| 2008
|
Net Assets at beginning of period
| $31,186,859
| $80,535,127
| $36,781,465
| $79,687,951
|
Increase (decrease) in net assets from operations: | | | | |
Net investment income (loss)
| 311,617
| 545,738
| (212,269)
| (371,226)
|
Net realized loss
| (9,236,966)
| (6,255,171)
| (12,037,896)
| (9,479,633)
|
Net change in unrealized appreciation (depreciation)
| 11,981,862
| (18,091,854)
| 20,149,167
| (23,793,516)
|
Net increase (decrease) in net assets from operations
| 3,056,513
| (23,801,287)
| 7,899,002
| (33,644,375)
|
Distributions to shareholders from: | | | | |
Net investment income
| | | | |
Class A
| (254,180)
| (156,311)
| –
| –
|
Class B
| (48,758)
| –
| –
| –
|
Class Y
| (50,165)
| (134,542)
| –
| –
|
Net realized gains
| | | | |
Class A
| –
| (3,770,988)
| –
| (228,134)
|
Class B
| –
| (2,115,277)
| –
| (94,788)
|
Class Y
| –
| (2,032,161)
| –
| (254,772)
|
Total distributions
| (353,103)
| (8,209,279)
| –
| (577,694)
|
Capital Stock transactions: | | | | |
Class A Shares | | | | |
Shares sold
| 4,406,602
| 5,135,953
| 2,526,510
| 3,723,794
|
Issued to shareholders in reinvestment of distributions
| 250,019
| 3,870,252
| –
| 225,949
|
Shares redeemed
| (3,610,454)
| (11,702,810)
| (2,663,291)
| (9,851,778)
|
Redemption fees
| –
| –
| –
| –
|
Net increase (decrease) from capital stock transactions
| 1,046,167
| (2,696,605)
| (136,781)
| (5,902,035)
|
Class B Shares | | | | |
Shares sold
| 303,033
| 522,392
| 275,215
| 494,605
|
Issued to shareholders in reinvestment of distributions
| 47,960
| 2,080,810
| –
| 93,382
|
Shares redeemed
| (3,610,803)
| (7,373,728)
| (1,591,457)
| (4,390,443)
|
Redemption fees
| –
| –
| –
| –
|
Net increase (decrease) from capital stock transactions
| (3,259,810)
| (4,770,526)
| (1,316,242)
| (3,802,456)
|
Class Y Shares | | | | |
Shares sold
| 360,000
| 9,066,917
| 3,874,233
| 29,331,036
|
Issued to shareholders in reinvestment of distributions
| 50,165
| 2,166,703
| –
| 254,772
|
Shares redeemed
| (2,135,000)
| (21,104,191)
| (2,343,834)
| (28,565,734)
|
Net increase (decrease) from capital stock transactions
| (1,724,835)
| (9,870,571)
| 1,530,399
| 1,020,074
|
Total increase (decrease) in net assets
| (1,235,068)
| (49,348,268)
| 7,976,378
| (42,906,486)
|
Net Assets at end of period
| $29,951,791
| $31,186,859
| $44,757,843
| $36,781,465
|
Undistributed net investment income
| $ 9,340
| $ 6,254
| $ –
| $ –
|
Capital Share transactions: | | | | |
Class A Shares | | | | |
Shares sold
| 602,296
| 467,772
| 643,331
| 591,601
|
Issued to shareholders in reinvestment of distributions
| 36,118
| 324,686
| –
| 31,824
|
Shares redeemed
| (501,468)
| (1,100,072)
| (667,593)
| (1,627,795)
|
Net increase (decrease) from capital stock transactions
| 136,946
| (307,614)
| (24,262)
| (1,004,370)
|
Class B Shares | | | | |
Shares sold
| 44,911
| 50,842
| 74,972
| 85,331
|
Issued to shareholders in reinvestment of distributions
| 7,324
| 183,655
| –
| 13,938
|
Shares redeemed
| (529,745)
| (715,538)
| (433,851)
| (754,271)
|
Net increase (decrease) from capital stock transactions
| (477,510)
| (481,041)
| (358,879)
| (655,002)
|
Class Y Shares | | | | |
Shares sold
| 50,764
| 803,023
| 964,078
| 4,610,312
|
Issued to shareholders in reinvestment of distributions
| 7,167
| 181,770
| –
| 35,733
|
Shares redeemed
| (262,669)
| (1,938,357)
| (574,735)
| (4,719,320)
|
Net increase (decrease) from capital stock transactions
| (204,738)
| (953,564)
| 389,343
| (73,275)
|
See accompanying Notes to Financial Statements.
72
Statements of Changes in Net Assets
Small Cap Value Fund
| Small Cap Growth Fund
| International Stock Fund
|
2009
| 2008
| 2009
| 2008
| 2009
| 2008
|
$14,403,112
| $21,246,589
| $13,123,695
| $25,140,687
| $106,846,107
| $128,300,707
|
| | | | | | |
129,116
| 157,293
| (55,220)
| (108,324)
| 2,427,656
| 2,473,011
|
(1,830,712)
| (1,740,564)
| (6,258,063)
| (4,245,236)
| (22,836,035)
| 1,434,590
|
4,873,179
| (4,253,182)
| 6,223,052
| (6,697,805)
| 49,194,079
| (66,782,961)
|
3,171,583
| (5,836,453)
| (90,231)
| (11,051,365)
| 28,785,700
| (62,875,360)
|
| | | | | | |
| | | | | | |
(1,934)
| (29,762)
| –
| –
| (359,378)
| (744,049)
|
–
| –
| –
| –
| (68,725)
| (103,291)
|
(129,838)
| (128,498)
| –
| –
| (1,887,954)
| (569,819)
|
| | | | | | |
–
| (105,139)
| –
| (67,567)
| (473,176)
| (7,754,716)
|
–
| (3,496)
| –
| (2,008)
| (148,222)
| (2,225,021)
|
–
| (301,331)
| –
| (240,764)
| (2,206,294)
| (5,070,159)
|
(131,772)
| (568,226)
| –
| (310,339)
| (5,143,749)
| (16,467,055)
|
| | | | | | |
| | | | | | |
311,355
| 316,582
| 190,900
| 327,437
| 3,498,228
| 6,525,825
|
1,934
| 134,900
| –
| 67,567
| 813,053
| 6,944,808
|
(79,716)
| (4,666,884)
| (135,562)
| (4,920,640)
| (3,587,179)
| (22,521,530)
|
11
| 200
| 6
| –
| 304
| 544
|
233,584
| (4,215,202)
| 55,344
| (4,525,636)
| 724,406
| (9,050,353)
|
| | | | | | |
65,752
| 32,966
| 42,248
| 47,663
| 375,596
| 1,275,508
|
–
| 3,443
| –
| 2,008
| 214,432
| 2,246,164
|
(45,226)
| (127,221)
| (8,515)
| (119,343)
| (2,363,220)
| (5,554,919)
|
190
| 142
| –
| –
| 402
| 342
|
20,716
| (90,670)
| 33,733
| (69,672)
| (1,772,790)
| (2,032,905)
|
| | | | | | |
4,777,423
| 5,700,886
| 3,190,043
| 13,190,178
| 22,273,702
| 100,890,199
|
129,838
| 429,829
| –
| 240,764
| 4,094,248
| 5,639,978
|
(814,342)
| (2,263,641)
| (879,944)
| (9,490,922)
| (7,417,436)
| (37,559,104)
|
4,092,919
| 3,867,074
| 2,310,099
| 3,940,020
| 18,950,514
| 68,971,073
|
7,387,030
| (6,843,477)
| 2,308,945
| (12,016,992)
| 41,544,081
| (21,454,600)
|
$21,790,142
| $14,403,112
| $15,432,640
| $13,123,695
| $148,390,188
| $106,846,107
|
$ 7,176
| $ 6,221
| $ –
| $ –
| $2,151,328
| $2,029,577
|
| | | | | | |
| | | | | | |
47,485
| 37,006
| 35,400
| 33,608
| 419,009
| 501,204
|
301
| 13,808
| –
| 6,309
| 100,725
| 501,066
|
(11,000)
| (518,508)
| (22,156)
| (530,434)
| (443,478)
| (1,812,116)
|
36,786
| (467,694)
| 13,244
| (490,517)
| 76,256
| (809,846)
|
| | | | | | |
9,980
| 3,635
| 8,053
| 5,152
| 40,034
| 99,308
|
–
| 353
| –
| 189
| 26,897
| 163,834
|
(6,967)
| (14,213)
| (1,650)
| (14,128)
| (292,790)
| (444,807)
|
3,013
| (10,225)
| 6,403
| (8,787)
| (225,859)
| (181,665)
|
| | | | | | |
741,668
| 611,780
| 592,417
| 1,391,768
| 2,842,866
| 8,130,185
|
20,319
| 44,040
| –
| 22,438
| 507,971
| 407,219
|
(122,737)
| (256,048)
| (162,127)
| (1,067,965)
| (887,772)
| (2,462,120)
|
639,250
| 399,772
| 430,290
| 346,241
| 2,463,065
| 6,075,284
|
See accompanying Notes to Financial Statements.
73
Financial Highlights for a Share of Beneficial Interest Outstanding
CONSERVATIVE ALLOCATION FUND |
| | Year Ended October 31,
| Inception
to 10/31/061 |
| | 2009
| 2008
| 2007
| |
CLASS A
| | | | |
Net Asset Value at beginning of period
| $8.53
| $11.13
| $10.53
| $10.00
|
Income from Investment Operations: | | | | |
Net investment income
| 0.24
| 0.28
| 0.24
| 0.05
|
Net realized and unrealized gain (loss) on investments
| 0.98
| (2.58)
| 0.49
| 0.48
|
Total from investment operations
| 1.22
| (2.30)
| 0.73
| 0.53
|
Less Distributions: | | | | |
Distributions from net investment income
| (0.41)
| (0.27)
| (0.12)
| –
|
Distributions from capital gains
| -
| (0.03)
| (0.01)
| –
|
Total distributions
| (0.41)
| (0.30)
| (0.13)
| –
|
Net increase (decrease) in net asset value
| 0.81
| (2.60)
| 0.60
| 0.53
|
Net Asset Value at end of period
| $9.34
| $8.53
| $11.13
| $10.53
|
Total Return (%)2 | 14.91
| (21.19)
| 6.94
| 5.303 |
Ratios/Supplemental Data: | | | | |
Net Assets at end of period (in 000’s)
| $27,225
| $19,753
| $16,003
| $3,031
|
Ratios of expenses to average net assets:
| | | | |
Before reimbursement of expenses by Adviser (%)
| 0.92
| 1.14
| 1.79
| 10.534 |
After reimbursement of expenses by Adviser (%)
| 0.70
| 0.70
| 0.70
| 0.704 |
Ratio of net investment income to average net assets
| | | | |
After reimbursement of expenses by Adviser (%)
| 2.80
| 2.75
| 3.00
| 2.784 |
Portfolio Turnover (%)5 | 38
| 90
| 39
| 263 |
CLASS B
| | | | |
Net Asset Value at beginning of period
| $8.48
| $11.07
| $10.51
| $10.00
|
Income from Investment Operations: | | | | |
Net investment income
| 0.18
| 0.18
| 0.17
| 0.02
|
Net realized and unrealized gain (loss) on investments
| 0.98
| (2.55)
| 0.48
| 0.49
|
Total from investment operations
| 1.16
| (2.37)
| 0.65
| 0.51
|
Less Distributions: | | | | |
Distributions from net investment income
| (0.30)
| (0.19)
| (0.08)
| –
|
Distributions from capital gains
| –
| (0.03)
| (0.01)
| –
|
Total distributions
| (0.30)
| (0.22)
| (0.09)
| –
|
Net increase (decrease) in net asset value
| 0.86
| (2.59)
| 0.56
| 0.51
|
Net Asset Value at end of period
| $9.34
| $8.48
| $11.07
| $10.51
|
Total Return (%)2 | 14.09
| (21.82)
| 6.16
| 5.103 |
Ratios/Supplemental Data: | | | | |
Net Assets at end of period (in 000’s)
| $6,287
| $5,506
| $4,173
| $ 622
|
Ratios of expenses to average net assets:
| | | | |
Before reimbursement of expenses by Adviser (%)
| 1.68
| 1.89
| 2.53
| 10.214 |
After reimbursement of expenses by Adviser (%)
| 1.45
| 1.45
| 1.45
| 1.454 |
Ratio of net investment income to average net assets
| | | | |
After reimbursement of expenses by Adviser (%)
| 2.16
| 2.01
| 2.01
| 2.204 |
Portfolio Turnover (%)5 | 38
| 90
| 39
| 263 |
1 | Commenced investment operations June 30, 2006.
|
2 | Total return without applicable sales charge.
|
3 | Not annualized.
|
4 | Annualized.
|
5 | Portfolio Turnover is calculated at the fund level and represents the entire fiscal year or period.
|
See accompanying Notes to Financial Statements.
74
Financial Highlights for a Share of Beneficial Interest Outstanding
CONSERVATIVE ALLOCATION FUND |
| | Year Ended October 31,
| Inception
to 10/31/082 |
| | 2009
|
CLASS C
| | |
Net Asset Value at beginning of period
| $8.48
| $10.47
|
Income from Investment Operations: | | |
Net investment income
| 0.16
| 0.03
|
Net realized and unrealized gain (loss) on investments
| 1.01
| (2.02)
|
Total from investment operations
| 1.17
| (1.99)
|
Less Distributions: | | |
Distributions from net investment income
| (0.30)
| –
|
Total distributions
| (0.30)
| –
|
Net increase (decrease) in net asset value
| 0.87
| (1.99)
|
Net Asset Value at end of period
| $9.35
| $8.48
|
Total Return (%)3 | 14.21
| (19.01)4 |
Ratios/Supplemental Data: | | |
Net Assets at end of period (in 000’s)
| $3,412
| $2,198
|
Ratios of expenses to average net assets:
| | |
Before reimbursement of expenses by Adviser (%)
| 1.87
| 2.675 |
After reimbursement of expenses by Adviser (%)
| 1.45
| 1.455 |
Ratio of net investment income to average net assets
| | |
After reimbursement of expenses by Adviser (%)
| 2.03
| 0.605 |
Portfolio Turnover (%)7 | 38
| 904 |
MODERATE ALLOCATION FUND |
| | Year Ended October 31,
| Inception
to 10/31/061 |
| | 2009
| 2008
| 2007
| |
CLASS A
| | | | |
Net Asset Value at beginning of period
| $7.84
| $11.82
| $10.65
| $10.00
|
Income from Investment Operations: | | | | |
Net investment income
| 0.15
| 0.16
| 0.17
| 0.02
|
Net realized and unrealized gain (loss) on investments
| 0.93
| (3.88)
| 0.12
| 0.63
|
Total from investment operations
| 1.08
| (3.72)
| 1.29
| 0.65
|
Less Distributions: | | | | |
Distributions from net investment income
| (0.15)
| (0.18)
| (0.12)
| –
|
Distributions from capital gains
| –
| (0.08)
| (0.00)6 | –
|
Total distributions
| (0.15)
| (0.26)
| (0.12)
| –
|
Net increase (decrease) in net asset value
| 0.93
| (3.98)
| 1.17
| 0.65
|
Net Asset Value at end of period
| $8.77
| $7.84
| $11.82
| $10.65
|
Total Return (%)3 | 14.12
| (32.18)
| 12.26
| 6.504 |
Ratios/Supplemental Data: | | | | |
Net Assets at end of period (in 000’s)
| $64,631
| $50,326
| $56,312
| $8,762
|
Ratios of expenses to average net assets:
| | | | |
Before reimbursement of expenses by Adviser (%)
| 0.78
| 0.79
| 0.89
| 4.735 |
After reimbursement of expenses by Adviser (%)
| 0.70
| 0.70
| 0.70
| 0.705 |
Ratio of net investment income to average net assets
| | | | |
After reimbursement of expenses by Adviser (%)
| 1.93
| 1.41
| 1.45
| 1.345 |
Portfolio Turnover (%)7 | 30
| 83
| 21
| 114 |
1 | Commenced investment operations June 30, 2006.
| 5 | Annualized.
|
2 | Commenced investment operations February 29, 2008.
| 6 | Amounts represent less than $0.005 per share.
|
3 | Total return without applicable sales charge.
| 7 | Portfolio Turnover is calculated at the fund level and represents the entire fiscal year or period.
|
4 | Not annualized.
| | |
See accompanying Notes to Financial Statements.
75
Financial Highlights for a Share of Beneficial Interest Outstanding
MODERATE ALLOCATION FUND |
| | Year Ended October 31,
| Inception
to 10/31/061 |
| | 2009
| 2008
| 2007
| |
CLASS B
| | | | |
Net Asset Value at beginning of period
| $7.80
| $11.75
| $10.63
| $10.00
|
Income from Investment Operations: | | | | |
Net investment income
| 0.10
| 0.06
| 0.09
| 0.01
|
Net realized and unrealized gain (loss) on investments
| 0.92
| (3.84)
| 1.11
| 0.62
|
Total from investment operations
| 1.02
| (3.78)
| 1.20
| 0.63
|
Less Distributions: | | | | |
Distributions from net investment income
| (0.10)
| (0.09)
| (0.08)
| –
|
Distributions from capital gains
| –
| (0.08)
| –
| –
|
Total distributions
| (0.10)
| (0.17)
| (0.08)
| –
|
Net increase (decrease) in net asset value
| 0.92
| (3.95)
| 1.12
| 0.63
|
Net Asset Value at end of period
| $8.72
| $7.80
| $11.75
| $10.63
|
Total Return (%)3 | 13.20
| (32.64)
| 11.38
| 6.304 |
Ratios/Supplemental Data: | | | | |
Net Assets at end of period (in 000’s)
| $20,221
| $17,728
| $19,825
| $3,289
|
Ratios of expenses to average net assets:
| | | | |
Before reimbursement of expenses by Adviser (%)
| 1.53
| 1.54
| 1.64
| 4.715 |
After reimbursement of expenses by Adviser (%)
| 1.45
| 1.45
| 1.45
| 1.455 |
Ratio of net investment income to average net assets
| | | | |
After reimbursement of expenses by Adviser (%)
| 1.26
| 0.66
| 0.63
| 0.675 |
Portfolio Turnover (%)6 | 30
| 83
| 21
| 114 |
| | Year Ended October 31,
| Inception
to 10/31/082 |
| | 2009
|
CLASS C
| | |
Net Asset Value at beginning of period
| $7.80
| $10.61
|
Income from Investment Operations: | | |
Net investment income
| 0.09
| 0.02
|
Net realized and unrealized gain (loss) on investments
| 0.93
| (2.83)
|
Total from investment operations
| 1.02
| (2.81)
|
Less Distributions: | | |
Distributions from net investment income
| (0.10)
| –
|
Distributions from capital gains
| –
| –
|
Total distributions
| (0.10)
| –
|
Net increase (decrease) in net asset value
| 0.92
| (2.81)
|
Net Asset Value at end of period
| $8.72
| $7.80
|
Total Return (%)3 | 13.20
| (26.48)4 |
Ratios/Supplemental Data: | | |
Net Assets at end of period (in 000’s)
| $3,094
| $2,149
|
Ratios of expenses to average net assets:
| | |
Before reimbursement of expenses by Adviser (%)
| 1.74
| 2.385 |
After reimbursement of expenses by Adviser (%)
| 1.45
| 1.455 |
Ratio of net investment income to average net assets
| | |
After reimbursement of expenses by Adviser (%)
| 0.98
| 0.395 |
Portfolio Turnover (%)6 | 30
| 834 |
1 | Commenced investment operations June 30, 2006.
|
2 | Commenced investment operations February 29, 2008.
|
3 | Total return without applicable sales charge.
|
4 | Not annualized.
|
5 | Annualized.
|
6 | Portfolio Turnover is calculated at the fund level and represents the entire fiscal year or period.
|
See accompanying Notes to Financial Statements.
76
Financial Highlights for a Share of Beneficial Interest Outstanding
AGGRESSIVE ALLOCATION FUND |
| | Year Ended October 31,
| Inception
to 10/31/061 |
| | 2009
| 2008
| 2007
| |
CLASS A
| | | | |
Net Asset Value at beginning of period
| $7.16
| $12.53
| $10.76
| $10.00
|
Income from Investment Operations: | | | | |
Net investment income
| 0.08
| 0.04
| 0.09
| (0.01)
|
Net realized and unrealized gain (loss) on investments
| 0.92
| (5.18)
| 1.83
| 0.77
|
Total from investment operations
| 1.00
| (5.14)
| 1.92
| 0.76
|
Less Distributions: | | | | |
Distributions from net investment income
| (0.04)
| (0.13)
| (0.15)
| –
|
Distributions from capital gains
| –
| (0.10)
| –
| –
|
Total distributions
| (0.04)
| (0.23)
| (0.15)
| –
|
Net increase (decrease) in net asset value
| 0.96
| (5.37)
| 1.77
| 0.76
|
Net Asset Value at end of period
| $8.12
| $7.16
| $12.53
| $10.76
|
Total Return (%)2 | 14.00
| (41.73)
| 18.00
| 7.603 |
Ratios/Supplemental Data: | | | | |
Net Assets at end of period (in 000’s)
| $21,855
| $14,975
| $18,824
| $2,675
|
Ratios of expenses to average net assets:
| | | | |
Before reimbursement of expenses by Adviser (%)
| 1.11
| 1.25
| 1.62
| 10.144 |
After reimbursement of expenses by Adviser (%)
| 0.70
| 0.70
| 0.70
| 0.704 |
Ratio of net investment income to average net assets
| | | | |
After reimbursement of expenses by Adviser (%)
| 1.06
| 0.09
| (0.33)
| (0.56)4 |
Portfolio Turnover (%)6 | 17
| 91
| 24
| 103 |
CLASS B
| | | | |
Net Asset Value at beginning of period
| $7.12
| $12.46
| $10.74
| $10.00
|
Income from Investment Operations: | | | | |
Net investment income
| 0.03
| (0.06)
| 0.005 | (0.01)
|
Net realized and unrealized gain (loss) on investments
| 0.90
| (5.14)
| 1.82
| 0.75
|
Total from investment operations
| 0.93
| (5.20)
| 1.82
| 0.74
|
Less Distributions: | | | | |
Distributions from net investment income
| –
| (0.04)
| (0.10)
| –
|
Distributions from capital gains
| –
| (0.10)
| –
| –
|
Total distributions
| –
| (0.14)
| (0.10)
| –
|
Net increase (decrease) in net asset value
| 0.93
| (5.34)
| 1.72
| 0.74
|
Net Asset Value at end of period
| $8.05
| $7.12
| $12.46
| $10.74
|
Total Return (%)2 | 13.06
| (42.17)
| 17.11
| 7.403 |
Ratios/Supplemental Data: | | | | |
Net Assets at end of period (in 000’s)
| $7,518
| $6,050
| $7,234
| $1,164
|
Ratios of expenses to average net assets:
| | | | |
Before reimbursement of expenses by Adviser (%)
| 1.88
| 2.00
| 2.38
| 10.074 |
After reimbursement of expenses by Adviser (%)
| 1.45
| 1.45
| 1.45
| 1.454 |
Ratio of net investment income to average net assets
| | | | |
After reimbursement of expenses by Adviser (%)
| 0.44
| (0.73)
| (1.06)
| (1.28)4 |
Portfolio Turnover (%)6 | 17
| 90
| 24
| 103 |
1 | Commenced investment operations June 30, 2006.
|
2 | Total return without applicable sales charge.
|
3 | Not annualized.
|
4 | Annualized.
|
5 | Amounts represent less than $0.005 per share.
|
6 | Portfolio Turnover is calculated at the fund level and represents the entire fiscal year or period.
|
See accompanying Notes to Financial Statements.
77
Financial Highlights for a Share of Beneficial Interest Outstanding
AGGRESSIVE ALLOCATION FUND |
| | Year Ended October 31,
| Inception
to 10/31/081 |
| | 2009
|
CLASS C
| | |
Net Asset Value at beginning of period
| $7.12
| $10.70
|
Income from Investment Operations: | | |
Net investment income
| 0.01
| (0.06)
|
Net realized and unrealized gain (loss) on investments
| 0.93
| (3.52)
|
Total from investment operations
| 0.94
| (3.58)
|
Net increase (decrease) in net asset value
| 0.94
| (3.58)
|
Net Asset Value at end of period
| $8.06
| $7.12
|
Total Return (%)2 | 13.20
| (33.46)3 |
Ratios/Supplemental Data: | | |
Net Assets at end of period (in 000’s)
| $470
| $ 229
|
Ratios of expenses to average net assets:
| | |
Before reimbursement of expenses by Adviser (%)
| 3.72
| 7.844 |
After reimbursement of expenses by Adviser (%)
| 1.45
| 1.454 |
Ratio of net investment income to average net assets
| | |
After reimbursement of expenses by Adviser (%)
| 0.28
| (1.23)4 |
Portfolio Turnover (%)6 | 17
| 913 |
CASH RESERVES FUND |
| | Year Ended October 31,
|
| | 2009
| 2008
| 2007
| 2006
| 2005
|
CLASS A
| | | | | |
Net Asset Value at beginning of period
| $1.00
| $1.00
| $1.00
| $1.00
| $1.00
|
Income from Investment Operations: | | | | | |
Net investment income
| 0.005 | 0.02
| 0.05
| 0.04
| 0.02
|
Total from investment operations
| 0.005 | 0.02
| 0.05
| 0.04
| 0.02
|
Less Distributions: | | | | | |
Distributions from net investment income
| (0.00)5 | (0.02)
| (0.05)
| (0.04)
| (0.02)
|
Total distributions
| (0.00)5 | (0.02)
| (0.05)
| (0.04)
| (0.02)
|
Net increase (decrease) in net asset value
| (0.00)5 | –
| –
| –
| –
|
Net Asset Value at end of period
| $1.00
| $1.00
| $1.00
| $1.00
| $1.00
|
Total Return (%)2 | 0.07
| 2.26
| 4.73
| 4.27
| 2.33
|
Ratios/Supplemental Data: | | | | | |
Net Assets at end of period (in 000’s)
| $13,690
| $15,339
| $12,494
| $10,989
| $11,243
|
Ratios of expenses to average net assets:
| | | | | |
Before reimbursement and waiver of expenses by Adviser (%)
| 0.80
| 1.02
| 1.09
| 1.09
| 0.98
|
After reimbursement and waiver of expenses by Adviser (%)
| 0.337 | 0.55
| 0.55
| 0.55
| 0.55
|
Ratio of net investment income to average net assets
| | | | | |
After reimbursement and waiver of expenses by Adviser (%)
| 0.077 | 2.16
| 4.64
| 4.13
| 2.30
|
1 | Commenced investment operations February 29, 2008.
|
2 | Total return without applicable sales charge.
|
3 | Not annualized.
|
4 | Annualized.
|
5 | Amounts represent less than $0.005 per share.
|
6 | Portfolio Turnover is calculated at the fund level and represents the entire fiscal year or period.
|
7 | Ratio is net of fees waived by the adviser and distributor (See Note 3).
|
See accompanying Notes to Financial Statements.
78
Financial Highlights for a Share of Beneficial Interest Outstanding
CASH RESERVES FUND |
| | Year Ended October 31,
|
| | 2009
| 2008
| 2007
| 2006
| 2005
|
CLASS B
| | | | | |
Net Asset Value at beginning of period
| $1.00
| $1.00
| $1.00
| $1.00
| $1.00
|
Income from Investment Operations: | | | | | |
Net investment income
| 0.007 | 0.01
| 0.04
| 0.03
| 0.02
|
Total from investment operations
| 0.007 | 0.01
| 0.04
| 0.03
| 0.02
|
Less Distributions: | | | | | |
Distributions from net investment income
| (0.00)7 | (0.01)
| (0.04)
| (0.03)
| (0.02)
|
Total distributions
| (0.00)7 | (0.01)
| (0.04)
| (0.03)
| (0.02)
|
Net increase (decrease) in net asset value
| (0.00)7 | –
| –
| –
| –
|
Net Asset Value at end of period
| $1.00
| $1.00
| $1.00
| $1.00
| $1.00
|
Total Return (%)3 | 0.01
| 1.50
| 3.94
| 3.48
| 1.57
|
Ratios/Supplemental Data: | | | | | |
Net Assets at end of period (in 000’s)
| $3,250
| $4,655
| $2,779
| $4,242
| $6,105
|
Ratios of expenses to average net assets:
| | | | | |
Before reimbursement and waiver of expenses by Adviser (%)
| 1.56
| 1.77
| 1.84
| 1.84
| 1.73
|
After reimbursement and waiver of expenses by Adviser (%)
| 0.408 | 1.30
| 1.30
| 1.30
| 1.30
|
Ratio of net investment income to average net assets
| | | | | |
After reimbursement and waiver of expenses by Adviser (%)
| 0.018 | 1.32
| 3.88
| 3.37
| 1.49
|
| | For the Period
Ended 6/14/071 | Inception
to 10/31/062 |
| |
CLASS Y
| | |
Net Asset Value at beginning of period
| $1.00
| $1.00
|
Income from Investment Operations: | | |
Net investment income
| 0.03
| 0.02
|
Total from investment operations
| 0.03
| 0.02
|
Less Distributions: | | |
Distributions from net investment income
| (0.03)
| (0.02)
|
Total distributions
| (0.03)
| (0.02)
|
Net increase (decrease) in net asset value
| 0.00
| 0.00
|
Net Asset Value at end of period
| $1.00
| $1.00
|
Total Return (%)3 | N/A
| 1.575 |
Ratios/Supplemental Data: | | |
Net Assets at end of period (in 000’s)
| $–
| $2,746
|
Ratios of expenses to average net assets:
| | |
Before reimbursement of expenses by Adviser (%)
| 1.006 | 1.356 |
After reimbursement of expenses by Adviser (%)
| 0.556 | 0.556 |
Ratio of net investment income to average net assets
| | |
After reimbursement of expenses by Adviser (%)
| 4.626 | 4.756 |
1 | Cash Reserves Fund Class Y shares were liquidated June 14, 2007.
|
2 | Commenced investment operations June 30, 2006.
|
3 | Total return without applicable sales charge.
|
4 | Amount includes fees waived by distributor (see Note 3).
|
5 | Not annualized.
|
6 | Annualized.
|
7 | Amounts represent less than $0.005 per share.
|
8 | Ratio is net of fees waived by the adviser and distributor (see Note 3).
|
See accompanying Notes to Financial Statements.
79
Financial Highlights for a Share of Beneficial Interest Outstanding
BOND FUND |
| | Year Ended October 31,
|
| | 2009
| 2008
| 2007
| 2006
| 2005
|
CLASS A
| | | | | |
Net Asset Value at beginning of period
| $9.48
| $9.78
| $9.88
| $9.85
| $10.17
|
Income from Investment Operations: | | | | | |
Net investment income
| 0.30
| 0.39
| 0.43
| 0.42
| 0.39
|
Net realized and unrealized gain (loss) on investments
| 0.63
| (0.30)
| (0.10)
| 0.03
| (0.31)
|
Total from investment operations
| 0.93
| 0.09
| 0.33
| 0.45
| 0.08
|
Less Distributions: | | | | | |
Distributions from net investment income
| (0.30)
| (0.39)
| (0.36)
| (0.42)
| (0.40)
|
Return of capital
| –
| –
| (0.07)
| –
| –
|
Total distributions
| (0.30)
| (0.39)
| (0.43)
| (0.42)
| (0.40)
|
Net increase (decrease) in net asset value
| 0.63
| (0.30)
| (0.10)
| 0.03
| (0.32)
|
Net Asset Value at end of period
| $10.11
| $9.48
| $9.78
| $9.88
| $9.85
|
Total Return (%)1 | 9.91
| 0.89
| 3.42
| 4.70
| 0.74
|
Ratios/Supplemental Data: | | | | | |
Net Assets at end of period (in 000’s)
| $44,099
| $37,882
| $55,271
| $59,646
| $61,942
|
Ratios of expenses to average net assets:
| | | | | |
Before reimbursement of expenses by Adviser (%)
| 0.94
| 1.02
| 1.08
| 1.08
| 1.07
|
After reimbursement of expenses by Adviser (%)
| 0.90
| 0.90
| 0.90
| 0.90
| 0.90
|
Ratio of net investment income to average net assets
| | | | | |
After reimbursement of expenses by Adviser (%)
| 3.04
| 4.05
| 4.40
| 4.27
| 3.82
|
Portfolio Turnover2 | 37
| 22
| 40
| 33
| 43
|
CLASS B
| | | | | |
Net Asset Value at beginning of period
| $9.48
| $9.78
| $9.88
| $9.85
| $10.17
|
Income from Investment Operations: | | | | | |
Net investment income
| 0.23
| 0.32
| 0.35
| 0.35
| 0.31
|
Net realized and unrealized gain (loss) on investments
| 0.64
| (0.30)
| (0.10)
| 0.03
| (0.31)
|
Total from investment operations
| 0.87
| 0.02
| 0.25
| 0.38
| –
|
Less Distributions: | | | | | |
Distributions from net investment income
| (0.23)
| (0.32)
| (0.29)
| (0.35)
| (0.32)
|
Return of capital
| –
| –
| (0.06)
| –
| –
|
Total distributions
| (0.23)
| (0.32)
| (0.35)
| (0.35)
| (0.32)
|
Net increase (decrease) in net asset value
| 0.64
| (0.30)
| (0.10)
| 0.03
| (0.32)
|
Net Asset Value at end of period
| $10.12
| $9.48
| $9.78
| $9.88
| $9.85
|
Total Return (%)1 | 9.20
| 0.13
| 2.64
| 3.91
| (0.01)
|
Ratios/Supplemental Data: | | | | | |
Net Assets at end of period (in 000’s)
| $9,363
| $15,941
| $26,507
| $37,233
| $47,588
|
Ratios of expenses to average net assets:
| | | | | |
Before reimbursement of expenses by Adviser (%)
| 1.69
| 1.77
| 1.83
| 1.83
| 1.82
|
After reimbursement of expenses by Adviser (%)
| 1.65
| 1.65
| 1.65
| 1.65
| 1.65
|
Ratio of net investment income to average net assets
| | | | | |
After reimbursement of expenses by Adviser (%)
| 2.37
| 3.29
| 3.65
| 3.51
| 3.08
|
Portfolio Turnover2 | 37
| 22
| 40
| 33
| 43
|
1 | Total return without applicable sales charge.
|
2 | Portfolio Turnover is calculated at the fund level and represents the entire fiscal year or period.
|
See accompanying Notes to Financial Statements.
80
Financial Highlights for a Share of Beneficial Interest Outstanding
BOND FUND |
| | Year Ended October 31,
| Inception
to 10/31/061 |
| | 2009
| 2008
| 2007
| |
CLASS Y
| | | | |
Net Asset Value at beginning of period
| $9.47
| $9.77
| $9.88
| $9.61
|
Income from Investment Operations: | | | | |
Net investment income
| 0.32
| 0.42
| 0.45
| 0.15
|
Net realized and unrealized gain (loss) on investments
| 0.64
| (0.30)
| (0.11)
| 0.27
|
Total from investment operations
| 0.96
| 0.12
| 0.34
| 0.42
|
Less Distributions: | | | | |
Distributions from net investment income
| (0.32)
| (0.42)
| (0.38)
| (0.15)
|
Return of capital
| –
| –
| (0.07)
| –
|
Total distributions
| (0.32)
| (0.42)
| (0.45)
| (0.15)
|
Net increase (decrease) in net asset value
| 0.64
| (0.30)
| (0.11)
| 0.27
|
Net Asset Value at end of period
| $10.11
| $9.47
| $9.77
| $9.88
|
Total Return (%)2 | 10.30
| 1.14
| 3.58
| 4.393 |
Ratios/Supplemental Data: | | | | |
Net Assets at end of period (in 000’s)
| $147,145
| $105,043
| $34,542
| $6,141
|
Ratios of expenses to average net assets:
| | | | |
Before reimbursement of expenses by Adviser (%)
| 0.69
| 0.76
| 0.82
| 0.894 |
After reimbursement of expenses by Adviser (%)
| 0.65
| 0.65
| 0.65
| 0.654 |
Ratio of net investment income to average net assets
| | | | |
After reimbursement of expenses by Adviser (%)
| 3.28
| 4.23
| 4.69
| 4.674 |
Portfolio Turnover6 | 37
| 223 | 40
| 333 |
HIGH INCOME FUND |
| | Year Ended October 31,
|
| | 2009
| 2008
| 2007
| 2006
| 2005
|
CLASS A
| | | | | |
Net Asset Value at beginning of period
| $5.57
| $7.29
| $7.36
| $7.29
| $7.56
|
Income from Investment Operations: | | | | | |
Net investment income
| 0.46
| 0.47
| 0.53
| 0.52
| 0.49
|
Net realized and unrealized gain (loss) on investments
| 1.09
| (1.65)
| (0.08)
| 0.07
| (0.28)
|
Total from investment operations
| 1.55
| (1.18)
| 0.45
| 0.59
| 0.21
|
Less Distributions: | | | | | |
Distributions from net investment income
| (0.46)
| (0.54)
| (0.52)
| (0.52)
| (0.48)
|
Total distributions
| (0.46)
| (0.54)
| (0.52)
| (0.52)
| (0.48)
|
Net increase (decrease) in net asset value
| 1.09
| (1.72)
| (0.07)
| 0.07
| (0.27)
|
Net Asset Value at end of period
| $6.66
| $5.57
| $7.29
| $7.36
| $7.29
|
Total Return (%)2 | 28.98
| (17.24)
| 6.31
| 8.33
| 2.85
|
Ratios/Supplemental Data: | | | | | |
Net Assets at end of period (in 000’s)
| $25,684
| $17,818
| $35,610
| $36,281
| $43,872
|
Ratios of expenses to average net assets:
| | | | | |
Before reimbursement of expenses by Adviser (%)
| 1.05
| 1.14
| 1.21
| 1.22
| 1.23
|
After reimbursement of expenses by Adviser (%)
| 1.00
| 1.00
| 1.00
| 1.00
| 1.00
|
Ratio of net investment income to average net assets
| | | | | |
After reimbursement of expenses by Adviser (%)
| 7.78
| 6.77
| 7.10
| 6.98
| 6.50
|
Portfolio Turnover6 | 73
| 59
| 74
| 67
| 815 |
1 | Commenced investment operations June 30, 2006.
|
2 | Total return without applicable sales charge.
|
3 | Not annualized.
|
4 | Annualized.
|
5 | Reflects subadviser change as of February 28, 2005.
|
6 | Portfolio Turnover is calculated at the fund level and represents the entire fiscal year or period.
|
See accompanying Notes to Financial Statements.
81
Financial Highlights for a Share of Beneficial Interest Outstanding
HIGH INCOME FUND |
| | Year Ended October 31,
|
| | 2009
| 2008
| 2007
| 2006
| 2005
|
CLASS B
| | | | | |
Net Asset Value at beginning of period
| | | | | |
Income from Investment Operations: | $5.63
| $7.32
| $7.39
| $7.31
| $7.58
|
Net investment income
| | | | | |
Net realized and unrealized gain (loss) on investments
| 0.44
| 0.45
| 0.49
| 0.47
| 0.43
|
Total from investment operations
| 1.09
| (1.70)
| (0.09)
| 0.07
| (0.28)
|
Less Distributions: | 1.53
| (1.25)
| 0.40
| 0.54
| 0.15
|
Distributions from net investment income
| | | | | |
Return of capital
| (0.42)
| (0.44)
| (0.47)
| (0.46)
| (0.42)
|
Total distributions
| (0.42)
| (0.44)
| (0.47)
| (0.46)
| (0.42)
|
Net increase (decrease) in net asset value
| 1.11
| (1.69)
| (0.07)
| 0.08
| (0.27)
|
Net Asset Value at end of period
| $6.74
| $5.63
| $7.32
| $7.39
| $7.31
|
Total Return (%)2 | 28.08
| (17.93)
| 5.50
| 7.64
| 2.06
|
Ratios/Supplemental Data: | | | | | |
Net Assets at end of period (in 000’s)
| $4,711
| $5,833
| $12,255
| $17,099
| $21,255
|
Ratios of expenses to average net assets:
| | | | | |
Before reimbursement of expenses by Adviser (%)
| 1.81
| 1.90
| 1.96
| 1.97
| 1.98
|
After reimbursement of expenses by Adviser (%)
| 1.75
| 1.75
| 1.75
| 1.75
| 1.75
|
Ratio of net investment income to average net assets
| | | | | |
After reimbursement of expenses by Adviser (%)
| 7.01
| 6.04
| 6.37
| 6.24
| 5.75
|
Portfolio Turnover6 | 73
| 59
| 74
| 67
| 815 |
| | Year Ended October 31,
| Inception
to 10/31/061 |
| | 2009
| 2008
| 2007
| |
CLASS Y
| | | | |
Net Asset Value at beginning of period
| $5.56
| $7.30
| $7.36
| $7.21
|
Income from Investment Operations: | | | | |
Net investment income
| 0.47
| 0.48
| 0.51
| 0.16
|
Net realized and unrealized gain (loss) on investments
| 1.10
| (1.65)
| (0.03)
| 0.17
|
Total from investment operations
| 1.57
| (1.17)
| 0.48
| 0.33
|
Less Distributions: | | | | |
Distributions from net investment income
| (0.48)
| (0.57)
| (0.54)
| (0.18)
|
Total distributions
| (0.48)
| (0.57)
| (0.54)
| (0.18)
|
Net increase (decrease) in net asset value
| 1.09
| (1.74)
| (0.06)
| 0.15
|
Net Asset Value at end of period
| $6.65
| $5.56
| $7.30
| $7.36
|
Total Return (%)2 | 29.35
| (17.09)
| 6.72
| 4.593 |
Ratios/Supplemental Data: | | | | |
Net Assets at end of period (in 000’s)
| $80,394
| $33,127
| $21,115
| $2,637
|
Ratios of expenses to average net assets:
| | | | |
Before reimbursement of expenses by Adviser (%)
| 0.80
| 0.89
| 0.94
| 1.064 |
After reimbursement of expenses by Adviser (%)
| 0.75
| 0.75
| 0.75
| 0.754 |
Ratio of net investment income to average net assets
| | | | |
After reimbursement of expenses by Adviser (%)
| 8.04
| 7.03
| 7.43
| 7.334 |
Portfolio Turnover6 | 73
| 59
| 74
| 673 |
1 | Commenced investment operations June 30, 2006.
|
2 | Total return without applicable sales charge.
|
3 | Not annualized.
|
4 | Annualized.
|
5 | Reflects subadviser change as of February 28, 2005.
|
6 | Portfolio Turnover is calculated at the fund level and represents the entire fiscal year or period.
|
See accompanying Notes to Financial Statements.
82
Financial Highlights for a Share of Beneficial Interest Outstanding
DIVERSIFIED INCOME FUND |
| | Year Ended October 31,
|
| | 2009
| 2008
| 2007
| 2006
| 2005
|
CLASS A
| | | | | |
Net Asset Value at beginning of period
| $9.92
| $13.24
| $13.20
| $12.25
| $11.81
|
Income from Investment Operations: | | | | | |
Net investment income
| 0.38
| 0.45
| 0.49
| 0.26
| 0.24
|
Net realized and unrealized gain (loss) on investments
| 0.28
| (2.30)
| 0.27
| 0.95
| 0.44
|
Total from investment operations
| 0.66
| (1.85)
| 0.76
| 1.21
| 0.68
|
Less Distributions: | | | | | |
Distributions from net investment income
| (0.41)
| (0.47)
| (0.49)
| (0.26)
| (0.24)
|
Distributions from capital gains
| –
| (1.00)
| (0.23)
| –
| –
|
Total distributions
| (0.41)
| (1.47)
| (0.72)
| (0.26)
| (0.24)
|
Net increase (decrease) in net asset value
| 0.25
| (3.32)
| 0.04
| 0.95
| 0.44
|
Net Asset Value at end of period
| $10.17
| $9.92
| $13.24
| $13.20
| $12.25
|
Total Return (%)1 | 7.07
| (15.39)
| 5.95
| 9.97
| 5.74
|
Ratios/Supplemental Data: | | | | | |
Net Assets at end of period (in 000’s)
| $71,014
| $70,095
| $90,254
| $91,339
| $107,457
|
Ratios of expenses to average net assets:
| | | | | |
Before reimbursement of expenses by Adviser (%)
| 1.27
| 1.29
| 1.25
| 1.21
| 1.21
|
After reimbursement of expenses by Adviser (%)
| 1.10
| 1.10
| 1.10
| 1.10
| 1.10
|
Ratio of net investment income to average net assets
| | | | | |
After reimbursement of expenses by Adviser (%)
| 3.98
| 3.94
| 3.73
| 2.01
| 1.88
|
Portfolio Turnover2 | 28
| 15
| 62
| 62
| 34
|
CLASS B
| | | | | |
Net Asset Value at beginning of period
| $9.96
| $13.25
| $13.22
| $12.26
| $11.82
|
Income from Investment Operations: | | | | | |
Net investment income
| 0.32
| 0.39
| 0.40
| 0.16
| 0.14
|
Net realized and unrealized gain (loss) on investments
| 0.28
| (2.34)
| 0.26
| 0.96
| 0.44
|
Total from investment operations
| 0.60
| (1.95)
| 0.66
| 1.12
| 0.58
|
Less Distributions: | | | | | |
Distributions from net investment income
| (0.34)
| (0.34)
| (0.40)
| (0.16)
| (0.14)
|
Distributions from capital gains
| –
| (1.00)
| (0.23)
| –
| –
|
Total distributions
| (0.34)
| (1.34)
| (0.63)
| (0.16)
| (0.14)
|
Net increase (decrease) in net asset value
| 0.26
| (3.29)
| 0.03
| 0.96
| 0.44
|
Net Asset Value at end of period
| $10.22
| $9.96
| $13.25
| $13.22
| $12.26
|
Total Return (%)1 | 6.24
| (16.01)
| 5.09
| 9.23
| 4.94
|
Ratios/Supplemental Data: | | | | | |
Net Assets at end of period (in 000’s)
| $18,322
| $28,156
| $57,581
| $80,486
| $98,258
|
Ratios of expenses to average net assets:
| | | | | |
Before reimbursement of expenses by Adviser (%)
| 2.04
| 2.04
| 2.00
| 1.96
| 1.96
|
After reimbursement of expenses by Adviser (%)
| 1.85
| 1.85
| 1.85
| 1.85
| 1.85
|
Ratio of net investment income to average net assets
| | | | | |
After reimbursement of expenses by Adviser (%)
| 3.33
| 3.18
| 2.99
| 1.27
| 1.15
|
Portfolio Turnover2 | 28
| 15
| 62
| 62
| 34
|
1 | Total return without applicable sales charge.
|
2 | Portfolio Turnover is calculated at the fund level and represents the entire fiscal year or period.
|
See accompanying Notes to Financial Statements.
83
Financial Highlights for a Share of Beneficial Interest Outstanding
LARGE CAP VALUE FUND |
| | Year Ended October 31,
|
| | 2009
| 2008
| 2007
| 2006
| 2005
|
CLASS A
| | | | | |
Net Asset Value at beginning of period
| $10.60
| $16.91
| $15.47
| $13.20
| $12.19
|
Income from Investment Operations: | | | | | |
Net investment income
| 0.20
| 0.28
| 0.22
| 0.22
| 0.16
|
Net realized and unrealized gain (loss) on investments
| (0.01)
| (6.30)
| 1.45
| 2.23
| 1.00
|
Total from investment operations
| 0.19
| (6.02)
| 1.67
| 2.45
| 1.16
|
Less Distributions: | | | | | |
Distributions from net investment income
| (0.22)
| (0.19)
| (0.23)
| (0.18)
| (0.15)
|
Distributions from capital gains
| –
| (0.10)
| –
| –
| –
|
Total distributions
| (0.22)
| (0.29)
| (0.23)
| (0.18)
| (0.15)
|
Net increase (decrease) in net asset value
| (0.03)
| (6.31)
| 1.44
| 2.27
| 1.01
|
Net Asset Value at end of period
| $10.57
| $10.60
| $16.91
| $15.47
| $13.20
|
Total Return (%)1 | 2.08
| (36.17)
| 10.88
| 18.75
| 9.56
|
Ratios/Supplemental Data: | | | | | |
Net Assets at end of period (in 000’s)
| $54,242
| $58,075
| $116,358
| $113,441
| $103,765
|
Ratios of expenses to average net assets:
| | | | | |
Before reimbursement of expenses by Adviser (%)
| 1.19
| 1.16
| 1.13
| 1.16
| 1.17
|
After reimbursement of expenses by Adviser (%)
| 1.18
| 1.16
| 1.13
| 1.00
| 1.00
|
Ratio of net investment income to average net assets
| | | | | |
After reimbursement of expenses by Adviser (%)
| 2.00
| 1.87
| 1.32
| 1.53
| 1.29
|
Portfolio Turnover2 | 86
| 55
| 47
| 45
| 12
|
CLASS B
| | | | | |
Net Asset Value at beginning of period
| $10.42
| $16.61
| $15.20
| $12.97
| $11.98
|
Income from Investment Operations: | | | | | |
Net investment income
| 0.19
| 0.27
| 0.16
| 0.15
| 0.09
|
Net realized and unrealized gain (loss) on investments
| (0.08)
| (6.29)
| 1.36
| 2.16
| 0.96
|
Total from investment operations
| 0.11
| (6.02)
| 1.52
| 2.31
| 1.05
|
Less Distributions: | | | | | |
Distributions from net investment income
| (0.15)
| (0.07)
| (0.11)
| (0.08)
| (0.06)
|
Distributions from capital gains
| –
| (0.10)
| –
| –
| –
|
Total distributions
| (0.15)
| (0.17)
| (0.11)
| (0.08)
| (0.06)
|
Net increase (decrease) in net asset value
| (0.04)
| (6.19)
| 1.41
| 2.23
| 0.99
|
Net Asset Value at end of period
| $10.38
| $10.42
| $16.61
| $15.20
| $12.97
|
Total Return (%)1 | 1.23
| (36.59)
| 10.03
| 17.86
| 8.73
|
Ratios/Supplemental Data: | | | | | |
Net Assets at end of period (in 000’s)
| $9,637
| $14,993
| $43,146
| $62,766
| $74,028
|
Ratios of expenses to average net assets:
| | | | | |
Before reimbursement of expenses by Adviser (%)
| 1.95
| 1.91
| 1.89
| 1.90
| 1.92
|
After reimbursement of expenses by Adviser (%)
| 1.94
| 1.91
| 1.88
| 1.75
| 1.75
|
Ratio of net investment income to average net assets
| | | | | |
After reimbursement of expenses by Adviser (%)
| 1.36
| 1.11
| 0.61
| 0.80
| 0.57
|
Portfolio Turnover2 | 86
| 55
| 47
| 45
| 12
|
1 | Total return without applicable sales charge.
|
2 | Portfolio Turnover is calculated at the fund level and represents the entire fiscal year or period.
|
See accompanying Notes to Financial Statements.
84
Financial Highlights for a Share of Beneficial Interest Outstanding
LARGE CAP VALUE FUND |
| | Year Ended October 31,
| Inception
to 10/31/061 |
| | 2009
| 2008
| 2007
| |
CLASS Y
| | | | |
Net Asset Value at beginning of period
| $10.62
| $16.93
| $15.48
| $14.07
|
Income from Investment Operations: | | | | |
Net investment income
| 0.18
| 0.22
| 0.21
| 0.03
|
Net realized and unrealized gain (loss) on investments
| 0.03
| (6.20)
| 1.51
| 1.38
|
Total from investment operations
| 0.21
| (5.98)
| 1.72
| 1.41
|
Less Distributions: | | | | |
Distributions from net investment income
| (0.25)
| (0.23)
| (0.27)
| –
|
Return of capital
| –
| (0.10)
| –
| –
|
Total distributions
| (0.25)
| (0.33)
| (0.27)
| –
|
Net increase (decrease) in net asset value
| (0.04)
| (6.31)
| 1.45
| 1.41
|
Net Asset Value at end of period
| $10.58
| $10.62
| $16.93
| $15.48
|
Total Return (%)2 | 2.24
| (35.97)
| 11.21
| 10.023 |
Ratios/Supplemental Data: | | | | |
Net Assets at end of period (in 000’s)
| $80,167
| $54,828
| $47,949
| $7,169
|
Ratios of expenses to average net assets:
| | | | |
Before reimbursement of expenses by Adviser (%)
| 0.93
| 0.91
| 0.87
| 0.96
|
After reimbursement of expenses by Adviser (%)
| 0.93
| 0.91
| 0.88
| 0.75
|
Ratio of net investment income to average net assets
| | | | |
After reimbursement of expenses by Adviser (%)
| 2.12
| 2.07
| 1.47
| 1.314 |
Portfolio Turnover6 | 86
| 55
| 47
| 453 |
LARGE CAP GROWTH FUND |
| | Year Ended October 31,
|
| | 2009
| 2008
| 2007
| 2006
| 2005
|
CLASS A
| | | | | |
Net Asset Value at beginning of period
| $11.07
| $17.39
| $14.70
| $13.72
| $12.87
|
Income from Investment Operations: | | | | | |
Net investment income
| 0.05
| 0.03
| (0.00)5 | 0.005 | 0.08
|
Net realized and unrealized gain (loss) on investments
| 2.05
| (6.35)
| 2.69
| 1.05
| 0.77
|
Total from investment operations
| 2.10
| (6.32)
| 2.69
| 1.05
| 0.85
|
Less Distributions: | | | | | |
Distributions from net investment income
| (0.02)
| –
| –
| (0.07)
| (0.00)5 |
Total distributions
| (0.02)
| –
| –
| (0.07)
| (0.00)5 |
Net increase (decrease) in net asset value
| 2.08
| (6.32)
| 2.69
| 0.98
| 0.85
|
Net Asset Value at end of period
| $13.15
| $11.07
| $17.39
| $14.70
| $13.72
|
Total Return (%)2 | 18.99
| (36.34)
| 18.30
| 7.71
| 6.61
|
Ratios/Supplemental Data: | | | | | |
Net Assets at end of period (in 000’s)
| $45,398
| $38,538
| $68,253
| $65,216
| $78,785
|
Ratios of expenses to average net assets:
| | | | | |
Before reimbursement of expenses by Adviser (%)
| 1.31
| 1.34
| 1.43
| 1.45
| 1.44
|
After reimbursement of expenses by Adviser (%)
| 1.20
| 1.20
| 1.20
| 1.20
| 1.20
|
Ratio of net investment income to average net assets
| | | | | |
After reimbursement of expenses by Adviser (%)
| 0.41
| 0.18
| (0.02)
| 0.09
| 0.62
|
Portfolio Turnover6 | 105
| 141
| 93
| 148
| 18
|
1 | Commenced investment operations June 30, 2006.
|
2 | Total return without applicable sales charge.
|
3 | Not annualized.
|
4 | Annualized.
|
5 | Amounts represent less than $0.005 per share.
|
6 | Portfolio Turnover is calculated at the fund level and represents the entire fiscal year or period.
|
See accompanying Notes to Financial Statements.
85
Financial Highlights for a Share of Beneficial Interest Outstanding
LARGE CAP GROWTH FUND |
| | Year Ended October 31,
|
| | 2009
| 2008
| 2007
| 2006
| 2005
|
CLASS B
| | | | | |
Net Asset Value at beginning of period
| $10.30
| $16.29
| $13.88
| $12.98
| $12.27
|
Income from Investment Operations: | | | | | |
Net investment income
| (0.02)
| (0.11)
| (0.13)
| (0.09)
| (0.01)
|
Net realized and unrealized gain (loss) on investments
| 1.88
| (5.88)
| 2.54
| 0.99
| 0.72
|
Total from investment operations
| 1.86
| (5.99)
| 2.41
| 0.90
| 0.71
|
Net increase (decrease) in net asset value
| 1.86
| (5.99)
| 2.41
| 0.90
| 0.71
|
Net Asset Value at end of period
| $12.16
| $10.30
| $16.29
| $13.88
| $12.98
|
Total Return (%)2 | 18.06
| (36.77)
| 17.36
| 6.93
| 5.79
|
Ratios/Supplemental Data: | | | | | |
Net Assets at end of period (in 000’s)
| $9,665
| $13,580
| $36,147
| $43,975
| $54,946
|
Ratios of expenses to average net assets:
| | | | | |
Before reimbursement of expenses by Adviser (%)
| 2.07
| 2.10
| 2.18
| 2.20
| 2.19
|
After reimbursement of expenses by Adviser (%)
| 1.95
| 1.95
| 1.95
| 1.95
| 1.94
|
Ratio of net investment income to average net assets
| | | | | |
After reimbursement of expenses by Adviser (%)
| (0.30)
| (0.56)
| (0.76)
| (0.65)
| (0.09)
|
Portfolio Turnover6 | 105
| 141
| 93
| 148
| 18
|
| | Year Ended October 31,
| Inception
to 10/31/061 |
| | 2009
| 2008
| 2007
| |
CLASS Y
| | | | |
Net Asset Value at beginning of period
| $11.14
| $17.45
| $14.72
| $13.71
|
Income from Investment Operations: | | | | |
Net investment income
| 0.06
| 0.06
| 0.02
| (0.00)5 |
Net realized and unrealized gain (loss) on investments
| 2.07
| (6.37)
| 2.71
| 1.01
|
Total from investment operations
| 2.13
| (6.31)
| 2.73
| 1.01
|
Less Distributions: | | | | |
Distributions from net investment income
| (0.04)
| –
| –
| –
|
Total distributions
| (0.04)
| –
| –
| –
|
Net increase (decrease) in net asset value
| 2.09
| (6.31)
| 2.73
| 1.01
|
Net Asset Value at end of period
| $13.23
| $11.14
| $17.45
| $14.72
|
Total Return (%)2 | 19.26
| (36.16)
| 18.55
| 7.373 |
Ratios/Supplemental Data: | | | | |
Net Assets at end of period (in 000’s)
| $106,390
| $70,203
| $52,811
| $9,939
|
Ratios of expenses to average net assets:
| | | | |
Before reimbursement of expenses by Adviser (%)
| 1.06
| 1.09
| 1.16
| 1.304 |
After reimbursement of expenses by Adviser (%)
| 0.95
| 0.95
| 0.95
| 0.954 |
Ratio of net investment income to average net assets
| | | | |
After reimbursement of expenses by Adviser (%)
| 0.63
| 0.45
| 0.19
| (0.07)4 |
Portfolio Turnover6 | 105
| 141
| 93
| 1483 |
1 | Commenced investment operations June 30, 2006.
|
2 | Total return without applicable sales charge.
|
3 | Not annualized.
|
4 | Annualized.
|
5 | Amounts represent less than $0.005 per share.
|
6 | Portfolio Turnover is calculated at the fund level and represents the entire fiscal year or period.
|
See accompanying Notes to Financial Statements.
86
Financial Highlights for a Share of Beneficial Interest Outstanding
MID CAP VALUE FUND |
| | Year Ended October 31,
|
| | 2009
| 2008
| 2007
| 2006
| 2005
|
CLASS A
| | | | | |
Net Asset Value at beginning of period
| $7.67
| $13.90
| $15.54
| $14.08
| $12.44
|
Income from Investment Operations: | | | | | |
Net investment income
| 0.09
| 0.14
| 0.09
| 0.10
| 0.03
|
Net realized and unrealized gain (loss) on investments
| 0.79
| (4.98)
| 1.27
| 2.32
| 1.70
|
Total from investment operations
| 0.88
| (4.84)
| 1.36
| 2.42
| 1.73
|
Less Distributions: | | | | | |
Distributions from net investment income
| (0.10)
| (0.06)
| (0.08)
| (0.01)
| (0.09)
|
Distributions from capital gains
| –
| (1.33)
| (2.92)
| (0.95)
| –
|
Total distributions
| (0.10)
| (1.39)
| (3.00)
| (0.96)
| (0.09)
|
Net increase (decrease) in net asset value
| 0.78
| (6.23)
| (1.64)
| 1.46
| 1.64
|
Net Asset Value at end of period
| $8.45
| $7.67
| $13.90
| $15.54
| $14.08
|
Total Return (%)1 | 11.74
| (38.40)
| 9.94
| 17.93
| 13.95
|
Ratios/Supplemental Data: | | | | | |
Net Assets at end of period (in 000’s)
| $22,693
| $19,549
| $39,708
| $34,364
| $44,126
|
Ratios of expenses to average net assets:
| | | | | |
Before reimbursement of expenses by Adviser (%)
| 1.82
| 1.81
| 1.69
| 1.68
| 1.70
|
After reimbursement of expenses by Adviser (%)
| 1.40
| 1.40
| 1.40
| 1.40
| 1.40
|
Ratio of net investment income to average net assets
| | | | | |
After reimbursement of expenses by Adviser (%)
| 1.19
| 1.20
| 0.74
| 0.53
| 0.20
|
Portfolio Turnover3 | 106
| 83
| 76
| 108
| 37
|
CLASS B
| | | | | |
Net Asset Value at beginning of period
| $7.23
| $13.24
| $14.96
| $13.67
| $12.09
|
Income from Investment Operations: | | | | | |
Net investment income
| 0.07
| 0.07
| 0.002 | (0.03)
| (0.07)
|
Net realized and unrealized gain (loss) on investments
| 0.72
| (4.75)
| 1.20
| 2.27
| 1.65
|
Total from investment operations
| 0.79
| (4.68)
| 1.20
| 2.24
| 1.58
|
Less Distributions: | | | | | |
Distributions from net investment income
| (0.05)
| –
| –
| –
| –
|
Distributions from capital gains
| –
| (1.33)
| (2.92)
| (0.95)
| –
|
Total distributions
| (0.05)
| (1.33)
| (2.92)
| (0.95)
| –
|
Net increase (decrease) in net asset value
| 0.74
| (6.01)
| (1.72)
| 1.29
| 1.58
|
Net Asset Value at end of period
| $7.97
| $7.23
| $13.24
| $14.96
| $13.67
|
Total Return (%)1 | 11.01
| (38.97)
| 9.14
| 17.04
| 13.07
|
Ratios/Supplemental Data: | | | | | |
Net Assets at end of period (in 000’s)
| $5,498
| $8,448
| $21,835
| $24,813
| $22,633
|
Ratios of expenses to average net assets:
| | | | | |
Before reimbursement of expenses by Adviser (%)
| 2.62
| 2.56
| 2.44
| 2.45
| 2.45
|
After reimbursement of expenses by Adviser (%)
| 2.15
| 2.15
| 2.15
| 2.15
| 2.15
|
Ratio of net investment income to average net assets
| | | | | |
After reimbursement of expenses by Adviser (%)
| 0.55
| 0.45
| 0.00
| (0.20)
| (0.55)
|
Portfolio Turnover3 | 106
| 83
| 76
| 108
| 37
|
1 | Total return without applicable sales charge.
|
2 | Amounts represent less than $0.005 per share.
|
3 | Portfolio Turnover is calculated at the fund level and represents the entire fiscal year or period.
|
See accompanying Notes to Financial Statements.
87
Financial Highlights for a Share of Beneficial Interest Outstanding
MID CAP VALUE FUND |
| | Year Ended October 31,
| Inception
to 10/31/061 |
| | 2009
| 2008
| 2007
| |
CLASS Y
| | | | |
Net Asset Value at beginning of period
| $7.77
| $13.92
| $15.56
| $14.54
|
Income from Investment Operations: | | | | |
Net investment income
| 0.15
| 0.09
| 0.13
| 0.02
|
Net realized and unrealized gain (loss) on investments
| 0.77
| (4.82)
| 1.27
| 1.00
|
Total from investment operations
| 0.92
| (4.73)
| 1.40
| 1.02
|
Less Distributions: | | | | |
Distributions from net investment income
| (0.12)
| (0.09)
| (0.12)
| –
|
Distributions from capital gains
| –
| (1.33)
| (2.92)
| –
|
Total distributions
| (0.12)
| (1.42)
| (3.04)
| –
|
Net increase (decrease) in net asset value
| 0.80
| (6.15)
| (1.64)
| 1.02
|
Net Asset Value at end of period
| $8.57
| $7.77
| $13.92
| $15.56
|
Total Return (%)2 | 12.12
| (37.53)
| 10.25
| 6.953 |
Ratios/Supplemental Data: | | | | |
Net Assets at end of period (in 000’s)
| $1,761
| $3,190
| $18,992
| $5,531
|
Ratios of expenses to average net assets:
| | | | |
Before reimbursement of expenses by Adviser (%)
| 1.65
| 1.49
| 1.43
| 1.634 |
After reimbursement of expenses by Adviser (%)
| 1.15
| 1.15
| 1.15
| 1.154 |
Ratio of net investment income to average net assets
| | | | |
After reimbursement of expenses by Adviser (%)
| 1.54
| 1.45
| 0.94
| 0.974 |
Portfolio Turnover5 | 106
| 83
| 76
| 1083 |
MID CAP GROWTH FUND |
| | Year Ended October 31,
|
| | 2009
| 2008
| 2007
| 2006
| 2005
|
CLASS A
| | | | | |
Net Asset Value at beginning of period
| $4.08
| $7.45
| $6.27
| $5.36
| $4.83
|
Income from Investment Operations: | | | | | |
Net investment income
| (0.03)
| (0.04)
| (0.07)
| (0.04)
| (0.01)
|
Net realized and unrealized gain (loss) on investments
| 0.90
| (3.28)
| 1.25
| 0.95
| 0.54
|
Total from investment operations
| 0.87
| (3.32)
| 1.18
| 0.91
| 0.53
|
Less Distributions: | | | | | |
Distributions from capital gains
| -
| (0.05)
| –
| –
| –
|
Total distributions
| -
| (0.05)
| –
| –
| –
|
Net increase (decrease) in net asset value
| 0.87
| (3.37)
| 1.18
| 0.91
| 0.53
|
Net Asset Value at end of period
| $4.95
| $4.08
| $7.45
| $6.27
| $5.36
|
Total Return (%)2 | 21.03
| (44.71)
| 18.82
| 16.98
| 10.97
|
Ratios/Supplemental Data: | | | | | |
Net Assets at end of period (in 000’s)
| $17,138
| $14,241
| $33,459
| $33,899
| $32,395
|
Ratios of expenses to average net assets:
| | | | | |
Before reimbursement of expenses by Adviser (%)
| 1.56
| 1.44
| 1.50
| 1.61
| 1.69
|
After reimbursement of expenses by Adviser (%)
| 1.40
| 1.40
| 1.33
| 1.20
| 1.19
|
Ratio of net investment income to average net assets
| | | | | |
After reimbursement of expenses by Adviser (%)
| (0.61)
| (0.56)
| (0.87)
| (0.59)
| (0.25)
|
Portfolio Turnover5 | 198
| 127
| 109
| 207
| 92
|
1 | Commenced investment operations June 30, 2006.
|
2 | Total return without applicable sales charge.
|
3 | Not annualized.
|
4 | Annualized.
|
5 | Portfolio Turnover is calculated at the fund level and represents the entire fiscal year or period.
|
See accompanying Notes to Financial Statements.
88
Financial Highlights for a Share of Beneficial Interest Outstanding
MID CAP GROWTH FUND |
| | Year Ended October 31,
|
| | 2009
| 2008
| 2007
| 2006
| 2005
|
CLASS B
| | | | | |
Net Asset Value at beginning of period
| $3.83
| $7.04
| $5.96
| $5.14
| $4.67
|
Income from Investment Operations: | | | | | |
Net investment income
| (0.06)
| (0.10)
| (0.13)
| (0.08)
| (0.05)
|
Net realized and unrealized gain (loss) on investments
| 0.83
| (3.06)
| 1.21
| 0.90
| 0.52
|
Total from investment operations
| 0.77
| (3.16)
| 1.08
| 0.82
| 0.47
|
Less Distributions: | | | | | |
Distributions from capital gains
| –
| (0.05)
| –
| –
| –
|
Total distributions
| –
| (0.05)
| –
| –
| –
|
Net increase (decrease) in net asset value
| 0.77
| (3.21)
| 1.08
| 0.82
| 0.47
|
Net Asset Value at end of period
| $4.60
| $3.83
| $7.04
| $5.96
| $5.14
|
Total Return (%)2 | 20.10
| (45.18)
| 17.92
| 16.15
| 10.06
|
Ratios/Supplemental Data: | | | | | |
Net Assets at end of period (in 000’s)
| $4,231
| $4,891
| $13,598
| $15,754
| $14,464
|
Ratios of expenses to average net assets:
| | | | | |
Before reimbursement of expenses by Adviser (%)
| 2.32
| 2.19
| 2.25
| 2.35
| 2.44
|
After reimbursement of expenses by Adviser (%)
| 2.15
| 2.15
| 2.08
| 1.95
| 1.94
|
Ratio of net investment income to average net assets
| | | | | |
After reimbursement of expenses by Adviser (%)
| (1.34)
| (1.32)
| (1.62)
| (1.36)
| (0.98)
|
Portfolio Turnover5 | 198
| 127
| 109
| 207
| 92
|
| | Year Ended October 31,
| Inception
to 10/31/061 |
| | 2009
| 2008
| 2007
| |
CLASS Y
| | | | |
Net Asset Value at beginning of period
| $4.11
| $7.47
| $6.27
| $5.84
|
Income from Investment Operations: | | | | |
Net investment income
| (0.01)
| (0.02)
| (0.03)
| (0.01)
|
Net realized and unrealized gain (loss) on investments
| 0.90
| (3.29)
| 1.23
| 0.44
|
Total from investment operations
| 0.89
| (3.31)
| 1.20
| 0.43
|
Less Distributions: | | | | |
Distributions from capital gains
| –
| (0.05)
| –
| –
|
Total distributions
| –
| (0.05)
| –
| –
|
Net increase (decrease) in net asset value
| 0.89
| (3.36)
| 1.20
| 0.43
|
Net Asset Value at end of period
| $5.00
| $4.11
| $7.47
| $6.27
|
Total Return (%)2 | 21.65
| (44.66)
| 19.11
| 7.533 |
Ratios/Supplemental Data: | | | | |
Net Assets at end of period (in 000’s)
| $23,389
| $17,649
| $32,631
| $7,830
|
Ratios of expenses to average net assets:
| | | | |
Before reimbursement of expenses by Adviser (%)
| 1.30
| 1.19
| 1.22
| 1.474 |
After reimbursement of expenses by Adviser (%)
| 1.15
| 1.15
| 1.11
| 0.954 |
Ratio of net investment income to average net assets
| | | | |
After reimbursement of expenses by Adviser (%)
| (0.37)
| (0.27)
| (0.62)
| (0.58)4 |
Portfolio Turnover5 | 198
| 127
| 109
| 2073 |
1 | Commenced investment operations June 30, 2006.
|
2 | Total return without applicable sales charge.
|
3 | Not annualized.
|
4 | Annualized.
|
5 | Portfolio Turnover is calculated at the fund level and represents the entire fiscal year or period.
|
See accompanying Notes to Financial Statements.
89
Financial Highlights for a Share of Beneficial Interest Outstanding
SMALL CAP VALUE FUND |
| | Year Ended October 31,
| Inception
to 10/31/071 |
| | 2009
| 2008
| |
CLASS A
| | | |
Net Asset Value at beginning of period
| $7.29
| $10.36
| $10.00
|
Income from Investment Operations: | | | |
Net investment income
| 0.03
| 0.22
| 0.06
|
Net realized and unrealized gain (loss) on investments
| 0.94
| (3.07)
| 0.30
|
Total from investment operations
| 0.97
| (2.85)
| 0.36
|
Less Distributions: | | | |
Distributions from investment income
| (0.02)
| (0.05)
| –
|
Distributions from capital gains
| –
| (0.17)
| –
|
Total distributions
| (0.02)
| (0.22)
| –
|
Net increase (decrease) in net asset value
| 0.95
| (3.07)
| 0.36
|
Net Asset Value at end of period
| $8.24
| $7.29
| $10.36
|
Total Return (%)2 | 13.30
| (28.02)
| 3.603 |
Ratios/Supplemental Data: | | | |
Net Assets at end of period (in 000’s)
| $1,301
| $ 883
| $6,098
|
Ratios of expenses to average net assets:
| | | |
Before reimbursement of expenses by Adviser (%)
| 2.85
| 2.18
| 2.614 |
After reimbursement of expenses by Adviser (%)
| 1.50
| 1.50
| 1.504 |
Ratio of net investment income to average net assets
| | | |
After reimbursement of expenses by Adviser (%)
| 0.50
| 0.56
| 0.714 |
Portfolio Turnover6 | 21
| 55
| 143 |
CLASS B
| | | |
Net Asset Value at beginning of period
| $7.24
| $10.29
| $10.00
|
Income from Investment Operations: | | | |
Net investment income
| (0.02)
| 0.03
| (0.00)5 |
Net realized and unrealized gain (loss) on investments
| 0.94
| (2.91)
| 0.29
|
Total from investment operations
| 0.92
| (2.88)
| 0.29
|
Redemption Fees (see Note 2)
| 0.02
| 0.02
| 0.005 |
Less Distributions: | | | |
Distributions from capital gains
| –
| (0.17)
| –
|
Total distributions
| –
| (0.17)
| –
|
Net increase (decrease) in net asset value
| 0.94
| (3.05)
| 0.29
|
Net Asset Value at end of period
| $8.18
| $7.24
| $10.29
|
Total Return (%)2 | 12.98
| (28.38)
| 2.903 |
Ratios/Supplemental Data: | | | |
Net Assets at end of period (in 000’s)
| $100
| $67
| $200
|
Ratios of expenses to average net assets:
| | | |
Before reimbursement of expenses by Adviser (%)
| 11.03
| 7.88
| 11.244 |
After reimbursement of expenses by Adviser (%)
| 2.25
| 2.25
| 2.254 |
Ratio of net investment income to average net assets
| | | |
After reimbursement of expenses by Adviser (%)
| (0.22)
| (0.19)
| (0.01)4 |
Portfolio Turnover6 | 21
| 55
| 143 |
1 | Commenced investment operations December 27, 2006.
|
2 | Total return without applicable sales charge.
|
3 | Not annualized.
|
4 | Annualized.
|
5 | Amounts represent less than $0.005 per share.
|
6 | Portfolio Turnover is calculated at the fund level and represents the entire fiscal year or period.
|
See accompanying Notes to Financial Statements.
90
Financial Highlights for a Share of Beneficial Interest Outstanding
SMALL CAP VALUE FUND |
| | Year Ended October 31,
| Inception
to 10/31/071 |
| | 2009
| 2008
| |
CLASS Y
| | | |
Net Asset Value at beginning of period
| $7.31
| $10.37
| $9.82
|
Income from Investment Operations: | | | |
Net investment income
| 0.05
| 0.06
| 0.05
|
Net realized and unrealized gain (loss) on investments
| 0.92
| (2.88)
| 0.50
|
Total from investment operations
| 0.97
| (2.82)
| 0.55
|
Less Distributions: | | | |
Distributions from net investment income
| (0.06)
| (0.07)
| –
|
Distributions from capital gains
| –
| (0.17)
| –
|
Total distributions
| (0.06)
| (0.24)
| –
|
Net increase (decrease) in net asset value
| 0.91
| (3.06)
| 0.55
|
Net Asset Value at end of period
| $8.22
| $7.31
| $10.37
|
Total Return (%)3 | 13.53
| (27.71)
| 5.604 |
Ratios/Supplemental Data: | | | |
Net Assets at end of period (in 000’s)
| $20,389
| $13,453
| $14,949
|
Ratios of expenses to average net assets:
| | | |
Before reimbursement of expenses by Adviser (%)
| 1.52
| 1.61
| 1.915 |
After reimbursement of expenses by Adviser (%)
| 1.25
| 1.25
| 1.255 |
Ratio of net investment income to average net assets
| | | |
After reimbursement of expenses by Adviser (%)
| 0.77
| 0.81
| 0.995 |
Portfolio Turnover7 | 21
| 55
| 144 |
SMALL CAP GROWTH FUND |
| | Year Ended October 31,
| Inception
to 10/31/072 |
| | 2009
| 2008
| |
CLASS A
| | | |
Net Asset Value at beginning of period
| $6.25
| $1.19
| $10.00
|
Income from Investment Operations: | | | |
Net investment income
| (0.04)
| (0.55)
| (0.03)
|
Net realized and unrealized gain (loss) on investments
| (0.17)
| (4.26)
| 1.22
|
Total from investment operations
| (0.21)
| (4.81)
| 1.19
|
Less Distributions: | | | |
Distributions from net investment income
| –
| –
| (0.00)6 |
Distributions from capital gains
| –
| (0.13)
| –
|
Total distributions
| –
| (0.13)
| (0.00)6 |
Net increase (decrease) in net asset value
| (0.21)
| (4.94)
| 1.19
|
Net Asset Value at end of period
| $6.04
| $6.25
| $11.19
|
Total Return (%)3 | (3.36)
| (43.49)
| 11.924 |
Ratios/Supplemental Data: | | | |
Net Assets at end of period (in 000’s)
| $315
| $243
| $5,922
|
Ratios of expenses to average net assets:
| | | |
Before reimbursement of expenses by Adviser (%)
| 5.34
| 2.17
| 2.615 |
After reimbursement of expenses by Adviser (%)
| 1.50
| 1.50
| 1.505 |
Ratio of net investment income to average net assets
| | | |
After reimbursement of expenses by Adviser (%)
| (0.66)
| (0.54)
| (0.37)5 |
Portfolio Turnover7 | 113
| 143
| 904 |
1 | Commenced investment operations January 9, 2007.
| 5 | Annualized.
|
2 | Commenced investment operations December 27, 2006.
| 6 | Amounts represent less than $0.005 per share..
|
3 | Total return without applicable sales charge.
| 7 | Portfolio Turnover is calculated at the fund level and represents the entire fiscal year or period.. |
4 | Not annualized.
| | |
See accompanying Notes to Financial Statements.
91
Financial Highlights for a Share of Beneficial Interest Outstanding
SMALL CAP GROWTH FUND |
| | Year Ended October 31,
| Inception
to 10/31/071 |
| | 2009
| 2008
| |
CLASS B
| | | |
Net Asset Value at beginning of period
| $6.16
| $11.11
| $10.00
|
Income from Investment Operations: | | | |
Net investment income
| (0.06)
| (0.31)
| (0.08)
|
Net realized and unrealized gain (loss) on investments
| (0.19)
| (4.51)
| 1.19
|
Total from investment operations
| (0.25)
| (4.82)
| 1.11
|
Less Distributions: | | | |
Distributions from net investment income
| –
| –
| (0.00)6 |
Distributions from capital gains
| –
| (0.13)
| –
|
Total distributions
| –
| (0.13)
| (0.00)6 |
Net increase (decrease) in net asset value
| (0.25)
| (4.95)
| 1.11
|
Net Asset Value at end of period
| $5.91
| $6.16
| $11.11
|
Total Return (%)3 | (4.06)
| (43.90)
| 11.114 |
Ratios/Supplemental Data: | | | |
Net Assets at end of period (in 000’s)
| $74
| $38
| $166
|
Ratios of expenses to average net assets:
| | | |
Before reimbursement of expenses by Adviser (%)
| 12.86
| 9.51
| 12.615 |
After reimbursement of expenses by Adviser (%)
| 2.25
| 2.25
| 2.255 |
Ratio of net investment income to average net assets
| | | |
After reimbursement of expenses by Adviser (%)
| (1.44)
| (1.37)
| (1.10)5 |
Portfolio Turnover7 | 113
| 143
| 904 |
| | Year Ended October 31,
| Inception
to 10/31/072 |
| | 2009
| 2008
| |
CLASS Y
| | | |
Net Asset Value at beginning of period
| $6.28
| $11.21
| $9.84
|
Income from Investment Operations: | | | |
Net investment income
| (0.02)
| (0.04)
| (0.00)6 |
Net realized and unrealized gain (loss) on investments
| (0.19)
| (4.76)
| 1.37
|
Total from investment operations
| (0.21)
| (4.80)
| 1.37
|
Less Distributions: | | | |
Distributions from capital gains
| –
| (0.13)
| –
|
Total distributions
| –
| (0.13)
| –
|
Net increase (decrease) in net asset value
| (0.21)
| (4.93)
| 1.37
|
Net Asset Value at end of period
| $6.07
| $6.28
| $11.21
|
Total Return (%)3 | (3.34)
| (43.32)
| 13.924 |
Ratios/Supplemental Data: | | | |
Net Assets at end of period (in 000’s)
| $15,044
| $12,843
| $19,053
|
Ratios of expenses to average net assets:
| | | |
Before reimbursement of expenses by Adviser (%)
| 1.64
| 1.56
| 1.875 |
After reimbursement of expenses by Adviser (%)
| 1.25
| 1.25
| 1.255 |
Ratio of net investment income to average net assets
| | | |
After reimbursement of expenses by Adviser (%)
| (0.40)
| (0.41)
| (0.02)5 |
Portfolio Turnover7 | 113
| 143
| 904 |
1 | Commenced investment operations December 27, 2006.
| 5 | Annualized.
|
2 | Commenced investment operations January 9, 2007.
| 6 | Amounts represent less than $0.005 per share..
|
3 | Total return without applicable sales charge.
| 7 | Portfolio Turnover is calculated at the fund level and represents the entire fiscal year or period.. |
4 | Not annualized.
| | |
See accompanying Notes to Financial Statements.
92
Financial Highlights for a Share of Beneficial Interest Outstanding
INTERNATIONAL STOCK FUND |
| | Year Ended October 31,
|
| | 2009
| 2008
| 2007
| 2006
| 2005
|
CLASS A
| | | | | |
Net Asset Value at beginning of period
| $8.47
| $17.05
| $15.66
| $12.65
| $10.56
|
Income from Investment Operations: | | | | | |
Net investment income
| 0.15
| 0.23
| 0.16
| 0.15
| 0.14
|
Net realized and unrealized gain (loss) on investments
| 1.69
| (6.06)
| 2.92
| 3.01
| 2.05
|
Total from investment operations
| 1.84
| (5.83)
| 3.08
| 3.16
| 2.19
|
Less Distributions: | | | | | |
Distributions from net investment income
| (0.16)
| (0.24)
| (0.11)
| (0.14)
| (0.10)
|
Distributions from capital gains
| (0.21)
| (2.51)
| (1.58)
| (0.01)
| –
|
Total distributions
| (0.37)
| (2.75)
| (1.69)
| (0.15)
| (0.10)
|
Net increase (decrease) in net asset value
| 1.47
| (8.58)
| 1.39
| 3.01
| 2.09
|
Net Asset Value at end of period
| $9.94
| $8.47
| $17.05
| $15.66
| $12.65
|
Total Return (%)1 | 22.82
| (40.46)
| 21.24
| 25.11
| 20.81
|
Ratios/Supplemental Data: | | | | | |
Net Assets at end of period (in 000’s)
| $23,094
| $19,040
| $52,145
| $78,958
| $58,825
|
Ratios of expenses to average net assets:
| | | | | |
Before reimbursement of expenses by Adviser (%)
| 1.73
| 1.93
| 1.89
| 1.87
| 1.90
|
After reimbursement of expenses by Adviser (%)
| 1.60
| 1.60
| 1.60
| 1.60
| 1.60
|
Ratio of net investment income to average net assets
| | | | | |
After reimbursement of expenses by Adviser (%)
| 1.81
| 1.67
| 0.99
| 1.03
| 1.15
|
Portfolio Turnover2 | 82
| 69
| 79
| 63
| 64
|
CLASS B
| | | | | |
Net Asset Value at beginning of period
| $8.33
| $16.79
| $15.45
| $12.48
| $10.41
|
Income from Investment Operations: | | | | | |
Net investment income
| 0.14
| 0.18
| 0.08
| 0.03
| 0.04
|
Net realized and unrealized gain (loss) on investments
| 1.60
| (6.01)
| 2.84
| 2.98
| 2.04
|
Total from investment operations
| 1.74
| (5.83)
| 2.92
| 3.01
| 2.08
|
Less Distributions: | | | | | |
Distributions from net investment income
| (0.10)
| (0.12)
| –
| (0.03)
| (0.01)
|
Distributions from capital gains
| (0.21)
| (2.51)
| (1.58)
| (0.01)
| –
|
Total distributions
| (0.31)
| (2.63)
| (1.58)
| (0.04)
| (0.01)
|
Net increase (decrease) in net asset value
| 1.43
| (8.46)
| 1.34
| 2.97
| 2.07
|
Net Asset Value at end of period
| $9.76
| $8.33
| $16.79
| $15.45
| $12.48
|
Total Return (%)1 | 21.91
| (40.95)
| 20.31
| 24.18
| 20.00
|
Ratios/Supplemental Data: | | | | | |
Net Assets at end of period (in 000’s)
| $5,109
| $6,237
| $15,630
| $16,175
| $10,922
|
Ratios of expenses to average net assets:
| | | | | |
Before reimbursement of expenses by Adviser (%)
| 2.49
| 2.69
| 2.64
| 2.62
| 2.65
|
After reimbursement of expenses by Adviser (%)
| 2.35
| 2.35
| 2.35
| 2.35
| 2.35
|
Ratio of net investment income to average net assets
| | | | | |
After reimbursement of expenses by Adviser (%)
| 1.09
| 1.04
| 0.41
| 0.32
| 0.41
|
Portfolio Turnover2 | 82
| 69
| 79
| 63
| 64
|
1 | Total return without applicable sales charge.
|
2 | Portfolio Turnover is calculated at the fund level and represents the entire fiscal year or period.
|
See accompanying Notes to Financial Statements.
93
Financial Highlights for a Share of Beneficial Interest Outstanding
INTERNATIONAL STOCK FUND |
| | Year Ended October 31,
| Inception
to 10/31/061 |
| | 2009
| 2008
| 2007
| |
CLASS Y
| | | | |
Net Asset Value at beginning of period
| $8.48
| $17.08
| $15.68
| $14.57
|
Income from Investment Operations: | | | | |
Net investment income
| 0.16
| 0.31
| 0.17
| 0.01
|
Net realized and unrealized gain (loss) on investments
| 1.70
| (6.12)
| 2.96
| 1.10
|
Total from investment operations
| 1.86
| (5.81)
| 3.13
| 1.11
|
Less Distributions: | | | | |
Distributions from net investment income
| (0.18)
| (0.28)
| (0.15)
| –
|
Distributions from capital gains
| (0.21)
| (2.51)
| (1.58)
| –
|
Total distributions
| (0.39)
| (2.79)
| (1.73)
| –
|
Net increase (decrease) in net asset value
| 1.47
| (8.60)
| 1.40
| 1.11
|
Net Asset Value at end of period
| $9.95
| $8.48
| $17.08
| $15.68
|
Total Return (%)2 | 23.25
| (40.41)
| 21.59
| 7.623 |
Ratios/Supplemental Data: | | | | |
Net Assets at end of period (in 000’s)
| $120,187
| $81,569
| $60,525
| $9,025
|
Ratios of expenses to average net assets:
| | | | |
Before reimbursement of expenses by Adviser (%)
| 1.47
| 1.68
| 1.66
| 1.724 |
After reimbursement of expenses by Adviser (%)
| 1.35
| 1.35
| 1.35
| 1.354 |
Ratio of net investment income to average net assets
| | | | |
After reimbursement of expenses by Adviser (%)
| 2.07
| 2.25
| 1.48
| 0.484 |
Portfolio Turnover5 | 82
| 69
| 79
| 633 |
1 | Commenced investment operations June 30, 2006.
|
2 | Total return without applicable sales charge.
|
3 | Not annualized.
|
4 | Annualized.
|
5 | Portfolio Turnover is calculated at the fund level and represents the entire fiscal year or period.
|
See accompanying Notes to Financial Statements.
94
Notes to Financial Statements
1. ORGANIZATION
The MEMBERS Mutual Funds, a Delaware business trust (the “Trust”), is registered under the Investment Company Act of 1940, as amended (the “1940 Act”), as a diversified, open-end, management investment company. As of October 31, 2009, the Trust offered fourteen funds (individually, a “Fund,” collectively, the “Funds”). The Declaration of Trust permits the Trustees to issue an unlimited number of shares of beneficial interest of the Trust without par value. Through June 30, 2009, the Trust had entered into a management agreement with MEMBERS Capital Advisors, Inc. (“MCA”). Effective July 1, 2009, the Trust entered into an Investment Advisory Agreement with Madison Asset Management, LLC (the “Investment Adviser”). The Investment Adviser, in turn, entered into subadvisory agreements with certain subadvisers (“Subadvisers”) for the management of the investments of the High Income Fund, Small Cap Value Fund, Small Cap Growth Fund and International Stock Fund. In addition, through June 30, 2009 MCA had entered into a subadvisory agreement for the management of the Mid Cap Growth Fund and a portion of the Mid Cap Value Fund. The accompanying financial statements include the Cash Reserves, Bond, High Income, Diversified Income, Large Cap Value, Large Cap Growth, Mid Cap Value, Mid Cap Growth, Small Cap Value, Small Cap Growth, and International Stock Funds (collectively, the “Core Funds”), and the Conservative Allocation, Moderate Allocation, and Aggressive Allocation Funds (collectively, the “Target Allocation Funds”). The Core Funds, excluding the Cash Reserves and Diversified Income Funds, offer three classes of shares: Class A, B and Y; the Target Allocation Funds offer three classes of shares: Class A, B and C; and the Cash Reserves Fund and the Diversified Income Fund offer two classes of shares: Class A and B. Each class of shares represents an interest in the assets of the respective fund and has identical voting, dividend, liquidation and other rights, except that each class of shares bears its own distribution fees and servicing fees, if any, and its proportional share of fund level expenses, is subject to its own sales charges, if any, and has exclusive voting rights on matters pertaining to Rule 12b-1 of the 1940 Act as it relates to that class and other class-specific matters.
2. SIGNIFICANT ACCOUNTING POLICIES
The preparation of financial statements requires management to make estimates and assumptions that affect the reported amounts of assets and liabilities and disclosure of contingent assets and liabilities at the date of the financial statements and the reported amounts of income and expenses during the reported period. Actual results could differ from those estimates. The following is a summary of significant accounting policies consistently followed by each Fund in the preparation of its financial statements.
Portfolio Valuation: Securities and other investments are valued as follows: Equity securities and exchange-traded funds (“ETFs”) listed on any U.S. or foreign stock exchange or quoted on the NASDAQ are valued at the last quoted sale price or official closing price on that exchange or NASDAQ on the valuation day (provided that, for securities traded on NASDAQ, the Funds utilize the NASDAQ Official Closing Price). If no sale occurs, (a) equities traded on a U.S. exchange are valued at the mean between the closing bid and closing asked prices and (b) equity securities traded on a foreign exchange are valued at the official bid price. Debt securities purchased with a remaining maturity of 61 days or more are valued by a pricing service selected by the Trust or on the basis of dealer-supplied quotations. Investments in shares of open-ended mutual funds, including money market funds, are valued at their daily net asset value (“NAV”) which is calculated as of 3:00 p.m. Central Time on each day on which the New York Stock Exchange is open for business. NAV per share is determined by dividing each fund’s total net assets by the number of shares of such fund outstanding at the time of calculation. The assets of the Target Allocation Funds consist of shares of the underlying funds, the NAV of each Target Allocation Fund is determined based on the NAVs of the underlying funds. Total net assets are determined by adding the total current value of portfolio securities, cash, receivables, and other assets and subtracting liabilities. Short-term instruments having maturities of 60 days or less and all securities in the Cash Reserves Fund are valued on an amortized cost basis, which approximates market value.
95
Notes to Financial Statements
Over-the-counter securities not listed or traded on NASDAQ are valued at the last sale price on the valuation day. If no sale occurs on the valuation day, an over-the-counter security is valued at the mean between the last bid and asked prices. Over-the-counter options are valued based upon prices provided by market makers in such securities or dealers in such currencies. Exchange traded options are valued at the last sale or bid price on the exchange where such option contract is principally traded. Financial futures contracts generally are valued at the settlement price established by the exchange(s) on which the contracts are primarily traded. The Funds’ Pricing Committee (the “Committee”) shall estimate the fair value of futures positions affected by the daily limit by using its valuation procedures for determining fair value, when necessary. Spot and forward foreign currency exchange contracts are valued based on quotations supplied by dealers in such contracts. Overnight repurchase agreements are valued at cost, and term repurchase agreements (i.e., those whose maturity exceeds seven days), swaps, caps, collars and floors are valued at the average of the closing bids obtained daily from at least one dealer.
The value of all assets and liabilities expressed in foreign currencies will be converted into U.S. dollar values using the then-current exchange rate as of Noon Eastern Standard Time on each day that the New York Stock Exchange is open for business.
All other securities for which either quotations are not readily available, no other sales have occurred, or in the Investment Adviser’s opinion, do not reflect the current market value, are appraised at their fair values as determined in good faith by the Committee and under the general supervision of the Board of Trustees. When fair value pricing of securities is employed, the prices of securities used by the Funds to calculate NAV may differ from market quotations or official closing prices. Because the Target Allocation Funds primarily invest in underlying funds, government securities and short-term paper, it is not anticipated that the Investment Adviser will need to “fair” value any of the investments of these funds. However, an underlying fund may need to “fair” value one or more of its investments, which may, in turn, require a Target Allocation Fund to do the same because of delays in obtaining the underlying fund’s NAV.
A Fund’s investments (or underlying fund) will be valued at fair value if, in the judgment of the Committee, an event impacting the value of an investment occurred between the closing time of a security’s primary market or exchange (for example, a foreign exchange or market) and the time the fund’s share price is calculated at 3:00 p.m. Central Time. Significant events may include, but are not limited to, the following: (1) significant fluctuations in domestic markets, foreign markets or foreign currencies; (2) occurrences not directly tied to the securities markets such as natural disasters, armed conflicts or significant government actions; and (3) major announcements affecting a single issuer or an entire market or market sector. In responding to a significant event, the Committee would determine the fair value of affected securities considering factors including, but not limited to: fundamental analytical data relating to the investment; the nature and duration of any restrictions on the disposition of the investment; and the forces influencing the market(s) in which the investment is purchased or sold. The Committee may rely on an independent fair valuation service to adjust the valuations of foreign equity securities based on specific market-movement parameters established by the Committee and approved by the Funds.
Security Transactions and Investment Income: Security transactions are accounted for on a trade date basis. Net realized gains or losses on sales are determined by the identified cost method. Interest income is recorded on an accrual basis. Dividend income is recorded on ex-dividend date. Amortization and accretion are recorded on the effective yield method.
Federal Income Taxes: It is each Fund’s policy to comply with the requirements of Subchapter M of the Internal Revenue Code of 1986 applicable to regulated investment companies and to distribute substantially all it’s taxable income to its shareholders. Accordingly, no provisions for federal income taxes are recorded in the accompanying financial statements.
The Funds have not recorded any liabilities for material unrecognized tax benefits as of October 31, 2009. It is the funds’ policy to recognize accrued interest and penalties related to uncertain tax benefits in income taxes, as appropriate. Tax years that remain open to examination by major tax jurisdictions include tax years ended October 31, 2006 through October 31, 2009.
96
Notes to Financial Statements
Expenses: Expenses that are directly related to one Fund are charged directly to that Fund. Other operating expenses are prorated to the Funds on the basis of relative net assets. Class-specific expenses are borne by that class.
Classes: Income and realized and unrealized gains/losses are allocated to the respective classes on the basis of relative net assets.
Repurchase Agreements: Each Fund may engage in repurchase agreements. In a repurchase agreement, a security is purchased for a relatively short period (usually not more than 7 days) subject to the obligation to sell it back to the issuer at a fixed time and price plus accrued interest. The Funds will enter into repurchase agreements only with members of the Federal Reserve System and with “primary dealers” in U.S. Government securities. As of October 31, 2009, none of the Funds had open repurchase agreements.
The Trust has established a procedure providing that the securities serving as collateral for each repurchase agreement must be delivered to the Funds’ custodian either physically or in book-entry form and that the collateral must be marked to market daily to ensure that each repurchase agreement is fully collateralized at all times. In the event of bankruptcy or other default by a seller of a repurchase agreement, a Fund could experience one of the following: delays in liquidating the underlying securities during the period in which the Fund seeks to enforce its rights thereto, possible subnormal levels of income, declines in value of the underlying securities, or lack of access to income during this period and the expense of enforcing its rights.
Foreign Currency Transactions: The books and records are maintained in U.S. dollars. Foreign currency denominated transactions (i.e., market value of investment securities, assets and liabilities, purchases and sales of investment securities, and income and expenses) are translated into U.S. dollars at the current rate of exchange.
Each Fund, except the Cash Reserves Fund, reports certain foreign currency-related transactions as components of realized gains or losses for financial reporting purposes, whereas such components are treated as ordinary income for federal income tax purposes. Net realized gains of $3,765,261 are included in the Statements of Operations under the heading “Net realized loss on investments” for the International Stock Fund. The Cash Reserves Fund can only invest in U.S. dollar-denominated foreign money market securities.
The Funds do not isolate the portion of gains and losses on investments in securities that is due to changes in the foreign exchange rates from that which is due to change in market prices of securities. Such amounts are categorized as gain or loss on investments for financial reporting purposes.
Forward Foreign Currency Exchange Contracts: Each Fund, except the Cash Reserves Fund, may purchase and sell forward foreign currency exchange contracts for defensive or hedging purposes. When entering into forward foreign currency exchange contracts, the Funds agree to receive or deliver a fixed quantity of foreign currency for an agreed-upon price on an agreed future date. These contracts are valued daily. The Funds’ net assets reflect unrealized gains or losses on the contracts as measured by the difference between the forward foreign currency exchange rates at the dates of entry into the contracts and the forward rates at the reporting date. The Funds realize a gain or a loss at the time the forward foreign currency exchange contracts are settled or closed out with an offsetting contract. As of October 31, 2009, none of the Funds had open forward foreign currency exchange contracts.
If a Fund enters into a forward foreign currency exchange contract to buy foreign currency for any purpose, the Fund will be required to place cash or other liquid assets in a segregated account with the Fund’s custodian in an amount equal to the value of the Fund’s total assets committed to the consummation of the forward contract. If the value of the securities in the segregated account declines, additional cash or securities will be placed in the segregated account so that the value of the account will equal the amount of the Fund’s commitment with respect to the contract.
Futures Contracts: Each Fund, except the Cash Reserves Fund, may purchase and sell futures contracts and purchase and write options on futures contracts. The Funds will engage in futures contracts or related options transactions to hedge certain market
97
Notes to Financial Statements
positions. Upon entering into a futures contract, the Fund is required to pledge to the broker an amount of cash, U.S. Government securities or other assets, equal to a certain percentage of the contract (initial margin deposit). Subsequent payments, known as “variation margin,” are made or received by the Fund each day, depending on the daily fluctuations in the fair value of the futures contract. When a Fund enters into a futures contract, the Fund segregates cash or other liquid securities, of any type or maturity, equal in value to the Fund’s commitment. The Fund recognizes a gain or loss equal to the daily change in the value of the futures contracts. Should market conditions move unexpectedly, the Fund may not achieve the anticipated benefits of the futures contracts and may realize a loss. During the year ended October 31, 2009, none of the Funds held futures contracts.
Delayed Delivery Securities: Each Fund may purchase securities on a when-issued or delayed delivery basis. “When-issued” refers to securities whose terms are available and for which a market exists, but that have not been issued. For when-issued or delayed delivery transactions, no payment is made until delivery date, which is typically longer than the normal course of settlement, and often a month or more after the purchase. When a Fund enters into an agreement to purchase securities on a when-issued or delayed delivery basis, the Fund segregates cash or other liquid securities, of any type or maturity, equal in value to the Fund’s commitment. Losses may arise due to changes in the market value of the underlying securities, if the counterparty does not perform under the contract, or if the issuer does not issue the securities due to political, economic or other factors. As of October 31, 2009, the High Income Fund had entered into such transactions, the market values of which are identified in the Fund’s Portfolio of Investments.
Reclassification Adjustments: Paid-in capital, undistributed net investment income, and accumulated net realized gain (loss) have been adjusted in the Statements of Assets and Liabilities for permanent book-tax differences for all funds. Differences primarily relate to the tax treatment of net operating losses, paydown gains and losses, foreign currency gains and losses, and distributions from real estate investment trusts and passive foreign investment companies.
To the extent these book and tax differences are permanent in nature, such amounts are reclassified at the end of the fiscal year among paid-in capital in excess of par value, undistributed net investment income (loss) and undistributed net realized gain (loss) on investments and foreign currency translations. Accordingly, at October 31, 2009 reclassifications were recorded as follows:
Fund | Paid-in Capital
| Undistributed Net
Investment Income (Loss)
| Accumulated Net
Realized Gain (Loss)
|
Conservative Allocation
| $ (5,588)
| $ 37, 198
| $ (31,610)
|
Moderate Allocation
| (3,308)
| 44,788
| (41,480)
|
Aggressive Allocation
| (5,331)
| 5,091
| 240
|
Cash Reserves
| (746)
| 746
| –
|
Bond
| –
| (29,443)
| 29,443
|
High Income
| (1,720,815)
| 8,131
| 1,712,684
|
Diversified Income
| (33,534)
| (33,927)
| 67,461
|
Large Cap Value
| (2,076)
| (38,287)
| 40,363
|
Large Cap Growth
| (64,951)
| 11,915
| 53,036
|
Mid Cap Value
| (74)
| (55,428)
| 55,502
|
Mid Cap Growth
| (212,269)
| 212,269
| –
|
Small Cap Value
| –
| (36,389)
| 36,389
|
Small Cap Growth
| (64,735)
| 55,220
| 9,515
|
International Stock
| (46,885)
| 10,152
| 36,733
|
Redemption Fees: To help offset any costs associated with short-term shareholder trading, the Small Cap Value Fund, Small Cap Growth Fund, and the International Stock Fund will deduct a fee of 2% from redemption proceeds on Class A and Class B shares
98
Notes to Financial Statements
held 30 calendar days or less. Redemption fees are treated as additional paid-in capital to the Fund from which the shares are redeemed. No redemption fees were earned during the year ended October 31, 2009.
2. Fair Value Measurements: Each Fund has adopted the Financial Accounting Standards Board (“FASB”) guidance on fair value measurements. Fair value is defined as the price that each Fund would receive upon selling an investment in a timely transaction to an independent buyer in the principal or most advantageous market of the investment. A three-tier hierarchy is used to maximize the use of observable market data “inputs” and minimize the use of unobservable “inputs” and to establish classification of fair value measurements for disclosure purposes. Inputs refer broadly to the assumptions that market participants would use in pricing the asset or liability, including assumptions about risk (for example, the risk inherent in a particular valuation technique used to measure fair value including such a pricing model and/or the risk inherent in the inputs to the valuation technique). Inputs may be observable or unobservable. Observable inputs are inputs that reflect the assumptions market participants would use in pricing the asset or liability developed based on market data obtained from sources independent of the reporting entity. Unobservable inputs are inputs that reflect the reporting entity’s own assumptions about the assumptions market participants would use in pricing the asset or liability developed based on the best information available in the circumstances. The three-tier hierarchy of inputs is summarized in the three broad Levels listed below:
Level 1 – quoted prices in active markets for identical investments
Level 2 – other significant observable inputs (including quoted prices for similar investments, interest rates, prepayment speeds, credit risk, etc.)
Level 3 – significant unobservable inputs (including the Fund’s own assumptions in determining the fair value of investments)
In April 2009, the FASB also issued guidance on how to determine the fair value of assets and liabilities when the volume and level of activity for the asset/liability have significantly decreased as well as guidance on identifying circumstances that indicate a transaction is not orderly. The valuation techniques used by the Funds to measure fair value for the year ended October 31, 2009 maximized the use of observable inputs and minimized the use of unobservable inputs. As of October 31, 2009, only the International Stock Fund held securities deemed as Level 3. Those securities were valued at $0.
The following is a summary of the inputs used as of October 31, 2009 in valuing the Funds’ investments carried at market value:
Fund
| Quoted Prices in
Active Markets for
Identical Investments
(Level 1)
| Significant Other
Observable
Inputs
(Level 2)
| Significant
Unobservable
Inputs
(Level 3)
| Value at
10/31/2009
|
Conservative Allocation1 | $36,693,275
| $ –
| $ –
| $36,693,275
|
Moderate Allocation1 | 87,989,628
| –
| –
| 87,989,628
|
Aggressive Allocation1 | 29,842,750
| –
| –
| 29,842,750
|
Cash Reserves2 | 631,774
| 16,290,471
| –
| 16,922,245
|
Bond
| | | | |
Asset Backed
| –
| 2,144,333
| –
| 2,144,333
|
Corporate Notes and Bonds
| –
| 36,398,378
| –
| 36,398,378
|
Mortgage Backed
| –
| 39,962,856
| –
| 39,962,856
|
U.S. Government and Agency Obligations
| –
| 112,945,237
| –
| 112,945,237
|
Investment Companies
| 7,566,106
| –
| –
| 7,566,106
|
| | 7,566,106
| 191,450,804
| –
| 199,016,910
|
99
Notes to Financial Statements
Fund
| Quoted Prices in
Active Markets for
Identical Investments
(Level 1)
| Significant Other
Observable
Inputs
(Level 2)
| Significant
Unobservable
Inputs
(Level 3)
| Value at
10/31/2009
|
High Income
| | | | |
Corporate Notes and Bonds
| $ –
| $104,567,776
| $ –
| $104,567,776
|
Certificate of Deposit
| –
| 352,864
| –
| 352,864
|
Investment Companies
| 4,977,999
| –
| –
| 4,977,999
|
| | 4,977,999
| 104,920,640
| –
| 109,898,639
|
Diversified Income
| | | | |
Common Stocks
| 38,082,389
| –
| –
| 38,082,389
|
Asset Backed
| –
| 1,126,471
| –
| 1,126,471
|
Corporate Notes and Bonds
| –
| 18, 448,933
| –
| 18,448,933
|
Mortgage Backed
| –
| 15,962,648
| –
| 15,962,648
|
U.S. Government and Agency Obligations
| –
| 13,546,961
| –
| 13,546,961
|
Investment Companies
| 1,661,647
| –
| –
| 1,661,647
|
| | 39,744,036
| 49,085,013
| –
| 88,829,049
|
Large Cap Value1 | 145,740,627
| –
| –
| 145,740,627
|
Large Cap Growth2 | | | | |
Common Stocks
| 150,301,927
| –
| –
| 150,301,927
|
Certificate of Deposit
| –
| 4,787,164
| –
| 4,787,164
|
Investment Companies
| 9,900,626
| –
| –
| 9,900,626
|
| | 160,202,553
| 4,787,164
| –
| 164,989,717
|
Mid Cap Value1 | 29,861,151
| –
| –
| 29,861,151
|
Mid Cap Growth2 | 43,354,213
| –
| –
| 43,354,213
|
Small Cap Value1 | 21,842,090
| –
| –
| 21,842,090
|
Small Cap Growth1 | 15,442,653
| –
| –
| 15,442,653
|
International Stock3 | | | | |
Common Stocks
| | | | |
Australia3 | –
| 1,614,320
| –
| 1,614,320
|
Belgium
| –
| 3,026,482
| –
| 3,026,482
|
Brazil
| –
| 4,305,983
| –
| 4,305,983
|
Canada
| –
| 2,016,302
| –
| 2,016,302
|
China
| –
| 1,989,965
| –
| 1,989,965
|
Denmark
| –
| 1,477,730
| –
| 1,477,730
|
France
| –
| 12,949,383
| –
| 12,949,383
|
Germany
| –
| 12,373,163
| –
| 12,373,163
|
Hong Kong
| –
| 3,826,552
| –
| 3,826,552
|
India
| –
| 918,612
| –
| 918,612
|
Ireland
| –
| 1,979,194
| –
| 1,979,194
|
Italy
| –
| 1,468,659
| –
| 1,468,659
|
Japan
| –
| 23,331,221
| –
| 23,331,221
|
Mexico
| –
| 1,366,816
| –
| 1,366,816
|
Netherlands
| –
| 2,349,168
| –
| 2,349,168
|
Norway
| –
| 1,523,186
| –
| 1,523,186
|
Russia
| –
| 1,484,948
| –
| 1,484,948
|
Singapore
| –
| 1,335,651
| –
| 1,335,651
|
Spain
| –
| 4,668,963
| –
| 4,668,963
|
Sweden
| –
| 1,827,504
| –
| 1,827,504
|
Switzerland
| –
| 17,146,398
| –
| 17,146,398
|
Turkey
| –
| 1,064,365
| –
| 1,064,365
|
United Kingdom
| –
| 39,433,972
| –
| 39,433,972
|
Investment Companies
| 1,820,360
| –
| –
| 1,820,360
|
| | $1,820,360
| $143,478,537
| $ –
| $145,298,897
|
1 At October 31, 2009 all investments are Level 1, see respective Portfolio of Investments. 2 At October 31, 2009 all Level 2 securities held are Short Term Investments, see respective Portfolio of Investments. 3 At October 31, 2009 all Level 3 securities held were valued at $0, see respective Portfolio of Investments. |
100
Notes to Financial Statements
The following is a reconciliation of the fair valuations using significant unobservable inputs (Level 3) for the Funds during the year ended October 31, 2009:
Fund
| Fair Value
Beginning Balance
11/1/2008
| Purchases at
Cost/Sales
(Proceeds)
| Amortization
Disc/(Prem)
| Realized
Gain/(Loss)
| Unrealized
Gain/(Loss)
| Fair Value
Ending Balance
10/31/2009
|
International Stock
| $9,375
| $ –
| $ –
| $ –
| $(9,375)
| $ –
|
3. ADVISORY, ADMINISTRATION AND DISTRIBUTION AGREEMENTS
Advisory Agreement. For its investment advisory services to the Funds, the Investment Adviser is entitled to receive a fee, which is computed daily and paid monthly, at an annualized percentage rate of the average daily value of the net assets of each Fund as follows: 0.20% for each of the Target Allocation Funds; 0.40% for the Cash Reserves Fund; 0.50% for the Bond Fund; 0.55% for the High Income Fund; 0.65% for the Diversified Income Fund; 0.55% for the Large Cap Value Fund; 0.75% for the Large Cap Growth Fund; 0.95% for the Mid Cap Value Fund, 0.75% for the Mid Cap Growth Fund; 1.00% for the Small Cap Value Fund; 1.00% for the Small Cap Growth Fund; and 1.05% for the International Stock Fund. Except for the Target Allocations Funds, each fund’s management fee will be reduced by 0.05% on assets exceeding $500 million, and by another 0.05% on assets exceeding $1 billion. The Investment Adviser is solely responsible for the payment of all fees to the Subadvisers. The Subadvisers for the Funds at October 31, 2009, are Shenkman Capital Management, Inc. for the High Income Fund, Wellington Management Company, LLP for the Small Cap Value Fund, Paradigm Asset Management Company, LLC for the Small Cap Growth Fund, and Lazard Asset Management LLC for the International Stock Fund.
The Investment Adviser may from time to time voluntary agree to waive a portion of its fees or expenses related to the Funds. In that regard, the Investment Adviser waived a portion of management fees on the Cash Reserves Fund Class A Shares and Class B Shares for the purpose of maintaining a one-day yield of zero. The amount of the daily waiver is equal to the amount required to maintain a minimum daily distribution rate of zero. For the twelve-month period ended October 31, 2009, the waivers totaled $35,893 for Class A Shares and $9,718 for Class B Shares and are reflected as fees waived in the accompanying Statement of Operations.
Reimbursement Agreement. For the period November 1, 2008 through June 30, 2009 the previous investment adviser, MEMBERS Capital Advisors Inc. (“MCA”), contractually agreed to reimburse all ordinary expenses, other than management, 12b-1, and service fees, of each fund in excess of certain percentages of the average daily net assets of the fund. The contractual agreement included a provision that the reimbursement to a fund was subject to repayment by the fund, to the extent that the fund was able to make the repayment within its expense cap.
For the period November 1, 2008 through June 30, 2009 the amounts reimbursed by MCA to the funds were as follows: $72,625 for the Conservative Allocation Fund, $64,506 for the Moderate Allocation Fund, $104,132 for the Aggressive Allocation Fund, $99,431 for the Cash Reserves Fund, $67,712 for the Bond Fund, $42,061 for the High Income Fund, $154,461 for the Diversified Income Fund, $5,566 for the Large Cap Value Fund, $144,730 for the Large Cap Growth Fund, $126,516 for the Mid Cap Value Fund, $57,730 for the Mid Cap Growth Fund, $63,438 for the Small Cap Value Fund, $68,358 for the Small Cap Growth Fund, and $154,143 for the International Stock Fund.
The Reimbursement Agreement was terminated effective as of the close of business on June 30, 2009.
Services Agreement. Effective July 1, 2009, under a separate Services Agreement, the new investment adviser, Madison Asset Management, LLC (“Madison”), provides or arranges for each Fund to have all of the necessary operational and support services it needs for a fee. These fees are computed daily and paid monthly, at an annualized percentage rate of the average daily value of the net assets of each Fund as follows: 0.25% for each of the Conservative, Moderate and Aggressive Allocation Funds; 0.15% for the
101
Notes to Financial Statements
Cash Reserves Fund; 0.15% for the Bond Fund; 0.20% for the High Income Fund; 0.20% for the Diversified Income Fund; 0.36% for the Large Cap Value Fund; 0.20% for the Large Cap Growth Fund; 0.20% for the Mid Cap Value Fund, 0.40% for the Mid Cap Growth Fund; 0.25% for the Small Cap Value Fund; 0.25% for the Small Cap Growth Fund; and 0.30% for the International Stock Fund. While the Funds pay the expenses of the Funds’ Independent Trustees and independent auditors directly (the “Direct Fees”), these expenses come out of the service fee so that they do not represent an additional expense to the Funds above and beyond the service fee. The Direct Fees are reflected on the statement of operations and have been restated as if the Services Agreement had been in effect for the year ended October 31, 2009.
Distribution Agreement. Mosaic Funds Distributor, LLC (“MFD”) serves as distributor of the Funds. The Trust adopted distribution and/or service plans (the “Plans”) with respect to the Trust’s Class A, B, and C shares pursuant to Rule 12b-1 under the 1940 Act. Under the Plans, the Trust will pay service fees to MFD for Class A, Class B, and Class C shares at an aggregate annual rate of 0.25% of each Fund’s daily net assets attributable to the respective class of shares for all Funds except the Cash Reserves Fund. The Trust will also pay distribution fees to MFD for Class B and Class C shares at an aggregate annual rate of 0.75% of each Fund’s daily net assets attributable to their respective classes. The distribution fees are used to reimburse MFD for its distribution expenses with respect to Class B and Class C only, including but not limited to: (1) initial and ongoing sales compensation to selling brokers and others engaged in the sale of fund shares, (2) marketing, promotional and overhead expenses incurred in connection with the distribution of fund shares, and (3) interest expenses on unreimbursed distribution expenses. The service fees are used by MFD to compensate selling brokers and others for providing personal and account maintenance services to shareholders. Fees incurred by the Funds under the Plans are detailed in the statement of operations.
Front-end sales charges and contingent deferred sales charges (“CDSC”) do not represent expenses of the Funds. Rather, they are deduced from the proceeds of sales of Fund shares prior to investment or from redemption proceeds prior to remittance, as applicable, and paid to MFD. MFD, in turn, uses a portion of these fees to pay financial advisors who sell Fund shares, as disclosed in the prospectus. The sales charges retained by MFD from the sales of shares (Class A shares) and the CDSC retained by MFD on the redemption of shares (Class A, B and C shares) for the period July 1, 2009 through October 31, 2009, were as follows:
Fund | Class A
| Class B
| Class C
| | Fund | Class A
| Class B
|
Conservative Allocation
| $80,156
| $8,083
| $503
| | Large Cap Value
| $20,514
| $3,768
|
Moderate Allocation
| 176,400
| 19,297
| 329
| | Large Cap Growth
| 16,370
| 4,220
|
Aggressive Allocation
| 76,547
| 6,336
| | | Mid Cap Value
| 8,523
| 1,633
|
Cash Reserves
| –
| 7,995
| | | Mid Cap Growth
| 9,463
| 1,817
|
Bond
| 18,989
| 4,294
| | | Small Cap Value
| 945
| –
|
High Income
| 24,239
| 1,253
| | | Small Cap Growth
| 728
| –
|
Diversified Income
| 19,654
| 5,210
| | | International Stock
| 14,250
| 1,837
|
For the period November 1, 2008 through June 30, 2009, CUNA Brokerage Services, Inc. served as the Funds’ distributor for which it retained sales charges and CDSCs as follows:
Fund | Class A
| Class B
| Class C
| | Fund | Class A
| Class B
|
Conservative Allocation
| $133,746
| $23,634
| $2,317
| | Large Cap Value
| $35,148
| $12,815
|
Moderate Allocation
| 314,154
| 42,935
| 2,516
| | Large Cap Growth
| 32,502
| 11,749
|
Aggressive Allocation
| 132,086
| 13,208
| 534
| | Mid Cap Value
| 22,971
| 5,145
|
Cash Reserves
| –
| 28,804
| | | Mid Cap Growth
| 19,889
| 5,772
|
Bond
| 38,116
| 12,489
| | | Small Cap Value
| 1,514
| 89
|
High Income
| 39,140
| 6,232
| | | Small Cap Growth
| 2,598
| 145
|
Diversified Income
| 50,006
| 27,185
| | | International Stock
| 23,050
| 8,646
|
102
Notes to Financial Statements
The distributor may from time to time voluntary agree to waive a portion of its fees or expenses related to the Funds. In that regard, the distributor waived a portion of 12b-1 fees on the Cash Reserves Fund Class B Shares for the purpose of maintaining a one-day yield of zero. The amount of the daily waiver is equal to the amount required to maintain a minimum daily distribution rate of zero. For the twelve-month period ended October 31, 2009, the waivers totaled $31,526 and are reflected as fees waived in the accompanying Statement of Operations.
Officers and Trustees. Certain officers and trustees of the Funds are also officers of Madison. With the exception of the then-acting Chief Compliance Officer, the Funds did not compensate their officers or affiliated trustees. The Funds paid a pro rata portion of the Chief Compliance Officer’s annual salary through June 30, 2009. Unaffiliated trustees were compensated by the Trust directly for their service through June 30, 2009, and pursuant to the Services Agreement thereafter.
4. DIVIDENDS FROM NET INCOME AND DISTRIBUTIONS OF CAPITAL GAINS
With respect to dividends from net investment income, the Cash Reserves Fund declares dividends daily and reinvests monthly. The Bond Fund, High Income Fund and Diversified Income Fund declare and reinvest dividends monthly. The Conservative Allocation Fund declares and reinvests dividends quarterly. Moderate Allocation, Aggressive Allocation, Large Cap Value Fund, Large Cap Growth Fund, Mid Cap Value Fund, Mid Cap Growth Fund, Small Cap Value Fund, Small Cap Growth Fund, and the International Stock Fund declare and reinvest dividends annually. The Funds distribute net realized gains from investment transactions, if any, to shareholders annually.
Income and capital gain distributions, if any, are determined in accordance with federal income tax regulations, which may differ from accounting principles generally accepted in the United States of America. Taxable distributions from income and realized capital gains in the Funds differ from book amounts earned during the period due to differences in the timing of capital gains recognition, and due to the reclassification of certain gains or losses from capital to income. Dividends from net investment income are determined on a class level. Capital gains are determined on a Fund level.
5. SECURITIES TRANSACTIONS
For the year ended October 31, 2009, aggregate cost of purchases and proceeds from sales of securities, other than short-term investments, were as follows:
| | U.S. Government Securities
| Other Investment Securities
|
Fund
| Purchases
| Sales
| Purchases
| Sales
|
Conservative Allocation
| $ –
| $ –
| $16,443,766
| $11,593,507
|
Moderate Allocation
| –
| –
| 29,392,874
| 22,275,270
|
Aggressive Allocation
| –
| –
| 8,711,412
| 3,980,966
|
Bond
| 78,131,667
| 46,602,393
| 10,761,553
| 15,333,550
|
High Income
| –
| –
| 95,176,304
| 57,399,674
|
Diversified Income
| 7,247,276
| 6,509,351
| 16,950,698
| 29,138,402
|
Large Cap Value
| –
| –
| 119,317,339
| 15,097,694
|
Large Cap Growth
| –
| –
| 143,101,468
| 134,083,576
|
Mid Cap Value
| –
| –
| 29,603,765
| 32,906,366
|
Mid Cap Growth
| –
| –
| 71,620,699
| 74,484,583
|
Small Cap Value
| –
| –
| 7,744,716
| 3,512,099
|
Small Cap Growth
| –
| –
| 17,352,717
| 14,730,150
|
International Stock
| –
| –
| 109,820,078
| 95,882,317
|
103
Notes to Financial Statements
6. FOREIGN SECURITIES
Each Fund may invest in foreign securities, however, the Cash Reserves Fund is limited to U.S. dollar-denominated foreign money market securities. Foreign securities refer to securities that are: (1) issued by companies organized outside the U.S. or whose principal operations are outside the U.S., (2) issued by foreign governments or their agencies or instrumentalities, (3) principally traded outside the U.S., or (4) quoted or denominated in a foreign currency. Foreign securities include American Depositary Receipts (“ADRs”), European Depositary Receipts (“EDRs”), Global Depositary Receipts (“GDRs”), Swedish Depositary Receipts (“SDRs”) and foreign money market securities. Dollar-denominated securities that are part of the Merrill Lynch U.S. Domestic Master Index are not considered a foreign security.
Certain of the Funds have reclaim receivable balances, in which the Funds are due a reclaim on the taxes that have been paid to some foreign jurisdictions. The values of all reclaims are not significant for any of the Funds and are reflected in Other Assets on the Statement of Assets and Liabilities. On a periodic basis, these receivables are reviewed to ensure the current receivable balance is reflective of the amount deemed to be collectible.
7. SECURITIES LENDING
Each Fund, except the Target Allocation, Cash Reserves, Small Cap Value, and Small Cap Growth Funds, entered into a Securities Lending Agreement (the “Agreement”) with State Street Bank and Trust Company (“State Street”). Under the terms of the Agreement, the Funds may lend portfolio securities to qualified borrowers in order to earn additional income. The Agreement requires that loans are collateralized at all times by cash or other liquid assets at least equal to 102% of the value of the securities, which is determined on a daily basis. At October 31, 2009, none of the Funds were engaged in securities lending.
Amounts earned as interest on investments of cash collateral, net of rebates and fees, are included in the Statement of Operations.
The primary risk associated with securities lending is if the borrower defaults on its obligation to return the securities loaned because of insolvency or other reasons, the Funds could experience delays and costs in recovering securities loaned or in gaining access to the collateral.
8. TAX INFORMATION
The tax character of distributions paid during the years ended October 31, 2009 and 2008 was as follows:
| | Ordinary Income
| Long-Term Capital Gain
|
Fund | 2009
| 2008
| 2009
| 2008
|
Conservative Allocation
| $1,276,875
| $ 480,002
| $ –
| $ 60,393
|
Moderate Allocation
| 1,225,930
| 1,174,561
| –
| 377,700
|
Aggressive Allocation
| 76,578
| 232,391
| –
| 212,760
|
Cash Reserves
| 12,491
| 350,356
| –
| –
|
Bond
| 5,760,220
| 5,364,596
| –
| –
|
High Income
| 6,913,718
| 5,624,536
| –
| –
|
Diversified Income
| 3,665,946
| 4,615,505
| –
| 10,885,869
|
Large Cap Value
| 2,814,901
| 2,252,854
| –
| 1,207,706
|
Large Cap Growth
| 336,551
| –
| –
| –
|
Mid Cap Value
| 353,103
| 2,175,848
| –
| 6,033,431
|
Mid Cap Growth
| –
| –
| –
| 577,694
|
Small Cap Value
| 131,772
| 568,226
| –
| –
|
Small Cap Growth
| –
| 310,339
| –
| –
|
International Stock
| 2,316,059
| 2,447,159
| 2,827,690
| 14,019,896
|
104
Notes to Financial Statements
The International Stock Fund hereby designates $2,827,690 as a long-term capital gain distribution to its shareholders during the year ended October 31, 2009.
As of October 31, 2009, the components of distributable earnings on a tax basis were as follows:
Fund | Ordinary Income
| | Fund | Ordinary Income
|
Conservative Allocation
| $ 88,495
| | Large Cap Value
| 1,884,254
|
Moderate Allocation
| 653,157
| | Large Cap Growth
| 665,507
|
Aggressive Allocation
| 137,731
| | Mid Cap Value
| 139,340
|
Cash Reserves
| –
| | Mid Cap Growth
| –
|
Bond
| 41,283
| | Small Cap Value
| 47,176
|
High Income
| 108,830
| | Small Cap Growth
| –
|
Diversified Income
| –
| | International Stock
| 2,685,576
|
For federal income tax purposes, the Funds listed below have capital loss carryovers as of October 31, 2009, which are available to offset future capital gains, if any:
Fund | 2010
| 2011
| 2012
| 2013
| 2014
| 2015
| 2016
| 2017
|
Conservative Allocation
| $ –
| $ –
| $ –
| $ –
| $ –
| $ –
| $ 823,887
| $1,619,779
|
Moderate Allocation
| –
| –
| –
| –
| –
| –
| 4,121,648
| 6,462,247
|
Aggressive Allocation
| –
| –
| –
| –
| –
| –
| 1,431,110
| 2,049,055
|
Bond
| –
| –
| 85,623
| 65,261
| 362,802
| 57,909
| -
| 836,574
|
High Income
| 2,445,850
| 614,259
| –
| –
| –
| 72,549
| 4,653,350
| 2,183,308
|
Diversified Income
| –
| –
| –
| –
| –
| –
| 3,638,247
| 14,441,031
|
Large Cap Value
| –
| –
| –
| –
| –
| –
| 9,531,689
| 20,011,738
|
Large Cap Growth
| –
| 1,255,080
| –
| –
| –
| –
| 15,286,497
| 18,608,339
|
Mid Cap Value
| –
| –
| –
| –
| –
| –
| 5,486,237
| 8,971,382
|
Mid Cap Growth
| –
| –
| –
| –
| –
| –
| 5,654,757
| 16,406,364
|
Small Cap Value
| –
| –
| –
| –
| –
| –
| 1,362,749
| 1,697,646
|
Small Cap Growth
| –
| –
| –
| –
| –
| –
| 3,905,861
| 6,563,854
|
International Stock
| –
| –
| –
| –
| –
| –
| –
| 22,902,552
|
The High Income Fund had a capital loss carryover expire unused in the current year in the amount of $1,720,815.
At October 31, 2009, the aggregate gross unrealized appreciation (depreciation) and net unrealized appreciation (depreciation) for all securities as computed on a federal income tax basis for each Fund were as follows:
Fund | Appreciation
| Depreciation
| Net
|
Conservative Allocation
| $938,803
| $2,496,718
| $(1,557,915)
|
Moderate Allocation
| 1,300,289
| 10,682,792
| (9,382,503)
|
Aggressive Allocation
| 344,960
| 5,248,423
| (4,903,463)
|
Bond
| 7,664,346
| 1,117,453
| 6,486,893
|
High Income
| 6,752,496
| 611,311
| 6,141,185
|
Diversified Income
| 5,706,431
| 3,940,968
| 1,765,463
|
Large Cap Value
| 6,786,401
| 11,195,711
| (4,409,310)
|
Large Cap Growth
| 13,974,144
| 3,010,541
| 10,963,603
|
Mid Cap Value
| 1,193,795
| 1,525,263
| (331,468)
|
Mid Cap Growth
| 5,154,624
| 436,848
| 4,717,776
|
Small Cap Value
| 1,693,905
| 1,723,888
| (29,983)
|
Small Cap Growth
| 2,077,292
| 969,886
| 1,107,406
|
International Stock
| 10,136,434
| 5,122,069
| 5,014,365
|
The differences between cost amounts for book purposes and tax purposes are primarily due to the tax deferral of losses.
105
9. CONCENTRATION OF RISK
Investing in certain financial instruments, including forward foreign currency contracts and futures contracts, involves certain risks, other than that reflected in the Statements of Assets and Liabilities. Risks associated with these instruments include potential for an illiquid secondary market for the instruments or inability of counterparties to perform under the terms of the contracts, changes in the value of foreign currency relative to the U.S. dollar and financial statement volatility resulting from an imperfect correlation between the movements in the prices of the instruments and the prices of the underlying securities and interest rates being hedged. The High Income Fund, Mid Cap Growth Fund and International Stock Fund enter into these contracts primarily to protect these funds from adverse currency movements.
Investing in foreign securities involves certain risks not necessarily found in U.S. markets. These include risks associated with adverse changes in economic, political, regulatory and other conditions, changes in currency exchange rates, exchange control regulations, expropriation of assets or nationalization, imposition of withholding taxes on dividend or interest payments or capital gains and possible difficulty in obtaining and enforcing judgments against foreign entities. Further, issuers of foreign securities are subject to different and often less comprehensive, accounting, reporting and disclosure requirements than domestic issuers.
The High Income Fund invests in securities offering high current income which generally will include bonds in the below-investment-grade categories of recognized rating agencies (so-called “junk bonds”). These securities generally involve more credit risk than securities in the higher rating categories. In addition, the trading market for high yield securities may be relatively less liquid than the market for higher-rated securities. The High Income Fund generally invests at least 80% of its assets in high yield securities.
The Target Allocation Funds are structured as fund of funds, meaning that they invest primarily in the shares of other registered investment companies (the “underlying funds”), including ETFs. Thus, each Target Allocation Fund’s investment performance and its ability to achieve its investment goal are directly related to the performance of the underlying funds in which it invests; and the underlying fund’s performance, in turn, depends on the particular securities in which that underlying fund invests and the expenses of that fund. Accordingly, the Target Allocation Funds are subject to the risks of the underlying funds in direct proportion to the allocation of their respective assets among the underlying funds.
Additionally, the Target Allocation Funds are subject to asset allocation risk and manager risk. Manager risk (i.e., fund selection risk) is the risk that the fund(s) selected to fulfill a particular asset class under performs their peer. Asset allocation risk is the risk that the allocation of the fund’s assets among the various asset classes and market segments will cause the fund to under perform other funds with a similar investment objective.
10. CAPITAL SHARES AND AFFILIATED OWNERSHIP
The Target Allocation Funds invest in underlying funds, of which certain underlying funds may be deemed to be under common control because of the same Board of Trustees (the “affiliated underlying funds’’). A summary of the transactions with each affiliated underlying fund during the year ended October 31, 2009 follows:
106
Notes to Financial Statements
Fund/Underlying Fund | Balance of
Shares
Held at
10/31/2008
| Gross
Additions
| Gross
Sales
| Balance of
Shares
Held at
10/31/2009
| Value at
10/31/2009
| Realized
Loss
| Distributions
Received1 |
Conservative Allocation Fund | | | | | | | |
MEMBERS Bond Fund Class Y
| 839,783
| 183,698
| 89,068
| 934,413
| $9,446,915
| $ (7,983)
| $286,325
|
MEMBERS High Income Fund Class Y
| 488,267
| 287,635
| 66,730
| 709,172
| 4,715,994
| (82,844)
| 290,503
|
MEMBERS International Stock Fund Class Y
| 295,746
| 71,050
| 43,257
| 323,539
| 3,219,216
| (296,206)
| 117,989
|
MEMBERS Large Cap Growth Fund Class Y1
| 225,859
| 68,667
| 29,959
| 264,567
| 3,500,225
| (167,039)
| 9,592
|
MEMBERS Large Cap Value Fund Class Y
| 166,865
| 123,447
| 28,643
| 261,669
| 2,768,459
| (208,885)
| 41,666
|
Totals | | | | | $23,650,809 | $(762,957) | $746,075 |
1 Distributions received includes distributions from net investment income and from capital gains from the underlying funds.
Fund/Underlying Fund | Balance of
Shares Held at
10/31/2008
| Gross
Additions
| Gross
Sales
| Balance of
Shares Held at
10/31/2009
| Value at
10/31/2009
| Realized
Loss
| Distributions
Received2 |
Moderate Allocation Fund | | | | | | | |
MEMBERS Bond Fund Class Y
| 1,068,764
| 298,151
| 62,370
| 1,304,545
| $13,188,947
| $ (4,796)
| $401,285
|
MEMBERS High Income Fund Class Y
| 661,435
| 633,185
| 57,997
| 1,236,623
| 8,223,542
| (98,411)
| 536,462
|
MEMBERS International Stock Fund Class Y
| 1,204,052
| 279,612
| 83,750
| 1,399,914
| 13,929,147
| (640,387)
| 492,215
|
MEMBERS Large Cap Growth Fund Class Y
| 734,970
| 172,654
| 51,836
| 855,788
| 11,322,077
| (323,644)
| 32,152
|
MEMBERS Large Cap Value Fund Class Y
| 514,669
| 277,100
| 45,417
| 746,352
| 7,896,399
| (336,770)
| 146,921
|
MEMBERS Mid Cap Growth Fund Class Y1 | 481,604
| 71,329
| 52,715
| 500,218
| 2,501,088
| (178,996)
| --
|
MEMBERS Small Cap Growth Fund Class Y1 | 292,912
| 34,994
| 20,560
| 307,346
| 1,865,592
| (121,546)
| --
|
MEMBERS Small Cap Value Fund Class Y
| 261,345
| 58,642
| 17,723
| 302,264
| 2,484,607
| (86,976)
| 17,755
|
Totals | | | | | $61,411,399 | $(1,791,526) | $1,626,790 |
Fund/Underlying Fund | Balance of
Shares Held at
10/31/2008
| Gross
Additions
| Gross
Sales
| Balance of
Shares Held at
10/31/2009
| Value at
10/31/2009
| Realized
Loss
| Distributions
Received2 |
Aggressive Allocation Fund | | | | | | | |
MEMBERS Bond Fund Class Y
| –
| 99,533
| 4,466
| 95,067
| $ 961,130
| $ (252)
| $ 25,240
|
MEMBERS High Income Fund Class Y
| –
| 288,777
| 11,943
| 276,834
| 1,840,948
| (324)
| 116,399
|
MEMBERS International Stock Fund Class Y
| 487,475
| 122,051
| 35,666
| 573,860
| 5,709,904
| (282,986)
| 195,984
|
MEMBERS Large Cap Growth Fund Class Y
| 286,190
| 95,265
| 19,777
| 361,678
| 4,785,002
| (110,441)
| 12,602
|
MEMBERS Large Cap Value Fund Class Y
| 184,910
| 154,058
| 17,507
| 321,461
| 3,401,060
| (112,859)
| 47,996
|
MEMBERS Mid Cap Growth Fund Class Y1 | 315,566
| 74,522
| 32,665
| 357,423
| 1,787,116
| (102,402)
| --
|
MEMBERS Small Cap Growth Fund Class Y1 | 158,540
| 37,548
| 7,106
| 188,982
| 1,147,123
| (41,155)
| --
|
MEMBERS Small Cap Value Fund Class Y
| 142,343
| 33,104
| 6,108
| 169,339
| 1,391,968
| (27,105)
| 9,171
|
Totals | | | | | $21,024,251 | $(677,524) | $407,392 |
1 Non-income producing.
2 Distributions received includes distributions from net investment income and from capital gains from the underlying funds.
11. Subsequent Events
The initial investment in the fifteenth fund in the Trust, the Equity Income Fund, was made by the Investment Adviser on October 30, 2009. As of October 31, 2009, net assets were $100,000 (comprised solely of cash), shares outstanding were 10,000, and the net asset value per share was $10.00. Shares were offered to the public commencing on November 2, 2009.
107
Notes to Financial Statements
Effective November 30, 2009, the assets of the Small Cap Growth Fund were reorganized into the Small Cap Value Fund, and, together, renamed the Small Cap Fund. Under the Plan of Reorganization, 51,013.3480 Class A, 12,378.6100 Class B, and 2,476,474.9090 Class Y shares of the Small Cap Growth Fund were exchanged for 37,175.8260 Class A, 8,903.3630 Class B, and 1,821,068.1220 Class Y shares of the Small Cap Value Fund in a tax free exchange. Upon the business combination of such Funds, the value of the Small Cap Value Fund’s net assets combined with the Small Cap Growth Fund was $38,000,214.97 before the open of business on November 30, 2009.
On December 10, 2009, the Board of Trustees authorized and approved the Plan of Reorganization where the assets of the Mid Cap Value Fund will be transferred to the Mid Cap Growth Fund. The shareholders of the Mid Cap Value Fund will receive an amount equal to the aggregate net asset value of the shares of the Mid Cap Growth Fund on the date of the reorganization. The reorganization is expected to occur on or about March 1, 2010.
Management has evaluated the impact of all subsequent events on the Funds’ financial statements through December 22, 2009, the date the financial statements were issued and has determined that there were no subsequent events, other than as disclosed above, requiring adjustment or disclosure in the financial statements.
108
Report of Independent Registered Public Accounting Firm
To the Shareholders and Board of Trustees of MEMBERS Mutual Funds:
We have audited the accompanying statements of assets and liabilities, including the portfolios of investments, of MEMBERS Mutual Funds, comprising Conservative Allocation Fund, Moderate Allocation Fund, Aggressive Allocation Fund, Cash Reserves Fund, Bond Fund, High Income Fund, Diversified Income Fund, Large Cap Value Fund, Large Cap Growth Fund, Mid Cap Value Fund, Mid Cap Growth Fund, Small Cap Value Fund, Small Cap Growth Fund, and International Stock Fund (collectively, the “Funds”) as of October 31, 2009, and the related statements of operations for the year then ended, the statements of changes in net assets for each of the two years in the period then ended, and the financial highlights for the periods presented. These financial statements and financial highlights are the responsibility of the Funds’ management. Our responsibility is to express an opinion on these financial statements and financial highlights based on our audits.
We conducted our audits in accordance with the standards of the Public Company Accounting Oversight Board (United States). Those standards require that we plan and perform the audit to obtain reasonable assurance about whether the financial statements and financial highlights are free of material misstatement. The Funds are not required to have, nor were we engaged to perform, an audit of their internal control over financial reporting. Our audits included consideration of internal control over financial reporting as a basis for designing audit procedures that are appropriate in the circumstances, but not for the purpose of expressing an opinion on the effectiveness of the Funds’ internal control over financial reporting. Accordingly, we express no such opinion. An audit also includes examining, on a test basis, evidence supporting the amounts and disclosures in the financial statements, assessing the accounting principles used and significant estimates made by management, as well as evaluating the overall financial statement presentation. Our procedures included confirmation of securities owned as of October 31, 2009, by correspondence with the custodian and brokers; where replies were not received from brokers, we performed other auditing procedures. We believe that our audits provide a reasonable basis for our opinion.
In our opinion, the financial statements and financial highlights referred to above present fairly, in all material respects, the financial positions of each of the Funds as of October 31, 2009, the results of their operations for the year then ended, the changes in their net assets for each of the two years in the period then ended, and the financial highlights for each of the periods presented, in conformity with accounting principles generally accepted in the United States of America.
/s/ DELOITTE & TOUCHE LLP
Chicago, Illinois
December 22, 2009
109
Other Information
FUND EXPENSES PAID BY SHAREHOLDERS
As a shareholder of the Funds, you incur two types of costs: (1) transaction costs, including sales charges (loads) on purchase payments, and redemption fees; and (2) ongoing costs, including management fees; distribution and/or service (12b-1) fees; and other fund expenses. In the most recent six-month period, the Funds limited these ongoing costs; had the Funds not done so, expenses would have been higher. The examples below are intended to help you understand your ongoing costs (in dollars) of investing in the Funds and to compare these costs with the ongoing costs of investing in other mutual funds.
The examples below are based on an investment of $1,000 invested at the beginning of the period and held for the entire six month period ended October 31, 2009. Expenses paid during the period in the tables below are equal to each Fund’s annualized expense ratio, multiplied by the average account value over the period, multiplied by 184/365 (to reflect the one-half fiscal year period).
Actual Expenses
The table below provides information about actual account values using actual expenses and actual returns for the Funds. You may use the information in this table, together with the amount you invested, to estimate the expenses that you paid over the period. Simply divide your account value by $1,000 (for example, an $8,600 account value divided by $1,000 = 8.6), then multiply the result by the number in the table for the Fund you own under the heading entitled “Expenses Paid During Period” to estimate the expenses you paid on your account during this period.
| | CLASS A
| | CLASS B
|
Fund | Beginning
Account
Value
| Ending
Account
Value
| Annual
Expense
Ratio
| Expenses
Paid
During
Period
| | Ending
Account
Value
| Annual
Expense
Ratio
| Expenses
Paid
During
Period |
Conservative Allocation
| $1,000
| $1,116.00
| .70%
| $3.73
| | $1,111.80
| 1.45%
| $7.72
|
Moderate Allocation
| 1,000
| 1,143.40
| .70%
| 3.78
| | 1,139.90
| 1.45%
| 7.82
|
Aggressive Allocation
| 1,000
| 1,183.70
| .70%
| 3.85
| | 1,178.60
| 1.45%
| 7.96
|
Cash Reserves
| 1,000
| 1,000.00
| .23%
| 1.16
| | 1,000.00
| .23%
| 1.16
|
Bond
| 1,000
| 1,034.80
| .90%
| 4.62
| | 1,032.00
| 1.65%
| 8.45
|
High Income
| 1,000
| 1,136.70
| 1.00%
| 5.39
| | 1,132.50
| 1.74%
| 9.35
|
Diversified Income
| 1,000
| 1,117.30
| 1.10%
| 5.87
| | 1,112.50
| 1.85%
| 9.85
|
Large Cap Value
| 1,000
| 1,174.40
| 1.17%
| 6.41
| | 1,168.90
| 1.92%
| 10.50
|
Large Cap Growth
| 1,000
| 1,159.60
| 1.20%
| 6.53
| | 1,155.90
| 1.94%
| 10.54
|
Mid Cap Value
| 1,000
| 1,151.20
| 1.40%
| 7.59
| | 1,146.80
| 2.14%
| 11.58
|
Mid Cap Growth
| 1,000
| 1,173.00
| 1.40%
| 7.67
| | 1,167.50
| 2.14%
| 11.69
|
Small Cap Value
| 1,000
| 1,206.40
| 1.50%
| 8.34
| | 1,202.90
| 2.25%
| 12.49
|
Small Cap Growth
| 1,000
| 1,084.40
| 1.50%
| 7.88
| | 1,078.50
| 2.25%
| 11.79
|
International Stock
| 1,000
| 1,269.50
| 1.60%
| 9.15
| | 1,264.20
| 2.35%
| 13.41
|
| | CLASS C
|
Fund | Beginning Account
Value
| Ending Account
Value
| Annual Expense
Ratio
| Expenses Paid
During Period
|
Conservative Allocation
| $1,000
| $1,116.00
| 1.45%
| $7.72
|
Moderate Allocation
| 1,000
| 1,139.90
| 1.45%
| 7.71
|
Aggressive Allocation
| 1,000
| 1,178.40
| 1.46%
| 8.02
|
110
Other Information
| | CLASS Y
|
Fund | Beginning Account
Value
| Ending Account
Value
| Annual Expense
Ratio
| Expenses Paid
During Period
|
Bond
| $1,000
| $1,037.20
| .65%
| $3.34
|
High Income
| 1,000
| 1,138.30
| .75%
| 4.04
|
Large Cap Value
| 1,000
| 1,175.60
| .92%
| 5.06
|
Large Cap Growth
| 1,000
| 1,161.50
| .95%
| 5.18
|
Mid Cap Value
| 1,000
| 1,153.40
| 1.15%
| 6.24
|
Mid Cap Growth
| 1,000
| 1,176.50
| 1.15%
| 6.31
|
Small Cap Value
| 1,000
| 1,207.00
| 1.25%
| 6.95
|
Small Cap Growth
| 1,000
| 1,083.90
| 1.25%
| 6.57
|
International Stock
| 1,000
| 1,270.80
| 1.35%
| 7.73
|
Hypothetical Example for Comparison Purposes
The table below provides information about hypothetical account values and hypothetical expenses based on the Funds’ actual expense ratios and an assumed rate of return of 5% per year before expenses, which are not the Funds’ actual returns. The hypothetical account values and expenses may not be used to estimate the actual ending account balance or expenses you paid for the period. You may use this information to compare the ongoing costs of investing in the Funds and other funds. To do so, compare the 5% hypothetical example of the Funds you own with the 5% hypothetical examples that appear in the shareholder reports of other similar funds.
| | CLASS A
| | CLASS B
|
Fund | Beginning
Account
Value
| Ending
Account
Value
| Annual
Expense
Ratio
| Expenses
Paid
During
Period
| | Ending
Account
Value
| Annual
Expense
Ratio
| Expenses
Paid
During
Period |
Conservative Allocation
| $1,000
| $1,043.00
| .70%
| $7.15
| | $1,035.50
| 1.45%
| $14.76
|
Moderate Allocation
| 1,000
| 1,043.00
| .70%
| 7.15
| | 1,035.50
| 1.45%
| 14.76
|
Aggressive Allocation
| 1,000
| 1,043.00
| .70%
| 7.15
| | 1,035.50
| 1.45%
| 14.76
|
Cash Reserves
| 1,000
| 1,047.70
| .23%
| 2.35
| | 1,047.70
| .23%
| 2.35
|
Bond
| 1,000
| 1,041.00
| .90%
| 9.18
| | 1,033.50
| 1.65%
| 16.78
|
High Income
| 1,000
| 1,040.00
| 1.00%
| 10.20
| | 1,032.60
| 1.74%
| 17.68
|
Diversified Income
| 1,000
| 1,039.00
| 1.10%
| 11.21
| | 1,031.50
| 1.85%
| 18.79
|
Large Cap Value
| 1,000
| 1,038.30
| 1.17%
| 11.92
| | 1,030.80
| 1.92%
| 19.50
|
Large Cap Growth
| 1,000
| 1,038.00
| 1.20%
| 12.23
| | 1,030.60
| 1.94%
| 19.70
|
Mid Cap Value
| 1,000
| 1,036.00
| 1.40%
| 14.25
| | 1,028.60
| 2.14%
| 21.71
|
Mid Cap Growth
| 1,000
| 1,036.00
| 1.40%
| 14.25
| | 1,028.60
| 2.14%
| 21.71
|
Small Cap Value
| 1,000
| 1,035.00
| 1.50%
| 15.26
| | 1,027.50
| 2.25%
| 22.81
|
Small Cap Growth
| 1,000
| 1,035.00
| 1.50%
| 15.26
| | 1,027.50
| 2.25%
| 22.81
|
International Stock
| 1,000
| 1,034.00
| 1.60%
| 16.27
| | 1,026.50
| 2.35%
| 23.81
|
111
Other Information
| | CLASS C
|
Fund | Beginning Account
Value
| Ending Account
Value
| Annual Expense
Ratio
| Expenses Paid
During Period
|
Conservative Allocation
| $1,000
| $1,035.50
| 1.45%
| $14.76
|
Moderate Allocation
| 1,000
| 1,035.50
| 1.45%
| 14.76
|
Aggressive Allocation
| 1,000
| 1,035.50
| 1.45%
| 14.76
|
| | CLASS Y
|
Fund | Beginning Account
Value
| Ending Account
Value
| Annual Expense
Ratio
| Expenses Paid
During Period
|
Bond
| $1,000
| $1,043.50
| .65%
| $6.64
|
High Income
| 1,000
| 1,042.50
| .75%
| 7.66
|
Large Cap Value
| 1,000
| 1,040.77
| .92%
| 9.41
|
Large Cap Growth
| 1,000
| 1,040.50
| .95%
| 9.69
|
Mid Cap Value
| 1,000
| 1,038.50
| 1.15%
| 11.72
|
Mid Cap Growth
| 1,000
| 1,038.50
| 1.15%
| 11.72
|
Small Cap Value
| 1,000
| 1,037.50
| 1.25%
| 12.73
|
Small Cap Growth
| 1,000
| 1,037.50
| 1.25%
| 12.73
|
International Stock
| 1,000
| 1,036.50
| 1.35%
| 13.75
|
Please note that the expenses shown in both tables are meant to highlight your ongoing costs only and do not reflect any transactional costs, such as sales charges (loads), or redemption fees. The information provided in the hypothetical example table is useful in comparing ongoing costs only, and will not help you determine the relative total costs of owning different funds. In addition, if these transactional costs were included, your costs would have been higher.
AVAILABILITY OF QUARTERLY PORTFOLIO SCHEDULES
The Funds file their complete schedules of portfolio holdings with the SEC for the first and third quarters of each fiscal year on Form N-Q. Form N-Q is available to shareholders at no cost on the SEC’s website at www.sec.gov. Form N-Q may also be reviewed and copied at the SEC’s Public Reference Room in Washington, DC. More information on the operation of the Public Reference Room may be obtained by calling 1-800-SEC-0330.
PROXY VOTING POLICIES, PROCEDURES AND RECORDS
A description of the policies and procedures used by the Funds to vote proxies related to portfolio securities is available to shareholders at no cost on the Funds’ website at www.membersfunds.com or by calling 1-800-877-6089. The proxy voting records for the Funds for the most recent twelve-month period ended June 30 are available to shareholders at no cost on the SEC’s website at www.sec.gov.
TAX INFORMATION
Foreign Tax Credits: The International Stock Fund expects to make an election under Internal Revenue Code Section 853 to pass through foreign taxes paid by the fund to its shareholders. For the year ended October 31, 2009, the total amount of foreign taxes that is expected to pass through to shareholders and foreign source income for information reporting purposes will be $381,256 (all of which represents taxes withheld) and $4,522,352, respectively. Complete information regarding the fund’s foreign tax credit pass through to shareholders for 2009 will be reported in conjunction with Form 1099-DIV.
112
Other Information
Corporate Dividends Received Deduction: Of the dividends paid by the Conservative Allocation, Moderate Allocation, Aggressive Allocation, Diversified Income, Large Cap Value, Large Cap Growth, Mid Cap Value, Small Cap Value and International Stock Funds, 6.51%, 22.39%, 53.04%, 47.05%, 100%, 100%, 100%, 100% and 0.06%, respectively, qualify for the corporate dividends received deduction.
Qualified Dividend Income: For the fiscal year ended October 31, 2009, The Conservative Allocation, Moderate Allocation, Aggressive Allocation, Diversified Income, Large Cap Value, Large Cap Growth, Mid Cap Value, Small Cap Value and the International Stock Funds paid dividend income totaling $1,276,875, $1,225,930, $76,578, $1,584,972, $2,814,901, $336,551, $353,103, $131,772 and $2,316,059 respectively. The Funds hereby designate the maximum amount of dividends allowable pursuant to the Internal Revenue Code, as qualified dividend income (“QDI”) eligible for reduced tax rates (the rates range from 5% to 15% depending upon individual’s tax bracket). Complete information regarding each fund’s income distributions paid during the calendar year 2009, including the portion, if any, which qualify as QDI, will be reported in conjunction with Form
1099-DIV.
113
MEMBERS Mutual Funds’ Trustees and Officers
The address of each trustee and officer is 550 Science Drive, Madison WI 53711, except that Mr. Mason’s address is 8777 N. Gainey Center Drive, #220, Scottsdale, AZ 85258. The Statement of Additional Information, which includes additional information about the trustees and officers, is available at no cost on the Funds’ website at www.membersfunds.com or by calling 1-800-877-6089.
Interested Trustees and Officers
Name and
Year of Birth | Position(s)
and Length of Time Served | Principal Occupation(s) During Past Five Years | Other Directorships/Trusteeships |
Katherine L. Frank1
1960 | Trustee and President, 2009 – Present
| Madison Investment Advisors, Inc. (“MIA”) (affiliated investment advisory firm of Madison), Managing Director and Vice President, 1986 – Present; Madison Asset Management, LLC (“Madison”), Director and Vice President, 2004 – Present; Madison Mosaic, LLC (affiliated investment advisory firm of Madison), President, 1996 – Present ; Madison Mosaic Funds (13) (mutual funds) and Madison Strategic Sector Premium Fund (closed end fund), President, 1996 –
Present ; Madison/Claymore Covered Call and Equity Strategy Fund (closed end fund), Vice President, 2005 – Present; Ultra Series Fund (18) (mutual fund), President, 2009 – Present
| Madison Mosaic Funds (all but Equity Trust) and Madison Strategic Sector Premium Fund, 1996 – Present; Ultra Series Fund (18), 2009 – Present
|
Frank E. Burgess
1942 | Vice President, 2009 – Present
| MIA, Founder, President and Director, 1973 – Present ; Madison, President and Director, 2004 – Present; Madison Mosaic Funds (13) and Madison Strategic Sector Premium Fund, Vice President, 1996 – Present; Ultra Series Fund (18), Vice President, 2009 – Present
| N/A
|
Jay R. Sekelsky
1959 | Vice President,
2009 – Present
| MIA, Managing Director and Vice President, 1990 – Present; Madison, Director, 2009 – Present; Madison Mosaic, LLC, Vice President, 1996 – Present; Madison Mosaic Funds (13) and Madison Strategic Sector Premium Fund, Vice President, 1996 – Present; Madison/Claymore Covered Call and Equity Strategy Fund, Vice President, 2005 – Present; Ultra Series Fund (18), Vice President, 2009 – Present
| N/A
|
Paul Lefurgey
1964 | Vice President,
2009 – Present
| MIA, Managing Director, Head of Fixed Income, 2005 – Present; Madison, Portfolio Manager, 2009 – Present; MEMBERS Capital Advisors, Inc. (“MCA”) (investment advisory firm), Madison, WI, Vice President, 2003 – 2005; Ultra Series Fund (18), Vice President, 2009 – Present
| N/A
|
Greg D. Hoppe
1969 | Treasurer,
2009 – Present
| MIA and Madison Mosaic, LLC, Vice President, 1999 – Present; Madison, Vice President, 2009 – Present ; Madison Mosaic Funds (13), Treasurer, 2009 – Present; Chief Financial Officer, 1999 – 2009; Madison Strategic Sector Premium Fund, Treasurer, 2005 – Present; Chief Financial Officer, 2005 – 2009 ; Madison/Claymore Covered Call and Equity Strategy Fund, Vice President, 2008 – Pre sent; Ultra Series Fund (18), Treasurer, 2009 – Present
| N/A
|
Holly S. Baggot 1960 | Secretary, 1999 – Present; Assistant Treasurer, 1999 – 2007; 2009 – Present; Treasurer, 2008 – 2009
| Madison, Vice President, 2009 – Present; MCA, Director-Mutual Funds, 2008-2009; Director-Mutual Fund Operations, 2006-2008; Operations Officer-Mutual Funds, 2005-2006; Senior Manager-Product & Fund Operations, 2001-2005; Madison Mosaic Funds (13) and Madison Strategic Sector Premium Fund, Secretary and Assistant Treasurer, 2009 – Present ; Ultra Series Fund (19), Secretary, 1999-Present; Treasurer, 2008-2009; Assistant Treasurer, 1997-2007 and 2009-Present
| N/A |
1 “Interested person” as defined in the Investment Company Act of 1940. Considered an interested Trustee because of the position held with the investment adviser of the Trust.
114
MEMBERS Mutual Funds' Trustees and Officers
Name and
Year of Birth | Position(s)
and Length of Time Served | Principal Occupation(s)
During Past Five Years | Other Directorships/Trusteeships |
W. Richard Mason
1960 | Chief Compliance Officer, Corporate Counsel and Assistant Secretary, 2009 – Present
| MIA, Madison, Madison Scottsdale, LC (an affiliated investment advisory firm of Madison) and Madison Mosaic, LLC, Chief Compliance Officer and Corporate Counsel, 2009 – Present; General Counsel and Chief Compliance Officer, 1996 – 2009 ; Mosaic Funds Distributor, LLC (an affiliated brokerage firm of Madison), Principal, 1998 – Present; Concord Asset Management (“Concord”) (an affiliated investment advisory firm of Madison), LLC, General Counsel, 1996 – 2009; Madison Mosaic Funds (13) and Madison Strategic Sector Premium Fund, Chief Compliance Officer, Corporate Counsel and Assistant Secretary, 2009 – Present; Secretary, General Counsel and Chief Compliance Officer, 1992 – 2009 ; Ultra Series Fund (18), Chief Compliance Officer, Corporate Counsel and Assistant Secretary, 2009 – Present
| N/A
|
Pamela M. Krill
1966 | General Counsel, Chief Legal Officer and Assistant Secretary, 2009 – Present
| MIA, Madison, Madison Scottsdale, LC, Madison Mosaic, LLC, Mosaic Funds Distributor, and Concord, General Counsel and Chief Legal Officer, 2009 – Present; Madison Mosaic Funds (13) and Madison Strategic Sector Premium Fund, General Counsel, Chief Legal Officer and Assistant Secretary, 2009 – Present; Ultra Series Fund (18), General Counsel, Chief Legal Officer and Assistant Secretary, 2009 –
Present; CUNA Mutual Insurance Society (insurance company with affiliated investment advisory, brokerage and mutual fund operations), Madison, WI, Managing Associate General Counsel-Securities & Investments, 2007 – 2009 ; Godfrey & Kahn, S.C. (law firm), Madison and Milwaukee, WI, Shareholder, Securities Practice Group, 1994-2007
| N/A
|
Independent Trustees
Name and
Year of Birth | Position(s)
and Length of Time Served1 | Principal Occupation(s)
During Past Five Years | Portfolios
Overseen in
Fund Complex2 | Other Directorships/Trusteeships |
Lorence D. Wheeler
1938 | Trustee, 2009 – Present
| Retired investor; Credit Union Benefits Services, Inc. (a provider of retirement plans and related services for credit union employees nationwide), Madison, WI, President,
1997 – 2001
| 46
| Grand Mountain Bank FSB and Grand Mountain Bancshares, Inc. 2003 – Present ; Madison Mosaic Funds (13) and Madison Strategic Sector Premium Fund,
1996 – Present; Madison/Claymore Covered Call and Equity Strategy Fund, 1996 – Present; Ultra Series Fund (18), 2009 – Present
|
1 Independent Trustees serve in such capacity until the Trustee reaches the age of 76, unless retirement is waived by unanimous vote of the remaining Trustees on an annual basis.
2 As of October 31, 2009, the fund complex consists of the Trust with 14 portfolios, the Ultra Series Fund with 18 portfolios, the Madison Strategic Sector Premium Fund (a closed-end fund) and the Madison Mosaic Equity, Income, Tax-Free and Government Money Market Trusts, which together have 13 portfolios, for a grand total of 46 separate portfolios in the fund complex. Not every Trustee is a member of the Board of Trustees of every fund in the fund complex, as noted above.
115
MEMBERS Mutual Funds' Trustees and Officers
Name and
Year of Birth | Position(s)
and Length of Time Served1 | Principal Occupation(s)
During Past Five Years | Portfolios
Overseen in
Fund Complex2 | Other Directorships/Trusteeships |
Steven P. Riege
1954 | Trustee, 2005 – Present
| The Rgroup (management consulting), Milwaukee, WI, Owner/President, 2001 – Present; Robert W. Baird & Company (financial services), Milwaukee, WI, Senior Vice President-Marketing and Vice President-Human Resources, 1986 – 2001
| 32
| Ultra Series Fund (18), 2005 – Present
|
Richard E. Struthers
1952 | Trustee, 2004 – Present
| Clearwater Capital Management (investment advisory firm), Minneapolis, MN, Chair and Chief Executive Officer, 1998 – Present; Park Nicollet Health Services, Minneapolis, MN, Chairman, Finance and Investment Committee, 2006 – Present; IAI Mutual Funds, Minneapolis, MN, President and Director, 1992-1997
| 32
| Park Nicolet Health Services, 2001 – Present; Micro Component Technology, Inc., 2008 – Present ;
Ultra Series Fund (18), 2004 – Present
|
Philip E. Blake
1944 | Trustee, 2009 – Present
| Retired Investor; Lee Enterprises, Inc (news and advertising publisher), Madison, WI, Vice President, 1998 - 2001; Madison Newspapers, Inc., Madison, WI, President and Chief Executive Officer, 1993 – 2000
| 46
| Madison Newspapers, Inc., 1993 – Present;
Meriter Hospital & Health Services, 2000 – Present;
Edgewood College, 2003 – Present; Madison Mosaic Funds (13) and Madison Strategic Sector Premium Fund, 1996 – Present; Ultra Series Fund (18), 2009 – Present |
James R Imhoff, Jr.
1944 | Trustee, 2009 – Present
| First Weber Group (real estate brokers), Madison, WI, Chief Executive Officer, 1996 – Present
| 46
| Park Bank, 1978 – Present; Madison Mosaic Funds (13) and Madison Strategic Sector Premium Fund,
1996 – Present; Madison/Claymore Covered Call and Equity Strategy Fund, 1996 – Present; Ultra Series Fund (18), 2009 – Present
|
1 Independent Trustees serve in such capacity until the Trustee reaches the age of 76, unless retirement is waived by unanimous vote of the remaining Trustees on an annual basis.
2 As of October 31, 2009, the fund complex consists of the Trust with 14 portfolios, the Ultra Series Fund with 18 portfolios, the Madison Strategic Sector Premium Fund (a closed-end fund) and the Madison Mosaic Equity, Income, Tax-Free and Government Money Market Trusts, which together have 13 portfolios, for a grand total of 46 separate portfolios in the fund complex. Not every Trustee is a member of the Board of Trustees of every fund in the fund complex, as noted above.
116
(logo) MEMBERS(R) Mutual Funds
MEMBERS Mutual Funds
Post Office Box 8390
Boston, MA 02266-8390
1(800)877-6089
www.membersfunds.com
SEC File Number 811-08261
4460-P1053
Rev:1209
Item 2. Code of Ethics.
(a) The Trust has adopted a code of ethics that applies to the Trust’s principal executive officer, principal financial officer, principal accounting officer or controller or persons performing similar functions, regardless of whether these individuals are employed by the Trust or a third party.
(c) The code was amended and restated effective July 1, 2009 coinciding with the effectiveness of the Trust's invesmtment advisory agreement with Madison Asset Management, LLC (the "Adviser"). The provisions and restrictions of the code are not materially different than the code adopted by the Trust prior to that date. Rather, the revisions were made to reflect the identities and affiliations of the Adviser and is identical to the corresponding code of ethics adopted by other investment companies affiliated with the Adviser.
(d) The Trust granted no waivers from the code during the period covered by this report.
(f) Any person may obtain a complete copy of the code without charge by calling the Adviser at 800-767-0300 and requesting a copy of "the MEMBERS Mutual Funds Sarbanes Oxley Code of Ethics."
Item 3. Audit Committee Financial Expert.
James R. Imhoff, an “independent” Trustee and a member of the Trust’s audit committee, serves as the Trust’s audit committee financial expert among the five independent Trustees who so qualify to serve in that capacity.
Item 4. Principal Accountant Fees and Services.
(a) Audit Fees. Total audit fees paid (or to be paid) to the registrant's principal accountant for the fiscal years ended October 31, 2009 and 2008, respectively were $234,000 ($480,000 including the Ultra Series Fund, an affiliated registered investment company ("USF")) and $228,000 ($466,000 including USF).
(b) Audit-Related Fees. Not applicable.
(c) Tax-Fees. The Audit Committee has pre-approved, as required by Rule 2-01(c)(7)(i)(C) of Regulation S-X, 100% of the services described in this Item 4(b) through (d), which such services are described above.
For the fiscal years ended October 31, 2009 and October 31, 2008, the aggregate fees for professional services rendered by Deloitte & Touche for tax compliance, tax advice and tax planning for such fiscal years, totaled $41,200 and $39,995, respectively.
In the scope of services comprising the fees disclosed under this Item 4(c) were the following services:
-Review and sign as signature preparer for U.S. Income Tax Return for Regulated Investment Companies, Form 1120-RIC and the Return of Excise Tax on Undistributed Income of Regulated Investment Companies, Form 8613.
(d) All Other Fees. Not applicable.
(e) (1) Before any accountant is engaged by the registrant to render audit or non-audit services, the engagement must be approved by the audit committee as contemplated by paragraph (c)(7)(i)(A) of Rule 2-01of Regulation S-X.
(2) The Audit Committee has pre-approved, as required by Rule 2-01(c)(7)(i)(C) of Regulation S-X, 100% of the services described in this Item 4(b) through (d), which such services are described above.
(f) Not applicable.
(g) Not applicable.
(h) Not applicable.
Item 5. Audit Committee of Listed Registrants.
Not applicable.
Item 6. Schedule of Investments
Schedule included as part of the report to shareholders filed under Item 1 of this Form.
Item 7. Disclosure of Proxy Voting Policies and Procedures for Closed-End Management Investment Companies.
Not applicable.
Item 8. Portfolio Managers of Closed-End Management Investment Companies.
Not applicable.
Item 9. Purchases of Equity Securities by Closed-End Management Investment Company and Affiliated Purchasers.
Not applicable.
Item 10. Submission of Matters to a Vote of Security Holders.
The Trust does not normally hold shareholder meetings. There have been no changes to the Trust's procedures during the period covered by this report.
Item 11. Controls and Procedures.
(a) The Trust’s principal executive officer and principal financial officer determined that the Trust’s disclosure controls and procedures (as defined in Rule 30a-3(c) under the Investment Company Act of 1940 (the "Act")) are effective, based on their evaluation of these controls and procedures required by Rule 30a-3(b) under the Act and Rules 13a-15(b) or 15d-15(b) under the Securities Exchange Act of 1934 within 90 days of the date of this report. There were no significant changes in the Trust’s internal controls or in other factors that could significantly affect these controls subsequent to the date of their evaluation. The officers identified no significant deficiencies or material weaknesses.
(b) There were no changes in the Trust's internal control over financial reporting (as defined in Rule 30a-3(d) under the Act) that occurred during the second fiscal quarter of the period covered by this report that has materially affected, or is reasonably likely to materially affect, the Trust's internal control over financial reporting. The identities of the Trust's principal executive and financial officers changed on July 1, 2009 contemporaneously with the effectiveness of the investment advisory agreement between the Trust and the Adviser.
Item 12. Exhibits.
(a)(1) Code of ethics referred to in Item 2.
(a)(2) Certifications of principal executive and principal financial officers as required by Rule 30a-2(a) under the Act.
(b) Certification of principal executive and principal financial officers as required by Rule 30a-2(b) under the Act.
SIGNATURES
Pursuant to the requirements of the Securities Exchange Act of 1934 and the Investment Company Act of 1940, the Registrant has duly caused this Report to be signed on its behalf by the undersigned, thereunto duly authorized.
MEMBERS Mutual Funds
By: (signature)
W. Richard Mason, CCO and Assistant Secretary
Date: December 22, 2009
Pursuant to the requirements of the Securities Exchange Act of 1934 and the Investment Company Act of 1940, this Report has been signed below by the following persons on behalf of the Registrant and in the capacities and on the dates indicated.
By: (signature)
Katherine L. Frank, Chief Executive Officer
Date: December 22, 2009
By: (signature)
Greg Hoppe, Chief Financial Officer
Date: December 22, 2009