This material is for reporting purposes only and shall not be used in connection with a solicitation, offer or any proposed sale of securities unless preceded or accompanied by a prospectus.
MEMBERS Mutual Funds | October 31, 2010
Table of Contents
| Management’s Discussion of Fund Performance | |
| Economic Overview | 2 |
| Outlook | 3 |
| Conservative Allocation Fund | 4 |
| Moderate Allocation Fund | 6 |
| Aggressive Allocation Fund | 8 |
| Cash Reserves Fund | 10 |
| Bond Fund | 12 |
| High Income Fund | 14 |
| Diversified Income Fund | 16 |
| Equity Income Fund | 18 |
| Large Cap Value Fund | 20 |
| Large Cap Growth Fund | 22 |
| Mid Cap Fund | 24 |
| Small Cap Fund | 26 |
| International Stock Fund | 28 |
| Notes to Management’s Discussion of Fund Performance | 30 |
| Benchmark Descriptions | 31 |
| Portfolios of Investments | |
| Conservative Allocation Fund | 32 |
| Moderate Allocation Fund | 33 |
| Aggressive Allocation Fund | 34 |
| Cash Reserves Fund | 35 |
| Bond Fund | 36 |
| High Income Fund | 39 |
| Diversified Income Fund | 43 |
| Equity Income Fund | 46 |
| Large Cap Value Fund | 48 |
| Large Cap Growth Fund | 49 |
| Mid Cap Fund | 50 |
| Small Cap Fund | 51 |
| International Stock Fund | 53 |
| Financial Statements | |
| Statements of Assets and Liabilities | 56 |
| Statements of Operations | 60 |
| Statements of Changes in Net Assets | 62 |
| Financial Highlights | 68 |
| Notes to Financial Statements | 87 |
| Report of Independent Registered Public Accounting Firm | 103 |
| Other Information | 104 |
| Trustees and Officers | 109 |
Nondeposit investment products are not federally insured, involve investment risk, may lose value and are not obligations of or guaranteed by any financial institution. For more complete information about MEMBERS Mutual Funds, including charges and expenses, request a prospectus from your financial advisor or from MEMBERS Mutual Funds, P.O. Box 8390, Boston, MA 02266-8390. Consider the investment objectives, risks, and charges and expenses of any fund carefully before investing. The prospectus contains this and other information about the investment company. For more current performance information, please call 1-800-877-6089 or visit our website at www.membersfunds.com. Current performance may be lower or higher than the performance data quoted within. Past performance do es not guarantee future results. Nothing in this report represents a recommendation of a security by the investment adviser. Portfolio holdings may have changed since the date of this report.
MEMBERS Mutual Funds | October 31, 2010
Management’s Discussion of Fund Performance
ECONOMIC OVERVIEW
Perhaps the best one-word characterization of the economic mood as this twelve-month period ended would be "uncertainty." Uncertainty regarding future tax rates, employment costs, and sales growth clearly impacted businesses and consumers during the trailing period. Given these uncertainties, few businesses were willing to commit to expanded payrolls or expanded facilities, while investors continued to show a preference for the perceived safety of bonds over stocks.
While the consensus during the period appeared to move from worry over a double-dip recession to an acceptance of an extended period of below-normal growth, economic risks were far from eliminated. The housing sector remained persistently weak and the specter of foreclosures and other repercussions from the credit crisis continued to produce periodic waves of worries. Overseas economic stresses, particularly the sovereign debt crisis in Europe, remained unresolved. The enormous debt taken on by the U.S. government to counteract the banking and credit crisis of 2008 remained a potent overhang for future U.S. economic prospects and the stability of the dollar.
The period began with a continuation of the 2009 rally where low risk premiums persisted in equity markets. That rally paused as a correction began in April and riskier assets took a breather. After nearly a year of consistent gains from stocks and corporate bonds, turmoil in the European Union among sovereign bond issuers and the banks that finance them caused investors to seek the relative safety of the highest quality investments. In the U.S., that meant a drop in Treasury yields, widening risk premiums on corporate bonds, and declines in the broad equity indices. The domestic stock market, as measured by the S&P 500, hit its low in early July before recovering. Then, with equity markets again advancing strongly through the end of October, the S&P 500 rallied back to a 16.52% return for the twelve-month period ended October 31. International markets, as measured by the MSCI EAFE Index, showed similar weakness and experienced a less robust rally, and ended the period up over 8.8%. In the meantime, the Treasury rally continued through the end of October, with the yield on the 10-Year Treasury dropping from more than 3.6% in early April to 2.6% at the end of the period. The value of existing bonds increases as interest rates fall.
The low level of interest rates across the period was supported by a number of factors which we feel may not be permanent. Not only did the Federal Reserve hold short-term rates at record lows, the bond market rose in anticipation of a second round of quantitative easing. Economic troubles in Europe helped fuel a rise in foreign purchasers of U.S. bonds, while investors continued to rotate money from stocks and money markets into the bond market. All of these supporting factors can shift at any time, and we feel it is prudent to invest with the expectation that there is much more room for rates to rise than to fall. That said, we expect another quarter or two of slow growth before the economy gains any significant momentum.
MEMBERS Mutual Funds | Management’s Discussion of Fund Performance | October 31, 2010
OUTLOOK
While the outlook for the balance of the year and into the early part of 2011 is for more economic malaise, we expect that by the second half of 2011 the picture will be somewhat brighter. Bond investors should be aware that the bond market typically begins discounting events well in advance of their occurrence. With bond yields across the maturity spectrum well below our estimates of fair value, we perceive growing risk, particularly in longer maturity bonds which show the greatest price sensitivity to interest rate changes. We believe actively managing interest rate risk will be key to successful bond performance in the months ahead. On the stock side, as we look towards the end of 2010 and into 2011, we’re generally optimistic about the market. While not projecting gangbuster returns, we anticipate something close to long-term averages for the broader market. The positives include strong corporate profits, attractive valuations, and low inflation and low interest rates, normally a good backdrop for solid equity performance. On the other hand, we can’t discount a persistently slow economy. We are also operating with high budget deficits, which are certainly cause for concern. Housing has not rebounded in any meaningful way and consumer spending remains slow. So while indicators are clearly mixed, we believe the positives outweigh the negatives.
MEMBERS Mutual Funds | Management’s Discussion of Fund Performance | October 31, 2010
CONSERVATIVE ALLOCATION FUND
INVESTMENT STRATEGY HIGHLIGHTS
The MEMBERS Conservative Allocation Fund invests primarily in shares of registered investment companies (the "underlying funds"). The fund will be diversified among a number of asset classes and its allocation among underlying funds will be based on an asset allocation model developed by Madison Asset Management, LLC ("Madison"), the fund’s investment adviser.
The team may use multiple analytical approaches to determine the appropriate asset allocation:
| | •Asset allocation optimization analysis – considers the covariance between asset class returns (the degree to which returns in different asset classes do or do not move together), and the fund’s aim to achieve a favorable overall risk profile for any targeted portfolio return. |
| | •Scenario analysis – historical and expected return data is analyzed to model how individual asset classes and combinations of asset classes would affect the fund under different economic and market conditions. |
| | •Fundamental analysis – draws upon Madison’s investment teams to judge each asset class against current and forecasted market conditions. Economic, industry and security analysis is used to develop return and risk expectations that may influence asset class selection. |
In addition, Madison employs a risk management sleeve within the fund for the purpose of risk reduction when and if conditions exist that require reduction of equity exposure.
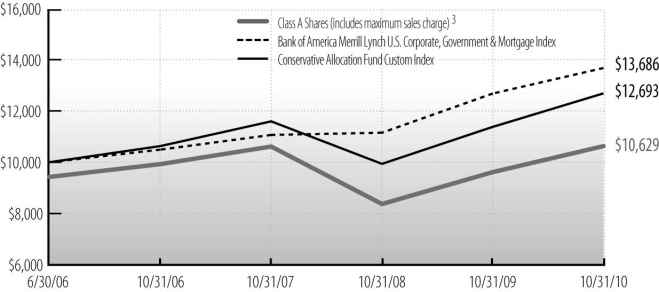
Cumulative Performance of $10,000 Investment Since Inception1,2
Average Annual Total Return through October 31, 20102 |
| | % Return Without Sales Charge | | % Return After Sales Charge6 |
| | | | | | | | | |
Class A Shares3 | 10.58% | 0.05% | 2.81% | — | | 4.22% | (1.91)% | 1.42% |
Class B Shares4 | 9.87 | (0.67) | 2.08 | — | | 5.37 | (1.76) | 1.64 |
Class C Shares5 | 9.86 | — | — | 0.60% | | 8.86 | — | 0.60 |
| Bank of America Merrill Lynch US Corp, Govt & Mortg Index | 7.88 | 7.34 | 7.49 | 6.79 | | NA | NA | NA |
| Conservative Allocation Fund Custom Index | 11.51 | 3.03 | 5.64 | 4.20 | | NA | NA | NA |
See accompanying Notes to Management’s Discussion of Fund Performance.
MEMBERS Mutual Funds | Management’s Discussion of Fund Performance | October 31, 2010
Conservative Allocation Fund (concluded)
The year-ended October 31, 2010 was a relatively friendly climate for asset allocation, characterized by high returns and relatively low volatility across asset classes. There were, however, a number of bumps along the way. During the spring of 2010 the European debt crisis was peaking at about the same time the U.S. was hit by the "flash crash," an intraday drop of roughly 9% on the S&P 500 Index on May 6th. These events provided the kindling for a 15% sell-off in the equity markets, which bottomed out in early July. As of October 31st, the equity markets have more than recovered on the heels of the anticipated and then announced second round of quantitative monetary easing by the Federal Reserve. All in all, the past year was a period where taking risk was handsomely rewarded across all asset classes.
Over the period the broad U.S. equity market as measured by the Russell¨ 3000 Index was up 18.3%, U.S. bonds as measured by the Barclays Capital U.S. Aggregate Bond Index were up 8.0%, and finally international equities returned 8.8% as measured by the MSCI EAFE Index.
| PORTFOLIO ALLOCATION AS A PERCENTAGE OF NET ASSETS |
|
| Bond Funds | 60% |
| Foreign Bond Funds | 8% |
| Foreign Stock Funds | 5% |
| Money Market Funds and Other Net Assets | 2% |
| Stock Funds | 25% |
For the twelve-month period ended October 31, 2010, the MEMBERS Conservative Allocation Fund returned 10.58% (Class A shares at net asset value), underperforming the Conservative Allocation Custom Index return of 11.51%. The fund’s focus on higher quality bonds and large cap equities were the main reasons behind the performance lag. Both lower quality stocks and bonds outperformed higher quality investments over the period. Additionally, small and mid cap stocks outpaced their large cap counterparts during the period.
Top contributors to the fund’s performance included: MEMBERS Large Cap Growth Fund Class Y which returned 16.3%; PIMCO Investment Grade Corporate Bond Fund which returned 16.1%; and MEMBERS High Income Fund Class Y which returned 15.0%.
Detractors from fund performance included: MEMBERS Bond Fund Class Y which returned 6.2%; MEMBERS International Stock Fund Class Y which returned 9.3%; and MEMBERS Large Cap Value Fund Class Y which returned 9.6%.
The most significant change to the fund’s positioning over the period was a sharp reduction in international equity exposure. This decision made in the fall of 2009 proved to be timely as domestic stocks outperformed international equities by nearly 10% over the period. No other significant changes were made to the fund’s overall asset allocation.
MEMBERS Mutual Funds | Management’s Discussion of Fund Performance | October 31, 2010
MODERATE ALLOCATION FUND
INVESTMENT STRATEGY HIGHLIGHTS
The MEMBERS Moderate Allocation Fund invests primarily in shares of registered investment companies (the "underlying funds"). The fund will be diversified among a number of asset classes and its allocation among underlying funds will be based on an asset allocation model developed by Madison Asset Management, LLC ("Madison"), the fund’s investment adviser.
The team may use multiple analytical approaches to determine the appropriate asset allocation:
| | •Asset allocation optimization analysis – considers the covariance between asset class returns (the degree to which returns in different asset classes do or do not move together), and the fund’s aim to achieve a favorable overall risk profile for any targeted portfolio return. |
| | •Scenario analysis – historical and expected return data is analyzed to model how individual asset classes and combinations of asset classes would affect the fund under different economic and market conditions. |
| | •Fundamental analysis – draws upon Madison’s investment teams to judge each asset class against current and forecasted market conditions. Economic, industry and security analysis is used to develop return and risk expectations that may influence asset class selection. |
In addition, Madison employs a risk management sleeve within the fund for the purpose of risk reduction when and if conditions exist that require reduction of equity exposure.
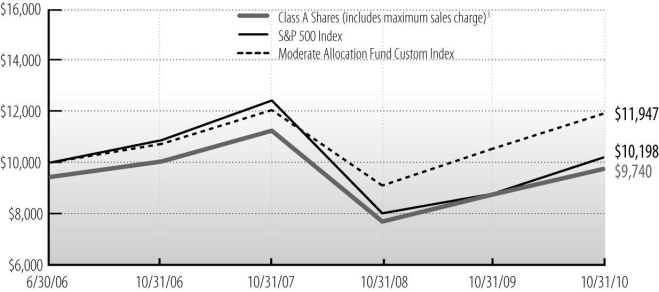
Cumulative Performance of $10,000 Investment Since Inception1,2
Average Annual Total Return through October 31, 20102 |
| | % Return Without Sales Charge | | % Return After Sales Charge6 |
| | | | | | | | | |
Class A Shares3 | 11.68% | (4.74)% | 0.76% | — | | 5.20% | (6.60)% | (0.61)% |
Class B Shares4 | 10.78 | (5.47) | 0.00 | — | | 6.28 | (6.54) | (0.44) |
Class C Shares5 | 10.89 | — | — | (2.96)% | | 9.89 | — | (2.96) |
| S&P 500 Index | 16.52 | (6.49) | 0.45 | (3.10) | | NA | NA | NA |
| Moderate Allocation Fund Custom Index | 13.23 | (0.40) | 4.18 | 2.07 | | NA | NA | NA |
See accompanying Notes to Management’s Discussion of Fund Performance.
MEMBERS Mutual Funds | Management’s Discussion of Fund Performance | October 31, 2010
Moderate Allocation Fund (concluded)
The year-ended October 31, 2010 was a relatively friendly climate for asset allocation, characterized by high returns and relatively low volatility across asset classes. There were, however, a number of bumps along the way. During the spring of 2010 the European debt crisis was peaking at about the same time the U.S. was hit by the "flash crash," an intraday drop of roughly 9% on the S&P 500 Index on May 6th. These events provided the kindling for a 15% sell-off in the equity markets, which bottomed out in early July. As of October 31st, the equity markets have more than recovered on the heels of the anticipated and then announced second round of quantitative monetary easing by the Federal Reserve. All in all, the past year was a period where taking risk was handsomely rewarded across all asset classes.
Over the period the broad U.S. equity market as measured by the Russell¨ 3000 Index was up 18.3%, U.S. bonds as measured by the Barclays Capital U.S. Aggregate Bond Index were up 8.0%, and finally international equities returned 8.8% as measured by the MSCI EAFE Index.
| PORTFOLIO ALLOCATION AS A PERCENTAGE OF NET ASSETS |
|
| Bond Funds | 36% |
| Foreign Bond Funds | 5% |
| Foreign Stock Funds | 10% |
| Money Market Funds and Other Net Assets | 1% |
| Stock Funds | 48% |
For the twelve-month period ended October 31, 2010, the MEMBERS Moderate Allocation Fund returned 11.68% (Class A shares at net asset value), underperforming the Moderate Allocation Custom Index return of 13.23%. The fund’s focus on higher quality bonds and large cap equities were the main reasons behind the performance lag. Both lower quality stocks and bonds outperformed higher quality investments over the period. Additionally, small and mid cap stocks outpaced their large cap counterparts during the period.
Top contributors to the fund’s performance included: Fairholme Fund which returned 24.4%; MEMBERS Small Cap Fund Class Y which returned 20.9%; and MEMBERS Mid Cap Fund Class Y which returned 20.2%.
Detractors from performance included: MEMBERS Bond Fund Class Y which returned 6.2%; MEMBERS International Stock Fund Class Y which returned 9.3%; and MEMBERS Large Cap Value Fund Class Y which returned 9.6%.
The most significant change to the fund’s positioning over the period was a sharp reduction in international equity exposure. This decision made in the fall of 2009 proved to be timely as domestic stocks outperformed international equities by nearly 10% over the period. That said, in the early summer, on market weakness we opportunistically established a position in a dedicated Asian equity fund. We believe Asian economies are uniquely positioned to realize above average long-term growth in the global marketplace.
MEMBERS Mutual Funds | Management’s Discussion of Fund Performance | October 31, 2010
AGGRESSIVE ALLOCATION FUND
INVESTMENT STRATEGY HIGHLIGHTS
The MEMBERS Aggressive Allocation Fund invests primarily in shares of registered investment companies (the "underlying funds"). The fund will be diversified among a number of asset classes and its allocation among underlying funds will be based on an asset allocation model developed by Madison Asset Management, LLC ("Madison"), the fund’s investment adviser.
The team may use multiple analytical approaches to determine the appropriate asset allocation:
| | •Asset allocation optimization analysis – considers the degree to which returns in different asset classes do or do not move together, and the fund’s aim to achieve a favorable overall risk profile for any targeted portfolio return. |
| | •Scenario analysis – historical and expected return data is analyzed to model how individual asset classes and combinations of asset classes would affect the fund under different economic and market conditions. |
| | •Fundamental analysis – draws upon Madison’s investment teams to judge each asset class against current and forecasted market conditions. Economic, industry and security analysis is used to develop return and risk expectations that may influence asset class selection. |
In addition, Madison employs a risk management sleeve within the fund for the purpose of risk reduction when and if conditions exist that require reduction of equity exposure.
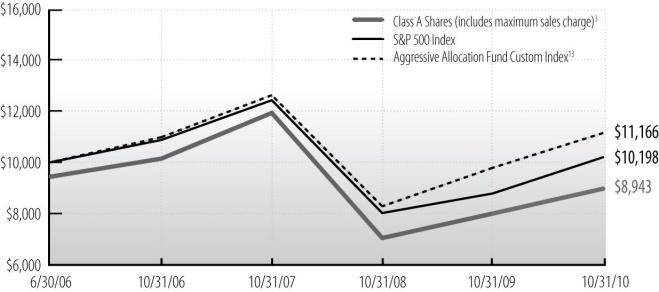
Cumulative Performance of $10,000 Investment Since Inception1,2
Average Annual Total Return through October 31, 20102 |
| | % Return Without Sales Charge | | % Return After Sales Charge6 |
| | | | | | | | | |
Class A Shares3 | 12.50% | (9.25)% | (1.20)% | — | | 5.98% | (11.02)% | (2.54)% |
Class B Shares4 | 11.67 | (9.95) | (1.94) | — | | 7.17 | (11.00) | (2.39) |
Class C Shares5 | 11.66 | — | — | (6.27)% | | 10.66 | — | (6.27) |
| S&P 500 Index | 16.52 | (6.49) | 0.45 | (3.10) | | NA | NA | NA |
| Aggressive Allocation Fund Custom Index | 14.21 | (4.14) | 2.57 | (0.49) | | NA | NA | NA |
See accompanying Notes to Management’s Discussion of Fund Performance.
MEMBERS Mutual Funds | Management’s Discussion of Fund Performance | October 31, 2010
Aggressive Allocation Fund (concluded)
The year-ended October 31, 2010 was a relatively friendly climate for asset allocation, characterized by high returns and relatively low volatility across asset classes. There were, however, a number of bumps along the way. During the spring of 2010 the European debt crisis was peaking at about the same time the U.S. was hit by the "flash crash," an intraday drop of roughly 9% on the S&P 500 Index on May 6th. These events provided the kindling for a 15% sell-off in the equity markets, which bottomed out in early July. As of October 31st, equity markets have more than recovered on the heels of the anticipated and then announced second round of quantitative monetary easing by the Federal Reserve. All in all, the past year was a period where taking risk was handsomely rewarded across all asset classes.
Over the period the broad U.S. equity market as measured by the Russell¨ 3000 Index was up 18.3%, U.S. bonds as measured by the Barclays Capital U.S. Aggregate Bond Index were up 8.0%, and finally international equities returned 8.8% as measured by the MSCI EAFE Index.
| PORTFOLIO ALLOCATION AS A PERCENTAGE OF NET ASSETS |
|
| Bond Funds | 8% |
| Foreign Bond Funds | 3% |
| Foreign Stock Funds | 15% |
| Money Market Funds and Other Net Assets | 1% |
| Stock Funds | 73% |
For the twelve-month period ended October 31, 2010, the MEMBERS Aggressive Allocation Fund returned 12.50% (Class A shares at net asset value), underperforming the Aggressive Allocation Custom Index return of 14.21%. The fund’s focus on high quality large cap equities was the main reasons behind the performance lag. Both lower quality stocks and bonds outperformed higher quality equities over the period. Additionally, small and mid cap stocks outpaced their large cap counterparts during the period. Although the fund did not have a high focus on higher quality bonds, the allocation the fund owned also provided a drag on performance.
Top contributors to the fund’s performance included: Fairholme Fund which returned 24.4%; MEMBERS Small Cap Fund Class Y which returned 20.9%; and MEMBERS Mid Cap Fund Class Y which returned 20.2%.
Detractors from performance included: MEMBERS International Stock Fund Class Y which returned 9.3%; MEMBERS Large Cap Value Fund Class Y which returned 9.6%, and Madison Mosaic Disciplined Equity Fund which returned 11.3%.
The most significant change to the fund’s positioning over the period was a sharp reduction in international equity exposure. This decision made in the fall of 2009 proved to be timely as domestic stocks outperformed international equities by nearly 10% over the period. That said, in the early summer, on market weakness we opportunistically established a position in a dedicated Asian equity fund. We believe Asian economies are uniquely positioned to realize above average long-term growth in the global marketplace.
MEMBERS Mutual Funds | Management’s Discussion of Fund Performance | October 31, 2010
CASH RESERVES FUND
INVESTMENT STRATEGY HIGHLIGHTS
The MEMBERS Cash Reserves Fund invests exclusively in U.S. dollar-denominated money market securities maturing in thirteen months or less from the date of purchase. These securities will be obligations of the U.S. Government and its agencies and instrumentalities, but may also include securities issued by U.S. and foreign financial institutions, corporations, municipalities, foreign governments, and multi-national organizations, such as the World Bank.
The fund may invest in mortgage-backed and asset-backed securities, including those representing pools of mortgage, commercial, or consumer loans originated by credit unions or other financial institutions.
| PORTFOLIO ALLOCATION AS A PERCENTAGE OF NET ASSETS |
|
| Fannie Mae | 31% |
| Federal Home Loan Bank | 28% |
| Freddie Mac | 29% |
| U.S. Treasury Bills | 9% |
| Cash and Other Net Assets | 3% |
MEMBERS Mutual Funds | Management’s Discussion of Fund Performance | October 31, 2010
This page was intentionally left blank.
MEMBERS Mutual Funds | Management’s Discussion of Fund Performance | October 31, 2010
INVESTMENT STRATEGY HIGHLIGHTS
Under normal circumstances, the MEMBERS Bond Fund invests at least 80% of its assets in bonds. To keep current income relatively stable and to limit share price volatility, the fund emphasizes investment grade securities and maintains an intermediate (typically 3-6 year) average portfolio duration (a measure of a security’s price sensitivity to changes in interest rates). The fund also strives to minimize risk in the portfolio by making strategic decisions relating to credit risk and yield curve outlook. The fund may invest in corporate debt securities, U.S. Government debt securities, foreign government debt securities, non-rated debt securities, and asset-backed, mortgage-backed and commercial mortgage-backed securities.
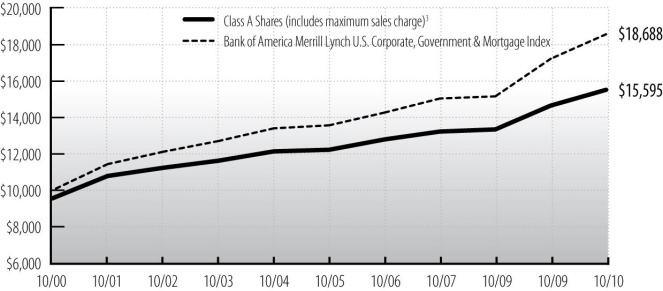
Cumulative Performance of $10,000 Investment Since Inception1,2
Average Annual Total Return through October 31, 20102 |
| | % Return Without Sales Charge | % Return After Sales Charge6 |
| | | | | | | | | | |
Class A Shares3 | 5.97% | 5.52% | 4.93% | 5.03% | — | 1.17% | 3.92% | 3.98% | 4.54% |
Class B Shares4 | 5.08 | 4.74 | 4.15 | 4.23 | — | 0.58 | 3.66 | 3.81 | 4.23 |
Class Y Shares7 | 6.23 | 5.82 | — | — | 5.88% | — | — | — | — |
| Bank of America Merrill Lynch US Corp, Govt & Mortg Index | 7.88 | 7.34 | 6.53 | 6.45 | 7.49 | NA | NA | NA | NA |
See accompanying Notes to Management’s Discussion of Fund Performance.
INVESTING ENVIRONMENT
The twelve-month period ended October 31, 2010 was dominated by two themes in the bond markets. First, it became increasingly apparent as we moved into and through 2010 that those forecasting a ‘V’ shaped recovery misread the economic environment. Even almost a trillion dollars of Federal fiscal stimulus and a monetary policy set to essentially zero interest rates could not overcome the desire of the private sector to deleverage and approach borrowing and lending sanely. By almost any standard, this has been a tepid recovery. Second, starting in the first quarter and accelerating into the second quarter of 2010, the markets became increasingly cognizant of the poor financial and economic position many European countries faced. Perceived inept leadership from the European politicians combined with
MEMBERS Mutual Funds | Management’s Discussion of Fund Performance | October 31, 2010
Bond Fund (concluded)
a realization that any restructuring of these countries’ debts could lead to a financial meltdown in Europe’s largest economies caused havoc in numerous sovereign debt markets. The combination of decelerating U.S. growth and concerns regarding the possibility of another financial crisis caused a flight to safety.
| PORTFOLIO ALLOCATION AS A PERCENTAGE OF NET ASSETS |
|
| Asset Backed | 1% |
| Corporate Notes and Bonds | 19% |
| Mortgage Backed | 14% |
| U.S. Government and Agency Obligations | 65% |
| Cash and Other Net Assets | 1% |
For the twelve-month period ended October 31, 2010, the MEMBERS Bond Fund earned 5.97% (Class A shares at net asset value) whereas the Bank of America Merrill Lynch U.S. Corporate, Government & Mortgage Index returned 7.88%. The underperformance experienced by the fund arose mainly for two reasons. First, we felt interest rates had fallen to levels that did not reflect good value longer term and consequently the interest rate exposure of the fund was significantly less than the market. As rates continued to fall and prices rallied, the fund lagged. Second, we have never bought into the idea that the actions of various governments over the past two years had resolved the outstanding problems. The residential housing situation is still uncertain and prices are beginning to drop again while foreclosures had only slowed because of proc ess issues. Commercial real estate faces similar issues and toxic assets remain on the books of many banks. Many state and local governments have only avoided serious problems due to Federal funding through the stimulus package.
European government fiscal problems and hidden losses on the books of many of their banks is another potential source of concern. Given this, we remained heavily overweight in U.S. Treasury securities and underweight in riskier sectors such as mortgages and corporate bonds in general, for example BBB rated securities and financial firms.
The two large-picture factors described above caused the lagging fund performance over the period. The portfolio holdings contained a number of individual securities which performed extremely well, just not enough to offset the detractors. There were only a few holdings which performed poorly such as a holding in Transocean which suffered from the oil spill in the Gulf of Mexico.
There were no significant changes to the strategy during the year, and only modest buying and selling of securities were effected to fine tune the position of the portfolio.
MEMBERS Mutual Funds | Management’s Discussion of Fund Performance | October 31, 2010
HIGH INCOME FUND
INVESTMENT STRATEGY HIGHLIGHTS
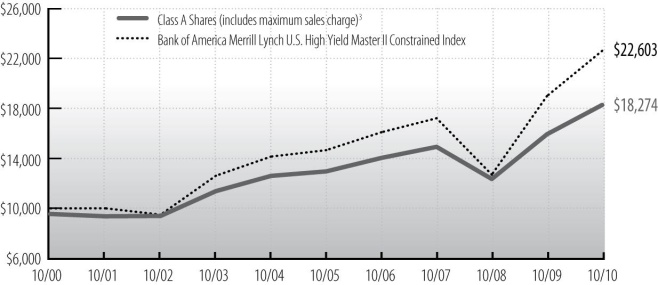
The MEMBERS High Income Fund invests primarily in lower-rated, higher-yielding income bearing securities, such as "junk" bonds. Because the performance of these securities has historically been strongly influenced by economic conditions, the fund may emphasize security selection in business sectors that favor the economic outlook. Under normal market conditions, the fund invests at least 80% of its assets in bonds rated lower than investment grade (BBB/Baa) and their unrated equivalents or other high-yielding securities.
Cumulative Performance of $10,000 Investment Since Inception1,2
Average Annual Total Return through October 31, 20102 |
| | % Return Without Sales Charge | % Return After Sales Charge6 |
| | | | | | | | | | |
Class A Shares3 | 14.73% | 6.99% | 7.12% | 6.70% | — | 9.63% | 5.37% | 6.15% | 6.21% |
Class B Shares4 | 13.86 | 6.17 | 6.33 | 5.91 | — | 9.36 | 5.14 | 6.02 | 5.91 |
Class Y Shares7 | 15.04 | 7.25 | — | — | 7.65% | — | — | — | — |
| Bank of America Merrill Lynch US High Yield Master II, Constrained | 19.04 | 9.51 | 9.05 | 8.50 | 9.54 | NA | NA | NA | NA |
See accompanying Notes to Management’s Discussion of Fund Performance.
INVESTING ENVIRONMENT
The high yield market generated solid returns for the twelve-month period ended October 31, 2010, as the Bank of America Merrill Lynch High Yield Master II Constrained Index gained 19.04%. The combination of lower default rates, significant refinancing activity and investor focus on yield enhancing strategies were key ingredients to the high yield market’s rally. Over the past twelve months, the U.S. economy has slowly begun to heal as GDP growth turned positive. Unfortunately this economic growth has been somewhat anemic due to prolonged weakness in the labor and housing markets.
The technical underpinnings of the high yield market remained solid for most of the past twelve months as record new issuance continued to be readily absorbed by investors’ near insatiable demand for income producing assets. During the reporting period, high yield new issue supply set an all-time record as 616 new issues, totaling $284 billion flooded the
MEMBERS Mutual Funds | Management’s Discussion of Fund Performance | October 31, 2010
High Income Fund (concluded)
market. The vast majority of the new issuance has been used to refinance existing debt. The significant access to capital for high yield issuers was a key contributor to lower default expectations. In fact, default rates continued to grind lower during the reporting period with Moody’s calculating a latest twelve-month trailing default rate of 3.7% as of October 31, 2010.
| SECTOR ALLOCATION AS A PERCENTAGE OF NET ASSETS |
|
Consumer Discretionary | 29% |
| Consumer Staples | 5% |
| Energy | 10% |
| Financials | 2% |
| Health Care | 6% |
| Industrials | 15% |
| Information Technology | 5% |
| Materials | 10% |
| Telecommunication Services | 7% |
| Utilities | 4% |
| Cash and Other Net Assets | 7% |
Consumer Discretionary includes securities in the following industries: Auto Components; Automobiles; Consumer Finance; Diversified Consumer Services; Hotels, Restaurants & Leisure; Household Durables; Internet & Catalog Retail; Media; Multiline Retail; Specialty Retail; and Textiles, Apparel & Luxury Goods |
The MEMBERS High Income Fund returned 14.73% (Class A shares at net asset value) for the twelve-month period ended October 31, 2010. For the same time period, the Bank of America Merrill Lynch High Yield Master II Constrained Index returned 19.04%.
The fund underperformed its benchmark index because it was significantly underweight in the Financial sector and ownership of Discount Bonds. These two sectors were among the best performing sectors within the Bank of America Merrill Lynch High Yield Master II Constrained Index. For the overall high yield market, the Financial sector’s weighting has grown significantly due to numerous fallen angels (i.e., downgrades from investment grade to high yield) and accounted for 12% of the index (as of October 31, 2010). The fund’s underweight was primarily due to the poor bond structure, long maturity, high leverage, and weak business profile that are endemic to many of these financial fallen angels. However, notwithstanding these concerns, the financial issuers that are components in the index generated returns in excess of 31% fo r the period, as of October 31, 2010. The Financial sector is the largest component in the BofA Merrill Lynch High Yield Index by a significant margin and it was a top 5 performing sector during the reporting period (i.e., Financials had the largest contribution to return). Additionally, Discount Bonds was the best performing price bucket within the price category.
Key contributors to the fund’s strong absolute performance during the reporting period were the fund’s bond holdings in the utility, metals, retail, telecom, health care and automotive areas. Each of these industry holdings gained over 15% returns during the period. The fund’s convertible holdings also generated strong returns during the period, in excess of 23%.
During the period, the fund was an active participant in the new issue market by adding 59 new issues to the portfolio. The fund reduced its weighting in the Health Care sector and increased its exposure in the Technology sector and Automotive industry within the Consumer Discretionary sector.
MEMBERS Mutual Funds | Management’s Discussion of Fund Performance | October 31, 2010
INVESTMENT STRATEGY HIGHLIGHTS
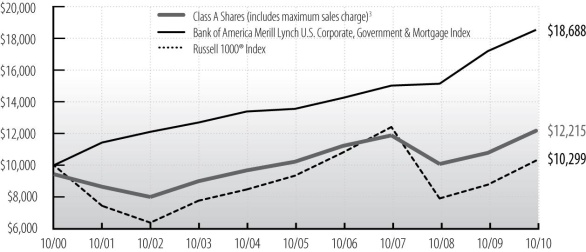
The MEMBERS Diversified Income Fund seeks income by investing in a broadly diversified array of securities including bonds, common stocks, real estate securities, foreign market bonds and stocks and money market instruments. Bonds, stock and cash components will vary, reflecting the portfolio managers’ judgments of the relative availability of attractively yielding and priced stocks and bonds. Generally, however, bonds will constitute up to 80% of the fund’s assets, stocks will constitute up to 60% of the fund’s assets, real estate securities will constitute up to 25% of the fund’s assets, foreign stocks and bonds will constitute up to 25% of the fund’s assets and money market instruments may constitute up to 25% of the fund’s assets. The fund intends to limit the investment in lower credit quality b onds to less than 50% of the fund’s assets.
Cumulative Performance of $10,000 Investment Since Inception1,2
Average Annual Total Return through October 31, 20102 |
| | % Return Without Sales Charge | % Return After Sales Charge6 |
| | | | | | | | | |
Class A Shares3 | 13.15% | 0.83% | 3.62% | 2.63% | 6.65% | (1.15)% | 2.39% | 2.02% |
Class B Shares4 | 12.35 | 0.08 | 2.85 | 1.86 | 7.85 | (0.91) | 2.52 | 1.86 |
| Russell 1000¨ Index | 17.67 | (6.14) | 1.99 | 0.29 | NA | NA | NA | NA |
| Bank of America Merrill Lynch US Corp, Govt & Mortg Index | 7.88 | 7.34 | 6.53 | 6.45 | NA | NA | NA | NA |
See accompanying Notes to Management’s Discussion of Fund Performance.
INVESTING ENVIRONMENT
Looking back to October 31, 2009, we were eight months past the stock market bottom of March 2009. Low quality stocks led the charge off the bottom, as we’ve seen historically. These low quality stocks included those companies that were closer to bankruptcy or insolvency near the bottom, and those with more cyclical cash flows and higher debt levels. These stocks continued to lead the market higher during the October 31, 2009 – April 30, 2010 period. Then, for the two months of late-April to late-June 2010, stocks corrected and higher quality stocks began to show better relative performance. As stock prices recovered after the correction, higher quality stocks began to lead performance.
Stock prices have recovered since the March 2009 bottom in spite of economic problems in Europe, a high unemployment rate in the U.S., and economic growth in emerging economies
MEMBERS Mutual Funds | Management’s Discussion of Fund Performance | October 31, 2010
Diversified Income Fund (concluded)
which has pushed oil and other commodity prices higher. During and after the late-April to late-June stock correction, interest rates on Treasury Bonds declined to generational lows. The ten year Treasury Bond yield fell from more than 3.6% in April to 2.6% at the end of the period. At the end of August, nearly one third of stocks in the S&P 500 Index offered a dividend yield above that of the ten year Treasury Bond, which we believe showed that the stock market had good valuation versus interest rates.
| PORTFOLIO ALLOCATION AS A PERCENTAGE OF NET ASSETS |
|
| Asset Backed | 1% |
| Common Stocks | 51% |
| Corporate Notes and Bonds | 20% |
| Mortgage Backed | 13% |
| U.S. Government and Agency Obligations | 12% |
| Cash and Other Net Assets | 3% |
For the twelve-month period ended October 31, 2010, the MEMBERS Diversified Income Fund returned 13.15% (Class A shares at net asset value) while the Bank of America Merrill Lynch U.S. Corporate, Government & Mortgage Index (the fund’s bond portion index) returned 7.88% and the Russell¨ 1000 Index (the fund’s stock portion index) returned 17.67%. The fund’s representative market index is represented by these two separate indexes as a better reflection of the types of stocks and bonds typically held by the fund as described in the prospectus. For the period, we are pleased that the stock portion of the fund outperformed its index and that, combined with strong bond performance, the fund’s overall performance reflects its blend of investments.
Within the stock portion of the fund (approximately 51% on October 31, 2010), performance of the fund’s Energy, Consumer Staples, and Industrials stocks helped with strong returns. The fund’s stock holdings did lag during the first half of the year while low quality stocks led the market, but held up better during the correction and have led since late June.
Specifically, the fund’s holding in McDonald’s Corporation was a strong contributor to performance during the period. The stock’s earnings outlook climbed during the period as new menu items were met with success and global sales climbed. The stock rose by over 30% and paid a 4% dividend. Fund holding Emerson Electric rose 29% during the period, and paid a 3% dividend. Asian business was strong and helped push earnings higher than beginning of period expectations.
The bond portion of the fund was significantly overweight corporate bonds vs. the Bank of America Merrill Lynch U.S. Corporate, Government and Mortgage Index in general and BBB rated securities in particular, both of which significantly outperformed government securities and mortgage securities. For example, BBB rated securities returned over 5.5% more during the period than comparable maturity Treasury securities. Additionally, the bond portion of the portfolio held a yield advantage over the Merrill bond index. While it varied over the year, at period end the current yield (coupon divided by price) of the portfolio was 4.85% while the index was 3.98% and the yield to maturity was 2.54% versus an index yield of 2.26%. The above factors all contributed to performance. Performance was slightly hurt by the bond portion position to have l ess interest rate exposure than the index. This positioning was due to our concerns that interest rates would eventually rise to a meaningful extent.
For the stock portion of the fund, the portfolio shifts during the period included reducing Industrial stock holdings, as price appreciation pushed them to our sell prices. We added to our Technology stock positions, as many quality Technology stocks have started to pay above average dividends, including IBM, Microsoft, and Intel.
MEMBERS Mutual Funds | Management’s Discussion of Fund Performance | October 31, 2010
EQUITY INCOME FUND
INVESTMENT STRATEGY HIGHLIGHTS
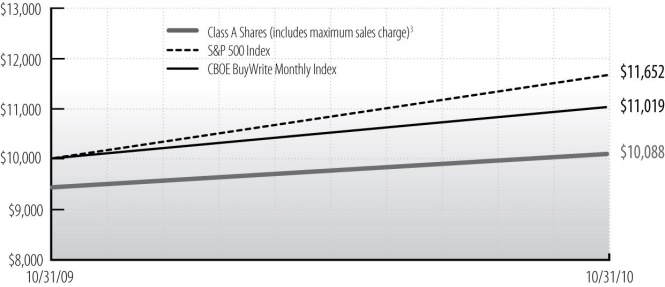
The MEMBERS Equity Income Fund invests primarily in common stocks of large-and mid-capitalization companies that are, in the view of the fund’s investment adviser, selling at a reasonable price in relation to their long-term earnings growth rates. The portfolio managers will allocate the fund’s assets among stocks in sectors of the economy based upon their expected earnings growth rates, adjusted to reflect their views on economic and market conditions and sector risk factors.
The fund will seek to generate current earnings from option premiums by writing (selling) covered call options on a substantial portion of its portfolio securities. The fund seeks to produce a high level of current income and current gains generated from option writing premiums and, to a lesser extent, from dividends. The extent of option writing activity will depend upon market conditions and the portfolio manager’s ongoing assessment of the attractiveness of writing call options on the fund’s stock holdings. In addition to providing income, covered call writing helps to reduce the volatility (and risk profile) of the fund by providing downside protection.
Cumulative Performance of $10,000 Investment Since Inception1,2
Average Annual Total Return through October 31, 20102 |
| | % Return Without Sales Charge | % Return After Sales Charge6 |
| | | | | |
Class A Shares3 | 7.03% | 7.03% | 0.88% | 0.88% |
Class Y Shares7 | 7.23 | 7.23 | — | — |
| S&P 500 Index | 16.52 | 16.52 | NA | NA |
| CBOE BuyWrite Monthly Index | 10.19 | 10.19 | NA | NA |
See accompanying Notes to Management’s Discussion of Fund Performance.
INVESTING ENVIRONMENT
The MEMBERS Equity Income Fund opened on November 1, 2009 and now celebrates its first anniversary. The investment environment over the twelve-month period ended October 31, 2010 has vacillated, wildly at times, between optimism and pessimism, as investors struggled to navigate through an uncertain path toward sustainable economic growth. The fund commenced operations in the midst of a strong bull market recovery off the market lows of March 2009. The fund took a conservative stance
MEMBERS Mutual Funds | Management’s Discussion of Fund Performance | October 31, 2010
Equity Income Fund (concluded)
early on as stock prices had already rebounded very strongly prior to the fund’s opening. This stance caused the fund to underperform the general market as stocks continued to advance through late April. With the market correction in the May/June period, the fund opportunistically moved to a fully invested status through mid-year with strong performance relative to the market as the covered nature of the fund provided added protection from the downturn. The trend since mid-year has been broadly positive for stocks as additional liquidity and reduced double-dip recession fears provided support for equities. With equity markets again advancing strongly through the end of October, the fund continues to participate in the positive movement of stocks; however, the covered call nature of the strategy limits the fund’s ability to fully participate.
| SECTOR ALLOCATION AS A PERCENTAGE OF NET ASSETS |
|
| | Fund | S&P 500 Index |
| Consumer Discretionary | 11% | 11% |
| Consumer Staples | – | 11% |
| Energy | 13% | 11% |
| Financials | 18% | 15% |
| Health Care | 16% | 11% |
| Industrials | 2% | 11% |
| Information Technology | 21% | 19% |
| Materials | – | 4% |
| Telecommunication Services | – | 3% |
| Utilities | – | 4% |
| Exchange-Traded Fund | 3% | – |
| Cash and Other Net Assets | 16% | – |
Although the fund’s performance has lagged the S&P 500 on a one year basis, much of the underperformance occurred during the initial start-up months which coincided with the continuation of a very strong bull market. During this time, initial fund capital and significant cash inflows resulted in a higher than normal cash position which impeded the fund’s ability to fully participate in the strong market upswing in November and December of 2009. For the twelve-month period ended October 31, 2010, the fund has delivered a 7.03% return (Class A shares at net asset value), compared with a 16.52% return on the S&P 500 and a 10.19% return on the CBOE BuyWrite Monthly Index which is the passive version of a covered call strategy.
Aside from the early underperformance due to the initial high cash levels, the performance of the fund’s individual holdings has been broadly positive led by Technology holdings Google Inc. Class A, BMC Software, and QUALCOMM, Inc. Strong performance from Financial stocks including Intercontinental Exchange, Aflac Inc. and Affiliated Managers offset weakness in Morgan Stanley. Further strength came from UnitedHealth Group, Inc., Coach Inc. and Freeport-McMoran Copper. A pocket of weakness came from Energy companies related to unconventional natural gas production and exploration, namely Southwestern Energy Co. and PetroHawk Energy Corp, due to subdued natural gas prices.
As the market has continued to show significant strength of late, the fund has taken a more conservative approach in advance of potential future volatility. The percentage of call options written against portfolio holdings has increased as the market has advanced as we position the fund for additional protection. The fund has delivered on its distribution goals and is well positioned to continue to payout a relatively high level of income.
MEMBERS Mutual Funds | Management’s Discussion of Fund Performance | October 31, 2010
LARGE CAP VALUE FUND
INVESTMENT STRATEGY HIGHLIGHTS
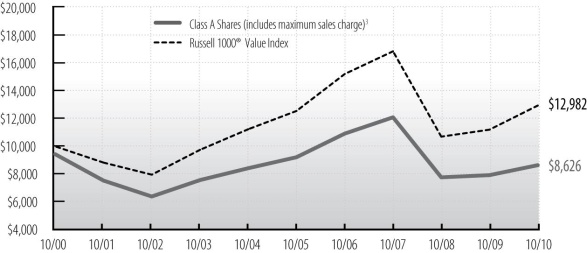
The MEMBERS Large Cap Value Fund will, under normal market conditions, invest primarily in large cap stocks. The fund follows a "value" approach, meaning the portfolio managers seek to invest in stocks at prices below their perceived intrinsic value as estimated based on fundamental analysis of the issuing company and its prospects. By investing in value stocks, the fund attempts to limit the downside risk over time but may also produce smaller gains than other stock funds if their intrinsic values are not realized by the market or if growth-oriented investments are favored by investors. The fund will diversify its holdings among various industries and among companies within those industries. The fund typically sells a stock when the fundamental expectations for buying it no longer apply, the price exceeds its intrinsic value or other stocks appear more attractively priced relative to their intrinsic values.
Cumulative Performance of $10,000 Investment Since Inception1,2
Average Annual Total Return through October 31, 20102 |
| | % Return Without Sales Charge | % Return After Sales Charge6 |
| | | | | | | | | | |
Class A Shares3 | 9.22% | (10.72)% | (1.29)% | (0.88)% | — | 2.98% | (12.46)% | (2.46)% | (1.47)% |
Class B Shares4 | 8.45 | (11.37) | (2.02) | (1.63) | — | 3.95 | (12.39) | (2.40) | (1.63) |
Class Y Shares7 | 9.58 | (10.48) | — | — | (2.96)% | — | — | — | — |
| Russell 1000¨ Value Index | 15.71 | (8.49) | 0.62 | 2.64 | (1.64) | NA | NA | NA | NA |
See accompanying Notes to Management’s Discussion of Fund Performance.
MEMBERS Mutual Funds | Management’s Discussion of Fund Performance | October 31, 2010
Large Cap Value Fund (concluded)
While stocks rose at above average rates during the twelve-month period ended October 31, 2010, large value stocks lagged the overall market. The period can be split in two portions. During the first six months through April 2010, lower quality stocks led the market higher. Then the market corrected for two months, falling over 15% before rebounding during the last four months of the period. As stock prices recovered after the correction, higher quality stocks began to lead performance.
| SECTOR ALLOCATION AS A PERCENTAGE OF NET ASSETS |
|
| | Fund | Russell 1000¨ Value Index |
| Consumer Discretionary | 4% | 8% |
| Consumer Staples | 13% | 10% |
| Energy | 15% | 12% |
| Financials | 21% | 27% |
| Health Care | 16% | 13% |
| Industrials | 8% | 9% |
| Information Technology | 11% | 6% |
| Materials | 3% | 3% |
| Telecommunication Services | 4% | 5% |
| Utilities | 3% | 7% |
| Cash and Other Net Assets | 2% | – |
For the twelve-month period ended October 31, 2010, the MEMBERS Large Cap Value Fund return of 9.22% (Class A shares at net asset value) lagged Russell 1000¨ Value Index return of 15.71%. The fund’s lag versus the benchmark built up during the first six months of the period, and was unable to close the gap when the market shifted to higher quality stocks during the second half of the period.
Energy stocks were the biggest detriment to performance during the period. While the fund’s larger oil related issues performed well, its holdings in natural gas related firms, as well as energy equipment and services stocks underperformed. Low natural gas prices hurt natural gas exploration & production company Southwestern Energy Co.which was down just over 21% for the period. Deep water drilling company Noble Corp also detracted from results.
Overall, the fund’s stock selection was weak during the twelve-month period ended October 31, 2010. The fund’s Financial holdings in Morgan Stanley and Bank of New York Mellon Corp. negatively impacted results, as did utility services company Exelon Corp. within the Utilities sector. In addition, allocation to seven out of the ten major sectors versus the index was also a negative contributor to performance.
Offsetting some of the losses include strong performance from several fund holdings. AutoZone, Inc. rose as earnings came in better than expected as the trend away from new car purchases led to more miles being put on existing cars, and AutoZone provided more parts to keep them running. UnitedHealth Group, Inc. was another good stock holding for the fund as earnings climbed higher than expected. Health Care reform had depressed the shares, and as the reform was legislated, the environment UnitedHealth Group was left operating in was not as difficult as expected. This led to an expanding valuation for the stock. Viacom, Inc. was another holding that aided performance. The stock was purchased for the fund partly because of its large free cash flow. The stock benefitted as better advertising revenues from their cable programs led to earni ngs exceeding beginning of period expectations.
The number of stocks held in the portfolio fell from 58 to 49 during the period as we built bigger positions in our favorite stocks. We reduced the weight invested in the Energy sector as well as Consumer Durables. While we increased our weight in two traditionally ‘defensive’ sectors, Consumer Staples and Health Care, we also increased our position size in the traditionally more aggressive Information Technology sector.
MEMBERS Mutual Funds | Management’s Discussion of Fund Performance | October 31, 2010
LARGE CAP GROWTH FUND
INVESTMENT STRATEGY HIGHLIGHTS
The MEMBERS Large Cap Growth Fund invests primarily in common stocks of larger companies and will, under normal market conditions, maintain at least 80% of its assets in large cap stocks. The fund follows a "growth" approach, meaning the portfolio managers seek stocks that have low market prices relative to their perceived growth capabilities as estimated based on fundamental analysis of the issuing companies and their prospects. The fund typically seeks higher earnings growth capabilities in the stocks it purchases, and may include some companies undergoing more significant changes in their operations or experiencing significant changes in their markets. The fund will diversify its holdings among various industries and among companies within those industries. The fund has an active trading strategy which will lead to more portfolio tu rnover than a more passively-managed fund. The fund typically sells a stock when the fundamental expectations for buying it no longer apply, the price exceeds its perceived value or other stocks appear more attractively priced relative to their prospects.
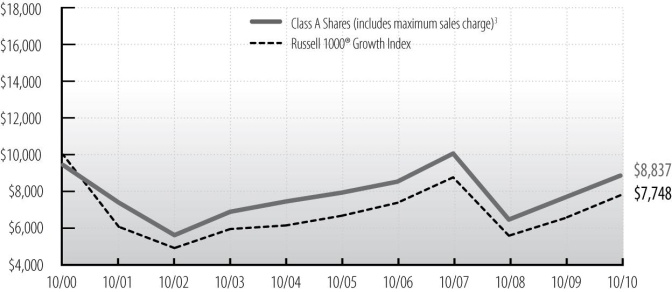
Cumulative Performance of $10,000 Investment Since Inception1,2
Average Annual Total Return through October 31, 20092 |
| | % Return Without Sales Charge | % Return After Sales Charge6 |
| | | | | | | | | | |
Class A Shares3 | 15.96% | (4.23)% | 2.28% | (0.64)% | — | 9.31% | (6.10)% | 1.07% | (1.23)% |
Class B Shares4 | 15.05 | (4.95) | 1.51 | (1.38) | — | 10.55 | (6.07) | 1.13 | (1.38) |
Class Y Shares7 | 16.26 | (3.99) | — | — | 2.78 | — | — | — | — |
| Russell 1000¨ Growth Index | 19.65 | (3.94) | 3.21 | (2.52) | 2.94 | NA | NA | NA | NA |
See accompanying Notes to Management’s Discussion of Fund Performance.
INVESTING ENVIRONMENT
Despite an anemic economy rife with structural challenges, the stock market had strong returns during the twelve-month period ended October 31, 2010. The period was unusual and highly challenging. Record low interest rates created a valuation floor for stocks. At the same time, sentiment shifted from fear of another depression to hope for recovery. Combined, these two factors drove the market up, even within the context of a tenuous economic recovery.
MEMBERS Mutual Funds | Management’s Discussion of Fund Performance | October 31, 2010
Large Cap Growth Fund (concluded)
| SECTOR ALLOCATION AS A PERCENTAGE OF NET ASSETS |
|
| | Fund | Russell 1000¨ Growth Index |
| Consumer Discretionary | 8% | 15% |
| Consumer Staples | 8% | 10% |
| Energy | 10% | 10% |
| Financials | 7% | 4% |
| Health Care | 13% | 10% |
| Industrials | 9% | 13% |
| Information Technology | 39% | 32% |
| Materials | 2% | 5% |
| Telecommunication Services | – | 1% |
| Utilities | – | – |
| Cash and Other Net Assets | 4% | – |
The MEMBERS Large Cap Growth Fund had a 15.96% gain (Class A shares at net asset value), while the Russell 1000¨ Growth Index returned 19.65% for the twelve-month period ended October 31, 2010.
Within our growth stock universe, our strategy was to focus on leading companies with strong balance sheets generating excess cash flow, with the belief that these types of firms would be able to distinguish themselves from others which were more economically cyclical. This strategy was effective for stocks held in the Financial, Health Care and Information Technology sectors. However, the main reason we did not outperform the benchmark was due to our Energy investments. Our focus was in rapidly growing firms developing domestic shale-based natural gas reserves. Our expectation was for a national energy policy to emerge based on secure, clean, domestic sources of long lasting fuel. The political agenda pivoted away from energy during the period, in part causing these types of stocks to underperform. The fund’s positions in Petroh awk Energy Corp., Weatherford International Ltd., Occidental Petroleum Corp., and Southwestern Energy Co. all hurt performance. However, we remain committed to this thesis.
Within the Consumer Discretionary sector, the fund’s position in ITT Educational Services Inc. negatively impacted performance as the stock returned -25.38% for the period. Additionally, the fund’s underweight allocation versus the index to the Industrials sector also detracted from relative performance as this sector produced strong returns.
Partially offsetting the losses were strong returns from several positions held during the period. Axis Capital Holdings, Ltd. is an insurance company which bought back almost 20% of its outstanding stock while paying a dividend to yield 2.50%. The stock gained over 20% for the period. HMS Holdings Corp. is a medical services company focused in part on identifying and rectifying Medicaid fraud. We believe the company will likely continue to grow earnings close to 20% for the foreseeable future, and has no debt. The stock gained 40% for the period. ArcSight, Inc. is a leading cyber-security firm. The stock gained over 35% for the period because Hewlett Packard shared our perspective in its strategic importance – by buying the entire company.
We believe the portfolio is well diversified by design since we find attractive investments across most economic sectors. Throughout the period we have generally emphasized Technology, Health Care and Energy ideas while being more selective in consumer-related sectors. Many businesses have accumulated large cash balances which will be deployed on productivity and growth initiatives once confidence solidifies. Alternatively, many consumers are likely facing lingering challenges as employment opportunities remain scarce and home prices stagnate.
MEMBERS Mutual Funds | Management’s Discussion of Fund Performance | October 31, 2010
MID CAP FUND
INVESTMENT STRATEGY HIGHLIGHTS
The MEMBERS Mid Cap Fund invests generally in common stocks of midsize companies and will, under normal market conditions, maintain at least 80% of its assets in mid cap securities. However, the fund will not automatically sell a stock because its market capitalization has changed and such positions may be increased through additional purchases. The fund seeks attractive long-term returns through bottom-up security selection based on fundamental analysis in a diversified portfolio of high-quality growth companies with attractive valuations. These will typically be industry leading companies in niches with strong growth prospects. The fund’s portfolio managers believe in selecting stocks for the fund that show steady, sustainable growth and reasonable valuation. As a result, stocks of issuers that are believed to have a blend of b oth value and growth potential will be selected for investment. Stocks are generally sold when target prices are reached, company fundamentals deteriorate or more attractive stocks are identified.
Cumulative Performance of $10,000 Investment Since Inception1,2
Average Annual Total Return through October 31, 20102 |
| | % Return Without Sales Charge | % Return After Sales Charge6 |
| | | | | | | | | | |
Class A Shares3 | 20.20% | (7.00)% | 2.26% | (2.69)% | — | 13.33% | (8.80)% | 1.04% | (3.26)% |
Class B Shares4 | 19.35 | (7.72) | 1.48 | (3.42) | — | 14.85 | (8.80) | 1.10 | (3.42) |
Class Y Shares7 | 20.20 | (6.81) | — | — | 0.83% | — | — | — | — |
| Russell Midcap¨ Growth Index | 28.03 | (3.47) | 4.28 | 0.20 | 2.85 | NA | NA | NA | NA |
| Russell Midcap¨ Index | 27.71 | (3.46) | 4.01 | 5.42 | 2.27 | | | | |
See accompanying Notes to Management’s Discussion of Fund Performance.
INVESTING ENVIRONMENT
During the twelve-month period ended October 31, 2010, mid cap stocks performed well despite a multi-month correction that occurred over the summer. The period began with a continuation of the 2009 rally where low risk premiums persisted in equity markets. That rally paused as a correction began in April. Investors worried about the sovereign debt crisis in Europe, the scope of financial reform and the tragic oil spill in the Gulf of Mexico. These issues were put on the back burner in September as
MEMBERS Mutual Funds | Management’s Discussion of Fund Performance | October 31, 2010
Mid Cap Fund (concluded)
the Fed announced its intentions to provide another round of quantitative easing. With the Fed once again likely to print money, investors embraced risk assets including securities with volatile earnings histories.
| SECTOR ALLOCATION AS A PERCENTAGE OF NET ASSETS |
|
| | Fund | Russell Midcap¨ Index |
| Consumer Discretionary | 11% | 15% |
| Consumer Staples | 6% | 6% |
| Energy | 8% | 8% |
| Financials | 21% | 19% |
| Health Care | 12% | 9% |
| Industrials | 15% | 13% |
| Information Technology | 11% | 15% |
| Materials | 6% | 6% |
| Telecommunication Services | 2% | 2% |
| Utilities | – | 7% |
| Cash and Other Net Assets | 8% | – |
For the twelve-month period ended October 31, 2010, the MEMBERS Mid Cap Fund increased 20.20% (Class A shares at net asset value), underperforming the Russell Midcap¨ Index return of 27.71%. Even though we produced strong absolute returns, the period was challenging for the fund as cyclical stocks performed better than companies with more consistent earnings profiles.
Stock picking was weakest in the Industrial and Energy sectors, which accounted for over half of the fund’s underperformance. Used construction equipment auctioneer Ritchie Bros Auctioneers, Inc., engineering and construction firm Jacobs Engineering Group, Inc. and used car auctioneer Copart, Inc. were notable underperformers in the Industrial sector. Within Energy, low natural gas prices hurt natural gas exploration & production companies Southwestern Energy Co. and EQT Corporation, and deep water drilling company Noble Corp. also negatively impacted results. Our assessments of these companies remains positive even though the market favored more leveraged and speculative companies over the past year. We continue to believe our focus on firms with sustainable competitive advantages, modest financial leverage and stable earnin gs histories will result in long-term outperformance.
Partially offsetting the underperformance, stock picking was best in the Financial sector relative to the index. Commercial real estate operating company Brookfield Properties Corp. and global infrastructure asset manager Brookfield Asset Management, Inc., Class A contributed nicely to performance. Consumer Staples stock picking was another area of strength as retail pharmacy Walgreen, spice manufacturer McCormick & Co., Inc. and alcohol manufacturer Brown-Forman Corp., Class B were additive to returns.
We increased our exposure to Financials during the period, particularly in insurance and asset management. We added to insurance broker Brown & Brown, Inc., specialty insurer Markel Corp. and property & casualty insurer RLI Corp. Other additions included Brookfield Asset Management, Inc., Class A and SEI Investments Co. We maintain an overweight position in Financials as we believe valuations are attractive.
The combination of rising valuations and concerns about sustainability of economic growth, and its impact on more cyclical sectors, caused us to reduce our Industrial and Consumer Discretionary exposure during the period.
MEMBERS Mutual Funds | Management’s Discussion of Fund Performance | October 31, 2010
SMALL CAP FUND
INVESTMENT STRATEGY HIGHLIGHTS
The MEMBERS Small Cap Fund invests primarily in a diversified mix of common stocks of small cap U.S. companies that are believed to be undervalued by various measures and offer sound prospects for capital appreciation. The portfolio managers employ a value-oriented investment approach in selecting stocks, using proprietary fundamental research to identify securities of companies they believe have attractive valuations. The portfolio managers focus on companies with a record of above average rates of profitability that sell at a discount relative to the overall small cap market. Through fundamental research, the portfolio managers seek to identify those companies which possess one or more of the following characteristics: sustainable competitive advantages within a market niche; strong profitability and free cash flows; strong market sh are positions and trends; quality of and share ownership by management; and financial structures that are more conservative than the relevant industry average.
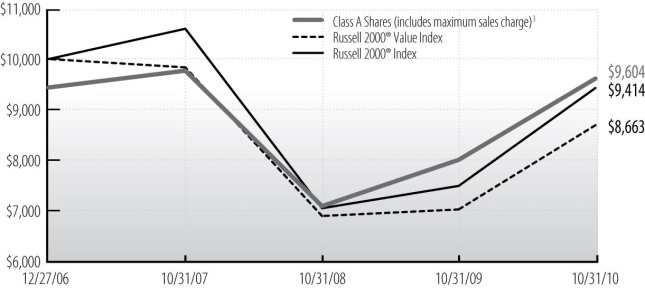
Cumulative Performance of $10,000 Investment Since Inception1,2
Average Annual Total Return through October 31, 20102 |
| | % Return Without Sales Charge | % Return After Sales Charge6 |
| | | | | | | | |
Class A Shares3 | 20.60% | (0.55)% | 0.49% | — | 13.70% | (2.49)% | (1.04)% |
Class B Shares4 | 19.56 | (1.10) | (0.12) | — | 15.06 | (2.24) | (0.89) |
Class Y Shares7 | 20.90 | (0.26) | — | 1.24% | — | — | — |
| Russell 2000¨ Value Index | 24.43 | (4.13) | (3.66) | (3.28) | NA | NA | NA |
| Russell 2000¨ Index | 26.58 | (3.91) | (1.56) | (1.22) | | | |
See accompanying Notes to Management’s Discussion of Fund Performance.
INVESTING ENVIRONMENT
A volatile twelve-month period ended October 31, 2010 closed in relatively strong fashion as concerns about a debt default in Greece, the impacts of tightening Chinese monetary policy, and stubbornly high U.S. unemployment pressured stocks early in 2010, but generally strong earnings reports, indications of additional monetary easing from the U.S. Federal Reserve, and a belief that the economy is finding its footing provided a lift to equities later in the period. Returns were
MEMBERS Mutual Funds | Management’s Discussion of Fund Performance | October 31, 2010
Small Cap Fund (concluded)
strong across capitalizations and styles. Growth stocks (+28.7%) modestly outperformed value (+24.4%), while small cap stocks (+26.6%) led their larger peers (+16.5%), as measured by the Russell 2000¨ Growth, Russell 2000¨ Value, Russell 2000¨, and S&P 500 indices, respectively. Sector performance was strong, with all sectors of the Russell 2000¨ Index posting double-digit gains for the period. Materials, Information Technology, and Consumer Discretionary led the market higher while Health Care and Consumer Staples trailed.
| SECTOR ALLOCATION AS A PERCENTAGE OF NET ASSETS |
|
| | Fund | Russell 2000¨ Index |
| Consumer Discretionary | 16% | 14% |
| Consumer Staples | 4% | 3% |
| Energy | 5% | 6% |
| Financials | 24% | 21% |
| Health Care | 8% | 13% |
| Industrials | 22% | 15% |
| Information Technology | 9% | 19% |
| Materials | 4% | 5% |
| Telecommunication Services | – | 1% |
| Utilities | 5% | 3% |
| Cash and Other Net Assets | 3% | – |
For the twelve-month period ended October 31, 2010, the MEMBERS Small Cap Fund returned 20.60% (Class A shares at net asset value), underperforming the Russell 2000¨ Index which returned 26.58%.
Among the largest sources of weakness relative to the index were our Consumer Discretionary, Materials, and Health Care holdings. Relative performance suffered in Consumer Discretionary due to positions in memorialization products company Matthews International Corp., Class A and casual dining operator Sonic Corp. Exposure to cleaning products company Zep, Inc. in the Materials sector and investments in contract research providers ICON PLC and Charles River Laboratories International, Inc. in Health Care detracted. Other sources of relative weakness included Penn Virginia Corp. (Energy) and Amsurg Corp. (Health Care).
Although the fund benefited from strong security selection among our Financials and Consumer Staples holdings, relative performance was negatively impacted by relative sector exposures, a residual of our bottom-up stock selection process. Below-index weights in the Information Technology and Materials sectors detracted from relative results.
The fund’s investment approach emphasizes individual stock selection; sector weights are a residual of our bottom-up investment process. We do, however, carefully consider diversification across economic sectors to limit risk. Based on bottom-up stock decisions, exposure to Financials increased and exposure to Consumer Staples fell. In Financials, we established new positions in Northwest Bancshares, Inc. and AMERISAFE, Inc. and added to our position in Reinsurance Group of America, Inc. Exposure to Consumer Staples declined as we trimmed our investments in Herbalife, Ltd. and Casey’s General Stores, Inc.
MEMBERS Mutual Funds | Management’s Discussion of Fund Performance | October 31, 2010
INTERNATIONAL STOCK FUND
INVESTMENT STRATEGY HIGHLIGHTS
The MEMBERS International Stock Fund will invest, under normal market conditions, primarily in foreign equity securities. Typically, a majority of the fund’s assets are invested in relatively large capitalization stocks of companies located or operating in developed countries. The fund may also invest up to 30% of its assets in securities of companies whose principal business activities are located in emerging market countries. The portfolio managers typically maintain this segment of the fund’s portfolio in such stocks which it believes have a low market price relative to their perceived value based on fundamental analysis of the issuing company and its prospects. The fund may also invest in foreign debt and other income bearing securities at times when it believes that income bearing securities have greater capital apprec iation potential than equity securities.
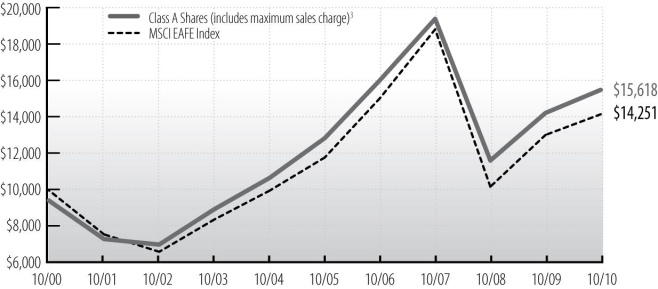
Cumulative Performance of $10,000 Investment Since Inception1,2
Average Annual Total Return through October 31, 20102 |
| | % Return Without Sales Charge | % Return After Sales Charge6 |
| | | | | | | | | | |
Class A Shares3 | 9.01% | (7.28)% | 3.87% | 5.18% | — | 2.71% | (9.09)% | 2.65% | 4.56% |
Class B Shares4 | 8.26 | (7.97) | 3.09 | 4.39 | — | 3.76 | (8.83) | 2.79 | 4.39 |
Class Y Shares7 | 9.28 | (7.07) | — | — | 1.14% | — | — | — | — |
| MSCI EAFE Index | 8.82 | (9.15) | 3.79 | 3.61 | 1.19 | NA | NA | NA | NA |
See accompanying Notes to Management’s Discussion of Fund Performance.
INVESTING ENVIRONMENT
Over the twelve-month period ended October 31, 2010, the market was volatile but finished up with the S&P 500 Index producing a double-digit positive return of 16.52%. Many developments during the period led to intervals of both investor confidence and fear. Positive developments included economic expansion in most parts of the world, strong corporate earnings, and the announcement of relatively benign financial regulation, including Basel III capital requirements. Among the negative developments were the sovereign debt crisis in Europe, the oil spill in the Gulf of Mexico, and tensions in the Korean peninsula. Sector leadership for the period was mixed between
MEMBERS Mutual Funds | Management’s Discussion of Fund Performance | October 31, 2010
International Stock Fund (concluded)
defensives and cyclicals, reflecting the uncertain economic outlook. Additionally, emerging markets stocks were particularly strong performers.
| GEOGRAPHICAL ALLOCATION AS A PERCENTAGE OF NET ASSETS |
|
| Europe (excluding United Kingdom) | 35% |
| Japan | 18% |
| Latin America | 4% |
| Pacific Basin | 6% |
| United Kingdom | 28% |
| Other Countries | 6% |
| Cash and Other Net Assets | 3% |
The MEMBERS International Stock Fund returned 9.01% (Class A shares at net asset value), outperforming the MSCI EAFE Index return of 8.82% for the twelve-month period ended October 31, 2010. Stock selection in the Financials sector contributed to relative returns. The fund benefited from its holding in emerging market banks Turkiye Garanti Bankasi AS and Banco do Brasil S.A., as well as U.K. bank Standard Chartered PLC, and Japanese real estate builder, Daito Trust Construction Co., Ltd..
Stock selection in the Consumer Discretionary sector also helped performance, despite underperformance from Hong Kong-based retailer Esprit Holdings, Ltd. Positions in French automobile components company Valeo S.A., South Korean automobile parts and services company Hyundai Mobis, and U.K. media company Informa PLC, added to returns.
The fund’s low exposure to the Utilities sector also helped performance, as the sector lagged the index. The sector continues to be oversupplied, as incremental supply has become available while demand remains below 2007 peak levels.
Conversely, the fund’s low exposure to the Materials sector hurt performance. However, the fund benefited from strong performance by its positions in Xstrata PLC and Potash Corp. of Saskatchewan, Inc., which was due to a recovery in demand for raw materials. This coincided with improved economic conditions and a weakening U.S. dollar.
Additionally, a high exposure to the Information Technology sector hurt performance. However, it was almost completely offset by positive stock selection. The fund’s positions in Canon, Inc. and Keyence Corp. performed well over the year, reflecting the companies’ competitive strength and improving earnings.
Over the last twelve-month period ended October 31, 2010, the portfolio transitioned to a less defensive position than during the previous year. The fund’s exposure to the Materials, Consumer Discretionary, and Information Technology sectors increased, while its exposure to the Telecommunication Services sector was reduced. Additionally, the fund’s exposure to emerging markets increased, transitioning from a weight of approximately 7.5% as of October 2009 to approximately 9.2% as of October 2010. Notable purchases within the emerging markets asset class included: Turkiye Garanti Bankasi, a Turkish bank; Hyundai Mobis, a South Korean automotive parts manufacturer; Vale, a Brazilian mining company; Weichai Power, a Chinese diesel engine manufacturer; and Samsung Electronics, a South Korean technology company.
During the market’s pullback in the second quarter of 2010, we opportunistically purchased shares in many high-quality companies across several sectors. These companies included energy companies Royal Dutch Shell, AMEC, and Tullow Oil, as well as the aforementioned Hyundai Mobis. Other notable purchases over the year included: materials companies Potash Corporation of Saskatchewan and BHP Billiton; Valeo, a French automobile parts supplier; as well as eAccess, a Japanese technology company.
MEMBERS Mutual Funds | Management’s Discussion of Fund Performance | October 31, 2010
Notes to Management’s Discussion of Fund Performance
| | NANot Applicable. Index returns do not reflect sales charges, fees or expenses. |
| | 1This chart compares a $10,000 investment made in the fund to a $10,000 investment made in the index. |
| | 2Fund returns are calculated after fund expenses have been subtracted and assume that dividends and capital gains are reinvested in additional shares of the fund. Returns do not reflect the deduction of taxes that a shareholder would pay on fund distributions or the redemption of fund shares. Investment return and principal value will fluctuate, so an investor’s shares, when redeemed, may be worth more or less than when purchased. Further information relating to the fund’s performance is contained in the Prospectus and elsewhere in this report. The fund’s past performance is not indicative of future performance. Current performance may be lower or higher than the performance data cited. For fund performance data current to the most recent month-end, please call 1-800-877-6089 or visit www.membersfunds.com. Indices are u nmanaged and investors cannot invest in them directly. Index returns do not reflect fees or expenses. |
| | 3Maximum sales charge is 5.75% for class A shares for the Conservative, Moderate and Aggressive Allocation Funds and the Diversified Income, Equity Income, Large Cap Value, Large Cap Growth, Mid Cap, Small Cap and International Stock Funds. The maximum sales charge is 4.50% for the Bond and High Income Fund class A shares. |
| | 4Maximum contingent deferred sales charge (CDSC) is 4.50% for class B shares, which is reduced after 12 months and eliminated after six years. |
| | 5Maximum contingent deferred sales charge (CDSC) is 1% for class C shares, which is eliminated after one year. |
| | 6Assumes maximum applicable sales charge. |
| | 7Class Y Shares are only available for purchase by MEMBERS Funds and other affiliated asset allocation funds, in managed account programs, and to certain other investors as described in the current Prospectus. |
MEMBERS Mutual Funds | Management’s Discussion of Fund Performance | October 31, 2010
BENCHMARK DESCRIPTIONS
Allocation Fund Indexes
The Conservative Allocation Fund Custom Index consists of 65% Merrill Lynch U.S. Corporate, Government and Mortgage Index, 30% Russell 3000¨ Index and 5% MSCI EAFE Index. See market indexes descriptions below.
The Moderate Allocation Fund Custom Index consists of 40% Merrill Lynch U.S. Corporate, Government and Mortgage Index, 45% Russell 3000¨ Index and 15% MSCI EAFE Index. See market indexes descriptions below.
The Aggressive Allocation Fund Custom Index consists of 15% Merrill Lynch U.S. Corporate, Government and Mortgage Index, 55% Russell 3000¨ Index and 30% MSCI EAFE Index. See market indexes descriptions below.
Market Indexes
The CBOE BuyWrite Monthly Index (BXM) is a benchmark index designed to track the performance of a hypothetical buy-write strategy (i.e. holding a long position in and selling covered call options on that position) on the S&P 500 Index.
The Bank of America Merrill Lynch U.S. Corporate, Government & Mortgage Index is a broad-based measure of the total rate of return performance of the U.S. investment-grade bond markets. The index is a capitalization-weighted aggregation of outstanding U.S. treasury, agency and supranational mortgage pass-through, and investment-grade corporate bonds meeting specified selection criteria.
The Bank of America Merrill Lynch U.S. High Yield Master II Constrained Index tracks the performance of below investment grade U.S. dollar denominated corporate bonds publicly issued in the U.S. domestic market, but limits any individual issuer to a maximum weighting of 2%.
The MSCI EAFE (Europe, Australasia & Far East) Index is a free float-adjusted market capitalization index that is designed to measure developed market equity performance, excluding the U.S. and Canada.
The Russell 1000¨ Index is a large-cap market index which measures the performance of the 1,000 largest companies in the Russell 3000¨ Index (see definition below).
The Russell 1000¨ Growth Index is a large-cap market index which measures the performance of those Russell 1000 companies with higher price-to-book ratios and higher forecasted growth values.
The Russell 1000¨ Value Index is a large-cap market index which measures the performance of those Russell 1000 companies with lower price-to-book ratios and lower forecasted growth values.
The Russell 2000¨ Index is a small-cap market index which measures the performance of the smallest 2,000 companies in the Russell 3000¨ Index (see definition below.)
The Russell 2000¨ Value Index is a small-cap market index which measures the performance of those Russell 2000 companies with lower price-to-book ratios and lower forecasted growth values.
The Russell 3000¨ Index measures the performance of the 3,000 largest U.S. companies based on total market capitalization, which represents 98% of the investable U.S. equity market.
The Russell Midcap¨ Index is a mid-cap market index which measures the performance of the mid-cap segment of the U.S. equity universe.
The Russell Midcap¨ Growth Index is a mid-cap market index which measures the performance of those Russell Midcap companies with higher price-to-book ratios and higher forecasted growth values.
The S&P 500 Index is a large-cap market index which measures the performance of a representative sample of 500 leading companies in leading industries in the U.S.
MEMBERS Mutual Funds | October 31, 2010
Conservative Allocation Fund Portfolio of Investments
| | | |
| INVESTMENT COMPANIES - 99.9% | | |
| Bond Funds - 59.9% | | |
| Madison Mosaic Institutional Bond Fund (A) | 350,948 | $ 3,909,564 |
| MEMBERS Bond Fund Class Y (A) | 835,120 | 8,735,354 |
| MEMBERS High Income Fund Class Y (A) | 769,951 | 5,458,955 |
| PIMCO Investment Grade Corporate Bond Fund Institutional Class | 412,478 | 4,924,985 |
| PIMCO Total Return Fund Institutional Class | 441,520 | |
| | | 28,190,228 |
| Foreign Bond Funds - 7.9% | | |
| Templeton Global Bond Fund Advisor Class | 271,957 | 3,701,328 |
| Foreign Stock Funds - 5.0% | | |
| MEMBERS International Stock Fund Class Y (A) | 220,952 | 2,339,881 |
| Money Market Funds - 1.7% | | |
| State Street Institutional U.S. Government Money Market Fund | 818,672 | 818,672 |
| | | |
| Stock Funds - 25.4% | | |
| Calamos Growth and Income Fund Class I | 51,418 | $ 1,515,794 |
| Madison Mosaic Disciplined Equity Fund (A) | 238,497 | 2,904,899 |
| MEMBERS Equity Income Fund Class Y (A) | 123,232 | 1,268,061 |
| MEMBERS Large Cap Growth Fund Class Y (A) | 212,973 | 3,258,492 |
| MEMBERS Large Cap Value Fund Class Y (A) | 263,236 | |
| | | |
TOTAL INVESTMENTS - 99.9% ( Cost $44,391,311** ) | 47,003,512 |
| NET OTHER ASSETS AND LIABILITIES - 0.1% | |
| TOTAL NET ASSETS - 100.0% | |
| ** | Aggregate cost for Federal tax purposes was $45,635,223. |
| (A) | Affiliated Company (see Note 11). |
See accompanying Notes to Financial Statements.
MEMBERS Mutual Funds | October 31, 2010
Moderate Allocation Fund Portfolio of Investments
| | | |
| INVESTMENT COMPANIES - 100.0% | | |
| Bond Funds - 35.7% | | |
| Madison Mosaic Institutional Bond Fund (A) | 441,727 | $ 4,920,838 |
| MEMBERS Bond Fund Class Y (A) | 1,080,212 | 11,299,016 |
| MEMBERS High Income Fund Class Y (A) | 1,317,938 | 9,344,182 |
| PIMCO Investment Grade Corporate Bond Fund Institutional Class | 518,944 | 6,196,196 |
| PIMCO Total Return Fund Institutional Class | 604,839 | |
| | | 38,830,797 |
| Foreign Bond Funds - 5.2% | | |
| Templeton Global Bond Fund Advisor Class | 410,950 | 5,593,027 |
| Foreign Stock Funds - 10.4% | | |
| Matthews Asian Growth and Income Fund | 193,372 | 3,505,825 |
| MEMBERS International Stock Fund Class Y (A) | 737,626 | |
| | | 11,317,288 |
| Money Market Funds - 1.0% | | |
| State Street Institutional U.S. Government Money Market Fund | 1,082,453 | 1,082,453 |
| | | |
| Stock Funds - 47.7% | | |
| Calamos Growth and Income Fund | 113,022 | $ 3,331,897 |
| Madison Mosaic Disciplined Equity Fund (A) | 781,020 | 9,512,823 |
| MEMBERS Equity Income Fund Class Y (A) | 351,549 | 3,617,443 |
| MEMBERS Large Cap Growth Fund Class Y (A) | 713,333 | 10,914,002 |
| MEMBERS Large Cap Value Fund Class Y (A) | 860,982 | 9,832,420 |
| MEMBERS Mid Cap Fund Class Y (A) | 584,578 | 3,513,317 |
| MEMBERS Small Cap Fund Class Y (A) | 368,325 | 3,650,102 |
| T Rowe Price New Era Fund | 25,632 | 1,177,785 |
| Yacktman Fund/The | 378,508 | |
| | | |
TOTAL INVESTMENTS - 100.0% ( Cost $102,973,505** ) | 108,656,585 |
| NET OTHER ASSETS AND LIABILITIES - 0.0% | |
| TOTAL NET ASSETS - 100.0% | |
| ** | Aggregate cost for Federal tax purposes was $105,883,913. |
| (A) | Affiliated Company (see Note 11). |
See accompanying Notes to Financial Statements.
MEMBERS Mutual Funds | October 31, 2010
Aggressive Allocation Fund Portfolio of Investments
| | | |
| INVESTMENT COMPANIES - 100.1% | | |
| Bond Funds - 8.1% | | |
| MEMBERS Bond Fund Class Y (A) | 34,635 | $ 362,279 |
| MEMBERS High Income Fund Class Y (A) | 312,201 | 2,213,506 |
| PIMCO Investment Grade Corporate Bond Fund Institutional Class | 38,616 | |
| | | 3,036,854 |
| Foreign Bond Funds - 3.0% | | |
| Templeton Global Bond Fund Advisor Class | 81,790 | 1,113,158 |
| Foreign Stock Funds - 15.4% | | |
| Matthews Asian Growth and Income Fund | 102,073 | 1,850,589 |
| MEMBERS International Stock Fund Class Y (A) | 368,614 | |
| | | 5,754,211 |
| Money Market Funds - 1.2% | | |
| State Street Institutional U.S. Government Money Market Fund | 439,928 | 439,928 |
| | | |
| Stock Funds - 72.4% | | |
| Calamos Growth and Income Fund Class I | 50,567 | $ 1,490,709 |
| Hussman Strategic Growth Fund | 143,327 | 1,871,851 |
| Madison Mosaic Disciplined Equity Fund (A) | 417,743 | 5,088,105 |
| MEMBERS Equity Income Fund Class Y (A) | 121,164 | 1,246,773 |
| MEMBERS Large Cap Growth Fund Class Y (A) | 284,694 | 4,355,811 |
| MEMBERS Large Cap Value Fund Class Y (A) | 359,580 | 4,106,398 |
| MEMBERS Mid Cap Fund Class Y (A) | 402,522 | 2,419,158 |
| MEMBERS Small Cap Fund Class Y (A) | 188,896 | 1,871,962 |
| T Rowe Price New Era Fund | 40,506 | 1,861,239 |
| Yacktman Fund/The | 169,547 | |
| | | |
TOTAL INVESTMENTS - 100.1% ( Cost $35,118,495** ) | 37,470,630 |
| NET OTHER ASSETS AND LIABILITIES - (0.1%) | |
| TOTAL NET ASSETS - 100.0% | |
| ** | Aggregate cost for Federal tax purposes was $36,443,953. |
| (A) | Affiliated Company (see Note 11). |
See accompanying Notes to Financial Statements.
MEMBERS Mutual Funds | October 31, 2010
Cash Reserves Fund Portfolio of Investments
| | | |
| TOTAL U.S. GOVERNMENT AND AGENCY OBLIGATIONS – 96.4% | | |
| Fannie Mae (A) - 30.9% | | |
| 0.16%, 11/3/10 | $500,000 | $ 499,996 |
| 0.17%, 11/10/10 | 250,000 | 249,989 |
| 0.17%, 11/24/10 | 750,000 | 749,919 |
| 0.175%, 12/1/10 | 500,000 | 499,927 |
| 0.175%, 12/8/10 | 450,000 | 449,919 |
| 0.18%, 12/13/10 | 750,000 | 749,843 |
| 0.15%, 12/22/10 | 450,000 | 449,904 |
| 0.16%, 1/5/11 | 100,000 | 99,971 |
| 0.175%, 1/12/11 | 500,000 | |
| | | 4,249,293 |
| Federal Home Loan Bank (A) - 27.7% | | |
| 0.11%, 11/10/10 | 400,000 | 399,989 |
| 0.12%, 11/18/10 | 600,000 | 599,966 |
| 0.12%, 11/23/10 | 500,000 | 499,963 |
| 0.17%, 11/30/10 | 500,000 | 499,932 |
| 0.12%, 12/2/10 | 450,000 | 449,953 |
| 0.18%, 12/27/10 | 450,000 | 449,874 |
| 0.14%, 1/6/11 | 250,000 | 249,936 |
| 0.16%, 1/19/11 | 650,000 | |
| | | 3,799,385 |
| Freddie Mac (A) - 28.7% | | |
| 0.17%, 11/1/10 | 600,000 | 600,000 |
| 0.145%, 11/12/10 | 500,000 | 499,978 |
| 0.17%, 11/15/10 | 650,000 | 649,957 |
| 0.175%, 11/16/10 | 500,000 | 499,963 |
| 0.16%, 12/14/10 | 250,000 | 249,952 |
| 0.15%, 12/28/10 | 450,000 | 449,893 |
| 0.17%, 1/10/11 | 500,000 | 499,835 |
| 0.15%, 1/13/11 | 500,000 | |
| | | 3,949,426 |
| | | |
| U.S. Treasury Bills (A) - 9.1% | | |
| 0.127%, 11/26/10 | $650,000 | $ 649,943 |
| 0.114%, 1/20/11 | 600,000 | |
| | | |
Total Total U.S. Government and Agency Obligations ( Cost $13,247,895 ) | 13,247,895 |
| | Shares | |
| INVESTMENT COMPANY - 3.6% | | |
| State Street Institutional U.S. Government Money Market Fund | 493,560 | |
Total Investment Company ( Cost $493,560 ) | |
TOTAL INVESTMENTS - 100.0% ( Cost $13,741,455** ) | 13,741,455 |
| NET OTHER ASSETS AND LIABILITIES - 0.0% | |
| TOTAL NET ASSETS - 100.0% | |
| ** | Aggregate cost for Federal tax purposes was $13,741,455. |
| (A) | Rate noted below represents annualized yield at time of purchase. |
See accompanying Notes to Financial Statements.
MEMBERS Mutual Funds | October 31, 2010
Bond Fund Portfolio of Investments
| | | |
| ASSET BACKED SECURITIES - 1.1% | |
| ABSC Long Beach Home Equity Loan Trust, Series 2000-LB1, Class AF5 (A), 8.55%, 9/21/30 | $ 64,040 | $ 66,407 |
| Chase Issuance Trust, Series 2007-A17, Class A, 5.12%, 10/15/14 | 670,000 | 728,328 |
| New Century Home Equity Loan Trust, Series 2003-5, Class AI5 (B), 5.5%, 11/25/33 | 1,500,000 | |
Total Asset Backed Securities ( Cost $2,228,965 ) | | 2,341,376 |
| CORPORATE NOTES AND BONDS - 18.5% | |
| Consumer Discretionary - 2.3% | | |
| American Association of Retired Persons (C) (D), 7.5%, 5/1/31 | 750,000 | 912,497 |
| DIRECTV Holdings LLC / DIRECTV Financing Co. Inc., 3.125%, 2/15/16 | 1,000,000 | 1,024,144 |
| DR Horton Inc., 5.25%, 2/15/15 | 215,000 | 212,850 |
| ERAC USA Finance LLC (C) (D), 6.7%, 6/1/34 | 575,000 | 610,950 |
| McDonald’s Corp., 5%, 2/1/19 | 1,000,000 | 1,148,225 |
| Time Warner Cable Inc., 8.25%, 2/14/14 | 1,000,000 | |
| | | 5,102,522 |
| Consumer Staples - 2.4% | | |
| Campbell Soup Co., 4.5%, 2/15/19 | 1,000,000 | 1,110,803 |
| PepsiCo Inc./NC, 4.65%, 2/15/13 | 215,000 | 234,294 |
| PepsiCo Inc./NC, 7.9%, 11/1/18 | 1,000,000 | 1,340,807 |
| Walgreen Co., 5.25%, 1/15/19 | 1,000,000 | 1,157,715 |
| WM Wrigley Jr. Co. (C) (D), 3.05%, 6/28/13 | 1,240,000 | |
| | | 5,122,301 |
| Energy - 0.8% | | |
| Hess Corp., 7.875%, 10/1/29 | 240,000 | 304,817 |
| Transocean Inc. (E), 6%, 3/15/18 | 850,000 | 921,160 |
| Valero Energy Corp., 7.5%, 4/15/32 | 450,000 | |
| | | 1,712,305 |
| Financials - 3.3% | | |
| Bank of America Corp., 5.75%, 12/1/17 | 215,000 | 227,870 |
| Bear Stearns Cos. LLC/The, 7.25%, 2/1/18 | 420,000 | 512,481 |
| Caterpillar Financial Services Corp., 7.05%, 10/1/18 | 1,250,000 | 1,576,504 |
| Goldman Sachs Group Inc./The, 5.7%, 9/1/12 | 750,000 | 806,304 |
| HCP Inc., 6.7%, 1/30/18 | 490,000 | 543,681 |
| Lehman Brothers Holdings Inc. * (F), 5.75%, 1/3/17 | 520,000 | 52 |
| Merrill Lynch & Co. Inc., 6.15%, 4/25/13 | 530,000 | 574,455 |
| Simon Property Group L.P., 5.875%, 3/1/17 | 270,000 | 309,591 |
| SLM Corp., 5.125%, 8/27/12 | 440,000 | 450,288 |
| Swiss Re Solutions Holding Corp., 7%, 2/15/26 | 290,000 | 314,467 |
| Swiss Re Solutions Holding Corp., 7.75%, 6/15/30 | 330,000 | 383,880 |
| | | |
| UBS AG/Stamford CT (E), 5.75%, 4/25/18 | $ 250,000 | $ 283,569 |
| US Bank NA/Cincinnati OH, 6.3%, 2/4/14 | 500,000 | 573,562 |
| Wells Fargo & Co., 5.25%, 10/23/12 | 485,000 | |
| | | 7,081,378 |
| Food & Drug Retailers - 0.2% | | |
| New Albertsons Inc., 7.5%, 2/15/11 | 425,000 | 431,375 |
| Health Care - 1.3% | | |
| Eli Lilly & Co., 6.57%, 1/1/16 | 500,000 | 610,409 |
| Genentech Inc., 5.25%, 7/15/35 | 325,000 | 336,426 |
| Johnson & Johnson, 2.95%, 9/1/20 | 1,000,000 | 1,007,629 |
| Merck & Co. Inc., 5.75%, 11/15/36 | 500,000 | 563,722 |
| Wyeth, 6.5%, 2/1/34 | 230,000 | |
| | | 2,795,270 |
| Industrials - 1.9% | | |
| Boeing Co./The, 8.625%, 11/15/31 | 240,000 | 337,359 |
| Burlington Northern Santa Fe LLC, 8.125%, 4/15/20 | 285,000 | 375,166 |
| EI du Pont de Nemours & Co., 5%, 1/15/13 | 35,000 | 38,188 |
| General Electric Co., 5%, 2/1/13 | 800,000 | 868,240 |
| Honeywell International Inc., 3.875%, 2/15/14 | 1,000,000 | 1,088,366 |
| Lockheed Martin Corp., 7.65%, 5/1/16 | 270,000 | 344,282 |
| Norfolk Southern Corp., 5.59%, 5/17/25 | 359,000 | 393,927 |
| Norfolk Southern Corp., 7.05%, 5/1/37 | 390,000 | 483,521 |
| Waste Management Inc., 7.125%, 12/15/17 | 235,000 | |
| | | 4,216,993 |
| Information Technology - 1.1% | | |
| Cisco Systems Inc., 5.5%, 2/22/16 | 400,000 | 473,622 |
| Hewlett-Packard Co., 6.125%, 3/1/14 | 1,000,000 | 1,157,979 |
| Xerox Corp., 6.875%, 8/15/11 | 660,000 | |
| | | 2,321,831 |
| Materials - 0.4% | | |
| Westvaco Corp., 8.2%, 1/15/30 | 325,000 | 352,272 |
| Weyerhaeuser Co., 7.375%, 3/15/32 | 500,000 | |
| | | 859,286 |
| Telecommunication Services - 3.3% | | |
| AT&T Inc., 4.85%, 2/15/14 | 1,500,000 | 1,662,816 |
| Cellco Partnership / Verizon Wireless Capital LLC, 8.5%, 11/15/18 | 1,500,000 | 2,053,596 |
| Comcast Cable Communications Holdings Inc., 9.455%, 11/15/22 | 525,000 | 745,576 |
| New Cingular Wireless Services Inc., 7.875%, 3/1/11 | 775,000 | 794,021 |
| Rogers Communications Inc. (E), 6.25%, 6/15/13 | 455,000 | 512,713 |
| Verizon Communications Inc., 8.75%, 11/1/18 | 1,000,000 | |
| | | 7,143,520 |
See accompanying Notes to Financial Statements.
MEMBERS Mutual Funds | October 31, 2010
Bond Fund Portfolio of Investments
| | | |
CORPORATE NOTES AND BONDS (continued) | |
| Utilities - 1.5% | | |
| Iberdrola USA Inc. (E), 8.05%, 11/15/10 | $ 500,000 | $ 500,615 |
| Interstate Power & Light Co., 6.25%, 7/15/39 | 535,000 | 614,087 |
| Progress Energy Inc., 7.75%, 3/1/31 | 250,000 | 322,047 |
| Sierra Pacific Power Co., Series M, 6%, 5/15/16 | 650,000 | 761,306 |
| Virginia Electric and Power Co., Series C, 5.1%, 11/30/12 | 215,000 | 233,576 |
| Wisconsin Electric Power Co., 6.5%, 6/1/28 | 750,000 | |
| | | |
Total Corporate Notes and Bonds ( Cost $36,038,750 ) | 40,113,931 |
| MORTGAGE BACKED SECURITIES - 14.2% | |
| Fannie Mae - 12.5% | | |
| 4%, 4/1/15 Pool # 255719 | 385,708 | 399,848 |
| 5.5%, 4/1/16 Pool # 745444 | 287,392 | 309,093 |
| 6%, 5/1/16 Pool # 582558 | 22,506 | 24,448 |
| 5.5%, 2/1/18 Pool # 673194 | 273,880 | 297,481 |
| 5%, 5/1/20 Pool # 813965 | 412,099 | 445,081 |
| 4.5%, 9/1/20 Pool # 835465 | 502,815 | 536,701 |
| 6%, 5/1/21 Pool # 253847 | 39,165 | 42,649 |
| 4.5%, 4/1/23 Pool # 974401 | 1,730,137 | 1,846,086 |
| 4.5%, 6/1/23 Pool # 984075 | 1,084,966 | 1,150,625 |
| 7%, 12/1/29 Pool # 762813 | 25,863 | 29,377 |
| 7%, 11/1/31 Pool # 607515 | 35,586 | 40,800 |
| 6.5%, 3/1/32 Pool # 631377 | 221,212 | 249,747 |
| 7%, 4/1/32 Pool # 641518 | 2,188 | 2,507 |
| 7%, 5/1/32 Pool # 644591 | 22,111 | 25,351 |
| 6.5%, 6/1/32 Pool # 545691 | 493,481 | 557,137 |
| 6%, 12/1/32 Pool # 676552 | 186,052 | 206,970 |
| 5.5%, 4/1/33 Pool # 690206 | 1,150,241 | 1,247,036 |
| 5%, 10/1/33 Pool # 254903 | 579,447 | 620,577 |
| 5.5%, 11/1/33 Pool # 555880 | 779,753 | 845,371 |
| 5%, 5/1/34 Pool # 775604 | 83,414 | 89,178 |
| 5%, 5/1/34 Pool # 780890 | 255,570 | 273,232 |
| 5%, 6/1/34 Pool # 255230 | 136,295 | 145,714 |
| 5.5%, 6/1/34 Pool # 780384 | 1,080,731 | 1,169,650 |
| 7%, 7/1/34 Pool # 792636 | 17,157 | 19,548 |
| 5.5%, 8/1/34 Pool # 793647 | 191,950 | 208,703 |
| 5.5%, 3/1/35 Pool # 815976 | 967,818 | 1,045,633 |
| 5.5%, 7/1/35 Pool # 825283 | 444,219 | 479,935 |
| 5%, 8/1/35 Pool # 829670 | 560,800 | 599,204 |
| 5.5%, 8/1/35 Pool # 826872 | 187,024 | 202,061 |
| 5%, 9/1/35 Pool # 820347 | 485,093 | 526,196 |
| 5%, 9/1/35 Pool # 835699 | 453,031 | 491,417 |
| 5%, 10/1/35 Pool # 797669 | 581,962 | 628,909 |
| 5.5%, 10/1/35 Pool # 836912 | 504,383 | 544,937 |
| 5%, 11/1/35 Pool # 844504 | 532,764 | 575,742 |
| | | |
| 5%, 11/1/35 Pool # 844809 | $ 521,190 | $ 556,882 |
| 5%, 12/1/35 Pool # 850561 | 519,971 | 555,580 |
| 6%, 7/1/36 Pool # 870749 | 595,690 | 648,890 |
| 6%, 11/1/36 Pool # 902510 | 554,297 | 612,634 |
| 5.5%, 2/1/37 Pool # 905140 | 524,689 | 570,482 |
| 5.5%, 5/1/37 Pool # 899323 | 444,072 | 477,140 |
| 5.5%, 5/1/37 Pool # 928292 | 823,724 | 895,616 |
| 6%, 10/1/37 Pool # 947563 | 608,129 | 672,132 |
| 6.5%, 12/1/37 Pool # 889072 | 994,199 | 1,097,902 |
| 5%, 4/1/38 Pool # 257160 | 1,436,794 | 1,528,148 |
| 5.5%, 7/1/38 Pool # 986805 | 525,468 | 564,514 |
| 5.5%, 7/1/38 Pool # 986973 | 943,537 | 1,021,169 |
| 5%, 8/1/38 Pool # 988934 | 917,932 | 976,296 |
| 6.5%, 8/1/38 Pool # 987711 | 899,623 | |
| | | 27,047,599 |
| Freddie Mac - 1.7% | | |
| 5%, 5/1/18 Pool # E96322 | 286,838 | 308,006 |
| 8%, 6/1/30 Pool # C01005 | 3,911 | 4,512 |
| 7%, 3/1/31 Pool # C48133 | 8,090 | 9,189 |
| 6.5%, 1/1/32 Pool # C62333 | 71,009 | 80,057 |
| 5%, 7/1/33 Pool # A11325 | 1,473,985 | 1,575,618 |
| 6%, 10/1/34 Pool # A28439 | 99,104 | 109,116 |
| 6%, 10/1/34 Pool # A28598 | 72,805 | 80,160 |
| 5%, 4/1/35 Pool # A32315 | 149,395 | 161,704 |
| 5%, 4/1/35 Pool # A32316 | 138,381 | 149,782 |
| 5.5%, 11/1/37 Pool # A68787 | 1,038,816 | |
| | | 3,610,383 |
| Ginnie Mae – 0.0% | | |
| 8%, 10/20/15 Pool # 2995 | 13,692 | 14,808 |
| 6.5%, 2/20/29 Pool # 2714 | 35,804 | 40,592 |
| 6.5%, 4/20/31 Pool # 3068 | 19,580 | |
| | | |
Total Mortgage Backed Securities ( Cost $28,257,722 ) | 30,735,502 |
| U.S. GOVERNMENT AND AGENCY OBLIGATIONS - 64.4% | | |
| Fannie Mae - 0.6% | | |
| 4.625%, 10/15/14 | 1,095,000 | 1,248,317 |
| Federal Farm Credit Bank - 0.3% | | |
| 5.875%, 10/3/16 | 500,000 | 611,928 |
| Freddie Mac - 1.5% | | |
| 4.875%, 11/15/13 | 2,500,000 | 2,820,787 |
| 4.5%, 1/15/14 | 400,000 | |
| | | 3,268,515 |
| U.S. Treasury Bill - 1.8% | | |
| 0.18%, 11/18/10 | 4,000,000 | 3,999,689 |
See accompanying Notes to Financial Statements.
MEMBERS Mutual Funds | October 31, 2010
Bond Fund Portfolio of Investments
| | | |
U.S. GOVERNMENT AND AGENCY OBLIGATIONS (continued) | |
| U.S. Treasury Bonds - 4.6% | | |
| 6.625%, 2/15/27 | $2,905,000 | $ 4,085,156 |
| 4.5%, 5/15/38 | 5,500,000 | |
| | | 10,088,747 |
| U.S. Treasury Notes - 55.6% | | |
| 0.875%, 1/31/11 | 21,000,000 | 21,036,918 |
| 0.875%, 2/28/11 | 3,100,000 | 3,107,146 |
| 1%, 7/31/11 | 7,000,000 | 7,040,467 |
| 1.75%, 11/15/11 | 5,000,000 | 5,077,540 |
| 1.125%, 12/15/11 | 4,000,000 | 4,038,124 |
| 1.375%, 2/15/12 | 4,975,000 | 5,046,516 |
| 4.625%, 2/29/12 | 1,000,000 | 1,058,008 |
| 4.5%, 3/31/12 | 1,200,000 | 1,272,187 |
| 1.375%, 5/15/12 | 688,000 | 699,368 |
| 3.125%, 8/31/13 | 7,425,000 | 7,983,612 |
| 4%, 2/15/14 | 8,850,000 | 9,834,563 |
| 4.25%, 8/15/14 | 8,360,000 | 9,449,408 |
| 2.375%, 9/30/14 | 2,000,000 | 2,120,624 |
| 2.25%, 1/31/15 | 9,000,000 | 9,492,192 |
| 2.5%, 3/31/15 | 265,000 | 282,392 |
| 4.25%, 8/15/15 | 5,500,000 | 6,312,966 |
| 2.75%, 11/30/16 | 5,000,000 | 5,334,375 |
| 4.25%, 11/15/17 | 4,300,000 | 4,965,158 |
| 2.75%, 2/15/19 | 7,700,000 | 7,974,913 |
| 3.625%, 8/15/19 | 2,750,000 | 3,016,406 |
| 3.375%, 11/15/19 | 5,000,000 | |
| | | |
Total U.S. Government and Agency Obligations ( Cost $132,588,689 ) | 139,726,874 |
| | | |
| INVESTMENT COMPANY - 1.4% | | |
| State Street Institutional U.S. Government Money Market Fund | 3,073,792 | |
Total Investment Company ( Cost $3,073,792 ) | |
TOTAL INVESTMENTS - 99.6% ( Cost $202,187,918** ) | 215,991,475 |
| NET OTHER ASSETS AND LIABILITIES - 0.4% | |
| TOTAL NET ASSETS - 100.0% | |
| * | Non-income producing. |
| ** | Aggregate cost for Federal tax purposes was $202,195,216. |
| (A) | Represents a security with a specified coupon until a predetermined date, at which time the stated rate is adjusted to a new contract rate. |
| (B) | Floating rate or variable rate note. Rate shown is as of October 31, 2010. |
| (C) | Security sold within terms of a private placement memorandum exempt from registration under section 144A of the Securities Act of 1933, as amended, and may be sold only to dealers in that program or other "qualified institutional investors." |
| (D) | Illiquid security. (See Note 2.) |
| (E) | Notes and bonds, issued by foreign entities, denominated in U.S. dollars. The aggregate of these securities is 1.0% of total net assets. |
| (F) | In Default. Issuer is bankrupt. |
See accompanying Notes to Financial Statements.
MEMBERS Mutual Funds | October 31, 2010
High Income Fund Portfolio of Investments
| | | |
| CORPORATE NOTES AND BONDS - 93.4% | |
| Consumer Discretionary - 28.9% | | |
| Auto Components - 2.3% | | |
| American Axle & Manufacturing Holdings Inc. (A), 9.25%, 1/15/17 | $ 500,000 | $ 566,875 |
| Goodyear Tire & Rubber Co./The, 10.5%, 5/15/16 | 500,000 | 572,500 |
| Goodyear Tire & Rubber Co./The, 8.75%, 8/15/20 | 500,000 | 547,500 |
| Lear Corp., 8.125%, 3/15/20 | 500,000 | 556,250 |
| Tenneco Inc., 8.625%, 11/15/14 | 250,000 | 258,750 |
| Tenneco Inc., 8.125%, 11/15/15 | 350,000 | |
| | | 2,872,875 |
| Automobiles - 1.1% | | |
| Ford Motor Credit Co. LLC, 7.8%, 6/1/12 | 750,000 | 808,362 |
| Ford Motor Credit Co. LLC, 8.125%, 1/15/20 | 500,000 | |
| | | 1,419,796 |
| Consumer Finance - 0.4% | | |
| Ally Financial Inc. (A), 7.5%, 9/15/20 | 500,000 | 540,000 |
| Diversified Consumer Services - 0.4% | | |
| Education Management LLC / Education Management Finance Corp., 8.75%, 6/1/14 | 500,000 | 502,500 |
| Hotels, Restaurants & Leisure - 4.8% | | |
| Ameristar Casinos Inc., 9.25%, 6/1/14 | 500,000 | 541,250 |
| Boyd Gaming Corp., 6.75%, 4/15/14 | 300,000 | 290,250 |
| Isle of Capri Casinos Inc., 7%, 3/1/14 | 500,000 | 473,750 |
| MCE Finance Ltd. (A) (B), 10.25%, 5/15/18 | 500,000 | 564,375 |
| MGM Resorts International, 8.375%, 2/1/11 | 750,000 | 757,500 |
| MGM Resorts International, 6.75%, 9/1/12 | 1,000,000 | 986,250 |
| MGM Resorts International, 6.75%, 4/1/13 | 150,000 | 145,875 |
| Penn National Gaming Inc., 6.75%, 3/1/15 | 150,000 | 153,000 |
| Penn National Gaming Inc., 8.75%, 8/15/19 | 250,000 | 276,875 |
| Pinnacle Entertainment Inc., 8.625%, 8/1/17 | 500,000 | 538,750 |
| Pinnacle Entertainment Inc., 8.75%, 5/15/20 | 500,000 | 499,375 |
| Scientific Games International Inc. (A), 7.875%, 6/15/16 | 500,000 | 515,000 |
| Speedway Motorsports Inc., 6.75%, 6/1/13 | 250,000 | |
| | | 5,995,375 |
| Household Durables - 1.1% | | |
| Jarden Corp., 8%, 5/1/16 | 500,000 | 551,875 |
| Jarden Corp., 7.5%, 5/1/17 | 250,000 | 265,938 |
| Spectrum Brands Holdings Inc. (A), 9.5%, 6/15/18 | 500,000 | |
| | | 1,373,125 |
| Internet & Catalog Retail - 0.7% | | |
| QVC Inc. (A), 7.5%, 10/1/19 | 750,000 | 806,250 |
| Leisure Equipment & Products - 0.2% | | |
| Easton-Bell Sports Inc., 9.75%, 12/1/16 | 250,000 | 273,750 |
| | | |
| Media - 11.1% | | |
| Allbritton Communications Co., 8%, 5/15/18 | $ 500,000 | $ 516,250 |
| Belo Corp., 8%, 11/15/16 | 500,000 | 551,250 |
| Cablevision Systems Corp., 7.75%, 4/15/18 | 250,000 | 272,813 |
| Cablevision Systems Corp., 8%, 4/15/20 | 250,000 | 276,562 |
| CCO Holdings LLC / CCO Holdings Capital Corp. (A), 8.125%, 4/30/20 | 1,000,000 | 1,080,000 |
| Cenveo Corp., 8.875%, 2/1/18 | 500,000 | 502,500 |
| Gray Television Inc., 10.5%, 6/29/15 | 500,000 | 521,875 |
| Hughes Network Systems LLC/HNS Finance Corp., 9.5%, 4/15/14 | 400,000 | 417,000 |
| Intelsat Jackson Holdings S.A. (B), 11.25%, 6/15/16 | 300,000 | 326,625 |
| Intelsat Luxembourg S.A. (B), 11.25%, 2/4/17 | 1,000,000 | 1,071,250 |
| Interpublic Group of Cos. Inc./The, 10%, 7/15/17 | 100,000 | 118,500 |
| Interpublic Group of Cos. Inc./The (C), 4.25%, 3/15/23 | 250,000 | 275,625 |
| Lamar Media Corp., Series C, 6.625%, 8/15/15 | 500,000 | 511,875 |
| Liberty Media LLC (C), 3.125%, 3/30/23 | 250,000 | 280,625 |
| LIN Television Corp., 6.5%, 5/15/13 | 500,000 | 505,000 |
| Mediacom Broadband LLC / Mediacom Broadband Corp., 8.5%, 10/15/15 | 500,000 | 522,500 |
| Mediacom LLC / Mediacom Capital Corp., 9.125%, 8/15/19 | 450,000 | 475,875 |
| Nielsen Finance LLC / Nielsen Finance Co., 11.625%, 2/1/14 | 200,000 | 230,000 |
| Nielsen Finance LLC / Nielsen Finance Co., 10%, 8/1/14 | 1,000,000 | 1,051,250 |
| Nielsen Finance LLC / Nielsen Finance Co. (A), 7.75%, 10/15/18 | 1,000,000 | 1,030,000 |
| Sirius XM Radio Inc. (C), 3.25%, 10/15/11 | 250,000 | 246,875 |
| Viasat Inc., 8.875%, 9/15/16 | 500,000 | 543,750 |
| Videotron Ltee (B), 6.875%, 1/15/14 | 750,000 | 760,312 |
| Virgin Media Finance PLC (B), 9.125%, 8/15/16 | 700,000 | 748,125 |
| WMG Acquisition Corp., 7.375%, 4/15/14 | 150,000 | 139,313 |
| XM Satellite Radio Inc. (A) (C), 7%, 12/1/14 | 250,000 | 295,625 |
| XM Satellite Radio Inc. (A), 7.625%, 11/1/18 | 500,000 | |
| | | 13,785,125 |
| Multiline Retail - 0.6% | | |
| Neiman Marcus Group Inc./The, PIK, 9%, 10/15/15 | 250,000 | 261,250 |
| Sears Holding Corp. (A), 6.625%, 10/15/18 | 500,000 | |
| | | 760,000 |
| Specialty Retail - 5.4% | | |
| AutoNation Inc., 6.75%, 4/15/18 | 500,000 | 517,500 |
| KAR Auction Services Inc., 8.75%, 5/1/14 | 500,000 | 519,375 |
| Leslie’s Poolmart, 7.75%, 2/1/13 | 300,000 | 306,000 |
| Ltd. Brands Inc., 6.9%, 7/15/17 | 250,000 | 271,250 |
See accompanying Notes to Financial Statements.
MEMBERS Mutual Funds | October 31, 2010
High Income Fund Portfolio of Investments
| | | |
CORPORATE NOTES AND BONDS (continued) | |
Consumer Discretionary (continued) | | |
Specialty Retail (continued) | | |
| Ltd. Brands Inc., 8.5%, 6/15/19 | $ 300,000 | $ 354,000 |
| Michaels Stores Inc., 11.375%, 11/1/16 | 1,500,000 | 1,653,750 |
| Pantry Inc./The, 7.75%, 2/15/14 | 500,000 | 505,625 |
| Penske Automotive Group Inc., 7.75%, 12/15/16 | 980,000 | 989,800 |
| Sally Holdings LLC/Sally Capital Inc., 9.25%, 11/15/14 | 300,000 | 315,375 |
| Toys R US Inc., 7.375%, 10/15/18 | 500,000 | 485,000 |
| Toys R Us Property Co. LLC (A), 8.5%, 12/1/17 | 250,000 | 270,625 |
| Yankee Acquisition Corp./MA, Series B, 8.5%, 2/15/15 | 500,000 | |
| | | 6,707,675 |
| Textiles, Apparel & Luxury Goods - 0.8% | | |
| Iconix Brand Group Inc. (C), 1.875%, 6/30/12 | 400,000 | 388,500 |
| Phillips-Van Heusen Corp., 7.375%, 5/15/20 | 500,000 | |
| | | 930,375 |
| Consumer Staples - 5.2% | | |
| ACCO Brands Corp., 10.625%, 3/15/15 | 250,000 | 282,188 |
| ACCO Brands Corp., 7.625%, 8/15/15 | 500,000 | 495,000 |
| Central Garden and Pet Co., 8.25%, 3/1/18 | 500,000 | 525,000 |
| Constellation Brands Inc., 7.25%, 5/15/17 | 400,000 | 438,500 |
| Dole Food Co. Inc. (A), 8%, 10/1/16 | 200,000 | 212,500 |
| Ingles Markets Inc., 8.875%, 5/15/17 | 850,000 | 939,250 |
| NBTY Inc., 7.125%, 10/1/15 | 200,000 | 205,000 |
| Pinnacle Foods Finance LLC / Pinnacle Foods Finance Corp., 9.25%, 4/1/15 | 300,000 | 316,125 |
| Pinnacle Foods Finance LLC / Pinnacle Foods Finance Corp. (A), 9.25%, 4/1/15 | 200,000 | 210,750 |
| Pinnacle Foods Finance LLC / Pinnacle Foods Finance Corp. (A), 8.25%, 9/1/17 | 500,000 | 522,500 |
| Sealy Mattress Co., 8.25%, 6/15/14 | 250,000 | 253,125 |
| Stater Brothers Holdings, 8.125%, 6/15/12 | 450,000 | 450,563 |
| Stater Brothers Holdings, 7.75%, 4/15/15 | 250,000 | 259,375 |
| SUPERVALU Inc., 8%, 5/1/16 | 750,000 | 762,187 |
| Tops Markets LLC (A), 10.125%, 10/15/15 | 500,000 | |
| | | 6,412,688 |
| Energy - 10.2% | | |
| Chesapeake Energy Corp., 6.5%, 8/15/17 | 250,000 | 260,625 |
| Complete Production Services Inc., 8%, 12/15/16 | 750,000 | 789,375 |
| Continental Resources Inc./OK, 8.25%, 10/1/19 | 250,000 | 278,125 |
| Denbury Resources Inc., 7.5%, 4/1/13 | 250,000 | 253,438 |
| Denbury Resources Inc., 9.75%, 3/1/16 | 500,000 | 566,250 |
| El Paso Corp., 7%, 6/15/17 | 250,000 | 272,509 |
| El Paso Corp., 7.25%, 6/1/18 | 1,000,000 | 1,109,550 |
| | | |
| EXCO Resources Inc., 7.5%, 9/15/18 | $2,000,000 | $ 1,970,000 |
| Ferrellgas LP/Ferrellgas Finance Corp., 9.125%, 10/1/17 | 500,000 | 552,500 |
| Ferrellgas Partners L.P. / Ferrellgas Partners Finance Corp., 8.625%, 6/15/20 | 500,000 | 552,500 |
| Helix Energy Solutions Group Inc. (A), 9.5%, 1/15/16 | 250,000 | 258,750 |
| Helix Energy Solutions Group Inc. (C), 3.25%, 12/15/25 | 500,000 | 476,250 |
| Inergy LP/Inergy Finance Corp., 6.875%, 12/15/14 | 1,000,000 | 1,022,500 |
| Inergy LP/Inergy Finance Corp. (A), 7%, 10/1/18 | 250,000 | 261,250 |
| Key Energy Services Inc., 8.375%, 12/1/14 | 250,000 | 267,812 |
| Mariner Energy Inc., 7.5%, 4/15/13 | 250,000 | 257,500 |
| MarkWest Energy Partners L.P. / MarkWest Energy Finance Corp., Series B, 8.75%, 4/15/18 | 500,000 | 548,750 |
| Petroplus Finance Ltd. (A) (B), 6.75%, 5/1/14 | 500,000 | 477,500 |
| Petroplus Finance Ltd. (A) (B), 7%, 5/1/17 | 100,000 | 91,500 |
| Pioneer Natural Resources Co., 6.65%, 3/15/17 | 500,000 | 539,840 |
| Plains Exploration & Production Co., 10%, 3/1/16 | 500,000 | 570,625 |
| Range Resources Corp., 6.375%, 3/15/15 | 250,000 | 255,000 |
| Range Resources Corp., 7.25%, 5/1/18 | 500,000 | 537,500 |
| Regency Energy Partners LP/Regency Energy Finance Corp., 6.875%, 12/1/18 | 500,000 | |
| | | 12,693,399 |
| Financials - 1.8% | | |
| CIT Group Inc., Series ., 7%, 5/1/16 | 650,000 | 647,563 |
| Nuveen Investments Inc., 10.5%, 11/15/15 | 975,000 | 1,018,875 |
| Trans Union LLC/TransUnion Financing Corp. (A), 11.375%, 6/15/18 | 500,000 | |
| | | 2,241,438 |
| Health Care - 6.3% | | |
| Biomet Inc., 10%, 10/15/17 | 500,000 | 555,000 |
| Biomet Inc., 11.625%, 10/15/17 | 1,000,000 | 1,126,250 |
| Capella Healthcare Inc. (A), 9.25%, 7/1/17 | 500,000 | 545,000 |
| DaVita Inc., 6.375%, 11/1/18 | 500,000 | 511,250 |
| HCA Inc., 5.75%, 3/15/14 | 250,000 | 254,375 |
| HCA Inc., 6.375%, 1/15/15 | 250,000 | 256,875 |
| Hologic Inc. (C) (D), 2%, 12/15/37 | 500,000 | 471,250 |
| Omega Healthcare Investors Inc., REIT, 7%, 4/1/14 | 500,000 | 510,000 |
| Psychiatric Solutions Inc., Series 1, 7.75%, 7/15/15 | 750,000 | 780,000 |
| Service Corp. International/US, 6.75%, 4/1/16 | 500,000 | 526,875 |
| Service Corp. International/US, 7.625%, 10/1/18 | 250,000 | 271,875 |
| Tenet Healthcare Corp. (A), 8%, 8/1/20 | 500,000 | 508,125 |
See accompanying Notes to Financial Statements.
MEMBERS Mutual Funds | October 31, 2010
High Income Fund Portfolio of Investments
| | | |
CORPORATE NOTES AND BONDS (continued) | |
Health Care (continued) | | |
| Valeant Pharmaceuticals International (A), 7%, 10/1/20 | $ 500,000 | $ 525,000 |
| Vanguard Health Holding Co. II LLC/Vanguard Holding Co. II Inc., 8%, 2/1/18 | 1,000,000 | |
| | | 7,895,625 |
| Industrials - 14.5% | | |
| Affinion Group Inc., 10.125%, 10/15/13 | 250,000 | 257,188 |
| Affinion Group Inc., 11.5%, 10/15/15 | 750,000 | 795,000 |
| ARAMARK Corp., 8.5%, 2/1/15 | 1,000,000 | 1,050,000 |
| Avis Budget Car Rental LLC / Avis Budget Finance Inc., 7.625%, 5/15/14 | 500,000 | 513,750 |
| Avis Budget Car Rental LLC / Avis Budget Finance Inc., 9.625%, 3/15/18 | 250,000 | 268,750 |
| Avis Budget Car Rental LLC / Avis Budget Finance Inc. (A), 8.25%, 1/15/19 | 500,000 | 505,000 |
| Baldor Electric Co., 8.625%, 2/15/17 | 750,000 | 800,625 |
| Bristow Group Inc., 7.5%, 9/15/17 | 250,000 | 259,375 |
| Casella Waste Systems Inc., 9.75%, 2/1/13 | 350,000 | 352,187 |
| Covanta Holding Corp. (C), 1%, 2/1/27 | 200,000 | 194,500 |
| FTI Consulting Inc., 7.75%, 10/1/16 | 350,000 | 370,562 |
| Gulfmark Offshore Inc., 7.75%, 7/15/14 | 200,000 | 203,500 |
| Hertz Corp./The, 8.875%, 1/1/14 | 250,000 | 256,875 |
| Hertz Corp./The, 10.5%, 1/1/16 | 250,000 | 265,938 |
| Hornbeck Offshore Services Inc., Series B, 6.125%, 12/1/14 | 500,000 | 500,000 |
| Iron Mountain Inc., 7.75%, 1/15/15 | 375,000 | 377,812 |
| Mac-Gray Corp., 7.625%, 8/15/15 | 350,000 | 345,188 |
| Moog Inc., 7.25%, 6/15/18 | 500,000 | 523,750 |
| Pinafore LLC/Pinafore Inc. (A), 9%, 10/1/18 | 500,000 | 535,000 |
| RBS Global Inc./Rexnord LLC, 8.5%, 5/1/18 | 500,000 | 525,000 |
| RSC Equipment Rental Inc./RSC Holdings III LLC, 9.5%, 12/1/14 | 1,000,000 | 1,043,750 |
| ServiceMaster Co./The, PIK (A), 10.75%, 7/15/15 | 750,000 | 804,375 |
| SPX Corp., 7.625%, 12/15/14 | 750,000 | 832,500 |
| Terex Corp., 8%, 11/15/17 | 550,000 | 548,625 |
| Texas Industries Inc. (A), 9.25%, 8/15/20 | 400,000 | 421,000 |
| TransDigm Inc., 7.75%, 7/15/14 | 500,000 | 513,750 |
| Trinity Industries Inc. (C), 3.875%, 6/1/36 | 1,000,000 | 931,250 |
| United Rentals North America Inc., 7.75%, 11/15/13 | 450,000 | 455,062 |
| United Rentals North America Inc., 10.875%, 6/15/16 | 250,000 | 285,000 |
| United Rentals North America Inc., 9.25%, 12/15/19 | 700,000 | 777,000 |
| United Rentals North America Inc., 8.375%, 9/15/20 | 500,000 | 507,500 |
| USG Corp., 9.5%, 1/15/18 | 500,000 | 492,500 |
| | | |
| WCA Waste Corp. (E), 9.25%, 6/15/14 | $ 250,000 | $ 258,750 |
| West Corp./Old, 9.5%, 10/15/14 | 750,000 | 785,625 |
| West Corp./Old, 11%, 10/15/16 | 500,000 | |
| | | 18,096,687 |
| Information Technology - 5.0% | | |
| ADC Telecommunications Inc. (C) (D), 1.121%, 6/15/13 | 500,000 | 495,625 |
| Advanced Micro Devices Inc. (C), 6%, 5/1/15 | 477,000 | 474,019 |
| Advanced Micro Devices Inc., 8.125%, 12/15/17 | 250,000 | 270,000 |
| Alcatel-Lucent USA Inc., Series B (C), 2.875%, 6/15/25 | 1,000,000 | 932,500 |
| Equinix Inc., 8.125%, 3/1/18 | 500,000 | 530,000 |
| GXS Worldwide Inc., 9.75%, 6/15/15 | 300,000 | 309,750 |
| Sanmina-SCI Corp., 8.125%, 3/1/16 | 600,000 | 616,500 |
| SunGard Data Systems Inc., 9.125%, 8/15/13 | 1,100,000 | 1,126,125 |
| SunGard Data Systems Inc., 10.625%, 5/15/15 | 500,000 | 558,750 |
| SunGard Data Systems Inc., 10.25%, 8/15/15 | 400,000 | 421,500 |
| Syniverse Technologies Inc., Series B (E), 7.75%, 8/15/13 | 500,000 | |
| | | 6,244,769 |
| Materials - 10.0% | | |
| AK Steel Corp., 7.625%, 5/15/20 | 500,000 | 520,625 |
| Arch Coal Inc., 8.75%, 8/1/16 | 500,000 | 561,250 |
| Arch Coal Inc., 7.25%, 10/1/20 | 1,000,000 | 1,095,000 |
| Arch Western Finance LLC, 6.75%, 7/1/13 | 213,000 | 215,130 |
| Cascades Inc. (B), 7.875%, 1/15/20 | 250,000 | 268,437 |
| Cloud Peak Energy Resources LLC / Cloud Peak Energy Finance Corp., 8.5%, 12/15/19 | 300,000 | 330,000 |
| Consol Energy Inc. (A), 8.25%, 4/1/20 | 1,000,000 | 1,115,000 |
| Crown Americas LLC / Crown Americas Capital Corp. II, 7.625%, 5/15/17 | 1,000,000 | 1,090,000 |
| Ferro Corp., 7.875%, 8/15/18 | 500,000 | 531,875 |
| FMG Resources August 2006 Pty Ltd. (A) (B), 7%, 11/1/15 | 1,000,000 | 1,025,000 |
| Graham Packaging Co. LP/GPC Capital Corp. I, 9.875%, 10/15/14 | 500,000 | 518,750 |
| Graham Packaging Co. LP/GPC Capital Corp. I (A), 8.25%, 1/1/17 | 500,000 | 518,750 |
| Graphic Packaging International Inc., 9.5%, 6/15/17 | 500,000 | 551,250 |
| Greif Inc., 6.75%, 2/1/17 | 250,000 | 260,625 |
| Hexion US Finance Corp. / Hexion Nova Scotia Finance ULC, 8.875%, 2/1/18 | 250,000 | 268,438 |
| Huntsman International LLC, 5.5%, 6/30/16 | 500,000 | 496,875 |
| Lyondell Chemical Co. (A), 8%, 11/1/17 | 500,000 | 547,500 |
| Reynolds Group Issuer Inc. / Reynolds Group Issuer LLC (A), 7.75%, 10/15/16 | 1,000,000 | 1,060,000 |
| Reynolds Group Issuer Inc. / Reynolds Group Issuer LLC (A), 8.5%, 5/15/18 | 250,000 | 255,625 |
See accompanying Notes to Financial Statements.
MEMBERS Mutual Funds | October 31, 2010
High Income Fund Portfolio of Investments
| | | |
CORPORATE NOTES AND BONDS (continued) | |
Materials (continued) | | |
| Reynolds Group Issuer Inc. / Reynolds Group Issuer LLC (A), 9%, 4/15/19 | $ 500,000 | $ 519,375 |
| Rock-Tenn Co., 9.25%, 3/15/16 | 250,000 | 273,750 |
| Steel Dynamics Inc., 7.375%, 11/1/12 | 350,000 | |
| | | 12,397,317 |
| Telecommunication Services - 7.1% | | |
| Angel Lux Common S.A. (A) (B) (E), 8.875%, 5/1/16 | 500,000 | 530,000 |
| Frontier Communications Corp., 8.5%, 4/15/20 | 1,000,000 | 1,155,000 |
| Level 3 Communications Inc. (C), 3.5%, 6/15/12 | 950,000 | 884,687 |
| Nextel Communications Inc., Series D, 7.375%, 8/1/15 | 500,000 | 501,875 |
| PAETEC Holding Corp., 8.875%, 6/30/17 | 500,000 | 538,750 |
| Qwest Communications International Inc., 7.5%, 2/15/14 | 385,000 | 392,700 |
| Qwest Communications International Inc., Series B, 7.5%, 2/15/14 | 350,000 | 357,000 |
| Qwest Communications International Inc. (A), 7.125%, 4/1/18 | 500,000 | 531,250 |
| Sprint Nextel Corp., 8.375%, 8/15/17 | 500,000 | 551,250 |
| tw telecom holdings, Inc., 8%, 3/1/18 | 500,000 | 540,000 |
| Wind Acquisition Finance S.A. (A) (B), 11.75%, 7/15/17 | 1,000,000 | 1,140,000 |
| Windstream Corp., 8.625%, 8/1/16 | 300,000 | 318,750 |
| Windstream Corp., 7.875%, 11/1/17 | 1,000,000 | 1,092,500 |
| Windstream Corp., 7%, 3/15/19 | 250,000 | |
| | | 8,786,575 |
| Utilities - 4.4% | | |
| AES Corp./The, 8%, 10/15/17 | 1,500,000 | 1,650,000 |
| AES Corp./The, 8%, 6/1/20 | 250,000 | 280,625 |
| Calpine Corp. (A), 7.25%, 10/15/17 | 500,000 | 520,000 |
| Mirant Americas Generation LLC, 8.3%, 5/1/11 | 480,000 | 492,000 |
| Mirant Americas Generation LLC, 8.5%, 10/1/21 | 500,000 | 490,000 |
| Mirant North America LLC, 7.375%, 12/31/13 | 250,000 | 256,563 |
| NRG Energy Inc., 7.375%, 2/1/16 | 750,000 | 780,937 |
| NRG Energy Inc., 7.375%, 1/15/17 | 250,000 | 260,625 |
| NRG Energy Inc. (A), 8.25%, 9/1/20 | 500,000 | 530,000 |
| RRI Energy Inc., 7.625%, 6/15/14 | 250,000 | |
| | | |
Total Corporate Notes and Bonds ( Cost $106,108,053 ) | 116,247,969 |
| | | |
| INVESTMENT COMPANY - 6.1% | | |
| State Street Institutional U.S. Government Money Market Fund | 7,599,938 | |
Total Investment Company( Cost $7,599,938 ) | |
TOTAL INVESTMENTS - 99.5% ( Cost $113,707,991** ) | 123,847,907 |
| NET OTHER ASSETS AND LIABILITIES - 0.5% | |
| TOTAL NET ASSETS - 100.0% | |
| ** | Aggregate cost for Federal tax purposes was $113,866,821. |
| (A) | Security sold within terms of a private placement memorandum exempt from registration under section 144A of the Securities Act of 1933, as amended, and may be sold only to dealers in that program or other "qualified institutional investors." |
| (B) | Notes and bonds, issued by foreign entities, denominated in U.S. dollars. The aggregate of these securities is 5.6% of total net assets. |
| (C) | Convertible. |
| (D) | Floating rate or variable rate note. Rate shown is as of October 31, 2010. |
| (E) | Illiquid security. (See Note 2.) |
| PIK | Payment in Kind. |
| PLC | Public Limited Company. |
| REIT | Real Estate Investment Trust. |
| ULC | Unlimited Limited Company. |
See accompanying Notes to Financial Statements.
MEMBERS Mutual Funds | October 31, 2010
Diversified Income Fund Portfolio of Investments
| | | |
| COMMON STOCKS - 51.3% | | |
| Consumer Discretionary - 2.5% | | |
| McDonald’s Corp. | 9,500 | $ 738,815 |
| Omnicom Group Inc. | 18,500 | 813,260 |
| VF Corp. | 9,200 | |
| | | 2,317,883 |
| Consumer Staples - 9.6% | | |
| Altria Group Inc. | 29,500 | 749,890 |
| Avon Products Inc. | 23,500 | 715,575 |
| Coca-Cola Co./The | 19,800 | 1,214,136 |
| Diageo PLC, ADR | 6,400 | 473,600 |
| Kraft Foods Inc., Class A | 32,051 | 1,034,286 |
| PepsiCo Inc./NC | 19,000 | 1,240,700 |
| Philip Morris International Inc. | 27,000 | 1,579,500 |
| Procter & Gamble Co./The | 11,000 | 699,270 |
| Sysco Corp. | 18,500 | 545,010 |
| Walgreen Co. | 16,500 | |
| | | 8,810,987 |
| Energy - 6.9% | | |
| Chevron Corp. | 29,500 | 2,436,995 |
| ConocoPhillips | 30,000 | 1,782,000 |
| Ensco PLC, ADR | 12,500 | 579,250 |
| Marathon Oil Corp. | 27,000 | 960,390 |
| Spectra Energy Corp. | 25,000 | |
| | | 6,352,885 |
| Financials - 5.8% | | |
| Axis Capital Holdings Ltd. | 21,000 | 714,210 |
| Bank of New York Mellon Corp./The | 25,500 | 639,030 |
| NYSE Euronext | 18,000 | 551,520 |
| Travelers Cos. Inc./The | 17,000 | 938,400 |
| US Bancorp | 37,000 | 894,660 |
| Wells Fargo & Co. | 37,000 | 964,960 |
| Willis Group Holdings PLC | 20,000 | |
| | | 5,338,780 |
| Health Care - 9.2% | | |
| Baxter International Inc. | 12,500 | 636,250 |
| Johnson & Johnson | 30,200 | 1,922,834 |
| Medtronic Inc. | 23,500 | 827,435 |
| Merck & Co. Inc. | 50,000 | 1,814,000 |
| Novartis AG, ADR | 18,000 | 1,043,100 |
| Pfizer Inc. | 122,062 | |
| | | 8,367,498 |
| Industrials - 4.9% | | |
| 3M Co. | 8,500 | 715,870 |
| Honeywell International Inc. | 10,500 | 494,655 |
| Illinois Tool Works Inc. | 19,000 | 868,300 |
| Lockheed Martin Corp. | 13,700 | 976,673 |
| | | |
| United Technologies Corp. | 7,000 | $ 523,390 |
| Waste Management Inc. | 25,300 | |
| | | 4,482,604 |
| Information Technology - 6.4% | | |
| Automatic Data Processing Inc. | 13,800 | 612,996 |
| Broadridge Financial Solutions Inc. | 31,500 | 693,000 |
| Intel Corp. | 73,600 | 1,477,152 |
| International Business Machines Corp. | 4,900 | 703,640 |
| Linear Technology Corp. | 17,500 | 564,025 |
| Microsoft Corp. | 42,000 | 1,118,880 |
| Paychex Inc. | 25,500 | |
| | | 5,876,043 |
| Materials - 1.6% | | |
| Air Products & Chemicals Inc. | 9,500 | 807,215 |
| Nucor Corp. | 16,000 | |
| | | 1,418,735 |
| Telecommunication Services - 2.7% | | |
| AT&T Inc. | 67,092 | 1,912,122 |
| Vodafone Group PLC, ADR | 19,000 | |
| | | 2,434,812 |
| Utilities - 1.7% | | |
| Duke Energy Corp. | 26,000 | 473,460 |
| Exelon Corp. | 14,000 | 571,480 |
| FirstEnergy Corp. | 13,600 | |
| | | |
Total Common Stocks ( Cost $42,941,690 ) | 46,939,119 |
| | | |
| ASSET BACKED SECURITIES - 1.2% | | |
| ABSC Long Beach Home Equity Loan Trust, Series 2000-LB1, Class AF5 (A), 8.55%, 9/21/30 | $ 98,971 | $ 102,630 |
| CarMax Auto Owner Trust, Series 2007-2, Class B, 5.37%, 3/15/13 | 525,000 | 536,355 |
| Chase Issuance Trust, Series 2007-A17, Class A, 5.12%, 10/15/14 | 465,000 | |
Total Asset Backed Securities ( Cost $1,091,785 ) | 1,144,466 |
| CORPORATE NOTES AND BONDS - 19.9% | |
| Consumer Discretionary - 2.0% | | |
| American Association of Retired Persons (B) (C), 7.5%, 5/1/31 | 750,000 | 912,497 |
| DR Horton Inc., 5.25%, 2/15/15 | 130,000 | 128,700 |
| ERAC USA Finance LLC (B) (C), 6.7%, 6/1/34 | 325,000 | 345,320 |
| Royal Caribbean Cruises Ltd. (D), 7.25%, 6/15/16 | 400,000 | |
| | | 1,822,517 |
See accompanying Notes to Financial Statements.
MEMBERS Mutual Funds | October 31, 2010
Diversified Income Fund Portfolio of Investments
| | | |
CORPORATE NOTES AND BONDS (continued) | |
| Consumer Staples - 0.9% | | |
| Kraft Foods Inc., 6.5%, 11/1/31 | $ 475,000 | $ 534,354 |
| WM Wrigley Jr. Co. (B) (C), 3.05%, 6/28/13 | 280,000 | |
| | | 823,088 |
| Energy - 0.7% | | |
| Hess Corp., 7.875%, 10/1/29 | 150,000 | 190,510 |
| Transocean Inc. (D), 7.5%, 4/15/31 | 400,000 | |
| | | 623,638 |
| Financials - 5.5% | | |
| Bear Stearns Cos. LLC/The, 7.25%, 2/1/18 | 250,000 | 305,048 |
| HCP Inc., 6.7%, 1/30/18 | 335,000 | 371,700 |
| Lehman Brothers Holdings Inc.* (E), 5.75%, 1/3/17 | 410,000 | 41 |
| Merrill Lynch & Co. Inc., 6.15%, 4/25/13 | 315,000 | 341,422 |
| National Rural Utilities Cooperative Finance Corp., Series C, 7.25%, 3/1/12 | 600,000 | 651,103 |
| Nationwide Health Properties Inc., Series D, 8.25%, 7/1/12 | 600,000 | 651,442 |
| Nissan Motor Acceptance Corp. (B) (C), 5.625%, 3/14/11 | 760,000 | 773,591 |
| Simon Property Group L.P., 5.875%, 3/1/17 | 140,000 | 160,529 |
| SLM Corp., 5.125%, 8/27/12 | 355,000 | 363,300 |
| Swiss Re Solutions Holding Corp., 7%, 2/15/26 | 210,000 | 227,717 |
| Swiss Re Solutions Holding Corp., 7.75%, 6/15/30 | 205,000 | 238,471 |
| US Bank NA/Cincinnati OH, 6.3%, 2/4/14 | 500,000 | 573,562 |
| Wells Fargo & Co., 5.25%, 10/23/12 | 330,000 | |
| | | 5,014,921 |
| Food & Drug Retailers - 0.1% | | |
| New Albertsons Inc., 7.5%, 2/15/11 | 90,000 | 91,350 |
| Health Care - 2.5% | | |
| Amgen Inc., 5.85%, 6/1/17 | 1,050,000 | 1,255,320 |
| Eli Lilly & Co., 6.57%, 1/1/16 | 300,000 | 366,246 |
| Genentech Inc., 5.25%, 7/15/35 | 195,000 | 201,856 |
| Merck & Co. Inc., 5.75%, 11/15/36 | 220,000 | 248,037 |
| Wyeth, 6.5%, 2/1/34 | 150,000 | |
| | | 2,252,166 |
| Industrials - 1.3% | | |
| Boeing Co./The, 8.625%, 11/15/31 | 150,000 | 210,850 |
| Burlington Northern Santa Fe LLC, 8.125%, 4/15/20 | 175,000 | 230,365 |
| Norfolk Southern Corp., 5.59%, 5/17/25 | 239,000 | 262,252 |
| Norfolk Southern Corp., 7.05%, 5/1/37 | 260,000 | 322,348 |
| Waste Management Inc., 7.125%, 12/15/17 | 150,000 | |
| | | 1,209,609 |
| Information Technology - 0.3% | | |
| Cisco Systems Inc., 5.5%, 2/22/16 | 240,000 | 284,173 |
| | | |
| Materials - 0.2% | | |
| Westvaco Corp., 8.2%, 1/15/30 | $ 175,000 | $ 189,685 |
| Telecommunication Services - 1.0% | | |
| Comcast Cable Communications Holdings Inc., 9.455%, 11/15/22 | 415,000 | 589,360 |
| Rogers Communications Inc. (D), 6.25%, 6/15/13 | 315,000 | |
| | | 944,315 |
| Utilities - 5.4% | | |
| Iberdrola USA Inc. (D), 8.05%, 11/15/10 | 500,000 | 500,615 |
| Interstate Power & Light Co., 6.25%, 7/15/39 | 175,000 | 200,870 |
| MidAmerican Energy Co., 5.65%, 7/15/12 | 1,000,000 | 1,074,853 |
| Nevada Power Co., Series R, 6.75%, 7/1/37 | 400,000 | 469,659 |
| Progress Energy Inc., 7.75%, 3/1/31 | 350,000 | 450,865 |
| Sierra Pacific Power Co., Series M, 6%, 5/15/16 | 126,000 | 147,576 |
| Southwestern Electric Power Co., Series E, 5.55%, 1/15/17 | 500,000 | 547,495 |
| Westar Energy Inc., 6%, 7/1/14 | 600,000 | 689,986 |
| Wisconsin Electric Power Co., 6.5%, 6/1/28 | 750,000 | |
| | | |
Total Corporate Notes and Bonds ( Cost $16,972,624 ) | 18,232,900 |
| MORTGAGE BACKED SECURITIES - 12.6% | |
| Fannie Mae - 10.8% | | |
| 4%, 4/1/15 Pool # 255719 | 138,614 | 143,695 |
| 5.5%, 4/1/16 Pool # 745444 | 183,286 | 197,126 |
| 6%, 5/1/16 Pool # 582558 | 33,759 | 36,672 |
| 5%, 12/1/17 Pool # 672243 | 365,352 | 393,222 |
| 5%, 5/1/20 Pool # 813965 | 337,172 | 364,157 |
| 4.5%, 9/1/20 Pool # 835465 | 502,815 | 536,701 |
| 6%, 5/1/21 Pool # 253847 | 54,832 | 59,708 |
| 7%, 12/1/29 Pool # 762813 | 16,458 | 18,694 |
| 7%, 11/1/31 Pool # 607515 | 35,586 | 40,800 |
| 7%, 5/1/32 Pool # 644591 | 35,378 | 40,562 |
| 5.5%, 10/1/33 Pool # 254904 | 375,146 | 406,715 |
| 5%, 5/1/34 Pool # 782214 | 16,069 | 17,179 |
| 5%, 6/1/34 Pool # 255230 | 333,523 | 356,571 |
| 7%, 7/1/34 Pool # 792636 | 10,784 | 12,288 |
| 5.5%, 8/1/34 Pool # 793647 | 117,406 | 127,653 |
| 5.5%, 3/1/35 Pool # 810075 | 222,724 | 240,632 |
| 5.5%, 3/1/35 Pool # 815976 | 594,079 | 641,844 |
| 5%, 8/1/35 Pool # 829670 | 326,046 | 348,374 |
| 5%, 9/1/35 Pool # 820347 | 289,354 | 313,871 |
| 5%, 9/1/35 Pool # 835699 | 281,988 | 305,882 |
| 5%, 10/1/35 Pool # 797669 | 529,057 | 571,735 |
| 5%, 11/1/35 Pool # 844504 | 372,935 | 403,019 |
| 5%, 11/1/35 Pool # 844809 | 331,666 | 354,380 |
| 5%, 12/1/35 Pool # 850561 | 316,504 | 338,179 |
See accompanying Notes to Financial Statements.
MEMBERS Mutual Funds | October 31, 2010
Diversified Income Fund Portfolio of Investments
| | | |
MORTGAGE BACKED SECURITIES (continued) | |
| 5.5%, 2/1/36 Pool # 851330 | $ 109,517 | $ 118,322 |
| 5.5%, 9/1/36 Pool # 831820 | 503,765 | 553,242 |
| 6%, 9/1/36 Pool # 831741 | 292,627 | 318,761 |
| 5.5%, 10/1/36 Pool # 896340 | 105,090 | 113,178 |
| 5.5%, 10/1/36 Pool # 901723 | 425,443 | 458,187 |
| 5.5%, 12/1/36 Pool # 902853 | 467,559 | 506,029 |
| 5.5%, 12/1/36 Pool # 903059 | 475,356 | 519,221 |
| 5.5%, 12/1/36 Pool # 907512 | 440,422 | 474,319 |
| 5.5%, 12/1/36 Pool # 907635 | 498,278 | |
| | | 9,874,272 |
| Freddie Mac - 1.7% | | |
| 8%, 6/1/30 Pool # C01005 | 7,236 | 8,348 |
| 6.5%, 1/1/32 Pool # C62333 | 106,513 | 120,086 |
| 5%, 7/1/33 Pool # A11325 | 1,052,847 | 1,125,441 |
| 6%, 10/1/34 Pool # A28439 | 58,245 | 64,129 |
| 6%, 10/1/34 Pool # A28598 | 42,789 | 47,112 |
| 5%, 4/1/35 Pool # A32315 | 98,601 | 106,725 |
| 5%, 4/1/35 Pool # A32316 | 78,329 | |
| | | 1,556,623 |
| Ginnie Mae - 0.1% | | |
| 8%, 10/20/15 Pool # 2995 | 8,956 | 9,686 |
| 6.5%, 2/20/29 Pool # 2714 | 50,126 | 56,829 |
| 6.5%, 4/20/31 Pool # 3068 | 32,634 | |
| | | |
Total Mortgage Backed Securities ( Cost $10,634,313 ) | 11,534,276 |
| U.S. GOVERNMENT AND AGENCY OBLIGATIONS - 11.5% | | |
| U.S. Treasury Bond - 1.3% | | |
| 6.625%, 2/15/27 | 860,000 | 1,209,375 |
| U.S. Treasury Notes - 10.2% | | |
| 0.875%, 2/28/11 | 225,000 | 225,519 |
| 4.875%, 4/30/11 | 320,000 | 327,450 |
| 4.625%, 12/31/11 | 1,100,000 | 1,155,859 |
| 1.375%, 5/15/12 | 375,000 | 381,196 |
| 3.125%, 8/31/13 | 290,000 | 311,818 |
| 4%, 2/15/14 | 1,150,000 | 1,277,937 |
| 4.25%, 8/15/14 | 1,575,000 | 1,780,241 |
| 4.25%, 11/15/14 | 2,000,000 | 2,271,876 |
| 2.5%, 3/31/15 | 190,000 | 202,470 |
| 4.25%, 8/15/15 | 60,000 | 68,869 |
| 4.25%, 11/15/17 | 1,100,000 | |
| | | |
Total U.S. Government and Agency Obligations ( Cost $9,808,640 ) | 10,482,767 |
| | | |
| INVESTMENT COMPANY - 2.3% | | |
| State Street Institutional U.S. Government Money Market Fund | 2,107,494 | |
Total Investment Company ( Cost $2,107,494 ) | |
TOTAL INVESTMENTS - 98.8% ( Cost $83,556,546** ) | 90,441,022 |
| NET OTHER ASSETS AND LIABILITIES - 1.2% | |
| TOTAL NET ASSETS - 100.0% | |
| * | Non-income producing. |
| ** | Aggregate cost for Federal tax purposes was $83,746,620. |
| (A) | Represents a security with a specified coupon until a predetermined date, at which time the stated rate is adjusted to a new contract rate. |
| (B) | Security sold within terms of a private placement memorandum exempt from registration under section 144A of the Securities Act of 1933, as amended, and may be sold only to dealers in that program or other "qualified institutional investors." |
| (C) | Illiquid security. (See Note 2.) |
| (D) | Notes and bonds, issued by foreign entities, denominated in U.S. dollars. The aggregate of these securities is 1.9% of total net assets. |
| (E) | In default. Issuer is bankrupt. |
| ADR | American Depositary Receipt. |
| PLC | Public Limited Company. |
See accompanying Notes to Financial Statements.
MEMBERS Mutual Funds | October 31, 2010
Equity Income Fund Portfolio of Investments
| | | |
| COMMON STOCKS - 81.4% | | |
| Consumer Discretionary - 11.4% | | |
| American Eagle Outfitters Inc. | 40,000 | $ 640,400 |
| Best Buy Co. Inc. | 20,000 | 859,600 |
| Coach Inc. | 25,000 | 1,250,000 |
| Kohl’s Corp.* | 15,000 | 768,000 |
| Target Corp. | 10,000 | |
| | | 4,037,400 |
| Energy - 13.1% | | |
| Noble Corp.* | 30,000 | 1,035,900 |
| Petrohawk Energy Corp.* | 40,000 | 680,400 |
| Schlumberger Ltd. | 15,000 | 1,048,350 |
| Southwestern Energy Co.* | 26,000 | 880,100 |
| Weatherford International Ltd.* | 60,000 | |
| | | 4,653,350 |
| Financials - 18.0% | | |
| Affiliated Managers Group Inc.* | 14,000 | 1,198,540 |
| Bank of New York Mellon Corp./The | 26,000 | 651,560 |
| Capital One Financial Corp. | 21,000 | 782,670 |
| IntercontinentalExchange Inc.* | 9,000 | 1,033,830 |
| Morgan Stanley | 37,000 | 920,190 |
| State Street Corp. | 21,000 | 876,960 |
| Wells Fargo & Co. | 35,000 | |
| | | 6,376,550 |
| Health Care - 16.0% | | |
| Celgene Corp.* | 15,000 | 931,050 |
| Community Health Systems Inc.* | 20,000 | 601,600 |
| Gilead Sciences Inc.* | 24,000 | 952,080 |
| Mylan Inc./PA* | 50,000 | 1,016,000 |
| Pfizer Inc. | 30,000 | 522,000 |
| St Jude Medical Inc.* | 17,000 | 651,100 |
| UnitedHealth Group Inc. | 28,000 | |
| | | 5,683,230 |
| Industrials - 2.2% | | |
| Jacobs Engineering Group Inc.* | 20,000 | 772,200 |
| | | |
| Information Technology - 20.7% | | |
| Adobe Systems Inc.* | 30,000 | $ 844,500 |
| BMC Software Inc.* | 24,000 | 1,091,040 |
| Brocade Communications Systems Inc.* | 120,000 | 758,400 |
| Cisco Systems Inc.* | 40,000 | 913,200 |
| Google Inc., Class A* | 3,000 | 1,838,970 |
| Varian Semiconductor Equipment Associates Inc.* | 25,000 | 816,750 |
| Visa Inc., Class A | 14,000 | |
| | | |
Total Common Stocks (Cost $28,853,370) | 28,879,970 |
| | | |
| U.S. GOVERNMENT AND AGENCY BONDS - 1.4% | |
| U.S. Treasury Note - 1.4% | | |
| 0.875%, 2/28/2011 | $500,000 | |
| | | |
Total U.S. Government and Agency Bonds ( Cost $501,096 ) | 501,231 |
| | | |
| INVESTMENT COMPANY - 2.6% | | |
| Powershares QQQ Nasdaq 100 | 18,000 | |
Total Investment Company ( Cost $884,065 ) | 939,420 |
| Repurchase Agreement - 17.1% | |
| With U.S. Bank National Association issued 10/29/10 at 0.01%, due 11/1/10, collateralized by $6,200,020 in Freddie Mac Pool #E99837 due 10/1/18. Proceeds at maturity are $6,078,117 (Cost $6,078,112) | |
TOTAL INVESTMENTS - 102.5% (Cost $36,316,643**) | 36,398,733 |
| NET OTHER ASSETS AND LIABILITIES - 2.3% | $831,739 |
| TOTAL CALL & PUT OPTIONS WRITTEN - (4.8%) | |
| TOTAL NET ASSETS - 100.0% | |
| * | Non-income producing. |
| ** | Aggregate Cost for Federal Tax purposes was $36,328,414. |
See accompanying Notes to Financial Statements.
MEMBERS Mutual Funds | October 31, 2010
Equity Income Fund Portfolio of Investments
| Call Options Written | Contracts (100 shares per contract) | Expiration Date | Exercise Price | Value (Note 2) |
| Affiliated Managers Group Inc. | 140 | December 2010 | 80.00 | $113,400 |
| American Eagle Outfitters Inc. | 200 | February 2011 | 15.00 | 39,500 |
| American Eagle Outfitters Inc. | 200 | May 2011 | 17.00 | 29,500 |
| Bank of New York Mellon Corp./The | 260 | January 2011 | 28.00 | 8,060 |
| Best Buy Co. Inc. | 200 | January 2011 | 38.00 | 117,000 |
| BMC Software Inc. | 240 | January 2011 | 40.00 | 153,600 |
| Capital One Financial Corp. | 210 | March 2011 | 43.00 | 28,140 |
| Celgene Corp. | 150 | January 2011 | 62.50 | 43,275 |
| Coach Inc. | 150 | January 2011 | 40.00 | 157,500 |
| Coach Inc. | 100 | February 2011 | 42.00 | 91,000 |
| Community Health Systems Inc. | 186 | December 2010 | 34.00 | 6,975 |
| Gilead Sciences Inc. | 110 | May 2011 | 39.00 | 42,350 |
| Google Inc. | 30 | January 2011 | 610.00 | 100,200 |
| IntercontinentalExchange Inc. | 90 | January 2011 | 110.00 | 90,450 |
| Kohl’s Corp. | 150 | April 2011 | 55.00 | 35,250 |
| Mylan Inc./PA | 250 | April 2011 | 21.00 | 30,375 |
| Noble Corp. | 150 | March 2011 | 40.00 | 14,025 |
| Petrohawk Energy Corp. | 200 | March 2011 | 20.00 | 15,900 |
| Powershares QQQ Nasdaq 100 | 180 | January 2011 | 50.00 | 61,830 |
| Schlumberger Ltd. | 150 | February 2011 | 65.00 | 116,250 |
| St Jude Medical Inc. | 170 | April 2011 | 40.00 | 35,275 |
| State Street Corp. | 110 | January 2011 | 40.00 | 39,050 |
| Target Corp. | 100 | January 2011 | 55.00 | 9,050 |
| UnitedHealth Group Inc. | 150 | January 2011 | 34.00 | 47,250 |
| UnitedHealth Group Inc. | 130 | March 2011 | 35.00 | 40,300 |
| Varian Semiconductor Equipment Associates Inc. | 250 | February 2011 | 30.00 | 108,750 |
| Visa Inc. | 140 | January 2011 | 80.00 | 44,100 |
| Weatherford International Ltd. | 246 | January 2011 | 17.50 | 23,124 |
| Weatherford International Ltd. | 354 | February 2011 | 17.00 | 49,029 |
| Wells Fargo & Co | 160 | January 2011 | 29.00 | |
Total Call Options Written (Premiums received $1,133,268) | | | |
| | | | | |
| Put Options Written | Contracts (100 shares per contract) | Expiration Date | Exercise Price | Value (Note 2) |
| Target Corp. | 100 | January 2011 | 47.50 | |
Total Put Options Written (Premiums received $20,925) | | | |
See accompanying Notes to Financial Statements.
MEMBERS Mutual Funds | October 31, 2010
Large Cap Value Fund Portfolio of Investments
| | | |
| COMMON STOCKS - 98.4% | | |
| Consumer Discretionary - 4.2% | | |
| Lowe’s Cos. Inc. | 74,000 | $ 1,578,420 |
| Omnicom Group Inc. | 75,000 | 3,297,000 |
| Viacom Inc. | 40,500 | |
| | | 6,438,315 |
| Consumer Staples - 13.0% | | |
| Diageo PLC, ADR | 17,000 | 1,258,000 |
| Kraft Foods Inc., Class A | 105,000 | 3,388,350 |
| PepsiCo Inc./NC | 59,500 | 3,885,350 |
| Philip Morris International Inc. | 29,000 | 1,696,500 |
| Procter & Gamble Co./The | 43,000 | 2,733,510 |
| Sysco Corp. | 55,000 | 1,620,300 |
| Wal-Mart Stores Inc. | 48,000 | 2,600,160 |
| Walgreen Co. | 77,000 | |
| | | 19,790,930 |
| Energy - 14.9% | | |
| Chevron Corp. | 59,066 | 4,879,442 |
| ConocoPhillips | 53,000 | 3,148,200 |
| Marathon Oil Corp. | 86,000 | 3,059,020 |
| Noble Corp. | 104,000 | 3,591,120 |
| Occidental Petroleum Corp. | 60,000 | 4,717,800 |
| Southwestern Energy Co. * | 100,000 | |
| | | 22,780,582 |
| Financials - 20.8% | | |
| American Express Co. | 80,000 | 3,316,800 |
| Arch Capital Group Ltd. * | 30,000 | 2,591,700 |
| Bank of New York Mellon Corp./The | 177,000 | 4,435,620 |
| JPMorgan Chase & Co. | 103,968 | 3,912,316 |
| Morgan Stanley | 125,000 | 3,108,750 |
| Travelers Cos. Inc./The | 54,000 | 2,980,800 |
| US Bancorp | 180,000 | 4,352,400 |
| Wells Fargo & Co. | 192,000 | 5,007,360 |
| Willis Group Holdings PLC | 64,000 | |
| | | 31,740,946 |
| Health Care - 15.8% | | |
| Baxter International Inc. | 38,000 | 1,934,200 |
| Johnson & Johnson | 95,000 | 6,048,650 |
| Medtronic Inc. | 60,000 | 2,112,600 |
| Merck & Co. Inc. | 107,000 | 3,881,960 |
| Pfizer Inc. | 351,040 | 6,108,096 |
| Quest Diagnostics Inc./DE | 35,000 | 1,719,900 |
| UnitedHealth Group Inc. | 61,500 | |
| | | 24,022,481 |
| | | |
| Industrials - 8.3% | | |
| General Electric Co. | 138,600 | $ 2,220,372 |
| Illinois Tool Works Inc. | 60,000 | 2,742,000 |
| Lockheed Martin Corp. | 43,000 | 3,065,470 |
| United Technologies Corp. | 23,000 | 1,719,710 |
| Waste Management Inc. | 82,000 | |
| | | 12,676,592 |
| Information Technology - 11.6% | | |
| Cisco Systems Inc. * | 140,000 | 3,196,200 |
| Intel Corp. | 235,000 | 4,716,450 |
| International Business Machines Corp. | 28,000 | 4,020,800 |
| Microsoft Corp. | 135,000 | 3,596,400 |
| Western Union Co./The | 126,000 | |
| | | 17,747,450 |
| Materials - 2.7% | | |
| Air Products & Chemicals Inc. | 26,000 | 2,209,220 |
| Nucor Corp. | 50,000 | |
| | | 4,120,220 |
| Telecommunication Services - 3.7% | | |
| AT&T Inc. | 132,532 | 3,777,162 |
| Vodafone Group PLC, ADR | 65,500 | |
| | | 5,579,067 |
| Utilities - 3.4% | | |
| Exelon Corp. | 87,500 | 3,571,750 |
| NextEra Energy Inc. | 30,000 | |
| | | |
Total Common Stocks ( Cost $143,644,625 ) | 150,119,533 |
| INVESTMENT COMPANY - 1.7% | |
| State Street Institutional U.S. Government Money Market Fund | 2,596,954 | |
Total Investment Company ( Cost $2,596,954 ) | |
TOTAL INVESTMENTS - 100.1% ( Cost $146,241,579** ) | 152,716,487 |
| NET OTHER ASSETS AND LIABILITIES - (0.1%) | |
| TOTAL NET ASSETS - 100.0% | |
| * | Non-income producing. |
| ** | Aggregate cost for Federal tax purposes was $146,528,743. |
| ADR | American Depositary Receipt. |
| PLC | Public Limited Company. |
See accompanying Notes to Financial Statements.
MEMBERS Mutual Funds | October 31, 2010
Large Cap Growth Fund Portfolio of Investments
| | | |
| COMMON STOCKS - 95.8% | | |
| Consumer Discretionary - 8.4% | | |
| Amazon.com Inc. * | 21,400 | $ 3,533,996 |
| Lamar Advertising Co., Class A * | 46,100 | 1,566,939 |
| McDonald’s Corp. | 19,590 | 1,523,514 |
| Omnicom Group Inc. | 67,378 | 2,961,937 |
| Starbucks Corp. | 55,800 | 1,589,184 |
| Vitamin Shoppe Inc. * | 26,200 | 728,622 |
| Yum! Brands Inc. | 17,861 | |
| | | 12,789,383 |
| Consumer Staples - 8.2% | | |
| Coca-Cola Co./The | 88,700 | 5,439,084 |
| Diageo PLC, ADR | 20,740 | 1,534,760 |
| PepsiCo Inc./NC | 85,760 | |
| | | 12,573,972 |
| Energy - 9.8% | | |
| Occidental Petroleum Corp. | 58,800 | 4,623,444 |
| Petrohawk Energy Corp. * | 182,405 | 3,102,709 |
| Schlumberger Ltd. | 37,500 | 2,620,875 |
| Southwestern Energy Co. * | 52,170 | 1,765,955 |
| Weatherford International Ltd. * | 167,285 | |
| | | 14,925,044 |
| Financials - 6.8% | | |
| Axis Capital Holdings Ltd. | 68,139 | 2,317,407 |
| Green Dot Corp., Class A * | 22,423 | 1,139,088 |
| IntercontinentalExchange Inc. * | 14,150 | 1,625,411 |
| T Rowe Price Group Inc. | 95,054 | |
| | | 10,335,541 |
| Health Care - 12.6% | | |
| Allergan Inc./United States | 45,530 | 3,296,827 |
| Celgene Corp. * | 116,125 | 7,207,879 |
| HMS Holdings Corp. * | 56,899 | 3,420,199 |
| Johnson & Johnson | 58,500 | 3,724,695 |
| UnitedHealth Group Inc. | 42,560 | |
| | | 19,183,888 |
| Industrials - 9.0% | | |
| 3M Co. | 17,965 | 1,513,012 |
| Boeing Co./The | 23,020 | 1,626,133 |
| Deere & Co. | 27,500 | 2,112,000 |
| Emerson Electric Co. | 68,000 | 3,733,200 |
| EnerNOC Inc. * | 15,634 | 470,114 |
| Illinois Tool Works Inc. | 61,100 | 2,792,270 |
| Waste Management Inc. | 42,055 | |
| | | 13,748,934 |
| Information Technology - 38.8% | | |
| Communications Equipment - 7.7% | | |
| Cisco Systems Inc. * | 307,325 | 7,016,230 |
| QUALCOMM Inc. | 105,310 | |
| | | 11,768,870 |
| | | |
| Computers & Peripherals - 5.4% | | |
| Apple Inc. * | 27,290 | $ 8,210,742 |
| Electronic Equipment, Instruments & Components - 1.0% | | |
| FLIR Systems Inc. * | 57,400 | 1,598,016 |
| Internet Software & Services - 9.2% | | |
| eBay Inc. * | 114,600 | 3,416,226 |
| Google Inc., Class A * | 17,212 | |
| | | 13,967,010 |
| IT Services - 7.3% | | |
| International Business Machines Corp. | 31,213 | 4,482,187 |
| VeriFone Systems Inc. * | 24,200 | 818,686 |
| Visa Inc., Class A | 74,400 | |
| | | 11,116,721 |
| Semiconductors & Semiconductor Equipment - 4.3% | | |
| Intel Corp. | 163,600 | 3,283,452 |
| Varian Semiconductor Equipment Associates Inc. * | 99,689 | |
| | | 6,540,292 |
| Software - 3.9% | | |
| BMC Software Inc. * | 38,685 | 1,758,620 |
| Microsoft Corp. | 128,110 | 3,412,850 |
| Salesforce.com Inc. * | 7,050 | |
| | | 5,989,764 |
| Materials - 2.2% | | |
| Ecolab Inc. | 69,245 | |
Total Common Stocks ( Cost $124,699,825 ) | 146,163,340 |
| INVESTMENT COMPANY - 5.5% | | |
| State Street Institutional U.S. Government Money Market Fund | 8,422,475 | |
Total Investment Company ( Cost $8,422,475 ) | |
TOTAL INVESTMENTS - 101.3% ( Cost $133,122,300** ) | 154,585,815 |
| NET OTHER ASSETS AND LIABILITIES - (1.3%) | |
| TOTAL NET ASSETS - 100.0% | |
| * | Non-income producing. |
| ** | Aggregate cost for Federal tax purposes was $134,608,075. |
| ADR | American Depositary Receipt. |
| PLC | Public Limited Company. |
See accompanying Notes to Financial Statements.
MEMBERS Mutual Funds | October 31, 2010
Mid Cap Fund Portfolio of Investments
| | | |
| COMMON STOCKS - 91.8% | | |
| Consumer Discretionary - 11.3% | | |
| Bed Bath & Beyond Inc. * | 33,752 | $ 1,481,713 |
| CarMax Inc. * | 59,034 | 1,829,463 |
| Lamar Advertising Co., Class A * | 40,715 | 1,383,903 |
| Omnicom Group Inc. | 37,875 | 1,664,985 |
| Sears Holdings Corp. * | 15,439 | 1,111,299 |
| Yum! Brands Inc. | 28,312 | |
| | | 8,874,506 |
| Consumer Staples - 5.7% | | |
| Brown-Forman Corp., Class B | 18,182 | 1,105,648 |
| McCormick & Co. Inc./MD | 42,383 | 1,874,176 |
| Walgreen Co. | 44,440 | |
| | | 4,485,451 |
| Energy - 8.3% | | |
| Contango Oil & Gas Co. * | 23,670 | 1,244,805 |
| Ensco PLC, ADR | 32,775 | 1,518,794 |
| EOG Resources Inc. | 12,735 | 1,218,994 |
| Noble Corp. | 39,995 | 1,381,028 |
| Southwestern Energy Co. * | 33,160 | |
| | | 6,486,087 |
| Financials - 21.1% | | |
| Arch Capital Group Ltd. * | 20,025 | 1,729,960 |
| Brookfield Asset Management Inc., Class A | 73,320 | 2,179,070 |
| Brookfield Properties Corp. | 92,940 | 1,616,227 |
| Brown & Brown Inc. | 66,275 | 1,477,270 |
| IntercontinentalExchange Inc. * | 12,639 | 1,451,842 |
| Leucadia National Corp. * | 59,599 | 1,515,006 |
| Markel Corp. * | 4,318 | 1,446,616 |
| RLI Corp. | 24,727 | 1,419,824 |
| SEI Investments Co. | 61,751 | 1,367,785 |
| T Rowe Price Group Inc. | 21,507 | 1,188,692 |
| WR Berkley Corp. | 44,082 | |
| | | 16,605,429 |
| Health Care - 11.9% | | |
| Covance Inc. * | 30,533 | 1,434,746 |
| CR Bard Inc. | 15,310 | 1,272,567 |
| DENTSPLY International Inc. | 51,278 | 1,609,616 |
| IDEXX Laboratories Inc. * | 23,944 | 1,435,682 |
| Laboratory Corp. of America Holdings * | 24,131 | 1,962,333 |
| Techne Corp. | 27,328 | |
| | | 9,379,766 |
| | | |
| Industrials - 14.9% | | |
| Aecom Technology Corp. * | 47,069 | $ 1,246,858 |
| Copart Inc. * | 53,541 | 1,812,898 |
| Expeditors International of Washington Inc. | 12,685 | 626,132 |
| IDEX Corp. | 45,708 | 1,649,145 |
| Jacobs Engineering Group Inc. * | 35,085 | 1,354,632 |
| Knight Transportation Inc. | 65,230 | 1,165,660 |
| Ritchie Bros Auctioneers Inc. | 55,557 | 1,176,697 |
| Wabtec Corp./DE | 26,129 | 1,223,882 |
| Waste Management Inc. | 40,126 | |
| | | 11,689,205 |
| Information Technology - 10.8% | | |
| Adobe Systems Inc. * | 32,919 | 926,670 |
| Amphenol Corp., Class A | 30,925 | 1,550,270 |
| Blackboard Inc. * | 20,835 | 869,653 |
| Broadridge Financial Solutions Inc. | 32,761 | 720,742 |
| Factset Research Systems Inc. | 14,238 | 1,249,812 |
| FLIR Systems Inc. * | 64,855 | 1,805,563 |
| Western Union Co./The | 79,495 | |
| | | 8,521,822 |
| Materials - 5.6% | | |
| Ecolab Inc. | 23,090 | 1,138,799 |
| iShares COMEX Gold Trust, ETF * | 139,535 | 1,853,025 |
| Valspar Corp. | 44,077 | |
| | | 4,406,695 |
| Telecommunication Service - 2.2% | | |
| Crown Castle International Corp. * | 40,911 | |
Total Common Stocks ( Cost $61,994,937 ) | 72,213,043 |
| INVESTMENT COMPANY - 9.2% | | |
| State Street Institutional U.S. Government Money Market Fund | 7,207,188 | |
Total Investment Company ( Cost $7,207,188 ) | |
TOTAL INVESTMENTS - 101.0% ( Cost $69,202,125** ) | 79,420,231 |
| NET OTHER ASSETS AND LIABILITIES - (1.0%) | |
| TOTAL NET ASSETS - 100.0% | |
| * | Non-income producing. |
| ** | Aggregate cost for Federal tax purposes was $69,219,026. |
| ADR | American Depositary Receipt. |
| ETF | Exchange Traded Fund. |
| PLC | Public Limited Company. |
See accompanying Notes to Financial Statements.
MEMBERS Mutual Funds | October 31, 2010
Small Cap Fund Portfolio of Investments
| | | |
| COMMON STOCKS - 97.6% | | |
| Consumer Discretionary - 16.3% | | |
| Arbitron Inc. | 21,400 | $ 541,848 |
| Bally Technologies Inc. * | 8,400 | 303,072 |
| Cato Corp./The, Class A | 30,200 | 798,790 |
| CEC Entertainment Inc. * | 11,300 | 375,160 |
| Choice Hotels International Inc. | 10,400 | 395,512 |
| Dress Barn Inc./The * | 17,100 | 392,274 |
| Helen of Troy Ltd. * | 20,200 | 518,130 |
| Hibbett Sports Inc. * | 11,400 | 307,230 |
| Matthews International Corp., Class A | 11,600 | 383,032 |
| Sonic Corp. * | 37,600 | 333,888 |
| Stage Stores Inc. | 48,500 | 646,505 |
| Tempur-Pedic International Inc. * | 6,800 | |
| | | 5,230,041 |
| Consumer Staples - 3.9% | | |
| Casey’s General Stores Inc. | 6,900 | 286,074 |
| Herbalife Ltd. | 8,800 | 561,968 |
| Lance Inc. | 17,800 | |
| | | 1,252,814 |
| Energy - 4.5% | | |
| Bristow Group Inc. * | 7,800 | 302,484 |
| Penn Virginia Corp. | 21,200 | 314,184 |
| SEACOR Holdings Inc. * | 6,300 | 596,925 |
| SM Energy Co. | 5,700 | |
| | | 1,451,169 |
| Financials - 23.9% | | |
| Alleghany Corp. * | 918 | 275,841 |
| American Campus Communities Inc., REIT | 10,000 | 316,300 |
| AMERISAFE Inc. * | 15,500 | 295,895 |
| Ares Capital Corp. | 38,500 | 644,490 |
| Assured Guaranty Ltd. | 20,000 | 381,000 |
| Delphi Financial Group Inc., Class A | 26,200 | 709,234 |
| DiamondRock Hospitality Co., REIT * | 26,184 | 277,027 |
| Education Realty Trust Inc., REIT | 38,500 | 288,750 |
| First Busey Corp. | 40,990 | 190,193 |
| First Midwest Bancorp Inc./IL | 40,300 | 431,613 |
| Hancock Holding Co. | 5,200 | 163,384 |
| International Bancshares Corp. | 22,420 | 384,054 |
| Mack-Cali Realty Corp., REIT | 6,400 | 214,912 |
| MB Financial Inc. | 19,800 | 294,822 |
| NewAlliance Bancshares Inc. | 23,300 | 300,337 |
| Northwest Bancshares Inc. | 32,500 | 368,550 |
| Platinum Underwriters Holdings Ltd. | 13,100 | 563,955 |
| Realty Income Corp., REIT | 600 | 20,568 |
| Reinsurance Group of America Inc. | 10,500 | 525,735 |
| Validus Holdings Ltd. | 9,089 | 257,764 |
| | | |
| Webster Financial Corp. | 30,600 | $ 523,872 |
| Westamerica Bancorporation | 4,400 | |
| | | 7,648,384 |
| Health Care - 8.4% | | |
| Amsurg Corp. * | 21,800 | 394,144 |
| Charles River Laboratories International Inc. * | 16,600 | 543,982 |
| Corvel Corp. * | 7,400 | 331,520 |
| Haemonetics Corp. * | 2,800 | 153,020 |
| ICON PLC, ADR * | 32,200 | 623,070 |
| ICU Medical Inc. * | 13,800 | 503,700 |
| Universal American Corp./NY | 8,400 | |
| | | 2,684,508 |
| Industrials - 21.7% | | |
| ACCO Brands Corp. * | 48,600 | 302,778 |
| Acuity Brands Inc. | 6,600 | 330,462 |
| Albany International Corp., Class A | 26,800 | 546,720 |
| Belden Inc. | 32,322 | 901,784 |
| Carlisle Cos. Inc. | 29,200 | 1,024,044 |
| ESCO Technologies Inc. | 11,200 | 383,936 |
| GATX Corp. | 15,300 | 484,398 |
| Genesee & Wyoming Inc., Class A * | 13,900 | 642,597 |
| Kirby Corp. * | 11,800 | 507,282 |
| Mueller Industries Inc. | 18,800 | 552,720 |
| Standard Parking Corp. * | 16,400 | 280,276 |
| Sterling Construction Co. Inc. * | 8,600 | 104,920 |
| Unifirst Corp./MA | 3,500 | 161,105 |
| United Stationers Inc. * | 12,600 | |
| | | 6,931,142 |
| Information Technology - 8.9% | | |
| Coherent Inc. * | 5,500 | 230,780 |
| Diebold Inc. | 15,800 | 484,270 |
| Electronics for Imaging Inc. * | 17,527 | 239,945 |
| MAXIMUS Inc. | 9,100 | 551,733 |
| MTS Systems Corp. | 10,000 | 327,700 |
| NAM TAI Electronics Inc. * | 29,400 | 141,708 |
| Websense Inc. * | 22,000 | 442,640 |
| Zebra Technologies Corp., Class A * | 12,300 | |
| | | 2,858,870 |
| Materials - 4.5% | | |
| AMCOL International Corp. | 1,000 | 27,740 |
| Aptargroup Inc. | 10,000 | 448,800 |
| Deltic Timber Corp. | 7,900 | 368,772 |
| Zep Inc. | 33,200 | |
| | | 1,447,560 |
| Utilities - 5.5% | | |
| Atmos Energy Corp. | 11,600 | 341,620 |
| New Jersey Resources Corp. | 6,350 | 257,111 |
See accompanying Notes to Financial Statements.
MEMBERS Mutual Funds | October 31, 2010
Small Cap Fund Portfolio of Investments
| | | |
COMMON STOCKS (continued) | | |
Utilities (continued) | | |
| Unisource Energy Corp. | 15,000 | $ 526,050 |
| Westar Energy Inc. | 14,800 | 374,440 |
| WGL Holdings Inc. | 7,000 | |
| | | 1,769,071 |
Total Common Stocks ( Cost $25,959,228 ) | 31,273,559 |
| | | |
| INVESTMENT COMPANY - 2.5% | | |
| State Street Institutional U.S. Government Money Market Fund | 815,463 | |
Total Investment Company ( Cost $815,463 ) | |
TOTAL INVESTMENTS - 100.1% ( Cost $26,774,691** ) | 32,089,022 |
| NET OTHER ASSETS AND LIABILITIES - (0.1%) | |
| TOTAL NET ASSETS - 100.0% | |
| * | Non-income producing. |
| ** | Aggregate cost for Federal tax purposes was $27,308,388. |
| ADR | American Depositary Receipt. |
| PLC | Public Limited Company. |
| REIT | Real Estate Investment Trust. |
See accompanying Notes to Financial Statements.
MEMBERS Mutual Funds | October 31, 2010
International Stock Fund Portfolio of Investments
| | | |
| COMMON STOCKS - 96.7% | | |
| Australia - 0.8% | | |
| QBE Insurance Group Ltd. | 48,500 | $ 816,191 |
| Belgium - 2.4% | | |
| Anheuser-Busch InBev N.V. | 39,533 | 2,477,917 |
| Brazil - 3.0% | | |
| Banco do Brasil S.A. | 88,159 | 1,716,205 |
| Cielo S.A. | 154,300 | |
| | | 3,043,858 |
| Canada - 1.7% | | |
| Potash Corp. of Saskatchewan Inc. | 6,100 | 882,195 |
| Rogers Communications Inc. | 24,700 | |
| | | 1,782,138 |
| China - 1.6% | | |
| Industrial & Commercial Bank of China | 1,196,800 | 963,462 |
| Weichai Power Co. Ltd. | 54,000 | |
| | | 1,669,180 |
| Denmark - 1.7% | | |
| Novo Nordisk A/S, B Shares | 11,525 | 1,213,135 |
| Pandora AS * | 11,092 | |
| | | 1,751,371 |
| France - 10.7% | | |
| BNP Paribas | 26,798 | 1,959,981 |
| Danone | 25,510 | 1,614,582 |
| Sanofi-Aventis S.A. | 39,449 | 2,755,139 |
| Technip S.A. | 15,915 | 1,337,668 |
| Total S.A. | 28,631 | 1,555,890 |
| Valeo S.A. * | 32,500 | |
| | | 10,970,178 |
| Germany - 4.3% | | |
| Bayerische Motoren Werke AG | 16,400 | 1,175,743 |
| SAP AG | 20,000 | 1,043,015 |
| Siemens AG | 18,774 | |
| | | 4,363,480 |
| Hong Kong - 2.1% | | |
| AIA Group Ltd. * | 83,200 | 247,950 |
| Esprit Holdings Ltd. | 155,407 | 832,045 |
| Kerry Properties Ltd. | 186,900 | |
| | | 2,116,821 |
| Ireland - 0.9% | | |
| CRH PLC | 55,840 | 956,322 |
| Israel - 0.9% | | |
| Teva Pharmaceutical Industries Ltd., ADR | 18,400 | 954,960 |
| Italy - 1.8% | | |
| Atlantia SpA | 54,220 | 1,239,109 |
| Prysmian SpA | 29,930 | |
| | | 1,819,385 |
| | | |
| Japan - 18.2% | | |
| Asics Corp. | 41,990 | $ 453,452 |
| Benesse Holdings Inc. | 18,800 | 902,970 |
| Canon Inc. | 44,300 | 2,047,918 |
| Daito Trust Construction Co. Ltd. | 31,640 | 1,910,903 |
| Don Quijote Co. Ltd. | 18,600 | 508,281 |
| eAccess Ltd. | 1,186 | 865,145 |
| Honda Motor Co. Ltd. | 47,600 | 1,737,308 |
| Hoya Corp. | 57,100 | 1,335,432 |
| Keyence Corp. | 3,550 | 880,111 |
| Kubota Corp. | 100,200 | 891,552 |
| Mitsubishi Corp. | 40,100 | 964,254 |
| Mitsubishi Estate Co. Ltd. | 67,800 | 1,187,996 |
| Nidec Corp. | 11,400 | 1,127,675 |
| Sumitomo Mitsui Financial Group Inc. | 44,300 | 1,327,844 |
| Yahoo! Japan Corp. | 4,171 | 1,459,617 |
| Yamada Denki Co. Ltd. | 17,540 | |
| | | 18,740,438 |
| Mexico - 0.7% | | |
| Grupo Televisa S.A., ADR | 34,000 | 763,300 |
| Netherlands - 1.7% | | |
| ING Groep N.V. * | 82,700 | 882,831 |
| TNT N.V. | 30,738 | |
| | | 1,699,951 |
| Norway - 0.8% | | |
| Aker Solutions ASA | 56,080 | 854,137 |
| Russia - 0.7% | | |
| Lukoil OAO, ADR | 12,800 | 714,250 |
| Singapore - 0.9% | | |
| Singapore Telecommunications Ltd. | 390,500 | 932,276 |
| South Korea - 2.1% | | |
| Hyundai Mobis | 4,714 | 1,173,001 |
| Samsung Electronics Co. Ltd., GDR (A) | 2,912 | |
| | | 2,145,027 |
| Spain - 2.7% | | |
| Amadeus IT Holding S.A. * | 44,600 | 908,457 |
| Banco Santander S.A. | 144,129 | |
| | | 2,760,184 |
| Switzerland - 7.4% | | |
| Julius Baer Group Ltd. | 12,300 | 519,224 |
| Nestle S.A. | 30,770 | 1,685,385 |
| Novartis AG | 44,985 | 2,607,992 |
| Roche Holding AG | 7,807 | 1,146,396 |
| UBS AG * | 99,600 | |
| | | 7,645,228 |
See accompanying Notes to Financial Statements.
MEMBERS Mutual Funds | October 31, 2010
International Stock Fund Portfolio of Investments
| | | |
COMMON STOCKS (continued) | | |
| Turkey - 1.0% | | |
| Turkiye Garanti Bankasi AS, ADR | 172,000 | $ 1,047,480 |
| United Kingdom - 28.6% | | |
| AMEC PLC | 33,800 | 588,172 |
| BAE Systems PLC | 174,215 | 962,242 |
| BG Group PLC | 55,051 | 1,072,205 |
| BHP Billiton PLC | 52,000 | 1,844,338 |
| British Airways PLC * | 134,700 | 584,270 |
| British American Tobacco PLC | 27,926 | 1,064,985 |
| GlaxoSmithKline PLC | 93,300 | 1,825,387 |
| HSBC Holdings PLC | 184,383 | 1,917,742 |
| Informa PLC | 225,098 | 1,572,591 |
| International Power PLC | 188,006 | 1,257,123 |
| Lloyds Banking Group PLC * | 1,476,616 | 1,631,160 |
| Prudential PLC | 230,887 | 2,332,610 |
| Royal Dutch Shell PLC | 68,700 | 2,230,251 |
| Standard Chartered PLC | 55,800 | 1,614,319 |
| Tullow Oil PLC | 52,700 | 1,000,660 |
| Unilever PLC | 70,700 | 2,038,019 |
| Vodafone Group PLC | 415,223 | 1,130,068 |
| WM Morrison Supermarkets PLC | 303,800 | 1,430,201 |
| WPP PLC | 109,863 | 1,278,044 |
| Xstrata PLC | 103,100 | |
| | | |
Total Common Stocks ( Cost $81,942,808 ) | | 99,396,582 |
| WARRANTS AND RIGHTS - 0.1% | | |
| United Kingdom - 0.1% | | |
| Standard Chartered PLC NPR Rights, Exp. 11/5/10 (Exercise Price $20.51) * | 6,875 | |
Total Warrants and Rights( Cost $0 ) | 57,890 |
| INVESTMENT COMPANY - 2.9% | | |
| United States - 2.9% | | |
| State Street Institutional U.S. Government Money Market Fund | 3,010,174 | |
Total Investment Company ( Cost $3,010,174 ) | |
TOTAL INVESTMENTS - 99.7% ( Cost $84,952,982** ) | 102,464,646 |
| NET OTHER ASSETS AND LIABILITIES - 0.3% | |
| TOTAL NET ASSETS - 100.0% | |
| * | Non-income producing. |
| ** | Aggregate cost for Federal tax purposes was $87,056,462. |
| (A) | Security sold within terms of a private placement memorandum exempt from registration under section 144A of the Securities Act of 1933, as amended, and may be sold only to dealers in that program or other "qualified institutional investors." |
| ADR | American Depositary Receipt. |
| GDR | Global Depositary Receipt. |
| PLC | Public Limited Company. |
| OTHER INFORMATION: |
| Industry Concentration |
| | |
| Consumer Discretionary | 13% |
| Consumer Staples | 10% |
| Energy | 9% |
| Financials | 24% |
| Health Care | 10% |
| Industrials | 10% |
| Information Technology | 11% |
| Materials | 6% |
| Money Market Funds | 3% |
| Telecommunication Services | 3% |
| Utilities | 1% |
| Net Other Assets & Liabilities | |
| | 100% |
See accompanying Notes to Financial Statements.
MEMBERS Mutual Funds | October 31, 2010
This page was intentionally left blank.
MEMBERS Mutual Funds | October 31, 2010
Statements of Assets and Liabilities as of October 31, 2010
| | Conservative Allocation Fund | | Aggressive Allocation Fund |
| Assets: | | | |
| Investments: | | | |
| Investments at cost | | | |
| Unaffiliated issuers | $ 15,335,797 | $ 32,421,845 | $ 11,298,169 |
Affiliated issuers3 | 29,055,514 | 70,551,660 | 23,820,326 |
| Net unrealized appreciation | | | |
| Unaffiliated issuers | 786,352 | 1,819,134 | 604,848 |
Affiliated issuers3 | | | |
| Total investments at value | 47,003,512 | 108,656,585 | 37,470,630 |
| Receivables: | | | |
| Fund shares sold | 21,892 | 36,120 | 16,035 |
| Dividends and interest | | | |
| Total assets | 47,109,238 | 108,814,850 | 37,501,783 |
| Liabilities: | | | |
| Payables: | | | |
| Fund shares repurchased | 8,000 | 99,452 | 22,984 |
| Auditor fees | 10,600 | 10,600 | 10,600 |
| Advisory agreement fees | 7,884 | 18,303 | 6,282 |
| Service agreement fees | 9,854 | 22,878 | 7,852 |
| Distribution fees - Class B | 5,256 | 15,794 | 5,747 |
| Distribution fees - Class C | 3,328 | 2,444 | 334 |
| Shareholder servicing fees | | | |
| Total liabilities | | | |
| Net Assets | | | |
| Net Assets consist of: | | | |
| Paid-in capital | $ 47,962,052 | $118,648,738 | $ 42,088,457 |
| Accumulated net investment income (loss) | (1) | 1,042,512 | 151,318 |
| Accumulated net realized loss on investments sold and foreign currency related transactions | (3,519,790) | (16,751,829) | (7,151,779) |
| Net unrealized appreciation of investments (including appreciation (depreciation) of foreign currency related transactions) | | | |
| Net Assets | | | |
| Class A Shares: | | | |
| Net Assets | $ 33,274,373 | $ 79,764,744 | $ 27,823,417 |
| Shares of beneficial interest outstanding | 3,319,218 | 8,280,371 | 3,077,824 |
Net Asset Value and redemption price per share1 | $ 10.02 | $ 9.63 | $ 9.04 |
Sales charge of offering price2 | 0.61 | 0.59 | 0.55 |
| Maximum offering price per share | | | |
| Class B Shares: | | | |
| Net Assets | $ 8,362,816 | $ 25,001,877 | $ 9,108,457 |
| Shares of beneficial interest outstanding | 833,816 | 2,611,116 | 1,016,368 |
Net Asset Value and redemption price per share1 | | | |
| Class C Shares: | | | |
| Net Assets | $ 5,417,273 | $ 3,855,880 | $ 508,257 |
| Shares of beneficial interest outstanding | 539,767 | 402,389 | 56,677 |
Net Asset Value and redemption price per share1 | | | |
| 1 | If applicable, redemption price per share may be reduced by a contingent deferred sales charge and/or redemption fee. |
| 2 | Sales charge of offering price is 5.75% for the Conservative Allocation, Moderate Allocation and Aggressive Allocation Funds. |
| 3 | See Note 11 for information on affiliated issuers. |
See accompanying Notes to Financial Statements.
MEMBERS Mutual Funds | October 31, 2010
Statements of Assets and Liabilities as of October 31, 2010
| | | | |
| Assets: |
| Investments: |
| Investments at cost |
| Unaffiliated issuers | $ 13,741,455 | $202,187,918 | $113,707,991 |
| Net unrealized appreciation |
| Unaffiliated issuers | | | |
| Total investments at value | 13,741,455 | 215,991,475 | 123,847,907 |
| Receivables: |
| Investments sold | – | – | – |
| Fund shares sold | 9,425 | 11,630 | 9,571 |
| Dividends and interest | 45 | 1,723,777 | 2,335,612 |
| Due from Adviser | | | |
| Total assets | 13,756,962 | 217,726,882 | 126,193,090 |
| Liabilities: |
| Payables: |
| Investments purchased | – | – | 1,035,812 |
| Fund shares repurchased | 1,807 | 530,609 | 61,520 |
| Auditor fees | 3,800 | 12,100 | 10,600 |
| Advisory agreement fees | 4,764 | 93,420 | 57,859 |
| Service agreement fees | 1,787 | 28,026 | 21,040 |
| Distribution fees - Class B | 1,333 | 5,362 | 2,899 |
| Shareholder servicing fees | – | 11,240 | 6,229 |
| Accrued expenses and other payables | | | |
| Total liabilities | | | |
| Net Assets | | | |
| Net Assets consist of: |
| Paid-in capital | $ 13,743,481 | $204,323,034 | $120,583,384 |
| Accumulated undistributed net investment income | – | 79,320 | 88,964 |
| Accumulated net realized loss on investments sold and foreign currency related transactions | (10) | (1,390,101) | (6,347,965) |
| Net unrealized appreciation of investments (including appreciation (depreciation) of foreign currency related transactions) | | | |
| Net Assets | | | |
| Class A Shares: |
| Net Assets | $ 11,687,518 | $ 44,238,395 | $ 24,985,684 |
| Shares of beneficial interest outstanding | 11,689,826 | 4,228,690 | 3,519,467 |
Net Asset Value and redemption price per share1 | $ 1.00 | $ 10.46 | $ 7.10 |
Sales charge of offering price2 | – | 0.49 | 0.33 |
| Maximum offering price per share | | | |
| Class B Shares: |
| Net Assets | $ 2,055,953 | $ 8,387,604 | $ 4,571,623 |
| Shares of beneficial interest outstanding | 2,058,765 | 801,511 | 635,705 |
Net Asset Value and redemption price per share1 | | | |
Class Y Shares3: |
| Net Assets | | $164,189,811 | $ 94,906,992 |
| Shares of beneficial interest outstanding | | 15,702,271 | 13,392,881 |
Net Asset Value and redemption price per share1 | | | |
| 1 | If applicable, redemption price per share may be reduced by a contingent deferred sales charge and/or redemption fee. |
| 2 | Sales charge of offering price is 4.50% for the Bond and High Income Funds. |
| 3 | The Cash Reserves Fund does not have Class Y shares. |
See accompanying Notes to Financial Statements.
MEMBERS Mutual Funds | October 31, 2010
Statements of Assets and Liabilities as of October 31, 2010
| | | | |
| Assets: | | | |
| Investments: | | | |
| Investments at cost | | | |
| Unaffiliated issuers | $ 83,556,546 | $ 36,316,643 | $146,241,579 |
| Net unrealized appreciation | | | |
| Unaffiliated issuers | | | |
| Total investments at value | 90,441,022 | 36,398,733 | 152,716,487 |
| Foreign currency (cost of $14,246)(Note 2) | – | – | – |
| Cash | – | 137,780 | – |
| Receivables: | | | |
| Investments sold | 712,518 | 646,288 | – |
| Fund shares sold | 10,444 | 50,326 | 4,998 |
| Dividends and interest | 593,245 | 4,945 | 188,242 |
| Other assets | | | |
| Total assets | 91,762,022 | 37,238,072 | 152,909,727 |
| Liabilities: | | | |
| Payables: | | | |
| Investments purchased | – | – | 125,751 |
| Fund shares repurchased | 95,263 | – | 18,616 |
| Auditor fees | 12,100 | 7,600 | 12,100 |
| Advisory agreement fees | 50,702 | – | 71,436 |
| Service agreement fees | 15,601 | – | 46,758 |
| Distribution fees - Class B | 11,775 | – | 5,659 |
| Shareholder servicing fees | 22,961 | – | 13,303 |
| Accrued expenses and other payables | 2,970 | – | – |
| Options written, at value (premiums received of $1,154,193) | | | |
| Total liabilities | | | |
| Net Assets | | | |
| Net Assets consist of: | | | |
| Paid-in capital | $ 99,372,320 | $ 34,671,227 | $173,511,985 |
| Accumulated net investment income (loss) | 4,151 | – | 1,560,083 |
| Accumulated net realized gain (loss) on investments sold, options and foreign currency related transactions | (14,710,297) | 1,322,962 | (28,930,872) |
| Net unrealized appreciation of investments (including appreciation (depreciation) of options and foreign currency related transactions) | | | |
| Net Assets | | | |
| Class A Shares: | | | |
| Net Assets | $ 73,039,946 | $ 2,886,054 | $ 53,519,698 |
| Shares of beneficial interest outstanding | 6,542,934 | 281,116 | 4,693,029 |
Net Asset Value and redemption price per share1 | $ 11.16 | $ 10.27 | $ 11.40 |
Sales charge of offering price2 | 0.68 | 0.63 | 0.70 |
| Maximum offering price per share | | | |
Class B Shares3: | | | |
| Net Assets | $ 18,510,704 | | $ 8,863,605 |
| Shares of beneficial interest outstanding | 1,650,002 | | 791,130 |
Net Asset Value and redemption price per share1 | | | |
Class Y Shares4: | | | |
| Net Assets | | $ 32,634,210 | $ 90,232,801 |
| Shares of beneficial interest outstanding | | 3,171,046 | 7,902,697 |
Net Asset Value and redemption price per share1 | | | |
| 1 | If applicable, redemption price per share may be reduced by a contingent deferred sales charge and/or redemption fee. |
| 2 | Sales charge of offering price is 5.75% for the Diversified Income, Equity Income, Large Cap Value, Large Cap Growth, Mid Cap, Small Cap and International Stock Funds. |
| 3 | The Equity Income Fund does not have Class B shares. |
| 4 | The Diversified Income Fund does not have Class Y shares. |
See accompanying Notes to Financial Statements.
MEMBERS Mutual Funds | October 31, 2010
Statements of Assets and Liabilities as of October 31, 2010
| | | |
| | | | |
| | | | |
| | | | |
| $133,122,300 | $ 69,202,125 | $ 26,774,691 | $ 84,952,982 |
| | | | |
| | | |
| 154,585,815 | 79,420,231 | 32,089,022 | 102,464,646 |
| – | – | – | 13,811 |
| – | – | – | – |
| | | | |
| 2,614,853 | – | 31,016 | 355,764 |
| 9,987 | 8,464 | 517 | 12,439 |
| 13,121 | 18,426 | 9,002 | 230,802 |
| | | |
| 157,223,776 | 79,450,644 | 32,136,880 | 103,272,689 |
| | | | |
| | | | |
| 3,707,786 | 719,495 | 49,378 | 355,050 |
| 801,499 | 21,866 | 3,488 | 159 |
| 12,100 | 9,600 | 7,600 | 11,600 |
| 96,094 | 49,221 | 26,615 | 90,628 |
| 25,625 | 26,251 | 6,654 | 25,894 |
| 6,067 | 6,263 | 168 | 3,087 |
| 12,176 | 11,096 | 589 | 6,006 |
| – | – | – | – |
| | | |
| | | |
| | | |
| | | | |
| $153,888,784 | $ 93,029,765 | $ 33,170,262 | $110,137,857 |
| 359,530 | – | 28,684 | 872,468 |
(23,149,400) | (24,641,019) | (6,470,889) | (25,770,773) |
| | | |
| | | |
| | | | |
$ 48,389,317 | $ 42,626,800 | $ 2,539,924 | $ 23,505,329 |
| 3,184,116 | 7,166,577 | 255,767 | 2,221,807 |
$ 15.20 | $ 5.95 | $ 9.93 | $ 10.58 |
| 0.93 | 0.36 | 0.61 | 0.65 |
| | | |
| | | | |
$ 9,698,529 | $ 9,879,189 | $ 262,148 | $ 4,854,259 |
| 693,104 | 1,800,232 | 26,797 | 467,168 |
| | | |
| | | | |
$ 94,474,583 | $ 26,100,863 | $ 29,240,316 | $ 74,420,677 |
| 6,174,984 | 4,339,519 | 2,950,277 | 7,026,658 |
| | | |
See accompanying Notes to Financial Statements.
MEMBERS Mutual Funds | October 31, 2010
Statements of Operations for the Year Ended October 31, 2010
| | Conservative Allocation Fund | | Aggressive Allocation Fund | | |
| Investment Income: | | | | | |
| Interest | $ 371 | $ 752 | $ 266 | $ 21,542 | $ 7,033,198 |
| Dividends | | | | | |
| Unaffiliated issuers | 600,437 | 1,021,425 | 159,257 | – | – |
Affiliated issuers1 | 863,336 | 1,627,801 | 428,584 | – | – |
| Less: Foreign taxes withheld | | | | | |
| Total investment income | 1,464,144 | 2,649,978 | 588,107 | 21,542 | 7,033,198 |
| Expenses: | | | | | |
| Advisory agreement fees | 83,945 | 197,372 | 67,793 | 61,987 | 1,059,010 |
| Service agreement fees | 82,932 | 222,214 | 62,742 | 8,246 | 290,203 |
| Audit fees | 16,000 | 16,000 | 16,000 | 9,000 | 17,500 |
| Trustees’ fees | 6,000 | 8,500 | 6,000 | 6,000 | 10,000 |
| Distribution fees - Class B | 54,168 | 168,974 | 62,671 | 17,998 | 62,994 |
| Distribution fees - Class C | 31,453 | 26,385 | 3,954 | – | – |
| Shareholder servicing fees - Class A | 76,391 | 181,595 | 62,533 | – | 110,361 |
| Shareholder servicing fees - Class B | 18,056 | 56,324 | 20,890 | – | 20,998 |
| Shareholder servicing fees - Class C | 10,485 | 8,795 | 1,318 | – | – |
| Other expenses | | | | | |
| Total expenses before reimbursement/waiver | | | | | |
Less reimbursement/waiver2 | | | | | |
| Total expenses net of reimbursement/waiver | | | | | |
| Net Investment Income (Loss) | 1,084,714 | 1,763,819 | 284,206 | – | 5,462,132 |
| Net Realized and Unrealized Gain (Loss) on Investments | | | | | |
Net realized gain (loss) on investments (including net realized gain (loss) on options and foreign currency related transactions)3 | | | | | |
| Options | – | – | – | – | – |
| Unaffiliated issuers | 820,887 | (354,666) | (834,693) | (10) | 6,564 |
Affiliated issuers1 | (582,076) | (2,736,227) | (1,359,955) | – | – |
Net change in unrealized appreciation on investments (including net unrealized appreciation (depreciation) on options and foreign currency related transactions)4 | | | | | |
| Options | – | – | – | – | – |
| Unaffiliated issuers | 359,222 | 2,330,305 | 1,513,233 | – | 7,309,366 |
| Affiliated issuers | | | | | |
| Net Realized and Unrealized Gain (Loss) on Investments and Option Transactions | | | | | |
| Net Increase (Decrease) in Net Assets from Operations | | | | | |
| 1 | See Note 11 for information on affiliated issuers. |
| 2 | Waiver includes advisory agreement fees of $61,553, service agreement fees of $2,138, and distribution fees of $17,998 for the Cash Reserves Fund. |
| 3 | Includes foreign capital gains taxes paid of $1,788 for the International Stock Fund. |
| 4 | Net of change in deferred foreign capital gains taxes of $1,967 for the International Stock Fund. |
See accompanying Notes to Financial Statements.
MEMBERS Mutual Funds | October 31, 2010
Statements of Operations for the Year Ended October 31, 2010
| | | | | | | |
| | | | | | | | |
$ 9,805,105 | $ 2,239,942 | $ 1,009 | $ 2,412 | $ 4,144 | $ 3,060 | $ 819 | $ 33 |
| | | | | | | | |
| – | 1,585,729 | 167,290 | 3,468,183 | 2,004,445 | 619,161 | 456,125 | 3,170,712 |
| – | – | – | – | – | – | – | – |
| | | | | | | |
| 9,805,105 | 3,822,418 | 168,299 | 3,470,595 | 2,008,022 | 606,837 | 456,944 | 2,924,954 |
| | | | | | | | |
| 644,305 | 591,036 | 264,715 | 858,025 | 1,132,803 | 500,200 | 296,854 | 1,108,473 |
| 209,793 | 156,607 | 27,714 | 535,116 | 275,581 | 245,024 | 55,213 | 290,706 |
| 16,000 | 17,500 | 13,000 | 17,500 | 17,500 | 15,000 | 13,000 | 17,000 |
| 8,500 | 7,750 | 6,000 | 9,000 | 9,000 | 6,750 | 6,000 | 9,000 |
| 33,935 | 134,560 | – | 68,863 | 70,916 | 58,896 | 1,607 | 35,680 |
| – | – | – | – | – | – | – | – |
| 61,613 | 182,468 | 4,308 | 138,206 | 118,982 | 84,525 | 5,542 | 56,836 |
| 11,312 | 44,853 | – | 22,954 | 23,638 | 19,632 | 535 | 11,893 |
| – | – | – | – | – | – | – | – |
| | | | | | | |
| | | | | | | |
| | | | | | | |
| | | | | | | |
| 8,819,647 | 2,687,644 | (147,438) | 1,820,931 | 359,526 | (323,190) | 78,193 | 1,395,195 |
| | | | | | | | |
| | | | | | | | |
| – | – | 1,975,026 | – | – | – | – | – |
| 3,644,532 | 3,501,819 | 865,738 | 1,022,315 | 14,714,954 | 6,085,349 | 1,767,722 | (1,295,384) |
| – | – | – | – | – | – | – | – |
| | | | | | | | |
| – | – | (556,015) | – | – | – | – | – |
| 3,941,701 | 4,941,504 | 82,090 | 10,451,675 | 7,785,473 | 5,278,024 | 4,900,087 | 10,562,451 |
| | | | | | | |
| | | | | | | |
| | | | | | | |
See accompanying Notes to Financial Statements.
MEMBERS Mutual Funds | October 31, 2010
Statements of Changes in Net Assets
| | Conservative Allocation Fund |
| | |
| Net Assets at beginning of period | | |
| Increase in net assets from operations: | | |
| Net investment income | 1,084,714 | 786,646 |
| Net realized gain (loss) | 238,811 | (2,354,472) |
| Net change in unrealized appreciation | | |
| Net increase in net assets from operations | 4,178,476 | 4,206,564 |
| Distributions to shareholders from: | | |
| Net investment income | | |
| Class A | (917,190) | (1,001,065) |
| Class B | (163,052) | (191,959) |
| Class C | | |
| Total distributions | | |
| Capital Stock transactions: | | |
| Class A Shares | | |
| Shares sold | 9,260,567 | 9,874,441 |
| Issued to shareholders in reinvestment of distributions | 892,905 | 991,489 |
| Shares redeemed | | |
| Net increase from capital stock transactions | | |
| Class B Shares | | |
| Shares sold | 2,323,982 | 2,290,041 |
| Issued to shareholders in reinvestment of distributions | 162,179 | 189,510 |
| Shares redeemed | | |
| Net increase from capital stock transactions | | |
Class C Shares1 | | |
| Shares sold | 2,449,046 | 1,633,492 |
| Issued to shareholders in reinvestment of distributions | 92,946 | 83,576 |
| Shares redeemed | | |
| Net increase (decrease) from capital stock transactions | | |
| Total net increase (decrease) from capital stock transactions | | |
| Total increase (decrease) in net assets | | |
| Net Assets at end of period | | |
| Undistributed net investment income (loss) | | |
| Capital Share transactions: | | |
| Class A Shares | | |
| Shares sold | 962,288 | 1,145,414 |
| Issued to shareholders in reinvestment of distributions | 93,172 | 116,698 |
| Shares redeemed | | |
| Net increase from capital stock transactions | | |
| Class B Shares | | |
| Shares sold | 240,657 | 263,886 |
| Issued to shareholders in reinvestment of distributions | 16,913 | 22,362 |
| Shares redeemed | | |
| Net increase from capital stock transactions | | |
Class C Shares1 | | |
| Shares sold | 253,253 | 185,898 |
| Issued to shareholders in reinvestment of distributions | 9,681 | 9,841 |
| Shares redeemed | | |
| Net increase (decrease) from capital stock transactions | | |
| 1 | Class C shares commenced investment operations on February 29, 2008. |
See accompanying Notes to Financial Statements.
MEMBERS Mutual Funds | October 31, 2010
Statements of Changes in Net Assets
| Aggressive Allocation Fund |
| | | |
| | | |
| | | | |
| 1,763,819 | 1,277,060 | 284,206 | 209,218 |
| (3,090,893) | (8,133,079) | (2,194,648) | (2,893,316) |
| | | |
| 10,658,508 | 10,143,473 | 3,870,272 | 3,699,095 |
| | | | |
| | | | |
| (1,146,272) | (983,056) | (243,892) | (76,578) |
| (197,558) | (218,911) | (26,973) | – |
| | | |
| | | |
| | | | |
| | | | |
| 17,762,820 | 17,769,059 | 6,821,765 | 6,876,110 |
| 1,139,420 | 978,110 | 243,604 | 76,555 |
| | | |
| | | |
| | | | |
| 5,577,226 | 5,580,531 | 1,720,135 | 1,963,764 |
| 196,551 | 217,667 | 26,923 | – |
| | | |
| | | |
| | | | |
| 1,112,997 | 1,233,059 | 161,351 | 283,975 |
| 26,884 | 19,723 | 1,836 | – |
| | | |
| | | |
| | | |
| | | |
| | | |
| | | |
| | | | |
| | | | |
| 1,945,064 | 2,270,585 | 797,626 | 982,720 |
| 126,884 | 129,038 | 28,626 | 11,358 |
| | | |
| | | |
| | | | |
| 612,821 | 718,101 | 201,153 | 294,040 |
| 21,863 | 28,716 | 3,171 | – |
| | | |
| | | |
| | | | |
| 121,903 | 162,462 | 19,013 | 37,993 |
| 2,990 | 2,599 | 216 | – |
| | | |
| | | |
See accompanying Notes to Financial Statements.
MEMBERS Mutual Funds | October 31, 2010
Statements of Changes in Net Assets
| | | |
| | | | |
| Net Assets at beginning of period | | | | |
| Increase (decrease) in net assets from operations: | | | | |
| Net investment income (loss) | – | 11,745 | 5,462,132 | 5,824,879 |
| Net realized gain (loss) on investments and options transactions | (10) | – | 6,564 | (867,253) |
| Net unrealized appreciation (depreciation) on investments and options transactions | | | | |
| Net increase (decrease) in net assets from operations | | | | |
| Distributions to shareholders from: | | | | |
| Net investment income | | | | |
| Class A | – | (11,307) | (1,056,048) | (1,241,362) |
Class B1 | – | (1,184) | (138,172) | (291,620) |
Class Y2 | – | – | (4,211,073) | (4,227,238) |
| Net realized gains | | | | |
| Class A | – | – | – | – |
Class Y2 | | | | |
| Total distributions | | | | |
| Capital Stock transactions: | | | | |
| Class A Shares | | | | |
| Shares sold | 7,588,372 | 15,542,671 | 5,962,274 | 11,176,349 |
| Issued to shareholders in reinvestment of distributions | – | 10,817 | 985,322 | 1,148,936 |
| Shares redeemed | | | | |
| Net increase (decrease) from capital stock transactions | | | | |
Class B Shares1 | | | | |
| Shares sold | 432,347 | 3,595,448 | 1,112,327 | 1,331,858 |
| Issued to shareholders in reinvestment of distributions | – | 406 | 134,495 | 276,664 |
| Shares redeemed | | | | |
| Net decrease from capital stock transactions | | | | |
Class Y Shares2 | | | | |
| Shares sold | | | 38,062,957 | 42,940,604 |
| Issued to shareholders in reinvestment of distributions | | | 2,652,823 | 4,227,238 |
| Shares redeemed | | | | |
| Net increase from capital stock transactions | | | | |
| Total net increase (decrease) from capital stock transactions | | | | |
| Total increase (decrease) in net assets | | | | |
| Net Assets at end of period | | | | |
| Undistributed net investment income (loss) | | | | |
| Capital Share transactions: | | | | |
| Class A Shares | | | | |
| Shares sold | 7,588,372 | 15,542,671 | 583,443 | 1,126,923 |
| Issued to shareholders in reinvestment of distributions | – | 10,817 | 96,207 | 115,519 |
| Shares redeemed | | | | |
| Net increase (decrease) from capital stock transactions | | | | |
Class B Shares1 | | | | |
| Shares sold | 432,347 | 3,595,448 | 109,005 | 134,267 |
| Issued to shareholders in reinvestment of distributions | – | 406 | 13,132 | 27,853 |
| Shares redeemed | | | | |
| Net decrease in shares outstanding | | | | |
Class Y Shares2 | | | | |
| Shares sold | | | 3,711,454 | 4,352,678 |
| Issued to shareholders in reinvestment of distributions | | | 260,970 | 425,037 |
| Shares redeemed | | | | |
| Net increase from capital stock transactions | | | | |
| 1 | The Equity Income Fund does not have Class B shares. |
| 2 | The Cash Reserves and Diversified Income Funds do not have Class Y shares. |
See accompanying Notes to Financial Statements.
MEMBERS Mutual Funds | October 31, 2010
Statements of Changes in Net Assets
| | | |
| | | | | | |
| | | | | | |
| | | | | | | |
| 8,819,647 | 6,914,561 | 2,687,644 | 3,384,519 | (147,438) | 1,820,931 | 2,462,117 |
| 3,644,532 | (2,161,856) | 3,501,819 | (14,421,210) | 2,840,764 | 1,022,315 | (19,479,396) |
| | | | | | |
| | | | | | |
| | | | | | | |
| | | | | | | |
| (1,798,552) | (1,626,719) | (2,228,197) | (2,888,214) | – | (725,998) | (1,200,577) |
| (294,235) | (334,392) | (412,215) | (777,732) | – | (50,104) | (204,938) |
| (6,712,878) | (4,952,607) | – | – | – | (1,346,219) | (1,409,386) |
| | | | | | | |
| – | – | – | – | (101,946) | – | – |
| | | | | | |
| | | | | | |
| | | | | | | |
| | | | | | | |
| 3,588,382 | 7,675,232 | 5,295,937 | 10,812,642 | 2,839,934 | 2,959,402 | 6,138,032 |
| 1,467,582 | 1,309,344 | 2,162,726 | 2,816,920 | 98,577 | 712,650 | 1,184,777 |
| | | | | | |
| | | | | | |
| | | | | | | |
| 506,875 | 416,638 | 1,823,730 | 1,333,130 | | 519,225 | 619,912 |
| 247,976 | 272,825 | 405,805 | 763,172 | | 49,582 | 202,297 |
| | | | | | |
| | | | | | |
| | | | | | | |
| 6,634,044 | 33,447,327 | | | 31,992,664 | 16,397,421 | 29,078,385 |
| 3,516,706 | 4,952,607 | | | – | 1,346,219 | 1,409,386 |
| | | | | | |
| | | | | | |
| | | | | | |
| | | | | | |
| | | | | | |
| | | | | | |
| | | | | | | |
| | | | | | | |
| 527,390 | 1,266,566 | 501,317 | 1,134,694 | 280,239 | 266,163 | 650,460 |
| 215,307 | 213,932 | 203,967 | 295,353 | 10,261 | 63,066 | 125,639 |
| | | | | | |
| | | | | | |
| | | | | | | |
| 73,405 | 67,990 | 171,222 | 139,456 | | 46,992 | 67,117 |
| 35,940 | 44,515 | 38,099 | 79,929 | | 4,439 | 21,706 |
| | | | | | |
| | | | | | |
| | | | | | | |
| 983,835 | 5,834,491 | | | 3,187,518 | 1,461,378 | 3,079,972 |
| 519,886 | 807,800 | | | - | 119,240 | 149,616 |
| | | | | | |
| | | | | | |
See accompanying Notes to Financial Statements.
MEMBERS Mutual Funds | October 31, 2010
Statements of Changes in Net Assets
| | | |
| | | | |
| Net Assets at beginning of period | | | | |
| Increase in net assets from operations: | | | | |
| Net investment income (loss) | 359,526 | 653,764 | (323,190) | (212,269) |
| Net realized gain (loss) | 14,714,954 | (18,703,861) | 6,085,349 | (12,037,896) |
| Net change in unrealized appreciation | | | | |
| Net increase in net assets from operations | | | | |
| Distributions to shareholders from: | | | | |
| Net investment income | | | | |
| Class A | (159,641) | (58,214) | – | – |
| Class B | – | – | – | – |
| Class Y | (505,862) | (278,337) | – | – |
| Net realized gains | | | | |
| Class A | – | – | – | – |
| Class B | – | – | – | – |
| Class Y | | | | |
| Total distributions | | | | |
| Capital Stock transactions: | | | | |
| Class A Shares | | | | |
Shares sold1 | 3,289,721 | 6,947,131 | 24,424,921 | 2,526,510 |
| Issued to shareholders in reinvestment of distributions | 156,733 | 57,588 | 3 | – |
| Shares redeemed | (7,287,557) | (7,200,938) | (6,439,891) | (2,663,291) |
| Redemption fees | | | | |
| Net increase (decrease) from capital stock transactions | | | | |
| Class B Shares | | | | |
Shares sold1 | 699,132 | 952,928 | 5,957,725 | 275,215 |
| Issued to shareholders in reinvestment of distributions | – | – | – | – |
| Shares redeemed | (2,014,084) | (6,239,507) | (1,425,469) | (1,591,457) |
| Redemption fees | | | | |
| Net increase (decrease) from capital stock transactions | | | | |
| Class Y Shares | | | | |
Shares sold1 | 7,734,097 | 25,528,207 | 4,676,630 | 3,874,233 |
| Issued to shareholders in reinvestment of distributions | 505,862 | 278,337 | – | – |
| Shares redeemed | | | | |
| Net increase (decrease) from capital stock transactions | | | | |
| Total net increase (decrease) from capital stock transactions | | | | |
| Total increase (decrease) in net assets | | | | |
| Net Assets at end of period | | | | |
| Undistributed net investment income (loss) | | | | |
| Capital Share transactions: | | | | |
| Class A Shares | | | | |
Shares sold1 | 234,700 | 621,666 | 4,879,859 | 643,331 |
| Issued to shareholders in reinvestment of distributions | 10,892 | 5,713 | 1 | – |
| Shares redeemed | | | | |
| Net increase (decrease) in shares outstanding | | | | |
| Class B Shares | | | | |
Shares sold1 | 53,169 | 85,350 | 1,163,397 | 74,972 |
| Issued to shareholders in reinvestment of distributions | – | – | – | – |
| Shares redeemed | | | | |
| Net increase (decrease) in shares outstanding | | | | |
| Class Y Shares | | | | |
Shares sold1 | 543,286 | 2,215,241 | 450,561 | 964,078 |
| Issued to shareholders in reinvestment of distributions | 34,984 | 27,504 | – | – |
| Shares redeemed | | | | |
| Net increase (decrease) from capital stock transactions | | | | |
| 1 | A portion of the shares sold for the Mid Cap and Small Cap Funds are merger related. See Note 12. |
See accompanying Notes to Financial Statements.
MEMBERS Mutual Funds | October 31, 2010
Statements of Changes in Net Assets
| |
| | | |
| | | |
| | | | |
| 78,193 | 129,116 | 1,395,195 | 2,427,656 |
| 1,767,722 | (1,830,712) | (1,295,384) | (22,836,035) |
| | | |
| | | |
| | | | |
| | | | |
| (1,513) | (1,934) | (571,003) | (359,378) |
| – | – | (86,425) | (68,725) |
| (80,058) | (129,838) | (2,166,283) | (1,887,954) |
| | | | |
| – | – | – | (473,176) |
| – | – | – | (148,222) |
| | | |
| | | |
| | | | |
| | | | |
| 1,041,961 | 311,355 | 2,312,185 | 3,498,228 |
| 1,513 | 1,934 | 552,568 | 813,053 |
| (288,770) | (79,716) | (3,834,327) | (3,587,179) |
| | | |
| | | |
| | | | |
| 180,449 | 65,752 | 293,183 | 375,596 |
| – | – | 85,641 | 214,432 |
| (55,843) | (45,226) | (922,843) | (2,363,220) |
| | | |
| | | |
| | | | |
| 15,963,438 | 4,777,423 | 4,166,123 | 22,273,702 |
| 80,058 | 129,838 | 2,166,283 | 4,094,248 |
| | | |
| | | |
| | | |
| | | |
| | | |
| | | |
| | | | |
| | | | |
| 128,751 | 47,485 | 232,372 | 419,009 |
| 168 | 301 | 54,280 | 100,725 |
| | | |
| | | |
| | | | |
| 20,426 | 9,980 | 29,839 | 40,034 |
| – | – | 8,505 | 26,897 |
| | | |
| | | |
| | | | |
| 2,004,828 | 741,668 | 410,912 | 2,842,866 |
| 8,925 | 20,319 | 213,007 | 507,971 |
| | | |
| | | |
See accompanying Notes to Financial Statements.
MEMBERS Mutual Funds | October 31, 2010
Financial Highlights for a Share of Beneficial Interest Outstanding
CONSERVATIVE ALLOCATION FUND |
| | | |
| | | | | |
| CLASS A | | | | | |
Net Asset Value at beginning of period | $ 9.34 | $ 8.53 | $11.13 | $10.53 | $10.00 |
| Income from Investment Operations: | | | | | |
| Net investment income | 0.27 | 0.24 | 0.28 | 0.24 | 0.05 |
| Net realized and unrealized gain (loss) on investments | | | | | |
| Total from investment operations | 0.97 | 1.22 | (2.30) | 0.73 | 0.53 |
| Less Distributions: | | | | | |
| Distributions from net investment income | (0.29) | (0.41) | (0.27) | (0.12) | – |
| Distributions from capital gains | | | | | |
| Total distributions | (0.29) | (0.41) | (0.30) | (0.13) | – |
| Net increase (decrease) in net asset value | 0.68 | 0.81 | (2.60) | 0.60 | 0.53 |
Net Asset Value at end of period | $10.02 | $ 9.34 | $ 8.53 | $11.13 | $10.53 |
Total Return (%)2 | 10.58 | 14.91 | (21.19) | 6.94 | 5.303 |
| Ratios/Supplemental Data: | | | | | |
| Net Assets at end of period (in 000’s) | $33,274 | $27,225 | $19,753 | $16,003 | $3,031 |
| Ratios of expenses to average net assets: | | | | | |
| Before reimbursement of expenses by Adviser (%) | 0.70 | 0.92 | 1.14 | 1.79 | 10.534 |
| After reimbursement of expenses by Adviser (%) | 0.70 | 0.70 | 0.70 | 0.70 | 0.704 |
| Ratio of net investment income to average net assets | | | | | |
| After reimbursement of expenses by Adviser (%) | 2.79 | 2.80 | 2.75 | 3.00 | 2.784 |
Portfolio Turnover (%)5 | 50 | 38 | 90 | 39 | 263 |
| CLASS B | | | | | |
Net Asset Value at beginning of period | $9.34 | $ 8.48 | $11.07 | $10.51 | $10.00 |
| Income from Investment Operations: | | | | | |
| Net investment income | 0.20 | 0.18 | 0.18 | 0.17 | 0.02 |
| Net realized and unrealized gain (loss) on investments | | | | | |
| Total from investment operations | 0.91 | 1.16 | (2.37) | 0.65 | 0.51 |
| Less Distributions: | | | | | |
| Distributions from net investment income | (0.22) | (0.30) | (0.19) | (0.08) | – |
| Distributions from capital gains | | | | | |
| Total distributions | (0.22) | (0.30) | (0.22) | (0.09) | – |
| Net increase (decrease) in net asset value | 0.69 | 0.86 | (2.59) | 0.56 | 0.51 |
Net Asset Value at end of period | $10.03 | $ 9.34 | $ 8.48 | $11.07 | $10.51 |
Total Return (%)2 | 9.87 | 14.09 | (21.82) | 6.16 | 5.103 |
| Ratios/Supplemental Data: | | | | | |
| Net Assets at end of period (in 000’s) | $8,363 | $6,287 | $5,506 | $4,173 | $ 622 |
| Ratios of expenses to average net assets: | | | | | |
| Before reimbursement of expenses by Adviser (%) | 1.45 | 1.68 | 1.89 | 2.53 | 10.214 |
| After reimbursement of expenses by Adviser (%) | 1.45 | 1.45 | 1.45 | 1.45 | 1.454 |
| Ratio of net investment income to average net assets | | | | | |
| After reimbursement of expenses by Adviser (%) | 2.04 | 2.16 | 2.01 | 2.01 | 2.204 |
Portfolio Turnover (%)5 | 50 | 38 | 90 | 39 | 263 |
| 1 | Commenced investment operations June 30, 2006. |
| 2 | Total return without applicable sales charge. |
| 3 | Not annualized. |
| 4 | Annualized. |
| 5 | Portfolio Turnover is calculated at the fund level and represents the entire fiscal year or period. |
See accompanying Notes to Financial Statements.
MEMBERS Mutual Funds | October 31, 2010
Financial Highlights for a Share of Beneficial Interest Outstanding
CONSERVATIVE ALLOCATION FUND (continued) |
| | | |
| | | |
| CLASS C | | | |
Net Asset Value at beginning of period | $ 9.35 | $ 8.48 | $10.47 |
| Income from Investment Operations: | | | |
| Net investment income | 0.20 | 0.16 | 0.03 |
| Net realized and unrealized gain (loss) on investments | | | |
| Total from investment operations | 0.91 | 1.17 | (1.99) |
| Less Distributions: | | | |
| Distributions from net investment income | | | |
| Total distributions | (0.22) | (0.30) | – |
| Net increase (decrease) in net asset value | 0.69 | 0.87 | (1.99) |
Net Asset Value at end of period | $10.04 | $ 9.35 | $ 8.48 |
Total Return (%)3 | 9.86 | 14.21 | (19.01)4 |
| Ratios/Supplemental Data: | | | |
| Net Assets at end of period (in 000’s) | $5,417 | $3,412 | $2,198 |
| Ratios of expenses to average net assets: | | | |
| Before reimbursement of expenses by Adviser (%) | 1.45 | 1.87 | 2.675 |
| After reimbursement of expenses by Adviser (%) | 1.45 | 1.45 | 1.455 |
| Ratio of net investment income to average net assets | | | |
| After reimbursement of expenses by Adviser (%) | 2.03 | 2.03 | 0.605 |
Portfolio Turnover (%)7 | 50 | 38 | 904 |
|
| | | |
| | | | | |
| CLASS A | | | | | |
Net Asset Value at beginning of period | $ 8.77 | $ 7.84 | $11.82 | $10.65 | $10.00 |
| Income from Investment Operations: | | | | | |
| Net investment income | 0.18 | 0.15 | 0.16 | 0.17 | 0.02 |
| Net realized and unrealized gain (loss) on investments | | | | | |
| Total from investment operations | 1.01 | 1.08 | (3.72) | 1.29 | 0.65 |
| Less Distributions: | | | | | |
| Distributions from net investment income | (0.15) | (0.15) | (0.18) | (0.12) | – |
| Distributions from capital gains | | | | | |
| Total distributions | (0.15) | (0.15) | (0.26) | (0.12) | – |
| Net increase (decrease) in net asset value | 0.86 | 0.93 | (3.98) | 1.17 | 0.65 |
Net Asset Value at end of period | $ 9.63 | $ 8.77 | $ 7.84 | $11.82 | $10.65 |
Total Return (%)3 | 11.68 | 14.12 | (32.18) | 12.26 | 6.504 |
| Ratios/Supplemental Data: | | | | | |
| Net Assets at end of period (in 000’s) | $79,765 | $64,631 | $50,326 | $56,312 | $8,762 |
| Ratios of expenses to average net assets: | | | | | |
| Before reimbursement of expenses by Adviser (%) | 0.70 | 0.78 | 0.79 | 0.89 | 4.735 |
| After reimbursement of expenses by Adviser (%) | 0.70 | 0.70 | 0.70 | 0.70 | 0.705 |
| Ratio of net investment income to average net assets | | | | | |
| After reimbursement of expenses by Adviser (%) | 1.98 | 1.93 | 1.41 | 1.45 | 1.345 |
Portfolio Turnover (%)7 | 54 | 30 | 83 | 21 | 114 |
| 1 | Commenced investment operations June 30, 2006. | 5 | Annualized. |
| 2 | Commenced investment operations February 29, 2008. | 6 | Amounts represent less than $0.005 per share. |
| 3 | Total return without applicable sales charge. | 7 | Portfolio Turnover is calculated at the fund level and represents the entire fiscal year or period. |
| 4 | Not annualized. | | |
See accompanying Notes to Financial Statements.
MEMBERS Mutual Funds | October 31, 2010
Financial Highlights for a Share of Beneficial Interest Outstanding
MODERATE ALLOCATION FUND (continued) |
| | | |
| | | | | |
| CLASS B | | | | | |
Net Asset Value at beginning of period | $ 8.72 | $ 7.80 | $11.75 | $10.63 | $10.00 |
| Income from Investment Operations: | | | | | |
| Net investment income | 0.10 | 0.10 | 0.06 | 0.09 | 0.01 |
| Net realized and unrealized gain (loss) on investments | | | | | |
| Total from investment operations | 0.94 | 1.02 | (3.78) | 1.20 | 0.63 |
| Less Distributions: | | | | | |
| Distributions from net investment income | (0.08) | (0.10) | (0.09) | (0.08) | – |
| Distributions from capital gains | | | | | |
| Total distributions | (0.08) | (0.10) | (0.17) | (0.08) | – |
| Net increase (decrease) in net asset value | 0.86 | 0.92 | (3.95) | 1.12 | 0.63 |
Net Asset Value at end of period | $ 9.58 | $ 8.72 | $ 7.80 | $11.75 | $10.63 |
Total Return (%)3 | 10.78 | 13.20 | (32.64) | 11.38 | 6.304 |
| Ratios/Supplemental Data: | | | | | |
| Net Assets at end of period (in 000’s) | $25,002 | $20,221 | $17,728 | $19,825 | $3,289 |
| Ratios of expenses to average net assets: | | | | | |
| Before reimbursement of expenses by Adviser (%) | 1.45 | 1.53 | 1.54 | 1.64 | 4.715 |
| After reimbursement of expenses by Adviser (%) | 1.45 | 1.45 | 1.45 | 1.45 | 1.455 |
| Ratio of net investment income to average net assets | | | | | |
| After reimbursement of expenses by Adviser (%) | 1.24 | 1.26 | 0.66 | 0.63 | 0.675 |
Portfolio Turnover (%)6 | 54 | 30 | 83 | 21 | 114 |
| | | |
| | | |
| CLASS C | | | |
Net Asset Value at beginning of period | $ 8.72 | $ 7.80 | $10.61 |
| Income from Investment Operations: | | | |
| Net investment income | 0.10 | 0.09 | 0.02 |
| Net realized and unrealized gain (loss) on investments | | | |
| Total from investment operations | 0.94 | 1.02 | (2.81) |
| Less Distributions: | | | |
| Distributions from net investment income | (0.08) | (0.10) | – |
| Distributions from capital gains | | | |
| Total distributions | (0.08) | (0.10) | – |
| Net increase (decrease) in net asset value | 0.86 | 0.92 | (2.81) |
Net Asset Value at end of period | $ 9.58 | $ 8.72 | $ 7.80 |
Total Return (%)3 | 10.89 | 13.20 | (26.48)4 |
| Ratios/Supplemental Data: | | | |
| Net Assets at end of period (in 000’s) | $3,856 | $3,094 | $2,149 |
| Ratios of expenses to average net assets: | | | |
| Before reimbursement of expenses by Adviser (%) | 1.45 | 1.74 | 2.385 |
| After reimbursement of expenses by Adviser (%) | 1.45 | 1.45 | 1.455 |
| Ratio of net investment income to average net assets | | | |
| After reimbursement of expenses by Adviser (%) | 1.23 | 0.98 | 0.395 |
Portfolio Turnover (%)6 | 54 | 30 | 834 |
| 1 | Commenced investment operations June 30, 2006. |
| 2 | Commenced investment operations February 29, 2008. |
| 3 | Total return without applicable sales charge. |
| 4 | Not annualized. |
| 5 | Annualized. |
| 6 | Portfolio Turnover is calculated at the fund level and represents the entire fiscal year or period. |
See accompanying Notes to Financial Statements.
MEMBERS Mutual Funds | October 31, 2010
Financial Highlights for a Share of Beneficial Interest Outstanding
AGGRESSIVE ALLOCATION FUND |
| | | |
| | | | | |
| CLASS A | | | | | |
Net Asset Value at beginning of period | $ 8.12 | $ 7.16 | $12.53 | $10.76 | $10.00 |
| Income from Investment Operations: | | | | | |
| Net investment income | 0.09 | 0.08 | 0.04 | 0.09 | (0.01) |
| Net realized and unrealized gain (loss) on investments | | | | | |
| Total from investment operations | 1.01 | 1.00 | (5.14) | 1.92 | 0.76 |
| Less Distributions: | | | | | |
| Distributions from net investment income | (0.09) | (0.04) | (0.13) | (0.15) | – |
| Distributions from capital gains | | | | | |
| Total distributions | (0.09) | (0.04) | (0.23) | (0.15) | – |
| Net increase (decrease) in net asset value | 0.92 | 0.96 | (5.37) | 1.77 | 0.76 |
Net Asset Value at end of period | $ 9.04 | $ 8.12 | $ 7.16 | $12.53 | $10.76 |
Total Return (%)2 | 12.50 | 14.00 | (41.73) | 18.00 | 7.603 |
| Ratios/Supplemental Data: | | | | | |
| Net Assets at end of period (in 000’s) | $27,823 | $21,855 | $14,975 | $18,824 | $2,675 |
| Ratios of expenses to average net assets: | | | | | |
| Before reimbursement of expenses by Adviser (%) | 0.70 | 1.11 | 1.25 | 1.62 | 10.144 |
| After reimbursement of expenses by Adviser (%) | 0.70 | 0.70 | 0.70 | 0.70 | 0.704 |
| Ratio of net investment income to average net assets | | | | | |
| After reimbursement of expenses by Adviser (%) | 1.03 | 1.06 | 0.09 | (0.33) | (0.56)4 |
Portfolio Turnover (%)6 | 62 | 17 | 91 | 24 | 103 |
| CLASS B | | | | | |
Net Asset Value at beginning of period | $ 8.05 | $ 7.12 | $12.46 | $10.74 | $10.00 |
| Income from Investment Operations: | | | | | |
| Net investment income | 0.03 | 0.03 | (0.06) | 0.005 | (0.01) |
| Net realized and unrealized gain (loss) on investments | | | | | |
| Total from investment operations | 0.94 | 0.93 | (5.20) | 1.82 | 0.74 |
| Less Distributions: | | | | | |
| Distributions from net investment income | (0.03) | – | (0.04) | (0.10) | – |
| Distributions from capital gains | | | | | |
| Total distributions | (0.03) | – | (0.14) | (0.10) | – |
| Net increase (decrease) in net asset value | 0.91 | 0.93 | (5.34) | 1.72 | 0.74 |
Net Asset Value at end of period | $ 8.96 | $ 8.05 | $ 7.12 | $12.46 | $10.74 |
Total Return (%)2 | 11.67 | 13.06 | (42.17) | 17.11 | 7.403 |
| Ratios/Supplemental Data: | | | | | |
| Net Assets at end of period (in 000’s) | $9,109 | $7,518 | $6,050 | $7,234 | $1,164 |
| Ratios of expenses to average net assets: | | | | | |
| Before reimbursement of expenses by Adviser (%) | 1.45 | 1.88 | 2.00 | 2.38 | 10.074 |
| After reimbursement of expenses by Adviser (%) | 1.45 | 1.45 | 1.45 | 1.45 | 1.454 |
| Ratio of net investment income to average net assets | | | | | |
| After reimbursement of expenses by Adviser (%) | 0.30 | 0.44 | (0.73) | (1.06) | (1.28)4 |
Portfolio Turnover (%)6 | 62 | 17 | 90 | 24 | 103 |
| 1 | Commenced investment operations June 30, 2006. |
| 2 | Total return without applicable sales charge. |
| 3 | Not annualized. |
| 4 | Annualized. |
| 5 | Amounts represent less than $0.005 per share. |
| 6 | Portfolio Turnover is calculated at the fund level and represents the entire fiscal year or period. |
See accompanying Notes to Financial Statements.
MEMBERS Mutual Funds | October 31, 2010
Financial Highlights for a Share of Beneficial Interest Outstanding
AGGRESSIVE ALLOCATION FUND (continued) |
| | | |
| | | |
| CLASS C | | | |
Net Asset Value at beginning of period | $ 8.06 | $ 7.12 | $10.70 |
| Income from Investment Operations: | | | |
| Net investment income | 0.03 | 0.01 | (0.06) |
| Net realized and unrealized gain (loss) on investments | | | |
| Total from investment operations | 0.94 | 0.94 | (3.58) |
| Less Distributions: | | | |
| Distributions from net investment income | | | |
| Total distributions | (0.03) | – | – |
| Net increase (decrease) in net asset value | 0.91 | 0.94 | (3.58) |
Net Asset Value at end of period | $ 8.97 | $ 8.06 | $ 7.12 |
Total Return (%)2 | 11.66 | 13.20 | (33.46)3 |
| Ratios/Supplemental Data: | | | |
| Net Assets at end of period (in 000’s) | $508 | $ 470 | $ 229 |
| Ratios of expenses to average net assets: | | | |
| Before reimbursement of expenses by Adviser (%) | 1.45 | 3.72 | 7.844 |
| After reimbursement of expenses by Adviser (%) | 1.45 | 1.45 | 1.454 |
| Ratio of net investment income to average net assets | | | |
| After reimbursement of expenses by Adviser (%) | 0.34 | 0.28 | (1.23)4 |
Portfolio Turnover (%)6 | 62 | 17 | 913 |
|
| | |
| | | | | | |
| CLASS A | | | | | |
Net Asset Value at beginning of period | $ 1.00 | $ 1.00 | $ 1.00 | $ 1.00 | $ 1.00 |
| Income from Investment Operations: | | | | | |
| Net investment income | | | | | |
| Total from investment operations | (0.00)5 | 0.005 | 0.02 | 0.05 | 0.04 |
| Less Distributions: | | | | | |
| Distributions from net investment income | | | | | |
| Total distributions | – | (0.00)5 | (0.02) | (0.05) | (0.04) |
| Net increase (decrease) in net asset value | (0.00)5 | (0.00)5 | – | – | – |
Net Asset Value at end of period | $ 1.00 | $ 1.00 | $ 1.00 | $ 1.00 | $ 1.00 |
Total Return (%)2 | 0.00 | 0.07 | 2.26 | 4.73 | 4.27 |
| Ratios/Supplemental Data: | | | | | |
| Net Assets at end of period (in 000’s) | $11,687 | $13,690 | $15,339 | $12,494 | $10,989 |
| Ratios of expenses to average net assets: | | | | | |
| Before reimbursement and waiver of expenses by Adviser (%) | 0.55 | 0.80 | 1.02 | 1.09 | 1.09 |
| After reimbursement and waiver of expenses by Adviser (%) | 0.147 | 0.33 | 0.55 | 0.55 | 0.55 |
| Ratio of net investment income to average net assets | | | | | |
| After reimbursement and waiver of expenses by Adviser (%) | 0.007 | 0.07 | 2.16 | 4.64 | 4.13 |
| 1 | Commenced investment operations February 29, 2008. |
| 2 | Total return without applicable sales charge. |
| 3 | Not annualized. |
| 4 | Annualized. |
| 5 | Amounts represent less than $0.005 per share. |
| 6 | Portfolio Turnover is calculated at the fund level and represents the entire fiscal year or period. |
| 7 | Ratio is net of fees waived by the adviser and distributor (See Note 3). |
See accompanying Notes to Financial Statements.
MEMBERS Mutual Funds | October 31, 2010
Financial Highlights for a Share of Beneficial Interest Outstanding
CASH RESERVES FUND (continued) |
| | |
| | | | | | |
| CLASS B | | | | | |
Net Asset Value at beginning of period | $1.00 | $ 1.00 | $ 1.00 | $ 1.00 | $ 1.00 |
| Income from Investment Operations: | | | | | |
| Net investment income | | | | | |
| Total from investment operations | (0.00)6 | 0.006 | 0.01 | 0.04 | 0.03 |
| Less Distributions: | | | | | |
| Distributions from net investment income | | | | | |
| Total distributions | 0.00 | (0.00)6 | (0.01) | (0.04) | (0.03) |
| Net increase (decrease) in net asset value | (0.00)6 | (0.00)6 | – | – | – |
Net Asset Value at end of period | $1.00 | $ 1.00 | $ 1.00 | $ 1.00 | $ 1.00 |
Total Return (%)3 | 0.00 | 0.01 | 1.50 | 3.94 | 3.48 |
| Ratios/Supplemental Data: | | | | | |
| Net Assets at end of period (in 000’s) | $2,056 | $3,250 | $4,655 | $2,779 | $4,242 |
| Ratios of expenses to average net assets: | | | | | |
| Before reimbursement and waiver of expenses by Adviser (%) | 1.30 | 1.56 | 1.77 | 1.84 | 1.84 |
| After reimbursement and waiver of expenses by Adviser (%) | 0.147 | 0.40 | 1.30 | 1.30 | 1.30 |
| Ratio of net investment income to average net assets | | | | | |
| After reimbursement and waiver of expenses by Adviser (%) | 0.007 | 0.01 | 1.32 | 3.88 | 3.37 |
| | For the Period Ended 6/14/071 | |
| |
| CLASS Y | | |
Net Asset Value at beginning of period | $ 1.00 | $ 1.00 |
| Income from Investment Operations: | | |
| Net investment income | | |
| Total from investment operations | 0.03 | 0.02 |
| Less Distributions: | | |
| Distributions from net investment income | | |
| Total distributions | (0.03) | (0.02) |
| Net increase (decrease) in net asset value | 0.00 | 0.00 |
Net Asset Value at end of period | $ 1.00 | $ 1.00 |
Total Return (%)3 | N/A | 1.574 |
| Ratios/Supplemental Data: | | |
| Net Assets at end of period (in 000’s) | $ – | $2,746 |
| Ratios of expenses to average net assets: | | |
| Before reimbursement of expenses by Adviser (%) | 1.005 | 1.355 |
| After reimbursement of expenses by Adviser (%) | 0.555 | 0.555 |
| Ratio of net investment income to average net assets | | |
| After reimbursement of expenses by Adviser (%) | 4.625 | 4.755 |
| 1 | Cash Reserves Fund Class Y shares were liquidated June 14, 2007. |
| 2 | Commenced investment operations June 30, 2006. |
| 3 | Total return without applicable sales charge. |
| 4 | Not annualized. |
| 5 | Annualized. |
| 6 | Amounts represent less than $0.005 per share. |
| 7 | Ratio is net of fees waived by the adviser and distributor (see Note 3). |
See accompanying Notes to Financial Statements.
MEMBERS Mutual Funds | October 31, 2010
Financial Highlights for a Share of Beneficial Interest Outstanding
|
| | |
| | | | | | |
| CLASS A | | | | | |
Net Asset Value at beginning of period | $10.11 | $ 9.48 | $ 9.78 | $ 9.88 | $ 9.85 |
| Income from Investment Operations: | | | | | |
| Net investment income | 0.25 | 0.30 | 0.39 | 0.43 | 0.42 |
| Net realized and unrealized gain (loss) on investments | | | | | |
| Total from investment operations | 0.60 | 0.93 | 0.09 | 0.33 | 0.45 |
| Less Distributions: | | | | | |
| Distributions from net investment income | (0.25) | (0.30) | (0.39) | (0.36) | (0.42) |
| Return of capital | | | | | |
| Total distributions | (0.25) | (0.30) | (0.39) | (0.43) | (0.42) |
| Net increase (decrease) in net asset value | 0.35 | 0.63 | (0.30) | (0.10) | 0.03 |
Net Asset Value at end of period | $10.46 | $10.11 | $ 9.48 | $ 9.78 | $ 9.88 |
Total Return (%)1 | 5.97 | 9.91 | 0.89 | 3.42 | 4.70 |
| Ratios/Supplemental Data: | | | | | |
| Net Assets at end of period (in 000’s) | $44,238 | $44,099 | $37,882 | $55,271 | $59,646 |
| Ratios of expenses to average net assets: | | | | | |
| Before reimbursement of expenses by Adviser (%) | 0.90 | 0.94 | 1.02 | 1.08 | 1.08 |
| After reimbursement of expenses by Adviser (%) | 0.90 | 0.90 | 0.90 | 0.90 | 0.90 |
| Ratio of net investment income to average net assets | | | | | |
| After reimbursement of expenses by Adviser (%) | 2.42 | 3.04 | 4.05 | 4.40 | 4.27 |
Portfolio Turnover (%)2 | 7 | 37 | 22 | 40 | 33 |
| CLASS B | | | | | |
Net Asset Value at beginning of period | $10.12 | $ 9.48 | $ 9.78 | $ 9.88 | $ 9.85 |
| Income from Investment Operations: | | | | | |
| Net investment income | 0.17 | 0.23 | 0.32 | 0.35 | 0.35 |
| Net realized and unrealized gain (loss) on investments | | | | | |
| Total from investment operations | 0.51 | 0.87 | 0.02 | 0.25 | 0.38 |
| Less Distributions: | | | | | |
| Distributions from net investment income | (0.17) | (0.23) | (0.32) | (0.29) | (0.35) |
| Return of capital | | | | | |
| Total distributions | (0.17) | (0.23) | (0.32) | (0.35) | (0.35) |
| Net increase (decrease) in net asset value | 0.34 | 0.64 | (0.30) | (0.10) | 0.03 |
Net Asset Value at end of period | $10.46 | $10.12 | $ 9.48 | $ 9.78 | $ 9.88 |
Total Return (%)1 | 5.08 | 9.20 | 0.13 | 2.64 | 3.91 |
| Ratios/Supplemental Data: | | | | | |
| Net Assets at end of period (in 000’s) | $8,388 | $9,363 | $15,941 | $26,507 | $37,233 |
| Ratios of expenses to average net assets: | | | | | |
| Before reimbursement of expenses by Adviser (%) | 1.65 | 1.69 | 1.77 | 1.83 | 1.83 |
| After reimbursement of expenses by Adviser (%) | 1.65 | 1.65 | 1.65 | 1.65 | 1.65 |
| Ratio of net investment income to average net assets | | | | | |
| After reimbursement of expenses by Adviser (%) | 1.68 | 2.37 | 3.29 | 3.65 | 3.51 |
Portfolio Turnover (%)2 | 7 | 37 | 22 | 40 | 33 |
| 1 | Total return without applicable sales charge. |
| 2 | Portfolio Turnover is calculated at the fund level and represents the entire fiscal year or period. |
See accompanying Notes to Financial Statements.
MEMBERS Mutual Funds | October 31, 2010
Financial Highlights for a Share of Beneficial Interest Outstanding
|
| | | |
| | | | | |
| CLASS Y | | | | | |
Net Asset Value at beginning of period | $10.11 | $ 9.47 | $ 9.77 | $ 9.88 | $ 9.61 |
| Income from Investment Operations: | | | | | |
| Net investment income | 0.27 | 0.32 | 0.42 | 0.45 | 0.15 |
| Net realized and unrealized gain (loss) on investments | | | | | |
| Total from investment operations | 0.62 | 0.96 | 0.12 | 0.34 | 0.42 |
| Less Distributions: | | | | | |
| Distributions from net investment income | (0.27) | (0.32) | (0.42) | (0.38) | (0.15) |
| Return of capital | | | | | |
| Total distributions | (0.27) | (0.32) | (0.42) | (0.45) | (0.15) |
| Net increase (decrease) in net asset value | 0.35 | 0.64 | (0.30) | (0.11) | 0.27 |
Net Asset Value at end of period | $10.46 | $10.11 | $ 9.47 | $ 9.77 | $ 9.88 |
Total Return (%)2 | 6.23 | 10.30 | 1.14 | 3.58 | 4.393 |
| Ratios/Supplemental Data: | | | | | |
| Net Assets at end of period (in 000’s) | $164,190 | $147,145 | $105,043 | $34,542 | $6,141 |
| Ratios of expenses to average net assets: | | | | | |
| Before reimbursement of expenses by Adviser (%) | 0.65 | 0.69 | 0.76 | 0.82 | 0.894 |
| After reimbursement of expenses by Adviser (%) | 0.65 | 0.65 | 0.65 | 0.65 | 0.654 |
| Ratio of net investment income to average net assets | | | | | |
| After reimbursement of expenses by Adviser (%) | 2.67 | 3.28 | 4.23 | 4.69 | 4.674 |
Portfolio Turnover (%)5 | 7 | 37 | 223 | 40 | 333 |
|
| | |
| | | | | | |
| CLASS A | | | | | |
Net Asset Value at beginning of period | $ 6.66 | $ 5.57 | $ 7.29 | $ 7.36 | $ 7.29 |
| Income from Investment Operations: | | | | | |
| Net investment income | 0.51 | 0.46 | 0.47 | 0.53 | 0.52 |
| Net realized and unrealized gain (loss) on investments | | | | | |
| Total from investment operations | 0.94 | 1.55 | (1.18) | 0.45 | 0.59 |
| Less Distributions: | | | | | |
| Distributions from net investment income | | | | | |
| Total distributions | (0.50) | (0.46) | (0.54) | (0.52) | (0.52) |
| Net increase (decrease) in net asset value | 0.44 | 1.09 | (1.72) | (0.07) | 0.07 |
Net Asset Value at end of period | $ 7.10 | $ 6.66 | $ 5.57 | $ 7.29 | $ 7.36 |
Total Return (%)2 | 14.73 | 28.98 | (17.24) | 6.31 | 8.33 |
| Ratios/Supplemental Data: | | | | | |
| Net Assets at end of period (in 000’s) | $24,986 | $25,684 | $17,818 | $35,610 | $36,281 |
| Ratios of expenses to average net assets: | | | | | |
| Before reimbursement of expenses by Adviser (%) | 1.00 | 1.05 | 1.14 | 1.21 | 1.22 |
| After reimbursement of expenses by Adviser (%) | 1.00 | 1.00 | 1.00 | 1.00 | 1.00 |
| Ratio of net investment income to average net assets | | | | | |
| After reimbursement of expenses by Adviser (%) | 7.38 | 7.78 | 6.77 | 7.10 | 6.98 |
Portfolio Turnover (%)5 | 47 | 73 | 59 | 74 | 67 |
| 1 | Commenced investment operations June 30, 2006. |
| 2 | Total return without applicable sales charge. |
| 3 | Not annualized. |
| 4 | Annualized. |
| 5 | Portfolio Turnover is calculated at the fund level and represents the entire fiscal year or period. |
See accompanying Notes to Financial Statements.
MEMBERS Mutual Funds | October 31, 2010
Financial Highlights for a Share of Beneficial Interest Outstanding
HIGH INCOME FUND (continued) |
| | |
| | | | | | |
| CLASS B | | | | | |
Net Asset Value at beginning of period | | | | | |
| Income from Investment Operations: | $ 6.74 | $ 5.63 | $ 7.32 | $ 7.39 | $ 7.31 |
| Net investment income | 0.46 | 0.44 | 0.45 | 0.49 | 0.47 |
| Net realized and unrealized gain (loss) on investments | | | | | |
| Total from investment operations | 0.90 | 1.53 | (1.25) | 0.40 | 0.54 |
| Less Distributions: | | | | | |
| Distributions from net investment income | | | | | |
| Total distributions | (0.45) | (0.42) | (0.44) | (0.47) | (0.46) |
| Net increase (decrease) in net asset value | 0.45 | 1.11 | (1.69) | (0.07) | 0.08 |
Net Asset Value at end of period | $ 7.19 | $ 6.74 | $ 5.63 | $ 7.32 | $ 7.39 |
Total Return (%)2 | 13.86 | 28.08 | (17.93) | 5.50 | 7.64 |
| Ratios/Supplemental Data: | | | | | |
| Net Assets at end of period (in 000’s) | $4,571 | $4,711 | $ 5,833 | $12,255 | $17,099 |
| Ratios of expenses to average net assets: | | | | | |
| Before reimbursement of expenses by Adviser (%) | 1.75 | 1.81 | 1.90 | 1.96 | 1.97 |
| After reimbursement of expenses by Adviser (%) | 1.75 | 1.75 | 1.75 | 1.75 | 1.75 |
| Ratio of net investment income to average net assets | | | | | |
| After reimbursement of expenses by Adviser (%) | 6.62 | 7.01 | 6.04 | 6.37 | 6.24 |
Portfolio Turnover (%)5 | 47 | 73 | 59 | 74 | 67 |
| | | |
| | | | | |
| CLASS Y | | | | | |
Net Asset Value at beginning of period | $ 6.65 | $ 5.56 | $ 7.30 | $ 7.36 | $ 7.21 |
| Income from Investment Operations: | | | | | |
| Net investment income | 0.52 | 0.47 | 0.48 | 0.51 | 0.16 |
| Net realized and unrealized gain (loss) on investments | | | | | |
| Total from investment operations | 0.96 | 1.57 | (1.17) | 0.48 | 0.33 |
| Less Distributions: | | | | | |
| Distributions from net investment income | | | | | |
| Total distributions | (0.52) | (0.48) | (0.57) | (0.54) | (0.18) |
| Net increase (decrease) in net asset value | 0.44 | 1.09 | (1.74) | (0.06) | 0.15 |
Net Asset Value at end of period | $ 7.09 | $ 6.65 | $ 5.56 | $ 7.30 | $ 7.36 |
Total Return (%)2 | 15.04 | 29.35 | (17.09) | 6.72 | 4.593 |
| Ratios/Supplemental Data: | | | | | |
| Net Assets at end of period (in 000’s) | $94,907 | $80,394 | $33,127 | $21,115 | $ 2,637 |
| Ratios of expenses to average net assets: | | | | | |
| Before reimbursement of expenses by Adviser (%) | 0.75 | 0.80 | 0.89 | 0.94 | 1.064 |
| After reimbursement of expenses by Adviser (%) | 0.75 | 0.75 | 0.75 | 0.75 | 0.754 |
| Ratio of net investment income to average net assets | | | | | |
| After reimbursement of expenses by Adviser (%) | 7.61 | 8.04 | 7.03 | 7.43 | 7.334 |
Portfolio Turnover (%)5 | 47 | 73 | 59 | 74 | 673 |
| 1 | Commenced investment operations June 30, 2006. |
| 2 | Total return without applicable sales charge. |
| 3 | Not annualized. |
| 4 | Annualized. |
| 5 | Portfolio Turnover is calculated at the fund level and represents the entire fiscal year or period. |
See accompanying Notes to Financial Statements.
MEMBERS Mutual Funds | October 31, 2010
Financial Highlights for a Share of Beneficial Interest Outstanding
|
| | |
| | | | | | |
| CLASS A | | | | | |
Net Asset Value at beginning of period | $10.17 | $ 9.92 | $13.24 | $13.20 | $12.25 |
| Income from Investment Operations: | | | | | |
| Net investment income | 0.34 | 0.38 | 0.45 | 0.49 | 0.26 |
| Net realized and unrealized gain (loss) on investments | | | | | |
| Total from investment operations | 1.32 | 0.66 | (1.85) | 0.76 | 1.21 |
| Less Distributions: | | | | | |
| Distributions from net investment income | (0.33) | (0.41) | (0.47) | (0.49) | (0.26) |
| Distributions from capital gains | | | | | |
| Total distributions | (0.33) | (0.41) | (1.47) | (0.72) | (0.26) |
| Net increase (decrease) in net asset value | 0.99 | 0.25 | (3.32) | 0.04 | 0.95 |
Net Asset Value at end of period | $11.16 | $10.17 | $ 9.92 | $13.24 | $13.20 |
Total Return (%)1 | 13.15 | 7.07 | (15.39) | 5.95 | 9.97 |
| Ratios/Supplemental Data: | | | | | |
| Net Assets at end of period (in 000’s) | $73,040 | $71,014 | $70,095 | $90,254 | $91,339 |
| Ratios of expenses to average net assets: | | | | | |
| Before reimbursement of expenses by Adviser (%) | 1.10 | 1.27 | 1.29 | 1.25 | 1.21 |
| After reimbursement of expenses by Adviser (%) | 1.10 | 1.10 | 1.10 | 1.10 | 1.10 |
| Ratio of net investment income to average net assets | | | | | |
| After reimbursement of expenses by Adviser (%) | 3.10 | 3.98 | 3.94 | 3.73 | 2.01 |
Portfolio Turnover (%)2 | 24 | 28 | 15 | 62 | 62 |
| CLASS B | | | | | |
Net Asset Value at beginning of period | $10.22 | $ 9.96 | $13.25 | $13.22 | $12.26 |
| Income from Investment Operations: | | | | | |
| Net investment income | 0.26 | 0.32 | 0.39 | 0.40 | 0.16 |
| Net realized and unrealized gain (loss) on investments | | | | | |
| Total from investment operations | 1.25 | 0.60 | (1.95) | 0.66 | 1.12 |
| Less Distributions: | | | | | |
| Distributions from net investment income | (0.25) | (0.34) | (0.34) | (0.40) | (0.16) |
| Distributions from capital gains | | | | | |
| Total distributions | (0.25) | (0.34) | (1.34) | (0.63) | (0.16) |
| Net increase (decrease) in net asset value | 1.00 | 0.26 | (3.29) | 0.03 | 0.96 |
Net Asset Value at end of period | $11.22 | $10.22 | $9.96 | $13.25 | $13.22 |
Total Return (%)1 | 12.35 | 6.24 | (16.01) | 5.09 | 9.23 |
| Ratios/Supplemental Data: | | | | | |
| Net Assets at end of period (in 000’s) | $18,511 | $18,322 | $28,156 | $57,581 | $80,486 |
| Ratios of expenses to average net assets: | | | | | |
| Before reimbursement of expenses by Adviser (%) | 1.85 | 2.04 | 2.04 | 2.00 | 1.96 |
| After reimbursement of expenses by Adviser (%) | 1.85 | 1.85 | 1.85 | 1.85 | 1.85 |
| Ratio of net investment income to average net assets | | | | | |
| After reimbursement of expenses by Adviser (%) | 2.35 | 3.33 | 3.18 | 2.99 | 1.27 |
Portfolio Turnover (%)2 | 24 | 28 | 15 | 62 | 62 |
| 1 | Total return without applicable sales charge. |
| 2 | Portfolio Turnover is calculated at the fund level and represents the entire fiscal year or period. |
See accompanying Notes to Financial Statements.
MEMBERS Mutual Funds | October 31, 2010
Financial Highlights for a Share of Beneficial Interest Outstanding
|
| | |
| CLASS A | |
Net Asset Value at beginning of period | $10.00 |
| Income from Investment Operations: | |
| Net investment loss | (0.04) |
| Net realized and unrealized gain on investments | |
| Total from investment operations | 0.67 |
| Less Distributions: | |
| Distributions from capital gains | |
| Total distributions | (0.40) |
| Net increase in net asset value | 0.27 |
Net Asset Value at end of period | $10.27 |
Total Return (%)2 | 7.03 |
| Ratios/Supplemental Data: | |
| Net Assets at end of period (in 000’s) | $2,886 |
| Ratios of expenses to average net assets: | 1.25 |
| Ratio of net investment income to average net assets | (0.64) |
Portfolio Turnover (%)3 | 58 |
| CLASS Y | |
Net Asset Value at beginning of period1 | $10.00 |
| Income from Investment Operations: | |
| Net investment loss | (0.04) |
| Net realized and unrealized gain on investments | |
| Total from investment operations | 0.69 |
| Less Distributions: | |
| Distributions from capital gains | |
| Total distributions | (0.40) |
| Net increase in net asset value | 0.29 |
Net Asset Value at end of period | $10.29 |
Total Return (%)2 | 7.23 |
| Ratios/Supplemental Data: | |
| Net Assets at end of period (in 000’s) | $32,634 |
| Ratios of expenses to average net assets | 1.00 |
| Ratio of net investment income to average net assets | (0.46) |
Portfolio Turnover (%)3 | 58 |
| 1 | Commenced investment operations October 31, 2009 |
| 2 | Total return without applicable sales charge |
| 3 | Portfolio Turnover is calculated at the fund level and represents the entire period. |
See accompanying Notes to Financial Statements.
MEMBERS Mutual Funds | October 31, 2010
Financial Highlights for a Share of Beneficial Interest Outstanding
|
| | |
| | | | | | |
| CLASS A | | | | | |
Net Asset Value at beginning of period | $10.57 | $10.60 | $16.91 | $15.47 | $13.20 |
| Income from Investment Operations: | | | | | |
| Net investment income | 0.12 | 0.20 | 0.28 | 0.22 | 0.22 |
| Net realized and unrealized gain (loss) on investments | | | | | |
| Total from investment operations | 0.97 | 0.19 | (6.02) | 1.67 | 2.45 |
| Less Distributions: | | | | | |
| Distributions from net investment income | (0.14) | (0.22) | (0.19) | (0.23) | (0.18) |
| Distributions from capital gains | | | | | |
| Total distributions | (0.14) | (0.22) | (0.29) | (0.23) | (0.18) |
| Net increase (decrease) in net asset value | 0.83 | (0.03) | (6.31) | 1.44 | 2.27 |
Net Asset Value at end of period | $11.40 | $10.57 | $10.60 | $16.91 | $15.47 |
Total Return (%)1 | 9.22 | 2.08 | (36.17) | 10.88 | 18.75 |
| Ratios/Supplemental Data: | | | | | |
| Net Assets at end of period (in 000’s) | $53,520 | $54,242 | $58,075 | $116,358 | $113,441 |
| Ratios of expenses to average net assets: | | | | | |
| Before reimbursement of expenses by Adviser (%) | 1.16 | 1.19 | 1.16 | 1.13 | 1.16 |
| After reimbursement of expenses by Adviser (%) | 1.16 | 1.18 | 1.16 | 1.13 | 1.00 |
| Ratio of net investment income to average net assets | | | | | |
| After reimbursement of expenses by Adviser (%) | 1.07 | 2.00 | 1.87 | 1.32 | 1.53 |
Portfolio Turnover (%)2 | 70 | 86 | 55 | 47 | 45 |
| CLASS B | | | | | |
Net Asset Value at beginning of period | $10.38 | $10.42 | $16.61 | $15.20 | $12.97 |
| Income from Investment Operations: | | | | | |
| Net investment income | 0.06 | 0.19 | 0.27 | 0.16 | 0.15 |
| Net realized and unrealized gain (loss) on investments | | | | | |
| Total from investment operations | 0.88 | 0.11 | (6.02) | 1.52 | 2.31 |
| Less Distributions: | | | | | |
| Distributions from net investment income | (0.06) | (0.15) | (0.07) | (0.11) | (0.08) |
| Distributions from capital gains | | | | | |
| Total distributions | (0.06) | (0.15) | (0.17) | (0.11) | (0.08) |
| Net increase (decrease) in net asset value | 0.82 | (0.04) | (6.19) | 1.41 | 2.23 |
Net Asset Value at end of period | $11.20 | $10.38 | $10.42 | $16.61 | $15.20 |
Total Return (%)1 | 8.45 | 1.23 | (36.59) | 10.03 | 17.86 |
| Ratios/Supplemental Data: | | | | | |
| Net Assets at end of period (in 000’s) | $8,863 | $9,637 | $14,993 | $43,146 | $62,766 |
| Ratios of expenses to average net assets: | | | | | |
| Before reimbursement of expenses by Adviser (%) | 1.91 | 1.95 | 1.91 | 1.89 | 1.90 |
| After reimbursement of expenses by Adviser (%) | 1.91 | 1.94 | 1.91 | 1.88 | 1.75 |
| Ratio of net investment income to average net assets | | | | | |
| After reimbursement of expenses by Adviser (%) | 0.31 | 1.36 | 1.11 | 0.61 | 0.80 |
Portfolio Turnover (%)2 | 70 | 86 | 55 | 47 | 45 |
| 1 | Total return without applicable sales charge. |
| 2 | Portfolio Turnover is calculated at the fund level and represents the entire fiscal year or period. |
See accompanying Notes to Financial Statements.
MEMBERS Mutual Funds | October 31, 2010
Financial Highlights for a Share of Beneficial Interest Outstanding
LARGE CAP VALUE FUND (continued) |
| | | |
| | | | | |
| CLASS Y | | | | | |
Net Asset Value at beginning of period | $10.58 | $10.62 | $16.93 | $15.48 | $14.07 |
| Income from Investment Operations: | | | | | |
| Net investment income | 0.15 | 0.18 | 0.22 | 0.21 | 0.03 |
| Net realized and unrealized gain (loss) on investments | | | | | |
| Total from investment operations | 1.01 | 0.21 | (5.98) | 1.72 | 1.41 |
| Less Distributions: | | | | | |
| Distributions from net investment income | (0.17) | (0.25) | (0.23) | (0.27) | – |
| Return of capital | | | | | |
| Total distributions | (0.17) | (0.25) | (0.33) | (0.27) | – |
| Net increase (decrease) in net asset value | 0.84 | (0.04) | (6.31) | 1.45 | 1.41 |
Net Asset Value at end of period | $11.42 | $10.58 | $10.62 | $16.93 | $15.48 |
Total Return (%)2 | 9.58 | 2.24 | (35.97) | 11.21 | 10.023 |
| Ratios/Supplemental Data: | | | | | |
| Net Assets at end of period (in 000’s) | $90,233 | $80,167 | $54,828 | $47,949 | $7,169 |
| Ratios of expenses to average net assets: | | | | | |
| Before reimbursement of expenses by Adviser (%) | 0.91 | 0.93 | 0.91 | 0.87 | 0.96 |
| After reimbursement of expenses by Adviser (%) | 0.91 | 0.93 | 0.91 | 0.88 | 0.75 |
| Ratio of net investment income to average net assets | | | | | |
| After reimbursement of expenses by Adviser (%) | 1.31 | 2.12 | 2.07 | 1.47 | 1.314 |
Portfolio Turnover (%)6 | 70 | 86 | 55 | 47 | 453 |
|
| | |
| | | | | | |
| CLASS A | | | | | |
Net Asset Value at beginning of period | $13.15 | $11.07 | $17.39 | $14.70 | $13.72 |
| Income from Investment Operations: | | | | | |
| Net investment income | 0.02 | 0.05 | 0.03 | (0.00)5 | 0.005 |
| Net realized and unrealized gain (loss) on investments | | | | | |
| Total from investment operations | 2.10 | 2.10 | (6.32) | 2.69 | 1.05 |
| Less Distributions: | | | | | |
| Distributions from net investment income | | | | | |
| Total distributions | (0.05) | (0.02) | – | – | (0.07) |
| Net increase (decrease) in net asset value | 2.05 | 2.08 | (6.32) | 2.69 | 0.98 |
Net Asset Value at end of period | $15.20 | $13.15 | $11.07 | $17.39 | $14.70 |
Total Return (%)2 | 15.96 | 18.99 | (36.34) | 18.30 | 7.71 |
| Ratios/Supplemental Data: | | | | | |
| Net Assets at end of period (in 000’s) | $48,389 | $45,398 | $38,538 | $68,253 | $65,216 |
| Ratios of expenses to average net assets: | | | | | |
| Before reimbursement of expenses by Adviser (%) | 1.20 | 1.31 | 1.34 | 1.43 | 1.45 |
| After reimbursement of expenses by Adviser (%) | 1.20 | 1.20 | 1.20 | 1.20 | 1.20 |
| Ratio of net investment income to average net assets | | | | | |
| After reimbursement of expenses by Adviser (%) | 0.13 | 0.41 | 0.18 | (0.02) | 0.09 |
Portfolio Turnover (%)6 | 79 | 105 | 141 | 93 | 148 |
| 1 | Commenced investment operations June 30, 2006. |
| 2 | Total return without applicable sales charge. |
| 3 | Not annualized. |
| 4 | Annualized. |
| 5 | Amounts represent less than $0.005 per share. |
| 6 | Portfolio Turnover is calculated at the fund level and represents the entire fiscal year or period. |
See accompanying Notes to Financial Statements.
MEMBERS Mutual Funds | October 31, 2010
Financial Highlights for a Share of Beneficial Interest Outstanding
LARGE CAP GROWTH FUND (continued) |
| | |
| | | | | | |
| CLASS B | | | | | |
Net Asset Value at beginning of period | $12.16 | $10.30 | $16.29 | $13.88 | $12.98 |
| Income from Investment Operations: | | | | | |
| Net investment income | (0.08) | (0.02) | (0.11) | (0.13) | (0.09) |
| Net realized and unrealized gain (loss) on investments | | | | | |
| Total from investment operations | 1.83 | 1.86 | (5.99) | 2.41 | 0.90 |
| Net increase (decrease) in net asset value | 1.83 | 1.86 | (5.99) | 2.41 | 0.90 |
Net Asset Value at end of period | $13.99 | $12.16 | $10.30 | $16.29 | $13.88 |
Total Return (%)2 | 15.05 | 18.06 | (36.77) | 17.36 | 6.93 |
| Ratios/Supplemental Data: | | | | | |
| Net Assets at end of period (in 000’s) | $9,698 | $9,665 | $13,580 | $36,147 | $43,975 |
| Ratios of expenses to average net assets: | | | | | |
| Before reimbursement of expenses by Adviser (%) | 1.95 | 2.07 | 2.10 | 2.18 | 2.20 |
| After reimbursement of expenses by Adviser (%) | 1.95 | 1.95 | 1.95 | 1.95 | 1.95 |
| Ratio of net investment income to average net assets | | | | | |
| After reimbursement of expenses by Adviser (%) | (0.62) | (0.30) | (0.56) | (0.76) | (0.65) |
Portfolio Turnover (%)6 | 79 | 105 | 141 | 93 | 148 |
| | | |
| | | | | |
| CLASS Y | | | | | |
Net Asset Value at beginning of period | $13.23 | $11.14 | $17.45 | $14.72 | $13.71 |
| Income from Investment Operations: | | | | | |
| Net investment income | 0.07 | 0.06 | 0.06 | 0.02 | (0.00)5 |
| Net realized and unrealized gain (loss) on investments | | | | | |
| Total from investment operations | 2.15 | 2.13 | (6.31) | 2.73 | 1.01 |
| Less Distributions: | | | | | |
| Distributions from net investment income | | | | | |
| Total distributions | (0.08) | (0.04) | – | – | – |
| Net increase (decrease) in net asset value | 2.07 | 2.09 | (6.31) | 2.73 | 1.01 |
Net Asset Value at end of period | $15.30 | $13.23 | $11.14 | $17.45 | $14.72 |
Total Return (%)2 | 16.26 | 19.26 | (36.16) | 18.55 | 7.373 |
| Ratios/Supplemental Data: | | | | | |
| Net Assets at end of period (in 000’s) | $94,475 | $106,390 | $70,203 | $52,811 | $9,939 |
| Ratios of expenses to average net assets: | | | | | |
| Before reimbursement of expenses by Adviser (%) | 0.95 | 1.06 | 1.09 | 1.16 | 1.304 |
| After reimbursement of expenses by Adviser (%) | 0.95 | 0.95 | 0.95 | 0.95 | 0.954 |
| Ratio of net investment income to average net assets | | | | | |
| After reimbursement of expenses by Adviser (%) | 0.38 | 0.63 | 0.45 | 0.19 | (0.07)4 |
Portfolio Turnover (%)6 | 79 | 105 | 141 | 93 | 1483 |
| 1 | Commenced investment operations June 30, 2006. |
| 2 | Total return without applicable sales charge. |
| 3 | Not annualized. |
| 4 | Annualized. |
| 5 | Amounts represent less than $0.005 per share. |
| 6 | Portfolio Turnover is calculated at the fund level and represents the entire fiscal year or period. |
See accompanying Notes to Financial Statements.
MEMBERS Mutual Funds | October 31, 2010
Financial Highlights for a Share of Beneficial Interest Outstanding
|
| | |
| | | | | | |
| CLASS A | | | | | |
Net Asset Value at beginning of period | $ 4.95 | $ 4.08 | $ 7.45 | $ 6.27 | $ 5.36 |
| Income from Investment Operations: | | | | | |
| Net investment income | (0.02) | (0.03) | (0.04) | (0.07) | (0.04) |
| Net realized and unrealized gain (loss) on investments | | | | | |
| Total from investment operations | 1.00 | 0.87 | (3.32) | 1.18 | 0.91 |
| Less Distributions: | | | | | |
| Distributions from capital gains | | | | | |
| Total distributions | 0.00 | – | (0.05) | – | – |
| Net increase (decrease) in net asset value | 1.00 | 0.87 | (3.37) | 1.18 | 0.91 |
Net Asset Value at end of period | $ 5.95 | $ 4.95 | $ 4.08 | $ 7.45 | $ 6.27 |
Total Return (%)1 | 20.20 | 21.03 | (44.71) | 18.82 | 16.98 |
| Ratios/Supplemental Data: | | | | | |
| Net Assets at end of period (in 000’s) | $42,627 | $17,138 | $14,241 | $33,459 | $33,899 |
| Ratios of expenses to average net assets: | | | | | |
| Before reimbursement of expenses by Adviser (%) | 1.40 | 1.56 | 1.44 | 1.50 | 1.61 |
| After reimbursement of expenses by Adviser (%) | 1.40 | 1.40 | 1.40 | 1.33 | 1.20 |
| Ratio of net investment income to average net assets | | | | | |
| After reimbursement of expenses by Adviser (%) | (0.50) | (0.61) | (0.56) | (0.87) | (0.59) |
Portfolio Turnover (%)2 | 68 | 198 | 127 | 109 | 207 |
| CLASS B | | | | | |
Net Asset Value at beginning of period | $ 4.60 | $ 3.83 | $ 7.04 | $ 5.96 | $ 5.14 |
| Income from Investment Operations: | | | | | |
| Net investment income | (0.05) | (0.06) | (0.10) | (0.13) | (0.08) |
| Net realized and unrealized gain (loss) on investments | | | | | |
| Total from investment operations | 0.89 | 0.77 | (3.16) | 1.08 | 0.82 |
| Less Distributions: | | | | | |
| Distributions from capital gains | | | | | |
| Total distributions | 0.00 | – | (0.05) | – | – |
| Net increase (decrease) in net asset value | 0.89 | 0.77 | (3.21) | 1.08 | 0.82 |
Net Asset Value at end of period | $ 5.49 | $ 4.60 | $ 3.83 | $ 7.04 | $ 5.96 |
Total Return (%)1 | 19.35 | 20.10 | (45.18) | 17.92 | 16.15 |
| Ratios/Supplemental Data: | | | | | |
| Net Assets at end of period (in 000’s) | $9,879 | $4,231 | $ 4,891 | $13,598 | $15,754 |
| Ratios of expenses to average net assets: | | | | | |
| Before reimbursement of expenses by Adviser (%) | 2.15 | 2.32 | 2.19 | 2.25 | 2.35 |
| After reimbursement of expenses by Adviser (%) | 2.15 | 2.15 | 2.15 | 2.08 | 1.95 |
| Ratio of net investment income to average net assets | | | | | |
| After reimbursement of expenses by Adviser (%) | (1.24) | (1.34) | (1.32) | (1.62) | (1.36) |
Portfolio Turnover (%)2 | 68 | 198 | 127 | 109 | 207 |
| 1 | Total return without applicable sales charge. |
| 2 | Portfolio Turnover is calculated at the fund level and represents the entire fiscal year or period. |
See accompanying Notes to Financial Statements.
MEMBERS Mutual Funds | October 31, 2010
Financial Highlights for a Share of Beneficial Interest Outstanding
|
| | | |
| | | | | |
| CLASS Y | | | | | |
Net Asset Value at beginning of period | $ 5.00 | $ 4.11 | $ 7.47 | $ 6.27 | $ 5.84 |
| Income from Investment Operations: | | | | | |
| Net investment income | (0.01) | (0.01) | (0.02) | (0.03) | (0.01) |
| Net realized and unrealized gain (loss) on investments | | | | | |
| Total from investment operations | 1.01 | 0.89 | (3.31) | 1.20 | 0.43 |
| Less Distributions: | | | | | |
| Distributions from capital gains | | | | | |
| Total distributions | 0.00 | – | (0.05) | – | – |
| Net increase (decrease) in net asset value | 1.01 | 0.89 | (3.36) | 1.20 | 0.43 |
Net Asset Value at end of period | $ 6.01 | $ 5.00 | $ 4.11 | $ 7.47 | $ 6.27 |
Total Return (%)3 | 20.20 | 21.65 | (44.66) | 19.11 | 7.534 |
| Ratios/Supplemental Data: | | | | | |
| Net Assets at end of period (in 000’s) | $26,101 | $23,389 | $17,649 | $32,631 | $ 7,830 |
| Ratios of expenses to average net assets: | | | | | |
| Before reimbursement of expenses by Adviser (%) | 1.15 | 1.30 | 1.19 | 1.22 | 1.475 |
| After reimbursement of expenses by Adviser (%) | 1.15 | 1.15 | 1.15 | 1.11 | 0.955 |
| Ratio of net investment income to average net assets | | | | | |
| After reimbursement of expenses by Adviser (%) | (0.23) | (0.37) | (0.27) | (0.62) | (0.58)5 |
Portfolio Turnover (%)6 | 68 | 198 | 127 | 109 | 2074 |
|
| | | |
| | | | |
| CLASS A | | | | |
Net Asset Value at beginning of period | $ 8.24 | $ 7.29 | $10.36 | $10.00 |
| Income from Investment Operations: | | | | |
| Net investment income | 0.005 | 0.03 | 0.22 | 0.06 |
| Net realized and unrealized gain (loss) on investments | | | | |
| Total from investment operations | 1.70 | 0.97 | (2.85) | 0.36 |
| Less Distributions: | | | | |
| Distributions from investment income | (0.01) | (0.02) | (0.05) | – |
| Distributions from capital gains | | | | |
| Total distributions | (0.01) | (0.02) | (0.22) | – |
| Net increase (decrease) in net asset value | 1.69 | 0.95 | (3.07) | 0.36 |
Net Asset Value at end of period | $ 9.93 | $ 8.24 | $ 7.29 | $10.36 |
Total Return (%)3 | 20.60 | 13.30 | (28.02) | 3.604 |
| Ratios/Supplemental Data: | | | | |
| Net Assets at end of period (in 000’s) | $2,540 | $1,301 | $ 883 | $6,098 |
| Ratios of expenses to average net assets: | | | | |
| Before reimbursement of expenses by Adviser (%) | 1.50 | 2.85 | 2.18 | 2.615 |
| After reimbursement of expenses by Adviser (%) | 1.50 | 1.50 | 1.50 | 1.505 |
| Ratio of net investment income to average net assets | | | | |
| After reimbursement of expenses by Adviser (%) | 0.04 | 0.50 | 0.56 | 0.715 |
Portfolio Turnover (%)6 | 40 | 21 | 55 | 144 |
| 1 | Commenced investment operations June 30, 2006. |
| 2 | Commenced investment operations December 27, 2006. |
| 3 | Total return without applicable sales charge. |
| 4 | Not annualized. |
| 5 | Annualized. |
| 6 | Portfolio Turnover is calculated at the fund level and represents the entire fiscal year or period. |
See accompanying Notes to Financial Statements.
MEMBERS Mutual Funds | October 31, 2010
Financial Highlights for a Share of Beneficial Interest Outstanding
SMALL CAP FUND (continued) |
| | | |
| | | | |
| CLASS B | | | | |
Net Asset Value at beginning of period | $ 8.18 | $ 7.24 | $10.29 | $10.00 |
| Income from Investment Operations: | | | | |
| Net investment income | (0.07) | (0.02) | 0.03 | (0.00)6 |
| Net realized and unrealized gain (loss) on investments | | | | |
| Total from investment operations | 1.60 | 0.92 | (2.88) | 0.29 |
Redemption Fees (see Note 2) | – | 0.02 | 0.02 | 0.005 |
| Less Distributions: | – | | | |
| Distributions from capital gains | | | | |
| Total distributions | 0.00 | – | (0.17) | – |
| Net increase (decrease) in net asset value | 1.60 | 0.94 | (3.05) | 0.29 |
Net Asset Value at end of period | $ 9.78 | $ 8.18 | $ 7.24 | $10.29 |
Total Return (%)3 | 19.56 | 12.98 | (28.38) | 2.904 |
| Ratios/Supplemental Data: | | | | |
| Net Assets at end of period (in 000’s) | $262 | $100 | $ 67 | $ 200 |
| Ratios of expenses to average net assets: | | | | |
| Before reimbursement of expenses by Adviser (%) | 2.25 | 11.03 | 7.88 | 11.245 |
| After reimbursement of expenses by Adviser (%) | 2.25 | 2.25 | 2.25 | 2.255 |
| Ratio of net investment income to average net assets | | | | |
| After reimbursement of expenses by Adviser (%) | (0.72) | (0.22) | (0.19) | (0.01)5 |
Portfolio Turnover (%)7 | 40 | 21 | 55 | 144 |
| | | Inception to 10/31/072 |
| | | | |
| CLASS Y | | | | |
Net Asset Value at beginning of period | $ 8.22 | $ 7.31 | $10.37 | $ 9.82 |
| Income from Investment Operations: | | | | |
| Net investment income | 0.03 | 0.05 | 0.06 | 0.05 |
| Net realized and unrealized gain (loss) on investments | | | | |
| Total from investment operations | 1.72 | 0.97 | (2.82) | 0.55 |
| Less Distributions: | | | | |
| Distributions from net investment income | (0.03) | (0.06) | (0.07) | – |
| Distributions from capital gains | | | | |
| Total distributions | (0.03) | (0.06) | (0.24) | – |
| Net increase (decrease) in net asset value | 1.69 | 0.91 | (3.06) | 0.55 |
Net Asset Value at end of period | $ 9.91 | $ 8.22 | $ 7.31 | $10.37 |
Total Return (%)3 | 20.90 | 13.53 | (27.71) | 5.604 |
| Ratios/Supplemental Data: | | | | |
| Net Assets at end of period (in 000’s) | $29,240 | $20,389 | $13,453 | $14,949 |
| Ratios of expenses to average net assets: | | | | |
| Before reimbursement of expenses by Adviser (%) | 1.25 | 1.52 | 1.61 | 1.915 |
| After reimbursement of expenses by Adviser (%) | 1.25 | 1.25 | 1.25 | 1.255 |
| Ratio of net investment income to average net assets | | | | |
| After reimbursement of expenses by Adviser (%) | 0.29 | 0.77 | 0.81 | 0.995 |
Portfolio Turnover (%)7 | 40 | 21 | 55 | 144 |
| 1 | Commenced investment operations December 27, 2006. |
| 2 | Commenced investment operations on December 27, 2006. |
| 3 | Total return without applicable sales charge. |
| 4 | Not annualized. |
| 5 | Annualized. |
| 6 | Amounts represent less than $0.005 per share. |
| 7 | Portfolio Turnover is calculated at the fund level and represents the entire fiscal year or period. |
See accompanying Notes to Financial Statements.
MEMBERS Mutual Funds | October 31, 2010
Financial Highlights for a Share of Beneficial Interest Outstanding
|
| | |
| | | | | | |
| CLASS A | | | | | |
Net Asset Value at beginning of period | $ 9.94 | $ 8.47 | $17.05 | $15.66 | $12.65 |
| Income from Investment Operations: | | | | | |
| Net investment income | 0.12 | 0.15 | 0.23 | 0.16 | 0.15 |
| Net realized and unrealized gain (loss) on investments | | | | | |
| Total from investment operations | 0.89 | 1.84 | (5.83) | 3.08 | 3.16 |
| Less Distributions: | | | | | |
| Distributions from net investment income | (0.25) | (0.16) | (0.24) | (0.11) | (0.14) |
| Distributions from capital gains | | | | | |
| Total distributions | (0.25) | (0.37) | (2.75) | (1.69) | (0.15) |
| Net increase (decrease) in net asset value | 0.64 | 1.47 | (8.58) | 1.39 | 3.01 |
Net Asset Value at end of period | $10.58 | $ 9.94 | $ 8.47 | $17.05 | $15.66 |
Total Return (%)1 | 9.01 | 22.82 | (40.46) | 21.24 | 25.11 |
| Ratios/Supplemental Data: | | | | | |
| Net Assets at end of period (in 000’s) | $23,505 | $23,094 | $19,040 | $52,145 | $78,958 |
| Ratios of expenses to average net assets: | | | | | |
| Before reimbursement of expenses by Adviser (%) | 1.60 | 1.73 | 1.93 | 1.89 | 1.87 |
| After reimbursement of expenses by Adviser (%) | 1.60 | 1.60 | 1.60 | 1.60 | 1.60 |
| Ratio of net investment income to average net assets | | | | | |
| After reimbursement of expenses by Adviser (%) | 1.19 | 1.81 | 1.67 | 0.99 | 1.03 |
Portfolio Turnover (%)2 | 52 | 82 | 69 | 79 | 63 |
| CLASS B | | | | | |
Net Asset Value at beginning of period | $ 9.76 | $ 8.33 | $16.79 | $15.45 | $12.48 |
| Income from Investment Operations: | | | | | |
| Net investment income | 0.05 | 0.14 | 0.18 | 0.08 | 0.03 |
| Net realized and unrealized gain (loss) on investments | | | | | |
| Total from investment operations | 0.80 | 1.74 | (5.83) | 2.92 | 3.01 |
| Less Distributions: | | | | | |
| Distributions from net investment income | (0.17) | (0.10) | (0.12) | – | (0.03) |
| Distributions from capital gains | | | | | |
| Total distributions | (0.17) | (0.31) | (2.63) | (1.58) | (0.04) |
| Net increase (decrease) in net asset value | 0.63 | 1.43 | (8.46) | 1.34 | 2.97 |
Net Asset Value at end of period | $10.39 | $ 9.76 | $ 8.33 | $16.79 | $15.45 |
Total Return (%)1 | 8.26 | 21.91 | (40.95) | 20.31 | 24.18 |
| Ratios/Supplemental Data: | | | | | |
| Net Assets at end of period (in 000’s) | $4,854 | $5,109 | $ 6,237 | $15,630 | $16,175 |
| Ratios of expenses to average net assets: | | | | | |
| Before reimbursement of expenses by Adviser (%) | 2.35 | 2.49 | 2.69 | 2.64 | 2.62 |
| After reimbursement of expenses by Adviser (%) | 2.35 | 2.35 | 2.35 | 2.35 | 2.35 |
| Ratio of net investment income to average net assets | | | | | |
| After reimbursement of expenses by Adviser (%) | 0.43 | 1.09 | 1.04 | 0.41 | 0.32 |
Portfolio Turnover (%)2 | 52 | 82 | 69 | 79 | 63 |
| 1 | Total return without applicable sales charge. |
| 2 | Portfolio Turnover is calculated at the fund level and represents the entire fiscal year or period. |
See accompanying Notes to Financial Statements.
MEMBERS Mutual Funds | October 31, 2010
Financial Highlights for a Share of Beneficial Interest Outstanding
INTERNATIONAL STOCK FUND (continued) |
| | | |
| | | | | |
| CLASS Y | | | | | |
Net Asset Value at beginning of period | $ 9.95 | $ 8.48 | $17.08 | $15.68 | $14.57 |
| Income from Investment Operations: | | | | | |
| Net investment income | 0.22 | 0.16 | 0.31 | 0.17 | 0.01 |
| Net realized and unrealized gain (loss) on investments | | | | | |
| Total from investment operations | 0.91 | 1.86 | (5.81) | 3.13 | 1.11 |
| Less Distributions: | | | | | |
| Distributions from net investment income | (0.27) | (0.18) | (0.28) | (0.15) | – |
| Distributions from capital gains | | | | | |
| Total distributions | (0.27) | (0.39) | (2.79) | (1.73) | – |
| Net increase (decrease) in net asset value | 0.64 | 1.47 | (8.60) | 1.40 | 1.11 |
Net Asset Value at end of period | $10.59 | $ 9.95 | $ 8.48 | $17.08 | $15.68 |
Total Return (%)2 | 9.28 | 23.25 | (40.41) | 21.59 | 7.623 |
| Ratios/Supplemental Data: | | | | | |
| Net Assets at end of period (in 000’s) | $74,421 | $120,187 | $81,569 | $60,525 | $9,025 |
| Ratios of expenses to average net assets: | | | | | |
| Before reimbursement of expenses by Adviser (%) | 1.35 | 1.47 | 1.68 | 1.66 | 1.724 |
| After reimbursement of expenses by Adviser (%) | 1.35 | 1.35 | 1.35 | 1.35 | 1.354 |
| Ratio of net investment income to average net assets | | | | | |
| After reimbursement of expenses by Adviser (%) | 1.42 | 2.07 | 2.25 | 1.48 | 0.484 |
Portfolio Turnover (%)5 | 52 | 82 | 69 | 79 | 633 |
| 1 | Commenced investment operations June 30, 2006. |
| 2 | Total return without applicable sales charge. |
| 3 | Not annualized. |
| 4 | Annualized. |
| 5 | Portfolio Turnover is calculated at the fund level and represents the entire fiscal year or period. |
See accompanying Notes to Financial Statements.
MEMBERS Mutual Funds | October 31, 2010
Notes to Financial Statements
1. ORGANIZATION
The MEMBERS Mutual Funds, a Delaware business trust (the "Trust"), is registered under the Investment Company Act of 1940, as amended (the "1940 Act"), as a diversified, open-end, management investment company. As of the date of this report, the Trust offers thirteen funds (individually, a "Fund," collectively, the "Funds"). The Declaration of Trust permits the Trustees to issue an unlimited number of shares of beneficial interest of the Trust without par value. The Trust has entered into an Investment Advisory Agreement with Madison Asset Management, LLC (the "Investment Adviser"). The Investment Adviser, in turn, has entered into subadvisory agreements with certain subadvisers ("Subadvisers") for the management of the investments of the High Income Fund, Small Cap Fund, and the International Stock Fund. The accompanying financial statem ents include the Cash Reserves, Bond, High Income, Diversified Income, Equity Income, Large Cap Value, Large Cap Growth, Mid Cap, Small Cap and International Stock Funds (collectively, the "Core Funds"), and the Conservative Allocation, Moderate Allocation, and Aggressive Allocation Funds (collectively, the "Target Allocation Funds"). The Core Funds, excluding the Cash Reserves, Diversified Income and Equity Income Funds, offer three classes of shares: Class A, B and Y, the Target Allocation Funds offer three classes of shares: Class A, B and C. The Cash Reserves Fund and the Diversified Income Fund, offer two classes of shares: Class A and B, and the Equity Income Fund offers two classes of shares: Class A and Y. Each class of shares represents an interest in the assets of the respective Fund and has identical voting, dividend, liquidation and other rights, except that each class of shares bears its own distribution fees and servicing fees, if any, its proportional share of Fund level expenses, is subject t o its own sales charges, if any, and has exclusive voting rights on matters pertaining to Rule 12b-1 of the 1940 Act as it relates to that class and other class-specific matters.
2. SIGNIFICANT ACCOUNTING POLICIES
The preparation of financial statements requires management to make estimates and assumptions that affect the reported amounts of assets and liabilities and disclosure of contingent assets and liabilities at the date of the financial statements and the reported amounts of income and expenses during the reported period. Actual results could differ from those estimates. The following is a summary of significant accounting policies consistently followed by each Fund in the preparation of its financial statements.
Portfolio Valuation: Securities and other investments are valued as follows: Equity securities and exchange-traded funds ("ETFs") listed on any U.S. or foreign stock exchange or quoted on the National Association of Securities Dealers Automated Quotation System ("NASDAQ") are valued at the last quoted sale price or official closing price on that exchange or NASDAQ on the valuation day (provided that, for securities traded on NASDAQ, the Funds utilize the NASDAQ Official Closing Price). If no sale occurs, equities traded on a U.S. exchange, on NASDAQ or a foreign exchange are valued at the official bid price. Debt securities purchased with a remaining maturity of 61 days or more are valued by a pricing service selected by the Trust or on the basis of dealer-supplied quotati ons. Short-term instruments having maturities of 60 days or less and all securities in the Cash Reserves Fund are valued on an amortized cost basis, which approximates market value. Investments in shares of open-end mutual funds, including money market funds, are valued at their daily net asset value ("NAV") which is calculated as of the close of regular trading on the New York Stock Exchange (usually 4:00 p.m. Eastern Standard Time) on each day on which the New York Stock Exchange is open for business. NAV per share is determined by dividing each Fund’s total net assets by the number of shares of such Fund outstanding at the time of calculation. Total net assets are determined by adding the total current value of portfolio securities, cash, receivables, and other assets and subtracting liabilities.
Over-the-counter securities not listed or traded on NASDAQ are valued at the last sale price on the valuation day. If no sale occurs on the valuation day, an over-the-counter security is valued at the official bid price. Over-the-counter options are valued based upon prices provided by market makers in such securities or dealers in such currencies. Exchange traded options are valued at the last sale or bid price on the exchange where such option contract is principally traded except for the Equity Income Fund where
MEMBERS Mutual Funds | October 31, 2010
Notes to Financial Statements
they are valued at the mean of the best bid and best ask prices across all option exchanges. Financial futures contracts generally are valued at the settlement price established by the exchange(s) on which the contracts are primarily traded. The Funds’ Pricing Committee (the "Committee") shall estimate the fair value of futures positions affected by the daily limit by using its valuation procedures for determining fair value, when necessary. Spot and forward foreign currency exchange contracts are valued based on quotations supplied by dealers in such contracts. Overnight repurchase agreements are valued at cost, and term repurchase agreements (i.e., those whose maturity exceeds seven days), swaps, caps, collars and floors are valued at the average of the clos ing bids obtained daily from at least one dealer.
The value of all assets and liabilities expressed in foreign currencies was converted into U.S. dollar values using the then current exchange rate at the close of regular trading on the New York Stock Exchange (usually 4:00 p.m. Eastern Standard Time).
All other securities for which either quotations are not readily available, no other sales have occurred, or in the Investment Adviser’s opinion, do not reflect the current market value, are appraised at their fair values as determined in good faith by the Committee and under the general supervision of the Board of Trustees. When fair value pricing of securities is employed, the prices of securities used by the Funds to calculate NAV may differ from market quotations or official closing prices. Because the Target Allocation Funds primarily invest in underlying funds, government securities and short-term paper, it is not anticipated that the Investment Adviser will need to "fair" value any of the investments of these funds. However, an underlying fund may need to "fair" value one or more of its investments, which may, in turn, requir e a Target Allocation Fund to do the same because of delays in obtaining the underlying fund’s NAV.
A Fund’s investments (or underlying fund) will be valued at fair value if, in the judgment of the Committee, an event impacting the value of an investment occurred between the closing time of a security’s primary market or exchange (for example, a foreign exchange or market) and the time the Fund’s share price is calculated as of the close of regular trading on the New York Stock Exchange (usually 4:00 p.m. Eastern Standard Time). Significant events may include, but are not limited to, the following: (1) significant fluctuations in domestic markets, foreign markets or foreign currencies; (2) occurrences not directly tied to the securities markets such as natural disasters, armed conflicts or significant government actions; and (3) major announcements affecting a single issuer or an entire market or market sector. In resp onding to a significant event, the Committee would determine the fair value of affected securities considering factors including, but not limited to: fundamental analytical data relating to the investment; the nature and duration of any restrictions on the disposition of the investment; and the forces influencing the market(s) in which the investment is purchased or sold. The Committee may rely on an independent fair valuation service to adjust the valuations of foreign equity securities based on specific market-movement parameters established by the Committee and approved by the Funds.
Security Transactions and Investment Income: Security transactions are accounted for on a trade date basis. Net realized gains or losses on sales are determined by the identified cost method. Interest income is recorded on an accrual basis. Dividend income is recorded on ex-dividend date. Amortization and accretion are recorded on the effective yield method.
Federal Income Taxes: It is each Fund’s policy to comply with the requirements of Subchapter M of the Internal Revenue Code of 1986 applicable to regulated investment companies and to distribute substantially all its taxable income to its shareholders. Accordingly, no provisions for federal income taxes are recorded in the accompanying financial statements.
The Funds have not recorded any liabilities for material unrecognized tax benefits as of October 31, 2010. It is the Funds’ policy to recognize accrued interest and penalties related to uncertain tax benefits in income taxes, as appropriate. Tax years that remain open to examination by major tax jurisdictions include tax years ended October 31, 2007 through October 31, 2010.
Expenses: Expenses that are directly related to one Fund are charged directly to that Fund. Other operating expenses are prorated to the Funds on the basis of relative net assets. Class-specific expenses are borne by that class.
MEMBERS Mutual Funds | October 31, 2010
Notes to Financial Statements
Classes: Income and realized and unrealized gains/losses are allocated to the respective classes on the basis of relative net assets.
Repurchase Agreements: Each Fund may engage in repurchase agreements. In a repurchase agreement, a security is purchased for a relatively short period (usually not more than 7 days) subject to the obligation to sell it back to the issuer at a fixed time and price plus accrued interest. The Funds will enter into repurchase agreements only with members of the Federal Reserve System and with "primary dealers" in U.S. Government securities. As of October 31, 2010, only the Equity Income Fund had open repurchase agreements.
The Trust has established a procedure providing that the securities serving as collateral for each repurchase agreement must be delivered to the Funds’ custodian either physically or in book-entry form and that the collateral must be marked to market daily to ensure that each repurchase agreement is fully collateralized at all times. In the event of bankruptcy or other default by a seller of a repurchase agreement, a Fund could experience one of the following: delays in liquidating the underlying securities during the period in which the Fund seeks to enforce its rights thereto, possible subnormal levels of income, declines in value of the underlying securities, or lack of access to income during this period and the expense of enforcing its rights.
Foreign Currency Transactions: The books and records are maintained in U.S. dollars. Foreign currency denominated transactions (i.e., market value of investment securities, assets and liabilities, purchases and sales of investment securities, and income and expenses) are translated into U.S. dollars at the current rate of exchange.
Each Fund, except the Cash Reserves Fund, reports certain foreign currency-related transactions as components of realized gains or losses for financial reporting purposes, whereas such components are treated as ordinary income for federal income tax purposes. Net realized gains of $507,383 are included in the Statements of Operations under the heading "Net realized gain (loss) on investments" for the International Stock Fund. The Cash Reserves Fund can only invest in U.S. dollar-denominated foreign money market securities.
The Funds do not isolate the portion of gains and losses on investments in securities that is due to changes in the foreign exchange rates from that which is due to change in market prices of securities. Such amounts are categorized as gain or loss on investments for financial reporting purposes.
Forward Foreign Currency Exchange Contracts: Each Fund, except the Cash Reserves Fund, may purchase and sell forward foreign currency exchange contracts for defensive or hedging purposes. When entering into forward foreign currency exchange contracts, the Funds agree to receive or deliver a fixed quantity of foreign currency for an agreed-upon price on an agreed future date. These contracts are valued daily. The Funds’ net assets reflect unrealized gains or losses on the contracts as measured by the difference between the forward foreign currency exchange rates at the dates of entry into the contracts and the forward rates at the reporting date. The Funds realize a gain or a loss at the time the forward foreign currency exchange contracts are settled or closed out wi th an offsetting contract. Realized and unrealized gains and losses are included in the Statements of Operations. As of October 31, 2010, none of the Funds had open forward foreign currency exchange contracts.
If a Fund enters into a forward foreign currency exchange contract to buy foreign currency for any purpose, the Fund will be required to place cash or other liquid assets in a segregated account with the Fund’s custodian in an amount equal to the value of the Fund’s total assets committed to the consummation of the forward contract. If the value of the securities in the segregated account declines, additional cash or securities will be placed in the segregated account so that the value of the account will equal the amount of the Fund’s commitment with respect to the contract.
Futures Contracts: Each Fund, except the Cash Reserves Fund, may purchase and sell futures contracts and purchase and write options on futures contracts. The Funds will engage in futures contracts or related options transactions to hedge certain market positions. Upon entering into a futures contract, the Fund is required to pledge to the broker an amount of cash, U.S. Government
MEMBERS Mutual Funds | October 31, 2010
Notes to Financial Statements
securities or other assets, equal to a certain percentage of the contract (initial margin deposit). Subsequent payments, known as "variation margin," are made or received by the Fund each day, depending on the daily fluctuations in the fair value of the futures contract. When a Fund enters into a futures contract, the fund segregates cash or other liquid securities, of any type or maturity, equal in value to the Fund’s commitment. The Fund recognizes a gain or loss equal to the daily change in the value of the futures contracts. Should market conditions move unexpectedly, the Fund may not achieve the anticipated benefits of the futures contracts and may realize a loss. As of October 31, 2010, none of the Funds had open futures contracts.
Illiquid Securities: Each Fund currently limits investments in illiquid securities to 15% of net assets at the time of purchase, except for the Cash Reserves Fund which limits the investment in illiquid securities to 5% of net assets. At October 31, 2010, investments in securities of the Bond, High Income and Diversified Income Funds include issues that are illiquid. The aggregate values of illiquid securities held by the Bond, High Income and Diversified Income were $2,802,129, $1,298,750 and $2,320,142, respectively, which represent 1.3%, 1.0% and 2.5% of net assets, respectively. Pursuant to guidelines adopted by the Board of Trustees, certain unregistered securities are determined to be liquid and are not included within the percent limitations specified above. Informa tion concerning the illiquid securities held at October 31, 2010, which includes cost and acquisition date, is as follows:
| Bond Fund | | |
| Security: | Acquisition Date | Acquisition Cost |
| American Association of Retired Persons | 5/16/02 | 793,402 |
| ERAC USA Finance LLC | 12/16/04 | 629,355 |
| WM Wrigley Jr. Co. | 6/21/10 | |
| | | $2,661,765 |
| High Income Fund | | |
| Security: | Acquisition Date | Acquisition Cost |
| WCA Waste Corp. | 6/28/06 | 250,590 |
| Syniverse Technologies Inc., Series B | Various | 497,520 |
| Angel Lux Common S.A. | Various | |
| | | $1,259,485 |
| Diversified Income Fund | | |
| Security: | Acquisition Date | Acquisition Cost |
| American Association of Retired Persons | 5/16/02 | 793,403 |
| ERAC USA Finance LLC | 12/16/04 | 355,722 |
| WM Wrigley Jr. Co. | 6/21/10 | 279,776 |
| Nissan Motor Acceptance Corp. | 3/16/07 | |
| | | $2,195,270 |
All securities listed above are deemed illiquid primarily due to low trading volume. These securities are classified as Level 2 as there are significant observable inputs used to price them and a market exists for each.
Delayed Delivery Securities: Each Fund may purchase securities on a when-issued or delayed delivery basis. "When-issued" refers to securities whose terms are available and for which a market exists, but that have not been issued. For when-issued or delayed delivery transactions, no payment is made until delivery date, which is typically longer than the normal course of settlement, and often a month or more after the purchase. When a Fund enters into an agreement to purchase securities on a when-issued or delayed delivery basis, the Fund segregates cash or other liquid securities, of any type or maturity, equal in value to the Fund’s commitment. Losses may arise due to changes in the market value of the underlying securities, if the counterparty does not perform under the contract, or if the issuer does not issue the securities due to political, economic or other factors. As of October 31, 2010, none of the Funds had entered into such transactions.
Reclassification Adjustments: Paid-in capital, undistributed net investment income, and accumulated net realized gain (loss) have been adjusted in the Statements of Assets and Liabilities for permanent book-tax differences for all Funds. Differences
MEMBERS Mutual Funds | October 31, 2010
Notes to Financial Statements
primarily relate to the tax treatment of net operating losses, paydown gains and losses, foreign currency gains and losses, and distributions from real estate investment trusts and passive foreign investment companies.
To the extent these book and tax differences are permanent in nature, such amounts are reclassified at the end of the fiscal year among paid-in capital in excess of par value, undistributed net investment income (loss) and undistributed net realized gain (loss) on investments and foreign currency translations. Accordingly, at October 31, 2010 reclassifications were recorded as follows:
| | Undistributed Net Investment Income (Loss) | Accumulated Net Realized Gain (Loss) |
| Conservative Allocation | $ (439) | $ 210 | $ 229 |
| Moderate Allocation | (2,960) | – | 2,960 |
| Aggressive Allocation | – | 2,081 | (2,081) |
| Cash Reserves | – | – | – |
| Bond | – | (12,740) | 12,740 |
| High Income | – | 6,035 | (6,035) |
| Diversified Income | (1,589) | (38,301) | 39,890 |
| Equity Income | – | (147,438) | 147,438 |
| Large Cap Value | – | (22,781) | 22,781 |
| Large Cap Growth | – | – | – |
| Mid Cap | 8,119,752 | 323,190 | (8,442,942) |
| Small Cap | 4,749,104 | (15,114) | (4,733,990) |
| International Stock | (654) | 149,656 | (149,002) |
Redemption Fees: The Small Cap and the International Stock Funds will deduct a fee of 2% from redemption proceeds on Class A and Class B shares held 30 calendar days or less. Redemption fees are treated as additional paid-in capital to the Fund from which the shares are redeemed and are designed to help offset any costs associated with short-term shareholder trading.
Fair Value Measurements: Each Fund has adopted the Financial Accounting Standards Board ("FASB") Accounting Standards Codification ("ASC") 820, Fair Value Measurements and Disclosures. Fair value is defined as the price that each Fund would receive upon selling an investment in, or pay to transfer a liability in, an orderly transaction with an independent buyer in the principal or most advantageous market of the investment or liability. A three-tier hierarchy is used to maximize the use of observable market data "inputs" and minimize the use of unobservable "inputs" and to establish classification of fair value measurements for disclosure purposes. Inputs refer broadly to the assumptions that market participants woul d use in pricing the asset or liability, including assumptions about risk (for example, the risk inherent in a particular valuation technique used to measure fair value including such a pricing model and/or the risk inherent in the inputs to the valuation technique). Inputs may be observable or unobservable.
Observable inputs are inputs that reflect the assumptions market participants would use in pricing the asset or liability developed based on market data obtained from sources independent of the reporting entity. Unobservable inputs are inputs that reflect the reporting entity’s own assumptions about the assumptions market participants would use in pricing the asset or liability developed based on the best information available in the circumstances. The three-tier hierarchy of inputs is summarized in the three broad Levels listed on the next page:
Level 1 – unadjusted quoted prices in active markets for identical investments
Level 2 – other significant observable inputs (including quoted prices for similar investments, interest rates, prepayment speeds, credit risk, etc.)
Level 3 – significant unobservable inputs (including the Fund’s own assumptions in determining the fair value of investments)
MEMBERS Mutual Funds | October 31, 2010
Notes to Financial Statements
The valuation techniques used by the Funds to measure fair value for the period ended October 31, 2010 maximized the use of observable inputs and minimized the use of unobservable inputs. The Funds utilized the following fair value techniques: multi-dimensional relational pricing model and option adjusted spread pricing; the Funds estimated the price that would have prevailed in a liquid market for an international equity security given information available at the time of evaluation. During the year ended October 31, 2010, none of the Funds held securities deemed as a Level 3.
The following is a summary of the inputs used as of October 31, 2010 in valuing the Funds’ investments carried at market value:
| Quoted Prices in Active Markets for Identical Investments (Level 1) | Significant Other Observable Inputs (Level 2) | Significant Unobservable Inputs (Level 3) | |
Conservative Allocation1 | $ 47,003,512 | $ – | $ – | $ 47,003,512 |
Moderate Allocation1 | 108,656,585 | – | – | 108,656,585 |
Aggressive Allocation1 | 37,470,630 | – | – | 37,470,630 |
Cash Reserves2 | 493,560 | 13,247,895 | – | 13,741,455 |
| Bond | | | | |
| Asset Backed | – | 2,341,376 | – | 2,341,376 |
| Corporate Notes and Bonds | – | 40,113,931 | – | 40,113,931 |
| Mortgage Backed | – | 30,735,502 | – | 30,735,502 |
| U.S. Government and Agency Obligations | – | 139,726,874 | – | 139,726,874 |
| Investment Companies | | | | |
| | 3,073,792 | 212,917,683 | – | 215,991,475 |
| High Income | | | | |
| Corporate Notes and Bonds | – | 116,247,969 | – | 116,247,969 |
| Investment Companies | | | | |
| | 7,599,938 | 116,247,969 | – | 123,847,907 |
| Diversified Income | | | | |
| Common Stocks | 46,939,119 | – | – | 46,939,119 |
| Asset Backed | – | 1,144,466 | – | 1,144,466 |
| Corporate Notes and Bonds | – | 18,232,900 | – | 18,232,900 |
| Mortgage Backed | – | 11,534,276 | – | 11,534,276 |
| U.S. Government and Agency Obligations | – | 10,482,767 | – | 10,482,767 |
| Investment Companies | | | | |
| | 49,046,613 | 41,394,409 | – | 90,441,022 |
| Equity Income | | | | |
| Assets: | | | | |
| Common Stocks | 28,879,970 | – | – | 28,879,970 |
| Repurchase Agreement | – | 6,078,112 | – | 6,078,112 |
| U.S. Government and Agency Oglibations | – | 501,231 | | 501,231 |
| Investment Companies | | | | |
| | 29,819,390 | 6,579,343 | – | 36,398,733 |
| Liabilities: | | | | |
| Options Written | 1,710,208 | – | – | 1,710,208 |
| Large Cap Value | | | | |
| Common Stocks | 150,119,533 | – | – | 150,119,533 |
| Investment Companies | | | | |
| | 152,716,487 | – | – | 152,716,487 |
| Large Cap Growth | | | | |
| Common Stocks | $146,163,340 | $ – | $ – | $146,163,340 |
| Investment Companies | | | | |
| | 154,585,815 | – | – | 154,585,815 |
MEMBERS Mutual Funds | October 31, 2010
Notes to Financial Statements
| Quoted Prices in Active Markets for Identical Investments (Level 1) | Significant Other Observable Inputs (Level 2) | Significant Unobservable Inputs (Level 3) | |
| Mid Cap | | | | |
| Common Stocks | 72,213,043 | – | – | 72,213,043 |
| Investment Companies | | | | |
| | 79,420,231 | – | – | 79,420,231 |
| Small Cap | | | | |
| Common Stocks | 31,273,559 | – | – | 31,273,559 |
| Investment Companies | | | | |
| | 32,089,022 | – | – | 32,089,022 |
| International Stock | | | | |
| Common Stocks | | | | |
| Australia | $ – | $ 816,191 | $ – | $ 816,191 |
| Belgium | – | 2,477,917 | – | 2,477,917 |
| Brazil | – | 3,043,858 | – | 3,043,858 |
| Canada | – | 1,782,138 | – | 1,782,138 |
| China | – | 1,669,180 | – | 1,669,180 |
| Denmark | – | 1,751,371 | – | 1,751,371 |
| France | – | 10,970,178 | – | 10,970,178 |
| Germany | – | 4,363,480 | – | 4,363,480 |
| Hong Kong | – | 2.116,821 | – | 2,116,821 |
| Ireland | – | 956,322 | – | 956,322 |
| Israel | – | 954,960 | – | 954,960 |
| Italy | – | 1,819,385 | – | 1,819,385 |
| Japan | – | 18,740,438 | – | 18,740,438 |
| Mexico | – | 763.300 | – | 763,300 |
| Netherland | – | 1,699,951 | – | 1,699,951 |
| Norway | – | 854,137 | – | 854,137 |
| Russia | – | 714,250 | – | 714,250 |
| Singapore | – | 932,276 | – | 932,276 |
| South Korea | – | 2,145,027 | – | 2,145,027 |
| Spain | – | 2,760,184 | – | 2,760,184 |
| Switzerland | – | 7,645,228 | – | 7,645,228 |
| Turkey | – | 1,047,480 | – | 1,047,480 |
| United Kingdom | – | 29,430,400 | – | 29,430,400 |
| Investment Companies | | | | |
| | 3,010,174 | 99,454,472 | – | 102,464,646 |
1 At October 31, 2010, all investments are Level 1, see respective Portfolio of Investments. 2 At October 31, 2010, all Level 2 securities held are Short Term Investments, see respective Portfolio of Investments. |
The Funds have adopted the Accounting Standard Update, Fair Value Measurements and Disclosures; Improving Disclosures about Fair Value Measurements which provides guidance on how investment assets and liabilities are to be valued and disclosed. Specifically, the amendment requires reporting entities to disclose i) the input and valuation techniques used to measure fair value for both recurring and nonrecurring fair value measurements, for Level 2 or Level 3 positions, ii) transfers between all levels (including Level 1 and Level 2) will be required to be disclosed on a gross basis (i.e. transfers out must be disclosed separately from transfers in) as well as the reason(s) for the transfer and iii) purchases, sales, issuances and settlements must be shown on a gross basis in the Leve l 3 rollforward rather than as one net number. The effective date of the amendment is for interim and annual
MEMBERS Mutual Funds | October 31, 2010
Notes to Financial Statements
periods beginning after December 15, 2009, however, the requirement to provide the Level 3 activity for purchases, sales, issuance and settlements on a gross basis will be effective for interim and annual period beginning after December 15, 2010. There were no transfers between classification levels during the period ended October 31. 2010.
Derivatives: In March 2008, the FASB issued guidance intended to enhance financial statement disclosures for derivative instruments and hedging activities and enable investors to understand: a) how and why a Fund uses derivative instruments, b) how derivative instruments and related hedge fund items are accounted for, and c) how derivative instruments and related hedge items affect a Fund’s financial position, results of operations and cash flows. This guidance is effective for financial statements issued for fiscal years and interim periods beginning after November 15, 2008. The funds adopted this guidance effective November 1, 2009 with the inception of the Equity Income Fund .
The following table presents the types of derivatives in the Equity Income Fund by location as presented on the Statement of Assets and Liabilities as of October 31, 2010:
Statement of Asset & Liability Presentation of Fair Values of Derivative Instruments |
| | | |
Derivatives not accounted for as hedging instruments | Statement of Assets and Liabilities Location | | Statement of Assets | |
| Equity contracts | – | -- | Options written | $1,710,208 |
The following table presents the effect of Derivative Instruments on the Statement of Operations for the period ended October 31, 2010:
Derivatives not accounted for as hedging instruments | Realized Gain on Derivatives: | Change in Unrealized Depreciation on Derivatives |
| Equity contracts | $1,975,026 | ($556,015) |
Management has determined that there is no impact on the financial statements of the other funds held in the Trust as they did not hold derivative financial instruments during the year ended October 31, 2010.
3. ADVISORY, ADMINISTRATION AND DISTRIBUTION AGREEMENTS
Advisory Agreement: For its investment advisory services to the Funds, the Investment Adviser is entitled to receive a fee, which is computed daily and paid monthly, at an annualized percentage rate of the average daily value of the net assets of each fund as follows: 0.20% for the Conservative, Moderate and Aggressive Allocation Funds (collectively, the "Target Allocation Funds") ; 0.40% for the Cash Reserves Fund; 0.50% for the Bond Fund; 0.55% for the High Income Fund; 0.65% for the Diversified Income Fund; 0.85% for the Equity Income Fund; 0.55% for the Large Cap Value Fund; 0.75% for the Large Cap Growth Fund; 0.75% for the Mid Cap Fund; 1.00% for the Small Cap Fund; and 1.05% for the International Stock Fund. Except for the Target Allocations Funds and the Equity Inc ome Fund, each Fund’s management fee will be reduced by 0.05% on assets exceeding $500 million, and by another 0.05% on assets exceeding $1 billion. The Investment Adviser is solely responsible for the payment of all fees to the Subadvisers. The Subadvisers for the funds at October 31, 2010, are Shenkman Capital Management, Inc. for the High Income Fund, Wellington Management Company, LLP for the Small Cap Fund, and Lazard Asset Management LLC for the International Stock Fund.
The Investment Adviser may from time to time voluntarily agree to waive a portion of its fees or expenses related to the funds. In that regard, the Investment Adviser waived a portion of management fees on the Cash Reserves Fund Class A Shares and Class B Shares for the purpose of maintaining a one-day yield of zero. The amount of the daily waiver is equal to the amount required to
MEMBERS Mutual Funds | October 31, 2010
Notes to Financial Statements
maintain a minimum daily distribution rate of zero. For the year ended October 31, 2010, the waivers totaled $52,020 for Class A Shares and $9,533 for Class B Shares and are reflected as reimbursement/waiver in the accompanying Statement of Operations. The Investment Adviser does not have the right to recoup these waived fees.
Services Agreement. The Investment Adviser provides or arranges for each Fund to have all of the necessary operational and support services it needs for a fee. These fees are computed daily and paid monthly, at an annualized percentage rate of the average daily value of the net assets of each Fund as follows: 0.25% for each of the Conservative, Moderate and Aggressive Allocation Funds; 0.15% for the Cash Reserves Fund; 0.15% for the Bond Fund; 0.20% for the High Income Fund; 0.20% for the Diversified Income Fund; 0.15% for the Equity Income Fund; 0.36% for the Large Cap Value Fund; 0.20% for the Large Cap Growth Fund; 0.40% for the Mid Cap Fund; 0.25% for the Small Cap Fund; and 0.30% for the International Stock Fund. While the Funds pay the expenses of the Funds’ In dependent Trustees and independent auditors directly (the "Direct Fees"), these expenses come out of the service fee so that they do not represent an additional expense to the Funds above and beyond the service fee.
The Investment Adviser may from time to time voluntarily agree to waive a portion of its fees or expenses related to the Funds. In that regard, the Investment Adviser waived a portion of service agreement fees on the Cash Reserves Fund Class A Shares and Class B Shares for the purpose of maintaining a one-day yield of zero. The amount of the daily waiver is equal to the amount required to maintain a minimum daily distribution rate of zero. For the year ended October 31, 2010, the waivers totaled $1,796 for Class A Shares and $342 for Class B Shares and are reflected as reimbursement/waiver in the accompanying Statement of Operations. The Investment Adviser does not have the right to recoup these waived fees.
Distribution Agreement. Mosaic Funds Distributor, LLC ("MFD") serves as distributor of the Funds. The Trust adopted distribution and/or service plans (the "Plans") with respect to the Trust’s Class A, B, and C shares pursuant to Rule 12b–1 under the 1940 Act. Under the Plans, the Trust will pay service fees to MFD for Class A, Class B, and Class C shares at an aggregate annual rate of 0.25% of each Fund’s daily net assets attributable to the respective class of shares for all funds except the Cash Reserves Fund. The Trust will also pay distribution fees to MFD for Class B and Class C shares at an aggregate annual rate of 0.75% of each Fund’s daily net assets attributable to their respective classes. The distribution fees are used to reimburse MFD fo r its distribution expenses with respect to Class B and Class C only, including but not limited to: (1) initial and ongoing sales compensation to selling brokers and others engaged in the sale of Fund shares, (2) marketing, promotional and overhead expenses incurred in connection with the distribution of Fund shares, and (3) interest expenses on unreimbursed distribution expenses. The service fees are used by MFD to compensate selling brokers and others for providing personal and account maintenance services to shareholders. Fees incurred by the Funds under the Plans are detailed in the statement of operations.
Front-end sales charges and contingent deferred sales charges ("CDSC") do not represent expenses of the Funds. Rather, they are deducted from the proceeds of sales of Fund shares prior to investment or from redemption proceeds prior to remittance, as applicable, and paid to MFD. MFD, in turn, uses a portion of these fees to pay financial advisors who sell Fund shares, as disclosed in the prospectus. The sales charges retained by MFD from the sales of shares (Class A shares) and the CDSC retained by MFD on the redemption of shares (Class A, B and C shares) for the period November 1, 2009 through October 31, 2010, were as follows:
| | | | | | | |
| Conservative Allocation | $230,054 | $15,927 | $3,310 | | Equity Income | $161,544 | NA |
| Moderate Allocation | 493,686 | 60,359 | 1,082 | | Large Cap Value | 42,165 | $10,398 |
| Aggressive Allocation | 205,910 | 12,391 | 31 | | Large Cap Growth | 40,638 | 11,496 |
| Cash Reserves | – | 17,454 | NA | | Mid Cap | 43,779 | 12,476 |
| Bond | 44,772 | 9,349 | NA | | Small Cap | 5,127 | 82 |
| High Income | 68,598 | 3,441 | NA | | International Stock | 37,045 | 5,863 |
| Diversified Income | 74,624 | 17,670 | NA | | | | |
MEMBERS Mutual Funds | October 31, 2010
Notes to Financial Statements
The distributor may from time to time voluntary agree to waive a portion of its fees or expenses related to the Funds. In that regard, the distributor waived a portion of 12b-1 fees on the Cash Reserves Fund Class B Shares for the purpose of maintaining a one-day yield of zero. The amount of the daily waiver is equal to the amount required to maintain a minimum daily distribution rate of zero. For the year ended October 31, 2010, the waivers totaled $17,998 and are reflected as reimbursement/waiver in the accompanying Statement of Operations. The distributor does not have the right to recoup these waived fees.
Officers and Trustees: Certain officers and trustees of the Funds are also officers of the Investment Adviser. The Funds do not compensate their officers or affiliated trustees. Unaffiliated trustees receive from the Trust an attendance fee for each Board or Committee meeting attended, with additional remuneration paid to the audit committee and nominating and governance committee chairs.
4. DIVIDENDS FROM NET INCOME AND DISTRIBUTIONS OF CAPITAL GAINS
With respect to dividends from net investment income, the Cash Reserves Fund declares dividends, if any, daily and reinvests monthly. The Bond Fund, High Income Fund and Diversified Income Fund declare and reinvest dividends, if any, monthly. The Conservative Allocation and Equity Income Funds declare and reinvest dividends, if any, quarterly. The Moderate Allocation, Aggressive Allocation, Large Cap Value Fund, Large Cap Growth Fund, Mid Cap Fund, Small Cap Fund, and the International Stock Fund declare and reinvest dividends, if any, annually. The Funds distribute net realized gains from investment transactions, if any, to shareholders annually.
Income and capital gain distributions, if any, are determined in accordance with federal income tax regulations, which may differ from accounting principles generally accepted in the United States of America. Taxable distributions from income and realized capital gains in the Funds differ from book amounts earned during the period due to differences in the timing of capital gains recognition, and due to the reclassification of certain gains or losses from capital to income. Dividends from net investment income are determined on a class level. Capital gains are determined on a fund level.
5. SECURITIES TRANSACTIONS
For the year ended October 31, 2010, aggregate cost of purchases and proceeds from sales of securities, other than short-term investments, were as follows:
| | U.S. Government Securities | Other Investment Securities |
| | | | |
| Conservative Allocation | $ – | $ – | $26,545,909 | $20,802,904 |
| Moderate Allocation | – | – | 61,788,669 | 52,422,968 |
| Aggressive Allocation | – | – | 74,067,810 | 20,698,188 |
| Bond | 27,044,392 | 9,521,094 | 4,692,108 | 3,605,207 |
| High Income | – | – | 55,439,684 | 52,241,803 |
| Diversified Income | 188,723 | 3,372,289 | 21,340,034 | 24,520,908 |
| Equity Income | – | – | 43,040,623 | 13,562,445 |
| Large Cap Value | – | – | 106,261,506 | 107,928,789 |
| Large Cap Growth | – | – | 114,428,806 | 143,376,895 |
| Mid Cap | – | – | 41,619,408 | 50,758,376 |
| Small Cap | – | – | 11,451,937 | 22,325,078 |
| International Stock | – | – | 52,879,934 | 107,232,383 |
MEMBERS Mutual Funds | October 31, 2010
Notes to Financial Statements
6. COVERED CALL OPTIONS
The Equity Income Fund will pursue its primary objective by employing an option strategy of writing (selling) covered call options on common stocks. The number of call options the fund can write (sell) is limited by the amount of equity securities the Fund holds in its portfolio. The Fund will not write (sell) "naked" or uncovered call options. The Fund seeks to produce a high level of current income and gains generated from option writing premiums and, to a lesser extent, from dividends. Covered call writing also helps to reduce the volatility (and risk profile) of the Fund by providing protection from declining stock prices.
Transactions in option contracts during the period ended October 31, 2010 were as follows:
| | | |
| Options outstanding, beginning of period | – | $ – |
| Options written during the period | 19,801 | 4,191,385 |
| Options expired during the period | (7,504) | (1,562,287) |
| Options closed during the period | (3,743) | (868,425) |
| Options assigned during the period | | |
| Options outstanding, end of period | | |
7. FOREIGN SECURITIES
Each Fund may invest in foreign securities, however, the Cash Reserves Fund is limited to U.S. dollar-denominated foreign money market securities. Foreign securities refer to securities that are: (1) issued by companies organized outside the U.S. or whose principal operations are outside the U.S., (2) issued by foreign governments or their agencies or instrumentalities, (3) principally traded outside the U.S., or (4) quoted or denominated in a foreign currency. Foreign securities include American Depositary Receipts ("ADRs"), European Depositary Receipts ("EDRs"), Global Depositary Receipts ("GDRs"), Swedish Depositary Receipts ("SDRs") and foreign money market securities. Dollar-denominated securities that are part of the Merrill Lynch U.S. Domestic Master Index are not considered a foreign security.
Certain of the Funds have reclaim receivable balances, in which the Funds are due a reclaim on the taxes that have been paid to some foreign jurisdictions. The values of all reclaims are not significant for any of the Funds and are reflected in Other Assets on the Statement of Assets and Liabilities. On a periodic basis, these receivables are reviewed to ensure the current receivable balance is reflective of the amount deemed to be collectible.
8. SECURITIES LENDING
Each Fund, except the Target Allocation Funds, Cash Reserves, Small Cap and Equity Income Funds, entered into a Securities Lending Agreement (the "Agreement") with State Street Bank and Trust Company ("State Street"). Under the terms of the Agreement, such Funds may lend portfolio securities to qualified borrowers in order to earn additional income. The Agreement requires that loans are collateralized at all times by cash or other liquid assets at least equal to 102% of the value of the securities, which is determined on a daily basis. At October 31, 2010, none of the Funds had securities out on loan.
Amounts earned as interest on investments of cash collateral, net of rebates and fees, if any, are included in the Statement of Operations.
The primary risk associated with securities lending is if the borrower defaults on its obligation to return the securities loaned because of insolvency or other reasons, the Funds could experience delays and costs in recovering securities loaned or in gaining access to the collateral.
MEMBERS Mutual Funds | October 31, 2010
Notes to Financial Statements
9. TAX INFORMATION
The tax character of distributions paid during the years ended October 31, 2010 and 2009 was as follows:
| | | |
| | | | |
| Conservative Allocation | $1,173,419 | $1,276,875 | $ – | $ – |
| Moderate Allocation | 1,374,464 | 1,225,930 | – | – |
| Aggressive Allocation | 272,700 | 76,578 | – | – |
| Cash Reserves | – | 12,941 | – | – |
| Bond | 5,405,293 | 5,760,220 | – | – |
| High Income | 8,805,665 | 6,913,718 | – | – |
| Diversified Income | 2,640,412 | 3,665,946 | – | – |
| Equity Income | 1,370,365 | – | – | N/A |
| Large Cap Value | 2,122,321 | 2,814,901 | – | – |
| Large Cap Growth | 665,503 | 336,551 | – | – |
| Mid Cap | – | 353,103 | – | – |
| Small Cap | 81,571 | 131,772 | – | – |
| International Stock | 2,823,711 | 2,316,059 | – | 2,827,690 |
As of October 31, 2010, the components of distributable earnings on a tax basis were as follows:
| |
| Conservative Allocation | $ – |
| Moderate Allocation | 1,042,512 |
| Aggressive Allocation | 151,318 |
| Cash Reserves | – |
| Bond | 85,382 |
| High Income | 230,647 |
| Diversified Income | 8,931 |
| Equity Income | 1,334,733 |
| Large Cap Value | 1,560,083 |
| Large Cap Growth | 359,530 |
| Mid Cap | – |
| Small Cap | 28,684 |
| International Stock | 1,490,030 |
There were no undistributed long-term capital gains.
For federal income tax purposes, the funds listed below have capital loss carryovers as of October 31, 2010, which are available to offset future capital gains, if any, through the year indicated:
| | | | | | | | |
| Conservative Allocation | $ – | $ – | $ – | $ – | $ – | $ 656,100 | $ 1,619,779 | $ – |
| Moderate Allocation | – | – | – | – | – | 4,121,648 | 6,462,247 | 3,257,526 |
| Aggressive Allocation | – | – | – | – | – | 1,431,110 | 2,049,055 | 2,346,155 |
| Cash Reserves | – | – | – | – | – | – | – | 10 |
| Bond | – | 66,319 | 65,261 | 362,802 | 57,909 | – | 836,574 | – |
| High Income | – | – | – | – | | 4,147,511 | 2,183,308 | – |
| Diversified Income | – | – | – | – | – | 83,974 | 14,441,031 | – |
| Large Cap Value | – | – | – | – | – | 8,631,972 | 20,011,738 | – |
| Large Cap Growth | – | – | – | – | – | 3,055,287 | 18,608,339 | – |
| Mid Cap | – | – | – | – | – | 8,217,755 | 16,406,364 | – |
| Small Cap | – | – | – | – | – | 4,239,545 | 1,697,646 | – |
| International Stock | – | – | – | – | – | – | 22,902,552 | 1,381,274 |
MEMBERS Mutual Funds | October 31, 2010
Notes to Financial Statements
Included in the net capital loss carryovers for the Mid Cap Fund and Small Cap Fund are $7,468,164 and $4,055,364, respectively, of capital loss carryovers subject to certain limitations upon availability to offset future gains, if any, as the successor of a merger. Additionally, the Mid Cap Fund forfeited $3,276,037 of capital loss carryovers acquired from the Mid Cap Value Fund, and the Small Cap Fund forfeited $5,547,405 of capital loss carryovers acquired from the Small Cap Growth Fund due to the change-of-ownership rules in the tax law.
As of October 31, 2010, capital losses utilized for each Fund were as follows:
| |
| Conservative Allocation | $ 167,787 |
| Bond | 19,304 |
| High Income | 3,638,497 |
| Diversified Income | 3,554,273 |
| Large Cap Value | 899,717 |
| Large Cap Growth | 13,486,290 |
| Mid Cap | 5,747,466 |
| Small Cap | 1,804,465 |
At October 31, 2010, the aggregate gross unrealized appreciation (depreciation) and net unrealized appreciation (depreciation) for all securities excluding option contracts as computed on a federal income tax basis for each Fund were as follows:
| | | |
| Conservative Allocation | $ 1,368,289 | $ – | $ 1,368,289 |
| Moderate Allocation | 3,477,505 | 704,833 | 2,772,672 |
| Aggressive Allocation | 1,216,149 | 189,472 | 1,026,677 |
| Bond | 14,421,452 | 625,193 | 13,796,259 |
| High Income | 10,013,545 | 32,459 | 9,981,086 |
| Diversified Income | 9,021,866 | 2,327,464 | 6,694,402 |
| Equity Income | 1,532,302 | 1,461,983 | 70,319 |
| Large Cap Value | 11,686,708 | 5,498,964 | 6,187,744 |
| Large Cap Growth | 20,716,117 | 738,377 | 19,977,740 |
| Mid Cap | 10,750,873 | 549,668 | 10,201,205 |
| Small Cap | 5,663,575 | 882,941 | 4,780,634 |
| International Stock | 16,610,753 | 1,202,569 | 15,408,184 |
The differences between cost amounts for book purposes and tax purposes are primarily due to the tax deferral of losses.
10. CONCENTRATION OF RISK
Investing in certain financial instruments, including forward foreign currency contracts and futures contracts, involves certain risks, other than that reflected in the Statements of Assets and Liabilities. Risks associated with these instruments include potential for an illiquid secondary market for the instruments or inability of counterparties to perform under the terms of the contracts, changes in the value of foreign currency relative to the U.S. dollar and financial statement volatility resulting from an imperfect correlation between the movements in the prices of the instruments and the prices of the underlying securities and interest rates being hedged. The High Income Fund, Mid Cap Fund, and International Stock Fund enter into these contracts primarily to protect these Funds from adverse currency movements.
Investing in foreign securities involves certain risks not necessarily found in U.S. markets. These include risks associated with adverse changes in economic, political, regulatory and other conditions, changes in currency exchange rates, exchange control regulations, expropriation of assets or nationalization, imposition of withholding taxes on dividend or interest payments or capital
MEMBERS Mutual Funds | October 31, 2010
Notes to Financial Statements
gains, and possible difficulty in obtaining and enforcing judgments against foreign entities. Further, issuers of foreign securities are subject to different, and often less comprehensive, accounting, reporting and disclosure requirements than domestic issuers.
The High Income Fund invests in securities offering high current income which generally will include bonds in the below investment grade categories of recognized rating agencies (so-called "junk bonds"). These securities generally involve more credit risk than securities in the higher rating categories. In addition, the trading market for high yield securities may be relatively less liquid than the market for higher-rated securities. The Fund generally invests at least 80% of its assets in high yield securities.
The Equity Income Fund invests in options on securities. As the writer of a covered call option, the Fund forgoes, during the option’s life, the opportunity to profit from increases in the market value of the security covering the call option above the sum of the premium and the strike price of the call but has retained the risk of loss should the price of the underlying security decline. The writer of an option has no control over the time when it may be required to fulfill its obligation as writer of the option. Once an option writer has received an exercise notice, it cannot effect a closing purchase transaction in order to terminate its obligation under the option and must deliver the underlying security at the exercise price.
Each Target Allocation Fund is structured as a Fund of funds, meaning that they invest primarily in the shares of other registered investment companies (the "underlying funds"), including ETFs. Thus, each Fund’s investment performance and its ability to achieve its investment goal are directly related to the performance of the underlying funds in which it invests; and the underlying fund’s performance, in turn, depends on the particular securities in which that underlying fund invests and the expenses of that fund. Accordingly, the Target Allocation Funds are subject to the risks of the underlying funds in direct proportion to the allocation of their respective assets among the underlying funds.
Additionally, the Target Allocation Funds are subject to asset allocation risk and manager risk. Manager risk (i.e., fund selection risk) is the risk that the fund(s) selected to fulfill a particular asset class under performs their peer. Asset allocation risk is the risk that the allocation of the fund’s assets among the various asset classes and market segments will cause the fund to under perform other funds with a similar investment objective.
11. CAPITAL SHARES AND AFFILIATED OWNERSHIP
The Target Allocation Funds invest in underlying funds, of which certain underlying funds may be deemed to be under common control because of the same or affiliated investment adviser and membership in a common family of investment companies (the "affiliated underlying funds’’). A summary of the transactions with each affiliated underlying fund during the year ended October 31, 2010 follows:
| Balance of Shares Held at 10/31/2009 | | | Balance of Shares Held at 10/31/2010 | | | |
| Conservative Allocation Fund | | | | | | | |
| Madison Mosaic Disciplined Equity Fund | – | 238,497 | – | 238,497 | $2,904,899 | $ – | $ – |
| Madison Mosaic Institutional Bond Fund | – | 350,948 | – | 350,948 | 3,909,564 | – | 50,488 |
| MEMBERS Bond Fund Class Y | 934,413 | 39,193 | 138,486 | 835,120 | 8,735,354 | 60,981 | 251,984 |
| MEMBERS High Income Fund Class Y | 709,172 | 79,785 | 19,006 | 769,951 | 5,458,955 | (5,313) | 387,770 |
| MEMBERS International Stock Fund Class Y | 323,539 | 26,180 | 128,767 | 220,952 | 2,339,881 | (314,619) | 59,975 |
| MEMBERS Equity Income Fund, Class Y | – | 123,789 | 557 | 123,232 | 1,268,061 | (37) | 49,293 |
| MEMBERS Large Cap Growth Fund Class Y | 264,567 | 17,241 | 68,835 | 212,973 | 3,258,492 | (130,985) | 17,580 |
| MEMBERS Large Cap Value Fund Class Y | 261,669 | 47,175 | 45,608 | 263,236 | 3,006,157 | (192,103) | 46,246 |
| Totals | | | | | | | |
1 Distributions received include distributions from net investment income and from capital gains from the underlying funds. |
MEMBERS Mutual Funds | October 31, 2010
Notes to Financial Statements
| Balance of Shares Held at 10/31/2009 | | | Balance of Shares Held at 10/31/2010 | | | |
| Moderate Allocation Fund | | | | | | | |
| Madison Mosaic Institutional Bond Fund | – | 441,727 | – | 441,727 | $4,920,838 | $ – | $63,547 |
| MEMBERS Bond Fund Class Y | 1,304,545 | 29,612 | 253,945 | 1,080,212 | 11,299,016 | 127,323 | 342,684 |
| MEMBERS High Income Fund Class Y | 1,236,623 | 86,709 | 5,394 | 1,317,938 | 9,344,182 | (4,667) | 668,782 |
| MEMBERS International Stock Fund Class Y | 1,399,914 | 29,959 | 692,247 | 737,626 | 7,811,463 | (2,017,908) | 217,652 |
| Madison Mosaic Disciplined Equity Fund | – | 781,020 | – | 781,020 | 9,512,823 | – | 5,379 |
| MEMBERS Equity Income Fund Class Y | – | 352,642 | 1,093 | 351,549 | 3,617,443 | (20) | 140,620 |
| MEMBERS Large Cap Growth Fund Class Y | 855,788 | 72,925 | 215,380 | 713,333 | 10,914,002 | (411,553) | 49,798 |
| MEMBERS Large Cap Value Fund Class Y | 746,352 | 146,423 | 31,793 | 860,982 | 9,832,420 | (162,787) | 129,583 |
| MEMBERS Mid Cap Fund Class Y | 500,218 | 86,285 | 1,925 | 584,578 | 3,513,317 | (4,311) | – |
| MEMBERS Small Cap Fund Class Y | 302,264 | 227,093 | 161,032 | 368,325 | 3,650,102 | (262,304) | 9,756 |
| Totals | | | | | | | |
| | | | | | | | |
| Aggressive Allocation Fund | | | | | | | |
| MEMBERS Bond Fund Class Y | 95,067 | 35,743 | 96,175 | 34,635 | $362,279 | $ 57,355 | $ 24,022 |
| MEMBERS High Income Fund Class Y | 276,834 | 37,265 | 1,898 | 312,201 | 2,213,506 | (11) | 156,628 |
| MEMBERS International Stock Fund Class Y | 573,860 | 27,354 | 232,600 | 368,614 | 3,903,622 | (941,227) | 111,844 |
| Madison Mosaic Disciplined Equity Fund | – | 417,743 | – | 417,743 | 5,088,105 | – | 3,673 |
| MEMBERS Equity Income Fund Class Y | – | 121,327 | 163 | 121,164 | 1,246,773 | 3 | 48,465 |
| MEMBERS Large Cap Growth Fund Class Y | 361,678 | 21,366 | 98,350 | 284,694 | 4,355,811 | (205,354) | 20,911 |
| MEMBERS Large Cap Value Fund Class Y | 321,461 | 58,418 | 20,299 | 359,580 | 4,106,398 | (104,558) | 57,500 |
| MEMBERS Mid Cap Fund Class Y | 357,423 | 48,464 | 3,365 | 402,522 | 2,419,158 | (7,250) | – |
| MEMBERS Small Cap Fund Class Y | 169,339 | 139,585 | 120,028 | 188,896 | 1,871,962 | (158,913) | 5,541 |
| Totals | | | | | | | |
1 Distributions received include distributions from net investment income and from capital gains from the underlying funds. |
12. Merger Related Capital Stock Transactions
Effective November 30, 2009, the Small Cap Growth Fund was merged into the Small Cap Value Fund with the surviving Fund changing its name on that date to the Small Cap Fund. Also, effective March 1, 2010, the Mid Cap Value Fund was merged into the Mid Cap Growth Fund with the surviving Fund changing its name on that date to the Mid Cap Fund. A summary of the shares issued to the shareholders of the merged Fund and value of those shares by Class is summarized below:
| | |
| A | 37,176 | $ 197,309 |
| B | 8,903 | $ 71,190 |
| Y | 1,821,068 | $14,203,621 |
| | | |
| | |
| A | 4,442.642 | $22,032,199 |
| B | 1,097,226 | $ 5,617,588 |
| Y | 168,846 | $ 3,043,093 |
The amounts above are included in the Shares Sold on the Statement of Changes in Net Assets for each respective Fund.
MEMBERS Mutual Funds | October 31, 2010
Notes to Financial Statements
13. Subsequent Events
The Trust is aware of litigation relating to attempts by certain fixed income security-holders of Lyondell Chemical Company (LYO) to retrieve proceeds from the sale by equity security-holders of LYO shares occurring pursuant to its acquisition by merger in December 2007. The Midcap Fund received proceeds of approximately $389,000 from the sale of its LYO equity securities in December 2007. The Trust has not been named as a defendant in this litigation as of the date of this report.
On November 30, 2010, the parent company of Madison Asset Management, LLC changed its name from Madison Investment Advisors, Inc. to Madison Investment Holdings, Inc.
Management has evaluated the effects of all subsequent events that provide additional evidence about conditions that existed at the date of the Statement of Assets and Liabilities. There were no additional events or transactions that impacted the amounts or disclosures in the Funds’ financial statements.
MEMBERS Mutual Funds | October 31, 2010
Report of Independent Registered Public Accounting Firm
To the Shareholders and Board of Trustees of MEMBERS Mutual Funds:
We have audited the accompanying statements of assets and liabilities, including the portfolios of investments, of MEMBERS Mutual Funds, comprising Conservative Allocation Fund, Moderate Allocation Fund, Aggressive Allocation Fund, Cash Reserves Fund, Bond Fund, High Income Fund, Diversified Income Fund, Equity Income Fund, Large Cap Value Fund, Large Cap Growth Fund, Mid Cap Fund, Small Cap Fund, and International Stock Fund (collectively, the "Funds") as of October 31, 2010, and the related statements of operations for the year then ended, and the statements of changes in net assets and the financial highlights for each of the periods presented. These financial statements and financial highlights are the responsibility of the Funds’ management. Our responsibility is to express an opinion on these financial statements and financial highlights based on our audits.
We conducted our audits in accordance with the standards of the Public Company Accounting Oversight Board (United States). Those standards require that we plan and perform the audit to obtain reasonable assurance about whether the financial statements and financial highlights are free of material misstatement. The Funds are not required to have, nor were we engaged to perform, an audit of their internal control over financial reporting. Our audits included consideration of internal control over financial reporting as a basis for designing audit procedures that are appropriate in the circumstances, but not for the purpose of expressing an opinion on the effectiveness of the Funds’ internal control over financial reporting. Accordingly, we express no such opinion. An audit also includes examining, on a test basis, evidence supporting the amounts and disclosures in the financial statements, assessing the accounting principles used and significant estimates made by management, as well as evaluating the overall financial statement presentation. Our procedures included confirmation of securities owned as of October 31, 2010, by correspondence with the custodian and brokers; where replies were not received from brokers, we performed other auditing procedures. We believe that our audits provide a reasonable basis for our opinion.
In our opinion, the financial statements and financial highlights referred to above present fairly, in all material respects, the financial position of each of the Funds as of October 31, 2010, the results of their operations for the year then ended, and the changes in their net assets and the financial highlights for each of the periods presented, in conformity with accounting principles generally accepted in the United States of America.
(signature)
DELOITTE & TOUCHE LLP
Milwaukee, WI
December 20, 2010
MEMBERS Mutual Funds | October 31, 2010
Other Information
BOARD APPROVAL OF ADVISORY AND SUBADVISORY CONTRACTS
The Board reviewed a variety of matters in connection with the Trust’s investment advisory contract with the Adviser and the three subadvisers.
With regard to the nature, extent and quality of the services to be provided by the Adviser and each subadviser, the Board reviewed the biographies and tenure of the personnel involved in Trust management and the experience of the Adviser (and applicable subadviser) and its affiliates as investment manager to other investment companies with similar investment strategies or to individual clients or institutions with similar investment strategies. They recognized the wide array of investment professionals employed by the firm. Representatives of the Adviser and each subadviser discussed the firm’s ongoing investment philosophies and strategies intended to provide superior performance consistent with each Trust portfolio’s investment objectives under various market scenarios. The Trustees also noted their familiarity with the Adviser and its affiliates due to the Advisers’ history of providing advisory services to the Madison Mosaic organization as well as the MEMBERS Mutual Funds, Ultra Series Fund and the Madison Strategic Sector Premium Fund. Likewise, they noted their familiarity with each subadviser that had been managing their respective funds for a number of years. The Board also discussed the quality of services provided to the Trusts by its transfer agent, fund administrator and custodian as well as the various administrative services provided directly by the Adviser. Such services included arranging for third party service providers to provide all necessary administration as well as supervising the subadvisers to any Trust portfolios. With regard to the investment performance of the Trusts and the investment adviser, the Board reviewed current performance information provided in the written Board materials. They discussed the reaso ns for both outperformance and underperformance compared with peer groups and applicable indices and benchmarks. The Board performed this review in connection with the Adviser and each subadviser that manages a subadvised fund portfolio. A comprehensive discussion of fund performance and market conditions followed.
Representatives of the Adviser and each subadviser discussed with the Board the methodology for arriving at peer groups and indices used for performance comparisons.
With regard to the costs of the services to be provided and the profits to be realized by the investment adviser and its affiliates from the relationship with the Trusts, the Board reviewed the expense ratios for a variety of other funds in each Trust portfolio’s peer group with similar investment objectives. Again, the board reviewed these matters in connection with the Adviser and each subadviser that manages a subadvised Fund portfolio.
The Board noted that the Adviser or its affiliates, and, as applicable, each subaviser, provided investment management services to other investment company and/or non-investment company clients and considered the fees charged by the Adviser (and respective subadviser) to such funds and clients for purposes of determining whether the given advisory fee was disproportionately large under the so-called "Gartenberg" standard traditionally used by investment company boards in connection with contract renewal considerations. The Board took those fees into account and considered the differences in services and time required by the various types of funds and clients to which the Adviser (or subadviser, if applicable) provided services. The Board recognized that significant differences may exist between the services provided to one type of fund or client and those provided to others, such as those resulting from a greater frequency of shareholder redemptions in a mutual fund and the higher turnover of mutual fund assets. The Board gave such comparisons the weight that they merit in light of the similarities and differences between the services that the various Funds require and were wary of "inapt comparisons." They considered that, if the services rendered by the Adviser (or subadviser, if applicable) to one type of fund or client differ significantly from others, then the comparison should not be used. In the case of non-investment company clients for which the Adviser (or subadviser, if applicable) may act as either investment adviser or subadviser, the Board noted that the fee is lower than the fee charged to the Trust. The Board noted too the various administrative, operational, compliance, legal and corporate communication services
MEMBERS Mutual Funds | October 31, 2010
Other Information
required to be handled by the Adviser (or subadviser, if applicable) which are performed for investment company clients but are not performed for other institutional clients.
The Trustees reviewed each Fund’s fee structure based on total fund expense ratio as well as by comparing advisory fees to other advisory fees. The Board noted the simple expense structure maintained by the Trust (i.e. an advisory fee and a capped administrative "services" expense). The Board paid particular attention to the total expense ratios paid by other funds with similar investment objectives, recognizing that such a comparison, while not completely dispositive, was nevertheless an important consideration.
The Trustees sought to ensure that fees paid by the Trust were appropriate. The Board reviewed materials demonstrating that although the Adviser is compensated for a variety of the administrative services it provides or arranges to provide to the Trust pursuant to its Services Agreement with the Trust, such compensation does not always cover all costs due to the cap on administrative expenses. Administrative, operational, regulatory and compliance fees and costs in excess of the Services Agreement fees are paid by the Adviser from investment advisory fees earned. In this regard, the Trustees noted that examination of each Trust portfolio’s total expense ratio compared to those of other investment companies was more meaningful than a simple comparison of basic "investment management only" fee schedules. The Board noted that to the ex tent a Trust portfolio invests in other mutual funds also managed by the Adviser (or its affiliates), the Adviser (or an affiliate) receives investment advisory fees from both the Trust portfolio and the underlying mutual fund. The Board was satisfied in this regard that the Advisor (or an affiliate) provides separate services to the Trust’s "Fund of funds" portfolios and the underlying mutual funds in which each such Fund invests in exchange for the fees received from them.
With regard to the extent to which economies of scale would be realized as each Trust portfolio grows, the Trustees recognized that at their current sizes, it was premature to discuss any economies of scale not already factored into existing advisory and services agreements.
Counsel to the Trust’s non-interested Trustees met previously and reviewed the written contract renewal materials provided by the Adviser. He noted that the Independent Trustees had considered such materials in light of the aforementioned Gartenberg standards as well as criteria either set forth or discussed in the recent Supreme Court decision in Jones v. Harris regarding the investment company contract renewal process under Section 15(c) of the Investment Company Act of 1940, as amended. The Independent Trustees made a variety of additional inquiries regarding such written materials to the Adviser and the subadvisers and representatives of the Adviser and subadvisers, respectively, discussed each matter raised.
After further discussion and analysis and reviewing the totality of the information presented, including the information set forth above and the other information considered by the Board of Trustees, the Trustees concluded that the Trust’s advisory fees (including applicable subadvisry fees) are fair and reasonable for each respective portfolio and that renewal of their respective Advisory, Subadvisory and Services Agreements are in the best interests of each respective Trust portfolio and its shareholders.
FUND EXPENSES PAID BY SHAREHOLDERS
As a shareholder of the Funds, you incur two types of costs: (1) transaction costs, including sales charges (loads) on purchase payments, and redemption fees; and (2) ongoing costs, including management fees; distribution and/or service (12b–1) fees; and other fund expenses. The examples below are intended to help you understand your ongoing costs (in dollars) of investing in the Funds and to compare these costs with the ongoing costs of investing in other mutual funds.
The examples below are based on an investment of $1,000 invested at the beginning of the period and held for the entire six-month period ended October 31, 2010. Expenses paid during the period in the tables below are equal to the Fund’s annualized
MEMBERS Mutual Funds | October 31, 2010
Other Information
expense ratio, multiplied by the average account value over the period, multiplied by 184/365 (to reflect the one-half fiscal year period).
Actual Expenses
The table below provides information about actual account values using actual expenses and actual returns for the Funds. You may use the information in this table, together with the amount you invested, to estimate the expenses that you paid over the period. Simply divide your account value by $1,000 (for example, an $8,600 account value divided by $1,000 = 8.6), then multiply the result by the number in the table for the Fund you own under the heading entitled "Expenses Paid During Period" to estimate the expenses you paid on your account during this period.
| | | | |
| | | | | | | | |
| Conservative Allocation | $1,000 | $1,042.00 | .70% | $3.60 | | $1,039.10 | 1.45% | $7.45 |
| Moderate Allocation | 1,000 | 1,027.70 | .70% | 3.58 | | 1,024.60 | 1.45% | 7.40 |
| Aggressive Allocation | 1,000 | 1,015.70 | .70% | 3.56 | | 1,012.40 | 1.45% | 7.35 |
| Cash Reserves | 1,000 | 1,000.00 | .15% | 0.76 | | 1,000.00 | .15% | .76 |
| Bond | 1,000 | 1,044.70 | .90% | 4.64 | | 1,040.80 | 1.65% | 8.49 |
| High Income | 1,000 | 1,063.10 | 1.00% | 5.20 | | 1,059.90 | 1.75% | 9.09 |
| Diversified Income | 1,000 | 1,048.30 | 1.10% | 5.68 | | 1,044.20 | 1.85% | 9.53 |
| Equity Income | 1,000 | 1,022.25 | 1.25% | 6.05 | | NA | NA | NA |
| Large Cap Value | 1,000 | 968.60 | 1.16% | 5.76 | | 964.70 | 1.91% | 9.46 |
| Large Cap Growth | 1,000 | 1,022.20 | 1.20% | 6.12 | | 1,018.20 | 1.95% | 9.92 |
| Mid Cap Value | 1,000 | 1,020.60 | 1.40% | 7.13 | | 1,018.60 | 2.15% | 10.94 |
| Small Cap | 1,000 | 970.70 | 1.50% | 7.45 | | 966.40 | 2.25% | 11.15 |
| International Stock | 1,000 | 1,058.00 | 1.60% | 8.30 | | 1,053.80 | 2.35% | 12.17 |
| | |
| | | | Expenses Paid During Period |
| Conservative Allocation | $1,000 | $1,039.10 | 1.45% | $7.49 |
| Moderate Allocation | 1,000 | 1,024.60 | 1.45% | 7.40 |
| Aggressive Allocation | 1,000 | 1,012.40 | 1.45% | 7.35 |
| | |
| | | | Expenses Paid During Period |
| Bond | $1,000 | $1,047.00 | 0.65% | $3.35 |
| High Income | 1,000 | 1,066.10 | 0.75% | 3.91 |
| Equity Income | 1,000 | 1,023.18 | 1.00% | 4.83 |
| Large Cap Value | 1,000 | 970.30 | 0.91% | 4.52 |
| Large Cap Growth | 1,000 | 1,023.40 | 0.95% | 4.85 |
| Mid Cap | 1,000 | 1,022.10 | 1.15% | 5.86 |
| Small Cap | 1,000 | 971.60 | 1.25% | 6.21 |
| International Stock | 1,000 | 1,059.00 | 1.35% | 7.01 |
MEMBERS Mutual Funds | October 31, 2010
Other Information
Hypothetical Example for Comparison Purposes
The table below provides information about hypothetical account values and hypothetical expenses based on the Funds’ actual expense ratios and an assumed rate of return of 5% per year before expenses, which are not the Funds’ actual returns. The hypothetical account values and expenses may not be used to estimate the actual ending account balance or expenses you paid for the period. You may use this information to compare the ongoing costs of investing in the Funds and other funds. To do so, compare the 5% hypothetical example of the funds you own with the 5% hypothetical examples that appear in the shareholder reports of other similar funds.
| | | | |
| | | | | | | | |
| Conservative Allocation | $1,000 | $1,043.00 | .70% | $3.60 | | $1,035.50 | 1.45% | $ 7.44 |
| Moderate Allocation | 1,000 | 1,043.00 | .70% | 3.60 | | 1,035.50 | 1.45% | 7.44 |
| Aggressive Allocation | 1,000 | 1,043.00 | .70% | 3.60 | | 1,035.50 | 1.45% | 7.44 |
| Cash Reserves | 1,000 | 1,048.50 | .15% | 0.77 | | 1,062.10 | 0.15% | 0.77 |
| Bond | 1,000 | 1,041.00 | .90% | 4.63 | | 1,033.50 | 1.65% | 8.46 |
| High Income | 1,000 | 1,040.00 | 1.00% | 5.14 | | 1,032.50 | 1.75% | 8.97 |
| Diversified Income | 1,000 | 1,038.90 | 1.10% | 5.65 | | 1,031.50 | 1.85% | 9.47 |
| Equity Income | 1,000 | 1,025.47 | 1.25% | 6.38 | | NA | NA | NA |
| Large Cap Value | 1,000 | 1,038.40 | 1.16% | 5.96 | | 1,030.90 | 1.91% | 9.78 |
| Large Cap Growth | 1,000 | 1,038.00 | 1.20% | 6.16 | | 1,030.50 | 1.95% | 9.98 |
| Mid Cap | 1,000 | 1,036.00 | 1.40% | 7.18 | | 1,028.50 | 2.15% | 10.99 |
| Small Cap | 1,000 | 1,035.00 | 1.50% | 7.69 | | 1,027.50 | 2.25% | 11.50 |
| International Stock | 1,000 | 1,034.00 | 1.60% | 8.20 | | 1,026.50 | 2.35% | 12.00 |
| | |
| | | | Expenses Paid During Period |
| Conservative Allocation | $1,000 | $1,035.50 | 1.45% | $7.44 |
| Moderate Allocation | 1,000 | 1,035.50 | 1.45% | 7.44 |
| Aggressive Allocation | 1,000 | 1,035.50 | 1.45% | 7.44 |
| | |
| | | | Expenses Paid During Period |
| Bond | $1,000 | $1,043.50 | 0.65% | $3.35 |
| High Income | 1,000 | 1,042.50 | 0.75% | 3.86 |
| Equity Income | 1,000 | 1,023.18 | 1.00% | 5.09 |
| Large Cap Value | 1,000 | 1,040.89 | 0.91% | 4.69 |
| Large Cap Growth | 1,000 | 1,040.50 | 0.95% | 4.89 |
| Mid Cap | 1,000 | 1,038.50 | 1.15% | 5.91 |
| Small Cap | 1,000 | 1,037.50 | 1.25% | 6.42 |
| International Stock | 1,000 | 1,036.50 | 1.35% | 6.93 |
Please note that the expenses shown in both tables are meant to highlight your ongoing costs only and do not reflect any transactional costs, such as sales charges (loads), or redemption fees. The information provided in the hypothetical example table
MEMBERS Mutual Funds | October 31, 2010
Other Information
is useful in comparing ongoing costs only, and will not help you determine the relative total costs of owning different funds. In addition, if these transactional costs were included, your costs would have been higher.
AVAILABILITY OF QUARTERLY PORTFOLIO SCHEDULES
The Funds file their complete schedule of portfolio holdings with the SEC for the first and third quarters of each fiscal year on Form N–Q. Form N–Q is available to shareholders at no cost by calling 1-800-877-6089 or on the SEC’s website at www.sec.gov. Form N–Q may also be reviewed and copied at the SEC’s Public Reference Room in Washington, DC. More information on the operation of the Public Reference Room may be obtained by calling 1-800-SEC-0330.
PROXY VOTING POLICIES, PROCEDURES AND RECORDS
A description of the policies and procedures used by the Funds to vote proxies related to portfolio securities is available to shareholders at no cost on the Funds’ website at www.membersfunds.com or by calling 1-800-877-6089. The proxy voting records for the Funds for the most recent twelve-month period ended June 30 are available to shareholders at no cost on the SEC’s website at www.sec.gov.
FORWARD-LOOKING STATEMENT DISCLOSURE
One of our most important responsibilities as investment company managers is to communicate with shareholders in an open and direct manner. Some of our comments in our letters to shareholders are based on current management expectations and are considered "forward-looking statements." Actual future results, however, may prove to be different from our expectations. You can identify forward-looking statements by words such as "estimate," "may," "will," "expect," "believe," "plan" an d other similar terms. We cannot promise future returns. Our opinions are a reflection of our best judgment at the time this report is compiled, and we disclaim any obligation to update or alter forward-looking statements as a result of new information, future events, or otherwise.
TAX INFORMATION
Foreign Tax Credits: The International Stock Fund expects to make an election under Internal Revenue Code Section 853 to pass through foreign taxes paid by the Fund to its shareholders. For the year ended October 31, 2010, the total amount of foreign taxes that is expected to pass through to shareholders and foreign source income for information reporting purposes will be $245,692 (all of which represents taxes withheld) and $3,170,712, respectively. Complete information regarding the Fund’s foreign tax credit pass through to shareholders for 2010 will be reported in conjunction with Form 1099-DIV.
Corporate Dividends Received Deduction: Of the dividends paid by the Conservative Allocation, Moderate Allocation, Aggressive Allocation, Diversified Income, Large Cap Value, Large Cap Growth and Small Cap Funds, 10.77%, 21.71%, 54.35%, 56.54%, 100%, 100%, and 100%, respectively, qualify for the corporate dividends received deduction.
Qualified Dividend Income: For the fiscal year ended October 31, 2010, The Conservative Allocation, Moderate Allocation, Aggressive Allocation, Diversified Income, Large Cap Value, Large Cap Growth, Small Cap and the International Stock Funds paid dividend income totaling $1,173,419, $1,374,464, $272,700, $1,579,604, $2,122,321, $665,503, $81,571, and $2,755,382 respectively. The Funds hereby designate the maximum amount of dividends allowable pursuant to the Internal Revenue Code, as qualified dividend income ("QDI") eligible for reduced tax rates (the rates range from 5% to 15% depending upon individual’s tax bracket).Complete information regarding each Fund’s income distributions paid du ring the calendar year 2009, including the portion, if any, which qualify as QDI, will be reported in conjunction with Form 1099-DIV.
MEMBERS Mutual Funds | October 31, 2010
MEMBERS Mutual Funds’ Trustees and Officers
The address of each trustee and officer is 550 Science Drive, Madison WI 53711, except that Mr. Mason’s address is 8777 N. Gainey Center Drive, #220, Scottsdale, AZ 85258. The Statement of Additional Information, which includes additional information about the trustees and officers, is available at no cost on the Funds’ website at www.membersfunds.com or by calling 1-800-877-6089.
Interested Trustees and Officers
Name and Year of Birth | Position(s) and Length of Time Served | Principal Occupation(s) During Past Five Years | Other Directorships/Trusteeships |
Katherine L. Frank1 1960 | Trustee and President, 2009 - Present | Madison Investment Advisors, Inc. ("MIA") (affiliated investment advisory firm of Madison), Managing Director and Vice President, 1986 - Present; Madison Asset Management, LLC ("Madison"), Director and Vice President, 2004 - Present; Madison Mosaic, LLC (affiliated investment advisory firm of Madison), President, 1996 - Present ; Madison Mosaic Funds (13) (mutual funds) and Madison Strategic Sector Premium Fund (closed end fund), President, 1996 - Present ; Madison/Claymore Covered Call and Equity Strategy Fund (closed end fund), Vice President, 2005 - Present; Ultra Series Fund (16) (mutual fund), President, 2009 - Present | Madison Mosaic Funds (all but Equity Trust) and Madison Strategic Sector Premium Fund, 1996 - Present; Ultra Series Fund (16), 2009 - Present |
Frank E. Burgess 1942 | Vice President, 2009 - Present | MIA, Founder, President and Director, 1973 - Present ; Madison, President and Director, 2004 - Present; Madison Mosaic Funds (13) and Madison Strategic Sector Premium Fund, Vice President, 1996 - Present; Ultra Series Fund (16), Vice President, 2009 - Present | N/A |
Jay R. Sekelsky 1959 | Vice President, 2009 - Present | MIA, Managing Director and Vice President, 1990 - Present; Madison, Director, 2009 - Present; Madison Mosaic, LLC, Vice President, 1996 - Present; Madison Mosaic Funds (13) and Madison Strategic Sector Premium Fund, Vice President, 1996 - Present; Madison/Claymore Covered Call and Equity Strategy Fund, Vice President, 2005 - Present; Ultra Series Fund (16), Vice President, 2009 - Present | N/A |
Paul Lefurgey 1964 | Vice President, 2009 - Present | MIA, Managing Director, Head of Fixed Income, 2005 - Present; Madison, Portfolio Manager, 2009 - Present; MEMBERS Capital Advisors, Inc. ("MCA") (investment advisory firm), Madison, WI, Vice President, 2003 - 2005; Ultra Series Fund (16), Vice President, 2009 - Present | N/A |
Greg D. Hoppe 1969 | Treasurer, 2009 - Present | MIA and Madison Mosaic, LLC, Vice President, 1999 - Present; Madison, Vice President, 2009 - Present ; Madison Mosaic Funds (13), Treasurer, 2009 - Present; Chief Financial Officer, 1999 - 2009; Madison Strategic Sector Premium Fund, Treasurer, 2005 - Present; Chief Financial Officer, 2005 - 2009 ; Madison/Claymore Covered Call and Equity Strategy Fund, Vice President, 2008 - Present; Ultra Series Fund (16), Treasurer, 2009 - Present | N/A |
Holly S. Baggot 1960 | Secretary, 1999 - Present; Assistant Treasurer, 1999 - 2007; 2009 - Present; Treasurer, 2008 - 2009 | Madison, Vice President, 2009 - Present; MCA, Director-Mutual Funds, 2008-2009; Director-Mutual Fund Operations, 2006-2008; Operations Officer-Mutual Funds, 2005-2006; Senior Manager-Product & Fund Operations, 2001-2005; Madison Mosaic Funds (13) and Madison Strategic Sector Premium Fund, Secretary and Assistant Treasurer, 2009 - Present ; Ultra Series Fund (16), Secretary, 1999-Present; Treasurer, 2008-2009; Assistant Treasurer, 1997-2007 and 2009-Present | N/A |
1 "Interested person" as defined in the Investment Company Act of 1940. Considered an interested Trustee because of the position held with the investment adviser of the Trust.
MEMBERS Mutual Funds | October 31, 2010
MEMBERS Mutual Funds’ Trustees and Officers
Name and Year of Birth | Position(s) and Length of Time Served | Principal Occupation(s) During Past Five Years | Other Directorships/Trusteeships |
W. Richard Mason 1960 | Chief Compliance Officer, Corporate Counsel and Assistant Secretary, 2009 - Present | MIA, Madison, Madison Scottsdale, LC (an affiliated investment advisory firm of Madison) and Madison Mosaic, LLC, Chief Compliance Officer and Corporate Counsel, 2009 - Present; General Counsel and Chief Compliance Officer, 1996 - 2009 ; Mosaic Funds Distributor, LLC (an affiliated brokerage firm of Madison), Principal, 1998 - Present; Concord Asset Management ("Concord") (an affiliated investment advisory firm of Madison), LLC, General Counsel, 1996 - 2009; Madison Mosaic Funds (13) and Madison Strategic Sector Premium Fund, Chief Compliance Officer, Corporate Counsel and Assistant Secretary, 2009 - Present; Secretary, General Counsel and Chief Compliance Officer, 1992 - 2009 ; Ultra Series Fund (16), Chief Compliance Officer, Corporate Counsel and Assistant Secretary, 2009 - Present | N/A |
Pamela M. Krill 1966 | General Counsel, Chief Legal Officer and Assistant Secretary, 2009 - Present | MIA, Madison, Madison Scottsdale, LC, Madison Mosaic, LLC, Mosaic Funds Distributor, and Concord, General Counsel and Chief Legal Officer, 2009 - Present; Madison Mosaic Funds (13) and Madison Strategic Sector Premium Fund, General Counsel, Chief Legal Officer and Assistant Secretary, 2009 - Present; Ultra Series Fund (16), General Counsel, Chief Legal Officer and Assistant Secretary, 2009 - Present; CUNA Mutual Insurance Society (insurance company with affiliated investment advisory, brokerage and mutual fund operations), Madison, WI, Managing Associate General Counsel-Securities & Investments, 2007 - 2009 ; Godfrey & Kahn, S.C. (law firm), Madison and Milwaukee, WI, Shareholder, Securities Practice Group, 1994-2007 | N/A |
Independent Trustees
Name and Year of Birth | Position(s) and Length of Time Served1 | Principal Occupation(s) During Past Five Years | Portfolios Overseen in Fund Complex2 | Other Directorships/Trusteeships |
Lorence D. Wheeler 1938 | Trustee, 2009 - Present | Retired investor; Credit Union Benefits Services, Inc. (a provider of retirement plans and related services for credit union employees nationwide), Madison, WI, President, 1997 - 2001 | 43 | Grand Mountain Bank FSB and Grand Mountain Bancshares, Inc. 2003 - Present ; Madison Mosaic Funds (13) and Madison Strategic Sector Premium Fund, 1996 - Present; Madison/Claymore Covered Call and Equity Strategy Fund, 1996 - Present; Ultra Series Fund (16), 2009 - Present |
Steven P. Riege 1954 | Trustee, 2005 - Present | The Rgroup (management consulting), Milwaukee, WI, Owner/President, 2001 - Present; Robert W. Baird & Company (financial services), Milwaukee, WI, Senior Vice President-Marketing and Vice President-Human Resources, 1986 - 2001 | 29 | Ultra Series Fund (16), 2005 - Present |
MEMBERS Mutual Funds | October 31, 2010
MEMBERS Mutual Funds’ Trustees and Officers
Name and Year of Birth | Position(s) and Length of Time Served1 | Principal Occupation(s) During Past Five Years | Portfolios Overseen in Fund Complex2 | Other Directorships/Trusteeships |
Richard E. Struthers 1952 | Trustee, 2004 - Present | Clearwater Capital Management (investment advisory firm), Minneapolis, MN, Chair and Chief Executive Officer, 1998 - Present; Park Nicollet Health Services, Minneapolis, MN, Chairman, Finance and Investment Committee, 2006 - Present; IAI Mutual Funds, Minneapolis, MN, President and Director, 1992-1997 | 29 | Park Nicolet Health Services, 2001 - Present; Micro Component Technology, Inc., 2008 - 2009 ; Ultra Series Fund (16), 2004 - Present |
Philip E. Blake 1944 | Trustee, 2009 - Present | Retired Investor; Lee Enterprises, Inc (news and advertising publisher), Madison, WI, Vice President, 1998 - 2001; Madison Newspapers, Inc., Madison, WI, President and Chief Executive Officer, 1993 - 2000 | 43 | Madison Newspapers, Inc., 1993 - Present; Meriter Hospital & Health Services, 2000 - Present; Edgewood College, 2003 - Present; Nerites Corporation , 2004 - Present; Madison Mosaic Funds (13) and Madison Strategic Sector Premium Fund, 1996 - Present; Ultra Series Fund (16), 2009 - Present |
James R. Imhoff, Jr. 1944 | Trustee, 2009 - Present | First Weber Group (real estate brokers), Madison, WI, Chief Executive Officer, 1996 - Present | 43 | Park Bank, 1978 - Present; Madison Mosaic Funds (13) and Madison Strategic Sector Premium Fund, 1996 - Present; Madison/Claymore Covered Call and Equity Strategy Fund, 1996 - Present; Ultra Series Fund (16), 2009 - Present |
1 Independent Trustees serve in such capacity until the Trustee reaches the age of 76, unless retirement is waived by unanimous vote of the remaining Trustees on an annual basis.
2 As of October 31, 2010, the Fund complex consists of the Trust with 13 portfolios, the Ultra Series Fund with 16 portfolios, the Madison Strategic Sector Premium Fund (a closed-end fund) and the Madison Mosaic Equity, Income, Tax-Free and Government Money Market Trusts, which together have 13 portfolios, for a grand total of 43 separate portfolios in the Fund complex. Not every Trustee is a member of the Board of Trustees of every Fund in the Fund complex, as noted above.
This page was intentionally left blank.