OMB APPROVAL
OMB Number: 3235-0570
Expires: July 31, 2022
Estimated average burden hours per response...20.6
UNITED STATES SECURITIES AND EXCHANGE COMMISSION
Washington, DC 20549
FORM N-CSR
CERTIFIED SHAREHOLDER REPORT OF REGISTERED
MANAGEMENT INVESTMENT COMPANIES
Investment Company Act file number 811-08261
Madison Funds
(Exact name of registrant as specified in charter)
550 Science Drive, Madison, WI 53711
(Address of principal executive offices)(Zip code)
Kevin S. Thompson
Chief Legal Officer
550 Science Drive
Madison, WI 53711
(Name and address of agent for service)
Registrant’s telephone number, including area code: 608-274-0300
Date of fiscal year end: October 31
Date of reporting period: October 31, 2019
Form N-CSR is to be used by management investment companies to file reports with the Commission not later than 10 days after the transmission to stockholders of any report that is required to be transmitted to stockholders under Rule 30e-1 under the Investment Company Act of 1940 (17 CFR 270.30e-1). The Commission may use the information provided on Form N-CSR in its regulatory, disclosure review, inspection, and policymaking roles.
A registrant is required to disclose the information specified by Form N-CSR, and the Commission will make this information public. A registrant is not required to respond to the collection of information contained in Form N-CSR unless the Form displays a currently valid Office of Management and Budget (“OMB”) control number. Please direct comments concerning the accuracy of the information collection burden estimate and any suggestions for reducing the burden to Secretary, Securities and Exchange Commission, 450 Fifth Street, NW, Washington, DC 20549-0609. The OMB has reviewed this collection of information under the clearance requirements of 44 U.S.C. § 3507.
Item 1. Report to Shareholders.
Annual Report
October 31, 2019

Madison Conservative Allocation Fund
Madison Moderate Allocation Fund
Madison Aggressive Allocation Fund
Madison Government Money Market Fund
Madison Tax-Free Virginia Fund
Madison Tax-Free National Fund
Madison High Quality Bond Fund
Madison Core Bond Fund
Madison Corporate Bond Fund
Madison High Income Fund
Madison Diversified Income Fund
Madison Covered Call & Equity Income Fund
Madison Dividend Income Fund
Madison Large Cap Value Fund
Madison Investors Fund
Madison Mid Cap Fund
Madison Small Cap Fund
Madison International Stock Fund
Beginning March 1, 2021, as permitted by regulations adopted by the Securities and Exchange Commission, we will no longer mail paper copies of the funds’ shareholder reports, unless you specifically request paper copies from Madison Funds or your financial intermediary, such as a broker-dealer or bank. Instead, the reports will be made available on the Madison Funds website and we will notify you by mail each time a report is posted and provide you with a website link to access the report. If you have already elected to receive shareholder reports electronically, you will not be affected by this change and do not need to take any action. If you prefer to receive shareholder reports and other communications electronically, you can update your mailing preferences with your financial intermediary, or enroll in e-delivery at madisonfunds.com (for accounts held directly with the funds).
You may elect to receive all future reports in paper free of charge by calling Madison Funds at (800) 877-6089 if you hold shares directly with the funds. Your election to receive reports in paper will apply to all funds held with Madison Funds. If your fund shares are held through a financial intermediary, please contact them directly to make your request and to determine whether your election will apply to all funds in which you own shares through that intermediary.
Madison Funds | October 31, 2019
Table of Contents
| | | Page |
| Management’s Discussion of Fund Performance | | |
| Period in Review | | 2 |
| Allocation Funds Summary | | 3 |
| Conservative Allocation Fund | | 3 |
| Moderate Allocation Fund | | 4 |
| Aggressive Allocation Fund | | 4 |
| Government Money Market Fund | | 5 |
| Tax-Free Virginia Fund | | 5 |
| Tax-Free National Fund | | 6 |
| High Quality Bond Fund | | 7 |
| Core Bond Fund | | 8 |
| Corporate Bond Fund | | 9 |
| High Income Fund | | 10 |
| Diversified Income Fund | | 10 |
| Covered Call & Equity Income Fund | | 12 |
| Dividend Income Fund | | 13 |
| Large Cap Value Fund | | 13 |
| Investors Fund | | 14 |
| Mid Cap Fund | | 15 |
| Small Cap Fund | | 16 |
| International Stock Fund | | 16 |
| Notes to Management’s Discussion of Fund Performance | | 18 |
| Portfolios of Investments | | |
| Conservative Allocation Fund | | 19 |
| Moderate Allocation Fund | | 19 |
| Aggressive Allocation Fund | | 20 |
| Government Money Market Fund | | 20 |
| Tax-Free Virginia Fund | | 21 |
| Tax-Free National Fund | | 22 |
| High Quality Bond Fund | | 23 |
| Core Bond Fund | | 23 |
| Corporate Bond Fund | | 26 |
| High Income Fund | | 27 |
| Diversified Income Fund | | 28 |
| Covered Call & Equity Income Fund | | 30 |
| Dividend Income Fund | | 32 |
| Large Cap Value Fund | | 32 |
| Investors Fund | | 33 |
| Mid Cap Fund | | 33 |
| Small Cap Fund | | 34 |
| International Stock Fund | | 35 |
| Financial Statements | | |
| Statements of Assets and Liabilities | | 36 |
| Statements of Operations | | 38 |
| Statements of Changes in Net Assets | | 40 |
| Financial Highlights | | 46 |
| Notes to Financial Statements | | 55 |
Report of Independent Registered
Public Accounting Firm | | 65 |
| Other Information | | 66 |
| Trustees and Officers | | 71 |
Although each fund’s name begins with the word “Madison,” the word “Madison” may be omitted in this report for simplicity when referring to any particular fund, group of funds or list of funds.
Nondeposit investment products are not federally insured, involve investment risk, may lose value and are not obligations of or guaranteed by any financial institution.
For more complete information about Madison Funds, including charges and expenses, request a prospectus from your financial advisor or from Madison Funds, P.O. Box 219083, Kansas City, MO 64121-9083. Consider the investment objectives, risks, and charges and expenses of any fund carefully before investing. The prospectus contains this and other information about the funds.
For more current performance information, please call 1-800-877-6089 or visit our website at www.madisonfunds.com. Current performance may be lower or higher than the performance data quoted within this report. Performance data shown represents past performance, past performance does not guarantee future results.
Nothing in this report represents a recommendation of a security by the investment adviser. Portfolio holdings may have changed since the date of this report.
1
Management’s Discussion of Fund Performance(unaudited)
Period in Review
The one-year period ended October 31, 2019 was a solid one for both domestic stocks and bonds. The S&P 500® Index returned 14.33% for the year, with positive returns in 2019 offsetting weakness in the final months of 2018. The Barclays Aggregate Index had a banner 11.51% one-year period as rates drifted lower throughout the period. The yield on the 10-year Treasury began the period near a multi-year high at 3.14% and ended the period at 1.69%, up from the period low of 1.46% on September 3, 2019. International returns were positive as well, as the broad MSCI EAFE Index (net) rose 11.04%, somewhat behind the U.S. market, reflecting the relative strength of the U.S. economy compared to most of the rest of the world.
The Federal Reserve (Fed) Board initiated three “insurance” rate cuts during the one-year period, seeking to insulate the current economic expansion against growing headwinds. This was accompanied with debate over the source of slowing growth and how much monetary policy can help. Indeed, Fed Chairman Powell characterized their actions as a mid-cycle adjustment. However, it is important to note that the decision to cut rates and the magnitude of the adjustment, was not unanimous amongst the voting Fed members. The division over the appropriate policy level of rates was driven by disagreement about how far along we were in this economic cycle as well as uncertainty about the root cause of the sub-par growth. We believe that interest rates, particularly following two additional 0.25% cuts, are now quite accommodative.
All of these positive index numbers should not suggest indiscriminate advances for all securities. In fact, the returns were often quite varied across asset classes, based on stock size and sector, and for bonds, based on quality. Much of the stock market return was concentrated in a select number of large stocks, primarily in the technology and social networking arena. Smaller stocks in aggregate trailed the overall market with the Russell Midcap® Index returning 13.72% and the Russell 2000® Index of small-cap stocks returning just 4.90%.
Technology stocks advanced 22.5% during the year, while the Energy Sector struggled, losing -10.6%. The Energy Sector is particularly vulnerable to global economic weakness and there was considerable evidence of that weakness, as central banks in Europe and Japan continued to apply maximum stimulation, including negative rates on bonds. The Chinese economy, the world’s second largest, had been slowing for some time, and 2019 reports indicated that its rate of growth was the slowest since the early 1990s as it faced domestic issues and the impact of the U.S.-led trade war. The Health Care Sector was another drag on index performance as it returned 8.6%, in part due to the overhang of promised health care reform by the leading Democratic presidential candidates.
While employment numbers and the related consumer confidence numbers continued to be robust, the quality of those jobs has been debated. Manufacturing and capital expenditures showed increasing strains through the period as uncertainty over trade policies cast a shadow over many global businesses. The Fed monitors these indicators carefully and showed its concern by lowering interest rates by a quarter of a percent three times in 2019. Partly due to these rate reductions, the yield curve inverted in August, when short term bonds break the normal mold by yielding more than longer-term bonds. While the actual inversion was very short-lived, it raised further concerns about the future economy, since recessions often are preceded by this effect (although the reverse is not always true when it comes to inversions predicting recessions).
Looking ahead we share the general concerns over the unpredictable tariff and trade war situation, the economic troubles abroad and the unknown effects of what is almost certain to be a divisive presidential campaign. We believe that uncertain times are when you are most likely to be best served by the kind of careful attention to individual securities and broad trends through active management that we apply across all of the Madison Funds.
2
Madison Funds | Management’s Discussion of Fund Performance - continued | October 31, 2019
ALLOCATION FUNDS SUMMARY
The Madison Conservative Allocation, Moderate Allocation and Aggressive Allocation Funds invest primarily in shares of registered investment companies (the “Underlying Funds”). The funds are diversified among a number of asset classes and their allocation among Underlying Funds are based on an asset allocation model developed by Madison Asset Management, LLC (“Madison”), the funds’ investment adviser. The team may use multiple analytical approaches to determine the appropriate asset allocation, including:
| ● | Asset allocation optimization analysis – considers the degree to which returns in different asset classes do or do not move together, and the funds’ aim to achieve a favorable overall risk profile for any targeted portfolio return. |
| ● | Scenario analysis– historical and expected return data is analyzed to model how individual asset classes and combinations of asset classes would affect the funds under different economic and market conditions. |
| ● | Fundamental analysis – draws upon Madison’s investment teams to judge each asset class against current and forecasted market conditions. Economic, industry and security analysis is used to develop return and risk expectations that may influence asset class selection. In addition, Madison has a flexible mandate which permits the funds, at the sole discretion of Madison, to materially reduce equity risk exposures when and if conditions are deemed to warrant such an action. |
MADISON CONSERVATIVE ALLOCATION FUND
INVESTMENT STRATEGY HIGHLIGHTS
Under normal circumstances, the Madison Conservative Allocation Fund’s total net assets will be allocated among various asset classes and Underlying Funds, including those whose shares trade on a stock exchange (exchange traded funds or “ETFs”), with target allocations over time of approximately 35% equity investments and 65% fixed income investments. Underlying Funds in which the fund invests may include funds advised by Madison and/or its affiliates, including other Madison Funds (the “Affiliated Underlying Funds”). Generally, Madison will not invest more than 75% of the fund’s net assets, at the time of purchase, in Affiliated Underlying Funds.
PERFORMANCE DISCUSSION
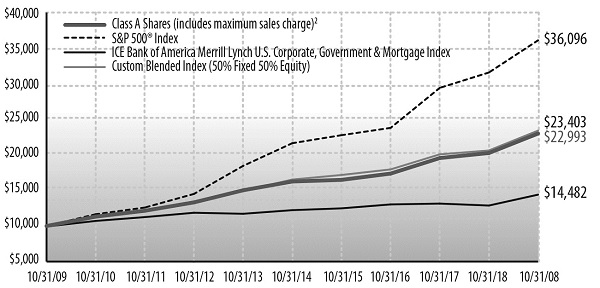
Cumulative Performance of $10,000 Investment1

| Average Annual Total Return through October 31, 20191 | | | | | | | | | |
| | | % Return Without Sales Charge | | % Return After Sales Charge5 | |
| | | 1 Year | | 3 Years | | 5 Years | | 10 Years | | 1 Year | | 3 Years | | 5 Years | | 10 Years | |
| Class A Shares2 | | 10.37 | | 5.85 | | 4.34 | | 5.57 | | 4.06 | | 3.77 | | 3.12 | | 4.95 | |
| Class B Shares3 | | 9.51 | | 5.04 | | 3.55 | | 4.95 | | 5.01 | | 3.97 | | 3.20 | | 4.95 | |
| Class C Shares4 | | 9.50 | | 5.04 | | 3.55 | | 4.78 | | 8.50 | | 5.04 | | 3.55 | | 4.78 | |
| ICE Bank of America Merrill Lynch US Corp, Govt & Mortgage Index | | 11.82 | | 3.38 | | 3.32 | | 3.77 | | NA | | NA | | NA | | NA | |
| Conservative Allocation Fund Custom Index | | 12.37 | | 6.65 | | 5.20 | | 6.46 | | NA | | NA | | NA | | NA | |
See accompanying Notes to Management’s Discussion of Fund Performance.
Madison Conservative Allocation Fund (Class A at NAV) returned 10.37% for the one-year period, compared to its Conservative Allocation Custom benchmark’s 12.37%. The Fund’s peer group, Morningstar Allocation 30-50% Equity, returned 9.31%. Major asset classes posted double digit returns over the trailing year; U.S. equities (Russell 3000 Index) 13.5%, International equities (MSCI ACWI ex USA Index) 11.3% and U.S. bonds (Bloomberg Barclays U.S. Aggregate Bond Index) 11.5%. However, when measuring performance over a relatively short period of time, the starting date can mask the larger picture. Case-in-point, equity markets had experienced a material correction in October 2018, with U.S. stocks declining -7.4% and International stocks dropping -8.1%. Recalculating returns to include this downdraft results in 13-month returns of 5.1% for U.S. stocks, and 2.2% for International equities. Starkly different results, and as more defensively-minded practitioners, the protection we provided in a very challenging month was lost to the turning of the calendar.
As alluded to above, the greatest detractor to performance was the Fund’s defensive positioning. The Fund carried high cash allocations throughout the period due to our concerns over slowing global growth and declining U.S. corporate earnings expectations. However, despite a couple brief periods of trade-war concerns, markets have generally looked past the deteriorating economic and earnings outlook and focused instead on easier monetary policy by central banks to push equities to record levels. Interestingly, the Fund’s single largest contribution came from our long-term U.S. Treasury position, which returned over 27% for the period, as interest rates plunged during this risk-on period. Exceptionally strong performance from our core U.S. equity holdings, as well as relative overweight allocations to U.S. large cap versus small cap, and U.S. versus international equities helped offset our risk-light positioning.
Moving forward we see little reason to move away from our guarded posturing. Global economic growth remains weak, the U.S./China trade war continues to linger, and 2019 U.S. earnings growth expectations have declined from over 10% year-over-year to below 2% year-over-year in the past 12 months. Further, analysts are expecting 10% earnings growth for 2020, which seems highly unlikely given below average economic growth and increased wage pressures. It seems unusual that markets would continue to march to all-time highs given this backdrop. The markets appear to be more concerned with increased central bank intervention than economic growth and fundamentals. Given our participate and protect philosophy, and what we are seeing in the data and valuations, we believe it is prudent to be vigilant in our risk taking.
| PORTFOLIO ALLOCATION AS A PERCENTAGE OF NET ASSETS AS OF 10/31/19 | | | |
| Bond Funds | | | 65.4 | % |
| Foreign Stock Funds | | | 5.6 | % |
| Short-Term Investments | | | 16.7 | % |
| Stock Funds | | | 23.5 | % |
| Net Other Assets and Liabilities | | | (11.2 | )% |
| TOP TEN HOLDINGS AS A PERCENTAGE OF NET ASSETS AS OF 10/31/19 | | | |
| Madison Core Bond Fund Class Y | | | 17.0 | % |
| State Street Navigator Securities Lending Government Money Market Portfolio, 1.75% | | | 11.2 | % |
| Vanguard Short-Term Corporate Bond ETF | | | 11.2 | % |
| Vanguard Short-Term Treasury ETF | | | 11.0 | % |
| Baird Aggregate Bond Fund Institutional Shares | | | 9.5 | % |
| Madison Investors Fund Class Y | | | 8.3 | % |
| Madison Dividend Income Fund Class Y | | | 8.2 | % |
| Madison Corporate Bond Fund Class Y | | | 6.1 | % |
| iShares 7-10 Year Treasury Bond ETF | | | 5.7 | % |
| iShares 20+ Year Treasury Bond ETF | | | 4.9 | % |
3
Madison Funds | Management’s Discussion of Fund Performance- continued | October 31, 2019
MADISON MODERATE ALLOCATION FUND
INVESTMENT STRATEGY HIGHLIGHTS
Under normal circumstances, the Madison Moderate Allocation Fund’s total net assets will be allocated among various asset classes and Underlying Funds, including those whose shares trade on a stock exchange (exchange traded funds or “ETFs”), with target allocations over time of approximately 60% equity investments and 40% fixed income investments. Underlying Funds in which the fund invests may include Affiliated Underlying Funds. Generally, Madison will not invest more than 75% of the fund’s net assets, at the time of purchase, in Affiliated Underlying Funds.
PERFORMANCE DISCUSSION
Cumulative Performance of $10,000 Investment1

| Average Annual Total Return through October 31, 20191 | | | | | | | | | |
| | | % Return Without Sales Charge | | % Return After Sales Charge5 | |
| | | 1 Year | | 3 Years | | 5 Years | | 10 Years | | 1 Year | | 3 Years | | 5 Years | | 10 Years | |
| Class A Shares2 | | 10.69 | | 7.98 | | 5.63 | | 7.38 | | 4.30 | | 5.88 | | 4.38 | | 6.74 | |
| Class B Shares3 | | 9.79 | | 7.18 | | 4.84 | | 6.73 | | 5.29 | | 6.16 | | 4.53 | | 6.73 | |
| Class C Shares4 | | 9.78 | | 7.17 | | 4.84 | | 6.58 | | 8.78 | | 7.17 | | 4.84 | | 6.58 | |
| S&P 500® Index | | 14.33 | | 14.91 | | 10.78 | | 13.70 | | NA | | NA | | NA | | NA | |
| Moderate Allocation Fund Custom Index | | 12.73 | | 8.98 | | 6.50 | | 8.29 | | NA | | NA | | NA | | NA | |
See accompanying Notes to Management’s Discussion of Fund Performance.
The Madison Moderate Allocation Fund (Class A at NAV) returned 10.69% for the one-year period, compared to its Moderate Allocation Custom benchmark’s 12.73%. The Fund’s peer group, Morningstar Allocation 50-70% Equity, returned 10.11%. Major asset classes posted double digit returns over the trailing year; U.S. equities (Russell 3000 Index) 13.5%, International equities (MSCI ACWI ex USA Index) 11.3% and U.S. bonds (Bloomberg Barclays U.S. Aggregate Bond Index) 11.5%. However, when measuring performance over a relatively short period of time, the starting date can mask the larger picture. Case-in-point, equities markets had experienced a material correction in October 2018, with U.S. stocks declining -7.4% and International stocks dropping -8.1%. Recalculating returns to include this downdraft results in 13-month returns of 5.1% for U.S. stocks and 2.2% for International equities. Starkly different results, and as more defensively-minded practitioners, the protection we provided in a very challenging month was lost to the turning of the calendar.
As alluded to above, the greatest detractor to performance was the Fund’s defensive positioning. The Fund carried high cash allocations throughout the period due to our concerns over slowing global growth and declining U.S. corporate earnings expectations. However, despite a couple brief periods of trade-war concerns, markets have generally looked past the deteriorating economic and earnings outlook and focused instead on easier monetary policy by central banks to push equities to record levels. Interestingly, one of the Fund’s largest contributions came from our long-term U.S. Treasury position, which returned over 27% for the period, as interest rates plunged during this risk-on period. Exceptionally strong performance from our core U.S. equity holdings, as well as relative overweight allocations to U.S. large cap versus small cap, and U.S. versus international equities helped offset our risk-light positioning.
Moving forward we see little reason to move away from our guarded posturing. Global economic growth remains weak, the U.S./China trade war continues to linger, and 2019 US earnings growth expectations have declined from over 10% year-over-year to below 2% year-over-year in the past 12 months. Further, analysts are expecting 10% earnings growth for 2020, which seems highly unlikely given below average economic growth and increased wage pressures. It seems unusual that markets would continue to march to all-time highs given this backdrop. The markets appear to be more concerned with increased central bank intervention than economic growth and fundamentals. Given our participate and protect philosophy, and what we are seeing in the data and valuations, we believe it is prudent to be vigilant in our risk taking.
| PORTFOLIO ALLOCATION AS A PERCENTAGE OF NET ASSETS AS OF 10/31/19 | | | |
| Bond Funds | | | 41.1 | % |
| Foreign Stock Funds | | | 9.5 | % |
| Short-Term Investments | | | 11.8 | % |
| Stock Funds | | | 41.2 | % |
| Net Other Assets and Liabilities | | | (3.6 | )% |
| TOP TEN HOLDINGS AS A PERCENTAGE OF NET ASSETS AS OF 10/31/19 | | | |
| Madison Investors Fund Class Y | | | 13.5 | % |
| Madison Dividend Income Fund Class Y | | | 13.3 | % |
| Madison Core Bond Fund Class Y | | | 11.6 | % |
| Vanguard Short-Term Corporate Bond ETF | | | 9.8 | % |
| Baird Aggregate Bond Fund Institutional Shares | | | 6.2 | % |
| Vanguard Short-Term Treasury ETF | | | 6.1 | % |
| iShares Edge MSCI Minimum Volatility EAFE ETF | | | 5.1 | % |
| iShares Edge MSCI Minimum Volatility USA ETF | | | 4.0 | % |
| Madison Mid Cap Fund Class Y | | | 3.9 | % |
| iShares 20+ Year Treasury Bond ETF | | | 3.7 | % |
MADISON AGGRESSIVE ALLOCATION FUND
INVESTMENT STRATEGY HIGHLIGHTS
Under normal circumstances, the Madison Moderate Allocation Fund’s total net assets will be allocated among various asset classes and Underlying Funds, including those whose shares trade on a stock exchange (exchange traded funds or “ETFs”), with target allocations over time of approximately 60% equity investments and 40% fixed income investments. Underlying Funds in which the fund invests may include Affiliated Underlying Funds. Generally, Madison will not invest more than 75% of the fund’s net assets, at the time of purchase, in Affiliated Underlying Funds.
PERFORMANCE DISCUSSION
Cumulative Performance of $10,000 Investment1

4
Madison Funds | Management’s Discussion of Fund Performance -Madison Aggressive Allocation Fund - continued | October 31, 2019
| Average Annual Total Return through October 31, 20191 | | | | | | | | | |
| | | % Return Without Sales Charge | | % Return After Sales Charge5 | |
| | | 1 Year | | 3 Years | | 5 Years | | 10 Years | | 1 Year | | 3 Years | | 5 Years | | 10 Years | |
| Class A Shares2 | | 10.93 | | 9.62 | | 6.57 | | 8.70 | | 4.58 | | 7.47 | | 5.32 | | 8.05 | |
| Class B Shares3 | | 10.12 | | 8.80 | | 5.77 | | 8.05 | | 5.63 | | 7.80 | | 5.48 | | 8.05 | |
| Class C Shares4 | | 10.11 | | 8.79 | | 5.77 | | 7.88 | | 9.11 | | 8.79 | | 5.77 | | 7.88 | |
| S&P 500 Index | | 14.33 | | 14.91 | | 10.78 | | 13.70 | | NA | | NA | | NA | | NA | |
| Aggressive Allocation Fund Custom Index | | 12.87 | | 10.81 | | 7.47 | | 9.69 | | NA | | NA | | NA | | NA | |
See accompanying Notes to Management’s Discussion of Fund Performance.
The Madison Aggressive Allocation Fund (Class A at NAV) returned 10.93% for the one-year period, compared to its Aggressive Allocation Custom benchmark’s 12.87%. The Fund’s peer group, Morningstar Allocation: 70-85% Equity, returned 9.58%. Major asset classes posted double digit returns over the trailing year; U.S. equities (Russell 3000 Index) 13.5%, International equities (MSCI ACWI ex USA Index) 11.3% and U.S. bonds (Bloomberg Barclays U.S. Aggregate Bond Index) 11.5%. However, when measuring performance over a relatively short period of time, the starting date can mask the larger picture. Case-in-point, equities markets had experienced a material correction in October 2018, with U.S. stocks declining -7.4% and International stocks dropping -8.1%. Recalculating returns to include this downdraft results in 13-month returns of 5.1% for U.S. stocks and 2.2% for International equities. Starkly different results, and as more defensively-minded practitioners, the protection we provided in a very challenging month was lost to the turning of the calendar.
As alluded to above, the greatest detractor to performance was the Fund’s defensive positioning. The Fund carried high cash allocations throughout the period due to our concerns over slowing global growth and declining U.S. corporate earnings expectations. However, despite a couple brief periods of trade-war concerns, markets have generally looked past the deteriorating economic and earnings outlook and focused instead on easier monetary policy by central banks to push equities to record levels. Interestingly, one of the Fund’s largest contributions came from our long-term U.S. Treasury position, which returned over 27% for the period, as interest rates plunged during this risk-on period. Exceptionally strong performance from our core U.S. equity holdings, as well as relative overweight allocations to U.S. large cap versus small cap, and U.S. versus international equities helped offset our risk-light positioning.
Moving forward we see little reason to move away from our guarded posturing. Global economic growth remains weak, the U.S./China trade war continues to linger, and 2019 US earnings growth expectations have declined from over 10% year-over-year to below 2% year-over-year in the past 12 months. Further, analysts are expecting 10% earnings growth for 2020, which seems highly unlikely given below average economic growth and increased wage pressures. It seems unusual that markets would continue to march to all-time highs given this backdrop. The markets appear to be more concerned with increased central bank intervention than economic growth and fundamentals. Given our participate and protect philosophy, and what we are seeing in the data/valuations, we believe it is prudent to be vigilant in our risk taking.
| PORTFOLIO ALLOCATION AS A PERCENTAGE OF NET ASSETS AS OF 10/31/19 | | | |
| Bond Funds | | | 21.6 | % |
| Foreign Stock Funds | | | 14.3 | % |
| Short-Term Investments | | | 11.4 | % |
| Stock Funds | | | 52.8 | % |
| Net Other Assets and Liabilities | | | (0.1 | )% |
| TOP TEN HOLDINGS AS A PERCENTAGE OF NET ASSETS AS OF 10/31/19 | | | |
| Madison Investors Fund Class Y | | | 15.6 | % |
| Madison Dividend Income Fund Class Y | | | 15.6 | % |
| iShares Edge MSCI Minimum Volatility EAFE ETF | | | 7.1 | % |
| Madison Core Bond Fund Class Y | | | 6.8 | % |
| Madison Mid Cap Fund Class Y | | | 6.2 | % |
| Vanguard Short-Term Corporate Bond ETF | | | 5.7 | % |
| iShares Edge MSCI Minimum Volatility USA ETF | | | 5.4 | % |
| Vanguard FTSE All-World ex-U.S. ETF | | | 5.1 | % |
| Vanguard Short-Term Treasury ETF | | | 5.0 | % |
| iShares Core S&P 500 ETF | | | 3.8 | % |
MADISON GOVERNMENT MONEY MARKET FUND
INVESTMENT STRATEGY HIGHLIGHTS
The Madison Government Money Market Fund invests at least 99.5% of its total assets in cash, government securities, and/or repurchase agreements that are collateralized by cash or government securities, including but not limited to the Federal National Mortgage Association, Federal Home Loan Banks, Federal Home Loan Mortgage Corporate, and Federal Farm Credit Banks.
The Fund is a money market fund that seeks to maintain a stable net asset value (“NAV”) of $1.00 per share. The Fund’s investments must have a remaining maturity of no more than 397 days and must be high quality. The Fund maintains a dollar-weighted average portfolio maturity of 60 days or less.
PERFORMANCE DISCUSSION
The Madison Government Money Market (Class A at NAV) returned 1.75% for the one-year period. The Fund’s peer group, Morningstar Taxable Money Market returned 1.84%. The unmanaged, fee-free return of the Fund’s 90-day U.S. Treasury Bill benchmark returned 2.35%. For many years following the 2008 financial crisis, the Federal Reserve (Fed) pinned rates near zero. Since money market rates are closely associated with the Fed funds rate, Madison Government Money Market paid no dividends for much of this period. In late 2015 the Fed moved the funds rate up a quarter percent and continued to gradually increase the rate nine times, to a range of 2.25% to 2.5%, including three rate increases in 2019. However, concern about global and domestic economic growth prompted the Fed to lower rates a quarter percent in July, 2019, the first rate drop in a decade, and proceeded to make two more rate cuts through September. These actions had the effect of reducing the rate of return for Government Money Market, which ended the period with a SEC yield of 1.32%.
| PORTFOLIO ALLOCATION AS A PERCENTAGE OF NET ASSETS AS OF 10/31/19 | | | |
| Fannie Mae | | | 26.0 | % |
| Federal Home Loan Bank | | | 27.4 | % |
| Freddie Mac | | | 28.9 | % |
| Short-Term Investments | | | 3.3 | % |
| U.S. Treasury Notes | | | 14.4 | % |
MADISON TAX-FREE VIRGINIA FUND
INVESTMENT STRATEGY HIGHLIGHTS
The Madison Tax-Free Virginia Fund seeks to achieve its investment objectives by investing at least 80% of its net assets in municipal bonds that are exempt from federal and state income tax for residents of Virginia. These securities may be issued by state governments, their political subdivisions (for example, cities and counties) and public authorities (for example, school districts and housing authorities). The Fund may also invest in bonds that, under federal law, are exempt from federal and state income taxation, such as bonds issued by the District of Columbia, Puerto Rico, the Virgin Islands and Guam. The Fund invests in intermediate and long-term bonds having average, aggregate maturities (at the portfolio level) of 7 to 15 years.
5
Madison Funds | Management’s Discussion of Fund Performance - Madison Tax-Free Virginia Fund - continued | October 31, 2019
PERFORMANCE DISCUSSION
Cumulative Performance of $10,000 Investment1

| Average Annual Total Return through October 31, 20191 | | | | | | | |
| | | % Return Without Sales Charge | |
| | | 1 Year | | 3 Years | | 5 Years | | 10 Years | |
| Class Y Shares6 | | 7.78 | | 2.24 | | 2.41 | | 3.07 | |
| ICE Bank of America Merrill Lynch 1-22 Yr Municipal Securities Index | | 8.65 | | 3.25 | | 3.19 | | 4.04 | |
See accompanying Notes to Management’s Discussion of Fund Performance.
The Madison Tax-Free Virginia Fund (Class Y) returned 7.78% for the one-year period, underperforming the ICE Bank of America Merrill Lynch 1-22 Year Municipal Securities Index, which returned 8.65%. The Morningstar Municipal Single State Intermediate peer group returned 7.33% for the period.
The Fund’s relative performance is attributable to yield curve positioning, sector allocation and security selection within the BBB quality bucket. Specific to maturity profile, the Fund benefited from the less-than-benchmark exposure to maturities less than five years as well as its slightly higher exposure to maturities between eight and 17 years where the yield curve was more positively sloped. Also additive to return was the Fund’s allocation to local general obligation bonds and revenue bonds which outperformed general obligations issued by the state of Virginia. Although the Fund was less exposed to BBB-rated issues, positive relative performance was generated by the Fund’s lower quality securities which held their value better as risk premiums shifted.
The municipal bond market has benefited from the favorable U.S. economic environment as evidenced by increasing state and local tax receipts as well as benign default trends. Most state and local governments appear to be on solid financial footing with no immediate need to battle budget woes. Fortunately for these issuers, history suggests tax receipts are likely to keep growing until the U.S. economy contracts. However, over the longer term we believe many municipalities are faced with not necessarily new but difficult challenges such as limited federal funding, unfunded pension liabilities and climate-related events. Typically, these general obligations issuers have enough time to formulate and implement corrective actions.
We envision demand for tax-exempt securities to remain robust during the coming quarters as higher wage earners reposition assets to lessen federal taxes. Lower corporate tax rates amplify the likelihood institutional investors will have a diminished appetite for federally tax-exempt holdings. This is especially true for banks which have reduced muni holdings in recent quarters. The supply of muni bonds is apt to remain in-line with investor demand as issuers take advantage of lower interest rates by refunding higher cost debt and funding approved projects. However, we anticipate tax-exempt investors will become more attentive to the absolute level of yields as well as relative valuations versus other fixed income sectors.
In general, investors seem to be geared towards locking in the highest yields possible while dismissing signs of potential trouble spots percolating within the muni market. While it is true muni defaults are rare, the number of impairments is experiencing an upsurge. The good news is a vast majority of impairments and defaults are within the riskiest sectors including retirement communities, local housing, land secured, charter schools and hospitals. Without taking uncompensated risk, we foresee tax-exempt investors taking advantage of the upward sloping muni curve by positioning a portion of holdings beyond 12 years. In addition, the nearly identical yields for munis with maturities less than seven years poses an opportunity for investors to reposition five-to-seven-year paper into shorter maturities. The result of this two-pronged approach is a barbell portfolio (e.g. a portfolio with limited intermediate maturities). Lastly, we believe uncertainties about the economy and investors’ potential reactions to tax-exempt headlines warrants swapping lower quality holdings into higher quality credits.
| PORTFOLIO ALLOCATION AS A PERCENTAGE OF NET ASSETS AS OF 10/31/19 | | | |
| Airport | | | 3.2 | % |
| Development | | | 3.2 | % |
| Education | | | 10.4 | % |
| Facilities | | | 6.5 | % |
| General | | | 15.4 | % |
| General Obligation | | | 28.2 | % |
| Medical | | | 7.3 | % |
| Power | | | 1.5 | % |
| Transportation | | | 9.4 | % |
| Utilities | | | 1.5 | % |
| Water | | | 10.7 | % |
| Net Other Assets and Liabilities | | | 2.7 | % |
| TOP TEN HOLDINGS AS A PERCENTAGE OF NET ASSETS AS OF 10/31/19 | | | |
| Northern Virginia Transportation Authority, 5.0%, 6/1/30 | | | 4.1 | % |
| County of Arlington VA, 5.0%, 8/15/30 | | | 3.3 | % |
| James City County Economic Development Authority, 5.0%, 6/15/30 | | | 2.9 | % |
| Metropolitan Washington Airports Authority Revenue, 5.0%, 10/1/43 | | | 2.7 | % |
| Virginia Commonwealth Transportation Board, 5.0%, 3/15/25 | | | 2.7 | % |
| City of Norfolk VA, 5.0%, 8/1/47 | | | 2.6 | % |
| Commonwealth of Virginia, 5.0%, 6/1/23 | | | 2.6 | % |
| County of Henrico VA Water & Sewer Revenue, 4.0%, 5/1/32 | | | 2.6 | % |
| Hampton Roads Transportation Accountability Commission, 5.0%, 7/1/42 | | | 2.6 | % |
| Virginia College Building Authority, 5.0%, 2/1/23 | | | 2.5 | % |
MADISON TAX-FREE NATIONAL FUND
INVESTMENT STRATEGY HIGHLIGHTS
The Madison Tax-Free National Fund seeks to achieve its investment objective by investing at least 80% of its net assets in municipal bonds that are exempt from federal income taxes. These securities may be issued by state governments, their political subdivisions (for example, cities and counties) and public authorities (for example, school districts and housing authorities). The Fund may also invest in bonds that, under federal law, are exempt from federal and state income taxation, such as bonds issued by the District of Columbia, Puerto Rico, the Virgin Islands and Guam. The Fund invests in intermediate and long-term bonds having average, aggregate maturities (at the portfolio level) of 7 to 15 years. The primary difference between this Fund and the Madison Tax-Free Virginia Fund is that the Madison Tax-Free Virginia Fund will invest in bonds that are exempt from federal and state income tax for residents of Virginia, while this Fund will invest in bonds that are exempt from federal income tax.
6
Madison Funds | Management’s Discussion of Fund Performance - Madison Tax-Free National Fund - continued | October 31, 2019
PERFORMANCE DISCUSSION
Cumulative Performance of $10,000 Investment1

| Average Annual Total Return through October 31, 20191 |
| | % Return Without Sales Charge | |
| | | 1 Year | | 3 Years | | 5 Years | | 10 Years | |
| Class Y Shares6 | | 8.20 | | 2.37 | | 2.69 | | 3.35 | |
| ICE Bank of America Merrill Lynch 1-22 Yr Municipal Securities Index | | 8.65 | | 3.25 | | 3.19 | | 4.04 | |
See accompanying Notes to Management’s Discussion of Fund Performance.
The Madison Tax-Free National Fund (Class Y) returned 8.20% for the one-year period, underperforming the ICE Bank of America Merrill Lynch 1-22 Year Municipal Securities Index, which returned 8.65%. The Morningstar Muni National Long peer group returned 9.96%.
The Fund’s relative performance is attributable to yield curve positioning, sector allocation and security selection within the BBB quality bucket. Specific to maturity profile, the Fund benefited from the less than benchmark exposure to maturities less than five years as well as its slightly higher exposure to maturities between eight and 17 years where the yield curve was more positively sloped. Also additive to return was the Fund’s allocation to local general obligation bonds and revenue bonds which handily outperformed comparable state general obligations. Although the Fund was less exposed to BBB-rated issues, positive relative performance was generated by the Fund’s lower quality securities which held their value better as risk premiums shifted.
The municipal bond market has benefited from the favorable U.S. economic environment as evidenced by increasing state and local tax receipts as well as benign default trends. Most state and local governments appear to be on solid financial footing with no immediate need to battle budget woes. Fortunately for these issuers, history suggests tax receipts are likely to keep growing until the U.S. economy contracts. However, over the longer term we believe many municipalities are faced with not necessarily new but difficult challenges such as limited federal funding, unfunded pension liabilities and climate-related events. Typically, these general obligations issuers have enough time to formulate and implement corrective actions.
We envision demand for tax-exempt securities to remain robust during the coming quarters as higher wage earners reposition assets to lessen federal taxes. Lower corporate tax rates amplify the likelihood institutional investors will have a diminished appetite for federally tax-exempt holdings. This is especially true for banks which have reduced muni holdings in recent quarters. The supply of muni bonds is apt to remain in-line with investor demand as issuers take advantage of lower interest rates by refunding higher cost debt and funding approved projects. However, we anticipate tax-exempt investors will become more attentive to the absolute level of yields as well as relative valuations versus other fixed income sectors.
In general, investors seem to be geared towards locking in the highest yields possible while dismissing signs of potential trouble spots percolating within the muni market. While it is true muni defaults are rare, the number of impairments is experiencing an upsurge. The good news is a vast majority of impairments and defaults are within the riskiest sectors including retirement communities, local housing, land secured, charter schools and hospitals. Without taking uncompensated risk, we foresee tax-exempt investors taking advantage of the upward sloping muni curve by positioning a portion of holdings beyond 12 years. In addition, the nearly identical yields for munis with maturities less than seven years poses an opportunity for investors to reposition five-to-seven-year paper into shorter maturities. The result of this two-pronged approach is a barbell portfolio (e.g. a portfolio with limited intermediate maturities). Lastly, we believe uncertainties about the economy and investors’ potential reactions to tax-exempt headlines warrants swapping lower quality holdings into higher quality credits.
STATE ALLOCATION AS A PERCENTAGE OF NET ASSETS AS OF 10/31/19 |
| Alabama | 3.1% |
| Arkansas | 0.9% |
| California | 0.6% |
| Colorado | 2.1% |
| Florida | 7.2% |
| Georgia | 3.7% |
| Hawaii | 2.2% |
| Idaho | 2.3% |
| Illinois | 8.6% |
| Indiana | 2.5% |
| Iowa | 2.0% |
| Kansas | 3.6% |
| Kentucky | 2.2% |
| Michigan | 3.1% |
| Mississippi | 2.5% |
| Missouri | 2.0% |
| New Jersey | 5.5% |
| New York | 4.2% |
| North Carolina | 3.7% |
| Ohio | 2.4% |
| Oklahoma | 4.6% |
| Pennsylvania | 1.8% |
| South Carolina | 1.1% |
| Tennessee | 2.3% |
| Texas | 9.5% |
| Utah | 1.6% |
| Virginia | 6.8% |
| Washington | 1.0% |
| West Virginia | 2.3% |
| Wisconsin | 1.9% |
| Net Other Assets and Liabilities | 2.7% |
| | |
| TOP TEN HOLDINGS AS A PERCENTAGE OF NET ASSETS AS OF 10/31/19 | | | |
| City of Austin TX, General Obligation, 5.0%, 9/1/26 | | | 2.8 | % |
| Cook County School District No. 111, General Obligation, 5.0%, 12/1/35 | | | 2.7 | % |
| Hampton Roads Sanitation District, 5.0%, 10/1/36 | | | 2.7 | % |
| Western Regional Jail Authority, 5.0%, 12/1/34 | | | 2.6 | % |
| City of Wichita KS, General Obligation, 5.0%, 12/1/24 | | | 2.5 | % |
| Vanderburgh County Redevelopment District, 5.0%, 2/1/26 | | | 2.5 | % |
| Caddo County Governmental Building Authority Revenue, 5.0%, 9/1/40 | | | 2.5 | % |
| Medical Center Educational Building Corp., 5.0%, 6/1/30 | | | 2.5 | % |
| Cleveland-Cuyahoga County Port Authority, 5.0%, 7/1/24 | | | 2.4 | % |
| Orlando Utilities Commission, 5.0%, 10/1/22 | | | 2.4 | % |
MADISON HIGH QUALITY BOND FUND
INVESTMENT STRATEGY HIGHLIGHTS
The Madison High Quality Bond Fund seeks to achieve its investment objective through diversified investments in a broad range of corporate debt securities, obligations of the U.S. Government and its agencies, and money market instruments. In seeking to achieve the Fund’s goals, the Fund’s management will (1) shorten or lengthen the dollar weighted average maturity of the Fund based on its anticipation of the movement of interest rates (the dollar weighted average maturity is expected to be ten years or less), and (2) monitor the yields of the various bonds that satisfy the Fund’s investment guidelines to determine the best combination of yield, credit risk and diversification for the Fund. Under normal market conditions, the Fund will invest at least 80% of its net assets in higher quality bond issues and, therefore, intends to maintain an overall portfolio quality rating of A by Standard & Poor’s and/or A2 by Moody’s.
7
Madison Funds | Management’s Discussion of Fund Performance-Madison High Quality Bond Fund- continued | October 31, 2019
PERFORMANCE DISCUSSION
Cumulative Performance of $10,000 Investment1

| Average Annual Total Return through October 31, 20191 | |
| | % Return Without Sales Charge | |
| | | 1 Year | | 3 Years | | 5 Years | | 10 Years | |
| Class Y Shares6 | | 6.43 | | 1.81 | | 1.64 | | 1.85 | |
| Bloomberg Barclays U.S. Intermediate Govt/Credit A+ Bond Index | | 8.18 | | 2.35 | | 2.36 | | 2.71 | |
See accompanying Notes to Management’s Discussion of Fund Performance.
The Madison High Quality Bond Fund (Class Y) returned 6.43% for the one-year period, lagging the benchmark Bloomberg Barclays U.S. Intermediate Government/Credit A+ Bond Index, which returned 8.18%. The Fund outperformed the Morningstar Short-Term Bond category peer group’s return of 4.85% over the same period.
Relative performance over this period was largely a duration story. In a period of falling interest rates, the value of longer bonds with a built-in yield advantage rises. Longer bonds, in general, outperformed shorter bonds. As a result, Fund performance versus the benchmark was adversely impacted by its relatively conservative duration posture over the trailing 12-month period. The largest impact was a result of underweighting 7-10 year Treasury securities as they rallied sharply over the period. Conversely the Fund is currently in the Morningstar Short-Term Bond category which it outperformed as a result of having a longer average duration than the typical Fund within that category.
The past twelve months have brought increased volatility to financial markets as heightened domestic and geopolitical uncertainty cast doubt upon growth prospects around the world. Against this backdrop, central banks around the world extended their efforts to ease monetary policy. Citing slowing global growth and uncertainties around trade, the Federal Reserve Bank (Fed) pivoted toward more accommodative policy as they lowered the federal funds rate three times in 2019 at the July, September, and October Federal Open Market Committee (FOMC) meetings, bringing the target range to 1.50%-1.75%.
In response, Treasury yields moved sharply lower over the period. The 10-year Treasury note which began the period at 2.85%, traded as low as 1.46% in early September before closing the period at 1.49%, a decline of nearly 133 basis points (a basis point is one one-hundredth of a percent). Lower yields translated into positive returns for bond holders over the period. Overall, fixed income returns remain strong across asset classes for the trailing twelve-month period with the highest relative returns going to longer, lower quality, asset classes.
Fixed income investors have been rewarded handsomely over the past year, as yields have fallen, enjoying above-average returns. From this point forward, yields appear fully valued, elevating risk levels. With that in mind, our intent at the end of the period was to position portfolios with a defensive duration posture and high-quality bias designed to protect principal should rates rise or volatility increase.
| PORTFOLIO ALLOCATION AS A PERCENTAGE OF NET ASSETS AS OF 10/31/19 |
| Consumer Discretionary | | | 2.3 | % |
| Consumer Staples | | | 1.6 | % |
| Energy | | | 1.4 | % |
| Fannie Mae | | | 4.4 | % |
| Financials | | | 18.8 | % |
| Freddie Mac | | | 4.5 | % |
| Health Care | | | 3.4 | % |
| Industrials | | | 0.6 | % |
| Information Technology | | | 11.5 | % |
| Short-Term Investments | | | 4.5 | % |
| U.S. Treasury Notes | | | 48.5 | % |
| Net Other Assets and Liabilities | | | (1.5 | )% |
| | | | | |
| TOP TEN HOLDINGS AS A PERCENTAGE OF NET ASSETS AS OF 10/31/19 |
| U.S. Treasury Note, 2.375%, 5/15/27 | | | 5.2 | % |
| U.S. Treasury Note, 2.125%, 5/15/25 | | | 4.6 | % |
| Freddie Mac, 2.375%, 1/13/22 | | | 4.5 | % |
| Fannie Mae, 1.375%, 10/7/21 | | | 4.4 | % |
| U.S. Treasury Note, 1.625%, 3/15/20 | | | 3.9 | % |
| U.S. Treasury Note, 2.375%, 8/15/24 | | | 3.7 | % |
| U.S. Treasury Note, 2.750%, 11/15/23 | | | 3.5 | % |
| U.S. Treasury Note, 2.625%, 11/15/20 | | | 3.4 | % |
| U.S. Treasury Note, 2.500%, 8/15/23 | | | 3.4 | % |
| U.S. Treasury Note, 3.625%, 2/15/20 | | | 3.3 | % |
MADISON CORE BOND FUND
INVESTMENT STRATEGY HIGHLIGHTS
Under normal market conditions, the Madison Core Bond Fund invests at least 80% of its net assets in bonds. To keep current income relatively stable and to limit share price volatility, the Fund emphasizes investment grade securities and maintains an intermediate (typically 3-7 year) average portfolio duration, with the goal of being between 85-115% of the market benchmark duration. The Fund strives to add incremental return in the portfolio by making strategic decisions related to credit risk, sector exposure and yield curve positioning. The Fund may invest in corporate debt securities, U.S. Government debt securities, foreign government debt securities, non-rated debt securities, and asset-backed, mortgage-backed and commercial mortgage-backed securities.
PERFORMANCE DISCUSSION
Cumulative Performance of $10,000 Investment1

| Average Annual Total Return through October 31, 20191 |
| | | % Return Without Sales Charge | | % Return After Sales Charge5 | |
| | | 1
Year | | 3
Years | | 5
Years | | 10
Years | | Since
4/19/13
Inception | | 1
Year | | 3
Years | | 5
Years | | 10
Years | |
| Class A Shares2 | | 10.37 | | 2.85 | | 2.81 | | 2.79 | | – | | 5.40 | | 1.28 | | 1.88 | | 2.31 | |
| Class B Shares3 | | 9.65 | | 2.08 | | 2.07 | | 2.17 | | – | | 5.15 | | 0.95 | | 1.69 | | 2.17 | |
| Class Y Shares6 | | 10.67 | | 3.12 | | 3.09 | | 3.05 | | – | | – | | – | | – | | – | |
| Class R6 Shares7 | | 10.82 | | 3.23 | | 3.20 | | – | | 2.65 | | – | | – | | – | | – | |
| Bloomberg Barclays U.S. Aggregate Bond Index | | 11.51 | | 3.29 | | 3.24 | | 3.73 | | 2.82 | | NA | | NA | | NA | | NA | |
See accompanying Notes to Management’s Discussion of Fund Performance.
8
Madison Funds | Management’s Discussion of Fund Performance - Madison Core Bond Fund - continued | October 31, 2019
The Madison Core Bond Fund (Class Y) returned 10.67% for the one-year period, lagging the Fund’s benchmark, the Bloomberg Barclays U.S. Aggregate Bond Index®, which gained 11.51%. The Fund outperformed the Morningstar Intermediate Core Bond peer group, which gained 10.23% for the period.
The primary drivers of Fund performance versus the benchmark over the last year was owning longer maturity Treasuries as well as shorter maturity corporate and securitized bonds. Performance was also impacted by the yield advantage over the benchmark. The Fund had a yield advantage of thirty basis points (a basis point is one one-hundredth of a percent) during the last year. This was primarily due to an overweight to corporate and securitized bonds. The Fund also held a small position in high-yield corporate bonds which helped the overall portfolio yield.
The Fund’s securitized bond allocation underperformed the Bloomberg Barclay’s U.S. Securitized Index® over the one-year period. The Fund’s positions in non-agency mortgage backed securities (MBS) and an overweight to fifteen-year MBS both detracted from performance. A significant amount of the non-agency MBS owned was backed by borrowers with large mortgage balances. As interest rates fell, the incentive for these borrowers to refinance increased thus reducing the value of non-agency MBS. The Fund’s allocation to fifteen-year and twenty-year MBS dragged on performance given the underperformance versus thirty-year MBS on a total return basis given falling interest rates.
Finally, the Fund benefited from a slightly longer duration on average during the trailing one-year period. Since October 2018, the two-year, ten-year and thirty-year Treasury yields fell 134, 145 and 121 basis points, respectively. The Fund’s duration was between 95% and 105% of the benchmark’s over the last year. The Fund has an overweight to twenty and thirty-year Treasury bonds which performed well over the last year given lower inflation and slowing economic growth.
Looking forward, the Fund’s managers plan to reduce exposure to corporate bonds given historically tight valuations and slightly worsening fundamentals. Any proceeds from the sale of corporate bond will likely be used to buy more MBS and Treasuries to increase the overall quality of the Fund.
| PORTFOLIO ALLOCATION AS A PERCENTAGE OF NET ASSETS AS OF 10/31/19 |
| Asset Backed Securities | | | 4.7 | % |
| Collateralized Mortgage Obligations | | | 5.8 | % |
| Commercial Mortgage-Backed Securities | | | 3.5 | % |
| Corporate Notes and Bonds | | | 23.8 | % |
| Long Term Municipal Bonds | | | 1.3 | % |
| Mortgage Backed Securities | | | 20.1 | % |
| Short-Term Investments | | | 3.5 | % |
| U.S. Government and Agency Obligations | | | 33.8 | % |
| Net Other Assets and Liabilities | | | 3.5 | % |
| | | | | |
| TOP TEN HOLDINGS AS A PERCENTAGE OF NET ASSETS AS OF 10/31/19 | | | | |
| U.S. Treasury Notes, 2.625%, 2/15/29 | | | 3.7 | % |
| U.S. Treasury Notes, 2.0%, 11/15/21 | | | 3.3 | % |
| U.S. Treasury Notes, 3.125%, 5/15/21 | | | 2.7 | % |
| U.S. Treasury Notes, 2.125%, 3/31/24 | | | 2.3 | % |
| U.S. Treasury Notes, 2.625%, 11/15/20 | | | 2.0 | % |
| U.S. Treasury Notes, 2.875%, 5/15/28 | | | 1.8 | % |
| U.S. Treasury Notes, 1.500%, 8/15/26 | | | 1.7 | % |
| U.S. Treasury Bonds, 3.750%, 8/15/41 | | | 1.7 | % |
| U.S. Treasury Bonds, 3.0%, 5/15/45 | | | 1.5 | % |
| U.S. Treasury Bonds, 4.500%, 5/15/38 | | | 1.4 | % |
MADISON CORPORATE BOND FUND
INVESTMENT STRATEGY HIGHLIGHTS
The Madison Corporate Bond Fund seeks to achieve its investment objective through diversified investment in a broad range of corporate debt securities. Under normal market conditions, the Fund will invest at least 80% of its net assets in income-producing corporate bonds, and at least 80% of its assets in investment grade bonds. Up to 20% of the Fund’s assets may be invested in non-investment grade fixed-income securities commonly referred to as “high yield” or “junk” bonds. The Fund expects to maintain an average overall portfolio quality of BBB or better, an overall portfolio dollar weighted average maturity of 15 years or less, and an overall portfolio duration within 25% of the Bloomberg Barclays U.S. Corporate Bond Index benchmark (with the flexibility to occasionally vary from the benchmark by up to 50% when the investment adviser believes interest rates are likely to materially change).
PERFORMANCE DISCUSSION
Cumulative Performance of $10,000 Investment1

| Average Annual Total Return through October 31, 20191 |
| | | % Return Without Sales Charge | |
| | | 1 Year | | | 3 Years | | | 5 Years | | | 10 Years | |
| Class Y Shares6 | | 14.32 | | | 4.48 | | | 4.25 | | | 4.32 | |
| Bloomberg Barclays U.S. Corporate Bond Index | | 15.37 | | | 5.00 | | | 4.64 | | | 5.55 | |
See accompanying Notes to Management’s Discussion of Fund Performance.
It was a strong year for corporate bond returns as Madison Corporate Bond Fund (Class Y) returned 14.32% for the period, trailing its benchmark, the Bloomberg Barclays U.S. Corporate Bond Index, which returned 15.37%. The Fund’s Morningstar Corporate Bond peer group returned 13.29% for the same period. Versus its benchmark, the Fund benefited from its overweight of BBB securities and some new issue purchases, where yield premiums were more attractive than those available in the secondary market. However, the Fund was negatively impacted by its lower duration than the benchmark and its underweight to the thirty-year part of the yield curve. Interest rates fell significantly during the past year, which caused longer-term securities to significantly outperform shorter-term securities. Despite having a lower duration than the benchmark, the Fund’s yield to maturity is close to the benchmark. Versus the peer group, the Fund outperformed over the past year due to its longer duration than its peers and its underweight to lower-quality high yield securities. Lower-quality high yield securities posted negative total returns over the past year, as investors remain concerned about more-challenged companies being able to repay or refinance their large debt loads given weaker global growth and the potential for slowing growth in the United States.
| PORTFOLIO ALLOCATION AS A PERCENTAGE OF NET ASSETS AS OF 10/31/19 |
| Communication Services | | | 9.0 | % |
| Consumer Discretionary | | | 6.5 | % |
| Consumer Staples | | | 0.8 | % |
| Energy | | | 16.2 | % |
| Financials | | | 38.2 | % |
| Health Care | | | 3.9 | % |
| Industrials | | | 8.4 | % |
| Information Technology | | | 6.0 | % |
| Materials | | | 5.4 | % |
| Real Estate | | | 0.7 | % |
| Short-Term Investments | | | 3.3 | % |
| Utilities | | | 1.0 | % |
| Net Other Assets and Liabilities | | | 0.6 | % |
9
Madison Funds | Management’s Discussion of Fund Performance - Madison Corporate Bond Fund - continued | October 31, 2019
| TOP TEN HOLDINGS AS A PERCENTAGE OF NET ASSETS AS OF 10/31/19 |
| Valero Energy Corp., 6.625%, 6/15/37 | | | 2.6 | % |
| AT&T Inc., 4.250%, 3/1/27 | | | 1.8 | % |
| Citigroup Inc., 2.700%, 10/27/22 | | | 1.7 | % |
| Goldman Sachs Group Inc./The, 3.500%, 11/16/26 | | | 1.7 | % |
| Huntington National Bank/The, 3.550%, 10/6/23 | | | 1.7 | % |
| KeyCorp, 5.100%, 3/24/21 | | | 1.7 | % |
| Berkshire Hathaway Finance Corp., 4.200%, 8/15/48 | | | 1.6 | % |
| Verizon Communications Inc., 4.400%, 11/1/34 | | | 1.5 | % |
| Affiliated Managers Group Inc., 4.250%, 2/15/24 | | | 1.4 | % |
| CRH America Inc., 3.875%, 5/18/25 | | | 1.4 | % |
MADISON HIGH INCOME FUND
INVESTMENT STRATEGY HIGHLIGHTS
The Madison High Income Fund invests primarily in lower-rated, higher-yielding, income bearing securities, such as “junk” bonds. Because the performance of these securities has historically been strongly influenced by economic conditions, the Fund may rotate securities selection by business sector according to economic outlook. Under normal market conditions, the Fund invests at least 80% of its net assets in bonds rated lower than investment grade (BBB/Baa) and their unrated equivalents or other high-yielding securities.
PERFORMANCE DISCUSSION
Cumulative Performance of $10,000 Investment1

| Average Annual Total Return through October 31, 20191 |
| | | % Return Without Sales Charge | | % Return After Sales Charge5 | |
| | | 1 Year | | | 3 Years | | | 5 Years | | | 10 Years | | 1 Year | | | 3 Years | | | 5 Years | | | 10 Years | |
| Class A Shares2 | | 5.68 | | | 3.88 | | | 3.21 | | | 5.59 | | 0.98 | | | 2.32 | | | 2.26 | | | 5.11 | |
| Class B Shares3 | | 4.92 | | | 3.12 | | | 2.42 | | | 4.95 | | 0.42 | | | 2.04 | | | 2.10 | | | 4.95 | |
| Class Y Shares6 | | 6.07 | | | 4.19 | | | 3.50 | | | 5.89 | | – | | | – | | | – | | | – | |
| ICE Bank of America Merrill Lynch U.S. High Yield Constrained Index | | 8.32 | | | 6.04 | | | 5.18 | | | 7.67 | | NA | | | NA | | | NA | | | NA | |
See accompanying Notes to Management’s Discussion of Fund Performance.
The Madison High Income Fund (Class Y) returned 6.07% over the 12-month period ended October 31, 2019, lagging the ICE BofAML U.S. High Yield Constrained Index’s ®8.32% total return. The Fund also trailed its Morningstar High Yield Bond Category peer group, which returned 7.06%.
The high yield market experienced its fourth consecutive full-year of positive total returns. We believe the strong positive trend over the past year was driven by several ongoing factors, including 1) multiple interest rate cuts, which supported a rally in treasury bond prices and, thus, higher prices for high yield bonds; 2) a strong new issue market for high yield bonds, which has allowed companies to refinance debt at very attractive coupons; and 3) solid company-specific fundamentals, on the whole.
Within the high yield rating categories, BB-rated bonds had the best annual total return at 11.75%, while B-rated bonds trailed at 7.34% and CCC-rated bonds experienced a loss of -3.03%. While higher quality credit performed well, much of the outperformance occurred in longer-duration bonds that mature in seven years or greater. The total return of the longer-duration bonds nearly doubled the total return of shorter duration bonds that mature in five years or less. The Fund was underweight longer-duration bonds during the year.
The Fund’s performance was negatively impacted by a high cash balance in a rising market while the comparable benchmark has no cash balance. In addition, the Fund’s performance was hampered by underexposure to the volatile Basic Industry Sector, in tandem with sluggish returns from bond selection within that same sector. The Fund also underperformed in its bond selection within the Services and Media Sectors. Partially offsetting these negatives, the Fund had a positive contribution to performance from its bond selection within the Energy and Telecommunications Sectors, as well as having an overweight in the Consumer Goods Sector.
With the recent spread tightening and more difficult upcoming corporate earnings comparisons, we see little on the near-term horizon to drive further material price appreciation. That said, given the supportive Federal Reserve stance on interest rate policy, we may look to extend the duration of the overall portfolio slightly via partial use of the excess cash balance. The Fund should continue to emphasize BB-rated and B-rated corporate bonds as it maintains its bias towards higher quality credit.
Regarding our market outlook for the next year, we anticipate high yield’s total return could be relatively flat and, given unattractive high yield bond valuations, we believe conservative positioning remains prudent. Thus, we anticipate a potential decline in bond prices could offset the positive return generated by the coupons. Sector exposure wise, we ended the period with an overweight in Consumer Goods. We also have a modest overweight in Services, Media and Financial Services. Our largest underweighted sectors include Basic Industry, Healthcare, Technology & Electronics and Telecom. The portfolio is also underweight CCC-rated bonds.
| PORTFOLIO ALLOCATION AS A PERCENTAGE OF NET ASSETS AS OF 10/31/19 |
| Communication Services | | | 6.2 | % |
| Consumer Discretionary | | | 17.9 | % |
| Consumer Staples | | | 8.6 | % |
| Energy | | | 14.7 | % |
| Exchange Traded Funds | | | 2.5 | % |
| Financials | | | 9.8 | % |
| Health Care | | | 4.6 | % |
| Industrials | | | 16.5 | % |
| Materials | | | 2.6 | % |
| Real Estate | | | 1.6 | % |
| Short-Term Investments | | | 11.1 | % |
| U.S. Treasury Bills | | | 5.0 | % |
| Utilities | | | 3.0 | % |
| Net Other Assets and Liabilities | | | (4.1 | )% |
| | | | | |
| TOP TEN HOLDINGS AS A PERCENTAGE OF NET ASSETS AS OF 10/31/19 |
| State Street Navigator Securities Lending Government Money Market Portfolio, 1.75% | | | 5.3 | % |
| U.S. Treasury Bill, 1.764%, 11/5/19 | | | 5.0 | % |
| Outfront Media Capital LLC / Outfront Media Capital Corp., 5.625%, 2/15/24 | | | 2.7 | % |
| iShares iBoxx High Yield Corporate Bond ETF | | | 2.5 | % |
| Murphy Oil USA Inc., 5.625%, 5/1/27 | | | 2.3 | % |
| Unit Corp., 6.625%, 5/15/21 | | | 2.1 | % |
| Simmons Foods Inc., 5.750%, 11/1/24 | | | 2.0 | % |
| American Midstream Partners L.P. / American Midstream Finance Corp., 9.500%, 12/15/21 | | | 1.9 | % |
| Carrizo Oil & Gas Inc., 6.250%, 4/15/23 | | | 1.9 | % |
| Pilgrim’s Pride Corp., 5.750%, 3/15/25 | | | 1.9 | % |
MADISON DIVERSIFIED INCOME FUND
INVESTMENT STRATEGY HIGHLIGHTS
The Madison Diversified Income Fund seeks income by investing in a broadly diversified array of securities including bonds, common stocks, real estate securities, foreign market bonds and stocks and money market instruments. Bonds, stock and cash components will vary, reflecting the portfolio managers’ judgments of the relative availability of attractively yielding and priced stocks and bonds; however, under normal market conditions, the Fund’s portfolio managers generally attempt to target a 40% bond and 60% stock investment allocation. Nevertheless, bonds
10
Madison Funds | Management’s Discussion of Fund Performance - Madison Diversified Income Fund - continued | October 31, 2019
may constitute up to 80% of the Fund’s assets, stocks will constitute up to 70% of the Fund’s assets, real estate securities will constitute up to 25% of the Fund’s assets, foreign stocks and bonds will constitute up to 25% of the Fund’s assets and money market instruments may constitute up to 25% of the Fund’s assets. Although the Fund is permitted in invest up to 80% of its assets in lower credit quality bonds, under normal circumstances, the Fund intends to limit the investment in lower credit quality bonds to less than 50% of the Fund’s assets.
PERFORMANCE DISCUSSION
Cumulative Performance of $10,000 Investment1
| Average Annual Total Return through October 31, 20191 |
| | | % Return Without Sales Charge | | % Return After Sales Charge5 | |
| | | 1
Year | | 3
Years | | 5
Years | | 10
Years | | Since
7/31/12
Inception | | 1
Year | | 3
Years | | 5
Years | | 10
Years | | Since
7/31/12
Inception | |
| Class A Shares2 | | 13.51 | | 9.81 | | 7.18 | | 8.68 | | – | | 7.01 | | 7.66 | | 5.93 | | 8.04 | | – | |
| Class B Shares3 | | 12.64 | | 8.97 | | 6.37 | | 8.04 | | – | | 8.14 | | 7.98 | | 6.06 | | 8.04 | | – | |
| Class C Shares4 | | 12.72 | | 8.98 | | 6.39 | | – | | 7.17 | | 11.72 | | 8.98 | | 6.39 | | – | | 7.17 | |
| ICE Bank of America Merrill Lynch US Corp, Govt & Mortgage Index | | 11.82 | | 3.38 | | 3.32 | | 3.77 | | 2.76 | | NA | | NA | | NA | | NA | | NA | |
| S&P 500® Index | | 14.33 | | 14.91 | | 10.78 | | 13.70 | | 13.85 | | NA | | NA | | NA | | NA | | NA | |
| Custom Blended Index (50% Fixed 50% Equity) | | 13.54 | | 9.24 | | 7.20 | | 8.87 | | 8.36 | | NA | | NA | | NA | | NA | | NA | |
See accompanying Notes to Management’s Discussion of Fund Performance.
The Madison Diversified Income Fund (Class A at NAV) returned 13.51% for the one-year period, nearly matching its blended benchmark index (50% Bank of America Merrill Lynch U.S. Corporate, Government and Mortgage Index and 50% S&P 500® Index) which returned 13.54%. The Fund outperformed its Morningstar Moderate Allocation category peer group, which advanced 10.11% over the last year.
The equity portion of the Madison Diversified Income Fund performed well compared to the S&P 500 Index, returning 16.5% for the twelve-month period ending October 31, 2019, which outperformed the S&P 500 return of 14.33%. Sector allocation was detractive and stock selection was strong and accounted for all of the Fund outperformance. For sector allocation, an underweight position in Technology and an overweight position in Energy adversely impacted the portfolio. In terms of stock selection, there were positive results in Consumer Staples, Consumer Discretionary, Energy, Health Care, Utilities and Materials, while there were negative results in Technology, Financials, Industrials and Communication Services. Within Consumer Discretionary, global coffee restaurant chain Starbucks (SBUX) was the best performing stock in the portfolio. In Consumer Staples, consumer product company Procter & Gamble (PG) and chocolate manufacturer Hershey (HSY) contributed nicely to performance. Within Industrials, industrial distributor Fastenal (FAST) outperformed the market. Another notable outperforming stock was renewable power firm NextEra (NEE) in Utilities. On the negative side, in Energy, integrated oil company Exxon Mobile (XOM) was the worst performing stock in the portfolio. Within Financials, exchange operator CME Group (CME) and regional banks PNC Financial Services Group (PNC) and Wells Fargo each trailed the market. Another notable underperforming stock was pharmaceutical firm Pfizer (PFE) in Health Care. The Fund continues to hold all stocks mentioned above except for PNC and WFC which were sold.
The fixed income portion of the Madison Diversified Income Fund also performed well over the last twelve months keeping pace with the Bank of America Merrill Lynch US Corporate, Government, and Mortgage Index. Fixed income performance was significantly aided by the Fund maintaining a slightly longer maturity posture relative to the benchmark during a period of sharply falling interest rates. This duration positioning helped produce benchmark like returns over the trailing 12 months as 10-year U.S. Treasury rates fell from 3.14% at the beginning of the period to 1.69% at the end.
The primary drivers of Fund performance versus the benchmark over the last year was owning longer maturity Treasuries as well as shorter maturity corporate and securitized bonds. Performance was also impacted by maintaining a yield advantage over the benchmark. The Fund’s yield advantage resulted from an overweight to corporate and securitized bonds. The Fund also held a small position in high yield corporate bonds which helped the overall portfolio yield.
The Fund’s securitized bond allocation underperformed the Bloomberg Barclay’s U.S. Securitized Index® over the one-year period. The Fund’s positions in non-agency mortgage backed securities (MBS) and an overweight to fifteen-year MBS both detracted from performance. As interest rates fell, the incentive for borrowers to refinance increased thus reducing the value of non-agency MBS. The Fund’s allocation to fifteen-year and twenty-year MBS dragged on performance given the underperformance versus thirty-year MBS on a total return basis given falling interest rates.
Finally, the Fund benefited from a slightly longer duration on average during the trailing one-year period. Since October 2018, the two-year, ten-year and thirty-year Treasury yields fell 134, 145 and 121 basis points (one basis point is equal to one-hundredth of one percent of yield), respectively. The Fund’s duration was between 95% and 105% of the benchmark’s over the last year. The Fund has an overweight to twenty and thirty-year Treasury bonds which performed well over the last year given lower inflation and slowing economic growth.
Looking forward, the Fund’s managers plan to reduce exposure to corporate bonds given historically tight valuations and slightly worsening fundamentals. Any proceeds from the sale of corporate bond will likely be used to buy more MBS and Treasuries to increase the overall quality of the Fund.
We believe the Madison Diversified Income Fund remains well equipped to navigate a dynamic and changing investment landscape. The Fund remains positioned with high-quality stocks and a conservative maturity posture with meaningful allocation to domestic credit and mortgage sectors in bonds. The Fund’s approach to both interest rate risk and sector allocations risk is designed to help protect client principal and provide the flexibility required to take advantage of opportunities should markets adjust to higher interest rates and equity market volatility.
| PORTFOLIO ALLOCATION AS A PERCENTAGE OF NET ASSETS AS OF 10/31/19 |
| Asset Backed Securities | | | 1.7 | % |
| Collateralized Mortgage Obligations | | | 1.4 | % |
| Commercial Mortgage-Backed Securities | | | 1.3 | % |
| Common Stocks | | | 67.8 | % |
| Corporate Notes and Bonds | | | 9.5 | % |
| Long Term Municipal Bonds | | | 0.8 | % |
| Mortgage Backed Securities | | | 6.9 | % |
| Short-Term Investments | | | 1.2 | % |
| U.S. Government and Agency Obligations | | | 8.7 | % |
| Net Other Assets and Liabilities | | | 0.7 | % |
11
Madison Funds | Management’s Discussion of Fund Performance - Madison Diversified Income Fund - continued | October 31, 2019
TOP TEN HOLDINGS AS A PERCENTAGE OF NET ASSETS AS OF 10/31/19
| Comcast Corp. | | | 2.7 | % |
| JPMorgan Chase & Co. | | | 2.6 | % |
| Verizon Communications Inc. | | | 2.5 | % |
| US Bancorp | | | 2.3 | % |
| Medtronic PLC | | | 2.1 | % |
| Texas Instruments Inc. | | | 2.1 | % |
| Exxon Mobil Corp. | | | 2.0 | % |
| Fastenal Co. | | | 2.0 | % |
| Linde PLC | | | 2.0 | % |
| McDonald’s Corp. | | | 2.0 | % |
MADISON COVERED CALL & EQUITY INCOME FUND
INVESTMENT STRATEGY HIGHLIGHTS
The Madison Covered Call & Equity Income Fund invests, under normal market conditions, primarily in common stocks of large- and mid-capitalization companies that are, in the view of the Fund’s investment adviser, selling at a reasonable price in relation to their long-term earnings growth rates. The portfolio managers will allocate the Fund’s assets among stocks in sectors of the economy based upon their views on forward earnings growth rates, adjusted to reflect their views on economic and market conditions and sector risk factors.
The Fund will seek to generate current earnings from option premiums by writing (selling) covered call options on a substantial portion of its portfolio securities. The extent of option writing activity will depend upon market conditions and the portfolio manager’s ongoing assessment of the attractiveness of writing call options on the Fund’s stock holdings. In addition to providing income, covered call writing helps to reduce the volatility (and risk profile) of the Fund by providing downside protection.
PERFORMANCE DISCUSSION
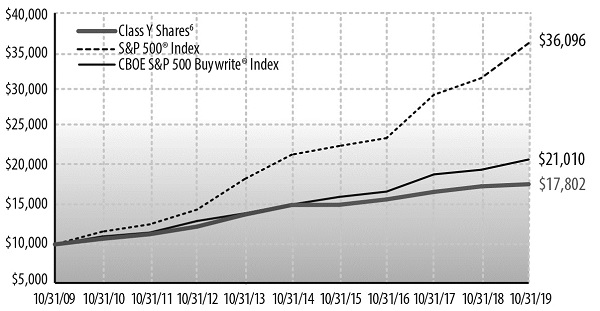
Cumulative Performance of $10,000 Investment1
| Average Annual Total Return through October 31, 20191 | |
| | | % Return Without Sales Charge | | % Return After Sales Charge5 | |
| | | 1 Year | | 3 Years | | 5 Years | | 10 Years | | Since
7/31/12
Inception | | 1 Year | | 3 Years | | 5 Years | | 10 Years | | Since
7/31/12
Inception | |
| Class A Shares2 | | 1.46 | | 3.78 | | 3.07 | | 5.70 | | – | | -4.38 | | 1.73 | | 1.85 | | 5.07 | | – | |
| Class C Shares4 | | 0.68 | | 2.98 | | 2.32 | | – | | 4.63 | | -0.23 | | 2.98 | | 2.32 | | – | | 4.63% | |
| Class Y Shares6 | | 1.60 | | 4.00 | | 3.34 | | 5.94 | | – | | – | | – | | – | | – | | – | |
| Class R6 Shares7 | | 1.82 | | 4.16 | | 3.47 | | – | | 5.81 | | – | | – | | – | | – | | – | |
| S&P 500® Index | | 14.33 | | 14.91 | | 10.78 | | 13.70 | | 13.85 | | NA | | NA | | NA | | NA | | NA | |
| CBOE S&P 500 | | | | | | | | | | | | | | | | | | | | | |
| BuyWrite® Index | | 6.76 | | 7.65 | | 6.73 | | 7.71 | | 6.97 | | NA | | NA | | NA | | NA | | NA | |
See accompanying Notes to Management’s Discussion of Fund Performance.
Madison Covered Call & Equity Fund (Class Y) returned 1.60% for the period, compared to the 14.33% return for the S&P 500 and 6.76% for its benchmark CBOE SS&P 500 BuyWrite Index. Driven by defensive positioning during the period stock selection within the Fund was a negative contributor to total performance, primarily from holdings which were buffeted by the prolonged nature of the U.S./China trade dispute. The uncertainty surrounding this extremely volatile issue was negatively reflected in holdings perceived to be economically sensitive such as those within the Energy and Financial Sectors. Although crude oil prices remained relatively high compared to the past five-year period, they declined approximately 17% during the period, due to concerns over oil demand in a global economy negatively impacted by a trade war between two major trading partners. Similarly, industrial commodity prices such as copper, aluminum and steel were driven lower. The Fund’s positioning within these areas was increased, expecting a quicker resolution to the trade issues and a realization that these sectors and some of the best companies within these sectors were trading at unrealistically low valuations. Among the biggest laggards during the period were Alcoa, Freeport-McMoRan, Range Resources and Apache. Although early in our assessment, we continue to believe that a shift toward economically cyclical companies will occur. A consumer cyclical company, Nordstrom, which was a top performer in the prior period, lagged given the continued concerns over weaker mall-based competitors such as Sears. Technology holdings Qualcomm and First Data were among the top performers given Qualcomm’s resolution of its Apple lawsuit and First Data’s acquisition by Fiserv. The Fund’s gold exposure led by Newmont Mining, was also a positive contributor as gold prices rose almost 25% during the period. Medical device companies such as Baxter International and Medtronic also positively contributed despite the relative underperformance of the Health Care Sector as a whole.
Despite helping during the market decline in late 2018, the Fund’s cash exposure and call option overlay were detractive to performance over the entirety of the period as would be expected during such a strong market advance. From an income-generation perspective the Fund has continued to generate a very attractive yield which has fallen within our expected range.
Given the defensive nature of covered call writing as a strategy, and our conservative approach to actively managing the strategy, protecting downside risk and generating income in a low-yield environment continues to offer a reasonable attraction to investors. With equity markets at all-time highs, an economy that requires constant encouragement to generate below-potential growth and a potentially volatile political environment on the near horizon that may provide significant uncertainty for corporate America, a defensive investment approach seems prudent. We remain steadfastly committed to maintaining a very high-quality equity portfolio with a high level of call option coverage in order to stay true to the purpose and objectives of your Fund.
PORTFOLIO ALLOCATION AS A PERCENTAGE OF TOTAL INVESTMENTS AS OF 10/31/19
| Communication Services | | | 10.4 | % |
| Consumer Discretionary | | | 10.3 | % |
| Consumer Staples | | | 5.7 | % |
| Energy | | | 8.6 | % |
| Exchange Traded Funds | | | 5.4 | % |
| Financials | | | 12.0 | % |
| Health Care | | | 10.4 | % |
| Industrials | | | 5.9 | % |
| Information Technology | | | 10.0 | % |
| Materials | | | 9.8 | % |
| Money Market Funds | | | 9.4 | % |
| Utilities | | | 2.1 | % |
TOP TEN HOLDINGS AS A PERCENTAGE OF NET ASSETS AS OF 10/31/19
| Newmont Goldcorp Corp. | | | 4.3 | % |
| T-Mobile U.S. Inc. | | | 3.2 | % |
| Zimmer Biomet Holdings Inc. | | | 3.1 | % |
| Berkshire Hathaway Inc., Class B | | | 3.0 | % |
| General Dynamics Corp. | | | 3.0 | % |
| Microsoft Corp. | | | 3.0 | % |
| Alphabet Inc., Class C | | | 2.9 | % |
| Baxter International Inc. | | | 2.9 | % |
| JPMorgan Chase & Co. | | | 2.9 | % |
| Lowe’s Cos. Inc. | | | 2.9 | % |
12
Madison Funds | Management’s Discussion of Fund Performance- continued | October 31, 2019
MADISON DIVIDEND INCOME FUND
INVESTMENT STRATEGY HIGHLIGHTS
The Madison Dividend Income Fund invests in equity securities of companies with a market capitalization of over $1 billion and a history of paying dividends, with the ability to increase dividends over time. Under normal market conditions, at least 80% of the Fund’s net assets will be invested in dividend paying equity securities. The Fund typically owns 30-60 securities which generally have a dividend yield of at least the S&P 500’s average yield, a strong balance sheet, a dividend that has been maintained and likely to increase and trades at a high relative dividend yield due to issues viewed by the adviser as temporary, among other characteristics.
PERFORMANCE DISCUSSION
Cumulative Performance of $10,000 Investment1
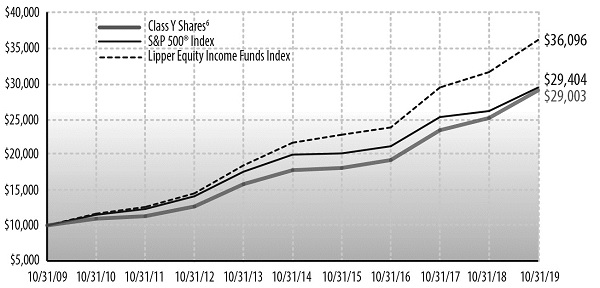
| Average Annual Total Return through October 31, 20191 | |
| | | % Return Without Sales Charge | |
| | | 1 Year | | 3 Years | | 5 Years | | 10 Years | |
| Class Y Shares6 | | 15.48 | | 14.74 | | 10.29 | | 11.24 | |
| S&P 500® Index | | 14.33 | | 14.91 | | 10.78 | | 13.70 | |
| Lipper Equity Income Funds | | 12.69 | | 11.62 | | 8.05 | | 11.39 | |
See accompanying Notes to Management’s Discussion of Fund Performance.
In addition to the S&P 500® broad-based market index reflected in the above chart and table, the Lipper Equity Income Funds Index has been added because of the Fund’s focus on above average dividend yield stocks.
The Madison Dividend Income Fund (Class Y) returned 15.48% for the twelve-month period ending October 31, 2019, which outperformed the S&P 500 Index’s return of 14.33% and its Morningstar peer group, U.S. Large Value, which returned 9.57%. Relative to the index, sector allocation was detractive and stock selection was strong and accounted for all of the Fund outperformance. For sector allocation, an underweight position in Technology and an overweight position in Energy adversely impacted the portfolio. In terms of stock selection, there were positive results in Consumer Staples, Consumer Discretionary, Energy, Health Care, Utilities and Materials, while there were negative results in Technology, Financials, Industrials and Communication Services. Within Consumer Discretionary, global coffee restaurant chain Starbucks (SBUX) was the best performing stock in the portfolio. In Consumer Staples, consumer product company Procter & Gamble (PG) and chocolate snack manufacturer Hershey (HSY) contributed nicely to performance. Within Industrials, industrial distributor Fastenal (FAST) outperformed the market. Another notable outperforming stock was renewable power firm NextEra (NEE) in Utilities. On the negative side, in Energy, integrated oil company Exxon Mobile (XOM) was the worst performing stock in the portfolio. Within Financials, exchange operator CME Group (CME) and regional banks PNC Financial Services Group (PNC) and Wells Fargo each trailed the market. Another notable underperforming stock was pharmaceutical firm Pfizer (PFE) in Health Care. The Fund continues to hold all stocks mentioned above except for PNC and WFC which were sold.
SECTOR ALLOCATION AS A PERCENTAGE OF NET ASSETS AS OF 10/31/19
| Communication Services | | | 7.5 | % |
| Consumer Discretionary | | | 8.5 | % |
| Consumer Staples | | | 7.8 | % |
| Energy | | | 5.3 | % |
| Financials | | | 19.3 | % |
| Health Care | | | 15.1 | % |
| Industrials | | | 13.1 | % |
| Information Technology | | | 14.3 | % |
| Materials | | | 2.8 | % |
| Short-Term Investments | | | 2.1 | % |
| Utilities | | | 4.1 | % |
| Net Other Assets and Liabilities | | | 0.1 | % |
TOP TEN HOLDINGS AS A PERCENTAGE OF NET ASSETS AS OF 10/31/19
| Comcast Corp. | | | 3.9 | % |
| JPMorgan Chase & Co. | | | 3.8 | % |
| Verizon Communications Inc. | | | 3.7 | % |
| US Bancorp | | | 3.4 | % |
| Texas Instruments Inc. | | | 3.1 | % |
| Medtronic PLC | | | 3.0 | % |
| BlackRock Inc. | | | 2.8 | % |
| Caterpillar Inc. | | | 2.8 | % |
| Exxon Mobil Corp. | | | 2.8 | % |
| Linde PLC | | | 2.8 | % |
MADISON LARGE CAP VALUE FUND
INVESTMENT STRATEGY HIGHLIGHTS
The Madison Large Cap Value Fund will, under normal market conditions, maintain at least 80% of its net assets in large cap stocks. The Fund follows a “value” approach, meaning the portfolio managers seek to invest in stocks at prices below their perceived intrinsic value as estimated based on fundamental analysis of the issuing company and its prospects. By investing in value stocks, the Fund attempts to limit the downside risk over time but may also produce smaller gains than other stock funds if their intrinsic values are not realized by the market or if growth-oriented investments are favored by investors. The Fund will diversify its holdings among various industries and among companies within those industries. The Fund typically sells a stock when the fundamental expectations for buying it no longer apply, the price exceeds its intrinsic value or other stocks appear more attractively priced relative to their intrinsic values. The Fund generally holds 25-60 individual securities in its portfolio at any given time.
PERFORMANCE DISCUSSION
Cumulative Performance of $10,000 Investment1
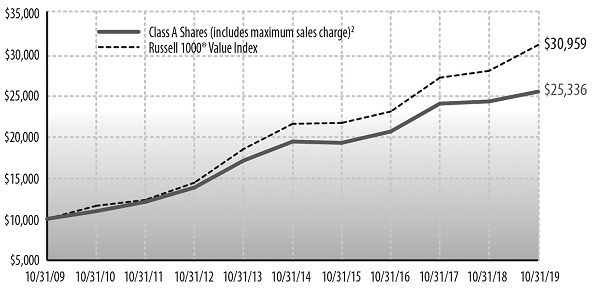
| Average Annual Total Return through October 31, 20191 | |
| | | % Return Without Sales Charge | | % Return After Sales Charge5 | |
| | | 1 Year | | 3 Years | | 5 Years | | 10 Years | | 1 Year | | 3 Years | | 5 Years | | 10 Years | |
| Class A Shares2 | | 4.89 | | 7.26 | | 5.58 | | 9.74 | | -1.13 | | 5.17 | | 4.33 | | 9.10 | |
| Class B Shares3 | | 4.18 | | 6.45 | | 4.80 | | 9.09 | | 0.07 | | 5.58 | | 4.57 | | 9.09 | |
| Class Y Shares6 | | 5.24 | | 7.52 | | 5.85 | | 10.02 | | – | | – | | – | | – | |
| Russell 1000® Value Index | | 11.21 | | 10.51 | | 7.61 | | 11.96 | | NA | | NA | | NA | | NA | |
See accompanying Notes to Management’s Discussion of Fund Performance.
13
Madison Funds | Management’s Discussion of Fund Performance - Madison Large Cap Value Fund - continued | October 31, 2019
The Madison Large Cap Value Fund (Class Y) returned 5.24% for the twelve-month period ending October 31, 2019, which compared to the Russell 1000® Value Index return of 11.21%. The Fund’s Morningstar peer group, Large Cap Value, returned 9.57%. Relative to the index, both sector allocation and stock selection were detractive. For sector allocation, underweight positions in Technology, Health Care and Industrials negatively impacted results, which was partially offset by an overweight position in Utilities. In terms of stock selection, there were positive results in Consumer Staples, Technology, Real Estate and Health Care, while there were negative results in Communication Services, Energy and Materials. In Technology, payment processor First Data (FDC) was the best performing stock in the portfolio. Within Consumer Staples, consumer product firm Procter & Gamble (PG) contributed nicely to performance. Within Materials, gold producer Barrick Gold (GOLD) outperformed the market. Other notable outperforming stocks were independent power producer Sempra Energy (SRE) in Utilities, and industrial warehouse owner Prologis (PLD) in Real Estate. On the negative side, within Energy, oil and gas exploration and production firms EOG Resources (EOG) and Range Resources (RRC), along with deep water drilling company Transocean (RIG) each trailed the market. In Materials, iron ore producer Vale (VALE) negatively impacted performance. Another notable underperforming stock was telecom provider CenturyLink (CTL) in Telecommunications. At the end of the period the Fund no longer held EOG, FDC, RRC, RIG and VALE.
SECTOR ALLOCATION AS A PERCENTAGE OF NET ASSETS AS OF 10/31/19
| Communication Services | | 5.3 | % |
| Consumer Discretionary | | 5.1 | % |
| Consumer Staples | | 6.3 | % |
| Energy | | 9.5 | % |
| Financials | | 27.6 | % |
| Health Care | | 8.7 | % |
| Industrials | | 8.4 | % |
| Information Technology | | 4.8 | % |
| Materials | | 10.0 | % |
| Real Estate | | 5.3 | % |
| Short-Term Investments | | 1.6 | % |
| Utilities | | 7.4 | % |
| Net Other Assets and Liabilities | | 0.0 | % |
TOP TEN HOLDINGS AS A PERCENTAGE OF NET ASSETS AS OF 10/31/19
| Jacobs Engineering Group Inc. | | 6.4 | % |
| Sempra Energy | | 5.3 | % |
| JPMorgan Chase & Co. | | 5.2 | % |
| Barrick Gold Corp. | | 5.0 | % |
| Baxter International Inc. | | 4.6 | % |
| Aon PLC | | 4.4 | % |
| Procter & Gamble Co./The | | 4.3 | % |
| American Express Co. | | 4.2 | % |
| Bank of America Corp. | | 4.2 | % |
| Zimmer Biomet Holdings Inc. | | 4.1 | % |
MADISON INVESTORS FUND
INVESTMENT STRATEGY HIGHLIGHTS
The Madison Investors Fund invests primarily in the common stocks of established, high-quality growth companies selected via bottom-up fundamental analysis. The Fund typically owns 25-40 securities which have demonstrated stable revenue and earnings growth patterns, have high profitability metrics, and have maintained proportionately low levels of debt. A rigorous analytical process is followed when evaluating companies. The business model, the management team and the valuation of each potential investment are considered. Management strives to purchase securities trading at a discount to their intrinsic value as determined by discounted cash flows. Management corroborates this valuation work with additional valuation methodologies. The Fund typically sells a stock when the valuation target the portfolio managers have set for the stock has been exceeded, the fundamental business prospects for the company have materially changed, or the portfolio managers find a more attractive alternative.
PERFORMANCE DISCUSSION
Cumulative Performance of $10,000 Investment1
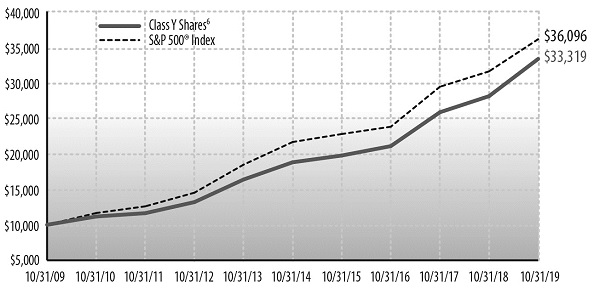
| Average Annual Total Return through October 31, 20191 | |
| | | % Return Without Sales Charge | | % Return After Sales Charge5 | |
| | | 1 Year | | 3 Years | | 5 Years | | 10 Years | | Since
9/23/13
Inception | | 1 Year | | 3 Years | | 5 Years | | 10 Years | | Since
9/23/13
Inception | |
| Class A Shares2 | | 18.37 | | 16.24 | | 11.87 | | – | | 12.42 | | 11.54 | | 13.98 | | 10.55 | | – | | 11.33 | |
| Class Y Shares6 | | 18.63 | | 16.52 | | 12.14 | | 12.79 | | – | | – | | – | | – | | – | | – | |
| Class R6 Shares7 | | 18.88 | | 16.73 | | 12.35 | | – | | 12.92 | | – | | – | | – | | – | | – | |
| S&P 500® Index | | 14.33 | | 14.91 | | 10.78 | | 13.70 | | 12.23 | | NA | | NA | | NA | | NA | | NA | |
See accompanying Notes to Management’s Discussion of Fund Performance.
The Madison Investors Fund (Class Y) returned 18.63% for the year ending October 31, 2019, while the S&P 500® Index returned 14.33% for the same period. The Fund outperformed the Morningstar Large Blend peer group whose average return was 12.44% for the year. Similar to the comparable 2018 period, the period was characterized by a stronger return performance for faster growing, higher valuation multiple stocks (“growth stocks”).
The Fund managers found opportunities to sell and trim portfolio stocks deemed to have less favorable risk-reward profiles and to add stocks with more favorable risk-reward characteristics. The portfolio managers added three new stocks to the portfolio from the insurance, energy, and retail industries over the course of the year that are expected to contribute positively to future returns. Six stocks were sold from the portfolio because they were deemed to have unfavorable risk-reward profiles at the time of the sales. This activity led to Fund turnover of over 23%, which is near the lower end of the Fund’s expected annual turnover range. We believe the turnover has been productive because it related to improving the risk-reward proposition of the Fund.
For the year, the Fund enjoyed strong returns from its holdings in the Industrial Sector, which was its best performing sector. The Fund’s industrial holdings posted strong sales and earnings performances over the past year. The Fund also enjoyed good returns from its Consumer Discretionary Sector holdings due to a combination of earnings growth and price-to-earnings multiple expansion. The Fund’s Health Care Sector holdings outperformed those in the S&P 500, and the Fund’s underweight to underperforming energy stocks also helped performance relative to the benchmark.
The Fund’s Consumer Staples, Communications Services, Financials, and Information Technology holdings underperformed their comparative sectors in the S&P 500. The Fund’s cash balance was also a relative performance drag given the modest returns available on short-term bonds compared the period’s strong stock returns.
14
Madison Funds | Management’s Discussion of Fund Performance - Madison Investors Fund - continued | October 31, 2019
SECTOR ALLOCATION AS A PERCENTAGE OF NET ASSETS AS OF 10/31/19
| Communication Services | | | 5.1 | % |
| Consumer Discretionary | | | 21.4 | % |
| Energy | | | 2.3 | % |
| Financials | | | 18.7 | % |
| Health Care | | | 10.5 | % |
| Industrials | | | 11.0 | % |
| Information Technology | | | 15.9 | % |
| Materials | | | 7.7 | % |
| Real Estate | | | 1.6 | % |
| Short-Term Investments | | | 5.6 | % |
| Net Other Assets and Liabilities | | | 0.2 | % |
TOP TEN HOLDINGS AS A PERCENTAGE OF NET ASSETS AS OF 10/31/19
| Alphabet Inc., Class C | | | 5.1 | % |
| Jacobs Engineering Group Inc. | | | 4.9 | % |
| PPG Industries Inc. | | | 4.9 | % |
| Brookfield Asset Management Inc., Class A | | | 4.8 | % |
| Lowe’s Cos. Inc. | | | 4.8 | % |
| Berkshire Hathaway Inc., Class B | | | 4.7 | % |
| CarMax Inc. | | | 4.6 | % |
| US Bancorp | | | 4.6 | % |
| Dollar Tree Inc. | | | 4.0 | % |
| TJX Cos. Inc./The | | | 3.7 | % |
MADISON MID CAP FUND
INVESTMENT STRATEGY HIGHLIGHTS
The Madison Mid Cap Fund invests generally in common stocks, securities convertible into common stocks and related equity securities of midsize companies and will, under normal market conditions, maintain at least 80% of its net assets in such midcap securities. The Fund seeks attractive long-term returns through bottom-up security selection based on fundamental analysis in a diversified portfolio of high-quality growth companies with attractive valuations. These will typically be industry leading companies in niches with strong growth prospects. The Fund’s portfolio managers believe in selecting stocks for the Fund that show steady, sustainable growth and reasonable valuation. The Fund generally holds 25-40 individual securities in its portfolio at any given time. Stocks are generally sold when target prices are reached, company fundamentals deteriorate or more attractive stocks are identified.
PERFORMANCE DISCUSSION
Cumulative Performance of $10,000 Investment1
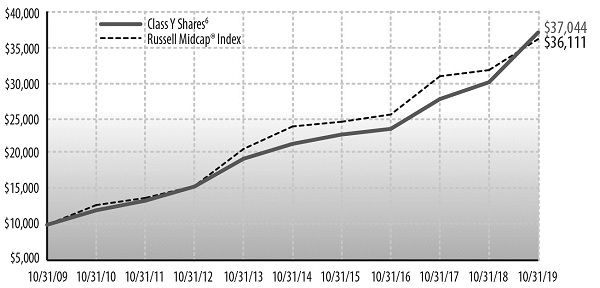
| Average Annual Total Return through October 31, 20191 | |
| | | % Return Without Sales Charge | | % Return After Sales Charge5 | |
| | | 1 Year | | 3 Years | | 5 Years | | 10 Years | | Since
2/29/12
Inception | | Since
4/19/13
Inception | | 1 Year | | 3 Years | | 5 Years | | Since
4/19/13
Inception | |
| Class A Shares2 | | 22.65 | | 15.91 | | 11.18 | | – | | – | | 12.18 | | 15.56 | | 13.64 | | 9.87 | | 11.17 | |
| Class B Shares3 | | 21.91 | | 15.03 | | 10.36 | | – | | – | | 11.34 | | 17.41 | | 14.14 | | 10.09 | | 11.34 | |
| Class Y Shares6 | | 23.27 | | 16.40 | | 11.62 | | 13.99 | | – | | – | | – | | – | | – | | – | |
| Class R6 Shares7 | | 23.49 | | 16.63 | | 11.90 | | – | | 13.14 | | – | | – | | – | | – | | – | |
| Russell Midcap® Index | | 13.72 | | 12.28 | | 8.67 | | 13.70 | | 12.02 | | 11.43 | | NA | | NA | | NA | | NA | |
See accompanying Notes to Management’s Discussion of Fund Performance.
Madison Mid Cap Fund (Class Y) returned 23.27% for the one-year period, well outperforming both its index and peer group. The Russell Midcap® Index returned 13.72% and the Morningstar Mid-Cap Growth peer group returned 13.94%. The Mid Cap Fund benefitted from both strong stock picking and sector allocation during the period; however, stock picking was the much more significant driver of outperformance. True to our approach, our strong stock picking was driven by some of our largest and highest conviction holdings. Our positive contribution from sector allocation was driven by performance in the Energy, Consumer Staples and Communication Services Sectors. We benefited from being meaningfully underweight the Energy Sector, where the -28% return placed it as the worst within the benchmark. Similarly, we had an underweight within the Communication Services Sector, which posted the second lowest return over the period. Our Consumer Staples return was driven by strong performance of a long-time holding. Our three worst contributors to sector allocation were Information Technology, Real Estate and Consumer Discretionary. We were notably underweight in both the Information Technology and Real Estate Sectors while these two were among the top performing areas of the market during the period. Our large overweight within the underperforming Consumer Discretionary Sector was a drag on our sector allocation; however, strong stock picking within this space helped drive our overall return.
SECTOR ALLOCATION AS A PERCENTAGE OF NET ASSETS AS OF 10/31/19
| Communication Services | | | 5.6 | % |
| Consumer Discretionary | | | 20.7 | % |
| Consumer Staples | | | 1.2 | % |
| Financials | | | 28.3 | % |
| Health Care | | | 4.5 | % |
| Industrials | | | 15.5 | % |
| Information Technology | | | 9.6 | % |
| Materials | | | 5.7 | % |
| Short-Term Investments | | | 8.7 | % |
| Net Other Assets and Liabilities | | | 0.2 | % |
TOP TEN HOLDINGS AS A PERCENTAGE OF NET ASSETS AS OF 10/31/19
| Arch Capital Group Ltd. | | | 6.2 | % |
| Liberty Broadband Corp., Class C | | | 5.6 | % |
| CarMax Inc. | | | 4.7 | % |
| Dollar Tree Inc. | | | 4.7 | % |
| Markel Corp. | | | 4.7 | % |
| Brown & Brown Inc. | | | 4.3 | % |
| IHS Markit Ltd. | | | 4.2 | % |
| O’Reilly Automotive Inc. | | | 4.2 | % |
| Copart Inc. | | | 4.1 | % |
| Brookfield Asset Management Inc., Class A | | | 4.0 | % |
15
Madison Funds | Management’s Discussion of Fund Performance - continued | October 31, 2019
MADISON SMALL CAP FUND
INVESTMENT STRATEGY HIGHLIGHTS
The Madison Small Cap Fund invests primarily in a diversified mix of common stocks of small-cap U.S. companies that are believed to be undervalued by various measures and offer sound prospects for capital appreciation. Under normal market conditions, the Fund will maintain at least 80% of its net assets in small-cap securities.
Madison focuses on core growth strategies through bottom-up fundamental research analysis to identify stocks of businesses that are selling at what it believes are substantial discounts to prices that accurately reflect their future earnings prospects. Madison conducts extensive research on each prospective investment using a five pillar analysis process to evaluate companies as potential investments for the portfolio. Investments that meet most of the criteria are added to a list of similar companies to be monitored by Madison. Companies meeting all five pillars may be added to the portfolio. The five pillars of the analysis are: (1) strong business traits, (2) defendable market niche, (3) attractive growth potential, (4) capable management, and (5) discount to private market value. In reviewing companies, Madison applies the characteristics identified above on a case-by-case basis as the order of importance varies depending on the type of business or industry and the company being reviewed. As a result of employing the five pillar analysis, the Fund may hold cash opportunistically, particularly during periods of market uncertainty when investments meeting all five pillars may be difficult to identify.
PERFORMANCE DISCUSSION
Cumulative Performance of $10,000 Investment1
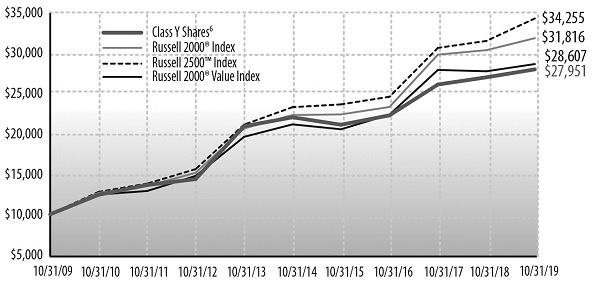
| Average Annual Total Return through October 31, 20191 | |
| | | % Return Without Sales Charge | | % Return After Sales Charge5 | |
| | | 1 Year | | 3 Years | | 5 Years | | 10 Years | | Since
8/31/19
Inception | | 1 Year | | 3 Years | | 5 Years | | Since
8/31/19
Inception | |
| Class A Shares2 | | – | | – | | – | | – | | 5.79 | | – | | – | | – | | -0.27 | |
| Class Y Shares6 | | 3.65 | | 7.90 | | 4.89 | | 10.83 | | – | | – | | – | | – | | – | |
| Russell 2000® Index | | 4.90 | | 10.96 | | 7.37 | | 12.27 | | 4.77 | | NA | | NA | | NA | | NA | |
| Russell 2500™ Index8 | | 8.84 | | 11.74 | | 8.04 | | 13.10 | | 3.72 | | NA | | NA | | NA | | NA | |
| Russell 2000® Value Index8 | | 3.22 | | 8.60 | | 6.24 | | 11.08 | | 7.68 | | NA | | NA | | NA | | NA | |
See accompanying Notes to Management’s Discussion of Fund Performance.
The performance shown in the graph and table above represents that of the accounting survivor with the period end restated to the legal survivor’s fiscal year end. See Note 13 for a discussion of the Fund’s reorganization.
Madison Small Cap Fund (Class Y) returned 3.65% for the one-year period. The Fund’s benchmark, the Russell 2000® Index returned 4.90% while its peer group, Morningstar Small Blend, returned 4.34%. This return profile does not capture the extreme volatility that the markets experienced in December of 2018 and the subsequent snap back in valuation in the first quarter of 2019. While punishing, we were able to opportunistically add to core positions during this market swoon, which helped our performance in calendar year 2019.
Consumer Discretionary, Financials, and Information Technology were the largest detractors in relative performance. Lack of exposure to Real Estate and Utilities, areas in which we typically do not invest, also were net detractors for our annual performance. On the positive side, Industrials, Healthcare and Consumer Staples contributed positively to our performance. The Fund’s top performing sectors were Consumer Staples and Industrials. Both these areas of positive return were driven by absolute performance from large core positions, such as Kornit Digital, Carlisle Companies, Masco, Boston Beer Company, and Hain Celestial Group.
The Fund had a disappointing return from energy stocks due to poor management execution against a backdrop of terrible sentiment in the Energy Sector. Other stocks that disappointed were Ferro Corporation, Trip Advisor, Nordstrom, CommVault Systems, Covetrus, and Tivity Health. While negative absolute performance is always disappointing, the Fund managers remain excited in the long-term prospects of many of these negative performers. However, the tough economic environment and difficult macro fundamentals in energy have dictated that the Fund managers exit these positions. While healthcare was a poorly performing sector for the Russell in this time period, the Fund managers have found areas of relative value and exited the fiscal year in an overweight position, despite the average underweight position for the year. The Fund managers continue to find good opportunities in both consumer discretionary and stables, which offset the underweight in Information Technology at the fiscal year-end.
SECTOR ALLOCATION AS A PERCENTAGE OF NET ASSETS AS OF 10/31/19
| Communication Services | | | 3.5 | % |
| Consumer Discretionary | | | 6.2 | % |
| Consumer Staples | | | 7.0 | % |
| Financials | | | 13.8 | % |
| Health Care | | | 19.6 | % |
| Industrials | | | 20.0 | % |
| Information Technology | | | 17.0 | % |
| Materials | | | 5.9 | % |
| Short-Term Investments | | | 11.8 | % |
| Net Other Assets and Liabilities | | | (4.8 | )% |
TOP TEN HOLDINGS AS A PERCENTAGE OF NET ASSETS AS OF 10/31/19
| MGIC Investment Corp. | | | 4.6 | % |
| Encompass Health Corp. | | | 3.7 | % |
| FireEye Inc. | | | 3.1 | % |
| Masco Corp. | | | 3.1 | % |
| Globus Medical Inc. | | | 2.8 | % |
| PRA Health Sciences Inc. | | | 2.6 | % |
| PRA Group Inc. | | | 2.5 | % |
| Welbilt Inc. | | | 2.4 | % |
| WillScot Corp. | | | 2.4 | % |
| Edgewell Personal Care Co. | | | 2.3 | % |
MADISON INTERNATIONAL STOCK FUND
INVESTMENT STRATEGY HIGHLIGHTS
The Madison International Stock Fund will invest, under normal market conditions, at least 80% of its net assets in the stock of foreign companies. Typically, a majority of the Fund’s assets are invested in relatively large capitalization stocks of companies located or operating in developed countries. The fund may also invest up to 30% of its assets in securities of companies whose principal business activities are located in emerging market countries. The portfolio managers typically maintain this segment of the Fund’s portfolio in such stocks which they believe have a low market price relative to their perceived value based on fundamental analysis of the issuing company and its prospects. The Fund may also invest in foreign debt and other income bearing securities at times when the portfolio managers believe that income bearing securities have greater capital appreciation potential than equity securities. The Fund usually holds securities of issuers located in at least three countries other than the U.S. and generally holds 60-80 individual securities in its portfolio at any given time.
16
Madison Funds | Management’s Discussion of Fund Performance - Madison International Stock Fund - continued | October 31, 2019
PERFORMANCE DISCUSSION
Cumulative Performance of $10,000 Investment1
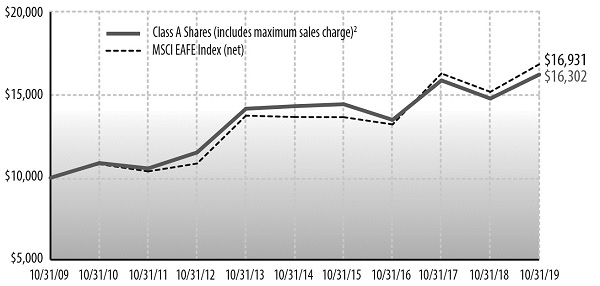
| Average Annual Total Return through October 31, 20191 | | | | | | | | | |
| | | % Return Without Sales Charge | | % Return After Sales Charge5 | |
| | | 1 Year | | 3 Years | | 5 Years | | 10 Years | | 1 Year | | 3 Years | | 5 Years | | 10 Years | |
| Class A Shares2 | | 9.85 | | 6.39 | | 2.55 | | 5.01 | | 3.52 | | 4.32 | | 1.33 | | 4.38 | |
| Class B Shares3 | | 9.04 | | 5.58 | | 1.78 | | 4.38 | | 4.54 | | 4.53 | | 1.40 | | 4.38 | |
| Class Y Shares6 | | 10.10 | | 6.67 | | 2.81 | | 5.27 | | – | | – | | – | | – | |
| MSCI EAFE Index (net) | | 11.04 | | 8.48 | | 4.31 | | 5.41 | | NA | | NA | | NA | | NA | |
See accompanying Notes to Management’s Discussion of Fund Performance.
Madison International Stock Fund (Class Y) returned 10.10% for the one-year period, compared to its benchmark, the MSCI EAFE Index (net), which returned 11.04%. The Fund’s peer group, Morningstar Foreign Large Blend, returned 10.18%.
The Madison International Stock Fund underperformed the unmanaged and fee-free MSCI EAFE Index by less than one percent during the period despite generally strong stock selection. In the materials sector, Shin-Etsu Chemical, a Japanese chemical company, reported strong first quarter results with quarter-over-quarter operating profit growth in all segments. Management’s Shin-Etsu thesis is centered on two markets: silicon wafers and PVC. Both markets have robust demand and have supply constraints leading to tightening market conditions. Over the last ten years as the semi wafer industry has consolidated, little capacity has been added. In the PVC market, supply has been reduced and constrained by environmental regulatory changes in Europe and China leading to a tightening market. Management expects this to continue in the medium-term making this a high quality/diversified wafer and chemicals business with earnings upgrades to come. Also in the sector, Netherlands based Royal DSM outperformed. DSM is a global specialty chemical company and operates within health, nutrition, and materials. DSM is a much more stable business than in the past when the company was more focused on commodity chemicals. It also is now a higher-quality company with improving margins, higher growth, and little-to-no financial leverage. The structural growth of the nutrition segment should provide more resilience in earnings than was experienced during the last cyclical downturn. Unlike a pharmaceutical company, investors typically ascribe little to no value for a chemical company’s “pipeline.” However, DSM’s innovation projects are options that are not yet built into consensus estimates and this can add optionality to the stock price. The company has been executing well, and announced a EUR 1bn buyback in February 2019, representing an estimated 7% of market cap.
In contrast, stock selection and a higher-than-benchmark weight in the underperforming Energy Sector detracted from relative returns. Canadian integrated oil sands and refinery company, Suncor, lagged on the back of a very weak commodity, specifically in the fourth quarter of 2018. With cash operating costs below $50/barrel, however, we believe Suncor will continue to generate significant free cash flow. Management spent the past several years repositioning their portfolio by selling highly valued infrastructure and renewables as well as downstream assets and buying cheap, synergistic oil assets. Total operating costs continue to decline while production growth continues amidst declining capital expenditures. This capital allocation model allows Suncor to be one of the rare large energy companies with the ability to buy back stock and increase their dividend. Elsewhere, in the Industrials Sector, a position in Ryanair detracted from relative returns. Ryanair is the leader in the intra-Europe discount airline market with a highly competitive cost base and a record of profitable value creation and cash generation. The stock lagged in the period due to the continued slowdown in European Union economic activity and air traffic demand which more than offset a five-year low on capacity growth, leading to further summer 2019 fare downgrades. Brexit uncertainty could still be weighing on UK outbound demand and oil is still a cost headwind year to date. Management still likes the stock, as believes that the valuation is inexpensive trading below total fleet value as well as a ten-year low relative to the market. This at the same time profitability per passenger is at its lowest since 2011 – implying significant margin and valuation upside. While hard to call the timing of the turn, management believes these variables negatively affecting the stock currently, are much closer to the trough than the peak. As EU airline consolidation continues in this challenging market, management believes the low-cost structure of Ryanair is an advantage that will enable the company to be a leader amidst this changing market. Lastly, a lower-than-benchmark weight in the strong performing utilities sector detracted from relative returns.
In terms of our outlook, management believes the global economy’s recent deceleration is part of its progression through the late stages of a normal cycle. Ultimately, the outlook remains mostly unchanged from previous periods. As the world’s central banks ease monetary policy and expectations of earnings across regions remain similar, investors may focus on relatively cheap companies that can more reliably deliver earnings and cash flows. In this environment, in management’s view, stock selection will be a main driver of returns. Management believes high quality, more defensive companies, whose fortunes are less geared to the economic cycle and offer inexpensive valuations, will be the leadership stocks for the foreseeable future.
GEOGRAPHICAL ALLOCATION AS A PERCENTAGE OF NET ASSETS AS OF 10/31/19
| United Kingdom | | 19.9 | % |
| Japan | | 14.9 | % |
| France | | 12.8 | % |
| Germany | | 7.7 | % |
| Canada | | 5.5 | % |
| Switzerland | | 4.6 | % |
| Ireland | | 4.4 | % |
| United States | | 4.3 | % |
| Netherlands | | 4.1 | % |
| Sweden | | 3.8 | % |
| Norway | | 3.0 | % |
| Singapore | | 2.7 | % |
| Finland | | 2.3 | % |
| Australia | | 2.2 | % |
| South Korea | | 2.2 | % |
| China | | 1.6 | % |
| Belgium | | 1.5 | % |
| Denmark | | 1.5 | % |
| Israel | | 1.2 | % |
| Spain | | 0.9 | % |
| Hong Kong | | 0.4 | % |
| Mexico | | 0.4 | % |
| Other Net Assets | | (1.9 | )% |
| | | | |
SECTOR ALLOCATION AS A PERCENTAGE OF NET ASSETS AS OF 10/31/19
| Communication Services | | | 4.3 | % |
| Consumer Discretionary | | | 12.0 | % |
| Consumer Staples | | | 10.9 | % |
| Energy | | | 5.8 | % |
| Financials | | | 17.3 | % |
| Health Care | | | 9.8 | % |
| Industrials | | | 14.9 | % |
| Information Technology | | | 9.0 | % |
| Materials | | | 6.7 | % |
| Real Estate | | | 3.7 | % |
| Short-Term Investments | | | 4.3 | % |
| Utilities | | | 3.2 | % |
| Net Other Assets and Liabilities | | | (1.9 | )% |
TOP TEN HOLDINGS AS A PERCENTAGE OF NET ASSETS AS OF 10/31/19
| SAP SE | | | 3.3 | % |
| Medtronic PLC | | | 3.1 | % |
| Novartis AG | | | 3.0 | % |
| Royal Dutch Shell PLC | | | 3.0 | % |
| Daiwa House Industry Co. Ltd. | | | 2.6 | % |
| RELX PLC | | | 2.6 | % |
| Sanofi | | | 2.6 | % |
| Volkswagen AG | | | 2.6 | % |
| AON PLC | | | 2.5 | % |
| Safran S.A. | | | 2.5 | % |
17
Madison Funds | Management’s Discussion of Fund Performance - concluded | October 31, 2019
| |
| Notes to Management’s Discussion of Fund Performance |
| 1 | Fund returns are calculated after fund expenses have been subtracted and assume that dividends and capital gains are reinvested in additional shares of the fund. Returns do not reflect the deduction of taxes that a shareholder would pay on fund distributions or the redemption of fund shares. Investment return and principal value will fluctuate, so an investor’s shares, when redeemed, may be worth more or less than original cost. Further information relating to the fund’s performance is contained in the prospectus and elsewhere in this report. The fund’s past performance is not indicative of future performance. Current performance may be lower or higher than the performance data cited. For fund performance data current to the most recent month-end, please call 1-800-877-6089 or visit www.madisonfunds.com. Indices are unmanaged and investors cannot invest in them directly. Index returns do not reflect sales charges, fees or expenses. |
| 2 | Maximum sales charge is 5.75% for class A shares for the Conservative, Moderate and Aggressive Allocation Funds and the Diversified Income, Equity Income, Large Cap Value, Investors, Mid Cap, Small Cap and International Stock Funds. The maximum sales charge is 4.50% for the Core Bond and High Income Fund class A shares. |
| 3 | Maximum contingent deferred sales charge (CDSC) is 4.50% for class B shares, which is reduced after 12 months and eliminated after six years. |
| 4 | Maximum contingent deferred sales charge (CDSC) is 1% for class C shares, which is eliminated after one year. |
| 5 | Assumes maximum applicable sales charge. |
| 6 | Class Y shares are only available for purchase by Madison Funds and other affiliated asset allocation funds, in managed account programs, and to certain other investors as described in the current prospectus. |
| 7 | Class R6 shares are generally only available for purchase by retirement plan investors and certain other institutional investors. |
| 8 | Effective August 31, 2019 the secondary benchmark for the Fund is changed from the Russell 2000® Value Index to the Russell 2500™ Index to better reflect the manner in which the Fund is being managed |
BENCHMARK DESCRIPTIONS
Allocation Fund Indexes*
The Conservative Allocation Fund Custom Index consists of 65% Bloomberg Barclays US Aggregate Bond Index, 24.5% Russell 3000® Index and 10.5% MSCI ACWI ex-US Index. See market index descriptions below.
The Moderate Allocation Fund Custom Index consists of 42% Russell 3000® Index, 40% Bloomberg Barclays US Aggregate Bond Index and 18% MSCI ACWI ex-US Index. See market index descriptions below.
The Aggressive Allocation Fund Custom Index consists of 56% Russell 3000® Index, 24% MSCI ACWI ex-US Index and 20% Bloomberg Barclays US Aggregate Bond Index. See market index descriptions below.
Hybrid Fund Indexes*
The Custom Blended Index consists of 50% S&P 500® Index and 50% ICE Bank of America Merrill Lynch U.S. Corporate, Government & Mortgage Index. See market index descriptions below.
Market Indexes
The CBOE S&P 500 BuyWrite® IndexSM (BXM) is a benchmark index designed to track the performance of a hypothetical buy-write strategy (i.e. holding a long position in and selling covered call options on that position) on the S&P 500® Index.
The ICE Bank of America Merrill Lynch 1-22 Year U.S. Municipal Securities Index tracks the performance of U.S. dollar denominated investment grade tax-exempt debt publicly issued by U.S. states and territories, their political subdivisions, in the U.S. domestic market, with a remaining term to final maturity less than 22 years.
The ICE Bank of America Merrill Lynch U.S. Corporate, Government & Mortgage Index is a broad-based measure of the total rate of return performance of the U.S. investment-grade bond markets. The index is a capitalization-weighted aggregation of outstanding U.S. treasury, agency and supranational mortgage pass-through, and investment-grade corporate bonds meeting specified selection criteria.
The ICE Bank of America Merrill Lynch U.S. High Yield Constrained Index tracks the performance of below investment grade U.S. dollar denominated corporate bonds publicly issued in the U.S. domestic market, but limits any individual issuer to a maximum weighting of 2%.
The Bloomberg Barclays U.S. Corporate Bond Index measures the investment grade, fixed-rate, taxable corporate bond market. It includes USD denominated securities publicly issued by U.S. financial issuers.
The Bloomberg Barclays U.S. Aggregate Bond Index is a broad-based flagship benchmark that measures the investment grade, U.S. dollar-denominated, fixed-rate taxable bond market. The index includes Treasuries, government-related and corporate securities, mortgage backed-securities, asset-backed securities and corporate securities, with maturities greater than one year.
The Bloomberg Barclays U.S. Intermediate Government Credit A+ Bond Index measures the performance of U.S. dollar denominated U.S. Treasuries, government related and investment grade U.S. corporate securities with quality ratings of A3/A- or better and maturities between one and 10 years.
The Lipper Equity Income Funds Index tracks the performance of funds that, by prospectus language and portfolio practice, seek relatively high current income and growth of income by investing at least 65% of their portfolio weight in dividend-paying equity securities. The index is composed of the 30 largest funds by asset size in the Lipper investment objective category.
THE MSCI ACWI ex-U.S. Index is a market-capitalization-weighted index maintained by Morgan Stanley Capital International (MSCI) and designed to provide a broad measure of stock performance throughout the world, with the exception of U.S.-based companies. The index includes both developed and emerging markets.
The MSCI EAFE (Europe, Australasia & Far East) Index (net) is a free-float adjusted market capitalization index that is designed to measure developed market equity performance, excluding the U.S. and Canada. The MSCI EAFE Index (net) is calculated on a total return basis with dividends reinvested after the deduction of withholding taxes.
The Russell 1000® Value Index is a large-cap market index which measures the performance of those Russell 1000 companies with lower price-to-book ratios and lower forecasted growth values.
The Russell 2000® Index is a small-cap market index which measures the performance of the smallest 2,000 companies in the Russell 3000® Index.
The Russell 2000® Value Index measures the performance of the small-cap value segment of the U.S. equity universe. It includes those Russell 2000® Index companies with lower price-to-book ratios and lower forecasted growth values.
The Russell 2500™ Index is a broad index, featuring 2,500 stocks that cover the small-and mid-cap market capitalizations of the U.S. equity universe.
The Russell 3000® Index measures the performance of the 3,000 largest U.S. companies based on total market capitalization, which represents 98% of the investable U.S. equity market.
The Russell Midcap® Index is a mid-cap market index which measures the performance of the mid-cap segment of the U.S. equity universe.
The S&P 500® Index is a large-cap market index which measures the performance of a representative sample of 500 leading companies in leading industries in the U.S.
*The Custom Indexes are calculated using a monthly re-balancing frequency (i.e., rebalanced back to original constituent weight every calendar month-end).
© 2019 Morningstar, Inc. All rights reserved. The information contained herein: (1) is proprietary to Morningstar and/or its content providers; (2) may not be copied or distributed; and (3) is not warranted to be accurate, complete, or timely. Neither Morningstar nor its content providers are responsible for any damages or losses arising from any use of this information.
Russell Investment Group is the source and owner of the trademarks, service marks and copyrights related to the Russell Indexes. Russell® is a trademark of Russell Investment Group.
18
Madison Funds | October 31, 2019
| |
| Madison Conservative Allocation Fund Portfolio of Investments |
| | | Shares | | | Value (Note 2) | |
| INVESTMENT COMPANIES - 94.5% | | | | | | | | |
| Bond Funds - 65.4% | | | | | | | | |
| Baird Aggregate Bond Fund Institutional Shares | | | 577,476 | | | $ | 6,508,149 | |
| iShares 20+ Year Treasury Bond ETF | | | 23,747 | | | | 3,354,026 | |
| iShares 7-10 Year Treasury Bond ETF | | | 34,534 | | | | 3,885,420 | |
| Madison Core Bond Fund Class Y (A) | | | 1,136,278 | | | | 11,646,850 | |
| Madison Corporate Bond Fund Class Y (A) | | | 346,961 | | | | 4,177,416 | |
| Vanguard Short-Term Corporate Bond ETF (B) | | | 94,324 | | | | 7,665,712 | |
| Vanguard Short-Term Treasury ETF (B) | | | 123,410 | | | | 7,532,946 | |
| | | | | | | | 44,770,519 | |
| | | | | | | | | |
| Foreign Stock Funds - 5.6% | | | | | | | | |
| iShares Edge MSCI Minimum Volatility | | | | | | | | |
| EAFE ETF | | | 29,014 | | | | 2,177,501 | |
| Vanguard FTSE All-World ex-U.S. ETF | | | 31,178 | | | | 1,609,408 | |
| | | | | | | | 3,786,909 | |
| | | | | | | | | |
| Stock Funds - 23.5% | | | | | | | | |
| iShares Core S&P 500 ETF | | | 4,041 | | | | 1,232,384 | |
| iShares Core S&P Mid-Cap ETF | | | 385 | | | | 75,194 | |
| iShares Edge MSCI Minimum Volatility USA ETF | | | 25,591 | | | | 1,636,545 | |
| Madison Dividend Income Fund Class Y (A) | | | 203,856 | | | | 5,636,611 | |
| Madison Investors Fund Class Y (A) | | | 237,609 | | | | 5,662,225 | |
| Madison Mid Cap Fund Class Y (A) | | | 67,364 | | | | 788,837 | |
| Vanguard Health Care ETF | | | 1,952 | | | | 342,966 | |
| Vanguard Information Technology ETF | | | 3,172 | | | | 709,386 | |
| | | | | | | | 16,084,148 | |
| | | | | | | | | |
| Total Investment Companies | | | | | | | | |
| (Cost $60,314,307) | | | | | | | 64,641,576 | |
| | | | | | | | | |
| SHORT-TERM INVESTMENTS - 16.7% | | | | | | | | |
| | | | | | | | |
| State Street Institutional U.S. Government Money Market Fund, 1.75%, Premier Class (C) | | | 3,818,700 | | | | 3,818,700 | |
| State Street Navigator Securities Lending Government Money Market Portfolio,1.75% (C) (D) | | | 7,649,162 | | | | 7,649,162 | |
| | | | | | | | | |
| Total Short-Term Investments | | | | | | | | |
| (Cost $11,467,862) | | | | | | | 11,467,862 | |
| TOTAL INVESTMENTS - 111.2% (Cost $71,782,169**) | | | | | | | 76,109,438 | |
| NET OTHER ASSETS AND LIABILITIES - (11.2%) | | | | | | | (7,687,137 | ) |
| TOTAL NET ASSETS - 100.0% | | | | | | $ | 68,422,301 | |
| ** | Aggregate cost for Federal tax purposes was $71,832,164. |
| (A) | Affiliated Company (see Note 12). |
| (B) | All or a portion of these securities, with an aggregate fair value of $7,555,083, are on loan as part of a securities lending program. See footnote (D) and Note 9 for details on the securities lending program. |
| (C) | 7-day yield. |
| (D) | Represents investments of cash collateral received in connection with securities lending. |
| EAFE | Europe, Australasia and Far East. |
| ETF | Exchange Traded Fund. |
| |
| Madison Moderate Allocation Fund Portfolio of Investments |
| | | Shares | | | Value (Note 2) | |
| INVESTMENT COMPANIES - 91.8% | | | | | | | | |
| | | | | | | | | |
| Bond Funds - 41.1% | | | | | | | | |
| Baird Aggregate Bond Fund Institutional Shares | | | 750,138 | | | $ | 8,454,054 | |
| iShares 20+ Year Treasury Bond ETF | | | 36,059 | | | | 5,092,973 | |
| iShares 7-10 Year Treasury Bond ETF | | | 44,607 | | | | 5,018,734 | |
| Madison Core Bond Fund Class Y (A) | | | 1,539,812 | | | | 15,783,068 | |
| Vanguard Short-Term Corporate Bond ETF (B) | | | 164,105 | | | | 13,336,813 | |
| Vanguard Short-Term Treasury ETF (B) | | | 136,039 | | | | 8,303,821 | |
| | | | | | | | 55,989,463 | |
| Foreign Stock Funds - 9.5% | | | | | | | | |
| iShares Edge MSCI Minimum Volatility EAFE ETF | | | 92,791 | | | | 6,963,965 | |
| SPDR S&P Emerging Asia Pacific ETF | | | 3,688 | | | | 358,400 | |
| Vanguard FTSE All-World ex-U.S. ETF | | | 89,296 | | | | 4,609,460 | |
| Vanguard FTSE Emerging Markets ETF | | | 8,391 | | | | 351,163 | |
| Vanguard FTSE Europe ETF | | | 13,011 | | | | 724,322 | |
| | | | | | | | 13,007,310 | |
| Stock Funds - 41.2% | | | | | | | | |
| iShares Core S&P 500 ETF | | | 11,207 | | | | 3,417,799 | |
| iShares Core S&P Mid-Cap ETF | | | 752 | | | | 146,873 | |
| iShares Edge MSCI Minimum Volatility USA ETF | | | 84,905 | | | | 5,429,675 | |
| JPMorgan BetaBuilders Japan ETF | | | 27,807 | | | | 683,218 | |
| Madison Dividend Income Fund Class Y (A) | | | 654,792 | | | | 18,105,009 | |
| Madison Investors Fund Class Y (A) | | | 770,385 | | | | 18,358,269 | |
| Madison Mid Cap Fund Class Y (A) | | | 458,407 | | | | 5,367,940 | |
| Vanguard Health Care ETF | | | 7,781 | | | | 1,367,121 | |
| Vanguard Information Technology ETF | | | 14,316 | | | | 3,201,630 | |
| | | | | | | | 56,077,534 | |
| Total Investment Companies | | | | | | | | |
| (Cost $111,504,756) | | | | | | | 125,074,307 | |
| | | | | | | | | |
| SHORT-TERM INVESTMENTS - 11.8% | | | | | | | | |
| State Street Institutional U.S. Government Money Market Fund, 1.75%, Premier Class (C) | | | 11,106,182 | | | | 11,106,182 | |
| State Street Navigator Securities Lending Government Money Market Portfolio, 1.75% (C) (D) | | | 5,065,826 | | | | 5,065,826 | |
| | | | | | | | | |
| Total Short-Term Investments | | | | | | | | |
| (Cost $16,172,008) | | | | | | | 16,172,008 | |
| | | | | | | | | |
| TOTAL INVESTMENTS - 103.6% | | | | | | | |
| (Cost $127,676,764**) | | | | | | | 141,246,315 | |
| NET OTHER ASSETS AND LIABILITIES - (3.6%) | | | | | | | (4,969,824 | ) |
| TOTAL NET ASSETS - 100.0% | | | | | | $ | 136,276,491 | |
| ** | Aggregate cost for Federal tax purposes was $127,730,846. |
| (A) | Affiliated Company (see Note 12). |
| (B) | All or a portion of these securities, with an aggregate fair value of $4,974,991, are on loan as part of a securities lending program. See footnote (D) and Note 9 for details on the securities lending program. |
| (C) | 7-day yield. |
| (D) | Represents investments of cash collateral received in connection with securities lending. |
| EAFE | Europe, Australasia and Far East. |
| ETF | Exchange Traded Fund. |
See accompanying Notes to Financial Statements.
19
Madison Funds | October 31, 2019
| |
| Madison Aggressive Allocation Fund Portfolio of Investments |
| | | Shares | | | Value (Note 2) | |
| INVESTMENT COMPANIES - 88.7% | | | | | | | | |
| | | | | | | | | |
| Bond Funds - 21.6% | | | | | | | | |
| iShares 20+ Year Treasury Bond ETF | | | 9,561 | | | $ | 1,350,396 | |
| iShares 7-10 Year Treasury Bond ETF | | | 11,130 | | | | 1,252,236 | |
| Madison Core Bond Fund Class Y (A) | | | 421,485 | | | | 4,320,220 | |
| Vanguard Short-Term Corporate Bond ETF | | | 44,461 | | | | 3,613,346 | |
| Vanguard Short-Term Treasury ETF | | | 51,684 | | | | 3,154,791 | |
| | | | | | | | 13,690,989 | |
| Foreign Stock Funds - 14.3% | | | | | | | | |
| iShares Edge MSCI Minimum Volatility EAFE ETF | | | 59,718 | | | | 4,481,836 | |
| SPDR S&P Emerging Asia Pacific ETF | | | 3,394 | | | | 329,829 | |
| Vanguard FTSE All-World ex-U.S. ETF | | | 63,153 | | | | 3,259,958 | |
| Vanguard FTSE Emerging Markets ETF | | | 7,714 | | | | 322,831 | |
| Vanguard FTSE Europe ETF | | | 11,966 | | | | 666,147 | |
| | | | | | | | 9,060,601 | |
| Stock Funds - 52.8% | | | | | | | | |
| iShares Core S&P 500 ETF | | | 7,892 | | | | 2,406,823 | |
| iShares Core S&P Mid-Cap ETF | | | 333 | | | | 65,038 | |
| iShares Edge MSCI Minimum Volatility USA ETF | | | 53,667 | | | | 3,432,005 | |
| JPMorgan BetaBuilders Japan ETF | | | 25,859 | | | | 635,356 | |
| Madison Dividend Income Fund Class Y (A) | | | 356,364 | | | | 9,853,465 | |
| Madison Investors Fund Class Y (A) | | | 413,638 | | | | 9,856,982 | |
| Madison Mid Cap Fund Class Y (A) | | | 332,721 | | | | 3,896,159 | |
| Vanguard Health Care ETF | | | 5,427 | | | | 953,524 | |
| Vanguard Information Technology ETF | | | 10,296 | | | | 2,302,597 | |
| | | | | | | | 33,401,949 | |
| Total Investment Companies | | | | | | | | |
| (Cost $49,058,699) | | | | | | | 56,153,539 | |
| SHORT-TERM INVESTMENTS - 11.4% | | | | | | | | |
| State Street Institutional U.S. Government Money Market Fund, 1.75%, Premier Class (B) | | | 7,212,612 | | | | 7,212,612 | |
| Total Short-Term Investments | | | | | | | | |
| (Cost $7,212,612) | | | | | | | 7,212,612 | |
| TOTAL INVESTMENTS - 100.1% (Cost $56,271,311**) | | | | | | | 63,366,151 | |
| NET OTHER ASSETS AND LIABILITIES - (0.1%) | | | | | | | (41,180 | ) |
| TOTAL NET ASSETS - 100.0% | | | | | | $ | 63,324,971 | |
| ** | Aggregate cost for Federal tax purposes was $56,307,740. |
| (A) | Affiliated Company (see Note 12). |
| |
| Madison Government Money Market Fund Portfolio of Investments |
| | | Par Value | | | Value (Note 2) | |
| U.S. GOVERNMENT AND AGENCY OBLIGATIONS - 96.7% | | | | | | | | |
| | | | | | | | | |
| Fannie Mae - 26.0% | | | | | | | | |
| 1.948%, 11/14/19 (A) | | $ | 450,000 | | | $ | 449,689 | |
| 1.890%, 11/18/19 (A) | | | 470,000 | | | | 469,580 | |
| 1.945%, 11/27/19 (A) | | | 300,000 | | | | 299,579 | |
| 1.860%, 12/6/19 (A) | | | 600,000 | | | | 598,915 | |
| 1.675%, 12/12/19 (A) | | | 230,000 | | | | 229,561 | |
| 1.730%, 12/16/19 (A) | | | 425,000 | | | | 424,081 | |
| 1.660%, 12/27/19 (A) | | | 690,000 | | | | 688,218 | |
| 1.610%, 12/30/19 (A) | | | 460,000 | | | | 458,786 | |
| 1.620%, 1/22/20 (A) | | | 300,000 | | | | 298,893 | |
| | | | | | | | 3,917,302 | |
| Federal Home Loan Bank - 27.4% | | | | | | | | |
| 2.020%, 11/1/19 | | | 280,000 | | | | 280,000 | |
| 1.945%, 11/20/19 (A) | | | 100,000 | | | | 99,897 | |
| 1.950%, 11/22/19 (A) | | | 400,000 | | | | 399,545 | |
| 1.875%, 11/26/19 (A) | | | 295,000 | | | | 294,616 | |
| 1.940%, 12/2/19 (A) | | | 260,000 | | | | 259,566 | |
| 1.929%, 12/20/19 (A) | | | 430,000 | | | | 428,871 | |
| 1.925%, 12/26/19 (A) | | | 650,000 | | | | 648,088 | |
| 1.700%, 1/3/20 (A) | | | 280,000 | | | | 279,167 | |
| 1.685%, 1/8/20 (A) | | | 465,000 | | | | 463,520 | |
| 1.665%, 1/10/20 (A) | | | 385,000 | | | | 383,754 | |
| 1.640%, 1/17/20 (A) | | | 585,000 | | | | 582,948 | |
| | | | | | | | 4,119,972 | |
| Freddie Mac - 28.9% | | | | | | | | |
| 1.630%, 2/13/20 (A) | | | 840,000 | | | | 836,044 | |
| 2.220%, 11/4/19 (A) | | | 750,000 | | | | 749,861 | |
| 2.012%, 11/7/19 (A) | | | 320,000 | | | | 319,895 | |
| 1.980%, 11/12/19 (A) | | | 500,000 | | | | 499,697 | |
| 1.960%, 12/4/19 (A) | | | 495,000 | | | | 494,111 | |
| 1.890%, 12/9/19 (A) | | | 400,000 | | | | 399,202 | |
| 1.790%, 12/12/19 (A) | | | 295,000 | | | | 294,399 | |
| 1.830%, 12/18/19 (A) | | | 160,000 | | | | 159,618 | |
| 1.855%, 1/21/20 (A) | | | 605,000 | | | | 602,475 | |
| | | | | | | | 4,355,302 | |
| U.S. Treasury Notes - 14.4% | | | | | | | | |
| 1.000%, 11/15/19 (A) | | | 365,000 | | | | 364,849 | |
| 1.375%, 12/15/19 (A) | | | 400,000 | | | | 399,758 | |
| 1.375%, 1/15/20 (A) | | | 705,000 | | | | 704,384 | |
| 1.375%, 2/15/20 (A) | | | 690,000 | | | | 689,491 | |
| | | | | | | | 2,158,482 | |
| | | | | | | | | |
Total U.S. Government and Agency Obligations
(Cost $14,551,058) | | | | | | | 14,551,058 | |
| | | | | | | | |
| | | | Shares | | | | | |
| SHORT-TERM INVESTMENTS - 3.3% | | | | | | |
| State Street Institutional U.S. Government Money Market Fund, 1.75%, Premier Class (B) | | | 503,765 | | | | 503,765 | |
| Total Short-Term Investments | | | | | | | | |
| (Cost $503,765) | | | | | | | 503,765 | |
| TOTAL INVESTMENTS - 100.0% (Cost $15,054,823**) | | | | | | | 15,054,823 | |
| NET OTHER ASSETS AND LIABILITIES - 0.0% | | | | | | | (1,128 | ) |
| TOTAL NET ASSETS - 100.0% | | | | | | $ | 15,053,695 | |
| ** | Aggregate cost for Federal tax purposes was $15,054,823. |
| (A) | Rate noted represents annualized yield at time of purchase. |
See accompanying Notes to Financial Statements.
20
Madison Funds | October 31, 2019
| |
| Madison Tax-Free Virginia Fund Portfolio of Investments |
| | | Par Value | | | Value (Note 2) | |
| MUNICIPAL BONDS - 97.3% | | | | | | | | |
| | | | | | | | | |
| Airport - 3.2% | | | | | | | | |
| Metropolitan Washington Airports Authority Revenue, 5%, 10/1/21 | | $ | 100,000 | | | $ | 107,186 | |
| Metropolitan Washington Airports Authority Revenue, Series A, AMT, 5%, 10/1/43 | | | 500,000 | | | | 598,325 | |
| | | | | | | | 705,511 | |
| Development - 3.2% | | | | | | | | |
| Fairfax County Economic Development Authority, Series A, 5%, 10/1/26 | | | 150,000 | | | | 176,584 | |
| Norfolk Economic Development Authority, 5%, 11/1/29 | | | 480,000 | | | | 530,904 | |
| | | | | | | | 707,488 | |
| Education - 10.4% | | | | | | | | |
| Henrico County Economic Development Authority, 4%, 4/15/42 | | | 220,000 | | | | 226,642 | |
| Roanoke County Economic Development Authority, Series A, 5%, 9/1/30 | | | 400,000 | | | | 486,932 | |
| Virginia College Building Authority, Series E, 5%, 2/1/23 | | | 500,000 | | | | 560,960 | |
| Virginia Commonwealth University, Series A, 5%, 5/1/26 | | | 385,000 | | | | 432,486 | |
| Virginia Public School Authority, (ST AID WITHHLDG), 3%, 2/1/30 | | | 305,000 | | | | 325,142 | |
| Virginia Resources Authority, Series C, (MORAL OBLG), 4%, 11/1/32 | | | 250,000 | | | | 287,465 | |
| | | | | | | | 2,319,627 | |
| Facilities - 6.5% | | | | | | | | |
| Henry County Virginia Industrial Development Authority, 4.125%, 11/1/50 | | | 250,000 | | | | 272,793 | |
| New River Valley Regional Jail Authority, 5%, 10/1/25 | | | 100,000 | | | | 119,890 | |
| Prince Edward County Industrial Development Authority, 5%, 9/1/32 | | | 405,000 | | | | 493,792 | |
| Stafford County & Staunton Industrial Development Authority, Series B, (NATL-RE), 4.5%, 8/1/25 | | | 35,000 | | | | 35,047 | |
| Western Regional Jail Authority, 3.125%, 12/1/29 | | | 500,000 | | | | 531,650 | |
| | | | | | | | 1,453,172 | |
| General - 15.4% | | | | | | | | |
| Chesterfield County Economic Development Authority Revenue, Series B, 3%, 4/1/38 | | | 285,000 | | | | 293,980 | |
| James City County Economic Development Authority, 5%, 6/15/30 | | | 500,000 | | | | 635,220 | |
| Northern Virginia Transportation Authority, 5%, 6/1/30 | | | 780,000 | | | | 902,515 | |
| Virginia Beach Development Authority, 5%, 9/1/28 | | | 100,000 | | | | 119,114 | |
| Virginia Beach Development Authority, 5%, 9/1/29 | | | 125,000 | | | | 148,443 | |
| Virginia Beach Development Authority, Series A, 3.5%, 5/1/30 | | | 250,000 | | | | 265,550 | |
| Virginia Public Building Authority, Series B, 5%, 8/1/25 | | | 235,000 | | | | 283,997 | |
| Virginia Resources Authority, Series C, 5%, 11/1/30 | | | 250,000 | | | | 316,730 | |
| Virginia Resources Authority, Series C, 4%, 11/1/34 | | | 125,000 | | | | 140,825 | |
| Wise County Industrial Development Authority Revenue, 5%, 11/1/20 | | | 100,000 | | | | 103,684 | |
| Wise County Industrial Development Authority Revenue, 5%, 11/1/21 | | | 100,000 | | | | 107,259 | |
| Wise County Industrial Development Authority Revenue, 5%, 11/1/22 | | | 100,000 | | | | 110,752 | |
| | | | | | | | 3,428,069 | |
| General Obligation - 28.2% | | | | | | | | |
| City of Alexandria VA, (ST AID WITHHLDG), 5%, 7/15/27 | | | 150,000 | | | | 185,846 | |
| City of Alexandria VA, Series A, (ST AID WITHHLDG), 5%, 7/15/28 | | | 100,000 | | | | 126,771 | |
| City of Danville VA, Series A, (ST AID WITHHLDG), 5%, 8/1/23 | | | 190,000 | | | | 216,678 | |
| City of Fredericksburg VA, Series A, 3.625%, 7/15/30 | | | 400,000 | | | | 404,472 | |
| City of Norfolk VA, (ST AID WTHHLDG), 5%, 8/1/47 | | | 455,000 | | | | 586,727 | |
| City of Poquoson VA, (ST AID WITHHLDG), 4%, 2/15/29 | | | 425,000 | | | | 505,780 | |
| City of Portsmouth VA, Series A, (ST AID WITHHLDG), 5%, 2/1/31 | | | 75,000 | | | | 83,409 | |
| City of Richmond VA, Series C, (ST AID WITHHLDG), 5%, 7/15/22 | | | 100,000 | | | | 102,671 | |
| City of Richmond VA, Series A, (ST AID WITHHLDG), 3%, 7/15/34 | | | 435,000 | | | | 458,320 | |
| City of Roanoke VA, Series A, (Prerefunded 2/1/20 @ $100), (ST AID WITHHLDG), 5%, 2/1/25 | | | 230,000 | | | | 232,132 | |
| City of Virginia Beach VA, Series A, 4%, 8/1/22 | | | 300,000 | | | | 323,124 | |
| Commonwealth of Virginia, Series A, 5%, 6/1/23 | | | 500,000 | | | | 567,760 | |
| County of Arlington VA, Series B, (ST AID WITHHLDG), 5%, 8/15/27 | | | 175,000 | | | | 205,618 | |
| County of Arlington VA, Series A, 5%, 8/15/30 | | | 600,000 | | | | 734,670 | |
| County of Fairfax VA, Series B, (ST AID WITHHLDG), 4%, 10/1/22 | | | 250,000 | | | | 270,467 | |
| County of Fairfax VA, Series A, (ST AID WITHHLDG), 5%, 10/1/26 | | | 410,000 | | | | 511,139 | |
| County of Henrico VA, 5%, 7/15/25 | | | 150,000 | | | | 154,017 | |
| County of Prince William VA, (ST AID WITHHLDG), 5%, 8/1/21 | | | 105,000 | | | | 112,081 | |
| County of Spotsylvania VA, (ST AID WITHHLDG), 5%, 1/15/24 | | | 200,000 | | | | 231,156 | |
| Town of Leesburg VA, (ST AID WITHHLDG), 5%, 1/15/25 | | | 90,000 | | | | 107,318 | |
| Town of Leesburg VA, Series A, (Prerefunded 1/15/21 @ $100), 5%, 1/15/41 | | | 135,000 | | | | 141,210 | |
| | | | | | | | 6,261,366 | |
| Medical - 7.3% | | | | | | | | |
| Lynchburg Economic Development Authority, Series A, (Central Health), 4%, 1/1/47 | | | 260,000 | | | | 275,975 | |
| Norfolk Economic Development Authority, Series B, 5%, 11/1/36 | | | 480,000 | | | | 525,240 | |
| Prince William County Industrial Development Authority, Series B, 4%, 11/1/22 | | | 200,000 | | | | 216,024 | |
| Stafford County Economic Development Authority Revenue, 5%, 6/15/25 | | | 260,000 | | | | 308,443 | |
| Virginia Small Business Financing Authority, 5%, 11/1/40 | | | 300,000 | | | | 305,214 | |
| | | | | | | | 1,630,896 | |
| Power - 1.5% | | | | | | | | |
| Puerto Rico Electric Power Authority, Series V, (BHAC-CR, MBIA-RE, FGIC), 5.25%, 7/1/24 | | | 290,000 | | | | 327,755 | |
| | | | | | | | | |
| Transportation - 9.4% | | | | | | | | |
| Hampton Roads Transportation Accountability Commission, Series A, 5%, 7/1/42 | | | 470,000 | | | | 574,415 | |
| Puerto Rico Highways & Transportation Authority, Series N, (ASSURED GTY), 5.25%, 7/1/34 | | | 100,000 | | | | 112,218 | |
| Richmond Metropolitan Authority, (NATL-RE), 5.25%, 7/15/22 | | | 85,000 | | | | 89,786 | |
| Virginia Commonwealth Transportation Board, 5%, 5/15/22 | | | 100,000 | | | | 109,574 | |
| Virginia Commonwealth Transportation Board, Series A, (Prerefunded 3/15/22 @ $100), 5%, 9/15/24 | | | 225,000 | | | | 245,306 | |
| Virginia Commonwealth Transportation Board, Series B, (Prerefunded 9/15/22 @ $100), 5%, 3/15/25 | | | 535,000 | | | | 593,336 | |
| Virginia Commonwealth Transportation Board, 5%, 9/15/27 | | | 200,000 | | | | 253,156 | |
| Virginia Port Authority Revenue, Series B, 5%, 7/1/21 | | | 100,000 | | | | 105,743 | |
| | | | | | | | 2,083,534 | |
| Utilities - 1.5% | | | | | | | | |
| City of Richmond VA Public Utility Revenue, Series A, 5%, 1/15/38 | | | 300,000 | | | | 333,120 | |
| | | | | | | | | |
| Water - 10.7% | | | | | | | | |
| County of Henrico VA Water & Sewer Revenue, 4%, 5/1/32 | | | 500,000 | | | | 587,900 | |
| County of Henrico VA Water & Sewer Revenue, 5%, 5/1/27 | | | 150,000 | | | | 184,602 | |
| Fairfax County Water Authority, Series B, 5.25%, 4/1/23 | | | 180,000 | | | | 204,732 | |
| Fairfax County Water Authority, 5%, 4/1/27 | | | 150,000 | | | | 163,613 | |
| Hampton Roads Sanitation District, Series A, 5%, 10/1/35 | | | 410,000 | | | | 519,777 | |
| Hampton Roads Sanitation District, Series A, (Prerefunded 10/1/27 @ $100), 5%, 10/1/36 | | | 250,000 | | | | 315,870 | |
| Prince William County Service Authority, 5%, 7/1/22 | | | 250,000 | | | | 275,375 | |
| Virginia Resources Authority, Series B, (Prerefunded 11/1/21@ $100), (MORAL OBLG), 5%, 11/1/23 | | | 5,000 | | | | 5,376 | |
| Virginia Resources Authority, Series B, (MORAL OBLG), 5%, 11/1/23 | | | 115,000 | | | | 123,655 | |
| | | | | | | | 2,380,900 | |
| TOTAL INVESTMENTS - 97.3% (Cost $20,578,560**) | | | | | | | 21,631,438 | |
| NET OTHER ASSETS AND LIABILITIES - 2.7% | | | | | | | 593,901 | |
| TOTAL NET ASSETS - 100.0% | | | | | | $ | 22,225,339 | |
| ** | Aggregate cost for Federal tax purposes was $20,578,560. |
| ASSURED GTY | Assured Guaranty. |
| BHAC-CR | Berkshire Hathaway Assurance Corp. |
| FGIC | Financial Guaranty Insurance Co. |
| MBIA-RE MBIA | Insurance Corp. |
| MORAL OBLG | Moral Obligation. |
| NATL-RE | National Public Finance Guarantee Corp. |
| ST AID WITHHLDG | State Aid Withholding. |
See accompanying Notes to Financial Statements.
21
Madison Funds | October 31, 2019
| |
| Madison Tax-Free National Fund Portfolio of Investments |
| | | Par Value | | | Value (Note 2) | |
| MUNICIPAL BONDS - 97.3% | | | | | | | | |
| | | | | | | | | |
| Alabama - 3.1% | | | | | | | | |
| Lee County Board of Education Authority Revenue, 4%, 2/1/28 | | $ | 490,000 | | | $ | 551,637 | |
| Town of Pike Road Authority Revenue, 4%, 9/1/31 | | | 170,000 | | | | 188,517 | |
| | | | | | | | 740,154 | |
| Arkansas - 0.9% | | | | | | | | |
| Arkansas Development Finance Authority, 5%, 2/1/26 | | | 175,000 | | | | 207,774 | |
| | | | | | | | | |
| California - 0.6% | | | | | | | | |
| Los Angeles Department of Water & Power Revenue, Series A, 5%, 7/1/40 | | | 120,000 | | | | 146,947 | |
| | | | | | | | | |
| Colorado - 2.1% | | | | | | | | |
| El Paso County Facilities Corp., Certificate Participation, Series A, 5%, 12/1/27 | | | 400,000 | | | | 498,936 | |
| | | | | | | | | |
| Florida - 7.2% | | | | | | | | |
| Lee County Industrial Development Authority, 5%, 11/1/28 | | | 500,000 | | | | 518,775 | |
| Orlando Utilities Commission, Series C, 5%, 10/1/22 | | | 525,000 | | | | 582,319 | |
| Palm Beach County Solid Waste Authority, 5%, 10/1/24 | | | 300,000 | | | | 321,753 | |
| Port St. Lucie Community Redevelopment Agency Revenue, Tax Allocation, 5%, 1/1/26 | | | 250,000 | | | | 299,873 | |
| | | | | | | | 1,722,720 | |
| Georgia - 3.7% | | | | | | | | |
| City of Atlanta GA Water & Wastewater Revenue, (AGM), 5.75%, 11/1/30 | | | 300,000 | | | | 422,058 | |
| City of Atlanta GA Water & Wastewater Revenue, 5%, 11/1/43 | | | 275,000 | | | | 317,963 | |
| Dublin GA School District, General Obligation, (ST AID WITHHLDG), 4%, 4/1/23 | | | 135,000 | | | | 142,626 | |
| | | | | | | | 882,647 | |
| Hawaii - 2.2% | | | | | | | | |
| State of Hawaii, General Obligation, Series EY, 5%, 10/1/25 | | | 435,000 | | | | 527,281 | |
| | | | | | | | | |
| Idaho - 2.3% | | | | | | | | |
| Idaho Health Facilities Authority, Series A, 5%, 3/1/34 | | | 500,000 | | | | 557,335 | |
| | | | | | | | | |
| Illinois - 8.6% | | | | | | | | |
| City of Chicago IL Waterworks Revenue, 5%, 11/1/20 | | | 150,000 | | | | 155,193 | |
| City of Waukegan IL, General Obligation, Series A, (BAM), 4%, 12/30/24 | | | 430,000 | | | | 471,891 | |
| Cook County School District No. 111, General Obligation, (BAM), 5%, 12/1/35 | | | 545,000 | | | | 643,645 | |
| Du Page County School District No. 45, General Obligation, 4%, 1/1/26 | | | 460,000 | | | | 522,854 | |
| Regional Transportation Authority, Series A, (AMBAC, GO of AUTH) *, 7.2%, 11/1/20 | | | 75,000 | | | | 77,231 | |
| Sales Tax Securitization Corp., Series C, 5%, 1/1/27 | | | 140,000 | | | | 165,834 | |
| | | | | | | | 2,036,648 | |
| Indiana - 2.5% | | | | | | | | |
| Vanderburgh County Redevelopment District, (AGM), 5%, 2/1/26 | | | 500,000 | | | | 600,500 | |
| | | | | | | | | |
| Iowa - 2.0% | | | | | | | | |
| City of Bettendorf IA, General Obligation, Series A, (Prerefunded 6/1/20 @ $100), 5%, 6/1/28 | | | 475,000 | | | | 485,612 | |
| | | | | | | | | |
| Kansas - 3.6% | | | | | | |
| City of Wichita KS, General Obligation, Series 816, 5%, 12/1/24 | | | 510,000 | | | | 604,886 | |
| Shawnee County Unified School District No. 437, General Obligation, 4%, 9/1/24 | | | 220,000 | | | | 247,997 | |
| | | | | | | | 852,883 | |
| Kentucky - 2.2% | | | | | | | | |
| Eastern Kentucky University, Series A, (ST INTERCEPT), 5%, 4/1/33 | | | 445,000 | | | | 515,657 | |
| Michigan - 3.1% | | | | | | | | |
| Detroit City School District, General Obligation, Series A, (FGIC, Q-SBLF), 6%, 5/1/20 | | | 400,000 | | | | 409,104 | |
| Redford Unified School District No. 1, General Obligation, (AMBAC, Q-SBLF) *, 5%, 5/1/22 | | | 320,000 | | | | 338,285 | |
| | | | | | | | 747,389 | |
| Mississippi - 2.5% | | | | | | | | |
| Medical Center Educational Building Corp., 5%, 6/1/30 | | | 475,000 | | | | 584,834 | |
| | | | | | | | | |
| Missouri - 2.0% | | | | | | | | |
| Springfield School District No. R-12, General Obligation, Series B, (ST AID DIR DEP), 5%, 3/1/25 | | | 400,000 | | | | 478,264 | |
| | | | | | | | | |
| New Jersey - 5.5% | | | | | | | | |
| New Jersey Economic Development Authority Revenue, (ST APPROP), 5%, 3/1/26 | | | 450,000 | | | | 492,313 | |
| New Jersey State Turnpike Authority, Series A, (BHAC-CR, AGM), 5.25%, 1/1/28 | | | 250,000 | | | | 323,913 | |
| New Jersey State Turnpike Authority, Series A, (BHAC-CR, AGM), 5.25%, 1/1/29 | | | 250,000 | | | | 329,782 | |
| Union County Improvement Authority, Series A, 4%, 2/1/25 | | | 150,000 | | | | 164,874 | |
| | | | | | | | 1,310,882 | |
| New York - 4.2% | | | | | | | | |
| Brookhaven Local Development Corp., 5%, 11/1/24 | | | 110,000 | | | | 124,392 | |
| New York State Dormitory Authority, Series 1, (BHAC-CR, AMBAC) *, 5.5%, 7/1/31 | | | 250,000 | | | | 330,083 | |
| Port Authority of New York & New Jersey, (GO of AUTH), 5.375%, 3/1/28 | | | 455,000 | | | | 542,192 | |
| | | | | | | | 996,667 | |
| North Carolina - 3.7% | | | | | | | | |
| North Carolina Medical Care Commission, 5%, 6/1/40 | | | 500,000 | | | | 573,645 | |
| Town of Cary NC Combined Utility Systems Revenue, 5%, 12/1/23 | | | 285,000 | | | | 318,203 | |
| | | | | | | | 891,848 | |
| Ohio - 2.4% | | | | | | | | |
| Cleveland-Cuyahoga County Port | | | | | | | | |
| Authority, 5%, 7/1/24 | | | 500,000 | | | | 576,805 | |
| | | | | | | | | |
| Oklahoma - 4.6% | | | | | | | | |
| Caddo County Governmental Building Authority Revenue, 5%, 9/1/40 | | | 500,000 | | | | 585,570 | |
| Elk City Industrial Authority, 4%, 5/1/30 | | | 435,000 | | | | 501,599 | |
| | | | | | | | 1,087,169 | |
| Pennsylvania - 1.8% | | | | | | | | |
| Commonwealth Financing Authority Revenue, Series A, 5%, 6/1/35 | | | 370,000 | | | | 426,162 | |
| South Carolina - 1.1% | | | | | | | | |
| City of Newberry SC Revenue, (AGM), 4%, 4/1/22 | | | 240,000 | | | | 253,510 | |
| | | | | | | | | |
| Tennessee - 2.3% | | | | | | | | |
| City of Newport Tennessee Electric System Revenue, (AGM), 4%, 5/1/32 | | | 370,000 | | | | 420,090 | |
| Town of Decatur TN Water & Sewer Revenue, General Obligation, 3%, 6/1/24 | | | 120,000 | | | | 128,729 | |
| | | | | | | | 548,819 | |
| Texas - 9.5% | | | | | | | | |
| Beaumont Independent School District, General Obligation, (Prerefunded 2/15/21 @ $100), (PSF-GTD), 4.75%, 2/15/38 | | | 300,000 | | | | 313,605 | |
| City of Austin TX, General Obligation, 5%, 9/1/26 | | | 550,000 | | | | 661,595 | |
| City of Fort Worth TX, General Obligation, 4%, 3/1/29 | | | 500,000 | | | | 576,710 | |
| Mueller Local Government Corp., 5%, 9/1/25 | | | 500,000 | | | | 501,380 | |
| San Jacinto River Authority, (BAM), 4%, 10/1/23 | | | 200,000 | | | | 218,934 | |
| | | | | | | | 2,272,224 | |
| Utah - 1.6% | | | | | | | | |
| Utah Transit Authority, (BHAC-CR, MBIA), 5%, 6/15/35 | | | 280,000 | | | | 377,630 | |
| | | | | | | | | |
| Virginia - 6.8% | | | | | | | | |
| Hampton Roads Sanitation District, Series A, (Prerefunded 10/1/27 @ $100), 5%, 10/1/36 | | | 500,000 | | | | 631,740 | |
| James City County Economic Development Authority, 5%, 6/15/22 | | | 250,000 | | | | 274,217 | |
| Virginia Port Authority Revenue, Series B, 5%, 7/1/21 | | | 100,000 | | | | 105,743 | |
| Western Regional Jail Authority, 5%, 12/1/34 | | | 500,000 | | | | 608,410 | |
| | | | | | | | 1,620,110 | |
| Washington - 1.0% | | | | | | | | |
| State of Washington, General Obligation, Series E, 5%, 2/1/29 | | | 205,000 | | | | 235,264 | |
| | | | | | | | | |
| West Virginia - 2.3% | | | | | | | | |
| West Virginia Economic Development Authority, Series A, 5%, 7/1/37 | | | 450,000 | | | | 539,105 | |
| | | | | | | | | |
| Wisconsin - 1.9% | | | | | | | | |
| Wisconsin Health & Educational Facilities Authority, Series A, 4%, 11/15/35 | | | 400,000 | | | | 440,812 | |
| TOTAL INVESTMENTS - 97.3% (Cost $21,881,333**) | | | | | | | 23,162,588 | |
| NET OTHER ASSETS AND LIABILITIES - 2.7% | | | | | | | 644,037 | |
| TOTAL NET ASSETS - 100.0% | | | | | | $ | 23,806,625 | |
| * | This bond is covered by insurance issued by Ambac Assurance Corporation (“AMBAC”). On November 8, 2010, Ambac Financial Group, Inc., the holding company of AMBAC, announced that it had filed for Chapter 11 bankruptcy protection. Although AMBAC’s claim paying ability appears strong at this point, its ultimate ability to guarantee timely payment of principal and interest on these bonds, should they default, will be dependent on the timing and magnitude of losses within the entity’s overall portfolio. |
| ** | Aggregate cost for Federal tax purposes was $21,881,333. |
| AGM | Assured Guaranty Municipal Corp. |
| AMBAC | AMBACIndemnity Corp. |
| BAM | Build America Mutual Assurance Co. |
| BHAC-CR | Berkshire Hathaway Assurance Corp. |
| FGIC | Financial Guaranty Insurance Co. |
| GO of AUTH | General Obligation of the Authority. |
| MBIA | MBIA Insurance Corp. |
| PSF-GTD | Permanent School Fund Guaranteed. |
| Q-SBLF | Qualified School Board Loan Fund. |
| ST AID DIR DEP | State Aid Direct Deposit. |
| ST AID WITHHLDG | State Aid Withholding. |
| ST APPROP | State Appropriations. |
| ST INTERCEPT | State Intercept. |
See accompanying Notes to Financial Statements.
22
Madison Funds | October 31, 2019
| |
| Madison High Quality Bond Fund Portfolio of Investments |
| | | | | | | |
| | | Par Value | | | Value (Note 2) | |
| | | | | | | | | |
| CORPORATE NOTES AND BONDS - 39.6% | | | | | | | | |
| | | | | | | | | |
| Consumer Discretionary - 2.3% | | | | | | | | |
| Target Corp., 2.9%, 1/15/22 | | $ | 2,000,000 | | | $ | 2,052,974 | |
| | | | | | | | | |
| Consumer Staples - 1.6% | | | | | | | | |
| Coca-Cola Co./The, 2.45%, 11/1/20 | | | 1,500,000 | | | | 1,510,230 | |
| | | | | | | | | |
| Energy - 1.4% | | | | | | | | |
| Chevron Corp., 2.427%, 6/24/20 | | | 1,250,000 | | | | 1,253,915 | |
| | | | | | | | | |
| Financials - 18.8% | | | | | | | | |
| American Express Credit Corp., MTN, 2.7%, 3/3/22 | | | 500,000 | | | | 508,638 | |
| Bank of America Corp., MTN, (3M USD LIBOR + 0.930%) (A), 2.816%, 7/21/23 | | | 1,500,000 | | | | 1,523,431 | |
| Bank of New York Mellon Corp./The, MTN, 2.2%, 8/16/23 | | | 1,000,000 | | | | 1,005,760 | |
| BB&T Corp., MTN, 2.85%, 10/26/24 | | | 750,000 | | | | 774,622 | |
| Berkshire Hathaway Finance Corp. (B), 2.9%, 10/15/20 | | | 500,000 | | | | 505,708 | |
| Goldman Sachs Bank USA, 3.2%, 6/5/20 | | | 1,000,000 | | | | 1,007,762 | |
| Huntington National Bank/The, 3.55%, 10/6/23 | | | 1,000,000 | | | | 1,055,400 | |
| John Deere Capital Corp., MTN (B), 2.65%, 1/6/22 | | | 1,500,000 | | | | 1,527,242 | |
| JPMorgan Chase & Co., 2.25%, 1/23/20 | | | 1,500,000 | | | | 1,500,660 | |
| JPMorgan Chase & Co., 2.972%, 1/15/23 | | | 450,000 | | | | 458,714 | |
| Morgan Stanley, 2.8%, 6/16/20 | | | 1,750,000 | | | | 1,758,526 | |
| PNC Financial Services Group Inc./The, 3.3%, 3/8/22 | | | 1,300,000 | | | | 1,339,112 | |
| State Street Corp.(SOFR + 0.940%) (A), 2.354%, 11/1/25 | | | 1,500,000 | | | | 1,509,908 | |
| U.S. Bancorp, MTN, 2.625%, 1/24/22 | | | 1,000,000 | | | | 1,016,133 | |
| Wells Fargo & Co., MTN, (3M USD LIBOR + 0.825%) (A), 2.406%, 10/30/25 | | | 1,500,000 | | | | 1,501,269 | |
| | | | | | | | 16,992,885 | |
| | | | | | | | | |
| Health Care - 3.4% | | | | | | | | |
| Merck & Co. Inc., 3.875%, 1/15/21 | | | 1,500,000 | | | | 1,531,073 | |
| UnitedHealth Group Inc., 2.875%, 3/15/23 | | | 1,500,000 | | | | 1,542,124 | |
| | | | | | | | 3,073,197 | |
| | | | | | | | | |
| Industrials - 0.6% | | | | | | | | |
| Caterpillar Inc., 3.9%, 5/27/21 | | | 500,000 | | | | 515,940 | |
| | | | | | | | | |
| Information Technology - 11.5% | | | | | | | | |
| Apple Inc., 2.4%, 5/3/23 | | | 1,500,000 | | | | 1,526,784 | |
| Cisco Systems Inc., 2.2%, 2/28/21 | | | 1,500,000 | | | | 1,508,595 | |
| Intel Corp., 3.3%, 10/1/21 | | | 1,750,000 | | | | 1,800,169 | |
| Microsoft Corp., 3%, 10/1/20 | | | 1,250,000 | | | | 1,264,605 | |
| Microsoft Corp., 2.875%, 2/6/24 | | | 500,000 | | | | 521,287 | |
| salesforce.com Inc., 3.25%, 4/11/23 | | | 2,000,000 | | | | 2,085,979 | |
| Visa Inc., 2.2%, 12/14/20 | | | 1,700,000 | | | | 1,708,364 | |
| | | | | | | | 10,415,783 | |
| Total Corporate Notes and Bonds | | | | | | | | |
| (Cost $35,220,198) | | | | | | | 35,814,924 | |
| | | | | | | | | |
| U.S. GOVERNMENT AND AGENCY OBLIGATIONS - 57.4% | | | | | | | | |
| | | | | | | | | |
| Fannie Mae - 4.4% | | | | | | | | |
| 1.375%, 10/7/21 | | | 4,000,000 | | | | 3,985,382 | |
| | | | | | | | | |
| Freddie Mac - 4.5% | | | | | | | | |
| 2.375%, 1/13/22 | | | 4,000,000 | | | | 4,069,255 | |
| | | | | | | | | |
| U.S. Treasury Notes - 48.5% | | | | | | | | |
| 3.625%, 2/15/20 | | | 3,000,000 | | | | 3,016,289 | |
| 1.625%, 3/15/20 | | | 3,500,000 | | | | 3,499,863 | |
| 1.375%, 3/31/20 | | | 2,750,000 | | | | 2,747,207 | |
| 2.000%, 7/31/20 | | | 2,750,000 | | | | 2,757,842 | |
| 1.375%, 8/31/20 | | | 3,000,000 | | | | 2,994,375 | |
| 1.625%, 5/31/23 | | | 1,000,000 | | | | 1,003,516 | |
| 2.375%, 8/15/24 | | | 3,250,000 | | | | 3,374,414 | |
| 2.125%, 5/15/25 | | | 4,000,000 | | | | 4,117,031 | |
| 1.625%, 5/15/26 | | | 1,750,000 | | | | 1,752,803 | |
| 2.250%, 11/15/27 | | | 2,750,000 | | | | 2,877,510 | |
| 2.625%, 11/15/20 | | | 3,000,000 | | | | 3,030,937 | |
| 2.500%, 8/15/23 | | | 3,000,000 | | | | 3,106,875 | |
| 2.750%, 11/15/23 | | | 3,000,000 | | | | 3,142,500 | |
| 1.500%, 8/15/26 | | | 1,750,000 | | | | 1,738,311 | |
| 2.375%, 5/15/27 | | | 4,450,000 | | | | 4,691,621 | |
| | | | | | | | 43,851,094 | |
| Total U.S. Government and Agency Obligations (Cost $50,838,084) | | | | | | | 51,905,731 | |
| | | Shares | | | | | |
| SHORT-TERM INVESTMENTS - 4.5% | | | | | | | | |
| State Street Institutional U.S. Government Money Market Fund, 1.75%, Premier Class (C) | | | 3,800,036 | | | | 3,800,036 | |
| State Street Navigator Securities Lending Government Money Market Portfolio, 1.75% (C) (D) | | | 214,965 | | | | 214,965 | |
| Total Short-Term Investments | | | | | | | | |
| (Cost $4,015,001) | | | | | | | 4,015,001 | |
| TOTAL INVESTMENTS - 101.5% (Cost $90,073,283**) | | | | | | | 91,735,656 | |
| NET OTHER ASSETS AND LIABILITIES - (1.5%) | | | | | | | (1,329,062 | ) |
| TOTAL NET ASSETS - 100.0% | | | | | | $ | 90,406,594 | |
| ** | | Aggregate cost for Federal tax purposes was $90,073,283. |
| (A) | | Floating rate or variable rate note. Rate shown is as of October 31, 2019. |
| (B) | | All or a portion of these securities, with an aggregate fair value of $210,612, are on loan as part of a securities lending program. See footnote (D) and Note 9 for details on the securities lending program. |
| (D) | | Represents investments of cash collateral received in connection with securities lending. |
| LIBOR | | London Interbank Offered Rate. |
| SOFR | | Secured Overnight Financing Rate. |
| |
| Madison Core Bond Fund Portfolio of Investments |
| | | Par Value | | | Value (Note 2) | |
| | | | | | | | | |
| ASSET BACKED SECURITIES - 4.7% | | | | | | | | |
| BMW Floorplan Master Owner Trust, | | | | | | | | |
| Series 2018-1, Class A2, (1M USD LIBOR + 0.320%) (A) (B), 2.234%, 5/15/23 | | $ | 325,000 | | | $ | 325,551 | |
| Chesapeake Funding II LLC, Series 2018-3A, Class B (A), 3.62%, 1/15/31 | | | 100,000 | | | | 103,719 | |
| Chesapeake Funding II LLC, Series 2017-4A, Class A1 (A), 2.12%, 11/15/29 | | | 536,052 | | | | 536,059 | |
| Chesapeake Funding II LLC, Series 2018-1A, Class A1 (A), 3.04%, 4/15/30 | | | 447,636 | | | | 453,312 | |
| Chesapeake Funding II LLC, Series 2018-2A, Class A1 (A), 3.23%, 8/15/30 | | | 312,143 | | | | 316,627 | |
| Chesapeake Funding II LLC, Series 2018-2A, Class B (A), 3.52%, 8/15/30 | | | 350,000 | | | | 360,346 | |
| CNH Equipment Trust, Series 2019-A, Class A4, 3.22%, 1/15/26 | | | 385,000 | | | | 400,260 | |
| Dell Equipment Finance Trust, Series 2019-2, Class A3 (A), 1.91%, 10/22/24 | | | 550,000 | | | | 548,852 | |
| Enterprise Fleet Financing LLC, Series 2017-2, Class A2 (A), 1.97%, 1/20/23 | | | 152,777 | | | | 152,684 | |
| Enterprise Fleet Financing LLC, Series 2017-3, Class A3 (A), 2.36%, 5/20/23 | | | 1,000,000 | | | | 1,003,968 | |
| Enterprise Fleet Financing LLC, Series 2019-3, Class A2 (A), 2.06%, 5/20/25 | | | 500,000 | | | | 499,921 | |
| Evergreen Credit Card Trust, Series 2019-1, Class B (A), 3.59%, 1/15/23 | | | 275,000 | | | | 278,870 | |
| Synchrony Credit Card Master Note Trust, Series 2017-1, Class B, 2.19%, 6/15/23 | | | 1,000,000 | | | | 999,792 | |
| Verizon Owner Trust, Series 2018-A, Class A1A, 3.23%, 4/20/23 | | | 830,000 | | | | 845,619 | |
| Wheels SPV LLC, Series 2019-1A, Class A3 (A), 2.35%, 5/22/28 | | | 300,000 | | | | 302,184 | |
| Total Asset Backed Securities | | | | | | | | |
| (Cost $7,050,616) | | | | | | | 7,127,764 | |
| | | | | | | | | |
| COLLATERALIZED MORTGAGE OBLIGATIONS - 5.8% | | | | | | | | |
| Bunker Hill Loan Depositary Trust, Series 2019-2, Class A1 (A), 2.879%, 7/25/49 | | | 572,136 | | | | 575,923 | |
| Fannie Mae REMICS, Series 2015-12, Class NI, IO, 3.5%, 3/25/30 | | | 1,411,474 | | | | 140,542 | |
| Fannie Mae REMICS, Series 2011-31, Class DB, 3.5%, 4/25/31 | | | 801,095 | | | | 842,332 | |
| Fannie Mae REMICS, Series 2011-36, Class QB, 4%, 5/25/31 | | | 929,783 | | | | 987,575 | |
| Fannie Mae REMICS, Series 2001-73, Class GZ, 6%, 12/25/31 | | | 200,633 | | | | 223,013 | |
| Fannie Mae REMICS, Series 2005-79, Class LT, 5.5%, 9/25/35 | | | 149,923 | | | | 170,595 | |
| Fannie Mae REMICS, Series 2011-101, Class NC, 2.5%, 4/25/40 | | | 242,652 | | | | 243,310 | |
| Fannie Mae REMICS, Series 2015-44, Class GI, IO, 3%, 11/25/40 | | | 509,143 | | | | 13,367 | |
| Fannie Mae REMICS, Series 2016-21, Class BA, 3%, 3/25/42 | | | 517,501 | | | | 528,086 | |
| Freddie Mac REMICS, Series 4066, Class DI, IO, 3%, 6/15/27 | | | 1,914,832 | | | | 135,285 | |
| Government National Mortgage Association, Series 2015-53, Class IL, IO, 3%, 9/20/44 | | | 1,576,463 | | | | 100,021 | |
| JPMorgan Mortgage Trust, Series 2019-2, Class A6 (A) (B) (C), 4%, 8/25/49 | | | 358,886 | | | | 358,989 | |
| JPMorgan Mortgage Trust, Series 2019-3, Class A4 (A) (B) (C), 4%, 9/25/49 | | | 701,173 | | | | 705,898 | |
| JPMorgan Mortgage Trust, Series 2019-5, Class A3 (A) (B) (C), 4%, 11/25/49 | | | 521,152 | | | | 529,295 | |
| JPMorgan Mortgage Trust, Series 2019-5, Class A4 (A) (B) (C), 4%, 11/25/49 | | | 247,434 | | | | 248,395 | |
| JPMorgan Mortgage Trust, Series 2019-7, Class A3 (A) (B) (C), 3.5%, 2/25/50 | | | 775,235 | | | | 786,530 | |
| OBX Trust, Series 2019-INV1, Class A8 (A) (B) (C), 4%, 11/25/48 | | | 681,868 | | | | 686,419 | |
See accompanying Notes to Financial Statements.
23
Madison Funds | October 31, 2019
| |
| Madison Core Bond Fund Portfolio of Investments - continued |
| | | Par Value | | | Value (Note 2) | |
| | | | | | | | | |
| COLLATERALIZED MORTGAGE OBLIGATIONS - continued | | | | | | | | |
| Onslow Bay Mortgage Loan Trust, | | | | | | | | |
| Series 2015-1, Class 2A4 (A) (B) (C), 3%, 11/25/45 | | $ | 620,122 | | | $ | 623,333 | |
| PSMC Trust, Series 2019-2, Class A1 (A) (B) (C), 3.5%, 10/25/49 | | | 500,000 | | | | 509,297 | |
| Wells Fargo Mortgage Backed Securities Trust, Series 2019-2, Class A1 (A) (B) (C), 4%, 4/25/49 | | | 431,275 | | | | 439,091 | |
| Total Collateralized Mortgage Obligations (Cost $9,081,404) | | | | | | | 8,847,296 | |
| | | | | | | | | |
| COMMERCIAL MORTGAGE-BACKED SECURITIES - 3.5% | | | | | | | | |
| Fannie Mae-Aces, Series 2017-M15, Class ATS2 (B) (C), 3.136%, 11/25/27 | | | 500,000 | | | | 526,460 | |
| FHLMC Multifamily Structured Pass Through Certificates, Series K718, Class X1, IO (B) (C), 0.608%, 1/25/22 | | | 22,117,617 | | | | 253,015 | |
| FHLMC Multifamily Structured Pass Through Certificates, Series KJ17, Class A2, 2.982%, 11/25/25 | | | 400,000 | | | | 419,760 | |
| FHLMC Multifamily Structured Pass Through Certificates, Series K058, Class A2, 2.653%, 8/25/26 | | | 2,000,000 | | | | 2,075,039 | |
| FHLMC Multifamily Structured Pass Through Certificates, Series K059, Class X1, IO (B) (C), 0.315%, 9/25/26 | | | 15,794,187 | | | | 297,430 | |
| FHLMC Multifamily Structured Pass Through Certificates, Series K066, Class A2, 3.117%, 6/25/27 | | | 1,000,000 | | | | 1,068,605 | |
| FREMF Mortgage Trust, Series 2015-K721, Class B (A) (B) (C), 3.565%, 11/25/47 | | | 750,000 | | | | 772,214 | |
| WFRBS Commercial Mortgage Trust, Series 2014-LC14, Class A2, 2.862%, 3/15/47 | | | 13,506 | | | | 13,493 | |
| Total Commercial Mortgage-Backed Securities (Cost $5,210,254) | | | | | | | 5,426,016 | |
| | | | | | | | | |
| CORPORATE NOTES AND BONDS - 23.8% | | | | | | | | |
| | | | | | | | | |
| Communication Services - 2.1% | | | | | | | | |
| AT&T Inc., 4.75%, 5/15/46 | | | 1,000,000 | | | | 1,110,240 | |
| Comcast Corp., 4.7%, 10/15/48 | | | 250,000 | | | | 307,860 | |
| Mars Inc. (A), 3.875%, 4/1/39 | | | 400,000 | | | | 448,758 | |
| Sprint Spectrum Co. LLC / Sprint Spectrum Co. II LLC / Sprint Spectrum Co. III LLC (A), 3.36%, 3/20/23 | | | 250,000 | | | | 251,562 | |
| Verizon Communications Inc., 4.4%, 11/1/34 | | | 500,000 | | | | 577,202 | |
| Vodafone Group PLC (D), 3.75%, 1/16/24 | | | 250,000 | | | | 263,543 | |
| Vodafone Group PLC (D), 5%, 5/30/38 | | | 250,000 | | | | 286,073 | |
| | | | | | | | 3,245,238 | |
| Consumer Discretionary - 2.6% | | | | | | | | |
| Charter Communications Operating LLC / Charter Communications Operating Capital Corp., 4.464%, 7/23/22 | | | 500,000 | | | | 525,631 | |
| D.R. Horton Inc., 2.55%, 12/1/20 | | | 500,000 | | | | 501,715 | |
| Discovery Communications LLC, 5%, 9/20/37 | | | 500,000 | | | | 542,975 | |
| DISH DBS Corp., 6.75%, 6/1/21 | | | 250,000 | | | | 262,500 | |
| Expedia Group Inc. (A), 3.25%, 2/15/30 | | | 500,000 | | | | 500,341 | |
| Lennar Corp., 4.75%, 4/1/21 | | | 500,000 | | | | 511,900 | |
| Lowe’s Cos. Inc., 4.55%, 4/5/49 | | | 500,000 | | | | 573,767 | |
| Walgreens Boots Alliance Inc., 4.5%, 11/18/34 | | | 500,000 | | | | 537,928 | |
| | | | | | | | 3,956,757 | |
| Consumer Staples - 0.3% | | | | | | | | |
| Molson Coors Brewing Co., 2.1%, 7/15/21 | | | 500,000 | | | | 500,345 | |
| | | | | | | | | |
| Energy - 4.1% | | | | | | | | |
| Antero Resources Corp. (E), 5.625%, 6/1/23 | | | 300,000 | | | | 210,375 | |
| Boardwalk Pipelines L.P., 4.45%, 7/15/27 | | | 400,000 | | | | 412,033 | |
| Energy Transfer Operating L.P., 5.25%, 4/15/29 | | | 375,000 | | | | 421,795 | |
| EnLink Midstream Partners L.P., 5.45%, 6/1/47 | | | 400,000 | | | | 306,000 | |
| Enterprise Products Operating LLC, 3.75%, 2/15/25 | | | 500,000 | | | | 533,128 | |
| Kinder Morgan Inc., 5.55%, 6/1/45 | | | 920,000 | | | | 1,079,333 | |
| Marathon Petroleum Corp., 3.8%, 4/1/28 | | | 600,000 | | | | 632,591 | |
| MPLX L.P., 4.8%, 2/15/29 | | | 250,000 | | | | 275,395 | |
| Occidental Petroleum Corp., 3.5%, 8/15/29 | | | 500,000 | | | | 506,635 | |
| Occidental Petroleum Corp., 4.4%, 8/15/49 | | | 250,000 | | | | 253,565 | |
| Unit Corp., 6.625%, 5/15/21 | | | 525,000 | | | | 346,500 | |
| Valero Energy Corp., 6.625%, 6/15/37 | | | 1,000,000 | | | | 1,304,892 | |
| | | | | | | | 6,282,242 | |
| | | | | | | | | |
| Financials - 7.3% | | | | | | | | |
| AerCap Ireland Capital DAC / AerCap Global Aviation Trust (D), 3.875%, 1/23/28 | | | 500,000 | | | | 517,526 | |
| Air Lease Corp., 3.75%, 2/1/22 | | | 300,000 | | | | 309,571 | |
| American Express Co., 2.5%, 8/1/22 | | | 350,000 | | | | 354,403 | |
| American Express Co., 4.2%, 11/6/25 | | | 650,000 | | | | 718,518 | |
| American International Group Inc., 4.75%, 4/1/48 | | | 500,000 | | | | 589,293 | |
| Bank of America Corp., MTN, (3M USD LIBOR + 0.930%) (B), 2.816%, 7/21/23 | | | 500,000 | | | | 507,810 | |
| Bank of Montreal (D), 3.3%, 2/5/24 | | | 325,000 | | | | 339,158 | |
| Capital One Financial Corp., 3.3%, 10/30/24 | | | 600,000 | | | | 624,683 | |
| Cboe Global Markets Inc., 3.65%, 1/12/27 | | | 445,000 | | | | 478,301 | |
| Goldman Sachs Group Inc./The, (3M USD LIBOR + 1.201%) (B), 3.272%, 9/29/25 | | | 850,000 | | | | 878,844 | |
| Goldman Sachs Group Inc./The, 3.5%, 11/16/26 | | | 300,000 | | | | 312,564 | |
| Huntington National Bank/The, 3.55%, 10/6/23 | | | 500,000 | | | | 527,700 | |
| Intercontinental Exchange Inc., 3.75%, 9/21/28 | | | 250,000 | | | | 274,591 | |
| JPMorgan Chase & Co., 2.972%, 1/15/23 | | | 300,000 | | | | 305,809 | |
| JPMorgan Chase & Co., 3.125%, 1/23/25 | | | 750,000 | | | | 779,549 | |
| M&T Bank Corp., 3.55%, 7/26/23 | | | 250,000 | | | | 262,881 | |
| Mitsubishi UFJ Financial Group Inc. (D), 3.195%, 7/18/29 | | | 500,000 | | | | 518,819 | |
| Morgan Stanley, 4.3%, 1/27/45 | | | 1,000,000 | | | | 1,162,801 | |
| PNC Bank NA, 2.7%, 10/22/29 | | | 250,000 | | | | 250,901 | |
| Regions Financial Corp., 2.75%, 8/14/22 | | | 600,000 | | | | 611,177 | |
| State Street Corp., (SOFR + 1.490%) (B), 3.031%, 11/1/34 | | | 250,000 | | | | 252,607 | |
| TD Ameritrade Holding Corp., 3.3%, 4/1/27 | | | 500,000 | | | | 526,897 | |
| | | | | | | | 11,104,403 | |
| | | | | | | | | |
| Health Care - 2.3% | | | | | | | | |
| AbbVie Inc., 3.75%, 11/14/23 | | | 400,000 | | | | 421,746 | |
| Becton, Dickinson and Co., 2.894%, 6/6/22 | | | 400,000 | | | | 407,829 | |
| Cigna Corp., 4.9%, 12/15/48 | | | 500,000 | | | | 580,741 | |
| CVS Health Corp., 5.125%, 7/20/45 | | | 750,000 | | | | 864,494 | |
| Forest Laboratories LLC (A), 5%, 12/15/21 | | | 200,000 | | | | 209,963 | |
| Humana Inc., 2.5%, 12/15/20 | | | 750,000 | | | | 753,212 | |
| UnitedHealth Group Inc., 3.7%, 8/15/49 | | | 250,000 | | | | 263,132 | |
| | | | | | | | 3,501,117 | |
| | | | | | | | | |
| Industrials - 2.0% | | | | | | | | |
| Bristol-Myers Squibb Co. (A), 3.4%, 7/26/29 | | | 650,000 | | | | 699,131 | |
| Carlisle Cos. Inc., 3.5%, 12/1/24 | | | 500,000 | | | | 517,071 | |
| DAE Funding LLC (A), 5.25%, 11/15/21 | | | 250,000 | | | | 259,375 | |
| Owens Corning, 3.95%, 8/15/29 | | | 550,000 | | | | 565,518 | |
| TransDigm Inc., 6%, 7/15/22 | | | 250,000 | | | | 254,250 | |
| WRKCo Inc., 3.9%, 6/1/28 | | | 700,000 | | | | 750,320 | |
| | | | | | | | 3,045,665 | |
| | | | | | | | | |
| Information Technology - 1.6% | | | | | | | | |
| Dell International LLC / EMC Corp. (A), 8.35%, 7/15/46 | | | 350,000 | | | | 466,051 | |
| Fidelity National Information Services Inc., 4.75%, 5/15/48 | | | 300,000 | | | | 359,175 | |
| Marvell Technology Group Ltd. (D), 4.2%, 6/22/23 | | | 500,000 | | | | 526,206 | |
| PayPal Holdings Inc., 2.4%, 10/1/24 | | | 500,000 | | | | 503,378 | |
| Salesforce.com Inc., 3.7%, 4/11/28 | | | 500,000 | | | | 552,053 | |
| | | | | | | | 2,406,863 | |
| | | | | | | | | |
| Materials - 0.1% | | | | | | | | |
| Arconic Inc., 5.125%, 10/1/24 | | | 200,000 | | | | 214,500 | |
| | | | | | | | | |
| Real Estate - 0.4% | | | | | | | | |
| Store Capital Corp., 4.5%, 3/15/28 | | | 500,000 | | | | 548,870 | |
| | | | | | | | | |
| Utilities - 1.0% | | | | | | | | |
| Duke Energy Corp., 3.75%, 9/1/46 | | | 1,000,000 | | | | 1,035,087 | |
| Interstate Power & Light Co., 3.5%, 9/30/49 | | | 250,000 | | | | 253,577 | |
| PacifiCorp., 4.15%, 2/15/50 | | | 250,000 | | | | 296,243 | |
| | | | | | | | 1,584,907 | |
| Total Corporate Notes and Bonds | | | | | | | | |
| (Cost $34,259,619) | | | | | | | 36,390,907 | |
| | | | | | | | | |
| LONG TERM MUNICIPAL BONDS - 1.3% | | | | | | | | |
| Rancho Water District Financing Authority Revenue, (Prerefunded 8/1/20 @ $100), 6.337%, 8/1/40 | | | 10,000 | | | | 10,345 | |
| Rancho Water District Financing Authority Revenue, 6.337%, 8/1/40 | | | 655,000 | | | | 677,598 | |
| South Dakota State Building Authority Revenue, Series F, 4.7%, 6/1/32 | | | 1,250,000 | | | | 1,361,487 | |
| Total Long Term Municipal Bonds | | | | | | | | |
| (Cost $1,929,655) | | | | | | | 2,049,430 | |
| | | | | | | | | |
| MORTGAGE BACKED SECURITIES - 20.1% | | | | | | | | |
| | | | | | | | | |
| Fannie Mae - 11.0% | | | | | | | | |
| 3%, 9/1/30 Pool # 890696 | | | 758,943 | | | | 780,872 | |
| 3%, 12/1/30 Pool # AL8924 | | | 389,952 | | | | 401,553 | |
| 7%, 11/1/31 Pool # 607515 | | | 6,501 | | | | 7,337 | |
| 3.5%, 12/1/31 Pool # MA0919 | | | 265,009 | | | | 275,944 | |
| 6.5%, 3/1/32 Pool # 631377 | | | 23,159 | | | | 25,795 | |
| 6.5%, 5/1/32 Pool # 636758 | | | 1,939 | | | | 2,159 | |
| 7%, 5/1/32 Pool # 644591 | | | 508 | | | | 524 | |
| 6.5%, 6/1/32 Pool # 545691 | | | 53,272 | | | | 60,537 | |
| 3.5%, 8/1/32 Pool # MA3098 | | | 500,174 | | | | 519,767 | |
| 3.5%, 9/1/32 Pool # MA3126 | | | 338,608 | | | | 351,900 | |
| 5.5%, 11/1/33 Pool # 555880 | | | 59,675 | | | | 66,917 | |
| 5%, 5/1/34 Pool # 780890 | | | 25,092 | | | | 27,700 | |
| 7%, 7/1/34 Pool # 792636 | | | 7,271 | | | | 7,500 | |
| 2.5%, 10/1/34 Pool # MA3797 | | | 248,087 | | | | 251,203 | |
| 4%, 2/1/35 Pool # MA2177 | | | 627,500 | | | | 664,282 | |
| 5%, 8/1/35 Pool # 829670 | | | 65,569 | | | | 72,293 | |
See accompanying Notes to Financial Statements.
24
Madison Funds | October 31, 2019
| |
| Madison Core Bond Fund Portfolio of Investments - continued |
| | | Par Value | | | Value (Note 2) | |
| | | | | | | | | |
| MORTGAGE BACKED SECURITIES - continued | | | | | | | | |
| | | | | | | | | |
| Fannie Mae - continued | | | | | | | | |
| 5%, 9/1/35 Pool # 820347 | | $ | 85,158 | | | $ | 94,977 | |
| 5%, 9/1/35 Pool # 835699 | | | 64,243 | | | | 71,259 | |
| 3.5%, 12/1/35 Pool # MA2473 | | | 785,669 | | | | 815,384 | |
| 4.5%, 12/1/35 Pool # 745147 | | | 9,434 | | | | 10,207 | |
| 5%, 12/1/35 Pool # 850561 | | | 21,866 | | | | 24,144 | |
| 6%, 11/1/36 Pool # 902510 | | | 50,230 | | | | 58,072 | |
| 6%, 10/1/37 Pool # 947563 | | | 68,708 | | | | 79,373 | |
| 6.5%, 12/1/37 Pool # 889072 | | | 51,024 | | | | 59,129 | |
| 6.5%, 8/1/38 Pool # 987711 | | | 113,509 | | | | 136,227 | |
| 3%, 11/1/39 Pool # MA3831 | | | 500,000 | | | | 512,336 | |
| 4%, 9/1/40 Pool # AE3039 | | | 652,944 | | | | 698,844 | |
| 4%, 1/1/41 Pool # AB2080 | | | 531,196 | | | | 568,452 | |
| 5.5%, 7/1/41 Pool # AL6588 | | | 432,345 | | | | 486,910 | |
| 4%, 9/1/41 Pool # AJ1406 | | | 346,039 | | | | 370,654 | |
| 4%, 10/1/41 Pool # AJ4046 | | | 634,966 | | | | 679,508 | |
| 3.5%, 11/1/41 Pool # AB3867 | | | 291,266 | | | | 305,654 | |
| 4%, 3/1/42 Pool # AL1998 | | | 947,151 | | | | 1,013,263 | |
| 3.5%, 6/1/42 Pool # AO4134 | | | 986,744 | | | | 1,035,530 | |
| 3.5%, 8/1/42 Pool # AP2133 | | | 594,128 | | | | 623,554 | |
| 3%, 9/1/42 Pool # AP6568 | | | 90,927 | | | | 93,795 | |
| 3.5%, 9/1/42 Pool # AB6228 | | | 348,685 | | | | 365,956 | |
| 4%, 10/1/42 Pool # AP7363 | | | 698,786 | | | | 745,798 | |
| 3.5%, 1/1/43 Pool # AQ9326 | | | 489,992 | | | | 518,479 | |
| 3%, 2/1/43 Pool # AL3072 | | | 824,543 | | | | 850,529 | |
| 3.5%, 3/1/43 Pool # AT0310 | | | 437,766 | | | | 459,303 | |
| 3.5%, 4/1/43 Pool # AT2887 | | | 414,400 | | | | 434,916 | |
| 4%, 1/1/45 Pool # AS4257 | | | 189,076 | | | | 200,706 | |
| 3.5%, 8/1/45 Pool # AS5645 | | | 713,143 | | | | 743,567 | |
| 4.5%, 10/1/46 Pool # MA2783 | | | 134,109 | | | | 142,416 | |
| 3%, 1/1/47 Pool # BE0108 | | | 594,849 | | | | 612,499 | |
| 3.5%, 1/1/49 Pool # MA3574 | | | 419,598 | | | | 431,936 | |
| | | | | | | | 16,759,660 | |
| | | | | | | | | |
| Freddie Mac - 9.1% | | | | | | | | |
| 4.5%, 2/1/25 Pool # J11722 | | | 89,743 | | | | 94,278 | |
| 4.5%, 5/1/25 Pool # J12247 | | | 189,151 | | | | 198,455 | |
| 8%, 6/1/30 Pool # C01005 | | | 510 | | | | 597 | |
| 6.5%, 1/1/32 Pool # C62333 | | | 22,225 | | | | 24,884 | |
| 3.5%, 8/1/32 Pool # C91485 | | | 315,539 | | | | 328,757 | |
| 4%, 5/1/33 Pool # G18693 | | | 947,511 | | | | 992,579 | |
| 4.5%, 6/1/34 Pool # C01856 | | | 342,088 | | | | 370,915 | |
| 2.5%, 10/1/34 Pool # SB8010 | | | 1,737,336 | | | | 1,756,107 | |
| 6.5%, 11/1/36 Pool # C02660 | | | 8,156 | | | | 9,271 | |
| 5.5%, 1/1/37 Pool # G04593 | | | 190,846 | | | | 214,917 | |
| 5.5%, 11/1/37 Pool # A68787 | | | 134,118 | | | | 150,695 | |
| 5.5%, 12/1/38 Pool # G05267 | | | 377,145 | | | | 423,799 | |
| 4.5%, 8/1/39 Pool # G08361 | | | 455,831 | | | | 494,333 | |
| 3.5%, 11/1/40 Pool # G06168 | | | 465,192 | | | | 488,425 | |
| 4%, 10/1/41 Pool # Q04092 | | | 744,529 | | | | 797,351 | |
| 4.5%, 3/1/42 Pool # G07491 | | | 485,804 | | | | 526,883 | |
| 3%, 9/1/42 Pool # C04233 | | | 581,334 | | | | 599,967 | |
| 3%, 2/1/43 Pool # Q15767 | | | 387,707 | | | | 400,111 | |
| 3%, 4/1/43 Pool # V80025 | | | 404,085 | | | | 417,078 | |
| 3%, 4/1/43 Pool # V80026 | | | 395,676 | | | | 408,358 | |
| 3.5%, 8/1/44 Pool # Q27927 | | | 537,420 | | | | 565,272 | |
| 3%, 7/1/45 Pool # G08653 | | | 646,456 | | | | 665,189 | |
| 3.5%, 8/1/45 Pool # Q35614 | | | 611,423 | | | | 639,854 | |
| 3%, 11/1/45 Pool # G08675 | | | 819,044 | | | | 842,744 | |
| 3%, 1/1/46 Pool # G08686 | | | 851,481 | | | | 876,143 | |
| 3%, 10/1/46 Pool # G60722 | | | 738,616 | | | | 759,159 | |
| 3.5%, 11/1/47 Pool # Q52079 | | | 904,801 | | | | 937,163 | |
| | | | | | | | 13,983,284 | |
| | | | | | | | | |
| Ginnie Mae - 0.0% | | | | | | | | |
| 6.5%, 2/20/29 Pool # 2714 | | | 7,672 | | | | 8,788 | |
| 6.5%, 4/20/31 Pool # 3068 | | | 3,763 | | | | 4,359 | |
| 4%, 4/15/39 Pool # 698089 | | | 31,427 | | | | 33,591 | |
| | | | | | | | 46,738 | |
| Total Mortgage Backed Securities | | | | | | | | |
| (Cost $30,197,457) | | | | | | | 30,789,682 | |
| | | | | | | | | |
| U.S. GOVERNMENT AND AGENCY OBLIGATIONS - 33.8% | | | | | | | | |
| | | | | | | | | |
| U.S. Treasury Bonds - 10.8% | | | | | | | | |
| 6.625%, 2/15/27 | | | 1,500,000 | | | | 2,016,269 | |
| 5.375%, 2/15/31 | | | 1,250,000 | | | | 1,717,432 | |
| 4.500%, 5/15/38 | | | 1,500,000 | | | | 2,096,426 | |
| 3.750%, 8/15/41 | | | 2,000,000 | | | | 2,575,000 | |
| 3.000%, 5/15/45 | | | 2,000,000 | | | | 2,327,656 | |
| 2.250%, 8/15/46 | | | 1,500,000 | | | | 1,520,977 | |
| 3.000%, 5/15/47 | | | 1,000,000 | | | | 1,170,937 | |
| 3.000%, 2/15/48 | | | 1,000,000 | | | | 1,173,555 | |
| 3.375%, 11/15/48 | | | 1,500,000 | | | | 1,889,473 | |
| | | | | | | | 16,487,725 | |
| | | | | | | | | |
| U.S. Treasury Notes - 23.0% | | | | | | | | |
| 2.625%, 11/15/20 | | | 3,000,000 | | | | 3,030,937 | |
| 3.125%, 5/15/21 | | | 4,000,000 | | | | 4,092,656 | |
| 2.125%, 8/15/21 | | | 2,000,000 | | | | 2,019,141 | |
| 2.000%, 10/31/21 | | | 1,000,000 | | | | 1,008,672 | |
| 2.000%, 11/15/21 | | | 5,000,000 | | | | 5,045,508 | |
| 2.000%, 2/15/23 | | | 500,000 | | | | 507,578 | |
| 2.750%, 2/15/24 | | | 1,500,000 | | | | 1,575,762 | |
| 2.125%, 3/31/24 | | | 3,375,000 | | | | 3,460,298 | |
| 2.000%, 8/15/25 | | | 450,000 | | | | 460,459 | |
| 2.250%, 11/15/25 | | | 2,000,000 | | | | 2,075,859 | |
| 1.500%, 8/15/26 | | | 2,630,000 | | | | 2,612,432 | |
| 2.375%, 5/15/27 | | | 1,000,000 | | | | 1,054,297 | |
| 2.875%, 5/15/28 | | | 2,500,000 | | | | 2,742,285 | |
| 2.625%, 2/15/29 | | | 5,200,000 | | | | 5,622,094 | |
| | | | | | | | 35,307,978 | |
| | | | | | | | | |
| Total U.S. Government and Agency Obligations (Cost $48,429,175) | | | | | | | 51,795,703 | |
| | | | | | | | | |
| | | Shares | | | | |
| | | | | | | | | |
| SHORT-TERM INVESTMENTS - 3.5% | | | | | | | | |
| State Street Institutional U.S. Government Money Market Fund, 1.75%, Premier Class (F) | | | 5,086,280 | | | | 5,086,280 | |
| State Street Navigator Securities Lending Government Money Market Portfolio, 1.75% (F) (G) | | | 227,850 | | | | 227,850 | |
| Total Short-Term Investments | | | | | | | | |
| (Cost $5,314,130) | | | | | | | 5,314,130 | |
| TOTAL INVESTMENTS - 96.5% (Cost $141,472,310**) | | | | | | | 147,740,928 | |
| NET OTHER ASSETS AND LIABILITIES - 3.5% | | | | | | | 5,400,092 | |
| TOTAL NET ASSETS - 100.0% | | | | | | $ | 153,141,020 | |
| ** | | Aggregate cost for Federal tax purposes was $141,472,310. |
| (A) | | Security sold within terms of a private placement memorandum exempt from registration under section 144A of the Securities Act of 1933, as amended, and may be sold only to dealers in that program or other “qualified institutional buyers.” |
| (B) | | Floating rate or variable rate note. Rate shown is as of October 31, 2019. |
| (C) | | Coupon rate may change based on changes of the underlying collateral or prepayments of principal. The coupon rate shown represents the rate at period end. |
| (D) | | Notes and bonds, issued by foreign entities, denominated in U.S. dollars. The aggregate of these securities is 1.6% of total net assets. |
| (E) | | All or a portion of these securities, with an aggregate fair value of $213,012, are on loan as part of a securities lending program. See footnote (G) and Note 9 for details on the securities lending program. |
| (G) | | Represents investments of cash collateral received in connection with securities lending. |
| DAC | | Designated Activity Company. |
| LIBOR | | London Interbank Offered Rate. |
| PLC | | Public Limited Company. |
| SOFR | | Secured Overnight Financing Rate. |
See accompanying Notes to Financial Statements.
25
Madison Funds | October 31, 2019
| |
| Madison Corporate Bond Fund Portfolio of Investments |
| | | Par Value | | | Value (Note 2) | |
| CORPORATE NOTES AND BONDS - 96.1% | | | | | | | | |
| | | | | | | | | |
| Communication Services - 9.0% | | | | | | | | |
| AT&T Inc., 4.25%, 3/1/27 | | $ | 250,000 | | | $ | 274,576 | |
| AT&T Inc., 4.75%, 5/15/46 | | | 125,000 | | | | 138,780 | |
| Comcast Corp., 4.15%, 10/15/28 | | | 100,000 | | | | 112,958 | |
| L3Harris Technologies Inc., 5.054%, 4/27/45 | | | 160,000 | | | | 200,345 | |
| Mars Inc. (A), 3.875%, 4/1/39 | | | 100,000 | | | | 112,189 | |
| Sprint Spectrum Co. LLC / Sprint Spectrum Co. II LLC / Sprint Spectrum Co. III LLC (A), 3.36%, 3/20/23 | | | 50,000 | | | | 50,313 | |
| Verizon Communications Inc., 4.329%, 9/21/28 | | | 115,000 | | | | 130,955 | |
| Verizon Communications Inc., 3.875%, 2/8/29 | | | 100,000 | | | | 110,592 | |
| Verizon Communications Inc., 4.4%, 11/1/34 | | | 200,000 | | | | 230,881 | |
| | | | | | | | 1,361,589 | |
| | | | | | | | | |
| Consumer Discretionary - 6.5% | | | | | | | | |
| Amazon.com Inc., 2.8%, 8/22/24 | | | 100,000 | | | | 103,997 | |
| CCO Holdings LLC / CCO Holdings Capital Corp. (A), 5.875%, 5/1/27 | | | 100,000 | | | | 106,000 | |
| Charter Communications Operating LLC / Charter Communications Operating Capital Corp., 4.464%, 7/23/22 | | | 100,000 | | | | 105,126 | |
| Discovery Communications LLC, 5%, 9/20/37 | | | 100,000 | | | | 108,595 | |
| Expedia Group Inc. (A), 3.25%, 2/15/30 | | | 100,000 | | | | 100,068 | |
| General Motors Financial Co. Inc., 3.2%, 7/6/21 | | | 75,000 | | | | 75,956 | |
| Harman International Industries Inc., 4.15%, 5/15/25 | | | 100,000 | | | | 105,693 | |
| Lowe’s Cos. Inc., 2.5%, 4/15/26 | | | 100,000 | | | | 100,383 | |
| Lowe’s Cos. Inc., 4.55%, 4/5/49 | | | 100,000 | | | | 114,754 | |
| McDonald’s Corp., MTN, 4.875%, 12/9/45 | | | 50,000 | | | | 60,535 | |
| | | | | | | | 981,107 | |
| | | | | | | | | |
| Consumer Staples - 0.8% | | | | | | | | |
| Anheuser-Busch Cos. LLC / Anheuser-Busch | | | | | | | | |
| InBev Worldwide Inc., 4.9%, 2/1/46 | | | 100,000 | | | | 119,956 | |
| | | | | | | | | |
| Energy - 16.2% | | | | | | | | |
| Antero Resources Corp., 5.625%, 6/1/23 | | | 50,000 | | | | 35,062 | |
| Boardwalk Pipelines L.P., 4.45%, 7/15/27 | | | 100,000 | | | | 103,008 | |
| BP Capital Markets America Inc., 3.119%, 5/4/26 | | | 100,000 | | | | 104,792 | |
| Chevron Corp., 3.191%, 6/24/23 | | | 200,000 | | | | 208,957 | |
| ConocoPhillips Co., 4.15%, 11/15/34 | | | 20,000 | | | | 22,345 | |
| Devon Energy Corp., 5.6%, 7/15/41 | | | 100,000 | | | | 119,044 | |
| Energy Transfer Operating L.P., 5.25%, 4/15/29 | | | 150,000 | | | | 168,718 | |
| EnLink Midstream Partners L.P., 5.45%, 6/1/47 | | | 50,000 | | | | 38,250 | |
| Enterprise Products Operating LLC, 4.45%, 2/15/43 | | | 100,000 | | | | 108,982 | |
| Exxon Mobil Corp., 4.114%, 3/1/46 | | | 50,000 | | | | 59,616 | |
| Helmerich & Payne Inc., 4.65%, 3/15/25 | | | 100,000 | | | | 108,637 | |
| Kinder Morgan Inc. (A), 5%, 2/15/21 | | | 50,000 | | | | 51,650 | |
| Kinder Morgan Inc., 5.55%, 6/1/45 | | | 100,000 | | | | 117,319 | |
| Marathon Petroleum Corp., 5.125%, 3/1/21 | | | 100,000 | | | | 104,096 | |
| Marathon Petroleum Corp., 3.8%, 4/1/28 | | | 100,000 | | | | 105,432 | |
| MPLX L.P., 4.8%, 2/15/29 | | | 50,000 | | | | 55,079 | |
| Occidental Petroleum Corp., 3.5%, 8/15/29 | | | 50,000 | | | | 50,663 | |
| Occidental Petroleum Corp., 4.4%, 8/15/49 | | | 50,000 | | | | 50,713 | |
| Phillips 66, 4.65%, 11/15/34 | | | 100,000 | | | | 116,219 | |
| Phillips 66 Partners L.P., 3.605%, 2/15/25 | | | 200,000 | | | | 209,262 | |
| Valero Energy Corp., 6.625%, 6/15/37 | | | 300,000 | | | | 391,468 | |
| Valero Energy Partners L.P., 4.5%, 3/15/28 | | | 100,000 | | | | 109,603 | |
| | | | | | | | 2,438,915 | |
| | | | | | | | | |
| Financials - 38.2% | | | | | | | | |
| | | | | | | | | |
| Banks - 18.4% | | | | | | | | |
| Bank of America Corp., MTN, 3.3%, 1/11/23 | | | 200,000 | | | | 207,356 | |
| Bank of America Corp., MTN, (3M USD LIBOR + 1.090%) (B), 3.093%, 10/1/25 | | | 100,000 | | | | 103,301 | |
| Citigroup Inc., 2.7%, 10/27/22 | | | 250,000 | | | | 254,150 | |
| Citigroup Inc.(3M USD LIBOR + 1.192%) (B), 4.075%, 4/23/29 | | | 150,000 | | | | 164,318 | |
| Discover Bank, 3.45%, 7/27/26 | | | 100,000 | | | | 103,778 | |
| Goldman Sachs Group Inc./The, 3.5%, 11/16/26 | | | 250,000 | | | | 260,470 | |
| Huntington National Bank/The, 3.55%, 10/6/23 | | | 250,000 | | | | 263,850 | |
| JPMorgan Chase & Co., 2.972%, 1/15/23 | | | 200,000 | | | | 203,873 | |
| JPMorgan Chase & Co., 3.125%, 1/23/25 | | | 200,000 | | | | 207,880 | |
| KeyCorp, MTN, 5.1%, 3/24/21 | | | 250,000 | | | | 260,267 | |
| Mitsubishi UFJ Financial Group Inc. (C), 3.195%, 7/18/29 | | | 200,000 | | | | 207,527 | |
| Morgan Stanley, MTN, 3.7%, 10/23/24 | | | 100,000 | | | | 106,391 | |
| Morgan Stanley, MTN, 3.875%, 1/27/26 | | | 150,000 | | | | 162,014 | |
| Morgan Stanley, FRN, (3M USD LIBOR + 1.340%) (B), 3.591%, 7/22/28 | | | 150,000 | | | | 158,296 | |
| PNC Financial Services Group Inc./The, 3.45%, 4/23/29 | | | 100,000 | | | | 107,704 | |
| | | | | | | | 2,771,175 | |
| | | | | | | | | |
| Diversified Financial Services - 9.7% | | | | | | | | |
| AerCap Ireland Capital DAC / AerCap Global | | | | | | | | |
| Aviation Trust (C), 3.875%, 1/23/28 | | | 150,000 | | | | 155,258 | |
| Affiliated Managers Group Inc., 4.25%, 2/15/24 | | | 200,000 | | | | 214,186 | |
| Air Lease Corp., 3.625%, 4/1/27 | | | 100,000 | | | | 104,317 | |
| American Express Co., 2.5%, 8/1/22 | | | 200,000 | | | | 202,516 | |
| American Express Co., 4.2%, 11/6/25 | | | 100,000 | | | | 110,541 | |
| Capital One Financial Corp., 3.3%, 10/30/24 | | | 200,000 | | | | 208,228 | |
| Cboe Global Markets Inc., 3.65%, 1/12/27 | | | 150,000 | | | | 161,225 | |
| Intercontinental Exchange Inc., 2.35%, 9/15/22 | | | 100,000 | | | | 101,041 | |
| Intercontinental Exchange Inc., 3.75%, 9/21/28 | | | 50,000 | | | | 54,918 | |
| Nasdaq Inc., 3.85%, 6/30/26 | | | 50,000 | | | | 53,763 | |
| TD Ameritrade Holding Corp., 3.3%, 4/1/27 | | | 100,000 | | | | 105,379 | |
| | | | | | | | 1,471,372 | |
| | | | | | | | | |
| Insurance - 8.7% | | | | | | | | |
| Aflac Inc., 4.75%, 1/15/49 | | | 100,000 | | | | 124,320 | |
| American International Group Inc., 3.875%, 1/15/35 | | | 100,000 | | | | 105,296 | |
| Berkshire Hathaway Finance Corp., 4.2%, 8/15/48 | | | 200,000 | | | | 235,336 | |
| Berkshire Hathaway Inc., 3.125%, 3/15/26 | | | 150,000 | | | | 159,518 | |
| Liberty Mutual Group Inc. (A), 4.25%, 6/15/23 | | | 23,000 | | | | 24,411 | |
| Liberty Mutual Group Inc. (A), 4.569%, 2/1/29 | | | 77,000 | | | | 87,013 | |
| Markel Corp., 5%, 5/20/49 | | | 50,000 | | | | 58,063 | |
| MetLife Inc., 3.6%, 4/10/24 | | | 100,000 | | | | 106,291 | |
| New York Life Global Funding (A), 1.95%, 2/11/20 | | | 200,000 | | | | 200,081 | |
| Prudential Financial Inc., MTN, 3.5%, 5/15/24 | | | 200,000 | | | | 212,668 | |
| | | | | | | | 1,312,997 | |
| | | | | | | | | |
| Real Estate - 1.4% | | | | | | | | |
| Boston Properties L.P., 3.4%, 6/21/29 | | | 100,000 | | | | 105,441 | |
| HCP Inc., 3.25%, 7/15/26 | | | 100,000 | | | | 104,442 | |
| | | | | | | | 209,883 | |
| | | | | | | | 5,765,427 | |
| | | | | | | | | |
| Health Care - 3.9% | | | | | | | | |
| Anthem Inc., 2.375%, 1/15/25 | | | 50,000 | | | | 49,969 | |
| Cigna Corp., 4.9%, 12/15/48 | | | 100,000 | | | | 116,148 | |
| CVS Health Corp., 2.625%, 8/15/24 | | | 50,000 | | | | 50,542 | |
| CVS Health Corp., 5.125%, 7/20/45 | | | 100,000 | | | | 115,266 | |
| UnitedHealth Group Inc., 3.7%, 8/15/49 | | | 50,000 | | | | 52,627 | |
| Zoetis Inc., 3%, 9/12/27 | | | 200,000 | | | | 206,240 | |
| | | | | | | | 590,792 | |
| | | | | | | | | |
| Industrials - 8.4% | | | | | | | | |
| Bristol-Myers Squibb Co. (A), 3.4%, 7/26/29 | | | 100,000 | | | | 107,559 | |
| Burlington Northern Santa Fe LLC, 4.45%, 3/15/43 | | | 100,000 | | | | 117,825 | |
| CRH America Inc. (A), 3.875%, 5/18/25 | | | 200,000 | | | | 213,578 | |
| DAE Funding LLC (A), 5.25%, 11/15/21 | | | 50,000 | | | | 51,875 | |
| General Dynamics Corp., 1.875%, 8/15/23 | | | 100,000 | | | | 100,043 | |
| Lockheed Martin Corp., 2.9%, 3/1/25 | | | 200,000 | | | | 209,019 | |
| Owens Corning, 3.95%, 8/15/29 | | | 50,000 | | | | 51,411 | |
| Textron Inc., 3.875%, 3/1/25 | | | 200,000 | | | | 212,422 | |
| WRKCo Inc., 3.75%, 3/15/25 | | | 100,000 | | | | 105,266 | |
| WRKCo Inc., 3.9%, 6/1/28 | | | 100,000 | | | | 107,188 | |
| | | | | | | | 1,276,186 | |
| | | | | | | | | |
| Information Technology - 6.0% | | | | | | | | |
| Citrix Systems Inc., 4.5%, 12/1/27 | | | 35,000 | | | | 38,288 | |
| Dell International LLC / EMC Corp. (A), 8.35%, 7/15/46 | | | 75,000 | | | | 99,868 | |
| Fidelity National Information Services Inc., 4.75%, 5/15/48 | | | 100,000 | | | | 119,725 | |
| Fiserv Inc., 3.8%, 10/1/23 | | | 50,000 | | | | 52,993 | |
| Fiserv Inc., 3.5%, 7/1/29 | | | 100,000 | | | | 105,782 | |
| Intel Corp., 3.734%, 12/8/47 | | | 50,000 | | | | 56,318 | |
| Microsoft Corp., 3.5%, 2/12/35 | | | 100,000 | | | | 109,646 | |
| NVIDIA Corp., 2.2%, 9/16/21 | | | 100,000 | | | | 100,438 | |
| Oracle Corp., 4%, 7/15/46 | | | 50,000 | | | | 55,612 | |
| PayPal Holdings Inc., 2.4%, 10/1/24 | | | 50,000 | | | | 50,338 | |
| Salesforce.com Inc., 3.7%, 4/11/28 | | | 100,000 | | | | 110,410 | |
| | | | | | | | 899,418 | |
| | | | | | | | | |
| Materials - 5.4% | | | | | | | | |
| Arconic Inc., 5.125%, 10/1/24 | | | 50,000 | | | | 53,625 | |
| Dow Chemical Co./The, 4.125%, 11/15/21 | | | 200,000 | | | | 207,263 | |
| Dow Chemical Co./The (A), 4.8%, 5/15/49 | | | 50,000 | | | | 55,608 | |
| DuPont de Nemours Inc., 4.725%, 11/15/28 | | | 100,000 | | | | 114,024 | |
| Nutrien Ltd. (C), 3.375%, 3/15/25 | | | 200,000 | | | | 208,311 | |
| Packaging Corp. of America, 3.65%, 9/15/24 | | | 175,000 | | | | 184,024 | |
| | | | | | | | 822,855 | |
| | | | | | | | | |
| Real Estate - 0.7% | | | | | | | | |
| Boston Properties L.P., 3.65%, 2/1/26 | | | 100,000 | | | | 106,538 | |
| | | | | | | | | |
| Utilities - 1.0% | | | | | | | | |
| Duke Energy Corp., 3.75%, 9/1/46 | | | 100,000 | | | | 103,509 | |
| Interstate Power & Light Co., 3.5%, 9/30/49 | | | 50,000 | | | | 50,715 | |
| | | | | | | | 154,224 | |
| Total Corporate Notes and Bonds | | | | | | | | |
| (Cost $13,474,507) | | | | | | | 14,517,007 | |
See accompanying Notes to Financial Statements.
26
Madison Funds | October 31, 2019
| |
| Madison Corporate Bond Fund Portfolio of Investments- continued |
| | | Shares | | | Value (Note 2) | |
| SHORT-TERM INVESTMENTS - 3.3% | | | | | | | | |
| State Street Institutional U.S. Government Money Market Fund, 1.75%, Premier Class (D) | | | 496,036 | | | $ | 496,036 | |
| Total Short-Term Investments | | | | | | | | |
| (Cost $496,036) | | | | | | | 496,036 | |
| TOTAL INVESTMENTS - 99.4% (Cost $13,970,543**) | | | | | | | 15,013,043 | |
| NET OTHER ASSETS AND LIABILITIES - 0.6% | | | | | | | 85,034 | |
| TOTAL NET ASSETS - 100.0% | | | | | | $ | 15,098,077 | |
| ** | | Aggregate cost for Federal tax purposes was $13,970,543. |
| (A) | | Security sold within terms of a private placement memorandum exempt from registration under section 144A of the Securities Act of 1933, as amended, and may be sold only to dealers in that program or other “qualified institutional buyers.” |
| (B) | | Floating rate or variable rate note. Rate shown is as of October 31, 2019. |
| (C) | | Notes and bonds, issued by foreign entities, denominated in U.S. dollars. The aggregate of these securities is 3.8% of total net assets. |
| (D) | | 7-day yield. |
| DAC | | Designated Activity Company. |
| LIBOR | | London Interbank Offered Rate. |
| MTN | | Medium Term Note. |
| |
| Madison High Income Fund Portfolio of Investments |
| | | Par Value | | | Value (Note 2) | |
| CORPORATE NOTES AND BONDS - 85.5% | | | | | | | | |
| | | | | | | | | |
| Communication Services - 6.2% | | | | | | | | |
| Altice Luxembourg S.A. (A) (B), 7.625%, 2/15/25 | | $ | 200,000 | | | $ | 206,250 | |
| Frontier Communications Corp. (A), 8.5%, 4/1/26 | | | 150,000 | | | | 150,375 | |
| GrubHub Holdings Inc. (A), 5.5%, 7/1/27 | | | 125,000 | | | | 117,188 | |
| Inmarsat Finance PLC (A) (B) (C), 6.5%, 10/1/24 | | | 300,000 | | | | 315,450 | |
| Nexstar Broadcasting Inc. (A), 5.625%, 8/1/24 | | | 125,000 | | | | 130,422 | |
| Sprint Spectrum Co. LLC / Sprint Spectrum Co. II LLC / Sprint Spectrum Co. III LLC (A), 3.36%, 3/20/23 | | | 125,000 | | | | 125,781 | |
| Telesat Canada / Telesat LLC (A) (B), 6.5%, 10/15/27 | | | 100,000 | | | | 104,405 | |
| | | | | | | | 1,149,871 | |
| | | | | | | | | |
| Consumer Discretionary - 17.9% | | | | | | | | |
| Cablevision Systems Corp., 5.875%, 9/15/22 | | | 250,000 | | | | 269,687 | |
| CCO Holdings LLC / CCO Holdings Capital Corp. (A), 5.875%, 4/1/24 | | | 300,000 | | | | 312,750 | |
| Diamond Resorts International Inc. (A) (C), 7.75%, 9/1/23 | | | 250,000 | | | | 258,697 | |
| DISH DBS Corp., 6.75%, 6/1/21 | | | 250,000 | | | | 262,500 | |
| IRB Holding Corp. (A), 6.75%, 2/15/26 | | | 250,000 | | | | 254,375 | |
| Jack Ohio Finance LLC / Jack Ohio Finance 1 Corp. (A), 6.75%, 11/15/21 | | | 250,000 | | | | 255,313 | |
| Outfront Media Capital LLC / Outfront Media Capital Corp., 5.625%, 2/15/24 | | | 500,000 | | | | 513,125 | |
| Panther BF Aggregator 2 L.P. / Panther Finance Co. Inc. (A), 6.25%, 5/15/26 | | | 125,000 | | | | 132,150 | |
| Penske Automotive Group Inc., 5.75%, 10/1/22 | | | 250,000 | | | | 253,125 | |
| Scientific Games International Inc. (A), 5%, 10/15/25 | | | 250,000 | | | | 257,500 | |
| Sirius XM Radio Inc. (A), 4.625%, 5/15/23 | | | 250,000 | | | | 254,500 | |
| Univision Communications Inc. (A), 5.125%, 5/15/23 | | | 325,000 | | | | 325,000 | |
| | | | | | | | 3,348,722 | |
| | | | | | | | | |
| Consumer Staples - 8.6% | | | | | | | | |
| ACCO Brands Corp. (A), 5.25%, 12/15/24 | | | 250,000 | | | | 259,375 | |
| Avon International Operations Inc. (A), 7.875%, 8/15/22 | | | 250,000 | | | | 260,313 | |
| Dean Foods Co. (A), 6.5%, 3/15/23 | | | 195,000 | | | | 91,650 | |
| Pilgrim’s Pride Corp. (A), 5.75%, 3/15/25 | | | 350,000 | | | | 363,125 | |
| Post Holdings Inc. (A), 5.5%, 3/1/25 | | | 250,000 | | | | 261,900 | |
| Simmons Foods Inc. (A), 5.75%, 11/1/24 | | | 375,000 | | | | 367,031 | |
| | | | | | | | 1,603,394 | |
| | | | | | | | | |
| Energy - 14.7% | | | | | | | | |
| American Midstream Partners L.P. / American Midstream Finance Corp. (A), 9.5%, 12/15/21 | | | 375,000 | | | | 348,750 | |
| Berry Petroleum Co. LLC (A), 7%, 2/15/26 | | | 125,000 | | | | 116,250 | |
| Carrizo Oil & Gas Inc. (C), 6.25%, 4/15/23 | | | 375,000 | | | | 348,750 | |
| Indigo Natural Resources LLC (A), 6.875%, 2/15/26 | | | 250,000 | | | | 227,500 | |
| Jonah Energy LLC / Jonah Energy Finance Corp. (A), 7.25%, 10/15/25 | | | 125,000 | | | | 35,000 | |
| Murphy Oil USA Inc., 5.625%, 5/1/27 | | | 400,000 | | | | 429,287 | |
| QEP Resources Inc., 5.375%, 10/1/22 | | | 300,000 | | | | 294,024 | |
| Southern Star Central Corp. (A), 5.125%, 7/15/22 | | | 300,000 | | | | 303,693 | |
| Sunoco L.P. / Sunoco Finance Corp., 4.875%, 1/15/23 | | | 250,000 | | | | 256,562 | |
| Unit Corp., 6.625%, 5/15/21 | | | 600,000 | | | | 396,000 | |
| | | | | | | | 2,755,816 | |
| | | | | | | | | |
| Financials - 9.8% | | | | | | | | |
| Donnelley Financial Solutions Inc., 8.25%, 10/15/24 | | | 250,000 | | | | 260,000 | |
| Equinix Inc., 5.875%, 1/15/26 | | | 250,000 | | | | 265,550 | |
| Exela Intermediate LLC / Exela Finance Inc. (A), 10%, 7/15/23 | | | 150,000 | | | | 71,625 | |
| Jefferies Finance LLC / JFIN Co-Issuer Corp. (A), 7.25%, 8/15/24 | | | 250,000 | | | | 251,875 | |
| MPT Operating Partnership L.P. / MPT Finance Corp., 5%, 10/15/27 | | | 250,000 | | | | 263,125 | |
| Nationstar Mortgage LLC / Nationstar Capital Corp., 6.5%, 7/1/21 | | | 249,000 | | | | 249,934 | |
| Quicken Loans Inc. (A), 5.75%, 5/1/25 | | | 250,000 | | | | 257,370 | |
| Solera LLC / Solera Finance Inc. (A), 10.5%, 3/1/24 | | | 200,000 | | | | 209,250 | |
| | | | | | | | 1,828,729 | |
| | | | | | | | | |
| Health Care - 4.6% | | | | | | | | |
| Acadia Healthcare Co. Inc., 5.125%, 7/1/22 | | | 250,000 | | | | 252,187 | |
| Avantor Inc. (A), 6%, 10/1/24 | | | 300,000 | | | | 320,664 | |
| HCA Inc., 5.875%, 2/15/26 | | | 250,000 | | | | 281,250 | |
| | | | | | | | 854,101 | |
| | | | | | | | | |
| Industrials - 16.5% | | | | | | | | |
| ADT Security Corp./The, 3.5%, 7/15/22 | | | 150,000 | | | | 150,348 | |
| ARD Finance S.A., 7.125% Cash, 7.875 PIK (B), 7.125%, 9/15/23 | | | 300,000 | | | | 311,625 | |
| Avis Budget Car Rental LLC / Avis Budget Finance Inc. (A) (C), 5.25%, 3/15/25 | | | 250,000 | | | | 255,000 | |
| DAE Funding LLC (A), 5%, 8/1/24 | | | 250,000 | | | | 260,950 | |
| DAE Funding LLC (A), 5.25%, 11/15/21 | | | 150,000 | | | | 155,625 | |
| GFL Environmental Inc. (A) (B), 5.375%, 3/1/23 | | | 250,000 | | | | 257,187 | |
| Hughes Satellite Systems Corp., 5.25%, 8/1/26 | | | 200,000 | | | | 214,250 | |
| Mueller Industries Inc., 6%, 3/1/27 | | | 250,000 | | | | 253,750 | |
| Nielsen Finance LLC / Nielsen Finance Co. (A), 5%, 4/15/22 | | | 340,000 | | | | 341,707 | |
| Patrick Industries Inc. (A), 7.5%, 10/15/27 | | | 125,000 | | | | 129,688 | |
| Prime Security Services Borrower LLC / Prime Finance Inc. (A), 9.25%, 5/15/23 | | | 36,000 | | | | 37,872 | |
| Tennant Co., 5.625%, 5/1/25 | | | 250,000 | | | | 259,375 | |
| TransDigm Inc., 6%, 7/15/22 | | | 250,000 | | | | 254,250 | |
| Waste Pro USA Inc. (A), 5.5%, 2/15/26 | | | 200,000 | | | | 206,500 | |
| | | | | | | | 3,088,127 | |
| | | | | | | | | |
| Materials - 2.6% | | | | | | | | |
| Berry Global Inc., 5.125%, 7/15/23 | | | 250,000 | | | | 256,250 | |
| Cornerstone Chemical Co. (A), 6.75%, 8/15/24 | | | 250,000 | | | | 230,000 | |
| | | | | | | | 486,250 | |
| | | | | | | | | |
| Real Estate - 1.6% | | | | | | | | |
| Iron Mountain Inc., 5.75%, 8/15/24 | | | 300,000 | | | | 302,625 | |
| | | | | | | | | |
| Utilities - 3.0% | | | | | | | | |
| AmeriGas Partners L.P. / AmeriGas Finance Corp., 5.5%, 5/20/25 | | | 250,000 | | | | 268,150 | |
| Calpine Corp., 5.5%, 2/1/24 | | | 300,000 | | | | 300,750 | |
| | | | | | | | 568,900 | |
| Total Corporate Notes and Bonds | | | | | | | | |
| (Cost $16,100,845) | | | | | | | 15,986,535 | |
| | | | | | | | | |
| | | Shares | | | | | |
| EXCHANGE TRADED FUNDS - 2.5% | | | | | | | | |
| iShares iBoxx High Yield Corporate Bond ETF | | | 5,400 | | | | 468,774 | |
| Total Exchange Traded Funds | | | | | | | | |
| (Cost $465,512) | | | | | | | 468,774 | |
| | | | | | | | | |
| | | Par Value | | | | | |
| U.S. GOVERNMENT AND AGENCY OBLIGATIONS - 5.0% | | | | | | | | |
| U.S. Treasury Bill - 5.0% | | | | | | | | |
| 1.764%, 11/5/19 | | $ | 939,000 | | | | 938,816 | |
| Total U.S. Government and Agency Obligations (Cost $938,816) | | | | | | | 938,816 | |
See accompanying Notes to Financial Statements.
27
Madison Funds | October 31, 2019
| |
| Madison High Income Fund Portfolio of Investments- continued |
| | | Shares | | | Value (Note 2) | |
| SHORT-TERM INVESTMENTS - 11.1% | | | | | | | | |
| State Street Institutional U.S. Government Money Market Fund, 1.75%, Premier Class (D) | | | 1,079,358 | | | $ | 1,079,358 | |
| State Street Navigator Securities Lending Government Money Market Portfolio, 1.75% (D) (E) | | | 982,778 | | | | 982,778 | |
| Total Short-Term Investments | | | | | | | | |
| (Cost $2,062,136) | | | | | | | 2,062,136 | |
| TOTAL INVESTMENTS - 104.1% (Cost $19,567,309**) | | | | | | | 19,456,261 | |
| NET OTHER ASSETS AND LIABILITIES - (4.1%) | | | | | | | (764,186 | ) |
| TOTAL NET ASSETS - 100.0% | | | | | | $ | 18,692,075 | |
| ** | | Aggregate cost for Federal tax purposes was $19,567,309. |
| (A) | | Security sold within terms of a private placement memorandum exempt from registration under section 144A of the Securities Act of 1933, as amended, and may be sold only to dealers in that program or other “qualified institutional buyers.” |
| (B) | | Notes and bonds, issued by foreign entities, denominated in U.S. dollars. The aggregate of these securities is 6.4% of total net assets. |
| (C) | | All or a portion of these securities, with an aggregate fair value of $956,101, are on loan as part of a securities lending program. See footnote (E) and Note 9 for details on the securities lending program. |
| (D) | | 7-day yield. |
| (E) | | Represents investments of cash collateral received in connection with securities lending. |
| ETF | | Exchange Traded Fund. |
| PIK | | Payment in Kind. |
| PLC | | Public Limited Company. |
| |
| Madison Diversified Income Fund Portfolio of Investments |
| | | Shares | | | Value (Note 2) | |
| COMMON STOCKS - 67.8% | | | | | | | | |
| | | | | | | | | |
| Communication Services - 5.3% | | | | | | | | |
| Comcast Corp., Class A | | | 101,000 | | | $ | 4,526,820 | |
| Verizon Communications Inc. | | | 69,000 | | | | 4,172,430 | |
| | | | | | | | 8,699,250 | |
| | | | | | | | | |
| Consumer Discretionary - 6.0% | | | | | | | | |
| Home Depot Inc./The | | | 11,000 | | | | 2,580,380 | |
| McDonald’s Corp. | | | 17,000 | | | | 3,343,900 | |
| Starbucks Corp. | | | 19,500 | | | | 1,648,920 | |
| TJX Cos. Inc./The | | | 39,500 | | | | 2,277,175 | |
| | | | | | | | 9,850,375 | |
| | | | | | | | | |
| Consumer Staples - 5.5% | | | | | | | | |
| Hershey Co./The | | | 9,000 | | | | 1,321,830 | |
| Nestle S.A., ADR | | | 22,000 | | | | 2,357,520 | |
| PepsiCo Inc. | | | 20,000 | | | | 2,743,400 | |
| Procter & Gamble Co./The | | | 22,000 | | | | 2,739,220 | |
| | | | | | | | 9,161,970 | |
| | | | | | | | | |
| Energy - 3.7% | | | | | | | | |
| Chevron Corp. | | | 24,500 | | | | 2,845,430 | |
| Exxon Mobil Corp. | | | 48,000 | | | | 3,243,360 | |
| | | | | | | | 6,088,790 | |
| | | | | | | | | |
| Financials - 13.2% | | | | | | | | |
| Bank of America Corp. | | | 96,500 | | | | 3,017,555 | |
| BlackRock Inc. | | | 7,000 | | | | 3,231,900 | |
| Chubb Ltd. | | | 16,000 | | | | 2,438,720 | |
| JPMorgan Chase & Co. | | | 34,000 | | | | 4,247,280 | |
| Northern Trust Corp. | | | 23,500 | | | | 2,342,480 | |
| Travelers Cos. Inc./The | | | 21,000 | | | | 2,752,260 | |
| US Bancorp | | | 67,000 | | | | 3,820,340 | |
| | | | | | | | 21,850,535 | |
| | | | | | | | | |
| Health Care - 10.3% | | | | | | | | |
| Amgen Inc. | | | 5,900 | | | | 1,258,175 | |
| Bristol-Myers Squibb Co. | | | 36,000 | | | | 2,065,320 | |
| Johnson & Johnson | | | 20,700 | | | | 2,733,228 | |
| Medtronic PLC | | | 31,500 | | | | 3,430,350 | |
| Merck & Co. Inc. | | | 36,500 | | | | 3,163,090 | |
| Novartis AG, ADR | | | 26,000 | | | | 2,273,440 | |
| Pfizer Inc. | | | 54,000 | | | | 2,071,980 | |
| | | | | | | | 16,995,583 | |
| | | | | | | | | |
| Industrials - 9.1% | | | | | | | | |
| Caterpillar Inc. | | | 23,000 | | | | 3,169,400 | |
| Emerson Electric Co. | | | 29,500 | | | | 2,069,425 | |
| Fastenal Co. | | | 90,000 | | | | 3,234,600 | |
| General Dynamics Corp. | | | 12,500 | | | | 2,210,000 | |
| Union Pacific Corp. | | | 11,500 | | | | 1,902,790 | |
| United Technologies Corp. | | | 17,500 | | | | 2,512,650 | |
| | | | | | | | 15,098,865 | |
| | | | | | | | | |
| Information Technology - 9.9% | | | | | | | | |
| Accenture PLC, Class A | | | 8,500 | | | | 1,576,070 | |
| Analog Devices Inc. | | | 23,500 | | | | 2,505,805 | |
| Automatic Data Processing Inc. | | | 9,000 | | | | 1,460,070 | |
| Cisco Systems Inc. | | | 66,500 | | | | 3,159,415 | |
| Microsoft Corp. | | | 9,500 | | | | 1,362,015 | |
| Paychex Inc. | | | 19,000 | | | | 1,589,160 | |
| TE Connectivity Ltd. | | | 13,500 | | | | 1,208,250 | |
| Texas Instruments Inc. | | | 30,000 | | | | 3,539,700 | |
| | | | | | | | 16,400,485 | |
| | | | | | | | | |
| Materials - 2.0% | | | | | | | | |
| Linde PLC | | | 16,500 | | | | 3,272,775 | |
| | | | | | | | | |
| Utilities - 2.8% | | | | | | | | |
| Dominion Energy Inc. | | | 22,000 | | | | 1,816,100 | |
| NextEra Energy Inc. | | | 12,000 | | | | 2,860,080 | |
| | | | | | | | 4,676,180 | |
| Total Common Stocks | | | | | | | | |
| (Cost $80,861,786) | | | | | | | 112,094,808 | |
| | | | | | | | | |
| | | Par Value | | | | | |
| ASSET BACKED SECURITIES - 1.7% | | | | | | | | |
| American Express Credit Account Master Trust, Series 2017-1, Class B, 2.1%, 9/15/22 | | $ | 250,000 | | | | 249,975 | |
| BMW Floorplan Master Owner Trust, Series 2018-1, Class A2, (1M USD LIBOR + 0.320%) (A) (B), 2.234%, 5/15/23 | | | 175,000 | | | | 175,297 | |
| Chesapeake Funding II LLC, Series 2018-3A, Class B (A), 3.62%, 1/15/31 | | | 100,000 | | | | 103,719 | |
| Chesapeake Funding II LLC, Series 2017-4A, Class A1 (A), 2.12%, 11/15/29 | | | 214,421 | | | | 214,424 | |
| Chesapeake Funding II LLC, Series 2018-1A, Class A1 (A), 3.04%, 4/15/30 | | | 344,335 | | | | 348,702 | |
| Chesapeake Funding II LLC, Series 2018-2A, Class A1 (A), 3.23%, 8/15/30 | | | 117,054 | | | | 118,735 | |
| CNH Equipment Trust, Series 2019-A, Class A4, 3.22%, 1/15/26 | | | 130,000 | | | | 135,153 | |
| Dell Equipment Finance Trust, Series 2019-2, Class A3 (A), 1.91%, 10/22/24 | | | 250,000 | | | | 249,478 | |
| Enterprise Fleet Financing LLC, Series 2019-3, Class A2 (A), 2.06%, 5/20/25 | | | 250,000 | | | | 249,960 | |
| Evergreen Credit Card Trust, Series 2019-1, Class B (A), 3.59%, 1/15/23 | | | 100,000 | | | | 101,407 | |
| Synchrony Credit Card Master Note Trust, Series 2017-1, Class B, 2.19%, 6/15/23 | | | 450,000 | | | | 449,906 | |
| Verizon Owner Trust, Series 2018-A, Class A1A, 3.23%, 4/20/23 | | | 250,000 | | | | 254,705 | |
| Wheels SPV LLC, Series 2019-1A, Class A2 (A), 2.3%, 5/22/28 | | | 100,000 | | | | 100,331 | |
| Total Asset Backed Securities | | | | | | | | |
| (Cost $2,723,313) | | | | | | | 2,751,792 | |
| | | | | | | | | |
| COLLATERALIZED MORTGAGE OBLIGATIONS - 1.4% | | | | | | | | |
| Fannie Mae REMICS, Series 2011-31, Class DB, 3.5%, 4/25/31 | | | 183,107 | | | | 192,533 | |
| Fannie Mae REMICS, Series 2011-36, Class QB, 4%, 5/25/31 | | | 232,446 | | | | 246,894 | |
| Fannie Mae REMICS, Series 2005-79, Class LT, 5.5%, 9/25/35 | | | 70,277 | | | | 79,966 | |
| Fannie Mae REMICS, Series 2011-101, Class NC, 2.5%, 4/25/40 | | | 121,326 | | | | 121,655 | |
| Fannie Mae REMICS, Series 2016-21, Class BA, 3%, 3/25/42 | | | 207,000 | | | | 211,234 | |
| Freddie Mac REMICS, Series 3187, Class Z, 5%, 7/15/36 | | | 196,926 | | | | 216,761 | |
| JPMorgan Mortgage Trust, Series 2019-2, Class A6 (A) (B) (C), 4%, 8/25/49 | | | 71,777 | | | | 71,798 | |
| JPMorgan Mortgage Trust, Series 2019-3, Class A4 (A) (B) (C), 4%, 9/25/49 | | | 224,375 | | | | 225,887 | |
| JPMorgan Mortgage Trust, Series 2019-5, Class A4 (A) (B) (C), 4%, 11/25/49 | | | 206,195 | | | | 206,996 | |
| JPMorgan Mortgage Trust, Series 2019-7, Class A3 (A) (B) (C), 3.5%, 2/25/50 | | | 238,201 | | | | 241,671 | |
| OBX Trust, Series 2019-INV1, Class A8 (A) (B) (C), 4%, 11/25/48 | | | 136,374 | | | | 137,284 | |
| Onslow Bay Mortgage Loan Trust, Series 2015-1, Class 2A4 (A) (B) (C), 3%, 11/25/45 | | | 265,766 | | | | 267,143 | |
| PSMC Trust, Series 2019-2, Class A1 (A) (B) (C), 3.5%, 10/25/49 | | | 100,000 | | | | 101,859 | |
| Total Collateralized Mortgage Obligations (Cost $2,331,429) | | | | | | | 2,321,681 | |
| | | | | | | | | |
| COMMERCIAL MORTGAGE-BACKED SECURITIES - 1.3% | | | | | | | | |
| Fannie Mae-Aces, Series 2013-M12, Class APT (B) (C), 2.406%, 3/25/23 | | | 292,332 | | | | 297,069 | |
| Fannie Mae-Aces, Series 2017-M15, Class A1, VRN (B) (C), 2.959%, 9/25/27 | | | 405,586 | | | | 424,988 | |
| Fannie Mae-Aces, Series 2017-M15, Class ATS2 (B) (C), 3.136%, 11/25/27 | | | 250,000 | | | | 263,230 | |
| FHLMC Multifamily Structured Pass Through Certificates, Series KJ17, Class A2, 2.982%, 11/25/25 | | | 250,000 | | | | 262,350 | |
| FHLMC Multifamily Structured Pass Through Certificates, Series K066, Class A2, 3.117%, 6/25/27 | | | 600,000 | | | | 641,163 | |
| FREMF Mortgage Trust, Series 2015-K721, Class B (A) (B) (C), 3.565%, 11/25/47 | | | 200,000 | | | | 205,924 | |
| Total Commercial Mortgage-Backed Securities (Cost $2,005,953) | | | | | | | 2,094,724 | |
See accompanying Notes to Financial Statements.
28
Madison Funds | October 31, 2019
| |
| Madison Diversified Income Fund Portfolio of Investments- continued |
| | | Par Value | | | Value (Note 2) | |
| CORPORATE NOTES AND BONDS - 9.5% | | | | | | | | |
| | | | | | | | | |
| Communication Services - 0.6% | | | | | | | | |
| AT&T Inc., 4.75%, 5/15/46 | | $ | 200,000 | | | $ | 222,048 | |
| Comcast Corp., 4.15%, 10/15/28 | | | 275,000 | | | | 310,635 | |
| Verizon Communications Inc., 4.329%, 9/21/28 | | | 331,000 | | | | 376,924 | |
| Verizon Communications Inc., 3.875%, 2/8/29 | | | 100,000 | | | | 110,591 | |
| | | | | | | | 1,020,198 | |
| | | | | | | | | |
| Consumer Discretionary - 1.0% | | | | | | | | |
| Charter Communications Operating LLC / Charter Communications Operating Capital Corp., 4.464%, 7/23/22 | | | 200,000 | | | | 210,253 | |
| Discovery Communications LLC, 5%, 9/20/37 | | | 250,000 | | | | 271,487 | |
| DISH DBS Corp., 6.75%, 6/1/21 | | | 100,000 | | | | 105,000 | |
| ERAC USA Finance LLC (A), 6.7%, 6/1/34 | | | 45,000 | | | | 61,196 | |
| Expedia Group Inc. (A), 3.25%, 2/15/30 | | | 200,000 | | | | 200,136 | |
| Lennar Corp., 4.75%, 4/1/21 | | | 150,000 | | | | 153,570 | |
| Lowe’s Cos. Inc., 4.55%, 4/5/49 | | | 150,000 | | | | 172,130 | |
| McDonald’s Corp., MTN, 4.875%, 12/9/45 | | | 300,000 | | | | 363,210 | |
| Walgreens Boots Alliance Inc., 4.5%, 11/18/34 | | | 155,000 | | | | 166,758 | |
| | | | | | | | 1,703,740 | |
| | | | | | | | | |
| Consumer Staples - 0.3% | | | | | | | | |
| Conagra Brands Inc., 4.6%, 11/1/25 | | | 250,000 | | | | 277,411 | |
| Mars Inc. (A), 3.95%, 4/1/49 | | | 200,000 | | | | 230,379 | |
| | | | | | | | 507,790 | |
| | | | | | | | | |
| Energy - 2.1% | | | | | | | | |
| Antero Resources Corp. (D), 5.625%, 6/1/23 | | | 150,000 | | | | 105,187 | |
| BP Capital Markets America Inc., 3.119%, 5/4/26 | | | 200,000 | | | | 209,584 | |
| ConocoPhillips Co., 4.15%, 11/15/34 | | | 129,000 | | | | 144,123 | |
| Energy Transfer Operating L.P., 5.25%, 4/15/29 | | | 75,000 | | | | 84,359 | |
| Enterprise Products Operating LLC, 5.2%, 9/1/20 | | | 300,000 | | | | 308,149 | |
| Enterprise Products Operating LLC, 3.75%, 2/15/25 | | | 300,000 | | | | 319,877 | |
| Exxon Mobil Corp., 4.114%, 3/1/46 | | | 225,000 | | | | 268,270 | |
| Kinder Morgan Inc., 5.55%, 6/1/45 | | | 350,000 | | | | 410,616 | |
| MPLX L.P., 4.8%, 2/15/29 | | | 150,000 | | | | 165,237 | |
| Occidental Petroleum Corp., 3.5%, 8/15/29 | | | 100,000 | | | | 101,327 | |
| Phillips 66, 4.65%, 11/15/34 | | | 250,000 | | | | 290,548 | |
| Schlumberger Holdings Corp. (A), 4%, 12/21/25 | | | 20,000 | | | | 21,381 | |
| Schlumberger Holdings Corp. (A), 3.9%, 5/17/28 | | | 292,000 | | | | 308,521 | |
| Unit Corp., 6.625%, 5/15/21 | | | 135,000 | | | | 89,100 | |
| Valero Energy Corp., 6.625%, 6/15/37 | | | 250,000 | | | | 326,223 | |
| Valero Energy Partners L.P., 4.5%, 3/15/28 | | | 300,000 | | | | 328,809 | |
| | | | | | | | 3,481,311 | |
| | | | | | | | | |
| Financials - 3.0% | | | | | | | | |
| Air Lease Corp., 3.625%, 4/1/27 | | | 200,000 | | | | 208,634 | |
| American Express Co., 2.5%, 8/1/22 | | | 150,000 | | | | 151,887 | |
| American Express Co., 4.2%, 11/6/25 | | | 250,000 | | | | 276,353 | |
| Bank of America Corp., MTN, (3M USD LIBOR + 0.930%) (B), 2.816%, 7/21/23 | | | 250,000 | | | | 253,905 | |
| Bank of America Corp., MTN, (3M USD LIBOR + 1.090%) (B), 3.093%, 10/1/25 | | | 400,000 | | | | 413,203 | |
| Bank of Montreal (E), 3.3%, 2/5/24 | | | 110,000 | | | | 114,792 | |
| BB&T Corp., MTN, 2.85%, 10/26/24 | | | 200,000 | | | | 206,566 | |
| Capital One Financial Corp., 3.3%, 10/30/24 | | | 200,000 | | | | 208,228 | |
| Cboe Global Markets Inc., 3.65%, 1/12/27 | | | 130,000 | | | | 139,728 | |
| Goldman Sachs Group Inc./The, (3M USD LIBOR + 1.201%) (B), 3.272%, 9/29/25 | | | 350,000 | | | | 361,877 | |
| HCP Inc., 3.25%, 7/15/26 | | | 100,000 | | | | 104,442 | |
| JPMorgan Chase & Co., 2.972%, 1/15/23 | | | 300,000 | | | | 305,809 | |
| JPMorgan Chase & Co., 2.95%, 10/1/26 | | | 350,000 | | | | 361,248 | |
| Mitsubishi UFJ Financial Group Inc. (E), 3.195%, 7/18/29 | | | 200,000 | | | | 207,527 | |
| Morgan Stanley, MTN, 3.875%, 1/27/26 | | | 100,000 | | | | 108,009 | |
| Morgan Stanley, 4.3%, 1/27/45 | | | 250,000 | | | | 290,700 | |
| PNC Financial Services Group Inc./The, 3.45%, 4/23/29 | | | 300,000 | | | | 323,113 | |
| Regions Financial Corp., 3.2%, 2/8/21 | | | 250,000 | | | | 253,458 | |
| Regions Financial Corp., 2.75%, 8/14/22 | | | 250,000 | | | | 254,657 | |
| Synchrony Financial, 3.7%, 8/4/26 | | | 150,000 | | | | 154,658 | |
| ZB NA, 3.5%, 8/27/21 | | | 250,000 | | | | 256,094 | |
| | | | | | | | 4,954,888 | |
| | | | | | | | | |
| Health Care - 0.8% | | | | | | | | |
| AbbVie Inc., 3.75%, 11/14/23 | | | 150,000 | | | | 158,155 | |
| Anthem Inc., 2.375%, 1/15/25 | | | 50,000 | | | | 49,969 | |
| Cigna Corp., 4.375%, 10/15/28 | | | 50,000 | | | | 54,913 | |
| CVS Health Corp., 5.125%, 7/20/45 | | | 250,000 | | | | 288,165 | |
| Humana Inc., 2.5%, 12/15/20 | | | 300,000 | | | | 301,285 | |
| UnitedHealth Group Inc., 3.7%, 8/15/49 | | | 50,000 | | | | 52,626 | |
| Zoetis Inc., 3%, 9/12/27 | | | 350,000 | | | | 360,921 | |
| | | | | | | | 1,266,034 | |
| | | | | | | | | |
| Industrials - 0.6% | | | | | | | | |
| Bristol-Myers Squibb Co. (A), 3.4%, 7/26/29 | | | 300,000 | | | | 322,676 | |
| DAE Funding LLC (A), 5.25%, 11/15/21 | | | 100,000 | | | | 103,750 | |
| Masco Corp., 4.375%, 4/1/26 | | | 25,000 | | | | 27,133 | |
| United Rentals North America Inc., 4.625%, 7/15/23 | | | 200,000 | | | | 204,300 | |
| WRKCo Inc., 3.9%, 6/1/28 | | | 250,000 | | | | 267,971 | |
| | | | | | | | 925,830 | |
| | | | | | | | | |
| Information Technology - 0.8% | | | | | | | | |
| Broadridge Financial Solutions Inc., 3.95%, 9/1/20 | | | 300,000 | | | | 304,915 | |
| Citrix Systems Inc., 4.5%, 12/1/27 | | | 55,000 | | | | 60,166 | |
| Dell International LLC / EMC Corp. (A), 8.35%, 7/15/46 | | | 75,000 | | | | 99,868 | |
| Intel Corp., 3.734%, 12/8/47 | | | 272,000 | | | | 306,371 | |
| Oracle Corp., 4%, 7/15/46 | | | 325,000 | | | | 361,482 | |
| PayPal Holdings Inc., 2.4%, 10/1/24 | | | 200,000 | | | | 201,351 | |
| | | | | | | | 1,334,153 | |
| | | | | | | | | |
| Materials - 0.1% | | | | | | | | |
| DuPont de Nemours Inc., 4.725%, 11/15/28 | | | 180,000 | | | | 205,243 | |
| | | | | | | | | |
| Real Estate - 0.1% | | | | | | | | |
| Store Capital Corp., 4.5%, 3/15/28 | | | 100,000 | | | | 109,774 | |
| | | | | | | | | |
| Utilities - 0.1% | | | | | | | | |
| Interstate Power & Light Co., 3.5%, 9/30/49 | | | 100,000 | | | | 101,431 | |
| PacifiCorp., 4.15%, 2/15/50 | | | 100,000 | | | | 118,497 | |
| | | | | | | | 219,928 | |
| Total Corporate Notes and Bonds | | | | | | | | |
| (Cost $14,646,233) | | | | | | | 15,728,889 | |
| | | | | | | | | |
| LONG TERM MUNICIPAL BONDS - 0.8% | | | | | | | | |
| Metropolitan Transportation Authority Revenue, 6.548%, 11/15/31 | | | 325,000 | | | | 424,720 | |
| New York City Transitional Finance Authority Future Tax Secured Revenue, 6.267%, 8/1/39 | | | 500,000 | | | | 501,605 | |
| Rancho Water District Financing Authority Revenue, (Prerefunded 8/1/20 @ $100), 6.337%, 8/1/40 | | | 5,000 | | | | 5,173 | |
| Rancho Water District Financing Authority Revenue, 6.337%, 8/1/40 | | | 225,000 | | | | 232,762 | |
| University of Massachusetts Building Authority Revenue, 6.573%, 5/1/39 | | | 35,000 | | | | 35,115 | |
| Washington County School District #1 West Union, General Obligation, 4.355%, 6/30/34 | | | 200,000 | | | | 220,128 | |
| Total Long Term Municipal Bonds | | | | | | | | |
| (Cost $1,388,052) | | | | | | | 1,419,503 | |
| | | | | | | | | |
| MORTGAGE BACKED SECURITIES - 6.9% | | | | | | | | |
| | | | | | | | | |
| Fannie Mae - 4.3% | | | | | | | | |
| 3%, 9/1/30 Pool # 890696 | | | 159,133 | | | | 163,731 | |
| 3%, 12/1/30 Pool # AL8924 | | | 259,968 | | | | 267,702 | |
| 7%, 11/1/31 Pool # 607515 | | | 6,501 | | | | 7,336 | |
| 3.5%, 12/1/31 Pool # MA0919 | | | 422,193 | | | | 439,613 | |
| 7%, 5/1/32 Pool # 644591 | | | 813 | | | | 838 | |
| 3.5%, 8/1/32 Pool # MA3098 | | | 166,725 | | | | 173,256 | |
| 3.5%, 9/1/32 Pool # MA3126 | | | 137,766 | | | | 143,173 | |
| 5.5%, 10/1/33 Pool # 254904 | | | 39,969 | | | | 45,004 | |
| 7%, 7/1/34 Pool # 792636 | | | 4,570 | | | | 4,714 | |
| 4%, 2/1/35 Pool # MA2177 | | | 271,916 | | | | 287,855 | |
| 5%, 8/1/35 Pool # 829670 | | | 38,122 | | | | 42,031 | |
| 5%, 9/1/35 Pool # 820347 | | | 50,796 | | | | 56,653 | |
| 5%, 9/1/35 Pool # 835699 | | | 39,988 | | | | 44,355 | |
| 3%, 12/1/35 Pool # AS6267 | | | 243,271 | | | | 250,158 | |
| 5%, 12/1/35 Pool # 850561 | | | 13,310 | | | | 14,697 | |
| 4%, 6/1/36 Pool # AL8618 | | | 214,532 | | | | 227,218 | |
| 5.5%, 9/1/36 Pool # 831820 | | | 60,086 | | | | 66,050 | |
| 5.5%, 10/1/36 Pool # 901723 | | | 27,306 | | | | 30,662 | |
| 5.5%, 12/1/36 Pool # 903059 | | | 41,007 | | | | 44,625 | |
| 3%, 11/1/39 Pool # MA3831 | | | 250,000 | | | | 256,168 | |
| 4.5%, 7/1/41 Pool # AB3274 | | | 144,955 | | | | 157,165 | |
| 5.5%, 7/1/41 Pool # AL6588 | | | 129,704 | | | | 146,073 | |
| 3.5%, 6/1/42 Pool # AO4134 | | | 231,268 | | | | 242,702 | |
| 4%, 6/1/42 Pool # MA1087 | | | 163,292 | | | | 174,321 | |
| 3.5%, 8/1/42 Pool # AO8100 | | | 143,961 | | | | 151,088 | |
| 3.5%, 8/1/42 Pool # AP2133 | | | 178,238 | | | | 187,066 | |
| 4%, 10/1/42 Pool # AP7363 | | | 299,480 | | | | 319,628 | |
| 3%, 2/1/43 Pool # AB8486 | | | 278,289 | | | | 287,068 | |
| 3%, 2/1/43 Pool # AB8563 | | | 168,170 | | | | 173,476 | |
| 3%, 2/1/43 Pool # AL3072 | | | 251,728 | | | | 259,662 | |
| 3%, 3/1/43 Pool # AB8818 | | | 262,004 | | | | 270,270 | |
| 3.5%, 3/1/43 Pool # AT0310 | | | 125,076 | | | | 131,229 | |
| 4%, 1/1/45 Pool # MA2145 | | | 291,243 | | | | 308,160 | |
| 4%, 1/1/45 Pool # AS4257 | | | 99,514 | | | | 105,635 | |
| 4.5%, 2/1/45 Pool # MA2193 | | | 191,274 | | | | 205,314 | |
| 3.5%, 12/1/45 Pool # AS6309 | | | 128,031 | | | | 133,487 | |
| 3%, 1/1/47 Pool # BE0108 | | | 198,283 | | | | 204,166 | |
| 3.5%, 12/1/47 Pool # MA3210 | | | 516,896 | | | | 535,234 | |
| 4%, 7/1/48 Pool # MA3415 | | | 195,756 | | | | 203,897 | |
| 3.5%, 1/1/49 Pool # MA3574 | | | 419,598 | | | | 431,936 | |
| | | | | | | | 7,193,416 | |
See accompanying Notes to Financial Statements.
29
Madison Funds | October 31, 2019
| |
| Madison Diversified Income Fund Portfolio of Investments- continued |
| | | Par Value | | | Value (Note 2) | |
| MORTGAGE BACKED SECURITIES - continued | | | | | | | | |
| | | | | | | | | |
| Freddie Mac - 2.6% | | | | | | | | |
| 4.5%, 2/1/25 Pool # J11722 | | $ | 22,436 | | | $ | 23,570 | |
| 4.5%, 5/1/25 Pool # J12247 | | | 20,266 | | | | 21,263 | |
| 8%, 6/1/30 Pool # C01005 | | | 943 | | | | 1,104 | |
| 6.5%, 1/1/32 Pool # C62333 | | | 33,338 | | | | 37,326 | |
| 2.5%, 10/1/34 Pool # SB8010 | | | 546,020 | | | | 551,919 | |
| 4.5%, 8/1/39 Pool # G08361 | | | 227,916 | | | | 247,166 | |
| 3.5%, 11/1/40 Pool # G06168 | | | 246,762 | | | | 259,086 | |
| 4.5%, 9/1/41 Pool # Q03516 | | | 128,787 | | | | 139,717 | |
| 4%, 10/1/41 Pool # Q04092 | | | 175,980 | | | | 188,465 | |
| 3%, 8/1/42 Pool # G08502 | | | 230,407 | | | | 237,803 | |
| 3%, 9/1/42 Pool # C04233 | | | 107,029 | | | | 110,459 | |
| 3%, 4/1/43 Pool # V80025 | | | 269,390 | | | | 278,052 | |
| 3%, 4/1/43 Pool # V80026 | | | 263,784 | | | | 272,239 | |
| 3.5%, 8/1/44 Pool # Q27927 | | | 416,501 | | | | 438,086 | |
| 3%, 7/1/45 Pool # G08653 | | | 161,614 | | | | 166,297 | |
| 3.5%, 8/1/45 Pool # Q35614 | | | 305,712 | | | | 319,927 | |
| 3%, 10/1/46 Pool # G60722 | | | 240,050 | | | | 246,727 | |
| 4%, 3/1/47 Pool # Q46801 | | | 280,496 | | | | 295,004 | |
| 3.5%, 12/1/47 Pool # Q52955 | | | 432,233 | | | | 447,674 | |
| | | | | | | | 4,281,884 | |
| Ginnie Mae - 0.0% | | | | | | | | |
| 6.5%, 2/20/29 Pool # 2714 | | | 10,741 | | | | 12,304 | |
| 6.5%, 4/20/31 Pool # 3068 | | | 6,272 | | | | 7,264 | |
| | | | | | | | 19,568 | |
| Total Mortgage Backed Securities | | | | | | | | |
| (Cost $11,315,637) | | | | | | | 11,494,868 | |
| | | | | | | | | |
| U.S. GOVERNMENT AND AGENCY OBLIGATIONS - 8.7% | | | | | | | | |
| | | | | | | | | |
| U.S. Treasury Bonds - 3.1% | | | | | | | | |
| 6.625%, 2/15/27 | | | 700,000 | | | | 940,926 | |
| 3.750%, 8/15/41 | | | 550,000 | | | | 708,125 | |
| 3.000%, 5/15/42 | | | 750,000 | | | | 866,367 | |
| 2.500%, 2/15/45 | | | 500,000 | | | | 531,914 | |
| 2.500%, 5/15/46 | | | 400,000 | | | | 425,906 | |
| 2.250%, 8/15/46 | | | 450,000 | | | | 456,293 | |
| 3.000%, 5/15/47 | | | 250,000 | | | | 292,735 | |
| 3.000%, 2/15/48 | | | 250,000 | | | | 293,389 | |
| 3.375%, 11/15/48 | | | 435,000 | | | | 547,947 | |
| | | | | | | | 5,063,602 | |
| U.S. Treasury Notes - 5.6% | | | | | | | | |
| 2.625%, 11/15/20 | | | 1,500,000 | | | | 1,515,469 | |
| 3.125%, 5/15/21 | | | 1,000,000 | | | | 1,023,164 | |
| 2.000%, 11/15/21 | | | 500,000 | | | | 504,551 | |
| 2.500%, 8/15/23 | | | 750,000 | | | | 776,719 | |
| 2.125%, 3/31/24 | | | 1,280,000 | | | | 1,312,350 | |
| 2.250%, 11/15/25 | | | 1,000,000 | | | | 1,037,930 | |
| 1.500%, 8/15/26 | | | 1,150,000 | | | | 1,142,318 | |
| 2.875%, 5/15/28 | | | 900,000 | | | | 987,222 | |
| 2.625%, 2/15/29 | | | 900,000 | | | | 973,055 | |
| | | | | | | | 9,272,778 | |
| Total U.S. Government and Agency Obligations (Cost $13,333,340) | | | | | | | 14,336,380 | |
| | | Shares | | | | | |
| SHORT-TERM INVESTMENTS - 1.2% | | | | | | | | |
| State Street Institutional U.S. Government Money Market Fund, 1.75%, Premier Class (F) | | | 1,915,518 | | | | 1,915,518 | |
| State Street Navigator Securities Lending Government Money Market Portfolio, 1.75% (F) (G) | | | 113,925 | | | | 113,925 | |
| Total Short-Term Investments | | | | | | | | |
| (Cost $2,029,443) | | | | | | | 2,029,443 | |
| TOTAL INVESTMENTS - 99.3% (Cost $130,635,186**) | | | | | | | 164,272,088 | |
| NET OTHER ASSETS AND LIABILITIES - 0.7% | | | | | | | 1,112,756 | |
| TOTAL NET ASSETS - 100.0% | | | | | | $ | 165,384,844 | |
| ** | | Aggregate cost for Federal tax purposes was $130,788,587. |
| (A) | | Security sold within terms of a private placement memorandum exempt from registration under section 144A of the Securities Act of 1933, as amended, and may be sold only to dealers in that program or other “qualified institutional buyers.” |
| (B) | | Floating rate or variable rate note. Rate shown is as of October 31, 2019. |
| (C) | | Coupon rate may change based on changes of the underlying collateral or prepayments of principal. The coupon rate shown represents the rate at period end. |
| (D) | | All or a portion of these securities, with an aggregate fair value of $106,506, are on loan as part of a securities lending program. See footnote (G) and Note 9 for details on the securities lending program. |
| (E) | | Notes and bonds, issued by foreign entities, denominated in U.S. dollars. The aggregate of these securities is 0.2% of total net assets. |
| (G) | | Represents investments of cash collateral received in connection with securities lending. |
| ADR | | American Depositary Receipt. |
| LIBOR | | London Interbank Offered Rate. |
| PLC | | Public Limited Company. |
| |
| Madison Covered Call & Equity Income Fund Portfolio of Investments |
| | | Shares | | | Value (Note 2) | |
| COMMON STOCKS - 85.2% | | | | | | | | |
| | | | | | | | | |
| Communication Services - 10.4% | | | | | | | | |
| Alphabet Inc., Class C * (A) | | | 2,900 | | | $ | 3,654,319 | |
| CenturyLink Inc. (A) | | | 218,000 | | | | 2,820,920 | |
| Discovery Inc., Class C * (A) | | | 103,000 | | | | 2,599,720 | |
| T-Mobile U.S. Inc. * (A) | | | 49,000 | | | | 4,050,340 | |
| | | | | | | | 13,125,299 | |
| Consumer Discretionary - 10.3% | | | | | | | | |
| Amazon.com Inc. * (A) | | | 1,500 | | | | 2,664,990 | |
| General Motors Co. (A) | | | 75,100 | | | | 2,790,716 | |
| Lowe’s Cos. Inc. (A) | | | 32,500 | | | | 3,627,325 | |
| Nordstrom Inc. (A) | | | 52,300 | | | | 1,877,570 | |
| Whirlpool Corp. (A) | | | 13,300 | | | | 2,023,196 | |
| | | | | | | | 12,983,797 | |
| Consumer Staples - 5.7% | | | | | | | | |
| Archer-Daniels-Midland Co. (A) | | | 56,000 | | | | 2,354,240 | |
| JM Smucker Co./The (A) | | | 20,000 | | | | 2,113,600 | |
| PepsiCo Inc. (A) | | | 19,900 | | | | 2,729,683 | |
| | | | | | | | 7,197,523 | |
| Energy - 8.6% | | | | | | | | |
| Apache Corp. (A) | | | 77,700 | | | | 1,682,982 | |
| Baker Hughes Co. | | | 126,300 | | | | 2,702,820 | |
| Canadian Natural Resources Ltd. | | | 63,000 | | | | 1,588,860 | |
| EOG Resources Inc. (A) | | | 39,500 | | | | 2,737,745 | |
| Range Resources Corp. (B) | | | 202,200 | | | | 814,866 | |
| Transocean Ltd. * | | | 295,000 | | | | 1,401,250 | |
| | | | | | | | 10,928,523 | |
| Financials - 12.0% | | | | | | | | |
| Bank of America Corp. (A) | | | 82,000 | | | | 2,564,140 | |
| Berkshire Hathaway Inc., Class B * (A) | | | 18,100 | | | | 3,847,698 | |
| JPMorgan Chase & Co. (A) | | | 29,000 | | | | 3,622,680 | |
| Northern Trust Corp. (A) | | | 25,000 | | | | 2,492,000 | |
| Regions Financial Corp. (A) | | | 166,300 | | | | 2,677,430 | |
| | | | | | | | 15,203,948 | |
| Health Care - 10.4% | | | | | | | | |
| Baxter International Inc. (A) | | | 47,500 | | | | 3,643,250 | |
| CVS Health Corp. (A) | | | 48,200 | | | | 3,199,998 | |
| Gilead Sciences Inc. (A) | | | 38,500 | | | | 2,452,835 | |
| Zimmer Biomet Holdings Inc. (A) | | | 28,000 | | | | 3,870,440 | |
| | | | | | | | 13,166,523 | |
| Industrials - 5.9% | | | | | | | | |
| Fastenal Co. (A) | | | 68,100 | | | | 2,447,514 | |
| FedEx Corp. (A) | | | 8,000 | | | | 1,221,280 | |
| General Dynamics Corp. (A) | | | 21,500 | | | | 3,801,200 | |
| | | | | | | | 7,469,994 | |
| Information Technology - 10.0% | | | | | | | | |
| Accenture PLC, Class A (A) | | | 11,000 | | | | 2,039,620 | |
| Microsoft Corp. (A) | | | 26,700 | | | | 3,827,979 | |
| Texas Instruments Inc. (A) | | | 21,000 | | | | 2,477,790 | |
| Visa Inc., Class A (A) | | | 11,000 | | | | 1,967,460 | |
| Xilinx Inc. (A) | | | 25,000 | | | | 2,268,500 | |
| | | | | | | | 12,581,349 | |
| Materials - 9.8% | | | | | | | | |
| Alcoa Corp. * | | | 93,700 | | | | 1,948,023 | |
| Freeport-McMoRan Inc. | | | 290,900 | | | | 2,856,638 | |
| Newmont Goldcorp Corp. (A) | | | 136,200 | | | | 5,411,226 | |
| Steel Dynamics Inc. (A) | | | 70,000 | | | | 2,125,200 | |
| | | | | | | | 12,341,087 | |
| Utilities - 2.1% | | | | | | | | |
| AES Corp. (A) | | | 155,000 | | | | 2,642,750 | |
| | | | | | | | | |
| Total Common Stocks | | | | | | | | |
| (Cost $133,866,861) | | | | | | | 107,640,793 | |
| | | | | | | | | |
| EXCHANGE TRADED FUNDS - 5.4% | | | | | | | | |
| Invesco DB Gold Fund | | | 78,000 | | | | 3,592,680 | |
| VanEck Vectors Gold Miners ETF (A) | | | 116,600 | | | | 3,282,290 | |
| Total Exchange Traded Funds | | | | | | | | |
| (Cost $6,001,811) | | | | | | | 6,874,970 | |
| | | | | | | | | |
| SHORT-TERM INVESTMENTS - 9.4% | | | | | | | | |
| State Street Institutional U.S. Government Money Market Fund, 1.75%, Premier Class (C) | | | 11,882,135 | | | | 11,882,135 | |
| Total Short-Term Investments | | | | | | | | |
| (Cost $11,882,135) | | | | | | | 11,882,135 | |
| TOTAL INVESTMENTS - 100.0% | | | | | | | | |
| (Cost $151,750,807**) | | | | | | | 126,397,898 | |
| TOTAL CALL OPTIONS WRITTEN - (1.4%) | | | | | | | (1,732,410 | ) |
| NET OTHER ASSETS AND LIABILITIES - 1.4% | | | | | | | 1,677,294 | |
| TOTAL NET ASSETS - 100.0% | | | | | | $ | 126,342,782 | |
See accompanying Notes to Financial Statements.
30
Madison Funds | October 31, 2019
| |
| Madison Covered Call & Equity Income Fund Portfolio of Investments -continued |
| ** | | Aggregate cost for Federal tax purposes was $153,786,803. |
| (A) | | All or a portion of these securities’ positions, with a value of $99,610,626, represent covers (directly or through conversion rights) for outstanding options written. |
| (B) | | All or a portion of these securities, with an aggregate fair value of $798,569, are on loan as part of a securities lending program. See Note 9 for details on the securities lending program. |
| ETF | | Exchange Traded Fund. |
| PLC | | Public Limited Company. |
Written Option Contracts Outstanding at October 31, 2019
| | | | | | | | | | | | | | | | | | | | | |
| Description | | Exercise Price | | | Expiration Date | | Number of
Contracts | | | Notional
Amount | | | Fair Value | | | Premiums
(Received) | | | Unrealized Appreciation
(Depreciation) | |
| Call Options Written | | | | | | | | | | | | | | | | | | | | | | | | | | |
| Accenture PLC, Class A | | $ | 200.00 | | | 01/17/2020 | | | (110 | ) | | $ | (2,200,000 | ) | | $ | (17,600 | ) | | $ | (28,676 | ) | | $ | 11,076 | |
| AES Corp. | | | 17.00 | | | 11/15/2019 | | | (1,550 | ) | | | (2,635,000 | ) | | | (62,000 | ) | | | (21,639 | ) | | | (40,361 | ) |
| Alphabet Inc., Class C | | | 1,290.00 | | | 11/15/2019 | | | (6 | ) | | | (774,000 | ) | | | (2,910 | ) | | | (14,626 | ) | | | 11,716 | |
| Alphabet Inc., Class C | | | 1,300.00 | | | 12/20/2019 | | | (23 | ) | | | (2,990,000 | ) | | | (36,225 | ) | | | (64,375 | ) | | | 28,150 | |
| Amazon.com Inc. | | | 1,820.00 | | | 01/17/2020 | | | (15 | ) | | | (2,730,000 | ) | | | (77,513 | ) | | | (69,568 | ) | | | (7,945 | ) |
| Apache Corp. | | | 25.00 | | | 12/20/2019 | | | (260 | ) | | | (650,000 | ) | | | (18,850 | ) | | | (34,408 | ) | | | 15,558 | |
| Archer-Daniels-Midland Co. | | | 42.00 | | | 12/20/2019 | | | (280 | ) | | | (1,176,000 | ) | | | (30,380 | ) | | | (18,312 | ) | | | (12,068 | ) |
| Archer-Daniels-Midland Co. | | | 43.00 | | | 01/17/2020 | | | (280 | ) | | | (1,204,000 | ) | | | (27,160 | ) | | | (16,565 | ) | | | (10,595 | ) |
| Bank of America Corp. | | | 32.00 | | | 01/17/2020 | | | (410 | ) | | | (1,312,000 | ) | | | (37,310 | ) | | | (42,213 | ) | | | 4,903 | |
| Bank of America Corp. | | | 33.00 | | | 01/17/2020 | | | (410 | ) | | | (1,353,000 | ) | | | (22,345 | ) | | | (26,223 | ) | | | 3,878 | |
| Baxter International Inc. | | | 80.00 | | | 01/17/2020 | | | (235 | ) | | | (1,880,000 | ) | | | (35,133 | ) | | | (47,129 | ) | | | 11,996 | |
| Baxter International Inc. | | | 82.50 | | | 01/17/2020 | | | (240 | ) | | | (1,980,000 | ) | | | (19,800 | ) | | | (27,744 | ) | | | 7,944 | |
| Berkshire Hathaway Inc., Class B | | | 220.00 | | | 01/17/2020 | | | (181 | ) | | | (3,982,000 | ) | | | (57,468 | ) | | | (52,424 | ) | | | (5,044 | ) |
| CenturyLink Inc. | | | 14.00 | | | 01/17/2020 | | | (1,090 | ) | | | (1,526,000 | ) | | | (43,600 | ) | | | (42,728 | ) | | | (872 | ) |
| CVS Health Corp. | | | 70.00 | | | 01/17/2020 | | | (482 | ) | | | (3,374,000 | ) | | | (82,422 | ) | | | (74,415 | ) | | | (8,007 | ) |
| Discovery Inc., Class C | | | 27.50 | | | 01/17/2020 | | | (467 | ) | | | (1,284,250 | ) | | | (26,853 | ) | | | (46,332 | ) | | | 19,479 | |
| EOG Resources Inc. | | | 75.00 | | | 01/17/2020 | | | (395 | ) | | | (2,962,500 | ) | | | (92,233 | ) | | | (57,618 | ) | | | (34,615 | ) |
| Fastenal Co. | | | 33.75 | | | 11/15/2019 | | | (1 | ) | | | (3,375 | ) | | | (227 | ) | | | (79 | ) | | | (148 | ) |
| Fastenal Co. | | | 37.50 | | | 12/20/2019 | | | (226 | ) | | | (847,500 | ) | | | (15,255 | ) | | | (29,145 | ) | | | 13,890 | |
| Fastenal Co. | | | 40.00 | | | 01/17/2020 | | | (64 | ) | | | (256,000 | ) | | | (2,720 | ) | | | (5,373 | ) | | | 2,653 | |
| FedEx Corp. | | | 160.00 | | | 01/17/2020 | | | (80 | ) | | | (1,280,000 | ) | | | (37,400 | ) | | | (34,414 | ) | | | (2,986 | ) |
| General Dynamics Corp. | | | 180.00 | | | 12/20/2019 | | | (215 | ) | | | (3,870,000 | ) | | | (77,400 | ) | | | (79,704 | ) | | | 2,304 | |
| General Motors Co. | | | 38.00 | | | 12/20/2019 | | | (250 | ) | | | (950,000 | ) | | | (20,875 | ) | | | (19,820 | ) | | | (1,055 | ) |
| General Motors Co. | | | 38.00 | | | 01/17/2020 | | | (250 | ) | | | (950,000 | ) | | | (28,750 | ) | | | (23,415 | ) | | | (5,335 | ) |
| General Motors Co. | | | 40.00 | | | 01/17/2020 | | | (251 | ) | | | (1,004,000 | ) | | | (12,424 | ) | | | (21,809 | ) | | | 9,385 | |
| Gilead Sciences Inc. | | | 67.50 | | | 12/20/2019 | | | (385 | ) | | | (2,598,750 | ) | | | (22,330 | ) | | | (47,197 | ) | | | 24,867 | |
| JM Smucker Co./The | | | 110.00 | | | 12/20/2019 | | | (91 | ) | | | (1,001,000 | ) | | | (17,290 | ) | | | (24,475 | ) | | | 7,185 | |
| JM Smucker Co./The | | | 115.00 | | | 01/17/2020 | | | (109 | ) | | | (1,253,500 | ) | | | (12,262 | ) | | | (21,838 | ) | | | 9,576 | |
| JPMorgan Chase & Co. | | | 125.00 | | | 11/15/2019 | | | (170 | ) | | | (2,125,000 | ) | | | (27,455 | ) | | | (14,599 | ) | | | (12,856 | ) |
| JPMorgan Chase & Co. | | | 130.00 | | | 01/17/2020 | | | (120 | ) | | | (1,560,000 | ) | | | (22,980 | ) | | | (25,442 | ) | | | 2,462 | |
| Lowe’s Cos. Inc. | | | 115.00 | | | 11/15/2019 | | | (240 | ) | | | (2,760,000 | ) | | | (12,840 | ) | | | (52,120 | ) | | | 39,280 | |
| Lowe’s Cos. Inc. | | | 115.00 | | | 12/20/2019 | | | (85 | ) | | | (977,500 | ) | | | (24,778 | ) | | | (28,568 | ) | | | 3,790 | |
| Microsoft Corp. | | | 145.00 | | | 12/20/2019 | | | (267 | ) | | | (3,871,500 | ) | | | (80,634 | ) | | | (54,670 | ) | | | (25,964 | ) |
| Newmont Goldcorp Corp. | | | 40.00 | | | 12/20/2019 | | | (700 | ) | | | (2,800,000 | ) | | | (96,600 | ) | | | (65,946 | ) | | | (30,654 | ) |
| Newmont Goldcorp Corp. | | | 43.00 | | | 01/17/2020 | | | (662 | ) | | | (2,846,600 | ) | | | (49,650 | ) | | | (48,299 | ) | | | (1,351 | ) |
| Nordstrom Inc. | | | 40.00 | | | 01/17/2020 | | | (523 | ) | | | (2,092,000 | ) | | | (74,789 | ) | | | (54,894 | ) | | | (19,895 | ) |
| Northern Trust Corp. | | | 100.00 | | | 01/17/2020 | | | (250 | ) | | | (2,500,000 | ) | | | (90,000 | ) | | | (49,942 | ) | | | (40,058 | ) |
| PepsiCo Inc. | | | 140.00 | | | 11/15/2019 | | | (59 | ) | | | (826,000 | ) | | | (2,271 | ) | | | (10,299 | ) | | | 8,028 | |
| PepsiCo Inc. | | | 140.00 | | | 01/17/2020 | | | (140 | ) | | | (1,960,000 | ) | | | (27,510 | ) | | | (33,983 | ) | | | 6,473 | |
| Regions Financial Corp. | | | 17.00 | | | 11/15/2019 | | | (1,663 | ) | | | (2,827,100 | ) | | | (9,146 | ) | | | (45,850 | ) | | | 36,704 | |
| Steel Dynamics Inc. | | | 32.00 | | | 12/20/2019 | | | (350 | ) | | | (1,120,000 | ) | | | (29,750 | ) | | | (22,491 | ) | | | (7,259 | ) |
| Steel Dynamics Inc. | | | 33.00 | | | 01/17/2020 | | | (86 | ) | | | (283,800 | ) | | | (6,880 | ) | | | (8,940 | ) | | | 2,060 | |
| T-Mobile U.S. Inc. | | | 82.50 | | | 11/15/2019 | | | (253 | ) | | | (2,087,250 | ) | | | (37,697 | ) | | | (39,705 | ) | | | 2,008 | |
| T-Mobile U.S. Inc. | | | 85.00 | | | 12/20/2019 | | | (237 | ) | | | (2,014,500 | ) | | | (33,299 | ) | | | (42,550 | ) | | | 9,251 | |
| Texas Instruments Inc. | | | 125.00 | | | 12/20/2019 | | | (210 | ) | | | (2,625,000 | ) | | | (22,575 | ) | | | (31,796 | ) | | | 9,221 | |
| VanEck Vectors Gold Miners ETF | | | 29.00 | | | 12/20/2019 | | | (580 | ) | | | (1,682,000 | ) | | | (50,750 | ) | | | (42,897 | ) | | | (7,853 | ) |
| Visa Inc., Class A | | | 185.00 | | | 01/17/2020 | | | (110 | ) | | | (2,035,000 | ) | | | (36,850 | ) | | | (33,985 | ) | | | (2,865 | ) |
| Whirlpool Corp. | | | 165.00 | | | 11/15/2019 | | | (133 | ) | | | (2,194,500 | ) | | | (2,061 | ) | | | (55,721 | ) | | | 53,660 | |
| Xilinx Inc. | | | 100.00 | | | 12/20/2019 | | | (250 | ) | | | (2,500,000 | ) | | | (27,000 | ) | | | (71,856 | ) | | | 44,856 | |
| Zimmer Biomet Holdings Inc. | | | 145.00 | | | 11/15/2019 | | | (232 | ) | | | (3,364,000 | ) | | | (30,160 | ) | | | (81,094 | ) | | | 50,934 | |
| | | | | | | | | | | | | | | | | | | | | | | | | | | |
| Total Options Written, at Value | | | | | | | | | | | | | | | | $ | (1,732,410 | ) | | $ | (1,907,911 | ) | | $ | 175,501 | |
See accompanying Notes to Financial Statements.
31
Madison Funds | October 31, 2019
| |
| Madison Dividend Income Fund Portfolio of Investments |
| | | Shares | | | Value (Note 2) | |
| COMMON STOCKS - 97.8% | | | | | | | | |
| | | | | | | | | |
| Communication Services - 7.5% | | | | | | | | |
| Comcast Corp., Class A | | | 191,000 | | | $ | 8,560,620 | |
| Verizon Communications Inc. | | | 134,000 | | | | 8,102,980 | |
| | | | | | | | 16,663,600 | |
| Consumer Discretionary - 8.5% | | | | | | | | |
| Home Depot Inc./The | | | 21,000 | | | | 4,926,180 | |
| McDonald’s Corp. | | | 31,000 | | | | 6,097,700 | |
| Starbucks Corp. | | | 40,000 | | | | 3,382,400 | |
| TJX Cos. Inc./The | | | 76,000 | | | | 4,381,400 | |
| | | | | | | | 18,787,680 | |
| Consumer Staples - 7.8% | | | | | | | | |
| Hershey Co./The | | | 16,500 | | | | 2,423,355 | |
| Nestle S.A., ADR | | | 42,000 | | | | 4,500,720 | |
| PepsiCo Inc. | | | 38,000 | | | | 5,212,460 | |
| Procter & Gamble Co./The | | | 41,500 | | | | 5,167,165 | |
| | | | | | | | 17,303,700 | |
| Energy - 5.3% | | | | | | | | |
| Chevron Corp. | | | 46,000 | | | | 5,342,440 | |
| Exxon Mobil Corp. | | | 93,000 | | | | 6,284,010 | |
| | | | | | | | 11,626,450 | |
| Financials - 19.3% | | | | | | | | |
| Bank of America Corp. | | | 178,000 | | | | 5,566,060 | |
| BlackRock Inc. | | | 13,500 | | | | 6,232,950 | |
| Chubb Ltd. | | | 31,500 | | | | 4,801,230 | |
| JPMorgan Chase & Co. | | | 66,500 | | | | 8,307,180 | |
| Northern Trust Corp. | | | 47,000 | | | | 4,684,960 | |
| Travelers Cos. Inc./The | | | 41,000 | | | | 5,373,460 | |
| US Bancorp | | | 132,500 | | | | 7,555,150 | |
| | | | | | | | 42,520,990 | |
| Health Care - 15.1% | | | | | | | | |
| Amgen Inc. | | | 13,000 | | | | 2,772,250 | |
| Bristol-Myers Squibb Co. | | | 73,000 | | | | 4,188,010 | |
| Johnson & Johnson | | | 40,000 | | | | 5,281,600 | |
| Medtronic PLC | | | 61,500 | | | | 6,697,350 | |
| Merck & Co. Inc. | | | 69,000 | | | | 5,979,540 | |
| Novartis AG, ADR | | | 50,000 | | | | 4,372,000 | |
| Pfizer Inc. | | | 104,000 | | | | 3,990,480 | |
| | | | | | | | 33,281,230 | |
| Industrials - 13.1% | | | | | | | | |
| Caterpillar Inc. | | | 45,000 | | | | 6,201,000 | |
| Emerson Electric Co. | | | 53,500 | | | | 3,753,025 | |
| Fastenal Co. | | | 170,000 | | | | 6,109,800 | |
| General Dynamics Corp. | | | 25,000 | | | | 4,420,000 | |
| Union Pacific Corp. | | | 22,000 | | | | 3,640,120 | |
| United Technologies Corp. | | | 33,500 | | | | 4,809,930 | |
| | | | | | | | 28,933,875 | |
| Information Technology - 14.3% | | | | | | | | |
| Accenture PLC, Class A | | | 16,500 | | | | 3,059,430 | |
| Analog Devices Inc. | | | 45,000 | | | | 4,798,350 | |
| Automatic Data Processing Inc. | | | 17,000 | | | | 2,757,910 | |
| Cisco Systems Inc. | | | 122,000 | | | | 5,796,220 | |
| Microsoft Corp. | | | 19,500 | | | | 2,795,715 | |
| Paychex Inc. | | | 37,000 | | | | 3,094,680 | |
| TE Connectivity Ltd. | | | 27,000 | | | | 2,416,500 | |
| Texas Instruments Inc. | | | 58,000 | | | | 6,843,420 | |
| | | | | | | | 31,562,225 | |
| Materials - 2.8% | | | | | | | | |
| Linde PLC | | | 31,000 | | | | 6,148,850 | |
| | | | | | | | | |
| Utilities - 4.1% | | | | | | | | |
| Dominion Energy Inc. | | | 44,000 | | | | 3,632,200 | |
| NextEra Energy Inc. | | | 22,500 | | | | 5,362,650 | |
| | | | | | | | 8,994,850 | |
| Total Common Stocks | | | | | | | | |
| (Cost $185,195,406) | | | | | | | 215,823,450 | |
| | | | | | | | | |
| SHORT-TERM INVESTMENTS - 2.1% | | | | | | | | |
| State Street Institutional U.S. Government Money Market Fund, 1.75%, Premier Class (A) | | | 4,573,975 | | | | 4,573,975 | |
| Total Short-Term Investments | | | | | | | | |
| (Cost $4,573,975) | | | | | | | 4,573,975 | |
| TOTAL INVESTMENTS - 99.9% (Cost $189,769,381**) | | | | | | | 220,397,425 | |
| NET OTHER ASSETS AND LIABILITIES - 0.1% | | | | | | | 327,895 | |
| TOTAL NET ASSETS - 100.0% | | | | | | $ | 220,725,320 | |
| ** | | Aggregate cost for Federal tax purposes was $189,818,836. |
| ADR | | American Depositary Receipt. |
| PLC | | Public Limited Company. |
| |
| Madison Large Cap Value Fund Portfolio of Investments |
| | | Shares | | | Value (Note 2) | |
| COMMON STOCKS - 98.4% | | | | | | | | |
| | | | | | | | | |
| Communication Services - 5.3% | | | | | | | | |
| Verizon Communications Inc. | | | 18,000 | | | $ | 1,088,460 | |
| Walt Disney Co./The | | | 18,300 | | | | 2,377,536 | |
| | | | | | | | 3,465,996 | |
| Consumer Discretionary - 5.1% | | | | | | | | |
| Lowe’s Cos. Inc. | | | 17,000 | | | | 1,897,370 | |
| Toll Brothers Inc. | | | 37,000 | | | | 1,471,490 | |
| | | | | | | | 3,368,860 | |
| Consumer Staples - 6.3% | | | | | | | | |
| Mondelez International Inc., Class A | | | 25,500 | | | | 1,337,475 | |
| Procter & Gamble Co./The | | | 22,500 | | | | 2,801,475 | |
| | | | | | | | 4,138,950 | |
| Energy - 9.5% | | | | | | | | |
| Canadian Natural Resources Ltd. | | | 66,500 | | | | 1,677,130 | |
| EOG Resources Inc. | | | 14,200 | | | | 984,202 | |
| Halliburton Co. | | | 41,500 | | | | 798,875 | |
| Marathon Petroleum Corp. | | | 22,000 | | | | 1,406,900 | |
| ONEOK Inc. | | | 19,200 | | | | 1,340,736 | |
| | | | | | | | 6,207,843 | |
| Financials - 27.6% | | | | | | | | |
| Capital Markets - 2.8% | | | | | | | | |
| Cboe Global Markets Inc. | | | 16,000 | | | | 1,842,400 | |
| | | | | | | | | |
| Commercial Banks - 14.2% | | | | | | | | |
| Bank of America Corp. | | | 88,500 | | | | 2,767,395 | |
| Citigroup Inc. | | | 10,000 | | | | 718,600 | |
| JPMorgan Chase & Co. | | | 27,500 | | | | 3,435,300 | |
| US Bancorp | | | 42,000 | | | | 2,394,840 | |
| | | | | | | | 9,316,135 | |
| Consumer Finance - 4.2% | | | | | | | | |
| American Express Co. | | | 23,200 | | | | 2,720,896 | |
| | | | | | | | | |
| Insurance - 6.4% | | | | | | | | |
| Aon PLC | | | 14,800 | | | | 2,858,768 | |
| Principal Financial Group Inc. | | | 25,600 | | | | 1,366,528 | |
| | | | | | | | 4,225,296 | |
| | | | | | | | 18,104,727 | |
| Health Care - 8.7% | | | | | | | | |
| Baxter International Inc. | | | 39,000 | | | | 2,991,300 | |
| Zimmer Biomet Holdings Inc. | | | 19,400 | | | | 2,681,662 | |
| | | | | | | | 5,672,962 | |
| Industrials - 8.4% | | | | | | | | |
| Delta Air Lines Inc. | | | 24,000 | | | | 1,321,920 | |
| Jacobs Engineering Group Inc. | | | 44,500 | | | | 4,164,310 | |
| | | | | | | | 5,486,230 | |
| Information Technology - 4.8% | | | | | | | | |
| Broadcom Inc. | | | 5,500 | | | | 1,610,675 | |
| First Solar Inc. * | | | 29,500 | | | | 1,527,805 | |
| | | | | | | | 3,138,480 | |
| Materials - 10.0% | | | | | | | | |
| Barrick Gold Corp. | | | 188,000 | | | | 3,263,680 | |
| Franco-Nevada Corp. | | | 11,000 | | | | 1,066,670 | |
| Royal Gold Inc. | | | 19,000 | | | | 2,193,360 | |
| | | | | | | | 6,523,710 | |
| Real Estate - 5.3% | | | | | | | | |
| Boston Properties Inc., REIT | | | 11,500 | | | | 1,577,800 | |
| Prologis Inc., REIT | | | 21,500 | | | | 1,886,840 | |
| | | | | | | | 3,464,640 | |
| Utilities - 7.4% | | | | | | | | |
| Duke Energy Corp. | | | 14,500 | | | | 1,366,770 | |
| Sempra Energy | | | 24,000 | | | | 3,468,240 | |
| | | | | | | | 4,835,010 | |
| Total Common Stocks | | | | | | | | |
| (Cost $54,765,150) | | | | | | | 64,407,408 | |
| | | | | | | | | |
| SHORT-TERM INVESTMENTS - 1.6% | | | | | | | | |
| State Street Institutional U.S. Government Money Market Fund, 1.75%, Premier Class (A) | | | 1,023,351 | | | | 1,023,351 | |
| Total Short-Term Investments | | | | | | | | |
| (Cost $1,023,351) | | | | | | | 1,023,351 | |
| TOTAL INVESTMENTS - 100.0% (Cost $55,788,501**) | | | | | | | 65,430,759 | |
| NET OTHER ASSETS AND LIABILITIES - 0.0% | | | | | | | 4,498 | |
| TOTAL NET ASSETS - 100.0% | | | | | | $ | 65,435,257 | |
| ** | | Aggregate cost for Federal tax purposes was $55,860,963. |
| PLC | | Public Limited Company. |
| REIT | | Real Estate Investment Trust. |
See accompanying Notes to Financial Statements.
32
Madison Funds | October 31, 2019
| |
| Madison Investors Fund Portfolio of Investments |
| | | Shares | | | Value (Note 2) | |
| COMMON STOCKS - 94.2% | | | | | | | | |
| | | | | | | | | |
| Communication Service - 5.1% | | | | | | | | |
| Alphabet Inc., Class C * | | | 13,763 | | | $ | 17,342,894 | |
| | | | | | | | | |
| Consumer Discretionary - 21.4% | | | | | | | | |
| Booking Holdings Inc. * | | | 4,017 | | | | 8,229,909 | |
| CarMax Inc. * | | | 166,430 | | | | 15,506,283 | |
| Dollar Tree Inc. * | | | 122,953 | | | | 13,574,011 | |
| Lowe’s Cos. Inc. | | | 145,166 | | | | 16,201,977 | |
| Omnicom Group Inc. | | | 82,606 | | | | 6,376,357 | |
| TJX Cos. Inc./The | | | 217,344 | | | | 12,529,882 | |
| | | | | | | | 72,418,419 | |
| Energy - 2.3% | | | | | | | | |
| Exxon Mobil Corp. | | | 118,260 | | | | 7,990,828 | |
| | | | | | | | | |
| Financials - 18.7% | | | | | | | | |
| Berkshire Hathaway Inc., Class B * | | | 74,640 | | | | 15,866,971 | |
| Brookfield Asset Management Inc., Class A | | | 293,673 | | | | 16,225,433 | |
| Charles Schwab Corp./The | | | 134,135 | | | | 5,460,636 | |
| Progressive Corp./The | | | 143,309 | | | | 9,988,637 | |
| US Bancorp | | | 275,436 | | | | 15,705,361 | |
| | | | | | | | 63,247,038 | |
| Health Care - 10.5% | | | | | | | | |
| Alcon Inc. * | | | 26,992 | | | | 1,599,816 | |
| Danaher Corp. | | | 71,196 | | | | 9,812,233 | |
| Novartis AG, ADR | | | 134,961 | | | | 11,800,990 | |
| Varian Medical Systems Inc. * | | | 101,721 | | | | 12,288,914 | |
| | | | | | | | 35,501,953 | |
| Industrials - 11.0% | | | | | | | | |
| Copart Inc. * | | | 120,591 | | | | 9,965,641 | |
| Jacobs Engineering Group Inc. | | | 177,014 | | | | 16,564,970 | |
| PACCAR Inc. | | | 139,636 | | | | 10,620,714 | |
| | | | | | | | 37,151,325 | |
| Information Technology - 15.9% | | | | | | | | |
| Accenture PLC, Class A | | | 33,717 | | | | 6,251,806 | |
| Analog Devices Inc. | | | 68,807 | | | | 7,336,890 | |
| CDW Corp. | | | 88,205 | | | | 11,282,302 | |
| Cognizant Technology Solutions Corp., Class A | | | 179,735 | | | | 10,953,051 | |
| TE Connectivity Ltd. | | | 82,901 | | | | 7,419,640 | |
| Visa Inc., Class A | | | 58,850 | | | | 10,525,911 | |
| | | | | | | | 53,769,600 | |
| Materials - 7.7% | | | | | | | | |
| Linde PLC | | | 48,446 | | | | 9,609,264 | |
| PPG Industries Inc. | | | 133,341 | | | | 16,683,626 | |
| | | | | | | | 26,292,890 | |
| Real Estate - 1.6% | | | | | | | | |
| American Tower Corp. | | | 25,055 | | | | 5,463,994 | |
| | | | | | | | | |
| Total Common Stocks | | | | | | | | |
| (Cost $217,584,295) | | | | | | | 319,178,941 | |
| | | | | | | | | |
| SHORT-TERM INVESTMENTS - 5.6% | | | | | | | | |
| State Street Institutional U.S. Government Money Market Fund, 1.75%, Premier Class (A) | | | 19,056,090 | | | | 19,056,090 | |
| Total Short-Term Investments | | | | | | | | |
| (Cost $19,056,090) | | | | | | | 19,056,090 | |
| TOTAL INVESTMENTS - 99.8% (Cost $236,640,385**) | | | | | | | 338,235,031 | |
| NET OTHER ASSETS AND LIABILITIES - 0.2% | | | | | | | 747,580 | |
| TOTAL NET ASSETS - 100.0% | | | | | | $ | 338,982,611 | |
| ** | | Aggregate cost for Federal tax purposes was $236,960,003. |
| ADR | | American Depositary Receipt. |
| PLC | | Public Limited Company. |
| |
| Madison Mid Cap Fund Portfolio of Investments |
| | | Shares | | | Value (Note 2) | |
| COMMON STOCKS - 91.1% | | | | | | | | |
| | | | | | | | | |
| Communication Service - 5.6% | | | | | | | | |
| Liberty Broadband Corp., Class C * | | | 276,921 | | | $ | 32,696,063 | |
| | | | | | | | | |
| Consumer Discretionary - 20.7% | | | | | | | | |
| CarMax Inc. * | | | 294,143 | | | | 27,405,303 | |
| Dollar Tree Inc. * | | | 248,287 | | | | 27,410,885 | |
| Floor & Decor Holdings Inc., Class A * | | | 164,030 | | | | 7,517,495 | |
| Mohawk Industries Inc. * | | | 97,430 | | | | 13,969,513 | |
| O’Reilly Automotive Inc. * | | | 57,132 | | | | 24,881,557 | |
| Ross Stores Inc. | | | 184,019 | | | | 20,181,364 | |
| | | | | | | | 121,366,117 | |
| Consumer Staples - 1.2% | | | | | | | | |
| Brown-Forman Corp., Class B | | | 111,060 | | | | 7,276,651 | |
| | | | | | | | | |
| Financials - 28.3% | | | | | | | | |
| Capital Markets - 4.0% | | | | | | | | |
| Brookfield Asset Management Inc., Class A | | | 426,085 | | | | 23,541,196 | |
| | | | | | | | | |
| Commercial Banks - 1.9% | | | | | | | | |
| Glacier Bancorp Inc. | | | 259,333 | | | | 10,974,973 | |
| | | | | | | | | |
| Insurance - 22.4% | | | | | | | | |
| Arch Capital Group Ltd. * | | | 875,270 | | | | 36,551,275 | |
| Brown & Brown Inc. | | | 667,739 | | | | 25,160,406 | |
| Kemper Corp. | | | 164,578 | | | | 11,829,867 | |
| Markel Corp. * | | | 23,511 | | | | 27,531,381 | |
| Progressive Corp./The | | | 199,092 | | | | 13,876,712 | |
| WR Berkley Corp. | | | 236,988 | | | | 16,565,461 | |
| | | | | | | | 131,515,102 | |
| | | | | | | | 166,031,271 | |
| Health Care - 4.5% | | | | | | | | |
| Elanco Animal Health Inc. * | | | 255,994 | | | | 6,916,958 | |
| Laboratory Corp. of America Holdings * | | | 117,213 | | | | 19,313,186 | |
| | | | | | | | 26,230,144 | |
| Industrials - 15.5% | | | | | | | | |
| Copart Inc. * | | | 293,091 | | | | 24,221,040 | |
| Expeditors International of Washington Inc. | | | 134,096 | | | | 9,780,962 | |
| Fastenal Co. | | | 458,470 | | | | 16,477,412 | |
| HD Supply Holdings Inc. * | | | 391,063 | | | | 15,462,631 | |
| IHS Markit Ltd. * | | | 354,537 | | | | 24,824,681 | |
| | | | | | | | 90,766,726 | |
| Information Technology - 9.6% | | | | | | | | |
| Amphenol Corp., Class A | | | 153,487 | | | | 15,399,351 | |
| CDW Corp. | | | 175,489 | | | | 22,446,798 | |
| Gartner Inc. * | | | 64,183 | | | | 9,889,316 | |
| TE Connectivity Ltd. | | | 100,152 | | | | 8,963,604 | |
| | | | | | | | 56,699,069 | |
| Materials - 5.7% | | | | | | | | |
| Axalta Coating Systems Ltd. * | | | 670,598 | | | | 19,775,935 | |
| NewMarket Corp. | | | 28,857 | | | | 14,009,785 | |
| | | | | | | | 33,785,720 | |
| Total Common Stocks | | | | | | | | |
| (Cost $333,373,921) | | | | | | | 534,851,761 | |
| | | | | | | | | |
| SHORT-TERM INVESTMENTS - 8.7% | | | | | | | | |
| State Street Institutional U.S. Government Money Market Fund, 1.75%, Premier Class (A) | | | 51,308,932 | | | | 51,308,932 | |
| Total Short-Term Investments | | | | | | | | |
| (Cost $51,308,932) | | | | | | | 51,308,932 | |
| TOTAL INVESTMENTS - 99.8% (Cost $384,682,853**) | | | | | | | 586,160,693 | |
| NET OTHER ASSETS AND LIABILITIES - 0.2% | | | | | | | 1,003,806 | |
| TOTAL NET ASSETS - 100.0% | | | | | | $ | 587,164,499 | |
| ** | | Aggregate cost for Federal tax purposes was $385,157,180. |
See accompanying Notes to Financial Statements.
33
Madison Funds | October 31, 2019
| |
| Madison Small Cap Fund Portfolio of Investments |
| | | Shares | | | Value (Note 2) | |
| COMMON STOCKS - 93.0% | | | | | | | | |
| | | | | | | | | |
| Communication Services - 3.5% | | | | | | | | |
| National CineMedia Inc. | | | 557,959 | | | $ | 4,684,066 | |
| TripAdvisor Inc. * | | | 115,800 | | | | 4,678,320 | |
| | | | | | | | 9,362,386 | |
| Consumer Discretionary - 6.2% | | | | | | | | |
| Brunswick Corp. | | | 71,700 | | | | 4,175,808 | |
| Chuy’s Holdings Inc. * | | | 237,203 | | | | 5,780,637 | |
| Hibbett Sports Inc. * | | | 151,830 | | | | 3,622,664 | |
| Nordstrom Inc. (A) | | | 80,760 | | | | 2,899,284 | |
| | | | | | | | 16,478,393 | |
| Consumer Staples - 7.0% | | | | | | | | |
| Boston Beer Co. Inc./The, - Class A * | | | 12,586 | | | | 4,712,954 | |
| Edgewell Personal Care Co. * | | | 177,240 | | | | 6,203,400 | |
| Freshpet Inc. * | | | 56,382 | | | | 2,946,523 | |
| Hain Celestial Group Inc./The * | | | 200,900 | | | | 4,749,276 | |
| | | | | | | | 18,612,153 | |
| Financials - 13.8% | | | | | | | | |
| MGIC Investment Corp. | | | 890,221 | | | | 12,204,930 | |
| PacWest Bancorp | | | 59,451 | | | | 2,199,093 | |
| PRA Group Inc. * | | | 193,995 | | | | 6,582,250 | |
| TCF Financial Corp. | | | 145,894 | | | | 5,775,943 | |
| Veritex Holdings Inc. | | | 114,593 | | | | 2,821,280 | |
| Western Alliance Bancorp | | | 109,621 | | | | 5,407,604 | |
| Zions Bancorp NA | | | 39,100 | | | | 1,895,177 | |
| | | | | | | | 36,886,277 | |
| Health Care - 19.6% | | | | | | | | |
| AMN Healthcare Services Inc. * | | | 71,936 | | | | 4,226,959 | |
| Avanos Medical Inc. * | | | 120,200 | | | | 5,293,608 | |
| Cardiovascular Systems Inc. * | | | 68,755 | | | | 3,060,973 | |
| Catalent Inc. * | | | 98,830 | | | | 4,808,080 | |
| Encompass Health Corp. | | | 153,299 | | | | 9,814,202 | |
| Flexion Therapeutics Inc. * (A) | | | 169,080 | | | | 2,903,104 | |
| Globus Medical Inc., - Class A * | | | 141,700 | | | | 7,420,829 | |
| Natera Inc. * | | | 104,424 | | | | 4,022,412 | |
| Nevro Corp. * | | | 16,158 | | | | 1,392,820 | |
| Phibro Animal Health Corp., - Class A | | | 61,947 | | | | 1,484,250 | |
| PRA Health Sciences Inc. * | | | 71,135 | | | | 6,950,601 | |
| Tivity Health Inc. * | | | 60,869 | | | | 986,686 | |
| | | | | | | | 52,364,524 | |
| Industrials - 20.0% | | | | | | | | |
| Beacon Roofing Supply Inc. * | | | 104,900 | | | | 3,256,096 | |
| Carlisle Cos. Inc. | | | 29,990 | | | | 4,566,577 | |
| Construction Partners Inc., - Class A * | | | 133,534 | | | | 2,286,102 | |
| Crane Co. | | | 65,540 | | | | 5,015,121 | |
| Kennametal Inc. | | | 100,967 | | | | 3,124,929 | |
| Kornit Digital Ltd. * | | | 127,303 | | | | 4,327,029 | |
| ManpowerGroup Inc. | | | 30,986 | | | | 2,817,247 | |
| Masco Corp. | | | 176,073 | | | | 8,143,376 | |
| Rexnord Corp. * | | | 184,856 | | | | 5,229,576 | |
| Welbilt Inc. * | | | 334,164 | | | | 6,335,750 | |
| Wesco Aircraft Holdings Inc. * | | | 170,419 | | | | 1,878,017 | |
| WillScot Corp. * | | | 404,662 | | | | 6,377,473 | |
| | | | | | | | 53,357,293 | |
| Information Technology - 17.0% | | | | | | | | |
| Box Inc., - Class A * | | | 236,200 | | | | 3,996,504 | |
| Ciena Corp. * | | | 78,327 | | | | 2,907,498 | |
| CommVault Systems Inc. * | | | 101,451 | | | | 5,039,071 | |
| Entegris Inc. | | | 101,400 | | | | 4,867,200 | |
| FireEye Inc. * | | | 522,600 | | | | 8,277,984 | |
| FLIR Systems Inc. | | | 108,630 | | | | 5,600,963 | |
| Keysight Technologies Inc. * | | | 32,360 | | | | 3,265,448 | |
| LiveRamp Holdings Inc. * | | | 87,444 | | | | 3,418,186 | |
| Marvell Technology Group Ltd. | | | 172,728 | | | | 4,212,836 | |
| National Instruments Corp. | | | 20,430 | | | | 845,598 | |
| PTC Inc. * | | | 44,539 | | | | 2,980,104 | |
| | | | | | | | 45,411,392 | |
| | | | | | | | | |
| Materials - 5.9% | | | | | | |
| Allegheny Technologies Inc. * | | | 188,011 | | | | 3,950,111 | |
| Ferro Corp. * | | | 106,460 | | | | 1,184,900 | |
| Olin Corp. | | | 248,401 | | | | 4,555,674 | |
| Scotts Miracle-Gro Co./The | | | 26,432 | | | | 2,653,509 | |
| Vulcan Materials Co. | | | 23,621 | | | | 3,374,732 | |
| | | | | | | | 15,718,926 | |
| Total Common Stocks | | | | | | | | |
| (Cost $196,136,936) | | | | | | | 248,191,344 | |
| | | | | | | | | |
| SHORT-TERM INVESTMENTS - 11.8% | | | | | | | | |
| State Street Institutional U.S. Government | | | | | | | | |
| Money Market Fund, 1.75%, Premier | | | | | | | | |
| Class (B) | | | 27,356,791 | | | | 27,356,791 | |
| State Street Navigator Securities Lending | | | | | | | | |
| Government Money Market Portfolio, 1.75% (B) (C) | | | 4,301,630 | | | | 4,301,630 | |
| Total Short-Term Investments | | | | | | | | |
| (Cost $31,658,421) | | | | | | | 31,658,421 | |
| TOTAL INVESTMENTS - 104.8% | | | | | | | | |
| (Cost $227,795,357**) | | | | | | $ | 279,849,765 | |
| NET OTHER ASSETS AND LIABILITIES - (4.8%) | | | | | | | (12,866,071 | ) |
| TOTAL NET ASSETS - 100.0% | | | | | | $ | 266,983,694 | |
| ** | Aggregate cost for Federal tax purposes was $229,258,986. |
| (A) | All or a portion of these securities, with an aggregate fair value of $5,686,304, are on loan as part of a securities lending program. See footnote (C) and Note 9 for details on the securities lending program. |
| (C) | Represents investments of cash collateral received in connection with securities lending. |
See accompanying Notes to Financial Statements.
34
Madison Funds | October 31, 2019
| |
| Madison International Stock Fund Portfolio of Investments |
| | | Shares | | | Value (Note 2) | |
| COMMON STOCKS - 95.0% | | | | | | | | |
| | | | | | | | | |
| Australia - 2.2% | | | | | | | | |
| Amcor PLC | | | 20,357 | | | $ | 195,481 | |
| BHP Group PLC | | | 11,139 | | | | 235,884 | |
| | | | | | | | 431,365 | |
| Belgium - 1.5% | | | | | | | | |
| Anheuser-Busch InBev S.A. | | | 3,581 | | | | 287,720 | |
| | | | | | | | | |
| Canada - 5.5% | | | | | | | | |
| Canadian National Railway Co. | | | 2,358 | | | | 210,897 | |
| National Bank of Canada | | | 4,853 | | | | 250,627 | |
| Suncor Energy Inc. | | | 12,161 | | | | 361,571 | |
| TMX Group Ltd. | | | 2,578 | | | | 225,249 | |
| | | | | | | | 1,048,344 | |
| China - 1.6% | | | | | | | | |
| Ping An Insurance Group Co. of China Ltd., | | | | | | | | |
| Class H | | | 27,000 | | | | 312,693 | |
| | | | | | | | | |
| Denmark - 1.5% | | | | | | | | |
| Carlsberg AS, Class B | | | 2,049 | | | | 288,257 | |
| | | | | | | | | |
| Finland - 2.3% | | | | | | | | |
| Nordea Bank Abp | | | 28,772 | | | | 210,463 | |
| Sampo Oyj, Class A | | | 5,806 | | | | 237,907 | |
| | | | | | | | 448,370 | |
| France - 12.8% | | | | | | | | |
| Air Liquide S.A. | | | 2,371 | | | | 314,945 | |
| Atos SE | | | 862 | | | | 66,740 | |
| Engie S.A. | | | 25,923 | | | | 433,534 | |
| Safran S.A. | | | 3,080 | | | | 487,272 | |
| Sanofi | | | 5,508 | | | | 507,541 | |
| Vinci S.A. | | | 2,100 | | | | 235,618 | |
| Vivendi S.A. | | | 14,957 | | | | 416,371 | |
| | | | | | | | 2,462,021 | |
| Germany - 5.1% | | | | | | | | |
| Fresenius Medical Care AG & Co. KGaA | | | 1,029 | | | | 74,459 | |
| Fresenius SE & Co. KGaA | | | 2,561 | | | | 134,603 | |
| SAP SE | | | 4,751 | | | | 629,496 | |
| Vonovia SE | | | 2,570 | | | | 136,752 | |
| | | | | | | | 975,310 | |
| Hong Kong - 0.4% | | | | | | | | |
| ESR Cayman Ltd. * | | | 34,200 | | | | 73,324 | |
| | | | | | | | | |
| Ireland - 4.4% | | | | | | | | |
| Medtronic PLC | | | 5,408 | | | | 588,931 | |
| Ryanair Holdings PLC, ADR * | | | 3,324 | | | | 248,104 | |
| | | | | | | | 837,035 | |
| Israel - 1.2% | | | | | | | | |
| Bank Leumi Le-Israel BM | | | 31,650 | | | | 230,430 | |
| | | | | | | | | |
| Japan - 14.9% | | | | | | | | |
| Asahi Group Holdings Ltd. | | | 4,200 | | | | 211,186 | |
| Daiwa House Industry Co. Ltd. | | | 14,396 | | | | 497,908 | |
| Hitachi Ltd. | | | 7,700 | | | | 290,131 | |
| Kao Corp. | | | 3,710 | | | | 300,400 | |
| Makita Corp. | | | 6,500 | | | | 221,803 | |
| Nexon Co. Ltd. * | | | 18,200 | | | | 211,510 | |
| Pan Pacific International Holdings Corp. | | | 11,392 | | | | 180,074 | |
| Shin-Etsu Chemical Co. Ltd. | | | 2,500 | | | | 281,508 | |
| Sumitomo Mitsui Financial Group Inc. | | | 8,400 | | | | 301,806 | |
| Suzuki Motor Corp. | | | 4,200 | | | | 199,791 | |
| Yamaha Corp. | | | 3,700 | | | | 173,710 | |
| | | | | | | | 2,869,827 | |
| Mexico - 0.4% | | | | | | | | |
| Arca Continental S.A.B. de C.V. | | | 12,800 | | | | 71,544 | |
| | | | | | | | | |
| Netherlands - 4.1% | | | | | | | | |
| ABN AMRO Group N.V. (A) | | | 10,480 | | | | 195,079 | |
| Koninklijke DSM N.V. | | | 2,208 | | | | 261,649 | |
| Wolters Kluwer N.V. | | | 4,582 | | | | 337,382 | |
| | | | | | | | 794,110 | |
| Norway - 3.0% | | | | | | | | |
| Equinor ASA | | | 9,353 | | | | 173,001 | |
| Mowi ASA | | | 6,849 | | | | 166,977 | |
| Telenor ASA | | | 12,821 | | | | 240,007 | |
| | | | | | | | 579,985 | |
| Singapore - 2.7% | | | | | | | | |
| DBS Group Holdings Ltd. | | | 18,640 | | | | 356,235 | |
| NetLink NBN Trust | | | 242,900 | | | | 166,046 | |
| | | | | | | | 522,281 | |
| South Korea - 2.2% | | | | | | | | |
| Samsung Electronics Co. Ltd. | | | 9,937 | | | | 430,465 | |
| | | | | | | | | |
| Spain - 0.9% | | | | | | | | |
| Red Electrica Corp. S.A. | | | 8,410 | | | | 169,303 | |
| | | | | | | | | |
| Sweden - 3.8% | | | | | | | | |
| Assa Abloy AB, Class B | | | 18,927 | | | | 448,883 | |
| Epiroc AB, Class A (B) | | | 25,003 | | | | 281,215 | |
| | | | | | | | 730,098 | |
| Switzerland - 4.6% | | | | | | | | |
| ABB Ltd. | | | 14,725 | | | | 308,829 | |
| Novartis AG | | | 6,706 | | | | 585,220 | |
| | | | | | | | 894,049 | |
| United Kingdom - 19.9% | | | | | | | | |
| Aon PLC | | | 2,472 | | | | 477,492 | |
| Compass Group PLC | | | 7,135 | | | | 190,022 | |
| Ferguson PLC | | | 2,715 | | | | 231,622 | |
| Howden Joinery Group PLC | | | 13,933 | | | | 104,210 | |
| Informa PLC | | | 24,509 | | | | 246,045 | |
| Network International Holdings PLC * (A) | | | 13,214 | | | | 92,602 | |
| Prudential PLC | | | 21,026 | | | | 367,278 | |
| RELX PLC | | | 20,769 | | | | 499,860 | |
| Royal Dutch Shell PLC, Class A | | | 19,933 | | | | 576,565 | |
| RSA Insurance Group PLC | | | 26,137 | | | | 176,799 | |
| Tesco PLC | | | 101,558 | | | | 309,413 | |
| Unilever PLC | | | 7,373 | | | | 441,477 | |
| Weir Group PLC/The | | | 6,387 | | | | 111,401 | |
| | | | | | | | 3,824,786 | |
| Total Common Stocks | | | | | | | | |
| (Cost $14,203,337) | | | | | | | 18,281,317 | |
| | | | | | | | | |
| PREFERRED STOCK - 2.6% | | | | | | | | |
| | | | | | | | | |
| Germany - 2.6% | | | | | | | | |
| Volkswagen AG | | | 2,619 | | | | 498,609 | |
| Total Preferred Stocks | | | | | | | | |
| (Cost $487,175) | | | | | | | 498,609 | |
| | | | | | | | | |
| Short-Term Investments - 4.3% | | | | | | | | |
| | | | | | | | | |
| United States - 4.3% | | | | | | | | |
| State Street Institutional U.S. Government Money Market Fund, 1.75%, Premier Class (C) | | | 539,284 | | | | 539,284 | |
| State Street Navigator Securities Lending Government Money Market Portfolio, 1.75% (C) (D) | | | 279,086 | | | | 279,086 | |
| | | | | | | | 818,370 | |
| Total Short-Term Investments | | | | | | | | |
| (Cost $818,370) | | | | | | | 818,370 | |
| TOTAL INVESTMENTS - 101.9% (Cost $15,508,882**) | | | | | | | 19,598,296 | |
| NET OTHER ASSETS AND LIABILITIES - (1.9%) | | | | | | | (364,433 | ) |
| TOTAL NET ASSETS - 100.0% | | | | | | $ | 19,233,863 | |
| * | Non-income producing. |
| ** | Aggregate cost for Federal tax purposes was $15,708,573. |
| (A) | Security sold within terms of a private placement memorandum exempt from registration under section 144A of the Securities Act of 1933, as amended, and may be sold only to dealers in that program or other “qualified institutional investors.” The securities have been determined to be liquid under guidelines established by the Board of Trustees. |
| (B) | All or a portion of these securities, with an aggregate fair value of $266,941, are on loan as part of a securities lending program. See footnote (D) and Note 9 for details on the securities lending program. |
| (C) | 7-day yield. |
| (D) | Represents investments of cash collateral received in connection with securities lending. |
| ADR | American Depositary Receipt. |
| PLC | Public Limited Company. |
| SECTOR ALLOCATION AS A PERCENTAGE OF NET ASSETS AS OF 10/31/19 |
| Communication Services | | | 4.3 | % |
| Consumer Discretionary | | | 12.0 | % |
| Consumer Staples | | | 10.9 | % |
| Energy | | | 5.8 | % |
| Financials | | | 17.3 | % |
| Health Care | | | 9.8 | % |
| Industrials | | | 14.9 | % |
| Information Technology | | | 9.0 | % |
| Materials | | | 6.7 | % |
| Real Estate | | | 3.7 | % |
| Short-Term Investments | | | 4.3 | % |
| Utilities | | | 3.2 | % |
| Net Other Assets and Liabilities | | | (1.9 | )% |
See accompanying Notes to Financial Statements.
35
Madison Funds | October 31, 2019
| |
| Statements of Assets and Liabilities as of October 31, 2019 |
| | | Conservative Allocation
Fund | | | Moderate
Allocation
Fund | | | Aggressive
Allocation
Fund | | | Government Money Market Fund | | | Tax-Free
Virginia
Fund | | | Tax-Free
National
Fund | | | High Quality Bond Fund | | | Core Bond Fund | |
| Assets: | | | | | | | | | | | | | | | | | | | | | | | | | | | | | | | | |
| Investments in unaffiliated securities, at fair value†§ | | $ | 48,197,499 | | | $ | 83,632,029 | | | $ | 35,439,325 | | | $ | 15,054,823 | | | $ | 21,631,438 | | | $ | 23,162,588 | | | $ | 91,735,656 | | | $ | 147,740,928 | |
| Investments in affiliated securities, at fair value2‡ | | | 27,911,939 | | | | 57,614,286 | | | | 27,926,826 | | | | – | | | | – | | | | – | | | | – | | | | – | |
| Cash | | | – | | | | – | | | | – | | | | – | | | | 360,806 | | | | 385,011 | | | | – | | | | 425,705 | |
| Foreign currency (cost of $1,011)(Note 2) | | | – | | | | – | | | | – | | | | – | | | | – | | | | – | | | | – | | | | – | |
| Receivables: | | | | | | | | | | | | | | | | | | | | | | | | | | | | | | | | |
| Investments sold | | | 350,499 | | | | 2,195,569 | | | | 1,101,134 | | | | – | | | | – | | | | – | | | | 1,514,843 | | | | 4,700,705 | |
| Fund shares sold | | | 813 | | | | 13,867 | | | | 3,850 | | | | 125 | | | | – | | | | – | | | | 4,009 | | | | 13,367 | |
| Dividends and interest | | | 34,242 | | | | 32,899 | | | | 9,005 | | | | 9,413 | | | | 250,053 | | | | 285,155 | | | | 558,186 | | | | 1,019,841 | |
| Due from Adviser | | | – | | | | – | | | | – | | | | – | | | | – | | | | – | | | | – | | | | – | |
| Total assets | | | 76,494,992 | | | | 143,488,650 | | | | 64,480,140 | | | | 15,064,361 | | | | 22,242,297 | | | | 23,832,754 | | | | 93,812,694 | | | | 153,900,546 | |
| Liabilities: | | | | | | | | | | | | | | | | | | | | | | | | | | | | | | | | |
| Payables: | | | | | | | | | | | | | | | | | | | | | | | | | | | | | | | | |
| Investments purchased | | | 342,633 | | | | 2,049,222 | | | | 1,111,663 | | | | – | | | | – | | | | – | | | | 2,999,890 | | | | 250,000 | |
| Fund shares repurchased | | | 23,950 | | | | 1,700 | | | | 1,000 | | | | 3,352 | | | | 153 | | | | 5,925 | | | | 153,481 | | | | 2,517 | |
| Upon return of securities loaned | | | 7,649,162 | | | | 5,065,826 | | | | – | | | | – | | | | – | | | | – | | | | 214,965 | | | | 227,850 | |
| Advisory agreement fees | | | 11,573 | | | | 23,028 | | | | 10,650 | | | | 5,131 | | | | 9,453 | | | | 8,118 | | | | 23,121 | | | | 65,344 | |
| Administrative services agreement fees | | | 14,468 | | | | 28,785 | | | | 13,312 | | | | 1,925 | | | | 6,617 | | | | 7,104 | | | | 14,643 | | | | 19,387 | |
| Distribution fees - Class B | | | 3,473 | | | | 8,777 | | | | 3,878 | | | | 43 | | | | – | | | | – | | | | – | | | | 815 | |
| Distribution fees - Class C | | | 13,004 | | | | 6,102 | | | | 1,424 | | | | – | | | | – | | | | – | | | | – | | | | – | |
| Shareholder service fees | | | 14,428 | | | | 28,719 | | | | 13,242 | | | | – | | | | – | | | | – | | | | – | | | | 6,314 | |
| Dividends | | | – | | | | – | | | | – | | | | 215 | | | | 735 | | | | 4,982 | | | | – | | | | 187,299 | |
| Options written, at value (premium received $1,907,911) (Note 6) | | | – | | | | – | | | | – | | | | – | | | | – | | | | – | | | | – | | | | – | |
| Total liabilities | | | 8,072,691 | | | | 7,212,159 | | | | 1,155,169 | | | | 10,666 | | | | 16,958 | | | | 26,129 | | | | 3,406,100 | | | | 759,526 | |
| Net Assets | | $ | 68,422,301 | | | $ | 136,276,491 | | | $ | 63,324,971 | | | $ | 15,053,695 | | | $ | 22,225,339 | | | $ | 23,806,625 | | | $ | 90,406,594 | | | $ | 153,141,020 | |
| Net Assets consist of: | | | | | | | | | | | | | | | | | | | | | | | | | | | | | | | | |
| Common Stock/Shares: | | | | | | | | | | | | | | | | | | | | | | | | | | | | | | | | |
| Paid-in capital | | $ | 62,722,853 | | | $ | 118,374,544 | | | $ | 53,336,731 | | | $ | 15,053,918 | | | $ | 21,190,902 | | | $ | 22,448,950 | | | $ | 88,802,222 | | | $ | 146,628,268 | |
| Accumulated distributable earnings (loss) | | | 5,699,448 | | | | 17,901,947 | | | | 9,988,240 | | | | (223 | ) | | | 1,034,437 | | | | 1,357,675 | | | | 1,604,372 | | | | 6,512,752 | |
| Net Assets | | $ | 68,422,301 | | | $ | 136,276,491 | | | $ | 63,324,971 | | | $ | 15,053,695 | | | $ | 22,225,339 | | | $ | 23,806,625 | | | $ | 90,406,594 | | | $ | 153,141,020 | |
| Class A Shares: |
| Net Assets | | $ | 42,661,923 | | | $ | 112,915,654 | | | $ | 54,974,307 | | | $ | 14,989,583 | | | | | | | | | | | | | | | $ | 28,901,509 | |
| Shares of beneficial interest outstanding | | | 3,893,586 | | | | 9,602,042 | | | | 4,573,613 | | | | 14,989,798 | | | | | | | | | | | | | | | | 2,810,570 | |
| Net Asset Value and redemption price per share | | $ | 10.96 | | | $ | 11.76 | | | $ | 12.02 | | | $ | 1.00 | | | | | | | | | | | | | | | $ | 10.28 | |
| Sales charge of offering price3 | | | 0.67 | | | | 0.72 | | | | 0.73 | | | | – | | | | | | | | | | | | | | | | 0.48 | |
| Maximum offering price per share | | $ | 11.63 | | | $ | 12.48 | | | $ | 12.75 | | | $ | 1.00 | | | | | | | | | | | | | | | $ | 10.76 | |
| Class B Shares: |
| Net Assets | | | 5,457,250 | | | | 13,753,904 | | | | 6,087,552 | | | | 64,112 | | | | | | | | | | | | | | | | 1,272,204 | |
| Shares of beneficial interest outstanding | | | 491,521 | | | | 1,185,509 | | | | 523,875 | | | | 64,119 | | | | | | | | | | | | | | | | 123,660 | |
| Net Asset Value and redemption price per share4 | | $ | 11.10 | | | $ | 11.60 | | | $ | 11.62 | | | $ | 1.00 | | | | | | | | | | | | | | | $ | 10.29 | |
| Class C Shares: |
| Net Assets | | | 20,303,128 | | | | 9,606,933 | | | | 2,263,112 | | | | | | | | | | | | | | | | | | | | | |
| Shares of beneficial interest outstanding | | | 1,827,398 | | | | 827,284 | | | | 194,582 | | | | | | | | | | | | | | | | | | | | | |
| Net Asset Value and redemption price per share4 | | $ | 11.11 | | | $ | 11.61 | | | $ | 11.63 | | | | | | | | | | | | | | | | | | | | | |
| Class Y Shares: |
| Net Assets | | | | | | | | | | | | | | | | | | | 22,225,339 | | | | 23,806,625 | | | | 90,406,594 | | | | 120,999,896 | |
| Shares of beneficial interest outstanding | | | | | | | | | | | | | | | | | | | 1,898,715 | | | | 2,171,932 | | | | 8,136,142 | | | | 11,809,631 | |
| Net Asset Value and redemption price per share | | | | | | | | | | | | | | | | | | $ | 11.71 | | | $ | 10.96 | | | $ | 11.11 | | | $ | 10.25 | |
| Class R6 Shares: |
| Net Assets | | | | | | | | | | | | | | | | | | | | | | | | | | | | | | | 1,967,411 | |
| Shares of beneficial interest outstanding | | | | | | | | | | | | | | | | | | | | | | | | | | | | | | | 190,433 | |
| Net Asset Value and redemption price per share | | | | | | | | | | | | | | | | | | | | | | | | | | | | | | $ | 10.33 | |
| | | | | | | | | | | | | | | | | | | | | | | | | | | | | | | | | |
| † Cost of Investments in unaffiliated securities | | $ | 46,525,675 | | | $ | 79,968,673 | | | $ | 33,772,096 | | | $ | 15,054,823 | | | $ | 20,578,560 | | | $ | 21,881,333 | | | $ | 90,073,283 | | | $ | 141,472,310 | |
| ‡ Cost of investments in affiliated securities2 | | $ | 25,256,494 | | | $ | 47,708,091 | | | $ | 22,499,215 | | | | – | | | | – | | | | – | | | | – | | | | – | |
| § Fair Value of securities on loan | | $ | 7,555,083 | | | | 4,974,991 | | | | – | | | | – | | | | – | | | | – | | | $ | 210,612 | | | $ | 213,012 | |
| 2 | See Note 12 for information on affiliated issuers. |
| 3 | Sales charge of offering price is 4.50% for the Core Bond and High Income Funds and 5.75% for the Diversified Income, Covered Call & Equity Income, Large Cap Value, Investors, Large Cap Growth, Mid Cap, Small Cap and International Stock Funds. |
| 4 | If applicable, redemption price per share may be reduced by a contingent deferred sales charge. |
See accompanying Notes to Financial Statements.
36
Madison Funds | October 31, 2019
| |
| Statements of Assets and Liabilities as of October 31, 2019 |
| | | Corporate
Bond
Fund | | | High
Income
Fund | | | Diversified
Income
Fund | | | Covered Call & Equity Income Fund | | | Dividend
Income
Fund | | | Large Cap
Value
Fund | | | Investors
Fund | | | Mid
Cap
Fund | | | Small
Cap
Fund | | | International Stock
Fund | |
| Assets: | | | | | | | | | | | | | | | | | | | | | | | | | | | | | | |
| Investments in unaffiliated securities, at fair value†§ | | $ | 15,013,043 | | | $ | 19,456,261 | | | $ | 164,272,088 | | | $ | 126,397,898 | | | $ | 220,397,425 | | | $ | 65,430,759 | | | $ | 338,235,031 | | | $ | 586,160,693 | | | $ | 279,849,765 | | | $ | 19,598,296 | |
| Investments in affiliated securities, at fair value2‡ | | | | | | | | | | | | | | | | | | | | | | | | | | | | | | | | | | | | | | | | |
| | | | – | | | | – | | | | – | | | | – | | | | – | | | | – | | | | – | | | | – | | | | – | | | | – | |
| Cash | | | – | | | | – | | | | – | | | | – | | | | – | | | | – | | | | – | | | | – | | | | – | | | | – | |
| Foreign currency (cost of $1,011)(Note 2) | | | – | | | | – | | | | – | | | | – | | | | – | | | | – | | | | – | | | | – | | | | – | | | | 1,027 | |
| Receivables: | | | | | | | | | | | | | | | | | | | | | | | | | | | | | | | | | | | | | | | | |
| Investments sold | | | – | | | | – | | | | 2,236,070 | | | | 1,448,309 | | | | 2,241,036 | | | | – | | | | – | | | | – | | | | 3,362,724 | | | | 87,770 | |
| Fund shares sold | | | 94 | | | | 921 | | | | 18,979 | | | | 334,434 | | | | 1,829,000 | | | | 1,725 | | | | 788,265 | | | | 2,076,357 | | | | 4,695 | | | | 577 | |
| Dividends and interest | | | 129,263 | | | | 247,001 | | | | 526,318 | | | | 120,150 | | | | 387,823 | | | | 71,170 | | | | 340,015 | | | | 100,863 | | | | 74,477 | | | | 89,061 | |
| Due from Adviser | | | – | | | | – | | | | – | | | | – | | | | 27,873 | | | | – | | | | – | | | | – | | | | 27,211 | | | | – | |
| Total assets | | $ | 15,142,400 | | | $ | 19,704,183 | | | $ | 167,053,455 | | | $ | 128,300,791 | | | $ | 224,883,157 | | | $ | 65,503,654 | | | $ | 339,363,311 | | | $ | 588,337,913 | | | $ | 283,318,872 | | | $ | 19,776,731 | |
| Liabilities: | | | | | | | | | | | | | | | | | | | | | | | | | | | | | | | | | | | | | | | | |
| Payables: | | | | | | | | | | | | | | | | | | | | | | | | | | | | | | | | | | | | | | | | |
| Investments purchased | | | – | | | | – | | | | 1,339,401 | | | | – | | | | 2,160,465 | | | | – | | | | – | | | | – | | | | – | | | | 236,002 | |
| Fund shares repurchased | | | 3,884 | | | | 11,087 | | | | 39,738 | | | | 110,141 | | | | 1,792,971 | | | | 3,377 | | | | 94,628 | | | | 685,483 | | | | 11,740,422 | | | | 1,933 | |
| Upon return of securities loaned | | | – | | | | 982,778 | | | | 113,925 | | | | – | | | | – | | | | – | | | | – | | | | – | | | | 4,301,630 | | | | 279,086 | |
| Advisory agreement fees | | | 5,126 | | | | 8,744 | | | | 91,530 | | | | 90,032 | | | | 139,365 | | | | 30,738 | | | | 212,711 | | | | 360,966 | | | | 233,909 | | | | 16,917 | |
| Administrative services agreement fees | | | 3,204 | | | | 3,180 | | | | 28,163 | | | | 15,626 | | | | 65,036 | | | | 20,119 | | | | 55,518 | | | | 111,692 | | | | 58,477 | | | | 4,833 | |
| Distribution fees - Class B | | | – | | | | 650 | | | | 6,081 | | | | – | | | | – | | | | 1,276 | | | | – | | | | 1,085 | | | | – | | | | 448 | |
| Distribution fees - Class C | | | – | | | | – | | | | 10,200 | | | | 5,202 | | | | – | | | | – | | | | – | | | | – | | | | – | | | | – | |
| Shareholder service fees | | | – | | | | 3,696 | | | | 38,253 | | | | 4,598 | | | | – | | | | 12,887 | | | | 17,843 | | | | 14,188 | | | | 740 | | | | 3,649 | |
| Dividends | | | 32,109 | | | | 1,973 | | | | 1,320 | | | | – | | | | – | | | | – | | | | – | | | | – | | | | – | | | | – | |
| Options written, at value (premium received $1,907,911) (Note 6) | | | – | | | | – | | | | – | | | | 1,732,410 | | | | – | | | | – | | | | – | | | | – | | | | – | | | | – | |
| Total liabilities | | | 44,323 | | | | 1,012,108 | | | | 1,668,611 | | | | 1,958,009 | | | | 4,157,837 | | | | 68,397 | | | | 380,700 | | | | 1,173,414 | | | | 16,335,178 | | | | 542,868 | |
| Net Assets | | $ | 15,098,077 | | | $ | 18,692,075 | | | $ | 165,384,844 | | | $ | 126,342,782 | | | $ | 220,725,320 | | | $ | 65,435,257 | | | $ | 338,982,611 | | | $ | 587,164,499 | | | $ | 266,983,694 | | | $ | 19,233,863 | |
| Net Assets consist of: | | | | | | | | | | | | | | | | | | | | | | | | | | | | | | | | | | | | | | | | |
| Common Stock/Shares: | | | | | | | | | | | | | | | | | | | | | | | | | | | | | | | | | | | | | | | | |
| Paid-in capital | | $ | 14,133,212 | | | $ | 20,584,078 | | | $ | 123,829,601 | | | $ | 151,135,021 | | | $ | 184,452,863 | | | $ | 53,637,381 | | | $ | 219,883,015 | | | $ | 365,867,796 | | | $ | 206,861,772 | | | $ | 14,131,282 | |
| Accumulated distributable earnings (loss) | | | 964,865 | | | | (1,892,003 | ) | | | 41,555,243 | | | | (24,792,239 | ) | | | 36,272,457 | | | | 11,797,876 | | | | 119,099,596 | | | | 221,296,703 | | | | 60,121,922 | | | | 5,102,581 | |
| Net Assets | | $ | 15,098,077 | | | $ | 18,692,075 | | | $ | 165,384,844 | | | $ | 126,342,782 | | | $ | 220,725,320 | | | $ | 65,435,257 | | | $ | 338,982,611 | | | $ | 587,164,499 | | | $ | 266,983,694 | | | $ | 19,233,863 | |
| | | | | | | | | | | | | | | | | | | | | | | | | | | | | | | | | | | | | | | | | |
| Class A Shares: | | | | | | | | | | | | | | | | | | | | | | | | | | | | | | | | | | | | | | | | |
| Net Assets | | | | | | $ | 16,772,016 | | | $ | 139,683,372 | | | $ | 13,748,415 | | | | | | | $ | 60,059,534 | | | $ | 86,476,450 | | | $ | 66,249,534 | | | $ | 3,456,691 | | | $ | 17,208,812 | |
| Shares of beneficial interest outstanding | | | | | | | 2,875,733 | | | | 8,535,048 | | | | 1,754,428 | | | | | | | | 4,632,841 | | | | 3,640,150 | | | | 5,972,086 | | | | 310,431 | | | | 1,271,776 | |
| Net Asset Value and redemption price per share | | | | | | $ | 5.83 | | | $ | 16.37 | | | $ | 7.84 | | | | | | | $ | 12.96 | | | $ | 23.76 | | | $ | 11.09 | | | $ | 11.14 | | | $ | 13.53 | |
| Sales charge of offering price3 | | | | | | | 0.27 | | | | 1.00 | | | | 0.48 | | | | | | | | 0.79 | | | | 1.45 | | | | 0.68 | | | | 0.68 | | | | 0.83 | |
| Maximum offering price per share | | | | | | $ | 6.10 | | | $ | 17.37 | | | $ | 8.32 | | | | | | | $ | 13.75 | | | | 25.21 | | | $ | 11.77 | | | $ | 11.82 | | | $ | 14.36 | |
| Class B Shares: | | | | | | | | | | | | | | | | | | | | | | | | | | | | | | | | | | | | | | | | |
| Net Assets | | | | | | $ | 1,017,908 | | | $ | 9,611,657 | | | | | | | | | | | $ | 1,984,215 | | | | | | | $ | 1,729,575 | | | | | | | $ | 714,855 | |
| Shares of beneficial interest outstanding | | | | | | | 169,279 | | | | 583,142 | | | | | | | | | | | | 158,228 | | | | | | | | 195,660 | | | | | | | | 54,399 | |
| Net Asset Value and redemption price per share4 | | | | | | $ | 6.01 | | | $ | 16.48 | | | | | | | | | | | $ | 12.54 | | | | | | | $ | 8.84 | | | | | | | $ | 13.14 | |
| Class C Shares: | | | | | | | | | | | | | | | | | | | | | | | | | | | | | | | | | | | | | | | | |
| Net Assets | | | | | | | | | | $ | 16,089,815 | | | $ | 8,191,299 | | | | | | | | | | | | | | | | | | | | | | | | | |
| Shares of beneficial interest outstanding | | | | | | | | | | | 976,579 | | | | 1,120,882 | | | | | | | | | | | | | | | | | | | | | | | | | |
| Net Asset Value and redemption price per share4 | | | | | | | | | | $ | 16.48 | | | $ | 7.31 | | | | | | | | | | | | | | | | | | | | | | | | | |
| Class Y Shares: | | | | | | | | | | | | | | | | | | | | | | | | | | | | | | | | | | | | | | | | |
| Net Assets | | $ | 15,098,077 | | | $ | 902,151 | | | | | | | $ | 102,017,838 | | | $ | 220,725,320 | | | $ | 3,391,508 | | | $ | 244,442,764 | | | $ | 463,768,078 | | | $ | 263,527,003 | | | $ | 1,310,196 | |
| Shares of beneficial interest outstanding | | | 1,254,280 | | | | 157,938 | | | | | | | | 12,651,840 | | | | 7,983,315 | | | | 261,507 | | | | 10,255,947 | | | | 39,613,622 | | | | 23,545,351 | | | | 96,554 | |
| Net Asset Value and redemption price per share | | $ | 12.04 | | | $ | 5.71 | | | | | | | $ | 8.06 | | | $ | 27.65 | | | $ | 12.97 | | | $ | 23.83 | | | $ | 11.71 | | | $ | 11.19 | | | $ | 13.57 | |
| Class R6 Shares: | | | | | | | | | | | | | | | | | | | | | | | | | | | | | | | | | | | | | | | | |
Net Assets | | | | | | | | | | | | | | $ | 2,385,230 | | | | | | | | | | | $ | 8,063,397 | | | $ | 55,417,312 | | | | | | | | | |
| Shares of beneficial interest outstanding | | | | | | | | | | | | | | | 292,339 | | | | | | | | | | | | 335,117 | | | | 4,620,887 | | | | | | | | | |
| Net Asset Value and redemption price per share | | | | | | | | | | | | | | $ | 8.16 | | | | | | | | | | | $ | 24.06 | | | $ | 11.99 | | | | | | | | | |
| | | | | | | | | | | | | | | | | | | | | | | | | | | | | | | | | | | | | | | | | |
| † Cost of Investments in unaffiliated securities | | $ | 13,970,543 | | | $ | 19,567,309 | | | $ | 130,635,186 | | | $ | 151,750,807 | | | $ | 189,769,381 | | | $ | 55,788,501 | | | $ | 236,640,385 | | | $ | 384,682,853 | | | $ | 227,795,357 | | | $ | 15,508,882 | |
| ‡ Cost of investments in affiliated securities2 | | | – | | | | – | | | | – | | | | – | | | | – | | | | – | | | | – | | | | – | | | | – | | | | – | |
| § Fair Value of securities on loan | | | – | | | $ | 956,101 | | | $ | 106,506 | | | $ | 798,569 | | | | – | | | | – | | | | – | | | | – | | | $ | 5,686,304 | | | $ | 266,941 | |
See accompanying Notes to Financial Statements.
37
Madison Funds | October 31, 2019
| |
| Statements of Operations for the Year Ended October 31, 2019 |
| | | Conservative Allocation
Fund | | | Moderate
Allocation
Fund | | | Aggressive Allocation
Fund | | | Government Money Market
Fund | | | Tax-Free
Virginia
Fund | | | Tax-Free
National
Fund | | | High Quality Bond Fund | | | Core
Bond
Fund | | | Corporate Bond
Fund | |
| | | | | | | | | | | | | | | | | | | | | | | | | | | | | | | | | | | | | |
| Investment Income: | | | | | | | | | | | | | | | | | | | | | | | | | | | | | | | | | | | | |
| | | | | | | | | | | | | | | | | | | | | | | | | | | | | | | | | | | | | |
| Interest | | $ | 54,199 | | | $ | 136,299 | | | $ | 74,589 | | | $ | 346,233 | | | $ | 611,766 | | | $ | 702,661 | | | $ | 2,132,934 | | | $ | 5,175,462 | | | $ | 591,531 | |
| Dividends | | | | | | | | | | | | | | | | | | | | | | | | | | | | | | | | | | | | |
| Unaffiliated issuers | | | 948,140 | | | | 1,837,445 | | | | 791,324 | | | | – | | | | – | | | | – | | | | – | | | | – | | | | – | |
| Affiliated issuers2 | | | 571,157 | | | | 814,938 | | | | 328,475 | | | | – | | | | – | | | | – | | | | – | | | | – | | | | – | |
| Less: Foreign taxes withheld/reclaimed | | | – | | | | – | | | | – | | | | – | | | | – | | | | – | | | | – | | | | – | | | | – | |
| Income from securities lending | | | 20,265 | | | | 46,075 | | | | 19,633 | | | | – | | | | – | | | | – | | | | 671 | | | | 1,646 | | | | – | |
| Total investment income | | | 1,593,761 | | | | 2,834,757 | | | | 1,214,021 | | | | 346,233 | | | | 611,766 | | | | 702,661 | | | | 2,133,605 | | | | 5,177,108 | | | | 591,531 | |
| Expenses:3 | | | | | | | | | | | | | | | | | | | | | | | | | | | | | | | | | | | | |
| Advisory agreement fees | | | 136,133 | | | | 270,520 | | | | 124,618 | | | | 60,390 | | | | 108,803 | | | | 95,540 | | | | 270,368 | | | | 797,017 | | | | 63,538 | |
| Administrative services agreement fees | | | 170,166 | | | | 338,150 | | | | 155,772 | | | | 22,646 | | | | 76,162 | | | | 83,598 | | | | 171,233 | | | | 236,824 | | | | 39,712 | |
| Distribution fees - Class A | | | – | | | | – | | | | – | | | | – | | | | – | | | | – | | | | – | | | | – | | | | – | |
| Distribution fees - Class B | | | 42,710 | | | | 115,633 | | | | 51,253 | | | | 900 | | | | – | | | | – | | | | – | | | | 10,302 | | | | – | |
| Distribution fees - Class C | | | 152,718 | | | | 70,655 | | | | 16,426 | | | | – | | | | – | | | | – | | | | – | | | | – | | | | – | |
| Shareholder service fees - Class A | | | 104,922 | | | | 275,835 | | | | 133,058 | | | | – | | | | – | | | | – | | | | – | | | | 72,818 | | | | – | |
| Shareholder service fees - Class B | | | 14,237 | | | | 38,525 | | | | 17,003 | | | | – | | | | – | | | | – | | | | – | | | | 3,432 | | | | – | |
| Shareholder service fees - Class C | | | 50,906 | | | | 23,552 | | | | 5,475 | | | | – | | | | – | | | | – | | | | – | | | | – | | | | – | |
| Other expenses | | | – | | | | – | | | | – | | | | – | | | | – | | | | – | | | | 362 | | | | – | | | | – | |
| Total expenses before reimbursement/waiver | | | 671,792 | | | | 1,132,870 | | | | 503,605 | | | | 83,936 | | | | 184,965 | | | | 179,138 | | | | 441,963 | | | | 1,120,393 | | | | 103,250 | |
| Less reimbursement/waiver4 | | | – | | | | – | | | | – | | | | – | | | | – | | | | – | | | | – | | | | – | | | | – | |
| Total expenses net of reimbursement/waiver | | | 671,792 | | | | 1,132,870 | | | | 503,605 | | | | 83,936 | | | | 184,965 | | | | 179,138 | | | | 441,963 | | | | 1,120,393 | | | | 103,250 | |
| Net Investment Income (Loss) | | | 921,969 | | | | 1,701,887 | | | | 710,416 | | | | 262,297 | | | | 426,801 | | | | 523,523 | | | | 1,691,642 | | | | 4,056,715 | | | | 488,281 | |
| Net Realized and Unrealized Gain (Loss) on Investments | | | | | | | | | | | | | | | | | | | | | | | | | | | | | | | | | | | | |
| Net realized gain (loss) on investments (including net realized gain (loss) on foreign currency related transactions) | | | | | | | | | | | | | | | | | | | | | | | | | | | | | | | | | | | | |
| Options purchased | | | – | | | | – | | | | – | | | | – | | | | – | | | | – | | | | – | | | | (83,782 | ) | | | – | |
| Options written | | | – | | | | – | | | | – | | | | – | | | | – | | | | – | | | | – | | | | 52,516 | | | | – | |
| Futures | | | – | | | | – | | | | – | | | | – | | | | – | | | | – | | | | – | | | | (46,496 | ) | | | – | |
| Unaffiliated issuers | | | 24,755 | | | | (1,206,746 | ) | | | 5,168 | | | | – | | | | (3,809 | ) | | | 74,305 | | | | 44,442 | | | | 973,130 | | | | (49,711 | ) |
| Affiliated issuers2 | | | 110,612 | | | | 545,115 | | | | 298,098 | | | | – | | | | – | | | | – | | | | – | | | | – | | | | – | |
| Capital gain distributions received from underlying funds | | | | | | | | | | | | | | | | | | | | | | | | | | | | | | | | | | | | |
| Affiliated issuers2 | | | 1,178,838 | | | | 4,138,235 | | | | 2,230,804 | | | | – | | | | – | | | | – | | | | – | | | | – | | | | – | |
| Net change in unrealized appreciation (depreciation) on investments | | | | | | | | | | | | | | | | | | | | | | | | | | | | | | | | | | | | |
| (including net unrealized appreciation (depreciation) on foreign currency | | | | | | | | | | | | | | | | | | | | | | | | | | | | | | | | | | | | |
| related transactions) | | | | | | | | | | | | | | | | | | | | | | | | | | | | | | | | | | | | |
| Options purchased | | | – | | | | – | | | | – | | | | – | | | | – | | | | – | | | | – | | | | 3,834 | | | | – | |
| Options written | | | – | | | | – | | | | – | | | | – | | | | – | | | | – | | | | – | | | | (4,291 | ) | | | – | |
| Unaffiliated issuers | | | 2,325,168 | | | | 5,018,757 | | | | 1,689,996 | | | | – | | | | 1,183,550 | | | | 1,276,817 | | | | 3,857,883 | | | | 11,158,785 | | | | 1,633,884 | |
| Affiliated issuers2 | | | 1,935,876 | | | | 3,296,164 | | | | 1,457,974 | | | | – | | | | – | | | | – | | | | – | | | | – | | | | – | |
| Net Realized and Unrealized Gain (Loss) on Investments | | | 5,575,249 | | | | 11,791,525 | | | | 5,682,040 | | | | – | | | | 1,179,741 | | | | 1,351,122 | | | | 3,902,325 | | | | 12,053,696 | | | | 1,584,173 | |
| Net Increase (Decrease) in Net Assets from Operations | | $ | 6,497,218 | | | | 13,493,412 | | | $ | 6,392,456 | | | $ | 262,297 | | | $ | 1,606,542 | | | $ | 1,874,645 | | | $ | 5,593,967 | | | $ | 16,110,411 | | | $ | 2,072,454 | |
1Disclosure represents the period October 1, 2019 to October 31, 2019. See Notes 1 and 13.
2See Note 12 for information on affiliated issuers.
3See Note 3 for information on expenses.
4See Note 3 for information on these waivers.
See accompanying Notes to Financial Statements.
38
Madison Funds | October 31, 2019
| |
| Statements of Operations for the Year Ended October 31, 2019 |
| | | | | | | | | | | | | | | | | | | | | | | | Small Cap Fund | | | | |
| | | High
Income
Fund | | | Diversified
Income
Fund | | | Covered Call &
Equity Income
Fund | | | Dividend
Income
Fund | | | Large Cap
Value
Fund | | | Investors
Fund | | | Mid
Cap
Fund | | | Period Ended
October 31,
20191 | | | Period Ended
September 30,
2019* | | | International Stock
Fund | |
| | | | | | | | | | | | | | | | | | | | | | | | | | | | | | | | | | | | | | | | | |
| Investment Income: | | | | | | | | | | | | | | | | | | | | | | | | | | | | | | | | | | | | | | | | |
| | | | | | | | | | | | | | | | | | | | | | | | | | | | | | | | | | | | | | | | | |
| Interest | | $ | 1,138,215 | | | $ | 1,767,648 | | | $ | 474,153 | | | $ | 119,327 | | | $ | 35,562 | | | $ | 359,683 | | | $ | 889,330 | | | $ | 52,671 | | | $ | 852,185 | | | $ | 14,513 | |
| Dividends | | | | | | | | | | | | | | | | | | | | | | | | | | | | | | | | | | | | | | | | |
| Unaffiliated issuers | | | 6,036 | | | | 3,065,133 | | | | 2,511,902 | | | | 4,430,853 | | | | 1,331,214 | | | | 4,091,609 | | | | 3,103,208 | | | | 44,761 | | | | 2,164,603 | | | | 637,021 | |
| Affiliated issuers2 | | | – | | | | – | | | | – | | | | – | | | | – | | | | – | | | | – | | | | – | | | | – | | | | – | |
| Less: Foreign taxes withheld/reclaimed | | | – | | | | (25,192 | ) | | | (10,642 | ) | | | (34,213 | ) | | | (3,341 | ) | | | (85,293 | ) | | | (46,538 | ) | | | – | | | | – | | | | (71,935 | ) |
| Income from securities lending | | | 10,399 | | | | 1,572 | | | | 1,910 | | | | 16 | | | | 17,529 | | | | 6,949 | | | | 78,507 | | | | 2,442 | | | | 26 | | | | 5,483 | |
| Total investment income | | | 1,154,650 | | | | 4,809,161 | | | | 2,977,323 | | | | 4,515,983 | | | | 1,380,964 | | | | 4,372,948 | | | | 4,024,507 | | | | 99,874 | | | | 3,016,814 | | | | 585,082 | |
| Expenses:3 | | | | | | | | | | | | | | | | | | | | | | | | | | | | | | | | | | | | | | | | |
| Advisory agreement fees | | | 106,156 | | | | 1,077,774 | | | | 1,107,604 | | | | 1,236,189 | | | | 383,778 | | | | 2,309,624 | | | | 3,772,781 | | | | 233,909 | | | | 3,245,497 | | | | 203,359 | |
| Administrative services agreement fees | | | 38,602 | | | | 331,623 | | | | 192,550 | | | | 576,888 | | | | 251,200 | | | | 602,387 | | | | 1,211,324 | | | | 58,477 | | | | 254,245 | | | | 58,103 | |
| Distribution fees - Class A | | | – | | | | – | | | | – | | | | – | | | | – | | | | – | | | | – | | | | – | | | | – | | | | – | |
| Distribution fees - Class B | | | 8,003 | | | | 77,169 | | | | – | | | | – | | | | 16,375 | | | | – | | | | 13,145 | | | | – | | | | – | | | | 5,661 | |
| Distribution fees - Class C | | | – | | | | 115,434 | | | | 66,891 | | | | – | | | | – | | | | – | | | | – | | | | – | | | | – | | | | – | |
| Shareholder service fees - Class A | | | 42,950 | | | | 349,594 | | | | 36,822 | | | | – | | | | 151,063 | | | | 202,205 | | | | 156,087 | | | | 723 | | | | 713 | | | | 42,765 | |
| Shareholder service fees - Class B | | | 2,668 | | | | 25,638 | | | | – | | | | – | | | | 5,439 | | | | – | | | | 4,369 | | | | – | | | | – | | | | 1,887 | |
| Shareholder service fees - Class C | | | – | | | | 37,648 | | | | 22,297 | | | | – | | | | – | | | | – | | | | – | | | | – | | | | – | | | | – | |
| Other expenses | | | – | | | | – | | | | 32 | | | | – | | | | – | | | | – | | | | – | | | | – | | | | 689,056 | | | | 34 | |
| Total expenses before reimbursement/waiver | | | 198,379 | | | | 2,014,880 | | | | 1,426,196 | | | | 1,813,077 | | | | 807,855 | | | | 3,114,216 | | | | 5,157,706 | | | | 293,109 | | | | 4,189,511 | | | | 311,809 | |
| Less reimbursement/waiver4 | | | – | | | | – | | | | – | | | | (247,238 | ) | | | – | | | | – | | | | – | | | | (9,356 | ) | | | (9,348 | ) | | | – | |
| Total expenses net of reimbursement/waiver | | | 198,379 | | | | 2,014,880 | | | | 1,426,196 | | | | 1,565,839 | | | | 807,855 | | | | 3,114,216 | | | | 5,157,706 | | | | 283,753 | | | | 4,180,163 | | | | 311,809 | |
| Net Investment Income (Loss) | | | 956,271 | | | | 2,794,281 | | | | 1,551,127 | | | | 2,950,144 | | | | 573,109 | | | | 1,258,732 | | | | (1,133,199 | ) | | | (183,879 | ) | | | (1,163,349 | ) | | | 273,273 | |
| Net Realized and Unrealized Gain (Loss) on | | | | | | | | | | | | | | | | | | | | | | | | | | | | | | | | | | | | | | | | |
| Investments | | | | | | | | | | | | | | | | | | | | | | | | | | | | | | | | | | | | | | | | |
| Net realized gain (loss) on investments (including net realized gain (loss) on foreign currency related transactions) | | | | | | | | | | | | | | | | | | | | | | | | | | | | | | | | | | | | | | | | |
| Options purchased | | | – | | | | – | | | | (76,490 | ) | | | – | | | | – | | | | – | | | | – | | | | – | | | | – | | | | – | |
| Options written | | | – | | | | – | | | | 5,492,971 | | | | – | | | | – | | | | – | | | | – | | | | – | | | | – | | | | – | |
| Futures | | | – | | | | – | | | | – | | | | – | | | | – | | | | – | | | | – | | | | – | | | | – | | | | – | |
| Unaffiliated issuers | | | (210,221 | ) | | | 8,141,987 | | | | 2,535,744 | | | | 5,357,324 | | �� | | 1,788,066 | | | | 16,962,128 | | | | 21,058,953 | | | | 58,890 | | | | 38,493,785 | | | | 992,488 | |
| Affiliated issuers2 | | | – | | | | – | | | | – | | | | – | | | | – | | | | – | | | | – | | | | – | | | | – | | | | – | |
| Capital gain distributions received from underlying funds | | | | | | | | | | | | | | | | | | | | | | | | | | | | | | | | | | | | | | | | |
| Affiliated issuers2 | | | – | | | | – | | | | – | | | | – | | | | – | | | | – | | | | – | | | | – | | | | – | | | | – | |
| Net change in unrealized appreciation (depreciation) on investments (including net unrealized appreciation (depreciation) on foreign currency related transactions) | | | | | | | | | | | | | | | | | | | | | | | | | | | | | | | | | | | | | | | | |
| Options purchased | | | – | | | | – | | | | – | | | | – | | | | – | | | | – | | | | – | | | | – | | | | – | | | | – | |
| Options written | | | – | | | | – | | | | 53,493 | | | | – | | | | – | | | | – | | | | – | | | | – | | | | – | | | | – | |
| Unaffiliated issuers | | | 342,245 | | | | 10,172,228 | | | | (7,855,589 | ) | | | 15,027,570 | | | | 350,570 | | | | 34,211,611 | | | | 87,420,175 | | | | 8,107,216 | | | | (93,866,277 | ) | | | 533,790 | |
| Affiliated issuers2 | | | – | | | | – | | | | – | | | | – | | | | – | | | | – | | | | – | | | | – | | | | – | | | | – | |
| Net Realized and Unrealized Gain (Loss) on Investments | | | 132,024 | | | | 18,314,215 | | | | 150,129 | | | | 20,384,894 | | | | 2,148,636 | | | | 51,173,739 | | | | 108,479,128 | | | | 8,166,106 | | | | (55,372,492 | ) | | | 1,526,278 | |
| Net Increase (Decrease) in Net Assets from Operations | | $ | 1,088,295 | | | $ | 21,108,496 | | | $ | 1,701,256 | | | $ | 23,335,038 | | | $ | 2,711,745 | | | $ | 52,432,471 | | | $ | 107,345,929 | | | $ | 7,982,227 | | | | (56,535,841 | ) | | $ | 1,799,551 | |
*The Statement of Operations presented herein reflect the historical operating results of the Broadview Opportunity Fund for the one–year period October 1, 2018 to September 30, 2019. See Notes 1 and 13 for a discussion of the Fund’s reorganization.
1Disclosure represents the period October 1, 2019 to October 31, 2019. See Notes 1 and 13.
2See Note 12 for information on affiliated issuers.
3See Note 3 for information on expenses.
4See Note 3 for information on these waivers.
See accompanying Notes to Financial Statements.
39
Madison Funds | October 31, 2019
| |
| Statements of Changes in Net Assets |
| | | Conservative Allocation Fund | | | Moderate Allocation Fund | | | Aggressive Allocation Fund | | | Government Money
Market Fund | |
| | | Year Ended
October 31,
2019 | | | Year Ended
October 31,
2018 | | | Year Ended
October 31,
2019 | | | Year Ended
October 31,
2018 | | | Year Ended
October 31,
2019 | | | Year Ended
October 31,
2018 | | | Year Ended
October 31,
2019 | | | Year Ended
October 31,
2018 | |
| Net Assets at beginning of period | | $ | 68,296,655 | | | $ | 74,084,303 | | | $ | 135,277,809 | | | $ | 148,311,927 | | | $ | 61,371,867 | | | $ | 65,553,699 | | | $ | 14,774,271 | | | $ | 15,186,479 | |
| Increase (decrease) in net assets from operations: | | | | | | | | | | | | | | | | | | | | | | | | | | | | | | | | |
| Net investment income | | | 921,969 | | | | 1,050,959 | | | | 1,701,887 | | | | 1,800,483 | | | | 710,416 | | | | 633,902 | | | | 262,297 | | | | 156,093 | |
| Net realized gain (loss) | | | 1,314,205 | | | | 2,250,587 | | | | 3,476,604 | | | | 9,136,151 | | | | 2,534,070 | | | | 5,050,612 | | | | – | | | | (59 | ) |
| Net change in unrealized appreciation (depreciation) | | | 4,261,044 | | | | (4,008,450 | ) | | | 8,314,921 | | | | (11,019,140 | ) | | | 3,147,970 | | | | (5,616,577 | ) | | | – | | | | – | |
| Net increase (decrease) in net assets from operations | | | 6,497,218 | | | | (706,904 | ) | | | 13,493,412 | | | | (82,506 | ) | | | 6,392,456 | | | | 67,937 | | | | 262,297 | | | | 156,034 | |
| Distributions to shareholders from: | | | | | | | | | | | | | | | | | | | | | | | | | | | | | | | | |
| Accumulated earnings (combined net investment income and net realized gains): | | | | | | | | | | | | | | | | | | | | | | | | | | | | | | | | |
| Class A | | | (1,846,529 | ) | | | (2,072,248 | ) | | | (8,683,332 | ) | | | (5,760,085 | ) | | | (4,781,352 | ) | | | (3,027,746 | ) | | | (261,075 | ) | | | (155,442 | ) |
| Class B | | | (183,316 | ) | | | (294,430 | ) | | | (1,253,989 | ) | | | (962,358 | ) | | | (664,087 | ) | | | (515,211 | ) | | | (1,222 | ) | | | (651 | ) |
| Class C | | | (632,431 | ) | | | (805,348 | ) | | | (697,160 | ) | | | (410,130 | ) | | | (193,786 | ) | | | (115,397 | ) | | | – | | | | – | |
| Total distributions | | | (2,662,276 | ) | | | (3,172,026 | ) | | | (10,634,481 | ) | | | (7,132,573 | ) | | | (5,639,225 | ) | | | (3,658,354 | ) | | | (262,297 | ) | | | (156,093 | ) |
| Capital Stock transactions: | | | | | | | | | | | | | | | | | | | | | | | | | | | | | | | | |
| Class A Shares | | | | | | | | | | | | | | | | | | | | | | | | | | | | | | | | |
| Shares sold | | | 4,630,711 | | | | 4,870,811 | | | | 8,705,197 | | | | 9,643,570 | | | | 4,634,404 | | | | 4,766,404 | | | | 6,569,533 | | | | 6,099,988 | |
| Issued to shareholders in reinvestment of distributions | | | 1,844,632 | | | | 2,068,690 | | | | 8,677,765 | | | | 5,754,011 | | | | 4,779,615 | | | | 3,025,407 | | | | 256,983 | | | | 152,770 | |
| Shares redeemed | | | (8,341,766 | ) | | | (7,307,159 | ) | | | (15,412,248 | ) | | | (16,812,923 | ) | | | (6,465,299 | ) | | | (6,375,461 | ) | | | (6,442,674 | ) | | | (6,618,795 | ) |
| Net increase (decrease) from capital stock transactions | | | (1,866,423 | ) | | | (367,658 | ) | | | 1,970,714 | | | | (1,415,342 | ) | | | 2,948,720 | | | | 1,416,350 | | | | 383,842 | | | | (366,037 | ) |
| Class B Shares | | | | | | | | | | | | | | | | | | | | | | | | | | | | | | | | |
| Shares sold | | | 69,418 | | | | 11,815 | | | | 114,510 | | | | 266,037 | | | | 26,662 | | | | 119,659 | | | | 128,594 | | | | 109,456 | |
| Issued to shareholders in reinvestment of distributions | | | 183,316 | | | | 294,407 | | | | 1,253,056 | | | | 961,142 | | | | 664,087 | | | | 515,206 | | | | 1,201 | | | | 644 | |
| Shares redeemed | | | (1,179,846 | ) | | | (1,999,607 | ) | | | (5,278,288 | ) | | | (5,833,118 | ) | | | (2,528,414 | ) | | | (2,631,247 | ) | | | (234,213 | ) | | | (156,212 | ) |
| Net decrease from capital stock transactions | | | (927,112 | ) | | | (1,693,385 | ) | | | (3,910,722 | ) | | | (4,605,939 | ) | | | (1,837,665 | ) | | | (1,996,382 | ) | | | (104,418 | ) | | | (46,112 | ) |
| Class C Shares | | | | | | | | | | | | | | | | | | | | | | | | | | | | | | | | |
| Shares sold | | | 739,881 | | | | 1,303,351 | | | | 368,409 | | | | 646,390 | | | | 163,841 | | | | 192,899 | | | | | | | | | |
| Issued to shareholders in reinvestment of distributions | | | 632,288 | | | | 805,213 | | | | 697,076 | | | | 410,102 | | | | 170,418 | | | | 101,349 | | | | | | | | | |
| Shares redeemed | | | (2,287,930 | ) | | | (1,956,239 | ) | | | (985,726 | ) | | | (854,250 | ) | | | (245,441 | ) | | | (305,631 | ) | | | | | | | | |
| Net decrease from capital stock transactions | | | (915,761 | ) | | | 152,325 | | | | 79,759 | | | | 202,242 | | | | 88,818 | | | | (11,383 | ) | | | | | | | | |
| Total net increase (decrease) from capital stock transactions | | | (3,709,296 | ) | | | (1,908,718 | ) | | | (1,860,249 | ) | | | (5,819,039 | ) | | | 1,199,873 | | | | (591,415 | ) | | | 279,424 | | | | (412,149 | ) |
| Total increase (decrease) in net assets | | | 125,646 | | | | (5,787,648 | ) | | | 998,682 | | | | (13,034,118 | ) | | | 1,953,104 | | | | (4,181,832 | ) | | | 279,424 | | | | (412,208 | ) |
| Net Assets at end of period | | $ | 68,422,301 | | | $ | 68,296,655 | | | $ | 136,276,491 | | | $ | 135,277,809 | | | $ | 63,324,971 | | | $ | 61,371,867 | | | $ | 15,053,695 | | | $ | 14,774,271 | |
| Capital Share transactions: | | | | | | | | | | | | | | | | | | | | | | | | | | | | | | | | |
| Class A Shares | | | | | | | | | | | | | | | | | | | | | | | | | | | | | | | | |
| Shares sold | | | 441,746 | | | | 452,611 | | | | 771,933 | | | | 807,717 | | | | 403,414 | | | | 381,627 | | | | 6,569,533 | | | | 6,099,988 | |
| Issued to shareholders in reinvestment of distributions | | | 182,776 | | | | 192,809 | | | | 841,684 | | | | 485,161 | | | | 462,245 | | | | 245,370 | | | | 256,983 | | | | 152,770 | |
| Shares redeemed | | | (797,312 | ) | | | (680,413 | ) | | | (1,367,131 | ) | | | (1,409,778 | ) | | | (560,847 | ) | | | (512,647 | ) | | | (6,442,674 | ) | | | (6,618,795 | ) |
| Net increase (decrease) in shares outstanding | | | (172,790 | ) | | | (34,993 | ) | | | 246,486 | | | | (116,900 | ) | | | 304,812 | | | | 114,350 | | | | 383,842 | | | | (366,037 | ) |
| Class B Shares | | | | | | | | | | | | | | | | | | | | | | | | | | | | | | | | |
| Shares sold | | | 6,576 | | | | 1,106 | | | | 10,418 | | | | 22,281 | | | | 2,372 | | | | 9,628 | | | | 128,594 | | | | 109,456 | |
| Issued to shareholders in reinvestment of distributions | | | 18,039 | | | | 27,166 | | | | 122,369 | | | | 81,522 | | | | 66,013 | | | | 42,791 | | | | 1,201 | | | | 644 | |
| Shares redeemed | | | (110,639 | ) | | | (185,211 | ) | | | (472,812 | ) | | | (493,201 | ) | | | (225,809 | ) | | | (216,884 | ) | | | (234,213 | ) | | | (156,212 | ) |
| Net decrease in shares outstanding | | | (86,024 | ) | | | (156,939 | ) | | | (340,025 | ) | | | (389,398 | ) | | | (157,424 | ) | | | (164,465 | ) | | | (104,418 | ) | | | (46,112 | ) |
| Class C Shares | | | | | | | | | | | | | | | | | | | | | | | | | | | | | | | | |
| Shares sold | | | 69,489 | | | | 120,563 | | | | 32,956 | | | | 54,349 | | | | 14,939 | | | | 15,805 | | | | | | | | | |
| Issued to shareholders in reinvestment of distributions | | | 62,127 | | | | 74,267 | | | | 68,007 | | | | 34,754 | | | | 16,923 | | | | 8,411 | | | | | | | | | |
| Shares redeemed | | | (212,730 | ) | | | (181,309 | ) | | | (87,987 | ) | | | (72,046 | ) | | | (22,481 | ) | | | (25,159 | ) | | | | | | | | |
| Net increase (decrease) in shares outstanding | | | (81,114 | ) | | | 13,521 | | | | 12,976 | | | | 17,057 | | | | 9,381 | | | | (943 | ) | | | | | | | | |
See accompanying Notes to Financial Statements.
40
Madison Funds | October 31, 2019
| |
| Statements of Changes in Net Assets |
| | | Tax–Free Virginia Fund | | | Tax–Free National Fund | | | High Quality Bond Fund | | | Core Bond Fund | |
| | | Year Ended
October 31,
2019 | | | Year Ended
October 31,
2018 | | | Year Ended
October 31,
2019 | | | Year Ended
October 31,
2018 | | | Year Ended
October 31,
2019 | | | Year Ended
October 31,
2018 | | | Year Ended
October 31,
2019 | | | Year Ended
October 31,
2018 | |
| Net Assets at beginning of period | | $ | 20,868,463 | | | $ | 21,866,239 | | | $ | 23,324,867 | | | $ | 25,293,667 | | | $ | 89,253,004 | | | $ | 100,536,237 | | | $ | 170,866,494 | | | $ | 207,713,774 | |
| Increase (decrease) in net assets from operations: | | | | | | | | | | | | | | | | | | | | | | | | | | | | | | | | |
| Net investment income | | | 426,801 | | | | 449,410 | | | | 523,523 | | | | 540,900 | | | | 1,691,642 | | | | 1,567,545 | | | | 4,056,715 | | | | 4,584,350 | |
| Net realized gain (loss) | | | (3,809 | ) | | | 1,032 | | | | 74,305 | | | | 127,563 | | | | 44,442 | | | | (210,317 | ) | | | 895,368 | | | | (111,964 | ) |
| Net change in unrealized appreciation (depreciation) | | | 1,183,550 | | | | (778,928 | ) | | | 1,276,817 | | | | (1,036,885 | ) | | | 3,857,883 | | | | (2,375,312 | ) | | | 11,158,328 | | | | (8,828,642 | ) |
| Net increase (decrease) in net assets from operations | | | 1,606,542 | | | | (328,486 | ) | | | 1,874,645 | | | | (368,422 | ) | | | 5,593,967 | | | | (1,018,084 | ) | | | 16,110,411 | | | | (4,356,256 | ) |
| Distributions to shareholders from: | | | | | | | | | | | | | | | | | | | | | | | | | | | | | | | | |
| Accumulated earnings (combined net investment income and net realized gains): | | | | | | | | | | | | | | | | | | | | | | | | | | | | | | | | |
| Class A | | | | | | | | | | | | | | | | | | | | | | | | | | | (730,291 | ) | | | (760,432 | ) |
| Class B | | | | | | | | | | | | | | | | | | | | | | | | | | | (23,967 | ) | | | (28,476 | ) |
| Class Y | | | (427,160 | ) | | | (449,377 | ) | | | (651,384 | ) | | | (617,794 | ) | | | (1,708,613 | ) | | | (1,519,170 | ) | | | (3,487,446 | ) | | | (4,146,903 | ) |
| Class R6 | | | | | | | | | | | | | | | | | | | | | | | | | | | (48,207 | ) | | | (44,252 | ) |
| Total distributions | | | (427,160 | ) | | | (449,377 | ) | | | (651,384 | ) | | | (617,794 | ) | | | (1,708,613 | ) | | | (1,519,170 | ) | | | (4,289,911 | ) | | | (4,980,063 | ) |
| Capital Stock transactions: | | | | | | | | | | | | | | | | | | | | | | | | | | | | | | | | |
| Class A Shares | | | | | | | | | | | | | | | | | | | | | | | | | | | | | | | | |
| Shares sold | | | | | | | | | | | | | | | | | | | | | | | | | | | 932,174 | | | | 1,637,165 | |
| Issued to shareholders in reinvestment of distributions | | | | | | | | | | | | | | | | | | | | | | | | | | | 725,446 | | | | 755,268 | |
| Shares redeemed | | | | | | | | | | | | | | | | | | | | | | | | | | | (4,530,261 | ) | | | (4,972,897 | ) |
| Net decrease from capital stock transactions | | | | | | | | | | | | | | | | | | | | | | | | | | | (2,872,641 | ) | | | (2,580,464 | ) |
| Class B Shares | | | | | | | | | | | | | | | | | | | | | | | | | | | | | | | | |
| Shares sold | | | | | | | | | | | | | | | | | | | | | | | | | | | – | | | | 5,263 | |
| Issued to shareholders in reinvestment of distributions | | | | | | | | | | | | | | | | | | | | | | | | | | | 23,967 | | | | 28,472 | |
| Shares redeemed | | | | | | | | | | | | | | | | | | | | | | | | | | | (320,593 | ) | | | (484,911 | ) |
| Net decrease from capital stock transactions | | | | | | | | | | | | | | | | | | | | | | | | | | | (296,626 | ) | | | (451,176 | ) |
| Class Y Shares | | | | | | | | | | | | | | | | | | | | | | | | | | | | | | | | |
| Shares sold | | | 613,715 | | | | 288,490 | | | | 392,709 | | | | 405,496 | | | | 18,094,324 | | | | 16,172,950 | | | | 946,001 | | | | 2,790,954 | |
| Issued to shareholders in reinvestment of distributions | | | 415,800 | | | | 437,013 | | | | 576,901 | | | | 545,794 | | | | 1,590,730 | | | | 1,414,930 | | | | 864,191 | | | | 938,795 | |
| Shares redeemed | | | (852,021 | ) | | | (945,416 | ) | | | (1,711,113 | ) | | | (1,933,874 | ) | | | (22,416,818 | ) | | | (26,333,859 | ) | | | (28,416,001 | ) | | | (28,096,547 | ) |
| Net increase (decrease) from capital stock transactions | | | 177,494 | | | | (219,913 | ) | | | (741,503 | ) | | | (982,584 | ) | | | (2,731,764 | ) | | | (8,745,979 | ) | | | (26,605,809 | ) | | | (24,366,798 | ) |
| Class R6 Shares | | | | | | | | | | | | | | | | | | | | | | | | | | | | | | | | |
| Shares sold | | | | | | | | | | | | | | | | | | | | | | | | | | | 375,806 | | | | 224,358 | |
| Issued to shareholders in reinvestment of distributions | | | | | | | | | | | | | | | | | | | | | | | | | | | 48,207 | | | | 44,251 | |
| Shares redeemed | | | | | | | | | | | | | | | | | | | | | | | | | | | (194,911 | ) | | | (381,132 | ) |
| Net increase (decrease) from capital stock transactions | | | | | | | | | | | | | | | | | | | | | | | | | | | 229,102 | | | | (112,523 | ) |
| Total net increase (decrease) from capital stock transactions | | | 177,494 | | | | (219,913 | ) | | | (741,503 | ) | | | (982,584 | ) | | | (2,731,764 | ) | | | (8,745,979 | ) | | | (29,545,974 | ) | | | (27,510,961 | ) |
| Total increase (decrease) in net assets | | | 1,356,876 | | | | (997,776 | ) | | | 481,758 | | | | (1,968,800 | ) | | | 1,153,590 | | | | (11,283,233 | ) | | | (17,725,474 | ) | | | (36,847,280 | ) |
| Net Assets at end of period | | $ | 22,225,339 | | | $ | 20,868,463 | | | $ | 23,806,625 | | | $ | 23,324,867 | | | $ | 90,406,594 | | | $ | 89,253,004 | | | $ | 153,141,020 | | | $ | 170,866,494 | |
| Capital Share transactions: | | | | | | | | | | | | | | | | | | | | | | | | | | | | | | | | |
| Class A Shares | | | | | | | | | | | | | | | | | | | | | | | | | | | | | | | | |
| Shares sold | | | | | | | | | | | | | | | | | | | | | | | | | | | 94,058 | | | | 166,942 | |
| Issued to shareholders in reinvestment of distributions | | | | | | | | | | | | | | | | | | | | | | | | | | | 72,796 | | | | 77,327 | |
| Shares redeemed | | | | | | | | | | | | | | | | | | | | | | | | | | | (456,585 | ) | | | (508,290 | ) |
| Net decrease in shares outstanding | | | | | | | | | | | | | | | | | | | | | | | | | | | (289,731 | ) | | | (264,021 | ) |
| Class B Shares | | | | | | | | | | | | | | | | | | | | | | | | | | | | | | | | |
| Shares sold | | | | | | | | | | | | | | | | | | | | | | | | | | | – | | | | 525 | |
| Issued to shareholders in reinvestment of distributions | | | | | | | | | | | | | | | | | | | | | | | | | | | 2,407 | | | | 2,912 | |
| Shares redeemed | | | | | | | | | | | | | | | | | | | | | | | | | | | (32,218 | ) | | | (49,651 | ) |
| Net decrease in shares outstanding | | | | | | | | | | | | | | | | | | | | | | | | | | | (29,811 | ) | | | (46,214 | ) |
| Class Y Shares | | | | | | | | | | | | | | | | | | | | | | | | | | | | | | | | |
| Shares sold | | | 53,039 | | | | 25,439 | | | | 36,221 | | | | 38,207 | | | | 1,666,543 | | | | 1,502,579 | | | | 95,330 | | | | 281,817 | |
| Issued to shareholders in reinvestment of distributions | | | 36,109 | | | | 38,806 | | | | 53,770 | | | | 51,536 | | | | 145,584 | | | | 131,943 | | | | 86,973 | | | | 96,408 | |
| Shares redeemed | | | (73,730 | ) | | | (83,715 | ) | | | (157,964 | ) | | | (181,793 | ) | | | (2,060,802 | ) | | | (2,451,841 | ) | | | (2,894,792 | ) | | | (2,883,404 | ) |
| Net increase (decrease) in shares outstanding | | | 15,418 | | | | (19,470 | ) | | | (67,973 | ) | | | (92,050 | ) | | | (248,675 | ) | | | (817,319 | ) | | | (2,712,489 | ) | | | (2,505,179 | ) |
| Class R6 Shares | | | | | | | | | | | | | | | | | | | | | | | | | | | | | | | | |
| Shares sold | | | | | | | | | | | | | | | | | | | | | | | | | | | 37,558 | | | | 22,790 | |
| Issued to shareholders in reinvestment of distributions | | | | | | | | | | | | | | | | | | | | | | | | | | | 4,807 | | | | 4,519 | |
| Shares redeemed | | | | | | | | | | | | | | | | | | | | | | | | | | | (19,848 | ) | | | (38,784 | ) |
| Net increase (decrease) in shares outstanding | | | | | | | | | | | | | | | | | | | | | | | | | | | 22,517 | | | | (11,475 | ) |
See accompanying Notes to Financial Statements.
41
Madison Funds | October 31, 2019
| |
| Statements of Changes in Net Assets |
| | | Corporate Bond Fund | | | High Income Fund | | | Diversified Income Fund | | | Covered Call &
Equity Income Fund | |
| | | Year Ended
October 31,
2019 | | | Year Ended
October 31,
2018 | | | Year Ended
October 31,
2019 | | | Year Ended
October 31,
2018 | | | Year Ended
October 31,
2019 | | | Year Ended
October 31,
2018 | | | Year Ended
October 31,
2019 | | | Year Ended
October 31,
2018 | |
| Net Assets at beginning of period | | $ | 19,667,812 | | | $ | 21,772,545 | | | $ | 19,677,553 | | | $ | 23,600,011 | | | $ | 156,606,322 | | | $ | 165,668,561 | | | $ | 134,637,439 | | | $ | 128,242,884 | |
| Increase (decrease) in net assets from operations: | | | | | | | | | | | | | | | | | | | | | | | | | | | | | | | | |
| Net investment income | | | 488,281 | | | | 616,409 | | | | 956,271 | | | | 1,082,204 | | | | 2,794,281 | | | | 2,587,951 | | | | 1,551,127 | | | | 797,206 | |
| Net realized gain (loss) | | | (49,711 | ) | | | 4,347 | | | | (210,221 | ) | | | (246,417 | ) | | | 8,141,987 | | | | 12,158,875 | | | | 7,952,225 | | | | 10,664,208 | |
| Net change in unrealized appreciation (depreciation) | | | 1,633,884 | | | | (1,282,370 | ) | | | 342,245 | | | | (1,168,687 | ) | | | 10,172,228 | | | | (9,050,511 | ) | | | (7,802,096 | ) | | | (6,977,793 | ) |
| Net increase (decrease) in net assets from operations | | | 2,072,454 | | | | (661,614 | ) | | | 1,088,295 | | | | (332,900 | ) | | | 21,108,496 | | | | 5,696,315 | | | | 1,701,256 | | | | 4,483,621 | |
| Distributions to shareholders from: | | | | | | | | | | | | | | | | | | | | | | | | | | | | | | | | |
| Accumulated earnings (combined net investment income and net realized gains): | | | | | | | | | | | | | | | | | | | | | | | | | | | | | | | | |
| Class A | | | | | | | | | | | (863,416 | ) | | | (983,684 | ) | | | (12,714,306 | ) | | | (4,474,942 | ) | | | (1,400,368 | ) | | | (1,320,812 | ) |
| Class B | | | | | | | | | | | (44,006 | ) | | | (54,287 | ) | | | (922,436 | ) | | | (303,540 | ) | | | | | | | | |
| Class C | | | | | | | | | | | | | | | | | | | (1,292,945 | ) | | | (380,579 | ) | | | (879,736 | ) | | | (909,031 | ) |
| Class Y | | | (493,497 | ) | | | (794,793 | ) | | | (49,642 | ) | | | (44,583 | ) | | | | | | | | | | | (9,698,583 | ) | | | (7,782,141 | ) |
| Class R6 | | | | | | | | | | | | | | | | | | | | | | | | | | | (202,718 | ) | | | (205,832 | ) |
| Total distributions | | | (493,497 | ) | | | (794,793 | ) | | | (957,064 | ) | | | (1,082,554 | ) | | | (14,929,687 | ) | | | (5,159,061 | ) | | | (12,181,405 | ) | | | (10,217,816 | ) |
| Capital Stock transactions: | | | | | | | | | | | | | | | | | | | | | | | | | | | | | | | | |
| Class A Shares | | | | | | | | | | | | | | | | | | | | | | | | | | | | | | | | |
| Shares sold | | | | | | | | | | | 566,943 | | | | 812,573 | | | | 17,730,639 | | | | 8,912,343 | | | | 846,183 | | | | 2,321,061 | |
| Issued to shareholders in reinvestment of distributions | | | | | | | | | | | 840,112 | | | | 954,222 | | | | 12,650,413 | | | | 4,430,935 | | | | 1,336,535 | | | | 1,257,313 | |
| Shares redeemed | | | | | | | | | | | (2,507,613 | ) | | | (4,022,376 | ) | | | (27,171,103 | ) | | | (20,533,996 | ) | | | (3,214,108 | ) | | | (3,656,688 | ) |
| Net increase (decrease) from capital stock transactions | | | | | | | | | | | (1,100,558 | ) | | | (2,255,581 | ) | | | 3,209,949 | | | | (7,190,718 | ) | | | (1,031,390 | ) | | | (78,314 | ) |
| Class B Shares | | | | | | | | | | | | | | | | | | | | | | | | | | | | | | | | |
| Shares sold | | | | | | | | | | | | | | | | | | | 101,261 | | | | 83,167 | | | | | | | | | |
| Issued to shareholders in reinvestment of distributions | | | | | | | | | | | 40,837 | | | | 48,450 | | | | 922,436 | | | | 303,538 | | | | | | | | | |
| Shares redeemed | | | | | | | | | | | (167,457 | ) | | | (331,882 | ) | | | (2,546,255 | ) | | | (2,293,806 | ) | | | | | | | | |
| Net decrease from capital stock transactions | | | | | | | | | | | (126,620 | ) | | | (283,432 | ) | | | (1,522,558 | ) | | | (1,907,101 | ) | | | | | | | | |
| Class C Shares | | | | | | | | | | | | | | | | | | | | | | | | | | | | | | | | |
| Shares sold | | | | | | | | | | | | | | | | | | | 1,086,683 | | | | 1,014,521 | | | | 617,858 | | | | 1,925,097 | |
| Issued to shareholders in reinvestment of distributions | | | | | | | | | | | | | | | | | | | 1,292,945 | | | | 380,579 | | | | 749,952 | | | | 776,536 | |
| Shares redeemed | | | | | | | | | | | | | | | | | | | (1,467,306 | ) | | | (1,896,774 | ) | | | (1,952,758 | ) | | | (5,874,256 | ) |
| Net increase (decrease) from capital stock transactions | | | | | | | | | | | | | | | | | | | 912,322 | | | | (501,674 | ) | | | (584,948 | ) | | | (3,172,623 | ) |
| Class Y Shares | | | | | | | | | | | | | | | | | | | | | | | | | | | | | | | | |
| Shares sold | | | 394,275 | | | | 353,932 | | | | 282,856 | | | | 2,324,220 | | | | | | | | | | | | 60,696,062 | | | | 66,196,879 | |
| Issued to shareholders in reinvestment of distributions | | | 45,001 | | | | 50,657 | | | | 49,642 | | | | 44,583 | | | | | | | | | | | | 9,567,385 | | | | 7,680,318 | |
| Shares redeemed | | | (6,587,968 | ) | | | (1,052,915 | ) | | | (222,029 | ) | | | (2,336,794 | ) | | | | | | | | | | | (66,623,709 | ) | | | (58,441,647 | ) |
| Net increase (decrease) from capital stock transactions | | | (6,148,692 | ) | | | (648,326 | ) | | | 110,469 | | | | 32,009 | | | | | | | | | | | | 3,639,738 | | | | 15,435,550 | |
| Class R6 Shares | | | | | | | | | | | | | | | | | | | | | | | | | | | | | | | | |
| Shares sold | | | | | | | | | | | | | | | | | | | | | | | | | | | 353,149 | | | | 252,652 | |
| Issued to shareholders in reinvestment of distributions | | | | | | | | | | | | | | | | | | | | | | | | | | | 202,717 | | | | 205,832 | |
| Shares redeemed | | | | | | | | | | | | | | | | | | | | | | | | | | | (393,774 | ) | | | (514,347 | ) |
| Net increase (decrease) from capital stock transactions | | | | | | | | | | | | | | | | | | | | | | | | | | | 162,092 | | | | (55,863 | ) |
| Total net increase (decrease) from capital stock transactions | | | (6,148,692 | ) | | | (648,326 | ) | | | (1,116,709 | ) | | | (2,507,004 | ) | | | 2,599,713 | | | | (9,599,493 | ) | | | 2,185,492 | | | | 12,128,750 | |
| Total increase (decrease) in net assets | | | (4,569,735 | ) | | | (2,104,733 | ) | | | (985,478 | ) | | | (3,922,458 | ) | | | 8,778,522 | | | | (9,062,239 | ) | | | (8,294,657 | ) | | | 6,394,555 | |
| Net Assets at end of period | | $ | 15,098,077 | | | $ | 19,667,812 | | | $ | 18,692,075 | | | $ | 19,677,553 | | | $ | 165,384,844 | | | $ | 156,606,322 | | | $ | 126,342,782 | | | $ | 134,637,439 | |
See accompanying Notes to Financial Statements.
42
Madison Funds | October 31, 2019
| |
| Statements of Changes in Net Assets |
| Continued from previous page | | Corporate Bond Fund | | | High Income Fund | | | Diversified Income Fund | | | Covered Call & Equity
Income Fund | |
| | | Year Ended
October 31,
2019 | | | Year Ended
October 31,
2018 | | | Year Ended
October 31,
2019 | | | Year Ended
October 31,
2018 | | | Year Ended
October 31,
2019 | | | Year Ended
October 31,
2018 | | | Year Ended
October 31,
2019 | | | Year Ended
October 31,
2018 | |
| Capital Share transactions: | | | | | | | | | | | | | | | | | | | | | | | | | | | | | | | | |
| Class A Shares | | | | | | | | | | | | | | | | | | | | | | | | | | | | | | | | |
| Shares sold | | | | | | | | | | | 97,382 | | | | 134,574 | | | | 1,157,022 | | | | 555,056 | | | | 103,863 | | | | 257,892 | |
| Issued to shareholders in reinvestment of distributions | | | | | | | | | | | 144,456 | | | | 159,514 | | | | 877,125 | | | | 275,662 | | | | 174,084 | | | | 142,018 | |
| Shares redeemed | | | | | | | | | | | (429,426 | ) | | | (669,845 | ) | | | (1,706,995 | ) | | | (1,275,062 | ) | | | (404,564 | ) | | | (408,431 | ) |
| Net increase (decrease) in shares outstanding | | | | | | | | | | | (187,588 | ) | | | (375,757 | ) | | | 327,152 | | | | (444,344 | ) | | | (126,617 | ) | | | (8,521 | ) |
| Class B Shares | | | | | | | | | | | | | | | | | | | | | | | | | | | | | | | | |
| Shares sold | | | | | | | | | | | | | | | | | | | 6,345 | | | | 5,011 | | | | | | | | | |
| Issued to shareholders in reinvestment of distributions | | | | | | | | | | | 6,817 | | | | 7,864 | | | | 64,048 | | | | 18,748 | | | | | | | | | |
| Shares redeemed | | | | | | | | | | | (28,020 | ) | | | (53,593 | ) | | | (160,860 | ) | | | (142,278 | ) | | | | | | | | |
| Net decrease in shares outstanding | | | | | | | | | | | (21,203 | ) | | | (45,729 | ) | | | (90,467 | ) | | | (118,519 | ) | | | | | | | | |
| Class C Shares | | | | | | | | | | | | | | | | | | | | | | | | | | | | | | | | |
| Shares sold | | | | | | | | | | | | | | | | | | | 68,334 | | | | 63,061 | | | | 81,745 | | | | 226,968 | |
| Issued to shareholders in reinvestment of distributions | | | | | | | | | | | | | | | | | | | 89,755 | | | | 23,524 | | | | 104,080 | | | | 92,276 | |
| Shares redeemed | | | | | | | | | | | | | | | | | | | (92,798 | ) | | | (117,580 | ) | | | (263,219 | ) | | | (691,135 | ) |
| Net increase (decrease) in shares outstanding | | | | | | | | | | | | | | | | | | | 65,291 | | | | (30,995 | ) | | | (77,394 | ) | | | (371,891 | ) |
| Class Y Shares | | | | | | | | | | | | | | | | | | | | | | | | | | | | | | | | |
| Shares sold | | | 33,976 | | | | 30,560 | | | | 49,821 | | | | 396,528 | | | | | | | | | | | | 7,397,947 | | | | 7,242,647 | |
| Issued to shareholders in reinvestment of distributions | | | 3,903 | | | | 4,493 | | | | 8,708 | | | | 7,598 | | | | | | | | | | | | 1,213,509 | | | | 847,955 | |
| Shares redeemed | | | (592,503 | ) | | | (94,818 | ) | | | (38,847 | ) | | | (396,862 | ) | | | | | | | | | | | (8,165,153 | ) | | | (6,441,910 | ) |
| Net increase (decrease) in shares outstanding | | | (554,624 | ) | | | (59,765 | ) | | | 19,682 | | | | 7,264 | | | | | | | | | | | | 446,303 | | | | 1,648,692 | |
| Class R6 Shares | | | | | | | | | | | | | | | | | | | | | | | | | | | | | | | | |
| Shares sold | | | | | | | | | | | | | | | | | | | | | | | | | | | 42,881 | | | | 27,308 | |
| Issued to shareholders in reinvestment of distributions | | | | | | | | | | | | | | | | | | | | | | | | | | | 25,444 | | | | 22,558 | |
| Shares redeemed | | | | | | | | | | | | | | | | | | | | | | | | | | | (46,854 | ) | | | (56,319 | ) |
| Net increase (decrease) in shares outstanding | | | | | | | | | | | | | | | | | | | | | | | | | | | 21,471 | | | | (6,453 | ) |
See accompanying Notes to Financial Statements.
43
Madison Funds | October 31, 2019
| |
| Statements of Changes in Net Assets |
| | | Dividend Income Fund | | | Large Cap Value Fund | | | Investors Fund | | | Mid Cap Fund | |
| | | Year Ended
October 31,
2019 | | | Year Ended
October 31,
2018 | | | Year Ended
October 31,
2019 | | | Year Ended
October 31,
2018 | | | Year Ended
October 31,
2019 | | | Year Ended
October 31,
2018 | | | Year Ended
October 31,
2019 | | | Year Ended
October 31,
2018 | |
| Net Assets at beginning of period | | $ | 111,456,654 | | | $ | 107,411,281 | | | $ | 84,779,821 | | | $ | 91,027,054 | | | $ | 293,903,580 | | | $ | 307,152,504 | | | $ | 426,011,773 | | | $ | 344,426,344 | |
| Increase (decrease) in net assets from operations: | | | | | | | | | | | | | | | | | | | | | | | | | | | | | | | | |
| Net investment income (loss) | | | 2,950,144 | | | | 1,968,552 | | | | 573,109 | | | | 795,943 | | | | 1,258,732 | | | | 1,236,022 | | | | (1,133,199 | ) | | | (584,505 | ) |
| Net realized gain | | | 5,357,324 | | | | 11,357,800 | | | | 1,788,066 | | | | 7,671,685 | | | | 16,962,128 | | | | 41,088,332 | | | | 21,058,953 | | | | 30,302,539 | |
| Net change in unrealized appreciation (depreciation) | �� | | 15,027,570 | | | | (5,765,260 | ) | | | 350,570 | | | | (7,096,462 | ) | | | 34,211,611 | | | | (16,758,589 | ) | | | 87,420,175 | | | | (4,917,263 | ) |
| Net increase in net assets from operations | | | 23,335,038 | | | | 7,561,092 | | | | 2,711,745 | | | | 1,371,166 | | | | 52,432,471 | | | | 25,565,765 | | | | 107,345,929 | | | | 24,800,771 | |
| Distributions to shareholders from: | | | | | | | | | | | | | | | | | | | | | | | | | | | | | | | | |
| Accumulated earnings (combined net investment income and net realized gains): | | | | | | | | | | | | | | | | | | | | | | | | | | | | | | | | |
| Class A | | | | | | | | | | | (6,982,002 | ) | | | (7,041,494 | ) | | | (11,433,615 | ) | | | (4,273,399 | ) | | | (4,084,319 | ) | | | (2,205,515 | ) |
| Class B | | | | | | | | | | | (264,799 | ) | | | (317,803 | ) | | | | | | | | | | | (159,037 | ) | | | (110,824 | ) |
| Class Y | | | (14,038,658 | ) | | | (4,430,522 | ) | | | (1,215,273 | ) | | | (2,026,373 | ) | | | (30,207,013 | ) | | | (12,731,568 | ) | | | (24,096,901 | ) | | | (9,665,189 | ) |
| Class R6 | | | | | | | | | | | | | | | | | | | (1,012,359 | ) | | | (408,963 | ) | | | (759,093 | ) | | | (412,317 | ) |
| Total distributions | | | (14,038,658 | ) | | | (4,430,522 | ) | | | (8,462,074 | ) | | | (9,385,670 | ) | | | (42,652,987 | ) | | | (17,413,930 | ) | | | (29,099,350 | ) | | | (12,393,845 | ) |
| Capital Stock transactions: | | | | | | | | | | | | | | | | | | | | | | | | | | | | | | | | |
| Class A Shares | | | | | | | | | | | | | | | | | | | | | | | | | | | | | | | | |
| Shares sold | | | | | | | | | | | 1,592,817 | | | | 2,200,371 | | | | 3,399,429 | | | | 2,595,018 | | | | 3,332,918 | | | | 3,138,196 | |
| Issued to shareholders in reinvestment of distributions | | | | | | | | | | | 6,966,804 | | | | 7,023,455 | | | | 11,419,345 | | | | 4,267,912 | | | | 4,071,914 | | | | 2,197,702 | |
| Shares redeemed | | | | | | | | | | | (7,588,312 | ) | | | (8,670,002 | ) | | | (8,722,495 | ) | | | (8,894,301 | ) | | | (9,524,526 | ) | | | (7,512,316 | ) |
| Net increase (decrease) from capital stock transactions | | | | | | | | | | | 971,309 | | | | 553,824 | | | | 6,096,279 | | | | (2,031,371 | ) | | | (2,119,694 | ) | | | (2,176,418 | ) |
| Class B Shares | | | | | | | | | | | | | | | | | | | | | | | | | | | | | | | | |
| Shares sold | | | | | | | | | | | 13,055 | | | | 14,538 | | | | | | | | | | | | 82,247 | | | | – | |
| Issued to shareholders in reinvestment of distributions | | | | | | | | | | | 264,799 | | | | 317,803 | | | | | | | | | | | | 159,036 | | | | 110,823 | |
| Shares redeemed | | | | | | | | | | | (646,029 | ) | | | (843,230 | ) | | | | | | | | | | | (580,466 | ) | | | (843,939 | ) |
| Net decrease from capital stock transactions | | | | | | | | | | | (368,175 | ) | | | (510,889 | ) | | | | | | | | | | | (339,183 | ) | | | (733,116 | ) |
Class Y Shares Shares sold | | | 117,583,727 | | | | 19,309,096 | | | | 619,314 | | | | 8,489,943 | | | | 48,882,088 | | | | 17,138,404 | | | | 153,030,925 | | | | 123,566,228 | |
| Issued to shareholders in reinvestment of distributions | | | 13,814,254 | | | | 4,378,116 | | | | 1,206,859 | | | | 2,023,931 | | | | 29,670,932 | | | | 12,573,624 | | | | 17,448,020 | | | | 8,380,187 | |
| Shares redeemed | | | (31,425,695 | ) | | | (22,772,409 | ) | | | (16,023,542 | ) | | | (8,789,538 | ) | | | (50,187,658 | ) | | | (48,921,087 | ) | | | (122,223,748 | ) | | | (60,447,381 | ) |
| Net increase (decrease) from capital stock transactions | | | 99,972,286 | | | | 914,803 | | | | (14,197,369 | ) | | | 1,724,336 | | | | 28,365,362 | | | | (19,209,059 | ) | | | 48,255,197 | | | | 71,499,034 | |
Class R6 Shares Shares sold | | | | | | | | | | | | | | | | | | | 1,065,095 | | | | 1,065,585 | | | | 42,215,184 | | | | 1,655,582 | |
| Issued to shareholders in reinvestment of distributions | | | | | | | | | | | | | | | | | | | 1,012,359 | | | | 408,963 | | | | 759,093 | | | | 412,318 | |
| Shares redeemed | | | | | | | | | | | | | | | | | | | (1,239,548 | ) | | | (1,634,877 | ) | | | (5,864,450 | ) | | | (1,478,897 | ) |
| Net increase (decrease) from capital stock transactions | | | | | | | | | | | | | | | | | | | 837,906 | | | | (160,329 | ) | | | 37,109,827 | | | | 589,003 | |
| Total net increase (decrease) from capital stock transactions | | | 99,972,286 | | | | 914,803 | | | | (13,594,235 | ) | | | 1,767,271 | | | | 35,299,547 | | | | (21,400,759 | ) | | | 82,906,147 | | | | 69,178,503 | |
| Total increase (decrease) in net assets | | | 109,268,666 | | | | 4,045,373 | | | | (19,344,564 | ) | | | (6,247,233 | ) | | | 45,079,031 | | | | (13,248,924 | ) | | | 161,152,726 | | | | 81,585,429 | |
| Net Assets at end of period | | $ | 220,725,320 | | | $ | 111,456,654 | | | $ | 65,435,257 | | | $ | 84,779,821 | | | $ | 338,982,611 | | | $ | 293,903,580 | | | $ | 587,164,499 | | | $ | 426,011,773 | |
| Capital Share transactions: | | | | | | | | | | | | | | | | | | | | | | | | | | | | | | | | |
| Class A Shares | | | | | | | | | | | | | | | | | | | | | | | | | | | | | | | | |
| Shares sold | | | | | | | | | | | 125,695 | | | | 146,743 | | | | 153,395 | | | | 112,069 | | | | 336,847 | | | | 321,323 | |
| Issued to shareholders in reinvestment of distributions | | | | | | | | | | | 634,499 | | | | 477,461 | | | | 606,766 | | | | 186,209 | | | | 484,165 | | | | 231,825 | |
| Shares redeemed | | | | | | | | | | | (594,010 | ) | | | (572,832 | ) | | | (392,871 | ) | | | (379,434 | ) | | | (943,776 | ) | | | (771,122 | ) |
| Net increase (decrease) in shares outstanding | | | | | | | | | | | 166,184 | | | | 51,372 | | | | 367,290 | | | | (81,156 | ) | | | (122,764 | ) | | | (217,974 | ) |
| Class B Shares | | | | | | | | | | | | | | | | | | | | | | | | | | | | | | | | |
| Shares sold | | | | | | | | | | | 1,065 | | | | 973 | | | | | | | | | | | | 10,104 | | | | – | |
| Issued to shareholders in reinvestment of distributions | | | | | | | | | | | 24,771 | | | | 22,116 | | | | | | | | | | | | 23,596 | | | | 14,208 | |
| Shares redeemed | | | | | | | | | | | (52,637 | ) | | | (57,832 | ) | | | | | | | | | | | (74,890 | ) | | | (105,071 | ) |
| Net decrease in shares outstanding | | | | | | | | | | | (26,801 | ) | | | (34,743 | ) | | | | | | | | | | | (41,190 | ) | | | (90,863 | ) |
| Class Y Shares | | | | | | | | | | | | | | | | | | | | | | | | | | | | | | | | |
| Shares sold | | | 4,444,480 | | | | 714,335 | | | | 52,136 | | | | 565,661 | | | | 2,216,256 | | | | 728,550 | | | | 14,973,859 | | | | 11,740,600 | |
| Issued to shareholders in reinvestment of distributions | | | 590,672 | | | | 164,119 | | | | 110,115 | | | | 137,776 | | | | 1,574,890 | | | | 548,109 | | | | 1,973,758 | | | | 846,483 | |
| Shares redeemed | | | (1,178,168 | ) | | | (855,354 | ) | | | (1,250,938 | ) | | | (588,744 | ) | | | (2,271,577 | ) | | | (2,087,227 | ) | | | (11,723,889 | ) | | | (5,959,973 | ) |
| Net increase (decrease) in shares outstanding | | | 3,856,984 | | | | 23,100 | | | | (1,088,687 | ) | | | 114,693 | | | | 1,519,569 | | | | (810,568 | ) | | | 5,223,728 | | | | 6,627,110 | |
| Class R6 Shares | | | | | | | | | | | | | | | | | | | | | | | | | | | | | | | | |
| Shares sold | | | | | | | | | | | | | | | | | | | 47,813 | | | | 45,196 | | | | 3,826,504 | | | | 157,299 | |
| Issued to shareholders in reinvestment of distributions | | | | | | | | | | | | | | | | | | | 53,310 | | | | 17,742 | | | | 83,970 | | | | 40,864 | |
| Shares redeemed | | | | | | | | | | | | | | | | | | | (53,445 | ) | | | (69,857 | ) | | | (523,737 | ) | | | (142,730 | ) |
| Net increase (decrease) in shares outstanding | | | | | | | | | | | | | | | | | | | 47,678 | | | | (6,919 | ) | | | 3,386,737 | | | | 55,433 | |
See accompanying Notes to Financial Statements.
44
Madison Funds | October 31, 2019
| |
| Statements of Changes in Net Assets |
| | | Small Cap Fund | | International Stock Fund | |
| | | Period Ended
October 31,
20191 | | | Period Ended
September 30,
2019* | | | Year Ended
September 30,
2018* | | | Year Ended
October 31,
2019 | | | Year Ended
October 31,
2018 | |
| Net Assets at beginning of period | | $ | 278,243,606 | | | $ | 543,960,603 | | | $ | 611,730,277 | | | $ | 19,953,347 | | | $ | 31,812,695 | |
| Increase (decrease) in net assets from operations: |
| Net investment income (loss) | | | (183,879 | ) | | | (1,163,349 | ) | | | (3,304,833 | ) | | | 273,273 | | | | 291,263 | |
| Net realized gain | | | 58,890 | | | | 38,493,785 | | | | 83,867,641 | | | | 992,488 | | | | 3,357,235 | |
| Net change in unrealized appreciation (depreciation) | | | 8,107,216 | | | | (93,866,277 | ) | | | 2,338,916 | | | | 533,790 | | | | (4,918,893 | ) |
| Net increase (decrease) in net assets from operations | | | 7,982,227 | | | | (56,535,841 | ) | | | 82,901,724 | | | | 1,799,551 | | | | (1,270,395 | ) |
| Distributions to shareholders from: |
| Accumulated earnings (combined net investment income and net realized gains): |
| Class A | | | – | | | | – | | | | – | | | | (760,503 | ) | | | (175,256 | ) |
| Class B | | | – | | | | – | | | | – | | | | (29,904 | ) | | | (2,510 | ) |
| Class Y | | | – | | | | (95,905,613 | ) | | | (62,281,529 | ) | | | (62,847 | ) | | | (84,986 | ) |
| Total distributions | | | – | | | | (95,905,613 | ) | | | (62,281,529 | ) | | | (853,254 | ) | | | (262,752 | ) |
| Capital Stock transactions: |
| Class A Shares |
| Shares sold | | | 9,222 | | | | 9,213 | | | | – | | | | 699,644 | | | | 1,353,437 | |
| Shares issued in lieu of reorganization | | | – | | | | 3,382,044 | | | | – | | | | – | | | | – | |
| Issued to shareholders in reinvestment of distributions | | | – | | | | – | | | | – | | | | 757,818 | | | | 174,704 | |
| Shares redeemed | | | (70,590 | ) | | | (66,082 | ) | | | – | | | | (2,776,691 | ) | | | (2,896,875 | ) |
| Net increase (decrease) from capital stock transactions | | | (61,368 | ) | | | 3,325,175 | | | | – | | | | (1,319,229 | ) | | | (1,368,734 | ) |
| Class B Shares |
| Shares sold | | | | | | | | | | | | | | | – | | | | 19,752 | |
| Issued to shareholders in reinvestment of distributions | | | | | | | | | | | | | | | 29,904 | | | | 2,510 | |
| Shares redeemed | | | | | | | | | | | | | | | (187,734 | ) | | | (307,313 | ) |
| Net decrease from capital stock transactions | | | | | | | | | | | | | | | (157,830 | ) | | | (285,051 | ) |
| Class Y Shares |
| Shares sold | | | 172,791 | | | | 15,373,673 | | | | 38,272,723 | | | | 190,233 | | | | 350,065 | |
| Shares issued in lieu of reorganization | | | – | | | | 24,220,585 | | | | – | | | | – | | | | – | |
| Issued to shareholders in reinvestment of distributions | | | – | | | | 94,412,904 | | | | 61,406,985 | | | | 62,846 | | | | 84,986 | |
| Shares redeemed | | | (19,353,562 | ) | | | (250,607,880 | ) | | | (188,069,577 | ) | | | (441,801 | ) | | | (9,107,467 | ) |
| Net decrease from capital stock transactions | | | (19,180,771 | ) | | | (116,600,718 | ) | | | (88,389,869 | ) | | | (188,722 | ) | | | (8,672,416 | ) |
| Total net decrease from capital stock transactions | | | (19,242,139 | ) | | | (113,275,543 | ) | | | (88,389,869 | ) | | | (1,665,781 | ) | | | (10,326,201 | ) |
| Total decrease in net assets | | | (11,259,912 | ) | | | (265,716,997 | ) | | | (67,769,674 | ) | | | (719,484 | ) | | | (11,859,348 | ) |
| Net Assets at end of period | | $ | 266,983,694 | | | $ | 278,243,606 | | | $ | 543,960,603 | | | $ | 19,233,863 | | | $ | 19,953,347 | |
| Capital Share transactions: |
| Class A Shares |
| Shares sold | | | 853 | | | | 854 | | | | – | | | | 54,574 | | | | 95,071 | |
| Shares issued in lieu of reorganization | | | – | | | | 321,301 | | | | – | | | | – | | | | – | |
| Issued to shareholders in reinvestment of distributions | | | – | | | | – | | | | – | | | | 65,498 | | | | 12,217 | |
| Shares redeemed | | | (6,509 | ) | | | (6,068 | ) | | | – | | | | (216,288 | ) | | | (204,624 | ) |
| Net increase (decrease) in shares outstanding | | | (5,656 | ) | | | 316,087 | | | | – | | | | (96,216 | ) | | | (97,336 | ) |
| Class B Shares |
| Shares sold | | | | | | | | | | | | | | | – | | | | 1,352 | |
| Issued to shareholders in reinvestment of distributions | | | | | | | | | | | | | | | 2,644 | | | | 179 | |
| Shares redeemed | | | | | | | | | | | | | | | (15,109 | ) | | | (22,289 | ) |
| Net decrease in shares outstanding | | | | | | | | | | | | | | | (12,465 | ) | | | (20,758 | ) |
| Class Y Shares |
| Shares sold | | | 15,842 | | | | 1,322,528 | | | | 1,049,443 | | | | 14,989 | | | | 24,643 | |
| Shares issued in lieu of reorganization | | | – | | | | 2,290,103 | | | | – | | | | – | | | | – | |
| Issued to shareholders in reinvestment of distributions | | | – | | | | 8,351,953 | | | | 1,770,674 | | | | 5,427 | | | | 5,939 | |
| Shares redeemed | | | (1,749,463 | ) | | | (21,653,948 | ) | | | (5,147,149 | ) | | | (34,505 | ) | | | (639,402 | ) |
| Net decrease in shares outstanding | | | (1,733,621 | ) | | | (9,689,364 | ) | | | (2,327,032 | ) | | | (14,089 | ) | | | (608,820 | ) |
*The Statements of Changes in Net Assets presented herein reflect the historical operating results of the Broadview Opportunity Fund prior to the reorganization. See Notes 1 and 13 for a discussion of the Fund’s reorganization. Share activity for the one-year period ended October 1, 2018 to September 30, 2019 reflects share conversion discussed in Note 13.
1Disclosure represents the period October 1, 2019 to October 31, 2019. See Notes 1 and 13.
See accompanying Notes to Financial Statements.
45
Madison Funds | October 31, 2019
| |
| Financial Highlights for a Share of Beneficial Interest Outstanding |
| | | | | | | | | | | | | | | | | | | | | | | | | | | | | | | | | | |
| | | CONSERVATIVE ALLOCATION FUND | |
| | | CLASS A | | | CLASS B | | | CLASS C | |
| | | Year Ended October 31, | | | Year Ended October 31, | | | Year Ended October 31, | |
| | | 2019 | | | 2018 | | | 2017 | | | 2016 | | | 2015 | | | 2019 | | | 2018 | | | 2017 | | | 2016 | | | 2015 | | | 2019 | | | 2018 | | | 2017 | | | 2016 | | | 2015 | |
| Net Asset Value at beginning of period | | $ | 10.39 | | | $ | 10.97 | | | $ | 10.46 | | | $ | 10.63 | | | $ | 11.15 | | | $ | 10.47 | | | $ | 11.05 | | | $ | 10.52 | | | $ | 10.69 | | | $ | 11.19 | | | $ | 10.48 | | | $ | 11.06 | | | $ | 10.53 | | | $ | 10.69 | | | $ | 11.20 | |
| Income from Investment Operations: | | | | | | | | | | | | | | | | | | | | | | | | | | | | | | | | | | | | | | | | | | | | | | | | | | | | | | | | | | | | |
| Net investment income | | | 0.36 | | | | 0.19 | | | | 0.15 | 1 | | | 0.14 | 1 | | | 0.13 | 1 | | | 0.31 | | | | 0.12 | | | | 0.08 | 1 | | | 0.07 | 1 | | | 0.06 | 1 | | | 0.29 | | | | 0.11 | | | | 0.08 | 1 | | | 0.06 | 1 | | | 0.05 | 1 |
| Net realized and unrealized gain (loss) on investments | | | 0.68 | | | | (0.26 | ) | | | 0.69 | | | | 0.17 | | | | – | | | | 0.66 | | | | (0.28 | ) | | | 0.69 | | | | 0.16 | | | | (0.01 | ) | | | 0.68 | | | | (0.27 | ) | | | 0.69 | | | | 0.18 | | | | (0.01 | ) |
| Total from investment operations | | | 1.04 | | | | (0.07 | ) | | | 0.84 | | | | 0.31 | | | | 0.13 | | | | 0.97 | | | | (0.16 | ) | | | 0.77 | | | | 0.23 | | | | 0.05 | | | | 0.97 | | | | (0.16 | ) | | | 0.77 | | | | 0.24 | | | | 0.04 | |
| Less Distributions From: | | | | | | | | | | | | | | | | | | | | | | | | | | | | | | | | | | | | | | | | | | | | | | | | | | | | | | | | | | | | |
| Net investment income | | | (0.18 | ) | | | (0.24 | ) | | | (0.18 | ) | | | (0.16 | ) | | | (0.17 | ) | | | (0.05 | ) | | | (0.15 | ) | | | (0.09 | ) | | | (0.08 | ) | | | (0.07 | ) | | | (0.05 | ) | | | (0.15 | ) | | | (0.09 | ) | | | (0.08 | ) | | | (0.07 | ) |
| Capital gains | | | (0.29 | ) | | | (0.27 | ) | | | (0.15 | ) | | | (0.32 | ) | | | (0.48 | ) | | | (0.29 | ) | | | (0.27 | ) | | | (0.15 | ) | | | (0.32 | ) | | | (0.48 | ) | | | (0.29 | ) | | | (0.27 | ) | | | (0.15 | ) | | | (0.32 | ) | | | (0.48 | ) |
| Total distributions | | | (0.47 | ) | | | (0.51 | ) | | | (0.33 | ) | | | (0.48 | ) | | | (0.65 | ) | | | (0.34 | ) | | | (0.42 | ) | | | (0.24 | ) | | | (0.40 | ) | | | (0.55 | ) | | | (0.34 | ) | | | (0.42 | ) | | | (0.24 | ) | | | (0.40 | ) | | | (0.55 | ) |
| Net increase (decrease) in net asset value | | | 0.57 | | | | (0.58 | ) | | | 0.51 | | | | (0.17 | ) | | | (0.52 | ) | | | 0.63 | | | | (0.58 | ) | | | 0.53 | | | | (0.17 | ) | | | (0.50 | ) | | | 0.63 | | | | (0.58 | ) | | | 0.53 | | | | (0.16 | ) | | | (0.51 | ) |
| Net Asset Value at end of period | | $ | 10.96 | | | $ | 10.39 | | | $ | 10.97 | | | $ | 10.46 | | | $ | 10.63 | | | $ | 11.10 | | | $ | 10.47 | | | $ | 11.05 | | | $ | 10.52 | | | $ | 10.69 | | | $ | 11.11 | | | $ | 10.48 | | | $ | 11.06 | | | $ | 10.53 | | | $ | 10.69 | |
| Total Return (%)2 | | | 10.37 | | | | (0.75 | ) | | | 8.25 | | | | 3.10 | | | | 1.17 | | | | 9.51 | | | | (1.51 | ) | | | 7.47 | | | | 2.27 | | | | 0.44 | | | | 9.50 | | | | (1.51 | ) | | | 7.46 | | | | 2.37 | | | | 0.34 | |
| Ratios/Supplemental Data: | | | | | | | | | | | | | | | | | | | | | | | | | | | | | | | | | | | | | | | | | | | | | | | | | | | | | | | | | | | | |
| Net Assets at end of period (in 000’s) | | $ | 42,662 | | | $ | 42,247 | | | $ | 45,005 | | | $ | 43,752 | | | $ | 46,039 | | | $ | 5,457 | | | $ | 6,049 | | | $ | 8,119 | | | $ | 9,175 | | | $ | 10,064 | | | $ | 20,303 | | | $ | 20,001 | | | $ | 20,960 | | | $ | 20,225 | | | $ | 19,694 | |
| Ratios of expenses to average net assets (%) | | | 0.70 | | | | 0.70 | | | | 0.70 | | | | 0.71 | | | | 0.70 | | | | 1.45 | | | | 1.45 | | | | 1.45 | | | | 1.46 | | | | 1.45 | | | | 1.45 | | | | 1.45 | | | | 1.45 | | | | 1.46 | | | | 1.45 | |
| Ratio of net investment income to average net assets (%) | | | 3.38 | | | | 1.74 | | | | 1.46 | | | | 1.36 | | | | 1.23 | | | | 2.68 | | | | 1.04 | | | | 0.74 | | | | 0.60 | | | | 0.59 | | | | 2.60 | | | | 0.99 | | | | 0.71 | | | | 0.54 | | | | 0.49 | |
| Portfolio turnover (%)3 | | | 57 | | | | 63 | | | | 48 | | | | 82 | | | | 83 | | | | 57 | | | | 63 | | | | 48 | | | | 82 | | | | 83 | | | | 57 | | | | 63 | | | | 48 | | | | 82 | | | | 83 | |
| | | | | | | | | | | | | | | | | | | | | | | | | | | | | | | | | | | | | |
| | | MODERATE ALLOCATION FUND | |
| | | CLASS A | | | CLASS B | | | CLASS C | |
| | | Year Ended October 31, | | | Year Ended October 31, | | | Year Ended October 31, | |
| | | 2019 | | | 2018 | | | 2017 | | | 2016 | | | 2015 | | | 2019 | | | 2018 | | | 2017 | | | 2016 | | | 2015 | | | 2019 | | | 2018 | | | 2017 | | | 2016 | | | 2015 | |
| Net Asset Value at beginning of period | | $ | 11.59 | | | $ | 12.20 | | | $ | 11.18 | | | $ | 11.62 | | | $ | 12.27 | | | $ | 11.46 | | | $ | 12.06 | | | $ | 11.05 | | | $ | 11.52 | | | $ | 12.19 | | | $ | 11.47 | | | $ | 12.07 | | | $ | 11.06 | | | $ | 11.53 | | | $ | 12.20 | |
| Income from Investment Operations: | | | | | | | | | | | | | | | | | | | | | | | | | | | | | | | | | | | | | | | | | | | | | | | | | | | | | | | | | | | | |
| Net investment income | | | 0.51 | | | | 0.17 | | | | 0.14 | 1 | | | 0.13 | 1 | | | 0.13 | 1 | | | 0.53 | | | | 0.10 | | | | 0.07 | 1 | | | 0.06 | 1 | | | 0.05 | 1 | | | 0.42 | | | | 0.08 | | | | 0.06 | 1 | | | 0.05 | 1 | | | 0.02 | 1 |
| Net realized and unrealized gain (loss) on investments | | | 0.60 | | | | (0.17 | ) | | | 1.35 | | | | 0.18 | | | | 0.04 | | | | 0.48 | | | | (0.18 | ) | | | 1.33 | | | | 0.16 | | | | 0.04 | | | | 0.59 | | | | (0.16 | ) | | | 1.34 | | | | 0.17 | | | | 0.07 | |
| Total from investment operations | | | 1.11 | | | | – | | | | 1.49 | | | | 0.31 | | | | 0.17 | | | | 1.01 | | | | (0.08 | ) | | | 1.40 | | | | 0.22 | | | | 0.09 | | | | 1.01 | | | | (0.08 | ) | | | 1.40 | | | | 0.22 | | | | 0.09 | |
| Less Distributions From: | | | | | | | | | | | | | | | | | | | | | | | | | | | | | | | | | | | | | | | | | | | | | | | | | | | | | | | | | | | | |
| Net investment income | | | (0.17 | ) | | | (0.17 | ) | | | (0.15 | ) | | | (0.12 | ) | | | (0.17 | ) | | | (0.10 | ) | | | (0.08 | ) | | | (0.07 | ) | | | (0.06 | ) | | | (0.11 | ) | | | (0.10 | ) | | | (0.08 | ) | | | (0.07 | ) | | | (0.06 | ) | | | (0.11 | ) |
| Capital gains | | | (0.77 | ) | | | (0.44 | ) | | | (0.32 | ) | | | (0.63 | ) | | | (0.65 | ) | | | (0.77 | ) | | | (0.44 | ) | | | (0.32 | ) | | | (0.63 | ) | | | (0.65 | ) | | | (0.77 | ) | | | (0.44 | ) | | | (0.32 | ) | | | (0.63 | ) | | | (0.65 | ) |
| Total distributions | | | (0.94 | ) | | | (0.61 | ) | | | (0.47 | ) | | | (0.75 | ) | | | (0.82 | ) | | | (0.87 | ) | | | (0.52 | ) | | | (0.39 | ) | | | (0.69 | ) | | | (0.76 | ) | | | (0.87 | ) | | | (0.52 | ) | | | (0.39 | ) | | | (0.69 | ) | | | (0.76 | ) |
| Net increase (decrease) in net asset value | | | 0.17 | | | | (0.61 | ) | | | 1.02 | | | | (0.44 | ) | | | (0.65 | ) | | | 0.14 | | | | (0.60 | ) | | | 1.01 | | | | (0.47 | ) | | | (0.67 | ) | | | 0.14 | | | | (0.60 | ) | | | 1.01 | | | | (0.47 | ) | | | (0.67 | ) |
| Net Asset Value at end of period | | $ | 11.76 | | | $ | 11.59 | | | $ | 12.20 | | | $ | 11.18 | | | $ | 11.62 | | | $ | 11.60 | | | $ | 11.46 | | | $ | 12.06 | | | $ | 11.05 | | | $ | 11.52 | | | $ | 11.61 | | | $ | 11.47 | | | $ | 12.07 | | | $ | 11.06 | | | $ | 11.53 | |
| Total Return (%)2 | | | 10.69 | | | | (0.12 | ) | | | 13.88 | | | | 2.95 | | | | 1.44 | | | | 9.79 | | | | (0.82 | ) | | | 13.07 | | | | 2.15 | | | | 0.72 | | | | 9.78 | | | | (0.82 | ) | | | 13.06 | | | | 2.15 | | | | 0.72 | |
| Ratios/Supplemental Data: | | | | | | | | | | | | | | | | | | | | | | | | | | | | | | | | | | | | | | | | | | | | | | | | | | | | | | | | | | | | |
| Net Assets at end of period (in 000’s) | | $ | 112,916 | | | $ | 108,459 | | | $ | 115,586 | | | $ | 104,276 | | | $ | 107,043 | | | $ | 13,754 | | | $ | 17,481 | | | $ | 23,101 | | | $ | 25,440 | | | $ | 29,451 | | | $ | 9,607 | | | $ | 9,338 | | | $ | 9,625 | | | $ | 9,100 | | | $ | 9,506 | |
| Ratios of expenses to average net assets (%) | | | 0.70 | | | | 0.70 | | | | 0.70 | | | | 0.71 | | | | 0.70 | | | | 1.45 | | | | 1.45 | | | | 1.45 | | | | 1.46 | | | | 1.45 | | | | 1.45 | | | | 1.45 | | | | 1.45 | | | | 1.46 | | | | 1.45 | |
| Ratio of net investment income to average net assets (%) | | | 4.42 | | | | 1.39 | | | | 1.23 | | | | 1.13 | | | | 1.02 | | | | 4.01 | | | | 0.73 | | | | 0.56 | | | | 0.58 | | | | 0.41 | | | | 3.68 | | | | 0.62 | | | | 0.52 | | | | 0.47 | | | | 0.01 | |
| Portfolio turnover (%)3 | | | 64 | | | | 75 | | | | 50 | | | | 97 | | | | 81 | | | | 64 | | | | 75 | | | | 50 | | | | 97 | | | | 81 | | | | 64 | | | | 75 | | | | 50 | | | | 97 | | | | 81 | |
1Net investment income (loss) calculated excluding permanent tax adjustments to undistributed net investment income.
2Total return without applicable sales charge.
3Portfolio turnover is calculated at the fund level and represents the entire fiscal year.
See accompanying Notes to Financial Statements.
46
Madison Funds | October 31, 2019
| |
| Financial Highlights for a Share of Beneficial Interest Outstanding |
| | | AGGRESSIVE ALLOCATION FUND | |
| | | CLASS A | | | CLASS B | | | CLASS C | |
| | | Year Ended October 31, | | | Year Ended October 31, | | | Year Ended October 31, | |
| | | 2019 | | | 2018 | | | 2017 | | | 2016 | | | 2015 | | | 2019 | | | 2018 | | | 2017 | | | 2016 | | | 2015 | | | 2019 | | | 2018 | | | 2017 | | | 2016 | | | 2015 | |
| Net Asset Value at beginning of period | | $ | 12.01 | | | $ | 12.71 | | | $ | 11.12 | | | $ | 11.87 | | | $ | 12.81 | | | $ | 11.65 | | | $ | 12.35 | | | $ | 10.83 | | | $ | 11.65 | | | $ | 12.61 | | | $ | 11.66 | | | $ | 12.36 | | | $ | 10.84 | | | $ | 11.66 | | | $ | 12.62 | |
| Income from Investment Operations: | | | | | | | | | | | | | | | | | | | | | | | | | | | | | | | | | | | | | | | | | | | | | | | | | | | | | | | | | | | | |
| Net investment income | | | 0.56 | | | | 0.14 | | | | 0.13 | 1 | | | 0.12 | 1 | | | 0.11 | 1 | | | 0.55 | | | | 0.03 | | | | 0.02 | 1 | | | 0.06 | 1 | | | 0.03 | 1 | | | 0.48 | | | | 0.04 | | | | 0.02 | 1 | | | 0.05 | 1 | | | 0.02 | 1 |
| Net realized and unrealized gain (loss) on investments | | | 0.57 | | | | (0.11 | ) | | | 1.88 | | | | 0.15 | | | | 0.10 | | | | 0.47 | | | | (0.10 | ) | | | 1.85 | | | | 0.12 | | | | 0.09 | | | | 0.54 | | | | (0.11 | ) | | | 1.85 | | | | 0.13 | | | | 0.10 | |
| Total from investment operations | | | 1.13 | | | | 0.03 | | | | 2.01 | | | | 0.27 | | | | 0.21 | | | | 1.02 | | | | (0.07 | ) | | | 1.87 | | | | 0.18 | | | | 0.12 | | | | 1.02 | | | | (0.07 | ) | | | 1.87 | | | | 0.18 | | | | 0.12 | |
| Less Distributions From: | | | | | | | | | | | | | | | | | | | | | | | | | | | | | | | | | | | | | | | | | | | | | | | | | | | | | | | | | | | | |
| Net investment income | | | (0.14 | ) | | | (0.15 | ) | | | (0.13 | ) | | | (0.10 | ) | | | (0.20 | ) | | | (0.07 | ) | | | (0.05 | ) | | | (0.06 | ) | | | (0.08 | ) | | | (0.13 | ) | | | (0.07 | ) | | | (0.05 | ) | | | (0.06 | ) | | | (0.08 | ) | | | (0.13 | ) |
| Capital gains | | | (0.98 | ) | | | (0.58 | ) | | | (0.29 | ) | | | (0.92 | ) | | | (0.95 | ) | | | (0.98 | ) | | | (0.58 | ) | | | (0.29 | ) | | | (0.92 | ) | | | (0.95 | ) | | | (0.98 | ) | | | (0.58 | ) | | | (0.29 | ) | | | (0.92 | ) | | | (0.95 | ) |
| Total distributions | | | (1.12 | ) | | | (0.73 | ) | | | (0.42 | ) | | | (1.02 | ) | | | (1.15 | ) | | | (1.05 | ) | | | (0.63 | ) | | | (0.35 | ) | | | (1.00 | ) | | | (1.08 | ) | | | (1.05 | ) | | | (0.63 | ) | | | (0.35 | ) | | | (1.00 | ) | | | (1.08 | ) |
| Net increase (decrease) in net asset value | | | 0.01 | | | | (0.70 | ) | | | 1.59 | | | | (0.75 | ) | | | (0.94 | ) | | | (0.03 | ) | | | (0.70 | ) | | | 1.52 | | | | (0.82 | ) | | | (0.96 | ) | | | (0.03 | ) | | | (0.70 | ) | | | 1.52 | | | | (0.82 | ) | | | (0.96 | ) |
| Net Asset Value at end of period | | $ | 12.02 | | | $ | 12.01 | | | $ | 12.71 | | | $ | 11.12 | | | $ | 11.87 | | | $ | 11.62 | | | $ | 11.65 | | | $ | 12.35 | | | $ | 10.83 | | | $ | 11.65 | | | $ | 11.63 | | | $ | 11.66 | | | $ | 12.36 | | | $ | 10.84 | | | $ | 11.66 | |
| Total Return (%)2 | | | 10.93 | | | | 0.06 | | | | 18.66 | | | | 2.65 | | | | 1.66 | | | | 10.12 | | | | (0.74 | ) | | | 17.83 | | | | 1.88 | | | | 0.91 | | | | 10.11 | | | | (0.74 | ) | | | 17.81 | | | | 1.87 | | | | 0.91 | |
| Ratios/Supplemental Data: | | | | | | | | | | | | | | | | | | | | | | | | | | | | | | | | | | | | | | | | | | | | | | | | | | | | | | | | | | | | |
| Net Assets at end of period (in 000’s) | | $ | 54,974 | | | $ | 51,274 | | | $ | 52,811 | | | $ | 45,317 | | | $ | 46,834 | | | $ | 6,088 | | | $ | 7,938 | | | $ | 10,442 | | | $ | 11,089 | | | $ | 12,383 | | | $ | 2,263 | | | $ | 2,160 | | | $ | 2,300 | | | $ | 2,411 | | | $ | 2,600 | |
| Ratios of expenses to average net assets (%) | | | 0.70 | | | | 0.70 | | | | 0.70 | | | | 0.71 | | | | 0.70 | | | | 1.45 | | | | 1.45 | | | | 1.45 | | | | 1.46 | | | | 1.45 | | | | 1.45 | | | | 1.45 | | | | 1.45 | | | | 1.46 | | | | 1.45 | |
| Ratio of net investment income to average net assets (%) | | | 4.77 | | | | 1.08 | | | | 1.02 | | | | 1.04 | | | | 0.81 | | | | 4.50 | | | | 0.45 | | | | 0.35 | | | | 0.56 | | | | 0.21 | | | | 4.15 | | | | 0.32 | | | | 0.45 | | | | 0.42 | | | | 0.05 | |
| Portfolio turnover (%)3 | | | 79 | | | | 71 | | | | 45 | | | | 98 | | | | 72 | | | | 79 | | | | 71 | | | | 45 | | | | 98 | | | | 72 | | | | 79 | | | | 71 | | | | 45 | | | | 98 | | | | 72 | |
| | | GOVERNMENT MONEY MARKET FUND* | |
| | | CLASS A | | | CLASS B | |
| | | Year Ended October 31, | | | Year Ended October 31, | |
| | | 2019 | | | 2018 | | | 2017 | | | 2016 | | | 2015 | | | 2019 | | | 2018 | | | 2017 | | | 2016 | | | 2015 | |
| Net Asset Value at beginning of period | | $ | 1.00 | | | $ | 1.00 | | | $ | 1.00 | | | $ | 1.00 | | | $ | 1.00 | | | $ | 1.00 | | | $ | 1.00 | | | $ | 1.00 | | | $ | 1.00 | | | $ | 1.00 | |
| Income from Investment Operations: | | | | | | | | | | | | | | | | | | | | | | | | | | | | | | | | | | | | | | | | |
| Net investment income | | | 0.02 | | | | 0.01 | | | | 0.00 | 1,4 | | | 0.00 | 1,4 | | | 0.00 | 1,4 | | | 0.01 | | | | 0.00 | 4 | | | 0.00 | 1,4 | | | 0.00 | 1,4 | | | 0.00 | 1,4 |
| Total from investment operations | | | 0.02 | | | | 0.01 | | | | 0.00 | 4 | | | 0.00 | 4 | | | 0.00 | 4 | | | 0.01 | | | | 0.00 | 4 | | | 0.00 | 4 | | | 0.00 | 4 | | | 0.00 | 4 |
| Less Distributions From: | | | | | | | | | | | | | | | | | | | | | | | | | | | | | | | | | | | | | | | | |
| Net investment income | | | (0.02 | ) | | | (0.01 | ) | | | – | | | | – | | | | – | | | | (0.01 | )4 | | | – | | | | – | | | | – | | | | – | |
| Total distributions | | | (0.02 | ) | | | (0.01 | ) | | | – | | | | – | | | | – | | | | (0.01 | ) | | | – | | | | – | | | | – | | | | – | |
| Net increase in net asset value | | | – | | | | 0.00 | | | | 0.00 | 4 | | | 0.00 | 4 | | | 0.00 | 4 | | | – | | | | 0.00 | 4 | | | 0.00 | 4 | | | 0.00 | 4 | | | 0.00 | 4 |
| Net Asset Value at end of period | | $ | 1.00 | | | $ | 1.00 | | | $ | 1.00 | | | $ | 1.00 | | | $ | 1.00 | | | $ | 1.00 | | | $ | 1.00 | | | $ | 1.00 | | | $ | 1.00 | | | $ | 1.00 | |
| Total Return (%)2 | | | 1.75 | | | | 1.08 | | | | 0.21 | | | | 0.00 | | | | 0.00 | | | | 0.99 | | | | 0.36 | | | | 0.01 | | | | 0.00 | | | | 0.00 | |
| Ratios/Supplemental Data: | | | | | | | | | | | | | | | | | | | | | | | | | | | | | | | | | | | | | | | | |
| Net Assets at end of period (in 000’s) | | $ | 14,990 | | | $ | 14,606 | | | $ | 14,972 | | | $ | 18,295 | | | $ | 19,076 | | | $ | 64 | | | $ | 168 | | | $ | 215 | | | $ | 599 | | | $ | 234 | |
| Ratios of expenses to average net assets: | | | | | | | | | | | | | | | | | | | | | | | | | | | | | | | | | | | | | | | | |
| Before reimbursement of expenses by Adviser (%) | | | 0.55 | | | | 0.55 | | | | 0.55 | | | | 0.56 | | | | 0.55 | | | | 1.30 | | | | 1.35 | | | | 1.30 | | | | 1.30 | | | | 1.30 | |
| After reimbursement of expenses by Adviser (%) | | | 0.55 | | | | 0.55 | 5 | | | 0.51 | 5 | | | 0.28 | 5 | | | 0.07 | 5 | | | 1.30 | | | | 1.26 | 5 | | | 0.62 | 5 | | | 0.28 | 5 | | | 0.08 | 5 |
| Ratio of net investment income (loss) to average net assets | | | | | | | | | | | | | | | | | | | | | | | | | | | | | | | | | | | | | | | | |
| After reimbursement and waiver of expenses by Adviser (%) | | | 1.74 | | | | 1.07 | 5 | | | 0.20 | 5 | | | 0.00 | 5 | | | 0.00 | 5 | | | 1.02 | | | | 0.35 | 5 | | | 0.01 | 5 | | | 0.00 | 5 | | | 0.00 | 5 |
*Prior to close of business on February 29, 2016, the Fund was known as the Cash Reserves Fund.
1Net investment income (loss) calculated excluding permanent tax adjustments to undistributed net investment income.
2Total return without applicable sales charge.
3Portfolio turnover is calculated at the fund level and represents the entire fiscal year.
4Amounts represent less than $0.005 per share.
5Ratio is net of fees waived by the adviser and distributor (See Note 3).
See accompanying Notes to Financial Statements.
47
Madison Funds | October 31, 2019
| |
| Financial Highlights for a Share of Beneficial Interest Outstanding |
| | | TAX-FREE VIRGINIA FUND | | | TAX-FREE NATIONAL FUND | |
| | | CLASS Y | | | CLASS Y | |
| | | Year Ended October 31, | | | Year Ended October 31, | |
| | | 2019 | | | 2018 | | | 2017 | | | 2016 | | | 2015 | | | 2019 | | | 2018 | | | 2017 | | | 2016 | | | 2015 | |
| Net Asset Value at beginning of period | | $ | 11.08 | | | $ | 11.49 | | | $ | 11.67 | | | $ | 11.61 | | | $ | 11.70 | | | $ | 10.41 | | | $ | 10.85 | | | $ | 11.10 | | | $ | 11.01 | | | $ | 11.08 | |
| Income from Investment Operations: | | | | | | | | | | | | | | | | | | | | | | | | | | | | | | | | | | | | | | | | |
| Net investment income | | | 0.23 | | | | 0.24 | | | | 0.24 | 1 | | | 0.25 | 1 | | | 0.28 | 1 | | | 0.24 | | | | 0.24 | | | | 0.25 | 1 | | | 0.26 | 1 | | | 0.27 | 1 |
| Net realized and unrealized gain (loss) on investments | | | 0.63 | | | | (0.41 | ) | | | (0.16 | ) | | | 0.10 | | | | (0.01 | ) | | | 0.61 | | | | (0.41 | ) | | | (0.18 | ) | | | 0.15 | | | | 0.01 | |
| Total from investment operations | | | 0.86 | | | | (0.17 | ) | | | 0.08 | | | | 0.35 | | | | 0.27 | | | | 0.85 | | | | (0.17 | ) | | | 0.07 | | | | 0.41 | | | | 0.28 | |
| Less Distributions From: | | | | | | | | | | | | | | | | | | | | | | | | | | | | | | | | | | | | | | | | |
| Net investment income | | | (0.23 | ) | | | (0.24 | ) | | | (0.24 | ) | | | (0.25 | ) | | | (0.28 | ) | | | (0.24 | ) | | | (0.24 | ) | | | (0.25 | ) | | | (0.26 | ) | | | (0.27 | ) |
| Capital gains | | | – | | | | – | | | | (0.02 | ) | | | (0.04 | ) | | | (0.08 | ) | | | (0.06 | ) | | | (0.03 | ) | | | (0.07 | ) | | | (0.06 | ) | | | (0.08 | ) |
| Total distributions | | | (0.23 | ) | | | (0.24 | ) | | | (0.26 | ) | | | (0.29 | ) | | | (0.36 | ) | | | (0.30 | ) | | | (0.27 | ) | | | (0.32 | ) | | | (0.32 | ) | | | (0.35 | ) |
| Net increase (decrease) in net asset value | | | 0.63 | | | | (0.41 | ) | | | (0.18 | ) | | | 0.06 | | | | (0.09 | ) | | | 0.55 | | | | (0.44 | ) | | | (0.25 | ) | | | 0.09 | | | | (0.07 | ) |
| Net Asset Value at end of period | | $ | 11.71 | | | $ | 11.08 | | | $ | 11.49 | | | $ | 11.67 | | | $ | 11.61 | | | $ | 10.96 | | | $ | 10.41 | | | $ | 10.85 | | | $ | 11.10 | | | $ | 11.01 | |
| Total Return (%)2 | | | 7.78 | | | | (1.52 | ) | | | 0.68 | | | | 3.01 | | | | 2.36 | | | | 8.20 | | | | (1.56 | ) | | | 0.72 | | | | 3.75 | | | | 2.61 | |
| Ratios/Supplemental Data: | | | | | | | | | | | | | | | | | | | | | | | | | | | | | | | | | | | | | | | | |
| Net Assets at end of period (in 000’s) | | $ | 22,225 | | | $ | 20,868 | | | $ | 21,866 | | | $ | 22,350 | | | $ | 22,659 | | | $ | 23,807 | | | $ | 23,325 | | | $ | 25,294 | | | $ | 27,333 | | | $ | 27,744 | |
| Ratios of expenses to average net assets (%) | | | 0.85 | | | | 0.85 | | | | 0.85 | | | | 0.86 | | | | 0.85 | | | | 0.75 | | | | 0.75 | | | | 0.75 | | | | 0.79 | | | | 0.85 | |
| Ratio of net investment income to average net assets (%) | | | 1.96 | | | | 2.09 | | | | 2.06 | | | | 2.12 | | | | 2.45 | | | | 2.19 | | | | 2.25 | | | | 2.30 | | | | 2.27 | | | | 2.44 | |
| Portfolio turnover (%)3 | | | 22 | | | | 26 | | | | 8 | | | | 12 | | | | 12 | | | | 26 | | | | 31 | | | | 6 | | | | 9 | | | | 15 | |
| | | HIGH QUALITY BOND FUND | |
| | | CLASS Y | |
| | | Year Ended October 31, | |
| | | 2019 | | | 2018 | | | 2017 | | | 2016 | | | 2015 | |
| Net Asset Value at beginning of period | | $ | 10.64 | | | $ | 10.93 | | | $ | 11.06 | | | $ | 11.04 | | | $ | 11.04 | |
| Income from Investment Operations: | | | | | | | | | | | | | | | | | | | | |
| Net investment income | | | 0.21 | | | | 0.18 | | | | 0.14 | 1 | | | 0.12 | 1 | | | 0.11 | 1 |
| Net realized and unrealized gain (loss) on investments | | | 0.47 | | | | (0.30 | ) | | | (0.12 | ) | | | 0.06 | | | | 0.01 | |
| Total from investment operations | | | 0.68 | | | | (0.12 | ) | | | 0.02 | | | | 0.18 | | | | 0.12 | |
| Less Distributions From: | | | | | | | | | | | | | | | | | | | | |
| Net investment income | | | (0.21 | ) | | | (0.17 | ) | | | (0.14 | ) | | | (0.12 | ) | | | (0.11 | ) |
| Capital gains | | | – | | | | – | | | | (0.01 | ) | | | (0.04 | ) | | | (0.01 | ) |
| Total distributions | | | (0.21 | ) | | | (0.17 | ) | | | (0.15 | ) | | | (0.16 | ) | | | (0.12 | ) |
| Net increase (decrease) in net asset value | | | 0.47 | | | | (0.29 | ) | | | (0.13 | ) | | | 0.02 | | | | – | |
| Net Asset Value at end of period | | $ | 11.11 | | | $ | 10.64 | | | $ | 10.93 | | | $ | 11.06 | | | $ | 11.04 | |
| Total Return (%)2 | | | 6.43 | | | | (1.09 | ) | | | 0.25 | | | | 1.62 | | | | 1.11 | |
| Ratios/Supplemental Data: | | | | | | | | | | | | | | | | | | | | |
| Net Assets at end of period (in 000’s) | | $ | 90,407 | | | $ | 89,253 | | | $ | 100,536 | | | $ | 105,807 | | | $ | 102,552 | |
| Ratios of expenses to average net assets (%) | | | 0.49 | | | | 0.49 | | | | 0.49 | | | | 0.50 | | | | 0.49 | |
| Ratio of net investment income to average net assets (%) | | | 1.88 | | | | 1.64 | | | | 1.32 | | | | 1.10 | | | | 1.00 | |
| Portfolio turnover (%)3 | | | 20 | | | | 31 | | | | 26 | | | | 25 | | | | 35 | |
1Net investment income calculated excluding permanent tax adjustments to undistributed net investment income.
2Total return without applicable sales charge.
3Portfolio turnover is calculated at the fund level and represents the entire fiscal year.
See accompanying Notes to Financial Statements.
48
Madison Funds | October 31, 2019
| |
| Financial Highlights for a Share of Beneficial Interest Outstanding |
| | | CORE BOND FUND | |
| | | CLASS A | | | CLASS B | | | CLASS Y | |
| | | Year Ended October 31, | | | Year Ended October 31, | | | Year Ended October 31, | |
| | | 2019 | | | 2018 | | | 2017 | | | 2016 | | | 2015 | | | 2019 | | | 2018 | | | 2017 | | | 2016 | | | 2015 | | | 2019 | | | 2018 | | | 2017 | | | 2016 | | | 2015 | |
| Net Asset Value at beginning of period | | $ | 9.55 | | | $ | 10.03 | | | $ | 10.20 | | | $ | 10.09 | | | $ | 10.25 | | | $ | 9.55 | | | $ | 10.03 | | | $ | 10.21 | | | $ | 10.10 | | | $ | 10.25 | | | $ | 9.52 | | | $ | 9.99 | | | $ | 10.17 | | | $ | 10.07 | | | $ | 10.22 | |
| Income from Investment Operations: | | | | | | | | | | | | | | | | | | | | | | | | | | | | | | | | | | | | | | | | | | | | | | | | | | | | | | | | | | | | |
| Net investment income | | | 0.24 | | | | 0.21 | | | | 0.20 | 1 | | | 0.20 | 1 | | | 0.19 | 1 | | | 0.16 | | | | 0.15 | | | | 0.14 | 1 | | | 0.13 | 1 | | | 0.11 | 1 | | | 0.25 | | | | 0.24 | | | | 0.23 | 1 | | | 0.23 | 1 | | | 0.21 | 1 |
| Net realized and unrealized gain (loss) on investments | | | 0.74 | | | | (0.46 | ) | | | (0.10 | ) | | | 0.21 | | | | (0.05 | ) | | | 0.75 | | | | (0.47 | ) | | | (0.12 | ) | | | 0.21 | | | | (0.04 | ) | | | 0.75 | | | | (0.45 | ) | | | (0.11 | ) | | | 0.20 | | | | (0.04 | ) |
| Total from investment operations | | | 0.98 | | | | (0.25 | ) | | | 0.10 | | | | 0.41 | | | | 0.14 | | | | 0.91 | | | | (0.32 | ) | | | 0.02 | | | | 0.34 | | | | 0.07 | | | | 1.00 | | | | (0.21 | ) | | | 0.12 | | | | 0.43 | | | | 0.17 | |
| Less Distributions From: | | | | | | | | | | | | | | | | | | | | | | | | | | | | | | | | | | | | | | | | | | | | | | | | | | | | | | | | | | | | |
| Net investment income | | | (0.25 | ) | | | (0.23 | ) | | | (0.22 | ) | | | (0.22 | ) | | | (0.21 | ) | | | (0.17 | ) | | | (0.16 | ) | | | (0.15 | ) | | | (0.15 | ) | | | (0.13 | ) | | | (0.27 | ) | | | (0.26 | ) | | | (0.25 | ) | | | (0.25 | ) | | | (0.23 | ) |
| Capital gains | | | – | | | | (0.00 | )4 | | | (0.05 | ) | | | (0.08 | ) | | | (0.09 | ) | | | – | | | | (0.00 | )4 | | | (0.05 | ) | | | (0.08 | ) | | | (0.09 | ) | | | – | | | | (0.00 | )4 | | | (0.05 | ) | | | (0.08 | ) | | | (0.09 | ) |
| Total distributions | | | (0.25 | ) | | | (0.23 | ) | | | (0.27 | ) | | | (0.30 | ) | | | (0.30 | ) | | | (0.17 | ) | | | (0.16 | ) | | | (0.20 | ) | | | (0.23 | ) | | | (0.22 | ) | | | (0.27 | ) | | | (0.26 | ) | | | (0.30 | ) | | | (0.33 | ) | | | (0.32 | ) |
| Net increase (decrease) in net asset value | | | 0.73 | | | | (0.48 | ) | | | (0.17 | ) | | | 0.11 | | | | (0.16 | ) | | | 0.74 | | | | (0.48 | ) | | | (0.18 | ) | | | 0.11 | | | | (0.15 | ) | | | 0.73 | | | | (0.47 | ) | | | (0.18 | ) | | | 0.10 | | | | (0.15 | ) |
| Net Asset Value at end of period | | $ | 10.28 | | | $ | 9.55 | | | $ | 10.03 | | | $ | 10.20 | | | $ | 10.09 | | | $ | 10.29 | | | $ | 9.55 | | | $ | 10.03 | | | $ | 10.21 | | | $ | 10.10 | | | $ | 10.25 | | | $ | 9.52 | | | $ | 9.99 | | | $ | 10.17 | | | $ | 10.07 | |
| Total Return (%)2 | | | 10.37 | | | | (2.45 | ) | | | 1.05 | | | | 4.21 | | | | 1.34 | | | | 9.65 | | | | (3.18 | ) | | | 0.20 | | | | 3.43 | | | | 0.69 | | | | 10.67 | | | | (2.12 | ) | | | 1.22 | | | | 4.40 | | | | 1.71 | |
| Ratios/Supplemental Data: | | | | | | | | | | | | | | | | | | | | | | | | | | | | | | | | | | | | | | | | | | | | | | | | | | | | | | | | | | | | |
| Net Assets at end of period (in 000’s) | | $ | 28,902 | | | $ | 29,605 | | | $ | 33,738 | | | $ | 34,325 | | | $ | 32,823 | | | $ | 1,272 | | | $ | 1,466 | | | $ | 2,004 | | | $ | 2,575 | | | $ | 2,929 | | | $ | 121,000 | | | $ | 138,186 | | | $ | 170,169 | | | $ | 178,046 | | | $ | 186,414 | |
| Ratios of expenses to average net assets (%) | | | 0.90 | | | | 0.90 | | | | 0.90 | | | | 0.91 | | | | 0.90 | | | | 1.65 | | | | 1.65 | | | | 1.65 | | | | 1.66 | | | | 1.65 | | | | 0.65 | | | | 0.65 | | | | 0.65 | | | | 0.66 | | | | 0.65 | |
| Ratio of net investment income to average net assets (%) | | | 2.35 | | | | 2.20 | | | | 2.00 | | | | 2.00 | | | | 1.85 | | | | 1.60 | | | | 1.44 | | | | 1.25 | | | | 1.25 | | | | 1.10 | | | | 2.60 | | | | 2.44 | | | | 2.25 | | | | 2.25 | | | | 2.10 | |
| Portfolio turnover (%)3 | | | 36 | | | | 26 | | | | 27 | | | | 39 | | | | 57 | | | | 36 | | | | 26 | | | | 27 | | | | 39 | | | | 57 | | | | 36 | | | | 26 | | | | 27 | | | | 39 | | | | 57 | |
| | | CORE BOND FUND | | | CORPORATE BOND FUND | |
| | | CLASS R6 | | | CLASS Y | |
| | | Year Ended October 31, | | | Year Ended October 31, | |
| | | 2019 | | | 2018 | | | 2017 | | | 2016 | | | 2015 | | | 2019 | | | 2018 | | | 2017 | | | 2016 | | | 2015 | |
| Net Asset Value at beginning of period | | $ | 9.58 | | | $ | 10.05 | | | $ | 10.21 | | | $ | 10.09 | | | $ | 10.24 | | | $ | 10.87 | | | $ | 11.65 | | | $ | 11.69 | | | $ | 11.34 | | | $ | 11.49 | |
| Income from Investment Operations: | | | | | | | | | | | | | | | | | | | | | | | | | | | | | | | | | | | | | | | | |
| Net investment income | | | 0.27 | | | | 0.26 | | | | 0.24 | 1 | | | 0.24 | 1 | | | 0.23 | 1 | | | 0.36 | | | | 0.33 | | | | 0.33 | 1 | | | 0.33 | 1 | | | 0.29 | 1 |
| Net realized and unrealized gain (loss) on investments | | | 0.75 | | | | (0.47 | ) | | | (0.10 | ) | | | 0.21 | | | | (0.06 | ) | | | 1.17 | | | | (0.69 | ) | | | – | | | | 0.39 | | | | (0.13 | ) |
| Total from investment operations | | | 1.02 | | | | (0.21 | ) | | | 0.14 | | | | 0.45 | | | | 0.17 | | | | 1.53 | | | | (0.36 | ) | | | 0.33 | | | | 0.72 | | | | 0.16 | |
| Less Distributions From: | | | | | | | | | | | | | | | | | | | | | | | | | | | | | | | | | | | | | | | | |
| Net investment income | | | (0.27 | ) | | | (0.26 | ) | | | (0.25 | ) | | | (0.25 | ) | | | (0.23 | ) | | | (0.36 | ) | | | (0.33 | ) | | | (0.33 | ) | | | (0.33 | ) | | | (0.29 | ) |
| Capital gains | | | – | | | | (0.00 | )4 | | | (0.05 | ) | | | (0.08 | ) | | | (0.09 | ) | | | – | | | | (0.09 | ) | | | (0.04 | ) | | | (0.04 | ) | | | (0.02 | ) |
| Total distributions | | | (0.27 | ) | | | (0.26 | ) | | | (0.30 | ) | | | (0.33 | ) | | | (0.32 | ) | | | (0.36 | ) | | | (0.42 | ) | | | (0.37 | ) | | | (0.37 | ) | | | (0.31 | ) |
| Net increase (decrease) in net asset value | | | 0.75 | | | | (0.47 | ) | | | (0.16 | ) | | | 0.12 | | | | (0.15 | ) | | | 1.17 | | | | (0.78 | ) | | | (0.04 | ) | | | 0.35 | | | | (0.15 | ) |
| Net Asset Value at end of period | | $ | 10.33 | | | $ | 9.58 | | | $ | 10.05 | | | $ | 10.21 | | | $ | 10.09 | | | $ | 12.04 | | | $ | 10.87 | | | $ | 11.65 | | | $ | 11.69 | | | $ | 11.34 | |
| Total Return (%)2 | | | 10.82 | | | | (2.11 | ) | | | 1.41 | | | | 4.59 | | | | 1.71 | | | | 14.32 | | | | (3.11 | ) | | | 2.97 | | | | 6.45 | | | | 1.40 | |
| Ratios/Supplemental Data: | | | | | | | | | | | | | | | | | | | | | | | | | | | | | | | | | | | | | | | | |
| Net Assets at end of period (in 000’s) | | $ | 1,967 | | | $ | 1,609 | | | $ | 1,802 | | | $ | 1,876 | | | $ | 1,693 | | | $ | 15,098 | | | $ | 19,668 | | | $ | 21,773 | | | $ | 23,846 | | | $ | 23,545 | |
| Ratios of expenses to average net assets (%) | | | 0.52 | | | | 0.52 | | | | 0.52 | | | | 0.53 | | | | 0.52 | | | | 0.65 | | | | 0.65 | | | | 0.65 | | | | 0.66 | | | | 0.65 | |
| Ratio of net investment income to average net assets (%) | | | 2.72 | | | | 2.58 | | | | 2.38 | | | | 2.38 | | | | 2.24 | | | | 3.08 | | | | 2.95 | | | | 2.88 | | | | 2.86 | | | | 2.55 | |
| Portfolio turnover (%)3 | | | 36 | | | | 26 | | | | 27 | | | | 39 | | | | 57 | | | | 20 | | | | 21 | | | | 23 | | | | 36 | | | | 37 | |
1Net investment income calculated excluding permanent tax adjustments to undistributed net investment income.
2 Total return without applicable sales charge.
3Portfolio turnover is calculated at the fund level and represents the entire fiscal year.
4 Amounts represent less than $0.005 per share.
See accompanying Notes to Financial Statements.
49
Madison Funds | October 31, 2019
| |
| Financial Highlights for a Share of Beneficial Interest Outstanding |
| | | HIGH INCOME FUND | |
| | | CLASS A | | | CLASS B | | | CLASS Y | |
| | | Year Ended October 31, | | | Year Ended October 31, | | | Year Ended October 31, | |
| | | 2019 | | | 2018 | | | 2017 | | | 2016 | | | 2015 | | | 2019 | | | 2018 | | | 2017 | | | 2016 | | | 2015 | | | 2019 | | | 2018 | | | 2017 | | | 2016 | | | 2015 | |
| Net Asset Value at beginning of period | | $ | 5.80 | | | $ | 6.19 | | | $ | 6.03 | | | $ | 5.93 | | | $ | 6.79 | | | $ | 5.97 | | | $ | 6.37 | | | $ | 6.19 | | | $ | 6.08 | | | $ | 6.95 | | | $ | 5.68 | | | $ | 6.09 | | | $ | 5.94 | | | $ | 5.86 | | | $ | 6.73 | |
| Income from Investment Operations: | | | | | | | | | | | | | | | | | | | | | | | | | | | | | | | | | | | | | | | | | | | | | | | | | | | | | | | | | | | | |
| Net investment income | | | 0.29 | | | | 0.30 | | | | 0.29 | 1 | | | 0.29 | 1 | | | 0.32 | 1 | | | 0.27 | | | | 0.29 | | | | 0.26 | 1 | | | 0.26 | 1 | | | 0.29 | 1 | | | 0.28 | | | | 0.33 | | | | 0.26 | 1 | | | 0.27 | 1 | | | 0.01 | 1 |
| Net realized and unrealized gain (loss) on investments | | | 0.03 | | | | (0.39 | ) | | | 0.16 | | | | 0.10 | | | | (0.47 | ) | | | 0.02 | | | | (0.43 | ) | | | 0.16 | | | | 0.10 | | | | (0.50 | ) | | | 0.06 | | | | (0.41 | ) | | | 0.21 | | | | 0.13 | | | | (0.14 | ) |
| Total from investment operations | | | 0.32 | | | | (0.09 | ) | | | 0.45 | | | | 0.39 | | | | (0.15 | ) | | | 0.29 | | | | (0.14 | ) | | | 0.42 | | | | 0.36 | | | | (0.21 | ) | | | 0.34 | | | | (0.08 | ) | | | 0.47 | | | | 0.40 | | | | (0.13 | ) |
| Less Distributions From: | | | | | | | | | | | | | | | | | | | | | | | | | | | | | | | | | | | | | | | | | | | | | | | | | | | | | | | | | | | | |
| Net investment income | | | (0.29 | ) | | | (0.30 | ) | | | (0.29 | ) | | | (0.29 | ) | | | (0.32 | ) | | | (0.25 | ) | | | (0.26 | ) | | | (0.24 | ) | | | (0.25 | ) | | | (0.27 | ) | | | (0.31 | ) | | | (0.33 | ) | | | (0.32 | ) | | | (0.32 | ) | | | (0.35 | ) |
| Capital gains | | | – | | | | – | | | | – | | | | – | | | | (0.39 | ) | | | – | | | | – | | | | – | | | | – | | | | (0.39 | ) | | | – | | | | – | | | | – | | | | – | | | | (0.39 | ) |
| Total distributions | | | (0.29 | ) | | | (0.30 | ) | | | (0.29 | ) | | | (0.29 | ) | | | (0.71 | ) | | | (0.25 | ) | | | (0.26 | ) | | | (0.24 | ) | | | (0.25 | ) | | | (0.66 | ) | | | (0.31 | ) | | | (0.33 | ) | | | (0.32 | ) | | | (0.32 | ) | | | (0.74 | ) |
| Net decrease in net asset value | | | 0.03 | | | | (0.39 | ) | | | 0.16 | | | | 0.10 | | | | (0.86 | ) | | | 0.04 | | | | (0.40 | ) | | | 0.18 | | | | 0.11 | | | | (0.87 | ) | | | 0.03 | | | | (0.41 | ) | | | 0.15 | | | | 0.08 | | | | (0.87 | ) |
| Net Asset Value at end of period | | $ | 5.83 | | | $ | 5.80 | | | $ | 6.19 | | | $ | 6.03 | | | $ | 5.93 | | | $ | 6.01 | | | $ | 5.97 | | | $ | 6.37 | | | $ | 6.19 | | | $ | 6.08 | | | $ | 5.71 | | | $ | 5.68 | | | $ | 6.09 | | | $ | 5.94 | | | $ | 5.86 | |
| Total Return (%)2 | | | 5.68 | | | | (1.42 | ) | | | 7.61 | | | | 6.91 | | | | (2.29 | ) | | | 4.92 | | | | (2.25 | ) | | | 6.92 | | | | 6.07 | | | | (3.11 | ) | | | 6.07 | | | | (1.32 | ) | | | 8.06 | | | | 7.15 | | | | (2.00 | ) |
| Ratios/Supplemental Data: | | | | | | | | | | | | | | | | | | | | | | | | | | | | | | | | | | | | | | | | | | | | | | | | | | | | | | | | | | | | |
| Net Assets at end of period (in 000’s) | | $ | 16,772 | | | $ | 17,755 | | | $ | 21,298 | | | $ | 21,403 | | | $ | 23,155 | | | $ | 1,018 | | | $ | 1,137 | | | $ | 1,505 | | | $ | 1,651 | | | $ | 1,685 | | | $ | 902 | | | $ | 786 | | | $ | 797 | | | $ | 712 | | | $ | 664 | |
| Ratios of expenses to average net assets (%) | | | 1.00 | | | | 1.00 | | | | 1.00 | | | | 1.01 | | | | 1.00 | | | | 1.75 | | | | 1.75 | | | | 1.75 | | | | 1.76 | | | | 1.75 | | | | 0.75 | | | | 0.75 | | | | 0.75 | | | | 0.75 | | | | 0.75 | |
| Ratio of net investment income to average net assets (%) | | | 4.98 | | | | 5.00 | | | | 4.72 | | | | 4.98 | | | | 5.12 | | | | 4.24 | | | | 4.24 | | | | 3.97 | | | | 4.23 | | | | 4.36 | | | | 5.22 | | | | 5.24 | | | | 4.97 | | | | 5.20 | | | | 5.39 | |
| Portfolio turnover (%)3 | | | 16 | | | | 25 | | | | 53 | | | | 73 | | | | 28 | | | | 16 | | | | 25 | | | | 53 | | | | 73 | | | | 28 | | | | 16 | | | | 25 | | | | 53 | | | | 73 | | | | 28 | |
| | | DIVERSIFIED INCOME FUND | |
| | | CLASS A | | | CLASS B | | | CLASS C | |
| | | Year Ended October 31, | | | Year Ended October 31, | | | Year Ended October 31, | |
| | | 2019 | | | 2018 | | | 2017 | | | 2016 | | | 2015 | | | 2019 | | | 2018 | | | 2017 | | | 2016 | | | 2015 | | | 2019 | | | 2018 | | | 2017 | | | 2016 | | | 2015 | |
| Net Asset Value at beginning of period | | $ | 15.98 | | | $ | 15.93 | | | $ | 14.92 | | | $ | 14.75 | | | $ | 14.79 | | | $ | 16.08 | | | $ | 16.04 | | | $ | 15.01 | | | $ | 14.83 | | | $ | 14.88 | | | $ | 16.07 | | | $ | 16.03 | | | $ | 15.01 | | | $ | 14.83 | | | $ | 14.88 | |
| Income from Investment Operations: | | | | | | | | | | | | | | | | | | | | | | | | | | | | | | | | | | | | | | | | | | | | | | | | | | | | | | | | | | | | |
| Net investment income | | | 0.28 | | | | 0.28 | | | | 0.26 | 1 | | | 0.25 | 1 | | | 0.23 | 1 | | | 0.16 | | | | 0.16 | | | | 0.14 | 1 | | | 0.14 | 1 | | | 0.13 | 1 | | | 0.16 | | | | 0.16 | | | | 0.14 | 1 | | | 0.14 | 1 | | | 0.13 | 1 |
| Net realized and unrealized gain (loss) on investments | | | 1.64 | | | | 0.30 | | | | 1.56 | | | | 0.52 | | | | (0.03 | ) | | | 1.65 | | | | 0.29 | | | | 1.58 | | | | 0.53 | | | | (0.04 | ) | | | 1.66 | | | | 0.29 | | | | 1.57 | | | | 0.53 | | | | (0.04 | ) |
| Total from investment operations | | | 1.92 | | | | 0.58 | | | | 1.82 | | | | 0.77 | | | | 0.20 | | | | 1.81 | | | | 0.45 | | | | 1.72 | | | | 0.67 | | | | 0.09 | | | | 1.82 | | | | 0.45 | | | | 1.71 | | | | 0.67 | | | | 0.09 | |
| Less Distributions From: | | | | | | | | | | | | | | | | | | | | | | | | | | | | | | | | | | | | | | | | | | | | | | | | | | | | | | | | | | | | |
| Net investment income | | | (0.29 | ) | | | (0.29 | ) | | | (0.27 | ) | | | (0.26 | ) | | | (0.24 | ) | | | (0.17 | ) | | | (0.17 | ) | | | (0.15 | ) | | | (0.15 | ) | | | (0.14 | ) | | | (0.17 | ) | | | (0.17 | ) | | | (0.15 | ) | | | (0.15 | ) | | | (0.14 | ) |
| Capital gains | | | (1.24 | ) | | | (0.24 | ) | | | (0.54 | ) | | | (0.34 | ) | | | – | | | | (1.24 | ) | | | (0.24 | ) | | | (0.54 | ) | | | (0.34 | ) | | | – | | | | (1.24 | ) | | | (0.24 | ) | | | (0.54 | ) | | | (0.34 | ) | | | – | |
| Total distributions | | | (1.53 | ) | | | (0.53 | ) | | | (0.81 | ) | | | (0.60 | ) | | | (0.24 | ) | | | (1.41 | ) | | | (0.41 | ) | | | (0.69 | ) | | | (0.49 | ) | | | (0.14 | ) | | | (1.41 | ) | | | (0.41 | ) | | | (0.69 | ) | | | (0.49 | ) | | | (0.14 | ) |
| Net increase (decrease) in net asset value | | | 0.39 | | | | 0.05 | | | | 1.01 | | | | 0.17 | | | | (0.04 | ) | | | 0.40 | | | | 0.04 | | | | 1.03 | | | | 0.18 | | | | (0.05 | ) | | | 0.41 | | | | 0.04 | | | | 1.02 | | | | 0.18 | | | | (0.05 | ) |
| Net Asset Value at end of period | | $ | 16.37 | | | $ | 15.98 | | | $ | 15.93 | | | $ | 14.92 | | | $ | 14.75 | | | $ | 16.48 | | | $ | 16.08 | | | $ | 16.04 | | | $ | 15.01 | | | $ | 14.83 | | | $ | 16.48 | | | $ | 16.07 | | | $ | 16.03 | | | $ | 15.01 | | | $ | 14.83 | |
| Total Return (%)2 | | | 13.51 | | | | 3.63 | | | | 12.57 | | | | 5.38 | | | | 1.39 | | | | 12.64 | | | | 2.77 | | | | 11.79 | | | | 4.63 | | | | 0.58 | | | | 12.72 | | | | 2.77 | | | | 11.72 | | | | 4.63 | | | | 0.64 | |
| Ratios/Supplemental Data: | | | | | | | | | | | | | | | | | | | | | | | | | | | | | | | | | | | | | | | | | | | | | | | | | | | | | | | | | | | | |
| Net Assets at end of period (in 000’s) | | $ | 139,683 | | | $ | 131,127 | | | $ | 137,863 | | | $ | 128,208 | | | $ | 121,026 | | | $ | 9,612 | | | $ | 10,832 | | | $ | 12,702 | | | $ | 13,293 | | | $ | 13,442 | | | $ | 16,090 | | | $ | 14,647 | | | $ | 15,103 | | | $ | 13,498 | | | $ | 12,766 | |
| Ratios of expenses to average net assets (%) | | | 1.10 | | | | 1.10 | | | | 1.10 | | | | 1.11 | | | | 1.10 | | | | 1.85 | | | | 1.85 | | | | 1.85 | | | | 1.86 | | | | 1.85 | | | | 1.84 | | | | 1.85 | | | | 1.85 | | | | 1.86 | | | | 1.85 | |
| Ratio of net investment income to average net assets (%) | | | 1.80 | | | | 1.72 | | | | 1.65 | | | | 1.68 | | | | 1.59 | | | | 1.06 | | | | 0.97 | | | | 0.91 | | | | 0.94 | | | | 0.84 | | | | 1.05 | | | | 0.97 | | | | 0.89 | | | | 0.93 | | | | 0.84 | |
| Portfolio turnover (%)3 | | | 34 | | | | 27 | | | | 21 | | | | 35 | | | | 25 | | | | 34 | | | | 27 | | | | 21 | | | | 35 | | | | 25 | | | | 34 | | | | 27 | | | | 21 | | | | 35 | | | | 25 | |
1Net investment income calculated excluding permanent tax adjustments to undistributed net investment income.
2 Total return without applicable sales charge.
3 Portfolio turnover is calculated at the fund level and represents the entire fiscal year.
See accompanying Notes to Financial Statements.
50
Madison Funds | October 31, 2019
| |
| Financial Highlights for a Share of Beneficial Interest Outstanding |
| | | COVERED CALL & EQUITY INCOME FUND | |
| | | CLASS A | | | CLASS C | | | CLASS Y | |
| | | Year Ended October 31, | | | Year Ended October 31, | | | Year Ended October 31, | |
| | | 2019 | | | 2018 | | | 2017 | | | 2016 | | | 2015 | | | 2019 | | | 2018 | | | 2017 | | | 2016 | | | 2015 | | | 2019 | | | 2018 | | | 2017 | | | 2016 | | | 2015 | |
| Net Asset Value at beginning of period | | $ | 8.52 | | | $ | 8.88 | | | $ | 8.95 | | | $ | 9.14 | | | $ | 9.92 | | | $ | 8.04 | | | $ | 8.47 | | | $ | 8.63 | | | $ | 8.89 | | | $ | 9.74 | | | $ | 8.73 | | | $ | 9.06 | | | $ | 9.11 | | | $ | 9.27 | | | $ | 10.03 | |
| Income from Investment Operations: | | | | | | | | | | | | | | | | | | | | | | | | | | | | | | | | | | | | | | | | | | | | | | | | | | | | | | | | | | | | |
| Net investment income | | | 0.03 | | | | 0.06 | | | | 0.07 | | | | 0.05 | | | | 0.06 | | | | (0.05 | ) | | | (0.10 | ) | | | 0.02 | | | | 0.06 | | | | 0.16 | | | | 0.12 | | | | 0.10 | | | | 0.14 | | | | 0.08 | | | | 0.14 | |
| Net realized and unrealized gain (loss) on investments | | | 0.05 | | | | 0.30 | | | | 0.46 | | | | 0.33 | | | | (0.06 | ) | | | 0.07 | | | | 0.38 | | | | 0.42 | | | | 0.24 | | | | (0.23 | ) | | | (0.02 | ) | | | 0.29 | | | | 0.42 | | | | 0.33 | | | | (0.12 | ) |
| Total from investment operations | | | 0.08 | | | | 0.36 | | | | 0.53 | | | | 0.38 | | | | – | | | | 0.02 | | | | 0.28 | | | | 0.44 | | | | 0.30 | | | | (0.07 | ) | | | 0.10 | | | | 0.39 | | | | 0.56 | | | | 0.41 | | | | 0.02 | |
| Less Distributions From: | | | | | | | | | | | | | | | | | | | | | | | | | | | | | | | | | | | | | | | | | | | | | | | | | | | | | | | | | | | | |
| Net investment income | | | (0.44 | ) | | | (0.43 | ) | | | (0.39 | ) | | | (0.41 | ) | | | (0.50 | ) | | | (0.43 | ) | | | (0.42 | ) | | | (0.39 | ) | | | (0.40 | ) | | | (0.50 | ) | | | (0.45 | ) | | | (0.43 | ) | | | (0.40 | ) | | | (0.41 | ) | | | (0.50 | ) |
| Capital gains | | | (0.32 | ) | | | (0.29 | ) | | | (0.21 | ) | | | (0.16 | ) | | | (0.28 | ) | | | (0.32 | ) | | | (0.29 | ) | | | (0.21 | ) | | | (0.16 | ) | | | (0.28 | ) | | | (0.32 | ) | | | (0.29 | ) | | | (0.21 | ) | | | (0.16 | ) | | | (0.28 | ) |
| Total distributions | | | (0.76 | ) | | | (0.72 | ) | | | (0.60 | ) | | | (0.57 | ) | | | (0.78 | ) | | | (0.75 | ) | | | (0.71 | ) | | | (0.60 | ) | | | (0.56 | ) | | | (0.78 | ) | | | (0.77 | ) | | | (0.72 | ) | | | (0.61 | ) | | | (0.57 | ) | | | (0.78 | ) |
| Net decrease in net asset value | | | (0.68 | ) | | | (0.36 | ) | | | (0.07 | ) | | | (0.19 | ) | | | (0.78 | ) | | | (0.73 | ) | | | (0.43 | ) | | | (0.16 | ) | | | (0.26 | ) | | | (0.85 | ) | | | (0.67 | ) | | | (0.33 | ) | | | (0.05 | ) | | | (0.16 | ) | | | (0.76 | ) |
| Net Asset Value at end of period | | $ | 7.84 | | | $ | 8.52 | | | $ | 8.88 | | | $ | 8.95 | | | $ | 9.14 | | | $ | 7.31 | | | $ | 8.04 | | | $ | 8.47 | | | $ | 8.63 | | | $ | 8.89 | | | $ | 8.06 | | | $ | 8.73 | | | $ | 9.06 | | | $ | 9.11 | | | $ | 9.27 | |
| Total Return (%)2 | | | 1.46 | | | | 3.96 | | | | 5.97 | | | | 4.29 | | | | (0.18 | ) | | | 0.68 | | | | 3.21 | | | | 5.09 | | | | 3.53 | | | | (0.83 | ) | | | 1.60 | | | | 4.29 | | | | 6.15 | | | | 4.63 | | | | 0.13 | |
| Ratios/Supplemental Data: | | | | | | | | | | | | | | | | | | | | | | | | | | | | | | | | | | | | | | | | | | | | | | | | | | | | | | | | | | | | |
| Net Assets at end of period (in 000’s) | | $ | 13,748 | | | $ | 16,035 | | | $ | 16,773 | | | $ | 18,252 | | | $ | 16,042 | | | $ | 8,191 | | | $ | 9,638 | | | $ | 13,299 | | | $ | 13,519 | | | $ | 9,287 | | | $ | 102,018 | | | $ | 106,576 | | | $ | 95,640 | | | $ | 71,241 | | | $ | 60,916 | |
| Ratios of expenses to average net assets (%) | | | 1.25 | | | | 1.25 | | | | 1.25 | | | | 1.25 | | | | 1.25 | | | | 2.00 | | | | 2.00 | | | | 2.00 | | | | 2.00 | | | | 1.99 | | | | 1.00 | | | | 1.00 | | | | 1.00 | | | | 1.00 | | | | 1.00 | |
| Ratio of net investment income to average net assets (%) | | | 1.05 | | | | 0.47 | | | | 1.03 | | | | 0.17 | | | | 0.13 | | | | 0.29 | | | | (0.28 | ) | | | 0.28 | | | | (0.58 | ) | | | (0.59 | ) | | | 1.28 | | | | 0.73 | | | | 1.26 | | | | 0.42 | | | | 0.40 | |
| Portfolio turnover (%)3 | | | 116 | | | | 130 | | | | 166 | | | | 135 | | | | 107 | | | | 116 | | | | 130 | | | | 166 | | | | 135 | | | | 107 | | | | 116 | | | | 130 | | | | 166 | | | | 135 | | | | 107 | |
| | | COVERED CALL & EQUITY INCOME FUND | | | DIVIDEND INCOME FUND | |
| | | CLASS R6 | | | CLASS Y | |
| | | Year Ended October 31, | | | Year Ended October 31, | |
| | | 2019 | | | 2018 | | | 2017 | | | 2016 | | | 2015 | | | 2019 | | | 2018 | | | 2017 | | | 2016 | | | 2015 | |
| Net Asset Value at beginning of period | | $ | 8.81 | | | $ | 9.13 | | | $ | 9.16 | | | $ | 9.31 | | | $ | 10.06 | | | $ | 27.01 | | | $ | 26.18 | | | $ | 22.38 | | | $ | 22.28 | | | $ | 23.59 | |
| Income from Investment Operations: | | | | | | | | | | | | | | | | | | | | | | | | | | | | | | | | | | | | | | | | |
| Net investment income | | | 0.18 | | | | 0.06 | | | | 0.14 | | | | 0.07 | | | | 0.24 | | | | 0.46 | | | | 0.47 | | | | 0.44 | 1 | | | 0.33 | 1 | | | 0.40 | 1 |
| Net realized and unrealized gain (loss) on investments | | | (0.06 | ) | | | 0.34 | | | | 0.44 | | | | 0.35 | | | | (0.21 | ) | | | 3.12 | | | | 1.42 | | | | 4.34 | | | | 0.99 | | | | 0.01 | |
| Total from investment operations | | | 0.12 | | | | 0.40 | | | | 0.58 | | | | 0.42 | | | | 0.03 | | | | 3.58 | | | | 1.89 | | | | 4.78 | | | | 1.32 | | | | 0.41 | |
| Less Distributions From: | | | | | | | | | | | | | | | | | | | | | | | | | | | | | | | | | | | | | | | | |
| Net investment income | | | (0.45 | ) | | | (0.43 | ) | | | (0.40 | ) | | | (0.41 | ) | | | (0.50 | ) | | | (0.43 | ) | | | (0.47 | ) | | | (0.44 | ) | | | (0.32 | ) | | | (0.38 | ) |
| Capital gains | | | (0.32 | ) | | | (0.29 | ) | | | (0.21 | ) | | | (0.16 | ) | | | (0.28 | ) | | | (2.51 | ) | | | (0.59 | ) | | | (0.54 | ) | | | (0.90 | ) | | | (1.34 | ) |
| Total distributions | | | (0.77 | ) | | | (0.72 | ) | | | (0.61 | ) | | | (0.57 | ) | | | (0.78 | ) | | | (2.94 | ) | | | (1.06 | ) | | | (0.98 | ) | | | (1.22 | ) | | | (1.72 | ) |
| Net increase (decrease) in net asset value | | | (0.65 | ) | | | (0.32 | ) | | | (0.03 | ) | | | (0.15 | ) | | | (0.75 | ) | | | 0.64 | | | | 0.83 | | | | 3.80 | | | | 0.10 | | | | (1.31 | ) |
| Net Asset Value at end of period | | $ | 8.16 | | | $ | 8.81 | | | $ | 9.13 | | | $ | 9.16 | | | $ | 9.31 | | | $ | 27.65 | | | $ | 27.01 | | | $ | 26.18 | | | $ | 22.38 | | | $ | 22.28 | |
| Total Return (%)2 | | | 1.82 | | | | 4.37 | | | | 6.34 | | | | 4.72 | | | | 0.23 | | | | 15.48 | | | | 7.35 | | | | 21.85 | | | | 6.16 | | | | 1.76 | |
| Ratios/Supplemental Data: | | | | | | | | | | | | | | | | | | | | | | | | | | | | | | | | | | | | | | | | |
| Net Assets at end of period (in 000’s) | | $ | 2,385 | | | $ | 2,388 | | | $ | 2,531 | | | $ | 3,110 | | | $ | 2,826 | | | $ | 220,725 | | | $ | 111,457 | | | $ | 107,411 | | | $ | 102,402 | | | $ | 20,925 | |
| Ratios of expenses to average net assets: | | | | | | | | | | | | | | | | | | | | | | | | | | | | | | | | | | | | | | | | |
| Before reimbursement of expenses by Adviser (%) | | | 0.87 | | | | 0.87 | | | | 0.87 | | | | 0.88 | | | | 0.87 | | | | 1.10 | | | | 1.10 | | | | 1.10 | | | | 1.10 | | | | 1.10 | |
| After reimbursement of expenses by Adviser (%) | | | 0.87 | | | | 0.87 | | | | 0.87 | | | | 0.88 | | | | 0.87 | | | | 0.95 | | | | 0.95 | | | | 0.95 | | | | 0.95 | | | | 0.95 | |
| Ratio of net investment income (loss) to average net assets | | | | | | | | | | | | | | | | | | | | | | | | | | | | | | | | | | | | | | | | |
| Before reimbursement of expenses by Adviser (%) | | | 1.41 | | | | 0.85 | | | | 1.26 | | | | 0.55 | | | | 0.70 | | | | 1.64 | | | | 1.60 | | | | 1.66 | | | | 1.46 | | | | 1.60 | |
| After reimbursement and waiver of expenses by Adviser (%) | | | 1.41 | | | | 0.85 | | | | 1.26 | | | | 0.55 | | | | 0.70 | | | | 1.79 | | | | 1.75 | | | | 1.81 | | | | 1.61 | | | | 1.75 | |
| Portfolio turnover (%)3 | | | 116 | | | | 130 | | | | 166 | | | | 135 | | | | 107 | | | | 28 | | | | 32 | | | | 19 | | | | 33 | | | | 24 | |
1Net investment income (loss) calculated excluding permanent tax adjustments to undistributed net investment income.
2Total return without applicable sales charge.
3 Portfolio turnover is calculated at the fund level and represents the entire fiscal year.
See accompanying Notes to Financial Statements.
51
Madison Funds | October 31, 2019
| |
| Financial Highlights for a Share of Beneficial Interest Outstanding |
| | | | | | | | | | | | | | | | | | | | | | | | | | | | | | | | | | | | | | | | | | | | | | |
| | | LARGE CAP VALUE FUND | |
| | | CLASS A | | | CLASS B | | | CLASS Y | |
| | | Year Ended October 31, | | | Year Ended October 31, | | | Year Ended October 31, | |
| | | 2019 | | | 2018 | | | 2017 | | | 2016 | | | 2015 | | | 2019 | | | 2018 | | | 2017 | | | 2016 | | | 2015 | | | 2019 | | | 2018 | | | 2017 | | | 2016 | | | 2015 | |
| Net Asset Value at beginning of period | | $ | 14.14 | | | $ | 15.52 | | | $ | 15.47 | | | $ | 16.33 | | | $ | 19.18 | | | $ | 13.72 | | | $ | 15.10 | | | $ | 15.09 | | | $ | 16.01 | | | $ | 18.84 | | | $ | 14.14 | | | $ | 15.53 | | | $ | 15.48 | | | $ | 16.35 | | | $ | 19.20 | |
| Income from Investment Operations: | | | | | | | | | | | | | | | | | | | | | | | | | | | | | | | | | | | | | | | | | | | | | | | | | | | | | | | | | | | | |
| Net investment income (loss) | | | 0.11 | | | | 0.13 | | | | 0.25 | 1 | | | 0.16 | 1 | | | 0.08 | 1 | | | 0.05 | | | | 0.05 | | | | 0.16 | 1 | | | 0.06 | 1 | | | (0.05 | )1 | | | 0.75 | | | | 0.17 | | | | 0.37 | 1 | | | 0.26 | 1 | | | 0.14 | 1 |
| Net realized and unrealized gain (loss) on investments | | | 0.29 | | | | 0.10 | | | | 2.05 | | | | 0.92 | | | | (0.10 | ) | | | 0.26 | | | | 0.06 | | | | 1.98 | | | | 0.88 | | | | (0.09 | ) | | | (0.31 | ) | | | 0.09 | | | | 1.97 | | | | 0.85 | | | | (0.11 | ) |
| Total from investment operations | | | 0.40 | | | | 0.23 | | | | 2.30 | | | | 1.08 | | | | (0.02 | ) | | | 0.31 | | | | 0.11 | | | | 2.14 | | | | 0.94 | | | | (0.14 | ) | | | 0.44 | | | | 0.26 | | | | 2.34 | | | | 1.11 | | | | 0.03 | |
| Less Distributions From: | | | | | | | | | | | | | | | | | | | | | | | | | | | | | | | | | | | | | | | | | | | | | | | | | | | | | | | | | | | | |
| Net investment income | | | (0.15 | ) | | | (0.27 | ) | | | (0.18 | ) | | | (0.10 | ) | | | (0.14 | ) | | | (0.06 | ) | | | (0.15 | ) | | | (0.06 | ) | | | (0.02 | ) | | | (0.00 | )4 | | | (0.18 | ) | | | (0.31 | ) | | | (0.22 | ) | | | (0.14 | ) | | | (0.19 | ) |
| Capital gains | | | (1.43 | ) | | | (1.34 | ) | | | (2.07 | ) | | | (1.84 | ) | | | (2.69 | ) | | | (1.43 | ) | | | (1.34 | ) | | | (2.07 | ) | | | (1.84 | ) | | | (2.69 | ) | | | (1.43 | ) | | | (1.34 | ) | | | (2.07 | ) | | | (1.84 | ) | | | (2.69 | ) |
| Total distributions | | | (1.58 | ) | | | (1.61 | ) | | | (2.25 | ) | | | (1.94 | ) | | | (2.83 | ) | | | (1.49 | ) | | | (1.49 | ) | | | (2.13 | ) | | | (1.86 | ) | | | (2.69 | ) | | | (1.61 | ) | | | (1.65 | ) | | | (2.29 | ) | | | (1.98 | ) | | | (2.88 | ) |
| Net increase (decrease) in net asset value | | | (1.18 | ) | | | (1.38 | ) | | | 0.05 | | | | (0.86 | ) | | | (2.85 | ) | | | (1.18 | ) | | | (1.38 | ) | | | 0.01 | | | | (0.92 | ) | | | (2.83 | ) | | | (1.17 | ) | | | (1.39 | ) | | | 0.05 | | | | (0.87 | ) | | | (2.85 | ) |
| Net Asset Value at end of period | | $ | 12.96 | | | $ | 14.14 | | | $ | 15.52 | | | $ | 15.47 | | | $ | 16.33 | | | $ | 12.54 | | | $ | 13.72 | | | $ | 15.10 | | | $ | 15.09 | | | $ | 16.01 | | | $ | 12.97 | | | $ | 14.14 | | | $ | 15.53 | | | $ | 15.48 | | | $ | 16.35 | |
| Total Return (%)2 | | | 4.89 | | | | 1.10 | | | | 16.36 | | | | 7.16 | | | | (0.80 | ) | | | 4.18 | | | | 0.29 | | | | 15.43 | | | | 6.38 | | | | (1.49 | ) | | | 5.24 | | | | 1.30 | | | | 16.60 | | | | 7.44 | | | | (0.51 | ) |
| Ratios/Supplemental Data: | | | | | | | | | | | | | | | | | | | | | | | | | | | | | | | | | | | | | | | | | | | | | | | | | | | | | | | | | | | | |
| Net Assets at end of period (in 000’s) | | $ | 60,060 | | | $ | 63,143 | | | $ | 68,522 | | | $ | 62,757 | | | $ | 63,566 | | | $ | 1,984 | | | $ | 2,539 | | | $ | 3,318 | | | $ | 3,586 | | | $ | 4,096 | | | $ | 3,392 | | | $ | 19,098 | | | $ | 19,187 | | | $ | 36,721 | | | $ | 109,546 | |
| Ratios of expenses to average net assets (%) | | | 1.16 | | | | 1.16 | | | | 1.16 | | | | 1.17 | | | | 1.16 | | | | 1.91 | | | | 1.91 | | | | 1.91 | | | | 1.92 | | | | 1.91 | | | | 0.91 | | | | 0.91 | | | | 0.91 | | | | 0.92 | | | | 0.91 | |
| Ratio of net investment income to average net assets (%) | | | 0.82 | | | | 0.80 | | | | 1.65 | | | | 1.02 | | | | 0.47 | | | | 0.08 | | | | 0.01 | | | | 0.88 | | | | 0.27 | | | | (0.27 | ) | | | 1.11 | | | | 1.03 | | | | 1.74 | | | | 1.33 | | | | 0.73 | |
| Portfolio turnover (%)3 | | | 71 | | | | 91 | | | | 86 | | | | 74 | | | | 97 | | | | 71 | | | | 91 | | | | 86 | | | | 74 | | | | 97 | | | | 71 | | | | 91 | | | | 86 | | | | 74 | | | | 97 | |
| | | INVESTORS FUND | |
| | | CLASS A | | | CLASS Y | | | CLASS R6 | |
| | | Year Ended October 31 | | | Year Ended October 31, | | | Year Ended October 31 | |
| | | 2019 | | | 2018 | | | 2017 | | | 2016 | | | 2015 | | | 2019 | | | 2018 | | | 2017 | | | 2016 | | | 2015 | | | 2019 | | | 2018 | | | 2017 | | | 2016 | | | 2015 | |
| Net Asset Value at beginning of period | | $ | 23.85 | | | $ | 23.22 | | | $ | 19.57 | | | $ | 21.30 | | | $ | 25.01 | | | $ | 23.92 | | | $ | 23.29 | | | $ | 19.62 | | | $ | 21.36 | | | $ | 25.07 | | | $ | 24.07 | | | $ | 23.44 | | | $ | 19.74 | | | $ | 21.47 | | | $ | 25.14 | |
| Income from Investment Operations: | | | | | | | | | | | | | | | | | | | | | | | | | | | | | | | | | | | | | | | | | | | | | | | | | | | | | | | | | | | | |
| Net investment income (loss) | | | 0.06 | | | | 0.05 | | | | 0.03 | 1 | | | (0.00 | )1,4,5 | | | 0.09 | 1 | | | 0.12 | | | | 0.11 | | | | 0.09 | 1 | | | 0.06 | 1,5 | | | 0.16 | 1 | | | 0.16 | | | | 0.15 | | | | 0.13 | 1 | | | 0.11 | 1,5 | | | 0.15 | 1 |
| Net realized and unrealized gain (loss) on investments | | | 3.39 | | | | 1.87 | | | | 4.23 | | | | 1.18 | | | | 1.06 | | | | 3.39 | | | | 1.87 | | | | 4.24 | | | | 1.17 | | | | 1.05 | | | | 3.43 | | | | 1.88 | | | | 4.26 | | | | 1.17 | | | | 1.10 | |
| Total from investment operations | | | 3.45 | | | | 1.92 | | | | 4.26 | | | | 1.18 | | | | 1.15 | | | | 3.51 | | | | 1.98 | | | | 4.33 | | | | 1.23 | | | | 1.21 | | | | 3.59 | | | | 2.03 | | | | 4.39 | | | | 1.28 | | | | 1.25 | |
| Less Distributions From: | | | | | | | | | | | | | | | | | | | | | | | | | | | | | | | | | | | | | | | | | | | | | | | | | | | | | | | | | | | | |
| Net investment income | | | (0.10 | ) | | | (0.03 | ) | | | – | | | | (0.12 | ) | | | (0.06 | ) | | | (0.16 | ) | | | (0.09 | ) | | | (0.05 | ) | | | (0.18 | ) | | | (0.12 | ) | | | (0.16 | ) | | | (0.14 | ) | | | (0.08 | ) | | | (0.22 | ) | | | (0.12 | ) |
| Capital gains | | | (3.44 | ) | | | (1.26 | ) | | | (0.61 | ) | | | (2.79 | ) | | | (4.80 | ) | | | (3.44 | ) | | | (1.26 | ) | | | (0.61 | ) | | | (2.79 | ) | | | (4.80 | ) | | | (3.44 | ) | | | (1.26 | ) | | | (0.61 | ) | | | (2.79 | ) | | | (4.80 | ) |
| Total distributions | | | (3.54 | ) | | | (1.29 | ) | | | (0.61 | ) | | | (2.91 | ) | | | (4.86 | ) | | | (3.60 | ) | | | (1.35 | ) | | | (0.66 | ) | | | (2.97 | ) | | | (4.92 | ) | | | (3.60 | ) | | | (1.40 | ) | | | (0.69 | ) | | | (3.01 | ) | | | (4.92 | ) |
| Net increase (decrease) in net asset value | | | (0.09 | ) | | | 0.63 | | | | 3.65 | | | | (1.73 | ) | | | (3.71 | ) | | | (0.09 | ) | | | 0.63 | | | | 3.67 | | | | (1.74 | ) | | | (3.71 | ) | | | (0.01 | ) | | | 0.63 | | | | 3.70 | | | | (1.73 | ) | | | (3.67 | ) |
| Net Asset Value at end of period | | $ | 23.76 | | | $ | 23.85 | | | $ | 23.22 | | | $ | 19.57 | | | $ | 21.30 | | | $ | 23.83 | | | $ | 23.92 | | | $ | 23.29 | | | $ | 19.62 | | | $ | 21.36 | | | $ | 24.06 | | | $ | 24.07 | | | $ | 23.44 | | | $ | 19.74 | | | $ | 21.47 | |
| Total Return(%)2 | | | 18.37 | | | | 8.50 | | | | 22.30 | | | | 6.46 | | | | 4.78 | | | | 18.63 | | | | 8.75 | | | | 22.62 | | | | 6.69 | | | | 5.07 | | | | 18.88 | | | | 8.90 | | | | 22.87 | | | | 6.92 | | | | 5.25 | |
| Ratios/Supplemental Data: | | | | | | | | | | | | | | | | | | | | | | | | | | | | | | | | | | | | | | | | | | | | | | | | | | | | | | | | | | | | |
| Net Assets at end of period (in 000’s) | | $ | 86,476 | | | $ | 78,043 | | | $ | 77,891 | | | $ | 67,479 | | | $ | 2,189 | | | $ | 244,443 | | | $ | 208,942 | | | $ | 222,363 | | | $ | 204,962 | | | $ | 109,506 | | | $ | 8,063 | | | $ | 6,919 | | | $ | 6,898 | | | $ | 6,198 | | | $ | 6,589 | |
| Ratios of expenses to average net assets: | | | | | | | | | | | | | | | | | | | | | | | | | | | | | | | | | | | | | | | | | | | | | | | | | | | | | | | | | | | | |
| Before reimbursement of expenses by Adviser (%) | | | 1.20 | | | | 1.20 | | | | 1.20 | | | | 1.20 | | | | 1.31 | | | | 0.95 | | | | 0.95 | | | | 0.95 | | | | 0.98 | | | | 1.06 | | | | 0.77 | | | | 0.77 | | | | 0.77 | | | | 0.77 | | | | 0.73 | |
| After reimbursement of expenses by Adviser (%) | | | 1.20 | | | | 1.20 | | | | 1.20 | | | | 1.20 | | | | 1.19 | | | | 0.95 | | | | 0.95 | | | | 0.95 | | | | 0.95 | | | | 0.94 | | | | 0.77 | | | | 0.77 | | | | 0.77 | | | | 0.77 | | | | 0.73 | |
| Ratio of net investment income to average net assets | | | | | | | | | | | | | | | | | | | | | | | | | | | | | | | | | | | | | | | | | | | | | | | | | | | | | | | | | | | | |
| After reimbursement and waiver of expenses by Adviser (%) | | | 0.23 | | | | 0.22 | | | | 0.14 | | | | (0.01 | ) | | | 0.38 | | | | 0.47 | | | | 0.47 | | | | 0.39 | | | | 0.33 | | | | 0.62 | | | | 0.65 | | | | 0.64 | | | | 0.56 | | | | 0.57 | | | | 0.83 | |
| Portfolio turnover (%)3 | | | 23 | | | | 40 | | | | 33 | | | | 27 | | | | 33 | | | | 23 | | | | 40 | | | | 33 | | | | 27 | | | | 33 | | | | 23 | | | | 40 | | | | 33 | | | | 27 | | | | 33 | |
1Net investment income (loss) calculated excluding permanent tax adjustments to undistributed net investment income.
2Total return without applicable sales charge.
3Portfolio turnover is calculated at the fund level and represents the entire fiscal year.
4Amounts represent less than $0.005 per share.
5Per share net investment income has been calculated using the average shares outstanding during the period.
See accompanying Notes to Financial Statements.
52
Madison Funds | October 31, 2019
| |
| Financial Highlights for a Share of Beneficial Interest Outstanding |
| | | MID CAP FUND | |
| | | CLASS A | | | CLASS B | |
| | | Year Ended October 31, | | | Year Ended October 31, | |
| | | 2019 | | | 2018 | | | 2017 | | | 2016 | | | 2015 | | | 2019 | | | 2018 | | | 2017 | | | 2016 | | | 2015 | |
| Net Asset Value at beginning of period | | $ | 9.77 | | | $ | 9.37 | | | $ | 8.34 | | | $ | 8.59 | | | $ | 9.78 | | | $ | 7.98 | | | $ | 7.78 | | | $ | 7.04 | | | $ | 7.38 | | | $ | 8.69 | |
| Income from Investment Operations: |
| Net investment loss | | | (0.07 | ) | | | (0.06 | ) | | | (0.05 | )1 | | | (0.04 | )1 | | | (0.06 | )1 | | | (0.32 | ) | | | (0.35 | ) | | | (0.20 | )1 | | | (0.14 | )1 | | | (0.13 | )1 |
| Net realized and unrealized gain (loss) on investments | | | 2.07 | | | | 0.81 | | | | 1.46 | | | | 0.29 | | | | 0.61 | | | | 1.86 | | | | 0.90 | | | | 1.32 | | | | 0.30 | | | | 0.56 | |
| Total from investment operations | | | 2.00 | | | | 0.75 | | | | 1.41 | | | | 0.25 | | | | 0.55 | | | | 1.54 | | | | 0.55 | | | | 1.12 | | | | 0.16 | | | | 0.43 | |
| Less Distributions From: |
| Capital gains | | | (0.68 | ) | | | (0.35 | ) | | | (0.38 | ) | | | (0.50 | ) | | | (1.74 | ) | | | (0.68 | ) | | | (0.35 | ) | | | (0.38 | ) | | | (0.50 | ) | | | (1.74 | ) |
| Total distributions | | | (0.68 | ) | | | (0.35 | ) | | | (0.38 | ) | | | (0.50 | ) | | | (1.74 | ) | | | (0.68 | ) | | | (0.35 | ) | | | (0.38 | ) | | | (0.50 | ) | | | (1.74 | ) |
| Net increase (decrease) in net asset value | | | 1.32 | | | | 0.40 | | | | 1.03 | | | | (0.25 | ) | | | (1.19 | ) | | | 0.86 | | | | 0.20 | | | | 0.74 | | | | (0.34 | ) | | | (1.31 | ) |
| Net Asset Value at end of period | | $ | 11.09 | | | $ | 9.77 | | | $ | 9.37 | | | $ | 8.34 | | | $ | 8.59 | | | $ | 8.84 | | | $ | 7.98 | | | $ | 7.78 | | | $ | 7.04 | | | $ | 7.38 | |
| Total Return (%)2 | | | 22.65 | | | | 8.15 | | | | 17.40 | | | | 3.12 | | | | 5.80 | | | | 21.91 | | | | 7.21 | | | | 16.46 | | | | 2.38 | | | | 5.06 | |
| Ratios/Supplemental Data: |
| Net Assets at end of period (in 000’s) | | $ | 66,250 | | | $ | 59,519 | | | $ | 59,175 | | | $ | 52,482 | | | $ | 54,000 | | | $ | 1,730 | | | $ | 1,891 | | | $ | 2,550 | | | $ | 2,832 | | | $ | 3,401 | |
| Ratios of expenses to average net assets (%) | | | 1.40 | | | | 1.40 | | | | 1.40 | | | | 1.41 | | | | 1.40 | | | | 2.15 | | | | 2.15 | | | | 2.15 | | | | 2.16 | | | | 2.15 | |
| Ratio of net investment income to average net assets (%) | | | (0.59 | ) | | | (0.51 | ) | | | (0.53 | ) | | | (0.47 | ) | | | (0.72 | ) | | | (1.33 | ) | | | (1.26 | ) | | | (1.28 | ) | | | (1.23 | ) | | | (1.47 | ) |
| Portfolio turnover (%)3 | | | 25 | | | | 27 | | | | 22 | | | | 27 | | | | 28 | | | | 25 | | | | 27 | | | | 22 | | | | 27 | | | | 28 | |
| | | MID CAP FUND | |
| | | CLASS Y | | | CLASS R6 | |
| | | Year Ended October 31, | | | Year Ended October 31, | |
| | | 2019 | | | 2018 | | | 2017 | | | 2016 | | | 2015 | | | 2019 | | | 2018 | | | 2017 | | | 2016 | | | 2015 | |
| Net Asset Value at beginning of period | | $ | 10.23 | | | $ | 9.76 | | | $ | 8.64 | | | $ | 8.85 | | | $ | 10.00 | | | $ | 10.44 | | | $ | 9.94 | | | $ | 8.77 | | | $ | 8.95 | | | $ | 10.06 | |
| Income from Investment Operations: | | | | | | | | | | | | | | | | | | | | | | | | | | | | | | | | | | | | | | | | |
| Net investment loss | | | (0.02 | ) | | | (0.01 | ) | | | (0.01 | )1 | | | 0.00 | 1,4 | | | (0.04 | )1 | | | (0.10 | ) | | | 0.01 | | | | 0.01 | 1 | | | 0.02 | 1 | | | (0.05 | )1 |
| Net realized and unrealized gain (loss) on investments | | | 2.18 | | | | 0.83 | | | | 1.51 | | | | 0.29 | | | | 0.63 | | | | 2.33 | | | | 0.84 | | | | 1.54 | | | | 0.30 | | | | 0.68 | |
| Total from investment operations | | | 2.16 | | | | 0.82 | | | | 1.50 | | | | 0.29 | | | | 0.59 | | | | 2.23 | | | | 0.85 | | | | 1.55 | | | | 0.32 | | | | 0.63 | |
| Less Distributions From: | | | | | | | | | | | | | | | | | | | | | | | | | | | | | | | | | | | | | | | | |
| Capital gains | | | (0.68 | ) | | | (0.35 | ) | | | (0.38 | ) | | | (0.50 | ) | | | (1.74 | ) | | | (0.68 | ) | | | (0.35 | ) | | | (0.38 | ) | | | (0.50 | ) | | | (1.74 | ) |
| Total distributions | | | (0.68 | ) | | | (0.35 | ) | | | (0.38 | ) | | | (0.50 | ) | | | (1.74 | ) | | | (0.68 | ) | | | (0.35 | ) | | | (0.38 | ) | | | (0.50 | ) | | | (1.74 | ) |
| Net increase (decrease) in net asset value | | | 1.48 | | | | 0.47 | | | | 1.12 | | | | (0.21 | ) | | | (1.15 | ) | | | 1.55 | | | | 0.50 | | | | 1.17 | | | | (0.18 | ) | | | (1.11 | ) |
| Net Asset Value at end of period | | $ | 11.71 | | | $ | 10.23 | | | $ | 9.76 | | | $ | 8.64 | | | $ | 8.85 | | | $ | 11.99 | | | $ | 10.44 | | | $ | 9.94 | | | $ | 8.77 | | | $ | 8.95 | |
| Total Return(%)2 | | | 23.27 | | | | 8.55 | | | | 17.85 | | | | 3.50 | | | | 6.13 | | | | 23.49 | | | | 8.71 | | | | 18.17 | | | | 3.81 | | | | 6.55 | |
| Ratios/Supplemental Data: | | | | | | | | | | | | | | | | | | | | | | | | | | | | | | | | | | | | | | | | |
| Net Assets at end of period (in 000’s) | | $ | 463,768 | | | $ | 351,716 | | | $ | 270,989 | | | $ | 242,308 | | | $ | 198,605 | | | $ | 55,417 | | | $ | 12,886 | | | $ | 11,713 | | | $ | 8,792 | | | $ | 9,874 | |
| Ratios of expenses to average net assets (%) | | | 0.98 | | | | 0.98 | | | | 0.98 | | | | 1.08 | | | | 1.15 | | | | 0.76 | | | | 0.77 | | | | 0.77 | | | | 0.78 | | | | 0.77 | |
| Ratio of net investment income to average net assets (%) | | | (0.18 | ) | | | (0.09 | ) | | | (0.11 | ) | | | (0.14 | ) | | | (0.47 | ) | | | (0.06 | ) | | | 0.12 | | | | 0.10 | | | | 0.16 | | | | (0.09 | ) |
| Portfolio turnover (%)3 | | | 25 | | | | 27 | | | | 22 | | | | 27 | | | | 28 | | | | 25 | | | | 27 | | | | 22 | | | | 27 | | | | 28 | |
1Net investment income (loss) calculated excluding permanent tax adjustments to undistributed net investment income.
2Total return without applicable sales charge.
3Portfolio turnover is calculated at the fund level and represents the entire fiscal year.
4Amounts represent less than $0.005 per share.
See accompanying Notes to Financial Statements.
53
Madison Funds | October 31, 2019
| |
| Financial Highlights for a Share of Beneficial Interest Outstanding |
| | | SMALL CAP FUND | |
| | | CLASS A | | | CLASS Y* | |
| | | Period Ended | | | Inception to | | | Period Ended | | | Period Ended | | | | | | | | | | | | | |
| | | October 31, | | | September 30, | | | October 31, | | | September 30, | | | Year Ended September 30, | |
| | | 20199 | | | 20195 | | | 20199 | | | 2019 | | | 20188 | | | 20178 | | | 20168 | | | 20158 | |
| Net Asset Value at beginning of period | | $ | 10.82 | | | $ | 10.53 | | | $ | 10.87 | | | $ | 15.56 | | | $ | 15.03 | | | $ | 14.09 | | | $ | 13.71 | | | $ | 15.58 | |
| Income from Investment Operations: | | | | | | | | | | | | | | | | | | | | | | | | | | | | | | | | |
| Net investment loss | | | (0.01 | ) | | | (0.01 | ) | | | (0.01 | ) | | | (0.04 | ) | | | (0.08 | ) | | | (0.09 | ) | | | (0.06 | ) | | | (0.08 | ) |
| Net realized and unrealized gain (loss) on investments | | | 0.33 | | | | 0.30 | | | | 0.33 | | | | (1.39 | ) | | | 2.21 | | | | 1.70 | | | | 1.60 | | | | (0.13 | ) |
| Total from investment operations | | | 0.32 | | | | 0.29 | | | | 0.32 | | | | (1.43 | ) | | | 2.13 | | | | 1.61 | | | | 1.54 | | | | (0.21 | ) |
| Less Distributions From: | | | | | | | | | | | | | | | | | | | | | | | | | | | | | | | | |
| Net investment income | | | – | | | | – | | | | – | | | | – | | | | – | | | | – | | | | – | | | | – | |
| Capital gains | | | – | | | | – | | | | – | | | | (3.26 | ) | | | (1.60 | ) | | | (0.67 | ) | | | (1.16 | ) | | | (1.66 | ) |
| Total distributions | | | – | | | | – | | | | – | | | | (3.26 | ) | | | (1.60 | ) | | | (0.67 | ) | | | (1.16 | ) | | | (1.66 | ) |
| Net increase (decrease) in net asset value | | | 0.32 | | | | 0.29 | | | | 0.32 | | | | (4.69 | ) | | | 0.53 | | | | 0.94 | | | | 0.38 | | | | (1.87 | ) |
| Net Asset Value at end of period | | $ | 11.14 | | | $ | 10.82 | | | $ | 11.19 | | | $ | 10.87 | | | $ | 15.56 | | | $ | 15.03 | | | $ | 14.09 | | | $ | 13.71 | |
| Total Return (%)2 | | | 2.96 | 6 | | | 2.75 | 6 | | | 2.94 | 6 | | | (8.81 | ) | | | 15.29 | | | | 11.58 | | | | 12.17 | | | | (2.40 | ) |
| Ratios/Supplemental Data: | | | | | | | | | | | | | | | | | | | | | | | | | | | | | | | | |
| Net Assets at end of period (in 000’s) | | $ | 3,457 | | | $ | 3,420 | | | $ | 263,527 | | | $ | 274,824 | | | $ | 543,961 | | | $ | 611,730 | | | $ | 653,838 | | | $ | 742,230 | |
| Ratios of expenses to average net assets: | | | | | | | | | | | | | | | | | | | | | | | | | | | | | | | | |
| Before reimbursement of expenses by Adviser (%) | | | 1.50 | 7 | | | 1.50 | 7 | | | 1.25 | 7 | | | 1.29 | | | | 1.21 | | | | 1.23 | | | | 1.25 | | | | 1.23 | |
| After reimbursement of expenses by Adviser (%) | | | 1.46 | 7 | | | 1.46 | 7 | | | 1.21 | 7 | | | 1.29 | | | | 1.21 | | | | 1.23 | | | | 1.25 | | | | 1.23 | |
| Ratio of net investment income to average net assets | | | | | | | | | | | | | | | | | | | | | | | | | | | | | | | | |
| Before reimbursement of expenses by Adviser (%) | | | (1.07 | )7 | | | (1.28 | )7 | | | (0.82 | )7 | | | (0.36 | ) | | | (0.57 | ) | | | (0.64 | ) | | | (0.42 | ) | | | (0.48 | ) |
| After reimbursement of expenses by Adviser (%) | | | (1.03 | )7 | | | (1.24 | )7 | | | (0.78 | )7 | | | (0.36 | ) | | | (0.57 | ) | | | (0.64 | ) | | | (0.42 | ) | | | (0.48 | ) |
| Portfolio turnover (%)3 | | | 3 | | | | 73 | | | | 3 | | | | 73 | | | | 49 | | | | 53 | | | | 40 | | | | 41 | |
| | | INTERNATIONAL STOCK FUND | |
| | | CLASS A | | | CLASS B | | | CLASS Y | |
| | | Year Ended October 31, | | | Year Ended October 31, | | | Year Ended October 31, | |
| | | 2019 | | | 2018 | | | 2017 | | | 2016 | | | 2015 | | | 2019 | | | 2018 | | | 2017 | | | 2016 | | | 2015 | | | 2019 | | | 2018 | | | 2017 | | | 2016 | | | 2015 | |
| Net Asset Value at beginning of period | | $ | 12.92 | | | $ | 14.00 | | | $ | 12.03 | | | $ | 12.99 | | | $ | 13.20 | | | $ | 12.56 | | | $ | 13.63 | | | $ | 11.73 | | | $ | 12.68 | | | $ | 12.89 | | | $ | 12.96 | | | $ | 14.04 | | | $ | 12.05 | | | $ | 13.00 | | | $ | 13.22 | |
| Income from Investment Operations: | | | | | | | | | | | | | | | | | | | | | | | | | | | | | | | | | | | | | | | | | | | | | | | | | | | | | | | | | | | | |
| Net investment income (loss) | | | 0.18 | | | | 0.16 | | | | 0.10 | 1 | | | 0.12 | 1 | | | 0.12 | 1 | | | 0.06 | | | | 0.03 | | | | 0.00 | 1,4, | | | 0.03 | 1 | | | 0.03 | 1 | | | 0.62 | | | | 2.47 | | | | 0.34 | 1 | | | 0.14 | 1 | | | (0.05 | )1 |
| Net realized and unrealized gain (loss) on investments | | | 0.99 | | | | (1.12 | ) | | | 2.01 | | | | (0.97 | ) | | | (0.02 | ) | | | 0.99 | | | | (1.07 | ) | | | 1.97 | | | | (0.95 | ) | | | (0.03 | ) | | | 0.58 | | | | (3.40 | ) | | | 1.82 | | | | (0.95 | ) | | | 0.17 | |
| Total from investment operations | | | 1.17 | | | | (0.96 | ) | | | 2.11 | | | | (0.85 | ) | | | 0.10 | | | | 1.05 | | | | (1.04 | ) | | | 1.97 | | | | (0.92 | ) | | | – | | | | 1.20 | | | | (0.93 | ) | | | 2.16 | | | | (0.81 | ) | | | 0.12 | |
| Less Distributions From: | | | | | | | | | | | | | | | | | | | | | | | | | | | | | | | | | | | | | | | | | | | | | | | | | | | | | | | | | | | | |
| Net investment income | | | (0.19 | ) | | | (0.12 | ) | | | (0.14 | ) | | | (0.11 | ) | | | (0.31 | ) | | | (0.10 | ) | | | (0.03 | ) | | | (0.07 | ) | | | (0.03 | ) | | | (0.21 | ) | | | (0.22 | ) | | | (0.15 | ) | | | (0.17 | ) | | | (0.14 | ) | | | (0.34 | ) |
| Capital gains | | | (0.37 | ) | | | – | | | | – | | | | – | | | | – | | | | (0.37 | ) | | | – | | | | – | | | | – | | | | – | | | | (0.37 | ) | | | – | | | | – | | | | – | | | | – | |
| Total distributions | | | (0.56 | ) | | | (0.12 | ) | | | (0.14 | ) | | | (0.11 | ) | | | (0.31 | ) | | | (0.47 | ) | | | (0.03 | ) | | | (0.07 | ) | | | (0.03 | ) | | | (0.21 | ) | | | (0.59 | ) | | | (0.15 | ) | | | (0.17 | ) | | | (0.14 | ) | | | (0.34 | ) |
| Net increase (decrease) in net asset value | | | 0.61 | | | | (1.08 | ) | | | 1.97 | | | | (0.96 | ) | | | (0.21 | ) | | | 0.58 | | | | (1.07 | ) | | | 1.90 | | | | (0.95 | ) | | | (0.21 | ) | | | 0.61 | | | | (1.08 | ) | | | 1.99 | | | | (0.95 | ) | | | (0.22 | ) |
| Net Asset Value at end of period | | $ | 13.53 | | | $ | 12.92 | | | $ | 14.00 | | | $ | 12.03 | | | $ | 12.99 | | | $ | 13.14 | | | $ | 12.56 | | | $ | 13.63 | | | $ | 11.73 | | | $ | 12.68 | | | $ | 13.57 | | | $ | 12.96 | | | $ | 14.04 | | | $ | 12.05 | | | $ | 13.00 | |
| Total Return (%)2 | | | 9.85 | | | | (6.94 | ) | | | 17.79 | | | | (6.60 | ) | | | 0.83 | | | | 9.04 | | | | (7.65 | ) | | | 16.89 | | | | (7.27 | ) | | | 0.06 | | | | 10.10 | | | | (6.72 | ) | | | 18.18 | | | | (6.40 | ) | | | 1.09 | |
| Ratios/Supplemental Data: | | | | | | | | | | | | | | | | | | | | | | | | | | | | | | | | | | | | | | | | | | | | | | | | | | | | | | | | | | | | |
| Net Assets at end of period (in 000’s) | | $ | 17,209 | | | $ | 17,679 | | | $ | 20,520 | | | $ | 18,573 | | | $ | 21,072 | | | $ | 715 | | | $ | 840 | | | $ | 1,195 | | | $ | 1,288 | | | $ | 1,692 | | | $ | 1,310 | | | $ | 1,434 | | | $ | 10,098 | | | $ | 15,398 | | | $ | 15,566 | |
| Ratios of expenses to average net assets (%) | | | 1.60 | | | | 1.60 | | | | 1.60 | | | | 1.61 | | | | 1.60 | | | | 2.35 | | | | 2.35 | | | | 2.35 | | | | 2.36 | | | | 2.35 | | | | 1.35 | | | | 1.35 | | | | 1.35 | | | | 1.36 | | | | 1.35 | |
| Ratio of net investment income to average net assets (%) | | | 1.42 | | | | 1.14 | | | | 0.82 | | | | 1.00 | | | | 0.88 | | | | 0.65 | | | | 0.36 | | | | 0.05 | | | | 0.21 | | | | 0.10 | | | | 1.67 | | | | 1.12 | | | | 1.06 | | | | 1.21 | | | | 1.27 | |
| Portfolio turnover (%)3 | | | 37 | | | | 29 | | | | 32 | | | | 34 | | | | 45 | | | | 37 | | | | 29 | | | | 32 | | | | 34 | | | | 45 | | | | 37 | | | | 29 | | | | 32 | | | | 34 | | | | 45 | |
*The Financial Highlights presented herein reflect the adjusted historical operating results of the Broadview Opportunity Fund. See Notes 1 and 13 for a discussion of the Fund’s reorganization.
1 Net investment income (loss) calculated excluding permanent tax adjustments to undistributed net investment income.
2 Total return without applicable sales charge.
3 Portfolio turnover is calculated at the fund level and is not annualized for periods less than one year.
4Amounts represent less than $0.005 per share.
5For accounting purposes, the Small Cap Fund Class A is treated as having commenced investment operations on August 31, 2019. See Note 13.
6Not annualized.
7Annualized.
8The financial highlights prior to August 31, 2019 are those of the Broadview Opportunity Fund, the accounting survivor of the reorganization of the Madison Small Cap Fund into the Broadview Opportunity Fund. The net asset values and other per share information of the Broadview Opportunity Fund have been restated by the conversion ratio of 2.469195 for Class Y shares to reflect those of the legal survivor of the reorganization, the Madison Small Cap Fund.
9Disclosure represents the period October 1, 2019 to October 31, 2019. See Notes 1 and 13.
See accompanying Notes to Financial Statements.
54
Madison Funds | October 31, 2019
Notes to the Financial Statements
1. ORGANIZATION
Madison Funds, a Delaware statutory trust (the “Trust”), is registered under the Investment Company Act of 1940, as amended (the “1940 Act”), as a diversified, open-end management investment company. As of the date of this report, the Trust offers eighteen funds (individually, a “fund,” collectively, the “funds”).
The Declaration of Trust permits the Trustees to issue an unlimited number of shares of beneficial interest of the Trust without par value. The Trust has entered into an Investment Advisory Agreement with Madison Asset Management, LLC (the “Investment Adviser” or “Madison”). The Investment Adviser, in turn, has entered into a subadvisory agreement for the management of the investments of the International Stock Fund (“Subadviser”).
The accompanying financial statements include the Government Money Market, Tax-Free Virginia, Tax-Free National, High Quality Bond, Core Bond, Corporate Bond, High Income, Diversified Income, Covered Call & Equity Income, Dividend Income, Large Cap Value, Investors, Mid Cap, Small Cap and International Stock Funds (collectively, the “Core Funds”), and the Conservative Allocation, Moderate Allocation, and Aggressive Allocation Funds (collectively, the “Allocation Funds”).
The Government Money Market Fund offers two classes of shares: Class A and B. The Small Cap Fund offers two classes of shares: Class A and Y. The High Income, Large Cap Value, and International Stock Funds offer three classes of shares: Class A, B and Y. The Diversified Income Fund and Allocation Funds offer three classes of shares: Class A, B and C. The Investors Fund offers three classes of shares: Class A, Y and R6. The Core Bond Fund and Mid Cap Fund offer four classes of shares: Class A, B, Y and R6. The Covered Call & Equity Income Fund offers four classes of shares: Class A, C, Y and R6. The Tax-Free Virginia, Tax-Free National, High Quality Bond, Corporate Bond and Dividend Income Funds offer one class of shares: Class Y. Each class of shares represents an interest in the assets of the respective fund and has identical voting, dividend, liquidation and other rights, except that each class of shares bears its own distribution fees and servicing fees, if any, and its proportional share of fund level expenses, is subject to its own sales charges, if any, and has exclusive voting rights on matters pertaining to Rule 12b-1 of the 1940 Act as it relates to that class and other class-specific matters.
As of February 1, 2017, Class B shares of the funds may not be purchased or acquired, except by exchange from Class B shares of another Madison Fund, or through dividend and/or capital gains reinvestments. Shareholders with investments in Class B shares of the funds may continue to hold such shares until they convert to Class A shares.
Following the close of business on August 30, 2019, the Small Cap Fund acquired all of the assets, subject to liabilities, of the Broadview Opportunity Fund (the “Predecessor Fund”) through a tax-free reorganization (the “Reorganization”). The Small Cap Fund had the same investment objective and substantially similar investment strategies and risks as the Predecessor Fund.
As part of the Reorganization, shareholders of the Predecessor Fund’s sole share class received Class Y Shares of the Small Cap Fund. Because the Predecessor Fund was deemed the accounting survivor of the Reorganization, the Small Cap Fund’s Class Y Shares adopted the Predecessor Fund’s performance and financial history which commenced investment operations on December 16, 1996. The performance and financial history for Class A shares was deemed to be new effective August 31, 2019 as a result of the Reorganization. See Note 13 for further explanation of the Reorganization.
2. SIGNIFICANT ACCOUNTING POLICIES
The preparation of financial statements requires management to make estimates and assumptions that affect the reported amounts of assets and liabilities and disclosure of contingent assets and liabilities at the date of the financial statements and the reported amounts of income and expenses during the reported period. Actual results could differ from those estimates.
Each fund is an investment company and accordingly follows the investment company accounting and reporting guidance of the Financial Accounting Standards Board (FASB) Accounting Standard Codification Topic 946 “Financial Services –Investment Companies”.
The following is a summary of significant accounting policies consistently followed by each fund in the preparation of its financial statements.
Portfolio Valuation: Equity securities, including American Depositary Receipts (“ADRs”), Global Depository Receipts (“GDRs”) and exchange-traded funds (“ETFs”) listed on any U.S. or foreign stock exchange or quoted on the National Association of Securities Dealers Automated Quotation System (“NASDAQ”) are valued at the last quoted sale price or official closing price on that exchange or NASDAQ on the valuation day (provided that, for securities traded on NASDAQ, the funds utilize the NASDAQ Official Closing Price (“NOCP”)). If no sale occurs, equities traded on a U.S. exchange, foreign exchange or on NASDAQ are valued at the bid price. Debt securities purchased (other than short-term obligations) with a remaining maturity of 61 days or more are valued on the basis of last available bid prices or current market quotations provided by dealers or pricing services approved by the Trust. In determining the value of a particular investment, pricing services may use certain information with respect to transactions in such investments, quotations from dealers, pricing matrixes, market transactions in comparable investments, various relationships observed in the market between investments and calculated yield measurements based on valuation technology commonly employed in the market for such investments.
Municipal debt securities are traded via a network of dealers and brokers that connect buyers and sellers. They are valued on the basis of last available bid prices or current market quotations provided by dealers or pricing services approved by the Trust. There may be little trading in the secondary market for particular bonds and other debt securities, making them more difficult to value or sell. Asset-backed and mortgage-backed securities are valued by independent pricing services using models that consider estimated cash flows of each tranche of the security, establish a benchmark yield and develop an estimated tranche specific spread to the benchmark yield based on the unique attributes of the tranche.
Investments in shares of open-end mutual funds, including money market funds, are valued at their daily net asset value (“NAV”) which is calculated as of the close of regular trading on the New York Stock Exchange (the “NYSE”), usually 4:00 p.m. Eastern Standard Time, on each day on which the NYSE is open for business. NAV per share is determined by dividing each fund’s total net assets by the number of shares of such fund outstanding at the time of calculation. Because the assets of each Allocation Fund consist primarily of shares of other registered investment companies (the “Underlying Funds”), the NAV of each fund is determined based on the NAVs of the Underlying Funds. Total net assets are determined by adding the total current value of portfolio securities, cash, receivables, and other assets and subtracting liabilities.
Short-term instruments having maturities of 60 days or less and all securities in the Government Money Market Fund are valued on an amortized cost basis, which approximates fair value.
Over-the-counter securities not listed or traded on NASDAQ are valued at the last sale price on the valuation day. If no sale occurs on the valuation day, an over-the-counter security is valued at the last bid price. Exchange-traded options are valued at the mean of the best bid and ask prices across all option exchanges. Over-the-counter options are valued based upon prices provided by market makers in such securities or dealers in such currencies. Financial futures contracts generally are valued at the settlement price established by the exchange(s) on which the contracts are primarily
55
Madison Funds | Notes to the Financial Statements - continued | October 31, 2019
traded. Spot and forward foreign currency exchange contracts are valued based on quotations supplied by dealers in such contracts. Overnight repurchase agreements are valued at cost, and term repurchase agreements (i.e., those whose maturity exceeds seven days), swaps, caps, collars and floors, if any, are valued at the average of the closing bids obtained daily from at least one dealer.
Through the end of this reporting period, the value of all assets and liabilities expressed in foreign currencies was converted into U.S. dollar values using the then-current exchange rate at the close of regular trading on the NYSE.
All other securities for which either quotations are not readily available, no other sales have occurred, or in the Investment Adviser’s opinion, do not reflect the current fair value, are appraised at their fair values as determined in good faith by the Pricing Committee (the “Committee”) and under the general supervision of the Board of Trustees. When fair value pricing of securities is employed, the prices of securities used by the funds to calculate NAV may differ from market quotations or NOCP. Because the Allocation Funds primarily invest in Underlying Funds, government securities and short-term paper, it is not anticipated that the Investment Adviser will need to “fair value” any of the investments of these funds. However, an Underlying Fund may need to “fair value” one or more of its investments, which may, in turn, require an Allocation Fund to do the same because of delays in obtaining the Underlying Fund’s NAV.
A fund’s investments will be valued at fair value if, in the judgment of the Committee, an event impacting the value of an investment occurred between the closing time of a security’s primary market or exchange (for example, a foreign exchange or market) and the time the fund’s share price is calculated as of the close of regular trading on the NYSE. Significant events may include, but are not limited to, the following: (1) significant fluctuations in domestic markets, foreign markets or foreign currencies; (2) occurrences not directly tied to the securities markets such as natural disasters, armed conflicts or significant government actions; and (3) major announcements affecting a single issuer or an entire market or market sector. In responding to a significant event, the Committee would determine the fair value of affected securities considering factors including, but not limited to: fundamental analytical data relating to the investment; the nature and duration of any restrictions on the disposition of the investment; and the forces influencing the market(s) in which the investment is purchased or sold. The Committee may rely on an independent fair valuation service to adjust the valuations of foreign equity securities based on specific market-movement parameters established by the Committee and approved by the Trust.
Recently Issued Accounting Pronouncements: In March 2017, the Financial Accounting Standards Board (FASB) issued Accounting Standards Update (ASU) 2017-08 which changes the amortization period for a callable debt security from the maturity date to the earliest call date. The ASU is effective for annual periods beginning after December 15, 2018, and interim periods within those annual periods. Management does not believe the ASU will have a material impact on the financial statements due to the fact the funds did not hold convertible debt for the year ended October 31, 2019.
Security Transactions and Investment Income: Security transactions are accounted for on a trade date basis. Net realized gains or losses on sales are determined by the identified cost method. Net realized gain on investments in the Statements of Operations also includes realized gain distributions received from the underlying exchange-listed funds. Distributions of net realized gains are recorded on the fund’s ex-distribution date. Dividend income is recorded on ex-dividend date, except that certain dividends from foreign securities may be recorded after the ex-dividend date based on when the fund is informed of the dividend. Interest income is recorded on an accrual basis and is increased by the accretion of discount and decreased by the amortization of premium.
Amortization and accretion are recorded on the effective yield method.
Expenses: Expenses that are directly related to one fund are charged directly to that fund. Other operating expenses are prorated to the funds on the basis of relative net assets. Class-specific expenses are borne by that class.
Classes: Income and realized and unrealized gains/losses are allocated to the respective classes on the basis of relative net assets.
Repurchase Agreements: Each fund may engage in repurchase agreements. In a repurchase agreement, a security is purchased for a relatively short period (usually not more than seven days) subject to the obligation to sell it back to the issuer at a fixed time and price plus accrued interest. The funds will enter into repurchase agreements only with members of the Federal Reserve System and with “primary dealers” in U.S. Government securities. As of October 31, 2019, none of the funds held open repurchase agreements.
The Trust has established a procedure providing that the securities serving as collateral for each repurchase agreement must be delivered to the funds’ custodian either physically or in book-entry form and that the collateral must be marked to market daily to ensure that each repurchase agreement is fully collateralized at all times. In the event of bankruptcy or other default by a seller of a repurchase agreement, a fund could experience one of the following: delays in liquidating the underlying securities during the period in which the fund seeks to enforce its rights thereto, possible decreased levels of income, declines in value of the underlying securities, or lack of access to income during this period and the expense of enforcing its rights.
Foreign Currency Transactions: The fund’s books and records are maintained in U.S. dollars. Foreign currency-denominated transactions (i.e., fair value of investment securities, assets and liabilities, purchases and sales of investment securities, and income and expenses) are translated into U.S. dollars at the current rate of exchange. The funds enter into contracts on the trade date to settle any securities transactions denominated in foreign currencies on behalf of the funds at the spot rate at settlement.
Each fund, except the Government Money Market, Tax-Free Virginia and Tax-Free National Funds, reports certain foreign currency-related transactions as components of realized gains or losses for financial reporting purposes, whereas such components are treated as ordinary income for federal income tax purposes. Realized gains or losses associated with currency transactions are included in the Statements of Operations under the heading “Net realized gain (loss) on investments.” The Covered Call & Equity Fund and International Stock Fund had net realized losses of $94 and $4,117 related to foreign currency transactions. The funds do not isolate the portion of gains and losses on investments in securities that is due to changes in the foreign exchange rates from that which is due to change in market prices of securities. Such amounts are categorized as gain or loss on investments for financial reporting purposes.
Forward Foreign Currency Exchange Contracts: Each fund, except the Government Money Market Fund, Tax-Free Virginia and Tax-Free National Funds, may purchase and sell forward foreign currency exchange contracts for defensive or hedging purposes. When entering into forward foreign currency exchange contracts, the funds agree to receive or deliver a fixed quantity of foreign currency for an agreed-upon price on an agreed future date. These contracts are valued daily. The funds’ net assets reflect unrealized gains or losses on the contracts as measured by the difference between the forward foreign currency exchange rates at the dates of entry into the contracts and the forward rates at the reporting date. The funds realize a gain or a loss at the time the forward foreign currency exchange contracts are settled or closed out with an offsetting contract. Contracts are traded over-the-counter directly with a counterparty. Realized and unrealized gains and losses are included in the Statements of Operations. During the year ended October 31, 2019, none of the funds transacted forward foreign currency exchange contracts.
56
Madison Funds | Notes to the Financial Statements - continued | October 31, 2019
If a fund enters into a forward foreign currency exchange contract to buy foreign currency for any purpose, the fund will be required to place cash or other liquid assets in a segregated account with the fund’s custodian in an amount equal to the value of the fund’s total assets committed to the consummation of the forward contract. If the value of the securities in the segregated account declines, additional cash or securities will be placed in the segregated account so that the value of the account will equal the amount of the fund’s commitment with respect to the contract.
Cash Concentration: At times, the funds maintain cash balances at financial institutions in excess of federally insured limits. The funds monitor this credit risk and have not experienced any losses related to this risk.
Illiquid Securities: Each fund currently limits investments in illiquid investments, as defined by Rule 22e-4 under the 1940 Act, to 15% of net assets at the time of purchase except for the Government Money Market Fund which is governed by the Rule 2(a)-7 liquidity guidelines. An illiquid investment is generally defined as a security that a fund reasonably expects cannot be sold or disposed of in current market conditions in seven calendar days or less without the sale or disposition significantly changing the market value of the security. At October 31, 2019, there were no illiquid securities held in the funds.
Delayed Delivery Securities: Each fund may purchase securities on a when-issued or delayed delivery basis. “When-issued” refers to securities whose terms are available and for which a market exists, but that have not been issued. For when-issued or delayed delivery transactions, no payment is made until delivery date, which is typically longer than the normal course of settlement. When a fund enters into an agreement to purchase securities on a when-issued or delayed delivery basis, the fund segregates cash or other liquid securities, of any type or maturity, equal in value to the fund’s commitment. Losses may arise due to changes in the fair value of the underlying securities, if the counterparty does not perform under the contract, or if the issuer does not issue the securities due to political, economic or other factors. As of October 31, 2019, none of the funds had entered into such transactions.
Indemnifications: Under the funds’ organizational documents, the funds’ officers and Trustees are indemnified against certain liabilities arising out of the performance of their duties to the funds. In the normal course of business, the funds enter into contracts that contain a variety of representations and provide general indemnifications. The funds’ maximum liability exposure under these arrangements is unknown, as future claims that have not yet occurred may be made against the funds. However, based on experience, management expects the risk of loss to be remote.
Fair Value Measurements: Each fund has adopted FASB guidance on fair value measurements. Fair value is defined as the price that each fund would receive upon selling an investment in a timely transaction to an independent buyer in the principal or most advantageous market of the investment. A three-tier hierarchy is used to maximize the use of observable market data “inputs” and minimize the use of unobservable “inputs” and to establish classification of fair value measurements for disclosure purposes. Inputs refer broadly to the assumptions that market participants would use in pricing the asset or liability, including assumptions about risk (for example, the risk inherent in a particular valuation technique used to measure fair value including such a pricing model and/or the risk inherent in the inputs used in the valuation technique). Inputs may be observable or unobservable.
Observable inputs are inputs that reflect the assumptions market participants would use in pricing the asset or liability developed based on market data obtained from sources independent of the reporting entity. Unobservable inputs are inputs that reflect the reporting entity’s own assumptions about the assumptions market participants would use in pricing the asset or liability developed based on the best information available in the circumstances. The three-tier hierarchy of inputs is summarized in the three broad Levels listed below:
Level 1 - unadjusted quoted prices in active markets for identical investments
Level 2 - other significant observable inputs (including quoted prices for similar investments, interest rate volatilities, prepayment speeds, credit risk, benchmark yields, transactions, bids, offers, new issues, spreads, and other relationships observed in the markets among comparable securities, underlying equity of the issuer; and proprietary pricing models such as yield measures calculated using factors such as cash flows, financial or collateral performance, and other reference data, etc.)
Level 3 - significant unobservable inputs (including the fund’s own assumptions in determining the fair value of investments)
The valuation techniques used by the funds to measure fair value for the year ended October 31, 2019 maximized the use of observable inputs and minimized the use of unobservable inputs. The funds estimated the price that would have prevailed in a liquid market for an international equity security given information available at the time of valuation. As of October 31, 2019, none of the funds held securities deemed as a Level 3, and there were no transfers between classification levels.
The following is a summary of the inputs used as of October 31, 2019, in valuing the funds’ investments carried at fair value (please see the Portfolio of Investments for each fund for a listing of all securities within each category):
| Fund1 | | Quoted Prices In
Active Markets
for Identical
Investments
(Level 1) | | | Significant
Other
Observable
Inputs
(Level 2) | | | Significant
Unobservable
Inputs
(Level 3) | | | Value at
10/31/19 | |
| Conservative Allocation | | | | | | | | | | | | | | | | |
| Investment Companies | | $ | 64,641,576 | | | $ | – | | | $ | – | | | $ | 64,641,576 | |
| Short-Term Investments | | | 11,467,862 | | | | – | | | | – | | | | 11,467,862 | |
| | | | 76,109,438 | | | | – | | | | – | | | | 76,109,438 | |
| Moderate Allocation | | | | | | | | | | | | | | | | |
| Investment Companies | | | 125,074,307 | | | | – | | | | – | | | | 125,074,307 | |
| Short-Term Investments | | | 16,172,008 | | | | – | | | | – | | | | 16,172,008 | |
| | | | 141,246,315 | | | | – | | | | – | | | | 141,246,315 | |
| Aggressive Allocation | | | | | | | | | | | | | | | | |
| Investment Companies | | | 56,153,539 | | | | – | | | | – | | | | 56,153,539 | |
| Short-Term Investments | | | 7,212,612 | | | | – | | | | – | | | | 7,212,612 | |
| | | | 63,366,151 | | | | – | | | | – | | | | 63,366,151 | |
| Government Money Market2 | | | | | | | | | | | | | | | | |
| U.S. Government and Agency | | | | | | | | | | | | | | | | |
| Obligations | | | – | | | | 14,551,058 | | | | – | | | | 14,551,058 | |
| Short-Term Investments | | | 503,765 | | | | – | | | | – | | | | 503,765 | |
| | | | 503,765 | | | | 14,551,058 | | | | – | | | | 15,054,823 | |
| Tax-Free Virginia | | | | | | | | | | | | | | | | |
| Municipal Bonds | | | – | | | | 21,631,438 | | | | – | | | | 21,631,438 | |
| | | | | | | | | | | | | | | | | |
| Tax-Free National | | | | | | | | | | | | | | | | |
| Municipal Bonds | | | – | | | | 23,162,588 | | | | – | | | | 23,162,588 | |
| | | | | | | | | | | | | | | | | |
| High Quality Bond | | | | | | | | | | | | | | | | |
| Corporate Notes and Bonds | | | – | | | | 35,814,924 | | | | – | | | | 35,814,924 | |
| U.S. Government and Agency | | | | | | | | | | | | | | | | |
| Obligations | | | – | | | | 51,905,731 | | | | – | | | | 51,905,731 | |
| Short-Term Investments | | | 4,015,001 | | | | – | | | | – | | | | 4,015,001 | |
| | | | 4,015,001 | | | | 87,720,655 | | | | – | | | | 91,735,656 | |
| Core Bond | | | | | | | | | | | | | | | | |
| Asset Backed Securities | | | – | | | | 7,127,764 | | | | – | | | | 7,127,764 | |
| Collateralized Mortgage | | | | | | | | | | | | | | | | |
| Obligations | | | – | | | | 8,847,296 | | | | – | | | | 8,847,296 | |
| Commercial Mortgage-Backed | | | | | | | | | | | | | | | | |
| Securities | | | – | | | | 5,426,016 | | | | – | | | | 5,426,016 | |
| Corporate Notes and Bonds | | | – | | | | 36,390,907 | | | | – | | | | 36,390,907 | |
| Long Term Municipal Bonds | | | – | | | | 2,049,430 | | | | – | | | | 2,049,430 | |
| Mortgage Backed Securities | | | – | | | | 30,789,682 | | | | – | | | | 30,789,682 | |
| U.S. Government and Agency | | | | | | | | | | | | | | | | |
| Obligations | | | – | | | | 51,795,703 | | | | – | | | | 51,795,703 | |
| Short-Term Investments | | | 5,314,130 | | | | – | | | | – | | | | 5,314,130 | |
| | | | 5,314,130 | | | | 142,426,798 | | | | – | | | | 147,740,928 | |
57
Madison Funds | Notes to the Financial Statements - continued | October 31, 2019
| | | Quoted Prices In
Active Markets
for Identical
Investments | | | Significant
Other
Observable
Inputs | | | Significant
Unobservable
Inputs | | | Value at | |
| Fund1 | | (Level 1) | | | (Level 2) | | | (Level 3) | | | 10/31/19 | |
| Corporate Bond | | | | | | | | | | | | | | | | |
| Corporate Notes and Bonds | | $ | – | | | $ | 14,517,007 | | | $ | – | | | $ | 14,517,007 | |
| Short-Term Investments | | | 496,036 | | | | – | | | | – | | | | 496,036 | |
| | | | 496,036 | | | | 14,517,007 | | | | – | | | | 15,013,043 | |
| High Income | | | | | | | | | | | | | | | | |
| Corporate Notes and Bonds | | | – | | | | 15,986,535 | | | | – | | | | 15,986,535 | |
| Exchange Traded Funds | | | 468,774 | | | | – | | | | | | | | 468,774 | |
| U.S. Government and Agency Obligations | | | – | | | | 938,816 | | | | | | | | 938,816 | |
| Short-Term Investments | | | 2,062,136 | | | | – | | | | – | | | | 2,062,136 | |
| | | | 2,530,910 | | | | 16,925,351 | | | | – | | | | 19,456,261 | |
| Diversified Income | | | | | | | | | | | | | | | | |
| Common Stocks | | | 112,094,808 | | | | – | | | | – | | | | 112,094,808 | |
| Asset Backed Securities | | | – | | | | 2,751,792 | | | | – | | | | 2,751,792 | |
| Collateralized Mortgage Obligations | | | – | | | | 2,321,681 | | | | – | | | | 2,321,681 | |
| Commercial Mortgage-Backed Securities | | | – | | | | 2,094,724 | | | | – | | | | 2,094,724 | |
| Corporate Notes and Bonds | | | – | | | | 15,728,889 | | | | – | | | | 15,728,889 | |
| Long Term Municipal Bonds | | | – | | | | 1,419,503 | | | | – | | | | 1,419,503 | |
| Mortgage Backed Securities | | | – | | | | 11,494,868 | | | | – | | | | 11,494,868 | |
| U.S. Government and Agency Obligations | | | – | | | | 14,336,380 | | | | – | | | | 14,336,380 | |
| Short-Term Investments | | | 2,029,443 | | | | – | | | | – | | | | 2,029,443 | |
| | | | 114,124,251 | | | | 50,147,837 | | | | – | | | | 164,272,088 | |
| Covered Call & Equity Income | | | | | | | | | | | | | | | | |
| Assets: | | | | | | | | | | | | | | | | |
| Common Stocks | | | 107,640,793 | | | | – | | | | – | | | | 107,640,793 | |
| Exchange Traded Funds | | | 6,874,970 | | | | – | | | | – | | | | 6,874,970 | |
| Short-Term Investments | | | 11,882,135 | | | | – | | | | – | | | | 11,882,135 | |
| | | | 126,397,898 | | | | – | | | | – | | | | 126,397,898 | |
| Liabilities: | | | | | | | | | | | | | | | | |
| Call Options Written | | | (1,732,410 | ) | | | – | | | | – | | | | (1,732,410 | ) |
| Dividend Income | | | | | | | | | | | | | | | | |
| Common Stocks | | | 215,823,450 | | | | – | | | | – | | | | 215,823,450 | |
| Short-Term Investments | | | 4,573,975 | | | | – | | | | – | | | | 4,573,975 | |
| | | | 220,397,425 | | | | – | | | | – | | | | 220,397,425 | |
| Large Cap Value | | | | | | | | | | | | | | | | |
| Common Stocks | | | 64,407,408 | | | | – | | | | – | | | | 64,407,408 | |
| Short-Term Investments | | | 1,023,351 | | | | – | | | | – | | | | 1,023,351 | |
| | | | 65,430,759 | | | | – | | | | – | | | | 65,430,759 | |
| Investors | | | | | | | | | | | | | | | | |
| Common Stocks | | | 319,178,941 | | | | – | | | | – | | | | 319,178,941 | |
| Short-Term Investments | | | 19,056,090 | | | | – | | | | – | | | | 19,056,090 | |
| | | | 338,235,031 | | | | – | | | | – | | | | 338,235,031 | |
| Mid Cap | | | | | | | | | | | | | | | | |
| Common Stocks | | | 534,851,761 | | | | – | | | | – | | | | 534,851,761 | |
| Short-Term Investments | | | 51,308,932 | | | | – | | | | – | | | | 51,308,932 | |
| | | | 586,160,693 | | | | – | | | | – | | | | 586,160,693 | |
| Small Cap | | | | | | | | | | | | | | | | |
| Common Stocks | | | 248,191,344 | | | | – | | | | – | | | | 248,191,344 | |
| Short-Term Investments | | | 31,658,421 | | | | – | | | | – | | | | 31,658,421 | |
| | | | 279,849,765 | | | | – | | | | – | | | | 279,849,765 | |
| International Stock | | | | | | | | | | | | | | | | |
| Common Stocks | | | | | | | | | | | | | | | | |
| Australia | | | – | | | | 431,365 | | | | – | | | | 431,365 | |
| Belgium | | | – | | | | 287,720 | | | | – | | | | 287,720 | |
| Canada | | | – | | | | 1,048,344 | | | | – | | | | 1,048,344 | |
| China | | | – | | | | 312,693 | | | | – | | | | 312,693 | |
| Denmark | | | – | | | | 288,257 | | | | – | | | | 288,257 | |
| Finland | | | – | | | | 448,370 | | | | – | | | | 448,370 | |
| France | | | – | | | | 2,462,021 | | | | – | | | | 2,462,021 | |
| Germany | | | – | | | | 975,310 | | | | – | | | | 975,310 | |
| Hong Kong | | | – | | | | 73,324 | | | | – | | | | 73,324 | |
| Ireland | | | 837,035 | | | | – | | | | – | | | | 837,035 | |
| | | Quoted Prices In
Active Markets
for Identical
Investments | | | Significant
Other
Observable
Inputs | | | Significant
Unobservable
Inputs | | | Value at | |
| Fund1 | | (Level 1) | | | (Level 2) | | | (Level 3) | | | 10/31/19 | |
| Israel | | $ | – | | | $ | 230,430 | | | $ | – | | | $ | 230,430 | |
| Japan | | | – | | | | 2,869,827 | | | | – | | | | 2,869,827 | |
| Mexico | | | – | | | | 71,544 | | | | – | | | | 71,544 | |
| Netherlands | | | – | | | | 794,110 | | | | – | | | | 794,110 | |
| Norway | | | – | | | | 579,985 | | | | – | | | | 579,985 | |
| Singapore | | | – | | | | 522,281 | | | | – | | | | 522,281 | |
| South Korea | | | – | | | | 430,465 | | | | – | | | | 430,465 | |
| Spain | | | – | | | | 169,303 | | | | – | | | | 169,303 | |
| Sweden | | | – | | | | 730,098 | | | | – | | | | 730,098 | |
| Switzerland | | | – | | | | 894,049 | | | | – | | | | 894,049 | |
| United Kingdom | | | 477,492 | | | | 3,347,294 | | | | – | | | | 3,824,786 | |
| Preferred Stocks | | | – | | | | 498,609 | | | | – | | | | 498,609 | |
| Short-Term Investments | | | 818,370 | | | | – | | | | – | | | | 818,370 | |
| | | | 2,132,897 | | | | 17,465,399 | | | | – | | | | 19,598,296 | |
1See respective Portfolio of Investments for underlying holdings in each fund. For additional information on the Underlying Funds held in the Allocation Funds, including shareholder prospectuses and financial reports, please visit each Underlying Fund’s website or visit the Securities and Exchange Commission’s website at http://www.sec.gov.
2At October 31, 2019, all Level 2 securities held are U.S. Government and Agency Obligations. See respective Portfolio of Investments.
Derivatives: The FASB issued guidance intended to enhance financial statement disclosure for derivative instruments and enable investors to understand: a) how and why a fund uses derivative investments, b) how derivative instruments are accounted for, and c) how derivative instruments affect a fund’s financial position, and results of operations.
The following table presents the types of derivatives in the fund by location and as presented on the Statements of Assets and Liabilities as of October 31, 2019.
| Statements of Asset & Liability Presentation of Fair Values of Derivative Instruments |
| | | | | Asset Derivatives | | | Liability Derivatives | |
| Fund | | Underlying Risk | | Statement of
Assets and
Liabilities
Location | | | Fair Value | | | Statement of
Assets and
Liabilities
Location | | Fair Value | |
| Covered Call & Equity Income | | Equity | | Options purchased | | | – | | | Options written | | $ | (1,732,410 | ) |
The following table presents the effect of derivative instruments on the Statements of Operations for the year ended October 31, 2019.
| Fund | | Derivatives not accounted
for as hedging Instruments | | Realized Gain
(Loss) on Derivatives: | | | Change in Unrealized Appreciation
(Depreciation) on Derivatives | |
| Core Bond | | Option Purchased | | $ | (83,782 | ) | | $ | 3,834 | |
| | | Option Written | | | 52,516 | | | | (4,291 | ) |
| | | Futures | | | (46,496 | ) | | | – | |
| Total | | | | $ | (77,762 | ) | | $ | (457 | ) |
| Covered Call & Equity Income | | Option Purchased | | $ | (76,490 | ) | | $ | – | |
| | | Option Written | | | 5,492,971 | | | | 53,493 | |
| Total | | | | $ | 5,416,481 | | | $ | 53,493 | |
The average volume (based on the open positions at each month-end) of derivative activity during the year ended October 31, 2019.
| | | Options Purchased Contracts(1) | | | Options Written Contracts(1) | |
| Core Bond | | 33 | | | 38 | |
| Covered Call & Equity Income | | 288 | | | 16,494 | |
(1)Number of Contracts
There is no impact on the financial statements of the other funds as they did not hold derivative investments during the year ended October 31, 2019.
58
Madison Funds | Notes to the Financial Statements - continued | October 31, 2019
3. ADVISORY, ADMINISTRATION AND DISTRIBUTION AGREEMENTS
Advisory Agreement. For its investment advisory services to the funds, the Investment Adviser is entitled to receive a fee, which is computed daily and paid monthly, at an annualized percentage rate of the average daily value of the net assets of each fund as follows as of October 31, 2019:
| Fund | | Advisory Fee | | | Fund | | Advisory Fee | |
| Conservative Allocation | | | 0.20 | % | | High Income | | | 0.55 | % |
| Moderate Allocation | | | 0.20 | % | | Diversified Income | | | 0.65 | % |
| Aggressive Allocation | | | 0.20 | % | | Covered Call & Equity Income | | | 0.85 | % |
| Government Money Market | | | 0.40 | % | | Dividend Income | | | 0.75 | % |
| Tax-Free Virginia | | | 0.50 | % | | Large Cap Value | | | 0.55 | % |
| Tax-Free National | | | 0.40 | % | | Investors | | | 0.75 | % |
| High Quality Bond | | | 0.30 | % | | Mid Cap | | | 0.75 | % |
| Core Bond | | | 0.50 | % | | Small Cap | | | 1.00 | % |
| Corporate Bond | | | 0.40 | % | | International Stock | | | 1.05 | % |
Each of the Government Money Market, Core Bond, High Income, Diversified Income, Large Cap Value, Investors, Mid Cap, Small Cap, and International Stock Funds’ advisory fee will be reduced by 0.05% on assets exceeding $500 million, and by another 0.05% on assets exceeding $1 billion. The Investment Adviser is solely responsible for the payment of all fees to Subadvisers. The only Subadviser for the funds at October 31, 2019, was Lazard Asset Management LLC for the International Stock Fund.
The Investment Adviser may, from time to time, contractually or voluntarily agree to waive a portion of its fees or expenses related to the funds. Fee agreements may by modified or terminated at any time or for any reason, but only with fund Board approval. During the year ended October 31, 2019, the Investment Adviser contractually agreed to waive advisory fees for the following funds:
| Fund | | Advisory Fee Waiver | | Amount Waived | |
| Government Money Market | | The daily amount required to avoid a negative daily distribution rate, until at least February 27, 2020 | | $ | 0 | |
| Dividend Income | | 0.10%, until at least February 27, 2020 | | | 164,825 | |
The amounts waived for the year ended October 31, 2019, are reflected as fees waived in the accompanying Statements of Operations. The Investment Adviser does not have the right to recoup waived fees.
Administrative Services Agreement. The Investment Adviser provides or arranges for each fund to have all of the necessary operational and support services it needs for a fee. These fees are computed daily and paid monthly, at an annualized percentage rate of the average daily value of the net assets of each fund as follows:
| Fund | | Class A | | Class B | | Class C | | Class Y | | Class R6 |
| Conservative Allocation | | 0.25% | | | 0.25% | | | 0.25% | | | N/A | | | N/A | |
| Moderate Allocation | | 0.25% | | | 0.25% | | | 0.25% | | | N/A | | | N/A | |
| Aggressive Allocation | | 0.25% | | | 0.25% | | | 0.25% | | | N/A | | | N/A | |
| Government Money Market | | 0.15% | | | 0.15% | | | N/A | | | N/A | | | N/A | |
| Tax-Free Virginia | | N/A | | | N/A | | | N/A | | | 0.35% | | | N/A | |
| Tax-Free National | | N/A | | | N/A | | | N/A | | | 0.35% | | | N/A | |
| High Quality Bond | | N/A | | | N/A | | | N/A | | | 0.19% | | | N/A | |
| Core Bond | | 0.15% | | | 0.15% | | | N/A | | | 0.15% | | | 0.02% | |
| Corporate Bond | | N/A | | | N/A | | | N/A | | | 0.25% | | | N/A | |
| High Income | | 0.20% | | | 0.20% | | | N/A | | | 0.20% | | | N/A | |
| Diversified Income | | 0.20% | | | 0.20% | | | 0.20% | | | N/A | | | N/A | |
| Covered Call & Equity Income | | 0.15% | | | N/A | | | 0.15% | | | 0.15% | | | 0.02% | |
| Dividend Income | | N/A | | | N/A | | | N/A | | | 0.35% | | | N/A | |
| Large Cap Value | | 0.36% | | | 0.36% | | | N/A | | | 0.36% | | | N/A | |
| Investors | | 0.20% | | | N/A | | | N/A | | | 0.20% | | | 0.02% | |
| Mid Cap | | 0.40% | | | 0.40% | | | N/A | | | 0.23% | | | 0.02% | |
| Small Cap | | 0.25% | | | N/A | | | N/A | | | 0.25% | | | N/A | |
| International Stock | | 0.30% | | | 0.30% | | | N/A | | | 0.30% | | | N/A | |
The direct expenses of the funds’ Independent Trustees and independent auditors are paid out of this fee on behalf of the funds.
The Investment Adviser may from time to time contractually or voluntarily agree to waive a portion of its fees or expenses related to the funds. Fee agreements may by modified or terminated at any time or for any reason, but only with fund Board approval. During the year ended October 31, 2019, the Investment Adviser contractually agreed to waive administrative services fees for the following funds:
| Fund | | Administrative Services Fee Waiver | | Amount Waived | |
| Government Money Market | | The daily amount required to avoid a negative daily distribution rate, until at least February 27, 2020 | | $ | 0 | |
| Dividend Income | | 0.05%, until at least February 27, 2020 | | | 82,413 | |
| Small Cap | | 0.04%, until at least August 31, 2021 | | | 9,356 | |
The amounts waived for the year ended October 31, 2019, are reflected as fees waived in the accompanying Statements of Operations. The Investment Adviser does not have the right to recoup waived fees.
Shareholder Service and Distribution Plans (Rule 12b-1). The Trust has adopted, on behalf of certain funds and share classes, distribution and/or service plans pursuant to Rule 12b-1 under the 1940 Act. These plans permit the applicable share classes to pay for distribution of their shares and servicing of their shareholders out of fund assets; therefore, the cost of these plans is indirectly borne by all shareholders who own shares of the affected funds and share classes. These plans are described below:
Shareholder Service Fees (Class A, B and C shares). Service plans have been adopted pursuant to Rule 12b-1 under the 1940 Act for Class A, B and C shares of each of the funds, other than the Government Money Market Fund. Under the terms of these plans, each fund pays MFD Distributor, LLC (“MFD”) a service fee equal to 0.25% of the average daily net assets attributable to each class of shares of that fund. The service fee is used by MFD to offset costs of servicing shareholder accounts or to compensate other qualified broker/dealers who sell shares of the funds pursuant to agreements with MFD for their costs of servicing shareholder accounts. MFD may retain any portion of the service fee for which there is no broker/dealer of record as partial consideration for its services with respect to shareholder accounts.
Distribution Fees (Class B and C shares only). Distribution plans have been adopted pursuant to Rule 12b-1 under 1940 Act for Class B and C shares of each of the funds. Under the terms of each plan, each fund pays its principal distributor, MFD, a fee equal to 0.75% of the average daily net assets attributable to Class B and C shares of that fund. MFD may use this fee to cover its distribution-related expenses (including commissions paid to broker/dealers for selling Class B and C shares) or distribution-related expenses of dealers. This fee increases the cost of investment in the Class B and C shares of a fund and, over time, may cost more than paying the initial sales charge for Class A shares.
The Shareholder Servicing & Distribution Fees are computed daily and paid monthly, at an annualized percentage rate of the average daily value of the net assets of each fund as follows:
| | | | Shareholder Servicing Fee | | | | Distribution Fee | | | | Total Shareholder Servicing
and Distribution Fees
(Rule 12b-1) | |
| Fund | | | Class A | | | | Class B | | | | Class C | | | | Class B | | | | Class C | | | | Class A | | | | Class B | | | | Class C | |
| Conservative Allocation | | | 0.25% | | | | 0.25% | | | | 0.25% | | | | 0.75% | | | | 0.75% | | | | 0.25% | | | | 1.00% | | | | 1.00% | |
| Moderate Allocation | | | 0.25% | | | | 0.25% | | | | 0.25% | | | | 0.75% | | | | 0.75% | | | | 0.25% | | | | 1.00% | | | | 1.00% | |
| Aggressive Allocation | | | 0.25% | | | | 0.25% | | | | 0.25% | | | | 0.75% | | | | 0.75% | | | | 0.25% | | | | 1.00% | | | | 1.00% | |
| Government Money Market | | | N/A | | | | N/A | | | | N/A | | | | 0.75% | | | | N/A | | | | N/A | | | | 0.75% | | | | N/A | |
| Tax-Free Virginia | | | N/A | | | | N/A | | | | N/A | | | | N/A | | | | N/A | | | | N/A | | | | N/A | | | | N/A | |
| Tax-Free National | | | N/A | | | | N/A | | | | N/A | | | | N/A | | | | N/A | | | | N/A | | | | N/A | | | | N/A | |
| High Quality Bond | | | N/A | | | | N/A | | | | N/A | | | | N/A | | | | N/A | | | | N/A | | | | N/A | | | | N/A | |
| Core Bond | | | 0.25% | | | | 0.25% | | | | N/A | | | | 0.75% | | | | N/A | | | | 0.25% | | | | 1.00% | | | | N/A | |
| Corporate Bond | | | N/A | | | | N/A | | | | N/A | | | | N/A | | | | N/A | | | | N/A | | | | N/A | | | | N/A | |
| High Income | | | 0.25% | | | | 0.25% | | | | N/A | | | | 0.75% | | | | N/A | | | | 0.25% | | | | 1.00% | | | | N/A | |
| Diversified Income | | | 0.25% | | | | 0.25% | | | | 0.25% | | | | 0.75% | | | | 0.75% | | | | 0.25% | | | | 1.00% | | | | 1.00% | |
| Covered Call & Equity Income | | | 0.25% | | | | N/A | | | | 0.25% | | | | N/A | | | | 0.75% | | | | 0.25% | | | | N/A | | | | 1.00% | |
| Dividend Income | | | N/A | | | | N/A | | | | N/A | | | | N/A | | | | N/A | | | | N/A | | | | N/A | | | | N/A | |
| Large Cap Value | | | 0.25% | | | | 0.25% | | | | N/A | | | | 0.75% | | | | N/A | | | | 0.25% | | | | 1.00% | | | | N/A | |
| Investors | | | 0.25% | | | | N/A | | | | N/A | | | | N/A | | | | N/A | | | | 0.25% | | | | N/A | | | | N/A | |
| | | | | | | | | | | | | | | | | | | | | | | | |
| | | | Shareholder Servicing Fee | | | Distribution Fee | | | Total Shareholder Servicing and Distribution Fees
(Rule 12b-1) |
| Fund | | | Class A | | | Class B | | | Class C | | | Class B | | | Class C | | | Class A | | | Class B | | | Class C |
| Mid Cap | | | 0.25% | | | 0.25% | | | N/A | | | 0.75% | | | N/A | | | 0.25% | | | 1.00% | | | N/A |
| Small Cap | | | 0.25% | | | N/A | | | N/A | | | N/A | | | N/A | | | 0.25% | | | N/A | | | N/A |
| International Stock | | | 0.25% | | | 0.25% | | | N/A | | | 0.75% | | | N/A | | | 0.25% | | | 1.00% | | | N/A |
59
Madison Funds | Notes to the Financial Statements - continued | October 31, 2019
MFD may from time to time voluntarily agree to waive a portion of its fees or expenses related to the funds. In that regard, MFD agreed to waive a portion of 12b-1 fees on the Government Money Market Fund Class B Shares until at least February 27, 2020 for the purpose of maintaining a one day yield of zero. The amount of the daily waiver is equal to the amount required to maintain a minimum daily distribution rate of zero. For the year ended October 31, 2019, no fees were waived. MFD does not have the right to recoup waived fees.
Front-end sales charges and contingent deferred sales charges (“CDSC”) do not represent expenses of the funds. Rather, they are deducted from the proceeds of sales of fund shares prior to investment (Class A shares) or from redemption proceeds prior to remittance (Class A, B, and C shares), as applicable. MFD, in turn, uses a portion of these fees to pay financial advisors who sell fund shares, as disclosed in the prospectus. The sales charges and CDSC collected and retained for the year ended October 31, 2019, were as follows:
| | | | Amount Collected | | | Amount Retained | |
| Fund | | | Class A | | | | Class B | | | | Class C | | | | Class A | | | | Class B | | | | Class C | |
| Conservative Allocation | | $ | 79,265 | | | $ | 3,102 | | | $ | 484 | | | $ | 9,899 | | | $ | 3,102 | | | | 484 | |
| Moderate Allocation | | | 120,739 | | | | 15,621 | | | | 643 | | | | 13,986 | | | | 15,621 | | | | 643 | |
| Aggressive Allocation | | | 82,987 | | | | 6,230 | | | | 134 | | | | 9,500 | | | | 6,230 | | | | 134 | |
| Government Money Market | | | – | | | | – | | | | N/A | | | | – | | | | – | | | | N/A | |
| Core Bond | | | 7,770 | | | | 558 | | | | N/A | | | | 939 | | | | 558 | | | | N/A | |
| High Income | | | 6,633 | | | | 238 | | | | N/A | | | | 766 | | | | 238 | | | | N/A | |
| Diversified Income | | | 122,308 | | | | 4,255 | | | | 924 | | | | 15,722 | | | | 4,255 | | | | 924 | |
| Covered Call & Equity Income | | | 16,042 | | | | N/A | | | | 233 | | | | 1,906 | | | | N/A | | | | 233 | |
| Large Cap Value | | | 23,563 | | | | 838 | | | | N/A | | | | 2,768 | | | | 838 | | | | N/A | |
| Investors | | | 91,537 | | | | N/A | | | | N/A | | | | 11,052 | | | | N/A | | | | N/A | |
| Mid Cap | | | 43,606 | | | | 1,205 | | | | N/A | | | | 4,906 | | | | 1,205 | | | | N/A | |
| Small Cap1 | | | 121 | | | | N/A | | | | N/A | | | | 9 | | | | N/A | | | | N/A | |
| International Stock | | | 11,853 | | | | 872 | | | | N/A | | | | 1,300 | | | | 872 | | | | N/A | |
1Small Cap Class A reflects the period October 1, 2019 to October 31, 2019.
Other Expenses: In addition to the fees described above, the funds are responsible for brokerage commissions and other expenses incurred in connection with the acquisition or disposition of investments, costs of borrowing money, overdrafts and any potential taxes owed and extraordinary expenses as approved by a majority of independent trustees.
Officers and Trustees: Certain officers and trustees of the funds are also officers of the Investment Adviser. The funds do not compensate their officers or affiliated trustees. Independent Trustees are compensated. Fees paid to the Trustees reduce the fees paid to the Investment Adviser pursuant to the Administrative Services Agreement as described above.
4. DIVIDENDS FROM NET INCOME AND DISTRIBUTIONS OF CAPITAL GAINS
With respect to dividends from net investment income, the Government Money Market Fund declares dividends, if any, daily and reinvests monthly. The Tax-Free Virginia, Tax-Free National, Core Bond, Corporate Bond, High Income and Diversified Income Funds declare and reinvest dividends, if any, monthly. The Conservative Allocation, High Quality Bond, Dividend Income and Covered Call & Equity Income Funds declare and reinvest dividends, if any, quarterly. The Moderate Allocation, Aggressive Allocation, Large Cap Value, Investors, Mid Cap, Small Cap and International Stock Funds declare and reinvest dividends, if any, annually. The funds distribute net realized gains from investment transactions, if any, to shareholders annually.
Income and capital gain distributions, if any, are determined in accordance with federal income tax regulations, which may differ from accounting principles generally accepted in the United States of America. Taxable distributions from income and realized capital gains in the funds differ from book amounts earned during the period due to differences in the timing of capital gains recognition, and due to the reclassification of certain gains or losses from capital to income. Dividends from net investment income are determined on a class level. Capital gains are determined on a fund level.
5. SECURITIES TRANSACTIONS
For the year ended October 31, 2019, aggregate cost of purchases and proceeds from sales of securities, other than short-term investment, were as follows:
| | | | U.S. Government Securities | | | Other Investment Securities | |
| Fund | | | Purchases | | | Sales | | | Purchases | | | Sales | |
| Conservative Allocation | | $ | – | | $ | – | | | $37,133,388 | | | $44,183,375 | |
| Moderate Allocation | | | – | | | – | | | 81,768,923 | | | 98,413,935 | |
| Aggressive Allocation | | | – | | | – | | | 45,966,255 | | | 53,870,539 | |
| Tax-Free Virginia | | | – | | | – | | | 4,809,546 | | | 4,624,288 | |
| Tax-Free National | | | – | | | – | | | 6,042,569 | | | 6,751,076 | |
| High Quality Bond | | | 13,280,269 | | | 18,923,186 | | | 3,841,736 | | | 6,084,780 | |
| Core Bond | | | 29,304,589.25 | | | 25,658,218 | | | 26,698,992 | | | 65,639,336 | |
| Corporate Bond | | | – | | | – | | | 3,058,474 | | | 9,365,111 | |
| High Income | | | – | | | – | | | 2,805,080 | | | 4,482,341 | |
| Diversified Income | | | 11,542,713 | | | 8,915,530 | | | 43,156,575 | | | 53,891,111 | |
| Covered Call & Equity Income | | | – | | | – | | | 137,344,110 | | | 129,628,646 | |
| Dividend Income | | | – | | | – | | | 132,942,552 | | | 44,768,420 | |
| Large Cap Value | | | – | | | – | | | 48,613,284 | | | 68,158,366 | |
| Investors | | | – | | | – | | | 67,941,112 | | | 78,585,200 | |
| Mid Cap | | | – | | | – | | | 146,560,138 | | | 115,990,768 | |
| Small Cap | | | – | | | – | | | 6,428,620 | | | 17,411,257 | |
| International Stock | | | – | | | – | | | 6,843,443 | | | 8,266,762 | |
6. COVERED CALL AND PUT OPTIONS
An option on a security is a contract that gives the holder of the option, in return for a premium, the right to buy from (in the case of a call) or sell to (in the case of a put) the writer of the option the security underlying the option at a specified exercise or “strike” price. The writer of an option on a security has an obligation upon exercise of the option to deliver the underlying security upon payment of the exercise price (in the case of a call) or pay the exercise price upon delivery of the underlying security (in the case of a put).
The Covered Call & Equity Income Fund pursues its primary objective by employing an option strategy of writing (selling) covered call options on common stocks. The number of call options the fund can write (sell) is limited by the amount of equity securities the fund holds in its portfolio. The fund will not write (sell) “naked” or uncovered call options. The fund seeks to produce a high level of current income and gains generated from option writing premiums and, to a lesser extent, from dividends. Covered call writing also helps to reduce volatility (and risk profile) of the fund by providing protection from declining stock prices.
When an option is written, the premium received is recorded as an asset with an equal liability and is subsequently marked to market to reflect the current fair value of the option written. These liabilities are reflected as options written in the Statements of Assets and Liabilities. Premiums received from writing options which expire unexercised are recorded on the expiration date as a realized gain. The difference between the premium received and the amount paid on effecting a closing purchase transaction, including brokerage commissions, is also treated as a realized gain, or if the premium is less than the amount paid for the closing purchase transactions, as a realized loss. If a call option is exercised, the premium is added to the proceeds from the sale of the underlying security in determining whether there has been a realized gain or loss. See Note 2 for information on derivatives.
7. FUTURES CONTRACTS AND OPTIONS ON FUTURES CONTRACTS
The Core Bond Fund may purchase and sell futures contracts and purchase and write options on futures contracts on a limited basis. The fund may purchase and sell futures contracts based on various securities (such as U.S. Government securities), securities indices, foreign currencies and other financial instruments and indices. The fund will engage in futures or related options transactions on a limited basis only for bona fide hedging purposes or for purposes of seeking to increase total returns to the extent permitted by regulations of the Commodity Futures Trading Commission.
Futures Contracts. The Core Bond Fund may use futures contracts to manage its exposure to the securities markets or to movements in interest rates and currency values. The primary risks associated with the use of futures contracts are the
60
Madison Funds | Notes to the Financial Statements - continued | October 31, 2019
imperfect correlation between the change in fair value of the securities held by the fund and the prices of futures contracts and the possibility of an illiquid market. Futures contracts are valued based upon their quoted daily settlement prices. Upon entering into a futures contract, the fund is required to deposit with its futures broker an amount of cash, U.S. Government and Agency Obligations, or other assets, in accordance with the initial margin requirements of the broker or exchange. Futures contracts are marked to market daily and based on such movements in the price of the contracts, an appropriate payable or receivable for the change in value may be posted or collected by the fund (“variation margin”). Gains or losses are recognized but not considered realized until the contracts expire or close. Futures contracts involve, to varying degrees, risk of loss in excess of the variation margin disclosed within exchange traded or centrally cleared financial derivative instruments on the Statements of Assets and Liabilities.
Options on Futures Contracts. The acquisition of put and call options on futures contracts will give the Core Bond Fund the right (but not the obligation) for a specified price, to sell or to purchase, respectively, the underlying futures contract at any time during the option period. As the purchaser of an option on a futures contract, the fund obtains the benefit of the futures position if prices move in a favorable direction but limits its risk of loss in the event of an unfavorable price movement to the loss of the premium and transaction costs.
The writing of a call option on a futures contract generates a premium which may partially offset a decline in the value of the fund’s assets. By writing a call option, the fund becomes obligated, in exchange for the premium, to sell a futures contract which may have a value higher than the exercise price. Conversely, the writing of a put option on a futures contract generates a premium, which may partially offset an increase in the price of securities that the fund intends to purchase. However, the fund becomes obligated to purchase a futures contract, which may have a value lower than the exercise price. Thus, the loss incurred by the fund in writing options on futures is potentially unlimited and may exceed the amount of the premium received.
8. FOREIGN SECURITIES
Each fund, other than the Tax-Free Funds and the Government Money Market Fund may invest in foreign securities. Foreign securities are defined as securities that are: (i) issued by companies organized outside the U.S. or whose principal operations are outside the U.S. or issued by foreign governments or their agencies or instrumentalities (“foreign issuers”); (ii) principally traded outside of the U.S.; and (iii) quoted or denominated in a foreign currency (“non-dollar securities”). Foreign securities include ADRs, European Depositary Receipts (“EDRs”), GDRs, Swedish Depositary Receipts (“SDRs”) and foreign money market securities.
Certain of the funds have reclaims receivable balances, in which the funds are due a reclaim on the taxes that have been paid to some foreign jurisdictions. The values of all reclaims are not significant for any of the funds and are reflected in Other Assets on the Statements of Assets and Liabilities. These receivables are reviewed to ensure the current receivable balance is reflective of the amount deemed to be collectible.
9. SECURITIES LENDING
The Board of Trustees has authorized the Funds, other than the Government Money Market Fund, to engage in securities lending with State Street Bank and Trust Company as securities lending agent pursuant to a Securities Lending Authorization Agreement (the “Agreement”) and subject to certain securities lending policies and procedures. Under the terms of the Agreement, and subject to the policies and procedures, the authorized funds may lend portfolio securities to qualified borrowers in order to generate additional income, while managing risk associated with thesecurities lending program. The Agreement requires that loans are collateralized at all times by cash or U.S. government securities, initially equal to at least 102% of the value of domestic securities and 105% of non-domestic securities. The loaned securities and collateral are marked to market daily to maintain collateral at 102% of the total loaned portfolio for each broker/borrower. Amounts earned as interest on investments of cash collateral, net of rebates and fees, if any, are included in the Statements of Operations. The primary risk associated with securities lending is loss associated with investment of cash and non-cash collateral. A secondary risk is if the borrower defaults on its obligation to return the securities loaned because of insolvency or other reasons. The fund could experience delays and costs in recovering securities loaned or in gaining access to the collateral. Under the Agreement, the securities lending agent has provided a limited indemnification in the event of a borrower default. The funds do not have a master netting agreement.
As of October 31, 2019, the aggregate fair value of securities on loan for the Madison fund family was $20,768,119. Cash collateral received for such loans are reinvested into the State Street Navigator Securities Lending Government Money Market Portfolio. Non-cash collateral is invested in U.S. Treasuries or Government securities. See below for fair value on loan and collateral breakout for each fund and each respective fund’s portfolio of investments for individual securities identified on loan.
| | | Market Value | | | Cash Collateral | | | Non-Cash
Collateral | |
| Madison Conservative Allocation Fund | | $ | 7,555,083 | | | $ | 7,649,162 | | | $ | 43,575 | |
| Madison Moderate Allocation Fund | | | 4,974,991 | | | | 5,065,826 | | | | – | |
| Madison High Quality Bond | | | 210,612 | | | | 214,965 | | | | – | |
| Madison Core Bond Fund | | | 213,012 | | | | 227,850 | | | | – | |
| Madison High Income Fund | | | 956,101 | | | | 982,778 | | | | – | |
| Madison Diversified Income Fund | | | 106,506 | | | | 113,925 | | | | – | |
| Madison Covered Call & Equity Income | | | 798,569 | | | | – | | | | 842,163 | |
| Madison Small Cap Fund | | | 5,686,304 | | | | 4,301,630 | | | | 1,364,420 | |
| Madison International Stock Fund | | | 266,941 | | | | 279,086 | | | | – | |
10. FEDERAL AND FOREIGN INCOME TAX INFORMATION
It is each fund’s policy to comply with the requirements of Subchapter M of the Internal Revenue Code of 1986 applicable to regulated investment companies and to distribute all its taxable income to its shareholders and any net realized capital gains at least annually. Accordingly, no provisions for federal income taxes are recorded in the accompanying statements.
The funds have not recorded any liabilities for material unrecognized tax benefits as of October 31, 2019. It is each fund’s policy to recognize accrued interest and penalties related to uncertain tax benefits in income taxes, as appropriate. Tax years that remain open to examination by major tax jurisdictions include tax years ended 2016-2019.
The tax character of distributions paid during the years ended October 31, 2019 and 2018 were as follows:
| | | | Ordinary Income | | | | Long-Term Capital Gain | |
| Fund | | | 2019 | | | | 2018 | | | | 2019 | | | | 2018 | |
| Conservative Allocation | | $ | 816,149 | | | $ | 1,671,190 | | | $ | 1,846,126 | | | $ | 1,500,836 | |
| Moderate Allocation | | | 1,779,112 | | | | 3,234,984 | | | | 8,855,369 | | | | 3,897,589 | |
| Aggressive Allocation | | | 661,934 | | | | 1,479,235 | | | | 4,977,290 | | | | 2,179,119 | |
| Government Money Market | | | 262,297 | | | | 156,093 | | | | – | | | | – | |
| High Quality Bond | | | 1,708,613 | | | | 1,519,170 | | | | – | | | | – | |
| Core Bond | | | 4,289,911 | | | | 4,914,754 | | | | – | | | | 65,309 | |
| Corporate Bond | | | 489,150 | | | | 646,146 | | | | 4,347 | | | | 148,647 | |
| High Income | | | 957,064 | | | | 1,082,554 | | | | – | | | | – | |
| Diversified Income | | | 2,872,876 | | | | 2,684,671 | | | | 12,056,811 | | | | 2,474,390 | |
| Covered Call & Equity Income | | | 12,181,405 | | | | 10,217,816 | | | | – | | | | – | |
| Dividend Income | | | 2,676,689 | | | | 2,013,485 | | | | 11,361,969 | | | | 2,417,037 | |
| Large Cap Value | | | 811,605 | | | | 1,600,961 | | | | 7,650,469 | | | | 7,784,709 | |
| Investors | | | 1,676,076 | | | | 2,761,809 | | | | 40,976,911 | | | | 14,652,121 | |
| Mid Cap | | | 2,503,740 | | | | 75,123 | | | | 26,595,610 | | | | 12,318,722 | |
| Small Cap* | | | – | | | | 1,371,532 | | | | – | | | | 6,028,679 | |
| International Stock | | | 287,826 | | | | 262,752 | | | | 565,428 | | | | – | |
*Amounts for Small Cap Fund reflect distributions during the one-month period ended October 31, 2019.
61
Madison Funds | Notes to the Financial Statements - continued | October 31, 2019
| | | Tax Exempt Income | | | Ordinary Income | | | Capital Gain | |
| Fund | | | 2019 | | | | 2018 | | | | 2019 | | | | 2018 | | | | 2019 | | | | 2018 | |
| Tax-Free Virginia | | $ | 427,160 | | | $ | 449,377 | | | $ | – | | | $ | – | | | $ | – | | | $ | – | |
| Tax-Free National | | | 523,821 | | | | 540,980 | | | $ | – | | | | 3,539 | | | | 127,563 | | | | 73,275 | |
As of October 31, 2019, the components of distributable earnings on a tax basis were as follows:
| Fund | | Ordinary Income | | Tax Exempt Income | | Long-Term Capital Gain | |
| Conservative Allocation | | | $ | 107,712 | | | | $ | – | | | | $ | 1,314,463 | | |
| Moderate Allocation | | | | 1,072,254 | | | | | – | | | | | 3,314,224 | | |
| Aggressive Allocation | | | | 402,490 | | | | | – | | | | | 2,527,340 | | |
| Government Money Market | | | | 360 | | | | | – | | | | | – | | |
| Tax-Free Virginia | | | | – | | | | | 2,354 | | | | | – | | |
| Tax-Free National | | | | 6,609 | | | | | 7,097 | | | | | 67,697 | | |
| High Quality Bond | | | | 150,446 | | | | | – | | | | | – | | |
| Core Bond | | | | 431,433 | | | | | – | | | | | – | | |
| Corporate Bond | | | | 4,185 | | | | | – | | | | | – | | |
| High Income | | | | 5,624 | | | | | – | | | | | – | | |
| Diversified Income | | | | 14,572 | | | | | – | | | | | 8,058,491 | | |
| Covered Call & Equity Income | | | | 2,421,165 | | | | | – | | | | | – | | |
| Dividend Income | | | | 330,082 | | | | | – | | | | | 5,363,786 | | |
| Large Cap Value | | | | 420,921 | | | | | – | | | | | 1,807,159 | | |
| Investors | | | | 993,388 | | | | | – | | | | | 16,831,180 | | |
| Mid Cap | | | | 17,207 | | | | | – | | | | | 21,674,396 | | |
| Small Cap | | | | – | | | | | – | | | | | 9,953,599 | | |
| International Stock | | | | 269,007 | | | | | – | | | | | 947,498 | | |
For federal income tax purposes, the funds listed below have capital loss carryovers as of October 31, 2019, which are available to offset future capital gains, if any, realized through the fiscal year listed:
| | | | No Expiration Date |
| Fund | | Short-Term | | | Long-Term |
| Government Money Market | | $ | 368 | | | | $ | – | |
| Tax-Free Virginia | | | 16,251 | | | | | 3,809 | |
| High Quality Bond | | | 20,149 | | | | | 188,298 | |
| Corporate Bond | | | – | | | | | 49,711 | |
| High Income | | | 457,060 | | | | | 1,327,546 | |
Certain ordinary losses incurred after December 31 and within the taxable year are deemed to arise on the first day of the funds’ next taxable year, if the funds so elect.
Amounts deferred are as follows:
| Fund | | Amount Deferred | |
| Mid Cap | | | $ | 1,398,413 | | |
| Small Cap | | | | 422,454 | | |
For the year ended October 31, 2019, capital losses utilized for each Fund were as follows:
| Fund | | Amount Utilized | |
| Core Bond | | | $ | 441,251 | | |
| High Quality Bond | | | | 44,442 | | |
At October 31, 2019, the aggregate gross unrealized appreciation (depreciation) and net unrealized appreciation (depreciation) for all securities, as computed on a federal income tax basis for each fund were as follows:
| Fund | | Appreciation | | | Depreciation | | | Net | |
| Conservative Allocation | | $ | 4,277,274 | | | $ | – | | | $ | 4,277,274 | |
| Moderate Allocation | | | 13,515,680 | | | | 211 | | | | 13,515,469 | |
| Aggressive Allocation | | | 7,058,411 | | | | – | | | | 7,058,411 | |
| Tax-Free Virginia | | | 1,059,123 | | | | 6,245 | | | | 1,052,878 | |
| Tax-Free National | | | 1,283,179 | | | | 1,924 | | | | 1,281,255 | |
| High Quality Bond | | | 1,662,373 | | | | – | | | | 1,662,373 | |
| Core Bond | | | 6,926,592 | | | | 657,974 | | | | 6,268,618 | |
| Corporate Bond | | | 1,069,179 | | | | 26,679 | | | | 1,042,500 | |
| High Income | | | 432,776 | | | | 543,824 | | | | (111,048 | ) |
| Diversified Income | | | 34,559,280 | | | | 1,075,779 | | | | 33,483,501 | |
| Covered Call & Equity Income | | | 2,425,686 | | | | 29,639,090 | | | | (27,213,404 | ) |
| Dividend Income | | | 31,841,043 | | | | 1,262,454 | | | | 30,578,589 | |
| Large Cap Value | | | 10,424,801 | | | | 855,005 | | | | 9,569,796 | |
| Investors | | | 106,565,899 | | | | 5,290,871 | | | | 101,275,028 | |
| Mid Cap | | | 206,349,962 | | | | 5,346,449 | | | | 201,003,513 | |
| Small Cap | | | 54,804,768 | | | | 4,213,991 | | | | 50,590,777 | |
| International Stock | | | 4,364,937 | | | | 475,214 | | | | 3,889,723 | |
The differences between cost amounts for book purposes and tax purposes are primarily due to the tax deferral of wash sales.
Reclassification Adjustments: Paid-in capital, undistributed net investment income, and accumulated net realized gain (loss) have been adjusted in the Statements of Assets and Liabilities for permanent book-tax differences for all funds.
Differences relate to the tax treatment of net operating losses, paydown gains and losses, foreign currency gains and losses, distributions from real estate investment trusts, distribution re-designations from investments in other regulated investment companies, and unusable capital loss carryforwards.
To the extent these book and tax differences are permanent in nature, such amounts are reclassified at the end of the fiscal year among paid-in capital in excess of par value, undistributed net investment income (loss) and undistributed net realized gain (loss) on investments and foreign currency translations. Accordingly, at October 31, 2019, reclassifications were recorded as follows:
| Fund | | Paid-in Capital | | | Undistributed
Net Investment
Income (Loss) | | | Accumulated
Net Realized
Gain (Loss) | |
| Conservative Allocation | | $ | – | | | $ | 4,746 | | | $ | (4,746 | ) |
| Moderate Allocation | | | – | | | | 18,175 | | | | (18,175 | ) |
| Aggressive Allocation | | | (2 | ) | | | 10,643 | | | | (10,641 | ) |
| Government Money Market | | | – | | | | – | | | | – | |
| Tax-Free Virginia | | | – | | | | – | | | | – | |
| Tax-Free National | | | – | | | | – | | | | – | |
| High Quality Bond | | | – | | | | – | | | | – | |
| Core Bond | | | – | | | | 227,209 | | | | (227,209 | ) |
| Corporate Bond | | | – | | | | – | | | | – | |
| High Income | | | – | | | | – | | | | – | |
| Diversified Income | | | 2 | | | | 67,158 | | | | (67,160 | ) |
| Covered Call & Equity Income | | | – | | | | 5,536,198 | | | | (5,536,198 | ) |
| Dividend Income | | | – | | | | – | | | | – | |
| Large Cap Value | | | – | | | | – | | | | – | |
| Investors Fund | | | – | | | | – | | | | – | |
| Mid Cap | | | – | | | | (145,960 | ) | | | 145,960 | |
| Small Cap | | | (8,445,513 | ) | | | (238,577 | ) | | | 8,684,090 | |
| International Stock | | | – | | | | (4,117 | ) | | | 4,117 | |
11. CERTAIN RISKS
Investing in certain financial instruments, including forward foreign currency contracts, involves certain risks. Risks associated with these instruments include potential for an illiquid secondary market for the instruments or inability of counterparties to perform under the terms of the contracts, changes in the value of foreign currency relative to the U.S. dollar and financial statements’ volatility resulting from an imperfect correlation between the movements in the prices of the instruments and the prices of the underlying securities and interest rates being hedged. The International Stock Fund may enter into these contracts primarily to protect the fund from adverse currency movements.
Investing in foreign securities involves certain risks not necessarily found in U.S. markets. These include risks associated with adverse changes in economic, political, regulatory and other conditions, changes in currency exchange rates, exchange control regulations, expropriation of assets or nationalization, imposition of withholding taxes on dividend or interest payments or capital gains, and possible difficulty in obtaining and enforcing judgments against foreign entities. Further, issuers of foreign securities are subject to different, and often less comprehensive, accounting, reporting and disclosure requirements than domestic issuers.
62
Madison Funds | Notes to the Financial Statements - continued | October 31, 2019
The funds may be subject to interest rate risk which is the risk that the value of your investment will fluctuate with changes in interest rates. Typically, a rise in interest rates causes a decline in the fair value of income-bearing securities. When interest rates rise, bond prices fall; generally the longer a bond’s maturity, the more sensitive it is to risk. Federal Reserve policy changes may expose fixed-income and related markets to heightened volatility and may reduce liquidity for certain fund investments, which could cause the value of a fund’s investments and share price to decline. The Core Bond Fund may invest in derivatives tied to fixed-income markets and may be more substantially exposed to these risks than a fund that does not invest in derivatives.
The Government Money Market Fund is not insured or guaranteed by the Federal Deposit Insurance Corporation (“FDIC”) or any other government agency. Although the fund seeks to preserve the value of your investment at $1.00 per share, it is possible to lose money by investing in the fund. Additionally, while the fund has maintained a constant share price since inception, and will continue to try to do so, neither the Investment Adviser nor its affiliates are required to make a capital infusion, enter into a capital support agreement or take other actions to prevent the fund’s share price from falling below $1.00.
The Tax-Free Funds invest in municipal securities. Municipal securities generally are subject to possible default, bankruptcy or insolvency of the issuer. Principal and interest repayment may be affected by federal, state and local legislation, referendums, judicial decisions and executive acts. The tax-exempt status of municipal securities may be affected by future changes in the tax laws, litigation involving the tax status of the securities and errors and omissions by issuers and their counsel. Madison will not attempt to make an independent determination of the present or future tax-exempt status of municipal securities acquired for the funds. While most municipal securities have a readily available market, a variety of factors, including the scarcity of issues and the fact that tax-free investments are inappropriate for significant numbers of investors, limit the depth of the market for these securities. Accordingly, it may be more difficult for the funds to sell large blocks of municipal securities advantageously than would be the case with comparable taxable securities.
The Core Bond Fund may invest in futures contracts or options on futures contracts. Investing in futures contracts and options on futures entail certain other risks such as: unanticipated changes in interest rates, securities prices or currency exchange rates, and may result in a poorer overall performance for the fund than if it had not entered into any futures contracts or options transactions. In the event of an imperfect correlation between a futures position and portfolio position which is intended to be protected, the desired protection may not be obtained and the fund may be exposed to risk of loss. Perfect correlation between the fund’s futures positions and portfolio positions may be difficult to achieve.
The High Income Fund invests in securities offering high current income which generally will include bonds in the below investment grade categories of recognized rating agencies (so-called “junk bonds”). These securities generally involve more credit risk than securities in the higher rating categories. In addition, the trading market for high yield securities may be relatively less liquid than the market for higher-rated securities. The fund generally invests at least 80% of its net assets in high yield securities.
The Covered Call & Equity Income Fund invests in options on securities. As the writer of a covered call option, the fund forgoes, during the option’s life, the opportunity to profit from increases in the fair value of the security covering the call option above the sum of the premium and the strike price of the call but has retained the risk of loss should the price of the underlying security decline. A writer of a put option is exposed to the risk of loss if fair value of the underlying securities declines, but profits only to the extent of the premium received if the underlying security increases in value. The writer of an option has no control over the time when it may be required to fulfill its obligation as writer of the option. Once an option writer has received an exercise notice, it cannot effect a closing purchase transaction in order to terminate its obligation under the option and must deliver the underlying security at the exercise price.
The Allocation Funds are fund of funds, meaning that each invests primarily in Underlying Funds, including ETFs. Thus, each fund’s investment performance and its ability to achieve its investment goal are directly related to the performance of the Underlying Funds in which it invests; and the Underlying Fund’s performance, in turn, depends on the particular securities in which that Underlying Fund invests and the expenses of that fund. Accordingly, the Allocation Funds are subject to the risks of the Underlying Funds in direct proportion to the allocation of their respective assets among the Underlying Funds.
Additionally, the Allocation Funds are subject to asset allocation risk and manager risk. Manager risk (i.e., fund selection risk) is the risk that the Underlying Fund(s) selected to fulfill a particular asset class underperforms their peers. Asset allocation risk is the risk that the allocation of the fund’s assets among the various asset classes and market segments will cause the fund to underperform other funds with a similar investment objective.
The funds are also subject to cybersecurity risk, which include the risks associated with computer systems, networks and devices to carry out routine business operations. These systems, networks and devices employ a variety of protections that are designed to prevent cyberattacks. Despite the various cyber protections utilized by the funds, the Investment Adviser, and other service providers, their systems, networks, or devices could potentially be breached. The funds, their shareholders, and the Investment Adviser could be negatively impacted as a result of a cybersecurity breach. The funds cannot control the cybersecurity plans and systems put in place by service providers or any other third parties whose operations may affect the funds. The funds do monitor this risk closely.
In addition to the other risks described above and in the prospectus, you should understand what we refer to as “unknown market risks”. While investments in securities have been keystones in wealth building and management, at times these investments have produced surprises. Those who enjoyed growth and income of their investments generally were rewarded for the risks they took by investing in the markets. Although the Investment Adviser seeks to appropriately address and manage the risks identified and disclosed to you in connection with the management of the securities in the funds, you should understand that the very nature of the securities markets includes the possibility that there may be additional risks of which we are not aware. We certainly seek to identify all applicable risks and then appropriately address them, take appropriate action to reasonably manage them and to make you aware of them so you can determine if they exceed your risk tolerance. Nevertheless, the often volatile nature of the securities markets and the global economy in which we work suggests that the risk of the unknown is something to consider in connection with an investment in securities. Unforeseen events could under certain circumstances produce a material loss of the value of some or all of the securities we manage for you in the funds.
12. CAPITAL SHARES AND AFFILIATED OWNERSHIP
The Allocation Funds invest in Underlying Funds, certain of which may be deemed to be under common control because of the same or affiliated investment adviser and membership in a common family of investment companies (the “Affiliated Issuers”). A summary of the transactions with each Affiliated Underlying Fund during the year ended October 31, 2019 follows:
63
Madison Funds | Notes to the Financial Statements - continued | October 31, 2019
| Fund/Underlying Fund | | Beginning
Value as of
10/31/2018 | | Gross
Additions | | Gross
Sales | | Realized
Gain (Loss) | | Change in Unrealized Appreciation (Depreciation) | | Value at 10/31/2019 | | Shares | | Dividend Income | | Distributions Received1 |
| Conservative Allocation Fund | | | | | | | | | | | | | | | | | | |
| Madison Core Bond Fund Class Y | | $ | 13,042,539 | | | $ | – | | | $ | (2,313,895 | ) | | $ | (67,366 | ) | | $ | 985,572 | | | $ | 11,646,850 | | | | 1,136,278 | | | $ | 337,612 | | | $ | – | |
| Madison Corporate Bond Fund Class Y | | | 4,856,723 | | | | – | | | | (1,101,099 | ) | | | (47,733 | ) | | | 469,525 | | | | 4,177,416 | | | | 346,961 | | | | 116,559 | | | | 1,073 | |
| Madison Dividend Income Fund Class Y | | | 4,770,573 | | | | 724,974 | | | | (74,757 | ) | | | 2,434 | | | | 213,387 | | | | 5,636,611 | | | | 203,856 | | | | 85,520 | | | | 459,454 | |
| Madison Investors Fund Class Y | | | 4,836,327 | | | | 726,836 | | | | (74,526 | ) | | | 2,053 | | | | 171,535 | | | | 5,662,225 | | | | 237,609 | | | | 31,372 | | | | 695,465 | |
| Madison Mid Cap Fund Class Y | | | 345,040 | | | | 347,940 | | | | – | | | | – | | | | 95,857 | | | | 788,837 | | | | 67,364 | | | | 94 | | | | 22,846 | |
| Totals | | $ | 27,851,202 | | | $ | 1,799,750 | | | $ | (3,564,277 | ) | | $ | (110,612 | ) | | $ | 1,935,876 | | | $ | 27,911,939 | | | | | | | $ | 571,157 | | | $ | 1,178,838 | |
| | | | | | | | | | | | | | | | | | | | | | | | | | | | | | | | | | | | | |
| Moderate Allocation Fund | | | | | | | | | | | | | | | | | | | | | | | | | | | | | | | | | | | | |
| Madison Core Bond Fund Class Y | | $ | 16,767,597 | | | $ | – | | | $ | (2,201,158 | ) | | $ | (55,089 | ) | | $ | 1,271,718 | | | $ | 15,783,068 | | | | 1,539,812 | | | $ | 411,750 | | | | – | |
| Madison Dividend Income Fund Class Y | | | 15,524,909 | | | | 1,887,005 | | | | – | | | | – | | | | 693,095 | | | | 18,105,009 | | | | 654,792 | | | | 269,896 | | | $ | 1,442,108 | |
| Madison Investors Fund Class Y | | | 15,474,848 | | | | 2,325,665 | | | | – | | | | – | | | | 557,756 | | | | 18,358,269 | | | | 770,385 | | | | 100,380 | | | | 2,225,285 | |
| Madison Large Cap Value Fund Class Y | | | 3,086,868 | | | | 285,777 | | | | (2,984,782 | ) | | | (490,026 | ) | | | 102,163 | | | | – | | | | – | | | | 32,019 | | | | 253,759 | |
| Madison Mid Cap Fund Class Y | | | 3,278,532 | | | | 1,417,976 | | | | – | | | | – | | | | 671,432 | | | | 5,367,940 | | | | 458,407 | | | | 893 | | | | 217,083 | |
| Totals | | $ | 54,132,754 | | | $ | 5,916,423 | | | $ | (5,185,940 | ) | | $ | (545,115 | ) | | $ | 3,296,164 | | | $ | 57,614,286 | | | | | | | $ | 814,938 | | | $ | 4,138,235 | |
| Aggressive Allocation Fund | | | | | | | | | | | | | | | | | | | | | | | | | | | | | | | | | | | | |
| Madison Core Bond Fund Class Y | | $ | 4,527,616 | | | $ | – | | | $ | (535,195 | ) | | $ | (13,786 | ) | | $ | 341,585 | | | $ | 4,320,220 | | | | 421,485 | | | $ | 110,856 | | | | – | |
| Madison Dividend Income Fund Class Y | | | 7,927,719 | | | | 1,555,456 | | | | – | | | | – | | | | 370,290 | | | | 9,853,465 | | | | 356,364 | | | | 144,116 | | | $ | 758,839 | |
| Madison Investors Fund Class Y | | | 8,285,193 | | | | 1,470,153 | | | | (203,705 | ) | | | 5,653 | | | | 299,688 | | | | 9,856,982 | | | | 413,638 | | | | 53,743 | | | | 1,191,412 | |
| Madison Large Cap Value Fund Class Y | | | 2,043,720 | | | | 171,658 | | | | (1,964,409 | ) | | | (289,965 | ) | | | 38,996 | | | | – | | | | – | | | | 19,232 | | | | 152,425 | |
| Madison Mid Cap Fund Class Y | | | 1,935,088 | | | | 1,553,656 | | | | – | | | | – | | | | 407,415 | | | | 3,896,159 | | | | 332,721 | | | | 527 | | | | 128,129 | |
| Totals | | $ | 24,719,336 | | | $ | 4,750,923 | | | $ | (2,703,309 | ) | | $ | (298,098 | ) | | $ | 1,457,974 | | | $ | 27,926,826 | | | | | | | $ | 328,475 | | | $ | 2,230,804 | |
1Distributions received include distributions from net investment income and from capital gains from the underlying funds.
13. FUND REORGANIZATION
As of the close of business on August 30, 2019 the net assets of the Predecessor Fund were reorganized into the Small Cap Fund, based upon approval granted at a meeting held August 22, 2019 by the shareholders of the Predecessor Fund. Though the legal survivor of the business combination was the Small Cap Fund, the Predecessor Fund was determined to be the accounting survivor, and therefore, the historical performance of the Predecessor Fund was retained. Under the plan of reorganization, a single share of the Predecessor Fund was exchanged for 2.469195 shares of the Small Cap Fund’s Class Y shares. Net asset values and other per share information within the financial highlights for historical periods were adjusted by this conversion ratio for comparability purposes due to the accounting survivor being the Predecessor Fund. Additionally, due to the accounting survivor being the Predecessor Fund, previously held Class A shares the Small Cap Fund are treated to have commenced investment operations on August 31, 2019 as shown in the financial highlights. The Reorganization was accomplished by a tax free exchange as detailed below:
| | | Before Merger | | After Merger |
| | | Broadview
Opportunity Fund | | Madison Small Cap Fund
Class Y | | Madison Small Cap Fund
Class Y |
| Net Assets | | $ | 254,130,721 | | | $ | 24,220,585 | | | $ | 278,351,306 | |
| Shares Outstanding | | | 9,731,341 | | | | 2,290,103 | | | | 26,318,681 | |
| NAV per share | | $ | 26.11 | | | $ | 10.58 | | | $ | 10.58 | |
*Above table illustrates the sole share class of the Predecessor Fund before the Reorganization and the Small Cap Fund’s Class Y shares immediately before and after Reorganization. Immediately before and after the Reorganization, the Small Cap Fund had 321,301 Class A shares outstanding with a combined net asset value of $3,382,044 and a NAV per share of $10.53. As discussed above, as a result of the Reorganization, Class A shares are deemed to have commenced operation on August 31, 2019.
14. SUBSEQUENT EVENTS
Management has evaluated the impact of all subsequent events on the funds through the date the financial statements were available for issue. No other events have taken place that meet the definition of subsequent event that require adjustment to, or disclosure in the financial statements.
64
Madison Funds | Notes to the Financial Statements - continued | October 31, 2019
Report of Independent Registered Public Accounting Firm
To the Shareholders and Board of Trustees of Madison Funds:
Opinion on the Financial Statements and Financial Highlights
We have audited the accompanying statements of assets and liabilities of Madison Funds (the “Funds”) comprising Madison Conservative Allocation Fund, Madison Moderate Allocation Fund, Madison Aggressive Allocation Fund, Madison Government Money Market Fund, Madison Tax-Free Virginia Fund, Madison Tax-Free National Fund, Madison High Quality Bond Fund, Madison Core Bond Fund, Madison Corporate Bond Fund, Madison High Income Fund, Madison Diversified Income Fund, Madison Covered Call & Equity Income Fund, Madison Dividend Income Fund, Madison Large Cap Value Fund, Madison Investors Fund, Madison Mid Cap Fund, Madison Small Cap Fund, and Madison International Stock Fund, including the portfolios of investments as of October 31, 2019, the related statements of operations for the year then ended, the statements of changes in net assets for each of the two years in the period then ended, the financial highlights for each of the five years in the period then ended; and the related notes, except Madison Small Cap Fund; the related statements of operations, changes in net assets, and financial highlights for the period from October 1, 2019 through October 31, 2019 and the year ended September 30, 2019, for Madison Small Cap Fund; and the related notes.
In our opinion, the financial statements and financial highlights present fairly, in all material respects, the financial position of the Funds constituting the Madison Funds, except Madison Small Cap Fund as of October 31, 2019, and the results of their operations for the year then ended, the changes in their net assets for each of the two years in the period then ended, and the financial highlights for each of the five years in the period then ended in conformity with accounting principles generally accepted in the United States of America. Also, in our opinion, the financial statements and financial highlights present fairly, in all material respects, the financial position of Madison Small Cap Fund as of October 31, 2019 the results of its operations, changes in its net assets and financial highlights for the period ended October 31, 2019 and for the year ended September 30, 2019, in conformity with accounting principles generally accepted in the United States of America.
The statement of changes in net assets for the year ended September 30, 2018 for Madison Small Cap Fund was audited by another auditor whose report dated November 20, 2018, expressed an unqualified opinion on this statement. The financial highlights for the four years in the period ended September 30, 2018, for Madison Small Cap Fund, before the effects of adjustments to retrospectively adjust the financial highlights to give effect to the reorganization discussed in footnote 13 to the financial statements, were audited by other auditors whose reports, dated November 20, 2018 and November 27, 2015, expressed unqualified opinions on those financial highlights. We have audited the adjustments to the financial highlights for each of the years in the period ended September 30, 2018, to retrospectively adjust the financial highlights to give effect to the reorganization as discussed in footnote 13 to the financial statements. Our procedures included recalculating the conversion factor discussed in footnote 13 to the financial statements. In our opinion, such retrospective adjustments are appropriate and have been appropriately applied. However, we were not engaged to audit, review, or reperform any procedures to the financial statements and financial highlights for periods prior to October 1, 2018 other than with respect to the retrospective adjustment described herein, and accordingly, we do not express an opinion or any other form of assurance on the financial statements and financial highlights of Madison Small Cap Fund for periods prior to October 1, 2018.
Basis for Opinion
These financial statements and financial highlights are the responsibility of the Funds’ management. Our responsibility is to express an opinion on the Funds’ financial statements and financial highlights based on our audits. We are a public accounting firm registered with the Public Company Accounting Oversight Board (United States) (PCAOB) and are required to be independent with respect to the Funds in accordance with the U.S. federal securities laws and the applicable rules and regulations of the Securities and Exchange Commission and the PCAOB.
We conducted our audits in accordance with the standards of the PCAOB. Those standards require that we plan and perform the audit to obtain reasonable assurance about whether the financial statements and financial highlights are free of material misstatement, whether due to error or fraud. The Funds are not required to have, nor were we engaged to perform, an audit of their internal control over financial reporting. As part of our audits we are required to obtain an understanding of internal control over financial reporting but not for the purpose of expressing an opinion on the effectiveness of the Funds’ internal control over financial reporting. Accordingly, we express no such opinion.
Our audits included performing procedures to assess the risks of material misstatement of the financial statements and financial highlights, whether due to error or fraud, and performing procedures that respond to those risks. Such procedures included examining, on a test basis, evidence regarding the amounts and disclosures in the financial statements and financial highlights. Our audits also included evaluating the accounting principles used and significant estimates made by management, as well as evaluating the overall presentation of the financial statements and financial highlights. Our procedures included confirmation of securities owned as of October 31, 2019, by correspondence with the custodian and brokers; when replies were not received from brokers, we performed other auditing procedures. We believe that our audits provide a reasonable basis for our opinion.
/s/ Deloitte & Touche, LLP
Chicago, IL
December 20, 2019
We have served as the auditor of one or more Madison Funds investment companies since 2009.
65
Madison Funds | Notes to the Financial Statements - continued | October 31, 2019
Other Information(unaudited)
DISCUSSION OF CONTRACT RENEWAL PROCESS AND CONSIDERATIONS
At an in-person meeting of the Board held on July 30-31, 2019, the Board of Trustees (the “Board” or “Trustees”) of Madison Funds (the “Trust”), and by a separate vote, the Independent Trustees of the Trust, approved the continuance of the Investment Advisory Agreement between the Trust and Madison Asset Management, LLC (the “Adviser”) with respect to the individual series of the Trust (each a “fund” and together, the “funds”) and the continuance of the Investment Sub-Advisory Agreements between the Adviser and Lazard Asset Management LLC (“Lazard”) and Wellington Management Company LLP (“Wellington,” and together with Lazard, the “Sub-Advisers”) with respect to certain funds.
In determining whether to approve the continuation of the Investment Advisory Agreement and the Investment Sub-Advisory Agreements (together, the “Agreements”) the Adviser and Sub-Advisers furnished information necessary for a majority of the Independent Trustees to make the determination that the continuance of the Agreements was in the best interests of the respective funds and their shareholders. The Board noted that, following the consummation of the pending merger of the Broadview Opportunity Fund with and into the Madison Small Cap Fund (the “Broadview Transaction”), Wellington would be terminated as Sub-Adviser to the Madison Small Cap Fund and the combined Fund would be managed internally by the portfolio management team that currently manages the Broadview Opportunity Fund. Accordingly, the Board was being asked to consider approving the continuation of the Sub-Advisory Agreement between the Adviser and Wellington through the consummation of the Broadview Transaction, after which the Madison Small Cap Fund would be managed under the Investment Advisory Agreement with the Adviser. The information provided to the Board included: (1) data comparing advisory fees and expense ratios of comparable investment companies; (2) comparative performance information; (3) the Adviser’s and its affiliates’ revenues and costs of providing services to the funds; and (4) information about the Adviser’s and Sub-Advisers’ personnel. Prior to voting, the Independent Trustees reviewed the proposed continuance of the Investment Advisory Agreement and the Investment Sub-Advisory Agreements with management and independent legal counsel to the Independent Trustees and received materials from such counsel discussing the legal standards for their consideration of the proposed continuation of the Agreements. The Independent Trustees also reviewed the proposed continuation of the Investment Advisory Agreement and Investment Sub-Advisory Agreements with independent legal counsel in a private session at which no representatives of management were present. The Independent Trustees made a variety of additional inquiries regarding the written materials provided by the Adviser and the Sub-Advisers, and representatives of the Adviser and Lazard, respectively, discussed with the Independent Trustees each of those additional inquiries at the July 2019 meeting. The Board noted that representatives from Wellington did not join the meeting (telephonically or otherwise) in light of the pending Broadview Transaction, but representatives from the Adviser responded to questions regarding the materials provided by Wellington.
In approving the continuance of the Investment Advisory Agreement and the Investment Sub-Advisory Agreements, the Board considered various factors, among them: (1) the nature, extent and quality of services provided by the Adviser and Sub-Advisers to the funds, as applicable, including the personnel providing such services; (2) the Adviser’s and Sub-Advisers’ compensation and profitability; (3) a comparison of fees and performance with comparable funds and accounts; (4) economies of scale; and (5) the terms of the Investment Advisory Agreement and the Investment Sub-Advisory Agreements. The Board’s analysis of these factors is set forth below. The Independent Trustees were advised by independent legal counsel throughout the process.
With regard to thenature, extent and quality of the services to be provided by the Adviser and Sub-Advisers, the Board reviewed the biographies and tenure of the personnel involved in Trust management and the experience of the Adviser (and, as applicable, Sub-Adviser) and its affiliates as investment manager to other investment companies with similar investment strategies or to individual clients or institutions with similar investment strategies. They recognized the wide array of investment professionals employed by the respective firm or firms. Representatives of the Adviser and Sub-Advisers discussed or otherwise presented their respective firms’ ongoing investment philosophies and strategies intended to provide investment performance consistent with each fund’s investment objectives in a variety of market environments. The Trustees also noted their familiarity with the Adviser and its affiliates due to the Adviser’s history of providing advisory services to its proprietary investment company clients.
The Board also discussed the quality of services provided to the Trust by its applicable transfer agent, fund administrator and custodian as well as the various administrative services provided directly by the Adviser. Such services included arranging for third party service providers to provide all necessary administration as well as supervising any Sub-Advisers to fund portfolios.
Based on their review of the information provided, the Board determined with respect to each fund that the nature, extent and quality of services provided by the Adviser (and Sub-Adviser, as applicable) to the fund were satisfactory.
With regard to theinvestment performance of the Trust and the investment adviser, the Board reviewed current performance information provided in the written Board materials. They discussed the reasons for both outperformance and underperformance compared with peer groups and applicable indices and benchmarks. They recognized that the usefulness of comparative performance data as a frame of reference to measure a fund’s performance may be limited because the performance peer group, among other things, may not precisely reflect the objectives and strategies of the funds, may have a different investable universe, or the composition of the peer group may be limited in size or number as well as other factors. They discussed the unique aspects of the securities markets applicable to particular funds so that the performance of any such funds could be reviewed in context. They reviewed both long-term and short-term performance and considered the effect on long-term performance that may have been attributable to any previous investment advisers/portfolio managers to any fund or to a different investment strategy. They recognized that the performance data reflects a snapshot in time, in this case as of the end of the most recent calendar year or quarter. They took into account that a different performance period, however, could generate significantly different results. Further, they noted that long-term performance can be adversely affected by even one period of significant underperformance so that a single investment decision or theme has the ability to disproportionately affect long-term performance. The Board also noted that on a quarterly basis, they review detailed information for each fund, including investment performance results, portfolio composition and investment philosophies, processes and strategies. They also considered whether any relative underperformance was appropriate in view of the Adviser’s conservative investment philosophy. The Board noted the type of market environments that favor the funds’ strategies and discussed the funds’ performance in such market environments. Representatives of the Adviser discussed with the Board the methodology for arriving at peer groups and indices used for performance comparisons which, with respect to peer groups, followed a different process this year than the prior year, after Board input and review. The Board also considered that sometimes, the Morningstar categories the funds fall into do not precisely match a fund’s investment strategy and philosophy.
66
Madison Funds | Other Information (unaudited) - continued | October 31, 2019
Based on their review, the Board determined that, given the totality of the above factors and considerations, each fund’s overall investment performance had been satisfactory.
With regard to thecosts of the services to be provided and the profits to be realized by the investment adviser and its affiliatesfrom the relationship with the Trust, the Board reviewed the expense ratios for a variety of other funds in each fund’s peer group with similar investment objectives. Like the performance comparisons described above, the expense comparisons followed a different methodology this year versus last in terms of peer group selection, which, again, was the result of Board input and review.
The Board noted that the Adviser or its affiliates, and, as applicable, Sub-Advisers, provided investment management services to other investment company and/or non-investment company clients and considered the fees charged by the Adviser (and respective Sub-Advisers) to such funds and clients for purposes of determining whether the given advisory fee was disproportionately large under the so-calledGartenberg standard traditionally used by investment company boards in connection with contract renewal considerations. The Board took those fees into account and considered the differences in services and time required by the various types of funds and clients to which the Adviser (or Sub-Adviser, if applicable) provided services. The Board recognized that significant differences may exist between the services provided to one type of fund or client and those provided to others, such as those resulting from a greater frequency of shareholder redemptions in a mutual fund and the higher turnover of mutual fund assets. The Board gave such comparisons the weight that they merit in light of the similarities and differences between the services that the various funds require. They considered that, if the services rendered by the Adviser (or Sub-Adviser, if applicable) to one type of fund or client differed significantly from others, then the comparison should be given less weight. In the case of non-investment company clients for which the Adviser (or Sub-Adviser, if applicable) may act as either investment adviser or sub-adviser, the Board noted that the fee may be lower than the fee charged to the Trust. The Board noted too the various administrative, operational, compliance, legal and corporate communication services required to be handled by the Adviser (or Sub-Adviser, if applicable) which are performed for investment company clients but are not typically performed for non-investment company clients.
The Trustees compared each fund’s total expense ratio and advisory fee to those of comparable funds with similar investment objectives and strategies. The Board noted the simple expense structure maintained by the Trust, an advisory fee and a capped administrative “services” expense. The Board reviewed total expense ratios paid by other funds with similar investment objectives and asset size, recognizing that such a comparison, while not dispositive, was an important consideration.
The Trustees sought to ensure that fees paid by the Trust were appropriate. The Board reviewed materials demonstrating that although the Adviser is compensated for a variety of the administrative services it provides or arranges to provide to the funds pursuant to its administrative services agreement with the Trust (or series, as the case may be) (“Services Agreement”), such compensation does not always cover all costs because the Services Agreement effectively acts as a cap on administrative expenses. Therefore, the Board recognized that some of the administrative, operational, regulatory or compliance fees or costs in excess of the Services Agreement fees are paid by the Adviser from investment advisory fees earned. In this regard, the Trustees noted that examination of each fund’s total expense ratio compared to those of other investment companies was more meaningful than a simple comparison of basic “investment management only” fee schedules.
The Board recognized that to the extent a fund invests in other mutual funds also managed by the Adviser (or its affiliates), the Adviser (or an affiliate) receives investment advisory fees from both the fund and the underlying mutual fund. The Board was satisfied in this regard that the Adviser (or an affiliate) provides separate services to the Trust’s “fund of funds” portfolios and the underlying mutual funds in which each such fund invests in exchange for the fees received from them.
In reviewing costs and profits, the Board noted that for some smaller funds, the salaries of all portfolio management personnel, trading desk personnel, corporate accounting personnel and employees of the Adviser who serve as Trust officers, as well as facility costs (e.g., rent, etc.), could not be supported by fees received from such portfolios alone. However, the Board recognized that the Trust is profitable to the Adviser because such salaries and fixed costs are already paid in whole or in part from revenue generated by management of other client assets managed by the Adviser, including the Trust as a consolidated family of investment companies. The Trustees noted that total assets managed by the Adviser and its affiliates were approximately $16.5 billion at the time of the meeting. As a result, although the fees paid by an individual fund at its present size might not be sufficient to profitably support a stand-alone fund, the Trust is reasonably profitable to the Adviser as part of its larger, diversified organization. In sum, the Trustees recognized that the Trust is important to the Adviser and is managed with the attention given to the Adviser’s other clients.
Based on the foregoing, the Board concluded that the level of profitability to the Adviser and its affiliates was reasonable in light of the services provided. In considering the profitability of the Sub-Advisers, the Board noted that the Sub-Advisory fees payable under the Sub-Advisory Agreements are paid by the Adviser out of the fees that it receives under the Advisory Agreement and were negotiated by the Adviser at arm’s length. As a consequence, the profitability to each Sub-Adviser of its relationship with the applicable fund was not a substantial factor in the Board’s deliberations.
With regard to the extent to whicheconomies of scalewould be realized as each fund’s assets increase, the Trustees recognized that at their current asset levels, it was premature to discuss any economies of scale not already factored into the compensation payable under existing Advisory and Services Agreements. In addition, the Trustees recognized that the Adviser was currently waiving certain fees (pursuant to its existing Advisory Agreement or pursuant to an applicable Services Agreement, as the case may be) with regard to: the Madison Government Money Market Fund and Madison Dividend Income Fund. Further, the Trustees noted that the Adviser agreed to reduce its services fee for the Madison Small Cap Fund for at least two years following the date of consummation of the Broadview Transaction. Because the Adviser pays the Sub-Advisers’ Sub-Advisory fees and those fees are negotiated at arm’s length by the Adviser, the Board did not consider the potential economies of scale with respect to a Sub-Advisers’ management of the applicable funds to be a material factor in its consideration.
The Board recognized that another method to help ensure the shareholders share in any economies of scale is to include breakpoints in the advisory fee schedules. Based on its review, the Board concluded that the current advisory fee schedules and fee arrangements and waivers (as applicable) were appropriate and reflect economies of scale to be shared with shareholders when assets under management increase.
Counsel to the Independent Trustees confirmed that the Trust’s Independent Trustees had met previously and reviewed the written contract renewal materials provided by the Adviser and Sub-Advisers. She noted that the Independent Trustees had considered such materials in light of theGartenberg standard as well as criteria either set forth or discussed in the Supreme Court decision inJones v. Harris regarding the investment company contract renewal process under Section 15(c) of the Investment Company Act of 1940, as amended. The Independent Trustees made a variety of additional inquiries regarding such written materials to the Adviser and the Sub-Advisers and representatives of the Adviser and Lazard, respectively, and discussed each matter raised.
In considering the renewal of the funds’ Advisory and Sub-Advisory Agreements, as applicable, the Board, including the Independent Trustees, did not identify any single factor as controlling, and each Trustee may have attributed different weights to the various factors. The Board evaluated all information available to them on a fund-by-fund basis, and their determinations were made separately with respect to each
67
Madison Funds | Other Information (unaudited) - continued | October 31, 2019
fund. The Board reached the following conclusions regarding each fund’s Advisory (and, as applicable, Sub-Advisory) Agreement, among others: (a) the Adviser (and Sub-Adviser, as applicable) demonstrated that it possesses the capability and resources to perform the duties required of it under the Investment Advisory or Sub-Advisory Agreements, as applicable; (b) the Adviser (and Sub-Adviser, as applicable) is qualified to manage the fund’s assets in accordance with the fund’s investment objective and strategies; (c) the overall investment performance of the fund is satisfactory relative to the performance of funds with similar investment objectives and relevant indices and benchmarks; (d) the fund’s advisory (and, as applicable, sub-advisory) fee is reasonable in light of the services received by the fund from the Adviser (and, as applicable, Sub-Adviser) and other factors considered; and (e) the Adviser’s (and Sub-Advisers’, as applicable) investment strategies are appropriate for pursuing the investment objectives of the fund. Based on the foregoing conclusions, the Board determined with respect to each fund that continuation of the Advisory Agreement with the Adviser was in the best interests of the fund and its shareholders, and that with respect to those funds that are Sub-Advised, continuation of such fund’s Sub-Advisory Agreement was in the best interests of the fund and its shareholders. Moreover, the Board determined that renewal of the Services Agreements for those funds with such agreements currently in place was in the best interests of each respective fund and its shareholders.
FUND EXPENSES PAID BY SHAREHOLDERS
As shareholders of the funds, you incur two types of costs: (1) transaction costs, including sales charges (loads) on purchase payments, and redemption fees; and (2) ongoing costs, including management fees; distribution and/or service (12b-1) fees; and other fund expenses. The examples below are intended to help you understand your ongoing costs (in dollars) of investing in the funds and to compare these costs with the ongoing costs of investing in other mutual funds.
The examples below are based on an investment of $1,000 invested at the beginning of the period and held for the entire six-month period ended October 31, 2019. Expenses paid during the period in the tables below are equal to the fund’s annualized expense ratio, multiplied by the average account value over the period, multiplied by 184/365 (to reflect the one-half fiscal year period).
Actual Expenses
The table below provides information about actual account values using actual expenses and actual returns for the funds. You may use the information in this table, together with the amount you invested, to estimate the expenses that you paid over the period. Simply divide your account value by $1,000 (for example, an $8,600 account value divided by $1,000 = 8.6), then multiply the result by the number in the table for the fund you own under the heading entitled “Expenses Paid During Period” to estimate the expenses you paid on your account during this period.
| | | CLASS A | | CLASS B |
| Fund | | Beginning Account Value | | Ending
Account Value | | Annual
Expense Ratio | | Expenses Paid
During Period | | Ending
Account Value | | Annual
Expense Ratio | | Expenses Paid
During Period |
| Conservative Allocation* | | $1,000 | | | $1,039.90 | | | 0.70 | % | | $3.60 | | | $1,035.40 | | | 1.45 | % | | $7.44 | |
| Moderate Allocation* | | 1,000 | | | 1,031.60 | | | 0.70 | % | | 3.58 | | | 1,027.50 | | | 1.45 | % | | 7.41 | |
| Aggressive Allocation* | | 1,000 | | | 1,025.60 | | | 0.70 | % | | 3.57 | | | 1,022.00 | | | 1.45 | % | | 7.39 | |
| Government Money Market | | 1,000 | | | 1,008.40 | | | 0.55 | % | | 2.78 | | | 1,004.60 | | | 1.30 | % | | 6.57 | |
| Core Bond | | 1,000 | | | 1,051.10 | | | 0.90 | % | | 4.65 | | | 1,047.10 | | | 1.65 | % | | 8.51 | |
| High Income | | 1,000 | | | 1,010.70 | | | 1.00 | % | | 5.07 | | | 1,006.60 | | | 1.75 | % | | 8.85 | |
| Diversified Income | | 1,000 | | | 1,041.20 | | | 1.10 | % | | 5.66 | | | 1,036.30 | | | 1.85 | % | | 9.50 | |
| Covered Call & Equity Income | | 1,000 | | | 1,011.60 | | | 1.25 | % | | 6.34 | | | N/A | | | N/A | | | N/A | |
| Large Cap Value | | 1,000 | | | 1,014.10 | | | 1.16 | % | | 5.89 | | | 1,010.50 | | | 1.91 | % | | 9.68 | |
| Investors | | 1,000 | | | 1,045.30 | | | 1.20 | % | | 6.19 | | | N/A | | | N/A | | | N/A | |
| Mid Cap | | 1,000 | | | 1,080.90 | | | 1.40 | % | | 7.34 | | | 1,078.00 | | | 2.15 | % | | 11.26 | |
| Small Cap | | 1,000 | | | 1,029.60 | | | 1.46 | % | | 1.26 | | | N/A | | | N/A | | | N/A | |
| International Stock | | 1,000 | | | 1,024.20 | | | 1.60 | % | | 8.16 | | | 1,020.20 | | | 2.35 | % | | 11.97 | |
| | | CLASS C |
| Fund | | Beginning
Account Value | | Ending
Account Value | | Annual
Expense Ratio | | Expenses Paid
During Period |
| Conservative Allocation* | | $1,000 | | | $1,035.40 | | | 1.45 | % | | $7.44 | |
| Moderate Allocation* | | 1,000 | | | 1,027.40 | | | 1.45 | % | | 7.41 | |
| Aggressive Allocation* | | 1,000 | | | 1,022.00 | | | 1.45 | % | | 7.39 | |
| Diversified Income | | 1,000 | | | 1,037.00 | | | 1.84 | % | | 9.45 | |
| Covered Call & Equity Income | | 1,000 | | | 1,008.30 | | | 2.00 | % | | 10.12 | |
| | | CLASS Y |
| Fund | | Beginning
Account Value | | Ending
Account Value | | Annual
Expense Ratio | | Expenses Paid
During Period |
| Tax-Free Virginia | | $1,000 | | | $1,030.30 | | | N/A | | | N/A | |
| Tax-Free National | | 1,000 | | | 1,031.20 | | | 0.75 | % | | $3.84 | |
| High Quality Bond | | 1,000 | | | 1,029.00 | | | N/A | | | $N/A | |
| Core Bond | | 1,000 | | | 1,052.60 | | | 0.65 | % | | $3.36 | |
| Corporate Bond | | 1,000 | | | 1,070.00 | | | 0.65 | % | | $3.39 | |
| High Income | | 1,000 | | | 1,012.20 | | | 0.75 | % | | $3.80 | |
| Covered Call & Equity Income | | 1,000 | | | 1,012.50 | | | 1.00 | % | | $5.07 | |
| Dividend Income | | 1,000 | | | 1,036.90 | | | 0.95 | % | | $4.88 | |
| Large Cap Value | | 1,000 | | | 1,015.70 | | | 0.91 | % | | $4.62 | |
| Investors | | 1,000 | | | 1,046.10 | | | 0.95 | % | | $4.90 | |
| Mid Cap | | 1,000 | | | 1,084.30 | | | 0.97 | % | | $5.10 | |
| Small Cap | | 1,000 | | | 1,029.40 | | | 1.21 | % | | $1.04 | |
| International Stock | | 1,000 | | | 1,025.70 | | | 1.35 | % | | $6.89 | |
| | | CLASS R6 |
| Fund | | Beginning
Account Value | | Ending
Account Value | | Annual
Expense Ratio | | Expenses Paid
During Period |
| Core Bond | | $1,000 | | | $1,053.20 | | | 0.52 | % | | $2.69 | |
| Covered Call & Equity Income | | 1,000 | | | $1,013.60 | | | 0.87 | % | | $4.42 | |
| Investors | | 1,000 | | | $1,047.00 | | | 0.77 | % | | $3.97 | |
| Mid Cap | | 1,000 | | | $1,084.10 | | | 0.76 | % | | $3.99 | |
*The annual expense ratio does not include the expenses of the underlying funds.
68
Madison Funds | Other Information (unaudited) - continued | October 31, 2019
Hypothetical Example for Comparison Purposes
The table below provides information about hypothetical account values and hypothetical expenses based on the funds’ actual expense ratios and an assumed rate of return of 5% per year before expenses, which are not the funds’ actual returns. The hypothetical account values and expenses may not be used to estimate the actual ending account balance or expenses you paid for the period. You may use this information to compare the ongoing costs of investing in the funds and other funds. To do so, compare the 5% hypothetical example of the funds you own with the 5% hypothetical examples that appear in the shareholder reports of other similar funds.
| | | CLASS A | | CLASS B |
| Fund | | Beginning
Account Value | | Ending
Account Value | | Annual
Expense Ratio | | Expenses Paid
During Period | | Ending
Account Value | | Annual
Expense Ratio | | Expenses Paid
During Period |
| Conservative Allocation* | | $1,000 | | | $1,021.68 | | | 0.70 | % | | $3.57 | | | $1,017.90 | | | 1.45 | % | | $7.37 | |
| Moderate Allocation* | | 1,000 | | | 1,021.68 | | | 0.70 | % | | 3.57 | | | 1,017.90 | | | 1.45 | % | | 7.37 | |
| Aggressive Allocation* | | 1,000 | | | 1,021.68 | | | 0.70 | % | | 3.57 | | | 1,017.90 | | | 1.45 | % | | 7.37 | |
| Government Money Market | | 1,000 | | | 1,022.43 | | | 0.55 | % | | 2.80 | | | 1,018.65 | | | 1.30 | % | | 6.61 | |
| Core Bond | | 1,000 | | | 1,020.67 | | | 0.90 | % | | 4.58 | | | 1,016.89 | | | 1.65 | % | | 8.39 | |
| High Income | | 1,000 | | | 1,020.16 | | | 1.00 | % | | 5.09 | | | 1,016.38 | | | 1.75 | % | | 8.89 | |
| Diversified Income | | 1,000 | | | 1,019.66 | | | 1.10 | % | | 5.60 | | | 1,015.88 | | | 1.85 | % | | 9.40 | |
| Covered Call & Equity Income | | 1,000 | | | 1,018.90 | | | 1.25 | % | | 6.36 | | | N/A | | | N/A | | | N/A | |
| Large Cap Value | | 1,000 | | | 1,019.36 | | | 1.16 | % | | 5.90 | | | 1,015.58 | | | 1.91 | % | | 9.70 | |
| Investors | | 1,000 | | | 1,019.16 | | | 1.20 | % | | 6.11 | | | N/A | | | N/A | | | N/A | |
| Mid Cap | | 1,000 | | | 1,018.15 | | | 1.40 | % | | 7.12 | | | 1,014.37 | | | 2.15 | % | | 10.92 | |
| Small Cap | | 1,000 | | | 1,071.85 | | | 1.46 | % | | 7.43 | | | N/A | | | N/A | | | N/A | |
| International Stock | | 1,000 | | | 1,017.14 | | | 1.60 | % | | 8.13 | | | 1,013.36 | | | 2.35 | % | | 11.93 | |
| | | CLASS C |
| Fund | | Beginning
Account Value | | Ending
Account Value | | Annual
Expense Ratio | | Expenses Paid
During Period |
| Conservative Allocation* | | $1,000 | | | $1,017.90 | | | 1.45 | % | | $7.37 | |
| Moderate Allocation* | | 1,000 | | | $1,017.90 | | | 1.45 | % | | $7.37 | |
| Aggressive Allocation* | | 1,000 | | | $1,017.90 | | | 1.45 | % | | $7.37 | |
| Diversified Income | | 1,000 | | | $1,015.93 | | | 1.84 | % | | $9.35 | |
| Covered Call & Equity Income | | 1,000 | | | $1,015.12 | | | 2.00 | % | | 10.16 | |
| | | CLASS Y |
| Fund | | Beginning
Account Value | | Ending
Account Value | | Annual
Expense Ratio | | Expenses Paid
During Period |
| Tax-Free Virginia | | $1,000 | | | $1,025.21 | | | N/A | | | N/A | |
| Tax-Free National | | 1,000 | | | 1,021.42 | | | 0.75 | % | | $3.82 | |
| High Quality Bond | | 1,000 | | | 1,025.21 | | | N/A | | | N/A | |
| Core Bond | | 1,000 | | | 1,021.93 | | | 0.65 | % | | 3.31 | |
| Corporate Bond | | 1,000 | | | 1,021.93 | | | 0.65 | % | | 3.31 | |
| High Income | | 1,000 | | | 1,021.42 | | | 0.75 | % | | 3.82 | |
| Covered Call & Equity Income | | 1,000 | | | 1,020.16 | | | 1.00 | % | | 5.09 | |
| Dividend Income | | 1,000 | | | 1,020.42 | | | 0.95 | % | | 4.84 | |
| Large Cap Value | | 1,000 | | | 1,020.62 | | | 0.91 | % | | 4.63 | |
| Investors | | 1,000 | | | 1,020.42 | | | 0.95 | % | | 4.84 | |
| Mid Cap | | 1,000 | | | 1,020.32 | | | 0.97 | % | | 4.94 | |
| Small Cap | | 1,000 | | | 1,019.11 | | | 1.21 | % | | 6.16 | |
| International Stock | | 1,000 | | | 1,018.40 | | | 1.35 | % | | 6.87 | |
| | | CLASS R6 |
| Fund | | Beginning
Account Value | | Ending
Account Value | | Annual
Expense Ratio | | Expenses Paid
During Period |
| Core Bond | | $1,000 | | | $1,022.58 | | | 0.52 | % | | $2.65 | |
| Covered Call & Equity Income | | 1,000 | | | 1,020.82 | | | 0.87 | % | | 4.43 | |
| Investors | | 1,000 | | | 1,021.32 | | | 0.77 | % | | 3.92 | |
| Mid Cap | | 1,000 | | | 1,021.37 | | | 0.76 | % | | 3.87 | |
*The annual expense ratio does not include the expenses of the underlying funds.
Please note that the expenses shown in the tables are meant to highlight your ongoing costs only and do not reflect any transactional costs, such as sales charges (loads), or redemption fees. The information provided in the hypothetical example table is useful in comparing ongoing costs only, and will not help you determine the relative total costs of owning different funds. In addition, if these transactional costs were included, your costs would have been higher.
AVAILABILITY OF QUARTERLY PORTFOLIO SCHEDULES
The funds file their complete schedule of portfolio holdings with the SEC for the first and third quarters of each fiscal year on Form NPORT-EX. Form NPORT-EX is available to shareholders at no cost by calling 1-800-877-6089 or on the SEC’s website at www.sec.gov. Form NPORT-EX may also be reviewed and copied at the SEC’s Public Reference Room in Washington, DC. More information on the operation of the Public Reference Room may be obtained by calling 1-800-SEC-0330.
PROXY VOTING POLICIES, PROCEDURES AND RECORDS
A description of the policies and procedures used by the funds to vote proxies related to portfolio securities is available to shareholders at no cost on the funds’ website at www.madisonfunds.com or by calling 1-800-877-6089 or on the SEC’s website at www.sec.gov. The proxy voting records for the funds for the most recent twelve-month period ended June 30 are available to shareholders at no cost 1-800-SEC-0330 on the SEC’s website at www.sec.gov.
69
Madison Funds | Other Information (unaudited) - continued | October 31, 2019
FORWARD-LOOKING STATEMENT DISCLOSURE
One of our most important responsibilities as investment company managers is to communicate with shareholders in an open and direct manner. Some of our comments Management’s Discussion of Fund Performance are based on current management expectations and are considered “forward-looking statements.” Actual future results, however, may prove to be different from our expectations. You can identify forward-looking statements by words such as estimate, may, will, expect, believe, plan and other similar terms. We cannot promise future returns. Our opinions are a reflection of our best judgment at the time this report is compiled, and we disclaim any obligation to update or alter forward-looking statements as a result of new information, future events, or otherwise.
RESULTS OF SHAREHOLDER VOTES
Special Meeting. A Special Meeting of Shareholders (“Meeting”) of the Trust was held on October 3, 2019. At this meeting, shareholders of the Trust voted on Proposal No. 1 - Election of Trustees. The number of shares of the funds as of July 19, 2019, the “record date,” issued and outstanding and entitled to vote at the Meeting was 178,392,364.262 with a net asset value of $2,112,324,349.376. Each shareholder is entitled to one vote for each dollar of net asset value standing in such shareholder’s name on the books of the funds as of the record date.
A quorum of shareholders is necessary to hold a valid meeting and to consider the proposal, and the presence in person or by proxy of shareholders entitled to cast at least 20% of the votes entitled to be cast at the Meeting shall constitute a quorum. The election of each trustee nominee under Proposal 1 must be approved by the affirmative vote of a plurality of the votes cast at the Meeting
Proposal 1: Election of Trustees. The six trustee nominees up for election at the Meeting received the requisite votes and were approved. The proxy vote totals were as follows:
| Trustee Nominee | | Term Ends
(as of 12/31) | | | Votes For | | | % Votes For | | | Votes Withheld | | | % Votes Withheld | |
| James R. Imhoff, Jr. | | | 2020 | | | | 1,486,928,631.613 | | | | 98.624% | | | | 20,744,414.494 | | | | 1.376% | |
| Scott C. Jones | | | 2034 | | | | 1,486,178,830.761 | | | | 98.574% | | | | 21,494,215.346 | | | | 1.426% | |
| Steven P. Riege | | | 2028 | | | | 1,487,584,716.221 | | | | 98.668% | | | | 20,088,329.886 | | | | 1.332% | |
| Richard E. Struthers | | | 2028 | | | | 1,488,395,900.225 | | | | 98.721% | | | | 19,277,145.882 | | | | 1.279% | |
| Carrie J. Thome | | | 2032 | | | | 1,488,826,063.126 | | | | 98.750% | | | | 18,846,982.981 | | | | 1.250% | |
| Kevin S. Thompson | | | 2034 | | | | 1,487,672,284.986 | | | | 98.673% | | | | 20,000,761.121 | | | | 1.327% | |
TAX INFORMATION
Foreign Tax Credits: The funds expect to make an election under Internal Revenue Code Section 853 to pass through foreign taxes paid by the funds to their shareholders. For the year ended 2019, the following funds intend to pass through foreign tax credits and have derived gross income from foreign countries amounting to:
| Fund | | Foreign Tax Credit Pass-Through | | Foreign Source Income |
| International Stock | | $34,380 | | $636,967 |
Complete information regarding the funds’ foreign tax credit pass through to shareholders for the year ended October 31, 2019, will be reported in conjunction with Form 1099-DIV.
Corporate Dividends Received Deduction: For the taxable year ended 2019, the following percentage of income dividends paid by the fund qualify for the dividends received deduction available to corporations:
| Fund | | Percentage | | Fund | | Percentage |
| Conservative Allocation | | | 17.49% | | | Dividend Income | | | 100.00% | |
| Moderate Allocation | | | 11.30% | | | Investors | | | 100.00% | |
| Aggressive Allocation | | | 39.10% | | | Large Cap Value | | | 100.00% | |
| Diversified Income | | | 92.99% | | | Mid Cap | | | 100.00% | |
| Covered Call Equity Income | | | 20.74% | | | | | | | |
Qualified Dividend Income: For the taxable year ended 2019, the funds hereby designate the maximum amount of dividends allowable pursuant to the Internal Revenue Code, as qualified dividend income (“QDI”) eligible for reduced tax rates (the rates range from 5% to 15% depending upon individual’s tax bracket). Complete information regarding each fund’s income distributions paid during the calendar year 2017, including the portion, if any, which qualify as QDI, will be reported in conjunction with Form 1099-DIV.
| Fund | | Amount | | Fund | | Amount |
| Conservative Allocation | | | $286,419 | | | Investors | | | $1,610,642 | |
| Moderate Allocation | | | 978,453 | | | Dividend Income | | | 2,950,144 | |
| Aggressive Allocation | | | 586,940 | | | Large Cap Value | | | 573,109 | |
| Diversified Income | | | 2,884,276 | | | Mid Cap | | | 119,254 | |
| Covered Call & Equity Income | | | 2,415,932 | | | International Stock | | | 303,537 | |
70
Madison Funds | October 31, 2019
Trustees and Officers
The address of each Trustee and officer is 550 Science Drive, Madison, WI 53711. The Statement of Additional Information, which includes additional information about the Trustees and officers, is available at no cost on the Fund’s website at www.madisonfunds.com or by calling 1-800-877-6089.
| | | | | | | |
| Interested Trustees and Officers |
| Name and Year of Birth | | Position(s) and Length
of Time Served | | Principal Occupation(s) During Past Five Years | | Portfolios Overseen
in Fund Complex by
Director/Trustee1 | | Other Directorships Held by Director/ Trustee |
Kevin S. Thompson2
1966 | | Trustee and President, 2019 - Present; Chief Legal Officer and Assistant Secretary, 2017 - Present | | Madison Asset Management, LLC (“Madison”), Chief Legal Officer and Chief Administrative Officer, 2017 - Present Madison Investment Holdings, Inc. (“MIH”) (affiliated investment advisory firm of Madison), Chief Legal Officer and Chief Administrative Officer, 2017 - Present | | 18 | | N/A |
| | | | | Madison Investment Advisors, LLC (“MIA”) (affiliated investment advisory firm of Madison), Chief Legal Officer and Chief Administrative Officer, 2017 - Present | | | | |
| | | | | Ultra Series Fund (14) (mutual funds) and Madison Covered Call & Equity Strategy Fund (closed-end fund), Chief Legal Officer and Assistant Secretary, 2017 - Present; Madison Strategic Sector Premium Fund, Chief Legal Officer and Assistant Secretary, 2017 - 2018 | | | | |
| | | | | CFMG Life Insurance Company, Associate General Counsel, 2012 - 2015; Vice President Wealth Management, 2015 - 2017; President of CUNA Brokerage Services, Inc, 2016 - 2017 | | | | |
Paul A. Lefurgey
1964 | | Vice President, 2009 - Present | | MIH, Madison and MIA, CEO, 2017 - Present; Director of Fixed Income Investments, 2016 - Present; Executive Director and Head of Fixed Income Investments, 2013 - 2016; Chairman - Executive Committee, 2015 - 2017 | | N/A | | N/A |
| | | | | Ultra Series Fund (14), Vice President, 2009 - Present; Madison Covered Call & Equity Strategy Fund, Vice President, 2012 - Present; Madison Strategic Sector Premium Fund, Vice President, 2010 - 2018 | | | | |
Greg D. Hoppe
1969 | | Chief Financial Officer 2019 - Present; Treasurer, 2009 - 2019 | | MIH and MIA, Vice President, 1999 - Present; Madison, Vice President, 2009 - Present Ultra Series Fund (14), Chief Financial Officer, 2019 - Present; Treasurer, 2009 - 2019; Madison Covered Call & Equity Strategy Fund, Chief Financial Officer, 2019 - Present; Treasurer, 2012 - 2019; Madison Strategic Sector Premium Fund, Treasurer, 2009 - 2018 | | N/A | | N/A |
Holly S. Baggot
1960 | | Secretary, 1999 - Present;
Assistant Treasurer, 1999 - 2007 and 2009 - Present; Anti-Money Laundering Officer, 2019 - Present | | MIH and MIA, Vice President, 2010 - Present; Madison, Vice President, 2009 - Present; MFD Distributor, LLC (“MFD”) (an affiliated brokerage firm of Madison), Vice President, 2012 - Present Ultra Series Fund (14), Secretary, 1999 - Present and Assistant Treasurer, 2009 - Present; Madison Covered Call & Equity Strategy Fund, Secretary and Assistant Treasurer, 2012 - Present; Ultra Series Fund and Madison Covered Call & Equity Strategy Fund, Anti-Money Laundering Officer, 2019 - Present; Madison Strategic Sector Premium Fund, Secretary and Assistant Treasurer, 2010 - 2018 | | N/A | | N/A |
Steve J. Fredricks
1970 | | Chief Compliance Officer and Assistant Secretary, 2018 - Present | | MIH, MIA and Madison, Chief Compliance Officer, 2018 - Present Ultra Series Fund (14) and Madison Covered Call & Equity Strategy Fund, Chief Compliance Officer and Assistant Secretary, 2018 - Present; Madison Strategic Sector Premium Fund, Chief Compliance Officer, 2018 | | N/A | | N/A |
| | | | | Jackson National Asset Management, LLC, Senior Vice President and Chief Compliance Officer, 2005 - 2018 | | | | |
Trey D. Edgerle
1990 | | Assistant Secretary, 2017 - Present | | MIH, MIA and Madison, Mutual Fund and Compliance Associate, 2016 - Present | | N/A | | N/A |
| | | | | Ultra Series Fund (14) and Madison Covered Call & Equity Strategy Fund, Assistant Secretary, 2017 - Present; Madison Strategic Sector Premium Fund, Assistant Secretary, 2017 - 2018 | | | | |
| | | | | U.S. Bancorp, Mutual Fund Compliance Officer, 2013 - 2016 | | | | |
1 As of the date of this report, the fund complex consists of Madison Funds with 18 portfolios, the Ultra Series Fund with 14 portfolios and the Madison Covered Call & Equity Strategy Fund (closed end fund), for a grand total of 33 separate portfolios in the fund complex. Not every Trustee is a member of the Board of Trustees of every fund in the fund complex, as noted above. References to the “Fund Complex” in the following tables have the meaning disclosed in this paragraph.
2 “Interested person” as defined in the 1940 Act. Considered an interested Trustee because of the position held with the investment adviser of Madison Funds. On October 31, 2019, the shareholders of each series of the Madison Funds approved the election of Mr. Thompson as a Trustee.
| | | | | | | |
| Independent Trustees |
| Name and Year of Birth | | Position(s) and Length
of Time Served1 | | Principal Occupation(s) During Past Five Years | | Portfolios Overseen
in Fund Complex2 | | Other Directorships Held by Director/ Trustee |
James R. Imhoff, Jr.
1944 | | Trustee, 2009 - Present | | First Weber Inc. (real estate brokers), Madison, WI, Chairman, 2017 - Present; Chief Executive Officer, 1996 - 2017 | | 33 | | Park Bank, 1978 - Present |
| | | | | | | | | First Weber, Inc., 2017 - Present |
| | | | | | | | | Madison Covered Call & Equity Strategy Fund, 2005 - Present; Ultra Series Fund (14), 2009 - Present |
Steven P. Riege
1954 | | Trustee, 2005 - Present | | Ovation Leadership (management consulting) Milwaukee, WI, Owner/ President, 2001 - Present | | 33 | | Lange Bros. Woodworking Co., Inc., 2017 - Present |
| | | | | Robert W. Baird & Company (financial services), Milwaukee, WI, Senior Vice President-Marketing and Vice President-Human Resources, 1986 - 2001 | | | | Ultra Series Fund (14), 2005 - Present; Madison Covered Call & Equity Strategy Fund, 2015 - Present |
Richard E. Struthers
1952 | | Trustee, 2004 - Present | | Clearwater Capital Management (investment advisory firm), Naples, FL, Chair and Chief Executive Officer 1998 - Present Park Nicollet Health Services, Minneapolis, MN, Chairman, Finance and Investment Committee, 2006 - 2012 | | 33 | | Ultra Series Fund (14), 2004 - Present; Madison Covered Call & Equity Strategy Fund, 2017 - Present |
Carrie J. Thome
1968 | | Trustee, 2017- Present | | Wisconsin Alumni Research Foundation, Madison, WI, Chief Investment Officer, 2007 - 2019 | | 32 | | Ultra Series Fund (14), 2017 - Present |
Scott C. Jones3
1962 | | Trustee, 2019 - Present | | Managing Director, Carne Global Financial Services (US) LLC (a provider of independent governance and distribution support for the asset management industry), since 2013 | | 18 | | Trustee, XAI Octagon Floating Rate & Alternative Income Term Trust, 2017 - Present; Trustee, Manager Directed Portfolios (open-end fund family (9), 2016 - Present (Lead Independent Trustee since 2017); Director, Guestlogix Inc. (a provider of ancillary-focused technology to the travel industry), 2015 -2016 |
| 1 | A Trustee must retire at the end of the calendar year in which the first of the following two events occurs: (1) he or she attains the age of 76, or (2) he or she has served on the Board for a total of 15 years, subject in the latter case to extension by unanimous vote of the remaining Trustees. In the event a Trustee’s term is extended as described above, following such initial approval, the decision to allow such Trustee to continue to hold office must be unanimously approved at the last regular Trustee meeting of each successive calendar year and shall be effective no longer than the end of the following calendar year. Should any such Trustee fail to receive the requisite unanimous approval, the Trustee shall be considered to have retired as of the last day of the applicable calendar year unless he or she requests an earlier retirement date. For purposes of the policy, the 15-year term limitation shall commence on the later of April 19, 2013 or the date of the Trustee’s initial election or appointment as a trustee, and shall not apply to Mr. Imhoff, who is scheduled to retire at the end of 2020. The Board may change the mandatory retirement age or the term limitation without the approval of shareholders, subject to the unanimous approval of the full Board. |
| 2 | As of the date of this report, the fund complex consists of Madison Funds with 18 portfolios, the Ultra Series Fund with 14 portfolios and the Madison Covered Call & Equity Strategy Fund (closed end fund), for a grand total of 33 separate portfolios in the fund complex. Not every Trustee is a member of the Board of Trustees of every fund in the fund complex, as noted above. References to the “Fund Complex” in the preceding tables have the meaning disclosed in this paragraph. |
| 3 | On October 3, 2019, the shareholders of each series of the Madison Funds approved the election Mr. Jones to serve as an Independent Trustee. |
SEC File Number: 811-08261
Item 2. Code of Ethics.
(a) The Trust has adopted a code of ethics that applies to the Trust’s principal executive officer, principal financial officer, principal accounting officer or controller or persons performing similar functions, regardless of whether these individuals are employed by the Trust or a third party.
(c) During the period covered by the report, registrant did not make any substantive amendments to the Code.
(d) During the period covered by the report, registrant did not grant any waivers, including implicit waivers, from the provisions of the Code.
(f) Any person may obtain a complete copy of the code without charge by calling the Adviser at 800-767-0300 and requesting a copy of “the Madison Funds Sarbanes Oxley Code of Ethics.”
Item 3. Audit Committee Financial Expert.
In July 2019, Richard Struthers, an “independent” Trustee and a member of the Trust’s audit committee, was appointed to serve as the Trust’s audit committee financial expert among the four independent Trustees who so qualify to serve in that capacity.
Item 4. Principal Accountant Fees and Services.
(a)Audit Fees.Total audit fees paid (or to be paid) to the registrant’s principal accountant for the fiscal years ended October 31, 2019 and 2018, respectively were $220,000 ($483,000 including the Small Cap report dated September 30, 2019, Ultra Series Fund and the Madison Covered Call & Equity Strategy Fund, all affiliated investment companies “together, the “Affiliated Funds”) and $206,000 ($450,000 including the Affiliated Funds).
(b)Audit-Related Fees. For the fiscal years ended October 31, 2019 and October 31, 2018, the aggregate fees for professional services rendered by Deloitte & Touche for assurance and related services by such firm that were reasonably related to the performance of the audit of the Trust’s annual financial statements other than those referenced in paragraph (a) above, totaled $12,000 and $10,800, respectively.
(c)Tax-Fees.The Audit Committee has pre-approved, as required by Rule 2-01(c)(7)(i)(C) of Regulation S-X, 100% of the services described in this Item 4(b) through (d), which such services are described above.
For the fiscal years ended October 31, 2019 and October 31, 2018, the aggregate fees paid (or to be paid) for professional services rendered by Deloitte & Touche for tax compliance, tax advice and tax planning are approximately $87,780 and $89,398, respectively.
In the scope of services comprising the fees disclosed under this Item 4(c) were the following services:
-Review and sign as signature preparer for U.S. Income Tax Return for Regulated Investment Companies, Form 1120-RIC, Return of Excise Tax on Undistributed Income of Regulated Investment Companies, Form 8613 and appropriate State tax returns.
(d)All Other Fees.None.
(e) (1) Before any accountant is engaged by the registrant to render audit or non-audit services, the engagement must be approved by the audit committee as contemplated by paragraph (c)(7)(i)(A) of Rule 2-01of Regulation S-X.
(2) The Audit Committee has pre-approved, as required by Rule 2-01(c)(7)(i)(C) of Regulation S-X, 100% of the services described in this Item 4(b) through (d), which such services are described above.
(f) None.
(g) None.
(h) None.
Item 5. Audit Committee of Listed Registrants.
Not applicable.
Item 6. Schedule of Investments
Schedule included as part of the report to shareholders filed under Item 1 of this Form.
Item 7. Disclosure of Proxy Voting Policies and Procedures for Closed-End Management Investment Companies.
Not applicable.
Item 8. Portfolio Managers of Closed-End Management Investment Companies.
Not applicable.
Item 9. Purchases of Equity Securities by Closed-End Management Investment Company and Affiliated Purchasers.
Not applicable.
Item 10. Submission of Matters to a Vote of Security Holders.
The Trust does not normally hold shareholder meetings. There have been no changes to the Trust’s procedures during the period covered by this report.
Item 11. Controls and Procedures.
(a) The Trust’s principal executive officer and principal financial officer determined that the Trust’s disclosure controls and procedures (as defined in Rule 30a-3(c) under the Investment Company Act of 1940 (the “Act”)) are effective, based on their evaluation of these controls and procedures required by Rule 30a-3(b) under the Act and Rules 13a-15(b) or 15d-15(b) under the Securities Exchange Act of 1934 within 90 days of the date of this report. There were no significant changes in the Trust’s internal controls or in other factors that could significantly affect these controls subsequent to the date of their evaluation. The officers identified no significant deficiencies or material weaknesses.
(b) There were no changes in the Trust’s internal control over financial reporting (as defined in Rule 30a-3(d) under the Act) that occurred during the second fiscal quarter of the period covered by this report that has materially affected, or is reasonably likely to materially affect, the Trust’s internal control over financial reporting.
Item 12. Disclosure of Securities Lending Activities for Closed-End Management Investment Companies.
Not applicable.
Item 13. Exhibits.
(a) (1) Code of ethics - See Item 2.
(2) Certifications of principal executive and principal financial officers as required by Rule 30a-2(a) under the Act. –Filed herewith.
(3) Not applicable.
(4) There was no change in the registrant’s independent public accountant for the period covered by this report.
(b) Certification of principal executive and principal financial officers as required by Rule 30a-2(b) under the Act. -Filed herewith.
SIGNATURES
Pursuant to the requirements of the Securities Exchange Act of 1934 and the Investment Company Act of 1940, the Registrant has duly caused this Report to be signed on its behalf by the undersigned, thereunto duly authorized.
Madison Funds
/s/ Kevin S. Thompson
Kevin S. Thompson, Chief Legal Officer
Date:January 2, 2020
Pursuant to the requirements of the Securities Exchange Act of 1934 and the Investment Company Act of 1940, this Report has been signed below by the following persons on behalf of the Registrant and in the capacities and on the dates indicated.
/s/ Kevin S. Thompson
Kevin S. Thompson, Principal Executive Officer
Date:January 2, 2020
/s/ Greg D. Hoppe
Greg D. Hoppe, Principal Financial Officer
Date:January 2, 2020