OMB APPROVAL
OMB Number: 3235-0570
Expires: August 31, 2020
Estimated average burden hours per response...20.6
UNITED STATES SECURITIES AND EXCHANGE COMMISSION
Washington, DC 20549
FORM N-CSR
CERTIFIED SHAREHOLDER REPORT OF REGISTERED
MANAGEMENT INVESTMENT COMPANIES
Investment Company Act file number 811-08261
Madison Funds
(Exact name of registrant as specified in charter)
550 Science Drive, Madison, WI 53711
(Address of principal executive offices)(Zip code)
Kevin S. Thompson
Chief Legal Officer
550 Science Drive
Madison, WI 53711
(Name and address of agent for service)
Registrant’s telephone number, including area code: 608-274-0300
Date of fiscal year end: October 31
Date of reporting period: October 31, 2017
Form N-CSR is to be used by management investment companies to file reports with the Commission not later than 10 days after the transmission to stockholders of any report that is required to be transmitted to stockholders under Rule 30e-1 under the Investment Company Act of 1940 (17 CFR 270.30e-1). The Commission may use the information provided on Form N-CSR in its regulatory, disclosure review, inspection, and policymaking roles.
A registrant is required to disclose the information specified by Form N-CSR, and the Commission will make this information public. A registrant is not required to respond to the collection of information contained in Form N-CSR unless the Form displays a currently valid Office of Management and Budget (“OMB”) control number. Please direct comments concerning the accuracy of the information collection burden estimate and any suggestions for reducing the burden to Secretary, Securities and Exchange Commission, 450 Fifth Street, NW, Washington, DC 20549-0609. The OMB has reviewed this collection of information under the clearance requirements of 44 U.S.C. s 3507.
Item 1. Report to Shareholders.
Annual Report
October 31, 2017

Madison Conservative Allocation Fund
Madison Moderate Allocation Fund
Madison Aggressive Allocation Fund
Madison Government Money Market Fund
Madison Tax-Free Virginia Fund
Madison Tax-Free National Fund
Madison High Quality Bond Fund
Madison Core Bond Fund
Madison Corporate Bond Fund
Madison High Income Fund
Madison Diversified Income Fund
Madison Covered Call & Equity Income Fund
Madison Dividend Income Fund
Madison Large Cap Value Fund
Madison Investors Fund
Madison Mid Cap Fund
Madison Small Cap Fund
Madison International Stock Fund
Madison Funds | October 31, 2017
| | | Page |
| | | |
| Management’s Discussion of Fund Performance | | |
Period in Review | | 2 |
Allocation Funds Summary | | 3 |
Conservative Allocation Fund | | 3 |
Moderate Allocation Fund | | 4 |
Aggressive Allocation Fund | | 5 |
Government Money Market Fund | | 5 |
Tax-Free Virginia Fund | | 6 |
Tax-Free National Fund | | 7 |
High Quality Bond Fund | | 8 |
Core Bond Fund | | 8 |
Corporate Bond Fund | | 9 |
High Income Fund | | 10 |
Diversified Income Fund | | 11 |
Covered Call & Equity Income Fund | | 12 |
Dividend Income Fund | | 13 |
Large Cap Value Fund | | 13 |
Investors Fund | | 14 |
Mid Cap Fund | | 15 |
Small Cap Fund | | 16 |
International Stock Fund | | 17 |
Notes to Management’s Discussion of Fund Performance | | 19 |
| Portfolios of Investments | | |
Conservative Allocation Fund | | 20 |
Moderate Allocation Fund | | 20 |
Aggressive Allocation Fund | | 20 |
Government Money Market Fund | | 21 |
Tax-Free Virginia Fund | | 21 |
Tax-Free National Fund | | 22 |
High Quality Bond Fund | | 24 |
Core Bond Fund | | 24 |
Corporate Bond Fund | | 27 |
High Income Fund | | 28 |
Diversified Income Fund | | 29 |
Covered Call & Equity Income Fund | | 32 |
Dividend Income Fund | | 34 |
Large Cap Value Fund | | 34 |
Investors Fund | | 35 |
Mid Cap Fund | | 35 |
Small Cap Fund | | 36 |
International Stock Fund | | 37 |
| Financial Statements | | |
Statements of Assets and Liabilities | | 38 |
Statements of Operations | | 40 |
Statements of Changes in Net Assets | | 42 |
Financial Highlights | | 47 |
| Notes to Financial Statements | | 56 |
| Report of Independent Registered Public Accounting Firm | | 66 |
| Other Information | | 67 |
| Trustees and Officers | | 72 |
| | |
| | Although each fund’s name begins with the word “Madison,” the word “Madison” may be omitted in this report for simplicity when referring to any particular fund, group of funds or list of funds. |
| | |
| | Nondeposit investment products are not federally insured, involve investment risk, may lose value and are not obligations of or guaranteed by any financial institution. |
| | |
| | For more complete information about Madison Funds, including charges and expenses, request a prospectus from your financial advisor or from Madison Funds, P.O. Box 8390, Boston, MA 02266-8390. Consider the investment objectives, risks, and charges and expenses of any fund carefully before investing. The prospectus contains this and other information about the funds. |
| | |
| | For more current performance information, please call 1-800-877-6089 or visit our website at www.madisonfunds.com. Current performance may be lower or higher than the performance data quoted within. Past performance does not guarantee future results. |
| | |
| | Nothing in this report represents a recommendation of a security by the investment adviser. Portfolio holdings may have changed since the date of this report. |
Madison Funds | October 31, 2017
Management’s Discussion of Fund Performance (unaudited)
Period in Review
Stocks and risk assets continued their march higher during fiscal 2017 as most equity indices set new highs. The S&P 500® Index gained 23.63%, the Russell Midcap® rose 21.09% and the MSCI EAFE® Index (net) advanced 23.44% over the last twelve months. Interest rates across the maturity spectrum rose, leading to mostly flat returns as declining bond prices offset collected income. The Bloomberg Barclays Intermediate Government/Credit Index® advanced 0.60% and the Bloomberg Barclays Aggregate Index® gained 0.90% for the year.
Economic data improved in the calendar third-quarter as manufacturing strengthened, employment continued to improve and housing stabilized. Gains in employment showed an average of 148,000 jobs added in each of the last twelve months (through October) resulting in a 4.1% unemployment rate. While hourly wages were only up a modest 2.9% from a year ago, consumer confidence increased to its highest level since 2000. Second-quarter GDP growth was also revised upward to 3.1% (previously reported at 2.6%) partially driven by increased consumer spending, and the initial third-quarter GDP report showed a 3.0% annualized advance from the second-quarter. While hurricanes Harvey, Irma and Maria may have pruned third-quarter growth, it is likely that the rebuilding effort may boost consumption over the next several quarters. Importantly, earnings growth has been impressive, with earnings per share growing approximately 10% in the latest quarter compared to a year ago. This also marks the second consecutive quarter of double-digit earnings growth following a two-year stall, and may be supportive of increased business spending in 2018.
Meanwhile, the Federal Reserve (Fed) held short-term interest rates steady in September (at 1.00-1.25%) and, as expected, announced that the long-anticipated reduction of its $4.5 trillion balance sheet would begin in October. The Fed had indicated for some time that it would begin reducing the portfolio of bonds it accumulated since the 2008 financial crisis. The Fed further indicated it was on track for another quarter-point increase in December, and the Fed’s so-called “dot plot” indicated the potential for three more hikes in 2018. However, the Fed Funds futures contract, which has been more successful than the Fed itself at predicting interest-rate changes, is pricing far fewer rate increases over the next year. As we’ve expressed before, the net impact of aggressive monetary policy (low interest rates) has been elevated asset prices and we expect that, as interest rates increase, so will volatility in the capital markets.
Indeed, the resilience of the capital markets has been impressive, with 2017 recording the lowest level of volatility (daily moves of greater than 0.5%) in the equity market since 1965. The bull market is now the second longest on record as investors have seen their stocks more than triple since the depths of the financial crisis. This creates concerns about the imminent end of this great bull market run. High valuations, along with a rising short-term interest rate backdrop, suggest higher risk of a pull-back or correction. However, it should be pointed out that a correction is quite different than the prolonged market decline referred to as a “bear market.” Market corrections happen frequently, then have a way of bouncing back as long as the economy continues to grow. In fact, it’s worth reminding ourselves that, during the past several years, the S&P 500 Index suffered a number of pull-backs: a decline of 7% in 2014, a sell-off of 12% in August of 2015 and a decline of 11% in early 2016. The key distinction between a short-term correction and a prolonged bear market is tied to the sustainability of economic growth.
Global growth has been slow to accelerate to anticipated levels, though not surprisingly as the lingering effects of the financial crisis have been difficult to break. Despite recent vigor, yearly GDP growth in the U.S. continues to plod around a 2% central tendency. Growth in the rest of the world has tended to lag, but now seems to be on firmer footing. We expect global monetary policies to follow the U.S. lead, with the European Central Bank (ECB) likely to begin its own reversal of Quantitative Easing (QE) policies and move toward monetary restraint. Labor reforms in France and fiscal stimulus in Japan also look more likely. In the U.S., hurricane relief spending and the potential for modest tax reform measures could lift fiscal spending at home. This bodes well for continued global growth.
Geopolitical risks remain high and represent potential headwinds to growth and asset values. Most notably, the situation with North Korea remains tense. In the near-term, it seems that this risk has plateaued – perhaps an indication that back channel communications have developed, or the simple acceptance that deterrence with a nuclear armed North Korea has emerged. Regardless, markets have chosen to fade these day-to-day headlines for now.
Despite increasing over the last year, interest rates generally remain low by historical standards in the U.S., but relatively attractive compared to continued low levels in most developed countries. Our outlook for interest rates remains a cautious one as the Fed will continue to exert upward pressure on short-term yields while long-term yields will be driven largely by evolving inflation conditions. So far, cyclical inflation pressures have been modest in spite of steady, but uninspiring, economic growth. Wage pressures have remained contained even though the unemployment rate is quite low and anecdotal evidence of hiring difficulties among employers abounds. We expect that inflation will continue its gradual creep upwards, leading to persistent upward pressure on long-term yields.
By most measures, stock market valuations appear stretched, yet a catalyst for a correction has yet to emerge. Even at modestly elevated levels, short-term interest rates remain accommodative and liquidity remains abundant. As we look forward, it is likely that the low levels of volatility in the market won’t persist. Elevated stock valuations, high investor optimism, rising geopolitical tensions and uncertain policy from Washington create a recipe for higher volatility in the future. Although lofty valuations (along with stock prices) may continue longer than justified, we believe investors should prepare for more modest returns going forward. With this backdrop we continue to believe stocks of lower-risk, higher-quality companies, along with shorter-duration, higher-quality bonds will allow investors to participate in the market, while providing some shelter should volatility return to more typical levels.
Madison Funds | Management’s Discussion of Fund Performance - continued | October 31, 2017
The Madison Conservative Allocation, Moderate Allocation and Aggressive Allocation Funds invest primarily in shares of registered investment companies (the “Underlying Funds”). The funds are diversified among a number of asset classes and their allocation among Underlying Funds are based on an asset allocation model developed by Madison Asset Management, LLC (“Madison”), the funds’ investment adviser. The team may use multiple analytical approaches to determine the appropriate asset allocation, including:
| • | | Asset allocation optimization analysis – considers the degree to which returns in different asset classes do or do not move together, and the funds’ aim to achieve a favorable overall risk profile for any targeted portfolio return. |
| • | | Scenario analysis – historical and expected return data is analyzed to model how individual asset classes and combinations of asset classes would affect the funds under different economic and market conditions. |
| • | | Fundamental analysis – draws upon Madison’s investment teams to judge each asset class against current and forecasted market conditions. Economic, industry and security analysis is used to develop return and risk expectations that may influence asset class selection. In addition, Madison has a flexible mandate which permits the funds, at the sole discretion of Madison, to materially reduce equity risk exposures when and if conditions are deemed to warrant such an action. |
| MADISON CONSERVATIVE ALLOCATION FUND |
| |
| INVESTMENT STRATEGY HIGHLIGHTS |
Under normal circumstances, the Madison Conservative Allocation Fund’s total net assets will be allocated among various asset classes and Underlying Funds, including those whose shares trade on a stock exchange (exchange traded funds or “ETFs”), with target allocations over time of approximately 35% equity investments and 65% fixed income investments. Underlying Funds in which the fund invests may include funds advised by Madison and/or its affiliates, including other Madison Funds (the “Affiliated Underlying Funds”). Generally, Madison will not invest more than 75% of the fund’s net assets, at the time of purchase, in Affiliated Underlying Funds.
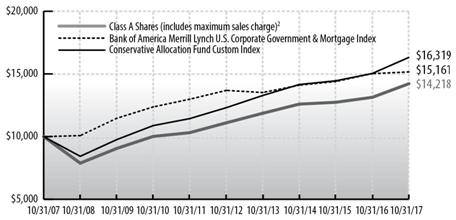
Cumulative Performance of $10,000 Investment1
| | Average Annual Total Return through October 31, 20171 |
| |
| | | | | % Return Without Sales Charge | | % Return After Sales Charge5 |
| | | | | | | | |
| | | | | | | | | | | | | | | | | | | | Since | | | | | | | | | | | | | | | | | | Since |
| | | | 1 | | 3 | | 5 | | 10 | | 2/29/08 | | 1 | | 3 | | 5 | | 10 | | 2/29/08 |
| | | | Year | | Years | | Years | | Years | | Inception | | Year | | Years | | Years | | Years | | Inception |
| |
| | Class A Shares2 | | | 8.25 | | | | 4.13 | | | | 5.08 | | | | 3.58 | | | | – | | | | 2.01 | | | | 2.10 | | | | 3.83 | | | | 2.97 | | | | – | |
| | Class B Shares3 | | | 7.47 | | | | 3.35 | | | | 4.30 | | | | 2.97 | | | | – | | | | 2.97 | | | | 2.26 | | | | 3.96 | | | | 2.97 | | | | – | |
| |
| | Class C Shares4 | | | 7.46 | | | | 3.35 | | | | 4.29 | | | | – | | | | 3.29 | | | | 6.46 | | | | 3.35 | | | | 4.29 | | | | – | | | | 3.29 | |
| |
| | Bank of America Merrill Lynch US Corp, Govt & Mortgage Index | | | 0.89 | | | | 2.44 | | | | 2.07 | | | | 4.25 | | | | 3.92 | | | | NA | | | | NA | | | | NA | | | | NA | | | | NA | |
| |
| |
| | Conservative Allocation Fund Custom Index | | | 8.51 | | | | 4.85 | | | | 5.80 | | | | 5.02 | | | | 5.45 | | | | NA | | | | NA | | | | NA | | | | NA | | | | NA | |
See accompanying Notes to Management’s Discussion of Fund Performance.
The Madison Conservative Allocation Fund (Class A at NAV) returned 8.25% for the one-year period, compared to its benchmark Conservative Allocation Fund Custom Index return of 8.51%. The fund underperformed its peers as measured by the Morningstar Conservative Allocation Category, which returned 9.36% for the year.
Fun fact: the S&P 500® Index has not recorded a negative monthly total return since the election of Donald Trump! That’s a perfect 12 for 12, and only the third time in history the index has gone 12 consecutive months with a positive return. The others occurred in 1935-1936 and 1949-1950. Given our conservative DNA, we are quite pleased with how well the fund kept pace over what has been a remarkable run in the global equity markets. Overall, the fund captured 97% of the benchmark’s return for the trailing year. A timely shift toward international equities in late 2016 served as the single biggest contributor to the fund’s ability to run with the benchmark. Other positives included relative overweight allocations to U.S. growth stocks and corporate bonds within the fund’s fixed income allocation. A modest underweight to equities overall, and an overweight allocation to U.S. mid cap stocks were the largest detractors from performance.
Years of consistently low U.S. inflation have provided our U.S. central bank (the Federal Reserve or the Fed) with the justification and conviction to provide massive levels of monetary stimulus. Importantly, this has been true in terms of both scale and longevity. The Fed’s primary goal since the 2007-09 global financial crisis has been to “reflate” and stimulate the real economy. In reality, the Fed has instead been more impactful at notably “inflating” the value of virtually all investment asset classes. The median U.S. stock, for example, is now trading near all-time record high valuation levels relative to both current and normalized long-term earnings. In our view, this level of valuation extreme is not justified given the elevated levels of uncertainty that both global economies (unprecedented debt levels) and established companies (pervasive disruption risk) are facing. Our perspective, then, is that today’s “concocted” increase in asset class valuations is not primarily based on prospects for improving economic fundamentals but rather the cumulative influence that pervasive liquidity and historically low interest rates have had on investor confidence and financial leverage.
Given this growing disconnect between tethered economic fundamentals and ebullient financial markets, we continue to exercise a good dose of caution and skepticism as we position portfolios. The market’s current, and seemingly gullible, “we’ll see it when we believe it” personality type is not particularly conducive for producing sustainable, repeatable and enduring long-term investment results.
Our defensively-oriented posture remains intact. Incremental allocations continue to focus on international equities. After years of relative weakness, we are also turning our attention to energy and commodities as a potential hunting ground for new ideas. We believe the global supply of oil, despite ongoing gains in fracking, will be curtailed due to sizable cutbacks in conventional exploration and development (such as offshore oil). Meanwhile, despite the growing excitement over Tesla and electric vehicles (EV) in general, poor EV ownership economics and highly limiting practicalities for broad-based EV usage implies that global demand for conventional oil is not likely to peak any time soon.
We are confident that the fund remains well-positioned for a growth-challenged global economy. We also understand and embrace our ongoing responsibility to insightfully differentiate between attractive and less attractive asset classes as we strive to deliver superior risk-adjusted returns. As always, we sincerely appreciate your support.
| PORTFOLIO ALLOCATION AS A PERCENTAGE OF NET ASSETS AS OF 10/31/17 | | | |
| |
| Alternative Funds | | 2.0 | % |
| Bond Funds | | 59.1 | % |
| Foreign Stock Funds | | 13.7 | % |
| Money Market Funds | | 2.1 | % |
| Stock Funds | | 23.1 | % |
| Net Other Assets and Liabilities | | (0.0 | )% |
| |
Madison Funds | Management’s Discussion of Fund Performance - Madison Conservative Allocation Fund - continued | October 31, 2017
| TOP TEN HOLDINGS AS A PERCENTAGE OF NET ASSETS AS OF 10/31/17 | | | |
| |
| Madison Core Bond Fund Class Y | | 20.4 | % |
| iShares 7-10 Year Treasury Bond ETF | | 7.8 | % |
| Vanguard FTSE All-World ex-U.S. ETF | | 7.8 | % |
| Virtus Seix Floating Rate High Income Fund, Class R6 | | 7.8 | % |
| Madison Corporate Bond Fund Class Y | | 7.0 | % |
| Baird Aggregate Bond Fund Institutional Shares | | 5.7 | % |
| Madison Investors Fund Class Y | | 5.7 | % |
| Madison Dividend Income Fund Class Y | | 5.7 | % |
| Vanguard Growth ETF | | 3.4 | % |
| Metropolitan West Total Return Bond Fund Class I | | 3.3 | % |
| |
| MADISON MODERATE ALLOCATION FUND |
| |
| INVESTMENT STRATEGY HIGHLIGHTS |
Under normal circumstances, the Madison Moderate Allocation Fund’s total net assets will be allocated among various asset classes and Underlying Funds, including those whose shares trade on a stock exchange (exchange traded funds or “ETFs”), with target allocations over time of approximately 60% equity investments and 40% fixed income investments. Underlying Funds in which the fund invests may include Affiliated Underlying Funds. Generally, Madison will not invest more than 75% of the fund’s net assets, at the time of purchase, in Affiliated Underlying Funds.
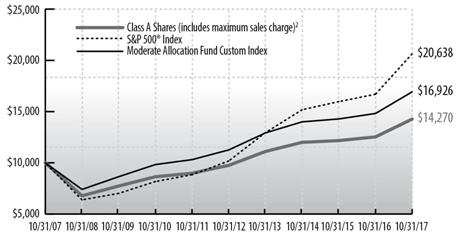
Cumulative Performance of $10,000 Investment1
| | Average Annual Total Return through October 31, 20171 |
| |
| | | | | % Return Without Sales Charge | | | % Return After Sales Charge5 |
| | | | | | | | |
| | | | | | | | | | | | | | | | | | | | Since | | | | | | | | | | | | | | | | | | Since |
| | | | 1 | | 3 | | 5 | | 10 | | 2/29/08 | | 1 | | 3 | | 5 | | 10 | | 2/29/08 |
| | | | Year | | Years | | Years | | Years | | Inception | | Year | | Years | | Years | | Years | | Inception |
| |
| | Class A Shares2 | | | 13.88 | | | | 5.95 | | | | 7.91 | | | | 3.62 | | | | – | | | | 7.35 | | | | 3.87 | | | | 6.64 | | | | 3.01 | | | | – | |
| |
| | Class B Shares3 | | | 13.07 | | | | 5.17 | | | | 7.09 | | | | 3.00 | | | | – | | | | 8.57 | | | | 4.12 | | | | 6.79 | | | | 3.00 | | | | – | |
| |
| | Class C Shares4 | | | 13.06 | | | | 5.17 | | | | 7.09 | | | | – | | | | 3.88 | | | | 12.06 | | | | 5.17 | | | | 7.09 | | | | – | | | | 3.88 | |
| |
| | S&P 500® Index | | | 23.63 | | | | 10.77 | | | | 15.18 | | | | 7.51 | | | | 9.40 | | | | NA | | | | NA | | | | NA | | | | NA | | | | NA | |
| |
| | Moderate Allocation | | | | | | | | | | | | | | | | | | | | | | | | | | | | | | | | | | | | | | | | |
| | Fund Custom Index | | | 14.24 | | | | 6.54 | | | | 8.49 | | | | 5.40 | | | | 6.34 | | | | NA | | | | NA | | | | NA | | | | NA | | | | NA | |
See accompanying Notes to Management’s Discussion of Fund Performance.
The Madison Moderate Allocation Fund (Class A at NAV) returned 13.88% for the one-year period, compared to its benchmark Moderate Allocation Fund Custom Index return of 14.24%. The fund outperformed its peers as measured by the Morningstar Moderate Allocation category, which advanced 13.56% for the period.
Fun fact: the S&P 500® Index has not recorded a negative monthly total return since the election of Donald Trump! That’s a perfect 12 for 12, and only the third time in history the index has gone 12 consecutive months with a positive return. The others occurred in 1935-1936 and 1949-1950. Given our conservative DNA, we are quite pleased with how well the fund kept pace over what has been a remarkable run in the global equity markets. Overall, the fund captured 98% of the benchmark’s return for the trailing year. A timely shift toward international equities in late 2016 served as the single biggest contributor to the fund’s ability to run with the benchmark. Other positives included relative overweight allocations to U.S. growth stocks and corporate bonds within the fund’s fixed income allocation. A modest underweight to equities overall, and an overweight allocation to U.S. mid cap stocks were the largest detractors from performance.
Years of consistently low U.S. inflation have provided our U.S. central bank (the Federal Reserve or the Fed) with the justification and conviction to provide massive levels of monetary stimulus. Importantly, this has been true in terms of both scale and longevity. The Fed’s primary goal since the 2007-09 global financial crisis has been to “reflate” and stimulate the real economy. In reality, the Fed has instead been more impactful at notably “inflating” the value of virtually all investment asset classes. The median U.S. stock, for example, is now trading near all-time record high valuation levels relative to both current and normalized long-term earnings. In our view, this level of valuation extreme is not justified given the elevated levels of uncertainty that both global economies (unprecedented debt levels) and established companies (pervasive disruption risk) are facing. Our perspective, then, is that today’s “concocted” increase in asset class valuations is not primarily based on prospects for improving economic fundamentals but rather the cumulative influence that pervasive liquidity and historically low interest rates have had on investor confidence and financial leverage.
Given this growing disconnect between tethered economic fundamentals and ebullient financial markets, we continue to exercise a good dose of caution and skepticism as we position portfolios. The market’s current, and seemingly gullible, “we’ll see it when we believe it” personality type is not particularly conducive for producing sustainable, repeatable and enduring long-term investment results.
Our defensively-oriented posture remains intact. Incremental allocations continue to focus on international equities. After years of relative weakness, we are also turning our attention to energy and commodities as a potential hunting ground for new ideas. We believe the global supply of oil, despite ongoing gains in fracking, will be curtailed due to sizable cutbacks in conventional exploration and development (such as offshore oil). Meanwhile, despite the growing excitement over Tesla and electric vehicles (EV) in general, poor EV ownership economics and highly limiting practicalities for broad-based EV usage implies that global demand for conventional oil is not likely to peak any time soon.
We are confident that the fund remains well-positioned for a growth-challenged global economy. We also understand and embrace our ongoing responsibility to insightfully differentiate between attractive and less attractive asset classes as we strive to deliver superior risk-adjusted returns. As always, we sincerely appreciate your support.
| PORTFOLIO ALLOCATION AS A PERCENTAGE OF NET ASSETS AS OF 10/31/17 | | | |
| |
| Alternative Funds | | 1.9 | % |
| Bond Funds | | 33.9 | % |
| Foreign Stock Funds | | 23.8 | % |
| Money Market Funds | | 2.4 | % |
| Stock Funds | | 38.0 | % |
| Net Other Assets and Liabilities | | (0.0 | )% |
| |
| | | | |
| TOP TEN HOLDINGS AS A PERCENTAGE OF NET ASSETS AS OF 10/31/17 | | | |
| |
| Madison Core Bond Fund Class Y | | 14.6 | % |
| Vanguard FTSE All-World ex-U.S. ETF | | 12.5 | % |
| Madison Dividend Income Fund Class Y | | 10.5 | % |
| Madison Investors Fund Class Y | | 10.5 | % |
| Vanguard Growth ETF | | 5.0 | % |
| iShares 7-10 Year Treasury Bond ETF | | 4.9 | % |
| Baird Aggregate Bond Fund Institutional Shares | | 4.4 | % |
| iShares Core S&P Mid-Cap ETF | | 4.2 | % |
| Virtus Seix Floating Rate High Income Fund, Class R6 | | 4.1 | % |
| Vanguard FTSE Europe ETF | | 3.8 | % |
| |
Madison Funds | Management’s Discussion of Fund Performance - continued | October 31, 2017
| MADISON AGGRESSIVE ALLOCATION FUND |
| |
| INVESTMENT STRATEGY HIGHLIGHTS |
Under normal circumstances, the Aggressive Allocation Fund’s total net assets will be allocated among various asset classes and Underlying Funds, including those whose shares trade on a stock exchange (exchange traded funds or “ETFs”), with target allocations over time of approximately 80% equity investments and 20% fixed income investments. Underlying Funds in which the fund invests may include Affiliated Underlying Funds. Generally, Madison will not invest more than 75% of fund’s net assets, at the time of purchase, in Affiliated Underlying Funds.
Cumulative Performance of $10,000 Investment1
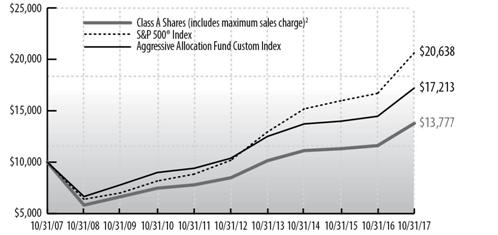
| | Average Annual Total Return through October 31, 20171 |
| |
| | | | | % Return Without Sales Charge | | | % Return After Sales Charge5 |
| | | | | | | | |
| | | | | | | | | | | | | | | | | | | | Since | | | | | | | | | | | | | | | | | | Since |
| | | | 1 | | 3 | | 5 | | 10 | | 2/29/08 | | 1 | | 3 | | 5 | | 10 | | 2/29/08 |
| | | | Year | | Years | | Years | | Years | | Inception | | Year | | Years | | Years | | Years | | Inception |
| |
| | Class A Shares2 | | | 18.66 | | | | 7.38 | | | | 10.18 | | | | 3.26 | | | | – | | | | 11.82 | | | | 5.29 | | | | 8.88 | | | | 2.65 | | | | – | |
| |
| | Class B Shares3 | | | 17.83 | | | | 6.60 | | | | 9.38 | | | | 2.63 | | | | – | | | | 13.33 | | | | 5.58 | | | | 9.10 | | | | 2.63 | | | | – | |
| |
| | Class C Shares4 | | | 17.81 | | | | 6.59 | | | | 9.37 | | | | – | | | | 4.07 | | | | 16.81 | | | | 6.59 | | | | 9.37 | | | | – | | | | 4.07 | |
| |
| | S&P 500 Index | | | 23.63 | | | | 10.77 | | | | 15.18 | | | | 7.51 | | | | 9.40 | | | | NA | | | | NA | | | | NA | | | | NA | | | | NA | |
| |
| | Aggressive Allocation Fund Custom Index | | | 19.02 | | | | 7.85 | | | | 10.64 | | | | 5.58 | | | | 6.93 | | | | NA | | | | NA | | | | NA | | | | NA | | | | NA | |
See accompanying Notes to Management’s Discussion of Fund Performance.
The Madison Aggressive Allocation Fund (Class A at NAV) returned 18.66% for the one-year period, compared to its benchmark Aggressive Allocation Fund Custom Index return of 19.02%. The fund outperformed its peers as measured by the Morningstar Aggressive Allocation category, which returned 16.88% for the period.
Fun fact: the S&P 500® Index has not recorded a negative monthly total return since the election of Donald Trump! That’s a perfect 12 for 12, and only the third time in history the index has gone 12 consecutive months with a positive return. The others occurred in 1935-1936 and 1949-1950. Given our conservative DNA, we are quite pleased with how well the fund kept pace over what has been a remarkable run in the global equity markets. Overall, the fund captured 98% of the benchmark’s return for the trailing year. A timely shift toward international equities in late 2016 served as the single biggest contributor to the fund’s ability to run with the benchmark. Other positives included relative overweight allocations to U.S. growth stocks and corporate bonds within the fund’s fixed income allocation. A modest underweight to equities overall, and an overweight allocation to U.S. mid cap stocks were the largest detractors from performance.
Years of consistently low U.S. inflation have provided our U.S. central bank (the Federal Reserve or the Fed) with the justification and conviction to provide massive levels of monetary stimulus. Importantly, this has been true in terms of both scale and longevity. The Fed’s primary goal since the 2007-09 global financial crisis, has been to “reflate” and stimulate the real economy. In reality, the Fed has instead been more impactful at notably “inflating” the value of virtually all investment asset classes. The median U.S. stock, for example, is now trading near all-time record high valuation levels relative to both current and normalized long-term earnings. In our view, this level of valuation extreme is not justified given the elevated levels of uncertainty that both global economies (unprecedented debt levels) and established companies (pervasive disruption risk) are facing. Our perspective, then, is that today’s “concocted” increase in asset class valuations is not primarily based on prospects for improving economic fundamentals but rather the cumulative influence that pervasive liquidity and historically low interest rates have had on investor confidence and financial leverage.
Given this growing disconnect between tethered economic fundamentals and ebullient financial markets, we continue to exercise a good dose of caution and skepticism as we position portfolios. The market’s current, and seemingly gullible, “we’ll see it when we believe it” personality type is not particularly conducive for producing sustainable, repeatable and enduring long-term investment results.
Our defensively-oriented posture remains intact. Incremental allocations continue to focus on international equities. After years of relative weakness, we are also turning our attention to energy and commodities as a potential hunting ground for new ideas. We believe the global supply of oil, despite ongoing gains in fracking, will be curtailed due to sizable cutbacks in conventional exploration and development (such as offshore oil). Meanwhile, despite the growing excitement over Tesla and electric vehicles (EV) in general, poor EV ownership economics and highly limiting practicalities for broad-based EV usage implies that global demand for conventional oil is not likely to peak any time soon.
We are confident that the fund remains well-positioned for a growth-challenged global economy. We also understand and embrace our ongoing responsibility to insightfully differentiate between attractive and less attractive asset classes as we strive to deliver superior risk-adjusted returns. As always, we sincerely appreciate your support.
| PORTFOLIO ALLOCATION AS A PERCENTAGE OF NET ASSETS AS OF 10/31/17 | | | |
| |
| Alternative Funds | | 1.9 | % |
| Bond Funds | | 14.1 | % |
| Foreign Stock Funds | | 31.4 | % |
| Money Market Funds | | 3.1 | % |
| Stock Funds | | 50.1 | % |
| Net Other Assets and Liabilities | | (0.6 | )% |
| |
| | | | |
| TOP TEN HOLDINGS AS A PERCENTAGE OF NET ASSETS AS OF 10/31/17 | | | |
| |
| Vanguard FTSE All-World ex-U.S. ETF | | 15.5 | % |
| Madison Dividend Income Fund Class Y | | 12.7 | % |
| Madison Investors Fund Class Y | | 12.7 | % |
| Madison Core Bond Fund Class Y | | 8.6 | % |
| Vanguard Growth ETF | | 7.4 | % |
| iShares Core S&P Mid-Cap ETF | | 6.1 | % |
| Vanguard FTSE Europe ETF | | 5.5 | % |
| iShares MSCI Eurozone ETF | | 4.7 | % |
| Madison Mid Cap Fund Class Y | | 3.3 | % |
| Vanguard FTSE Emerging Markets ETF | | 3.0 | % |
| |
| MADISON GOVERNMENT MONEY MARKET FUND |
| |
| INVESTMENT STRATEGY HIGHLIGHTS |
The Madison Government Money Market Fund invests at least 99.5% of its total assets in cash, government securities, and/or repurchase agreements that are collateralized by cash or government securities, including but not limited to the Federal National Mortgage Association, Federal Home Loan Banks, Federal Home Loan Mortgage Corporate, and Federal Farm Credit Banks.
The fund is a money market fund that seeks to maintain a stable net asset value (“NAV”) of $1.00 per share. The fund’s investments must have a remaining maturity of no more than 397 days and must be high quality. The fund maintains a dollar-weighted average portfolio maturity of 60 days or less.
Madison Funds | Management’s Discussion of Fund Performance - Madison Government Money Market Fund - continued | October 31, 2017
The Madison Government Money Market Fund (Class A) returned 0.21% for the prior twelve months, compared to a 0.71% return on the fund’s Citigroup 90 day Treasury Bill Index benchmark. The Morningstar U.S. Fund Money Market - Taxable peer group returned 0.38% for the period.
The fund continues to make heavy use of the additional yields available in the Federal Agency discount note market, but maintains a shorter average maturity (around 40 days) than its benchmark. As the Federal Reserve continues to raise short-term interest rates, the shorter average maturity of the fund allows us to more quickly take advantage of increases in market yields. We expect the Fed to continue raising the Fed Funds Rate, and by extension driving money market yields higher, at upcoming meetings and throughout 2018. As such, the average maturity of the fund will, for the time being, remain shorter than its benchmark.
| PORTFOLIO ALLOCATION AS A PERCENTAGE OF NET ASSETS AS OF 10/31/17 | | | |
| |
| Fannie Mae | | 17.1 | % |
| Federal Home Loan Bank | | 42.1 | % |
| Freddie Mac | | 26.5 | % |
| Money Market Funds | | 3.1 | % |
| U.S. Treasury Notes | | 11.4 | % |
| Net Other Assets and Liabilities | | (0.2 | )% |
| |
| MADISON TAX-FREE VIRGINIA FUND |
| |
| INVESTMENT STRATEGY HIGHLIGHTS |
The Madison Tax-Free Virginia Fund seeks to achieve its investment objective by investing at least 80% of its net assets in municipal bonds that are exempt from federal and state income tax for residents of Virginia. These securities may be issued by state governments, their political subdivisions (for example, cities and counties) and public authorities (for example, school districts and housing authorities). The fund may also invest in bonds that, under federal law, are exempt from federal and state income taxation, such as bonds issued by the District of Columbia, Puerto Rico, the Virgin Islands and Guam. The fund invests in intermediate and long-term bonds having average, aggregate maturities (at the portfolio level) of 7 to 15 years.
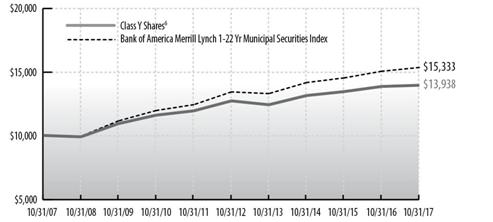
Cumulative Performance of $10,000 Investment1
| | Average Annual Total Return through October 31, 20171 |
| | | | | | | | | | | | | | | | | | |
| | | | | % Return Without Sales Charge |
| | | | | |
| | | | | 1 Year | | | | 3 Years | | | | 5 Years | | | | 10 Years | |
| | |
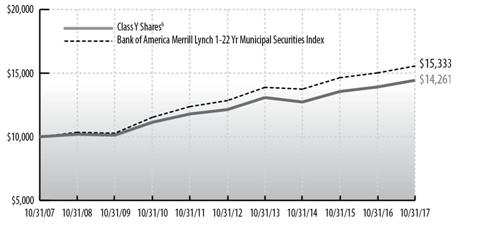
| | Class Y Shares6 | | | 0.68 | | | | 2.01 | | | | 1.86 | | | | 3.38 | |
| | |
| | Bank of America Merrill Lynch 1-22 Yr Municipal Securities Index | | | 1.96 | | | | 2.71 | | | | 2.71 | | | | 4.37 | |
See accompanying Notes to Management’s Discussion of Fund Performance.
The Madison Tax-Free Virginia Fund (Class Y) returned 0.68% for the one-year period, underperforming the Bank of America Merrill Lynch 1-22 year Municipal Securities Index, which returned 1.96%. The Morningstar Municipal Single State Intermediate peer group gained 0.75% for the period.
The underperformance of the fund versus its benchmark was primarily attributable to the fund’s concentration in a single, high quality state and shorter maturity profile. The average duration (a measure of interest rate risk) of the Virginia Fund was 4.13 years versus 4.53 years for the benchmark. Specific to quality, performance was held back by a less-than-benchmark exposure to issuers rated A and BBB and more volatile sectors including toll roads and housing (all of which outperformed the benchmark). In terms of maturity positioning, the fund’s higher-than-benchmark exposure to 6 to 8 year maturities detracted from return, as did limited exposure to maturities longer than 10 years.
We believe the fund is positioned to generate favorable returns relative to the benchmark going forward. Should our expectation for higher interest rates materialize, we believe our preference for non-callable securities will be accretive to the fund’s performance given callable paper is more sensitive to interest rate movements. As well, a reversal of the significant year-to-date contraction of risk premiums ought to favor the fund’s higher quality issuers within sectors prone to less volatility such as essential service revenue bonds. When this happens, we anticipate our high quality bias will generate better performance than the benchmark’s greater relative exposure to lower rated issuers in the more volatile sectors such as healthcare, hospitals and industrial revenue bonds.
Looking ahead, U.S. economic conditions, interest rates, stock market performance and tax reform are all likely to influence municipal issuance, credit quality and valuations. The lack of new issuance during the past twelve months is attributed to reservations specific to the timing and pace of further monetary policy actions by the Federal Reserve, the Trump Administration’s infrastructure spending program, and budgetary considerations. The possibility of significant tax reforms, which may affect issuer borrowing costs, also plays into the mix given the financial implications. We believe total municipal issuance will settle in around $360 billion this year and next with new capital (as opposed to refunding) growing in importance next year as states and localities undertake long-delayed projects.
Our outlook for the tax-exempt market is encouraging even though valuations have richened considerably during the past year. Based on index data, Muni/Treasury (M/T) yield ratios have yet to reach historic lows dating back to the 1970s. Within our call for stable credit trends, a balance between supply/demand and interest rates increasing over time, we expect M/T ratios to remain near current levels through year-end. We’d be remiss not to mention tax reform, yet the on-going rhetoric and political dysfunction leads us to believe the potential for significant valuation adjustments stemming from a change in marginal tax rates is limited until specific details are known. As always, our tax-exempt team is busy identifying opportunities to enhance client portfolios in terms of quality, diversification and tax-free yield while diligently monitoring holdings.
| PORTFOLIO ALLOCATION AS A PERCENTAGE OF NET ASSETS AS OF 10/31/17 | | | |
| |
| Development | | 4.2 | % |
| Education | | 13.6 | % |
| Facilities | | 4.0 | % |
| General | | 12.0 | % |
| General Obligation | | 29.4 | % |
| Medical | | 6.5 | % |
| Multifamily Housing | | 6.1 | % |
| Power | | 4.3 | % |
| Transportation | | 6.0 | % |
| Utilities | | 1.5 | % |
| Water | | 10.1 | % |
| Net Other Assets and Liabilities | | 2.3 | % |
| |
Madison Funds | Management’s Discussion of Fund Performance - Madison Tax-Free Virginia Fund - continued | October 31, 2017
| TOP TEN HOLDINGS AS A PERCENTAGE OF NET ASSETS AS OF 10/31/17 | | | |
| |
| Northern Virginia Transportation Authority, 5.0%, 6/1/30 | | 4.2 | % |
| Fairfax County Redevelopment & Housing Authority, 4.750%, 10/1/36 | | 3.4 | % |
| City of Portsmouth VA, 5.0%, 2/1/31 | | 3.3 | % |
| Virginia Commonwealth Transportation Board, 5.0%, 3/15/25 | | 2.8 | % |
| Chesterfield County Economic Development Authority, 5.0%, 5/1/23 | | 2.7 | % |
| Commonwealth of Virginia, 5.0%, 6/1/23 | | 2.7 | % |
| Virginia College Building Authority, 5.0%, 2/1/23 | | 2.7 | % |
| City of Manassas VA, 3.0%, 7/1/27 | | 2.5 | % |
| Loudoun County Economic Development Authority Revenue, 3.0%, 12/1/29 | | 2.5 | % |
| Norfolk Economic Development Authority, 5.0%, 11/1/36 | | 2.5 | % |
| |
| MADISON TAX-FREE NATIONAL FUND |
| |
| INVESTMENT STRATEGY HIGHLIGHTS |
The Madison Tax-Free National Fund seeks to achieve its investment objective by investing at least 80% of its net assets in municipal bonds that are exempt from federal income taxes. These securities may be issued by state governments, their political subdivisions (for example, cities and counties) and public authorities (for example, school districts and housing authorities). The fund may also invest in bonds that, under federal law, are exempt from federal and state income taxation, such as bonds issued by the District of Columbia, Puerto Rico, the Virgin Islands and Guam. The fund invests in intermediate and long-term bonds having average, aggregate maturities (at the portfolio level) of 7 to 15 years. The primary difference between this fund and the Madison Tax-Free Virginia Fund is that the Madison Tax-Free Virginia Fund will invest in bonds that are exempt from federal and state income tax for residents of Virginia, while this fund will invest in bonds that are exempt from federal income tax.
Cumulative Performance of $10,000 Investment1
| | Average Annual Total Return through October 31, 20171 |
| | | | | | | | | | | | | | | | | | |
| | | | | % Return Without Sales Charge |
| | | | | |
| | | | | 1 Year | | | | 3 Years | | | | 5 Years | | | | 10 Years | |
| | |
| | Class Y Shares6 | | | 0.72 | | | | 2.35 | | | | 2.14 | | | | 3.61 | |
| | |
| | Bank of America Merrill Lynch 1-22 Yr Municipal Securities Index | | | 1.96 | | | | 2.71 | | | | 2.71 | | | | 4.37 | |
See accompanying Notes to Management’s Discussion of Fund Performance.
The Madison Tax-Free National Fund (Class Y) returned 0.72% for the one-year period, underperforming the Bank of America Merrill Lynch 1-22 year Municipal Securities Index, which returned 1.96%. The Morningstar Muni National Long peer group gained 1.63%.
Although the fund was correctly positioned from a duration and sector standpoint, performance was hindered due to its overall high quality bias, yield curve positioning and preference for non-callable securities. The average duration (a measure of interest rate risk) of the fund was 4.39 years versus 4.53 years for the benchmark. Specific to quality, performance was held back by a less-than-benchmark exposure to issuers rated A and BBB, riskier states such as Illinois, larger state issuers such as California and New York and more volatile sectors including toll roads and housing (all of which outperformed the benchmark). In terms of maturity positioning, the fund’s higher-than-benchmark exposure to 6 to 8 year maturities detracted from return, as did limited exposure to maturities longer than 10 years. Lastly, the fund’s below benchmark exposure to callable bonds held back performance.
We believe the fund is positioned to generate favorable returns relative to the benchmark going forward. Should our expectation for higher interest rates materialize, we believe our preference for non-callable securities will be accretive to the fund’s performance given callable paper is more sensitive to interest rate movements. As well, a reversal of the significant year-to-date contraction of risk premiums ought to favor the fund’s higher quality issuers within sectors prone to less volatility such as essential service revenue bonds. When this happens, we anticipate our high quality bias will generate better performance than the benchmark’s greater relative exposure to lower-rated issuers in the more volatile sectors such as healthcare, hospitals and industrial revenue bonds.
Looking ahead, U.S. economic conditions, interest rates, stock market performance and tax reform are all likely to influence municipal issuance, credit quality and valuations. The lack of new issuance during the past twelve months is attributed to reservations specific to the timing and pace of further monetary policy actions by the Federal Reserve, the Trump Administration’s infrastructure spending program, and budgetary considerations. The possibility of significant tax reforms, which may affect issuer borrowing costs, also plays into the mix given the financial implications. We believe total municipal issuance will settle in around $360 billion this year and next with new capital (as opposed to refunding) growing in importance next year as states and localities undertake long-delayed projects.
Our outlook for the tax-exempt market is encouraging even though valuations have richened considerably during the past year. Based on index data, Muni/Treasury (M/T) yield ratios have yet to reach historic lows dating back to the 1970s. Within our call for stable credit trends, a balance between supply/demand and interest rates increasing over time, we expect M/T ratios to remain near current levels through year-end. We’d be remiss not to mention tax reform, yet the on-going rhetoric and political dysfunction leads us to believe the potential for significant valuation adjustments stemming from a change in marginal tax rates is limited until specific details are known. As always, our tax-exempt team is busy identifying opportunities to enhance client portfolios in terms of quality, diversification and tax-free yield while diligently monitoring holdings.
| STATE ALLOCATION AS A PERCENTAGE OF NET ASSETS AS OF 10/31/17 |
| |
| Alabama | | 2.5 | % | | Missouri | | 6.4 | % |
| Arkansas | | 0.7 | % | | New Jersey | | 6.4 | % |
| Colorado | | 1.9 | % | | New Mexico | | 1.9 | % |
| Delaware | | 1.6 | % | | New York | | 3.5 | % |
| Florida | | 17.9 | % | | North Carolina | | 4.8 | % |
| Georgia | | 3.1 | % | | Ohio | | 2.3 | % |
| Hawaii | | 2.1 | % | | South Carolina | | 8.3 | % |
| Illinois | | 0.6 | % | | Tennessee | | 1.0 | % |
| Indiana | | 3.7 | % | | Texas | | 8.5 | % |
| Iowa | | 2.9 | % | | Virginia | | 3.0 | % |
| Kansas | | 3.4 | % | | Washington | | 1.0 | % |
| Maryland | | 2.9 | % | | Wisconsin | | 3.0 | % |
| Michigan | | 3.5 | % | | Net Other Assets and Liabilities | | 3.1 | % |
| |
| TOP TEN HOLDINGS AS A PERCENTAGE OF NET ASSETS AS OF 10/31/17 | | | |
| |
| City of Margate FL General Obligation, 5.0%, 7/1/25 | | 3.8 | % |
| Anderson County School District No. 1, General Obligation, 5.0%, 3/1/25 | | 3.5 | % |
| Maple School District, General Obligation, 5.0%, 4/1/24 | | 3.0 | % |
| City of Rockville MD, General Obligation, 5.0%, 6/1/24 | | 2.9 | % |
| City of Port St. Lucie FL Utility System Revenue, 5.0%, 9/1/27 | | 2.7 | % |
| City of Wichita KS, General Obligation, 5.0%, 12/1/24 | | 2.4 | % |
| County of Miami-Dade FL, 5.0%, 3/1/25 | | 2.4 | % |
| Orlando Utilities Comm | | 2.4 | % |
| Cleveland-Cuyahoga County Port Authority, 5.0%, 7/1/24 | | 2.3 | % |
| Missouri State Board of Public Buildings, 4.0%, 4/1/25 | | 2.3 | % |
| |
Madison Funds | Management’s Discussion of Fund Performance - continued | October 31, 2017
| MADISON HIGH QUALITY BOND FUND |
| |
| INVESTMENT STRATEGY HIGHLIGHTS |
The Madison High Quality Bond Fund seeks to achieve its investment objectives through diversified investments in a broad range of corporate debt securities, obligations of the U.S. Government and its agencies, and money market instruments. In seeking to achieve the fund’s goals, the fund’s management will (1) shorten or lengthen the dollar weighted average maturity of the fund based on its anticipation of the movement of interest rates (the dollar weighted average maturity is expected to be ten years or less), and (2) monitor the yields of the various bonds that satisfy the fund’s investment guidelines to determine the best combination of yield, credit risk and diversification for the fund. Under normal market conditions, the fund will invest at least 80% of its net assets in higher quality bond issues and, therefore, intends to maintain an overall portfolio quality rating of A by Standard & Poor’s and/or A2 by Moody’s or equivalent.
Cumulative Performance of $10,000 Investment1
| | Average Annual Total Return through October 31, 20171 |
| | | | | | | | | | | | | | | | | | |
| | | | | % Return Without Sales Charge |
| | | | | |
| | | | | 1 Year | | | | 3 Years | | | | 5 Years | | | | 10 Years | |
| | |
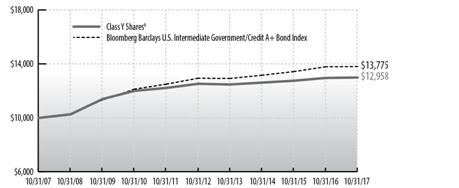
| | Class Y Shares6 | | | 0.25 | | | | 0.99 | | | | 0.73 | | | | 2.63 | |
| | |
| | Bloomberg Barclays U.S. Intermediate Govt/Credit A+ Bond Index | | | 0.14 | | | | 1.62 | | | | 1.31 | | | | 3.25 | |
See accompanying Notes to Management’s Discussion of Fund Performance.
The Madison High Quality Bond Fund (Class Y) returned 0.25% for the one-year period, edging the benchmark Bloomberg Barclays U.S. Intermediate Government/Credit A+ Index, which returned 0.14%. The fund underperformed the Morningstar Short-Term Bond category peer group’s return of 1.31% over the same period.
Examining the point-to-point movement in U.S. Treasury yields during much of the past 12 months would suggest a rather uneventful period. Nothing could be further from the truth. Investors have confronted a long list of policy, economic, and geopolitical events that will continue to influence returns in the months and years ahead. Interest rate volatility, driven by domestic growth concerns, central bank policy actions, renewed geopolitical tensions and economic uncertainty spawned by hurricanes has produced challenging market conditions. We are pleased that the Madison High Quality Bond Fund was well positioned to face challenges such as these and that many of the factors instrumental in forming our defensive view for higher interest rates are beginning to draw wider attention.
After posting several consecutive quarters of solid economic growth, we expect a slight slowing in the third quarter before growth resumes in the fourth quarter. Hurricanes Harvey and Irma will impact the U.S. economy as two very large population centers (Houston and the entire Florida Peninsula) were significantly affected. Judging from past storms, the negative impact on growth should be short-lived as the rebuilding process adds to economic activity in the fourth quarter and beyond. Recovery efforts, combined with possible fiscal stimulus actions, could lead to more vigorous economic growth in coming periods.
Initial concerns that storm-related dampening of growth might alter the Federal Reserve’s (Fed) path to tighter monetary policy were quickly dismissed. At the September Federal Open Market Committee (FOMC) meeting, the Fed announced that the long anticipated reduction in the Fed’s balance sheet would launch in October. This begins the reversal of the Quantitative Easing (QE) policy initiated in the aftermath of the financial crisis. The Fed will begin the process by letting $6 billion in Treasury holdings and $4 billion in mortgage-backed obligations mature without reinvestment. The Fed went to great lengths to communicate the size of the run-off in advance in order to prepare markets. The central bank also signaled that the level of run-off will be systematically steady over time, leaving changes in the Federal Funds rate as the primary reactive tool for monetary policy as economic conditions evolve.
On that front, the Fed has indicated that they still anticipate hiking interest rates again in December. The projected Fed Funds rate of 3% by the end of 2019 was lowered to 2.75% in their most recent forecast, reflecting the persistently low, but in the Fed’s view transitory, levels of inflation. We concur with the Fed’s forecast. Higher wage gains and firmer energy prices should eventually lift inflation measures to the Fed’s 2% target as we move deeper into 2018.
Through all of the factors influencing market direction, the Madison High Quality Bond Fund remains well equipped to navigate a dynamic and changing investment landscape. The fund remains positioned with a conservative maturity posture and higher average quality bias in order to help insulate the fund from increased market volatility. Increased domestic growth potential, changing Fed policy, and building inflation pressures will continue to challenge fixed income markets. The High Quality Bond Fund’s defensive approach to both interest rate risk and credit risk will help to protect shareholder principal and provide the liquidity necessary to act opportunistically. Our belief that interest rates are headed higher appears more imminent now than at any time in recent memory.
| PORTFOLIO ALLOCATION AS A PERCENTAGE OF NET ASSETS AS OF 10/31/17 | | | |
| |
| Consumer Discretionary | | 6.8 | % |
| Consumer Staples | | 1.5 | % |
| Energy | | 1.5 | % |
| Fannie Mae | | 7.9 | % |
| Financials | | 12.6 | % |
| Freddie Mac | | 4.0 | % |
| Health Care | | 3.1 | % |
| Industrials | | 3.1 | % |
| Information Technology | | 8.5 | % |
| Money Market Funds | | 1.5 | % |
| Real Estate | | 1.8 | % |
| U.S. Treasury Notes | | 46.9 | % |
| Net Other Assets and Liabilities | | 0.8 | % |
| |
| | | | |
| TOP TEN HOLDINGS AS A PERCENTAGE OF NET ASSETS AS OF 10/31/17 | | | |
| |
| U.S. Treasury Note, 2.625%, 11/15/20 | | 4.6 | % |
| U.S. Treasury Note, 2.500%, 8/15/23 | | 4.6 | % |
| U.S. Treasury Note, 1.125%, 12/31/19 | | 4.4 | % |
| U.S. Treasury Note, 2.375%, 5/15/27 | | 4.4 | % |
| U.S. Treasury Note, 3.625%, 2/15/20 | | 4.2 | % |
| Freddie Mac, 2.375%, 1/13/22 | | 4.0 | % |
| Fannie Mae, 0.875%, 2/8/18 | | 4.0 | % |
| Fannie Mae, 1.375%, 10/7/21 | | 3.9 | % |
| U.S. Treasury Note, 3.125%, 5/15/19 | | 3.8 | % |
| U.S. Treasury Note, 1.500%, 3/31/19 | | 3.7 | % |
| |
| MADISON CORE BOND FUND |
| |
| INVESTMENT STRATEGY HIGHLIGHTS |
Under normal market conditions, the Madison Core Bond Fund invests at least 80% of its net assets in bonds. To keep current income relatively stable and to limit share price volatility, the fund emphasizes investment grade securities and maintains an intermediate (typically 3-7 year) average portfolio duration, with the goal of
Madison Funds | Management’s Discussion of Fund Performance - Madison Core Bond Fund - continued | October 31, 2017
being between 85-115% of the market benchmark duration. The fund strives to add incremental return in the portfolio by making strategic decisions related to credit risk, sector exposure and yield curve positioning. The fund may invest in corporate debt securities, U.S. Government debt securities, foreign government debt securities, non-rated debt securities, and asset-backed, mortgage-backed and commercial mortgage-backed securities.
Cumulative Performance of $10,000 Investment1
| | Average Annual Total Return through October 31, 20171 |
| |
| | | | | % Return Without Sales Charge | | | % Return After Sales Charge5 |
| | | | | | | | |
| | | | | | | | | | | | | | | | | | | | Since | | | | | | | | | | | | | | | | |
| | | | 1 | | 3 | | 5 | | 10 | | 4/19/13 | | 1 | | 3 | | 5 | | 10 |
| | | | Year | | Years | | Years | | Years | | Inception | | Year | | Years | | Years | | Years |
| |
| | Class A Shares2 | | | 1.05 | | | | 2.19 | | | | 1.52 | | | | 3.09 | | | | – | | | | -3.49 | | | | 0.64 | | | | 0.60 | | | | 2.62 | |
| |
| | Class B Shares3 | | | 0.20 | | | | 1.43 | | | | 0.75 | | | | 2.49 | | | | – | | | | -4.23 | | | | 0.30 | | | | 0.38 | | | | 2.49 | |
| |
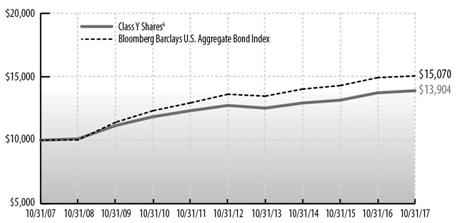
| | Class Y Shares6 | | | 1.22 | | | | 2.43 | | | | 1.76 | | | | 3.35 | | | | – | | | | – | | | | – | | | | – | | | | – | |
| |
| | Class R6 Shares7 | | | 1.41 | | | | 2.56 | | | | – | | | | – | | | | 2.00 | | | | – | | | | – | | | | – | | | | – | |
| |
| | Bloomberg Barclays U.S. Aggregate Bond Index | | | 0.90 | | | | 2.40 | | | | 2.04 | | | | 4.19 | | | | 2.09 | | | | NA | | | | NA | | | | NA | | | | NA | |
See accompanying Notes to Management’s Discussion of Fund Performance.
The Madison Core Bond Fund (Class Y) returned 1.22% for the one-year period, leading the fund’s benchmark, the Bloomberg Barclays U.S. Aggregate Bond Index®, which advanced 0.90%. The fund underperformed the Morningstar Intermediate-Term Bond peer group, which gained 1.55% for the period.
The fund’s outperformance versus its benchmark was driven by a yield and carry advantage, strong selection within corporate bonds and an overall shorter duration versus the benchmark. The fund carried a yield advantage over the benchmark of 15 to 25 basis points during the past year. This yield advantage was a function of the fund having an overweight to corporate bonds and certain mortgage and asset-backed securities. The fund’s corporate and municipal bond positions outperformed the Bloomberg Barclay’s U.S. Corporate Index® by a significant amount over the one-year period. New issue participation, coupled with an overweight in triple-B rated corporate bonds, were both additive to performance. Finally, the fund had a lower duration during the one-year period as interest rates rose significantly. The ten-year Treasury yield rose roughly 55 basis points since October 2016. The fund’s duration was between 86% and 91% of the benchmark’s duration for a majority of the last year.
The largest detractor from performance was caused by the flattening of the yield curve. Over the past year, long-term interest rates increased less than short-term interest rates. The two-year Treasury rose 76 basis points during the last twelve months while the thirty-year Treasury only rose 30 basis points. The fund is underweight thirty-year bonds versus a slight overweight in two-year bonds, thus leading to a modest drag on performance.
Looking forward, the fund will continue to have a defensive posture with respect to duration. We continue to believe inflation pressures will build and, as the Federal Reserve gradually reduces its purchases of bonds, interest rates will rise further. Risks in the credit markets remain high given mergers and acquisitions and shareholder friendly activity. However, as long as foreign buying continues, the odds of significant underperformance in corporate bonds is low. Given this outlook, the fund will remain overweight corporate bonds but with an overall higher-quality bias than in past periods.
As of October 31, 2017, the fund had a yield to worst (i.e. lowest potential yield that can be received today into account prepayments, calls, etc.) of 2.71% with an effective duration of 5.33 years.
| PORTFOLIO ALLOCATION AS A PERCENTAGE OF NET ASSETS AS OF 10/31/17 | | | |
| |
| Asset Backed Securities | | 3.1 | % |
| Collateralized Mortgage Obligations | | 2.7 | % |
| Commercial Mortgage-Backed Securities | | 3.7 | % |
| Corporate Notes and Bonds | | 35.3 | % |
| Long Term Municipal Bonds | | 5.6 | % |
| Mortgage Backed Securities | | 21.3 | % |
| Money Market Funds | | 3.9 | % |
| U.S. Government and Agency Obligations | | 23.2 | % |
| Net Other Assets and Liabilities | | 1.2 | % |
| |
| | | | |
| TOP TEN HOLDINGS AS A PERCENTAGE OF NET ASSETS AS OF 10/31/17 | | | |
| |
| U.S. Treasury Note, 3.625%, 8/15/19 | | 2.1 | % |
| U.S. Treasury Note, 1.375%, 2/28/19 | | 1.9 | % |
| U.S. Treasury Note, 3.125%, 5/15/21 | | 1.9 | % |
| U.S. Treasury Note, 2.625%, 11/15/20 | | 1.7 | % |
| U.S. Treasury Bond, 4.500%, 5/15/38 | | 1.7 | % |
| U.S. Treasury Note, 3.875%, 5/15/18 | | 1.5 | % |
| U.S. Treasury Note, 2.125%, 3/31/24 | | 1.3 | % |
| U.S. Treasury Bond, 6.625%, 2/15/27 | | 1.3 | % |
| U.S. Treasury Note, 2.750%, 2/28/18 | | 1.2 | % |
| U.S. Treasury Note, 2.000%, 10/31/21 | | 1.2 | % |
| |
| MADISON CORPORATE BOND FUND |
| |
| INVESTMENT STRATEGY HIGHLIGHTS |
The Madison Corporate Bond Fund seeks to achieve its investment objective through diversified investment in a broad range of corporate debt securities. Under normal market conditions, the fund will invest at least 80% of its net assets in income-producing corporate bonds, and at least 80% of its assets in investment grade bonds. Up to 20% of the fund’s assets may be invested in non-investment grade fixed-income securities commonly referred to as “high yield” or “junk” bonds. The fund expects to maintain an average overall portfolio quality of BBB or better, an overall portfolio dollar weighted average maturity of 15 years or less, and an overall portfolio duration within 25% of the Bloomberg Barclays U.S. Corporate Bond Index benchmark (with the flexibility to occasionally vary from the benchmark by up to 50% when the investment adviser believes interest rates are likely to materially change).
Cumulative Performance of $10,000 Investment1
Madison Funds | Management’s Discussion of Fund Performance - Madison Corporate Bond Fund - continued | October 31, 2017
| | Average Annual Total Return through October 31, 20171 |
| | | | | | | | | | | | | | | | | | |
| | | | | % Return Without Sales Charge |
| | | | | |
| | | | | | 1 Year | | | | 3 Years | | | | 5 Years | | | | 10 Years |
| | |
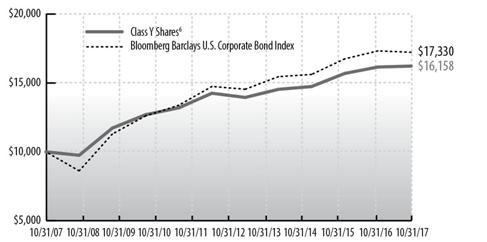
| | Class Y Shares6 | | | | 2.97 | | | | 3.59 | | | | 2.54 | | | | 4.92 |
| | |
| | Bloomberg Barclays U.S. Corporate Bond Index | | | | 3.46 | | | | 3.89 | | | | 3.28 | | | | 5.65 |
See accompanying Notes to Management’s Discussion of Fund Performance.
The Madison Corporate Bond Fund (Class Y) gained 2.97% for the year period, versus the Bloomberg Barclays U.S. Corporate Bond Index® which gained 3.46%. The fund lagged its peer group, the Morningstar Corporate Bond category, which posted a 3.48% gain.
Versus its benchmark, the fund benefited from being overweight Refiners and Master Limited Partnerships, both of which generated strong returns over the past year. The fund also benefited from owning high yield bonds, which significantly outperformed investment grade bonds during the period. The fund focused heavily on the new issue market where yield premiums were more attractive. Some of the bonds purchased on the new issue market during the past year that have performed well include Boardwalk Pipelines, CBOE Holdings, Air Lease, McDonald’s, EnLink Midstream, and Tyson Foods. The fund’s underweight to 30-year bonds detracted from performance, as longer-term bonds significantly outperformed intermediate-term bonds over the past year as the Treasury yield curve flattened. The fund’s underweight to Metal and Mining bonds also detracted from performance, as this sector performed very well with the recovery in related commodity prices. On a duration basis, the fund continues to have an underweight to the 30-year part of the yield curve as we believe overall yields and credit spreads on corporate bonds remain very low versus historical levels. Despite having a lower duration than the benchmark, the overall yield of the fund is very similar to the benchmark.
| PORTFOLIO ALLOCATION AS A PERCENTAGE OF NET ASSETS AS OF 10/31/17 | | | |
| |
| Consumer Discretionary | | 13.1 | % |
| Consumer Staples | | 1.7 | % |
| Energy | | 12.0 | % |
| Financials† | | 34.2 | % |
| Health Care | | 5.6 | % |
| Industrials | | 7.7 | % |
| Information Technology | | 7.5 | % |
| Long Term Municipal Bonds | | 2.0 | % |
| Materials | | 3.6 | % |
| Money Market Funds | | 2.5 | % |
| Real Estate | | 3.8 | % |
| Telecommunication Services | | 5.3 | % |
| Utilities | | 0.4 | % |
| Net Other Assets and Liabilities | | 0.6 | % |
| |
| †Financials includes securities in the following industries: Banks, Diversified Financial Services and Insurance. | | | |
| |
| TOP TEN HOLDINGS AS A PERCENTAGE OF NET ASSETS AS OF 10/31/17 |
| |
| Valero Energy Corp., 6.625%, 6/15/37 | | 2.1 | % |
| Comcast Corp., 6.450%, 3/15/37 | | 1.8 | % |
| Affiliated Managers Group Inc., 4.250%, 2/15/24 | | 1.4 | % |
| Huntington National Bank/The, 2.200%, 4/1/19 | | 1.4 | % |
| Packaging Corp. of America, 3.650%, 9/15/24 | | 1.4 | % |
| Prudential Financial Inc., 3.500%, 5/15/24 | | 1.4 | % |
| KeyCorp, 5.100%, 3/24/21 | | 1.3 | % |
| Marathon Petroleum Corp., 5.125%, 3/1/21 | | 1.2 | % |
| Regions Financial Corp., 3.200%, 2/8/21 | | 1.2 | % |
| PNC Bank NA, 2.450%, 7/28/22 | | 1.1 | % |
| |
| MADISON HIGH INCOME FUND |
| |
| INVESTMENT STRATEGY HIGHLIGHTS |
The Madison High Income Fund invests primarily in lower-rated, higher-yielding, income bearing securities, such as “junk” bonds. Because the performance of these securities has historically been strongly influenced by economic conditions, the fund may rotate securities selection by business sector according to economic outlook. Under normal market conditions, the fund invests at least 80% of its net assets in bonds rated lower than investment grade (BBB/Baa) and their unrated equivalents or other high-yielding securities.
Cumulative Performance of $10,000 Investment1
| | Average Annual Total Return through October 31, 20171 |
| | | | | | | | | | | | | | | | | | | | | | | | | | | | | | | | | | |
| | | | % Return Without Sales Charge | | % Return After Sales Charge5 |
| | | | | | |
| | | | 1 Year | | 3 Years | | 5 Years | | 10 Years | | 1 Year | | 3 Years | | 5 Years | | 10 Years |
| |
| | Class A Shares2 | | | 7.61 | | | | 3.98 | | | | 4.68 | | | | 5.85 | | | | 2.83 | | | | 2.39 | | | | 3.71 | | | | 5.37 | |
| |
| | Class B Shares3 | | | 6.92 | | | | 3.19 | | | | 3.92 | | | | 5.21 | | | | 2.42 | | | | 2.18 | | | | 3.62 | | | | 5.21 | |
| |
| | Class Y Shares6 | | | 8.06 | | | | 4.30 | | | | 5.03 | | | | 6.15 | | | | – | | | | – | | | | – | | | | – | |
| |
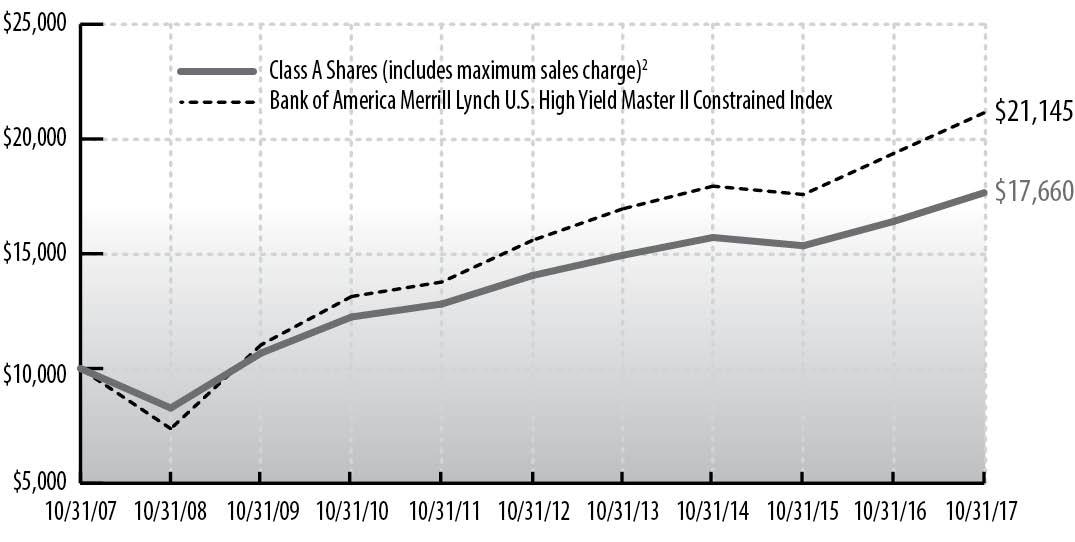
| | Bank of America Merrill Lynch U.S. High Yield Master II Constrained Index | | | 9.14 | | | | 5.62 | | | | 6.30 | | | | 7.78 | | | | NA | | | | NA | | | | NA | | | | NA | |
See accompanying Notes to Management’s Discussion of Fund Performance.
Madison High Income Fund (Class A at NAV) returned 7.61% over the twelve-month period, underperforming the Bank of America Merrill Lynch U.S. High Yield Master II Constrained Index benchmark return of 9.14%. The fund slightly underperformed the Morningstar High Yield Bond category peer group, which returned 7.94% over the same period.
The fund’s underperformance during the period can be largely attributed to maintaining an average cash balance above 6% over the past year as high yield bond spreads continued to tighten. This caused us to be more selective in our investment choices and resulted in the fund carrying a higher cash balance than normal as we patiently waited for attractive opportunities. The fund’s conservative positioning also led to an underweight in triple-C and below rated securities during a year when the lowest rated, most volatile sectors performed the best. Triple-C and below rated securities returned 14.62% during the trailing twelve months, outperforming the returns of the higher
quality B (+9.14%) and BB (+7.69%) categories. At the sector level, the fund had little exposure to the more volatile sectors of Steel (+11.93%), Metals & Mining (+11.48%) and Banks & Thrifts (+10.41%), all of which meaningfully outpaced the overall market. The fund also had an underweight in Energy (+10.69%) and Telecom (+9.97%), which both outperformed the benchmark return of 9.14%. Positive contributors to performance included an overweight in Services (+11.22%) and Utilities (+10.72%) and avoiding exposure to the significantly underperforming Food & Drug Retail sector (-3.46%). The fund currently has a yield-to-worst of 4.75% and an effective duration of 2.98 years. The average quality rating within the fund was B1 as of October 31, 2017.
In the present environment, we expect that the fund will remain conservatively positioned. Current high yield bond spreads are at cyclically tight levels and we see little upside potential remaining as many of the positives, both fundamental and economic, have been discounted in prevailing market prices. We expect total returns going forward to be largely driven by interest income.
Madison Funds | Management’s Discussion of Fund Performance - Madison High Income Fund - continued | October 31, 2017
| PORTFOLIO ALLOCATION AS A PERCENTAGE OF NET ASSETS AS OF 10/31/17 |
| |
| Bond Funds | | 1.1 | % |
| Consumer Discretionary | | 21.9 | % |
| Consumer Staples | | 8.3 | % |
| Energy | | 12.0 | % |
| Financials | | 11.2 | % |
| Health Care | | 5.7 | % |
| Industrials | | 12.1 | % |
| Information Technology | | 4.6 | % |
| Materials | | 3.3 | % |
| Money Market Funds | | 7.3 | % |
| Real Estate | | 1.5 | % |
| Telecommunication Services | | 4.1 | % |
| Utilities | | 4.8 | % |
| Net Other Assets and Liabilities | | 2.1 | % |
| |
| TOP TEN HOLDINGS AS A PERCENTAGE OF NET ASSETS AS OF 10/31/17 |
| |
| Donnelley Financial Solutions Inc., 8.250%, 10/15/24 | | 2.3 | % |
| Rayonier AM Products Inc., 5.500%, 6/1/24 | | 2.3 | % |
| Outfront Media Capital LLC / Outfront Media Capital Corp., 5.625%, 2/15/24 | | 2.2 | % |
| Unit Corp., 6.625%, 5/15/21 | | 2.2 | % |
| Scientific Games International Inc., 6.250%, 9/1/20 | | 2.1 | % |
| AES Corp., 5.500%, 3/15/24 | | 1.8 | % |
| Diebold Nixdorf Inc., 8.500%, 4/15/24 | | 1.8 | % |
| Jack Ohio Finance LLC / Jack Ohio Finance 1 Corp., 6.750%, 11/15/21 | | 1.8 | % |
| Murphy Oil USA Inc., 5.625%, 5/1/27 | | 1.8 | % |
| Alliance Data Systems Corp., 6.375%, 4/1/20 | | 1.7 | % |
| |
| MADISON DIVERSIFIED INCOME FUND |
| |
| INVESTMENT STRATEGY HIGHLIGHTS |
The Madison Diversified Income Fund seeks income by investing in a broadly diversified array of securities including bonds, common stocks, real estate securities, foreign market bonds and stocks and money market instruments. Bonds, stock and cash components will vary, reflecting the portfolio managers’ judgments of the relative availability of attractively yielding and priced stocks and bonds; however, under normal market conditions, the fund’s portfolio managers generally attempt to target a 40% bond and 60% stock investment allocation. Nevertheless, bonds may constitute up to 80% of the fund’s assets, stocks will constitute up to 70% of the fund’s assets, real estate securities will constitute up to 25% of the fund’s assets, foreign stocks and bonds will constitute up to 25% of the fund’s assets and money market instruments may constitute up to 25% of the fund’s assets. The fund intends to limit the investment in lower credit quality bonds to less than 50% of the fund’s assets.
Cumulative Performance of $10,000 Investment1
| Average Annual Total Return through October 31, 20171 |
| | | | | | | | | | | | | | | | | | | | | | | | | | | | | | | | | | | | | | | | | |
| | | % Return Without Sales Charge | | % Return After Sales Charge5 |
| | | | | |
| | | 1 Year | | 3 Years | | 5 Years | | 10 Years | | Since
7/31/12
Inception | | 1 Year | | 3 Years | | 5 Years | | 10 Years | | Since
7/31/12
Inception |
| |
| | | | | | | | | | | | | | | | | | | | | | | | | | | | | | | | | | | | | | | | | |
| Class A Shares2 | | | 12.57 | | | | 6.35 | | | | 7.97 | | | | 5.88 | | | | – | | | | 6.10 | | | | 4.27 | | | | 6.70 | | | | 5.25 | | | | – | |
| |
| Class B Shares3 | | | 11.79 | | | | 5.56 | | | | 7.18 | | | | 5.25 | | | | – | | | | 7.29 | | | | 4.51 | | | | 6.88 | | | | 5.25 | | | | – | |
| |
| Class C Shares4 | | | 11.72 | | | | 5.57 | | | | 7.17 | | | | – | | | | 7.00 | | | | 10.72 | | | | 5.57 | | | | 7.17 | | | | – | | | | 7.00 | |
| |
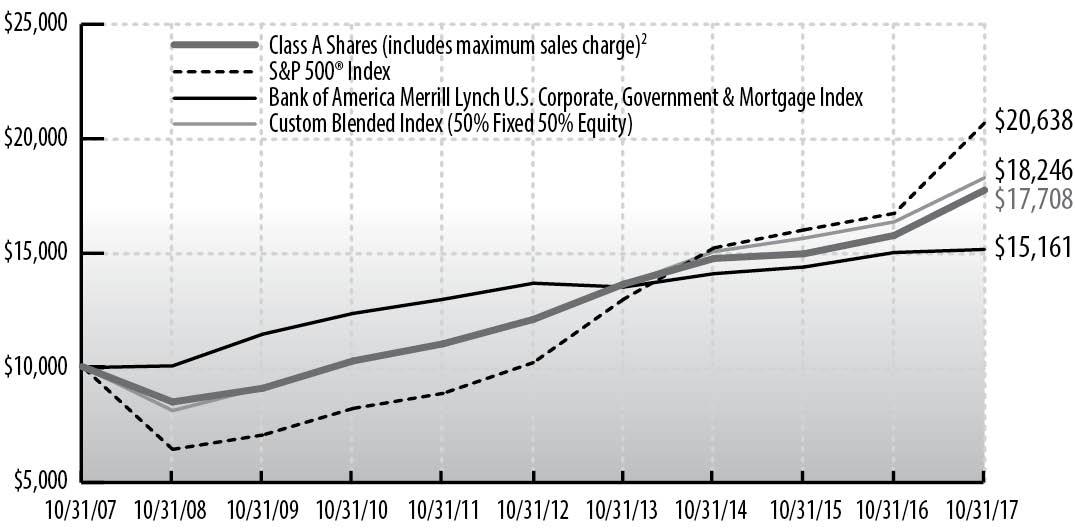
| Bank of America Merrill Lynch US Corp, Govt & Mortgage Index | | | 0.89 | | | | 2.44 | | | | 2.07 | | | | 4.25 | | | | 2.05 | | | | NA | | | | NA | | | | NA | | | | NA | | | | NA | |
| |
| S&P 500® Index | | | 23.63 | | | | 10.77 | | | | 15.18 | | | | 7.51 | | | | 15.04 | | | | NA | | | | NA | | | | NA | | | | NA | | | | NA | |
| |
| Custom Blended Index (50% Fixed 50% Equity) | | | 11.78 | | | | 6.69 | | | | 8.58 | | | | 6.20 | | | | 8.50 | | | | NA | | | | NA | | | | NA | | | | NA | | | | NA | |
See accompanying Notes to Management’s Discussion of Fund Performance.
The Madison Diversified Income Fund (Class A at NAV) returned 12.57% for the one-year period, beating its blended benchmark index (50% Bank of America Merrill Lynch U.S. Corporate, Government and Mortgage Index and 50% S&P 500® Index) which returned 11.78%. The fund lagged its Morningstar Moderate Allocation category peer group, which advanced 13.56% over the last year.
The equity portion of the Madison Diversified Income lagged the S&P 500 Index return modestly over the last twelve months as sector allocation and stock selection were modestly detractive. In terms of stock selection, there were positive results in Consumer Discretionary, Industrials, Consumer Staples and Utilities, while Health Care, Financials, Technology and Energy negatively impacted the portfolio. In Consumer Discretionary, global fast food restaurant company McDonald’s (MCD) contributed nicely to results. Within Industrials, aerospace and defense manufacturer Boeing (BA) was the best performing stock in the portfolio. Another notable outperforming stock was alcohol spirits manufacturer Diageo (DEO) in Consumer Staples. On the negative side, within Health Care, medical device manufacturer Medtronic (MDT) detracted from results. In Financials, property and casualty insurer The Travelers (TRV) negatively impacted performance. Another notable underperforming stock was global conglomerate General Electric (GE), which was the worst performing stock in the portfolio. The fund sold GE and continues to hold the other stocks discussed above.
The fixed income portion of the Madison Diversified Income Fund continued to perform well over the last year, modestly outpacing the Bank of America Merrill Lynch US Corporate, Government, and Mortgage Index. The fund’s ongoing overweight in credit versus the Index contributed meaningfully to performance during the period as credit spreads continued to tighten. Corporate bonds were again the best performing fixed income sector within the Index. Bond performance was also aided by the fund’s duration posture which was nearly 1 year shorter than the Index. This conservative duration positioning helped to protect principal during the last 12 months as ten-year U.S. Treasury rates rose from 1.82% (10/31/16) to 2.37% (10/31/17). The largest detractor from relative performance over the period was a significant flattening in the yield curve, as short rates rose more quickly than longer term rates. The fund’s conservative positioning resulted in a relative overweight in shorter maturities which acted as a drag on performance as short-term yields rose.
Through all of the factors influencing market direction, the Madison Diversified Income Fund remains well equipped to navigate a dynamic and changing investment landscape. The fund is heavily positioned in high-quality, large-cap and above-average dividend-yield stocks. In our view, high-quality, large-cap, “blue chip” stocks sold at high valuations in the year 2000, and have generally been out of favor and underperformed since then. Over the last decade, we believe they have reached attractive valuations and are poised to outperform going forward.
Madison Funds | Management’s Discussion of Fund Performance - Madison Diversified Income Fund - continued | October 31, 2017
The fund is also positioned with a conservative maturity posture and meaningful allocation to domestic credit sectors. Increased domestic growth potential, changing Fed policy and increasing inflation pressures will continue to challenge fixed income markets. The Madison Diversified Income Fund’s defensive approach to both interest rate risk and credit risk will help to protect client principal and provide the liquidity necessary to act opportunistically. Our belief that interest rates are headed higher appears more imminent now than at any time in recent memory.
| PORTFOLIO ALLOCATION AS A PERCENTAGE OF NET ASSETS AS OF 10/31/17 |
| |
| Asset Backed Securities | | 0.8 | % |
| Collateralized Mortgage Obligations | | 1.2 | % |
| Commercial Mortgage-Backed Securities | | 0.8 | % |
| Common Stocks | | 62.0 | % |
| Corporate Notes and Bonds | | 13.6 | % |
| Long Term Municipal Bonds | | 2.1 | % |
| Mortgage Backed Securities | | 8.3 | % |
| Money Market Funds | | 2.0 | % |
| U.S. Government and Agency Obligations | | 9.3 | % |
| Other Net Assets and Liabilities | | (0.1 | )% |
| |
| TOP TEN HOLDINGS AS A PERCENTAGE OF NET ASSETS AS OF 10/31/17 |
| |
| Microsoft Corp. | | 2.1 | % |
| Praxair Inc. | | 2.1 | % |
| US Bancorp | | 2.1 | % |
| Johnson & Johnson | | 2.0 | % |
| Cisco Systems Inc. | | 1.8 | % |
| CME Group Inc. | | 1.8 | % |
| PNC Financial Services Group Inc./The | | 1.8 | % |
| United Parcel Service Inc., Class B | | 1.8 | % |
| TE Connectivity Ltd. | | 1.7 | % |
| United Technologies Corp. | | 1.7 | % |
| |
| MADISON COVERED CALL & EQUITY INCOME FUND |
| |
| INVESTMENT STRATEGY HIGHLIGHTS |
The Madison Covered Call & Equity Income Fund invests, under normal market conditions, primarily in common stocks of large-and mid-capitalization companies that are, in the view of the fund’s investment adviser, selling at a reasonable price in relation to their long-term earnings growth rates. The portfolio managers will allocate the fund’s assets among stocks in sectors of the economy based upon their views on forward earnings growth rates, adjusted to reflect their views on economic and market conditions and sector risk factors.
The fund will seek to generate current earnings from option premiums by writing (selling) covered call options on a substantial portion of its portfolio securities. The extent of option writing activity will depend upon market conditions and the portfolio manager’s ongoing assessment of the attractiveness of writing call options on the fund’s stock holdings. In addition to providing income, covered call writing helps to reduce the volatility (and risk profile) of the fund by providing downside protection.
Cumulative Performance of $10,000 Investment1
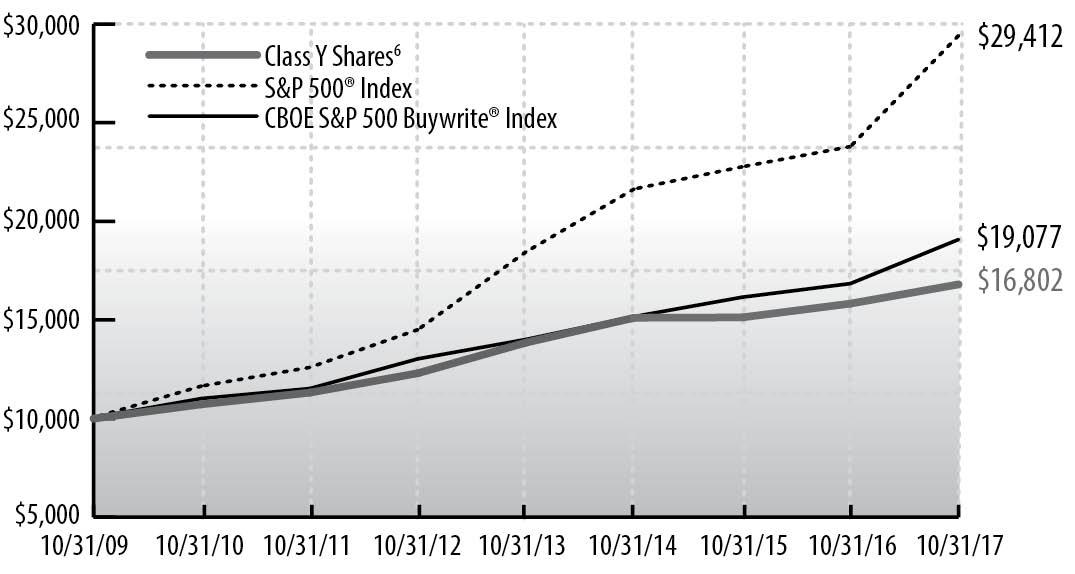
| | Average Annual Total Return through October 31, 20171 |
| | | | | | | | | | | | | | | | | | | | | | | | | | | | | | | | | | | | | | | | | | |
| | | | % Return Without Sales Charge | | % Return After Sales Charge5 |
| | | | | | |
| | | | 1 Year | | 3 Years | | 5 Years | | Since
10/30/09
Inception | | Since
7/31/12
Inception | | 1 Year | | 3 Years | | 5 Years | | Since
10/30/09
Inception | | Since
7/31/12
Inception |
| |
| | Class A Shares2 | | | 5.97 | | | | 3.32 | | | | 6.17 | | | | 6.46 | | | | – | | | | -0.17 | | | | 1.29 | | | | 4.91 | | | | 5.67 | | | | – | |
| |
| | Class C Shares4 | | | 5.09 | | | | 2.57 | | | | 5.37 | | | | – | | | | 5.67 | | | | 4.11 | | | | 2.57 | | | | 5.37 | | | | – | | | | 5.67 | |
| |
| | Class Y Shares6 | | | 6.15 | | | | 3.60 | | | | 6.44 | | | | 6.70 | | | | – | | | | – | | | | – | | | | – | | | | – | | | | – | |
| |
| | Class R6 Shares7 | | | 6.34 | | | | 3.73 | | | | 6.58 | | | | – | | | | 6.86 | | | | – | | | | – | | | | – | | | | – | | | | – | |
| |
| | S&P 500® Index | | | 23.63 | | | | 10.77 | | | | 15.18 | | | | 14.36 | | | | 15.04 | | | | NA | | | | NA | | | | NA | | | | NA | | | | NA | |
| |
| | CBOE S&P 500 BuyWrite® Index | | | 13.26 | | | | 7.93 | | | | 7.93 | | | | 8.33 | | | | 7.75 | | | | NA | | | | NA | | | | NA | | | | NA | | | | NA | |
See accompanying Notes to Management’s Discussion of Fund Performance.
Madison Covered Call & Equity Income Fund (Class Y) returned 6.15% for the one-year period, lagging the passive strategy of its covered call benchmark, the CBOE S&P 500 Buy/Write® Index (BXM), which returned 13.26%. The fund underperformed its Morningstar Option Writing category peer group, which returned 8.78% over the same period.
The past twelve months, particularly the period immediately following the Presidential election, was a very strong environment for equities with little or no downward pressure. This gave rise to historically low volatility and relatively poor option pricing which was not advantageous for call option writing. As the period closed, the S&P 500® has produced positive total returns in each of the past 12 months. The market has also set a record for the longest period without at least a 3% correction. All this while we are in the 9th consecutive year of a bull market. Global Central Banks have been providing the liquidity to keep riskier assets moving higher, but this may be about to change as the U.S. and European banks have suggested that a monetary tightening trend could replace the previous easy money period. The removal of accommodative policy should be cause for concern; however, there is a very high level of complacency amongst investors who believe markets can continue higher. We believe the rubber band has been stretched toward its breaking point and that it’s prudent to be wary of the current market levels. While the conservative and hedged nature of the fund naturally lags in a strongly up-trending market, we continue to believe that portfolio protection is prudent and increasingly imperative.
During the period, stock selection within the fund was weaker than hoped for as market performance was dominated by large technology and financial stock. Energy holdings, such as Apache and Range Resources, were among the weaker performers, as well as companies that were pressured by health care legislative uncertainty such as Express Scripts and McKesson. Weakness was somewhat offset by strength in NRG Energy, Marathon Petroleum, Baxter International and T-Mobile. From a sector allocation perspective, the fund’s general underweight in Technology stocks, particularly the FAANG (Facebook, Amazon, Apple, Netflix, Google) stocks, coupled with an overweight in the Energy sector, provided the bulk of the headwind. Given the consistent up trend of the market throughout the period, the call option overlay and the fund’s cash positioning were also detractive to performance. Despite the historically low volatility levels, the fund has continued to generate a very attractive yield which has fallen within our expected range.
Covered call writing, as a strategy, is designed to provide a level of protection from uncertain and volatile equity markets. We haven’t had such markets for quite some time but that should not, and has not, changed our focus on the strategy. “Throwing in the towel” and becoming more aggressive is counter to what the strategy is meant to accomplish. We remain steadfastly committed to maintaining a very high quality equity portfolio with a high level of call option coverage in order to stay true to the purpose and objectives of your fund.
Madison Funds | Management’s Discussion of Fund Performance - Madison Covered Call & Equity Income Fund - continued | October 31, 2017
| PORTFOLIO ALLOCATION AS A PERCENTAGE OF TOTAL INVESTMENTS AS OF 10/31/17 |
| |
| Consumer Discretionary | | 8.4 | % |
| Consumer Staples | | 5.7 | % |
| Energy | | 9.9 | % |
| Financials | | 6.5 | % |
| Health Care | | 9.1 | % |
| Industrials | | 8.3 | % |
| Information Technology | | 14.9 | % |
| Materials | | 3.5 | % |
| Real Estate | | 3.9 | % |
| Telecommunication Services | | 4.6 | % |
| Utilities | | 3.5 | % |
| Exchange Traded Funds | | 5.9 | % |
| U.S. Government and Agency Obligations | | 3.8 | % |
| Short-Term Investments | | 12.0 | % |
| |
| TOP TEN HOLDINGS AS A PERCENTAGE OF NET ASSETS AS OF 10/31/17 |
| |
| T-Mobile U.S. Inc. | | 4.7 | % |
| Weyerhaeuser Co. | | 3.9 | % |
| NRG Energy Inc. | | 3.5 | % |
| Lowe’s Cos. Inc. | | 3.1 | % |
| Textron Inc. | | 2.7 | % |
| Xilinx Inc. | | 2.6 | % |
| Apache Corp. | | 2.5 | % |
| Baxter International Inc. | | 2.5 | % |
| DowDuPont Inc. | | 2.5 | % |
| Gilead Sciences Inc. | | 2.4 | % |
| |
| MADISON DIVIDEND INCOME FUND |
| |
| INVESTMENT STRATEGY HIGHLIGHTS |
The Madison Dividend Income Fund invests in equity securities of companies with a market capitalization of over $1 billion and a history of paying dividends, with the ability to increase dividends over time. Under normal market conditions, at least 80% of the fund’s net assets will be invested in dividend paying equity securities. The fund typically owns 30-60 securities which generally have a dividend yield of at least the S&P 500’s average yield, a strong balance sheet, a dividend that has been maintained and likely to increase or trade on the high side of the company’s historical relative dividend yield, due to issues viewed by the adviser as temporary, among other characteristics. A key attraction for management is a company with a history of increasing dividend payments and a business model that supports the possibility of continuing these increases in the future.
Cumulative Performance of $10,000 Investment1
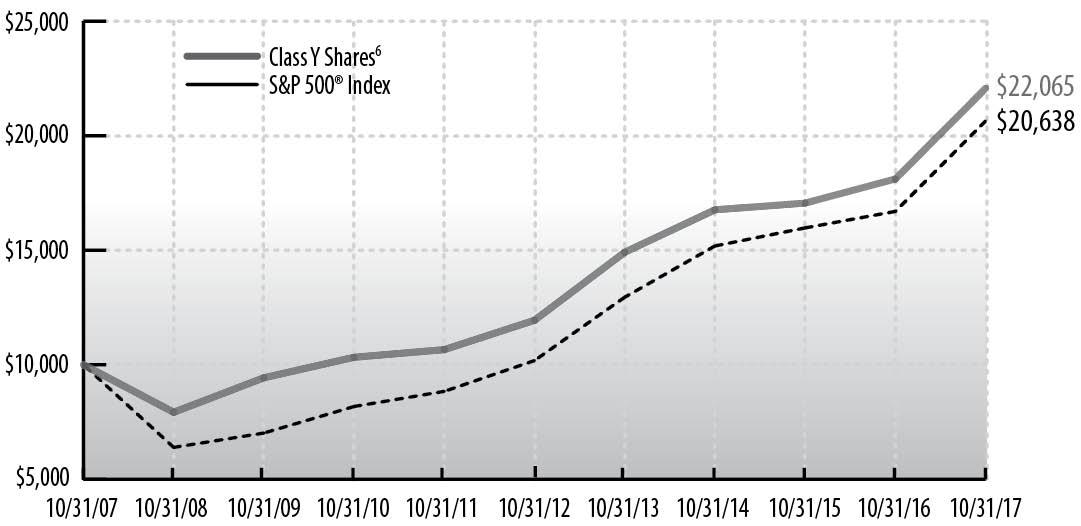
| | Average Annual Total Return through October 31, 20171 |
| | | | | | | | | | | | | | | | | | |
| | | | % Return Without Sales Charge |
| | | | |
| | | | 1 Year | | 3 Years | | 5 Years | | 10 Years |
| |
| | Class Y Shares6 | | | 21.85 | | | | 9.59 | | | | 13.07 | | | | 8.24 | |
| |
| | S&P 500® Index | | | 23.63 | | | | 10.77 | | | | 15.18 | | | | 7.51 | |
See accompanying Notes to Management’s Discussion of Fund Performance.
Madison Dividend Income Fund (Class Y) returned 21.85% for the annual period, lagging its benchmark S&P 500® Index, which advanced 23.63%. The fund outperformed its Morningstar Large Value category peer group, which returned 19.57% over the same period.
Relative to the benchmark, sector allocation and stock selection were modestly detractive. In terms of stock selection, there were positive results in Consumer Discretionary, Industrials, Consumer Staples and Utilities, while Health Care, Financials, Technology and Energy negatively impacted the portfolio. In Consumer Discretionary, global fast food restaurant company McDonald’s (MCD) contributed nicely to results. Within Industrials, aerospace and defense manufacturer Boeing (BA) was the best performing stock in the portfolio. Another notable outperforming stock was alcohol spirits manufacturer Diageo (DEO) in Consumer Staples. On the negative side, within Health Care, medical device manufacturer Medtronic (MDT) detracted from results. In Financials, property and casualty insurer The Travelers (TRV) negatively impacted performance. Another notable underperforming stock was global conglomerate General Electric (GE), which was the worst performing stock in the portfolio. The fund sold GE and continues to hold the other stocks discussed above.
| SECTOR ALLOCATION AS A PERCENTAGE OF NET ASSETS AS OF 10/31/17 |
| |
| Consumer Discretionary | | 6.0 | % |
| Consumer Staples | | 8.4 | % |
| Energy | | 6.8 | % |
| Financials | | 16.8 | % |
| Health Care | | 13.1 | % |
| Industrials | | 16.9 | % |
| Information Technology | | 19.1 | % |
| Materials | | 4.5 | % |
| Money Market Funds | | 1.5 | % |
| Telecommunication Services | | 2.3 | % |
| Utilities | | 4.6 | % |
| Net Other Assets and Liabilities | | – | |
| |
| TOP TEN HOLDINGS AS A PERCENTAGE OF NET ASSETS AS OF 10/31/17 |
| |
| Microsoft Corp. | | 3.3 | % |
| Praxair Inc. | | 3.3 | % |
| US Bancorp | | 3.3 | % |
| Johnson & Johnson | | 3.2 | % |
| PNC Financial Services Group Inc./The | | 2.9 | % |
| United Parcel Service Inc., Class B | | 2.9 | % |
| Cisco Systems Inc. | | 2.8 | % |
| CME Group Inc. | | 2.8 | % |
| Exxon Mobil Corp. | | 2.7 | % |
| TE Connectivity Ltd. | | 2.7 | % |
| |
| MADISON LARGE CAP VALUE FUND |
| |
| INVESTMENT STRATEGY HIGHLIGHTS |
The Madison Large Cap Value Fund will, under normal market conditions, invest primarily in large cap stocks. The fund follows a “value” approach, meaning the portfolio managers seek to invest in stocks at prices below their perceived intrinsic value as estimated based on fundamental analysis of the issuing company and its prospects. By investing in value stocks, the fund attempts to limit the downside risk over time but may also produce smaller gains than other stock funds if their intrinsic values are not realized by the market or if growth-oriented investments are favored by investors. The fund will diversify its holdings among various industries and among companies within those industries. The fund typically sells a stock when the fundamental expectations for buying it no longer apply, the price exceeds its intrinsic value or other stocks appear more attractively priced relative to their intrinsic values. The fund generally holds 25-60 individual securities in its portfolio at any given time.
Madison Funds | Management’s Discussion of Fund Performance - Madison Large Cap Value Fund - continued | October 31, 2017
Cumulative Performance of $10,000 Investment1
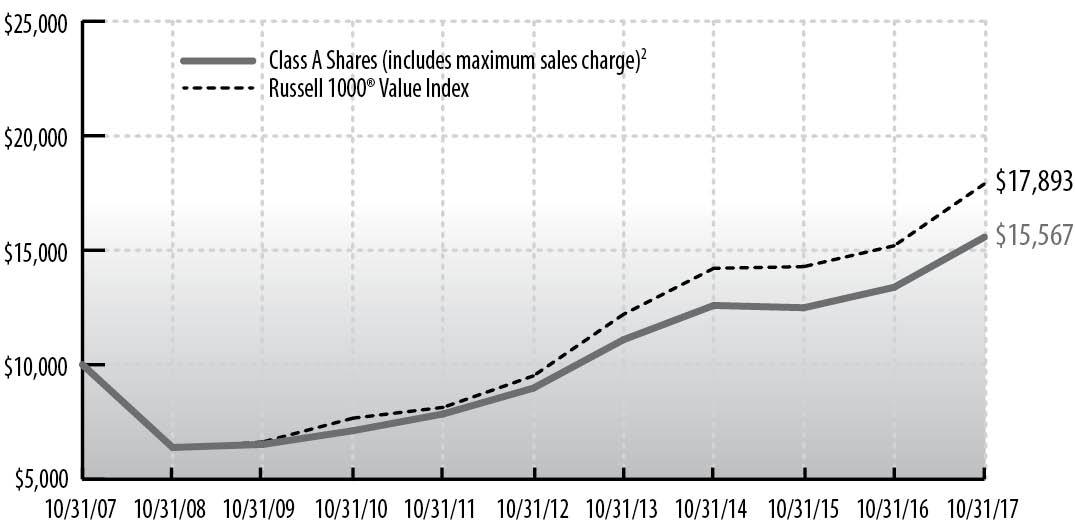
| | Average Annual Total Return through October 31, 20171 |
| | | | | | | | | | | | | | | | | | | | | | | | | | | | | | | | | |
| | | | % Return Without Sales Charge | | % Return After Sales Charge5 |
| | | | | | |
| | | | 1 Year | 3 Years | | 5 Years | | 10 Years | | 1 Year | | 3 Years | | 5 Years | | 10 Years |
| |
| | Class A Shares2 | | | 16.36 | | | 7.35 | | | | 11.64 | | | | 4.53 | | | | 9.69 | | | | 5.25 | | | | 10.34 | | | | 3.91 | |
| |
| | Class B Shares3 | | | 15.43 | | | 6.55 | | | | 10.82 | | | | 3.91 | | | | 10.93 | | | | 5.72 | | | | 10.55 | | | | 3.91 | |
| |
| | Class Y Shares6 | | | 16.60 | | | 7.62 | | | | 11.92 | | | | 4.79 | | | | – | | | | – | | | | – | | | | – | |
| |
| | Russell 1000® Value Index | | | 17.78 | | | 7.99 | | | | 13.48 | | | | 5.99 | | | | NA | | | | NA | | | | NA | | | | NA | |
See accompanying Notes to Management’s Discussion of Fund Performance.
Madison Large Cap Value Fund (Class A) returned 16.36% for the twelve-month period, underperforming its benchmark, the Russell 1000 Value® Index, which advanced 17.78%. The fund’s Morningstar Large Value category peer group returned 19.57% for the same period.
Relative to the benchmark, sector allocation was slightly detractive during the year while stock selection was additive. In terms of stock selection, there were positive results in Utilities, Telecommunications, Real Estate and Health Care, while Financials, Materials, Energy and Industrials negatively impacted the portfolio. In Utilities, independent power producer NRG Energy (NRG) was the best performing stock in the portfolio. Within Telecommunications, mobile phone operator T-Mobile (TMUS) contributed nicely to performance, while data center real estate investment trust (REIT) Digital Realty (DLR) was another notable outperforming stock in Real Estate. On the negative side, in Financials, insurance conglomerate American International Group (AIG) hurt results. Within Energy, exploration and production company Apache (APA) was the worst performing stock in the portfolio. Another notable underperforming stock was steel producer Nucor (NUE) in Materials. The fund sold APA, DLR and NUE and continues to hold the other stocks discussed above.
| SECTOR ALLOCATION AS A PERCENTAGE OF NET ASSETS AS OF 10/31/17 |
| |
| Consumer Discretionary | | 3.6 | % |
| Consumer Staples | | 2.2 | % |
| Energy | | 10.8 | % |
| Financials† | | 27.8 | % |
| Health Care | | 10.0 | % |
| Industrials | | 12.8 | % |
| Information Technology | | 8.6 | % |
| Materials | | 10.8 | % |
| Money Market Funds | | 1.5 | % |
| Real Estate | | 4.4 | % |
| Telecommunication Services | | 4.0 | % |
| Utilities | | 3.6 | % |
| Net Other Assets and Liabilities | | (0.1 | )% |
| |
| †Financials includes securities in the following industries: Capital Markets, Commercial Banks, Diversified Financial Services and Insurance. |
| |
| TOP TEN HOLDINGS AS A PERCENTAGE OF NET ASSETS AS OF 10/31/17 |
| |
| DowDuPont Inc. | | 5.4 | % |
| JPMorgan Chase & Co. | | 5.1 | % |
| Bank of America Corp. | | 5.0 | % |
| EOG Resources Inc. | | 4.8 | % |
| Bank of New York Mellon Corp./The | | 4.5 | % |
| TE Connectivity Ltd. | | 4.5 | % |
| Weyerhaeuser Co. | | 4.3 | % |
| Baxter International Inc. | | 4.2 | % |
| Humana Inc. | | 4.2 | % |
| T-Mobile U.S. Inc. | | 4.0 | % |
| |
| MADISON INVESTORS FUND |
| |
| INVESTMENT STRATEGY HIGHLIGHTS |
The Madison Investors Fund invests primarily in the common stocks of established, high-quality growth companies. The fund typically owns 25-40 securities which have demonstrated stable revenue and earnings growth patterns, high profitability metrics, and have maintained proportionately low levels of debt. A rigorous analytical process is followed when evaluating companies. The business model, the management team and the valuation of each potential investment are considered. Management strives to purchase securities trading at a discount to their intrinsic value as determined by discounted cash flows. Management corroborates this valuation work with additional valuation methodologies. The fund typically sells a stock when the valuation target the portfolio managers have set for the stock has been exceeded, the fundamental business prospects for the company have materially deteriorated, or the portfolio managers find a more attractive alternative.
Cumulative Performance of $10,000 Investment1
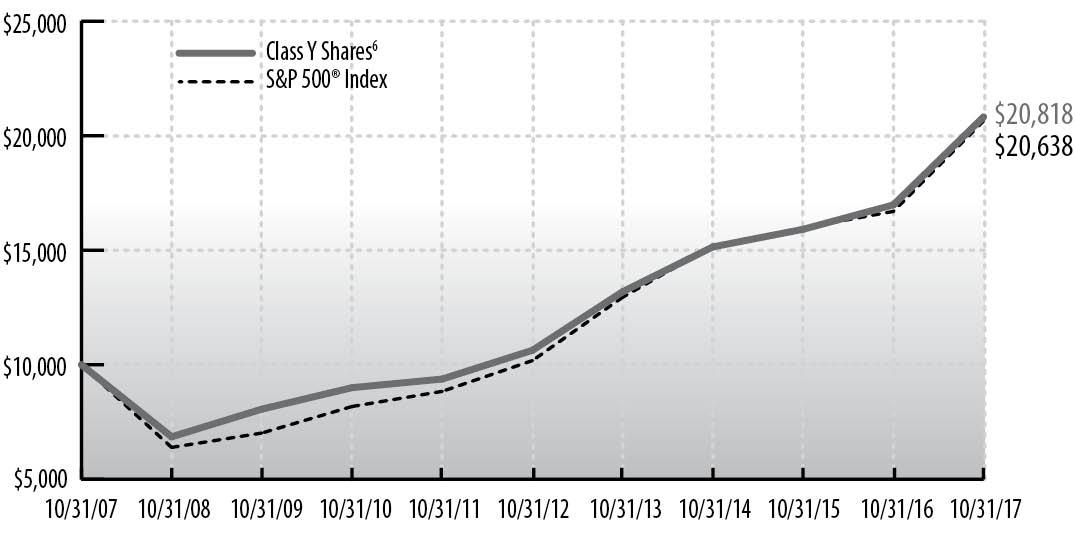
| | Average Annual Total Return through October 31, 20171 |
| | | | | | | | | | | | | | | | | | | | | | | | | | | | | | | | | | | | | | | | | | |
| | | | % Return Without Sales Charge | | % Return After Sales Charge5 |
| | | | | | |
| | | | 1 Year | | 3 Years | | 5 Years | | 10 Years | | Since
9/23/13
Inception | | 1 Year | | 3 Years | | 5 Years | | 10 Years | | Since
9/23/13
Inception |
| |
| | Class A Shares2 | | | 22.30 | | | | 10.91 | | | | – | | | | – | | | | 11.98 | | | | 15.29 | | | | 8.74 | | | | – | | | | – | | | | 10.38 | |
| |
| | Class Y Shares6 | | | 22.62 | | | | 11.19 | | | | 14.39 | | | | 7.61 | | | | – | | | | – | | | | – | | | | – | | | | – | | | | – | |
| |
| | Class R6 Shares7 | | | 22.87 | | | | 11.41 | | | | – | | | | – | | | | 12.51 | | | | – | | | | – | | | | – | | | | – | | | | – | |
| |
| | S&P 500® Index | | | 23.63 | | | | 10.77 | | | | 15.18 | | | | 7.51 | | | | 12.95 | | | | NA | | | | NA | | | | NA | | | | NA | | | | NA | |
See accompanying Notes to Management’s Discussion of Fund Performance.
The Madison Investors Fund (Class Y) returned 22.62% for the year ended 10/31/2017. The S&P 500® Index advanced 23.63% for the same period. The fund underperformed its Morningstar Large Growth peer group, which averaged 26.88%. In the prior year the fund outperformed the Morningstar Large Growth peer group.
The fund enjoyed good, broad-based relative performance from its holdings in the Energy, Materials, Industrials, and Consumer Staples sectors. The fund had softer relative performance in the Consumer Discretionary and Financials sectors, much of which is related to the market trends described below.
Madison Funds | Management’s Discussion of Fund Performance - Madison Investors Fund - continued | October 31, 2017
Over the past year, we’ve observed some notable trends that have impacted the performance of stocks. First, the stock market rally after the 2016 elections had a significant impact on stock returns, particularly in the Financials sector. The S&P 500®’s Financials sector posted a positive 37% return over the past year, the majority of which came in the two months following the 2016 elections. We believe the rally in bank and capital markets-related Financial stocks has been predicated, in part, on expectations for financial deregulation, rising interest rates, and tax reform. To date, we do not believe the actual changes in these fundamental factors have been as substantial as the increases in the Financials sector’s stock prices.
Another important trend impacting stocks has been rapidly changing consumer preferences enabled by advances in information and communications technologies. These changes in consumer preferences have manifested in some of the following trends: an increase in the proportion of goods purchased on-line versus at physical retail locations; a preference to consume entertainment by streaming content over mobile phones or internet connections; an increase in the proportion of advertising done via digital platforms – specifically Google or Facebook; and an increase in the substitution of private label consumer goods and smaller “challenger brands” for traditional consumer brands. These changes have been happening at a rate rapid enough that it has been disruptive to many businesses and they have certainly had an impact on stock prices. For example, S&P 500® stocks in the Multiline Retail industry, such as department stores and general merchandise chain stores, have collectively experienced negative returns over the past year. Likewise, Consumer Staples sector stocks have collectively posted meager 4% returns. These low returns contrast with those of the perceived disruptors: Information Technology sector stocks are up 39% and Internet & Direct Marketing Retail industry stocks are up 38%.
The Madison Investors Fund has navigated this disrupted landscape by strategically positioning the portfolio in several ways. First, where disruption exists, we’ve been very selective in the stocks we own. The fund’s retail holdings are niche retail operations that have strong barriers to competition. Second, we’ve directed a meaningful proportion of the portfolio’s weight away from disrupted industries. For example, our two stocks in the Materials sector, Praxair and PPG, are new to the fund within the past two years and now constitute around one-tenth of the portfolio. Their business models are distanced from consumer disruption. Third, we own stocks that are collateral disruptors. Examples include Accenture and Visa, both of which are information technology stocks that are benefitting from disruption trends. Finally, we’ve been opportunistic in buying stocks that we believe have become too cheap based on perceived disruption. New stock holdings in aftermarket auto parts distribution, dental and veterinary distribution and an advertising agency holding company embody this latter point.
The fund’s turnover was 33% over the past year which we believe has been productive since it related to improving the risk-reward proposition of the holdings and to strategically positioning the fund for the environment that exists today.
| SECTOR ALLOCATION AS A PERCENTAGE OF NET ASSETS AS OF 10/31/17 |
| |
| Consumer Discretionary | | 13.2 | % |
| Consumer Staples | | 5.5 | % |
| Financials | | 18.0 | % |
| Health Care | | 16.1 | % |
| Industrials | | 6.7 | % |
| Information Technology | | 20.5 | % |
| Materials | | 10.4 | % |
| Money Market Funds | | 4.3 | % |
| Real Estate | | 4.5 | % |
| Net Other Assets and Liabilities | | 0.8 | % |
| |
| TOP TEN HOLDINGS AS A PERCENTAGE OF NET ASSETS AS OF 10/31/17 |
| |
| Praxair Inc. | | 5.3 | % |
| PPG Industries Inc. | | 5.1 | % |
| Berkshire Hathaway Inc., Class B | | 5.0 | % |
| US Bancorp | | 4.6 | % |
| American Tower Corp. | | 4.5 | % |
| Oracle Corp. | | 4.4 | % |
| Accenture PLC, Class A | | 4.2 | % |
| Brookfield Asset Management Inc., Class A | | 4.1 | % |
| Danaher Corp. | | 4.1 | % |
| Jacobs Engineering Group Inc. | | 4.0 | % |
| |
| MADISON MID CAP FUND |
| |
| INVESTMENT STRATEGY HIGHLIGHTS |
The Madison Mid Cap Fund invests generally in common stocks, securities convertible into common stocks and related equity securities of midsize companies and will, under normal market conditions, maintain at least 80% of its net assets in such midcap securities. The fund seeks attractive long-term returns through bottom-up security selection based on fundamental analysis in a diversified portfolio of high-quality growth companies with attractive valuations. These will typically be industry leading companies in niches with strong growth prospects. The fund’s portfolio managers believe in selecting stocks for the fund that show steady, sustainable growth and reasonable valuation. The fund generally holds 25-40 individual securities in its portfolio at any given time. Stocks are generally sold when target prices are reached, company fundamentals deteriorate or more attractive stocks are identified.
Cumulative Performance of $10,000 Investment1
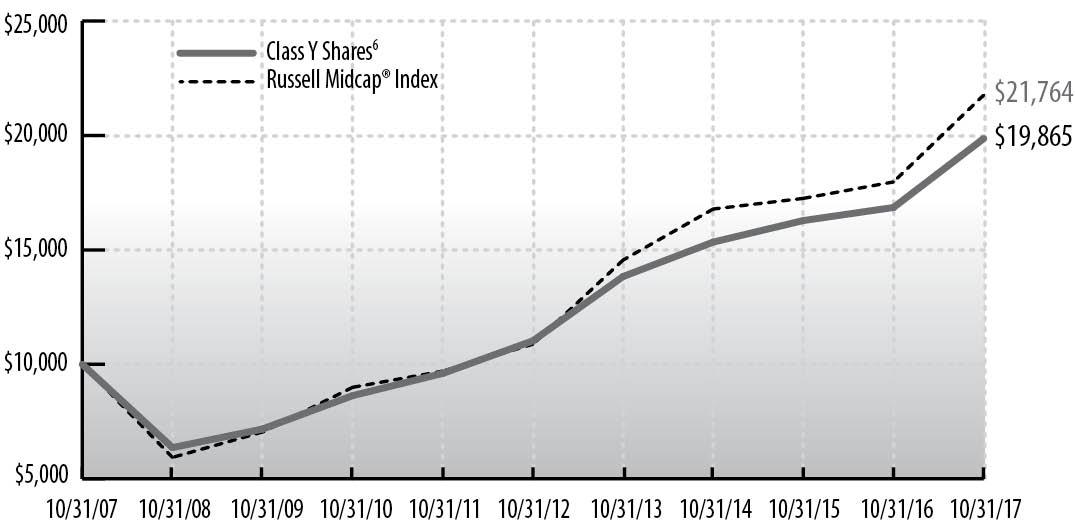
| | Average Annual Total Return through October 31, 20171 |
| | | | | | | | | | | | | | | | | | | | | | | | | | | | | | | | | | | | | | |
| | | | % Return Without Sales Charge | | % Return After Sales Charge5 |
| | | | | |
| | | | 1 Year | | 3 Years | | 5 Years | | 10 Years | | Since
2/29/12
Inception | | Since
4/19/13
Inception | | 1 Year | | 3 Years | | Since
4/19/13
Inception |
| |
| | Class A Shares2 | | | 17.40 | | | | 8.60 | | | | – | | | | – | | | | – | | | | 10.88 | | | | 10.63 | | | | 6.47 | | | | 9.45 | |
| |
| | Class B Shares3 | | | 16.46 | | | | 7.79 | | | | – | | | | – | | | | – | | | | 10.05 | | | | 11.96 | | | | 6.89 | | | | 9.74 | |
| |
| | Class Y Shares6 | | | 17.85 | | | | 8.99 | | | | 12.49 | | | | 7.10 | | | | – | | | | – | | | | – | | | | – | | | | – | |
| |
| | Class R6 Shares7 | | | 18.17 | | | | 9.34 | | | | 12.88 | | | | – | | | | 12.20 | | | | – | | | | – | | | | – | | | | – | |
| |
| | Russell Midcap® Index | | | 21.09 | | | | 9.04 | | | | 14.87 | | | | 8.09 | | | | 13.43 | | | | 12.92 | | | | NA | | | | NA | | | | NA | |
See accompanying Notes to Management’s Discussion of Fund Performance.
The Madison Mid Cap Fund (Class Y) returned 17.85% for the annual period, trailing its benchmark Russell Midcap® Index return of 21.09%. The fund underperformed its peer group, the Morningstar Mid-Cap Growth category, which returned 26.20% for the same period.
Both sector allocation and stock selection were unfavorable over the past twelve months. We were underweight in the three weakest sectors of the benchmark – Energy, Consumer Staples, and Real Estate – but we were also heavily underweight in Information Technology, the best performing sector. The fund was materially overweight in Consumer Discretionary, which lagged the broader benchmark. Our
Madison Funds | Management’s Discussion of Fund Performance - Madison Mid Cap Fund - continued | October 31, 2017
top three individual contributors were CDW, CarMax, and Copart. Our bottom three contributors were Sally Beauty, Omnicom, and World Fuel Services.
CDW is a value-added distributor selling hardware, software and services from thousands of vendors. The company is benefitting from growth in overall Information Technology spending. CarMax is a used car retailer that continues to take market share year after year. Copart is an auctioneer of salvaged cars. While it benefits Copart’s business, the skyrocketing use of mobile phones while driving has, sadly, increased the supply of totaled cars that flow through Copart’s lots.
Omnicom is an advertising agency that is experiencing a slowdown in ad spending from global consumer firms that have historically been bedrocks of agency business. The valuation of the stock more than reflects the slowdown. Sally Beauty and World Fuel Services reported disappointing results for an extended period of time, and both stocks are no longer held in the fund.
| SECTOR ALLOCATION AS A PERCENTAGE OF NET ASSETS AS OF 10/31/17 |
| |
| Consumer Discretionary | | 21.2 | % |
| Consumer Staples | | 1.4 | % |
| Energy | | 0.9 | % |
| Financials | | 22.1 | % |
| Health Care | | 12.6 | % |
| Industrials | | 15.9 | % |
| Information Technology | | 6.6 | % |
| Materials | | 7.2 | % |
| Money Market Funds | | 7.3 | % |
| Real Estate | | 5.0 | % |
| Net Other Assets and Liabilities | | (0.2 | )% |
| |
| TOP TEN HOLDINGS AS A PERCENTAGE OF NET ASSETS AS OF 10/31/17 |
| |
| Markel Corp. | | 5.1 | % |
| CDW Corp. | | 4.5 | % |
| Copart Inc. | | 4.5 | % |
| Ross Stores Inc. | | 4.4 | % |
| Brookfield Asset Management Inc., Class A | | 4.2 | % |
| Axalta Coating Systems Ltd. | | 4.1 | % |
| CarMax Inc. | | 3.9 | % |
| Brown & Brown Inc. | | 3.8 | % |
| Expeditors International of Washington Inc. | | 3.5 | % |
| Laboratory Corp. of America Holdings | | 3.5 | % |
| |
| MADISON SMALL CAP FUND |
| |
| INVESTMENT STRATEGY HIGHLIGHTS |
The Madison Small Cap Fund invests primarily in a diversified mix of common stocks of small cap U.S. companies that are believed to be undervalued by various measures and offer sound prospects for capital appreciation. Under normal market conditions, the fund will maintain at least 80% of its net assets in such small cap securities. The portfolio managers employ a value-oriented investment approach in selecting stocks, using proprietary fundamental research to identify securities of companies they believe have attractive valuations. The portfolio managers focus on companies with a record of above average rates of profitability that sell at a discount relative to the overall small cap market. Through fundamental research, the portfolio managers seek to identify those companies which possess one or more of the following characteristics: sustainable competitive advantages within a market niche; strong profitability and free cash flows; strong market share positions and trends; quality of and share ownership by management; and financial structures that are more conservative than the relevant industry average. Under normal circumstances, the fund will generally hold 60-90 individual securities in its portfolio at any given time.
Cumulative Performance of $10,000 Investment1
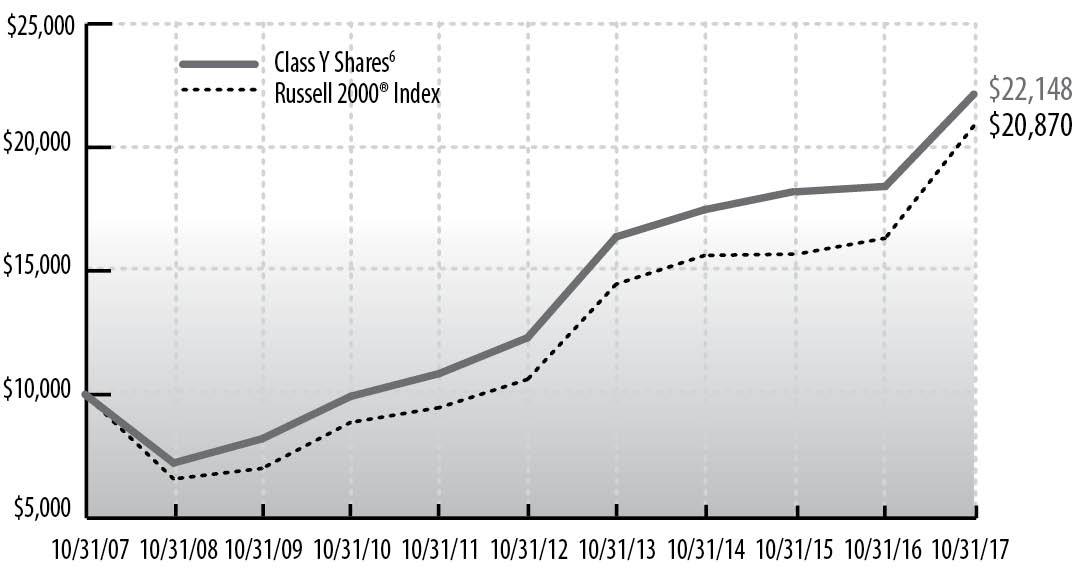
| | Average Annual Total Return through October 31, 20171 |
| | | | | | | | | | | | | | | | | | | | | | | | | | | | | | | | | | |
| | | | % Return Without Sales Charge | | % Return After Sales Charge5 |
| | | | | | |
| | | | 1 Year | | 3 Years | | 5 Years | | 10 Years | | 1 Year | | 3 Years | | 5 Years | | 10 Years |
| |
| | Class A Shares2 | | | 19.94 | | | | 7.97 | | | | 12.22 | | | | 8.01 | | | | 13.04 | | | | 5.85 | | | | 10.90 | | | | 7.37 | |
| |
| | Class B Shares3 | | | 19.06 | | | | 7.15 | | | | 11.39 | | | | 7.42 | | | | 14.56 | | | | 6.12 | | | | 11.13 | | | | 7.42 | |
| |
| | Class Y Shares6 | | | 20.25 | | | | 8.22 | | | | 12.49 | | | | 8.28 | | | | – | | | | – | | | | – | | | | – | |
| |
| | Russell 2000® Index | | | 27.85 | | | | 10.12 | | | | 14.49 | | | | 7.63 | | | | – | | | | – | | | | – | | | | – | |
| |
| | Russell 2000® Value Index | | | 24.81 | | | | 9.67 | | | | 13.58 | | | | 7.04 | | | | NA | | | | NA | | | | NA | | | | NA | |
See accompanying Notes to Management’s Discussion of Fund Performance.
The Madison Small Cap Fund (Class Y) returned 20.25% for the twelve-month period, trailing the returns of both the Russell 2000® Index, 27.85%, and the Russell 2000 Value® Index, 24.81%. The fund also lagged its Morningstar Small Blend category peer group, which returned 24.81% over the period.
Security selection was the primary source of underperformance relative to the Russell 2000® Index during the period as weak selection in the Industrials, Consumer Discretionary, and Real Estate sectors more than offset positive stock selection within Financials, Energy, and Utilities. Sector allocation, a residual of the bottom-up stock selection process, detracted modestly from relative results during the period, driven by our underweight to Health Care and Information Technology, and our overweight to the Energy sector. Fractional cash balance was a drag on performance during this period of strongly positive absolute returns.
The fund’s top detractors from relative performance during the period included Smart & Final Stores, a chain of warehouse-style food and supply stores; Babcock & Wilcox, a supplier of energy and environmental technologies and services to the power generation and industrial markets; and Cato Corporation, a women’s clothing retailer. We eliminated our position in Babcock & Wilcox during the period after the company announced large additional losses and the shares experienced a significant decline. The losses necessitated a refinancing of the balance sheet on what we believed were unfavorable terms and we determined that our original thesis was violated. The fund’s top contributors to relative performance during the period included Kemper, a multi-line insurer; Deltic Timber, a natural resources company; and Cranswick, a leading UK food producer and supplier of premium food products.
The fund’s investment approach emphasizes individual stock selection; sector weights are a residual of the bottom-up investment process. The fund manager does, however, carefully consider diversification across economic sectors seeking to limit risk. During the period we initiated new positions in Orion Engineered Carbon (Materials), Resolute Energy (Energy), Banc of California (Financials), and Tri Pointe Group (Consumer Discretionary), among others. We eliminated our positions in Webster Financial (Financials), G & K Services (Industrials), Charles River Labs (Health Care), and WGL Holdings (Utilities), among others during the period. As of the end of the period, the fund was most overweight in the Industrials and Materials sectors, and most underweight in Consumer Discretionary and Health Care relative to the Russell 2000® Index. Based on our long-term time horizon, we continue to
Madison Funds | Management’s Discussion of Fund Performance - Madison Small Cap Fund - continued | October 31, 2017
find opportunities created by the inefficiencies frequently found among small cap companies.
| SECTOR ALLOCATION AS A PERCENTAGE OF NET ASSETS AS OF 10/31/17 |
| |
| Consumer Discretionary | | 3.3 | % |
| Consumer Staples | | 3.6 | % |
| Energy | | 4.3 | % |
| Financials | | 21.8 | % |
| Health Care | | 6.6 | % |
| Industrials† | | 34.4 | % |
| Information Technology | | 7.9 | % |
| Materials | | 8.7 | % |
| Money Market Funds | | 1.8 | % |
| Real Estate | | 6.1 | % |
| Utilities | | 1.6 | % |
| Net Other Assets and Liabilities | | (0.1 | )% |
| |
| †Industrials includes securities in the following industries: Aerospace & Defense; Air Freight & Logistics; Building Products; Commercial Services & Supplies; Construction & Engineering; Electrical Equipment; Machinery; Professional Services and Trading Companies & Distributors. | | |
| |
| TOP TEN HOLDINGS AS A PERCENTAGE OF NET ASSETS AS OF 10/31/17 |
| |
| Belden Inc. | | 3.1 | % |
| Mueller Industries Inc. | | 2.9 | % |
| Hancock Holding Co. | | 2.5 | % |
| TriMas Corp. | | 2.5 | % |
| Cubic Corp. | | 2.4 | % |
| First Midwest Bancorp Inc. | | 2.4 | % |
| Albany International Corp. | | 2.3 | % |
| MB Financial Inc. | | 2.2 | % |
| Sensient Technologies Corp. | | 2.2 | % |
| Northwest Bancshares Inc. | | 2.1 | % |
| |
| MADISON INTERNATIONAL STOCK FUND |
| |
| INVESTMENT STRATEGY HIGHLIGHTS |
The Madison International Stock Fund will invest, under normal market conditions, at least 80% of its net assets in the stock of foreign companies. Typically, a majority of the fund’s assets are invested in relatively large capitalization stocks of companies located or operating in developed countries. The fund may also invest up to 30% of its assets in securities of companies whose principal business activities are located in emerging market countries. The portfolio managers typically maintain this segment of the fund’s portfolio in such stocks which they believe have a low market price relative to their perceived value based on fundamental analysis of the issuing company and its prospects. The fund may also invest in foreign debt and other income bearing securities at times when the portfolio managers believe that income bearing securities have greater capital appreciation potential than equity securities. The fund usually holds securities of issuers located in at least three countries other than the U.S. and generally holds 60-80 individual securities in its portfolio at any given time.
Cumulative Performance of $10,000 Investment1
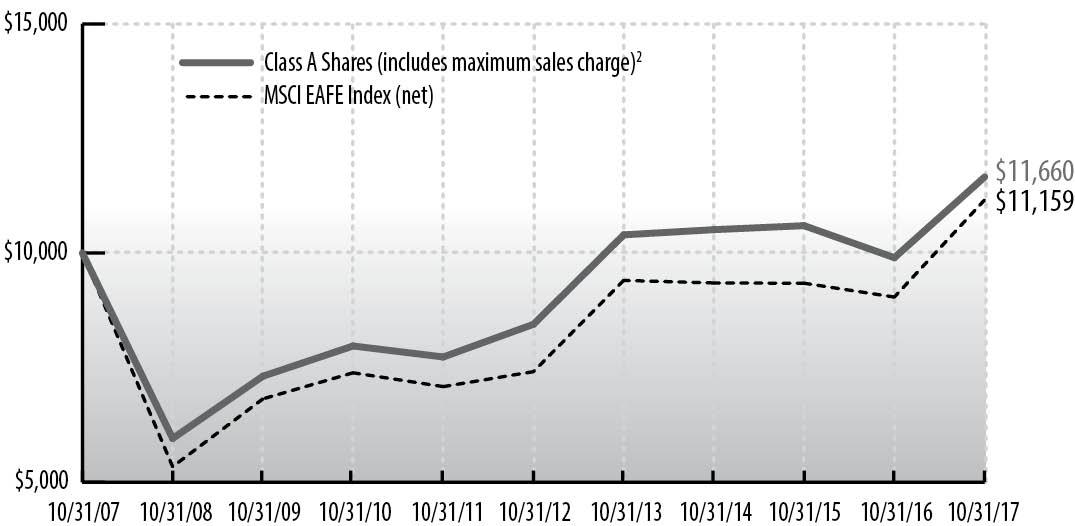
| | Average Annual Total Return through October 31, 20171 |
| |
| | | | % Return Without Sales Charge | | % Return After Sales Charge5 |
| | | | | | |
| | | | 1 Year | | 3 Years | | 5 Years | | 10 Years | | 1 Year | | 3 Years | | 5 Years | | 10 Years |
| |
| | Class A Shares2 | | | 17.79 | | | | 3.52 | | | | 6.66 | | | | 1.55 | | | | 11.05 | | | | 1.48 | | | | 5.41 | | | | 0.95 | |
| |
| | Class B Shares3 | | | 16.89 | | | | 2.74 | | | | 5.87 | | | | 0.94 | | | | 12.39 | | | | 1.62 | | | | 5.55 | | | | 0.94 | |
| |
| | Class Y Shares6 | | | 18.18 | | | | 3.80 | | | | 6.93 | | | | 1.80 | | | | – | | | | – | | | | – | | | | – | |
| |
| | MSCI EAFE Index (net) | | | 23.44 | | | | 6.08 | | | | 8.53 | | | | 1.10 | | | | NA | | | | NA | | | | NA | | | | NA | |
See accompanying Notes to Management’s Discussion of Fund Performance.
The Madison International Stock Fund (Class A at NAV) returned 17.79% for the twelve-month period, lagging the 23.44% return of its benchmark MSCI EAFE Index (net). The fund also lagged the Morningstar Foreign Large Blend category peer group’s return of 22.70% over the same span.
International equity markets rose strongly during the period and were driven by growing investor focus on fundamentals, including rising corporate profits, as well as continued global economic health. International equities mostly benefited in this environment, reaching or approaching all-time highs, yet with valuations still below those of the U.S. market. The economic expansion, which began almost a year ago off a very low base, has become increasingly synchronized across global economies.
Over the past year, the Madison International Stock Fund showed strong absolute returns but lagged the MSCI EAFE benchmark. Much of the underperformance stemmed from the early part of the 12-month period when low-quality stocks rallied strongly. Given that the relative value philosophy focuses on stocks with high-quality businesses at inexpensive prices, the fund was exposed to the parts of the market that rallied most strongly during that period. Since late in the first quarter, however, investors have focused more on quality and the widening gaps between stock prices and the earnings of some companies. Since the end of the first quarter, higher-quality stocks have begun to gradually rebound after a challenging period dominated by low-quality companies.
Stock selection in the Health Care sector has been a source of portfolio underperformance, especially the global specialty pharmaceutical manufacturer, Shire PLC. Despite consistently strong fundamentals and an attractive valuation, Shire’s stock price has struggled due to investor concerns over debt levels, its hemophilia franchise and most recently the departure of its CFO. Attractively valued with significant free cash flow growth expected through the rest of 2017 and 2018 (which will be used to de-lever the balance sheet), the portfolio managers (“managers”) continue to believe Shire’s prospects are very compelling. Another underperformer during the twelve month period was Teva Pharmaceutical. The global generic pharmaceutical manufacturer declined through the second half of 2016 and into 2017 due to political attention on drug pricing and concern about the level of competition facing one of its most important drugs. The managers’ thesis was invalidated when a key member of management departed, which negatively impacted their view of management. They subsequently sold the stock in January and the stock has fallen substantially since the sale. Cash was also a modest drag on relative performance over the past 12 months.
In Japan, a lower than benchmark weight helped relative returns. The fund remains underweight Japan, where the managers have found it difficult to find companies with impressive ROE’s whose valuations are attractive. Among the holdings the fund owns in Japan that the managers consider to represent good relative value investments, Daiwa House outperformed the market. Daiwa House designs and builds residential homes and commercial buildings in Japan. Their core businesses of rental apartment construction and logistics development are long-term areas of growth within a challenged Japanese economy. Stock selection in the Industrials sector was also a positive driver of relative returns. Shares of Vinci, a French toll-road, airport operator and infrastructure company continued higher on robust growth in air traffic while the company’s contracting/construction business also saw revenues rise. Additionally, shares of Irish discount airline Ryanair rose on good results and on the announcement of a new stock buyback program. Shares of
Madison Funds | Management’s Discussion of Fund Performance - Madison International Stock Fund - continued | October 31, 2017
British companies exposed to US construction and infrastructure spending, such as Ferguson, a distributor of heating and plumbing products, rallied on the back of the Trump presidential election. Many of the fund’s other UK holdings also outperformed the market. The fund remains overweight the United Kingdom, where it owns many high-quality global businesses.
Outlook
Global economic growth has improved over the past year, albeit off low levels, enabling strong corporate profit growth outside of the United States. Market sentiment has continued to rise above already high levels, and markets are near or past their historic highs – despite valuation, geo-political and credit risks. Optimistic economic growth expectations are already reflected in low-quality stock prices and the market appears to be complacent.
The pace of fundamental improvement has accelerated outside the United States, a function of the pickup in global economic growth, more opportunity for margin improvement and cheaper currencies. Additionally, after several years of stronger economic growth, higher corporate profits and U.S. dollar strength, U.S. equites reflect higher expectations and carry higher valuations than international equities.
The portfolio managers believe the fund is well positioned for this market environment. With consistently high financial productivity driven by barriers to entry and sustainable competitive advantages, the companies the fund owns are poised to benefit from the turn back towards corporate fundamentals. Overall, management remains confident that, by continuing to focus on stock selection and seeking stocks with sustainably high or improving returns trading at attractive valuations, the fund’s strong long-term track record can continue.
| GEOGRAPHICAL ALLOCATION AS A PERCENTAGE OF NET ASSETS AS OF 10/31/17 |
| |
| United Kingdom | | 21.7 | % |
| Japan | | 17.8 | % |
| France | | 10.8 | % |
| Canada | | 4.7 | % |
| Jersey | | 4.5 | % |
| Germany | | 4.3 | % |
| Switzerland | | 4.2 | % |
| Sweden | | 3.6 | % |
| Ireland | | 3.2 | % |
| United States | | 3.0 | % |
| Netherlands | | 2.9 | % |
| Norway | | 2.9 | % |
| Belgium | | 2.7 | % |
| Denmark | | 2.7 | % |
| Singapore | | 2.3 | % |
| Taiwan | | 1.6 | % |
| Finland | | 1.5 | % |
| Spain | | 1.4 | % |
| Italy | | 1.0 | % |
| Brazil | | 0.9 | % |
| Australia | | 0.7 | % |
| Turkey | | 0.7 | % |
| Luxembourg | | 0.6 | % |
| Net Other Assets and Liabilities | | 0.3 | % |
| |
| SECTOR ALLOCATION AS A PERCENTAGE OF NET ASSETS AS OF 10/31/17 |
| |
| Consumer Discretionary | | 14.9 | % |
| Consumer Staples | | 11.5 | % |
| Energy | | 7.0 | % |
| Financials | | 18.6 | % |
| Health Care | | 7.1 | % |
| Industrials | | 16.3 | % |
| Information Technology | | 6.8 | % |
| Materials | | 5.2 | % |
| Money Market Funds | | 3.0 | % |
| Reall Estate | | 3.0 | % |
| Telecommunication Services | | 5.1 | % |
| Utilities | | 1.2 | % |
| Net Other Assets and Liabilities | | 0.3 | % |
| |
| TOP TEN HOLDINGS AS A PERCENTAGE OF NET ASSETS AS OF 10/31/17 |
| |
| Prudential PLC | | 3.5 | % |
| Daiwa House Industry Co. Ltd. | | 3.0 | % |
| Novartis AG | | 2.9 | % |
| British American Tobacco PLC | | 2.8 | % |
| Royal Dutch Shell PLC | | 2.8 | % |
| SAP SE | | 2.7 | % |
| Vinci S.A. | | 2.5 | % |
| Capgemini SE | | 2.4 | % |
| BHP Billiton PLC | | 2.3 | % |
| Don Quijote Holdings Co. Ltd. | | 2.2 | % |
| |
Madison Funds | Management’s Discussion of Fund Performance - concluded | October 31, 2017
| |
| Notes to Management’s Discussion of Fund Performance |
| NA Not Applicable. Index returns do not reflect sales charges, fees or expenses. |
| 1 | | Fund returns are calculated after fund expenses have been subtracted and assume that dividends and capital gains are reinvested in additional shares of the fund. Returns do not reflect the deduction of taxes that a shareholder would pay on fund distributions or the redemption of fund shares. Investment return and principal value will fluctuate, so an investor’s shares, when redeemed, may be worth more or less than original cost. Further information relating to the fund’s performance is contained in the prospectus and elsewhere in this report. The fund’s past performance is not indicative of future performance. Current performance may be lower or higher than the performance data cited. For fund performance data current to the most recent month-end, please call 1-800-877-6089 or visit www.madisonfunds.com. Indices are unmanaged and investors cannot invest in them directly. Index returns do not reflect fees or expenses. |
| |
| 2 | | Maximum sales charge is 5.75% for class A shares for the Conservative, Moderate and Aggressive Allocation Funds and the Diversified Income, Equity Income, Large Cap Value, Investors, Mid Cap, Small Cap and International Stock Funds. The maximum sales charge is 4.50% for the Core Bond and High Income Fund class A shares. |
| |
| 3 | | Maximum contingent deferred sales charge (CDSC) is 4.50% for class B shares, which is reduced after 12 months and eliminated after six years. |
| |
| 4 | | Maximum contingent deferred sales charge (CDSC) is 1% for class C shares, which is eliminated after one year. |
| |
| 5 | | Assumes maximum applicable sales charge. |
| |
| 6 | | Class Y Shares are only available for purchase by Madison Funds and other affiliated asset allocation funds, in managed account programs, and to certain other investors as described in the current prospectus. |
| |
| 7 | | Class R6 shares are generally only available for purchase by retirement plan investors and certain other institutional investors. |
BENCHMARK DESCRIPTIONS
Allocation Fund Indexes*
The Conservative Allocation Fund Custom Index consists of 65% Bloomberg Barclays US Aggregate Bond Index, 24.5% Russell 3000® Index and 10.5% MSCI ACWI ex-US Index. See market index descriptions below.
The Moderate Allocation Fund Custom Index consists of 42% Russell 3000® Index, 40% Bloomberg Barclays US Aggregate Bond Index and 18% MSCI ACWI ex-US Index. See market index descriptions below.
The Aggressive Allocation Fund Custom Index consists of 56% Russell 3000® Index, 24% MSCI ACWI ex-US Index and 20% Bloomberg Barclays US Aggregate Bond Index. See market index descriptions below.
Hybrid Fund Indexes*
The Custom Blended Index consists of 50% S&P 500® Index and 50% Bank of America Merrill Lynch U.S. Corporate, Government & Mortgage Index. See market index descriptions below.
Market Indexes
The CBOE S&P 500 BuyWrite® IndexSM (BXM) is a benchmark index designed to track the performance of a hypothetical buy-write strategy (i.e. holding a long position in and selling covered call options on that position) on the S&P 500® Index.
The Bank of America Merrill Lynch 1-22 year Municipal Index tracks the performance of U.S. dollar denominated investment grade tax-exempt debt publicly issued by U.S. states and territories, their political subdivisions, in the U.S. domestic market, with a remaining term to final maturity less than 22 years.
The Bank of America Merrill Lynch U.S. Corporate, Government & Mortgage Index is a broad-based measure of the total rate of return performance of the U.S. investment-grade bond markets. The index is a capitalization-weighted aggregation of outstanding U.S. treasury, agency and supranational mortgage pass-through, and investment-grade corporate bonds meeting specified selection criteria.
The Bank of America Merrill Lynch U.S. High Yield Master II Constrained Index tracks the performance of below investment grade U.S. dollar denominated corporate bonds publicly issued in the U.S. domestic market, but limits any individual issuer to a maximum weighting of 2%.
The Bloomberg Barclays U.S. Corporate Bond Index measures the investment grade, fixed-rate, taxable corporate bond market. It includes USD denominated securities publicly issued by U.S. financial issuers.
The Bloomberg Barclays U.S. Aggregate Bond Index is a broad-based flagship benchmark that measures the investment grade, U.S. dollar-denominated, fixed-rate taxable bond market. The index includes Treasuries, government-related and corporate securities, mortgage backed-securities, asset-backed securities and corporate securities, with maturities greater than one year.
The Bloomberg Barclays U.S. Intermediate Government Credit A+ Bond Index measures the performance of U.S. dollar denominated U.S. Treasuries, government related and investment grade U.S. corporate securities with quality ratings of A3/A- or better and maturities between one and 10 years.
THE MSCI ACWI ex-U.S. Index is a market-capitalization-weighted index maintained by Morgan Stanley Capital International (MSCI) and designed to provide a broad measure of stock performance throughout the world, with the exception of U.S.-based companies. The Index includes both developed and emerging markets.
The MSCI EAFE (Europe, Australasia & Far East) Index is a free-float adjusted market capitalization index that is designed to measure developed market equity performance, excluding the U.S. and Canada. The MSCI EAFE Index (net) is calculated on a total return basis with dividends reinvested after the deduction of withholding taxes.
The Russell 1000® Value Index is a large-cap market index which measures the performance of those Russell 1000 companies with lower price-to-book ratios and lower forecasted growth values.
The Russell 2000® Index is a small-cap market index which measures the performance of the smallest 2,000 companies in the Russell 3000® Index.
The Russell 2000® Value Index measures the performance of the small-cap value segment of the U.S. equity universe. It includes those Russell 2000® Index companies with lower price-to-book ratios and lower forecasted growth values.
The Russell 3000® Index measures the performance of the 3,000 largest U.S. companies based on total market capitalization, which represents 98% of the investable U.S. equity market.
The Russell Midcap® Index is a mid-cap market index which measures the performance of the mid-cap segment of the U.S. equity universe.
The S&P 500® Index is a large-cap market index which measures the performance of a representative sample of 500 leading companies in leading industries in the U.S.
*The Custom Indexes are calculated using a monthly re-balancing frequency (i.e., rebalanced back to original constituent weight every calendar month-end).
© 2017 Morningstar, Inc. All rights reserved. The information contained herein: (1) is proprietary to Morningstar and/or its content providers; (2) may not be copied or distributed; and (3) is not warranted to be accurate, complete, or timely. Neither Morningstar nor its content providers are responsible for any damages or losses arising from any use of this information.
Russell Investment Group is the source and owner of the trademarks, service marks and copyrights related to the Russell Indexes. Russell® is a trademark of Russell Investment Group.
Past performance is no guarantee of future results.
Madison Funds | October 31, 2017
| |
| Madison Conservative Allocation Fund Portfolio of Investments |
| | | Shares | | Value (Note 2) | |
| | | | | | |
| INVESTMENT COMPANIES - 100.0% | | | | | | |
| | | | | | | |
| Alternative Funds - 2.0% | | | | | | |
| SPDR Gold Shares* | | 12,179 | | $ | 1,469,640 | |
| | | | | | |
| | | | | | | |
| Bond Funds - 59.1% | | | | | | |
| Baird Aggregate Bond Fund Institutional Shares | | 389,731 | | | 4,244,174 | |
| iShares 20+ Year Treasury Bond ETF | | 17,821 | | | 2,218,002 | |
| iShares 7-10 Year Treasury Bond ETF | | 54,453 | | | 5,780,730 | |
| iShares TIPS Bond Fund ETF | | 6,264 | | | 712,843 | |
| Madison Core Bond Fund Class Y (A) | | 1,515,887 | | | 15,143,715 | |
| Madison Corporate Bond Fund Class Y (A) | | 446,801 | | | 5,205,227 | |
| Metropolitan West Total Return Bond Fund Class I | | 229,305 | | | 2,444,387 | |
| Vanguard Short-Term Corporate Bond ETF | | 28,110 | | | 2,249,924 | |
| Virtus Seix Floating Rate High Income Fund, Class R6 | | 663,062 | | | 5,795,162 | |
| | | | | | |
| | | | | | 43,794,164 | |
| | | | | | | |
| Foreign Stock Funds - 13.7% | | | | | | |
| iShares MSCI Eurozone ETF | | 41,048 | | | 1,799,134 | |
| Vanguard FTSE All-World ex-U.S. ETF | | 106,967 | | | 5,748,406 | |
| Vanguard FTSE Emerging Markets ETF | | 16,673 | | | 744,116 | |
| Vanguard FTSE Europe ETF | | 22,883 | | | 1,340,944 | |
| WisdomTree Japan Hedged Equity Fund | | 9,567 | | | 555,556 | |
| | | | | | |
| | | | | | 10,188,156 | |
| Money Market Funds - 2.1% | | | | | | |
| State Street Institutional U.S. Government Money Market Fund, 0.96%, Premier Class | | 1,560,349 | | | 1,560,349 | |
| | | | | | |
| | | | | | | |
| Stock Funds - 23.1% | | | | | | |
| Energy Select Sector SPDR Fund | | 5,487 | | | 372,622 | |
| iShares Core S&P Mid-Cap ETF | | 10,708 | | | 1,959,136 | |
| Madison Dividend Income Fund Class Y (A) | | 160,581 | | | 4,204,015 | |
| Madison Investors Fund Class Y (A) | | 180,655 | | | 4,207,450 | |
| Madison Mid Cap Fund Class Y (A) | | 122,137 | | | 1,192,059 | |
| PowerShares Optimum Yield Diversified Commodity Strategy No. K-1 Portfolio | | 88,866 | | | 1,551,600 | |
| Vanguard Financials ETF | | 1,678 | | | 112,460 | |
| Vanguard Growth ETF | | 18,313 | | | 2,501,372 | |
| Vanguard Information Technology ETF | | 1,298 | | | 211,872 | |
| Vanguard Value ETF | | 7,757 | | | 788,499 | |
| | | | | | |
| | | | | | 17,101,085 | |
| | | | | | |
| | | | | | | |
| TOTAL INVESTMENTS - 100.0% | | | | | | |
| (Cost $70,038,719**) | | | | | 74,113,394 | |
| NET OTHER ASSETS AND LIABILITIES - (0.0)% | | | | | (29,091 | ) |
| | | | | | |
| TOTAL NET ASSETS - 100.0% | | | | $ | 74,084,303 | |
| | | | | | |
| * | | Non-income producing. |
| ** | | Aggregate cost for Federal tax purposes was $70,205,833. |
| (A) | | Affiliated Company (see Note 12). |
| ETF | | Exchange Traded Fund. |
| |
| Madison Moderate Allocation Fund Portfolio of Investments |
| | | Shares | | Value (Note 2) | |
| | | | | | |
| INVESTMENT COMPANIES - 100.0% | | | | | | |
| | | | | | | |
| Alternative Funds - 1.9% | | | | | | |
| SPDR Gold Shares* | | 24,033 | | $ | 2,900,062 | |
| | | | | | |
| | | | | | | |
| Bond Funds - 33.9% | | | | | | |
| Baird Aggregate Bond Fund Institutional Shares | | 598,547 | | | 6,518,179 | |
| iShares 20+ Year Treasury Bond ETF | | 35,666 | | | 4,438,990 | |
| iShares 7-10 Year Treasury Bond ETF | | 68,093 | | | 7,228,753 | |
| iShares Intermediate Credit Bond ETF | | 32,483 | | | 3,570,531 | |
| iShares TIPS Bond Fund ETF | | 6,202 | | | 705,788 | |
| Madison Core Bond Fund Class Y (A) | | 2,172,663 | | | 21,704,905 | |
| Virtus Seix Floating Rate High Income Fund, Class R6 | | 695,405 | | | 6,077,842 | |
| | | | | | |
| | | | | | 50,244,988 | |
| | | | | | | |
| Foreign Stock Funds - 23.8% | | | | | | |
| iShares MSCI Eurozone ETF | | 125,434 | | | 5,497,772 | |
| Vanguard FTSE All-World ex-U.S. ETF | | 345,771 | | | 18,581,734 | |
| Vanguard FTSE Emerging Markets ETF | | 66,712 | | | 2,977,357 | |
| Vanguard FTSE Europe ETF | | 97,044 | | | 5,686,778 | |
| WisdomTree Japan Hedged Equity Fund | | 44,727 | | | 2,597,297 | |
| | | | | | |
| | | | | | 35,340,938 | |
| Money Market Funds - 2.4% | | | | | | |
| State Street Institutional U.S. Government Money Market Fund, 0.96%, Premier Class | | 3,578,577 | | | 3,578,577 | |
| | | | | | |
| | | | | | | |
| Stock Funds - 38.0% | | | | | | |
| Energy Select Sector SPDR Fund | | 16,881 | | | 1,146,388 | |
| iShares Core S&P Mid-Cap ETF | | 33,903 | | | 6,202,893 | |
| Madison Dividend Income Fund Class Y (A) | | 593,542 | | | 15,538,922 | |
| Madison Investors Fund Class Y (A) | | 667,952 | | | 15,556,600 | |
| Madison Large Cap Value Fund Class Y (A) | | 121,435 | | | 1,885,886 | |
| Madison Mid Cap Fund Class Y (A) | | 316,754 | | | 3,091,522 | |
| PowerShares Optimum Yield Diversified Commodity Strategy No. K-1 Portfolio | | 177,789 | | | 3,104,196 | |
| Vanguard Financials ETF | | 5,606 | | | 375,714 | |
| Vanguard Growth ETF | | 54,361 | | | 7,425,169 | |
| Vanguard Information Technology ETF | | 7,673 | | | 1,252,464 | |
| Vanguard Value ETF | | 7,229 | | | 734,828 | |
| | | | | | |
| | | | | | 56,314,582 | |
| | | | | | |
| TOTAL INVESTMENTS - 100.0% | | | | | | |
| (Cost $132,105,377**) | | | | | 148,379,147 | |
| NET OTHER ASSETS AND LIABILITIES - (0.0)% | | | | | (67,220 | ) |
| | | | | | |
| TOTAL NET ASSETS - 100.0% | | | | $ | 148,311,927 | |
| | | | | | |
| * | | Non-income producing. |
| ** | | Aggregate cost for Federal tax purposes was $132,490,384. |
| (A) | | Affiliated Company (see Note 12). |
| ETF | | Exchange Traded Fund. |
| |
| Madison Aggressive Allocation Fund Portfolio of Investments |
| | | Shares | | Value (Note 2) | |
| | | | | | |
| INVESTMENT COMPANIES - 100.6% | | | | | | |
| | | | | | | |
| Alternative Funds - 1.9% | | | | | | |
| SPDR Gold Shares* | | 10,413 | | $ | 1,256,537 | |
| | | | | | |
| | | | | | | |
| Bond Funds - 14.1% | | | | | | |
| iShares 20+ Year Treasury Bond ETF | | 9,212 | | | 1,146,525 | |
| iShares 7-10 Year Treasury Bond ETF | | 13,890 | | | 1,474,562 | |
| iShares Intermediate Credit Bond ETF | | 8,442 | | | 927,945 | |
| Madison Core Bond Fund Class Y (A) | | 566,515 | | | 5,659,490 | |
| | | | | | |
| | | | | | 9,208,522 | |
| | | | | | | |
| Foreign Stock Funds - 31.4% | | | | | | |
| iShares MSCI Eurozone ETF | | 70,167 | | | 3,075,420 | |
| Vanguard FTSE All-World ex-U.S. ETF | | 189,141 | | | 10,164,437 | |
| Vanguard FTSE Emerging Markets ETF | | 43,923 | | | 1,960,284 | |
| Vanguard FTSE Europe ETF | | 61,532 | | | 3,605,775 | |
| WisdomTree Japan Hedged Equity Fund | | 31,033 | | | 1,802,086 | |
| | | | | | |
| | | | | | 20,608,002 | |
| | | | | | | |
| Money Market Funds - 3.1% | | | | | | |
| State Street Institutional U.S. Government Money Market Fund, 0.96%, Premier Class | | 2,005,534 | | | 2,005,534 | |
| | | | | | |
| | | | | | | |
| Stock Funds - 50.1% | | | | | | |
| Energy Select Sector SPDR Fund | | 9,801 | | | 665,586 | |
| iShares Core S&P Mid-Cap ETF | | 22,002 | | | 4,025,486 | |
| Madison Dividend Income Fund Class Y (A) | | 317,846 | | | 8,321,210 | |
| Madison Investors Fund Class Y (A) | | 357,698 | | | 8,330,792 | |
| Madison Large Cap Value Fund Class Y (A) | | 93,456 | | | 1,451,371 | |
| Madison Mid Cap Fund Class Y (A) | | 220,388 | | | 2,150,983 | |
| PowerShares Optimum Yield Diversified Commodity Strategy No. K-1 Portfolio | | 78,038 | | | 1,362,543 | |
| Vanguard Financials ETF | | 4,927 | | | 330,208 | |
| Vanguard Growth ETF | | 35,523 | | | 4,852,087 | |
| Vanguard Information Technology ETF | | 5,400 | | | 881,442 | |
| Vanguard Value ETF | | 4,713 | | | 479,076 | |
| | | | | | |
| | | | | | 32,850,784 | |
| | | | | | |
| TOTAL INVESTMENTS - 100.6% | | | | | | |
| (Cost $56,365,932**) | | | | | 65,929,379 | |
| NET OTHER ASSETS AND LIABILITIES - (0.6%) | | | | | (375,680 | ) |
| | | | | | |
| TOTAL NET ASSETS - 100.0% | | | | $ | 65,553,699 | |
| | | | | | |
| * | | Non-income producing. |
| ** | | Aggregate cost for Federal tax purposes was $56,421,288. |
| (A) | | Affiliated Company (see Note 12). |
| ETF | | Exchange Traded Fund. |
| See accompanying Notes to Financial Statements. |
| |
| |
| 20 |
Madison Funds | October 31, 2017
| |
| Madison Government Money Market Fund Portfolio of Investments |
| | | Par Value | | Value (Note 2) | |
| | | | | |
| U.S. GOVERNMENT AND AGENCY OBLIGATIONS - 97.1% | | | | | | |
| | | | | | | |
| Fannie Mae - 17.1% | | | | | | |
| 0.964%, 11/2/17 (A) | $ | 500,000 | | $ | 499,987 | |
| 1.048%, 11/8/17 (A) | | 600,000 | | | 599,880 | |
| 1.012%, 11/15/17 (A) | | 900,000 | | | 899,651 | |
| 0.956%, 12/20/17 (A) | | 600,000 | | | 599,232 | |
| | | | | | |
| | | | | | 2,598,750 | |
| | | | | | | |
| Federal Home Loan Bank - 42.1% | | | | | | |
| 1.069%, 11/2/17 (A) | | 550,000 | | | 549,984 | |
| 1.057%, 11/15/17 (A) | | 200,000 | | | 199,919 | |
| 1.047%, 11/17/17 (A) | | 600,000 | | | 599,725 | |
| 1.047%, 11/29/17 (A) | | 500,000 | | | 499,600 | |
| 1.057%, 12/1/17 (A) | | 800,000 | | | 799,307 | |
| 1.057%, 12/6/17 (A) | | 700,000 | | | 699,292 | |
| 1.037%, 12/7/17 (A) | | 500,000 | | | 499,490 | |
| 1.057%, 12/22/17 (A) | | 300,000 | | | 299,558 | |
| 1.083%, 12/29/17 (A) | | 1,000,000 | | | 998,284 | |
| 1.089%, 1/2/18 (A) | | 600,000 | | | 598,894 | |
| 1.078%, 1/5/18 (A) | | 200,000 | | | 199,617 | |
| 1.149%, 1/24/18 (A) | | 450,000 | | | 448,814 | |
| | | | | | |
| | | | | | 6,392,484 | |
| | | | | | | |
| Freddie Mac - 26.5% | | | | | | |
| 1.094%, 11/1/17 | | 100,000 | | | 100,000 | |
| 1.021%, 11/21/17 (A) | | 1,000,000 | | | 999,442 | |
| 1.021%, 12/1/17 (A) | | 400,000 | | | 399,665 | |
| 1.042%, 12/11/17 (A) | | 425,000 | | | 424,516 | |
| 1.043%, 12/14/17 (A) | | 500,000 | | | 499,388 | |
| 1.083%, 1/9/18 (A) | | 200,000 | | | 199,592 | |
| 1.098%, 1/16/18 (A) | | 1,000,000 | | | 997,720 | |
| 1.134%, 2/13/18 (A) | | 400,000 | | | 398,711 | |
| | | | | | |
| | | | | | 4,019,034 | |
| | | | | | | |
| U.S. Treasury Notes - 11.4% | | | | | | |
| 2.250%, 11/30/17 | | 300,000 | | | 300,300 | |
| 1.000%, 12/15/17 (A) | | 400,000 | | | 399,995 | |
| 2.750%, 12/31/17 | | 800,000 | | | 802,214 | |
| 0.875%, 1/31/18 (A) | | 225,000 | | | 224,874 | |
| | | | | | |
| | | | | | 1,727,383 | |
| | | | | | |
| Total U.S. Government and Agency Obligations ( Cost $14,737,651 ) | | | | | 14,737,651 | |
| | | | | | | |
| INVESTMENT COMPANIES - 3.1% | | | | | | |
| State Street Institutional U.S. Government Money Market Fund, 0.96%, Premier Class | | 471,917 | | | 471,917 | |
| | | | | | |
Total Investment Companies | | | | | | |
(Cost $471,917) | | | | | 471,917 | |
| | | | | | |
| TOTAL INVESTMENTS - 100.2% | | | | | | |
| (Cost $15,209,568**) | | | | | 15,209,568 | |
| NET OTHER ASSETS AND LIABILITIES - (0.2%) | | | | | (23,089 | ) |
| | | | | | |
| TOTAL NET ASSETS - 100.0% | | | | $ | 15,186,479 | |
| | | | | | |
| ** | | Aggregate cost for Federal tax purposes was $15,209,568. |
| (A) | | Rate noted represents annualized yield at time of purchase. |
| |
| Madison Tax-Free Virginia Fund Portfolio of Investments |
| | | Par Value | | Value (Note 2) | |
| | | | | |
| MUNICIPAL BONDS - 97.7% | | | | | | |
| | | | | | | |
| Development - 4.2% | | | | | | |
| Fairfax County Economic Development Authority, Series A, 5%, 10/1/26 | $ | 150,000 | | $ | 180,747 | |
| Norfolk Economic Development Authority, 5%, 11/1/29 | | 480,000 | | | 537,187 | |
| Virginia Housing Development Authority, Series C, 1.5%, 4/1/19 | | 200,000 | | | 200,608 | |
| | | | | | |
| | | | | | 918,542 | |
| | | | | | | |
| Education - 13.6% | | | | | | |
| Henrico County Economic Development Authority, 4%, 4/15/42 | | 220,000 | | | 224,224 | |
| University of Virginia, (Prerefunded 6/1/18 @ $100), 5%, 6/1/40 | | 255,000 | | | 260,661 | |
| Virginia College Building Authority, Series E, 5%, 2/1/23 | | 500,000 | | | 585,495 | |
| Virginia College Building Authority, (Prerefunded 9/1/18 @ $100), (ST APPROP), 5%, 9/1/26 | | 140,000 | | | 144,523 | |
| Virginia College Building Authority, Series A, (Prerefunded 2/1/19 @ $100), 5%, 2/1/29 | | 375,000 | | | 393,203 | |
| Virginia Commonwealth University, Series A, 5%, 5/1/26 | | 385,000 | | | 442,681 | |
| Virginia Public School Authority, 5%, 12/1/18 | | 100,000 | | | 104,232 | |
| Virginia Public School Authority, Series A, (Prerefunded 8/1/18 @ $100), (ST APPROP), 5%, 8/1/27 | | 350,000 | | | 360,203 | |
| Virginia Public School Authority, Series C, (ST AID WITHHLDG), 3%, 8/1/33 | | 450,000 | | | 449,428 | |
| | | | | | |
| | | | | | 2,964,650 | |
| | | | | | | |
| Facilities - 4.0% | | | | | | |
| New River Valley Regional Jail Authority, 5%, 10/1/25 | | 100,000 | | | 121,366 | |
| Stafford County & Staunton Industrial Development Authority, Series B, (NATL-RE), 4.5%, 8/1/25 | | 35,000 | | | 35,059 | |
| Virginia Public Building Authority, Series B, (Prerefunded 8/1/18 @ $100), 5.25%, 8/1/23 | | 200,000 | | | 206,202 | |
| Western Regional Jail Authority, 3.125%, 12/1/29 | | 500,000 | | | 513,860 | |
| | | | | | |
| | | | | | 876,487 | |
| | | | | | | |
| General - 12.0% | | | | | | |
| Fairfax County Economic Development Authority, 4.25%, 8/1/29 | | 340,000 | | | 364,494 | |
| Loudoun County Economic Development Authority Revenue, 3%, 12/1/29 | | 535,000 | | | 546,187 | |
| Northern Virginia Transportation Authority, 5%, 6/1/30 | | 780,000 | | | 920,961 | |
| Puerto Rico Public Finance Corp, Series E, (Escrowed To Maturity) (AMBAC) *, 5.5%, 8/1/27 | | 100,000 | | | 124,045 | |
| Territory of Guam, Series A, 5%, 1/1/26 | | 150,000 | | | 161,524 | |
| Virgin Islands Public Finance Authority, (NATL-RE), 5%, 10/1/23 | | 100,000 | | | 100,154 | |
| Virginia Beach Development Authority, Series A, 3.5%, 5/1/30 | | 250,000 | | | 265,215 | |
| Virginia Resources Authority, Series C, 4%, 11/1/34 | | 125,000 | | | 135,305 | |
| | | | | | |
| | | | | | 2,617,885 | |
| | | | | | | |
| General Obligation - 29.4% | | | | | | |
| City of Alexandria VA, Series A, (ST AID WITHHLDG), 5%, 7/15/28 | | 100,000 | | | 125,433 | |
| City of Danville VA, Series A, (ST AID WITHHLDG), 5%, 8/1/23 | | 190,000 | | | 224,759 | |
| City of Fredericksburg VA, Series A, 3.625%, 7/15/30 | | 400,000 | | | 411,784 | |
| City of Hampton VA, Series A, 5%, 1/15/21 | | 250,000 | | | 261,615 | |
| City of Manassas VA, (ST AID WITHHLDG), 3%, 7/1/27 | | 500,000 | | | 539,170 | |
| City of Norfolk VA, Series A (Prerefunded 11/1/19 @ $100), 4.125%, 11/1/27 | | 75,000 | | | 79,363 | |
| City of Portsmouth VA, Series A, (ST AID WITHHLDG), 5%, 2/1/31 | | 635,000 | | | 731,818 | |
| City of Richmond VA, Series C, (ST AID WITHHLDG), 5%, 7/15/22 | | 100,000 | | | 109,793 | |
| City of Roanoke VA, Series A, (Prerefunded 2/1/20 @ $100), (ST AID WITHHLDG), 5%, 2/1/25 | | 230,000 | | | 249,423 | |
| City of Suffolk VA, Series A, 3%, 2/1/32 | | 435,000 | | | 441,325 | |
| City of Virginia Beach VA, Series A, 4%, 8/1/22 | | 300,000 | | | 335,112 | |
| Commonwealth of Virginia, Series B (Prerefunded 6/1/18 @ $100), 5%, 6/1/21 | | 175,000 | | | 179,041 | |
| Commonwealth of Virginia, Series A, 5%, 6/1/23 | | 500,000 | | | 593,050 | |
| Commonwealth of Virginia, Series B (Prerefunded 6/1/19 @ $100), 5%, 6/1/27 | | 150,000 | | | 159,165 | |
| County of Arlington VA, Series B, (ST AID WITHHLDG), 5%, 8/15/27 | | 175,000 | | | 209,382 | |
| County of Fairfax VA, Series B, (ST AID WITHHLDG), 4%, 10/1/22 | | 250,000 | | | 279,875 | |
| County of Fairfax VA, Series A, (ST AID WITHHLDG), 5%, 10/1/26 | | 410,000 | | | 512,619 | |
| County of Henrico VA, Series A, (Prerefunded 12/1/18 @ $100), 5%, 12/1/24 | | 200,000 | | | 208,508 | |
| County of Henrico VA, 5%, 7/15/25 | | 150,000 | | | 164,103 | |
| County of Prince William VA, (ST AID WITHHLDG), 5%, 8/1/21 | | 105,000 | | | 119,327 | |
| County of Spotsylvania VA, (ST AID WITHHLDG), 5%, 1/15/24 | | 200,000 | | | 240,128 | |
| Town of Leesburg VA, (ST AID WITHHLDG), 5%, 1/15/25 | | 90,000 | | | 109,848 | |
| Town of Leesburg VA, Series A (Prerefunded 1/15/21 @ $100), 5%, 1/15/41 | | 135,000 | | | 150,979 | |
| | | | | | |
| | | | | | 6,435,620 | |
| See accompanying Notes to Financial Statements. |
| |
| |
| 21 |
Madison Funds | October 31, 2017
| |
| Madison Tax-Free Virginia Fund Portfolio of Investments - continued |
| | | Par Value | | Value (Note 2) | |
| | | | | |
| MUNICIPAL BONDS - continued | | | | | | |
| | | | | | | |
| Medical - 6.5% | | | | | | |
| Fredericksburg Economic Development Authority, 5.25%, 6/15/18 | $ | 250,000 | | $ | 255,942 | |
| Norfolk Economic Development Authority, Series B, 5%, 11/1/36 | | 480,000 | | | 537,874 | |
| Stafford County Economic Development Authority Revenue, 5%, 6/15/25 | | 260,000 | | | 303,459 | |
| Virginia Small Business Financing Authority, 5%, 11/1/40 | | 300,000 | | | 321,477 | |
| | | | | | |
| | | | | | 1,418,752 | |
| | | | | | | |
| Multifamily Housing - 6.1% | | | | | | |
| Fairfax County Redevelopment & Housing Authority, 4.75%, 10/1/36 | | 725,000 | | | 750,875 | |
| Fairfax County Redevelopment & Housing Authority, 5%, 10/1/39 | | 300,000 | | | 318,327 | |
| Virginia Housing Development Authority, Series E, 4.8%, 10/1/39 | | 250,000 | | | 258,458 | |
| | | | | | |
| | | | | | 1,327,660 | |
| | | | | | | |
| Power - 4.3% | | | | | | |
| Chesterfield County Economic Development Authority, Series A, 5%, 5/1/23 | | 565,000 | | | 593,736 | |
| Puerto Rico Electric Power Authority, Series V, (BHAC-CR MBIA-RE FGIC), 5.25%, 7/1/24 | | 290,000 | | | 337,081 | |
| | | | | | |
| | | | | | 930,817 | |
| | | | | | | |
| Transportation - 6.0% | | | | | | |
| Puerto Rico Highways & Transportation Authority, Series N, (ASSURED GTY), 5.25%, 7/1/34 | | 100,000 | | | 109,461 | |
| Richmond Metropolitan Authority, (Escrowed To Maturity) (NATL-RE), 5.25%, 7/15/22 | | 60,000 | | | 65,545 | |
| Richmond Metropolitan Authority, (NATL-RE), 5.25%, 7/15/22 | | 140,000 | | | 153,463 | |
| Virginia Commonwealth Transportation Board, Series A, 5%, 9/15/24 | | 225,000 | | | 258,284 | |
| Virginia Commonwealth Transportation Board, Series B, 5%, 3/15/25 | | 535,000 | | | 622,328 | |
| Virginia Port Authority Revenue, Series B, 5%, 7/1/21 | | 100,000 | | | 112,278 | |
| | | | | | |
| | | | | | 1,321,359 | |
| | | | | | | |
| Utilities - 1.5% | | | | | | |
| City of Richmond VA Public Utility Revenue, Series A, 5%, 1/15/38 | | 300,000 | | | 340,125 | |
| | | | | | |
| | | | | | | |
| Water - 10.1% | | | | | | |
| Fairfax County Water Authority, Series B, 5.25%, 4/1/23 | | 180,000 | | | 215,177 | |
| Fairfax County Water Authority, 5%, 4/1/27 | | 150,000 | | | 171,993 | |
| Hampton Roads Sanitation District, (Prerefunded 4/1/18 @ $100), 5%, 4/1/33 | | 90,000 | | | 91,452 | |
| Hampton Roads Sanitation District, (Prerefunded 4/1/18 @ $100), 5%, 4/1/33 | | 160,000 | | | 162,648 | |
| Prince William County Service Authority, 5%, 7/1/22 | | 250,000 | | | 290,370 | |
| Upper Occoquan Sewage Authority, Series A, (NATL-RE), 5.15%, 7/1/20 | | 315,000 | | | 335,538 | |
| Virginia Resources Authority, Series B, (Prerefunded 11/1/21@ $100), (MORAL OBLG), 5%, 11/1/23 | | 80,000 | | | 91,225 | |
| Virginia Resources Authority, (Prerefunded 10/1/19 @ $100), (ST AID WITHHLDG), 5%, 10/1/23 | | 500,000 | | | 536,725 | |
| Virginia Resources Authority, Series B, (MORAL OBLG), 5%, 11/1/23 | | 120,000 | | | 136,336 | |
| Virginia Resources Authority, (Prerefunded 10/1/19 @ $100), (ST AID WITHHLDG), 4.5%, 10/1/28 | | 160,000 | | | 170,241 | |
| | | | | | |
| | | | | | 2,201,705 | |
| | | | | | |
| TOTAL INVESTMENTS - 97.7% | | | | | | |
| (Cost $20,705,346**) | | | | | 21,353,602 | |
| NET OTHER ASSETS AND LIABILITIES - 2.3% | | | | | 512,637 | |
| | | | | | |
| TOTAL NET ASSETS - 100.0% | | | | $ | 21,866,239 | |
| | | | | | |
| * | | This bond is covered by insurance issued by Ambac Assurance Corporation (“AMBAC”). On November 8, 2010, Ambac Financial Group, Inc., the holding company of AMBAC, announced that it had filed for Chapter 11 bankruptcy protection. Although AMBAC’s claim paying ability appears strong at this point, its ultimate ability to guarantee timely payment of principal and interest on these bonds, should they default, will be dependent on the timing and magnitude of losses within the entity’s overall portfolio. |
| ** | | Aggregate cost for Federal tax purposes was $20,705,346. |
| AMBAC | | AMBAC Indemnity Corp. |
| ASSURED GTY | | Assured Guaranty. |
| BHAC-CR | | Berkshire Hathaway Assurance Corp. |
| FGIC | | Financial Guaranty Insurance Co. |
| MBIA-RE | | MBIA Insurance Corp. |
| MORAL OBLG | | Moral Obligation. |
| NATL-RE | | National Public Finance Guarantee Corp. |
| ST AID WITHHLDG | | State Aid Withholding. |
| ST APPROP | | State Appropriations. |
| |
| Madison Tax-Free National Fund Portfolio of Investments |
| | Par Value | | Value (Note 2) | |
| | | | | |
| MUNICIPAL BONDS - 96.9% | | | | | | |
| | | | | | | |
| Alabama - 2.5% | | | | | | |
| Alabama Incentives Financing Authority Revenue, Series A, 5%, 9/1/29 | $ | 300,000 | | $ | 319,446 | |
| Tuscaloosa Public Educational Building Authority, (ASSURED GTY), (Prerefunded 7/1/18 @ $100), 6.375%, 7/1/28 | | 295,000 | | | 305,340 | |
| | | | | | |
| | | | | | 624,786 | |
| | | | | | | |
| Arkansas - 0.7% | | | | | | |
| City of Fort Smith AR Water & Sewer Revenue, (Prerefunded 10/1/18 @ $100), (AGM), 5%, 10/1/21 | | 65,000 | | | 67,310 | |
| City of Fort Smith AR Water & Sewer Revenue, (AGM), 5%, 10/1/21 | | 110,000 | | | 113,848 | |
| | | | | | |
| | | | | | 181,158 | |
| | | | | | | |
| Colorado - 1.9% | | | | | | |
| El Paso County Facilities Corp., Certificate Participation, Series A, 5%, 12/1/27 | | 400,000 | | | 489,012 | |
| | | | | | |
| | | | | | | |
| Delaware - 1.6% | | | | | | |
| State of Delaware, General Obligation, Series A, 5%, 8/1/25 | | 345,000 | | | 409,156 | |
| | | | | | |
| | | | | | | |
| Florida - 17.9% | | | | | | |
| City of Margate FL, General Obligation, 5%, 7/1/25 | | 785,000 | | | 952,165 | |
| City of Port St. Lucie FL Utility System Revenue, 5%, 9/1/27 | | 600,000 | | | 682,770 | |
| County of Miami-Dade FL, Series B, 5%, 3/1/25 | | 525,000 | | | 605,110 | |
| Hillsborough County Industrial Development Authority, 5%, 10/1/34 | | 450,000 | | | 496,989 | |
| Lee County Industrial Development Authority, 5%, 11/1/28 | | 500,000 | | | 551,255 | |
| Orlando Utilities Commission, Series C, 5%, 10/1/22 | | 525,000 | | | 611,457 | |
| Palm Beach County Solid Waste Authority, 5%, 10/1/24 | | 300,000 | | | 339,276 | |
| Port St. Lucie Community Redevelopment Agency Revenue, Tax Allocation, 5%, 1/1/26 | | 250,000 | | | 298,740 | |
| | | | | | |
| | | | | | 4,537,762 | |
| | | | | | | |
| Georgia - 3.1% | | | | | | |
| City of Atlanta GA Water & Wastewater Revenue, (AGM), 5.75%, 11/1/30 | | 300,000 | | | 407,226 | |
| Dublin GA School District, General Obligation, (ST AID WITHHLDG), 4%, 4/1/23 | | 135,000 | | | 144,813 | |
| Georgia State Road & Tollway Authority, Series A, (Prerefunded 6/1/19 @ $100), 5%, 6/1/21 | | 90,000 | | | 95,425 | |
| Private Colleges & Universities Authority, Series C, (Prerefunded 9/1/18 @ $100), 5%, 9/1/38 | | 130,000 | | | 134,201 | |
| | | | | | |
| | | | | | 781,665 | |
| | | | | | | |
| Hawaii - 2.1% | | | | | | |
| State of Hawaii, General Obligation, Series EY, 5%, 10/1/25 | | 435,000 | | | 532,566 | |
| | | | | | |
| | | | | | | |
| Illinois - 0.6% | | | | | | |
| Regional Transportation Authority, Series A, (AMBAC GO of AUTH) *, 7.2%, 11/1/20 | | 135,000 | | | 146,948 | |
| | | | | | |
| | | | | | | |
| Indiana - 3.7% | | | | | | |
| Indiana Finance Authority, Series C, 5%, 2/1/21 | | 400,000 | | | 434,248 | |
| Indianapolis Local Public Improvement Bond Bank Revenue, Series A, (ASSURED GTY), (Prerefunded 1/1/19 @ $100), 5.5%, 1/1/38 | | 95,000 | | | 99,865 | |
| Indianapolis Local Public Improvement Bond Bank Revenue, Series A, (ASSURED GTY), 5.5%, 1/1/38 | | 380,000 | | | 398,415 | |
| | | | | | |
| | | | | | 932,528 | |
| | | | | | | |
| Iowa - 2.9% | | | | | | |
| City of Bettendorf IA, General Obligation, Series A, 5%, 6/1/28 | | 475,000 | | | 516,672 | |
| City of Bettendorf IA, General Obligation, Series A, 5%, 6/1/30 | | 210,000 | | | 227,587 | |
| | | | | | |
| | | | | | 744,259 | |
| See accompanying Notes to Financial Statements. |
| |
| |
| 22 |
Madison Funds | October 31, 2017
| |
| Madison Tax-Free National Fund Portfolio of Investments - continued |
| | | Par Value | | Value (Note 2) | |
| | | | | |
| MUNICIPAL BONDS - continued | | | | | | |
| | | | | | | |
| Kansas - 3.4% | | | | | | |
| City of Wichita KS, General Obligation, Series 816, 5%, 12/1/24 | $ | 510,000 | | $ | 617,279 | |
| Shawnee County Unified School District No. 437, General Obligation, 4%, 9/1/24 | | 220,000 | | | 252,344 | |
| | | | | | |
| | | | | | 869,623 | |
| | | | | | | |
| Maryland - 2.9% | | | | | | |
| City of Rockville MD, General Obligation, Series A, 5%, 6/1/24 | | 600,000 | | | 723,186 | |
| | | | | | |
| | | | | | | |
| Michigan - 3.5% | | | | | | |
| Detroit City School District, General Obligation, Series A, (FGIC Q-SBLF), 6%, 5/1/20 | | 400,000 | | | 441,984 | |
| Redford Unified School District No. 1, General Obligation, (AMBAC Q-SBLF) *, 5%, 5/1/22 | | 410,000 | | | 452,328 | |
| | | | | | |
| | | | | | 894,312 | |
| | | | | | | |
| Missouri - 6.4% | | | | | | |
| County of St Louis MO, Series D, (Escrowed To Maturity), 5.65%, 2/1/20 | | 500,000 | | | 547,070 | |
| Missouri State Board of Public Buildings, Series B, 4%, 4/1/25 | | 525,000 | | | 592,966 | |
| Springfield School District No. R-12, General Obligation, Series B, (ST AID DIR DEP), 5%, 3/1/25 | | 400,000 | | | 487,528 | |
| | | | | | |
| | | | | | 1,627,564 | |
| | | | | | | |
| New Jersey - 6.4% | | | | | | |
| City of Elizabeth NJ, General Obligation, (AGM), 3%, 4/1/24 | | 300,000 | | | 316,674 | |
| New Jersey Economic Development Authority Revenue, (ST APPROP), 5%, 3/1/26 | | 450,000 | | | 492,390 | |
| New Jersey State Turnpike Authority, Series A, (BHAC-CR AGM), 5.25%, 1/1/28 | | 250,000 | | | 315,977 | |
| New Jersey State Turnpike Authority, Series A, (BHAC-CR AGM), 5.25%, 1/1/29 | | 250,000 | | | 315,213 | |
| Union County Improvement Authority, Series A, 4%, 2/1/25 | | 150,000 | | | 166,323 | |
| | | | | | |
| | | | | | 1,606,577 | |
| | | | | | | |
| New Mexico - 1.9% | | | | | | |
| Farmington Municipal School District No. 5, General Obligation, Series A, (ST AID WITHHLDG), 3%, 9/1/23 | | 450,000 | | | 475,727 | |
| | | | | | |
| | | | | | | |
| New York - 3.5% | | | | | | |
| New York State Dormitory Authority, Series 1, (BHAC-CR AMBAC) *, 5.5%, 7/1/31 | | 250,000 | | | 318,433 | |
| Port Authority of New York & New Jersey, (GO of AUTH), 5.375%, 3/1/28 | | 455,000 | | | 556,824 | |
| | | | | | |
| | | | | | 875,257 | |
| | | | | | | |
| North Carolina - 4.8% | | | | | | |
| North Carolina Medical Care Commission, Series A, (HUD SECT 8), 5.5%, 10/1/24 | | 400,000 | | | 405,176 | |
| State of North Carolina, Series A, (Prerefunded 5/1/19 @ $100), 4.5%, 5/1/27 | | 200,000 | | | 209,978 | |
| Town of Cary NC Combined Utility Systems Revenue, 5%, 12/1/23 | | 500,000 | | | 585,825 | |
| | | | | | |
| | | | | | 1,200,979 | |
| | | | | | | |
| Ohio - 2.3% | | | | | | |
| Cleveland-Cuyahoga County Port Authority, 5%, 7/1/24 | | 500,000 | | | 589,035 | |
| | | | | | |
| | | | | | | |
| South Carolina - 8.3% | | | | | | |
| Anderson County School District No. 1, General Obligation, Series A, (SCSDE), 5%, 3/1/25 | | 720,000 | | | 873,691 | |
| City of Bennettsville SC Combined Utility System Revenue, (BAM), 3.5%, 2/1/24 | | 465,000 | | | 504,050 | |
| City of Newberry SC Revenue, (AGM), 4%, 4/1/22 | | 240,000 | | | 260,921 | |
| York County School District No. 1, General Obligation, Series A, (Prerefunded 3/1/19 @ $100), (SCSDE), 5%, 3/1/27 | | 440,000 | | | 462,779 | |
| | | | | | |
| | | | | | 2,101,441 | |
| | | | | | | |
| Tennessee - 1.0% | | | | | | |
| Jackson Energy Authority, 4.75%, 6/1/25 | | 100,000 | | | 111,514 | |
| Town of Decatur TN Water & Sewer Revenue, General Obligation, 3%, 6/1/24 | | 120,000 | | | 128,435 | |
| | | | | | |
| | | | | | 239,949 | |
| | | | | | | |
| Texas - 8.5% | | | | | | |
| Beaumont Independent School District, General Obligation, (PSF-GTD), 4.75%, 2/15/38 | | 300,000 | | | 326,604 | |
| City of San Antonio TX, Water System Revenue, (Prerefunded 11/15/18 @ $100), 5.125%, 5/15/29 | | 300,000 | | | 312,468 | |
| Liberty Hill Independent School District, General Obligation, (PSF-GTD), 5%, 8/1/26 | | 410,000 | | | 436,999 | |
| Mueller Local Government Corp., 5%, 9/1/25 | | 500,000 | | | 501,570 | |
| San Jacinto River Authority, (BAM), 4%, 10/1/23 | | 200,000 | | | 223,148 | |
| State of Texas, General Obligation, Series C, 5%, 8/1/27 | | 330,000 | | | 351,849 | |
| | | | | | |
| | | | | | 2,152,638 | |
| | | | | | | |
| Virginia - 3.0% | | | | | | |
| Fairfax County Redevelopment & Housing Authority, 5%, 10/1/39 | | 100,000 | | | 106,109 | |
| James City County Economic Development Authority, 5%, 6/15/22 | | 250,000 | | | 289,027 | |
| Virginia Housing Development Authority, Series E, 4.8%, 10/1/39 | | 250,000 | | | 258,458 | |
| Virginia Port Authority Revenue, Series B, 5%, 7/1/21 | | 100,000 | | | 112,278 | |
| | | | | | |
| | | | | | 765,872 | |
| | | | | | | |
| Washington - 1.0% | | | | | | |
| State of Washington, General Obligation, Series E, 5%, 2/1/29 | | 205,000 | | | 241,734 | |
| | | | | | |
| | | | | | | |
| Wisconsin - 3.0% | | | | | | |
| Maple School District, General Obligation, Series A, 5%, 4/1/24 | | 650,000 | | | 764,686 | |
| | | | | | |
| TOTAL INVESTMENTS - 96.9% | | | | | | |
| (Cost $23,467,097**) | | | | | 24,508,420 | |
| NET OTHER ASSETS AND LIABILITIES - 3.1% | | | | | 785,247 | |
| | | | | | |
| TOTAL NET ASSETS - 100.0% | | | | $ | 25,293,667 | |
| | | | | | |
| * | | This bond is covered by insurance issued by Ambac Assurance Corporation (“AMBAC”). On November 8, 2010, Ambac Financial Group, Inc., the holding company of AMBAC, announced that it had filed for Chapter 11 bankruptcy protection. Although AMBAC’s claim paying ability appears strong at this point, its ultimate ability to guarantee timely payment of principal and interest on these bonds, should they default, will be dependent on the timing and magnitude of losses within the entity’s overall portfolio. |
| ** | | Aggregate cost for Federal tax purposes was $23,467,097. |
| AGM | | Assured Guaranty Municipal Corp. |
| AMBAC | | AMBAC Indemnity Corp. |
| ASSURED GTY | | Assured Guaranty. |
| BAM | | Build America Mutual Assurance Co. |
| BHAC-CR | | Berkshire Hathaway Assurance Corp. |
| FGIC | | Financial Guaranty Insurance Co. |
| GO of AUTH | | General Obligation of the Authority. |
| HUD SECT 8 | | HUD Insured Multifamily Housing. |
| PSF-GTD | | Permanent School Fund Guaranteed. |
| Q-SBLF | | Qualified School Board Loan Fund. |
| SCSDE | | South Carolina School District-Enhanced (State of SC’s Intercept program). |
| ST AID DIR DEP | | State Aid Direct Deposit. |
| ST AID WITHHLDG | | State Aid Withholding. |
| ST APPROP | | State Appropriations. |
| See accompanying Notes to Financial Statements. |
| |
| |
| 23 |
Madison Funds | October 31, 2017
| |
| Madison High Quality Bond Fund Portfolio of Investments |
| | | Par Value | | Value (Note 2) | |
| | | | | |
| CORPORATE NOTES AND BONDS - 38.9% | | | | | | |
| | | | | | | |
| Consumer Discretionary - 6.8% | | | | | | |
| Comcast Corp., 3.125%, 7/15/22 | $ | 2,000,000 | | $ | 2,076,595 | |
| Home Depot Inc./The, 2%, 6/15/19 | | 2,000,000 | | | 2,009,177 | |
| Target Corp., 2.9%, 1/15/22 | | 2,000,000 | | | 2,046,706 | |
| Walt Disney Co./The, MTN, 1.1%, 12/1/17 | | 750,000 | | | 749,892 | |
| | | | | | |
| | | | | | 6,882,370 | |
| | | | | | | |
| Consumer Staples - 1.5% | | | | | | |
| Coca-Cola Co./The, 2.45%, 11/1/20 | | 1,500,000 | | | 1,525,024 | |
| | | | | | |
| | | | | | | |
| Energy - 1.5% | | | | | | |
| Chevron Corp., 2.427%, 6/24/20 | | 1,500,000 | | | 1,520,256 | |
| | | | | | |
| | | | | | | |
| Financials - 12.6% | | | | | | |
| American Express Credit Corp., 2.125%, 7/27/18 | | 1,000,000 | | | 1,003,343 | |
| Bank of New York Mellon Corp./The, MTN, 1.35%, 3/6/18 | | 500,000 | | | 499,749 | |
| Goldman Sachs Group Inc./The, 2.625%, 1/31/19 | | 1,360,000 | | | 1,370,338 | |
| John Deere Capital Corp., MTN, 2.65%, 1/6/22 | | 1,500,000 | | | 1,521,050 | |
| JPMorgan Chase & Co., 2.25%, 1/23/20 | | 1,500,000 | | | 1,507,428 | |
| JPMorgan Chase & Co., 2.972%, 1/15/23 | | 450,000 | | | 455,488 | |
| Morgan Stanley, 2.8%, 6/16/20 | | 2,000,000 | | | 2,029,202 | |
| State Street Corp., 1.95%, 5/19/21 | | 1,500,000 | | | 1,487,776 | |
| US Bancorp, MTN, 1.95%, 11/15/18 | | 750,000 | | | 751,789 | |
| Wells Fargo & Co., 5.625%, 12/11/17 | | 2,000,000 | | | 2,008,700 | |
| | | | | | |
| | | | | | 12,634,863 | |
| | | | | | | |
| Health Care - 3.1% | | | | | | |
| Merck & Co. Inc., 3.875%, 1/15/21 | | 1,500,000 | | | 1,584,972 | |
| UnitedHealth Group Inc., 2.875%, 3/15/23 | | 1,500,000 | | | 1,528,067 | |
| | | | | | |
| | | | | | 3,113,039 | |
| | | | | | | |
| Industrials - 3.1% | | | | | | |
| General Electric Co., MTN, 3.1%, 1/9/23 | | 1,500,000 | | | 1,554,041 | |
| United Parcel Service Inc., 5.5%, 1/15/18 | | 1,500,000 | | | 1,512,032 | |
| | | | | | |
| | | | | | 3,066,073 | |
| | | | | | | |
| Information Technology - 8.5% | | | | | | |
| Apple Inc., 2.4%, 5/3/23 | | 1,500,000 | | | 1,497,023 | |
| Cisco Systems Inc., 2.2%, 2/28/21 | | 1,500,000 | | | 1,504,027 | |
| Intel Corp., 3.3%, 10/1/21 | | 1,750,000 | | | 1,827,669 | |
| Microsoft Corp., 3%, 10/1/20 | | 1,500,000 | | | 1,547,924 | |
| QUALCOMM Inc., 3.25%, 5/20/27 | | 450,000 | | | 449,954 | |
| Visa Inc., 2.2%, 12/14/20 | | 1,700,000 | | | 1,712,102 | |
| | | | | | |
| | | | | | 8,538,699 | |
| | | | | | | |
| Real Estate - 1.8% | | | | | | |
| Simon Property Group L.P., 4.125%, 12/1/21 | | 1,750,000 | | | 1,857,445 | |
| | | | | | |
Total Corporate Notes and Bonds (Cost $38,790,720) | | | | | 39,137,769 | |
| | | | | | | |
| U.S. GOVERNMENT AND AGENCY OBLIGATIONS - 58.8% | | | | | | |
| | | | | | | |
| Fannie Mae - 7.9% | | | | | | |
| 0.875%, 2/8/18 | | 4,000,000 | | | 3,996,568 | |
| 1.375%, 10/7/21 | | 4,000,000 | | | 3,920,344 | |
| | | | | | |
| | | | | | 7,916,912 | |
| | | | | | | |
| Freddie Mac - 4.0% | | | | | | |
| 2.375%, 1/13/22 | | 4,000,000 | | | 4,057,316 | |
| | | | | | |
| | | | | | | |
| U.S. Treasury Notes - 46.9% | | | | | | |
| 3.875%, 5/15/18 | | 3,000,000 | | | 3,041,012 | |
| 3.750%, 11/15/18 | | 2,750,000 | | | 2,812,949 | |
| 1.500%, 12/31/18 | | 3,500,000 | | | 3,499,453 | |
| 1.250%, 1/31/19 | | 3,500,000 | | | 3,488,105 | |
| 1.500%, 3/31/19 | | 3,750,000 | | | 3,748,389 | |
| 3.125%, 5/15/19 | | 3,750,000 | | | 3,839,795 | |
| 1.125%, 12/31/19 | | 4,500,000 | | | 4,452,715 | |
| 3.625%, 2/15/20 | | 4,000,000 | | | 4,178,125 | |
| 2.625%, 11/15/20 | | 4,500,000 | | | 4,616,543 | |
| 2.500%, 8/15/23 | | 4,500,000 | | | 4,596,328 | |
| 2.750%, 11/15/23 | | 2,000,000 | | | 2,069,766 | |
| 1.500%, 8/15/26 | | 2,500,000 | | | 2,333,398 | |
| 2.375%, 5/15/27 | | 4,450,000 | | | 4,452,086 | |
| | | | | | |
| | | | | | 47,128,664 | |
| | | | | | |
Total U.S. Government and Agency Obligations (Cost $59,270,139) | | | | | 59,102,892 | |
| | | Shares | | | | |
| | | | | | |
| SHORT-TERM INVESTMENTS - 1.5% | | | | | | |
| State Street Institutional U.S. Government Money Market Fund, 0.96%, Premier Class | | 1,479,337 | | | 1,479,337 | |
| | | | | | |
Total Short-Term Investments (Cost $1,479,337) | | | | | 1,479,337 | |
| | | | | | |
| TOTAL INVESTMENTS - 99.2% | | | | | | |
| (Cost $99,540,196**) | | | | | 99,719,998 | |
| NET OTHER ASSETS AND LIABILITIES - 0.8% | | | | | 816,239 | |
| | | | | | |
| TOTAL NET ASSETS - 100.0% | | | | $ | 100,536,237 | |
| | | | | | |
| ** | | Aggregate cost for Federal tax purposes was $99,540,196. |
| MTN | | Medium Term Note. |
| |
| Madison Core Bond Fund Portfolio of Investments |
| | | Par Value | | Value (Note 2) | |
| | | | | |
| ASSET BACKED SECURITIES - 3.1% | | | | | | |
| CarMax Auto Owner Trust, Series 2014-1, Class B, 1.69%, 8/15/19 | $ | 600,000 | | $ | 600,104 | |
| CarMax Auto Owner Trust, Series 2017-1, Class A2, 1.54%, 2/18/20 | | 820,701 | | | 820,596 | |
| Chase Issuance Trust, Series 2017-A1, Class A, (1M LIBOR + 0.300%) (A), 1.539%, 1/18/22 | | 1,000,000 | | | 1,004,457 | |
| Chesapeake Funding II LLC, Series 2017 4A, Class A1 (B), 2.12%, 11/15/29 | | 1,000,000 | | | 999,893 | |
| Dell Equipment Finance Trust, Series 2017-2, Class A2A (B), 1.97%, 2/24/20 | | 750,000 | | | 750,024 | |
| Enterprise Fleet Financing LLC, Series 2017-3, Class A3 (B), 2.36%, 5/20/23 | | 1,000,000 | | | 999,770 | |
| Porsche Innovative Lease Owner Trust, Series 2015-1, Class A4 (B), 1.43%, 5/21/21 | | 537,464 | | | 537,440 | |
| Santander Drive Auto Receivables Trust, Series 2013-5, Class C, 2.25%, 6/17/19 | | 110,479 | | | 110,553 | |
| Santander Drive Auto Receivables Trust, Series 2013-5, Class D, 2.73%, 10/15/19 | | 530,000 | | | 532,683 | |
| Santander Drive Auto Receivables Trust, Series 2013-A, Class C (B), 3.12%, 10/15/19 | | 23,714 | | | 23,748 | |
| Santander Drive Auto Receivables Trust, Series 2013-4, Class C, 3.25%, 1/15/20 | | 17,158 | | | 17,168 | |
| | | | | | |
| | | | | | | |
Total Asset Backed Securities (Cost $6,395,752) | | | | | 6,396,436 | |
| | | | | | | |
| COLLATERALIZED MORTGAGE OBLIGATIONS - 2.7% | | | | | | |
| Fannie Mae REMICS, Series 2015-12, Class NI, IO, 3.5%, 3/25/30 | | 2,263,195 | | | 260,048 | |
| Fannie Mae REMICS, Series 2011-31, Class DB, 3.5%, 4/25/31 | | 425,000 | | | 443,650 | |
| Fannie Mae REMICS, Series 2011-36, Class QB, 4%, 5/25/31 | | 1,000,000 | | | 1,066,587 | |
| Fannie Mae REMICS, Series 2001-73, Class GZ, 6%, 12/25/31 | | 285,052 | | | 320,561 | |
| Fannie Mae REMICS, Series 2005-79, Class LT, 5.5%, 9/25/35 | | 215,331 | | | 239,548 | |
| Fannie Mae REMICS, Series 2011-101, Class NC, 2.5%, 4/25/40 | | 646,187 | | | 646,909 | |
| Fannie Mae REMICS, Series 2015-44, Class GI, IO, 3%, 11/25/40 | | 755,941 | | | 65,154 | |
| Fannie Mae REMICS, Series 2016-21, Class BA, 3%, 3/25/42 | | 765,875 | | | 777,956 | |
| Freddie Mac REMICS, Series 3825, Class CB, 3.5%, 3/15/26 | | 1,000,000 | | | 1,046,552 | |
| Freddie Mac REMICS, Series 4066, Class DI, IO, 3%, 6/15/27 | | 3,132,328 | | | 272,697 | |
| Government National Mortgage Association, Series 2015-53, Class IL, IO, 3%, 9/20/44 | | 2,263,757 | | | 408,024 | |
| | | | | | |
Total Collateralized Mortgage Obligations (Cost $5,622,762) | | | | | 5,547,686 | |
| | | | | | | |
| COMMERCIAL MORTGAGE-BACKED SECURITIES - 3.7% | | | | | | |
| Fannie Mae-Aces, Series 2016-M2, Class X2, IO (A) (C), 1.094%, 1/25/23 | | 12,489,847 | | | 561,139 | |
| FHLMC Multifamily Structured Pass Through Certificates, Series K718, Class X1, IO (A) (C), 0.643%, 1/25/22 | | 24,014,694 | | | 542,442 | |
| FHLMC Multifamily Structured Pass Through Certificates, Series K058, Class A2, 2.653%, 8/25/26 | | 2,000,000 | | | 1,982,903 | |
| FHLMC Multifamily Structured Pass Through Certificates, Series K066, Class A2, 3.117%, 6/25/27 | | 400,000 | | | 408,710 | |
| FREMF Mortgage Trust, Series 2011-K702, Class B (A) (B) (C), 4.785%, 4/25/44 | | 1,000,000 | | | 1,007,091 | |
| FREMF Mortgage Trust, Series 2012-K706, Class B (A) (B) (C), 4.029%, 11/25/44 | | 255,000 | | | 258,480 | |
| FREMF Mortgage Trust, Series 2012-K708, Class B (A) (B) (C), 3.751%, 2/25/45 | | 1,250,000 | | | 1,269,174 | |
| FREMF Mortgage Trust, Series 2011-K701, Class C (A) (B) (C), 4.058%, 7/25/48 | | 1,250,000 | | | 1,247,883 | |
| UBS-Barclays Commercial Mortgage Trust, Series 2013-C6, Class A2, 2.067%, 4/10/46 | | 300,000 | | | 300,273 | |
| | | | | | |
Total Commercial Mortgage-Backed Securities (Cost $7,771,855) | | | | | 7,578,095 | |
| See accompanying Notes to Financial Statements. |
| |
| |
| 24 |
Madison Funds | October 31, 2017
| |
| Madison Core Bond Fund Portfolio of Investments - continued |
| | | Par Value | | Value (Note 2) | |
| | | | | |
| CORPORATE NOTES AND BONDS - 35.3% | | | | | | |
| | | | | | | |
| Consumer Discretionary - 6.9% | | | | | | |
| Amazon.com Inc. (B), 2.8%, 8/22/24 | $ | 300,000 | | $ | 300,405 | |
| Charter Communications Operating LLC / Charter Communications Operating Capital Corp., 4.464%, 7/23/22 | | 1,000,000 | | | 1,056,074 | |
| Delphi Automotive PLC (D), 3.15%, 11/19/20 | | 1,000,000 | | | 1,023,634 | |
| Discovery Communications Inc., 5%, 9/20/37 | | 500,000 | | | 515,477 | |
| ERAC USA Finance LLC (B), 6.7%, 6/1/34 | | 250,000 | | | 313,662 | |
| Ford Motor Credit Co. LLC, MTN, 2.943%, 1/8/19 | | 1,000,000 | | | 1,010,607 | |
| General Motors Financial Co. Inc., 3.2%, 7/6/21 | | 800,000 | | | 816,302 | |
| Georgia-Pacific LLC (B), 3.163%, 11/15/21 | | 1,000,000 | | | 1,025,557 | |
| GLP Capital L.P. / GLP Financing II Inc., 4.875%, 11/1/20 | | 275,000 | | | 290,125 | |
| Harman International Industries Inc., 4.15%, 5/15/25 | | 1,000,000 | | | 1,030,687 | |
| Lennar Corp., 4.75%, 4/1/21 | | 500,000 | | | 523,750 | |
| Marriott International Inc., 3.125%, 6/15/26 | | 600,000 | | | 595,831 | |
| Newell Brands Inc., 4.2%, 4/1/26 | | 1,100,000 | | | 1,159,225 | |
| Omnicom Group Inc., 3.6%, 4/15/26 | | 750,000 | | | 760,386 | |
| Priceline Group Inc./The, 3.6%, 6/1/26 | | 1,000,000 | | | 1,022,107 | |
| QVC Inc., 3.125%, 4/1/19 | | 800,000 | | | 809,595 | |
| Sirius XM Radio Inc. (B), 6%, 7/15/24 | | 525,000 | | | 560,437 | |
| Toll Brothers Finance Corp., 4%, 12/31/18 | | 450,000 | | | 456,750 | |
| Walgreens Boots Alliance Inc., 4.5%, 11/18/34 | | 1,000,000 | | | 1,029,026 | |
| | | | | | |
| | | | | | 14,299,637 | |
| | | | | | | |
| Consumer Staples - 2.3% | | | | | | |
| Anheuser-Busch InBev Finance Inc., 4.9%, 2/1/46 | | 1,000,000 | | | 1,124,610 | |
| Bunge Ltd. Finance Corp., 3.25%, 8/15/26 | | 1,000,000 | | | 970,416 | |
| CVS Health Corp., 4.75%, 12/1/22 | | 1,000,000 | | | 1,089,158 | |
| CVS Health Corp., 5.125%, 7/20/45 | | 1,000,000 | | | 1,117,430 | |
| Molson Coors Brewing Co., 2.1%, 7/15/21 | | 500,000 | | | 494,003 | |
| | | | | | |
| | | | | | 4,795,617 | |
| | | | | | | |
| Energy - 5.3% | | | | | | |
| Antero Resources Corp., 5.625%, 6/1/23 | | 300,000 | | | 314,250 | |
| Boardwalk Pipelines L.P., 4.45%, 7/15/27 | | 400,000 | | | 410,681 | |
| EnLink Midstream Partners L.P., 4.85%, 7/15/26 | | 300,000 | | | 316,006 | |
| EnLink Midstream Partners L.P., 5.45%, 6/1/47 | | 400,000 | | | 415,144 | |
| Enterprise Products Operating LLC, 3.75%, 2/15/25 | | 1,000,000 | | | 1,041,685 | |
| Helmerich & Payne International Drilling Co., 4.65%, 3/15/25 | | 1,000,000 | | | 1,061,961 | |
| Kinder Morgan Inc. (B), 5%, 2/15/21 | | 1,000,000 | | | 1,073,733 | |
| Marathon Oil Corp., 2.7%, 6/1/20 | | 1,000,000 | | | 998,991 | |
| Marathon Petroleum Corp., 2.7%, 12/14/18 | | 500,000 | | | 502,601 | |
| Phillips 66 Partners L.P., 3.605%, 2/15/25 | | 1,300,000 | | | 1,309,520 | |
| Pioneer Natural Resources Co., 3.45%, 1/15/21 | | 1,000,000 | | | 1,030,457 | |
| Tosco Corp., 7.8%, 1/1/27 | | 1,000,000 | | | 1,318,174 | |
| Valero Energy Corp., 6.625%, 6/15/37 | | 1,000,000 | | | 1,283,636 | |
| | | | | | |
| | | | | | 11,076,839 | |
| | | | | | | |
| Financials - 9.3% | | | | | | |
| AerCap Ireland Capital DAC / AerCap Global Aviation Trust (D), 3.75%, 5/15/19 | | 450,000 | | | 460,299 | |
| Air Lease Corp., 3.875%, 4/1/21 | | 450,000 | | | 470,090 | |
| Air Lease Corp., 3.75%, 2/1/22 | | 1,000,000 | | | 1,044,547 | |
| American Express Co., 2.5%, 8/1/22 | | 1,000,000 | | | 994,867 | |
| Bank of America Corp., MTN, 3.3%, 1/11/23 | | 1,000,000 | | | 1,024,387 | |
| Bank of America Corp., MTN, (3M USD LIBOR + 0.930%) (A), 2.816%, 7/21/23 | | 500,000 | | | 499,481 | |
| Bank of Montreal, MTN (D), 1.9%, 8/27/21 | | 1,000,000 | | | 982,980 | |
| BB&T Corp., MTN, 2.85%, 10/26/24 | | 600,000 | | | 598,572 | |
| Berkshire Hathaway Inc., 3.125%, 3/15/26 | | 250,000 | | | 253,075 | |
| Brookfield Finance Inc. (D), 4.25%, 6/2/26 | | 675,000 | | | 700,115 | |
| Capital One Financial Corp., 2.5%, 5/12/20 | | 500,000 | | | 501,817 | |
| Capital One Financial Corp., 3.3%, 10/30/24 | | 600,000 | | | 601,197 | |
| Cboe Global Markets Inc., 3.65%, 1/12/27 | | 600,000 | | | 613,341 | |
| Citigroup Inc., 2.75%, 4/25/22 | | 400,000 | | | 401,264 | |
| Discover Bank, 3.45%, 7/27/26 | | 500,000 | | | 493,352 | |
| Goldman Sachs Group Inc./The(3M USD LIBOR + 1.201%) (A), 3.272%, 9/29/25 | | 850,000 | | | 847,044 | |
| Goldman Sachs Group Inc./The, 3.5%, 11/16/26 | | 300,000 | | | 300,421 | |
| Intercontinental Exchange Inc., 2.35%, 9/15/22 | | 300,000 | | | 298,861 | |
| JPMorgan Chase & Co., 2.972%, 1/15/23 | | 300,000 | | | 303,659 | |
| JPMorgan Chase & Co., 3.125%, 1/23/25 | | 1,000,000 | | | 1,005,818 | |
| Liberty Mutual Group Inc. (B), 4.25%, 6/15/23 | | 1,250,000 | | | 1,329,294 | |
| Morgan Stanley, 4.3%, 1/27/45 | | 1,000,000 | | | 1,054,487 | |
| Nasdaq Inc., 3.85%, 6/30/26 | | 175,000 | | | 180,729 | |
| PNC Bank NA, 2.45%, 7/28/22 | | 500,000 | | | 499,433 | |
| Raymond James Financial Inc., 3.625%, 9/15/26 | | 400,000 | | | 403,875 | |
| Regions Financial Corp., 3.2%, 2/8/21 | | 1,000,000 | | | 1,022,614 | |
| Regions Financial Corp., 2.75%, 8/14/22 | | 600,000 | | | 601,043 | |
| Synchrony Financial, 3.75%, 8/15/21 | | 700,000 | | | 724,090 | |
| Synchrony Financial, 3.7%, 8/4/26 | | 600,000 | | | 594,021 | |
| TD Ameritrade Holding Corp., 3.3%, 4/1/27 | | 500,000 | | | 506,189 | |
| | | | | | |
| | | | | | 19,310,962 | |
| | | | | | | |
| Health Care - 3.0% | | | | | | |
| AbbVie Inc., 4.7%, 5/14/45 | | 1,000,000 | | | 1,084,929 | |
| Allergan Funding SCS (D), 4.75%, 3/15/45 | | 1,000,000 | | | 1,054,921 | |
| Becton, Dickinson and Co., 2.894%, 6/6/22 | | 400,000 | | | 400,895 | |
| Express Scripts Holding Co., 4.8%, 7/15/46 | | 950,000 | | | 986,915 | |
| Forest Laboratories LLC (B), 5%, 12/15/21 | | 200,000 | | | 217,108 | |
| HCA Inc., 3.75%, 3/15/19 | | 800,000 | | | 812,000 | |
| Laboratory Corp. of America Holdings, 3.6%, 9/1/27 | | 300,000 | | | 303,273 | |
| Shire Acquisitions Investments Ireland DAC (D), 1.9%, 9/23/19 | | 750,000 | | | 747,005 | |
| Zoetis Inc., 3%, 9/12/27 | | 650,000 | | | 636,352 | |
| | | | | | |
| | | | | | 6,243,398 | |
| | | | | | | |
| Industrials - 1.5% | | | | | | |
| CRH America Inc. (B), 3.875%, 5/18/25 | | 1,000,000 | | | 1,041,960 | |
| Lockheed Martin Corp., 4.7%, 5/15/46 | | 1,000,000 | | | 1,127,779 | |
| Masco Corp., 4.375%, 4/1/26 | | 700,000 | | | 744,317 | |
| Northrop Grumman Corp., 2.93%, 1/15/25 | | 300,000 | | | 300,767 | |
| | | | | | |
| | | | | | 3,214,823 | |
| | | | | | | |
| Information Technology - 2.2% | | | | | | |
| Activision Blizzard Inc., 3.4%, 6/15/27 | | 400,000 | | | 400,743 | |
| Analog Devices Inc., 5.3%, 12/15/45 | | 600,000 | | | 704,717 | |
| Autodesk Inc., 4.375%, 6/15/25 | | 1,000,000 | | | 1,068,022 | |
| CDW LLC / CDW Finance Corp., 5%, 9/1/23 | | 200,000 | | | 208,750 | |
| Dell International LLC / EMC Corp. (B), 8.35%, 7/15/46 | | 350,000 | | | 453,555 | |
| Fidelity National Information Services Inc., 3%, 8/15/26 | | 625,000 | | | 606,473 | |
| Hewlett Packard Enterprise Co., 6.35%, 10/15/45 | | 350,000 | | | 372,625 | |
| QUALCOMM Inc., 3.25%, 5/20/27 | | 500,000 | | | 499,949 | |
| VMware Inc., 3.9%, 8/21/27 | | 300,000 | | | 300,543 | |
| | | | | | |
| | | | | | 4,615,377 | |
| | | | | | | |
| Materials - 0.6% | | | | | | |
| Arconic Inc., 5.125%, 10/1/24 | | 200,000 | | | 214,646 | |
| Packaging Corp. of America, 3.65%, 9/15/24 | | 1,000,000 | | | 1,025,056 | |
| | | | | | |
| | | | | | 1,239,702 | |
| | | | | | | |
| Real Estate - 1.2% | | | | | | |
| Boston Properties L.P., 3.65%, 2/1/26 | | 450,000 | | | 458,137 | |
| Brixmor Operating Partnership L.P., 3.65%, 6/15/24 | | 500,000 | | | 497,640 | |
| Iron Mountain Inc. (B), 4.375%, 6/1/21 | | 500,000 | | | 513,750 | |
| SL Green Operating Partnership L.P., 3.25%, 10/15/22 | | 500,000 | | | 501,510 | |
| WP Carey Inc., 4.25%, 10/1/26 | | 500,000 | | | 508,105 | |
| | | | | | |
| | | | | | 2,479,142 | |
| | | | | | | |
| Telecommunication Services - 2.0% | | | | | | |
| AT&T Inc., 4.75%, 5/15/46 | | 1,000,000 | | | 943,275 | |
| AT&T Inc., 5.15%, 2/14/50 | | 500,000 | | | 492,890 | |
| Harris Corp., 5.054%, 4/27/45 | | 1,000,000 | | | 1,155,985 | |
| Sprint Spectrum Co. LLC / Sprint Spectrum Co. II LLC / Sprint Spectrum Co. III LLC (B), 3.36%, 3/20/23 | | 500,000 | | | 507,250 | |
| Verizon Communications Inc., 4.4%, 11/1/34 | | 1,000,000 | | | 1,006,598 | |
| | | | | | |
| | | | | | 4,105,998 | |
| | | | | | | |
| Utilities - 1.0% | | | | | | |
| Black Hills Corp., 4.25%, 11/30/23 | | 1,000,000 | | | 1,066,597 | |
| Duke Energy Corp., 3.75%, 9/1/46 | | 1,000,000 | | | 971,979 | |
| | | | | | |
| | | | | | 2,038,576 | |
| | | | | | |
Total Corporate Notes and Bonds | | | | | | |
(Cost $71,047,082) | | | | | 73,420,071 | |
| | | | | | | |
| LONG TERM MUNICIPAL BONDS - 5.6% | | | | | | |
| City of Laredo TX, General Obligation, 6.566%, 2/15/39 | | 1,500,000 | | | 1,584,105 | |
| County of Palm Beach FL Revenue, 5%, 11/1/33 | | 1,880,000 | | | 2,056,006 | |
| County of Pasco FL Water & Sewer Revenue, Series B, 6.76%, 10/1/39 | | 1,500,000 | | | 1,634,745 | |
| East Baton Rouge Sewerage Commission Revenue, Series B, 6.087%, 2/1/45 | | 2,000,000 | | | 2,152,840 | |
| Northside Independent School District, General Obligation, Series B, (PSF-GTD), 5.741%, 8/15/35 | | 1,600,000 | | | 1,703,104 | |
| Rancho Water District Financing Authority Revenue, (Prerefunded 8/1/20 @ $100), 6.337%, 8/1/40 | | 10,000 | | | 11,139 | |
| Rancho Water District Financing Authority Revenue, 6.337%, 8/1/40 | | 990,000 | | | 1,101,593 | |
| South Dakota State Building Authority Revenue, Series F, 4.7%, 6/1/32 | | 1,250,000 | | | 1,327,062 | |
| | | | | | |
Total Long Term Municipal Bonds | | | | | | |
(Cost $11,301,104) | | | | | 11,570,594 | |
| See accompanying Notes to Financial Statements. |
| |
| |
| 25 |
Madison Funds | October 31, 2017
| |
| Madison Core Bond Fund Portfolio of Investments - continued |
| | | Par Value | | Value (Note 2) | |
| | | | | |
| MORTGAGE BACKED SECURITIES - 21.3% | | | | | | |
| | | | | | | |
| Fannie Mae - 13.3% | | | | | | |
| 1.125%, 10/19/18 Pool # IE MAE | $ | 500,000 | | $ | 498,210 | |
| 3%, 5/1/27 Pool # AL1715 | | 695,643 | | | 714,723 | |
| 3.5%, 5/1/29 Pool # AW3740 | | 1,232,715 | | | 1,284,237 | |
| 3.5%, 8/1/29 Pool # MA2003 | | 804,920 | | | 836,620 | |
| 3.5%, 10/1/29 Pool # AX3155 | | 425,580 | | | 443,498 | |
| 3%, 9/1/30 Pool # 890696 | | 1,157,738 | | | 1,188,687 | |
| 3%, 12/1/30 Pool # AL8924 | | 589,076 | | | 604,995 | |
| 7%, 11/1/31 Pool # 607515 | | 8,436 | | | 9,397 | |
| 3.5%, 12/1/31 Pool # MA0919 | | 186,006 | | | 192,750 | |
| 3%, 2/1/32 Pool # AL9867 | | 739,040 | | | 757,893 | |
| 6.5%, 3/1/32 Pool # 631377 | | 28,712 | | | 31,825 | |
| 6.5%, 5/1/32 Pool # 636758 | | 2,209 | | | 2,448 | |
| 7%, 5/1/32 Pool # 644591 | | 804 | | | 874 | |
| 6.5%, 6/1/32 Pool # 545691 | | 75,863 | | | 86,658 | |
| 3.5%, 8/1/32 Pool # MA3098 | | 733,620 | | | 763,446 | |
| 3.5%, 9/1/32 Pool # MA3126 | | 490,206 | | | 510,184 | |
| 5.5%, 11/1/33 Pool # 555880 | | 86,884 | | | 97,025 | |
| 5%, 5/1/34 Pool # 780890 | | 38,465 | | | 42,184 | |
| 7%, 7/1/34 Pool # 792636 | | 7,779 | | | 8,031 | |
| 4%, 2/1/35 Pool # MA2177 | | 908,657 | | | 962,550 | |
| 5%, 8/1/35 Pool # 829670 | | 80,319 | | | 87,990 | |
| 5%, 9/1/35 Pool # 820347 | | 113,665 | | | 126,242 | |
| 5%, 9/1/35 Pool # 835699 | | 88,722 | | | 98,500 | |
| 3.5%, 12/1/35 Pool # MA2473 | | 1,115,702 | | | 1,160,204 | |
| 4.5%, 12/1/35 Pool # 745147 | | 14,419 | | | 15,476 | |
| 5%, 12/1/35 Pool # 850561 | | 32,862 | | | 35,982 | |
| 6%, 11/1/36 Pool # 902510 | | 64,535 | | | 72,642 | |
| 6%, 10/1/37 Pool # 947563 | | 94,529 | | | 108,208 | |
| 6.5%, 12/1/37 Pool # 889072 | | 79,437 | | | 90,405 | |
| 6.5%, 8/1/38 Pool # 987711 | | 175,740 | | | 201,578 | |
| 4%, 9/1/40 Pool # AE3039 | | 869,758 | | | 923,507 | |
| 4%, 1/1/41 Pool # AB2080 | | 680,267 | | | 720,771 | |
| 5.5%, 7/1/41 Pool # AL6588 | | 631,998 | | | 706,189 | |
| 4%, 9/1/41 Pool # AJ1406 | | 496,221 | | | 522,935 | |
| 4%, 10/1/41 Pool # AJ4046 | | 863,705 | | | 916,696 | |
| 3.5%, 11/1/41 Pool # AB3867 | | 375,894 | | | 388,268 | |
| 4%, 3/1/42 Pool # AL1998 | | 1,353,955 | | | 1,437,113 | |
| 3.5%, 6/1/42 Pool # AO4134 | | 1,313,408 | | | 1,356,570 | |
| 3.5%, 8/1/42 Pool # AP2133 | | 757,258 | | | 781,812 | |
| 3%, 9/1/42 Pool # AP6568 | | 127,113 | | | 127,876 | |
| 3.5%, 9/1/42 Pool # AB6228 | | 446,586 | | | 460,861 | |
| 4%, 10/1/42 Pool # AP7363 | | 944,462 | | | 994,980 | |
| 3.5%, 12/1/42 Pool # AQ8892 | | 142,379 | | | 146,821 | |
| 3.5%, 1/1/43 Pool # AQ9326 | | 648,938 | | | 672,867 | |
| 3%, 2/1/43 Pool # AL3072 | | 1,044,902 | | | 1,052,299 | |
| 3.5%, 3/1/43 Pool # AT0310 | | 619,422 | | | 639,554 | |
| 3.5%, 4/1/43 Pool # AR9902 | | 416,701 | | | 432,068 | |
| 3.5%, 4/1/43 Pool # AT2887 | | 527,922 | | | 545,186 | |
| 4%, 1/1/45 Pool # AS4257 | | 296,556 | | | 313,166 | |
| 4.5%, 2/1/45 Pool # MA2193 | | 922,843 | | | 987,690 | |
| 3.5%, 8/1/45 Pool # AS5645 | | 979,102 | | | 1,007,205 | |
| 3.5%, 12/1/45 Pool # AS6309 | | 455,929 | | | 469,015 | |
| 4.5%, 10/1/46 Pool # MA2783 | | 227,157 | | | 242,962 | |
| 3%, 1/1/47 Pool # BE0108 | | 710,537 | | | 713,192 | |
| | | | | | |
| | | | | | 27,593,065 | |
| | | | | | | |
| Freddie Mac - 8.0% | | | | | | |
| 4.5%, 2/1/25 Pool # J11722 | | 173,723 | | | 183,733 | |
| 4.5%, 5/1/25 Pool # J12247 | | 348,434 | | | 368,575 | |
| 8%, 6/1/30 Pool # C01005 | | 686 | | | 798 | |
| 6.5%, 1/1/32 Pool # C62333 | | 25,191 | | | 27,937 | |
| 3.5%, 8/1/32 Pool # C91485 | | 436,110 | | | 454,381 | |
| 4.5%, 6/1/34 Pool # C01856 | | 502,030 | | | 538,371 | |
| 6.5%, 11/1/36 Pool # C02660 | | 11,958 | | | 13,554 | |
| 5.5%, 1/1/37 Pool # G04593 | | 272,405 | | | 303,506 | |
| 5.5%, 11/1/37 Pool # A68787 | | 165,177 | | | 185,752 | |
| 5.5%, 12/1/38 Pool # G05267 | | 550,494 | | | 611,959 | |
| 5%, 10/1/39 Pool # G60465 | | 1,376,169 | | | 1,502,742 | |
| 3.5%, 11/1/40 Pool # G06168 | | 602,312 | | | 622,196 | |
| 4%, 10/1/41 Pool # Q04092 | | 1,003,910 | | | 1,063,939 | |
| 4.5%, 3/1/42 Pool # G07491 | | 654,479 | | | 701,560 | |
| 3%, 9/1/42 Pool # C04233 | | 702,248 | | | 706,852 | |
| 3%, 2/1/43 Pool # Q15767 | | 514,242 | | | 517,479 | |
| 3%, 4/1/43 Pool # V80025 | | 511,321 | | | 514,812 | |
| 3%, 4/1/43 Pool # V80026 | | 499,844 | | | 503,261 | |
| 3.5%, 8/1/44 Pool # Q27927 | | 668,313 | | | 690,437 | |
| 3%, 7/1/45 Pool # G08653 (E), | | 1,011,838 | | | 1,014,075 | |
| 3.5%, 8/1/45 Pool # Q35614 | | 799,295 | | | 824,186 | |
| 3.5%, 9/1/45 Pool # G08667 | | 878,374 | | | 903,590 | |
| 3%, 11/1/45 Pool # G08675 | | 1,008,696 | | | 1,011,119 | |
| 3%, 1/1/46 Pool # G08686 | | 1,048,450 | | | 1,051,012 | |
| 3%, 10/1/46 Pool # G60722 | | 928,997 | | | 932,064 | |
| 4%, 3/1/47 Pool # Q46801 | | 1,332,682 | | | 1,400,995 | |
| | | | | | |
| | | | | | 16,648,885 | |
| | | | | | | |
| Ginnie Mae - 0.0% | | | | | | |
| 6.5%, 2/20/29 Pool # 2714 | | 11,165 | | | 12,941 | |
| 6.5%, 4/20/31 Pool # 3068 | | 5,277 | | | 6,160 | |
| 4%, 4/15/39 Pool # 698089 | | 44,451 | | | 46,754 | |
| | | | | | |
| | | | | | 65,855 | |
| | | | | | |
Total Mortgage Backed Securities | | | | | | |
(Cost $44,209,631) | | | | | 44,307,805 | |
| | | | | | | |
| U.S. GOVERNMENT AND AGENCY OBLIGATIONS - 23.2% | | | | | | |
| | | | | | | |
| U.S. Treasury Bonds - 5.9% | | | | | | |
| 6.625%, 2/15/27 | | 2,000,000 | | | 2,721,250 | |
| 5.375%, 2/15/31 | | 1,250,000 | | | 1,666,308 | |
| 4.500%, 5/15/38 | | 2,750,000 | | | 3,540,088 | |
| 3.750%, 8/15/41 | | 500,000 | | | 582,871 | |
| 3.000%, 5/15/45 | | 1,650,000 | | | 1,693,699 | |
| 2.250%, 8/15/46 | | 1,500,000 | | | 1,315,137 | |
| 3.000%, 5/15/47 | | 800,000 | | | 819,344 | |
| | | | | | |
| | | | | | 12,338,697 | |
| | | | | | | |
| U.S. Treasury Notes - 17.3% | | | | | | |
| 2.750%, 2/28/18 | | 2,500,000 | | | 2,512,477 | |
| 3.875%, 5/15/18 | | 3,000,000 | | | 3,041,012 | |
| 1.375%, 2/28/19 | | 4,000,000 | | | 3,992,656 | |
| 3.625%, 8/15/19 | | 4,250,000 | | | 4,402,734 | |
| 2.625%, 11/15/20 | | 3,500,000 | | | 3,590,645 | |
| 3.125%, 5/15/21 | | 3,750,000 | | | 3,916,992 | |
| 2.125%, 8/15/21 | | 2,000,000 | | | 2,019,063 | |
| 2.000%, 10/31/21 | | 2,500,000 | | | 2,509,863 | |
| 1.750%, 9/30/22 | | 2,500,000 | | | 2,468,555 | |
| 2.750%, 2/15/24 | | 2,000,000 | | | 2,068,047 | |
| 2.125%, 3/31/24 | | 2,750,000 | | | 2,740,117 | |
| 2.250%, 11/15/25 | | 1,750,000 | | | 1,743,164 | |
| 1.500%, 8/15/26 | | 1,000,000 | | | 933,359 | |
| | | | | | |
| | | | | | 35,938,684 | |
| | | | | | |
| | | | | | | |
Total U.S. Government and Agency Obligations (Cost $46,807,970) | | | | | 48,277,381 | |
| | | Shares | | | | |
| | | | | | |
| SHORT-TERM INVESTMENTS - 3.9% | | | | | | |
| State Street Institutional U.S. Government Money Market Fund, 0.96%, Premier Class | | 8,163,139 | | | 8,163,139 | |
| | | | | | |
Total Short-Term Investments | | | | | | |
(Cost $8,163,139) | | | | | 8,163,139 | |
| | | | | | |
| TOTAL PUT OPTIONS PURCHASED - 0.0% | | | | | 28,750 | |
| TOTAL INVESTMENTS - 98.8% | | | | | | |
| (Cost $201,358,910**) | | | | | 205,289,957 | |
| TOTAL PUT OPTIONS WRITTEN - (0.0)% | | | | | (17,500 | ) |
| NET OTHER ASSETS AND LIABILITIES - 1.2% | | | | | 2,441,317 | |
| | | | | | |
| TOTAL NET ASSETS - 100.0% | | | | $ | 207,713,774 | |
| | | | | | |
| ** | | Aggregate cost for Federal tax purposes was $201,355,930. |
| (A) | | Floating rate or variable rate note. Rate shown is as of October 31, 2017. |
| (B) | | Security sold within terms of a private placement memorandum exempt from registration under section 144A of the Securities Act of 1933, as amended, and may be sold only to dealers in that program or other “qualified institutional buyers.” |
| (C) | | Coupon rate may change based on changes of the underlying collateral or prepayments of principal. The coupon rate shown represents the rate at period end. |
| (D) | | Notes and bonds, issued by foreign entities, denominated in U.S. dollars. The aggregate of these securities is 2.1% of total net assets. |
| (E) | | Security purchased on a delayed delivery or when-issued basis. Rate shown is at issue date. |
| LIBOR | | London Interbank Offered Rate |
| MTN | | Medium Term Note. |
| PLC | | Public Limited Company. |
| PSF-GTD | | Permanent School Fund Guaranteed. |
| Purchased Option Contracts Outstanding at October 31, 2017 |
| | | | | | | | | | | | | | | | | | | | | | | | | |
| Description | | | Exercise
Price | | Expiration
Date | | Number of
Contracts | | | Notional
Amount | | | Market
Value | | | Premiums Paid
(Received) | | | Unrealized Appreciation
(Depreciation) |
| Put Options Purchased | | | | | | | | | | | | | | | | | | | | | | | | |
| 30 Year U.S. Treasury Bond Futures | | | $143.00 | | 12/22/2017 | | 40 | | | | $40,000 | | | | $ 4,375 | | | | $ 6,370 | | | | $ (1,995 | ) |
| 30 Year U.S. Treasury Bond Futures | | | 148.00 | | 12/22/2017 | | 40 | | | | 40,000 | | | | 24,375 | | | | 33,245 | | | | (8,870 | ) |
| | | | | | | | | | | | | | | | | | | | | | | | | |
| Total Put Options Purchased | | | | | | | | | | | | | | | $28,750 | | | | $39,615 | | | | $(10,865 | ) |
| | | | | | | | | | | | | | | | | | | | | | | | | |
| | | | | | | | | | | | | | | | | | | | | | | | | |
| Written Option Contracts Outstanding at October 31, 2017 |
| | | | | | | | | | | | | | | | | | | | | | | | | |
| Description | | | Exercise Price | | Expiration Date | | Number of Contracts | | | Notional Amount | | | Market Value | | | Premiums Paid (Received) | | | Unrealized Appreciation (Depreciation) |
| Put Options Written | | | | | | | | | | | | | | | | | | | | | | | | |
| 30 Year U.S. Treasury Bond Futures | | | $144.00 | | 12/22/2017 | | (40 | ) | | | $(40,000 | ) | | | $ (5,625 | ) | | | $ (8,630 | ) | | | $3,005 | |
| 30 Year U.S. Treasury Bond Futures | | | 146.00 | | 12/22/2017 | | (40 | ) | | | (40,000 | ) | | | (11,875 | ) | | | (16,755 | ) | | | 4,880 | |
| | | | | | | | | | | | | | | | | | | | | | | | | |
| | | | | | | | | | | | | | | | | | | | | | | | | |
| Total Put Options Written | | | | | | | | | | | | | | | $(17,500 | ) | | | $(25,385 | ) | | | $7,885 | |
| | | | | | | | | | | | | | | | | | | | | | | | | |
| See accompanying Notes to Financial Statements. |
| |
| |
| 26 |
Madison Funds | October 31, 2017
| |
| Madison Corporate Bond Fund Portfolio of Investments |
| | | Par Value | | Value (Note 2) | |
| | | | | | |
| CORPORATE NOTES AND BONDS - 94.9% | | | | | | |
| | | | | | | |
| Consumer Discretionary - 13.1% | | | | | | |
| Amazon.com Inc. (A), 2.8%, 8/22/24 | $ | 100,000 | | $ | 100,135 | |
| Amazon.com Inc., 3.8%, 12/5/24 | | 200,000 | | | 213,032 | |
| Charter Communications Operating LLC / Charter Communications Operating Capital Corp., 4.464%, 7/23/22 | | 200,000 | | | 211,215 | |
| Comcast Corp., 6.45%, 3/15/37 | | 300,000 | | | 401,355 | |
| Delphi Automotive PLC (B), 3.15%, 11/19/20 | | 200,000 | | | 204,727 | |
| Discovery Communications Inc., 5%, 9/20/37 | | 200,000 | | | 206,191 | |
| GameStop Corp. (A), 6.75%, 3/15/21 | | 50,000 | | | 52,313 | |
| General Motors Financial Co. Inc., 3.2%, 7/6/21 | | 200,000 | | | 204,075 | |
| Georgia-Pacific LLC (A), 3.163%, 11/15/21 | | 100,000 | | | 102,556 | |
| GLP Capital L.P. / GLP Financing II Inc., 4.875%, 11/1/20 | | 25,000 | | | 26,375 | |
| Harman International Industries Inc., 4.15%, 5/15/25 | | 100,000 | | | 103,069 | |
| Lowe’s Cos. Inc., 2.5%, 4/15/26 | | 100,000 | | | 95,916 | |
| McDonald’s Corp., MTN, 3.5%, 3/1/27 | | 100,000 | | | 102,604 | |
| McDonald’s Corp., MTN, 4.875%, 12/9/45 | | 50,000 | | | 56,935 | |
| Newell Brands Inc., 4.2%, 4/1/26 | | 100,000 | | | 105,384 | |
| Newell Brands Inc., 5.5%, 4/1/46 | | 100,000 | | | 118,695 | |
| Omnicom Group Inc., 3.6%, 4/15/26 | | 200,000 | | | 202,770 | |
| Sirius XM Radio Inc. (A), 6%, 7/15/24 | | 125,000 | | | 133,437 | |
| Toll Brothers Finance Corp., 4%, 12/31/18 | | 50,000 | | | 50,750 | |
| Walgreens Boots Alliance Inc., 4.5%, 11/18/34 | | 150,000 | | | 154,354 | |
| | | | | | |
| | | | | | 2,845,888 | |
| | | | | | | |
| Consumer Staples - 1.7% | | | | | | |
| Anheuser-Busch InBev Finance Inc., 4.9%, 2/1/46 | | 150,000 | | | 168,691 | |
| CVS Health Corp., 5.125%, 7/20/45 | | 100,000 | | | 111,743 | |
| Tyson Foods Inc., 3.55%, 6/2/27 | | 100,000 | | | 101,939 | |
| | | | | | |
| | | | | | 382,373 | |
| | | | | | | |
| Energy - 12.0% | | | | | | |
| Antero Resources Corp., 5.625%, 6/1/23 | | 50,000 | | | 52,375 | |
| Boardwalk Pipelines L.P., 4.45%, 7/15/27 | | 100,000 | | | 102,670 | |
| BP Capital Markets PLC (B), 3.119%, 5/4/26 | | 100,000 | | | 100,825 | |
| Chevron Corp., 3.191%, 6/24/23 | | 200,000 | | | 207,220 | |
| ConocoPhillips Co., 4.15%, 11/15/34 | | 75,000 | | | 79,154 | |
| Devon Energy Corp., 5.6%, 7/15/41 | | 100,000 | | | 112,423 | |
| EnLink Midstream Partners L.P., 4.85%, 7/15/26 | | 50,000 | | | 52,668 | |
| EnLink Midstream Partners L.P., 5.45%, 6/1/47 | | 50,000 | | | 51,893 | |
| Enterprise Products Operating LLC, 4.45%, 2/15/43 | | 200,000 | | | 205,562 | |
| Exxon Mobil Corp., 4.114%, 3/1/46 | | 50,000 | | | 54,453 | |
| Helmerich & Payne International Drilling Co., 4.65%, 3/15/25 | | 100,000 | | | 106,196 | |
| Kinder Morgan Inc. (A), 5%, 2/15/21 | | 50,000 | | | 53,687 | |
| Marathon Oil Corp., 2.7%, 6/1/20 | | 200,000 | | | 199,798 | |
| Marathon Petroleum Corp., 5.125%, 3/1/21 | | 250,000 | | | 270,282 | |
| Phillips 66, 4.65%, 11/15/34 | | 100,000 | | | 108,199 | |
| Phillips 66 Partners L.P., 3.605%, 2/15/25 | | 200,000 | | | 201,465 | |
| Schlumberger Holdings Corp. (A), 2.35%, 12/21/18 | | 200,000 | | | 200,973 | |
| Valero Energy Corp., 6.625%, 6/15/37 | | 350,000 | | | 449,272 | |
| | | | | | |
| | | | | | 2,609,115 | |
| | | | | | | |
| Financials - 34.2% | | | | | | |
| | | | | | | |
| Banks - 21.9% | | | | | | |
| Bank of America Corp., MTN, 2.503%, 10/21/22 | | 200,000 | | | 197,687 | |
| Bank of America Corp., MTN, 3.3%, 1/11/23 | | 200,000 | | | 204,877 | |
| Bank of America Corp., MTN, (3M USD LIBOR + 0.930%) (C), 2.816%, 7/21/23 | | 100,000 | | | 99,896 | |
| Bank of America Corp., MTN, (3M USD LIBOR + 1.090%) (C), 3.093%, 10/1/25 | | 100,000 | | | 99,480 | |
| Bank of Montreal, MTN (B), 1.9%, 8/27/21 | | 100,000 | | | 98,298 | |
| BB&T Corp., MTN, 2.85%, 10/26/24 | | 200,000 | | | 199,524 | |
| Capital One Financial Corp., 2.5%, 5/12/20 | | 100,000 | | | 100,363 | |
| Capital One Financial Corp., 3.3%, 10/30/24 | | 200,000 | | | 200,399 | |
| Citigroup Inc., 2.75%, 4/25/22 | | 100,000 | | | 100,316 | |
| Citigroup Inc., 2.7%, 10/27/22 | | 250,000 | | | 248,699 | |
| Discover Bank, 3.45%, 7/27/26 | | 100,000 | | | 98,670 | |
| Goldman Sachs Group Inc./The, 5.75%, 1/24/22 | | 100,000 | | | 111,950 | |
| Goldman Sachs Group Inc./The, 3.625%, 1/22/23 | | 200,000 | | | 206,870 | |
| Goldman Sachs Group Inc./The, 3.5%, 11/16/26 | | 200,000 | | | 200,281 | |
| Huntington National Bank/The, 2.2%, 4/1/19 | | 300,000 | | | 301,122 | |
| JPMorgan Chase & Co., 4.25%, 10/15/20 | | 100,000 | | | 105,688 | |
| JPMorgan Chase & Co., 2.972%, 1/15/23 | | 200,000 | | | 202,439 | |
| JPMorgan Chase & Co., 3.125%, 1/23/25 | | 200,000 | | | 201,164 | |
| KeyCorp, MTN, 5.1%, 3/24/21 | | 250,000 | | | 272,314 | |
| Morgan Stanley, 2.8%, 6/16/20 | | 200,000 | | | 202,920 | |
| Morgan Stanley, MTN, 3.7%, 10/23/24 | | 200,000 | | | 207,782 | |
| Morgan Stanley, MTN, 3.875%, 1/27/26 | | 100,000 | | | 104,329 | |
| PNC Bank NA, 2.45%, 7/28/22 | | 250,000 | | | 249,717 | |
| PNC Financial Services Group Inc./The, 3.3%, 3/8/22 | | 100,000 | | | 103,535 | |
| Regions Financial Corp., 3.2%, 2/8/21 | | 250,000 | | | 255,653 | |
| Regions Financial Corp., 2.75%, 8/14/22 | | 200,000 | | | 200,348 | |
| US Bancorp, MTN, 2.35%, 1/29/21 | | 200,000 | | | 200,868 | |
| | | | | | |
| | | | | | 4,775,189 | |
| Diversified Financial Services - 7.6% | | | | | | |
| AerCap Ireland Capital DAC / AerCap Global Aviation Trust (B), 3.75%, 5/15/19 | | 150,000 | | | 153,433 | |
| Affiliated Managers Group Inc., 4.25%, 2/15/24 | | 300,000 | | | 314,716 | |
| Air Lease Corp., 3.625%, 4/1/27 | | 100,000 | | | 100,543 | |
| American Express Co., 2.5%, 8/1/22 | | 200,000 | | | 198,974 | |
| Brookfield Finance Inc. (B), 4.25%, 6/2/26 | | 175,000 | | | 181,511 | |
| Cboe Global Markets Inc., 3.65%, 1/12/27 | | 150,000 | | | 153,335 | |
| Intercontinental Exchange Inc., 2.35%, 9/15/22 | | 100,000 | | | 99,620 | |
| Nasdaq Inc., 3.85%, 6/30/26 | | 50,000 | | | 51,637 | |
| Raymond James Financial Inc., 3.625%, 9/15/26 | | 100,000 | | | 100,969 | |
| Synchrony Financial, 3.75%, 8/15/21 | | 100,000 | | | 103,441 | |
| Synchrony Financial, 3.7%, 8/4/26 | | 100,000 | | | 99,004 | |
| TD Ameritrade Holding Corp., 3.3%, 4/1/27 | | 100,000 | | | 101,238 | |
| | | | | | |
| | | | | | 1,658,421 | |
| Insurance - 4.7% | | | | | | |
| American International Group Inc., 3.875%, 1/15/35 | | 200,000 | | | 197,976 | |
| Berkshire Hathaway Inc., 3.125%, 3/15/26 | | 50,000 | | | 50,615 | |
| Liberty Mutual Group Inc. (A), 4.25%, 6/15/23 | | 100,000 | | | 106,343 | |
| MetLife Inc., 3.6%, 4/10/24 | | 100,000 | | | 105,082 | |
| New York Life Global Funding (A), 1.95%, 2/11/20 | | 200,000 | | | 199,490 | |
| Old Republic International Corp., 3.875%, 8/26/26 | | 50,000 | | | 50,680 | |
| Prudential Financial Inc., MTN, 3.5%, 5/15/24 | | 300,000 | | | 312,623 | |
| | | | | | |
| | | | | | 1,022,809 | |
| | | | | | |
| | | | | | 7,456,419 | |
| Health Care - 5.6% | | | | | | |
| AbbVie Inc., 4.7%, 5/14/45 | | 100,000 | | | 108,493 | |
| AbbVie Inc., 4.45%, 5/14/46 | | 100,000 | | | 105,195 | |
| Allergan Funding SCS (B), 4.55%, 3/15/35 | | 130,000 | | | 136,712 | |
| Express Scripts Holding Co., 4.75%, 11/15/21 | | 200,000 | | | 216,004 | |
| Express Scripts Holding Co., 4.8%, 7/15/46 | | 50,000 | | | 51,943 | |
| HCA Inc., 3.75%, 3/15/19 | | 100,000 | | | 101,500 | |
| Laboratory Corp. of America Holdings, 3.6%, 9/1/27 | | 100,000 | | | 101,091 | |
| UnitedHealth Group Inc., 2.875%, 3/15/23 | | 200,000 | | | 203,742 | |
| Zoetis Inc., 3%, 9/12/27 | | 200,000 | | | 195,800 | |
| | | | | | |
| | | | | | 1,220,480 | |
| | | | | | | |
| Industrials - 7.7% | | | | | | |
| Burlington Northern Santa Fe LLC, 4.45%, 3/15/43 | | 200,000 | | | 219,417 | |
| Caterpillar Inc., 5.2%, 5/27/41 | | 20,000 | | | 24,591 | |
| CRH America Inc. (A), 3.875%, 5/18/25 | | 200,000 | | | 208,392 | |
| Fortive Corp., 2.35%, 6/15/21 | | 100,000 | | | 99,436 | |
| General Dynamics Corp., 1.875%, 8/15/23 | | 100,000 | | | 96,576 | |
| Lockheed Martin Corp., 2.9%, 3/1/25 | | 200,000 | | | 199,909 | |
| Masco Corp., 4.375%, 4/1/26 | | 100,000 | | | 106,331 | |
| Norfolk Southern Corp., 3.25%, 12/1/21 | | 200,000 | | | 205,546 | |
| Northrop Grumman Corp., 2.93%, 1/15/25 | | 100,000 | | | 100,256 | |
| Textron Inc., 3.875%, 3/1/25 | | 200,000 | | | 207,892 | |
| Verisk Analytics Inc., 4%, 6/15/25 | | 200,000 | | | 209,423 | |
| | | | | | |
| | | | | | 1,677,769 | |
| | | | | | | |
| Information Technology - 7.5% | | | | | | |
| Activision Blizzard Inc., 3.4%, 6/15/27 | | 100,000 | | | 100,186 | |
| Analog Devices Inc., 5.3%, 12/15/45 | | 50,000 | | | 58,726 | |
| Apple Inc., 2.25%, 2/23/21 | | 200,000 | | | 201,029 | |
| Broadridge Financial Solutions Inc., 3.4%, 6/27/26 | | 100,000 | | | 98,692 | |
| CDW LLC / CDW Finance Corp., 5%, 9/1/23 | | 50,000 | | | 52,188 | |
| Cisco Systems Inc., 2.2%, 2/28/21 | | 150,000 | | | 150,403 | |
| Dell International LLC / EMC Corp. (A), 8.35%, 7/15/46 | | 75,000 | | | 97,190 | |
| Fidelity National Information Services Inc., 3%, 8/15/26 | | 100,000 | | | 97,036 | |
| Fiserv Inc., 2.7%, 6/1/20 | | 200,000 | | | 202,195 | |
| Intel Corp., 4.9%, 7/29/45 | | 100,000 | | | 118,837 | |
| Microsoft Corp., 3.5%, 2/12/35 | | 100,000 | | | 102,073 | |
| NVIDIA Corp., 2.2%, 9/16/21 | | 100,000 | | | 99,506 | |
| Oracle Corp., 4%, 7/15/46 | | 100,000 | | | 103,313 | |
| QUALCOMM Inc., 3.25%, 5/20/27 | | 50,000 | | | 49,995 | |
| VMware Inc., 3.9%, 8/21/27 | | 100,000 | | | 100,181 | |
| | | | | | |
| | | | | | 1,631,550 | |
| | | | | | | |
| Materials - 3.6% | | | | | | |
| Agrium Inc. (B), 3.375%, 3/15/25 | | 200,000 | | | 201,817 | |
| Arconic Inc., 5.125%, 10/1/24 | | 50,000 | | | 53,661 | |
| Dow Chemical Co./The, 4.125%, 11/15/21 | | 200,000 | | | 212,037 | |
| Packaging Corp. of America, 3.65%, 9/15/24 | | 300,000 | | | 307,517 | |
| | | | | | |
| | | | | | 775,032 | |
| See accompanying Notes to Financial Statements. |
| |
| |
| 27 |
Madison Funds | October 31, 2017
| |
| Madison Corporate Bond Fund Portfolio of Investments - continued |
| | | Par Value | | Value (Note 2) | |
| | | | | | |
| CORPORATE NOTES AND BONDS - continued | | | | | | |
| | | | | | | |
| Real Estate - 3.8% | | | | | | |
| Boston Properties L.P., 3.65%, 2/1/26 | $ | 100,000 | | $ | 101,808 | |
| Iron Mountain Inc. (A), 4.375%, 6/1/21 | | 100,000 | | | 102,750 | |
| Simon Property Group L.P., 4.125%, 12/1/21 | | 200,000 | | | 212,279 | |
| SL Green Operating Partnership L.P., 3.25%, 10/15/22 | | 100,000 | | | 100,302 | |
| WP Carey Inc., 4.6%, 4/1/24 | | 200,000 | | | 209,095 | |
| WP Carey Inc., 4.25%, 10/1/26 | | 100,000 | | | 101,621 | |
| | | | | | |
| | | | | | 827,855 | |
| | | | | | | |
| Telecommunication Services - 5.3% | | | | | | |
| AT&T Inc., 5%, 3/1/21 | | 200,000 | | | 217,162 | |
| AT&T Inc., 4.75%, 5/15/46 | | 75,000 | | | 70,746 | |
| AT&T Inc., 5.15%, 2/14/50 | | 100,000 | | | 98,578 | |
| Harris Corp., 5.054%, 4/27/45 | | 200,000 | | | 231,197 | |
| Sprint Spectrum Co. LLC / Sprint Spectrum Co. II LLC / Sprint Spectrum Co. III LLC (A), 3.36%, 3/20/23 | | 100,000 | | | 101,450 | |
| Verizon Communications Inc., 5.15%, 9/15/23 | | 200,000 | | | 224,159 | |
| Verizon Communications Inc., 4.4%, 11/1/34 | | 200,000 | | | 201,319 | |
| | | | | | |
| | | | | | 1,144,611 | |
| | | | | | | |
| Utilities - 0.4% | | | | | | |
| Duke Energy Corp., 3.75%, 9/1/46 | | 100,000 | | | 97,198 | |
| | | | | | |
| | | | | | | |
Total Corporate Notes and Bonds | | | | | | |
(Cost $19,987,286) | | | | | 20,668,290 | |
| | | | | | | |
| LONG TERM MUNICIPAL BONDS - 2.0% | | | | | | |
| County of Palm Beach FL Revenue, 5%, 11/1/33 | | 200,000 | | | 218,724 | |
| County of Pasco FL Water & Sewer Revenue, Series B, 6.76%, 10/1/39 | | 200,000 | | | 217,966 | |
| | | | | | |
Total Long Term Municipal Bonds | | | | | | |
(Cost $426,708) | | | | | 436,690 | |
| | | Shares | | | | |
| | | | | | | | |
| SHORT-TERM INVESTMENTS - 2.5% | | | | | | |
| State Street Institutional U.S. Government Money Market Fund, 0.96%, Premier Class | | 537,127 | | | 537,127 | |
| | | | | | |
Total Short-Term Investments | | | | | | |
(Cost $537,127) | | | | | 537,127 | |
| | | | | | |
| TOTAL INVESTMENTS - 99.4% | | | | | | |
| (Cost $20,951,121**) | | | | | 21,642,107 | |
| NET OTHER ASSETS AND LIABILITIES - 0.6% | | | | | 130,438 | |
| | | | | | |
| TOTAL NET ASSETS - 100.0% | | | | $ | 21,772,545 | |
| | | | | | |
| ** | | Aggregate cost for Federal tax purposes was $20,951,121. |
| (A) | | Security sold within terms of a private placement memorandum exempt from registration under Rule 144A of the Securities Act of 1933, as amended, and may be sold only to dealers in that program or other “qualified institutional buyers.” |
| (B) | | Notes and bonds, issued by foreign entities, denominated in U.S. dollars. The aggregate of these securities is 4.9% of total net assets. |
| (C) | | Floating rate or variable rate note. Rate shown is as of October 31, 2017. |
| MTN | | Medium Term Note. |
| PLC | | Public Limited Company. |
| LIBOR | | London Interbank Offered Rate |
| |
| Madison High Income Fund Portfolio of Investments |
| | | Par Value | | Value (Note 2) | |
| | | | | | |
| CORPORATE NOTES AND BONDS - 89.5% | | | | | | |
| | | | | | | |
| Consumer Discretionary - 21.9% | | | | | | |
| Cablevision Systems Corp., 5.875%, 9/15/22 | $ | 200,000 | | $ | 205,750 | |
| CCO Holdings LLC / CCO Holdings Capital Corp. (A), 5.875%, 4/1/24 | | 300,000 | | | 319,500 | |
| Deck Chassis Acquisition Inc. (A), 10%, 6/15/23 | | 150,000 | | | 168,000 | |
| Diamond Resorts International Inc. (A), 7.75%, 9/1/23 | | 250,000 | | | 270,000 | |
| DISH DBS Corp., 6.75%, 6/1/21 | | 200,000 | | | 210,000 | |
| GameStop Corp. (A), 6.75%, 3/15/21 | | 325,000 | | | 340,031 | |
| Group 1 Automotive Inc., 5%, 6/1/22 | | 325,000 | | | 335,465 | |
| Jack Ohio Finance LLC / Jack Ohio Finance 1 Corp. (A), 6.75%, 11/15/21 | | 400,000 | | | 427,000 | |
| Mclaren Finance PLC (A) (B), 5.75%, 8/1/22 | | 125,000 | | | 128,650 | |
| Nexteer Automotive Group Ltd. (A) (B), 5.875%, 11/15/21 | | 300,000 | | | 313,500 | |
| Outfront Media Capital LLC / Outfront Media Capital Corp., 5.625%, 2/15/24 | | 500,000 | | | 526,250 | |
| Penske Automotive Group Inc., 5.75%, 10/1/22 | | 250,000 | | | 257,893 | |
| PetSmart Inc. (A), 7.125%, 3/15/23 | | 300,000 | | | 228,750 | |
| Pinnacle Entertainment Inc., 5.625%, 5/1/24 | | 250,000 | | | 258,125 | |
| Scientific Games International Inc., 6.25%, 9/1/20 | | 500,000 | | | 504,375 | |
| Scientific Games International Inc. (A), 5%, 10/15/25 | | 125,000 | | | 126,875 | |
| Sirius XM Radio Inc. (A), 4.625%, 5/15/23 | | 250,000 | | | 256,250 | |
| Univision Communications Inc. (A), 5.125%, 5/15/23 | | 300,000 | | | 303,750 | |
| | | | | | |
| | | | | | 5,180,164 | |
| Consumer Staples - 8.3% | | | | | | |
| ACCO Brands Corp. (A), 5.25%, 12/15/24 | | 250,000 | | | 259,063 | |
| Avon International Operations Inc. (A), 7.875%, 8/15/22 | | 250,000 | | | 254,375 | |
| Cott Beverages Inc., 5.375%, 7/1/22 | | 250,000 | | | 260,469 | |
| Dean Foods Co. (A), 6.5%, 3/15/23 | | 200,000 | | | 200,500 | |
| Pilgrim’s Pride Corp. (A), 5.75%, 3/15/25 | | 350,000 | | | 370,562 | |
| Post Holdings Inc. (A), 5.5%, 3/1/25 | | 250,000 | | | 260,625 | |
| Simmons Foods Inc. (A), 5.75%, 11/1/24 | | 350,000 | | | 351,645 | |
| | | | | | |
| | | | | | 1,957,239 | |
| Energy - 12.0% | | | | | | |
| American Midstream Partners L.P. / American Midstream Finance Corp. (A), 8.5%, 12/15/21 | | 250,000 | | | 258,750 | |
| Carrizo Oil & Gas Inc., 6.25%, 4/15/23 | | 375,000 | | | 381,562 | |
| Jonah Energy LLC / Jonah Energy Finance Corp. (A), 7.25%, 10/15/25 | | 250,000 | | | 250,000 | |
| Murphy Oil USA Inc., 5.625%, 5/1/27 | | 400,000 | | | 424,000 | |
| QEP Resources Inc., 5.375%, 10/1/22 | | 300,000 | | | 297,750 | |
| SM Energy Co., 6.75%, 9/15/26 | | 100,000 | | | 102,625 | |
| Southern Star Central Corp. (A), 5.125%, 7/15/22 | | 300,000 | | | 312,750 | |
| Andeavor Logistics L.P. / Andeavor | | | | | | |
| Logistics Finance Corp., 6.375%, 5/1/24 | | 250,000 | | | 273,750 | |
| Unit Corp., 6.625%, 5/15/21 | | 525,000 | | | 526,969 | |
| | | | | | |
| | | | | | 2,828,156 | |
| Financials - 11.2% | | | | | | |
| Donnelley Financial Solutions Inc., 8.25%, 10/15/24 | | 500,000 | | | 536,875 | |
| Equinix Inc., 5.875%, 1/15/26 | | 250,000 | | | 270,937 | |
| FBM Finance Inc. (A), 8.25%, 8/15/21 | | 250,000 | | | 265,937 | |
| Jefferies Finance LLC / JFIN Co-Issuer Corp. (A), 7.25%, 8/15/24 | | 250,000 | | | 255,313 | |
| Ladder Capital Finance Holdings LLLP / Ladder Capital Finance Corp. (A), 5.25%, 10/1/25 | | 250,000 | | | 249,063 | |
| MPT Operating Partnership L.P. / MPT Finance Corp., 5%, 10/15/27 | | 250,000 | | | 256,875 | |
| Nationstar Mortgage LLC / Nationstar Capital Corp., 6.5%, 7/1/21 | | 300,000 | | | 304,500 | |
| Quicken Loans Inc. (A), 5.75%, 5/1/25 | | 250,000 | | | 265,000 | |
| Solera LLC / Solera Finance Inc. (A), 10.5%, 3/1/24 | | 200,000 | | | 228,000 | |
| | | | | | |
| | | | | | 2,632,500 | |
| Health Care - 5.7% | | | | | | |
| Acadia Healthcare Co. Inc., 5.125%, 7/1/22 | | 250,000 | | | 255,000 | |
| Avantor Inc. (A), 6%, 10/1/24 | | 300,000 | | | 306,000 | |
| HCA Inc., 5.875%, 2/15/26 | | 250,000 | | | 262,812 | |
| Mallinckrodt International Finance S.A. (B), 4.75%, 4/15/23 | | 300,000 | | | 252,750 | |
| Valeant Pharmaceuticals International Inc. (A) (B), 5.625%, 12/1/21 | | 300,000 | | | 273,375 | |
| | | | | | |
| | | | | | 1,349,937 | |
| Industrials - 12.1% | | | | | | |
| ARD Finance S.A., 7.125% Cash, 7.875 PIK (B), 7.125%, 9/15/23 | | 250,000 | | | 266,250 | |
| Ashtead Capital Inc. (A), 4.125%, 8/15/25 | | 250,000 | | | 251,875 | |
| Avis Budget Car Rental LLC / Avis Budget Finance Inc. (A), 5.25%, 3/15/25 | | 250,000 | | | 244,375 | |
| Beacon Escrow Corp. (A), 4.875%, 11/1/25 | | 150,000 | | | 151,830 | |
| Bombardier Inc. (A) (B), 8.75%, 12/1/21 | | 250,000 | | | 278,125 | |
| DAE Funding LLC (A), 5%, 8/1/24 | | 250,000 | | | 255,313 | |
| Herc Rentals Inc. (A), 7.5%, 6/1/22 | | 240,000 | | | 259,752 | |
| Mueller Industries Inc., 6%, 3/1/27 | | 250,000 | | | 256,875 | |
| Nielsen Finance LLC / Nielsen Finance Co. (A), 5%, 4/15/22 | | 200,000 | | | 206,000 | |
| Prime Security Services Borrower LLC / Prime Finance Inc. (A), 9.25%, 5/15/23 | | 125,000 | | | 138,525 | |
| Summit Materials LLC / Summit Materials Finance Corp., 8.5%, 4/15/22 | | 250,000 | | | 279,375 | |
| Tennant Co. (A), 5.625%, 5/1/25 | | 250,000 | | | 260,937 | |
| | | | | | |
| | | | | | 2,849,232 | |
| See accompanying Notes to Financial Statements. |
| |
| |
| 28 |
Madison Funds | October 31, 2017
| |
| Madison High Income Fund Portfolio of Investments - continued |
| | | Par Value | | Value (Note 2) | |
| | | | | | |
| CORPORATE NOTES AND BONDS - continued | | | | | | |
| | | | | | | |
| Information Technology - 4.6% | | | | | | |
| Alliance Data Systems Corp. (A), 6.375%, 4/1/20 | $ | 400,000 | | $ | 404,000 | |
| Alliance Data Systems Corp. (A), 5.875%, 11/1/21 | | 100,000 | | | 103,500 | |
| Diebold Nixdorf Inc., 8.5%, 4/15/24 | | 395,000 | | | 415,244 | |
| Western Digital Corp. (A), 7.375%, 4/1/23 | | 150,000 | | | 164,250 | |
| | | | | | |
| | | | | | 1,086,994 | |
| Materials - 3.3% | | | | | | |
| Cornerstone Chemical Co. (A), 6.75%, 8/15/24 | | 250,000 | | | 253,125 | |
| Rayonier AM Products Inc. (A), 5.5%, 6/1/24 | | 550,000 | | | 533,500 | |
| | | | | | |
| | | | | | 786,625 | |
| Real Estate - 1.5% | | | | | | |
| Iron Mountain Inc., 5.75%, 8/15/24 | | 350,000 | | | 358,750 | |
| | | | | | |
| | | | | | | |
| Telecommunication Services - 4.1% | | | | | | |
| Altice Luxembourg S.A. (A) (B), 7.625%, 2/15/25 | | 250,000 | | | 271,250 | |
| Frontier Communications Corp., 6.25%, 9/15/21 | | 150,000 | | | 123,000 | |
| Inmarsat Finance PLC (A) (B), 6.5%, 10/1/24 | | 300,000 | | | 323,063 | |
| Sprint Spectrum Co. LLC / Sprint Spectrum Co. II LLC / Sprint Spectrum Co. III LLC (A), 3.36%, 3/20/23 | | 250,000 | | | 253,625 | |
| | | | | | |
| | | | | | 970,938 | |
| Utilities - 4.8% | | | | | | |
| AES Corp., 5.5%, 3/15/24 | | 400,000 | | | 418,000 | |
| AmeriGas Partners L.P. / AmeriGas Finance Corp., 5.5%, 5/20/25 | | 250,000 | | | 255,625 | |
| Calpine Corp., 5.5%, 2/1/24 | | 250,000 | | | 239,375 | |
| NRG Energy Inc., 6.25%, 5/1/24 | | 200,000 | | | 212,500 | |
| | | | | | |
| | | | | | 1,125,500 | |
| | | | | | |
Total Corporate Notes and Bonds | | | | | | |
(Cost $20,417,944) | | | | | 21,126,035 | |
| | | Shares | | | | |
| | | | | | | |
| MUTUAL FUND - 1.1% | | | | | | |
| | | | | | | |
| Bond Funds - 1.1% | | | | | | |
| iShares iBoxx $ High Yield Corporate Bond ETF | | 3,000 | | | 265,410 | |
| | | | | | |
Total Mutual Funds | | | | | | |
(Cost $258,107) | | | | | 265,410 | |
| SHORT-TERM INVESTMENTS - 7.3% | | | | | | |
| State Street Institutional U.S. Government Money Market Fund, 0.96%, Premier Class | | 1,720,036 | | | 1,720,036 | |
| | | | | | |
Total Short-Term Investments | | | | | | |
(Cost $1,720,036) | | | | | 1,720,036 | |
| | | | | | |
| TOTAL INVESTMENTS - 97.9% | | | | | | |
| (Cost $22,396,087**) | | | | | 23,111,481 | |
| NET OTHER ASSETS AND LIABILITIES - 2.1% | | | | | 488,530 | |
| | | | | | |
| TOTAL NET ASSETS - 100.0% | | | | $ | 23,600,011 | |
| | | | | | |
| ** | | Aggregate cost for Federal tax purposes was $22,396,087. |
| (A) | | Security sold within terms of a private placement memorandum exempt from registration under Rule 144A of the Securities Act of 1933, as amended, and may be sold only to dealers in that program or other “qualified institutional buyers.” |
| (B) | | Notes and bonds, issued by foreign entities, denominated in U.S. dollars. The aggregate of these securities is 8.9% of total net assets. |
| ETF | | Exchange Traded Fund. |
| PIK | | Payment in Kind. |
| PLC | | Public Limited Company. |
| |
| Madison Diversified Income Fund Portfolio of Investments |
| | | Shares | | Value (Note 2) | |
| | | | | | |
| COMMON STOCKS - 62.0% | | | | | | |
| | | | | | | |
| Consumer Discretionary - 3.8% | | | | | | |
| Carnival Corp. | | 31,500 | | $ | 2,091,285 | |
| Home Depot Inc./The | | 15,300 | | | 2,536,434 | |
| McDonald’s Corp. | | 10,000 | | | 1,669,100 | |
| | | | | | |
| | | | | | 6,296,819 | |
| Consumer Staples - 5.3% | | | | | | |
| Diageo PLC, ADR | | 17,000 | | | 2,329,170 | |
| Nestle S.A., ADR | | 31,000 | | | 2,611,130 | |
| PepsiCo Inc. | | 14,500 | | | 1,598,335 | |
| Procter & Gamble Co./The | | 25,000 | | | 2,158,500 | |
| | | | | | |
| | | | | | 8,697,135 | |
| Energy - 4.3% | | | | | | |
| Chevron Corp. | | 17,700 | | | 2,051,253 | |
| Exxon Mobil Corp. | | 33,500 | | | 2,792,225 | |
| Schlumberger Ltd. | | 36,000 | | | 2,304,000 | |
| | | | | | |
| | | | | | 7,147,478 | |
| Financials - 10.6% | | | | | | |
| BB&T Corp. | | 33,500 | | | 1,649,540 | |
| Chubb Ltd. | | 11,000 | | | 1,659,020 | |
| CME Group Inc. | | 21,500 | | | 2,949,155 | |
| Northern Trust Corp. | | 16,000 | | | 1,496,320 | |
| PNC Financial Services Group Inc./The | | 22,000 | | | 3,009,380 | |
| Travelers Cos. Inc./The | | 16,500 | | | 2,185,425 | |
| US Bancorp | | 63,500 | | | 3,453,130 | |
| Wells Fargo & Co. | | 22,000 | | | 1,235,080 | |
| | | | | | |
| | | | | | 17,637,050 | |
| Health Care - 8.3% | | | | | | |
| Amgen Inc. | | 11,000 | | | 1,927,420 | |
| Johnson & Johnson | | 24,000 | | | 3,345,840 | |
| Medtronic PLC | | 21,600 | | | 1,739,232 | |
| Merck & Co. Inc. | | 35,000 | | | 1,928,150 | |
| Novartis AG, ADR | | 28,800 | | | 2,378,304 | |
| Pfizer Inc. | | 69,000 | | | 2,419,140 | |
| | | | | | |
| | | | | | 13,738,086 | |
| Industrials - 10.5% | | | | | | |
| 3M Co. | | 10,500 | | | 2,416,995 | |
| Boeing Co./The | | 10,300 | | | 2,657,194 | |
| Caterpillar Inc. | | 13,000 | | | 1,765,400 | |
| Emerson Electric Co. | | 31,500 | | | 2,030,490 | |
| Fastenal Co. | | 26,500 | | | 1,244,705 | |
| Union Pacific Corp. | | 13,000 | | | 1,505,270 | |
| United Parcel Service Inc., Class B | | 25,200 | | | 2,961,756 | |
| United Technologies Corp. | | 24,000 | | | 2,874,240 | |
| | | | | | |
| | | | | | 17,456,050 | |
| Information Technology - 12.0% | | | | | | |
| Accenture PLC, Class A | | 15,000 | | | 2,135,400 | |
| Analog Devices Inc. | | 15,000 | | | 1,369,500 | |
| Apple Inc. | | 10,500 | | | 1,774,920 | |
| Automatic Data Processing Inc. | | 10,000 | | | 1,162,600 | |
| Cisco Systems Inc. | | 85,500 | | | 2,919,825 | |
| Microsoft Corp. | | 41,500 | | | 3,451,970 | |
| TE Connectivity Ltd. | | 31,500 | | | 2,865,555 | |
| Texas Instruments Inc. | | 22,000 | | | 2,127,180 | |
| Xilinx Inc. | | 27,500 | | | 2,026,475 | |
| | | | | | |
| | | | | | 19,833,425 | |
| Materials - 2.8% | | | | | | |
| Monsanto Co. | | 10,000 | | | 1,211,000 | |
| Praxair Inc. | | 23,500 | | | 3,433,820 | |
| | | | | | |
| | | | | | 4,644,820 | |
| Telecommunication Service - 1.5% | | | | | | |
| Verizon Communications Inc. | | 50,500 | | | 2,417,435 | |
| | | | | | |
| | | | | | | |
| Utilities - 2.9% | | | | | | |
| Dominion Energy Inc. | | 15,500 | | | 1,257,670 | |
| Duke Energy Corp. | | 15,870 | | | 1,401,480 | |
| NextEra Energy Inc. | | 13,500 | | | 2,093,445 | |
| | | | | | |
| | | | | | 4,752,595 | |
| | | | | | |
Total Common Stocks | | | | | | |
(Cost $71,254,655) | | | | | 102,620,893 | |
| | | Par Value | | | |
| | | | | | | |
| ASSET BACKED SECURITIES - 0.8% | | | | | | |
| | | | | | | |
| CarMax Auto Owner Trust, Series 2017-1, Class A2, 1.54%, 2/18/20 | $ | 328,280 | | | 328,239 | |
| Chase Issuance Trust, Series 2017-A1, Class A, (1M LIBOR + 0.300%) (A), 1.539%, 1/18/22 | | 200,000 | | | 200,891 | |
| Chesapeake Funding II LLC, Series 2017 4A, Class A1 (B), 2.12%, 11/15/29 | | 400,000 | | | 399,957 | |
| Porsche Innovative Lease Owner Trust, Series 2015-1, Class A4 (B), 1.43%, 5/21/21 | | 276,095 | | | 276,082 | |
| Santander Drive Auto Receivables Trust, Series 2013-5, Class C, 2.25%, 6/17/19 | | 27,620 | | | 27,638 | |
| Santander Drive Auto Receivables Trust, Series 2013-5, Class D, 2.73%, 10/15/19 | | 75,000 | | | 75,380 | |
| Santander Drive Auto Receivables Trust, Series 2013-A, Class C (B), 3.12%, 10/15/19 | | 7,905 | | | 7,916 | |
| Santander Drive Auto Receivables Trust, Series 2013-4, Class C, 3.25%, 1/15/20 | | 5,243 | | | 5,246 | |
| | | | | | |
| | | | | | | |
Total Asset Backed Securities (Cost $1,321,632) | | | | | 1,321,349 | |
| | | | | | | |
| COLLATERALIZED MORTGAGE OBLIGATIONS - 1.2% | | | | | | |
| | | | | | | |
| Fannie Mae REMICS, Series 2011-31, Class DB, 3.5%, 4/25/31 | | 200,000 | | | 208,777 | |
| Fannie Mae REMICS, Series 2011-36, Class QB, 4%, 5/25/31 | | 250,000 | | | 266,647 | |
| Fannie Mae REMICS, Series 2005-79, Class LT, 5.5%, 9/25/35 | | 100,936 | | | 112,288 | |
| Fannie Mae REMICS, Series 2011-101, Class NC, 2.5%, 4/25/40 | | 323,093 | | | 323,454 | |
| Fannie Mae REMICS, Series 2016-21, Class BA, 3%, 3/25/42 | | 306,350 | | | 311,183 | |
| Freddie Mac REMICS, Series 3825, Class CB, 3.5%, 3/15/26 | | 406,565 | | | 425,491 | |
| See accompanying Notes to Financial Statements. |
| |
| |
| 29 |
Madison Funds | October 31, 2017
| |
| Madison Diversified Income Fund Portfolio of Investments - continued |
| | | Par Value | | Value (Note 2) | |
| | | | | | |
| COLLATERALIZED MORTGAGE OBLIGATIONS - continued | | | | | | |
| | | | | | | |
| Freddie Mac REMICS, Series 3187, Class Z, 5%, 7/15/36 | $ | 270,332 | | $ | 294,994 | |
| | | | | | |
Total Collateralized Mortgage Obligations | | | | | | |
(Cost $1,972,885) | | | | | 1,942,834 | | | | | | | | | |
| COMMERCIAL MORTGAGE-BACKED SECURITIES - 0.8% | | | | | | |
| | | | | | | |
| Fannie Mae-Aces, Series 2016-M2, Class X2, IO (A) (C), 1.094%, 1/25/23 | | 3,843,030 | | | 172,658 | |
| Fannie Mae-Aces, Series 2013-M12, Class APT (A) (C), 2.393%, 3/25/23 | | 379,580 | | | 379,924 | |
| FHLMC Multifamily Structured Pass Through Certificates, Series K066, Class A2, 3.117%, 6/25/27 | | 225,000 | | | 229,899 | |
| FREMF Mortgage Trust, Series 2011-K702, Class B (A) (B) (C), 4.785%, 4/25/44 | | 300,000 | | | 302,127 | |
| FREMF Mortgage Trust, Series 2012-K708, Class B (A) (B) (C), 3.751%, 2/25/45 | | 300,000 | | | 304,602 | |
| | | | | | |
Total Commercial Mortgage-Backed Securities | | | | | | |
(Cost $1,406,905) | | | | | 1,389,210 | | | | | | | | | |
| CORPORATE NOTES AND BONDS - 13.6% | | | | | | |
| | | | | | | |
| Consumer Discretionary - 3.0% | | | | | | |
| Advance Auto Parts Inc., 4.5%, 12/1/23 | | 500,000 | | | 523,345 | |
| Amazon.com Inc., 3.3%, 12/5/21 | | 200,000 | | | 208,217 | |
| Amazon.com Inc. (B), 2.8%, 8/22/24 | | 125,000 | | | 125,169 | |
| Charter Communications Operating LLC / Charter Communications Operating Capital Corp., 4.464%, 7/23/22 | | 400,000 | | | 422,430 | |
| Discovery Communications Inc., 5%, 9/20/37 | | 250,000 | | | 257,739 | |
| ERAC USA Finance LLC (B), 6.7%, 6/1/34 | | 150,000 | | | 188,197 | |
| Ford Motor Credit Co. LLC, MTN, 2.943%, 1/8/19 | | 300,000 | | | 303,182 | |
| GameStop Corp. (B), 6.75%, 3/15/21 | | 100,000 | | | 104,625 | |
| General Motors Financial Co. Inc., 3.2%, 7/6/21 | | 300,000 | | | 306,113 | |
| GLP Capital L.P. / GLP Financing II Inc., 4.875%, 11/1/20 | | 125,000 | | | 131,875 | |
| Lennar Corp., 4.75%, 4/1/21 | | 150,000 | | | 157,125 | |
| Marriott International Inc., 3.125%, 6/15/26 | | 250,000 | | | 248,263 | |
| McDonald’s Corp., MTN, 4.875%, 12/9/45 | | 300,000 | | | 341,613 | |
| Newell Brands Inc., 5.5%, 4/1/46 | | 450,000 | | | 534,128 | |
| Omnicom Group Inc., 3.6%, 4/15/26 | | 350,000 | | | 354,847 | |
| Priceline Group Inc./The, 3.6%, 6/1/26 | | 250,000 | | | 255,527 | |
| Time Warner Inc., 4.75%, 3/29/21 | | 400,000 | | | 428,782 | |
| Walgreens Boots Alliance Inc., 4.5%, 11/18/34 | | 155,000 | | | 159,499 | |
| | | | | | |
| | | | | | 5,050,676 | |
| Consumer Staples - 0.6% | | | | | | |
| | | | | | | |
| Anheuser-Busch InBev Finance Inc., 4.9%, 2/1/46 | | 250,000 | | | 281,153 | |
| Bunge Ltd. Finance Corp., 3.25%, 8/15/26 | | 250,000 | | | 242,604 | |
| CVS Health Corp., 5.125%, 7/20/45 | | 250,000 | | | 279,357 | |
| Tyson Foods Inc., 3.55%, 6/2/27 | | 150,000 | | | 152,909 | |
| | | | | | |
| | | | | | 956,023 | |
| Energy - 2.1% | | | | | | |
| Antero Resources Corp., 5.625%, 6/1/23 | | 150,000 | | | 157,125 | |
| BP Capital Markets PLC (D), 3.119%, 5/4/26 | | 200,000 | | | 201,650 | |
| ConocoPhillips Co., 4.15%, 11/15/34 | | 500,000 | | | 527,693 | |
| Enterprise Products Operating LLC, 5.2%, 9/1/20 | | 450,000 | | | 486,457 | |
| Enterprise Products Operating LLC, 3.75%, 2/15/25 | | 300,000 | | | 312,505 | |
| Exxon Mobil Corp., 4.114%, 3/1/46 | | 225,000 | | | 245,039 | |
| Marathon Oil Corp., 2.7%, 6/1/20 | | 300,000 | | | 299,697 | |
| Phillips 66, 4.65%, 11/15/34 | | 500,000 | | | 540,998 | |
| Schlumberger Holdings Corp. (B), 4%, 12/21/25 | | 300,000 | | | 316,028 | |
| Valero Energy Corp., 6.625%, 6/15/37 | | 250,000 | | | 320,909 | |
| | | | | | |
| | | | | | 3,408,101 | |
| Financials - 3.4% | | | | | | |
| Air Lease Corp., 3.75%, 2/1/22 | | 300,000 | | | 313,364 | |
| Air Lease Corp., 3.625%, 4/1/27 | | 200,000 | | | 201,087 | |
| American Express Co., 2.5%, 8/1/22 | | 150,000 | | | 149,230 | |
| Bank of America Corp., MTN, (3M USD LIBOR + 1.090%) (A), 3.093%, 10/1/25 | | 400,000 | | | 397,919 | |
| Bank of Montreal, MTN (D), 1.9%, 8/27/21 | | 250,000 | | | 245,745 | |
| BB&T Corp., MTN, 2.85%, 10/26/24 | | 200,000 | | | 199,524 | |
| Berkshire Hathaway Inc., 3.125%, 3/15/26 | | 100,000 | | | 101,230 | |
| Brookfield Finance Inc. (D), 4.25%, 6/2/26 | | 125,000 | | | 129,651 | |
| Capital One Financial Corp., 2.45%, 4/24/19 | | 200,000 | | | 201,090 | |
| Capital One Financial Corp., 3.3%, 10/30/24 | | 200,000 | | | 200,399 | |
| Cboe Global Markets Inc., 3.65%, 1/12/27 | | 175,000 | | | 178,891 | |
| Goldman Sachs Group Inc./The(3M USD LIBOR + 1.201%) (A), 3.272%, 9/29/25 | | 350,000 | | | 348,783 | |
| Huntington National Bank/The, 2.2%, 4/1/19 | | 400,000 | | | 401,496 | |
| Intercontinental Exchange Inc., 2.35%, 9/15/22 | | 200,000 | | | 199,241 | |
| JPMorgan Chase & Co., 2.972%, 1/15/23 | | 300,000 | | | 303,658 | |
| JPMorgan Chase & Co., 2.95%, 10/1/26 | | 350,000 | | | 343,824 | |
| Morgan Stanley, MTN, 3.875%, 1/27/26 | | 100,000 | | | 104,329 | |
| Morgan Stanley, 4.3%, 1/27/45 | | 250,000 | | | 263,622 | |
| Nasdaq Inc., 3.85%, 6/30/26 | | 50,000 | | | 51,637 | |
| New York Life Global Funding (B), 1.95%, 2/11/20 | | 300,000 | | | 299,234 | |
| Regions Financial Corp., 3.2%, 2/8/21 | | 250,000 | | | 255,653 | |
| Regions Financial Corp., 2.75%, 8/14/22 | | 250,000 | | | 250,435 | |
| Synchrony Financial, 3.75%, 8/15/21 | | 250,000 | | | 258,604 | |
| Synchrony Financial, 3.7%, 8/4/26 | | 250,000 | | | 247,509 | |
| | | | | | |
| | | | | | 5,646,155 | |
| Health Care - 1.1% | | | | | | |
| AbbVie Inc., 4.45%, 5/14/46 | | 200,000 | | | 210,389 | |
| Allergan Funding SCS (D), 4.75%, 3/15/45 | | 150,000 | | | 158,238 | |
| HCA Inc., 3.75%, 3/15/19 | | 150,000 | | | 152,250 | |
| Merck Sharp & Dohme Corp., 5.75%, 11/15/36 | | 220,000 | | | 277,629 | |
| Shire Acquisitions Investments Ireland DAC (D), 1.9%, 9/23/19 | | 350,000 | | | 348,602 | |
| UnitedHealth Group Inc., 2.875%, 3/15/23 | | 400,000 | | | 407,485 | |
| Zoetis Inc., 3%, 9/12/27 | | 250,000 | | | 244,751 | |
| | | | | | |
| | | | | | 1,799,344 | |
| Industrials - 0.4% | | | | | | |
| Masco Corp., 4.375%, 4/1/26 | | 150,000 | | | 159,496 | |
| Norfolk Southern Corp., 5.59%, 5/17/25 | | 239,000 | | | 273,616 | |
| United Rentals North America Inc., 4.625%, 7/15/23 | | 150,000 | | | 156,375 | |
| | | | | | |
| | | | | | 589,487 | |
| Information Technology - 2.1% | | | | | | |
| Analog Devices Inc., 5.3%, 12/15/45 | | 225,000 | | | 264,269 | |
| Apple Inc., 2.4%, 5/3/23 | | 450,000 | | | 449,107 | |
| Autodesk Inc., 4.375%, 6/15/25 | | 250,000 | | | 267,006 | |
| Broadridge Financial Solutions Inc., 3.95%, 9/1/20 | | 450,000 | | | 470,346 | |
| Dell International LLC / EMC Corp. (B), 8.35%, 7/15/46 | | 75,000 | | | 97,190 | |
| Fidelity National Information Services Inc., 3%, 8/15/26 | | 175,000 | | | 169,812 | |
| Fiserv Inc., 2.7%, 6/1/20 | | 250,000 | | | 252,744 | |
| Hewlett Packard Enterprise Co., 6.35%, 10/15/45 | | 175,000 | | | 186,312 | |
| Intel Corp., 4.9%, 7/29/45 | | 250,000 | | | 297,091 | |
| International Business Machines Corp., 1.875%, 8/1/22 | | 400,000 | | | 391,006 | |
| Oracle Corp., 4%, 7/15/46 | | 325,000 | | | 335,768 | |
| Thomson Reuters Corp. (D), 4.3%, 11/23/23 | | 225,000 | | | 239,226 | |
| | | | | | |
| | | | | | 3,419,877 | |
| Real Estate - 0.3% | | | | | | |
| Brixmor Operating Partnership L.P., 3.65%, 6/15/24 | | 250,000 | | | 248,820 | |
| Iron Mountain Inc. (B), 4.375%, 6/1/21 | | 100,000 | | | 102,750 | |
| Welltower Inc., 4.5%, 1/15/24 | | 200,000 | | | 214,252 | |
| | | | | | |
| | | | | | 565,822 | |
| Telecommunication Services - 0.6% | | | | | | |
| AT&T Inc., 4.75%, 5/15/46 | | 200,000 | | | 188,655 | |
| AT&T Inc., 5.15%, 2/14/50 | | 150,000 | | | 147,867 | |
| Harris Corp., 5.054%, 4/27/45 | | 250,000 | | | 288,996 | |
| Verizon Communications Inc., 5.15%, 9/15/23 | | 400,000 | | | 448,318 | |
| | | | | | |
| | | | | | 1,073,836 | |
| | | | | | |
Total Corporate Notes and Bonds | | | | | | |
(Cost $21,495,583 ) | | | | | 22,509,321 | |
| | | | | | | |
| LONG TERM MUNICIPAL BONDS - 2.1% | | | | | | |
| | | | | | | |
| County of Pasco FL Water & Sewer Revenue, Series B, 6.76%, 10/1/39 | | 500,000 | | | 544,915 | |
| Los Angeles Department of Water & Power Revenue, 6.166%, 7/1/40 | | 500,000 | | | 549,785 | |
| Metropolitan Transportation Authority Revenue, 6.548%, 11/15/31 | | 325,000 | | | 425,828 | |
| New York City Transitional Finance Authority Future Tax Secured Revenue, 6.267%, 8/1/39 | | 500,000 | | | 534,825 | |
| Northside Independent School District, General Obligation, Series B, (PSF-GTD), 5.741%, 8/15/35 | | 325,000 | | | 345,943 | |
| Rancho Water District Financing Authority Revenue, (Prerefunded 8/1/20 @ $100), 6.337%, 8/1/40 | | 5,000 | | | 5,569 | |
| Rancho Water District Financing Authority Revenue, 6.337%, 8/1/40 | | 345,000 | | | 383,889 | |
| University of Massachusetts Building Authority Revenue, 6.573%, 5/1/39 | | 500,000 | | | 532,760 | |
| Washington County School District #1 West Union, General Obligation, 4.355%, 6/30/34 | | 200,000 | | | 205,348 | |
| | | | | | |
| | | | | | | |
Total Long Term Municipal Bonds | | | | | | |
(Cost $3,493,896) | | | | | 3,528,862 | |
| | | | | | | |
| MORTGAGE BACKED SECURITIES - 8.3% | | | | | | |
| | | | | | | |
| Fannie Mae - 5.2% | | | | | | |
| | | | | | | |
| 3.5%, 8/1/26 Pool # AL0787 | | 172,675 | | | 179,397 | |
| 3%, 5/1/27 Pool # AL1715 | | 226,084 | | | 232,285 | |
| 3.5%, 5/1/28 Pool # AL3678 | | 319,341 | | | 333,855 | |
| 3.5%, 8/1/29 Pool # MA2003 | | 201,230 | | | 209,155 | |
| 3%, 9/1/30 Pool # 890696 | | 242,751 | | | 249,241 | |
| 3%, 12/1/30 Pool # AL8924 | | 392,717 | | | 403,330 | |
| 7%, 11/1/31 Pool # 607515 | | 8,436 | | | 9,397 | |
| 3.5%, 12/1/31 Pool # MA0919 | | 406,655 | | | 421,400 | |
| 3%, 2/1/32 Pool # AL9867 | | 230,950 | | | 236,842 | |
| See accompanying Notes to Financial Statements. |
| |
| |
| 30 |
Madison Funds | October 31, 2017
| |
| Madison Diversified Income Fund Portfolio of Investments - continued |
| | | Par Value | | Value (Note 2) | |
| | | | | | |
| MORTGAGE BACKED SECURITIES - continued | | | | | | |
| | | | | | | |
| Fannie Mae - continued | | | | | | |
| | | | | | | |
| 7%, 5/1/32 Pool # 644591 | $ | 1,287 | | $ | 1,399 | |
| 3.5%, 8/1/32 Pool # MA3098 | | 244,540 | | | 254,482 | |
| 3.5%, 9/1/32 Pool # MA3126 | | 199,444 | | | 207,572 | |
| 5.5%, 10/1/33 Pool # 254904 | | 55,987 | | | 62,586 | |
| 7%, 7/1/34 Pool # 792636 | | 4,890 | | | 5,048 | |
| 4%, 2/1/35 Pool # MA2177 | | 393,751 | | | 417,105 | |
| 5%, 8/1/35 Pool # 829670 | | 46,697 | | | 51,157 | |
| 5%, 9/1/35 Pool # 820347 | | 67,800 | | | 75,302 | |
| 5%, 9/1/35 Pool # 835699 | | 55,225 | | | 61,311 | |
| 3%, 12/1/35 Pool # AS6267 | | 309,250 | | | 314,914 | |
| 5%, 12/1/35 Pool # 850561 | | 20,003 | | | 21,902 | |
| 5.5%, 9/1/36 Pool # 831820 | | 99,767 | | | 112,420 | |
| 6%, 9/1/36 Pool # 831741 | | 75,433 | | | 84,562 | |
| 5.5%, 10/1/36 Pool # 901723 | | 41,889 | | | 46,610 | |
| 5.5%, 12/1/36 Pool # 903059 | | 90,705 | | | 101,317 | |
| 4.5%, 7/1/41 Pool # AB3274 | | 201,190 | | | 217,588 | |
| 5.5%, 7/1/41 Pool # AL6588 | | 189,599 | | | 211,857 | |
| 3.5%, 6/1/42 Pool # AO4134 | | 307,830 | | | 317,946 | |
| 4%, 6/1/42 Pool # MA1087 | | 219,721 | | | 231,570 | |
| 3.5%, 8/1/42 Pool # AO8100 | | 191,135 | | | 197,284 | |
| 3.5%, 8/1/42 Pool # AP2133 | | 227,177 | | | 234,543 | |
| 4%, 10/1/42 Pool # AP7363 | | 404,769 | | | 426,420 | |
| 3%, 2/1/43 Pool # AB8486 | | 335,643 | | | 337,659 | |
| 3%, 2/1/43 Pool # AB8563 | | 203,237 | | | 204,458 | |
| 3%, 2/1/43 Pool # AL3072 | | 319,002 | | | 321,261 | |
| 3%, 3/1/43 Pool # AB8818 | | 328,071 | | | 330,040 | |
| 3.5%, 3/1/43 Pool # AT0310 | | 176,978 | | | 182,730 | |
| 4%, 1/1/45 Pool # AS4257 | | 156,082 | | | 164,824 | |
| 4%, 1/1/45 Pool # MA2145 | | 414,611 | | | 435,927 | |
| 4.5%, 2/1/45 Pool # MA2193 | | 307,614 | | | 329,230 | |
| 3.5%, 12/1/45 Pool # AS6309 | | 182,372 | | | 187,606 | |
| 3%, 1/1/47 Pool # BE0108 | | 236,846 | | | 237,731 | |
| | | | | | |
| | | | | | 8,661,263 | |
| Freddie Mac - 3.1% | | | | | | |
| | | | | | | |
| 4.5%, 2/1/25 Pool # J11722 | | 43,431 | | | 45,933 | |
| 4.5%, 5/1/25 Pool # J12247 | | 37,332 | | | 39,490 | |
| 3.5%, 1/1/29 Pool # J31950 | | 371,989 | | | 388,259 | |
| 8%, 6/1/30 Pool # C01005 | | 1,269 | | | 1,476 | |
| 6.5%, 1/1/32 Pool # C62333 | | 37,786 | | | 41,905 | |
| 5%, 10/1/39 Pool # G60465 | | 473,550 | | | 517,105 | |
| 3.5%, 11/1/40 Pool # G06168 | | 319,499 | | | 330,046 | |
| 4.5%, 9/1/41 Pool # Q03516 | | 166,551 | | | 178,536 | |
| 4%, 10/1/41 Pool # Q04092 | | 237,288 | | | 251,476 | |
| 3%, 8/1/42 Pool # G08502 | | 281,434 | | | 283,210 | |
| 3%, 9/1/42 Pool # C04233 | | 290,903 | | | 292,810 | |
| 3%, 4/1/43 Pool # V80025 | | 340,881 | | | 343,208 | |
| 3%, 4/1/43 Pool # V80026 | | 333,229 | | | 335,507 | |
| 3.5%, 8/1/44 Pool # Q27927 | | 517,943 | | | 535,089 | |
| 3%, 7/1/45 Pool # G08653 (F), | | 404,735 | | | 405,630 | |
| 3.5%, 8/1/45 Pool # Q35614 | | 399,647 | | | 412,093 | |
| 3%, 10/1/46 Pool # G60722 | | 301,924 | | | 302,921 | |
| 4%, 3/1/47 Pool # Q46801 | | 380,766 | | | 400,285 | |
| | | | | | |
| | | | | | 5,104,979 | |
| Ginnie Mae - 0.0% | | | | | | |
| | | | | | | |
| 6.5%, 2/20/29 Pool # 2714 | | 15,632 | | | 18,117 | |
| 6.5%, 4/20/31 Pool # 3068 | | 8,796 | | | 10,266 | |
| | | | | | |
| | | | | | 28,383 | |
| | | | | | |
Total Mortgage Backed Securities | | | | | | |
(Cost $13,821,472) | | | | | 13,794,625 | |
| | | | | | | |
| U.S. GOVERNMENT AND AGENCY OBLIGATIONS - 9.3% | | | | | | |
| | | | | | | |
| Federal Home Loan Bank - 0.2% | | | | | | |
| | | | | | | |
| 1.750%, 12/21/23 (E) | | 400,000 | | | 399,318 | |
| | | | | | |
| | | | | | | |
| U.S. Treasury Bonds - 1.7% | | | | | | |
| 6.625%, 2/15/27 | | 860,000 | | | 1,170,137 | |
| 3.000%, 5/15/42 | | 500,000 | | | 515,898 | |
| 2.500%, 2/15/45 | | 250,000 | | | 232,559 | |
| 2.500%, 5/15/46 | | 250,000 | | | 231,592 | |
| 2.250%, 8/15/46 | | 500,000 | | | 438,379 | |
| 3.000%, 5/15/47 | | 150,000 | | | 153,627 | |
| | | | | | |
| | | | | | 2,742,192 | |
| | | | | | | |
| U.S. Treasury Notes - 7.4% | | | | | | |
| 3.125%, 5/15/19 | | 500,000 | | | 511,973 | |
| 1.625%, 8/31/19 | | 2,000,000 | | | 2,001,250 | |
| 3.375%, 11/15/19 | | 2,000,000 | | | 2,070,391 | |
| 2.000%, 7/31/20 | | 1,500,000 | | | 1,511,660 | |
| 2.625%, 11/15/20 | | 2,250,000 | | | 2,308,271 | |
| 1.750%, 5/15/22 | | 1,600,000 | | | 1,586,125 | |
| 2.500%, 8/15/23 | | 750,000 | | | 766,055 | |
| 2.125%, 3/31/24 | | 1,000,000 | | | 996,406 | |
| 1.500%, 8/15/26 | | 500,000 | | | 466,680 | |
| | | | | | |
| | | | | | 12,218,811 | |
| | | | | | |
Total U.S. Government and Agency Obligations
(Cost $15,185,202) | | | | | 15,360,321 | |
| | | | | | | |
| | | Shares | | | | |
| | | | | | | |
| SHORT-TERM INVESTMENTS - 2.0% | | | | | | |
| State Street Institutional U.S. Government Money Market Fund, 0.96%, Premier Class | | 3,350,271 | | | 3,350,271 | |
| | | | | | |
Total Short-Term Investments | | | | | | |
(Cost $3,350,271) | | | | | 3,350,271 | |
| | | | | | |
| TOTAL INVESTMENTS - 100.1% | | | | | | |
| (Cost $133,302,501**) | | | | | 165,817,686 | |
| NET OTHER ASSETS AND LIABILITIES - (0.1%) | | | | | (149,125 | ) |
| | | | | | |
| TOTAL NET ASSETS - 100.0% | | | | $ | 165,668,561 | |
| | | | | | |
| ** | | Aggregate cost for Federal tax purposes was $133,452,894. |
| (A) | | Floating rate or variable rate note. Rate shown is as of October 31, 2017. |
| (B) | | Security sold within terms of a private placement memorandum exempt from registration under section 144A of the Securities Act of 1933, as amended, and may be sold only to dealers in that program or other “qualified institutional buyers.” |
| (C) | | Coupon rate may change based on changes of the underlying collateral or prepayments of principal. The coupon rate shown represents the rate at period end. |
| (D) | | Notes and bonds, issued by foreign entities, denominated in U.S. dollars. The aggregate of these securities is 0.8% of total net assets. |
| (E) | | Stepped rate security. Rate shown is as of October 31, 2017. |
| (F) | | Security purchased on a delayed delivery or when-issued basis. Rate shown is at issue date. |
| ADR | | American Depositary Receipt. |
| LIBOR | | London Interbank Offered Rate. |
| MTN | | Medium Term Note. |
| PLC | | Public Limited Company. |
| See accompanying Notes to Financial Statements. |
| |
| |
| 31 |
Madison Funds | October 31, 2017
| |
| Madison Covered Call & Equity Income Fund Portfolio of Investments |
| | | Shares | | Value (Note 2) | |
| | | | | | |
| COMMON STOCKS - 79.6% | | | | | | |
| | | | | | | |
| Consumer Discretionary - 8.6% | | | | | | |
| | | | | | | |
| Discovery Communications Inc., Class A * | | 33,800 | | $ | 638,144 | |
| Discovery Communications Inc., Class C * | | 36,000 | | | 641,160 | |
| General Motors Co. (A) | | 35,000 | | | 1,504,300 | |
| Lowe’s Cos. Inc. (A) | | 49,300 | | | 3,941,535 | |
| Nordstrom Inc. | | 52,300 | | | 2,073,695 | |
| Whirlpool Corp. (A) | | 13,300 | | | 2,180,269 | |
| | | | | | |
| | | | | | 10,979,103 | |
| Consumer Staples - 5.8% | | | | | | |
| Costco Wholesale Corp. (A) | | 18,200 | | | 2,931,656 | |
| CVS Health Corp. (A) | | 35,200 | | | 2,412,256 | |
| JM Smucker Co./The (A) | | 20,000 | | | 2,121,000 | |
| | | | | | |
| | | | | | 7,464,912 | |
| Energy - 10.1% | | | | | | |
| Apache Corp. (A) | | 77,700 | | | 3,214,449 | |
| Baker Hughes, a GE Co. | | 71,300 | | | 2,240,959 | |
| Marathon Petroleum Corp. (A) | | 26,200 | | | 1,565,188 | |
| National Oilwell Varco Inc. (A) | | 44,200 | | | 1,511,198 | |
| Occidental Petroleum Corp. (A) | | 31,400 | | | 2,027,498 | |
| Range Resources Corp. (A) | | 131,200 | | | 2,376,032 | |
| | | | | | |
| | | | | | 12,935,324 | |
| Financials - 6.7% | | | | | | |
| Bank of America Corp. (A) | | 76,000 | | | 2,081,640 | |
| Citigroup Inc. (A) | | 34,000 | | | 2,499,000 | |
| JPMorgan Chase & Co. (A) | | 20,300 | | | 2,042,383 | |
| Northern Trust Corp. (A) | | 20,400 | | | 1,907,808 | |
| | | | | | |
| | | | | | 8,530,831 | |
| Health Care - 9.2% | | | | | | |
| Baxter International Inc. (A) | | 50,300 | | | 3,242,841 | |
| Cerner Corp. * (A) | | 20,200 | | | 1,363,904 | |
| Express Scripts Holding Co. * (A) | | 44,200 | | | 2,709,018 | |
| Gilead Sciences Inc. (A) | | 41,200 | | | 3,088,352 | |
| McKesson Corp. (A) | | 10,500 | | | 1,447,740 | |
| | | | | | |
| | | | | | 11,851,855 | |
| Industrials - 8.5% | | | | | | |
| Delta Air Lines Inc. (A) | | 44,000 | | | 2,201,320 | |
| Fastenal Co. (A) | | 40,000 | | | 1,878,800 | |
| Textron Inc. (A) | | 65,000 | | | 3,428,100 | |
| Union Pacific Corp. | | 16,400 | | | 1,898,956 | |
| United Technologies Corp. (A) | | 12,100 | | | 1,449,096 | |
| | | | | | |
| | | | | | 10,856,272 | |
| Information Technology - 15.1% | | | | | | |
| Alphabet Inc., Class C * (A) | | 2,700 | | | 2,744,928 | |
| Analog Devices Inc. (A) | | 21,400 | | | 1,953,820 | |
| Ciena Corp. * (A) | | 137,600 | | | 2,926,752 | |
| Intel Corp. (A) | | 9,000 | | | 409,410 | |
| Microsoft Corp. (A) | | 28,400 | | | 2,362,312 | |
| QUALCOMM Inc. (A) | | 58,800 | | | 2,999,388 | |
| Visa Inc., Class A (A) | | 23,700 | | | 2,606,526 | |
| Xilinx Inc. (A) | | 45,500 | | | 3,352,895 | |
| | | | | | |
| | | | | | 19,356,031 | |
| Materials - 3.5% | | | | | | |
| DowDuPont Inc. (A) | | 45,000 | | | 3,253,950 | |
| Freeport-McMoRan Inc. * | | 90,000 | | | 1,258,200 | |
| | | | | | |
| | | | | | 4,512,150 | |
| Real Estate - 3.9% | | | | | | |
| Weyerhaeuser Co. (A) | | 140,700 | | | 5,052,537 | |
| | | | | | |
| | | | | | | |
| Telecommunication Service - 4.7% | | | | | | |
| T-Mobile U.S. Inc. * (A) | | 99,800 | | | 5,965,046 | |
| | | | | | |
| | | | | | | |
| Utilities - 3.5% | | | | | | |
| NRG Energy Inc. (A) | | 181,000 | | | 4,525,000 | |
| | | | | | |
Total Common Stocks | | | | | | |
(Cost $111,653,400) | | | | | 102,029,061 | |
| | | | | | | |
| EXCHANGE TRADED FUNDS - 6.0% | | | | | | |
| PowerShares DB Gold Fund * | | 72,600 | | | 2,933,766 | |
| SPDR S&P Oil & Gas Exploration & Production ETF (A) | | 70,900 | | | 2,430,452 | |
| VanEck Vectors Gold Miners ETF | | 103,600 | | | 2,328,928 | |
| | | | | | |
| | | | | | | |
Total Exchange Traded Funds | | | | | | |
(Cost $7,889,421) | | | | | 7,693,146 | |
| | | | | | | |
| SHORT-TERM INVESTMENTS - 12.2% | | | | | | |
| State Street Institutional U.S. Government Money Market Fund, 0.96%, Premier Class | | 15,647,062 | | | 15,647,062 | |
| | | | | | |
Total Short-Term Investments | | | | | | |
(Cost $15,647,062) | | | | | 15,647,062 | |
| | | Par Value | | | | |
| | | | | | | |
| U.S. GOVERNMENT AND AGENCY OBLIGATIONS - 3.9% | | | | | | |
| U.S. Treasury Bill (B), 1.037%, 1/11/18 | $ | 5,000,000 | | | 4,989,720 | |
| | | | | | |
| Total U.S. Government and Agency Obligations (Cost $4,989,947) | | | | | 4,989,720 | |
| | | | | | |
| TOTAL INVESTMENTS - 101.7% | | | | | | |
| (Cost $140,179,830**) | | | | | 130,358,989 | |
| TOTAL CALL WRITTEN - (2.0%) | | | | | (2,510,594 | ) |
| NET OTHER ASSETS AND LIABILITIES - 0.3% | | | | | 394,489 | |
| | | | | | |
| TOTAL NET ASSETS - 100.0% | | | | $ | 128,242,884 | |
| | | | | | |
| * | | Non-income producing. |
| ** | | Aggregate cost for Federal tax purposes was $142,502,506. |
| (A) | | All or a portion of these securities’ positions represent covers (directly or through conversion rights) for outstanding options written. |
| (B) | | Rate noted represents annualized yield at time of purchase. |
| ETF | | Exchange Traded Fund. |
Written Option Contracts Outstanding at October 31, 2017
| Description | | Exercise Price | | Expiration Date | | Number of
Contracts | | Notional
Amount | | Market Value | | Premiums
(Received) | | Unrealized Appreciation
(Depreciation) |
| |
| | | | | | | | | | | | | | | | | | | | | | | | | | | | | |
| Call Options Written | | | | | | | | | | | | | | | | | | | | | | | | | | | | |
| Alphabet Inc., Class C | | $ | 935.00 | | | | 11/17/2017 | | | | (27) | | | $ | (2,700) | | | $ | (224,235) | | | $ | (62,610) | | | $ | (161,625) | |
| Analog Devices Inc. | | | 87.50 | | | | 12/15/2017 | | | | (214) | | | | (21,400) | | | | (113,420) | | | | (57,556) | | | | (55,864 | ) |
| Apache Corp. | | | 47.50 | | | | 01/19/2018 | | | | (67) | | | | (6,700) | | | | (3,986) | | | | (8,774) | | | | 4,788 | |
| Bank of America Corp. | | | 25.00 | | | | 11/17/2017 | | | | (760) | | | | (76,000) | | | | (184,680) | | | | (46,327) | | | | (138,353 | ) |
| Baxter International Inc. | | | 65.00 | | | | 12/15/2017 | | | | (280) | | | | (28,000) | | | | (30,100) | | | | (28,268) | | | | (1,832 | ) |
| Baxter International Inc. | | | 65.00 | | | | 01/19/2018 | | | | (223) | | | | (22,300) | | | | (34,342) | | | | (27,839) | | | | (6,503 | ) |
| Cerner Corp. | | | 67.50 | | | | 12/15/2017 | | | | (202) | | | | (20,200) | | | | (44,945) | | | | (36,228) | | | | (8,717 | ) |
| Ciena Corp. | | | 23.00 | | | | 11/17/2017 | | | | (218) | | | | (21,800) | | | | (1,962) | | | | (13,943) | | | | 11,981 | |
| Ciena Corp. | | | 24.00 | | | | 01/19/2018 | | | | (562) | | | | (56,200) | | | | (30,067) | | | | (45,158) | | | | 15,091 | |
| Citigroup Inc. | | | 75.00 | | | | 12/15/2017 | | | | (340) | | | | (34,000) | | | | (46,240) | | | | (43,158) | | | | (3,082 | ) |
| Costco Wholesale Corp. | | | 165.00 | | | | 01/19/2018 | | | | (100) | | | | (10,000) | | | | (36,250) | | | | (35,895) | | | | (355 | ) |
| Costco Wholesale Corp. | | | 168.00 | | | | 01/19/2018 | | | | (82) | | | | (8,200) | | | | (20,910) | | | | (22,464) | | | | 1,554 | |
| CVS Health Corp. | | | 80.00 | | | | 12/15/2017 | | | | (176) | | | | (17,600) | | | | (4,928) | | | | (23,576) | | | | 18,648 | |
| CVS Health Corp. | | | 80.00 | | | | 01/19/2018 | | | | (176) | | | | (17,600) | | | | (9,680) | | | | (31,144) | | | | 21,464 | |
| Delta Air Lines Inc. | | | 50.00 | | | | 12/15/2017 | | | | (440) | | | | (44,000) | | | | (78,980) | | | | (78,238) | | | | (742 | ) |
| DowDuPont Inc. | | | 65.00 | | | | 12/15/2017 | | | | (150) | | | | (15,000) | | | | (112,500) | | | | (30,593) | | | | (81,907 | ) |
| DowDuPont Inc. | | | 72.50 | | | | 01/19/2018 | | | | (200) | | | | (20,000) | | | | (45,400) | | | | (31,799) | | | | (13,601 | ) |
| Express Scripts Holding Co. | | | 65.00 | | | | 11/17/2017 | | | | (221) | | | | (22,100) | | | | (7,624) | | | | (29,604) | | | | 21,980 | |
| Express Scripts Holding Co. | | | 62.50 | | | | 12/15/2017 | | | | (110) | | | | (11,000) | | | | (20,350) | | | | (13,525) | | | | (6,825 | ) |
| Express Scripts Holding Co. | | | 62.50 | | | | 01/19/2018 | | | | (111) | | | | (11,100) | | | | (28,583) | | | | (19,182) | | | | (9,401 | ) |
| Fastenal Co. | | | 50.00 | | | | 01/19/2018 | | | | (400) | | | | (40,000) | | | | (40,000) | | | | (55,582) | | | | 15,582 | |
| General Motors Co. | | | 47.00 | | | | 01/19/2018 | | | | (175) | | | | (17,500) | | | | (9,712) | | | | (18,717) | | | | 9,005 | |
| See accompanying Notes to Financial Statements. |
| |
| |
| 32 |
Madison Funds | October 31, 2017
| |
| Madison Covered Call & Equity Income Fund Portfolio of Investments - continued |
Written Option Contracts Outstanding at October 31, 2017
| Description | | Exercise Price | | Expiration Date | | Number of
Contracts | | Notional
Amount | | Market Value | | Premiums
(Received) | | Unrealized Appreciation
(Depreciation) |
| |
| | | | | | | | | | | | | | | | | | | | | | | | | | | | | |
| Call Options Written | | | | | | | | | | | | | | | | | | | | | | | | | | | | |
| Gilead Sciences Inc. | | $ | 77.50 | | | | 11/17/2017 | | | | (202) | | | $ | (20,200) | | | $ | (13,736) | | | $ | (26,459) | | | $ | 12,723 | |
| Gilead Sciences Inc. | | | 85.00 | | | | 12/15/2017 | | | | (59) | | | | (5,900) | | | | (1,829) | | | | (10,204) | | | | 8,375 | |
| Gilead Sciences Inc. | | | 90.00 | | | | 01/19/2018 | | | | (151) | | | | (15,100) | | | | (7,097) | | | | (28,834) | | | | 21,737 | |
| Intel Corp. | | | 35.00 | | | | 11/17/2017 | | | | (90) | | | | (9,000) | | | | (95,625) | | | | (9,381) | | | | (86,244 | ) |
| JM Smucker Co./The | | | 110.00 | | | | 11/17/2017 | | | | (100) | | | | (10,000) | | | | (10,750) | | | | (16,396) | | | | 5,646 | |
| JM Smucker Co./The | | | 110.00 | | | | 01/19/2018 | | | | (100) | | | | (10,000) | | | | (20,500) | | | | (23,492) | | | | 2,992 | |
| JPMorgan Chase & Co. | | | 97.50 | | | | 11/17/2017 | | | | (203) | | | | (20,300) | | | | (74,603) | | | | (23,742) | | | | (50,861 | ) |
| Lowe’s Cos. Inc. | | | 82.50 | | | | 12/15/2017 | | | | (200) | | | | (20,000) | | | | (31,000) | | | | (32,591) | | | | 1,591 | |
| Lowe’s Cos. Inc. | | | 82.50 | | | | 01/19/2018 | | | | (150) | | | | (15,000) | | | | (30,900) | | | | (31,793) | | | | 893 | |
| Lowe’s Cos. Inc. | | | 85.00 | | | | 01/19/2018 | | | | (143) | | | | (14,300) | | | | (17,303) | | | | (17,440) | | | | 137 | |
| Marathon Petroleum Corp. | | | 55.00 | | | | 11/17/2017 | | | | (162) | | | | (16,200) | | | | (79,380) | | | | (25,751) | | | | (53,629 | ) |
| Marathon Petroleum Corp. | | | 55.00 | | | | 01/19/2018 | | | | (100) | | | | (10,000) | | | | (54,500) | | | | (23,095) | | | | (31,405 | ) |
| McKesson Corp. | | | 155.00 | | | | 12/15/2017 | | | | (105) | | | | (10,500) | | | | (4,200) | | | | (42,940) | | | | 38,740 | |
| Microsoft Corp. | | | 75.00 | | | | 11/17/2017 | | | | (130) | | | | (13,000) | | | | (106,925) | | | | (18,064) | | | | (88,861 | ) |
| Microsoft Corp. | | | 80.00 | | | | 12/15/2017 | | | | (154) | | | | (15,400) | | | | (58,135) | | | | (23,247) | | | | (34,888 | ) |
| National Oilwell Varco Inc. | | | 33.00 | | | | 11/17/2017 | | | | (222) | | | | (22,200) | | | | (33,633) | | | | (26,760) | | | | (6,873 | ) |
| National Oilwell Varco Inc. | | | 35.00 | | | | 11/17/2017 | | | | (220) | | | | (22,000) | | | | (9,350) | | | | (15,131) | | | | 5,781 | |
| Northern Trust Corp. | | | 97.50 | | | | 01/19/2018 | | | | (204) | | | | (20,400) | | | | (35,700) | | | | (39,567) | | | | 3,867 | |
| NRG Energy Inc. | | | 27.00 | | | | 11/17/2017 | | | | (800) | | | | (80,000) | | | | (40,000) | | | | (62,165) | | | | 22,165 | |
| NRG Energy Inc. | | | 28.00 | | | | 12/15/2017 | | | | (100) | | | | (10,000) | | | | (6,500) | | | | (11,396) | | | | 4,896 | |
| NRG Energy Inc. | | | 26.00 | | | | 01/19/2018 | | | | (910) | | | | (91,000) | | | | (143,325) | | | | (126,022) | | | | (17,303 | ) |
| Occidental Petroleum Corp. | | | 65.00 | | | | 01/19/2018 | | | | (155) | | | | (15,500) | | | | (29,063) | | | | (24,226) | | | | (4,837 | ) |
| Occidental Petroleum Corp. | | | 67.50 | | | | 01/19/2018 | | | | (159) | | | | (15,900) | | | | (14,707) | | | | (29,567) | | | | 14,860 | |
| QUALCOMM Inc. | | | 55.00 | | | | 11/17/2017 | | | | (150) | | | | (15,000) | | | | (7,950) | | | | (18,593) | | | | 10,643 | |
| QUALCOMM Inc. | | | 55.00 | | | | 12/15/2017 | | | | (150) | | | | (15,000) | | | | (12,000) | | | | (18,743) | | | | 6,743 | |
| QUALCOMM Inc. | | | 55.00 | | | | 01/19/2018 | | | | (150) | | | | (15,000) | | | | (16,650) | | | | (20,693) | | | | 4,043 | |
| Range Resources Corp. | | | 21.00 | | | | 11/17/2017 | | | | (450) | | | | (45,000) | | | | (4,500) | | | | (37,780) | | | | 33,280 | |
| SPDR S&P Oil & Gas Exploration & Production ETF | | | 35.00 | | | | 11/17/2017 | | | | (349) | | | | (34,900) | | | | (16,926) | | | | (34,536) | | | | 17,610 | |
| SPDR S&P Oil & Gas Exploration & Production ETF | | | 35.00 | | | | 12/15/2017 | | | | (106) | | | | (10,600) | | | | (10,600) | | | | (6,355) | | | | (4,245 | ) |
| T-Mobile U.S. Inc. | | | 65.00 | | | | 01/19/2018 | | | | (500) | | | | (50,000) | | | | (45,750) | | | | (69,478) | | | | 23,728 | |
| Textron Inc. | | | 55.00 | | | | 11/17/2017 | | | | (250) | | | | (25,000) | | | | (7,000) | | | | (30,989) | | | | 23,989 | |
| Textron Inc. | | | 55.00 | | | | 12/15/2017 | | | | (240) | | | | (24,000) | | | | (18,960) | | | | (38,965) | | | | 20,005 | |
| Textron Inc. | | | 55.00 | | | | 01/19/2018 | | | | (160) | | | | (16,000) | | | | (20,720) | | | | (33,714) | | | | 12,994 | |
| United Technologies Corp. | | | 120.00 | | | | 11/17/2017 | | | | (121) | | | | (12,100) | | | | (17,182) | | | | (21,170) | | | | 3,988 | |
| Visa Inc., Class A | | | 105.00 | | | | 11/17/2017 | | | | (237) | | | | (23,700) | | | | (125,610) | | | | (55,711) | | | | (69,899 | ) |
| Weyerhaeuser Co. | | | 35.00 | | | | 01/19/2018 | | | | (360) | | | | (36,000) | | | | (54,900) | | | | (31,496) | | | | (23,404 | ) |
| Whirlpool Corp. | | | 165.00 | | | | 12/15/2017 | | | | (65) | | | | (6,500) | | | | (25,188) | | | | (18,132) | | | | (7,056 | ) |
| Whirlpool Corp. | | | 170.00 | | | | 01/19/2018 | | | | (68) | | | | (6,800) | | | | (24,140) | | | | (17,337) | | | | (6,803 | ) |
| Xilinx Inc. | | | 70.00 | | | | 11/17/2017 | | | | (133) | | | | (13,300) | | | | (54,863) | | | | (31,781) | | | | (23,082 | ) |
| | | | | | | | | | | | | | | | | | | | | | | | | | |
| Total Options Written, at Value | | | | | | | | | | | | | | | | | | $ | (2,510,594) | | | $ | (1,933,916) | | | $ | (576,678 | ) |
| | | | | | | | | | | | | | | | | | | | | | | | | | |
| See accompanying Notes to Financial Statements. |
| |
| |
| 33 |
Madison Funds | October 31, 2017
| |
| Madison Dividend Income Fund Portfolio of Investments |
| | | Shares | | Value (Note 2) | |
| | | | | | |
| COMMON STOCKS - 98.5% | | | | | | |
| | | | | | | |
| Consumer Discretionary - 6.0% | | | | | | |
| | | | | | | |
| Carnival Corp. | | 33,000 | | $ | 2,190,870 | |
| Home Depot Inc./The | | 15,000 | | | 2,486,700 | |
| McDonald’s Corp. | | 10,500 | | | 1,752,555 | |
| | | | | | |
| | | | | | 6,430,125 | |
| Consumer Staples - 8.4% | | | | | | |
| Diageo PLC, ADR | | 18,000 | | | 2,466,180 | |
| Nestle S.A., ADR | | 32,700 | | | 2,754,321 | |
| PepsiCo Inc. | | 15,000 | | | 1,653,450 | |
| Procter & Gamble Co./The | | 25,500 | | | 2,201,670 | |
| | | | | | |
| | | | | | 9,075,621 | |
| Energy - 6.8% | | | | | | |
| Chevron Corp. | | 17,500 | | | 2,028,075 | |
| Exxon Mobil Corp. | | 34,500 | | | 2,875,575 | |
| Schlumberger Ltd. | | 38,000 | | | 2,432,000 | |
| | | | | | |
| | | | | | 7,335,650 | |
| Financials - 16.8% | | | | | | |
| BB&T Corp. | | 32,000 | | | 1,575,680 | |
| Chubb Ltd. | | 11,000 | | | 1,659,020 | |
| CME Group Inc. | | 22,000 | | | 3,017,740 | |
| Northern Trust Corp. | | 15,500 | | | 1,449,560 | |
| PNC Financial Services Group Inc./The | | 22,500 | | | 3,077,775 | |
| Travelers Cos. Inc./The | | 17,500 | | | 2,317,875 | |
| US Bancorp | | 66,000 | | | 3,589,080 | |
| Wells Fargo & Co. | | 23,500 | | | 1,319,290 | |
| | | | | | |
| | | | | | 18,006,020 | |
| Health Care - 13.1% | | | | | | |
| Amgen Inc. | | 11,000 | | | 1,927,420 | |
| Johnson & Johnson | | 25,000 | | | 3,485,250 | |
| Medtronic PLC | | 22,500 | | | 1,811,700 | |
| Merck & Co. Inc. | | 34,000 | | | 1,873,060 | |
| Novartis AG, ADR | | 30,100 | | | 2,485,658 | |
| Pfizer Inc. | | 72,000 | | | 2,524,320 | |
| | | | | | |
| | | | | | 14,107,408 | |
| Industrials - 16.9% | | | | | | |
| 3M Co. | | 11,000 | | | 2,532,090 | |
| Boeing Co./The | | 11,000 | | | 2,837,780 | |
| Caterpillar Inc. | | 13,500 | | | 1,833,300 | |
| Emerson Electric Co. | | 33,000 | | | 2,127,180 | |
| Fastenal Co. | | 25,000 | | | 1,174,250 | |
| Union Pacific Corp. | | 14,000 | | | 1,621,060 | |
| United Parcel Service Inc., Class B | | 26,500 | | | 3,114,545 | |
| United Technologies Corp. | | 24,000 | | | 2,874,240 | |
| | | | | | |
| | | | | | 18,114,445 | |
| Information Technology - 19.1% | | | | | | |
| Accenture PLC, Class A | | 15,500 | | | 2,206,580 | |
| Analog Devices Inc. | | 16,000 | | | 1,460,800 | |
| Apple Inc. | | 10,500 | | | 1,774,920 | |
| Automatic Data Processing Inc. | | 11,000 | | | 1,278,860 | |
| Cisco Systems Inc. | | 88,000 | | | 3,005,200 | |
| Microsoft Corp. | | 43,000 | | | 3,576,740 | |
| TE Connectivity Ltd. | | 32,000 | | | 2,911,040 | |
| Texas Instruments Inc. | | 23,000 | | | 2,223,870 | |
| Xilinx Inc. | | 27,500 | | | 2,026,475 | |
| | | | | | |
| | | | | | 20,464,485 | |
| Materials - 4.5% | | | | | | |
| Monsanto Co. | | 10,500 | | | 1,271,550 | |
| Praxair Inc. | | 24,500 | | | 3,579,940 | |
| | | | | | |
| | | | | | 4,851,490 | |
| Telecommunication Service - 2.3% | | | | | | |
| Verizon Communications Inc. | | 52,000 | | | 2,489,240 | |
| | | | | | |
| Utilities - 4.6% | | | | | | |
| Dominion Energy Inc. | | 16,500 | | | 1,338,810 | |
| Duke Energy Corp. | | 17,000 | | | 1,501,270 | |
| NextEra Energy Inc. | | 13,500 | | | 2,093,445 | |
| | | | | | |
| | | | | | 4,933,525 | |
| | | | | | |
Total Common Stocks | | | | | | |
(Cost $84,442,275) | | | | | 105,808,009 | |
| | | | | | | |
| SHORT-TERM INVESTMENTS - 1.5% | | | | | | |
| State Street Institutional U.S. Government Money Market Fund, 0.96%, Premier Class | | 1,557,897 | | | 1,557,897 | |
| | | | | | |
Total Short-Term Investments | | | | | | |
(Cost $1,557,897) | | | | | 1,557,897 | |
| | | | | | |
| TOTAL INVESTMENTS - 100.0% | | | | | | |
| (Cost $86,000,172**) | | | | | 107,365,906 | |
| NET OTHER ASSETS AND LIABILITIES - 0.0% | | | | | 45,375 | |
| | | | | | |
| TOTAL NET ASSETS - 100.0% | | | | $ | 107,411,281 | |
| | | | | | |
| ** | | Aggregate cost for Federal tax purposes was $86,038,996. |
| ADR | | American Depositary Receipt. |
| PLC | | Public Limited Company. |
| |
| Madison Large Cap Value Fund Portfolio of Investments |
| | | Shares | | Value (Note 2) | |
| | | | | | |
| COMMON STOCKS - 98.6% | | | | | | |
| | | | | | | |
| Consumer Discretionary - 3.6% | | | | | | |
| General Motors Co. | | 77,000 | | $ | 3,309,460 | |
| | | | | | |
| | | | | | | |
| Consumer Staples - 2.2% | | | | | | |
| Nestle S.A., ADR | | 24,000 | | | 2,021,520 | |
| | | | | | |
| | | | | | | |
| Energy - 10.8% | | | | | | |
| Chevron Corp. | | 15,500 | | | 1,796,295 | |
| EOG Resources Inc. | | 44,000 | | | 4,394,280 | |
| Marathon Petroleum Corp. | | 61,000 | | | 3,644,140 | |
| | | | | | |
| | | | | | 9,834,715 | |
| Financials - 27.8% | | | | | | |
| Capital Markets - 4.5% | | | | | | |
| Bank of New York Mellon Corp./The | | 79,000 | | | 4,064,550 | |
| | | | | | |
| Commercial Banks - 13.7% | | | | | | |
| Bank of America Corp. | | 166,500 | | | 4,560,435 | |
| JPMorgan Chase & Co. | | 46,500 | | | 4,678,365 | |
| US Bancorp | | 60,000 | | | 3,262,800 | |
| | | | | | |
| | | | | | 12,501,600 | |
| Diversified Financial Services - 2.3% | | | | | | |
| Berkshire Hathaway Inc., Class B * | | 11,200 | | | 2,093,728 | |
| | | | | | |
| Insurance - 7.3% | | | | | | |
| American International Group Inc. | | 56,000 | | | 3,618,160 | |
| Hartford Financial Services Group Inc./The | | 55,500 | | | 3,055,275 | |
| | | | | | |
| | | | | | 6,673,435 | |
| | | | | | |
| | | | | | 25,333,313 | |
| Health Care - 10.0% | | | | | | |
| Amgen Inc. | | 8,400 | | | 1,471,848 | |
| Baxter International Inc. | | 59,500 | | | 3,835,965 | |
| Humana Inc. | | 15,000 | | | 3,830,250 | |
| | | | | | |
| | | | | | 9,138,063 | |
| Industrials - 12.8% | | | | | | |
| Delta Air Lines Inc. | | 49,500 | | | 2,476,485 | |
| FedEx Corp. | | 15,900 | | | 3,590,379 | |
| General Dynamics Corp. | | 13,000 | | | 2,638,740 | |
| Textron Inc. | | 56,000 | | | 2,953,440 | |
| | | | | | |
| | | | | | 11,659,044 | |
| Information Technology - 8.6% | | | | | | |
| Amdocs Ltd. | | 42,500 | | | 2,766,750 | |
| Seagate Technology PLC | | 23,500 | | | 868,795 | |
| TE Connectivity Ltd. | | 45,500 | | | 4,139,135 | |
| | | | | | |
| | | | | | 7,774,680 | |
| Materials - 10.8% | | | | | | |
| DowDuPont Inc. | | 67,500 | | | 4,880,925 | |
| Freeport-McMoRan Inc. * | | 149,000 | | | 2,083,020 | |
| Rio Tinto PLC, ADR | | 59,500 | | | 2,851,835 | |
| | | | | | |
| | | | | | 9,815,780 | |
| Real Estate - 4.4% | | | | | | |
| Weyerhaeuser Co. | | 110,000 | | | 3,950,100 | |
| | | | | | |
| | | | | | | |
| Telecommunication Service - 4.0% | | | | | | |
| T-Mobile U.S. Inc. * | | 61,500 | | | 3,675,855 | |
| | | | | | |
| | | | | | | |
| Utilities - 3.6% | | | | | | |
| NRG Energy Inc. | | 129,000 | | | 3,225,000 | |
| | | | | | |
Total Common Stocks | | | | | | |
(Cost $73,349,380) | | | | | 89,737,530 | |
| SHORT-TERM INVESTMENTS - 1.5% | | | | | | |
| State Street Institutional U.S. Government Money Market Fund, 0.96%, Premier Class | | 1,389,034 | | | 1,389,034 | |
| | | | | | |
Total Short-Term Investments | | | | | | |
(Cost $1,389,034) | | | | | 1,389,034 | |
| | | | | | |
| TOTAL INVESTMENTS - 100.1% | | | | | | |
| (Cost $74,738,414**) | | | | | 91,126,564 | |
| NET OTHER ASSETS AND LIABILITIES - (0.1%) | | | | | (99,510 | ) |
| | | | | | |
| TOTAL NET ASSETS - 100.0% | | | | $ | 91,027,054 | |
| | | | | | |
| * | | Non-income producing. |
| ** | | Aggregate cost for Federal tax purposes was $74,812,385. |
| ADR | | American Depositary Receipt. |
| PLC | | Public Limited Company. |
| See accompanying Notes to Financial Statements. |
| |
| |
| 34 |
Madison Funds | October 31, 2017
| |
| Madison Investors Fund Portfolio of Investments |
| | | Shares | | Value (Note 2) | |
| | | | | | |
| COMMON STOCKS - 94.9% | | | | | | |
| | | | | | | |
| Consumer Discretionary - 13.2% | | | | | | |
| CarMax Inc. * | | 79,164 | | $ | 5,945,217 | |
| Comcast Corp., Class A | | 255,306 | | | 9,198,675 | |
| O’Reilly Automotive Inc. * | | 24,107 | | | 5,085,372 | |
| Omnicom Group Inc. | | 155,112 | | | 10,421,975 | |
| TJX Cos. Inc./The | | 140,709 | | | 9,821,488 | |
| | | | | | |
| | | | | | 40,472,727 | |
| Consumer Staples - 5.5% | | | | | | |
| Diageo PLC, ADR | | 83,449 | | | 11,433,348 | |
| JM Smucker Co./The | | 51,184 | | | 5,428,063 | |
| | | | | | |
| | | | | | 16,861,411 | |
| Financials - 18.0% | | | | | | |
| Berkshire Hathaway Inc., Class B * | | 81,392 | | | 15,215,420 | |
| Brookfield Asset Management Inc., Class A | | 303,803 | | | 12,741,498 | |
| Charles Schwab Corp./The | | 108,099 | | | 4,847,159 | |
| Markel Corp. * | | 7,789 | | | 8,445,613 | |
| US Bancorp | | 260,135 | | | 14,146,141 | |
| | | | | | |
| | | | | | 55,395,831 | |
| Health Care - 16.1% | | | | | | |
| Danaher Corp. | | 136,820 | | | 12,624,381 | |
| Henry Schein Inc. * | | 106,967 | | | 8,407,606 | |
| Johnson & Johnson | | 57,445 | | | 8,008,407 | |
| Novartis AG, ADR | | 130,022 | | | 10,737,217 | |
| Varian Medical Systems Inc. * | | 94,135 | | | 9,807,926 | |
| | | | | | |
| | | | | | 49,585,537 | |
| Industrials - 6.7% | | | | | | |
| Copart Inc. * | | 229,135 | | | 8,315,309 | |
| Jacobs Engineering Group Inc. | | 211,463 | | | 12,309,261 | |
| | | | | | |
| | | | | | 20,624,570 | |
| Information Technology - 20.5% | | | | | | |
| Accenture PLC, Class A | | 90,795 | | | 12,925,576 | |
| Alphabet Inc., Class C * | | 9,414 | | | 9,570,649 | |
| CDW Corp. | | 112,917 | | | 7,904,190 | |
| Oracle Corp. | | 267,916 | | | 13,636,925 | |
| TE Connectivity Ltd. | | 103,007 | | | 9,370,547 | |
| Visa Inc., Class A | | 86,130 | | | 9,472,577 | |
| | | | | | |
| | | | | | 62,880,464 | |
| Materials - 10.4% | | | | | | |
| PPG Industries Inc. | | 135,967 | | | 15,804,804 | |
| Praxair Inc. | | 110,462 | | | 16,140,708 | |
| | | | | | |
| | | | | | 31,945,512 | |
| Real Estate - 4.5% | | | | | | |
| American Tower Corp. | | 95,681 | | | 13,746,489 | |
| | | | | | |
Total Common Stocks | | | | | | |
(Cost $207,370,917) | | | | | 291,512,541 | |
| | | | | | | |
| SHORT-TERM INVESTMENTS – 4.3% | | | | | | |
| State Street Institutional U.S. | | | | | | |
| Government Money Market Fund, 0.96%, Premier Class | | 13,256,894 | | | 13,256,894 | |
| | | | | | |
| | | | | | | |
Total Short-Term Investments | | | | | | |
(Cost $13,256,894) | | | | | 13,256,894 | |
| | | | | | |
| TOTAL INVESTMENTS - 99.2% | | | | | | |
| (Cost $220,627,811**) | | | | | 304,769,435 | |
| NET OTHER ASSETS AND LIABILITIES - 0.8% | | | | | 2,383,069 | |
| | | | | | |
| TOTAL NET ASSETS - 100.0% | | | | $ | 307,152,504 | |
| | | | | | |
| * | | Non-income producing. |
| ** | | Aggregate cost for Federal tax purposes was $220,837,592. |
| ADR | | American Depositary Receipt. |
| PLC | | Public Limited Company. |
| |
| Madison Mid Cap Fund Portfolio of Investments |
| | | Shares | | Value (Note 2) | |
| | | | | | |
| COMMON STOCKS - 92.9% | | | | | | |
| | | | | | | |
| Consumer Discretionary - 21.2% | | | | | | |
| CarMax Inc. * | | 178,957 | | $ | 13,439,671 | |
| | | | | | |
| Liberty Broadband Corp., Class C * | | 119,548 | | | 10,435,345 | |
| Liberty Global PLC, Series C * | | 385,594 | | | 11,525,405 | |
| O’Reilly Automotive Inc. * | | 51,223 | | | 10,805,492 | |
| Omnicom Group Inc. | | 172,166 | | | 11,567,833 | |
| Ross Stores Inc. | | 239,972 | | | 15,235,822 | |
| | | | | | |
| | | | | | 73,009,568 | |
| Consumer Staples - 1.4% | | | | | | |
| Brown-Forman Corp., Class B | | 87,441 | | | 4,985,886 | |
| | | | | | |
| | | | | | | |
| Energy - 0.9% | | | | | | |
| Oceaneering International Inc. | | 147,917 | | | 2,990,882 | |
| | | | | | |
| | | | | | | |
| Financials - 22.1% | | | | | | |
| Arch Capital Group Ltd. * | | 114,811 | | | 11,439,768 | |
| Brookfield Asset Management Inc., Class A | | 347,291 | | | 14,565,385 | |
| Brown & Brown Inc. | | 261,088 | | | 13,012,626 | |
| Glacier Bancorp Inc. | | 218,867 | | | 8,308,191 | |
| Markel Corp. * | | 16,048 | | | 17,400,846 | |
| WR Berkley Corp. | | 164,242 | | | 11,263,716 | |
| | | | | | |
| | | | | | 75,990,532 | |
| Health Care - 12.6% | | | | | | |
| DaVita Inc. * | | 176,805 | | | 10,739,136 | |
| Henry Schein Inc. * | | 141,878 | | | 11,151,611 | |
| Laboratory Corp. of America Holdings * | | 79,095 | | | 12,157,692 | |
| Zoetis Inc. | | 144,715 | | | 9,235,711 | |
| | | | | | |
| | | | | | 43,284,150 | |
| Industrials - 15.9% | | | | | | |
| Copart Inc. * | | 426,693 | | | 15,484,689 | |
| Expeditors International of Washington Inc. | | 205,946 | | | 12,023,128 | |
| Fastenal Co. | | 178,584 | | | 8,388,090 | |
| IHS Markit Ltd. * | | 270,021 | | | 11,505,595 | |
| Wabtec Corp. | | 97,992 | | | 7,496,388 | |
| | | | | | |
| | | | | | 54,897,890 | |
| Information Technology - 6.6% | | | | | | |
| Amphenol Corp., Class A | | 82,414 | | | 7,170,018 | |
| CDW Corp. | | 221,232 | | | 15,486,240 | |
| | | | | | |
| | | | | | 22,656,258 | |
| Materials - 7.2% | | | | | | |
| Axalta Coating Systems Ltd. * | | 421,833 | | | 14,025,947 | |
| Crown Holdings Inc. * | | 177,345 | | | 10,670,849 | |
| | | | | | |
| | | | | | 24,696,796 | |
| Real Estate - 5.0% | | | | | | |
| American Tower Corp. | | 60,375 | | | 8,674,076 | |
| Crown Castle International Corp. | | 81,382 | | | 8,714,385 | |
| | | | | | |
| | | | | | 17,388,461 | |
| | | | | | |
Total Common Stocks | | | | | | |
(Cost $200,925,495) | | | | | 319,900,423 | |
| | | | | | | |
| SHORT-TERM INVESTMENTS - 7.3% | | | | | | |
| State Street Institutional U.S. | | | | | | |
| Government Money Market Fund, 0.96%, Premier Class | | 25,123,090 | | | 25,123,090 | |
| | | | | | |
| | | | | | | |
Total Short-Term Investments | | | | | | |
(Cost $25,123,090) | | | | | 25,123,090 | |
| | | | | | |
| TOTAL INVESTMENTS - 100.2% | | | | | | |
| (Cost $226,048,585**) | | | | | 345,023,513 | |
| NET OTHER ASSETS AND LIABILITIES - (0.2%) | | | | | (597,169 | ) |
| | | | | | |
| TOTAL NET ASSETS - 100.0% | | | | $ | 344,426,344 | |
| | | | | | |
| * | | Non-income producing. |
| ** | | Aggregate cost for Federal tax purposes was $226,055,213. |
| PLC | | Public Limited Company. |
| See accompanying Notes to Financial Statements. |
| |
| |
| 35 |
Madison Funds | October 31, 2017
| |
| Madison Small Cap Fund Portfolio of Investments |
| | | Shares | | Value (Note 2) | |
| | | | | | |
| COMMON STOCKS - 98.3% | | | | | | |
| | | | | | | |
| Consumer Discretionary - 3.3% | | | | | | |
| Cato Corp./The, Class A | | 34,041 | | $ | 437,767 | |
| Dave & Buster’s Entertainment Inc. * | | 5,910 | | | 284,862 | |
| Fred’s Inc., Class A | | 84,579 | | | 372,994 | |
| Helen of Troy Ltd. * | | 6,907 | | | 641,660 | |
| TRI Pointe Group Inc. * | | 76,148 | | | 1,347,058 | |
| | | | | | |
| | | | | | 3,084,341 | |
| Consumer Staples - 3.6% | | | | | | |
| C&C Group PLC | | 310,369 | | | 1,065,077 | |
| Cranswick PLC | | 37,184 | | | 1,521,086 | |
| Smart & Final Stores Inc. * | | 136,609 | | | 819,654 | |
| | | | | | |
| | | | | | 3,405,817 | |
| Energy - 4.3% | | | | | | |
| Dorian LPG Ltd. * | | 63,637 | | | 455,004 | |
| Era Group Inc. * | | 36,299 | | | 390,577 | |
| Resolute Energy Corp. * | | 24,591 | | | 738,468 | |
| Scorpio Tankers Inc. | | 223,245 | | | 794,752 | |
| SEACOR Holdings Inc. * | | 22,688 | | | 1,070,874 | |
| SEACOR Marine Holdings Inc. * | | 30,164 | | | 426,821 | |
| Tesco Corp. * | | 42,930 | | | 165,280 | |
| | | | | | |
| | | | | | 4,041,776 | |
| Financials - 21.8% | | | | | | |
| 1st Source Corp. | | 18,665 | | | 957,701 | |
| Banc of California Inc. | | 47,709 | | | 1,004,274 | |
| FCB Financial Holdings Inc., Class A * | | 15,977 | | | 746,126 | |
| First Busey Corp. | | 44,177 | | | 1,374,788 | |
| First Midwest Bancorp Inc. | | 99,511 | | | 2,297,709 | |
| Flushing Financial Corp. | | 44,026 | | | 1,319,900 | |
| Great Western Bancorp Inc. | | 43,329 | | | 1,758,724 | |
| Hancock Holding Co. | | 47,861 | | | 2,333,224 | |
| International Bancshares Corp. | | 42,237 | | | 1,714,822 | |
| Kemper Corp. | | 30,223 | | | 1,937,294 | |
| MB Financial Inc. | | 45,347 | | | 2,083,241 | |
| Northwest Bancshares Inc. | | 119,325 | | | 2,013,013 | |
| Solar Capital Ltd. | | 38,082 | | | 807,719 | |
| State National Cos. Inc. | | 18,229 | | | 383,174 | |
| | | | | | |
| | | | | | 20,731,709 | |
| Health Care - 6.6% | | | | | | |
| Allscripts Healthcare Solutions Inc. * | | 135,078 | | | 1,820,852 | |
| AMN Healthcare Services Inc. * | | 9,170 | | | 402,563 | |
| Corvel Corp. * | | 15,802 | | | 948,120 | |
| Haemonetics Corp. * | | 31,811 | | | 1,512,931 | |
| ICU Medical Inc. * | | 3,781 | | | 722,549 | |
| Natus Medical Inc. * | | 18,551 | | | 786,562 | |
| Phibro Animal Health Corp., Class A | | 2,613 | | | 98,380 | |
| | | | | | |
| | | | | | 6,291,957 | |
| Industrials - 34.4% | | | | | | |
| Aerospace & Defense - 2.8% | | | | | | |
| Astronics Corp. * | | 11,610 | | | 399,384 | |
| Cubic Corp. | | 41,094 | | | 2,241,678 | |
| | | | | | |
| | | | | | 2,641,062 | |
| Air Freight & Logistics - 1.2% | | | | | | |
| Forward Air Corp. | | 20,219 | | | 1,161,379 | |
| | | | | | |
| | | | | | | |
| Building Products - 1.6% | | | | | | |
| Tyman PLC | | 340,223 | | | 1,545,386 | |
| | | | | | |
| | | | | | | |
| Commercial Services & Supplies - 6.1% | | | | | | |
| ACCO Brands Corp. * | | 116,161 | | | 1,515,901 | |
| Essendant Inc. | | 48,563 | | | 470,090 | |
| Matthews International Corp., Class A | | 26,373 | | | 1,657,543 | |
| SP Plus Corp. * | | 34,565 | | | 1,339,394 | |
| Steelcase Inc., Class A | | 56,094 | | | 816,167 | |
| | | | | | |
| | | | | | 5,799,095 | |
| Construction & Engineering - 1.2% | | | | | | |
| Primoris Services Corp. | | 40,347 | | | 1,140,610 | |
| | | | | | |
| | | | | | | |
| Electrical Equipment - 1.6% | | | | | | |
| Thermon Group Holdings Inc. * | | 70,351 | | | 1,513,250 | |
| | | | | | |
| | | | | | | |
| Machinery - 11.4% | | | | | | |
| Albany International Corp., Class A | | 35,967 | | | 2,170,608 | |
| CIRCOR International Inc. | | 20,470 | | | 899,657 | |
| ESCO Technologies Inc. | | 31,515 | | | 1,826,294 | |
| Luxfer Holdings PLC, ADR | | 65,258 | | | 807,894 | |
| Mueller Industries Inc. | | 78,570 | | | 2,730,308 | |
| TriMas Corp. * | | 90,502 | | | 2,402,828 | |
| | | | | | |
| | | | | | 10,837,589 | |
| Professional Services - 7.1% | | | | | | |
| Forrester Research Inc. | | 39,203 | | | 1,713,171 | |
| FTI Consulting Inc. * | | 45,424 | | | 1,941,876 | |
| Huron Consulting Group Inc. * | | 30,333 | | | 1,110,188 | |
| ICF International Inc. * | | 16,206 | | | 870,262 | |
| Mistras Group Inc. * | | 51,627 | | | 1,084,683 | |
| | | | | | |
| | | | | | 6,720,180 | |
| Trading Companies & Distributors - 1.4% | | | | | | |
| GATX Corp. | | 21,917 | | | 1,302,089 | |
| | | | | | |
| | | | | | 32,660,640 | |
| Information Technology - 7.9% | | | | | | |
| Belden Inc. | | 36,729 | | | 2,935,014 | |
| CTS Corp. | | 45,135 | | | 1,227,672 | |
| Diebold Nixdorf Inc. | | 46,206 | | | 891,776 | |
| ScanSource Inc. * | | 20,809 | | | 893,747 | |
| WNS Holdings Ltd., ADR * | | 41,257 | | | 1,564,465 | |
| | | | | | |
| | | | | | 7,512,674 | |
| Materials - 8.7% | | | | | | |
| Deltic Timber Corp. | | 20,759 | | | 1,922,491 | |
| Greif Inc., Class A | | 35,537 | | | 1,973,370 | |
| Neenah Paper Inc. | | 11,763 | | | 1,021,028 | |
| Orion Engineered Carbons S.A. | | 52,375 | | | 1,238,669 | |
| Sensient Technologies Corp. | | 27,434 | | | 2,086,356 | |
| | | | | | |
| | | | | | 8,241,914 | |
| Real Estate - 6.1% | | | | | | |
| Corporate Office Properties Trust, REIT | | 34,167 | | | 1,090,952 | |
| DiamondRock Hospitality Co., REIT | | 83,763 | | | 909,666 | |
| Education Realty Trust Inc., REIT | | 36,930 | | | 1,288,857 | |
| Ramco-Gershenson Properties Trust, REIT | | 107,180 | | | 1,353,684 | |
| Summit Hotel Properties Inc., REIT | | 71,585 | | | 1,131,759 | |
| | | | | | |
| | | | | | 5,774,918 | |
| Utilities - 1.6% | | | | | | |
| New Jersey Resources Corp. | | 15,557 | | | 691,509 | |
| Spire Inc. | | 10,564 | | | 834,028 | |
| | | | | | |
| | | | | | 1,525,537 | |
| | | | | | |
Total Common Stocks | | | | | | |
(Cost $75,018,787) | | | | | 93,271,283 | |
| SHORT-TERM INVESTMENTS - 1.8% | | | | | | |
| State Street Institutional U.S. | | | | | | |
| Government Money Market Fund, 0.96%, Premier Class | | 1,742,685 | | | 1,742,685 | |
| | | | | | |
Total Short-Term Investments | | | | | | |
(Cost $1,742,685) | | | | | 1,742,685 | |
| | | | | | |
| TOTAL INVESTMENTS - 100.1% | | | | | | |
| (Cost $76,761,472**) | | | | | 95,013,968 | |
| NET OTHER ASSETS AND LIABILITIES - (0.1%) | | | | | (71,041 | ) |
| | | | | | |
| TOTAL NET ASSETS - 100.0% | | | | $ | 94,942,927 | |
| | | | | | |
| * | | Non-income producing. |
| ** | | Aggregate cost for Federal tax purposes was $77,254,978. |
| ADR | | American Depositary Receipt. |
| PLC | | Public Limited Company. |
| REIT | | Real Estate Investment Trust. |
| See accompanying Notes to Financial Statements. |
| |
| |
| 36 |
Madison Funds | October 31, 2017
| |
| Madison International Stock Fund Portfolio of Investments |
| | | Shares | | Value (Note 2) | |
| | | | | | |
| COMMON STOCKS - 96.7% | | | | | | |
| | | | | | | |
| Australia - 0.7% | | | | | | |
| Caltex Australia Ltd. | | 8,742 | | $ | 229,223 | |
| | | | | | |
| | | | | | | |
| Belgium - 2.7% | | | | | | |
| Anheuser-Busch InBev S.A. | | 4,906 | | | 600,335 | |
| KBC Group N.V. | | 3,059 | | | 254,097 | |
| | | | | | |
| | | | | | 854,432 | |
| Brazil - 0.9% | | | | | | |
| BB Seguridade Participacoes S.A. | | 35,300 | | | 299,229 | |
| | | | | | |
| | | | | | | |
| Canada - 4.7% | | | | | | |
| Canadian National Railway Co. | | 5,180 | | | 416,817 | |
| National Bank of Canada | | 10,300 | | | 499,870 | |
| Suncor Energy Inc. | | 17,080 | | | 579,881 | |
| | | | | | |
| | | | | | 1,496,568 | |
| Denmark - 2.7% | | | | | | |
| AP Moeller - Maersk AS, Class B | | 238 | | | 457,130 | |
| Carlsberg AS, Class B | | 3,534 | | | 403,562 | |
| | | | | | |
| | | | | | 860,692 | |
| Finland - 1.5% | | | | | | |
| Sampo Oyj, Class A | | 8,809 | | | 461,547 | |
| | | | | | |
| | | | | | | |
| France - 10.8% | | | | | | |
| Air Liquide S.A. | | 4,711 | | | 599,795 | |
| Capgemini SE | | 6,307 | | | 766,629 | |
| Cie Generale des Etablissements Michelin | | 4,158 | | | 601,556 | |
| Safran S.A. | | 2,456 | | | 258,708 | |
| Valeo S.A. | | 6,082 | | | 411,616 | |
| Vinci S.A. | | 8,169 | | | 799,791 | |
| | | | | | |
| | | | | | 3,438,095 | |
| Germany - 4.3% | | | | | | |
| Deutsche Post AG (A) | | 11,302 | | | 517,525 | |
| SAP SE (A) | | 7,598 | | | 864,341 | |
| | | | | | |
| | | | | | 1,381,866 | |
| Ireland - 3.2% | | | | | | |
| Medtronic PLC | | 7,400 | | | 595,848 | |
| Ryanair Holdings PLC, ADR * | | 3,767 | | | 422,318 | |
| | | | | | |
| | | | | | 1,018,166 | |
| Italy - 1.0% | | | | | | |
| UniCredit SpA * | | 17,196 | | | 329,105 | |
| | | | | | |
| | | | | | | |
| Japan - 17.8% | | | | | | |
| Daiwa House Industry Co. Ltd. | | 26,550 | | | 966,686 | |
| Don Quijote Holdings Co. Ltd. | | 17,100 | | | 712,093 | |
| Hoshizaki Corp. | | 2,500 | | | 235,478 | |
| Isuzu Motors Ltd. | | 35,700 | | | 517,580 | |
| Kao Corp. | | 5,410 | | | 325,252 | |
| KDDI Corp. | | 14,700 | | | 390,948 | |
| Makita Corp. | | 13,000 | | | 543,072 | |
| Seven & I Holdings Co. Ltd. | | 6,900 | | | 277,444 | |
| Shin-Etsu Chemical Co. Ltd. | | 3,100 | | | 324,708 | |
| Sony Corp. | | 11,200 | | | 434,683 | |
| Sumitomo Mitsui Financial Group Inc. | | 12,900 | | | 512,460 | |
| United Arrows Ltd. | | 6,300 | | | 234,924 | |
| Yamaha Corp. | | 4,500 | | | 175,718 | |
| | | | | | |
| | | | | | 5,651,046 | |
| Jersey - 4.5% | | | | | | |
| Ferguson PLC | | 10,109 | | | 706,893 | |
| Shire PLC | | 14,328 | | | 708,097 | |
| | | | | | |
| | | | | | 1,414,990 | |
| Luxembourg - 0.6% | | | | | | |
| Tenaris S.A. | | 13,609 | | | 186,266 | |
| | | | | | |
| | | | | | | |
| Netherlands - 2.9% | | | | | | |
| Koninklijke KPN N.V. | | 76,517 | | | 264,184 | |
| Wolters Kluwer N.V. | | 13,636 | | | 668,394 | |
| | | | | | |
| | | | | | 932,578 | |
| Norway - 2.9% | | | | | | |
| Statoil ASA | | 19,189 | | | 388,572 | |
| Telenor ASA | | 24,743 | | | 525,577 | |
| | | | | | |
| | | | | | 914,149 | |
| Singapore - 2.3% | | | | | | |
| DBS Group Holdings Ltd. | | 31,000 | | | 518,069 | |
| NetLink NBN Trust * | | 374,500 | | | 226,662 | |
| | | | | | |
| | | | | | 744,731 | |
| Spain - 1.4% | | | | | | |
| Bankia S.A. | | 15,024 | | | 71,735 | |
| Red Electrica Corp. S.A. | | 17,289 | | | 382,844 | |
| | | | | | |
| | | | | | 454,579 | |
| Sweden - 3.6% | | | | | | |
| Assa Abloy AB, Class B | | 28,702 | | | 605,812 | |
| Nordea Bank AB | | 43,747 | | | 528,832 | |
| | | | | | |
| | | | | | 1,134,644 | |
| Switzerland - 4.2% | | | | | | |
| Julius Baer Group Ltd. * | | 6,735 | | | 398,301 | |
| Novartis AG | | 11,258 | | | 927,588 | |
| | | | | | |
| | | | | | 1,325,889 | |
| Taiwan - 1.6% | | | | | | |
| Taiwan Semiconductor Manufacturing Co. Ltd., ADR | | 12,200 | | | 516,426 | |
| | | | | | |
| | | | | | | |
| Turkey - 0.7% | | | | | | |
| Turkiye Garanti Bankasi AS | | 79,079 | | | 217,420 | |
| | | | | | |
| | | | | | | |
| United Kingdom - 21.7% | | | | | | |
| Aon PLC | | 4,960 | | | 711,413 | |
| BHP Billiton PLC | | 39,680 | | | 718,051 | |
| British American Tobacco PLC | | 13,651 | | | 883,140 | |
| BT Group PLC | | 66,297 | | | 229,200 | |
| ConvaTec Group PLC (B) | | 4,065 | | | 10,577 | |
| Diageo PLC | | 15,128 | | | 516,773 | |
| Howden Joinery Group PLC | | 40,511 | | | 220,653 | |
| Informa PLC | | 35,335 | | | 327,103 | |
| Prudential PLC | | 44,860 | | | 1,103,437 | |
| RELX PLC | | 28,728 | | | 661,228 | |
| Royal Dutch Shell PLC, Class A | | 27,972 | | | 878,807 | |
| Unilever PLC | | 11,398 | | | 646,328 | |
| | | | | | |
| | | | | | 6,906,710 | |
| | | | | | |
Total Common Stocks | | | | | | |
(Cost $22,293,508) | | | | | 30,768,351 | |
| | | | | | | |
| SHORT-TERM INVESTMENTS - 3.0% | | | | | | |
| | | | | | | |
| United States - 3.0% | | | | | | |
| State Street Institutional U.S. Government Money Market Fund, 0.96%, Premier Class | | 950,307 | | | 950,307 | |
| | | | | | |
Total Short-Term Investments | | | | | | |
(Cost $950,307) | | | | | 950,307 | |
| | | | | | |
| TOTAL INVESTMENTS - 99.7% | | | | | | |
| (Cost $23,243,815**) | | | | | 31,718,658 | |
| NET OTHER ASSETS AND LIABILITIES - 0.3% | | | | | 94,037 | |
| | | | | | |
| TOTAL NET ASSETS - 100.0% | | | | $ | 31,812,695 | |
| | | | | | |
| * | | Non-income producing. |
| ** | | Aggregate cost for Federal tax purposes was $23,633,595. |
| (A) | | Due to events that occurred between the close of the exchange on which this security is traded and that of the New York Stock Exchange, fair value was determined for this security using methods determined in good faith by or at the discretion of the Board of Trustees (see Note 2). |
| (B) | | Security sold within terms of a private placement memorandum exempt from registration under section 144A of the Securities Act of 1933, as amended, and may be sold only to dealers in that program or other “qualified institutional buyers.” |
| ADR | | American Depositary Receipt. |
| PLC | | Public Limited Company. |
| SECTOR ALLOCATION AS A PERCENTAGE OF NET ASSETS AS OF 10/31/17 | | |
| Consumer Discretionary | | 14.9% |
| Consumer Staples | | 11.5% |
| Energy | | 7.0% |
| Financials | | 18.6% |
| Health Care | | 7.1% |
| Industrials | | 16.3% |
| Information Technology | | 6.8% |
| Materials | | 5.2% |
| Money Market Funds | | 3.0% |
| Reall Estate | | 3.0% |
| Telecommunication Services | | 5.1% |
| Utilities | | 1.2% |
| Net Other Assets and Liabilities | | 0.3% |
| See accompanying Notes to Financial Statements. |
| |
| |
| 37 |
Madison Funds | October 31, 2017
| |
| Statements of Assets and Liabilities as of October 31, 2017 |
| | | Conservative | | Moderate | | Aggressive | | Government | | Tax-Free | | Tax-Free | | High Quality | | Core |
| | | Allocation
Fund | | Allocation
Fund | | Allocation
Fund | | Money Market
Fund | | Virginia
Fund | | National
Fund | | Bond
Fund | | Bond
Fund |
| | | |
| Assets: | | | | | | | | | | | | | | | | | | | | | | | | | | | | | | | | |
| Investments in securities, at cost: | | | | | | | | | | | | | | | | | | | | | | | | | | | | | | | | |
Unaffiliated issuers | | $ | 41,633,869 | | | $ | 81,595,417 | | | $ | 34,585,289 | | | $ | 15,209,568 | | | $ | 20,705,346 | | | $ | 23,467,097 | | | $ | 99,540,196 | | | $ | 201,358,910 | |
Affiliated issuers1 | | | 28,404,850 | | | | 50,509,960 | | | | 21,780,643 | | | | – | | | | – | | | | – | | | | – | | | | – | |
| Net unrealized appreciation | | | | | | | | | | | | | | | | | | | | | | | | | | | | | | | | |
Unaffiliated issuers | | | 2,527,059 | | | | 9,005,895 | | | | 5,430,244 | | | | – | | | | 648,256 | | | | 1,041,323 | | | | 179,802 | | | | 3,931,047 | |
Affiliated issuers1 | | | 1,547,616 | | | | 7,267,875 | | | | 4,133,203 | | | | – | | | | – | | | | – | | | | – | | | | – | |
| | | | |
Total investments, at value | | | 74,113,394 | | | | 148,379,147 | | | | 65,929,379 | | | | 15,209,568 | | | | 21,353,602 | | | | 24,508,420 | | | | 99,719,998 | | | | 205,289,957 | |
| Cash | | | – | | | | – | | | | – | | | | – | | | | 270,361 | | | | 538,012 | | | | – | | | | 890,161 | |
| Foreign currency (cost of $45 and $7) (Note 2) | | | – | | | | – | | | | – | | | | – | | | | – | | | | – | | | | – | | | | – | |
| Receivables: | | | | | | | | | | | | | | | | | | | | | | | | | | | | | | | | |
Investments sold | | | – | | | | – | | | | – | | | | – | | | | – | | | | – | | | | – | | | | 995,021 | |
Fund shares sold | | | 1,789 | | | | 7,770 | | | | 45,329 | | | | 331 | | | | 58 | | | | 4 | | | | 104,966 | | | | 500,942 | |
Dividends and interest | | | 70,401 | | | | 66,423 | | | | 11,628 | | | | 12,270 | | | | 259,223 | | | | 277,029 | | | | 793,149 | | | | 1,556,138 | |
Due from Adviser | | | – | | | | – | | | | – | | | | 209 | | | | – | | | | – | | | | – | | | | – | |
| Other assets | | | – | | | | – | | | | – | | | | – | | | | – | | | | – | | | | – | | | | 31 | |
| | | | |
Total assets | | | 74,185,584 | | | | 148,453,340 | | | | 65,986,336 | | | | 15,222,378 | | | | 21,883,244 | | | | 25,323,465 | | | | 100,618,113 | | | | 209,232,250 | |
| Liabilities: | | | | | | | | | | | | | | | | | | | | | | | | | | | | | | | | |
| Payables: | | | | | | | | | | | | | | | | | | | | | | | | | | | | | | | | |
Investments purchased | | | – | | | | – | | | | 385,864 | | | | – | | | | – | | | | – | | | | – | | | | 1,034,351 | |
Fund shares repurchased | | | 38,785 | | | | 32,582 | | | | – | | | | 27,830 | | | | 237 | | | | 7,905 | | | | 40,128 | | | | 78,085 | |
Advisory agreement fees | | | 12,566 | | | | 25,147 | | | | 11,060 | | | | 5,508 | | | | 9,270 | | | | 8,622 | | | | 25,560 | | | | 87,925 | |
Service agreement fees | | | 15,706 | | | | 31,433 | | | | 13,825 | | | | 2,334 | | | | 6,489 | | | | 7,545 | | | | 16,188 | | | | 26,176 | |
Distribution fees - Class B | | | 5,207 | | | | 14,768 | | | | 6,638 | | | | 156 | | | | – | | | | – | | | | – | | | | 1,285 | |
Distribution fees - Class C | | | 13,327 | | | | 6,110 | | | | 1,454 | | | | – | | | | – | | | | – | | | | – | | | | – | |
Shareholder service fees - Class A, B & C | | | 15,690 | | | | 31,373 | | | | 13,796 | | | | – | | | | – | | | | – | | | | – | | | | 7,606 | |
Dividends | | | – | | | | – | | | | – | | | | 71 | | | | 1,009 | | | | 5,726 | | | | – | | | | 265,548 | |
Options written, at value (premium received $25,385 and $1,933,916) (Note 6) | | | – | | | | – | | | | – | | | | – | | | | – | | | | – | | | | – | | | | 17,500 | |
| | | | |
Total liabilities | | | 101,281 | | | | 141,413 | | | | 432,637 | | | | 35,899 | | | | 17,005 | | | | 29,798 | | | | 81,876 | | | | 1,518,476 | |
| | | | |
| Net Assets | | $ | 74,084,303 | | | $ | 148,311,927 | | | $ | 65,553,699 | | | $ | 15,186,479 | | | $ | 21,866,239 | | | $ | 25,293,667 | | | $ | 100,536,237 | | | $ | 207,713,774 | |
| | | | |
| Net Assets consist of: | | | | | | | | | | | | | | | | | | | | | | | | | | | | | | | | |
| Common Stock/Shares: | | | | | | | | | | | | | | | | | | | | | | | | | | | | | | | | |
Paid-in capital | | $ | 68,340,867 | | | $ | 126,053,832 | | | $ | 52,728,275 | | | $ | 15,186,648 | | | $ | 21,233,321 | | | $ | 24,173,037 | | | $ | 100,279,965 | | | $ | 203,685,203 | |
Accumulated undistributed net investment income (loss) | | | 14,319 | | | | 1,047,817 | | | | 336,143 | | | | 145 | | | | 1,945 | | | | 2,493 | | | | 119,042 | | | | 21,350 | |
Accumulated net realized gain (loss) on investments sold and foreign currency related transactions | | | 1,654,442 | | | | 4,936,508 | | | | 2,925,834 | | | | (314 | ) | | | (17,283 | ) | | | 76,814 | | | | (42,572 | ) | | | 68,289 | |
Net unrealized appreciation (depreciation) of investments (including appreciation (depreciation) of foreign currency related transactions) | | | 4,074,675 | | | | 16,273,770 | | | | 9,563,447 | | | | – | | | | 648,256 | | | | 1,041,323 | | | | 179,802 | | | | 3,938,932 | |
| | | | |
| Net Assets | | $ | 74,084,303 | | | | 148,311,927 | | | $ | 65,553,699 | | | $ | 15,186,479 | | | $ | 21,866,239 | | | $ | 25,293,667 | | | $ | 100,536,237 | | | $ | 207,713,774 | |
| | | | |
| Class A Shares: | | | | | | | | | | | | | | | | | | | | | | | | | | | | | | | | |
Net Assets | | $ | 45,005,206 | | | $ | 115,586,037 | | | $ | 52,811,245 | | | $ | 14,971,837 | | | | | | | | | | | | | | | $ | 33,738,390 | |
Shares of beneficial interest outstanding | | | 4,101,369 | | | | 9,472,456 | | | | 4,154,451 | | | | 14,971,993 | | | | | | | | | | | | | | | | 3,364,322 | |
Net Asset Value and redemption price per share | | $ | 10.97 | | | $ | 12.20 | | | $ | 12.71 | | | $ | 1.00 | | | | | | | | | | | | | | | $ | 10.03 | |
Sales charge of offering price2 | | | 0.67 | | | | 0.74 | | | | 0.78 | | | | – | | | | | | | | | | | | | | | | 0.47 | |
| | | | | | | | | | | | | | | | | | | |
Maximum offering price per share | | $ | 11.64 | | | $ | 12.94 | | | $ | 13.49 | | | $ | 1.00 | | | | | | | | | | | | | | | $ | 10.50 | |
| | | | | | | | | | | | | | | | | | | |
| Class B Shares: | | | | | | | | | | | | | | | | | | | | | | | | | | | | | | | | |
Net Assets | | $ | 8,119,078 | | | $ | 23,100,952 | | | $ | 10,442,278 | | | $ | 214,642 | | | | | | | | | | | | | | | $ | 2,003,588 | |
Shares of beneficial interest outstanding | | | 734,484 | | | | 1,914,932 | | | | 845,764 | | | | 214,649 | | | | | | | | | | | | | | | | 199,685 | |
| | | | | | | | | | | | | | | | | | | |
Net Asset Value and redemption price per share3 | | $ | 11.05 | | | $ | 12.06 | | | $ | 12.35 | | | $ | 1.00 | | | | | | | | | | | | | | | $ | 10.03 | |
| | | | | | | | | | | | | | | | | | | |
| Class C Shares: | | | | | | | | | | | | | | | | | | | | | | | | | | | | | | | | |
Net Assets | | $ | 20,960,019 | | | $ | 9,624,938 | | | $ | 2,300,176 | | | | | | | | | | | | | | | | | | | | | |
Shares of beneficial interest outstanding | | | 1,894,991 | | | | 797,251 | | | | 186,144 | | | | | | | | | | | | | | | | | | | | | |
| | | | | | | | | | | | | | | | | | | | | | | | |
Net Asset Value and redemption price per share3 | | $ | 11.06 | | | $ | 12.07 | | | $ | 12.36 | | | | | | | | | | | | | | | | | | | | | |
| | | | | | | | | | | | | | | | | | | | | | | | |
| Class Y Shares: | | | | | | | | | | | | | | | | | | | | | | | | | | | | | | | | |
Net Assets | | | | | | | | | | | | | | | | | | $ | 21,866,239 | | | $ | 25,293,667 | | | $ | 100,536,237 | | | $ | 170,169,478 | |
Shares of beneficial interest outstanding | | | | | | | | | | | | | | | | | | | 1,902,767 | | | | 2,331,955 | | | | 9,202,136 | | | | 17,027,299 | |
| | | | | | | | | | | | | | | | | | | | |
Net Asset Value and redemption price per share3 | | | | | | | | | | | | | | | | | | $ | 11.49 | | | $ | 10.85 | | | $ | 10.93 | | | $ | 9.99 | |
| | | | | | | | | | | | | | | | | | | | |
| Class R6 Shares: | | | | | | | | | | | | | | | | | | | | | | | | | | | | | | | | |
Net Assets | | | | | | | | | | | | | | | | | | | | | | | | | | | | | | $ | 1,802,318 | |
Shares of beneficial interest outstanding | | | | | | | | | | | | | | | | | | | | | | | | | | | | | | | 179,391 | |
| | | | | | | | | | | | | | | | | | | | | | | | | | | | | | | | |
Net Asset Value and redemption price per share3 | | | | | | | | | | | | | | | | | | | | | | | | | | | | | | $ | 10.05 | |
| | | | | | | | | | | | | | | | | | | | | | | | | | | | | | | | |
| | | | | | | | | | | | | | | | | | | | | | | | | | | | | | | | | |
| 1 See Note 12 for information on affiliated issuers. |
| 2 Sales charge of offering price is 4.50% for the Core Bond and High Income Funds and 5.75% for the Conservative Allocation, Moderate Allocation, Aggressive Allocation, Diversified Income, Covered Call & Equity Income, Large Cap Value, Investors, Mid Cap, Small Cap and International Stock Funds. |
| 3 If applicable, redemption price per share may be reduced by a contingent deferred sales charge. |
| See accompanying Notes to Financial Statements. |
| |
| |
| 38 |
Madison Funds | October 31, 2017
| |
| Statements of Assets and Liabilities as of October 31, 2017 |
| | Corporate
Bond
Fund | | High
Income
Fund | | Diversified
Income
Fund | | Covered Call &
Equity Income
Fund | | Dividend
Income
Fund | | Large Cap
Value
Fund | | Investors
Fund | | Mid Cap
Fund | | Small Cap
Fund | | International
Stock
Fund |
| | |
| | | | | | | | | | | | | | | | | | | | | | | | | | | | | | | | | | | | | | | | |
| | $ | 20,951,121 | | | $ | 22,396,087 | | | $ | 133,302,501 | | | $ | 140,179,830 | | | $ | 86,000,172 | | | $ | 74,738,414 | | | $ | 220,627,811 | | | $ | 226,048,585 | | | $ | 76,761,472 | | | $ | 23,243,815 | |
| | | – | | | | – | | | | – | | | | – | | | | – | | | | – | | | | – | | | | – | | | | – | | | | – | |
| | | | | | | | | | | | | | | | | | | | | | | | | | | | | | | | | | | | | | | | |
| | | 690,986 | | | | 715,394 | | | | 32,515,185 | | | | (9,820,841 | ) | | | 21,365,734 | | | | 16,388,150 | | | | 84,141,624 | | | | 118,974,928 | | | | 18,252,496 | | | | 8,474,843 | |
| | | – | | | | – | | | | – | | | | – | | | | – | | | | – | | | | – | | | | – | | | | – | | | | – | |
| | | |
| | | 21,642,107 | | | | 23,111,481 | | | | 165,817,686 | | | | 130,358,989 | | | | 107,365,906 | | | | 91,126,564 | | | | 304,769,435 | | | | 345,023,513 | | | | 95,013,968 | | | | 31,718,658 | |
| | | – | | | | – | | | | – | | | | – | | | | – | | | | – | | | | – | | | | – | | | | – | | | | – | |
| | | – | | | | – | | | | – | | | | – | | | | – | | | | – | | | | – | | | | – | | | | 45 | | | | 7 | |
| | | | | | | | | | | | | | | | | | | | | | | | | | | | | | | | | | | | | | | | |
| | | – | | | | 302,725 | | | | 199,004 | | | | – | | | | – | | | | – | | | | 7,115,855 | | | | – | | | | 126,066 | | | | 108,244 | |
| | | – | | | | 5,435 | | | | 92,711 | | | | 523,378 | | | | 12,914 | | | | 1,263 | | | | 31,592 | | | | 203,895 | | | | 215 | | | | 55,988 | |
| | | 192,919 | | | | 316,858 | | | | 578,279 | | | | 70,093 | | | | 118,545 | | | | 39,750 | | | | 239,863 | | | | 96,310 | | | | 23,583 | | | | 109,422 | |
| | | – | | | | – | | | | – | | | | – | | | | 13,592 | | | | – | | | | – | | | | – | | | | – | | | | – | |
| | | – | | | | 76 | | | | – | | | | – | | | | – | | | | – | | | | – | | | | 2,022 | | | | 10,696 | | | | 106 | |
| | | |
| | | 21,835,026 | | | | 23,736,575 | | | | 166,687,680 | | | | 130,952,460 | | | | 107,510,957 | | | | 91,167,577 | | | | 312,156,745 | | | | 345,325,740 | | | | 95,174,573 | | | | 31,992,425 | |
| | | | | | | | | | | | | | | | | | | | | | | | | | | | | | | | | | | | | | | | |
| | | | | | | | | | | | | | | | | | | | | | | | | | | | | | | | | | | | | | | | |
| | | – | | | | 93,844 | | | | 376,998 | | | | – | | | | – | | | | – | | | | 4,679,980 | | | | – | | | | 121,965 | | | | 112,501 | |
| | | 64 | | | | 18,629 | | | | 465,863 | | | | 77,843 | | | | – | | | | 52,402 | | | | 61,876 | | | | 589,781 | | | | 4,877 | | | | 25,562 | |
| | | 7,402 | | | | 11,118 | | | | 90,708 | | | | 90,287 | | | | 67,961 | | | | 42,810 | | | | 195,025 | | | | 220,439 | | | | 82,897 | | | | 28,266 | |
| | | 4,626 | | | | 4,043 | | | | 27,910 | | | | 15,652 | | | | 31,715 | | | | 28,021 | | | | 50,944 | | | | 74,432 | | | | 20,724 | | | | 8,076 | |
| | | – | | | | 962 | | | | 8,099 | | | | – | | | | – | | | | 2,126 | | | | – | | | | 1,639 | | | | 267 | | | | 759 | |
| | | – | | | | – | | | | 9,607 | | | | 8,709 | | | | – | | | | – | | | | – | | | | – | | | | – | | | | – | |
| | | – | | | | 4,828 | | | | 38,203 | | | | 6,491 | | | | – | | | | 15,164 | | | | 16,416 | | | | 13,105 | | | | 916 | | | | 4,566 | |
| | | 50,389 | | | | 3,140 | | | | 1,731 | | | | – | | | | – | | | | – | | | | – | | | | – | | | | – | | | | – | |
| | | – | | | | – | | | | – | | | | 2,510,594 | | | | – | | | | – | | | | – | | | | – | | | | – | | | | – | |
| | | |
| | | 62,481 | | | | 136,564 | | | | 1,019,119 | | | | 2,709,576 | | | | 99,676 | | | | 140,523 | | | | 5,004,241 | | | | 899,396 | | | | 231,646 | | | | 179,730 | |
| | | |
| | $ | 21,772,545 | | | $ | 23,600,011 | | | $ | 165,668,561 | | | $ | 128,242,884 | | | $ | 107,411,281 | | | $ | 91,027,054 | | | $ | 307,152,504 | | | $ | 344,426,344 | | | $ | 94,942,927 | | | $ | 31,812,695 | |
| | | |
| | | | | | | | | | | | | | | | | | | | | | | | | | | | | | | | | | | | | | | | |
| | | | | | | | | | | | | | | | | | | | | | | | | | | | | | | | | | | | | | | | |
| | $ | 20,900,429 | | | $ | 24,207,791 | | | $ | 130,829,379 | | | $ | 136,820,779 | | | $ | 83,565,774 | | | $ | 65,464,345 | | | $ | 205,984,227 | | | $ | 213,783,146 | | | $ | 69,919,359 | | | $ | 26,123,264 | |
| | | 2,695 | | | | 4,794 | | | | – | | | | – | | | | 62,455 | | | | 1,463,821 | | | | 871,513 | | | | (718,953 | ) | | | 825,114 | | | | 263,021 | |
| | | 178,435 | | | | (1,327,968 | ) | | | 2,323,997 | | | | 1,819,624 | | | | 2,417,318 | | | | 7,710,738 | | | | 16,155,140 | | | | 12,387,223 | | | | 5,945,964 | | | | (3,044,462 | ) |
| | | | | | | | | | | | | | | | | | | | | | | | | | | | | | | | | | | | | | | | |
| | | 690,986 | | | | 715,394 | | | | 32,515,185 | | | | (10,397,519 | ) | | | 21,365,734 | | | | 16,388,150 | | | | 84,141,624 | | | | 118,974,928 | | | | 18,252,490 | | | | 8,470,872 | |
| | | |
| | $ | 21,772,545 | | | $ | 23,600,011 | | | $ | 165,668,561 | | | $ | 128,242,884 | | | $ | 107,411,281 | | | $ | 91,027,054 | | | $ | 307,152,504 | | | $ | 344,426,344 | | | $ | 94,942,927 | | | $ | 31,812,695 | |
| | | |
| | | | | | | | | | | | | | | | | | | | | | | | | | | | | | | | | | | | | | | | |
| | | | | | $ | 21,297,988 | | | $ | 137,862,803 | | | $ | 16,772,882 | | | | | | | $ | 68,521,546 | | | $ | 77,891,497 | | | $ | 59,175,344 | | | $ | 3,890,485 | | | $ | 20,520,040 | |
| | | | | | | 3,439,078 | | | | 8,652,240 | | | | 1,889,566 | | | | | | | | 4,415,285 | | | | 3,354,016 | | | | 6,312,824 | | | | 229,443 | | | | 1,465,328 | |
| | | | | | $ | 6.19 | | | $ | 15.93 | | | $ | 8.88 | | | | | | | $ | 15.52 | | | $ | 23.22 | | | $ | 9.37 | | | $ | 16.96 | | | $ | 14.00 | |
| | | | | | | 0.29 | | | | 0.97 | | | | 0.54 | | | | | | | | 0.95 | | | | 1.42 | | | | 0.57 | | | | 1.03 | | | | 0.85 | |
| | | | | | | | | | | | | | |
| | | | | | $ | 6.48 | | | $ | 16.90 | | | $ | 9.42 | | | | | | | $ | 16.47 | | | $ | 24.64 | | | $ | 9.94 | | | $ | 17.99 | | | $ | 14.85 | |
| | | | | | | | | | | | | | |
| | | | | | | | | | | | | | | | | | | | | | | | | | | | | | | | | | | | | | | | |
| | | | | | $ | 1,504,661 | | | $ | 12,702,468 | | | | | | | | | | | $ | 3,318,038 | | | | | | | $ | 2,549,551 | | | $ | 415,575 | | | $ | 1,194,544 | |
| | | | | | | 236,211 | | | | 792,128 | | | | | | | | | | | | 219,772 | | | | | | | | 327,713 | | | | 26,185 | | | | 87,622 | |
| | | | | | $ | 6.37 | | | $ | 16.04 | | | | | | | | | | | $ | 15.10 | | | | | | | $ | 7.78 | | | $ | 15.87 | | | $ | 13.63 | |
| | | | | | | | | | | | | | | | | | | | | | | | | |
| | | | | | | | | | | | | | | | | | | | | | | | | | | | | | | | | | | | | | | | |
| | | | | | | | | | $ | 15,103,290 | | | $ | 13,298,935 | | | | | | | | | | | | | | | | | | | | | | | | | |
| | | | | | | | | | | 942,283 | | | | 1,570,167 | | | | | | | | | | | | | | | | | | | | | | | | | |
| | | | | | | | | | $ | 16.03 | | | $ | 8.47 | | | | | | | | | | | | | | | | | | | | | | | | | |
| | | | | | | | | | | | | | | | | | | | | | | | | | | | | | | | | | | |
| | | | | | | | | | | | | | | | | | | | | | | | | | | | | | | | | | | | | | | | |
| | $ | 21,772,545 | | | $ | 797,362 | | | | | | | $ | 95,639,785 | | | $ | 107,411,281 | | | $ | 19,187,470 | | | $ | 222,362,537 | | | $ | 270,988,623 | | | $ | 90,636,867 | | | $ | 10,098,111 | |
| | | 1,868,669 | | | | 130,992 | | | | | | | | 10,556,845 | | | | 4,103,231 | | | | 1,235,501 | | | | 9,546,946 | | | | 27,762,784 | | | | 5,323,838 | | | | 719,463 | |
| | $ | 11.65 | | | $ | 6.09 | | | | | | | $ | 9.06 | | | $ | 26.18 | | | $ | 15.53 | | | $ | 23.29 | | | $ | 9.76 | | | $ | 17.02 | | | $ | 14.04 | |
| | | | | | | | | | |
| | | | | | | | | | | | | | | | | | | | | | | | | | | | | | | | | | | | | | | | |
| | | | | | | | | | | | | | $ | 2,531,282 | | | | | | | | | | | $ | 6,898,470 | | | $ | 11,712,826 | | | | | | | | | |
| | | | | | | | | | | | | | | 277,321 | | | | | | | | | | | | 294,358 | | | | 1,178,717 | | | | | | | | | |
| | | | | | | | | | | | | | $ | 9.13 | | | | | | | | | | | $ | 23.44 | | | $ | 9.94 | | | | | | | | | |
| | | | | | | | | | | | | | | | | | | | | | | | | | | | | | | | | | |
| See accompanying Notes to Financial Statements. |
| |
| |
| 39 |
Madison Funds | October 31, 2017
| |
| Statements of Operations for the Year Ended October 31, 2017 |
| | | | | | | | | | | | | | | | | | | | | | | | | | | | | | | | | |
| | | Conservative
Allocation
Fund | | Moderate
Allocation
Fund | | Aggressive
Allocation
Fund | | Government
Money Market
Fund | | Tax-Free
Virginia
Fund | | Tax-Free
National
Fund | | High Quality
Bond
Fund | | Core
Bond
Fund |
| | | |
| | | | | | | | | | | | | | | | | | | | | | | | | | | | | | | | | |
| Investment Income: | | | | | | | | | | | | | | | | | | | | | | | | | | | | | | | | |
| | | | | | | | | | | | | | | | | | | | | | | | | | | | | | | | | |
| Interest | | $ | 14,997 | | | $ | 30,654 | | | $ | 14,546 | | | $ | 118,046 | | | $ | 638,409 | | | $ | 792,082 | | | $ | 1,835,122 | | | $ | 6,126,331 | |
| Dividends | | | | | | | | | | | | | | | | | | | | | | | | | | | | | | | | |
Unaffiliated issuers | | | 961,404 | | | | 1,891,746 | | | | 764,044 | | | | – | | | | – | | | | – | | | | – | | | | – | |
Affiliated issuers1 | | | 604,638 | | | | 869,150 | | | | 306,645 | | | | – | | | | – | | | | – | | | | – | | | | – | |
Less: Foreign taxes withheld/reclaimed | | | – | | | | – | | | | – | | | | – | | | | – | | | | – | | | | – | | | | – | |
| | | | |
Total investment income | | | 1,581,039 | | | | 2,791,550 | | | | 1,085,235 | | | | 118,046 | | | | 638,409 | | | | 792,082 | | | | 1,835,122 | | | | 6,126,331 | |
| | | | | | | | | | | | | | | | | | | | | | | | | | | | | | | | | |
| Expenses:2 | | | | | | | | | | | | | | | | | | | | | | | | | | | | | | | | |
| Advisory agreement fees | | | 145,990 | | | | 287,080 | | | | 124,417 | | | | 66,903 | | | | 109,710 | | | | 103,919 | | | | 303,067 | | | | 1,056,362 | |
| Service agreement fees | | | 182,488 | | | | 358,850 | | | | 155,522 | | | | 25,050 | | | | 76,797 | | | | 90,929 | | | | 191,942 | | | | 314,538 | |
| Distribution fees - Class B | | | 65,251 | | | | 182,129 | | | | 79,277 | | | | 2,066 | | | | – | | | | – | | | | – | | | | 17,141 | |
| Distribution fees - Class C | | | 151,974 | | | | 69,372 | | | | 17,111 | | | | – | | | | – | | | | – | | | | – | | | | – | |
| Shareholder service fees - Class A | | | 110,051 | | | | 274,853 | | | | 123,363 | | | | – | | | | – | | | | – | | | | – | | | | 85,239 | |
| Shareholder service fees - Class B | | | 21,734 | | | | 60,695 | | | | 26,353 | | | | – | | | | – | | | | – | | | | – | | | | 5,711 | |
| Shareholder service fees - Class C | | | 50,647 | | | | 23,124 | | | | 5,704 | | | | – | | | | – | | | | – | | | | – | | | | – | |
| Other expenses | | | 1,261 | | | | 2,439 | | | | 1,039 | | | | 334 | | | | 379 | | | | 458 | | | | 1,825 | | | | 3,714 | |
| | | | |
Total expenses before reimbursement/waiver | | | 729,396 | | | | 1,258,542 | | | | 532,786 | | | | 94,353 | | | | 186,886 | | | | 195,306 | | | | 496,834 | | | | 1,482,705 | |
| | | | |
Less reimbursement/waiver3 | | | – | | | | – | | | | – | | | | (9,011 | ) | | | – | | | | – | | | | – | | | | – | |
| | | | |
Total expenses net of reimbursement/waiver | | | 729,396 | | | | 1,258,542 | | | | 532,786 | | | | 85,342 | | | | 186,886 | | | | 195,306 | | | | 496,834 | | | | 1,482,705 | |
| | | | |
| Net Investment Income (Loss) | | | 851,643 | | | | 1,533,008 | | | | 552,449 | | | | 32,704 | | | | 451,523 | | | | 596,776 | | | | 1,338,288 | | | | 4,643,626 | |
| Net Realized and Unrealized Gain (Loss) on Investments | | | | | | | | | | | | | | | | | | | | | | | | | | | | | | | | |
Net realized gain (loss) on investments (including net realized gain (loss) on foreign currency related transactions) | | | | | | | | | | | | | | | | | | | | | | | | | | | | | | | | |
Options | | | – | | | | – | | | | – | | | | – | | | | – | | | | – | | | | – | | | | 27,462 | |
Unaffiliated issuers | | | 1,603,275 | | | | 4,228,855 | | | | 2,535,017 | | | | (162 | ) | | | (17,283 | ) | | | 76,845 | | | | (42,572 | ) | | | 486,997 | |
Affiliated issuers1 | | | 23,955 | | | | 310,890 | | | | 148,352 | | | | – | | | | – | | | | – | | | | – | | | | – | |
| Capital gain distributions received from underlying funds | | | | | | | | | | | | | | | | | | | | | | | | | | | | | | | | |
Unaffiliated issuers | | | 23,295 | | | | 11,614 | | | | – | | | | – | | | | – | | | | – | | | | – | | | | – | |
Affiliated issuers1 | | | 342,627 | | | | 1,367,824 | | | | 670,415 | | | | – | | | | – | | | | – | | | | – | | | | – | |
Net change in unrealized appreciation (depreciation) on investments (including net unrealized appreciation (depreciation) on foreign currency related transactions) | | | | | | | | | | | | | | | | | | | | | | | | | | | | | | | | |
Options | | | – | | | | – | | | | – | | | | – | | | | – | | | | – | | | | – | | | | 7,885 | |
Unaffiliated issuers | | | 1,621,946 | | | | 6,599,720 | | | | 4,051,696 | | | | – | | | | (275,965 | ) | | | (521,824 | ) | | | (1,136,642 | ) | | | (2,663,612 | ) |
Affiliated issuers1 | | | 1,108,074 | | | | 4,426,039 | | | | 2,578,599 | | | | – | | | | – | | | | – | | | | – | | | | – | |
| | | | |
Net Realized and Unrealized Gain (Loss) on Investments and Option Transactions | | | 4,723,172 | | | | 16,944,942 | | | | 9,984,079 | | | | (162 | ) | | | (293,248 | ) | | | (444,979 | ) | | | (1,179,214 | ) | | | (2,141,268 | ) |
| | | | |
| Net Increase in Net Assets from Operations | | $ | 5,574,815 | | | $ | 18,477,950 | | | $ | 10,536,528 | | | $ | 32,542 | | | $ | 158,275 | | | $ | 151,797 | | | $ | 159,074 | | | $ | 2,502,358 | |
| | | | |
| | | | | | | | | | | | | | | | | | | | | | | | | | | | | | | | | |
| 1 See Note 12 for information on affiliated issuers. |
| 2 See Note 3 for information on expenses. |
| 3 See Note 3 for more information on these waivers. |
| See accompanying Notes to Financial Statements. |
| |
| |
| 40 |
Madison Funds | October 31, 2017
| |
| Statements of Operations for the Year Ended October 31, 2017 |
| | Corporate
Bond
Fund | | High
Income
Fund | | Diversified
Income
Fund | | Covered Call &
Equity Income
Fund | | Dividend
Income
Fund | | Large Cap
Value
Fund | | Investors
Fund | | Mid
Cap
Fund | | Small
Cap
Fund | | International
Stock
Fund |
| | |
| | | | | | | | | | | | | | | | | | | | | | | | | | | | | | | | | | | | | | | | |
| | $ | 793,726 | | | $ | 1,336,427 | | | $ | 1,768,615 | | | $ | 121,179 | | | $ | 12,668 | | | $ | 13,164 | | | $ | 124,369 | | | $ | 163,357 | | | $ | 29,769 | | | $ | 7,761 | |
| | | | | | | | | | | | | | | | | | | | | | | | | | | | | | | | | | | | | | | | |
| | | – | | | | 19,989 | | | | 2,642,463 | | | | 2,501,666 | | | | 2,901,433 | | | | 2,702,886 | | | | 3,965,323 | | | | 2,782,847 | | | | 2,258,595 | | | | 844,020 | |
| | | – | | | | – | | | | – | | | | – | | | | – | | | | – | | | | – | | | | – | | | | – | | | | – | |
| | | – | | | | – | | | | (14,947 | ) | | | – | | | | (16,610 | ) | | | – | | | | (159,817 | ) | | | (29,778 | ) | | | (1,333 | ) | | | (88,268 | ) |
| | | |
| | | 793,726 | | | | 1,356,416 | | | | 4,396,131 | | | | 2,622,845 | | | | 2,897,491 | | | | 2,716,050 | | | | 3,929,875 | | | | 2,916,426 | | | | 2,287,031 | | | | 763,513 | |
| | | | | | | | | | | | | | | | | | | | | | | | | | | | | | | | | | | | | | | | |
| | | 89,792 | | | | 130,521 | | | | 1,039,723 | | | | 985,547 | | | | 787,945 | | | | 540,697 | | | | 2,203,922 | | | | 2,505,063 | | | | 1,038,576 | | | | 331,446 | |
| | | 56,120 | | | | 47,462 | | | | 319,915 | | | | 170,380 | | | | 367,708 | | | | 353,911 | | | | 575,688 | | | | 846,209 | | | | 259,644 | | | | 94,699 | |
| | | – | | | | 11,849 | | | | 98,022 | | | | – | | | | – | | | | 26,767 | | | | – | | | | 20,850 | | | | 3,305 | | | | 8,968 | |
| | | – | | | | – | | | | 107,935 | | | | 104,189 | | | | – | | | | – | | | | – | | | | – | | | | – | | | | – | |
| | | – | | | | 53,137 | | | | 330,802 | | | | 46,147 | | | | – | | | | 165,954 | | | | 182,327 | | | | 142,674 | | | | 9,332 | | | | 47,882 | |
| | | – | | | | 3,950 | | | | 32,591 | | | | – | | | | – | | | | 8,897 | | | | – | | | | 6,950 | | | | 1,102 | | | | 2,989 | |
| | | – | | | | – | | | | 35,969 | | | | 34,730 | | | | – | | | | – | | | | – | | | | – | | | | – | | | | – | |
| | | 406 | | | | 418 | | | | 2,742 | | | | 1,913 | | | | 1,824 | | | | 1,871 | | | | 5,012 | | | | 5,671 | | | | 1,866 | | | | 599 | |
| | | |
| | | 146,318 | | | | 247,337 | | | | 1,967,699 | | | | 1,342,906 | | | | 1,157,477 | | | | 1,098,097 | | | | 2,966,949 | | | | 3,527,417 | | | | 1,313,825 | | | | 486,583 | |
| | | |
| | | – | | | | – | | | | – | | | | – | | | | (157,589 | ) | | | – | | | | – | | | | – | | | | – | | | | – | |
| | | |
| | | 146,318 | | | | 247,337 | | | | 1,967,699 | | | | 1,342,906 | | | | 999,888 | | | | 1,098,097 | | | | 2,966,949 | | | | 3,527,417 | | | | 1,313,825 | | | | 486,583 | |
| | | |
| | | 647,408 | | | | 1,109,079 | | | | 2,428,432 | | | | 1,279,939 | | | | 1,897,603 | | | | 1,617,953 | | | | 962,926 | | | | (610,991 | ) | | | 973,206 | | | | 276,930 | |
| | | | | | | | | | | | | | | | | | | | | | | | | | | | | | | | | | | | | | | | |
| | | | | | | | | | | | | | | | | | | | | | | | | | | | | | | | | | | | | | | | |
| | | | | | | | | | | | | | | | | | | | | | | | | | | | | | | | | | | | | | | | |
| | | – | | | | – | | | | – | | | | 7,026,516 | | | | – | | | | – | | | | – | | | | – | | | | – | | | | – | |
| | | 178,454 | | | | 418,319 | | | | 2,631,959 | | | | 3,038,362 | | | | 2,466,473 | | | | 7,948,836 | | | | 16,705,859 | | | | 12,992,993 | | | | 6,083,798 | | | | 142,593 | |
| | | – | | | | – | | | | – | | | | – | | | | – | | | | – | | | | – | | | | – | | | | – | | | | – | |
| | | | | | | | | | | | | | | | | | | | | | | | | | | | | | | | | | | | | | | | |
| | | – | | | | – | | | | – | | | | – | | | | – | | | | – | | | | – | | | | – | | | | – | | | | – | |
| | | – | | | | – | | | | – | | | | – | | | | – | | | | – | | | | – | | | | – | | | | – | | | | – | |
| | | | | | | | | | | | | | | | | | | | | | | | | | | | | | | | | | | | | | | | |
| | | | | | | | | | | | | | | | | | | | | | | | | | | | | | | | | | | | | | | | |
| | | – | | | | – | | | | – | | | | (892,041 | ) | | | – | | | | – | | | | – | | | | – | | | | – | | | | – | |
| | | (200,705 | ) | | | 219,456 | | | | 13,666,018 | | | | (4,022,267 | ) | | | 16,333,792 | | | | 5,511,070 | | | | 41,934,972 | | | | 41,373,630 | | | | 11,214,813 | | | | 4,706,201 | |
| | | – | | | | – | | | | – | | | | – | | | | – | | | | – | | | | – | | | | – | | | | – | | | | – | |
| | | |
| | | (22,251 | ) | | | 637,775 | | | | 16,297,977 | | | | 5,150,570 | | | | 18,800,265 | | | | 13,459,906 | | | | 58,640,831 | | | | 54,366,623 | | | | 17,298,611 | | | | 4,848,794 | |
| | | |
| | $ | 625,157 | | | $ | 1,746,854 | | | $ | 18,726,409 | | | $ | 6,430,509 | | | $ | 20,697,868 | | | $ | 15,077,859 | | | $ | 59,603,757 | | | $ | 53,755,632 | | | $ | 18,271,817 | | | $ | 5,125,724 | |
| | | |
| See accompanying Notes to Financial Statements. |
| |
| |
| 41 |
Madison Funds | October 31, 2017
| |
| Statements of Changes in Net Assets |
| | | Conservative Allocation Fund | | Moderate Allocation Fund | | Aggressive Allocation Fund | | Government Money
Market Fund |
| | | |
| | | Year Ended
October 31,
2017 | | Year Ended
October 31,
2016 | | Year Ended
October 31,
2017 | | Year Ended
October 31,
2016 | | Year Ended
October 31,
2017 | | Year Ended
October 31,
2016 | | Year Ended
October 31,
2017 | | Year Ended
October 31,
2016 |
| | | |
| | | | | | | | | | | | | | | | | | | | | | | | | | | | | | | | | |
| Net Assets at beginning of period | | $ | 73,151,961 | | | $ | 75,796,970 | | | $ | 138,815,574 | | | $ | 145,999,790 | | | $ | 58,816,082 | | | $ | 61,816,629 | | | $ | 18,894,157 | | | $ | 19,309,804 | |
| | | | |
| Increase (decrease) in net assets from operations: | | | | | | | | | | | | | | | | | | | | | | | | | | | | | | | | |
Net investment income | | | 851,643 | | | | 763,576 | | | | 1,533,008 | | | | 1,392,864 | | | | 552,449 | | | | 558,905 | | | | 32,704 | | | | – | |
Net realized gain (loss) | | | 1,993,152 | | | | 1,363,827 | | | | 5,919,183 | | | | 4,963,243 | | | | 3,353,784 | | | | 2,040,839 | | | | (162 | ) | | | (146 | ) |
Net change in unrealized appreciation (depreciation) | | | 2,730,020 | | | | (136,899 | ) | | | 11,025,759 | | | | (2,595,597 | ) | | | 6,630,295 | | | | (1,128,528 | ) | | | – | | | | – | |
| | | | |
Net increase (decrease) in net assets from operations | | | 5,574,815 | | | | 1,990,504 | | | | 18,477,950 | | | | 3,760,510 | | | | 10,536,528 | | | | 1,471,216 | | | | 32,542 | | | | (146 | ) |
| | | | |
| Distributions to shareholders from: | | | | | | | | | | | | | | | | | | | | | | | | | | | | | | | | |
Net investment income | | | | | | | | | | | | | | | | | | | | | | | | | | | | | | | | |
Class A | | | (750,763 | ) | | | (672,254 | ) | | | (1,426,923 | ) | | | (1,100,928 | ) | | | (518,663 | ) | | | (402,397 | ) | | | (32,526 | ) | | | – | |
Class B | | | (74,411 | ) | | | (70,918 | ) | | | (153,400 | ) | | | (158,540 | ) | | | (61,878 | ) | | | (87,614 | ) | | | (33 | ) | | | – | |
Class C | | | (170,190 | ) | | | (145,655 | ) | | | (56,550 | ) | | | (52,784 | ) | | | (14,374 | ) | | | (17,856 | ) | | | | | | | | |
Net realized gains | | | | | | | | | | | | | | | | | | | | | | | | | | | | | | | | |
Class A | | | (615,779 | ) | | | (1,385,777 | ) | | | (2,986,528 | ) | | | (5,707,228 | ) | | | (1,202,389 | ) | | | (3,649,031 | ) | | | – | | | | – | |
Class B | | | (129,617 | ) | | | (298,666 | ) | | | (719,238 | ) | | | (1,567,987 | ) | | | (283,060 | ) | | | (971,280 | ) | | | – | | | | – | |
Class C | | | (280,282 | ) | | | (588,819 | ) | | | (265,144 | ) | | | (522,047 | ) | | | (65,754 | ) | | | (197,949 | ) | | | | | | | | |
| | | | |
Total distributions | | | (2,021,042 | ) | | | (3,162,089 | ) | | | (5,607,783 | ) | | | (9,109,514 | ) | | | (2,146,118 | ) | | | (5,326,127 | ) | | | (32,559 | ) | | | – | |
| | | | |
| Capital Stock transactions: | | | | | | | | | | | | | | | | | | | | | | | | | | | | | | | | |
Class A Shares | | | | | | | | | | | | | | | | | | | | | | | | | | | | | | | | |
Shares sold | | | 6,334,759 | | | | 5,089,665 | | | | 11,156,898 | | | | 10,903,837 | | | | 5,057,797 | | | | 5,215,326 | | | | 3,613,727 | | | | 6,602,254 | |
Issued to shareholders in reinvestment of distributions | | | 1,365,548 | | | | 2,056,145 | | | | 4,407,213 | | | | 6,801,086 | | | | 1,720,248 | | | | 4,049,878 | | | | 32,084 | | | | – | |
Shares redeemed | | | (8,571,911 | ) | | | (8,694,132 | ) | | | (14,187,211 | ) | | | (16,675,755 | ) | | | (5,984,943 | ) | | | (7,965,069 | ) | | | (6,969,395 | ) | | | (7,382,598 | ) |
| | | | |
Net increase (decrease) from capital stock transactions | | | (871,604 | ) | | | (1,548,322 | ) | | | 1,376,900 | | | | 1,029,168 | | | | 793,102 | | | | 1,300,135 | | | | (3,323,584 | ) | | | (780,344 | ) |
| | | | |
Class B Shares | | | | | | | | | | | | | | | | | | | | | | | | | | | | | | | | |
Shares sold | | | 382,152 | | | | 1,304,974 | | | | 795,931 | | | | 2,696,102 | | | | 253,099 | | | | 1,166,372 | | | | 263,158 | | | | 631,365 | |
Issued to shareholders in reinvestment of distributions | | | 204,019 | | | | 369,472 | | | | 871,907 | | | | 1,724,768 | | | | 344,880 | | | | 1,055,906 | | | | 32 | | | | – | |
Shares redeemed | | | (2,062,514 | ) | | | (2,416,986 | ) | | | (6,124,594 | ) | | | (7,260,686 | ) | | | (2,634,850 | ) | | | (2,652,891 | ) | | | (647,267 | ) | | | (266,522 | ) |
| | | | |
Net increase (decrease) from capital stock transactions | | | (1,476,343 | ) | | | (742,540 | ) | | | (4,456,756 | ) | | | (2,839,816 | ) | | | (2,036,871 | ) | | | (430,613 | ) | | | (384,077 | ) | | | 364,843 | |
| | | | |
Class C Shares | | | | | | | | | | | | | | | | | | | | | | | | | | | | | | | | |
Shares sold | | | 1,686,163 | | | | 2,509,046 | | | | 862,587 | | | | 816,117 | | | | 243,622 | | | | 118,452 | | | | | | | | | |
Issued to shareholders in reinvestment of distributions | | | 450,472 | | | | 734,474 | | | | 321,694 | | | | 574,652 | | | | 72,103 | | | | 215,805 | | | | | | | | | |
Shares redeemed | | | (2,410,119 | ) | | | (2,426,082 | ) | | | (1,478,239 | ) | | | (1,415,333 | ) | | | (724,749 | ) | | | (349,415 | ) | | | | | | | | |
| | | | | | | | | | | | |
Net increase (decrease) from capital stock transactions | | | (273,484 | ) | | | 817,438 | | | | (293,958 | ) | | | (24,564 | ) | | | (409,024 | ) | | | (15,158 | ) | | | | | | | | |
| | | | | | | | | | | | |
Total net increase (decrease) from capital stock transactions | | | (2,621,431 | ) | | | (1,473,424 | ) | | | (3,373,814 | ) | | | (1,835,212 | ) | | | (1,652,793 | ) | | | 854,364 | | | | (3,707,661 | ) | | | (415,501 | ) |
| | | | |
| Total increase (decrease) in net assets | | | 932,342 | | | | (2,645,009 | ) | | | 9,496,353 | | | | (7,184,216 | ) | | | 6,737,617 | | | | (3,000,547 | ) | | | (3,707,678 | ) | | | (415,647 | ) |
| | | | |
| Net Assets at end of period | | $ | 74,084,303 | | | $ | 73,151,961 | | | $ | 148,311,927 | | | $ | 138,815,574 | | | $ | 65,553,699 | | | $ | 58,816,082 | | | $ | 15,186,479 | | | $ | 18,894,157 | |
| | | | |
Undistributed net investment income (loss) included in net assets | | $ | 14,319 | | | $ | 48,745 | | | $ | 1,047,817 | | | $ | 754,270 | | | $ | 336,143 | | | $ | 197,562 | | | $ | 145 | | | $ | – | |
| | | | |
| Capital Share transactions: | | | | | | | | | | | | | | | | | | | | | | | | | | | | | | | | |
Class A Shares | | | | | | | | | | | | | | | | | | | | | | | | | | | | | | | | |
Shares sold | | | 598,729 | | | | 491,452 | | | | 973,958 | | | | 990,487 | | | | 431,926 | | | | 473,774 | | | | 3,613,727 | | | | 6,602,254 | |
Issued to shareholders in reinvestment of distributions | | | 131,318 | | | | 201,467 | | | | 403,961 | | | | 636,210 | | | | 155,538 | | | | 380,628 | | | | 32,084 | | | | – | |
Shares redeemed | | | (811,088 | ) | | | (841,621 | ) | | | (1,234,277 | ) | | | (1,508,056 | ) | | | (508,168 | ) | | | (723,719 | ) | | | (6,969,395 | ) | | | (7,382,599 | ) |
| | | | |
Net increase (decrease) in shares outstanding | | | (81,041 | ) | | | (148,702 | ) | | | 143,642 | | | | 118,641 | | | | 79,296 | | | | 130,683 | | | | (3,323,584 | ) | | | (780,345 | ) |
| | | | |
Class B Shares | | | | | | | | | | | | | | | | | | | | | | | | | | | | | | | | |
Shares sold | | | 36,186 | | | | 126,839 | | | | 71,031 | | | | 248,262 | | | | 22,954 | | | | 107,735 | | | | 263,158 | | | | 631,365 | |
Issued to shareholders in reinvestment of distributions | | | 19,561 | | | | 36,060 | | | | 80,360 | | | | 162,102 | | | | 31,905 | | | | 101,238 | | | | 32 | | | | – | |
Shares redeemed | | | (193,083 | ) | | | (232,767 | ) | | | (538,097 | ) | | | (664,147 | ) | | | (232,867 | ) | | | (247,771 | ) | | | (647,266 | ) | | | (266,522 | ) |
| | | | |
Net increase (decrease) in shares outstanding | | | (137,336 | ) | | | (69,868 | ) | | | (386,706 | ) | | | (253,783 | ) | | | (178,008 | ) | | | (38,798 | ) | | | (384,076 | ) | | | 364,843 | |
| | | | |
Class C Shares | | | | | | | | | | | | | | | | | | | | | | | | | | | | | | | | |
Shares sold | | | 157,597 | | | | 241,008 | | | | 76,241 | | | | 74,585 | | | | 21,339 | | | | 11,172 | | | | | | | | | |
Issued to shareholders in reinvestment of distributions | | | 43,154 | | | | 71,673 | | | | 29,622 | | | | 53,958 | | | | 6,663 | | | | 20,671 | | | | | | | | | |
Shares redeemed | | | (226,492 | ) | | | (233,566 | ) | | | (131,330 | ) | | | (130,202 | ) | | | (64,276 | ) | | | (32,375 | ) | | | | | | | | |
| | | | | | | | | | | | |
Net increase (decrease) in shares outstanding | | | (25,741 | ) | | | 79,115 | | | | (25,467 | ) | | | (1,659 | ) | | | (36,274 | ) | | | (532 | ) | | | | | | | | |
| | | | | | | | | | | | |
|
| See accompanying Notes to Financial Statements. |
| |
| |
| 42 |
Madison Funds | October 31, 2017
| |
| Statements of Changes in Net Assets |
| | | Tax-Free Virginia Fund | | Tax-Free National Fund | | High Quality Bond Fund | | Core Bond Fund |
| | | |
| | | Year Ended
October 31,
2017 | | Year Ended
October 31,
2016 | | Year Ended
October 31,
2017 | | Year Ended
October 31,
2016 | | Year Ended
October 31,
2017 | | Year Ended
October 31,
2016 | | Year Ended
October 31,
2017 | | Year Ended
October 31,
2016 |
| | | |
| Net Assets at beginning of period | | $ | 22,350,143 | | | $ | 22,659,372 | | | $ | 27,332,854 | | | $ | 27,744,109 | | | $ | 105,806,832 | | | $ | 102,551,509 | | | $ | 216,822,576 | | | $ | 223,858,567 | |
| | | | |
| Increase (decrease) in net assets from operations: | | | | | | | | | | | | | | | | | | | | | | | | | | | | | | | | |
Net investment income | | | 451,523 | | | | 479,572 | | | | 596,776 | | | | 634,820 | | | | 1,338,288 | | | | 1,172,898 | | | | 4,643,626 | | | | 4,874,355 | |
Net realized gain (loss) | | | (17,283 | ) | | | 36,276 | | | | 76,845 | | | | 181,114 | | | | (42,572 | ) | | | 124,354 | | | | 514,459 | | | | 1,588,631 | |
Net change in unrealized appreciation (depreciation) | | | (275,965 | ) | | | 152,467 | | | | (521,824 | ) | | | 211,121 | | | | (1,136,642 | ) | | | 359,047 | | | | (2,655,727 | ) | | | 3,039,357 | |
| | | | |
Net increase in net assets from operations | | | 158,275 | | | | 668,315 | | | | 151,797 | | | | 1,027,055 | | | | 159,074 | | | | 1,656,299 | | | | 2,502,358 | | | | 9,502,343 | |
| | | | |
| Distributions to shareholders from: | | | | | | | | | | | | | | | | | | | | | | | | | | | | | | | | |
Net investment income | | | | | | | | | | | | | | | | | | | | | | | | | | | | | | | | |
Class A | | | | | | | | | | | | | | | | | | | | | | | | | | | (749,521 | ) | | | (739,467 | ) |
Class B | | | | | | | | | | | | | | | | | | | | | | | | | | | (32,830 | ) | | | (39,742 | ) |
Class Y | | | (451,544 | ) | | | (481,306 | ) | | | (596,927 | ) | | | (636,648 | ) | | | (1,315,129 | ) | | | (1,157,858 | ) | | | (4,265,108 | ) | | | (4,543,120 | ) |
Class R6 | | | | | | | | | | | | | | | | | | | | | | | | | | | (44,661 | ) | | | (44,763 | ) |
Net realized gains | | | | | | | | | | | | | | | | | | | | | | | | | | | | | | | | |
Class A | | | | | | | | | | | | | | | | | | | | | | | | | | | (175,602 | ) | | | (271,770 | ) |
Class B | | | | | | | | | | | | | | | | | | | | | | | | | | | (13,156 | ) | | | (23,795 | ) |
Class Y | | | (36,276 | ) | | | (69,797 | ) | | | (181,117 | ) | | | (162,274 | ) | | | (124,222 | ) | | | (346,318 | ) | | | (917,720 | ) | | | (1,544,568 | ) |
Class R6 | | | | | | | | | | | | | | | | | | | | | | | | | | | (9,658 | ) | | | (14,467 | ) |
| | | | |
Total distributions | | | (487,820 | ) | | | (551,103 | ) | | | (778,044 | ) | | | (798,922 | ) | | | (1,439,351 | ) | | | (1,504,176 | ) | | | (6,208,256 | ) | | | (7,221,692 | ) |
| | | | |
| Capital Stock transactions: | | | | | | | | | | | | | | | | | | | | | | | | | | | | | | | | |
Class A Shares | | | | | | | | | | | | | | | | | | | | | | | | | | | | | | | | |
Shares sold | | | | | | | | | | | | | | | | | | | | | | | | | | | 3,389,344 | | | | 5,672,094 | |
Issued to shareholders in reinvestment of distributions | | | | | | | | | | | | | | | | | | | | | | | | | | | 920,189 | | | | 1,005,724 | |
Shares redeemed | | | | | | | | | | | | | | | | | | | | | | | | | | | (4,318,859 | ) | | | (5,542,231 | ) |
| | | | | | | | | | | | | | | | | | | | | | | | | | | | |
Net increase (decrease) from capital stock transactions | | | | | | | | | | | | | | | | | | | | | | | | | | | (9,326 | ) | | | 1,135,587 | |
| | | | | | | | | | | | | | | | | | | | | | | | | | | | |
Class B Shares | | | | | | | | | | | | | | | | | | | | | | | | | | | | | | | | |
Shares sold | | | | | | | | | | | | | | | | | | | | | | | | | | | 92,099 | | | | 107,880 | |
Issued to shareholders in reinvestment of distributions | | | | | | | | | | | | | | | | | | | | | | | | | | | 45,901 | | | | 63,538 | |
Shares redeemed | | | | | | | | | | | | | | | | | | | | | | | | | | | (665,241 | ) | | | (554,763 | ) |
| | | | | | | | | | | | | | | | | | | | | | | | | | | | |
Net decrease from capital stock transactions | | | | | | | | | | | | | | | | | | | | | | | | | | | (527,241 | ) | | | (383,345 | ) |
| | | | | | | | | | | | | | | | | | | | | | | | | | | | |
Class Y Shares | | | | | | | | | | | | | | | | | | | | | | | | | | | | | | | | |
Shares sold | | | 481,709 | | | | 536,972 | | | | 456,854 | | | | 983,897 | | | | 21,374,350 | | | | 34,317,491 | | | | 7,419,347 | | | | 3,925,508 | |
Issued to shareholders in reinvestment of distributions | | | 474,510 | | | | 535,004 | | | | 698,613 | | | | 716,733 | | | | 1,351,692 | | | | 1,386,389 | | | | 1,228,039 | | | | 1,462,479 | |
Shares redeemed | | | (1,110,578 | ) | | | (1,498,417 | ) | | | (2,568,407 | ) | | | (2,340,018 | ) | | | (26,716,360 | ) | | | (32,600,680 | ) | | | (13,469,839 | ) | | | (15,618,847 | ) |
| | | | |
Net increase (decrease) from capital stock transactions | | | (154,359 | ) | | | (426,441 | ) | | | (1,412,940 | ) | | | (639,388 | ) | | | (3,990,318 | ) | | | 3,103,200 | | | | (4,822,453 | ) | | | (10,230,860 | ) |
| | | | |
Class R6 Shares | | | | | | | | | | | | | | | | | | | | | | | | | | | | | | | | |
Shares sold | | | | | | | | | | | | | | | | | | | | | | | | | | | 164,741 | | | | 387,488 | |
Issued to shareholders in reinvestment of distributions | | | | | | | | | | | | | | | | | | | | | | | | | | | 54,319 | | | | 59,231 | |
Shares redeemed | | | | | | | | | | | | | | | | | | | | | | | | | | | (262,944 | ) | | | (284,743 | ) |
| | | | | | | | | | | | | | | | | | | | | | | | | | | | |
Net increase (decrease) from capital stock transactions | | | | | | | | | | | | | | | | | | | | | | | | | | | (43,884 | ) | | | 161,976 | |
| | | | | | | | | | | | | | | | | | | | | | | | | | | | |
Total net increase (decrease) from capital stock transactions | | | (154,359 | ) | | | (426,441 | ) | | | (1,412,940 | ) | | | (639,388 | ) | | | (3,990,318 | ) | | | 3,103,200 | | | | (5,402,904 | ) | | | (9,316,642 | ) |
| | | | |
| Total increase (decrease) in net assets | | | (483,904 | ) | | | (309,229 | ) | | | (2,039,187 | ) | | | (411,255 | ) | | | (5,270,595 | ) | | | 3,255,323 | | | | (9,108,802 | ) | | | (7,035,991 | ) |
| | | | |
| Net Assets at end of period | | $ | 21,866,239 | | | $ | 22,350,143 | | | $ | 25,293,667 | | | $ | 27,332,854 | | | $ | 100,536,237 | | | $ | 105,806,832 | | | $ | 207,713,774 | | | $ | 216,822,576 | |
| | | | |
Undistributed net investment income (loss) included in net assets | | $ | 1,945 | | | $ | 1,966 | | | $ | 2,493 | | | $ | 2,644 | | | $ | 119,042 | | | $ | 111,636 | | | $ | 21,350 | | | $ | 23,859 | |
| | | | |
| Capital Share transactions: | | | | | | | | | | | | | | | | | | | | | | | | | | | | | | | | |
Class A Shares | | | | | | | | | | | | | | | | | | | | | | | | | | | | | | | | |
Shares sold | | | | | | | | | | | | | | | | | | | | | | | | | | | 338,890 | | | | 559,373 | |
Issued to shareholders in reinvestment of distributions | | | | | | | | | | | | | | | | | | | | | | | | | | | 92,223 | | | | 99,789 | |
Shares redeemed | | | | | | | | | | | | | | | | | | | | | | | | | | | (431,347 | ) | | | (545,982 | ) |
| | | | | | | | | | | | | | | | | | | | | | | | | | | | |
Net increase (decrease) in shares outstanding | | | | | | | | | | | | | | | | | | | | | | | | | | | (234 | ) | | | 113,180 | |
| | | | | | | | | | | | | | | | | | | | | | | | | | | | |
Class B Shares | | | | | | | | | | | | | | | | | | | | | | | | | | | | | | | | |
Shares sold | | | | | | | | | | | | | | | | | | | | | | | | | | | 9,163 | | | | 10,600 | |
Issued to shareholders in reinvestment of distributions | | | | | | | | | | | | | | | | | | | | | | | | | | | 4,603 | | | | 6,318 | |
Shares redeemed | | | | | | | | | | | | | | | | | | | | | | | | | | | (66,389 | ) | | | (54,634 | ) |
| | | | | | | | | | | | | | | | | | | | | | | | | | | | |
Net decrease in shares outstanding | | | | | | | | | | | | | | | | | | | | | | | | | | | (52,623 | ) | | | (37,716 | ) |
| | | | | | | | | | | | | | | | | | | | | | | | | | | | |
Class Y Shares | | | | | | | | | | | | | | | | | | | | | | | | | | | | | | | | |
Shares sold | | | 41,925 | | | | 45,709 | | | | 42,216 | | | | 87,841 | | | | 1,954,129 | | | | 3,101,143 | | | | 744,802 | | | | 387,789 | |
Issued to shareholders in reinvestment of distributions | | | 41,472 | | | | 45,640 | | | | 64,789 | | | | 64,336 | | | | 124,008 | | | | 125,606 | | | | 123,469 | | | | 145,618 | |
Shares redeemed | | | (96,605 | ) | | | (127,611 | ) | | | (236,695 | ) | | | (209,526 | ) | | | (2,443,293 | ) | | | (2,946,328 | ) | | | (1,349,502 | ) | | | (1,544,225 | ) |
| | | | |
Net increase (decrease) in shares outstanding | | | (13,208 | ) | | | (36,262 | ) | | | (129,690 | ) | | | (57,349 | ) | | | (365,156 | ) | | | 280,421 | | | | (481,231 | ) | | | (1,010,818 | ) |
| | | | |
Class R6 Shares | | | | | | | | | | | | | | | | | | | | | | | | | | | | | | | | |
Shares sold | | | | | | | | | | | | | | | | | | | | | | | | | | | 16,457 | | | | 38,493 | |
Issued to shareholders in reinvestment of distributions | | | | | | | | | | | | | | | | | | | | | | | | | | | 5,436 | | | | 5,875 | |
Shares redeemed | | | | | | | | | | | | | | | | | | | | | | | | | | | (26,305 | ) | | | (28,318 | ) |
| | | | | | | | | | | | | | | | | | | | | | | | | | | | |
Net increase (decrease) in shares outstanding | | | | | | | | | | | | | | | | | | | | | | | | | | | (4,412 | ) | | | 16,050 | |
| | | | | | | | | | | | | | | | | | | | | | | | | | | | |
| See accompanying Notes to Financial Statements. |
| |
| |
| 43 |
Madison Funds | October 31, 2017
| |
| Statements of Changes in Net Assets |
| | | Corporate Bond Fund | | High Income Fund | | Diversified Income Fund | | Covered Call &
Equity Income Fund |
| | | |
| | | Year Ended
October 31,
2017 | | Year Ended
October 31,
2016 | | Year Ended
October 31,
2017 | | Year Ended
October 31,
2016 | | Year Ended
October 31,
2017 | | Year Ended
October 31,
2016 | | Year Ended
October 31,
2017 | | Year Ended
October 31,
2016 |
| | | |
| Net Assets at beginning of period | | $ | 23,845,523 | | | $ | 23,545,115 | | | $ | 23,766,340 | | | $ | 25,503,956 | | | $ | 154,998,713 | | | $ | 147,233,643 | | | $ | 106,122,961 | | | $ | 89,071,393 | |
| | | | |
| Increase (decrease) in net assets from operations: | | | | | | | | | | | | | | | | | | | | | | | | | | | | | | | | |
Net investment income | | | 647,408 | | | | 670,481 | | | | 1,109,079 | | | | 1,168,704 | | | | 2,428,432 | | | | 2,313,564 | | | | 1,279,939 | | | | 239,728 | |
Net realized gain (loss) | | | 178,454 | | | | 87,743 | | | | 418,319 | | | | (1,432,655 | ) | | | 2,631,959 | | | | 5,660,656 | | | | 10,064,878 | | | | 1,329,854 | |
Net change in unrealized appreciation (depreciation) | | | (200,705 | ) | | | 708,932 | | | | 219,456 | | | | 1,774,630 | | | | 13,666,018 | | | | (414,885 | ) | | | (4,914,308 | ) | | | 2,302,123 | |
| | | | |
Net increase in net assets from operations | | | 625,157 | | | | 1,467,156 | | | | 1,746,854 | | | | 1,510,679 | | | | 18,726,409 | | | | 7,559,335 | | | | 6,430,509 | | | | 3,871,705 | |
| | | | |
| Distributions to shareholders from: | | | | | | | | | | | | | | | | | | | | | | | | | | | | | | | | |
Net investment income | | | | | | | | | | | | | | | | | | | | | | | | | | | | | | | | |
Class A | | | | | | | | | | | (1,001,872 | ) | | | (1,066,848 | ) | | | (2,298,681 | ) | | | (2,169,597 | ) | | | (787,571 | ) | | | (774,944 | ) |
Class B | | | | | | | | | | | (60,236 | ) | | | (65,575 | ) | | | (127,992 | ) | | | (134,801 | ) | | | | | | | | |
Class C | | | | | | | | | | | | | | | | | | | (139,888 | ) | | | (129,487 | ) | | | (625,057 | ) | | | (542,263 | ) |
Class Y | | | (647,595 | ) | | | (672,447 | ) | | | (47,093 | ) | | | (40,857 | ) | | | | | | | | | | | (3,615,921 | ) | | | (2,810,240 | ) |
Class R6 | | | | | | | | | | | | | | | | | | | | | | | | | | | (103,532 | ) | | | (131,637 | ) |
Net realized gains | | | | | | | | | | | | | | | | | | | | | | | | | | | | | | | | |
Class A | | | | | | | | | | | – | | | | – | | | | (4,582,932 | ) | | | (2,746,768 | ) | | | (428,064 | ) | | | (289,318 | ) |
Class B | | | | | | | | | | | – | | | | – | | | | (466,920 | ) | | | (303,965 | ) | | | | | | | | |
Class C | | | | | | | | | | | | | | | | | | | (487,580 | ) | | | (286,956 | ) | | | (321,419 | ) | | | (178,928 | ) |
Class Y | | | (87,745 | ) | | | (77,757 | ) | | | – | | | | – | | | | | | | | | | | | (1,634,708 | ) | | | (1,036,903 | ) |
Class R6 | | | | | | | | | | | | | | | | | | | | | | | | | | | (76,472 | ) | | | (50,094 | ) |
| | | | |
Total distributions | | | (735,340 | ) | | | (750,204 | ) | | | (1,109,201 | ) | | | (1,173,280 | ) | | | (8,103,993 | ) | | | (5,771,574 | ) | | | (7,592,744 | ) | | | (5,814,327 | ) |
| | | | |
| Capital Stock transactions: | | | | | | | | | | | | | | | | | | | | | | | | | | | | | | | | |
Class A Shares | | | | | | | | | | | | | | | | | | | | | | | | | | | | | | | | |
Shares sold | | | | | | | | | | | 1,472,285 | | | | 987,103 | | | | 11,771,897 | | | | 17,024,600 | | | | 5,133,825 | | | | 5,213,975 | |
Issued to shareholders in reinvestment of distributions | | | | | | | | | | | 973,636 | | | | 1,038,328 | | | | 6,835,767 | | | | 4,880,118 | | | | 1,167,788 | | | | 1,031,927 | |
Shares redeemed | | | | | | | | | | | (3,117,167 | ) | | | (4,074,755 | ) | | | (17,754,136 | ) | | | (16,208,159 | ) | | | (7,636,091 | ) | | | (3,700,248 | ) |
| | | | | | | | | | | | |
Net increase (decrease) from capital stock transactions | | | | | | | | | | | (671,246 | ) | | | (2,049,324 | ) | | | 853,528 | | | | 5,696,559 | | | | (1,334,478 | ) | | | 2,545,654 | |
| | | | | | | | | | | | |
Class B Shares | | | | | | | | | | | | | | | | | | | | | | | | | | | | | | | | |
Shares sold | | | | | | | | | | | 4,867 | | | | 94,802 | | | | 523,653 | | | | 1,489,442 | | | | | | | | | |
Issued to shareholders in reinvestment of distributions | | | | | | | | | | | 53,736 | | | | 57,051 | | | | 594,911 | | | | 438,764 | | | | | | | | | |
Shares redeemed | | | | | | | | | | | (250,246 | ) | | | (213,252 | ) | | | (2,565,093 | ) | | | (2,233,370 | ) | | | | | | | | |
| | | | | | | | | | | | | | | | | | | | |
Net decrease from capital stock transactions | | | | | | | | | | | (191,643 | ) | | | (61,399 | ) | | | (1,446,529 | ) | | | (305,164 | ) | | | | | | | | |
| | | | | | | | | | | | | | | | | | | | |
Class C Shares | | | | | | | | | | | | | | | | | | | | | | | | | | | | | | | | |
Shares sold | | | | | | | | | | | | | | | | | | | 1,669,969 | | | | 2,021,672 | | | | 1,757,805 | | | | 5,551,503 | |
Issued to shareholders in reinvestment of distributions | | | | | | | | | | | | | | | | | | | 627,468 | | | | 416,443 | | | | 691,489 | | | | 549,417 | |
Shares redeemed | | | | | | | | | | | | | | | | | | | (1,657,004 | ) | | | (1,852,201 | ) | | | (2,422,068 | ) | | | (1,596,838 | ) |
| | | | | | | | | | | | | | | | | | | | |
Net increase from capital stock transactions | | | | | | | | | | | | | | | | | | | 640,433 | | | | 585,914 | | | | 27,226 | | | | 4,504,082 | |
| | | | | | | | | | | | | | | | | | | | |
Class Y Shares | | | | | | | | | | | | | | | | | | | | | | | | | | | | | | | | |
Shares sold | | | 127,791 | | | | 183,681 | | | | 4,028,802 | | | | 1,892,024 | | | | | | | | | | | | 57,926,184 | | | | 25,903,265 | |
Issued to shareholders in reinvestment of distributions | | | 37,214 | | | | 32,936 | | | | 47,093 | | | | 40,749 | | | | | | | | | | | | 5,179,434 | | | | 3,764,499 | |
Shares redeemed | | | (2,127,800 | ) | | | (633,161 | ) | | | (4,016,988 | ) | | | (1,897,065 | ) | | | | | | | | | | | (37,931,562 | ) | | | (18,060,929 | ) |
| | | | | | | | | | | | | | | |
Net increase (decrease) from capital stock transactions | | | (1,962,795 | ) | | | (416,544 | ) | | | 58,907 | | | | 35,708 | | | | | | | | | | | | 25,174,056 | | | | 11,606,835 | |
| | | | | | | | | | | | | | | |
Class R6 Shares | | | | | | | | | | | | | | | | | | | | | | | | | | | | | | | | |
Shares sold | | | | | | | | | | | | | | | | | | | | | | | | | | | 635,052 | | | | 719,403 | |
Issued to shareholders in reinvestment of distributions | | | | | | | | | | | | | | | | | | | | | | | | | | | 180,004 | | | | 181,731 | |
Shares redeemed | | | | | | | | | | | | | | | | | | | | | | | | | | | (1,399,702 | ) | | | (563,515 | ) |
| | | | | | | | | | | | | | | | | | | | | | | | | | | | |
Net increase (decrease) from capital stock transactions | | | | | | | | | | | | | | | | | | | | | | | | | | | (584,646 | ) | | | 337,619 | |
| | | | | | | | | | | | | | | | | | | | | | | | | | | | |
Total net increase (decrease) from capital stock transactions | | | (1,962,795 | ) | | | (416,544 | ) | | | (803,982 | ) | | | (2,075,015 | ) | | | 47,432 | | | | 5,977,309 | | | | 23,282,158 | | | | 18,994,190 | |
| | | | |
| Total increase (decrease) in net assets | | | (2,072,978 | ) | | | 300,408 | | | | (166,329 | ) | | | (1,737,616 | ) | | | 10,669,848 | | | | 7,765,070 | | | | 22,119,923 | | | | 17,051,568 | |
| | | | |
| Net Assets at end of period | | $ | 21,772,545 | | | $ | 23,845,523 | | | $ | 23,600,011 | | | $ | 23,766,340 | | | $ | 165,668,561 | | | $ | 154,998,713 | | | $ | 128,242,884 | | | $ | 106,122,961 | |
| | | | |
Undistributed net investment income (loss) included in net assets | | $ | 2,695 | | | $ | 2,882 | | | $ | 4,794 | | | $ | 4,916 | | | $ | – | | | $ | 3,069 | | | $ | – | | | $ | – | |
| | | | |
| Capital Share transactions: | | | | | | | | | | | | | | | | | | | | | | | | | | | | | | | | |
Class A Shares | | | | | | | | | | | | | | | | | | | | | | | | | | | | | | | | |
Shares sold | | | | | | | | | | | 240,145 | | | | 170,049 | | | | 769,800 | | | | 1,149,706 | | | | 566,341 | | | | 581,978 | |
Issued to shareholders in reinvestment of distributions | | | | | | | | | | | 158,841 | | | | 178,480 | | | | 457,403 | | | | 335,770 | | | | 129,789 | | | | 115,406 | |
Shares redeemed | | | | | | | | | | | (509,309 | ) | | | (704,267 | ) | | | (1,167,193 | ) | | | (1,100,532 | ) | | | (845,787 | ) | | | (413,649 | ) |
| | | | | | | | | | | | |
Net increase (decrease) in shares outstanding | | | | | | | | | | | (110,323 | ) | | | (355,738 | ) | | | 60,010 | | | | 384,944 | | | | (149,657 | ) | | | 283,735 | |
| | | | | | | | | | | | |
Class B Shares | | | | | | | | | | | | | | | | | | | | | | | | | | | | | | | | |
Shares sold | | | | | | | | | | | 788 | | | | 15,627 | | | | 34,608 | | | | 100,171 | | | | | | | | | |
Issued to shareholders in reinvestment of distributions | | | | | | | | | | | 8,528 | | | | 9,548 | | | | 39,717 | | | | 30,137 | | | | | | | | | |
Shares redeemed | | | | | | | | | | | (39,707 | ) | | | (35,765 | ) | | | (167,670 | ) | | | (151,055 | ) | | | | | | | | |
| | | | | | | | | | | | | | | | | | | | |
Net decrease in shares outstanding | | | | | | | | | | | (30,391 | ) | | | (10,590 | ) | | | (93,345 | ) | | | (20,747 | ) | | | | | | | | |
| | | | | | | | | | | | | | | | | | | | |
Class C Shares | | | | | | | | | | | | | | | | | | | | | | | | | | | | | | | | |
Shares sold | | | | | | | | | | | | | | | | | | | 109,195 | | | | 135,512 | | | | 202,260 | | | | 642,363 | |
Issued to shareholders in reinvestment of distributions | | | | | | | | | | | | | | | | | | | 41,879 | | | | 28,605 | | | | 80,120 | | | | 63,469 | |
Shares redeemed | | | | | | | | | | | | | | | | | | | (108,304 | ) | | | (125,613 | ) | | | (279,415 | ) | | | (183,825 | ) |
| | | | | | | | | | | | | | | | | | | | |
Net increase in shares outstanding | | | | | | | | | | | | | | | | | | | 42,770 | | | | 38,504 | | | | 2,965 | | | | 522,007 | |
| | | | | | | | | | | | | | | | | | | | |
Class Y Shares | | | | | | | | | | | | | | | | | | | | | | | | | | | | | | | | |
Shares sold | | | 11,185 | | | | 15,894 | | | | 669,137 | | | | 331,236 | | | | | | | | | | | | 6,299,606 | | | | 2,840,804 | |
Issued to shareholders in reinvestment of distributions | | | 3,239 | | | | 2,872 | | | | 7,825 | | | | 7,124 | | | | | | | | | | | | 565,094 | | | | 414,352 | |
Shares redeemed | | | (185,211 | ) | | | (55,577 | ) | | | (665,869 | ) | | | (331,721 | ) | | | | | | | | | | | (4,130,437 | ) | | | (2,002,851 | ) |
| | | | | | | | | | | | | | | |
Net increase (decrease) in shares outstanding | | | (170,787 | ) | | | (36,811 | ) | | | 11,093 | | | | 6,639 | | | | | | | | | | | | 2,734,263 | | | | 1,252,305 | |
| | | | | | | | | | | | | | | |
Class R6 Shares | | | | | | | | | | | | | | | | | | | | | | | | | | | | | | | | |
Shares sold | | | | | | | | | | | | | | | | | | | | | | | | | | | 68,535 | | | | 77,492 | |
Issued to shareholders in reinvestment of distributions | | | | | | | | | | | | | | | | | | | | | | | | | | | 19,501 | | | | 19,912 | |
Shares redeemed | | | | | | | | | | | | | | | | | | | | | | | | | | | (150,298 | ) | | | (61,441 | ) |
| | | | | | | | | | | | | | | | | | | | | | | | | | | | |
Net increase (decrease) in shares outstanding | | | | | | | | | | | | | | | | | | | | | | | | | | | (62,262 | ) | | | 35,963 | |
| | | | | | | | | | | | | | | | | | | | | | | | | | | | |
| See accompanying Notes to Financial Statements. |
| |
| |
| 44 |
Madison Funds | October 31, 2017
| |
| Statements of Changes in Net Assets |
| | | Dividend Income Fund | | Large Cap Value Fund | | Investors Fund | | Mid Cap Fund |
| | | |
| | | Year Ended October 31, 2017 | | Year Ended October 31, 2016 | | Year Ended October 31, 2017 | | Year Ended October 31, 2016 | | Year Ended October 31, 2017 | | Year Ended October 31, 2016 | | Year Ended October 31, 2017 | | Year Ended October 31, 2016 |
| | | |
| Net Assets at beginning of period | | $ | 102,401,892 | | | $ | 20,924,558 | | | $ | 103,063,978 | | | $ | 177,208,386 | | | $ | 278,638,527 | | | $ | 118,284,204 | | | $ | 306,413,976 | | | $ | 265,880,184 | |
| | | | |
| Increase (decrease) in net assets from operations: | | | | | | | | | | | | | | | | | | | | | | | | | | | | | | | | |
Net investment income (loss) | | | 1,897,603 | | | | 1,083,945 | | | | 1,617,953 | | | | 1,564,854 | | | | 962,926 | | | | 571,085 | | | | (610,991 | ) | | | (588,643 | ) |
Net realized gain | | | 2,466,473 | | | | 2,369,983 | | | | 7,948,836 | | | | 13,539,337 | | | | 16,705,859 | | | | 8,295,419 | | | | 12,992,993 | | | | 14,740,332 | |
Net change in unrealized appreciation (depreciation) | | | 16,333,792 | | | | 1,225,487 | | | | 5,511,070 | | | | (6,493,824 | ) | | | 41,934,972 | | | | 22,660,122 | | | | 41,373,630 | | | | (3,041,950 | ) |
| | | | |
Net increase in net assets from operations | | | 20,697,868 | | | | 4,679,415 | | | | 15,077,859 | | | | 8,610,367 | | | | 59,603,757 | | | | 31,526,626 | | | | 53,755,632 | | | | 11,109,739 | |
| | | | |
| Distributions to shareholders from: | | | | | | | | | | | | | | | | | | | | | | | | | | | | | | | | |
Net investment income | | | | | | | | | | | | | | | | | | | | | | | | | | | | | | | | |
Class A | | | | | | | | | | | (733,449 | ) | | | (385,702 | ) | | | (2,015 | ) | | | (12,985 | ) | | | (2,531 | ) | | | – | |
Class B | | | | | | | | | | | (13,654 | ) | | | (4,614 | ) | | | | | | | | | | | – | | | | – | |
Class Y | | | (1,888,455 | ) | | | (1,027,860 | ) | | | (514,776 | ) | | | (924,359 | ) | | | (472,406 | ) | | | (866,821 | ) | | | – | | | | – | |
Class R6 | | | | | | | | | | | | | | | | | | | (25,360 | ) | | | (66,629 | ) | | | – | | | | – | |
Net realized gains | | | | | | | | | | | | | | | | | | | | | | | | | | | | | | | | |
Class A | | | | | | | | | | | (8,381,367 | ) | | | (7,048,086 | ) | | | (2,071,803 | ) | | | (290,582 | ) | | | (2,386,234 | ) | | | (3,119,742 | ) |
Class B | | | | | | | | | | | (501,914 | ) | | | (458,770 | ) | | | | | | | | | | | (154,728 | ) | | | (229,780 | ) |
Class Y | | | (2,424,186 | ) | | | (838,307 | ) | | | (4,807,334 | ) | | | (11,989,841 | ) | | | (6,262,644 | ) | | | (13,633,242 | ) | | | (10,575,693 | ) | | | (11,027,407 | ) |
Class R6 | | | | | | | | | | | | | | | | | | | (185,942 | ) | | | (863,240 | ) | | | (460,898 | ) | | | (549,126 | ) |
| | | | |
Total distributions | | | (4,312,641 | ) | | | (1,866,167 | ) | | | (14,952,494 | ) | | | (20,811,372 | ) | | | (9,020,170 | ) | | | (15,733,499 | ) | | | (13,580,084 | ) | | | (14,926,055 | ) |
| | | | |
| Capital Stock transactions: | | | | | | | | | | | | | | | | | | | | | | | | | | | | | | | | |
Class A Shares | | | | | | | | | | | | | | | | | | | | | | | | | | | | | | | | |
Shares sold | | | | | | | | | | | 3,748,022 | | | | 3,290,087 | | | | 3,194,360 | | | | 2,526,425 | | | | 4,346,577 | | | | 3,607,742 | |
Issued in merger | | | | | | | | | | | – | | | | – | | | | – | | | | 60,299,634 | | | | – | | | | – | |
Issued to shareholders in reinvestment of distributions | | | | | | | | | | | 9,072,454 | | | | 7,418,601 | | | | 2,069,032 | | | | 303,567 | | | | 2,384,049 | | | | 3,116,694 | |
Shares redeemed | | | | | | | | | | | (7,905,016 | ) | | | (8,388,132 | ) | | | (7,427,188 | ) | | | (5,685,925 | ) | | | (6,626,499 | ) | | | (6,750,425 | ) |
| | | | | | | | | | | | |
Net increase (decrease) from capital stock transactions | | | | | | | | | | | 4,915,460 | | | | 2,320,556 | | | | (2,163,796 | ) | | | 57,443,701 | | | | 104,127 | | | | (25,989 | ) |
| | | | | | | | | | | | |
Class B Shares | | | | | | | | | | | | | | | | | | | | | | | | | | | | | | | | |
Shares sold | | | | | | | | | | | 237,495 | | | | 352,221 | | | | | | | | | | | | 153,307 | | | | 265,455 | |
Issued to shareholders in reinvestment of distributions | | | | | | | | | | | 515,568 | | | | 463,383 | | | | | | | | | | | | 154,728 | | | | 229,779 | |
Shares redeemed | | | | | | | | | | | (1,013,067 | ) | | | (1,098,195 | ) | | | | | | | | | | | (866,212 | ) | | | (898,341 | ) |
| | | | | | | | | | | | | | | | | | | | | | |
Net decrease from capital stock transactions | | | | | | | | | | | (260,004 | ) | | | (282,591 | ) | | | | | | | | | | | (558,177 | ) | | | (403,107 | ) |
| | | | | | | | | | | | | | | | | | | | | | |
Class Y Shares | | | | | | | | | | | | | | | | | | | | | | | | | | | | | | | | |
Shares sold | | | 6,571,618 | | | | 81,433,767 | | | | 778,384 | | | | 9,682,939 | | | | 21,462,130 | | | | 50,116,980 | | | | 47,602,769 | | | | 79,449,133 | |
Issued in merger | | | – | | | | – | | | | – | | | | – | | | | – | | | | 56,267,155 | | | | – | | | | – | |
Issued to shareholders in reinvestment of distributions | | | 4,270,537 | | | | 1,819,290 | | | | 5,312,641 | | | | 12,900,310 | | | | 6,666,022 | | | | 14,292,493 | | | | 9,085,089 | | | | 9,641,548 | |
Shares redeemed | | | (22,217,993 | ) | | | (4,588,971 | ) | | | (22,908,770 | ) | | | (86,564,617 | ) | | | (47,583,599 | ) | | | (33,640,135 | ) | | | (59,874,276 | ) | | | (43,419,292 | ) |
| | | | |
Net increase (decrease) from capital stock transactions | | | (11,375,838 | ) | | | 78,664,086 | | | | (16,817,745 | ) | | | (63,981,368 | ) | | | (19,455,447 | ) | | | 87,036,493 | | | | (3,186,418 | ) | | | 45,671,389 | |
| | | | |
Class R6 Shares | | | | | | | | | | | | | | | | | | | | | | | | | | | | | | | | |
Shares sold | | | | | | | | | | | | | | | | | | | 263,617 | | | | 799,964 | | | | 2,768,960 | | | | 683,855 | |
Issued to shareholders in reinvestment of distributions | | | | | | | | | | | | | | | | | | | 211,302 | | | | 929,869 | | | | 460,898 | | | | 549,126 | |
Shares redeemed | | | | | | | | | | | | | | | | | | | (925,286 | ) | | | (1,648,831 | ) | | | (1,752,570 | ) | | | (2,125,166 | ) |
| | | | | | | | | | | | | | | | | | | | |
Net increase (decrease) from capital stock transactions | | | | | | | | | | | | | | | | | | | (450,367 | ) | | | 81,002 | | | | 1,477,288 | | | | (892,185 | ) |
| | | | | | | | | | | | | | | | | | | | |
| Total net increase (decrease) from capital stock transactions | | | (11,375,838 | ) | | | 78,664,086 | | | | (12,162,289 | ) | | | (61,943,403 | ) | | | (22,069,610 | ) | | | 144,561,196 | | | | (2,163,180 | ) | | | 44,350,108 | |
| | | | |
| Total increase (decrease) in net assets | | | 5,009,389 | | | | 81,477,334 | | | | (12,036,924 | ) | | | (74,144,408 | ) | | | 28,513,977 | | | | 160,354,323 | | | | 38,012,368 | | | | 40,533,792 | |
| | | | |
| Net Assets at end of period | | $ | 107,411,281 | | | $ | 102,401,892 | | | $ | 91,027,054 | | | $ | 103,063,978 | | | $ | 307,152,504 | | | $ | 278,638,527 | | | $ | 344,426,344 | | | $ | 306,413,976 | |
| | | | |
Undistributed net investment income (loss) included in net assets | | $ | 62,455 | | | $ | 59,135 | | | $ | 1,463,821 | | | $ | 1,110,413 | | | $ | 871,513 | | | $ | 408,368 | | | $ | (718,953) | | | $ | (546,715) | |
| | | | |
| Capital Share transactions: | | | | | | | | | | | | | | | | | | | | | | | | | | | | | | | | |
Class A Shares | | | | | | | | | | | | | | | | | | | | | | | | | | | | | | | | |
Shares sold | | | | | | | | | | | 250,332 | | | | 218,277 | | | | 151,837 | | | | 131,336 | | | | 490,629 | | | | 442,695 | |
Issued in merger | | | | | | | | | | | – | | | | – | | | | – | | | | 3,491,053 | | | | – | | | | – | |
Issued to shareholders in reinvestment of distributions | | | | | | | | | | | 640,706 | | | | 503,981 | | | | 104,609 | | | | 16,561 | | | | 279,172 | | | | 386,207 | |
Shares redeemed | | | | | | | | | | | (532,884 | ) | | | (556,810 | ) | | | (351,074 | ) | | | (293,049 | ) | | | (746,644 | ) | | | (822,763 | ) |
| | | | | | | | | | | | |
Net increase (decrease) in shares outstanding | | | | | | | | | | | 358,154 | | | | 165,448 | | | | (94,628 | ) | | | 3,345,901 | | | | 23,157 | | | | 6,139 | |
| | | | | | | | | | | | |
Class B Shares | | | | | | | | | | | | | | | | | | | | | | | | | | | | | | | | |
Shares sold | | | | | | | | | | | 15,076 | | | | 24,057 | | | | | | | | | | | | 20,801 | | | | 37,317 | |
Issued to shareholders in reinvestment of distributions | | | | | | | | | | | 37,199 | | | | 32,068 | | | | | | | | | | | | 21,701 | | | | 33,544 | |
Shares redeemed | | | | | | | | | | | (70,166 | ) | | | (74,341 | ) | | | | | | | | | | | (117,205 | ) | | | (129,518 | ) |
| | | | | | | | | | | | | | | | | | | | | | |
Net decrease in shares outstanding | | | | | | | | | | | (17,891 | ) | | | (18,216 | ) | | | | | | | | | | | (74,703 | ) | | | (58,657 | ) |
| | | | | | | | | | | | | | | | | | | | | | |
Class Y Shares | | | | | | | | | | | | | | | | | | | | | | | | | | | | | | | | |
Shares sold | | | 271,355 | | | | 3,758,374 | | | | 49,341 | | | | 662,380 | | | | 1,024,325 | | | | 2,600,056 | | | | 5,165,354 | | | | 9,575,828 | |
Issued in merger | | | – | | | | – | | | | – | | | | – | | | | – | | | | 3,678,946 | | | | – | | | | – | |
Issued to shareholders in reinvestment of distributions | | | 179,528 | | | | 82,612 | | | | 375,717 | | | | 876,976 | | | | 336,668 | | | | 779,307 | | | | 1,025,405 | | | | 1,157,449 | |
Shares redeemed | | | (922,873 | ) | | | (205,000 | ) | | | (1,561,425 | ) | | | (5,867,684 | ) | | | (2,261,486 | ) | | | (1,738,632 | ) | | | (6,477,726 | ) | | | (5,118,248 | ) |
| | | | |
Net increase (decrease) in shares outstanding | | | (471,990 | ) | | | 3,635,986 | | | | (1,136,367 | ) | | | (4,328,328 | ) | | | (900,493 | ) | | | 5,319,677 | | | | (286,967 | ) | | | 5,615,029 | |
| | | | |
Class R6 Shares | | | | | | | | | | | | | | | | | | | | | | | | | | | | | | | | |
Shares sold | | | | | | | | | | | | | | | | | | | 12,368 | | | | 43,005 | | | | 312,199 | | | | 80,726 | |
Issued to shareholders in reinvestment of distributions | | | | | | | | | | | | | | | | | | | 10,624 | | | | 50,482 | | | | 51,211 | | | | 65,062 | |
Shares redeemed | | | | | | | | | | | | | | | | | | | (42,647 | ) | | | (86,385 | ) | | | (187,281 | ) | | | (246,165 | ) |
Net increase (decrease) in shares outstanding | | | | | | | | | | | | | | | | | | | (19,655 | ) | | | 7,102 | | | | 176,129 | | | | (100,377 | ) |
| | | | | | | | | | | | | | | | | | | | |
| See accompanying Notes to Financial Statements. |
| |
| |
| 45 |
Madison Funds | October 31, 2017
| |
| Statements of Changes in Net Assets |
| | | Small Cap Fund | | International Stock Fund |
| | | |
| | | Year Ended
October 31,
2017 | | Year Ended
October 31,
2016 | | Year Ended
October 31,
2017 | | Year Ended
October 31,
2016 |
| | | |
| Net Assets at beginning of period | | $ | 95,008,369 | | | $ | 87,600,246 | | | $ | 35,258,713 | | | $ | 38,329,644 | |
| | | | |
| | | | | | | | | | | | | | | | | |
| Increase (decrease) in net assets from operations: | | | | | | | | | | | | | | | | |
Net investment income | | | 973,206 | | | | 448,463 | | | | 276,930 | | | | 399,573 | |
Net realized gain (loss) | | | 6,083,798 | | | | 3,787,484 | | | | 142,593 | | | | (2,145,772 | ) |
Net change in unrealized appreciation (depreciation) | | | 11,214,813 | | | | (2,674,212 | ) | | | 4,706,201 | | | | (910,500 | ) |
| | | | |
Net increase (decrease) in net assets from operations | | | 18,271,817 | | | | 1,561,735 | | | | 5,125,724 | | | | (2,656,699 | ) |
| | | | |
| | | | | | | | | | | | | | | | | |
| Distributions to shareholders from: | | | | | | | | | | | | | | | | |
| | | | | | | | | | | | | | | | | |
Net investment income | | | | | | | | | | | | | | | | |
Class A | | | (5,020 | ) | | | (3,775 | ) | | | (216,849 | ) | | | (176,364 | ) |
Class B | | | – | | | | – | | | | (7,146 | ) | | | (3,888 | ) |
Class Y | | | (406,818 | ) | | | (237,790 | ) | | | (162,676 | ) | | | (171,460 | ) |
| | | | | | | | | | | | | | | | | |
Net realized gains | | | | | | | | | | | | | | | | |
Class A | | | (108,733 | ) | | | (121,988 | ) | | | – | | | | – | |
Class B | | | (14,931 | ) | | | (15,891 | ) | | | – | | | | – | |
Class Y | | | (3,034,721 | ) | | | (2,938,689 | ) | | | – | | | | – | |
| | | | |
Total distributions | | | (3,570,223 | ) | | | (3,318,133 | ) | | | (386,671 | ) | | | (351,712 | ) |
| | | | |
| | | | | | | | | | | | | | | | | |
| Capital Stock transactions: | | | | | | | | | | | | | | | | |
Class A Shares | | | | | | | | | | | | | | | | |
Shares sold | | | 805,432 | | | | 606,668 | | | | 1,603,663 | | | | 1,668,297 | |
Issued to shareholders in reinvestment of distributions | | | 113,635 | | | | 125,763 | | | | 216,005 | | | | 175,730 | |
Shares redeemed | | | (712,093 | ) | | | (901,778 | ) | | | (2,817,803 | ) | | | (2,835,303 | ) |
| | | | |
Net increase (decrease) from capital stock transactions | | | 206,974 | | | | (169,347 | ) | | | (998,135 | ) | | | (991,276 | ) |
| | | | |
Class B Shares | | | | | | | | | | | | | | | | |
Shares sold | | | 35,497 | | | | 40,701 | | | | 33,292 | | | | 103,012 | |
Issued to shareholders in reinvestment of distributions | | | 14,931 | | | | 15,891 | | | | 7,146 | | | | 3,888 | |
Shares redeemed | | | (83,289 | ) | | | (85,433 | ) | | | (310,878 | ) | | | (390,564 | ) |
| | | | |
Net decrease from capital stock transactions | | | (32,861 | ) | | | (28,841 | ) | | | (270,440 | ) | | | (283,664 | ) |
| | | | |
Class Y Shares | | | | | | | | | | | | | | | | |
Shares sold | | | 7,779,707 | | | | 17,647,916 | | | | 2,597,484 | | | | 7,199,981 | |
Issued to shareholders in reinvestment of distributions | | | 3,326,506 | | | | 3,057,380 | | | | 162,676 | | | | 171,460 | |
Shares redeemed | | | (26,047,362 | ) | | | (11,342,587 | ) | | | (9,676,656 | ) | | | (6,159,021 | ) |
| | | | |
Net increase (decrease) from capital stock transactions | | | (14,941,149 | ) | | | 9,362,709 | | | | (6,916,496 | ) | | | 1,212,420 | |
| | | | |
| Total net increase (decrease) from capital stock transactions | | | (14,767,036 | ) | | | 9,164,521 | | | | (8,185,071 | ) | | | (62,520 | ) |
| | | | |
| Total increase (decrease) in net assets | | | (65,442 | ) | | | 7,408,123 | | | | (3,446,018 | ) | | | (3,070,931 | ) |
| | | | |
| Net Assets at end of period | | $ | 94,942,927 | | | $ | 95,008,369 | | | $ | 31,812,695 | | | $ | 35,258,713 | |
| | | | |
Undistributed net investment income included in net assets | | $ | 825,114 | | | $ | 290,489 | | | $ | 263,021 | | | $ | 386,670 | |
| | | | |
| | | | | | | | | | | | | | | | | |
| Capital Share transactions: | | | | | | | | | | | | | | | | |
Class A Shares | | | | | | | | | | | | | | | | |
Shares sold | | | 48,928 | | | | 41,423 | | | | 125,080 | | | | 137,881 | |
Issued to shareholders in reinvestment of distributions | | | 6,764 | | | | 8,697 | | | | 18,398 | | | | 13,718 | |
Shares redeemed | | | (43,619 | ) | | | (62,006 | ) | | | (222,164 | ) | | | (230,240 | ) |
| | | | |
Net increase (decrease) in shares outstanding | | | 12,073 | | | | (11,886 | ) | | | (78,686 | ) | | | (78,641 | ) |
| | | | |
Class B Shares | | | | | | | | | | | | | | | | |
Shares sold | | | 2,205 | | | | 2,898 | | | | 2,726 | | | | 8,565 | |
Issued to shareholders in reinvestment of distributions | | | 944 | | | | 1,158 | | | | 621 | | | | 309 | |
Shares redeemed | | | (5,467 | ) | | | (6,194 | ) | | | (25,524 | ) | | | (32,528 | ) |
| | | | |
Net decrease in shares outstanding | | | (2,318 | ) | | | (2,138 | ) | | | (22,177 | ) | | | (23,654 | ) |
| | | | |
Class Y Shares | | | | | | | | | | | | | | | | |
Shares sold | | | 474,356 | | | | 1,241,455 | | | | 208,011 | | | | 573,993 | |
Issued to shareholders in reinvestment of distributions | | | 197,653 | | | | 211,145 | | | | 13,857 | | | | 13,385 | |
Shares redeemed | | | (1,597,072 | ) | | | (774,035 | ) | | | (780,058 | ) | | | (506,676 | ) |
| | | | |
Net increase (decrease) in shares outstanding | | | (925,063 | ) | | | 678,565 | | | | (558,190 | ) | | | 80,702 | |
| | | | |
| See accompanying Notes to Financial Statements. |
| |
| |
| 46 |
Madison Funds | October 31, 2017
| |
| Financial Highlights for a Share of Beneficial Interest Outstanding |
| | | CONSERVATIVE ALLOCATION FUND |
| | | |
| | | CLASS A | | | | CLASS B | | | | CLASS C |
| | | | | | | | | | | |
| | | Year Ended October 31, | | | | Year Ended October 31, | | | | Year Ended October 31, |
| | | | | | | | | | | |
| | | | 2017 | | | 2016 | | | 2015 | | | 2014 | | | 2013 | | | | | 2017 | | | 2016 | | | 2015 | | | 2014 | | | 2013 | | | | | 2017 | | | 2016 | | | 2015 | | | 2014 | | | 2013 | |
| | | | | | | | | | | | |
| Net Asset Value at beginning of period | | $ | 10.46 | | $ | 10.63 | | $ | 11.15 | | $ | 10.68 | | $ | 10.43 | | | | $ | 10.52 | | $ | 10.69 | | $ | 11.19 | | $ | 10.71 | | $ | 10.42 | | | | $ | 10.53 | | $ | 10.69 | | $ | 11.20 | | $ | 10.72 | | $ | 10.43 | |
| | | | | | | | | | | | | | | | | | | | | | | | | | | | | | | | | | | | | | | | | | | | | | | | | | | |
Income from Investment Operations: | | | | | | | | | | | | | | | | | | | | | | | | | | | | | | | | | | | | | | | | | | | | | | | | | | |
Net investment income1 | | | 0.15 | | | 0.14 | | | 0.13 | | | 0.15 | | | 0.22 | | | | | 0.08 | | | 0.07 | | | 0.06 | | | 0.06 | | | 0.15 | | | | | 0.08 | | | 0.06 | | | 0.05 | | | 0.06 | | | 0.16 | |
Net realized and unrealized gain (loss) on investments | | | 0.69 | | | 0.17 | | | – | | | 0.50 | | | 0.48 | | | | | 0.69 | | | 0.16 | | | (0.01 | ) | | 0.51 | | | 0.47 | | | | | 0.69 | | | 0.18 | | | (0.01 | ) | | 0.51 | | | 0.46 | |
| | | | | | | | | | | | |
Total from investment operations | | | 0.84 | | | 0.31 | | | 0.13 | | | 0.65 | | | 0.70 | | | | | 0.77 | | | 0.23 | | | 0.05 | | | 0.57 | | | 0.62 | | | | | 0.77 | | | 0.24 | | | 0.04 | | | 0.57 | | | 0.62 | |
| | | | | | | | | | | | | | | | | | | | | | | | | | | | | | | | | | | | | | | | | | | | | | | | | | | |
Less Distributions From: | | | | | | | | | | | | | | | | | | | | | | | | | | | | | | | | | | | | | | | | | | | | | | | | | | |
Net investment income | | | (0.18 | ) | | (0.16 | ) | | (0.17 | ) | | (0.14 | ) | | (0.45 | ) | | | | (0.09 | ) | | (0.08 | ) | | (0.07 | ) | | (0.05 | ) | | (0.33 | ) | | | | (0.09 | ) | | (0.08 | ) | | (0.07 | ) | | (0.05 | ) | | (0.33 | ) |
Capital gains | | | (0.15 | ) | | (0.32 | ) | | (0.48 | ) | | (0.04 | ) | | – | | | | | (0.15 | ) | | (0.32 | ) | | (0.48 | ) | | (0.04 | ) | | – | | | | | (0.15 | ) | | (0.32 | ) | | (0.48 | ) | | (0.04 | ) | | – | |
| | | | | | | | | | | | |
Total distributions | | | (0.33 | ) | | (0.48 | ) | | (0.65 | ) | | (0.18 | ) | | (0.45 | ) | | | | (0.24 | ) | | (0.40 | ) | | (0.55 | ) | | (0.09 | ) | | (0.33 | ) | | | | (0.24 | ) | | (0.40 | ) | | (0.55 | ) | | (0.09 | ) | | (0.33 | ) |
| Net increase (decrease) in net asset value | | | 0.51 | | | (0.17 | ) | | (0.52 | ) | | 0.47 | | | 0.25 | | | | | 0.53 | | | (0.17 | ) | | (0.50 | ) | | 0.48 | | | 0.29 | | | | | 0.53 | | | (0.16 | ) | | (0.51 | ) | | 0.48 | | | 0.29 | |
| Net Asset Value at end of period | | $ | 10.97 | | $ | 10.46 | | $ | 10.63 | | $ | 11.15 | | $ | 10.68 | | | | $ | 11.05 | | $ | 10.52 | | $ | 10.69 | | $ | 11.19 | | $ | 10.71 | | | | $ | 11.06 | | $ | 10.53 | | $ | 10.69 | | $ | 11.20 | | $ | 10.72 | |
| Total Return (%)2 | | | 8.25 | | | 3.10 | | | 1.17 | | | 6.13 | | | 6.90 | | | | | 7.47 | | | 2.27 | | | 0.44 | | | 5.41 | | | 6.05 | | | | | 7.46 | | | 2.37 | | | 0.34 | | | 5.41 | | | 6.05 | |
| Ratios/Supplemental Data: | | | | | | | | | | | | | | | | | | | | | | | | | | | | | | | | | | | | | | | | | | | | | | | | | | |
| Net Assets at end of period (in 000’s) | | $ | 45,005 | | $ | 43,752 | | $ | 46,039 | | $ | 44,438 | | $ | 42,353 | | | | $ | 8,119 | | $ | 9,175 | | $ | 10,064 | | $ | 11,393 | | $ | 11,569 | | | | $ | 20,960 | | $ | 20,225 | | $ | 19,694 | | $ | 18,948 | | $ | 16,787 | |
| Ratios of expenses to average net assets (%) | | | 0.70 | | | 0.71 | | | 0.70 | | | 0.70 | | | 0.70 | | | | | 1.45 | | | 1.46 | | | 1.45 | | | 1.45 | | | 1.45 | | | | | 1.45 | | | 1.46 | | | 1.45 | | | 1.45 | | | 1.45 | |
| Ratio of net investment income to average net assets (%) | | | 1.46 | | | 1.36 | | | 1.23 | | | 1.35 | | | 2.09 | | | | | 0.74 | | | 0.60 | | | 0.59 | | | 0.59 | | | 1.29 | | | | | 0.71 | | | 0.54 | | | 0.49 | | | 0.57 | | | 1.22 | |
| Portfolio turnover (%)3 | | | 48 | | | 82 | | | 83 | | | 96 | | | 69 | | | | | 48 | | | 82 | | | 83 | | | 96 | | | 69 | | | | | 48 | | | 82 | | | 83 | | | 96 | | | 69 | |
| | | |
| | | |
| | | |
| | | MODERATE ALLOCATION FUND |
| | | |
| | | CLASS A | | | | CLASS B | | | | CLASS C |
| | | | | | | | | | | |
| | | Year Ended October 31, | | | | Year Ended October 31, | | | | Year Ended October 31, |
| | | | | | | | | | | |
| | | | 2017 | | | 2016 | | | 2015 | | | 2014 | | | 2013 | | | | | 2017 | | | 2016 | | | 2015 | | | 2014 | | | 2013 | | | | | 2017 | | | 2016 | | | 2015 | | | 2014 | | | 2013 | |
| | | | | | | | | | | | |
| Net Asset Value at beginning of period | | $ | 11.18 | | $ | 11.62 | | $ | 12.27 | | $ | 11.50 | | $ | 10.35 | | | | $ | 11.05 | | $ | 11.52 | | $ | 12.19 | | $ | 11.43 | | $ | 10.29 | | | | $ | 11.06 | | $ | 11.53 | | $ | 12.20 | | $ | 11.44 | | $ | 10.30 | |
| | | | | | | | | | | | | | | | | | | | | | | | | | | | | | | | | | | | | | | | | | | | | | | | | | | |
Income from Investment Operations: | | | | | | | | | | | | | | | | | | | | | | | | | | | | | | | | | | | | | | | | | | | | | | | | | | |
Net investment income1 | | | 0.14 | | | 0.13 | | | 0.13 | | | 0.12 | | | 0.17 | | | | | 0.07 | | | 0.06 | | | 0.05 | | | 0.04 | | | 0.09 | | | | | 0.06 | | | 0.05 | | | 0.02 | | | 0.03 | | | 0.10 | |
Net realized and unrealized gain on investments | | | 1.35 | | | 0.18 | | | 0.04 | | | 0.80 | | | 1.23 | | | | | 1.33 | | | 0.16 | | | 0.04 | | | 0.78 | | | 1.23 | | | | | 1.34 | | | 0.17 | | | 0.07 | | | 0.79 | | | 1.22 | |
| | | | | | | | | | | | |
Total from investment operations | | | 1.49 | | | 0.31 | | | 0.17 | | | 0.92 | | | 1.40 | | | | | 1.40 | | | 0.22 | | | 0.09 | | | 0.82 | | | 1.32 | | | | | 1.40 | | | 0.22 | | | 0.09 | | | 0.82 | | | 1.32 | |
| | | | | | | | | | | | | | | | | | | | | | | | | | | | | | | | | | | | | | | | | | | | | | | | | | | |
| Less Distributions From: | | | | | | | | | | | | | | | | | | | | | | | | | | | | | | | | | | | | | | | | | | | | | | | | | | |
Net investment income | | | (0.15 | ) | | (0.12 | ) | | (0.17 | ) | | (0.15 | ) | | (0.25 | ) | | | | (0.07 | ) | | (0.06 | ) | | (0.11 | ) | | (0.06 | ) | | (0.18 | ) | | | | (0.07 | ) | | (0.06 | ) | | (0.11 | ) | | (0.06 | ) | | (0.18 | ) |
Capital gains | | | (0.32 | ) | | (0.63 | ) | | (0.65 | ) | | – | | | – | | | | | (0.32 | ) | | (0.63 | ) | | (0.65 | ) | | – | | | – | | | | | (0.32 | ) | | (0.63 | ) | | (0.65 | ) | | – | | | – | |
| | | | | | | | | | | | |
Total distributions | | | (0.47 | ) | | (0.75 | ) | | (0.82 | ) | | (0.15 | ) | | (0.25 | ) | | | | (0.39 | ) | | (0.69 | ) | | (0.76 | ) | | (0.06 | ) | | (0.18 | ) | | | | (0.39 | ) | | (0.69 | ) | | (0.76 | ) | | (0.06 | ) | | (0.18 | ) |
| Net increase (decrease) in net asset value | | | 1.02 | | | (0.44 | ) | | (0.65 | ) | | 0.77 | | | 1.15 | | | | | 1.01 | | | (0.47 | ) | | (0.67 | ) | | 0.76 | | | 1.14 | | | | | 1.01 | | | (0.47 | ) | | (0.67 | ) | | 0.76 | | | 1.14 | |
| Net Asset Value at end of period | | $ | 12.20 | | $ | 11.18 | | $ | 11.62 | | $ | 12.27 | | $ | 11.50 | | | | $ | 12.06 | | $ | 11.05 | | $ | 11.52 | | $ | 12.19 | | $ | 11.43 | | | | $ | 12.07 | | $ | 11.06 | | $ | 11.53 | | $ | 12.20 | | $ | 11.44 | |
| Total Return (%)2 | | | 13.88 | | | 2.95 | | | 1.44 | | | 8.03 | | | 13.87 | | | | | 13.07 | | | 2.15 | | | 0.72 | | | 7.18 | | | 12.98 | | | | | 13.06 | | | 2.15 | | | 0.72 | | | 7.17 | | | 12.97 | |
| Ratios/Supplemental Data: | | | | | | | | | | | | | | | | | | | | | | | | | | | | | | | | | | | | | | | | | | | | | | | | | | |
| Net Assets at end of period (in 000’s) | | $ | 115,586 | | $ | 104,276 | | $ | 107,043 | | $ | 109,148 | | $ | 104,849 | | | | $ | 23,101 | | $ | 25,440 | | $ | 29,451 | | $ | 33,235 | | $ | 33,070 | | | | $ | 9,625 | | $ | 9,100 | | $ | 9,506 | | $ | 8,238 | | $ | 7,347 | |
| Ratios of expenses to average net assets (%) | | | 0.70 | | | 0.71 | | | 0.70 | | | 0.70 | | | 0.70 | | | | | 1.45 | | | 1.46 | | | 1.45 | | | 1.45 | | | 1.45 | | | | | 1.45 | | | 1.46 | | | 1.45 | | | 1.45 | | | 1.45 | |
| Ratio of net investment income to average net assets (%) | | | 1.23 | | | 1.13 | | | 1.02 | | | 1.00 | | | 1.55 | | | | | 0.56 | | | 0.58 | | | 0.41 | | | 0.27 | | | 0.82 | | | | | 0.52 | | | 0.47 | | | 0.01 | | | 0.21 | | | 0.82 | |
| Portfolio turnover (%)3 | | | 50 | | | 97 | | | 81 | | | 89 | | | 69 | | | | | 50 | | | 97 | | | 81 | | | 89 | | | 69 | | | | | 50 | | | 97 | | | 81 | | | 89 | | | 69 | |
| 1 | Net investment income (loss) calculated excluding permanent tax adjustments to undistributed net investment income. |
| 2 | Total return without applicable sales charge. |
| 3 | Portfolio turnover is calculated at the fund level and represents the entire fiscal year or period. |
| See accompanying Notes to Financial Statements. |
| |
| |
| 47 |
Madison Funds | October 31, 2017
| |
| Financial Highlights for a Share of Beneficial Interest Outstanding |
| | | | AGGRESSIVE ALLOCATION FUND |
| | | | |
| | | | CLASS A | | CLASS B | | CLASS C |
| | | | | | | | |
| | | | Year Ended October 31, | | Year Ended October 31, | | Year Ended October 31, |
| | | | | | | | |
| | | | 2017 | | 2016 | | 2015 | | 2014 | | 2013 | | | 2017 | | 2016 | | 2015 | | 2014 | | 2013 | | | 2017 | | 2016 | | 2015 | | 2014 | | 2013 | |
| | | | | | | | | | | | | | | | | | | | | | | | | | | | | | | | | | | |
| Net Asset Value at beginning of period | | | $ | 11.12 | | $ | 11.87 | | $ | 12.81 | | $ | 11.72 | | $ | 10.01 | | | $ | 10.83 | | $ | 11.65 | | $ | 12.61 | | $ | 11.59 | | $ | 9.89 | | | $ | 10.84 | | $ | 11.66 | | $ | 12.62 | | $ | 11.60 | | $ | 9.90 | |
Income from Investment Operations: | | | | | | | | | | | | | | | | | | | | | | | | | | | | | | | | | | | | | | | | | | | | | | | | | |
Net investment income (loss)1 | | | | 0.13 | | | 0.12 | | | 0.11 | | | 0.09 | | | 0.12 | | | | 0.02 | | | 0.06 | | | 0.03 | | | 0.00 | 4 | | 0.04 | | | | 0.02 | | | 0.05 | | | 0.02 | | | (0.01 | ) | | 0.05 | |
Net realized and unrealized gain on investments | | | | 1.88 | | | 0.15 | | | 0.10 | | | 1.04 | | | 1.80 | | | | 1.85 | | | 0.12 | | | 0.09 | | | 1.02 | | | 1.80 | | | | 1.85 | | | 0.13 | | | 0.10 | | | 1.03 | | | 1.79 | |
| | | | | | | | | | | | | | | | | | | | | | | | | | | | | | | | | | | |
Total from investment operations | | | | 2.01 | | | 0.27 | | | 0.21 | | | 1.13 | | | 1.92 | | | | 1.87 | | | 0.18 | | | 0.12 | | | 1.02 | | | 1.84 | | | | 1.87 | | | 0.18 | | | 0.12 | | | 1.02 | | | 1.84 | |
Less Distributions From: | | | | | | | | | | | | | | | | | | | | | | | | | | | | | | | | | | | | | | | | | | | | | | | | | |
Net investment income | | | | (0.13 | ) | | (0.10 | ) | | (0.20 | ) | | (0.04 | ) | | (0.21 | ) | | | (0.06 | ) | | (0.08 | ) | | (0.13 | ) | | – | | | (0.14 | ) | | | (0.06 | ) | | (0.08 | ) | | (0.13 | ) | | – | | | (0.14 | ) |
Capital gains | | | | (0.29 | ) | | (0.92 | ) | | (0.95 | ) | | – | | | – | | | | (0.29 | ) | | (0.92 | ) | | (0.95 | ) | | – | | | – | | | | (0.29 | ) | | (0.92 | ) | | (0.95 | ) | | – | | | – | |
| | | | | | | | | | | | | | | | | | | | | | | | | | | | | | | | | | | |
Total distributions | | | | (0.42 | ) | | (1.02 | ) | | (1.15 | ) | | (0.04 | ) | | (0.21 | ) | | | (0.35 | ) | | (1.00 | ) | | (1.08 | ) | | – | | | (0.14 | ) | | | (0.35 | ) | | (1.00 | ) | | (1.08 | ) | | – | | | (0.14 | ) |
Net increase (decrease) in net asset value | | | | 1.59 | | | (0.75 | ) | | (0.94 | ) | | 1.09 | | | 1.71 | | | | 1.52 | | | (0.82 | ) | | (0.96 | ) | | 1.02 | | | 1.70 | | | | 1.52 | | | (0.82 | ) | | (0.96 | ) | | 1.02 | | | 1.70 | |
Net Asset Value at end of period | | | $ | 12.71 | | $ | 11.12 | | $ | 11.87 | | $ | 12.81 | | $ | 11.72 | | | $ | 12.35 | | $ | 10.83 | | $ | 11.65 | | $ | 12.61 | | $ | 11.59 | | | $ | 12.36 | | $ | 10.84 | | $ | 11.66 | | $ | 12.62 | | $ | 11.60 | |
| Total Return (%)2 | | | | 18.66 | | | 2.65 | | | 1.66 | | | 9.67 | | | 19.56 | | | | 17.83 | | | 1.88 | | | 0.91 | | | 8.80 | | | 18.79 | | | | 17.81 | | | 1.87 | | | 0.91 | | | 8.79 | | | 18.78 | |
Ratios/Supplemental Data: | | | | | | | | | | | | | | | | | | | | | | | | | | | | | | | | | | | | | | | | | | | | | | | | | |
Net Assets at end of period (in 000’s) | | | $ | 52,811 | | $ | 45,317 | | $ | 46,834 | | $ | 45,697 | | $ | 41,526 | | | $ | 10,442 | | $ | 11,089 | | $ | 12,383 | | $ | 13,063 | | $ | 12,365 | | | $ | 2,300 | | $ | 2,411 | | $ | 2,600 | | $ | 2,547 | | $ | 2,116 | |
Ratios of expenses to average net assets (%) | | | | 0.70 | | | 0.71 | | | 0.70 | | | 0.70 | | | 0.70 | | | | 1.45 | | | 1.46 | | | 1.45 | | | 1.45 | | | 1.45 | | | | 1.45 | | | 1.46 | | | 1.45 | | | 1.45 | | | 1.45 | |
Ratio of net investment income (loss) to average net assets (%) | | | | 1.02 | | | 1.04 | | | 0.81 | | | 0.73 | | | 1.02 | | | | 0.35 | | | 0.56 | | | 0.21 | | | (0.01 | ) | | 0.34 | | | | 0.45 | | | 0.42 | | | 0.05 | | | (0.09 | ) | | 0.10 | |
| Portfolio turnover (%)3 | | | | 45 | | | 98 | | | 72 | | | 78 | | | 67 | | | | 45 | | | 98 | | | 72 | | | 78 | | | 67 | | | | 45 | | | 98 | | | 72 | | | 78 | | | 67 | |
| | | GOVERNMENT MONEY MARKET FUND* | |
| | | | |
| | | CLASS A | | | CLASS B | |
| | | | | | | |
| | | Year Ended October 31, | | | Year Ended October 31, | |
| | | | | | | |
| | | | 2017 | | | | 2016 | | | | 2015 | | | | 2014 | | | | 2013 | | | | 2017 | | | | 2016 | | | | 2015 | | | | 2014 | | | | 2013 | | |
| | | | | | | | | | | | | | | | | | | | | | | | | | | | | | | | | | | | | | | | | | |
| Net Asset Value at beginning of period | | | $1.00 | | | | $1.00 | | | | $1.00 | | | | $1.00 | | | | $1.00 | | | | $1.00 | | | | $1.00 | | | | $1.00 | | | | $1.00 | | | | $1.00 | | |
Income from Investment Operations: | | | | | | | | | | | | | | | | | | | | | | | | | | | | | | | | | | | | | | | | | |
Net investment income1 | | | 0.00 | 4 | | | 0.00 | 4 | | | 0.00 | 4 | | | 0.00 | 4 | | | 0.00 | 4 | | | 0.00 | 4 | | | 0.00 | 4 | | | 0.00 | 4 | | | 0.00 | 4 | | | 0.00 | 4 | |
| | | | | | | | | | | | | | | | | | | | | | | | | | | | | | | | | | | | | | | | | | |
Total from investment operations | | | 0.00 | 4 | | | 0.00 | 4 | | | 0.00 | 4 | | | 0.00 | 4 | | | 0.00 | 4 | | | 0.00 | 4 | | | 0.00 | 4 | | | 0.00 | 4 | | | 0.00 | 4 | | | 0.00 | 4 | |
| Net increase in net asset value | | | 0.00 | 4 | | | 0.00 | 4 | | | 0.00 | 4 | | | 0.00 | 4 | | | 0.00 | 4 | | | 0.00 | 4 | | | 0.00 | 4 | | | 0.00 | 4 | | | 0.00 | 4 | | | 0.00 | 4 | |
| Net Asset Value at end of period | | | $1.00 | | | | $1.00 | | | | $1.00 | | | | $1.00 | | | | $1.00 | | | | $1.00 | | | | $1.00 | | | | $1.00 | | | | $1.00 | | | | $1.00 | | |
| Total Return (%)2 | | | 0.21 | | | | 0.00 | | | | 0.00 | | | | 0.00 | | | | 0.00 | | | | 0.01 | | | | 0.00 | | | | 0.00 | | | | 0.00 | | | | 0.00 | | |
| Ratios/Supplemental Data: | | | | | | | | | | | | | | | | | | | | | | | | | | | | | | | | | | | | | | | | | |
| Net Assets at end of period (in 000’s) | | | $14,972 | | | | $18,295 | | | | $19,076 | | | | $20,570 | | | | $24,552 | | | | $215 | | | | $599 | | | | $234 | | | | $461 | | | | $524 | | |
| Ratios of expenses to average net assets: | | | | | | | | | | | | | | | | | | | | | | | | | | | | | | | | | | | | | | | | | |
Before reimbursement of expenses by Adviser (%) | | | 0.55 | | | | 0.56 | | | | 0.55 | | | | 0.55 | | | | 0.55 | | | | 1.30 | | | | 1.30 | | | | 1.30 | | | | 1.30 | | | | 1.30 | | |
After reimbursement of expenses by Adviser (%) | | | 0.51 | 5 | | | 0.28 | 5 | | | 0.07 | 5 | | | 0.07 | 5 | | | 0.09 | 5 | | | 0.62 | 5 | | | 0.28 | 5 | | | 0.08 | 5 | | | 0.07 | 5 | | | 0.10 | 5 | |
Ratio of net investment income (loss) to average net assets | | | | | | | | | | | | | | | | | | | | | | | | | | | | | | | | | | | | | | | | | |
After reimbursement and waiver of expenses by Adviser (%) | | | 0.20 | 5 | | | 0.00 | 5 | | | 0.00 | 5 | | | 0.00 | 5 | | | (0.00 | )5 | | | 0.01 | 5 | | | 0.00 | 5 | | | 0.00 | 5 | | | 0.00 | 5 | | | 0.00 | 5 | |
| * | Prior to close of business on February 29, 2016, the Fund was known as the Cash Reserves Fund. |
| 1 | Net investment income (loss) calculated excluding permanent tax adjustments to undistributed net investment income. |
| 2 | Total return without applicable sales charge. |
| 3 | Portfolio turnover is calculated at the fund level and represents the entire fiscal year or period. |
| 4 | Amounts represent less than $0.005 per share. |
| 5 | Ratio is net of fees waived by the adviser and distributor (See Note 3). |
| See accompanying Notes to Financial Statements. |
| |
| |
| 48 |
Madison Funds | October 31, 2017
| |
| Financial Highlights for a Share of Beneficial Interest Outstanding |
| | | TAX-FREE VIRGINIA FUND* | | TAX-FREE NATIONAL FUND* |
| | | | | |
| | | CLASS Y | | CLASS Y |
| | | | | |
| | | Period Ended October 31, | | Year Ended
September 30, | | Period Ended October 31, | | Year Ended
September 30, |
| | | | | | | | | |
| | | | 2017 | | | | 2016 | | | | 2015 | | | | 2014 | | | | 20136 | | | | 2013 | | | | 2017 | | | | 2016 | | | | 2015 | | | | 2014 | | | | 20136 | | | | 2013 | |
| | | | | | | | | | | | | | | | | | | | | | | | | | | | | | | | | | | | | | | | | | | | | | | | | |
| Net Asset Value at beginning of period | | | $11.67 | | | | $11.61 | | | | $11.70 | | | | $11.54 | | | | $11.50 | | | | $12.24 | | | | $11.10 | | | | $11.01 | | | | $11.08 | | | | $10.73 | | | | $10.70 | | | | $11.44 | |
Income from Investment Operations: | | | | | | | | | | | | | | | | | | | | | | | | | | | | | | | | | | | | | | | | | | | | | | | | |
Net investment income1 | | | 0.24 | | | | 0.25 | | | | 0.28 | | | | 0.30 | | | | 0.03 | | | | 0.32 | | | | 0.25 | | | | 0.26 | | | | 0.27 | | | | 0.29 | | | | 0.03 | | | | 0.32 | |
Net realized and unrealized gain (loss) on investments | | | (0.16 | ) | | | 0.10 | | | | (0.01 | ) | | | 0.35 | | | | 0.04 | | | | (0.65 | ) | | | (0.18 | ) | | | 0.15 | | | | 0.01 | | | | 0.40 | | | | 0.03 | | | | (0.66 | ) |
| | | | | | | | | | | | | | | | | | | | | | | | | | | | | | | | | | | | | | | | | | | | | | | | | |
Total from investment operations | | | 0.08 | | | | 0.35 | | | | 0.27 | | | | 0.65 | | | | 0.07 | | | | (0.33 | ) | | | 0.07 | | | | 0.41 | | | | 0.28 | | | | 0.69 | | | | 0.06 | | | | (0.34 | ) |
| Less Distributions From: | | | | | | | | | | | | | | | | | | | | | | | | | | | | | | | | | | | | | | | | | | | | | | | | |
Net investment income | | | (0.24 | ) | | | (0.25 | ) | | | (0.28 | ) | | | (0.30 | ) | | | (0.03 | ) | | | (0.32 | ) | | | (0.25 | ) | | | (0.26 | ) | | | (0.27 | ) | | | (0.29 | ) | | | (0.03 | ) | | | (0.32 | ) |
Capital gains | | | (0.02 | ) | | | (0.04 | ) | | | (0.08 | ) | | | (0.19 | ) | | | – | | | | (0.09 | ) | | | (0.07 | ) | | | (0.06 | ) | | | (0.08 | ) | | | (0.05 | ) | | | – | | | | (0.08 | ) |
| | | | | | | | | | | | | | | | | | | | | | | | | | | | | | | | | | | | | | | | | | | | | | | | | |
Total distributions | | | (0.26 | ) | | | (0.29 | ) | | | (0.36 | ) | | | (0.49 | ) | | | (0.03 | ) | | | (0.41 | ) | | | (0.32 | ) | | | (0.32 | ) | | | (0.35 | ) | | | (0.34 | ) | | | (0.03 | ) | | | (0.40 | ) |
| Net increase (decrease) in net asset value | | | (0.18 | ) | | | 0.06 | | | | (0.09 | ) | | | 0.16 | | | | 0.04 | | | | (0.74 | ) | | | (0.25 | ) | | | 0.09 | | | | (0.07 | ) | | | 0.35 | | | | 0.03 | | | | (0.74 | ) |
| Net Asset Value at end of period | | | $11.49 | | | | $11.67 | | | | $11.61 | | | | $11.70 | | | | $11.54 | | | | $11.50 | | | | $10.85 | | | | $11.10 | | | | $11.01 | | | | $11.08 | | | | $10.73 | | | | $10.70 | |
| Total Return (%)2 | | | 0.68 | | | | 3.01 | | | | 2.36 | | | | 5.82 | | | | 0.57 | 4 | | | (2.77 | ) | | | 0.72 | | | | 3.75 | | | | 2.61 | | | | 6.52 | | | | 0.52 | 4 | | | (3.03 | ) |
| Ratios/Supplemental Data: | | | | | | | | | | | | | | | | | | | | | | | | | | | | | | | | | | | | | | | | | | | | | | | | |
| Net Assets at end of period (in 000’s) | | | $21,866 | | | | $22,350 | | | | $22,659 | | | | $23,100 | | | | $23,408 | | | | $23,215 | | | | $25,294 | | | | $27,333 | | | | $27,744 | | | | $28,415 | | | | $27,805 | | | | $28,328 | |
| Ratios of expenses to average net assets: (%) | | | 0.85 | | | | 0.86 | | | | 0.85 | | | | 0.85 | | | | 0.85 | 5 | | | 0.85 | | | | 0.75 | | | | 0.79 | | | | 0.85 | | | | 0.85 | | | | 0.85 | 5 | | | 0.85 | |
| Ratio of net investment income to average net assets (%) | | | 2.06 | | | | 2.12 | | | | 2.45 | | | | 2.63 | | | | 2.58 | 5 | | | 2.71 | | | | 2.30 | | | | 2.27 | | | | 2.44 | | | | 2.65 | | | | 2.79 | 5 | | | 2.92 | |
| Portfolio turnover (%)3 | | | 8 | | | | 12 | | | | 12 | | | | 16 | | | | – | 4 | | | 14 | | | | 6 | | | | 9 | | | | 15 | | | | 30 | | | | 6 | 4 | | | 24 | |
| | | HIGH QUALITY BOND FUND* | |
| | | | |
| | | CLASS Y | |
| | | | |
| | | Period Ended October 31, | | Year Ended
December 31, | |
| | | | | | |
| | | | 2017 | | | | 2016 | | | | 2015 | | | | 2014 | | | | 2013 | 7 | | | 2012 | | |
| | | | | | | | | | | | | | | | | | | | | | | | | | |
| Net Asset Value at beginning of period | | | $11.06 | | | | $11.04 | | | | $11.04 | | | | $11.07 | | | | $11.21 | | | | $11.15 | | |
Income from Investment Operations: | | | | | | | | | | | | | | | | | | | | | | | | | |
Net investment income1 | | | 0.14 | | | | 0.12 | | | | 0.11 | | | | 0.11 | | | | 0.09 | | | | 0.13 | | |
Net realized and unrealized gain (loss) on investments | | | (0.12 | ) | | | 0.06 | | | | 0.01 | | | | 0.01 | | | | (0.13 | ) | | | 0.10 | | |
| | | | | | | | | | | | | | | | | | | | | | | | | | |
Total from investment operations | | | 0.02 | | | | 0.18 | | | | 0.12 | | | | 0.12 | | | | (0.04 | ) | | | 0.23 | | |
Less Distributions From: | | | | | | | | | | | | | | | | | | | | | | | | | |
Net investment income | | | (0.14 | ) | | | (0.12 | ) | | | (0.11 | ) | | | (0.11 | ) | | | (0.08 | ) | | | (0.13 | ) | |
Capital gains | | | (0.01 | ) | | | (0.04 | ) | | | (0.01 | ) | | | (0.04 | ) | | | (0.02 | ) | | | (0.04 | ) | |
| | | | | | | | | | | | | | | | | | | | | | | | | | |
Total distributions | | | (0.15 | ) | | | (0.16 | ) | | | (0.12 | ) | | | (0.15 | ) | | | (0.10 | ) | | | (0.17 | ) | |
| Net increase (decrease) in net asset value | | | (0.13 | ) | | | 0.02 | | | | – | | | | (0.03 | ) | | | (0.14 | ) | | | 0.06 | | |
| Net Asset Value at end of period | | | $10.93 | | | | $11.06 | | | | $11.04 | | | | $11.04 | | | | $11.07 | | | | $11.21 | | |
| Total Return (%)2 | | | 0.25 | | | | 1.62 | | | | 1.11 | | | | 1.12 | | | | (0.35 | )4 | | | 2.04 | | |
| Ratios/Supplemental Data: | | | | | | | | | | | | | | | | | | | | | | | | | |
| Net Assets at end of period (in 000’s) | | | $100,536 | | | | $105,807 | | | | $102,552 | | | | $118,082 | | | | $132,688 | | | | $109,694 | | |
| Ratios of expenses to average net assets: | | | | | | | | | | | | | | | | | | | | | | | | | |
Before reimbursement of expenses by Adviser (%) | | | 0.49 | | | | 0.50 | | | | 0.49 | | | | 0.49 | | | | 0.49 | 5 | | | 0.49 | | |
After reimbursement of expenses by Adviser (%) | | | 0.49 | | | | 0.50 | | | | 0.49 | | | | 0.49 | | | | 0.49 | 5 | | | – | | |
| Ratio of net investment income to average net assets | | | | | | | | | | | | | | | | | | | | | | | | | |
After reimbursement of expenses by Adviser (%) | | | 1.32 | | | | 1.10 | | | | 1.00 | | | | 1.00 | | | | 0.99 | 5 | | | 1.15 | | |
| Portfolio turnover (%)3 | | | 26 | | | | 25 | | | | 35 | | | | 20 | | | | 30 | 4 | | | 29 | | |
| * | The Financial Statements presented herein include the historical operating results of the Madison Mosaic Funds through April 19, 2013. Effective after market close on this date, the Madison Mosaic Funds reorganized into the Madison Funds. |
| 1 | Net investment income (loss) calculated excluding permanent tax adjustments to undistributed net investment income. |
| 2 | Total return without applicable sales charge. |
| 3 | Portfolio turnover is calculated at the fund level and represents the entire fiscal year or period. |
| 4 | Not annualized. |
| 5 | Annualized. |
| 6 | Effective at the close of business on April 19, 2013, the fiscal year end of the fund changed to October 31. Disclosure represents 1 month of information. |
| 7 | Effective at the close of business on April 19, 2013, the fiscal year end of the fund changed to October 31. Disclosure represents 10 months of information. |
| See accompanying Notes to Financial Statements. |
| |
| |
| 49 |
Madison Funds | October 31, 2017
| |
| Financial Highlights for a Share of Beneficial Interest Outstanding |
| | | | CORE BOND FUND |
| | | | |
| | | | CLASS A | | CLASS B | | | CLASS Y |
| | | | | | | | | |
| | | | Year Ended October 31, | | Year Ended October 31, | | | Year Ended October 31, |
| | | | | | | | | |
| | | | 2017 | | | 2016 | | | 2015 | | | 2014 | | | 2013 | | | | 2017 | | | 2016 | | | 2015 | | | 2014 | | | 2013 | | | | 2017 | | | 2016 | | | 2015 | | | 2014 | | | 2013 | |
| | | | | | | | | | | | | | | | | | | | | | | | | | | | | | | | | | | | | | | | | | | | | | | | | |
Net Asset Value at beginning of period | | | $10.20 | | | $10.09 | | | $10.25 | | | $10.21 | | | $10.66 | | | | $10.21 | | | $10.10 | | | $10.25 | | | $10.22 | | | $10.67 | | | | $10.17 | | | $10.07 | | | $10.22 | | | $10.19 | | | $10.64 | |
Income from Investment Operations: | | | | | | | | | | | | | | | | | | | | | | | | | | | | | | | | | | | | | | | | | | | | | | | | |
Net investment income1 | | | 0.20 | | | 0.20 | | | 0.19 | | | 0.22 | | | 0.26 | | | | 0.14 | | | 0.13 | | | 0.11 | | | 0.14 | | | 0.18 | | | | 0.23 | | | 0.23 | | | 0.21 | | | 0.23 | | | 0.28 | |
Net realized and unrealized gain (loss) on investments | | | (0.10 | ) | | 0.21 | | | (0.05 | ) | | 0.09 | | | (0.46 | ) | | | (0.12 | ) | | 0.21 | | | (0.04 | ) | | 0.08 | | | (0.46 | ) | | | (0.11 | ) | | 0.20 | | | (0.04 | ) | | 0.09 | | | (0.45 | ) |
| | | | | | | | | | | | | | | | | | | | | | | | | | | | | | | | | | | | | | | | | | | | | | | | | |
Total from investment operations | | | 0.10 | | | 0.41 | | | 0.14 | | | 0.31 | | | (0.20 | ) | | | 0.02 | | | 0.34 | | | 0.07 | | | 0.22 | | | (0.28 | ) | | | 0.12 | | | 0.43 | | | 0.17 | | | 0.32 | | | (0.17 | ) |
Less Distributions From: | | | | | | | | | | | | | | | | | | | | | | | | | | | | | | | | | | | | | | | | | | | | | | | | |
Net investment income | | | (0.22 | ) | | (0.22 | ) | | (0.21 | ) | | (0.22 | ) | | (0.25 | ) | | | (0.15 | ) | | (0.15 | ) | | (0.13 | ) | | (0.14 | ) | | (0.17 | ) | | | (0.25 | ) | | (0.25 | ) | | (0.23 | ) | | (0.24 | ) | | (0.28 | ) |
Capital gains | | | (0.05 | ) | | (0.08 | ) | | (0.09 | ) | | (0.05 | ) | | – | | | | (0.05 | ) | | (0.08 | ) | | (0.09 | ) | | (0.05 | ) | | – | | | | (0.05 | ) | | (0.08 | ) | | (0.09 | ) | | (0.05 | ) | | – | |
| | | | | | | | | | | | | | | | | | | | | | | | | | | | | | | | | | | | | | | | | | | | | | | | | |
Total distributions | | | (0.27 | ) | | (0.30 | ) | | (0.30 | ) | | (0.27 | ) | | (0.25 | ) | | | (0.20 | ) | | (0.23 | ) | | (0.22 | ) | | (0.19 | ) | | (0.17 | ) | | | (0.30 | ) | | (0.33 | ) | | (0.32 | ) | | (0.29 | ) | | (0.28 | ) |
Net increase (decrease) in net asset value | | | (0.17 | ) | | 0.11 | | | (0.16 | ) | | 0.04 | | | (0.45 | ) | | | (0.18 | ) | | 0.11 | | | (0.15 | ) | | 0.03 | | | (0.45 | ) | | | (0.18 | ) | | 0.10 | | | (0.15 | ) | | 0.03 | | | (0.45 | ) |
Net Asset Value at end of period | | | $10.03 | | | $10.20 | | | $10.09 | | | $10.25 | | | $10.21 | | | | $10.03 | | | $10.21 | | | $10.10 | | | $10.25 | | | $10.22 | | | | $9.99 | | | $10.17 | | | $10.07 | | | $10.22 | | | $10.19 | |
| Total Return (%)2 | | | 1.05 | | | 4.21 | | | 1.34 | | | 3.04 | | | (1.92 | ) | | | 0.20 | | | 3.43 | | | 0.69 | | | 2.18 | | | (2.65 | ) | | | 1.22 | | | 4.40 | | | 1.71 | | | 3.23 | | | (1.65 | ) |
Ratios/Supplemental Data: | | | | | | | | | | | | | | | | | | | | | | | | | | | | | | | | | | | | | | | | | | | | | | | | |
Net Assets at end of period (in 000’s) | | | $33,738 | | | $34,325 | | | $32,823 | | | $33,973 | | | $40,104 | | | | $2,004 | | | $2,575 | | | $2,929 | | | $3,445 | | | $4,433 | | | | $170,169 | | | $178,046 | | | $186,414 | | | $187,790 | | | $109,247 | |
Ratios of expenses to average net assets (%) | | | 0.90 | | | 0.91 | | | 0.90 | | | 0.90 | | | 0.90 | | | | 1.65 | | | 1.66 | | | 1.65 | | | 1.65 | | | 1.65 | | | | 0.65 | | | 0.66 | | | 0.65 | | | 0.65 | | | 0.65 | |
Ratio of net investment income to average net assets (%) | | | 2.00 | | | 2.00 | | | 1.85 | | | 2.10 | | | 2.42 | | | | 1.25 | | | 1.25 | | | 1.10 | | | 1.36 | | | 1.68 | | | | 2.25 | | | 2.25 | | | 2.10 | | | 2.30 | | | 2.64 | |
| Portfolio turnover (%)3 | | | 27 | | | 39 | | | 57 | | | 41 | | | 24 | | | | 27 | | | 39 | | | 57 | | | 41 | | | 24 | | | | 27 | | | 39 | | | 57 | | | 41 | | | 24 | |
| | | | CORE BOND FUND | | | | CORPORATE BOND FUND* | |
| | | | | | | | | |
| | | | | | | | | |
| | | | CLASS R6 | | | | CLASS Y | |
| | | | | | | | | |
| | | | | | | | | | | | | | | | | | | | | | | | | | | | | | | | | | | | | | | | | | | | | | |
| | | | Year Ended October 31, | | | | Inception
to
10/31/136 | | | | Period Ended October 31, | | | | Year Ended
December 31, | |
| | | | | | | | | | | | | | |
| | | | 2017 | | | | 2016 | | | | 2015 | | | | 2014 | | | | | | | 2017 | | | | 2016 | | | | 2015 | | | | 2014 | | | | 20138 | | | | 2012 | | |
| | | | | | | | | | | | | | | | | | | | | | | | | | | | | | | | | | | | | | | | | | | | | | |
Net Asset Value at beginning of period | | | $10.21 | | | | $10.09 | | | | $10.24 | | | | $10.20 | | | | $10.53 | | | | $11.69 | | | | $11.34 | | | | $11.49 | | | | $11.27 | | | | $11.67 | | | | $11.27 | | |
Income from Investment Operations: | | | | | | | | | | | | | | | | | | | | | | | | | | | | | | | | | | | | | | | | | | | | | |
Net investment income1 | | | 0.24 | | | | 0.24 | | | | 0.23 | | | | 0.20 | | | | 0.14 | | | | 0.33 | | | | 0.33 | | | | 0.29 | | | | 0.25 | | | | 0.19 | | | | 0.24 | | |
Net realized and unrealized gain (loss) on investments | | | (0.10 | ) | | | 0.21 | | | | (0.06 | ) | | | 0.13 | | | | (0.34 | ) | | | – | | | | 0.39 | | | | (0.13 | ) | | | 0.22 | | | | (0.38 | ) | | | 0.39 | | |
| | | | | | | | | | | | | | | | | | | | | | | | | | | | | | | | | | | | | | | | | | | | | | |
Total from investment operations | | | 0.14 | | | | 0.45 | | | | 0.17 | | | | 0.33 | | | | (0.20 | ) | | | 0.33 | | | | 0.72 | | | | 0.16 | | | | 0.47 | | | | (0.19 | ) | | | 0.63 | | |
Less Distributions From: | | | | | | | | | | | | | | | | | | | | | | | | | | | | | | | | | | | | | | | | | | | | | |
Net investment income | | | (0.25 | ) | | | (0.25 | ) | | | (0.23 | ) | | | (0.24 | ) | | | (0.13 | ) | | | (0.33 | ) | | | (0.33 | ) | | | (0.29 | ) | | | (0.25 | ) | | | (0.19 | ) | | | (0.23 | ) | |
Capital gains | | | (0.05 | ) | | | (0.08 | ) | | | (0.09 | ) | | | (0.05 | ) | | | – | | | | (0.04 | ) | | | (0.04 | ) | | | (0.02 | ) | | | – | | | | (0.02 | ) | | | (0.00 | )7 | |
| | | | | | | | | | | | | | | | | | | | | | | | | | | | | | | | | | | | | | | | | | | | | | |
Total distributions | | | (0.30 | ) | | | (0.33 | ) | | | (0.32 | ) | | | (0.29 | ) | | | (0.13 | ) | | | (0.37 | ) | | | (0.37 | ) | | | (0.31 | ) | | | (0.25 | ) | | | (0.21 | ) | | | (0.23 | ) | |
Net increase (decrease) in net asset value | | | (0.16 | ) | | | 0.12 | | | | (0.15 | ) | | | 0.04 | | | | (0.33 | ) | | | (0.04 | ) | | | 0.35 | | | | (0.15 | ) | | | 0.22 | | | | (0.40 | ) | | | 0.40 | | |
| Net Asset Value at end of period | | | $10.05 | | | | $10.21 | | | | $10.09 | | | | $10.24 | | | | $10.20 | | | | $11.65 | | | | $11.69 | | | | $11.34 | | | | $11.49 | | | | $11.27 | | | | $11.67 | | |
| Total Return (%)2 | | | 1.41 | | | | 4.59 | | | | 1.71 | | | | 3.32 | | | | (1.86 | )4 | | | 2.97 | | | | 6.45 | | | | 1.40 | | | | 4.21 | | | | (1.58 | )4 | | | 5.72 | | |
| Ratios/Supplemental Data: | | | | | | | | | | | | | | | | | | | | | | | | | | | | | | | | | | | | | | | | | | | | | |
| Net Assets at end of period (in 000’s) | | | $1,802 | | | | $1,876 | | | | $1,693 | | | | $10 | | | | $10 | | | | $21,773 | | | | $23,846 | | | | $23,545 | | | | $27,010 | | | | $19,743 | | | | $19,813 | | |
Ratios of expenses to average net assets: | | | | | | | | | | | | | | | | | | | | | | | | | | | | | | | | | | | | | | | | | | | | | |
Before reimbursement of expenses by Adviser (%) | | | 0.52 | | | | 0.53 | | | | 0.52 | | | | 0.54 | | | | 0.53 | 5 | | | 0.65 | | | | 0.66 | | | | 0.65 | | | | 0.65 | | | | 0.65 | 5 | | | 0.67 | | |
After reimbursement of expenses by Adviser (%) | | | 0.52 | | | | 0.53 | | | | 0.52 | | | | 0.54 | | | | 0.53 | 5 | | | 0.65 | | | | 0.66 | | | | 0.65 | | | | 0.65 | | | | 0.65 | 5 | | | – | | |
Ratio of net investment income to average net assets | | | | | | | | | | | | | | | | | | | | | | | | | | | | | | | | | | | | | | | | | | | | | |
After reimbursement of expenses by Adviser (%) | | | 2.38 | | | | 2.38 | | | | 2.24 | | | | 1.99 | | | | 2.71 | 5 | | | 2.88 | | | | 2.86 | | | | 2.55 | | | | 2.22 | | | | 2.05 | 5 | | | 2.04 | | |
| Portfolio turnover (%)3 | | | 27 | | | | 39 | | | | 57 | | | | 41 | | | | 24 | 4 | | | 23 | | | | 36 | | | | 37 | | | | 31 | | | | 10 | 4 | | | 11 | | |
| * | The Financial Statements presented herein include the historical operating results of the Madison Mosaic Funds through April 19, 2013. Effective after market close on this date, the Madison Mosaic Funds reorganized into the Madison Funds. |
| 1 | Net investment income (loss) calculated excluding permanent tax adjustments to undistributed net investment income. |
| 2 | Total return without applicable sales charge. |
| 3 | Portfolio turnover is calculated at the fund level and represents the entire fiscal year or period. |
| 4 | Not annualized. |
| 5 | Annualized. |
| 6 | Commenced investment operations at the close of business on April 22, 2013. |
| 7 | Amounts represent less than $0.005 per share. |
| 8 | Effective at the close of business on April 19, 2013, the fiscal year end of the fund changed to October 31. Disclosure represents 10 months of information. |
| See accompanying Notes to Financial Statements. |
| |
| |
| 50 |
Madison Funds | October 31, 2017
| |
| Financial Highlights for a Share of Beneficial Interest Outstanding |
| | | HIGH INCOME FUND |
| | | |
| | | CLASS A | | CLASS B | | CLASS Y |
| | | | | | | |
| | | Year Ended October 31, | | Year Ended October 31, | | Year Ended October 31, |
| | | | | | | |
| | | | 2017 | | | | 2016 | | | | 2015 | | | | 2014 | | | | 2013 | | | | 2017 | | | | 2016 | | | | 2015 | | | | 2014 | | | | 2013 | | | | 2017 | | | | 2016 | | | | 2015 | | | | 2014 | | | | 2013 | |
| | | | | | | | | | | | | | | | | | | | | | | | | | | | | | | | | | | | | | | | | | | | | | | | | | | | | | | | | | | | | |
| Net Asset Value at beginning of period | | | $6.03 | | | | $5.93 | | | | $6.79 | | | | $7.15 | | | | $7.15 | | | | $6.19 | | | | $6.08 | | | | $6.95 | | | | $7.30 | | | | $7.26 | | | | $5.94 | | | | $5.86 | | | | $6.73 | | | | $7.09 | | | | $7.10 | |
Income from Investment Operations: | | | | | | | | | | | | | | | | | | | | | | | | | | | | | | | | | | | | | | | | | | | | | | | | | | | | | | | | | | | | |
Net investment income1 | | | 0.29 | | | | 0.29 | | | | 0.32 | | | | 0.35 | | | | 0.41 | | | | 0.26 | | | | 0.26 | | | | 0.29 | | | | 0.30 | | | | 0.37 | | | | 0.26 | | | | 0.27 | | | | 0.01 | | | | 1.02 | | | | 0.45 | |
Net realized and unrealized gain (loss) on investments | | | 0.16 | | | | 0.10 | | | | (0.47 | ) | | | – | | | | 0.03 | | | | 0.16 | | | | 0.10 | | | | (0.50 | ) | | | – | | | | 0.03 | | | | 0.21 | | | | 0.13 | | | | (0.14 | ) | | | (0.65 | ) | | | 0.01 | |
| | | | | | | | | | | | | | | | | | | | | | | | | | | | | | | | | | | | | | | | | | | | | | | | | | | | | | | | | | | | | |
Total from investment operations | | | 0.45 | | | | 0.39 | | | | (0.15 | ) | | | 0.35 | | | | 0.44 | | | | 0.42 | | | | 0.36 | | | | (0.21 | ) | | | 0.30 | | | | 0.40 | | | | 0.47 | | | | 0.40 | | | | (0.13 | ) | | | 0.37 | | | | 0.46 | |
Less Distributions From: | | | | | | | | | | | | | | | | | | | | | | | | | | | | | | | | | | | | | | | | | | | | | | | | | | | | | | | | | | | | |
Net investment income | | | (0.29 | ) | | | (0.29 | ) | | | (0.32 | ) | | | (0.36 | ) | | | (0.44 | ) | | | (0.24 | ) | | | (0.25 | ) | | | (0.27 | ) | | | (0.30 | ) | | | (0.36 | ) | | | (0.32 | ) | | | (0.32 | ) | | | (0.35 | ) | | | (0.38 | ) | | | (0.47 | ) |
Capital gains | | | – | | | | – | | | | (0.39 | ) | | | (0.35 | ) | | | – | | | | – | | | | – | | | | (0.39 | ) | | | (0.35 | ) | | | – | | | | – | | | | 0.00 | | | | (0.39 | ) | | | (0.35 | ) | | | – | |
| | | | | | | | | | | | | | | | | | | | | | | | | | | | | | | | | | | | | | | | | | | | | | | | | | | | | | | | | | | | | |
Total distributions | | | (0.29 | ) | | | (0.29 | ) | | | (0.71 | ) | | | (0.71 | ) | | | (0.44 | ) | | | (0.24 | ) | | | (0.25 | ) | | | (0.66 | ) | | | (0.65 | ) | | | (0.36 | ) | | | (0.32 | ) | | | (0.32 | ) | | | (0.74 | ) | | | (0.73 | ) | | | (0.47 | ) |
Net increase (decrease) in net asset value | | | 0.16 | | | | 0.10 | | | | (0.86 | ) | | | (0.36 | ) | | | (0.00 | )4 | | | 0.18 | | | | 0.11 | | | | (0.87 | ) | | | (0.35 | ) | | | 0.04 | | | | 0.15 | | | | 0.08 | | | | (0.87 | ) | | | (0.36 | ) | | | (0.01 | ) |
Net Asset Value at end of period | | | $6.19 | | | | $6.03 | | | | $5.93 | | | | $6.79 | | | | $7.15 | | | | $6.37 | | | | $6.19 | | | | $6.08 | | | | $6.95 | | | | $7.30 | | | | $6.09 | | | | $5.94 | | | | $5.86 | | | | $6.73 | | | | $7.09 | |
| Total Return (%)2 | | | 7.61 | | | | 6.91 | | | | (2.29 | ) | | | 5.20 | | | | 6.29 | | | | 6.92 | | | | 6.07 | | | | (3.11 | ) | | | 4.47 | | | | 5.60 | | | | 8.06 | | | | 7.15 | | | | (2.00 | ) | | | 5.59 | | | | 6.68 | |
Ratios/Supplemental Data: | | | | | | | | | | | | | | | | | | | | | | | | | | | | | | | | | | | | | | | | | | | | | | | | | | | | | | | | | | | | |
Net Assets at end of period (in 000’s) | | | $21,298 | | | | $21,403 | | | | $23,155 | | | | $28,596 | | | | $28,530 | | | | $1,505 | | | | $1,651 | | | | $1,685 | | | | $2,267 | | | | $2,566 | | | | $797 | | | | $712 | | | | $664 | | | | $388 | | | | $17,449 | |
Ratios of expenses to average net assets (%) | | | 1.00 | | | | 1.01 | | | | 1.00 | | | | 1.00 | | | | 1.00 | | | | 1.75 | | | | 1.76 | | | | 1.75 | | | | 1.75 | | | | 1.75 | | | | 0.75 | | | | 0.75 | | | | 0.75 | | | | 0.75 | | | | 0.75 | |
Ratio of net investment income to average net assets (%) | | | 4.72 | | | | 4.98 | | | | 5.12 | | | | 5.05 | | | | 5.63 | | | | 3.97 | | | | 4.23 | | | | 4.36 | | | | 4.30 | | | | 4.89 | | | | 4.97 | | | | 5.20 | | | | 5.39 | | | | 5.36 | | | | 5.95 | |
| Portfolio turnover (%)3 | | | 53 | | | | 73 | | | | 28 | | | | 52 | | | | 28 | | | | 53 | | | | 73 | | | | 28 | | | | 52 | | | | 28 | | | | 53 | | | | 73 | | | | 28 | | | | 52 | | | | 28 | |
| | | DIVERSIFIED INCOME FUND |
| | | |
| | | CLASS A | | | | CLASS B | | | | CLASS C |
| | | | | | | | | | | |
| | | Year Ended October 31, | | | | Year Ended October 31, | | | | Year Ended October 31, |
| | | | | | | | | | | |
| | | | 2017 | | | | 2016 | | | | 2015 | | | | 2014 | | | | 2013 | | | | 2017 | | | | 2016 | | | | 2015 | | | | 2014 | | | | 2013 | | | | 2017 | | | | 2016 | | | | 2015 | | | 2014 | | | 2013 | |
| | | | | | | | | | | | | | | | | | | | | | | | | | | | | | | | | | | | | | | | | | | | | | | | | | | | | | | | | | | |
| Net Asset Value at beginning of period | | | $14.92 | | | | $14.75 | | | | $14.79 | | | | $13.89 | | | | $12.54 | | | | $15.01 | | | | $14.83 | | | | $14.88 | | | | $13.98 | | | | $12.61 | | | | $15.01 | | | | $14.83 | | | | $14.88 | | | $13.97 | | | $12.61 | |
Income from Investment Operations: | | | | | | | | | | | | | | | | | | | | | | | | | | | | | | | | | | | | | | | | | | | | | | | | | | | | | | | | | | |
Net investment income1 | | | 0.26 | | | | 0.25 | | | | 0.23 | | | | 0.23 | | | | 0.24 | | | | 0.14 | | | | 0.14 | | | | 0.13 | | | | 0.13 | | | | 0.13 | | | | 0.14 | | | | 0.14 | | | | 0.13 | | | 0.13 | | | 0.13 | |
Net realized and unrealized gain (loss) on investments | | | 1.56 | | | | 0.52 | | | | (0.03 | ) | | | 0.90 | | | | 1.35 | | | | 1.58 | | | | 0.53 | | | | (0.04 | ) | | | 0.90 | | | | 1.37 | | | | 1.57 | | | | 0.53 | | | | (0.04 | ) | | 0.91 | | | 1.36 | |
| | | | | | | | | | | | | | | | | | | | | | | | | | | | | | | | | | | | | | | | | | | | | | | | | | | | | | | | | | | |
Total from investment operations | | | 1.82 | | | | 0.77 | | | | 0.20 | | | | 1.13 | | | | 1.59 | | | | 1.72 | | | | 0.67 | | | | 0.09 | | | | 1.03 | | | | 1.50 | | | | 1.71 | | | | 0.67 | | | | 0.09 | | | 1.04 | | | 1.49 | |
Less Distributions From: | | | | | | | | | | | | | | | | | | | | | | | | | | | | | | | | | | | | | | | | | | | | | | | | | | | | | | | | | | |
Net investment income | | | (0.27 | ) | | | (0.26 | ) | | | (0.24 | ) | | | (0.23 | ) | | | (0.24 | ) | | | (0.15 | ) | | | (0.15 | ) | | | (0.14 | ) | | | (0.13 | ) | | | (0.13 | ) | | | (0.15 | ) | | | (0.15 | ) | | | (0.14 | ) | | (0.13 | ) | | (0.13 | ) |
Capital gains | | | (0.54 | ) | | | (0.34 | ) | | | – | | | | – | | | | – | | | | (0.54 | ) | | | (0.34 | ) | | | – | | | | – | | | | – | | | | (0.54 | ) | | | (0.34 | ) | | | – | | | – | | | – | |
| | | | | | | | | | | | | | | | | | | | | | | | | | | | | | | | | | | | | | | | | | | | | | | | | | | | | | | | | | | |
Total distributions | | | (0.81 | ) | | | (0.60 | ) | | | (0.24 | ) | | | (0.23 | ) | | | (0.24 | ) | | | (0.69 | ) | | | (0.49 | ) | | | (0.14 | ) | | | (0.13 | ) | | | (0.13 | ) | | | (0.69 | ) | | | (0.49 | ) | | | (0.14 | ) | | (0.13 | ) | | (0.13 | ) |
| Net increase (decrease) in net asset value | | | 1.01 | | | | 0.17 | | | | (0.04 | ) | | | 0.90 | | | | 1.35 | | | | 1.03 | | | | 0.18 | | | | (0.05 | ) | | | 0.90 | | | | 1.37 | | | | 1.02 | | | | 0.18 | | | | (0.05 | ) | | 0.91 | | | 1.36 | |
| Net Asset Value at end of period | | | $15.93 | | | | $14.92 | | | | $14.75 | | | | $14.79 | | | | $13.89 | | | | $16.04 | | | | $15.01 | | | | $14.83 | | | | $14.88 | | | | $13.98 | | | | $16.03 | | | | $15.01 | | | | $14.83 | | | $14.88 | | | $13.97 | |
| Total Return (%)2 | | | 12.57 | | | | 5.38 | | | | 1.39 | | | | 8.22 | | | | 12.76 | | | | 11.79 | | | | 4.63 | | | | 0.58 | | | | 7.37 | | | | 11.99 | | | | 11.72 | | | | 4.63 | | | | 0.64 | | | 7.38 | | | 11.91 | |
Ratios/Supplemental Data: | | | | | | | | | | | | | | | | | | | | | | | | | | | | | | | | | | | | | | | | | | | | | | | | | | | | | | | | | | |
Net Assets at end of period (in 000’s) | | | $137,863 | | | | $128,208 | | | | $121,026 | | | | $119,364 | | | | $105,521 | | | | $12,702 | | | | $13,293 | | | | $13,442 | | | | $14,378 | | | | $14,297 | | | | $15,103 | | | | $13,498 | | | | $12,766 | | | $11,545 | | | $6,732 | |
Ratios of expenses to average net assets (%) | | | 1.10 | | | | 1.11 | | | | 1.10 | | | | 1.10 | | | | 1.10 | | | | 1.85 | | | | 1.86 | | | | 1.85 | | | | 1.85 | | | | 1.85 | | | | 1.85 | | | | 1.86 | | | | 1.85 | | | 1.85 | | | 1.84 | |
Ratio of net investment income to average net assets (%) | | | 1.65 | | | | 1.68 | | | | 1.59 | | | | 1.61 | | | | 1.75 | | | | 0.91 | | | | 0.94 | | | | 0.84 | | | | 0.86 | | | | 1.01 | | | | 0.89 | | | | 0.93 | | | | 0.84 | | | 0.83 | | | 0.88 | |
| Portfolio turnover (%)3 | | | 21 | | | | 35 | | | | 25 | | | | 23 | | | | 18 | | | | 21 | | | | 35 | | | | 25 | | | | 23 | | | | 18 | | | | 21 | | | | 35 | | | | 25 | | | 23 | | | 18 | |
| 1 | Net investment income (loss) calculated excluding permanent tax adjustments to undistributed net investment income. |
| 2 | Total return without applicable sales charge. |
| 3 | Portfolio turnover is calculated at the fund level and represents the entire fiscal year or period. |
| 4 | Amounts represent less than $0.005 per share. |
| See accompanying Notes to Financial Statements. |
| |
| |
| 51 |
Madison Funds | October 31, 2017
| |
| Financial Highlights for a Share of Beneficial Interest Outstanding |
| | | | COVERED CALL & EQUITY INCOME FUND1 |
| | | | |
| | | | CLASS A | | | | CLASS C | | | | CLASS Y | |
| | | | | | | | | | | | | |
| | | | Year Ended October 31, | | | | Year Ended October 31, | | | | Year Ended October 31, | |
| | | | | | | | | | | | | |
| | | | 2017 | | | | 2016 | | | | 2015 | | | | 2014 | | | | 2013 | | | | 2017 | | | | 2016 | | | | 2015 | | | | 2014 | | | | 2013 | | | | 2017 | | | | 2016 | | | | 2015 | | | | 2014 | | | | 2013 | |
| | | | | | | | | | | | | | | | | | | | | | | | | | | | | | | | | | | | | | | | | | | | | | | | | | | | | | | | | | | | | |
| Net Asset Value at beginning of period | | | $8.95 | | | | $9.14 | | | | $9.92 | | | | $9.99 | | | | $9.76 | | | | $8.63 | | | | $8.89 | | | | $9.74 | | | | $9.89 | | | | $9.74 | | | | $9.11 | | | | $9.27 | | | | $10.03 | | | | $10.08 | | | | $9.82 | |
Income from Investment Operations: | | | | | | | | | | | | | | | | | | | | | | | | | | | | | | | | | | | | | | | | | | | | | | | | | | | | | | | | | | | | |
Net investment income (loss) | | | 0.07 | | | | 0.05 | | | | 0.06 | | | | 0.08 | | | | 0.02 | | | | 0.02 | | | | 0.06 | | | | 0.16 | | | | 0.08 | | | | 0.20 | | | | 0.14 | | | | 0.08 | | | | 0.14 | | | | 0.22 | | | | (0.28 | ) |
Net realized and unrealized gain (loss) on investments | | | 0.46 | | | | 0.33 | | | | (0.06 | ) | | | 0.77 | | | | 1.12 | | | | 0.42 | | | | 0.24 | | | | (0.23 | ) | | | 0.69 | | | | 0.86 | | | | 0.42 | | | | 0.33 | | | | (0.12 | ) | | | 0.67 | | | | 1.45 | |
| | | | | | | | | | | | | | | | | | | | | | | | | | | | | | | | | | | | | | | | | | | | | | | | | | | | | | | | | | | | | |
Total from investment operations | | | 0.53 | | | | 0.38 | | | | – | | | | 0.85 | | | | 1.14 | | | | 0.44 | | | | 0.30 | | | | (0.07 | ) | | | 0.77 | | | | 1.06 | | | | 0.56 | | | | 0.41 | | | | 0.02 | | | | 0.89 | | | | 1.17 | |
Less Distributions From: | | | | | | | | | | | | | | | | | | | | | | | | | | | | | | | | | | | | | | | | | | | | | | | | | | | | | | | | | | | | |
Net investment income | | | (0.39 | ) | | | (0.41 | ) | | | (0.50 | ) | | | (0.60 | ) | | | (0.60 | ) | | | (0.39 | ) | | | (0.40 | ) | | | (0.50 | ) | | | (0.60 | ) | | | (0.60 | ) | | | (0.40 | ) | | | (0.41 | ) | | | (0.50 | ) | | | (0.62 | ) | | | (0.60 | ) |
Capital gains | | | (0.21 | ) | | | (0.16 | ) | | | (0.28 | ) | | | (0.32 | ) | | | (0.31 | ) | | | (0.21 | ) | | | (0.16 | ) | | | (0.28 | ) | | | (0.32 | ) | | | (0.31 | ) | | | (0.21 | ) | | | (0.16 | ) | | | (0.28 | ) | | | (0.32 | ) | | | (0.31 | ) |
| | | | | | | | | | | | | | | | | | | | | | | | | | | | | | | | | | | | | | | | | | | | | | | | | | | | | | | | | | | | | |
Total distributions | | | (0.60 | ) | | | (0.57 | ) | | | (0.78 | ) | | | (0.92 | ) | | | (0.91 | ) | | | (0.60 | ) | | | (0.56 | ) | | | (0.78 | ) | | | (0.92 | ) | | | (0.91 | ) | | | (0.61 | ) | | | (0.57 | ) | | | (0.78 | ) | | | (0.94 | ) | | | (0.91 | ) |
Net increase (decrease) in net asset value | | | (0.07 | ) | | | (0.19 | ) | | | (0.78 | ) | | | (0.07 | ) | | | 0.23 | | | | (0.16 | ) | | | (0.26 | ) | | | (0.85 | ) | | | (0.15 | ) | | | 0.15 | | | | (0.05 | ) | | | (0.16 | ) | | | (0.76 | ) | | | (0.05 | ) | | | 0.26 | |
Net Asset Value at end of period | | | $8.88 | | | | $8.95 | | | | $9.14 | | | | $9.92 | | | | $9.99 | | | | $8.47 | | | | $8.63 | | | | $8.89 | | | | $9.74 | | | | $9.89 | | | | $9.06 | | | | $9.11 | | | | $9.27 | | | | $10.03 | | | | $10.08 | |
| Total Return (%)3 | | | 5.97 | | | | 4.29 | | | | (0.18 | ) | | | 8.90 | | | | 12.29 | | | | 5.09 | | | | 3.53 | | | | (0.83 | ) | | | 8.01 | | | | 11.44 | | | | 6.15 | | | | 4.63 | | | | 0.13 | | | | 9.08 | | | | 12.60 | |
Ratios/Supplemental Data: | | | | | | | | | | | | | | | | | | | | | | | | | | | | | | | | | | | | | | | | | | | | | | | | | | | | | | | | | | | | |
Net Assets at end of period (in 000’s) | | | $16,773 | | | | $18,252 | | | | $16,042 | | | | $11,373 | | | | $7,559 | | | | $13,299 | | | | $13,519 | | | | $9,287 | | | | $4,805 | | | | $2,258 | | | | $95,640 | | | | $71,241 | | | | $60,916 | | | | $43,891 | | | | $29,307 | |
Ratios of expenses to average net assets (%) | | | 1.25 | | | | 1.25 | | | | 1.25 | | | | 1.25 | | | | 1.25 | | | | 2.00 | | | | 2.00 | | | | 1.99 | | | | 2.00 | | | | 2.00 | | | | 1.00 | | | | 1.00 | | | | 1.00 | | | | 1.00 | | | | 1.00 | |
Ratio of net investment income (loss) to average net assets | | | 1.03 | | | | 0.17 | | | | 0.13 | | | | (0.30 | ) | | | (0.12 | ) | | | 0.28 | | | | (0.58 | ) | | | (0.59 | ) | | | (1.07 | ) | | | (0.91 | ) | | | 1.26 | | | | 0.42 | | | | 0.40 | | | | (0.03 | ) | | | 0.14 | |
| Portfolio turnover (%)6 | | | 166 | | | | 135 | | | | 107 | | | | 139 | | | | 100 | | | | 166 | | | | 135 | | | | 107 | | | | 139 | | | | 100 | | | | 166 | | | | 135 | | | | 107 | | | | 139 | | | | 100 | |
| | | | COVERED CALL &
EQUITY INCOME FUND1 | | | | DIVIDEND INCOME FUND* | | |
| | | | | | | | | |
| | | | CLASS R6 | | | | CLASS Y | |
| | | | | | | | | |
| | | | Year Ended October 31, | | | | Period Ended October 31, | | Year Ended
December 31, | |
| | | | | | | | | | | | |
| | | | 2017 | | | | 2016 | | | | 2015 | | | | 2014 | | | | 2013 | | | | 2017 | | | | 2016 | | | | 2015 | | | | 2014 | | | | 2013 | 7 | | | 2012 | | |
| | | | | | | | | | | | | | | | | | | | | | | | | | | | | | | | | | | | | | | | | | | | | | |
Net Asset Value at beginning of period | | | $9.16 | | | | $9.31 | | | | $10.06 | | | | $10.09 | | | | $9.82 | | | | $22.38 | | | | $22.28 | | | | $23.59 | | | | $21.94 | | | | $17.90 | | | | $17.17 | | |
Income from Investment Operations: | | | | | | | | | | | | | | | | | | | | | | | | | | | | | | | | | | | | | | | | | | | | | |
Net investment income | | | 0.14 | | | | 0.07 | | | | 0.24 | | | | 0.13 | | | | 0.04 | | | | 0.44 | 2 | | | 0.33 | 2 | | | 0.40 | 2 | | | 0.38 | 2 | | | 0.28 | 2 | | | 0.36 | 2 | |
Net realized and unrealized gain (loss) on investments | | | 0.44 | | | | 0.35 | | | | (0.21 | ) | | | 0.78 | | | | 1.14 | | | | 4.34 | | | | 0.99 | | | | 0.01 | | | | 2.29 | | | | 4.03 | | | | 1.50 | | |
| | | | | | | | | | | | | | | | | | | | | | | | | | | | | | | | | | | | | | | | | | | | | | |
Total from investment operations | | | 0.58 | | | | 0.42 | | | | 0.03 | | | | 0.91 | | | | 1.18 | | | | 4.78 | | | | 1.32 | | | | 0.41 | | | | 2.67 | | | | 4.31 | | | | 1.86 | | |
Less Distributions From: | | | | | | | | | | | | | | | | | | | | | | | | | | | | | | | | | | | | | | | | | | | | | |
Net investment income | | | (0.40 | ) | | | (0.41 | ) | | | (0.50 | ) | | | (0.62 | ) | | | (0.60 | ) | | | (0.44 | ) | | | (0.32 | ) | | | (0.38 | ) | | | (0.38 | ) | | | (0.27 | ) | | | (0.35 | ) | |
Capital gains | | | (0.21 | ) | | | (0.16 | ) | | | (0.28 | ) | | | (0.32 | ) | | | (0.31 | ) | | | (0.54 | ) | | | (0.90 | ) | | | (1.34 | ) | | | (0.64 | ) | | | – | | | | (0.78 | ) | |
| | | | | | | | | | | | | | | | | | | | | | | | | | | | | | | | | | | | | | | | | | | | | | |
Total distributions | | | (0.61 | ) | | | (0.57 | ) | | | (0.78 | ) | | | (0.94 | ) | | | (0.91 | ) | | | (0.98 | ) | | | (1.22 | ) | | | (1.72 | ) | | | (1.02 | ) | | | (0.27 | ) | | | (1.13 | ) | |
Net increase (decrease) in net asset value | | | (0.03 | ) | | | (0.15 | ) | | | (0.75 | ) | | | (0.03 | ) | | | 0.27 | | | | 3.80 | | | | 0.10 | | | | (1.31 | ) | | | 1.65 | | | | 4.04 | | | | 0.73 | | |
| Net Asset Value at end of period | | | $9.13 | | | | $9.16 | | | | $9.31 | | | | $10.06 | | | | $10.09 | | | | $26.18 | | | | $22.38 | | | | $22.28 | | | | $23.59 | | | | $21.94 | | | | $17.90 | | |
| Total Return (%)3 | | | 6.34 | | | | 4.72 | | | | 0.23 | | | | 9.29 | | | | 12.75 | | | | 21.85 | | | | 6.16 | | | | 1.76 | | | | 12.42 | | | | 24.18 | 4 | | | 10.86 | | |
| Ratios/Supplemental Data: | | | | | | | | | | | | | | | | | | | | | | | | | | | | | | | | | | | | | | | | | | | | | |
| Net Assets at end of period (in 000’s) | | | $2,531 | | | | $3,110 | | | | $2,826 | | | | $152 | | | | $116 | | | | $107,411 | | | | $102,402 | | | | $20,925 | | | | $21,518 | | | | $18,658 | | | | $13,263 | | |
Ratios of expenses to average net assets: | | | | | | | | | | | | | | | | | | | | | | | | | | | | | | | | | | | | | | | | | | | | | |
Before reimbursement of expenses by Adviser (%) | | | 0.87 | | | | 0.88 | | | | 0.87 | | | | 0.87 | | | | 0.87 | | | | 1.10 | | | | 1.10 | | | | 1.10 | | | | 1.10 | | | | 1.10 | 5 | | | 1.17 | | |
After reimbursement of expenses by Adviser (%) | | | 0.87 | | | | 0.88 | | | | 0.87 | | | | 0.87 | | | | 0.87 | | | | 0.95 | | | | 0.95 | | | | 0.95 | | | | 0.95 | | | | 0.95 | 5 | | | 1.09 | | |
Ratio of net investment income to average net assets | | | | | | | | | | | | | | | | | | | | | | | | | | | | | | | | | | | | | | | | | | | | | |
After reimbursement of expenses by Adviser (%) | | | 1.26 | | | | 0.55 | | | | 0.70 | | | | 0.10 | | | | 0.21 | | | | 1.81 | | | | 1.61 | | | | 1.75 | | | | 1.66 | | | | 1.66 | 5 | | | 1.95 | | |
| Portfolio turnover (%)6 | | | 166 | | | | 135 | | | | 107 | | | | 139 | | | | 100 | | | | 19 | | | | 33 | | | | 24 | | | | 29 | | | | 16 | 4 | | | 61 | | |
| * | The Financial Statements presented herein include the historical operating results of the Madison Mosaic Funds through April 19, 2013. Effective after market close on this date, the Madison Mosaic Funds reorganized into the Madison Funds. |
| 1 | Prior to close of business on February 28, 2014, the Fund was known as the Equity Income Fund. |
| 2 | Net investment income (loss) calculated excluding permanent tax adjustments to undistributed net investment income. |
| 3 | Total return without applicable sales charge. |
| 4 | Not annualized. |
| 5 | Annualized. |
| 6 | Portfolio turnover is calculated at the fund level and represents the entire fiscal year or period. |
| 7 | Effective at the close of business on April 19, 2013, the fiscal year end of the fund changed to October 31. Disclosure represents 10 months of information. |
| See accompanying Notes to Financial Statements. |
| |
| |
| 52 |
Madison Funds | October 31, 2017
| |
| Financial Highlights for a Share of Beneficial Interest Outstanding |
| | | LARGE CAP VALUE FUND |
| | | | |
| | | CLASS A | | | CLASS B | | | CLASS Y |
| | | | | | | | | | |
| | | Year Ended October 31, | | Year Ended October 31, | | Year Ended October 31, | |
| | | | | | | | | | |
| | | 2017 | | 2016 | | 2015 | | 2014 | | 2013 | | | 2017 | | 2016 | | 2015 | | 2014 | | 2013 | | | 2017 | | 2016 | | 2015 | | 2014 | | 2013 | |
| | | | | | | | | | |
| Net Asset Value at beginning of period | | $ | 15.47 | | $ | 16.33 | | $ | 19.18 | | $ | 17.04 | | $ | 13.99 | | | $ | 15.09 | | $ | 16.01 | | $ | 18.84 | | $ | 16.74 | | $ | 13.74 | | | $ | 15.48 | | $ | 16.35 | | $ | 19.20 | | $ | 17.06 | | $ | 14.01 | |
| | | | | | | | | | | | | | | | | | | | | | | | | | | | | | | | | | | | | | | | | | | | | | | | | |
Income from Investment Operations: | | | | | | | | | | | | | | | | | | | | | | | | | | | | | | | | | | | | | | | | | | | | | | | | |
Net investment income (loss)1 | | | 0.25 | | | 0.16 | | | 0.08 | | | 0.13 | | | 0.18 | | | | 0.16 | | | 0.06 | | | (0.05 | ) | | 0.04 | | | 0.12 | | | | 0.37 | | | 0.26 | | | 0.14 | | | 0.19 | | | 0.19 | |
Net realized and unrealized gain (loss) on investments | | | 2.05 | | | 0.92 | | | (0.10 | ) | | 2.15 | | | 3.07 | | | | 1.98 | | | 0.88 | | | (0.09 | ) | | 2.07 | | | 2.98 | | | | 1.97 | | | 0.85 | | | (0.11 | ) | | 2.14 | | | 3.10 | |
| | | | | | | | | | |
Total from investment operations | | | 2.30 | | | 1.08 | | | (0.02 | ) | | 2.28 | | | 3.25 | | | | 2.14 | | | 0.94 | | | (0.14 | ) | | 2.11 | | | 3.10 | | | | 2.34 | | | 1.11 | | | 0.03 | | | 2.33 | | | 3.29 | |
| | | | | | | | | | | | | | | | | | | | | | | | | | | | | | | | | | | | | | | | | | | | | | | | | |
Less Distributions From: | | | | | | | | | | | | | | | | | | | | | | | | | | | | | | | | | | | | | | | | | | | | | | | | |
Net investment income | | | (0.18 | ) | | (0.10 | ) | | (0.14 | ) | | (0.14 | ) | | (0.20 | ) | | | (0.06 | ) | | (0.02 | ) | | (0.00 | )6 | | (0.01 | ) | | (0.10 | ) | | | (0.22 | ) | | (0.14 | ) | | (0.19 | ) | | (0.19 | ) | | (0.24 | ) |
Capital gains | | | (2.07 | ) | | (1.84 | ) | | (2.69 | ) | | – | | | – | | | | (2.07 | ) | | (1.84 | ) | | (2.69 | ) | | – | | | – | | | | (2.07 | ) | | (1.84 | ) | | (2.69 | ) | | – | | | – | |
| | | | | | | | | | |
Total distributions | | | (2.25 | ) | | (1.94 | ) | | (2.83 | ) | | (0.14 | ) | | (0.20 | ) | | | (2.13 | ) | | (1.86 | ) | | (2.69 | ) | | (0.01 | ) | | (0.10 | ) | | | (2.29 | ) | | (1.98 | ) | | (2.88 | ) | | (0.19 | ) | | (0.24 | ) |
| Net increase (decrease) in net asset value | | | 0.05 | | | (0.86 | ) | | (2.85 | ) | | 2.14 | | | 3.05 | | | | 0.01 | | | (0.92 | ) | | (2.83 | ) | | 2.10 | | | 3.00 | | | | 0.05 | | | (0.87 | ) | | (2.85 | ) | | 2.14 | | | 3.05 | |
| Net Asset Value at end of period | | $ | 15.52 | | $ | 15.47 | | $ | 16.33 | | $ | 19.18 | | $ | 17.04 | | | $ | 15.10 | | $ | 15.09 | | $ | 16.01 | | $ | 18.84 | | $ | 16.74 | | | $ | 15.53 | | $ | 15.48 | | $ | 16.35 | | $ | 19.20 | | $ | 17.06 | |
| Total Return (%)2 | | | 16.36 | | | 7.16 | | | (0.80 | ) | | 13.47 | | | 23.58 | | | | 15.43 | | | 6.38 | | | (1.49 | ) | | 12.61 | | | 22.69 | | | | 16.60 | | | 7.44 | | | (0.51 | ) | | 13.74 | | | 23.86 | |
| Ratios/Supplemental Data: | | | | | | | | | | | | | | | | | | | | | | | | | | | | | | | | | | | | | | | | | | | | | | | | |
| Net Assets at end of period (in 000’s) | | $ | 68,522 | | $ | 62,757 | | $ | 63,566 | | $ | 70,495 | | $ | 67,048 | | | $ | 3,318 | | $ | 3,586 | | $ | 4,096 | | $ | 4,867 | | $ | 5,222 | | | $ | 19,187 | | $ | 36,721 | | $ | 109,546 | | $ | 128,456 | | $ | 132,206 | |
| Ratios of expenses to average net assets (%) | | | 1.16 | | | 1.17 | | | 1.16 | | | 1.16 | | | 1.16 | | | | 1.91 | | | 1.92 | | | 1.91 | | | 1.91 | | | 1.91 | | | | 0.91 | | | 0.92 | | | 0.91 | | | 0.91 | | | 0.91 | |
Ratio of net investment income (loss) to average net assets (%) | | | 1.65 | | | 1.02 | | | 0.47 | | | 0.69 | | | 1.12 | | | | 0.88 | | | 0.27 | | | (0.27 | ) | | (0.06 | ) | | 0.40 | | | | 1.74 | | | 1.33 | | | 0.73 | | | 0.92 | | | 1.33 | |
| Portfolio turnover (%)3 | | | 86 | | | 74 | | | 97 | | | 85 | | | 33 | | | | 86 | | | 74 | | | 97 | | | 85 | | | 33 | | | | 86 | | | 74 | | | 97 | | | 85 | | | 33 | |
| | | INVESTORS FUND* |
| | | | |
| | | CLASS A | | | | | | | | CLASS Y | | CLASS R6 |
| | | | |
| | | Year Ended October 31 | | Inception
to
10/31/137 | | Period Ended October 31 | | Year Ended
December 31, | | | Year Ended October 31, | | Inception
to
10/31/137 | |
| | | | | | | | | | | | |
| | | 2017 | | 2016 | | 2015 | | | 2014 | | | 2017 | | 2016 | | 2015 | | 2014 | | 20138 | | 2012 | | 2017 | | 2016 | | 2015 | | 2014 | |
| | | | | | | | | | | | | | |
Net Asset Value at beginning of period | | $ | 19.57 | | $ | 21.30 | | $ | 25.01 | | $ | 22.49 | | $ | 22.06 | | $ | 19.62 | | $ | 21.36 | | $ | 25.07 | | $ | 22.50 | | $ | 18.56 | | $ | 16.40 | | $ | 19.74 | | $ | 21.47 | | $ | 25.14 | | $ | 22.51 | | $ | 22.06 | |
| | | | | | | | | | | | | | | | | | | | | | | | | | | | | | | | | | | | | | | | | | | | | | | | | | |
Income from Investment Operations: | | | | | | | | | | | | | | | | | | | | | | | | | | | | | | | | | | | | | | | | | | | | | | | | | |
Net investment income (loss)1 | | | 0.03 | | | (0.00 | )6,9 | | 0.09 | | | 0.03 | | | – | | | 0.09 | | | 0.06 | 9 | | 0.16 | | | 0.12 | | | 0.10 | | | 0.13 | | | 0.13 | | | 0.11 | 9 | | 0.15 | | | 0.17 | | | – | |
Net realized and unrealized gain (loss) on investments | | | 4.23 | | | 1.18 | | | 1.06 | | | 3.18 | | | 0.43 | | | 4.24 | | | 1.17 | | | 1.05 | | | 3.15 | | | 3.94 | | | 2.17 | | | 4.26 | | | 1.17 | | | 1.10 | | | 3.16 | | | 0.45 | |
| | | | | | | | | | | | | | |
Total from investment operations | | | 4.26 | | | 1.18 | | | 1.15 | | | 3.21 | | | 0.43 | | | 4.33 | | | 1.23 | | | 1.21 | | | 3.27 | | | 4.04 | | | 2.30 | | | 4.39 | | | 1.28 | | | 1.25 | | | 3.33 | | | 0.45 | |
| | | | | | | | | | | | | | | | | | | | | | | | | | | | | | | | | | | | | | | | | | | | | | | | | | |
Less Distributions From: | | | | | | | | | | | | | | | | | | | | | | | | | | | | | | | | | | | | | | | | | | | | | | | | | |
Net investment income | | | – | | | (0.12 | ) | | (0.06 | ) | | (0.01 | ) | | – | | | (0.05 | ) | | (0.18 | ) | | (0.12 | ) | | (0.02 | ) | | (0.10 | ) | | (0.14 | ) | | (0.08 | ) | | (0.22 | ) | | (0.12 | ) | | (0.02 | ) | | – | |
Capital gains | | | (0.61 | ) | | (2.79 | ) | | (4.80 | ) | | (0.68 | ) | | – | | | (0.61 | ) | | (2.79 | ) | | (4.80 | ) | | (0.68 | ) | | – | | | – | | | (0.61 | ) | | (2.79 | ) | | (4.80 | ) | | (0.68 | ) | | – | |
| | | | | | | | | | | | | | |
Total distributions | | | (0.61 | ) | | (2.91 | ) | | (4.86 | ) | | (0.69 | ) | | – | | | (0.66 | ) | | (2.97 | ) | | (4.92 | ) | | (0.70 | ) | | (0.10 | ) | | (0.14 | ) | | (0.69 | ) | | (3.01 | ) | | (4.92 | ) | | (0.70 | ) | | – | |
Net increase (decrease) in net asset value | | | 3.65 | | | (1.73 | ) | | (3.71 | ) | | 2.52 | | | 0.43 | | | 3.67 | | | (1.74 | ) | | (3.71 | ) | | 2.57 | | | 3.94 | | | 2.16 | | | 3.70 | | | (1.73 | ) | | (3.67 | ) | | 2.63 | | | 0.45 | |
| Net Asset Value at end of period | | $ | 23.22 | | $ | 19.57 | | $ | 21.30 | | $ | 25.01 | | $ | 22.49 | | $ | 23.29 | | $ | 19.62 | | $ | 21.36 | | $ | 25.07 | | $ | 22.50 | | $ | 18.56 | | $ | 23.44 | | $ | 19.74 | | $ | 21.47 | | $ | 25.14 | | $ | 22.51 | |
| Total Return (%)2 | | | 22.30 | | | 6.46 | | | 4.78 | | | 14.55 | | | 1.95 | 4 | | 22.62 | | | 6.69 | | | 5.07 | | | 14.84 | | | 21.78 | 4 | | 14.05 | | | 22.87 | | | 6.92 | | | 5.25 | | | 15.10 | | | 2.04 | 4 |
| Ratios/Supplemental Data: | | | | | | | | | | | | | | | | | | | | | | | | | | | | | | | | | | | | | | | | | | | | | | | | | |
| Net Assets at end of period (in 000’s) | | $ | 77,891 | | $ | 67,479 | | $ | 2,189 | | $ | 1,340 | | $ | 280 | | $ | 222,363 | | $ | 204,962 | | $ | 109,506 | | $ | 166,819 | | $ | 196,164 | | $ | 35,176 | | $ | 6,898 | | $ | 6,198 | | $ | 6,589 | | $ | 5,200 | | $ | 7,234 | |
| Ratios of expenses to average net assets: | | | | | | | | | | | | | | | | | | | | | | | | | | | | | | | | | | | | | | | | | | | | | | | | | |
Before reimbursement of expenses by Adviser (%) | | | 1.20 | | | 1.20 | | | 1.31 | | | 1.28 | | | 1.20 | 5 | | 0.95 | | | 0.98 | | | 1.06 | | | 1.02 | | | 1.04 | 5 | | 1.05 | | | 0.77 | | | 0.77 | | | 0.73 | | | 0.69 | | | 0.65 | 5 |
After reimbursement of expenses by Adviser (%) | | | 1.20 | | | 1.20 | | | 1.19 | | | 1.13 | | | 1.06 | 5 | | 0.95 | | | 0.95 | | | 0.94 | | | 0.87 | | | 0.89 | 5 | | 0.97 | | | 0.77 | | | 0.77 | | | 0.73 | | | 0.64 | | | 0.56 | 5 |
Ratio of net investment income to average net assets | | | | | | | | | | | | | | | | | | | | | | | | | | | | | | | | | | | | | | | | | | | | | | | | | |
After reimbursement of expenses by Adviser (%) | | | 0.14 | | | (0.01 | ) | | 0.38 | | | 0.15 | | | (0.22 | )5 | | 0.39 | | | 0.33 | | | 0.62 | | | 0.43 | | | 0.41 | 5 | | 0.75 | | | 0.56 | | | 0.57 | | | 0.83 | | | 0.65 | | | 0.23 | 5 |
| Portfolio turnover (%)3 | | | 33 | | | 27 | | | 33 | | | 52 | | | 34 | 4 | | 33 | | | 27 | | | 33 | | | 52 | | | 34 | 4 | | 47 | | | 33 | | | 27 | | | 33 | | | 52 | | | 34 | 4 |
| * The Financial Statements presented herein include the historical operating results of the Madison Mosaic Funds through April 19, 2013. Effective after market close on this date, the Madison Mosaic Funds reorganized into the Madison Funds. |
| 1 Net investment income (loss) calculated excluding permanent tax adjustments to undistributed net investment income. |
| 2 Total return without applicable sales charge. |
| 3 Portfolio turnover is calculated at the fund level and represents the entire fiscal year or period. |
| 4 Not annualized. |
| 5 Annualized. |
| 6 Amounts represent less than $0.005 per share. |
| 7 Class was launched on September 20, 2013. |
| 8 Effective at the close of business on April 19, 2013, the fiscal year end of the fund changed to October 31. Disclosure represents 10 months of information. |
| 9 Per share net investment income has been calculated using the average shares outstanding during the period. |
| See accompanying Notes to Financial Statements. |
| |
| |
| 53 |
Madison Funds | October 31, 2017
| |
| Financial Highlights for a Share of Beneficial Interest Outstanding |
| | | MID CAP FUND* |
| | | | |
| | | CLASS A | | | | CLASS B |
| | | | |
| | | Year Ended October 31, | | Inception
to
10/31/131 | | | | Year Ended October 31, | | Inception
to
10/31/131 | |
| | | | | | | | | |
| | | 2017 | | 2016 | | 2015 | | 2014 | | | | | 2017 | | 2016 | | 2015 | | 2014 | | |
| | | | | | | | | | | | |
| Net Asset Value at beginning of period | | $ | 8.34 | | $ | 8.59 | | $ | 9.78 | | $ | 9.48 | | $ | 8.41 | | | | $ | 7.04 | | $ | 7.38 | | $ | 8.69 | | $ | 8.55 | | $ | 7.62 | |
Income from Investment Operations: | | | | | | | | | | | | | | | | | | | | | | | | | | | | | | | | | |
Net investment loss2 | | | (0.05 | ) | | (0.04 | ) | | (0.06 | ) | | (0.04 | ) | | (0.03 | ) | | | | (0.20 | ) | | (0.14 | ) | | (0.13 | ) | | (0.14 | ) | | (0.06 | ) |
Net realized and unrealized gain on investments | | | 1.46 | | | 0.29 | | | 0.61 | | | 1.01 | | | 1.10 | | | | | 1.32 | | | 0.30 | | | 0.56 | | | 0.95 | | | 0.99 | |
| | | | | | | | | | | | |
Total from investment operations | | | 1.41 | | | 0.25 | | | 0.55 | | | 0.97 | | | 1.07 | | | | | 1.12 | | | 0.16 | | | 0.43 | | | 0.81 | | | 0.93 | |
Less Distributions From: | | | | | | | | | | | | | | | | | | | | | | | | | | | | | | | | | |
Capital gains | | | (0.38 | ) | | (0.50 | ) | | (1.74 | ) | | (0.67 | ) | | – | | | | | (0.38 | ) | | (0.50 | ) | | (1.74 | ) | | (0.67 | ) | | – | |
| | | | | | | | | | | | |
Total distributions | | | (0.38 | ) | | (0.50 | ) | | (1.74 | ) | | (0.67 | ) | | – | | | | | (0.38 | ) | | (0.50 | ) | | (1.74 | ) | | (0.67 | ) | | – | |
| Net increase (decrease) in net asset value | | | 1.03 | | | (0.25 | ) | | (1.19 | ) | | 0.30 | | | 1.07 | | | | | 0.74 | | | (0.34 | ) | | (1.31 | ) | | 0.14 | | | 0.93 | |
| Net Asset Value at end of period | | $ | 9.37 | | $ | 8.34 | | $ | 8.59 | | $ | 9.78 | | $ | 9.48 | | | | $ | 7.78 | | $ | 7.04 | | $ | 7.38 | | $ | 8.69 | | $ | 8.55 | |
| Total Return (%)3 | | | 17.40 | | | 3.12 | | | 5.80 | | | 10.65 | | | 12.72 | 4 | | | | 16.46 | | | 2.38 | | | 5.06 | | | 9.89 | | | 12.20 | 4 |
| Ratios/Supplemental Data: | | | | | | | | | | | | | | | | | | | | | | | | | | | | | | | | | |
| Net Assets at end of period (in 000’s) | | $ | 59,175 | | $ | 52,482 | | $ | 54,000 | | $ | 57,117 | | $ | 56,578 | | | | $ | 2,550 | | $ | 2,832 | | $ | 3,401 | | $ | 4,235 | | $ | 5,476 | |
| Ratios of expenses to average net assets (%) | | | 1.40 | | | 1.41 | | | 1.40 | | | 1.40 | | | 1.40 | 5 | | | | 2.15 | | | 2.16 | | | 2.15 | | | 2.15 | | | 2.15 | 5 |
| Ratio of net investment income (loss) to average net assets (%) | | | (0.53 | ) | | (0.47 | ) | | (0.72 | ) | | (0.42 | ) | | (0.64 | )5 | | | | (1.28 | ) | | (1.23 | ) | | (1.47 | ) | | (1.19 | ) | | (1.39 | )5 |
| Portfolio turnover (%)6 | | | 22 | | | 27 | | | 28 | | | 33 | | | 21 | 4 | | | | 22 | | | 27 | | | 28 | | | 33 | | | 21 | 4 |
| | | MID CAP FUND* |
| | | | |
| | | CLASS Y | | | | | | | CLASS R6 |
| | | | |
| | | Year Ended October 31, | | | Year
Ended
12/31/127 | | | Year Ended October 31, | | Period
Ended
12/31/127,9 | |
| | | | | | | | | | |
| | | 2017 | | 2016 | | 2015 | | 2014 | | 20138 | | | | | 2017 | | 2016 | | 2015 | | 2014 | | 20138 | | |
| | | | | | | | | | | | |
| Net Asset Value at beginning of period | | $ | 8.64 | | $ | 8.85 | | $ | 10.00 | | $ | 9.66 | | $ | 8.31 | | | $ | 7.45 | | | $ | 8.77 | | $ | 8.95 | | $ | 10.06 | | $ | 9.68 | | $ | 8.30 | | $ | 7.42 | |
Income from Investment Operations: | | | | | | | | | | | | | | | | | | | | | | | | | | | | | | | | | | | | | | | |
Net investment income (loss)2 | | | (0.01 | ) | | 0.00 | 10 | | (0.04 | ) | | (0.02 | ) | | (0.02 | ) | | | – | | | | 0.01 | | | 0.02 | | | (0.05 | ) | | 0.02 | | | 0.01 | | | 0.08 | |
Net realized and unrealized gain on investments | | | 1.51 | | | 0.29 | | | 0.63 | | | 1.03 | | | 2.11 | | | | 1.17 | | | | 1.54 | | | 0.30 | | | 0.68 | | | 1.03 | | | 2.11 | | | 1.12 | |
| | | | | | | | | | | | |
Total from investment operations | | | 1.50 | | | 0.29 | | | 0.59 | | | 1.01 | | | 2.09 | | | | 1.17 | | | | 1.55 | | | 0.32 | | | 0.63 | | | 1.05 | | | 2.12 | | | 1.20 | |
| | | | | | | | | | | | | | | | | | | | | | | | | | | | | | | | | | | | | | | | |
Less Distributions From: | | | | | | | | | | | | | | | | | | | | | | | | | | | | | | | | | | | | | | | |
Net investment income | | | – | | | – | | | – | | | – | | | – | | | | – | | | | — | | | – | | | – | | | – | | | – | | | (0.01 | ) |
Capital gains | | | (0.38 | ) | | (0.50 | ) | | (1.74 | ) | | (0.67 | ) | | (0.74 | ) | | | (0.31 | ) | | | (0.38 | ) | | (0.50 | ) | | (1.74 | ) | | (0.67 | ) | | (0.74 | ) | | (0.31 | ) |
| | | | | | | | | | | | |
Total distributions | | | (0.38 | ) | | (0.50 | ) | | (1.74 | ) | | (0.67 | ) | | (0.74 | ) | | | (0.31 | ) | | | (0.38 | ) | | (0.50 | ) | | (1.74 | ) | | (0.67 | ) | | (0.74 | ) | | (0.32 | ) |
| Net increase (decrease) in net asset value | | | 1.12 | | | (0.21 | ) | | (1.15 | ) | | 0.34 | | | 1.35 | | | | 0.86 | | | | 1.17 | | | (0.18 | ) | | (1.11 | ) | | 0.38 | | | 1.38 | | | 0.88 | |
| Net Asset Value at end of period | | $ | 9.76 | | $ | 8.64 | | $ | 8.85 | | $ | 10.00 | | $ | 9.66 | | | $ | 8.31 | | | $ | 9.94 | | $ | 8.77 | | $ | 8.95 | | $ | 10.06 | | $ | 9.68 | | $ | 8.30 | |
| Total Return (%)3 | | | 17.85 | | | 3.50 | | | 6.13 | | | 10.88 | | | 22.68 | 4 | | | 15.69 | | | | 18.17 | | | 3.81 | | | 6.55 | | | 11.29 | | | 23.05 | 4 | | 7.34 | 4 |
| Ratios/Supplemental Data: | | | | | | | | | | | | | | | | | | | | | | | | | | | | | | | | | | | | | | | |
| Net Assets at end of period (in 000’s) | | $ | 270,989 | | $ | 242,308 | | $ | 198,605 | | $ | 224,181 | | $ | 255,263 | | | $ | 168,428 | | | $ | 11,713 | | $ | 8,792 | | $ | 9,874 | | $ | 5,118 | | $ | 6,270 | | $ | 4,856 | |
| Ratios of expenses to average net assets (%) | | | 0.98 | | | 1.08 | | | 1.15 | | | 1.15 | | | 1.15 | 5 | | | 1.20 | | | | 0.77 | | | 0.78 | | | 0.77 | | | 0.77 | | | 0.77 | 5 | | 0.76 | 5 |
| Ratio of net investment income (loss) to average net assets (%) | | | (0.11 | ) | | (0.14 | ) | | (0.47 | ) | | (0.17 | ) | | (0.29 | )5 | | | 0.00 | | | | 0.10 | | | 0.16 | | | (0.09 | ) | | 0.20 | | | 0.11 | 5 | | 1.19 | 5 |
| Portfolio turnover (%)6 | | | 22 | | | 27 | | | 28 | | | 33 | | | 21 | 4 | | | 28 | | | | 22 | | | 27 | | | 28 | | | 33 | | | 21 | 4 | | 28 | 4 |
| * The Financial Statements presented herein include the historical operating results of the Madison Mosaic Funds through April 19, 2013. Effective after market close on this date, the Madison Mosaic Funds reorganized into the Madison Funds. |
| 1 For accounting purposes, the Mid-Cap Fund Class A & B are treated as having commenced investment operations at the close of business on April 19, 2013. |
| 2 Net investment income (loss) calculated excluding permanent tax adjustments to undistributed net investment income. |
| 3 Total return without applicable sales charge. |
| 4 Not annualized. |
| 5 Annualized. |
| 6 Portfolio turnover is calculated at the fund level and represents the entire fiscal year or period. |
| 7 The financial highlights prior to April 22, 2013 are those of the Madison Mosaic Mid Cap Fund, the accounting survivor of the reorganization of the Madison Mid Cap and Madison Mosaic Mid Cap Funds. The net asset values and other per share information of the Madison Mosaic Mid Cap Fund have been restated by the conversion ratio of 1.5634 for Class Y shares to reflect those of the legal survivor of the reorganization, the Madison Mosaic Mid Cap Fund, which was renamed the Madison Mid Cap Fund after reorganization. |
| 8 Effective at the close of business on April 19, 2013, the fiscal year end of the fund changed to October 31. Disclosure represents 10 months of information. |
| 9 Class was launched on February 29, 2012. |
| 10 Amounts represent less than $0.005 per share. |
| See accompanying Notes to Financial Statements. |
| |
| |
| 54 |
Madison Funds | October 31, 2017
| |
| Financial Highlights for a Share of Beneficial Interest Outstanding |
| | | SMALL CAP FUND |
| | | | |
| | | CLASS A | | | | CLASS B | | | | CLASS Y | |
| | | | | | | | | | | | |
| | | Year Ended October 31, | | | | Year Ended October 31, | | | | Year Ended October 31, | |
| | | | | | | | | | | | |
| | | 2017 | | 2016 | | 2015 | | 2014 | | 2013 | | | | 2017 | | 2016 | | 2015 | | 2014 | | 2013 | | | | 2017 | | 2016 | | 2015 | | 2014 | | 2013 | |
| | | | | | | | | | | | |
| Net Asset Value at beginning of period | | $ | 14.58 | | $ | 14.98 | | $ | 15.21 | | $ | 14.87 | | $ | 11.81 | | | | $ | 13.75 | | $ | 14.25 | | $ | 14.58 | | $ | 14.38 | | $ | 11.45 | | | | $ | 14.63 | | $ | 15.03 | | $ | 15.26 | | $ | 14.88 | | $ | 11.82 | |
Income from Investment Operations: | | | | | | | | | | | | | | | | | | | | | | | | | | | | | | | | | | | | | | | | | | | | | | | | | | |
Net investment income (loss)1 | | | 0.11 | | | 0.04 | | | 0.02 | | | 0.06 | | | 0.02 | | | | | (0.05 | ) | | (0.10 | ) | | (0.14 | ) | | (0.05 | ) | | (0.06 | ) | | | | 0.18 | | | 0.07 | | | 0.04 | | | 0.07 | | | 0.02 | |
Net realized and unrealized gain on investments | | | 2.79 | | | 0.11 | | | 0.58 | | | 0.88 | | | 3.68 | | | | | 2.67 | | | 0.13 | | | 0.60 | | | 0.85 | | | 3.56 | | | | | 2.78 | | | 0.10 | | | 0.60 | | | 0.91 | | | 3.71 | |
| | | | | | | | | | | | |
Total from investment operations | | | 2.90 | | | 0.15 | | | 0.60 | | | 0.94 | | | 3.70 | | | | | 2.62 | | | 0.03 | | | 0.46 | | | 0.80 | | | 3.50 | | | | | 2.96 | | | 0.17 | | | 0.64 | | | 0.98 | | | 3.73 | |
| | | | | | | | | | | | | | | | | | | | | | | | | | | | | | | | | | | | | | | | | | | | | | | | | | | |
Less Distributions From: | | | | | | | | | | | | | | | | | | | | | | | | | | | | | | | | | | | | | | | | | | | | | | | | | | |
Net investment income | | | (0.02 | ) | | (0.02 | ) | | (0.04 | ) | | – | | | (0.09 | ) | | | | – | | | – | | | – | | | – | | | (0.02 | ) | | | | (0.07 | ) | | (0.04 | ) | | (0.08 | ) | | (0.00 | )4 | | (0.12 | ) |
Capital gains | | | (0.50 | ) | | (0.53 | ) | | (0.79 | ) | | (0.60 | ) | | (0.55 | ) | | | | (0.50 | ) | | (0.53 | ) | | (0.79 | ) | | (0.60 | ) | | (0.55 | ) | | | | (0.50 | ) | | (0.53 | ) | | (0.79 | ) | | (0.60 | ) | | (0.55 | ) |
| | | | | | | | | | | | |
Total distributions | | | (0.52 | ) | | (0.55 | ) | | (0.83 | ) | | (0.60 | ) | | (0.64 | ) | | | | (0.50 | ) | | (0.53 | ) | | (0.79 | ) | | (0.60 | ) | | (0.57 | ) | | | | (0.57 | ) | | (0.57 | ) | | (0.87 | ) | | (0.60 | ) | | (0.67 | ) |
| Net increase (decrease) in net asset value | | | 2.38 | | | (0.40 | ) | | (0.23 | ) | | 0.34 | | | 3.06 | | | | | 2.12 | | | (0.50 | ) | | (0.33 | ) | | 0.20 | | | 2.93 | | | | | 2.39 | | | (0.40 | ) | | (0.23 | ) | | 0.38 | | | 3.06 | |
| Net Asset Value at end of period | | $ | 16.96 | | $ | 14.58 | | $ | 14.98 | | $ | 15.21 | | $ | 14.87 | | | | $ | 15.87 | | $ | 13.75 | | $ | 14.25 | | $ | 14.58 | | $ | 14.38 | | | | $ | 17.02 | | $ | 14.63 | | $ | 15.03 | | $ | 15.26 | | $ | 14.88 | |
| Total Return (%)2 | | | 19.94 | | | 1.00 | | | 3.90 | | | 6.45 | | | 32.85 | | | | | 19.06 | | | 0.21 | | | 3.10 | | | 5.66 | | | 31.92 | | | | | 20.25 | | | 1.18 | | | 4.16 | | | 6.72 | | | 33.17 | |
| Ratios/Supplemental Data: | | | | | | | | | | | | | | | | | | | | | | | | | | | | | | | | | | | | | | | | | | | | | | | | | | |
| | | | | | | | | | | | | | | | | | | | | | | | | | | | | | | | | | | | | | | | | | | | | | | | | | | |
| Net Assets at end of period (in 000’s) | | $ | 3,890 | | $ | 3,168 | | $ | 3,435 | | $ | 3,639 | | $ | 4,566 | | | | $ | 416 | | $ | 392 | | $ | 437 | | $ | 522 | | $ | 497 | | | | $ | 90,637 | | $ | 91,448 | | $ | 83,728 | | $ | 60,279 | | $ | 45,217 | |
| Ratios of expenses to average net assets (%) | | | 1.50 | | | 1.51 | | | 1.50 | | | 1.50 | | | 1.50 | | | | | 2.25 | | | 2.26 | | | 2.25 | | | 2.25 | | | 2.25 | | | | | 1.25 | | | 1.26 | | | 1.25 | | | 1.25 | | | 1.25 | |
| Ratio of net investment income (loss) to average net assets (%) | | | 0.68 | | | 0.24 | | | 0.09 | | | 0.35 | | | 0.14 | | | | | (0.07 | ) | | (0.51 | ) | | (0.66 | ) | | (0.40 | ) | | (0.62 | ) | | | | 0.95 | | | 0.49 | | | 0.32 | | | 0.59 | | | 0.28 | |
| Portfolio turnover (%)3 | | | 20 | | | 19 | | | 19 | | | 29 | | | 22 | | | | | 20 | | | 19 | | | 19 | | | 29 | | | 22 | | | | | 20 | | | 19 | | | 19 | | | 29 | | | 22 | |
| | | INTERNATIONAL STOCK FUND |
| | | | |
| | | CLASS A | | | | CLASS B | | | | CLASS Y | |
| | | | | | | | | | | | |
| | | Year Ended October 31, | | | | Year Ended October 31, | | | | Year Ended October 31, | |
| | | | | | | | | | | | |
| | | 2017 | | 2016 | | 2015 | | 2014 | | 2013 | | | | 2017 | | 2016 | | 2015 | | 2014 | | 2013 | | | | 2017 | | 2016 | | 2015 | | 2014 | | 2013 | |
| | | | | | | | | | | | |
| Net Asset Value at beginning of period | | $ | 12.03 | | $ | 12.99 | | $ | 13.20 | | $ | 13.16 | | $ | 10.81 | | | | $ | 11.73 | | $ | 12.68 | | $ | 12.89 | | $ | 12.87 | | $ | 10.58 | | | | $ | 12.05 | | $ | 13.00 | | $ | 13.22 | | $ | 13.18 | | $ | 10.82 | |
Income from Investment Operations: | | | | | | | | | | | | | | | | | | | | | | | | | | | | | | | | | | | | | | | | | | | | | | | | | | |
Net investment income (loss)1 | | | 0.10 | | | 0.12 | | | 0.12 | | | 0.16 | | | 0.13 | | | | | 0.00 | | | 0.03 | | | 0.03 | | | 0.10 | | | 0.07 | | | | | 0.34 | | | 0.14 | | | (0.05 | ) | | 0.73 | | | 0.13 | |
Net realized and unrealized gain (loss) on investments | | | 2.01 | | | (0.97 | ) | | (0.02 | ) | | (0.02 | ) | | 2.35 | | | | | 1.97 | | | (0.95 | ) | | (0.03 | ) | | (0.06 | ) | | 2.28 | | | | | 1.82 | | | (0.95 | ) | | 0.17 | | | (0.56 | ) | | 2.38 | |
| | | | | | | | | | | | |
Total from investment operations | | | 2.11 | | | (0.85 | ) | | 0.10 | | | 0.14 | | | 2.48 | | | | | 1.97 | | | (0.92 | ) | | – | | | 0.04 | | | 2.35 | | | | | 2.16 | | | (0.81 | ) | | 0.12 | | | 0.17 | | | 2.51 | |
| | | | | | | | | | | | | | | | | | | | | | | | | | | | | | | | | | | | | | | | | | | | | | | | | | | |
Less Distributions From: | | | | | | | | | | | | | | | | | | | | | | | | | | | | | | | | | | | | | | | | | | | | | | | | | | |
Net investment income | | | (0.14 | ) | | (0.11 | ) | | (0.31 | ) | | (0.10 | ) | | (0.13 | ) | | | | (0.07 | ) | | (0.03 | ) | | (0.21 | ) | | (0.02 | ) | | (0.06 | ) | | | | (0.17 | ) | | (0.14 | ) | | (0.34 | ) | | (0.13 | ) | | (0.15 | ) |
| | | | | | | | | | | | |
Total distributions | | | (0.14 | ) | | (0.11 | ) | | (0.31 | ) | | (0.10 | ) | | (0.13 | ) | | | | (0.07 | ) | | (0.03 | ) | | (0.21 | ) | | (0.02 | ) | | (0.06 | ) | | | | (0.17 | ) | | (0.14 | ) | | (0.34 | ) | | (0.13 | ) | | (0.15 | ) |
| Net increase (decrease) in net asset value | | | 1.97 | | | (0.96 | ) | | (0.21 | ) | | 0.04 | | | 2.35 | | | | | 1.90 | | | (0.95 | ) | | (0.21 | ) | | 0.02 | | | 2.29 | | | | | 1.99 | | | (0.95 | ) | | (0.22 | ) | | 0.04 | | | 2.36 | |
| Net Asset Value at end of period | | $ | 14.00 | | $ | 12.03 | | $ | 12.99 | | $ | 13.20 | | $ | 13.16 | | | | $ | 13.63 | | $ | 11.73 | | $ | 12.68 | | $ | 12.89 | | $ | 12.87 | | | | $ | 14.04 | | $ | 12.05 | | $ | 13.00 | | $ | 13.22 | | $ | 13.18 | |
| Total Return (%)2 | | | 17.79 | | | (6.60 | ) | | 0.83 | | | 1.09 | | | 23.11 | | | | | 16.89 | | | (7.27 | ) | | 0.06 | | | 0.31 | | | 22.26 | | | | | 18.18 | | | (6.40 | ) | | 1.09 | | | 1.29 | | | 23.44 | |
| Ratios/Supplemental Data: | | | | | | | | | | | | | | | | | | | | | | | | | | | | | | | | | | | | | | | | | | | | | | | | | | |
| Net Assets at end of period (in 000’s) | | $ | 20,520 | | $ | 18,573 | | $ | 21,072 | | $ | 23,012 | | $ | 24,571 | | | | $ | 1,195 | | $ | 1,288 | | $ | 1,692 | | $ | 2,061 | | $ | 2,946 | | | | $ | 10,098 | | $ | 15,398 | | $ | 15,566 | | $ | 7,938 | | $ | 34,634 | |
| Ratios of expenses to average net assets (%) | | | 1.60 | | | 1.61 | | | 1.60 | | | 1.60 | | | 1.60 | | | | | 2.35 | | | 2.36 | | | 2.35 | | | 2.35 | | | 2.35 | | | | | 1.35 | | | 1.36 | | | 1.35 | | | 1.35 | | | 1.35 | |
| Ratio of net investment income to average net assets (%) | | | 0.82 | | | 1.00 | | | 0.88 | | | 1.13 | | | 1.02 | | | | | 0.05 | | | 0.21 | | | 0.10 | | | 0.29 | | | 0.28 | | | | | 1.06 | | | 1.21 | | | 1.27 | | | 1.65 | | | 1.26 | |
| Portfolio turnover (%)3 | | | 32 | | | 34 | | | 45 | | | 44 | | | 53 | | | | | 32 | | | 34 | | | 45 | | | 44 | | | 53 | | | | | 32 | | | 34 | | | 45 | | | 44 | | | 53 | |
| 1 Net investment income (loss) calculated excluding permanent tax adjustments to undistributed net investment income. |
| 2 Total return without applicable sales charge. |
| 3 Portfolio turnover is calculated at the fund level and represents the entire fiscal year or period. |
| 4 Amounts represent less than $0.005 per share. |
| See accompanying Notes to Financial Statements. |
| |
| |
| 55 |
Madison Funds | October 31, 2017
Notes to the Financial Statements
1. ORGANIZATION
Madison Funds, a Delaware statutory trust (the “Trust”), is registered under the Investment Company Act of 1940, as amended (the “1940 Act”), as a diversified, open-end, management investment company. As of the date of this report, the Trust offers eighteen funds (individually, a “Fund,” collectively, the “Funds”).
The Declaration of Trust permits the Trustees to issue an unlimited number of shares of beneficial interest of the Trust without par value. The Trust has entered into an Investment Advisory Agreement with Madison Asset Management, LLC (the “Investment Adviser” or “Madison”). The Investment Adviser, in turn, has entered into subadvisory agreements with certain subadvisers (“Subadvisers”) for the management of the investments of the Small Cap Fund and International Stock Fund.
The accompanying financial statements include the Government Money Market, Tax-Free Virginia, Tax-Free National, High Quality Bond, Core Bond, Corporate Bond, High Income, Diversified Income, Covered Call & Equity Income, Dividend Income, Large Cap Value, Investors, Mid Cap, Small Cap and International Stock (collectively, the “Core Funds”), and the Conservative Allocation, Moderate Allocation, and Aggressive Allocation Funds (collectively, the “Allocation Funds”).
The Government Money Market Fund offers two classes of shares: Class A and B. The High Income, Large Cap Value, Small Cap, and International Stock Funds offer three classes of shares: Class A, B and Y. The Diversified Income Fund and Allocation Funds offer three classes of shares: Class A, B and C. The Investors Fund offers three classes of shares: Class A, Y and R6. The Core Bond Fund and Mid Cap Fund offer four classes of shares: Class A, B, Y and R6. The Covered Call & Equity Income Fund offers four classes of shares: Class A, C, Y and R6. The Tax-Free Virginia, Tax-Free National, High Quality Bond, Corporate Bond and Dividend Income Funds offer one class of shares: Class Y. Each class of shares represents an interest in the assets of the respective fund and has identical voting, dividend, liquidation and other rights, except that each class of shares bears its own distribution fees and servicing fees, if any, and its proportional share of fund level expenses, is subject to its own sales charges, if any, and has exclusive voting rights on matters pertaining to Rule 12b-1 of the 1940 Act as it relates to that class and other class-specific matters.
As of February 1, 2017 Class B shares of the funds are no longer available for purchase.
2. SIGNIFICANT ACCOUNTING POLICIES
The preparation of financial statements requires management to make estimates and assumptions that affect the reported amounts of assets and liabilities and disclosure of contingent assets and liabilities at the date of the financial statements and the reported amounts of income and expenses during the reported period. Actual results could differ from those estimates.
Each fund is an investment company and accordingly follows the investment company accounting and reporting guidance of the Financial Accounting Standards Board (FASB) Accounting Standard Codification Topic 946 “Financial Services - Investment Companies.”
The following is a summary of significant accounting policies consistently followed by each fund in the preparation of its financial statements.
Portfolio Valuation: Equity securities, including American Depositary Receipts (“ADRs”), Global Depositary Receipts (“GDRs”) and exchange-traded funds (“ETFs”) listed on any U.S. or foreign stock exchange or quoted on the National Association of Securities Dealers Automated Quotation System (“NASDAQ”) are valued at the last quoted sale price or official closing price on that exchange or NASDAQ on the valuation day (provided that, for securities traded on NASDAQ, the funds utilize the NASDAQ Official Closing Price (“NOCP”)). If no sale occurs, equities traded on a U.S. exchange, foreign exchange or on NASDAQ are valued at the bid price. Debt securities purchased (other than short-term obligations) with a remaining maturity of 61 days or more are valued on the basis of last available bid prices or current market quotations provided by dealers or pricing services approved by the Trust. In determining the value of a particular investment, pricing services may use certain information with respect to transactions in such investments, quotations from dealers, pricing matrixes, market transactions in comparable investments, various relationships observed in the market between investments and calculated yield measurements based on valuation technology commonly employed in the market for such investments.
Municipal debt securities are traded via a network of dealers and brokers that connect buyers and sellers. Liquidity in the tax-exempt market has been reduced as a result of overall economic conditions and credit tightening. There may be little trading in the secondary market for particular bonds and other debt securities, making them more difficult to value or sell. Asset-backed and mortgage-backed securities are valued by independent pricing services using models that consider estimated cash flows of each tranche of the security, establish a benchmark yield and develop an estimated tranche specific spread to the benchmark yield based on the unique attributes of the tranche.
Investments in shares of open-end mutual funds, including money market funds, are valued at their daily net asset value (“NAV”) which is calculated as of the close of regular trading on the New York Stock Exchange (the “NYSE”), usually 4:00 p.m. Eastern Standard Time, on each day on which the NYSE is open for business. NAV per share is determined by dividing each fund’s total net assets by the number of shares of such fund outstanding at the time of calculation. Because the assets of each Allocation Fund consist primarily of shares of other registered investment companies (the “Underlying Funds”), the NAV of each fund is determined based on the NAVs of the Underlying Funds. Total net assets are determined by adding the total current value of portfolio securities, cash, receivables, and other assets and subtracting liabilities. Short-term instruments having maturities of 60 days or less and all securities in the Government Money Market Fund are valued on an amortized cost basis, which approximates market value.
Over-the-counter securities not listed or traded on NASDAQ are valued at the last sale price on the valuation day. If no sale occurs on the valuation day, an over-the-counter security is valued at the last bid price. Exchange-traded options are valued at the mean of the best bid and ask prices across all option exchanges. Financial futures contracts generally are valued at the settlement price established by the exchange(s) on which the contracts are primarily traded. Spot and forward foreign currency exchange contracts are valued based on quotations supplied by dealers in such contracts. Overnight repurchase agreements are valued at cost, and term repurchase agreements (i.e., those whose maturity exceeds seven days), swaps, caps, collars and floors, if any, are valued at the average of the closing bids obtained daily from at least one dealer.
Through the end of this reporting period, the value of all assets and liabilities expressed in foreign currencies was converted into U.S. dollar values using the then-current exchange rate at the close of regular trading on the NYSE.
All other securities for which either quotations are not readily available, no other sales have occurred, or in the Investment Adviser’s opinion, do not reflect the current market value, are appraised at their fair values as determined in good faith by the Pricing Committee (the “Committee”) and under the general supervision of the Board. When fair value pricing of securities is employed, the prices of securities used by the funds to calculate NAV may differ from market quotations or NOCP. Because the Allocation Funds primarily invest in Underlying Funds, government securities and short-term paper, it is not anticipated that the Investment Adviser will need to “fair value” any of the investments of these funds. However, an Underlying Fund may need to “fair value” one or more of its investments, which may, in turn, require
Madison Funds | Notes to the Financial Statements - continued | October 31, 2017
an Allocation Fund to do the same because of delays in obtaining the Underlying Fund’s NAV.
A fund’s investments (or Underlying Fund) will be valued at fair value if, in the judgment of the Committee, an event impacting the value of an investment occurred between the closing time of a security’s primary market or exchange (for example, a foreign exchange or market) and the time the fund’s share price is calculated as of the close of regular trading on the NYSE. Significant events may include, but are not limited to, the following: (1) significant fluctuations in domestic markets, foreign markets or foreign currencies; (2) occurrences not directly tied to the securities markets such as natural disasters, armed conflicts or significant government actions; and (3) major announcements affecting a single issuer or an entire market or market sector. In responding to a significant event, the Committee would determine the fair value of affected securities considering factors including, but not limited to: fundamental analytical data relating to the investment; the nature and duration of any restrictions on the disposition of the investment; and the forces influencing the market(s) in which the investment is purchased or sold. The Committee may rely on an independent fair valuation service to adjust the valuations of foreign equity securities based on specific market-movement parameters established by the Committee and approved by the Trust.
Recently Issued Accounting Pronouncements: In October 2016, the U.S. Securities and Exchange Commission (“SEC”) adopted new rules and forms, and amendments to certain current rules and forms, to modernize reporting and disclosure of information by registered investment companies. The amendments to Regulation S-X require standardized, enhanced disclosure about derivatives in investment company financial statements, and also change the rules governing the form and content of such financial statements. The amendments to Regulation S-X took effect on August 1, 2017 and the financial statements have been updated, as applicable.
Security Transactions and Investment Income: Security transactions are accounted for on a trade date basis. Net realized gains or losses on sales are determined by the identified cost method. Dividend income is recorded on ex-dividend date, except that certain dividends from foreign securities may be recorded after the ex-dividend date based on when the fund is informed of the dividend. Interest income is recorded on an accrual basis and is increased by the accretion of discount and decreased by the amortization of premium. Amortization and accretion are recorded on the effective yield method.
Expenses: Expenses that are directly related to one fund are charged directly to that fund. Other operating expenses are prorated to the funds on the basis of relative net assets. Class-specific expenses are borne by that class.
Classes: Income and realized and unrealized gains/losses are allocated to the respective classes on the basis of relative net assets.
Repurchase Agreements: Each fund may engage in repurchase agreements. In a repurchase agreement, a security is purchased for a relatively short period (usually not more than seven days) subject to the obligation to sell it back to the issuer at a fixed time and price plus accrued interest. The funds will enter into repurchase agreements only with members of the Federal Reserve System and with “primary dealers” in U.S. Government securities. As of October 31, 2017, none of the funds held open repurchase agreements.
The Trust has established a procedure providing that the securities serving as collateral for each repurchase agreement must be delivered to the funds’ custodian either physically or in book-entry form and that the collateral must be marked to market daily to ensure that each repurchase agreement is fully collateralized at all times. In the event of bankruptcy or other default by a seller of a repurchase agreement, a fund could experience one of the following: delays in liquidating the underlying securities during the period in which the fund seeks to enforce its rights thereto, possible decreased levels of income, declines in value of the underlying securities, or lack of access to income during this period and the expense of enforcing its rights.
Foreign Currency Transactions: The Trust’s books and records are maintained in U.S. dollars. Foreign currency-denominated transactions (i.e., market value of investment securities, assets and liabilities, purchases and sales of investment securities, and income and expenses) are translated into U.S. dollars at the current rate of exchange. The funds enter into contracts on the trade date to settle any securities transactions denominated in foreign currencies on behalf of the funds at the spot rate at settlement.
Each fund, except the Government Money Market, Tax-Free Virginia and Tax Free National Funds, reports certain foreign currency-related transactions as components of realized gains or losses for financial reporting purposes, whereas such components are treated as ordinary income for federal income tax purposes. Realized gains or losses associated with currency transactions are included in the Statements of Operations under the heading “Net realized gain (loss) on investments.” The International Stock Fund and Small Cap Fund had net realized losses of $14,797 and $950, related to foreign currency transactions, respectively.
The funds do not isolate the portion of gains and losses on investments in securities that is due to changes in the foreign exchange rates from that which is due to change in market prices of securities. Such amounts are categorized as gain or loss on investments for financial reporting purposes.
Forward Foreign Currency Exchange Contracts: Each fund, except the Government Money Market, Tax-Free Virginia and Tax Free National Funds, may purchase and sell forward foreign currency exchange contracts for defensive or hedging purposes. When entering into forward foreign currency exchange contracts, the funds agree to receive or deliver a fixed quantity of foreign currency for an agreed-upon price on an agreed future date. These contracts are valued daily. The funds’ net assets reflect unrealized gains or losses on the contracts as measured by the difference between the forward foreign currency exchange rates at the dates of entry into the contracts and the forward rates at the reporting date. The funds realize a gain or a loss at the time the forward foreign currency exchange contracts are settled or closed out with an offsetting contract. Contracts are traded over-the-counter directly with a counterparty. Realized and unrealized gains and losses are included in the Statements of Operations. As of October 31, 2017, none of the funds had open forward foreign currency exchange contracts.
If a fund enters into a forward foreign currency exchange contract to buy foreign currency for any purpose, the fund will be required to place cash or other liquid assets in a segregated account with the fund’s custodian in an amount equal to the value of the fund’s total assets committed to the consummation of the forward contract. If the value of the securities in the segregated account declines, additional cash or securities will be placed in the segregated account so that the value of the account will equal the amount of the fund’s commitment with respect to the contract.
Cash Concentration: At times, the funds maintain cash balances at financial institutions in excess of federally insured limits. The funds monitor this credit risk and have not experienced any losses related to this risk.
Illiquid Securities: Each fund currently limits investments in illiquid securities to 15% of net assets at the time of purchase, except for the Government Money Market Fund which is governed by the Rule 2(a)-7 liquidity guidelines. An illiquid security is generally defined as any investment that may be difficult to sell within seven days for the price at which the fund values it. At October 31, 2017, there were no illiquid securities held in the funds. Pursuant to guidelines adopted by the Board of Trustees, certain unregistered securities are determined to be liquid and are not included within the percent limitations specified above.
Madison Funds | Notes to the Financial Statements - continued | October 31, 2017
Delayed Delivery Securities: Each fund may purchase securities on a when-issued or delayed delivery basis. “When-issued” refers to securities whose terms are available and for which a market exists, but that have not been issued. For when-issued or delayed delivery transactions, no payment is made until delivery date, which is typically longer than the normal course of settlement. When a fund enters into an agreement to purchase securities on a when-issued or delayed delivery basis, the fund segregates cash or other liquid securities, of any type or maturity, equal in value to the fund’s commitment. Losses may arise due to changes in the market value of the underlying securities, if the counterparty does not perform under the contract, or if the issuer does not issue the securities due to political, economic or other factors. As of October 31, 2017, the Core Bond Fund and Diversified Income Fund had entered into such transactions, the market values of which are identified in the fund’s Portfolio of Investments.
Indemnifications: Under the funds’ organizational documents, the funds’ officers and Trustees are indemnified against certain liabilities arising out of the performance of their duties to the funds. In the normal course of business, the funds enter into contracts that contain a variety of representations and provide general indemnifications. The funds’ maximum liability exposure under these arrangements is unknown, as future claims that have not yet occurred may be made against the funds. However, based on experience, management expects the risk of loss to be remote.
Fair Value Measurements: Each fund has adopted Financial Accounting Standards Board (the “FASB”) guidance on fair value measurements. Fair value is defined as the price that each fund would receive upon selling an investment in a timely transaction to an independent buyer in the principal or most advantageous market of the investment. A three-tier hierarchy is used to maximize the use of observable market data “inputs” and minimize the use of unobservable “inputs” and to establish classification of fair value measurements for disclosure purposes. Inputs refer broadly to the assumptions that market participants would use in pricing the asset or liability, including assumptions about risk (for example, the risk inherent in a particular valuation technique used to measure fair value including such a pricing model and/or the risk inherent in the inputs used in the valuation technique). Inputs may be observable or unobservable.
Observable inputs are inputs that reflect the assumptions market participants would use in pricing the asset or liability developed based on market data obtained from sources independent of the reporting entity. Unobservable inputs are inputs that reflect the reporting entity’s own assumptions about the assumptions market participants would use in pricing the asset or liability developed based on the best information available in the circumstances. The three-tier hierarchy of inputs is summarized in the three broad Levels listed below:
Level 1 - unadjusted quoted prices in active markets for identical investments
Level 2 - other significant observable inputs (including quoted prices for similar investments, interest rate volatilities, prepayment speeds, credit risk, benchmark yields, transactions, bids, offers, new issues, spreads, and other relationships observed in the markets among comparable securities, underlying equity of the issuer; and proprietary pricing models such as yield measures calculated using factors such as cash flows, financial or collateral performance, and other reference data, etc.)
Level 3 - significant unobservable inputs (including the fund’s own assumptions in determining the fair value of investments)
The valuation techniques used by the funds to measure fair value for the year ended October 31, 2017 maximized the use of observable inputs and minimized the use of unobservable inputs. The funds utilized the following fair value techniques: multi-dimensional relational pricing model and option adjusted spread pricing; the funds estimated the price that would have prevailed in a liquid market for an international equity security given information available at the time of valuation. As of October 31, 2017, none of the funds held securities deemed as a Level 3, and there were no transfers between classification levels.
The following is a summary of the inputs used as of October 31, 2017, in valuing the funds’ investments carried at fair value (please see the Portfolio of Investments for each fund for a listing of all securities within each category):
| Fund1 | | Quoted Prices In
Active Markets
for Identical
Investments
(Level 1) | | | Significant
Other
Observable
Inputs
(Level 2) | | | Significant
Unobservable
Inputs
(Level 3) | | | Value at
10/31/17 |
| Conservative Allocation | | $ | 74,113,394 | | | | $ | – | | | | $ | – | | | | $ | 74,113,394 |
| Moderate Allocation | | | 148,379,147 | | | | | – | | | | | – | | | | | 148,379,147 |
| Aggressive Allocation | | | 65,929,379 | | | | | – | | | | | – | | | | | 65,929,379 |
| Government Money Market2 | | | 471,917 | | | | | 14,737,651 | | | | | – | | | | | 15,209,568 |
| Tax-Free Virginia | | | – | | | | | 21,353,602 | | | | | – | | | | | 21,353,602 |
| Tax-Free National | | | – | | | | | 24,508,420 | | | | | – | | | | | 24,508,420 |
| High Quality Bond | | | | | | | | | | | | | | | | | | |
Corporate Notes and Bonds | | | – | | | | | 39,137,769 | | | | | – | | | | | 39,137,769 |
U.S. Government and Agency Obligations | | | – | | | | | 59,102,892 | | | | | – | | | | | 59,102,892 |
Short-Term Investments | | | 1,479,337 | | | | | – | | | | | – | | | | | 1,479,337 |
| | | | | | | | | | | | | | | |
| | | | 1,479,337 | | | | | 98,240,661 | | | | | – | | | | | 99,719,998 |
| Core Bond | | | | | | | | | | | | | | | | | | |
Assets: | | | | | | | | | | | | | | | | | | |
Asset Backed Securities | | | – | | | | | 6,396,436 | | | | | – | | | | | 6,396,436 |
Collateralized Mortgage Obligations | | | – | | | | | 5,547,686 | | | | | – | | | | | 5,547,686 |
Commercial Mortgage-Backed Securities | | | – | | | | | 7,578,095 | | | | | – | | | | | 7,578,095 |
Corporate Notes and Bonds | | | – | | | | | 73,420,071 | | | | | – | | | | | 73,420,071 |
Long Term Municipal Bonds | | | – | | | | | 11,570,594 | | | | | – | | | | | 11,570,594 |
Mortgage Backed Securities | | | – | | | | | 44,307,805 | | | | | – | | | | | 44,307,805 |
U.S. Government and Agency Obligations | | | – | | | | | 48,277,381 | | | | | – | | | | | 48,277,381 |
Put Options Purchased | | | 28,750 | | | | | – | | | | | – | | | | | 28,750 |
Short-Term Investments | | | 8,163,139 | | | | | – | | | | | – | | | | | 8,163,139 |
| | | | | | | | | | | | | | | |
| | | | 8,191,889 | | | | | 197,098,068 | | | | | – | | | | | 205,289,957 |
Liabilities | | | | | | | | | | | | | | | | | | |
Put Options Written | | | 17,500 | | | | | – | | | | | – | | | | | 17,500 |
| | | | | | | | | | | | | | | | | | | |
| Corporate Bond | | | | | | | | | | | | | | | | | | |
Corporate Notes and Bonds | | | – | | | | | 20,668,290 | | | | | – | | | | | 20,668,290 |
Long Term Municipal Bonds | | | – | | | | | 436,690 | | | | | – | | | | | 436,690 |
Short-Term Investments | | | 537,127 | | | | | – | | | | | – | | | | | 537,127 |
| | | | | | | | | | | | | | | |
| | | | 537,127 | | | | | 21,104,980 | | | | | – | | | | | 21,642,107 |
| High Income | | | | | | | | | | | | | | | | | | |
Corporate Notes and Bonds | | | – | | | | | 21,126,035 | | | | | – | | | | | 21,126,035 |
Mutual Funds | | | 265,410 | | | | | – | | | | | – | | | | | 265,410 |
Short-Term Investments | | | 1,720,036 | | | | | – | | | | | – | | | | | 1,720,036 |
| | | | | | | | | | | | | | | |
| | | | 1,985,446 | | | | | 21,126,035 | | | | | – | | | | | 23,111,481 |
| Diversified Income | | | | | | | | | | | | | | | | | | |
Common Stocks | | | 102,620,893 | | | | | – | | | | | – | | | | | 102,620,893 |
Asset Backed Securities | | | – | | | | | 1,321,349 | | | | | – | | | | | 1,321,349 |
Collateralized Mortgage Obligations | | | – | | | | | 1,942,834 | | | | | – | | | | | 1,942,834 |
Commercial Mortgage-Backed Securities | | | – | | | | | 1,389,210 | | | | | – | | | | | 1,389,210 |
Corporate Notes and Bonds | | | – | | | | | 22,509,321 | | | | | – | | | | | 22,509,321 |
Long Term Municipal Bonds | | | – | | | | | 3,528,862 | | | | | – | | | | | 3,528,862 |
Mortgage Backed Securities | | | – | | | | | 13,794,625 | | | | | – | | | | | 13,794,625 |
U.S. Government and Agency Obligations | | | – | | | | | 15,360,321 | | | | | – | | | | | 15,360,321 |
Short-Term Investments | | | 3,350,271 | | | | | – | | | | | – | | | | | 3,350,271 |
| | | | | | | | | | | | | | | |
| | | | 105,971,164 | | | | | 59,846,522 | | | | | – | | | | | 165,817,686 |
| Covered Call & Equity Income | | | | | | | | | | | | | | | | | | |
Assets: | | | | | | | | | | | | | | | | | | |
Common Stocks | | | 102,029,061 | | | | | – | | | | | – | | | | | 102,029,061 |
Exchange Traded Funds | | | 7,693,146 | | | | | – | | | | | – | | | | | 7,693,146 |
Short-Term Investments | | | 15,647,062 | | | | | – | | | | | – | | | | | 15,647,062 |
U.S. Government and Agency Obligations | | | – | | | | | 4,989,720 | | | | | – | | | | | 4,989,720 |
| | | | | | | | | | | | | | | |
| | | | 125,369,269 | | | | | 4,989,720 | | | | | – | | | | | 130,358,989 |
Liabilities: | | | | | | | | | | | | | | | | | | |
Call Options Written | | | 2,510,594 | | | | | – | | | | | – | | | | | 2,510,594 |
Madison Funds | Notes to the Financial Statements - continued | October 31, 2017
| Fund1 | | Quoted Prices In
Active Markets
for Identical
Investments
(Level 1) | | | Significant
Other
Observable
Inputs
(Level 2) | | | Significant
Unobservable
Inputs
(Level 3) | | | Value at
10/31/17 |
| Dividend Income | | | | | | | | | | | | | | | | | | |
Common Stocks | | $ | 105,808,009 | | | | $ | – | | | | $ | – | | | | $ | 105,808,009 |
Short-Term Investments | | | 1,557,897 | | | | | – | | | | | – | | | | | 1,557,897 |
| | | | | | | | | | | | | | | |
| | | | 107,365,906 | | | | | – | | | | | – | | | | | 107,365,906 |
| Large Cap Value | | | | | | | | | | | | | | | | | | |
Common Stocks | | | 89,737,530 | | | | | – | | | | | – | | | | | 89,737,530 |
Short-Term Investments | | | 1,389,034 | | | | | – | | | | | – | | | | | 1,389,034 |
| | | | | | | | | | | | | | | |
| | | | 91,126,564 | | | | | – | | | | | – | | | | | 91,126,564 |
| Investors | | | | | | | | | | | | | | | | | | |
Common Stocks | | | 291,512,541 | | | | | – | | | | | – | | | | | 291,512,541 |
Short-Term Investments | | | 13,256,894 | | | | | – | | | | | – | | | | | 13,256,894 |
| | | | | | | | | | | | | | | |
| | | | 304,769,435 | | | | | – | | | | | – | | | | | 304,769,435 |
| Mid Cap | | | | | | | | | | | | | | | | | | |
Common Stocks | | | 319,900,423 | | | | | – | | | | | – | | | | | 319,900,423 |
Short-Term Investments | | | 25,123,090 | | | | | – | | | | | – | | | | | 25,123,090 |
| | | | | | | | | | | | | | | |
| | | | 345,023,513 | | | | | – | | | | | – | | | | | 345,023,513 |
| Small Cap | | | | | | | | | | | | | | | | | | |
Common Stocks | | | 89,139,734 | | | | | 4,131,549 | | | | | – | | | | | 93,271,283 |
Short-Term Investments | | | 1,742,685 | | | | | – | | | | | – | | | | | 1,742,685 |
| | | | | | | | | | | | | | | |
| | | | 90,882,419 | | | | | 4,131,549 | | | | | – | | | | | 95,013,968 |
| International Stock | | | | | | | | | | | | | | | | | | |
Common Stocks | | | | | | | | | | | | | | | | | | |
Australia | | | – | | | | | 229,223 | | | | | – | | | | | 229,223 |
Belgium | | | – | | | | | 854,432 | | | | | – | | | | | 854,432 |
Brazil | | | – | | | | | 299,229 | | | | | – | | | | | 299,229 |
Canada | | | – | | | | | 1,496,568 | | | | | – | | | | | 1,496,568 |
Denmark | | | – | | | | | 860,692 | | | | | – | | | | | 860,692 |
Finland | | | – | | | | | 461,547 | | | | | – | | | | | 461,547 |
France | | | – | | | | | 3,438,095 | | | | | – | | | | | 3,438,095 |
Germany | | | – | | | | | 1,381,866 | | | | | – | | | | | 1,381,866 |
Ireland | | | 1,018,166 | | | | | – | | | | | – | | | | | 1,018,166 |
Italy | | | – | | | | | 329,105 | | | | | – | | | | | 329,105 |
Japan | | | – | | | | | 5,651,046 | | | | | – | | | | | 5,651,046 |
Jersey | | | – | | | | | 1,414,990 | | | | | – | | | | | 1,414,990 |
Luxembourg | | | – | | | | | 186,266 | | | | | – | | | | | 186,266 |
Netherlands | | | – | | | | | 932,578 | | | | | – | | | | | 932,578 |
Norway | | | – | | | | | 914,149 | | | | | – | | | | | 914,149 |
Singapore | | | – | | | | | 744,731 | | | | | – | | | | | 744,731 |
Spain | | | – | | | | | 454,579 | | | | | – | | | | | 454,579 |
Sweden | | | – | | | | | 1,134,644 | | | | | – | | | | | 1,134,644 |
Switzerland | | | – | | | | | 1,325,889 | | | | | – | | | | | 1,325,889 |
Taiwan | | | 516,426 | | | | | – | | | | | – | | | | | 516,426 |
Turkey | | | – | | | | | 217,420 | | | | | – | | | | | 217,420 |
United Kingdom | | | 711,413 | | | | | 6,195,297 | | | | | – | | | | | 6,906,710 |
Short-Term Investments | | | 950,307 | | | | | – | | | | | – | | | | | 950,307 |
| | | | | | | | | | | | | | | |
| | | | 3,196,312 | | | | | 28,522,346 | | | | | – | | | | | 31,718,658 |
1See respective portfolio of investments for underlying holdings in each fund. For additional information on the underlying funds held in the Allocation Funds, including shareholder prospectuses and financial reports, please visit each underlying fund’s website or visit the Securities and Exchange Commission’s website at http://www.sec.gov.
2At October 31, 2017, all Level 2 securities held are U.S. Government and Agency Obligations. See respective Portfolio of Investments.
Derivatives: The FASB issued guidance intended to enhance financial statement disclosure for derivative instruments and hedging activities and enable investors to understand: a) how and why a fund uses derivative investments, b) how derivative instruments and related hedge fund items are accounted for, and c) how derivative instruments and related hedge items affect a fund’s financial position, results of operations and cash flows.
The following table presents the types of derivatives in the fund by location as presented on the Statements of Assets and Liabilities as of October 31, 2017.
| | Statements of Asset & Liability Presentation of Fair Values of Derivative Instruments |
| | | | | | | | | | | | | | | | | | | |
| | | | | | | | | | | | | | | | | | | |
| | | | | | | Asset Derivatives | | | | Liability Derivatives |
| | | | | | | | | | | |
| | | | | | | | | | | | | | | | | | | |
| Fund | | Derivatives
accounted
for as hedging
instruments | | | Statements of
Assets and
Liabilities
Location | | Fair
Value | | Statements of
Assets and
Liabilities
Location | | Fair
Value |
| Core Bond | | Equity contracts | | | | Options purchased | | | | $28,750 | | | | Options written | | | | $17,500 |
| | | | | | | | | | | | | | | | | | | |
| Covered Call & Equity Income | | Equity contracts | | | | Options purchased | | | | – | | | | Options written | | | | 2,510,594 |
The following table presents the effect of Derivative Instruments on the Statements of Operations for the year ended October 31, 2017.
| Fund | | Derivatives not accounted
for as hedging Instruments | | Realized Gain
on Derivatives: | | Change in Unrealized
Appreciation (Depreciation)
on Derivatives | |
| Core Bond | | Equity contracts | | $27,462 | | $7,885 | |
| | | | | | | | |
| Covered Call & | | | | | | | |
| Equity Income | | Equity contracts | | 7,026,516 | | (892,041) | |
There is no impact on the financial statements of the other funds held in the Trust as they currently do not hold derivative financial instruments.
3. ADVISORY, ADMINISTRATION AND DISTRIBUTION AGREEMENTS
Advisory Agreement. For its investment advisory services to the funds, the Investment Adviser is entitled to receive a fee, which is computed daily and paid monthly, at an annualized percentage rate of the average daily value of the net assets of each fund as follows as of October 31, 2017:
| Fund | | Advisory Fee | | | Fund | | Advisory Fee |
| | | | | | | | | | | | |
| Conservative Allocation | | | 0.20% | | | | High Income | | | 0.55% | |
| Moderate Allocation | | | 0.20% | | | | Diversified Income | | | 0.65% | |
| Aggressive Allocation | | | 0.20% | | | | Covered Call & Equity Income | | | 0.85% | |
| Government Money Market | | | 0.40% | | | | Dividend Income | | | 0.75% | |
| Tax-Free Virginia | | | 0.50% | | | | Large Cap Value | | | 0.55% | |
| Tax-Free National | | | 0.40% | | | | Investors | | | 0.75% | |
| High Quality Bond | | | 0.30% | | | | Mid Cap | | | 0.75% | |
| Core Bond | | | 0.50% | | | | Small Cap | | | 1.00% | |
| Corporate Bond | | | 0.40% | | | | International Stock | | | 1.05% | |
The Government Money Market, Core Bond, High Income, Diversified Income, Large Cap Value, Investors, Mid Cap, Small Cap, and International Stock Funds’ advisory fee will be reduced by 0.05% on assets exceeding $500 million, and by another 0.05% on assets exceeding $1 billion. The Investment Adviser is solely responsible for the payment of all fees to the Subadvisers. The Subadvisers for the funds at October 31, 2017, are Wellington Management Company, LLP for the Small Cap Fund and Lazard Asset Management LLC for the International Stock Fund.
The Investment Adviser may, from time to time, contractually or voluntarily agree to waive a portion of its fees or expenses related to the funds. In that regard, the Investment Adviser has contractually agreed to waive a portion of advisory fees on the Government Money Market Fund Class A Shares and Class B Shares until February 27, 2018, for the purpose of maintaining a one day yield of zero. The amount of the daily waiver was equal to the amount required to maintain a minimum daily distribution rate of zero. For the year ended October 31, 2017, the waivers totaled $6,884 for Class A Shares and $149 for Class B Shares and are reflected as fees waived in the accompanying Statements of Operations. A portion of the Dividend Income Fund’s advisory fee, 0.10%, is being waived by the Investment Adviser until February 27, 2018. For the year ended October 31, 2017, the waivers totaled $105,059 for the Dividend Income Fund and are reflected as fees waived in the accompanying Statements of Operations. The Investment Adviser does not have the right to recoup these waived fees.
Administrative Services Agreement. The Investment Adviser provides or arranges for each fund to have all of the necessary operational and support services it needs for a fee. These fees are computed daily and paid monthly, at an annualized percentage rate of the average daily value of the net assets of each fund as follows:
Madison Funds | Notes to the Financial Statements - continued | October 31, 2017
| Fund | | Class A | | | Class B | | | Class C | | | Class Y | | | Class R6 | |
| Conservative Allocation | | 0.25% | | | 0.25% | | | 0.25% | | | N/A | | | N/A | |
| Moderate Allocation | | 0.25% | | | 0.25% | | | 0.25% | | | N/A | | | N/A | |
| Aggressive Allocation | | 0.25% | | | 0.25% | | | 0.25% | | | N/A | | | N/A | |
| Government Money Market | | 0.15% | | | 0.15% | | | N/A | | | N/A | | | N/A | |
| Tax-Free Virginia | | N/A | | | N/A | | | N/A | | | 0.35% | | | N/A | |
| Tax-Free National | | N/A | | | N/A | | | N/A | | | 0.35% | | | N/A | |
| High Quality Bond | | N/A | | | N/A | | | N/A | | | 0.19% | | | N/A | |
| Core Bond | | 0.15% | | | 0.15% | | | N/A | | | 0.15% | | | 0.02% | |
| Corporate Bond | | N/A | | | N/A | | | N/A | | | 0.25% | | | N/A | |
| High Income | | 0.20% | | | 0.20% | | | N/A | | | 0.20% | | | N/A | |
| Diversified Income | | 0.20% | | | 0.20% | | | 0.20% | | | N/A | | | N/A | |
| Covered Call & Equity Income | | 0.15% | | | N/A | | | 0.15% | | | 0.15% | | | 0.02% | |
| Dividend Income | | N/A | | | N/A | | | N/A | | | 0.35% | | | N/A | |
| Large Cap Value | | 0.36% | | | 0.36% | | | N/A | | | 0.36% | | | N/A | |
| Investors | | 0.20% | | | N/A | | | N/A | | | 0.20% | | | 0.02% | |
| Mid Cap | | 0.40% | | | 0.40% | | | N/A | | | 0.23% | | | 0.02% | |
| Small Cap | | 0.25% | | | 0.25% | | | N/A | | | 0.25% | | | N/A | |
| International Stock | | 0.30% | | | 0.30% | | | N/A | | | 0.30% | | | N/A | |
The direct expenses of the funds’ Independent Trustees and independent auditors are paid out of this fee on behalf of the funds.
The Investment Adviser may from time to time contractually or voluntarily agree to waive a portion of its fees or expenses related to the funds. In that regard, the Investment Adviser waived a portion of service agreement fees on the Government Money Market Fund Class A Shares and Class B Shares until at least February 27, 2018. The amount of the daily waiver is equal to the amount required to maintain a minimum daily distribution rate of zero. A portion of the Dividend Income Fund’s annual service fee, 0.05% is being waived by the Investment Adviser until February 27, 2018. The waived amounts for the Government Money Market and Dividend Income Funds are reflected as fees in the accompanying Statements of Operations. For the year ended October 31, 2017 the waivers were as follows:
| | Waived Fees or Expenses* |
| | | | | | | | | |
| Fund | | Class A | | Class B | | Class Y | | Total Waivers |
| | | | | | | | | |
| Government Money Market | | $254 | | $22 | | $ – | | $ 276 |
| Dividend Income | | – | | – | | 52,530 | | 52,530 |
* The Investment Adviser does not have the right to recoup any of these waived fees.
Shareholder Service and Distribution Plans (Rule 12b-1). Madison Funds has adopted, on behalf of certain funds and share classes, distribution and/or service plans pursuant to Rule 12b-1 under the Investment Company Act of 1940, as amended (the “1940 Act”). These plans permit the funds to pay for distribution of their shares and servicing of their shareholders out of fund assets; therefore, the cost of these plans is indirectly borne by all shareholders who own shares of the affected funds and share classes. These plans are described below:
Shareholder Service Fees (Class A, B and C shares). Service plans have been adopted pursuant to Rule 12b-1 under the 1940 Act for Class A, B and C shares of each of the funds, other than the Government Money Market Fund. Under the terms of these plans, each fund pays MFD Distributor, LLC (“MFD”) a service fee equal to 0.25% of the average daily net assets attributable to each class of shares of that fund. The service fee is used by MFD to offset costs of servicing shareholder accounts or to compensate other qualified broker/dealers who sell shares of the funds pursuant to agreements with MFD for their costs of servicing shareholder accounts. MFD may retain any portion of the service fee for which there is no broker/dealer of record as partial consideration for its services with respect to shareholder accounts.
Distribution Fees (Class B and C shares only). Distribution plans have been adopted pursuant to Rule 12b-1 under 1940 Act for Class B and C shares of each of the funds. Under the terms of each plan, each fund pays its principal distributor, MFD, a fee equal to 0.75% of the average daily net assets attributable to Class B and C shares of that fund. MFD may use this fee to cover its distribution-related expenses (including commissions paid to broker/dealers for selling Class B and C shares) or distribution-related expenses of dealers. This fee increases the cost of investment in the Class B and C shares of a fund and, over time, may cost more than paying the initial sales charge for Class A shares.
The Shareholder Service & Distribution Fees are computed daily and paid monthly, at an annualized percentage rate of the average daily value of the net assets of each fund as follows:
| | | | Shareholder Servicing Fee | | Distribution Fee | | Total Shareholder Servicing
and Distribution Fees
(Rule 12b-1) |
| | | | | | | | | | | | | | | | | | | |
| Fund | | | Class A | | Class B | | Class C | | Class B | | Class C | | Class A | | Class B | | Class C | |
| Conservative Allocation | | | 0.25% | | 0.25% | | 0.25% | | 0.75% | | 0.75% | | 0.25% | | 1.00% | | 1.00% | |
| Moderate Allocation | | | 0.25% | | 0.25% | | 0.25% | | 0.75% | | 0.75% | | 0.25% | | 1.00% | | 1.00% | |
| Aggressive Allocation | | | 0.25% | | 0.25% | | 0.25% | | 0.75% | | 0.75% | | 0.25% | | 1.00% | | 1.00% | |
| Government Money Market | | | N/A | | N/A | | N/A | | 0.75% | | N/A | | N/A | | 0.75% | | N/A | |
| Tax-Free Virginia | | | N/A | | N/A | | N/A | | N/A | | N/A | | N/A | | N/A | | N/A | |
| Tax-Free National | | | N/A | | N/A | | N/A | | N/A | | N/A | | N/A | | N/A | | N/A | |
| High Quality Bond | | | N/A | | N/A | | N/A | | N/A | | N/A | | N/A | | N/A | | N/A | |
| Core Bond | | | 0.25% | | 0.25% | | N/A | | 0.75% | | N/A | | 0.25% | | 1.00% | | N/A | |
| Corporate Bond | | | N/A | | N/A | | N/A | | N/A | | N/A | | N/A | | N/A | | N/A | |
| High Income | | | 0.25% | | 0.25% | | N/A | | 0.75% | | N/A | | 0.25% | | 1.00% | | N/A | |
| Diversified Income | | | 0.25% | | 0.25% | | 0.25% | | 0.75% | | 0.75% | | 0.25% | | 1.00% | | 1.00% | |
| Covered Call & | | | | | | | | | | | | | | | | | | |
| Equity Income | | | 0.25% | | N/A | | 0.25% | | N/A | | 0.75% | | 0.25% | | N/A | | 1.00% | |
| Dividend Income | | | N/A | | N/A | | N/A | | N/A | | N/A | | N/A | | N/A | | N/A | |
| Large Cap Value | | | 0.25% | | 0.25% | | N/A | | 0.75% | | N/A | | 0.25% | | 1.00% | | N/A | |
| Investors | | | 0.25% | | N/A | | N/A | | N/A | | N/A | | 0.25% | | N/A | | N/A | |
| Mid Cap | | | 0.25% | | 0.25% | | N/A | | 0.75% | | N/A | | 0.25% | | 1.00% | | N/A | |
| Small Cap | | | 0.25% | | 0.25% | | N/A | | 0.75% | | N/A | | 0.25% | | 1.00% | | N/A | |
| International Stock | | | 0.25% | | 0.25% | | N/A | | 0.75% | | N/A | | 0.25% | | 1.00% | | N/A | |
MFD may from time to time voluntarily agree to waive a portion of its fees or expenses related to the funds. In that regard, MFD waived a portion of 12b-1 fees on the Government Money Market Fund Class B Shares for the purpose of maintaining a one day yield of zero. The amount of the daily waiver is equal to the amount required to maintain a minimum daily distribution rate of zero. For the year ended October 31, 2017, the waivers totaled $1,702 and are reflected as fees waived in the accompanying Statements of Operations. MFD does not have the right to recoup these waived fees.
Front-end sales charges and contingent deferred sales charges (“CDSC”) do not represent expenses of the funds. Rather, they are deducted from the proceeds of sales of fund shares prior to investment (Class A shares) or from redemption proceeds prior to remittance (Class A, B, and C shares), as applicable. MFD, in turn, uses a portion of these fees to pay financial advisors who sell fund shares, as disclosed in the prospectus. The sales charges and CDSC collected and retained for the year ended October 31, 2017 were as follows:
| | | Amount Collected | | | Amount Retained |
| Fund | | Class A | | Class B | | Class C | | | Class A | | Class B | | Class C |
| Conservative Allocation | | $85,738 | | $15,066 | | $1,500 | | | $10,915 | | $15,066 | | $1,500 |
| Moderate Allocation | | 189,509 | | 31,155 | | 214 | | | 23,123 | | 31,155 | | 214 |
| Aggressive Allocation | | 99,445 | | 13,156 | | 52 | | | 11,562 | | 13,156 | | 52 |
| Government Money Market | | n/a | | 4,858 | | n/a | | | n/a | | 4,858 | | n/a |
| Core Bond | | 49,020 | | 2,181 | | n/a | | | 6,605 | | 2,181 | | n/a |
| High Income | | 19,655 | | 1,446 | | n/a | | | 2,773 | | 1,446 | | n/a |
| Diversified Income | | 173,317 | | 10,166 | | 576 | | | 22,501 | | 10,166 | | 576 |
| Covered Call & Equity Income | | 104,146 | | n/a | | 2,502 | | | 13,836 | | n/a | | 2,502 |
| Large Cap Value | | 43,468 | | 2,504 | | n/a | | | 5,223 | | 2,504 | | n/a |
| Investors | | 64,434 | | n/a | | n/a | | | 7,974 | | n/a | | n/a |
| Mid Cap | | 100,451 | | 1,359 | | n/a | | | 12,510 | | 1,359 | | n/a |
| Small Cap | | 8,648 | | 396 | | n/a | | | 1,000 | | 396 | | n/a |
| International Stock | | 26,500 | | 1,819 | | n/a | | | 3,366 | | 1,819 | | n/a |
Other Expenses. In addition to the fees described above, the Trust is responsible for brokerage commissions and other expenses incurred in connection with the acquisition or disposition of investments, costs of borrowing money, overdrafts and
Madison Funds | Notes to the Financial Statements - continued | October 31, 2017
any potential taxes owed and extraordinary expenses as approved by a majority of independent trustees.
Officers and Trustees: Certain officers and trustees of the funds are also officers of the Investment Adviser. The funds do not compensate their officers or affiliated trustees. Independent Trustees are compensated. Fees paid to the Trustees reduce the fees paid to the Investment Adviser pursuant to the Administrative Services Agreement as described above.
4. DIVIDENDS FROM NET INCOME AND DISTRIBUTIONS OF CAPITAL GAINS
With respect to dividends from net investment income, the Government Money Market Fund declares dividends, if any, daily and reinvests monthly. The Tax-Free Funds, Core Bond, Corporate Bond, High Income and Diversified Income Funds declare and reinvest dividends, if any, monthly. The Conservative Allocation, High Quality Bond, Dividend Income and Covered Call & Equity Income Funds declare and reinvest dividends, if any, quarterly. The Moderate Allocation, Aggressive Allocation, Large Cap Value, Investors, Mid Cap, Small Cap and International Stock Funds declare and reinvest dividends, if any, annually. The funds distribute net realized gains from investment transactions, if any, to shareholders annually.
Income and capital gain distributions, if any, are determined in accordance with federal income tax regulations, which may differ from accounting principles generally accepted in the United States of America. Taxable distributions from income and realized capital gains in the funds differ from book amounts earned during the period due to differences in the timing of capital gains recognition, and due to the reclassification of certain gains or losses from capital to income. Dividends from net investment income are determined on a class level. Capital gains are determined on a fund level.
5. SECURITIES TRANSACTIONS
For the year ended October 31, 2017, aggregate cost of purchases and proceeds from sales of securities, other than short-term investment, were as follows:
| | | U.S. Government Securities | | | Other Investment Securities |
| Fund | | Purchases | | Sales | | Purchases | | Sales |
| Conservative Allocation | | $ | – | | | $ | – | | | $ | 34,174,565 | | | $ | 37,170,939 |
| Moderate Allocation | | | – | | | | – | | | | 68,924,579 | | | | 75,617,469 |
| Aggressive Allocation | | | – | | | | – | | | | 26,890,428 | | | | 29,514,872 |
| Tax-Free Virginia | | | – | | | | – | | | | 1,613,829 | | | | 1,681,660 |
| Tax-Free National | | | – | | | | – | | | | 1,410,275 | | | | 2,501,195 |
| High Quality Bond | | | 20,896,370 | | | | 23,878,666 | | | | 4,239,498 | | | | 4,576,695 |
| Core Bond | | | 28,849,354 | | | | 30,495,124 | | | | 26,611,359 | | | | 33,988,806 |
| Corporate Bond | | | – | | | | – | | | | 5,050,894 | | | | 6,813,514 |
| High Income | | | – | | | | – | | | | 11,253,426 | | | | 11,811,522 |
| Diversified Income | | | 10,127,801 | | | | 9,375,308 | | | | 23,939,482 | | | | 23,406,692 |
| Covered Call & Equity Income | | | – | | | | – | | | | 185,837,977 | | | | 163,373,070 |
| Dividend Income | | | – | | | | – | | | | 19,259,195 | | | | 27,742,664 |
| Large Cap Value | | | – | | | | – | | | | 82,755,246 | | | | 104,822,353 |
| Investors | | | – | | | | – | | | | 89,466,661 | | | | 110,235,355 |
| Mid Cap | | | – | | | | – | | | | 67,243,208 | | | | 83,700,306 |
| Small Cap | | | – | | | | – | | | | 19,392,124 | | | | 36,189,166 |
| International Stock | | | – | | | | – | | | | 9,595,433 | | | | 17,431,249 |
6. COVERED CALL AND PUT OPTIONS
An option on a security is a contract that gives the holder of the option, in return for a premium, the right to buy from (in the case of a call) or sell to (in the case of a put) the writer of the option the security underlying the option at a specified exercise or “strike” price. The writer of an option on a security has an obligation upon exercise of the option to deliver the underlying security upon payment of the exercise price (in the case of a call) or pay the exercise price upon delivery of the underlying security (in the case of a put).
The Covered Call & Equity Income Fund will pursue its primary objective by employing an option strategy of writing (selling) covered call options on common stocks. The number of call options the fund can write (sell) is limited by the amount of equity securities the fund holds in its portfolio. The fund will not write (sell) “naked” or uncovered call options. The fund seeks to produce a high level of current income and gains generated from option writing premiums and, to a lesser extent, from dividends. Covered call writing also helps to reduce volatility (and risk profile) of the fund by providing protection from declining stock prices.
When an option is written, the premium received is recorded as an asset with an equal liability and is subsequently marked to market to reflect the current market value of the option written. These liabilities are reflected as options written in the Statements of Assets and Liabilities. Premiums received from writing options which expire unexercised are recorded on the expiration date as a realized gain. The difference between the premium received and the amount paid on effecting a closing purchase transaction, including brokerage commissions, is also treated as a realized gain, or if the premium is less than the amount paid for the closing purchase transactions, as a realized loss. If a call option is exercised, the premium is added to the proceeds from the sale of the underlying security in determining whether there has been a realized gain or loss.
7. FUTURES CONTRACTS AND OPTIONS ON FUTURES CONTRACTS
The Core Bond Fund may purchase and sell futures contracts and purchase and write options on futures contracts on a limited basis. The fund may purchase and sell futures contracts based on various securities (such as U.S. Government securities), securities indices, foreign currencies and other financial instruments and indices. The fund will engage in futures or related options transactions on a limited basis only for bona fide hedging purposes or for purposes of seeking to increase total returns to the extent permitted by regulations of the Commodity Futures Trading Commission.
Futures Contracts. The Core Bond Fund may use futures contracts to manage its exposure to the securities markets or to movements in interest rates and currency values. The primary risks associated with the use of futures contracts are the imperfect correlation between the change in market value of the securities held by the fund and the prices of futures contracts and the possibility of an illiquid market. Futures contracts are valued based upon their quoted daily settlement prices. Upon entering into a futures contract, the fund is required to deposit with its futures broker an amount of cash, U.S. Government and Agency Obligations, or other assets, in accordance with the initial margin requirements of the broker or exchange. Futures contracts are marked to market daily and based on such movements in the price of the contracts, an appropriate payable or receivable for the change in value may be posted or collected by the fund (“variation margin”). Gains or losses are recognized but not considered realized until the contracts expire or close. Futures contracts involve, to varying degrees, risk of loss in excess of the variation margin disclosed within exchange traded or centrally cleared financial derivative instruments on the Statements of Assets and Liabilities.
Options on Futures Contracts. The acquisition of put and call options on futures contracts will give the Core Bond Fund the right (but not the obligation) for a specified price, to sell or to purchase, respectively, the underlying futures contract at any time during the option period. As the purchaser of an option on a futures contract, the fund obtains the benefit of the futures position if prices move in a favorable direction but limits its risk of loss in the event of an unfavorable price movement to the loss of the premium and transaction costs.
The writing of a call option on a futures contract generates a premium which may partially offset a decline in the value of the fund’s assets. By writing a call option, the fund becomes obligated, in exchange for the premium, to sell a futures contract which may have a value higher than the exercise price. Conversely, the writing of a put option on a futures contract generates a premium, which may partially offset an increase in the price of securities that the fund intends to purchase. However, the fund becomes obligated to purchase a futures contract, which may have a value lower than the exercise price. Thus, the loss incurred by the fund in writing options
Madison Funds | Notes to the Financial Statements - continued | October 31, 2017
on futures is potentially unlimited and may exceed the amount of the premium received.
8. FOREIGN SECURITIES
Each fund, other than the Tax-Free Funds and the Government Money Market Fund may invest in foreign securities. Foreign securities are defined as securities that are: (i) issued by companies organized outside the U.S. or whose principal operations are outside the U.S., or issued by foreign governments or their agencies or instrumentalities (“foreign issuers”); (ii) principally traded outside of the U.S.; and (iii) quoted or denominated in a foreign currency (“non-dollar securities”). Foreign securities include ADRs, European Depositary Receipts (“EDRs”), GDRs, Swedish Depositary Receipts (“SDRs”) and foreign money market securities.
Certain of the funds have reclaims receivable balances, in which the funds are due a reclaim on the taxes that have been paid to some foreign jurisdictions. The values of all reclaims are not significant for any of the funds and are reflected in Other Assets on the Statements of Assets and Liabilities. These receivables are reviewed to ensure the current receivable balance is reflective of the amount deemed to be collectible.
9. SECURITIES LENDING
Several Madison Funds had been previously authorized to engage in securities lending, although they have not done so since the financial crisis. The Madison Funds’ board has recently re-authorized the funds, other than the Government Money Market Fund, to engage in securities lending with State Street Bank and Trust Company as securities lending agent pursuant to a Securities Lending Authorization Agreement (the “Agreement”) and subject to certain securities lending policies and procedures. Under the terms of the Agreement, and subject to the policies and procedures, the authorized funds may lend portfolio securities to qualified borrowers in order to generate additional income, while managing risk associated with the securities lending program. The Agreement requires that loans are collateralized at all times by cash or U.S. government
securities, initially equal to at least 102% of the value of the securities. The loaned securities and collateral are marked to market daily to maintain collateral at 102% of the total loaned portfolio. Amounts earned as interest on investments of cash collateral, net of rebates and fees, if any, are included in the Statement of Operations. The primary risk associated with securities lending is if the borrower defaults on its obligation to return the securities loaned because of insolvency or other reasons, the fund could experience delays and costs in recovering securities loaned or in gaining access to the collateral. Under the Agreement, the securities lending agent has provided a limited indemnification in the event of a borrower default.
The funds did not engage in any securities lending activities during the year ended October 31, 2017. It is expected that the funds, other than the Government Money Market Fund, may re-engage in securities lending activity in the fiscal first quarter of 2018.
10. FEDERAL AND FOREIGN INCOME TAX INFORMATION
It is each fund’s policy to comply with the requirements of Subchapter M of the Internal Revenue Code of 1986 applicable to regulated investment companies and to distribute all its taxable income to its shareholders and any net realized capital gains at least annually. Accordingly, no provisions for federal income taxes are recorded in the accompanying statements.
The funds have not recorded any liabilities for material unrecognized tax benefits as of October 31, 2017. It is each fund’s policy to recognize accrued interest and penalties related to uncertain tax benefits in income taxes, as appropriate. Tax years that remain open to examination by major tax jurisdictions include tax years ended 2014 through 2017.
The tax character of distributions paid during the years ended October 31, 2017 and 2016 were as follows:
| | | Ordinary Income | | | Long-Term Capital Gain |
| Fund | | 2017 | | 2016 | | 2017 | | | 2016 |
| Conservative Allocation | | $ | 995,364 | | | $ | 888,827 | | | $ | 1,025,678 | | | $ | 2,273,262 |
| Moderate Allocation | | | 1,636,873 | | | | 1,312,247 | | | | 3,970,910 | | | | 7,797,267 |
| Aggressive Allocation | | | 594,915 | | | | 507,867 | | | | 1,551,203 | | | | 4,818,260 |
| Government Money Market | | | 32,559 | | | | – | | | | – | | | | – |
| High Quality Bond | | | 1,315,143 | | | | 1,213,921 | | | | 124,208 | | | | 290,255 |
| Core Bond | | | 5,457,754 | | | | 5,728,510 | | | | 750,502 | | | | 1,493,182 |
| Corporate Bond | | | 699,171 | | | | 682,749 | | | | 36,169 | | | | 67,455 |
| High Income | | | 1,017,799 | | | | 1,173,280 | | | | – | | | | – |
| Diversified Income | | | 3,063,597 | | | | 2,433,885 | | | | 5,040,396 | | | | 3,337,689 |
| Covered Call & Equity Income | | | 7,592,744 | | | | 5,814,327 | | | | – | | | | – |
| Dividend Income | | | 2,730,816 | | | | 1,027,860 | | | | 1,581,825 | | | | 838,307 |
| Large Cap Value | | | 6,660,460 | | | | 1,314,675 | | | | 8,292,034 | | | | 19,496,697 |
| Investors | | | 2,374,741 | | | | 2,061,390 | | | | 6,645,429 | | | | 13,672,109 |
| Mid Cap | | | 2,906 | | | | – | | | | 13,577,178 | | | | 14,926,055 |
| Small Cap | | | 411,838 | | | | 241,523 | | | | 3,158,385 | | | | 3,076,610 |
| International Stock | | | 386,671 | | | | 351,712 | | | | – | | | | – |
| | | | Tax Exempt Income | | | | Ordinary Income | | | | Capital Gain |
| Fund | | 2017 | | 2016 | | 2017 | | 2016 | | 2017 | | 2016 |
| Tax-Free Virginia | | $ | 451,666 | | | $ | 481,442 | | | $ | – | | | $ | – | | | $ | 36,276 | | | $ | 69,797 |
| Tax-Free National | | | 596,757 | | | | 637,014 | | | | 19,846 | | | | 1,913 | | | | 161,271 | | | | 160,361 |
As of October 31, 2017, the components of distributable earnings on a tax basis were as follows:
| | | Ordinary Income | | Tax Exempt Income | | Long-Term Capital Gain |
| Fund | | | | | | | | | | | |
| | | | | | | | | | | | |
| Conservative Allocation | | $ | 552,748 | | | $ | – | | | $ | 1,283,127 |
| Moderate Allocation | | | 2,471,874 | | | | – | | | | 3,897,458 |
| Aggressive Allocation | | | 1,138,214 | | | | – | | | | 2,179,119 |
| Government Money Market | | | 145 | | | | – | | | | – |
| Tax-Free Virginia | | | – | | | | 2,954 | | | | – |
| Tax-Free National | | | 3,539 | | | | 8,219 | | | | 73,275 |
| High Quality Bond | | | 119,042 | | | | – | | | | – |
| Core Bond | | | 21,350 | | | | – | | | | 65,309 |
| Corporate Bond | | | 181,130 | | | | – | | | | – |
| High Income | | | 99,148 | | | | – | | | | – |
| Diversified Income | | | – | | | | – | | | | 2,474,390 |
| Covered Call & Equity Income | | | 4,142,300 | | | | – | | | | – |
| Dividend Income | | | 101,560 | | | | – | | | | 2,417,037 |
| Large Cap Value | | | 1,463,821 | | | | – | | | | 7,784,709 |
| Investors | | | 2,584,609 | | | | – | | | | 14,651,825 |
| Mid Cap | | | 75,123 | | | | – | | | | 12,318,728 |
| Small Cap | | | 1,235,905 | | | | – | | | | 6,028,679 |
| International Stock | | | 262,753 | | | | – | | | | – |
For federal income tax purposes, the funds listed below have capital loss carryovers as of October 31, 2017, which are available to offset future capital gains, if any, realized through the fiscal year listed:
| | | | | | | | | | | | | | | No Expiration Date |
| Fund | | 2018 | | 2019 | | | 2020 | | | Short-Term | | Long-Term |
| | | | | | | | | | | | | | | | | | | | |
| Government Money Market | | $ | 5 | | | $ | – | | | $ | – | | | $ | 309 | | | $ | – |
| Tax-Free Virginia | | | – | | | | – | | | | – | | | | 11,166 | | | | 6,117 |
| High Quality Bond | | | – | | | | – | | | | – | | | | 42,572 | | | | – |
| High Income | | | – | | | | – | | | | – | | | | 311,933 | | | | 1,016,03 |
| International Stock | | | 710,871 | | | | – | | | | 6 | | | | 1,184,56 | | | | 758,977 |
Certain ordinary losses incurred after December 31 and within the taxable year are deemed to arise on the first day of the funds’ next taxable year, if the funds so elect.
For the year ended October 31, 2017, the Mid Cap Fund elected to defer $718,953 in late-year ordinary losses.
For the year ended October 31, 2017, capital losses utilized for each Fund were as follows:
| Fund | | Amount Utilized |
| | | | | |
| High Income | | $ | 410,043 | |
| International Stock | | | 124,187 | |
Madison Funds | Notes to the Financial Statements - continued | October 31, 2017
At October 31, 2017, the aggregate gross unrealized appreciation (depreciation) and net unrealized appreciation (depreciation) for all securities, as computed on a federal income tax basis for each fund were as follows:
| Fund | | Appreciation | | Depreciation | | Net |
| Conservative Allocation | | $ | 3,983,233 | | | $ | 75,672 | | | $ | 3,907,561 |
| Moderate Allocation | | | 16,007,757 | | | | 118,994 | | | | 15,888,763 |
| Aggressive Allocation | | | 9,603,281 | | | | 95,190 | | | | 9,508,091 |
| Government Money Market | | | – | | | | – | | | | – |
| Tax-Free Virginia | | | 680,728 | | | | 32,472 | | | | 648,256 |
| Tax-Free National | | | 1,079,766 | | | | 38,443 | | | | 1,041,323 |
| High Quality Bond | | | 446,538 | | | | 266,736 | | | | 179,802 | |
| Core Bond | | | 4,900,612 | | | | 969,565 | | | | 3,931,047 | |
| Corporate Bond | | | 725,656 | | | | 34,670 | | | | 690,986 | |
| High Income | | | 882,969 | | | | 167,575 | | | | 715,394 | |
| Diversified Income | | | 33,416,032 | | | | 1,051,240 | | | | 32,364,792 | |
| Covered Call & Equity Income | | | 2,360,147 | | | | 15,080,342 | | | | (12,720,195 | ) |
| Dividend Income | | | 21,983,708 | | | | 656,798 | | | | 21,326,910 | |
| Large Cap Value | | | 16,909,991 | | | | 595,812 | | | | 16,314,179 | |
| Investors | | | 86,732,020 | | | | 2,800,177 | | | | 83,931,843 | |
| Mid Cap | | | 123,234,712 | | | | 4,266,412 | | | | 118,968,300 | |
| Small Cap | | | 24,519,419 | | | | 6,760,429 | | | | 17,758,990 | |
| International Stock | | | 8,391,058 | | | | 306,263 | | | | 8,084,795 | |
The differences between cost amounts for book purposes and tax purposes are primarily due to the tax deferral of wash sales.
Reclassification Adjustments. Paid-in capital, undistributed net investment income, and accumulated net realized gain (loss) have been adjusted in the Statements of Assets and Liabilities for permanent book-tax differences for all funds.
Differences relate to the tax treatment of net operating losses, paydown gains and losses, foreign currency gains and losses, distributions from real estate investment trusts, distribution re-designations from investments in other regulated investment companies, and unusable capital loss carryforwards.
To the extent these book and tax differences are permanent in nature, such amounts are reclassified at the end of the fiscal year among paid-in capital in excess of par value, undistributed net investment income (loss) and undistributed net realized gain (loss) on investments and foreign currency translations. Accordingly, at October 31, 2017, reclassifications were recorded as follows:
| Fund | | Paid-in
Capital | | Undistributed
Net Investment
Income (Loss) | | Accumulated
Net Realized
Gain (Loss) |
| Conservative Allocation | | $ | (1 | ) | | $ | 109,295 | | | $ | (109,294 | ) |
| Moderate Allocation | | | 1 | | | | 397,402 | | | | (397,403 | ) |
| Aggressive Allocation | | | (1 | ) | | | 181,047 | | | | (181,046 | ) |
| Government Money Market | | | (16 | ) | | | – | | | | 16 | |
| Tax-Free Virginia | | | – | | | | – | | | | – | |
| Tax-Free National | | | – | | | | – | | | | – | |
| High Quality Bond | | | 15,739 | | | | (15,753 | ) | | | 14 | |
| Core Bond | | | 2 | | | | 445,985 | | | | (445,987 | ) |
| Corporate Bond | | | – | | | | – | | | | – | |
| High Income | | | – | | | | – | | | | – | |
| Diversified Income | | | 1 | | | | 135,060 | | | | (135,061 | ) |
| Covered Call & Equity Income | | | – | | | | 3,852,142 | | | | (3,852,142 | ) |
| Dividend Income | | | – | | | | (5,828 | ) | | | 5,828 | |
| Large Cap Value | | | – | | | | (2,666 | ) | | | 2,666 | |
| Investors Fund | | | – | | | | – | | | | – | |
| Mid Cap | | | 2 | | | | 441,284 | | | | (441,286 | ) |
| Small Cap | | | (4 | ) | | | (39,688 | ) | | | 39,692 | |
| International Stock | | | (1 | ) | | | (13,908 | ) | | | 13,909 | |
11. CERTAIN RISKS
Investing in certain financial instruments, including forward foreign currency contracts, involves certain risks. Risks associated with these instruments include potential for an illiquid secondary market for the instruments or inability of counterparties to perform under the terms of the contracts, changes in the value of foreign currency relative to the U.S. dollar and financial statements’ volatility resulting from an imperfect correlation between the movements in the prices of the instruments and the prices of the underlying securities and interest rates being hedged. The International Stock Fund may enter into these contracts primarily to protect the fund from adverse currency movements.
Investing in foreign securities involves certain risks not necessarily found in U.S. markets. These include risks associated with adverse changes in economic, political, regulatory and other conditions, changes in currency exchange rates, exchange control regulations, expropriation of assets or nationalization, imposition of withholding taxes on dividend or interest payments or capital gains, and possible difficulty in obtaining and enforcing judgments against foreign entities. Further, issuers of foreign securities are subject to different, and often less comprehensive, accounting, reporting and disclosure requirements than domestic issuers.
The funds may be subject to interest rate risk which is the risk that the value of your investment will fluctuate with changes in interest rates. Typically, a rise in interest rates causes a decline in the market value of income-bearing securities. When interest rates rise, bond prices fall; generally the longer a bond’s maturity, the more sensitive it is to risk. Federal Reserve policy changes may expose fixed-income and related markets to heightened volatility and may reduce liquidity for certain fund investments, which could cause the value of a fund’s investments and share price to decline. The Core Bond Fund may invest in derivatives tied to fixed-income markets and may be more substantially exposed to these risks than a fund that does not invest in derivatives.
The Government Money Market Fund is not insured or guaranteed by the Federal Deposit Insurance Corporation (“FDIC”) or any other government agency. Although the fund seeks to preserve the value of your investment at $1.00 per share, it is possible to lose money by investing in the fund. Additionally, while the fund has maintained a constant share price since inception, and will continue to try to do so, neither the Investment Adviser nor its affiliates are required to make a capital infusion, enter into a capital support agreement or take other actions to prevent the fund’s share price from falling below $1.00.
The Tax-Free Funds invest in municipal securities. Municipal securities generally are subject to possible default, bankruptcy or insolvency of the issuer. Principal and interest repayment may be affected by federal, state and local legislation, referendums, judicial decisions and executive acts. The tax-exempt status of municipal securities may be affected by future changes in the tax laws, litigation involving the tax status of the securities and errors and omissions by issuers and their counsel. Madison will not attempt to make an independent determination of the present or future tax-exempt status of municipal securities acquired for the funds. While most municipal securities have a readily available market, a variety of factors, including the scarcity of issues and the fact that tax-free investments are inappropriate for significant numbers of investors, limit the depth of the market for these securities. Accordingly, it may be more difficult for the funds to sell large blocks of municipal securities advantageously than would be the case with comparable taxable securities.
Effective May 1, 2015, the Core Bond Fund may invest in futures contracts or options on futures contracts. Investing in futures contracts and options on futures entail certain other risks such as: unanticipated changes in interest rates, securities prices or currency exchange rates, and may result in a poorer overall performance for the fund than if it had not entered into any futures contracts or options transactions. In the event of an imperfect correlation between a futures position and portfolio position which is intended to be protected, the desired protection may not be obtained
Madison Funds | Notes to the Financial Statements - continued | October 31, 2017
and the fund may be exposed to risk of loss. Perfect correlation between the fund’s futures positions and portfolio positions may be difficult to achieve.
The High Income Fund invests in securities offering high current income which generally will include bonds in the below investment grade categories of recognized rating agencies (so-called “junk bonds”). These securities generally involve more credit risk than securities in the higher rating categories. In addition, the trading market for high yield securities may be relatively less liquid than the market for higher-rated securities. The fund generally invests at least 80% of its net assets in high yield securities.
The Covered Call & Equity Income Fund invests in options on securities. As the writer of a covered call option, the fund forgoes, during the option’s life, the opportunity to profit from increases in the market value of the security covering the call option above the sum of the premium and the strike price of the call but has retained the risk of loss should the price of the underlying security decline. A writer of a put option is exposed to the risk of loss if fair value of the underlying securities declines, but profits only to the extent of the premium received if the underlying security increases in value. The writer of an option has no control over the time when it may be required to fulfill its obligation as writer of the option. Once an option writer has received an exercise notice, it cannot effect a closing purchase transaction in order to terminate its obligation under the option and must deliver the underlying security at the exercise price.
The Allocation Funds are fund of funds, meaning that each invests primarily in Underlying Funds, including ETFs. Thus, each fund’s investment performance and its ability to achieve its investment goal are directly related to the performance of the Underlying Funds in which it invests; and the Underlying Fund’s performance, in turn, depends on the particular securities in which that Underlying Fund invests and the expenses of that fund. Accordingly, the Allocation Funds are subject to the risks of the Underlying Funds in direct proportion to the allocation of their respective assets among the Underlying Funds.
Additionally, the Allocation Funds are subject to asset allocation risk and manager risk. Manager risk (i.e., fund selection risk) is the risk that the Underlying Fund(s) selected to fulfill a particular asset class underperforms their peers. Asset allocation risk is the risk that the allocation of the fund’s assets among the various asset classes and market segments will cause the fund to underperform other funds with a similar investment objective.
The funds are also subject to cybersecurity risk, which include the risks associated with computer systems, networks and devices to carry out routine business operations. These systems, networks and devices employ a variety of protections that are designed to prevent cyberattacks. Despite the various cyber protections utilized by the funds,
the Investment Adviser, and other service providers, their systems, networks, or devices could potentially be breached. The funds, their shareholders, and the Investment Adviser could be negatively impacted as a result of a cybersecurity breach. The funds cannot control the cybersecurity plans and systems put in place by service providers or any other third parties whose operations may affect the funds. The funds do monitor this risk closely.
In addition to the other risks described above in the prospectus, you should understand what we refer to as “unknown market risks.” While investments in securities have been keystones in wealth building and management, at times these investments have produced surprises. Those who enjoyed growth and income of their investments generally were rewarded for the risks they took by investing in the markets. Although the Investment Adviser seeks to appropriately address and manage the risks identified and disclosed to you in connection with the management of the securities in the funds, you should understand that the very nature of the securities markets includes the possibility that there may be additional risks of which we are not aware. We certainly seek to identify all applicable risks and then appropriately address them, take appropriate action to reasonably manage them and to make you aware of them so you can determine if they exceed your risk tolerance. Nevertheless, the often volatile nature of the securities markets and the global economy in which we work suggests that the risk of the unknown is something to consider in connection with an investment in securities. Unforeseen events could under certain circumstances produce a material loss of the value of some or all of the securities we manage for you in the funds.
12. CAPITAL SHARES AND AFFILIATED OWNERSHIP
The Allocation Funds invest in Underlying Funds, certain of which may be deemed to be under common control because of the same or affiliated investment adviser and membership in a common family of investment companies (the “Affiliated Underlying Funds”). A summary of the transactions with each Affiliated Underlying Fund during the year ended October 31, 2017 follows:
| Fund/Underlying Fund | | Beginning
Value as of
10/31/2016 | | Gross
Additions | | Gross
Sales | | Realized
Gain
(Loss) | | Change in
Unrealized
Appreciation
(Depreciation) | | Value at
10/31/2017 | | Shares | | Dividend Income | | Distributions
Received1 |
| Conservative Allocation Fund | | | | | | | | | | | | | | | | | | | | | | | | | | | | | | | | | | | |
| Madison Core Bond Fund Class Y | | $ | 15,516,535 | | | $ | 450,000 | | | $ | (550,551 | ) | | $ | (13,462 | ) | | $ | (258,807 | ) | | $ | 15,143,715 | | | | 1,515,887 | | | $ | 376,183 | | | $ | 455,871 |
| Madison Corporate Bond Fund Class Y | | | 5,223,099 | | | | – | | | | – | | | | – | | | | (17,872 | ) | | | 5,205,227 | | | | 446,801 | | | | 148,983 | | | | 168,133 |
| Madison Dividend Income Fund Class Y | | | 3,990,637 | | | | 352,490 | | | | (755,126 | ) | | | 26,631 | | | | 589,383 | | | | 4,204,015 | | | | 160,581 | | | | 71,757 | | | | 168,379 |
| Madison Investors Fund Class Y | | | 3,301,894 | | | | 329,988 | | | | (89,877 | ) | | | 5,425 | | | | 660,020 | | | | 4,207,450 | | | | 180,655 | | | | 7,715 | | | | 109,988 |
| Madison Mid Cap Fund Class Y | | | 1,106,016 | | | | 44,894 | | | | (99,562 | ) | | | 5,361 | | | | 135,350 | | | | 1,192,059 | | | | 122,137 | | | | – | | | | 44,894 |
| | | |
| Totals | | $ | 29,138,181 | | | $ | 1,177,372 | | | $ | (1,495,116 | ) | | $ | 23,955 | | | $ | 1,108,074 | | | $ | 29,952,466 | | | | | | | $ | 604,638 | | | $ | 947,265 |
| | | |
| Moderate Allocation Fund | | | | | | | | | | | | | | | | | | | | | | | | | | | | | | | | | | | |
| Madison Core Bond Fund Class Y | | $ | 21,838,385 | | | $ | 250,000 | | | $ | – | | | $ | – | | | $ | (383,480 | ) | | $ | 21,704,905 | | | | 2,172,663 | | | $ | 534,105 | | | $ | 646,261 |
| Madison Dividend Income Fund Class Y | | | 13,952,619 | | | | 945,346 | | | | (1,645,360 | ) | | | 75,016 | | | | 2,211,301 | | | | 15,538,922 | | | | 593,542 | | | | 263,351 | | | | 595,346 |
| Madison Investors Fund Class Y | | | 13,838,313 | | | | 799,653 | | | | (1,597,993 | ) | | | 234,477 | | | | 2,282,150 | | | | 15,556,600 | | | | 667,952 | | | | 31,539 | | | | 449,653 |
| Madison Large Cap Value Fund Class Y | | | 2,801,641 | | | | 415,148 | | | | (1,276,845 | ) | | | (45,911 | ) | | | (8,147 | ) | | | 1,885,886 | | | | 121,435 | | | | 40,155 | | | | 415,147 |
| Madison Mid Cap Fund Class Y | | | 2,941,740 | | | | 130,567 | | | | (352,308 | ) | | | 47,308 | | | | 324,215 | | | | 3,091,522 | | | | 316,754 | | | | – | | | | 130,567 |
| | | |
| Totals | | $ | 55,372,698 | | | $ | 2,540,714 | | | $ | (4,872,506 | ) | | $ | 310,890 | | | $ | 4,426,039 | | | $ | 57,777,835 | | | | | | | $ | 869,150 | | | $ | 2,236,974 |
| | | |
| Aggressive Allocation Fund | | | | | | | | | | | | | | | | | | | | | | | | | | | | | | | | | | | |
| Madison Core Bond Fund Class Y | | $ | 4,932,672 | | | $ | 810,000 | | | $ | – | | | $ | – | | | $ | (83,182 | ) | | $ | 5,659,490 | | | | 566,515 | | | $ | 135,194 | | | $ | 161,577 |
| Madison Dividend Income Fund Class Y | | | 7,037,980 | | | | 557,736 | | | | (470,283 | ) | | | 29,770 | | | | 1,166,007 | | | | 8,321,210 | | | | 317,846 | | | | 137,330 | | | | 307,736 |
| Madison Investors Fund Class Y | | | 6,967,873 | | | | 482,103 | | | | (439,888 | ) | | | 71,977 | | | | 1,248,727 | | | | 8,330,792 | | | | 357,698 | | | | 16,280 | | | | 232,103 |
| Madison Large Cap Value Fund Class Y | | | 1,244,769 | | | | 184,450 | | | | – | | | | – | | | | 22,152 | | | | 1,451,371 | | | | 93,456 | | | | 17,841 | | | | 184,450 |
| Madison Mid Cap Fund Class Y | | | 2,054,643 | | | | 91,193 | | | | (266,353 | ) | | | 46,605 | | | | 224,895 | | | | 2,150,983 | | | | 220,388 | | | | – | | | | 91,194 |
| | | |
| Totals | | $ | 22,237,937 | | | $ | 2,125,482 | | | $ | (1,176,524 | ) | | $ | 148,352 | | | $ | 2,578,599 | | | $ | 25,913,846 | | | | | | | $ | 306,645 | | | $ | 977,060 |
| | | |
| 1 Distributions received include distributions from net investment income and from capital gains from the underlying funds. |
Madison Funds | Notes to the Financial Statements - concluded | October 31, 2017
13. SUBSEQUENT EVENTS
Management has evaluated the impact of all subsequent events on the funds through the date the financial statements were available for issue. No other events have taken place that meet the definition of subsequent event that require adjustment to, or disclosure in the financial statements.
Madison Funds | October 31, 2017
Report of Independent Registered Public Accounting Firm
To the Shareholders and Board of Trustees of Madison Funds:
We have audited the accompanying statements of assets and liabilities, including the portfolios of investments, of Madison Funds, comprising the Madison Conservative Allocation Fund, Madison Moderate Allocation Fund, Madison Aggressive Allocation Fund, Madison Government Money Market, Madison Tax-Free Virginia Fund, Madison Tax-Free National Fund, Madison High Quality Bond Fund, Madison Core Bond Fund, Madison Corporate Bond Fund, Madison High Income Fund, Madison Diversified Income Fund, Madison Covered Call & Equity Income Fund, Madison Dividend Income Fund, Madison Large Cap Value Fund, Madison Investors Fund, Madison Mid Cap Fund, Madison Small Cap Fund, and Madison International Stock Fund, (collectively, the “Funds”) as of October 31, 2017, the related statements of operations for the year then ended, the statements of changes in net assets for each of the two years in the period then ended, the financial highlights of Madison Conservative Allocation Fund, Madison Moderate Allocation Fund, Madison Aggressive Allocation Fund, Madison Government Money Market Fund, Madison Core Bond Fund, Madison High Income Fund, Madison Diversified Income Fund, Madison Covered Call & Equity Income Fund, Madison Large Cap Value Fund, Madison Small Cap Fund, and Madison International Stock Fund, for each of the periods presented, the financial highlights of Madison Tax-Free Virginia Fund and Madison Tax-Free National Fund for the years ended October 31, 2017, 2016 2015, and 2014, and each of the two periods in the period ended October 31, 2013, the financial highlights of Madison High Quality Bond Fund, Madison Corporate Bond Fund, Madison Dividend Income Fund, Madison Investors Fund, and Madison Mid Cap Fund for the years ended October 31, 2017, 2016, 2015 and 2014, and the period ended October 31, 2013. Our responsibility is to express an opinion on these financial statements and financial highlights based on our audits. The financial highlights of Madison High Quality Bond Fund, Madison Corporate Bond Fund, Madison Dividend Income Fund, and Madison Investors Fund for the period ended December 31, 2012 were audited by other auditors, whose report, dated February 26, 2013, expressed an unqualified opinion on those financial highlights. The financial highlights of the Madison Mid Cap Fund for the period ended December 31 2012, before the effects of adjustments to retrospectively adjust the financial highlights to give effect to the reorganization as discussed in footnote 7 to the financial highlights, were audited by other auditors, whose report, dated February 26, 2013, expressed an unqualified opinion on those financial highlights.
We conducted our audits in accordance with the standards of the Public Company Accounting Oversight Board (United States) (PCAOB). Those standards require that we plan and perform the audit to obtain reasonable assurance about whether the financial statements and financial highlights are free of material misstatement. The Funds are not required to have, nor were we engaged to perform, an audit of their internal control over financial reporting. Our audits included consideration of internal control over financial reporting as a basis for designing audit procedures that are appropriate in the circumstances, but not for the purpose of expressing an opinion on the effectiveness of the Funds’ internal control over financial reporting. Accordingly, we express no such opinion. An audit also includes examining, on a test basis, evidence supporting the amounts and disclosures in the financial statements, assessing the accounting principles used and significant estimates made by management, as well as evaluating the overall financial statement presentation. Our procedures included confirmation of securities owned as of October 31, 2017, by correspondence with the custodian and brokers; where replies were not received from brokers, we performed other auditing procedures. We believe that our audits provide a reasonable basis for our opinion.
In our opinion, the financial statements and financial highlights referred to above present fairly, in all material respects, the financial position of each of the Funds as of October 31, 2017, the results of their operations for the year then ended, the statements of changes in net assets for each of the two years in the period then ended, the financial highlights of Madison Conservative Allocation Fund, Madison Moderate Allocation Fund, Madison Aggressive Allocation Fund, Madison Government Money Market Fund, Madison Core Bond Fund, Madison High Income Fund, Madison Diversified Income Fund, Madison Covered Call & Equity Income Fund, Madison Large Cap Value Fund, Madison Small Cap Fund, and Madison International Stock Fund for each of the periods presented, the financial highlights of Madison Tax-Free Virginia Fund and Madison Tax-Free National Fund for the years ended October 31, 2017, 2016, 2015, and 2014, and each of the two periods in the period ended October 31, 2013, the financial highlights of Madison High Quality Bond Fund, Madison Corporate Bond Fund, Madison Dividend Income Fund, Madison Investors Fund, and Madison Mid Cap Fund for the years ended October 31, 2017, 2016, 2015, and 2014, and the period ended October 31, 2013, in conformity with accounting principles generally accepted in the United States of America.
We have also audited the adjustments to the financial highlights of the Madison Mid Cap Fund for the period ended December 31, 2012, to retrospectively adjust the financial highlights to give effect to the reorganization as discussed in footnote 7 to the financial highlights. Our procedures included recalculating the conversion factor discussed in that footnote. In our opinion, such retrospective adjustments are appropriate and have been appropriately applied. However, we were not engaged to audit, review, or perform any procedures to the financial statements and financial highlights of the Madison Mid Cap Fund for the period ended December 31, 2012 other than with respect to the retrospective adjustment described herein, and accordingly, we do not express an opinion or any other form of assurance on the financial statements and financial highlights of Madison Mid Cap Fund for the period ended December 31, 2012.
/s/ Deloitte & Touche, LLP
Chicago, IL
December 21, 2017
Madison Funds | October 31, 2017
Other Information (unaudited)
DISCUSSION OF CONTRACT RENEWAL PROCESS AND CONSIDERATIONS
At an in-person meeting of the Board held in July 2017, the Board of Trustees (the “Board” or “Trustees”) of Madison Funds (the “Trust”), and by a separate vote, the Independent Trustees of the Trust, approved the continuance of the Investment Advisory Agreement between the Trust and Madison Asset Management, LLC (the “Adviser”) with respect to the individual series of the Trust (each a “fund” and together, the “funds”) and the continuance of the Investment Sub-Advisory Agreements between the Adviser and each of Wellington Management Company LLP and Lazard Asset Management LLC (each a “Subadviser” and together, the “Subadvisers”) with respect to certain funds.
In determining whether to approve the continuation of the Investment Advisory Agreement and the Investment Sub-Advisory Agreements, the Adviser and Subadvisers furnished information necessary for a majority of the Independent Trustees to make the determination that the continuance of the Agreements was in the best interests of the respective funds and their shareholders. The information provided to the Board included: (1) data comparing advisory fees and expense ratios of comparable investment companies; (2) comparative performance information; (3) the Adviser’s and its affiliates’ revenues and costs of providing services to the funds; and (4) information about the Adviser’s and Subadvisers’ personnel. Prior to voting, the Independent Trustees reviewed the proposed continuance of the Investment Advisory Agreement and the Investment Sub-Advisory Agreements with management and independent legal counsel to the Independent Trustees and received materials from such counsel discussing the legal standards for their consideration of the proposed continuation of the Agreements. The Independent Trustees also reviewed the proposed continuation of the Investment Advisory Agreement and each Investment Sub-Advisory Agreement with independent legal counsel in a private session at which no representatives of management were present. The Independent Trustees made a variety of additional inquiries regarding the written materials provided by the Adviser and the Subadvisers, and representatives of the Adviser and Subadvisers, respectively, discussed with the Independent Trustees each of those additional inquiries at the July 2017 meeting.
In approving the continuance of the Investment Advisory Agreement and the Investment Sub-Advisory Agreements, the Board considered various factors, among them: (1) the nature, extent and quality of services provided by the Adviser and Subadvisers to the funds, as applicable, including the personnel providing such services; (2) the Adviser’s and Subadvisers’ compensation and profitability; (3) a comparison of fees and performance with comparable funds and accounts; (4) economies of scale; and (5) the terms of the Investment Advisory Agreement and the Investment Sub-Advisory Agreements. The Board’s analysis of these factors is set forth below. The Independent Trustees were advised by independent legal counsel throughout the process.
Nature, Extent and Quality of Services. The Board reviewed a variety of materials provided by the Adviser and Subadvisers in connection with the Board’s consideration of the renewal of the Trust’s Investment Advisory Agreement with the Adviser and the Investment Sub-Advisory Agreements with the Subadvisers. The Board reviewed and considered a variety of fund specific information for each fund.
The Board reviewed the biographies and tenure of the personnel involved in Trust management and the experience of the Adviser (and applicable Subadviser) and its affiliates as investment manager to other investment companies with similar investment strategies or to individual clients or institutions with similar investment strategies. They recognized the wide array of investment professionals employed by the respective firm or firms. Representatives of the Adviser and each Subadviser discussed or otherwise presented their respective firms’ ongoing investment philosophies and strategies intended to provide investment performance consistent with each fund’s investment objectives in a variety of market environments.
The Board also discussed the various administrative services provided by the Adviser. The Board took into account that these services included arranging for third-party service providers to provide all necessary fund administration as well as ongoing monitoring of any Subadvisers to the funds. Based on their review of the information provided, the Independent Trustees determined with respect to each fund that the nature, extent and quality of services provided by the Adviser (and applicable Subadviser) to the fund were satisfactory.
Fund Investment Performance. With regard to the investment performance of each fund, the Board reviewed current performance information provided in the written Board materials. They discussed the reasons for both outperformance and underperformance relative to the applicable peer groups, indices and benchmarks. They recognized that the usefulness of comparative performance data as a frame of reference to measure a fund’s performance may be limited because the performance peer group, among other things, may not precisely reflect the objectives and strategies of the fund, may have a different investable universe, or the composition of the peer group may be limited in size or number as well as other factors. They discussed the unique aspects of the securities markets applicable to particular funds so that the performance of any such funds could be reviewed in context.
The Trustees reviewed with the Adviser both long-term and short-term performance of each fund and considered the effect on long-term performance that may have been attributable to any previous portfolio managers to any fund or to a different investment strategy. They recognized that the performance data reflects a snapshot in time, in this case as of the end of the most recent calendar year or quarter. They took into account that a different performance period, however, could generate significantly different results. Further, they noted that long-term performance can be adversely affected by even one period of significant underperformance so that a single investment decision or theme has the ability to disproportionately affect long-term performance. The Board also noted that it reviews on a quarterly basis detailed information for each fund, including investment performance results, portfolio composition and investment philosophies, processes and strategies. They also considered whether any relative underperformance was appropriate in view of the Adviser’s conservative investment philosophy. The Board discussed the conservative investment philosophy implemented across certain funds and recognized the challenges to achieving relative outperformance given the unprecedented bull market. The Board noted the type of market environments that favor the funds’ strategies and discussed the funds’ performance in such market environments. The Board performed this review in connection with the Adviser and each Subadviser. In connection with the review of the funds’ investment performance, the Board also engaged in a comprehensive discussion of market conditions and discussed the reasons for fund performance under such conditions. The equity funds participated reasonably well in a generally strong market environment and captured less downside during market corrections. The equity funds generally employ strategies that assume lower risk than that of the aggregate market. Regarding the allocation funds, the Board noted the risk adjusted performance of all three allocation funds rank in the top quartile over the trailing five year period. With regard to fixed-income funds, the Board considered each fund’s relatively conservative investment philosophy and high-quality bias during a period of historically low interest rates and the relative risks to fixed-income funds in the current environment. Representatives of the Adviser discussed with the Board the methodology for arriving at peer groups and indices used for performance comparisons. The Board also considered that sometimes the Morningstar categories the funds fall into do not precisely match a fund’s investment strategy and philosophy. Based on their review, the Independent Trustees determined that, given the totality of the above factors and considerations, each fund’s overall investment performance had been satisfactory.
Costs and Profitability. With regard to the costs of the services to be provided and the profits to be realized by the Adviser and its affiliates from the relationship with the
Madison Funds | Other Information (unaudited) - continued | October 31, 2017
Trust, the Board reviewed the expense ratios for comparable funds in each fund’s peer group. The Board reviewed these matters with respect to the Adviser and each Subadviser.
The Board noted that the Adviser or its affiliates, and, as applicable, each Subadviser, provided investment management services to other investment company and/or non-investment company clients and considered the fees charged by the Adviser (and respective Subadviser) to such funds and clients for purposes of determining whether the given advisory fee was disproportionately large under the legal standard traditionally used by investment company boards in connection with contract renewal considerations. The Board took those fees into account and considered the differences in services and time required by the various types of funds and clients to which the Adviser (or Subadviser, if applicable) provided services. The Board recognized that significant differences may exist between the services provided to one type of fund or client and those provided to others, such as those resulting from a greater frequency of shareholder redemptions in a mutual fund and the higher portfolio turnover rates typically experienced by mutual funds. The Board gave such comparisons the weight that they merit in light of the similarities and differences between the services that the various funds require. They considered that, if the services rendered by the Adviser (or Subadviser, if applicable) to one type of fund or client differed significantly from others, then the comparison should be given less weight. In the case of non-investment company clients for which the Adviser (or Subadviser, if applicable) may act as either investment adviser or Subadviser, the Board noted that the fee may be lower than the fee charged to the Trust. The Board also noted the various administrative, operational, compliance, legal and corporate communication services required to be handled by the Adviser (or Subadviser, if applicable) which are performed for investment company clients but are not typically performed for non-investment company clients.
The Trustees compared each fund’s total expense ratio and advisory fee to those of comparable funds with similar investment objectives and strategies. The Board noted the simple expense structure maintained by the Trust: an advisory fee and a capped administrative “services” expense.
The Trustees sought to ensure that fees paid by the Trust were reasonable. The Board reviewed materials demonstrating that although the Adviser is compensated for a variety of the administrative services it provides or arranges to provide to the funds pursuant to its administrative services agreements with the Trust (“Services Agreement”), such compensation does not always cover all costs because the Services Agreement effectively acts as a cap on administrative expenses. Therefore, the Board recognized that some of the administrative, operational, regulatory or compliance fees or costs in excess of the Services Agreement fees are paid by the Adviser from investment advisory fees earned. In this regard, the Trustees noted that examination of each fund’s total expense ratio compared to those of other investment companies was more meaningful than a comparison of management fee schedules alone.
The Board recognized that to the extent a fund invests in other funds managed by the Adviser (or its affiliates), the Adviser (or an affiliate) receives investment advisory fees from both the fund and the underlying fund. The Board was satisfied in this regard that the Adviser (or an affiliate) provides separate services to the Trust’s “fund of funds” portfolios and the underlying funds in which each such fund invests in exchange for the fees received from them.
The Board noted that for some smaller funds, the salaries of all portfolio management personnel, trading desk personnel, corporate accounting personnel and employees of the Adviser who serve as Trust officers, as well as facility costs (e.g., rent, etc.), could not be supported by fees received from such funds alone. However, the Board recognized that the Trust is profitable to the Adviser because such salaries and fixed costs are already paid in whole or in part from revenue generated by management of other client assets managed by the Adviser, including the Trust as one of a consolidated family of investment companies. The Trustees noted that total assets managed by the Adviser and its affiliates of approximately $16 billion at the time of the meeting. As a result, although the fees paid by an individual fund at its present size might not be sufficient to profitably support a stand-alone fund, the Trust is reasonably profitable to the Adviser as part of its larger, diversified organization. In sum, the Trustees recognized that the Trust is important to the Adviser and is managed with the attention given to the Adviser’s other clients.
Based on the foregoing, the Independent Trustees concluded that the level of profitability to the Adviser and its affiliates was reasonable in light of the services provided. In considering the profitability of each Subadviser, the Board noted that the Sub-advisory fees payable under the Investment Sub-Advisory Agreements were paid by the Adviser out of the fees that it receives under the Investment Advisory Agreement and were negotiated by the Adviser at arm’s length. As a consequence, the profitability to each Subadviser of its relationship with the applicable fund was not a substantial factor in the Board’s deliberations.
Economies of Scale. With regard to the extent to which economies of scale would be realized as each fund’s assets increase, the Trustees recognized that at their current asset levels, it was premature to discuss any economies of scale not already factored into the compensation payable under existing Advisory and Services Agreements. In addition, the Trustees recognized that the Adviser was currently waiving certain fees (pursuant to its investment management agreement or pursuant to the applicable Services Agreement, as the case may be) with regard to: the Dividend Income Fund and Government Money Market Fund.
The Board recognized that another method to help ensure the shareholders share in any economies of scale is to include breakpoints in the advisory fee schedules. Based on their review, the Independent Trustees concluded that the current advisory fee schedules and fee arrangements and waivers (as applicable) were appropriate and reflect economies of scale to be shared with shareholders when assets under management increase. In considering the economies of scale experienced by each Subadviser, the Board noted that the Sub-advisory fees payable under the Investment Sub-Advisory Agreements were paid by the Adviser out of the fees that it receives under the Investment Advisory Agreement and were negotiated by the Adviser at arm’s length. As a consequence, the Board did not consider the potential economies of scale in each Subadviser’s management of the applicable fund to be a substantial factor in its deliberations, although the Board noted that the Sub-advisory fee schedule for the fund managed by Lazard Asset Management contained a breakpoint that would reduce the Sub-advisory fee rate on assets above specified levels as the applicable fund’s assets increased.
Conclusions. In considering the renewal of the funds’ Investment Advisory Agreement with the Adviser, the Board, including the Independent Trustees, did not identify any single factor as controlling, and each Trustee may have attributed different weights to the various factors. The Trustees evaluated all information available to them on a fund-by-fund basis, and their determinations were made separately with respect to each fund. The Board reached the following conclusions regarding each fund’s Investment Advisory Agreement, among others: (a) the Adviser demonstrated that it possesses the capability and resources to perform the duties required of it under the Investment Advisory Agreement; (b) the Adviser is qualified to manage the fund’s assets in accordance with the fund’s investment objective and strategies; (c) the overall investment performance of the fund is satisfactory relative to the performance of funds with similar investment objectives and relevant indices and benchmarks; (d) the fund’s advisory fee is reasonable in light of the services received by the fund from the Adviser and other factors considered; and (e) the Adviser’s investment strategies are appropriate for pursuing the investment objectives of the fund. Based on the foregoing conclusions, the Trustees determined with respect to each fund that continuation of the Investment Advisory Agreement with the Adviser was in the best interests of the fund and its shareholders.
In considering the renewal of the Investment Sub-Advisory Agreement with respect to each Subadviser, the Board, including the Independent Trustees, did
Madison Funds | Other Information (unaudited) - continued | October 31, 2017
not identify any single factor as controlling, and each Trustee may have attributed different weights to the various factors. The Board reached the following conclusions regarding each applicable fund’s Sub-Advisory Agreement, among others: (a) the applicable Subadviser demonstrated that it possesses the capability and resources to perform the duties required of it under the applicable Investment Sub-Advisory Agreement; (b) the applicable Subadviser is qualified to manage the fund’s assets in accordance with the fund’s investment objectives and policies; (c) the overall investment performance of the fund is satisfactory relative to the performance of funds with similar investment objectives and relevant indices and benchmarks; (d) the fund’s Sub-advisory fee is reasonable in light of the services received by the fund from the applicable Subadviser; and (e) the applicable Subadviser’s investment strategies are appropriate for pursuing the investment objectives of the fund. Based on the foregoing conclusions, the Board determined that approval of each Investment Sub-Advisory Agreements with the applicable Subadviser was in the best interests of the applicable fund and its shareholders.
FUND EXPENSES PAID BY SHAREHOLDERS
As shareholders of the funds, you incur two types of costs: (1) transaction costs, including sales charges (loads) on purchase payments, and redemption fees; and (2) ongoing costs, including management fees; distribution and/or service (12b-1) fees; and other fund expenses. The examples below are intended to help you understand your ongoing costs (in dollars) of investing in the funds and to compare these costs with the ongoing costs of investing in other mutual funds.
The examples below are based on an investment of $1,000 invested at the beginning of the period and held for the entire six-month period ended October 31, 2017. Expenses paid during the period in the tables below are equal to the fund’s annualized expense ratio, multiplied by the average account value over the period, multiplied by 184/366 (to reflect the one-half fiscal year period).
Actual Expenses
The table below provides information about actual account values using actual expenses and actual returns for the funds. You may use the information in this table, together with the amount you invested, to estimate the expenses that you paid over the period. Simply divide your account value by $1,000 (for example, an $8,600 account value divided by $1,000 = 8.6), then multiply the result by the number in the table for the fund you own under the heading entitled “Expenses Paid During Period” to estimate the expenses you paid on your account during this period.
| | | CLASS A | | | | CLASS B |
| | | | | | | |
| | | Beginning | | Ending | | Annual | | Expenses Paid | | | | Ending | | Annual | | Expenses Paid |
| Fund | | Account Value | | Account Value | | Expense Ratio | | During Period | | | | Account Value | | Expense Ratio | | During Period |
| Conservative Allocation* | | | $1,000 | | | | $1,041.50 | | | | 0.70 | % | | | $3.60 | | | | | | $1,038.30 | | | | 1.45 | % | | | $7.45 | |
| Moderate Allocation* | | | 1,000 | | | | 1,062.70 | | | | 0.70 | % | | | 3.64 | | | | | | 1,058.80 | | | | 1.45 | % | | | 7.52 | |
| Aggressive Allocation* | | | 1,000 | | | | 1,079.90 | | | | 0.70 | % | | | 3.67 | | | | | | 1,075.80 | | | | 1.45 | % | | | 7.59 | |
| Government Money Market | | | 1,000 | | | | 1,002.00 | | | | 0.51 | % | | | 2.72 | | | | | | 1,000.10 | | | | 0.62 | % | | | 4.59 | |
| Core Bond | | | 1,000 | | | | 1,014.20 | | | | 0.90 | % | | | 4.57 | | | | | | 1,010.30 | | | | 1.65 | % | | | 8.36 | |
| High Income | | | 1,000 | | | | 1,032.20 | | | | 1.00 | % | | | 5.12 | | | | | | 1,029.10 | | | | 1.75 | % | | | 8.95 | |
| Diversified Income | | | 1,000 | | | | 1,059.30 | | | | 1.10 | % | | | 5.71 | | | | | | 1,056.30 | | | | 1.85 | % | | | 9.59 | |
| Covered Call & Equity Income | | | 1,000 | | | | 1,012.10 | | | | 1.25 | % | | | 6.34 | | | | | | N/A | | | | N/A | | | | N/A | |
| Large Cap Value | | | 1,000 | | | | 1,065.20 | | | | 1.16 | % | | | 6.04 | | | | | | 1,061.10 | | | | 1.91 | % | | | 9.92 | |
| Investors | | | 1,000 | | | | 1,092.70 | | | | 1.20 | % | | | 6.33 | | | | | | 1,000.00 | | | | N/A | | | | N/A | |
| Mid Cap | | | 1,000 | | | | 1,054.00 | | | | 1.40 | % | | | 7.25 | | | | | | 1,051.40 | | | | 2.15 | % | | | 11.12 | |
| Small Cap | | | 1,000 | | | | 1,021.10 | | | | 1.50 | % | | | 7.64 | | | | | | 1,016.70 | | | | 2.25 | % | | | 11.44 | |
| International Stock | | | 1,000 | | | | 1,092.00 | | | | 1.60 | % | | | 8.44 | | | | | | 1,087.80 | | | | 2.35 | % | | | 12.37 | |
| | | CLASS C |
| | | |
| Fund | | Beginning Account Value | | Ending Account Value | | Annual Expense Ratio | | Expenses Paid During Period |
| Conservative Allocation* | | | $1,000 | | | | $1,038.30 | | | | 1.45 | % | | $ | 7.45 | |
| Moderate Allocation* | | | 1,000 | | | | 1,058.80 | | | | 1.45 | % | | | 7.52 | |
| Aggressive Allocation* | | | 1,000 | | | | 1,075.70 | | | | 1.45 | % | | | 7.59 | |
| Diversified Income | | | 1,000 | | | | 1,056.30 | | | | 1.85 | % | | | 9.59 | |
| Covered Call & Equity Income | | | 1,000 | | | | 1,008.00 | | | | 2.00 | % | | | 10.12 | |
| | | CLASS Y |
| | | |
| Fund | | Beginning Account Value | | Ending Account Value | | Annual Expense Ratio | | Expenses Paid During Period |
| Tax-Free Virginia | | | $1,000 | | | | $1,012.90 | | | | 0.85 | % | | | $4.31 | |
| Tax-Free National | | | 1,000 | | | | 1,013.40 | | | | 0.75 | % | | | 3.81 | |
| High Quality Bond | | | 1,000 | | | | 1,005.10 | | | | 0.49 | % | | | 2.48 | |
| Core Bond | | | 1,000 | | | | 1,014.50 | | | | 0.65 | % | | | 3.30 | |
| Corporate Bond | | | 1,000 | | | | 1,027.80 | | | | 0.65 | % | | | 3.32 | |
| High Income | | | 1,000 | | | | 1,034.10 | | | | 0.75 | % | | | 3.85 | |
| Covered Call & Equity Income | | | 1,000 | | | | 1,013.00 | | | | 1.00 | % | | | 5.07 | |
| Dividend Income | | | 1,000 | | | | 1,092.50 | | | | 0.95 | % | | | 5.01 | |
| Large Cap Value | | | 1,000 | | | | 1,065.90 | | | | 0.91 | % | | | 4.74 | |
| Investors | | | 1,000 | | | | 1,093.90 | | | | 0.95 | % | | | 5.01 | |
| Mid Cap | | | 1,000 | | | | 1,057.40 | | | | 0.98 | % | | | 5.08 | |
| Small Cap | | | 1,000 | | | | 1,021.60 | | | | 1.25 | % | | | 6.37 | |
| International Stock | | | 1,000 | | | | 1,093.50 | | | | 1.35 | % | | | 7.12 | |
| | | CLASS R6 |
| | | |
| Fund | | Beginning Account Value | | Ending Account Value | | Annual Expense Ratio | | Expenses Paid During Period |
| Core Bond | | | $1,000 | | | | $1,016.50 | | | | 0.52 | % | | | $2.64 | |
| Covered Call & Equity Income | | | 1,000 | | | | 1,014.00 | | | | 0.87 | % | | | 4.42 | |
| Investors | | | 1,000 | | | | 1,095.30 | | | | 0.77 | % | | | 4.07 | |
| Mid Cap | | | 1,000 | | | | 1,058.60 | | | | 0.77 | % | | | 4.00 | |
| *The annual expense ratio does not include the expenses of the underlying funds. |
Madison Funds | Other Information (unaudited) - continued | October 31, 2017
Hypothetical Example for Comparison Purposes
The table below provides information about hypothetical account values and hypothetical expenses based on the funds’ actual expense ratios and an assumed rate of return of 5% per year before expenses, which are not the funds’ actual returns. The hypothetical account values and expenses may not be used to estimate the actual ending account balance or expenses you paid for the period. You may use this information to compare the ongoing costs of investing in the funds and other funds. To do so, compare the 5% hypothetical example of the funds you own with the 5% hypothetical examples that appear in the shareholder reports of other similar funds.
| | | CLASS A | | | | CLASS B |
| | | | | | | |
| | | Beginning | | Ending | | Annual | | Expenses Paid | | | | Ending | | Annual | | Expenses Paid |
| Fund | | Account Value | | Account Value | | Expense Ratio | | During Period | | | | Account Value | | Expense Ratio | | During Period |
| Conservative Allocation* | | | $1,000 | | | | $1,021.68 | | | | 0.70 | % | | | $3.57 | | | | | | $1,017.90 | | | | 1.45 | % | | | $7.38 | |
| Moderate Allocation* | | | 1,000 | | | | 1,021.68 | | | | 0.70 | % | | | 3.57 | | | | | | 1,017.90 | | | | 1.45 | % | | | 7.38 | |
| Aggressive Allocation* | | | 1,000 | | | | 1,021.68 | | | | 0.70 | % | | | 3.57 | | | | | | 1,017.90 | | | | 1.45 | % | | | 7.38 | |
| Government Money Market | | | 1,000 | | | | 1,022.48 | | | | 0.51 | % | | | 2.75 | | | | | | 1,020.62 | | | | 0.62 | % | | | 4.63 | |
| Core Bond | | | 1,000 | | | | 1,020.67 | | | | 0.90 | % | | | 4.58 | | | | | | 1,016.89 | | | | 1.65 | % | | | 8.39 | |
| High Income | | | 1,000 | | | | 1,020.16 | | | | 1.00 | % | | | 5.09 | | | | | | 1,016.38 | | | | 1.75 | % | | | 8.89 | |
| Diversified Income | | | 1,000 | | | | 1,019.66 | | | | 1.10 | % | | | 5.60 | | | | | | 1,015.88 | | | | 1.85 | % | | | 9.40 | |
| Covered Call & Equity Income | | | 1,000 | | | | 1,018.90 | | | | 1.25 | % | | | 6.36 | | | | | | N/A | | | | N/A | | | | N/A | |
| Large Cap Value | | | 1,000 | | | | 1,019.36 | | | | 1.16 | % | | | 5.90 | | | | | | 1,015.58 | | | | 1.91 | % | | | 9.70 | |
| Investors | | | 1,000 | | | | 1,019.16 | | | | 1.20 | % | | | 6.11 | | | | | | 1,000.00 | | | | N/A | | | | N/A | |
| Mid Cap | | | 1,000 | | | | 1,018.15 | | | | 1.40 | % | | | 7.12 | | | | | | 1,014.37 | | | | 2.15 | % | | | 10.92 | |
| Small Cap | | | 1,000 | | | | 1,017.64 | | | | 1.50 | % | | | 7.63 | | | | | | 1,013.86 | | | | 2.25 | % | | | 11.42 | |
| International Stock | | | 1,000 | | | | 1,017.14 | | | | 1.60 | % | | | 8.13 | | | | | | 1,013.36 | | | | 2.35 | % | | | 11.93 | |
| | | CLASS C |
| | | |
| Fund | | Beginning Account Value | | Ending Account Value | | Annual Expense Ratio | | Expenses Paid During Period |
| Conservative Allocation* | | | $1,000 | | | | $1,017.90 | | | | 1.45 | % | | $ | 7.38 | |
| Moderate Allocation* | | | 1,000 | | | | 1,017.90 | | | | 1.45 | % | | | 7.38 | |
| Aggressive Allocation* | | | 1,000 | | | | 1,017.90 | | | | 1.45 | % | | | 7.38 | |
| Diversified Income | | | 1,000 | | | | 1,015.88 | | | | 1.85 | % | | | 9.40 | |
| Covered Call & Equity Income | | | 1,000 | | | | 1,015.12 | | | | 2.00 | % | | | 10.16 | |
| | | CLASS Y |
| | | |
| Fund | | Beginning Account Value | | Ending Account Value | | Annual Expense Ratio | | Expenses Paid During Period |
| Tax-Free Virginia | | | $1,000 | | | | $1,020.92 | | | | 0.85 | % | | $ | 4.33 | |
| Tax-Free National | | | 1,000 | | | | 1,021.42 | | | | 0.75 | % | | | 3.82 | |
| High Quality Bond | | | 1,000 | | | | 1,022.74 | | | | 0.49 | % | | | 2.50 | |
| Core Bond | | | 1,000 | | | | 1,021.93 | | | | 0.65 | % | | | 3.31 | |
| Corporate Bond | | | 1,000 | | | | 1,021.93 | | | | 0.65 | % | | | 3.31 | |
| High Income | | | 1,000 | | | | 1,021.42 | | | | 0.75 | % | | | 3.82 | |
| Covered Call & Equity Income | | | 1,000 | | | | 1,020.16 | | | | 1.00 | % | | | 5.09 | |
| Dividend Income | | | 1,000 | | | | 1,020.42 | | | | 0.95 | % | | | 4.84 | |
| Large Cap Value | | | 1,000 | | | | 1,020.62 | | | | 0.91 | % | | | 4.63 | |
| Investors | | | 1,000 | | | | 1,020.42 | | | | 0.95 | % | | | 4.84 | |
| Mid Cap | | | 1,000 | | | | 1,020.27 | | | | 0.98 | % | | | 4.99 | |
| Small Cap | | | 1,000 | | | | 1,018.90 | | | | 1.25 | % | | | 6.36 | |
| International Stock | | | 1,000 | | | | 1,018.40 | | | | 1.35 | % | | | 6.87 | |
| | | CLASS R6 |
| | | |
| Fund | | Beginning Account Value | | Ending Account Value | | Annual Expense Ratio | | Expenses Paid During Period |
| Core Bond | | | $1,000 | | | | $1,022.58 | | | | 0.52 | % | | | $2.65 | |
| Covered Call & Equity Income | | | 1,000 | | | | 1,020.82 | | | | 0.87 | % | | | 4.43 | |
| Investors | | | 1,000 | | | | 1,021.32 | | | | 0.77 | % | | | 3.92 | |
| Mid Cap | | | 1,000 | | | | 1,021.32 | | | | 0.77 | % | | | 3.92 | |
| *The annual expense ratio does not include the expenses of the underlying funds. |
Please note that the expenses shown in the tables are meant to highlight your ongoing costs only and do not reflect any transactional costs, such as sales charges (loads), or redemption fees. The information provided in the hypothetical example table is useful in comparing ongoing costs only, and will not help you determine the relative total costs of owning different funds. In addition, if these transactional costs were included, your costs would have been higher.
Madison Funds | Other Information (unaudited) - concluded | October 31, 2017
AVAILABILITY OF QUARTERLY PORTFOLIO SCHEDULES
The funds file their complete schedule of portfolio holdings with the SEC for the first and third quarters of each fiscal year on Form N-Q. Form N-Q is available to shareholders at no cost by calling 1-800-877-6089 or on the SEC’s website at www.sec.gov. Form N-Q may also be reviewed and copied at the SEC’s Public Reference Room in Washington, DC. More information on the operation of the Public Reference Room may be obtained by calling 1-800-SEC-0330.
PROXY VOTING POLICIES, PROCEDURES AND RECORDS
A description of the policies and procedures used by the funds to vote proxies related to portfolio securities is available to shareholders at no cost on the funds’ website at www.madisonfunds.com, by calling 1-800-877-6089, or on the SEC’s website at www.sec.gov. The proxy voting records for the funds for the most recent twelve-month period ended June 30 are available to shareholders at no cost by calling 1-800-877-6089 or on the SEC’s website at www.sec.gov.
FORWARD-LOOKING STATEMENT DISCLOSURE
One of our most important responsibilities as investment company managers is to communicate with shareholders in an open and direct manner. Some of our comments in our letters to Shareholders are based on current management expectations and are considered “forward-looking statements.” Actual future results, however, may prove to be different from our expectations. You can identify forward-looking statements by words such as estimate, may, will, expect, believe, plan and other similar terms. We cannot promise future returns. Our opinions are a reflection of our best judgment at the time this report is compiled, and we disclaim any obligation to update or alter forward-looking statements as a result of new information, future events, or otherwise.
TAX INFORMATION
Foreign Tax Credits: The funds expect to make an election under Internal Revenue Code Section 853 to pass through foreign taxes paid by the funds to their shareholders. For the year ended 2017, the following funds intend to pass through foreign tax credits and have derived gross income from foreign countries amounting to:
| Fund | | Foreign Tax Credit Pass-Through | | Foreign Source Income |
| International Stock | | $76,546 | | $844,009 |
Complete information regarding the funds’ foreign tax credit pass through to shareholders for the year ended 2017 will be reported in conjunction with Form 1099-DIV.
Corporate Dividends Received Deduction: For the taxable year ended 2017, the following percentage of income dividends paid by the fund qualify for the dividends received deduction available to corporations:
| Fund | | Percentage | | | Fund | | Percentage |
| Conservative Allocation | | | 9.40 | % | | | Dividend Income | | | 93.48 | % |
| Moderate Allocation | | | 26.70 | % | | | Large Cap Value | | | 42.23 | % |
| Aggressive Allocation | | | 27.15 | % | | | Mid Cap | | | 100.00 | % |
| Diversified Income | | | 85.35 | % | | | Small Cap | | | 100.00 | % |
| Covered Call Equity Income | | | 21.81 | % | | | | | | | |
Qualified Dividend Income: For the taxable year ended 2017, the funds hereby designate the maximum amount of dividends allowable pursuant to the Internal Revenue Code, as qualified dividend income (“QDI”) eligible for reduced tax rates (the rates range from 5% to 15% depending upon individual’s tax bracket). Complete information regarding each fund’s income distributions paid during the calendar year 2017, including the portion, if any, which qualify as QDI, will be reported in conjunction with Form 1099-DIV.
| Fund | | Amount | | | Fund | | Amount |
| Conservative Allocation | | $ | 352,300 | | | | Dividend Income | | $ | 1,930,891 | |
| Moderate Allocation | | | 1,148,216 | | | | Large Cap Value | | | 1,615,338 | |
| Aggressive Allocation | | | 662,573 | | | | Mid Cap | | | 78,029 | |
| Diversified Income | | | 2,553,556 | | | | Small Cap | | | 1,344,309 | |
| Covered Call & Equity Income | | | 2,371,286 | | | | International Stock | | | 339,617 | |
Madison Funds | October 31, 2017
Trustees and Officers
The address of each Trustee and officer is 550 Science Drive, Madison, Wisconsin 53711. The Statement of Additional Information, which includes additional information about the Trustees and officers, is available at no cost on the funds’ website at www.madisonfunds.com or by calling 1-800-877-6089.
| Interested Trustees and Officers |
| |
Name and
Year of Birth | | Position(s) and Length
of Time Served | | Principal Occupation(s) During Past Five Years | | Portfolios Overseen
in Fund Complex by
Director/Trustee1 | | Other Directorships Held by Director/ Trustee
During Past Five Years |
| |
Katherine L. Frank2
1960 | | Trustee and
President,
2009 - Present | | Madison Investment Holdings, Inc. (“MIH”) (affiliated investment advisory firm of the Adviser), Executive Committee Member, 2010 - 2017; Chief Operating Officer, 2010 - Present; Managing Director and Vice President, 1986 - 2010
Madison Asset Management, LLC (“Madison”), Executive Committee Member, 2010 - 2017; Chief Operating Officer, 2010 - Present; Vice President, 2004 - 2010
Madison Investment Advisors, LLC (“MIA”) (affiliated investment advisory firm of the Adviser), Executive Committee Member, 2010 - 2017; Chief Operating Officer, 2010 - Present; President, 1996 - 2010
Madison Strategic Sector Premium Fund (closed end fund), President, December 2005 - Present; Ultra Series Fund (14) (mutual funds), President, 2009 - Present; Madison Covered Call & Equity Strategy Fund (closed end fund), President, December 2012 - Present | | 32 | | Madison Strategic Sector Premium Fund, 2005 - 2017
Ultra Series Fund (14), 2009 - Present |
| |
Jay R. Sekelsky
1959 | | Vice President,
2009 -
Present | | MIH, Executive Committee Member, 2010 - 2017; Chief Investment Officer, 2010 - Present; Managing Director and Vice President, 1990 - 2010
Madison, Executive Committee Member, 2010 - 2017; Chief Investment Officer, 2010 - Present
MIA, Executive Committee Member, 2010 - 2017; Chief Investment Officer, 2010 - Present; Vice President, 1996 - 2010
Madison Strategic Sector Premium Fund, Vice President, 2005 - Present; Ultra Series Fund (14), Vice President, 2009 - Present; Madison Covered Call & Equity Strategy Fund, Vice President, December 2012 - Present | | N/A | | N/A |
| |
Paul A. Lefurgey
1964 | | Vice President,
2009 -
Present | | MIH, Madison and MIA, CEO, 2017 - Present; Chairman - Executive Committee, 2015 - 2017; Director of Fixed Income Investments, 2016 - Present; Executive Director and Head of Fixed Income Investments, 2013 - 2016; Managing Director and Head of Fixed Income Investments, 2005 - 2013
MEMBERS Capital Advisors, Inc. (“MCA”) (investment advisory firm), Madison, WI, Vice President, 2003 - 2005
Madison Strategic Sector Premium Fund, Vice President, 2010 - Present; Ultra Series Fund (14), Vice President, 2009 - Present; Madison Covered Call & Equity Strategy Fund, Vice President, December 2012 - Present | | N/A | | N/A |
| |
Greg D. Hoppe
1969 | | Treasurer,
2009 - Present | | MIH and MIA, Vice President, 1999 - Present; Madison, Vice President, 2009 - Present
Madison Strategic Sector Premium Fund, Treasurer, 2009 - Present; Chief Financial Officer, 2005 - 2009; Ultra Series Fund (14), Treasurer, 2009 - Present; Madison Covered Call & Equity Strategy Fund, Treasurer, December 2012 - Present | | N/A | | N/A |
| |
Holly S. Baggot
1960 | | Secretary, 1999 -
Present
Assistant Treasurer, 1999 -
2007; 2009 - Present
Treasurer, 2008 | | MIH and MIA, Vice President, 2010 - Present; Madison, Vice President, 2009 - Present; MFD Distributor, LLC (“MFD”) (an affiliated brokerage firm of Madison),Vice President, 2012 - Present
MCA, Director - Mutual Funds, 2008-2009; Director - Mutual Fund Operations, 2006 - 2008; Operations Officer - Mutual Funds, 2005 - 2006; Senior Manager - Product & Fund Operations, 2001 - 2005
Madison Strategic Sector Premium Fund, Secretary and Assistant Treasurer, 2010 - Present; Ultra Series Fund (14), Secretary, 1999 - Present and Treasurer, 2008 - 2009 and Assistant Treasurer, 1997 - 2007 and 2009 - Present; Madison Covered Call & Equity Strategy Fund, Secretary and Assistant Treasurer, December 2012 - Present | | N/A | | N/A |
| |
1 As of the date of this report, the fund complex consists of Madison Funds with 18 portfolios, the Ultra Series Fund with 14 portfolios, the Madison Strategic Sector Premium Fund (closed-end fund) and the Madison Covered Call & Equity Strategy Fund (closed-end fund), for a total of 34 separate portfolios in the fund complex. Not every Trustee is a member of the Board of Trustees of every fund in the fund complex, as noted above. References to the “Fund Complex” in the following tables have the meaning disclosed in this paragraph.
2 “Interested person” as defined in the 1940 Act. Considered an interested Trustee because of the position held with the investment adviser of Madison Funds.
Madison Funds | Trustees and Officers - continued | October 31, 2017
| |
Name and
Year of Birth | | Position(s) and Length
of Time Served | | Principal Occupation(s) During Past Five Years | | Portfolios Overseen
in Fund Complex by
Director/Trustee1 | | Other Directorships Held by Director/ Trustee
During Past Five Years |
| |
Kevin Thompson
1966 | | Chief Legal Officer and
Assistant Secretary,
April 2017 - Present | | MIH, MIA and Madison, Chief Legal Officer, April 2017 - Present; Chief Administrative Officer, September 2017 - Present
Madison Strategic Sector Premium Fund, Chief Legal Officer and Assistant Secretary, April 2017 - Present
Madison Covered Call & Equity Strategy Fund, Chief Legal Officer and Assistant Secretary, April 2017 - Present
Ultra Series Fund (14), Chief Legal Officer and Assistant Secretary, April 2017 - Present
CFMG Life Insurance Company, Associate General Counsel, 2012 - 2015; Vice President Wealth Management, 2015 - 2017; President of CBSI, 2016 - 2017 | | N/A | | N/A |
| |
Lisa R. Lange
1969 | | Chief Compliance Officer
and Assistant Secretary,
April 2015 - Present | | MIH, MIA and Madison, Chief Compliance Officer, April 2015 - Present and Chief Legal Officer, April 2015 - April 2017
NorthRoad Capital Management LLC (“NorthRoad”) (former affiliated investment advisory firm of Madison), Chief Compliance Officer and Chief Legal Officer April 2015 - September 2016
Madison Strategic Sector Premium Fund, Chief Compliance Officer and Assistant Secretary, April 2015 - Present and Chief Legal Officer April 2015 - April 2017
Madison Covered Call & Equity Strategy Fund, Chief Compliance Officer and Assistant Secretary, April 2015 - Present and Chief Legal Officer, April 2015 - April 2017
Ultra Series Fund (14), Chief Compliance Officer and Assistant Secretary, April 2015 - Present and Chief Legal Officer, April 2015 - April 2017
Whyte Hirschboeck Dudek S.C. (law firm), Attorney and Shareholder, 2003 - 2015 | | N/A | | N/A |
| |
1 As of the date of this report, the fund complex consists of Madison Funds with 18 portfolios, the Ultra Series Fund with 14 portfolios, the Madison Strategic Sector Premium Fund (closed-end fund) and the Madison Covered Call & Equity Strategy Fund (closed-end fund), for a total of 34 separate portfolios in the fund complex. Not every Trustee is a member of the Board of Trustees of every fund in the fund complex, as noted above. References to the “Fund Complex” in the following tables have the meaning disclosed in this paragraph.
Madison Funds | Trustees and Officers - concluded | October 31, 2017
Independent Trustees
| |
Name and
Year of Birth | | Position(s) and Length
of Time Served1 | | Principal Occupation(s) During Past Five Years | | Portfolios Overseen
in Fund Complex2 | | Other Directorships Held by Director/ Trustee
During Past Five Years |
| |
James R. Imhoff, Jr.
1944 | | Trustee, 2009 - Present | | First Weber Inc. (real estate brokers), Madison, WI, Chief Executive Officer, 1996 - July 2017 and Chairman, July 2017 - Present | | 34 | | Park Bank, 1978 - Present
Madison Strategic Sector Premium Fund, 2005 - Present; Madison Covered Call & Equity Strategy Fund, 2005 - Present; Ultra Series Fund(14), 2009 - Present |
| |
Steven P. Riege
1954 | | Trustee, 2005 - Present | | Ovation Leadership (management consulting) Milwaukee, WI, Owner/President, 2001 - Present
Robert W. Baird & Company (financial services), Milwaukee, WI, Senior Vice President-Marketing and Vice President-Human Resources, 1986 - 2001 | | 33 | | Forward Service Corporation (employment training non-profit), 2010 - Present
Lange Bros. Woodworking Co., Inc., 2017 - Present
Ultra Series Fund (14), 2005 - Present; Madison Strategic Sector Premium Fund, 2014 - 2017; Madison Covered Call & Equity Strategy Fund, 2015- Present |
| |
| Richard E. Struthers 1952 | | Trustee, 2004 - Present | | Clearwater Capital Management (investment advisory firm), Naples, FL, Chair and Chief Executive Officer 1998 - Present
Park Nicollet Health Services, Minneapolis, MN, Chairman, Finance and Investment Committee, 2006 - 2012
IAI Mutual Funds, Minneapolis, MN, President and Director, 1992 - 1997 | | 34 | | Park Nicolet Services, 2001 - 2012
HealthPartners, 2013 - 2016
Madison Strategic Sector Premium Fund, 2017 - Present; Madison Covered Call & Equity Strategy Fund, 2017 - Present; Ultra Series Fund (14), 2004 - Present |
| |
Carrie J. Thome
1968 | | Trustee, May 2017- Present | | Wisconsin Alumni Research Foundation, Madison, WI, Chief Investment Officer, 2007 - Present | | 32 | | Ultra Series Fund (14), May 2017 - Present |
| |
1 Independent Trustees serve in such capacity until the age of 76, unless retirement is waived by unanimous vote of the remaining Trustees on an annual basis.
2 As of the date of this report, the fund complex consists of Madison Funds with 18 portfolios, the Ultra Series Fund with 14 portfolios, the Madison Strategic Sector Premium Fund (closed-end fund) and the Madison Covered Call & Equity Strategy Fund (closed-end fund), for a total of 34 separate portfolios in the fund complex. Not every Trustee is a member of the Board of Trustees of every fund in the fund complex, as noted above. References to the “Fund Complex” in the preceding tables have the meaning disclosed in this paragraph.
74
Madison Funds | October 31, 2017
This page was intentionally left blank.
75
Madison Funds | October 31, 2017
This page was intentionally left blank.
76
Madison Funds | October 31, 2017
This page was intentionally left blank.
77
Madison Funds | October 31, 2017
This page was intentionally left blank.
78
Madison Funds | October 31, 2017
This page was intentionally left blank.
79
Madison Funds | October 31, 2017
This page was intentionally left blank.
80
 | | Presorted Standard
U.S. POSTAGE
PAID
Louisville, KY
Permit No. 1051 | |
Madison Funds
Post Office Box 8390
Boston, MA 02266-8390
1 (800) 877-6089
www.madisonfunds.com
SEC File Number: 811-08261 | | | |
4460-P1053
Rev. 1017
Item 2. Code of Ethics.
(a) The Trust has adopted a code of ethics that applies to the Trust’s principal executive officer, principal financial officer, principal accounting officer or controller or persons performing similar functions, regardless of whether these individuals are employed by the Trust or a third party.
(c) During the period covered by the report, registrant did not make any substantive amendments to the Code.
(d) During the period covered by the report, registrant did not grant any waivers, including implicit waivers, from the provisions of the Code.
(f) Any person may obtain a complete copy of the code without charge by calling the Adviser at 800-767-0300 and requesting a copy of “the Madison Funds Sarbanes Oxley Code of Ethics.”
Item 3. Audit Committee Financial Expert.
In July 2017, Richard Struthers, an “independent” Trustee and a member of the Trust’s audit committee, was appointed to serve as the Trust’s audit committee financial expert among the four independent Trustees who so qualify to serve in that capacity.
Item 4. Principal Accountant Fees and Services.
(a) Audit Fees. Total audit fees paid (or to be paid) to the registrant’s principal accountant for the fiscal years ended October 31, 2017 and 2016, respectively were $201,000 ($450,000 including the Ultra Series Fund, the Madison Strategic Sector Premium Fund and the Madison Covered Call & Equity Strategy Fund, all affiliated investment companies “together, the “Affiliated Funds”) and $201,800 ($446,800 including the Affiliated Funds).
(b) Audit-Related Fees. For the fiscal years ended October 31, 2017 and October 31, 2016, the aggregate fees for professional services rendered by Deloitte & Touche for assurance and related services by such firm that were reasonably related to the performance of the audit of the Trust’s annual financial statements other than those referenced in paragraph (a) above, totaled $0 and $22,500, respectively.
(c) Tax-Fees. The Audit Committee has pre-approved, as required by Rule 2-01(c)(7)(i)(C) of Regulation S-X, 100% of the services described in this Item 4(b) through (d), which such services are described above.
For the fiscal years ended October 31, 2017 and October 31, 2016, the aggregate fees for professional services rendered by Deloitte & Touche for tax compliance, tax advice and tax planning for such fiscal years, totaled $91,328 and $99,294, respectively.
In the scope of services comprising the fees disclosed under this Item 4(c) were the following services:
-Review and sign as signature preparer for U.S. Income Tax Return for Regulated Investment Companies, Form 1120-RIC and the Return of Excise Tax on Undistributed Income of Regulated Investment Companies, Form 8613.
(d) All Other Fees. None.
(e) (1) Before any accountant is engaged by the registrant to render audit or non-audit services, the engagement must be approved by the audit committee as contemplated by paragraph (c)(7)(i)(A) of Rule 2-01of Regulation S-X.
(2) The Audit Committee has pre-approved, as required by Rule 2-01(c)(7)(i)(C) of Regulation S-X, 100% of the services described in this Item 4(b) through (d), which such services are described above.
(f) None.
(g) None.
(h) None.
Item 5. Audit Committee of Listed Registrants.
Not applicable.
Item 6. Schedule of Investments
Schedule included as part of the report to shareholders filed under Item 1 of this Form.
Item 7. Disclosure of Proxy Voting Policies and Procedures for Closed-End Management Investment Companies.
Not applicable.
Item 8. Portfolio Managers of Closed-End Management Investment Companies.
Not applicable.
Item 9. Purchases of Equity Securities by Closed-End Management Investment Company and Affiliated Purchasers.
Not applicable.
Item 10. Submission of Matters to a Vote of Security Holders.
The Trust does not normally hold shareholder meetings. There have been no changes to the Trust’s procedures during the period covered by this report.
Item 11. Controls and Procedures.
(a) The Trust’s principal executive officer and principal financial officer determined that the Trust’s disclosure controls and procedures (as defined in Rule 30a-3(c) under the Investment Company Act of 1940 (the “Act”)) are effective, based on their evaluation of these controls and procedures required by Rule 30a-3(b) under the Act and Rules 13a-15(b) or 15d-15(b) under the Securities Exchange Act of 1934 within 90 days of the date of this report. There were no significant changes in the Trust’s internal controls or in other factors that could significantly affect these controls subsequent to the date of their evaluation. The officers identified no significant deficiencies or material weaknesses.
(b) There were no changes in the Trust’s internal control over financial reporting (as defined in Rule 30a-3(d) under the Act) that occurred during the second fiscal quarter of the period covered by this report that has materially affected, or is reasonably likely to materially affect, the Trust’s internal control over financial reporting.
Item 12. Disclosure of Securities Lending Activities for Closed-End Management Investment Companies.
Not applicable.
Item 13. Exhibits.
(a)(1) Code of ethics - See Item 2.
(a)(2) Certifications of principal executive and principal financial officers as required by Rule 30a-2(a) under the Act.
(b) Certification of principal executive and principal financial officers as required by Rule 30a-2(b) under the Act.
SIGNATURES
Pursuant to the requirements of the Securities Exchange Act of 1934 and the Investment Company Act of 1940, the Registrant has duly caused this Report to be signed on its behalf by the undersigned, thereunto duly authorized.
Madison Funds
/s/ Kevin S. Thompson
Kevin S. Thompson, Chief Legal Officer
Date: January 2, 2018
Pursuant to the requirements of the Securities Exchange Act of 1934 and the Investment Company Act of 1940, this Report has been signed below by the following persons on behalf of the Registrant and in the capacities and on the dates indicated.
/s/ Katherine L. Frank
Katherine L. Frank, Principal Executive Officer
Date: January 2, 2018
/s/ Greg Hoppe
Greg Hoppe, Principal Financial Officer
Date: January 2, 2018