OMB APPROVAL
OMB Number: 3235-0570
Expires: September 30, 2025
Estimated average burden hours per response...20.59
UNITED STATES SECURITIES AND EXCHANGE COMMISSION
Washington, DC 20549
FORM N-CSR
CERTIFIED SHAREHOLDER REPORT OF REGISTERED
MANAGEMENT INVESTMENT COMPANIES
Investment Company Act file number 811-08261
Madison Funds
(Exact name of registrant as specified in charter)
550 Science Drive, Madison, WI 53711
(Address of principal executive offices)(Zip code)
Steve J. Fredricks
Chief Legal Officer & Chief Compliance Officer
550 Science Drive
Madison, WI 53711
(Name and address of agent for service)
Registrant's telephone number, including area code: 608-274-0300
Date of fiscal year end: October 31
Date of reporting period: October 31, 2023
Form N-CSR is to be used by management investment companies to file reports with the Commission not later than 10 days after the transmission to stockholders of any report that is required to be transmitted to stockholders under Rule 30e-1 under the Investment Company Act of 1940 (17 CFR 270.30e-1). The Commission may use the information provided on Form N-CSR in its regulatory, disclosure review, inspection, and policymaking roles.
A registrant is required to disclose the information specified by Form N-CSR, and the Commission will make this information public. A registrant is not required to respond to the collection of information contained in Form N-CSR unless the Form displays a currently valid Office of Management and Budget ("OMB") control number. Please direct comments concerning the accuracy of the information collection burden estimate and any suggestions for reducing the burden to Secretary, Securities and Exchange Commission, 450 Fifth Street, NW, Washington, DC 20549-0609. The OMB has reviewed this collection of information under the clearance requirements of 44 U.S.C. § 3507.
Item 1. Report to Shareholders.

Madison Funds | October 31, 2023
Although each fund’s name begins with the word “Madison,” the word “Madison” may be omitted in this report for simplicity when referring to any particular fund, group of funds or list of funds.
Nondeposit investment products are not federally insured, involve investment risk, may lose value and are not obligations of or guaranteed by any financial institution.
For more complete information about Madison Funds, including charges and expenses, request a prospectus from your financial advisor or from Madison Funds, P.O. Box 219083, Kansas City, MO 64121-9083. Consider the investment objectives, risks, and charges and expenses of any fund carefully before investing. The prospectus contains this and other information about the funds.
For more current performance information, please call 1-800-877-6089 or visit our website at www.madisonfunds.com. Current performance may be lower or higher than the performance data quoted within this report. Performance data shown represents past performance, past performance does not guarantee future results.
Nothing in this report represents a recommendation of a security by the investment adviser. Portfolio holdings may have changed since the date of this report.
Madison Funds | October 31, 2023
Management’s Discussion of Fund Performance (unaudited)
Period In Review
The trailing year provided investors a much-needed respite from the savage declines of 2022, where both broad stock and bond market indexes experienced double digit drawdowns. Fears of an impending recession driven by the Federal Reserve’s (Fed) breakneck interest rate hikes crested early in the period. Instead, investors became emboldened by the belief that the Fed would soon cease raising rates, and cuts were a distinct possibility in 2023 or early 2024. Economic growth surprised to the upside driven by a resilient labor market that helped keep consumers in a spending mood.
From a high-level perspective, the year appeared to be quite successful for equity investors, as the S&P 500 Index gained a pleasing +10.14%. However, from a broader point of view there were many stocks, and entire sectors, left out of the fun. The index was driven higher by a very small set of mega cap growth companies, coined the “Magnificent Seven” during their ascent. The bulk of this group saw gains of over 30% and two of the seven (NVIDA and Meta) jumped by over a staggering 200%! Stripping away the impact of these select big gainers showed a considerably less healthy broad US stock market. Both mid and smaller cap stocks were down for the period with the Russell Mid Cap Index declining -1.01% and the Russell 2000 Index falling -8.56%. Six out of the eleven S&P 500 Index sectors failed to generate a positive return over the past twelve months.
Bonds had a more muted performance as measured by the Bloomberg US Aggregate Bond Index return of +0.36%, yet still a very welcome development considering the continued interest rate volatility and vicious bear market of 2021-22. Rates remained volatile as investors weighed declining inflation against future Fed policy. By the end of the period, hopes of interest rate cuts around the corner were dashed by reaccelerating inflation in the late summer/early fall and an acceptance that rates would indeed need to remain higher for longer to truly quell inflation. Incongruent with the stock market, where companies deemed lower quality or more susceptible to higher rates suffered, lower quality and higher risk bonds outperformed. With recession risk being priced out of the market, interest rate spreads remained tame and the higher yields offered from riskier bonds generated more favorable returns.
So, while the respite from a woeful 2022 can be relished, important questions remain. Monetary policy works with notoriously long and variable lags. The Fed took rates from zero to 5.25% in less than 1.5 years, with the last hike coming in late July, meaning much of the effects of the Fed’s restrictive policy have yet to make their way into and be felt by the economy. Will a steady jobs market continue to embolden consumers? Will consumers continue to spend with admittedly low confidence and sticky inflation? Will investors continue to pay a high premium for growth stocks in a period of heightened uncertainty and elevated interest rates? Has a recession been avoided or just postponed?
The unquestionably good news is that over the past couple years, yield has been built back into fixed income and investors no longer need to take undue or unnecessary risk to reach for return. With high quality bonds yielding above 5%, and limited prospects for further material increases in interest rates, bonds once again offer a viable alternative to stocks. Within equities, we are firm believers that the highly uncertain economic conditions combined with the elevated valuations imbedded in the broad US equity market provides an ideal environment for risk-aware, active portfolio management.
Madison Funds | Management’s Discussion of Fund Performance - continued | October 31, 2023
Allocation Funds Summary
The Madison Conservative Allocation, Moderate Allocation, Aggressive Allocation and Diversified Income Funds invest primarily in shares of registered investment companies (the “Underlying Funds”). The funds are diversified among a number of asset classes and their allocation among Underlying Funds are based on an asset allocation model developed by Madison Asset Management, LLC (“Madison”), the funds’ investment adviser. The team may use multiple analytical approaches to determine the appropriate asset allocation, including:
| · | Asset allocation optimization analysis – considers the degree to which returns in different asset classes do or do not move together, and the funds’ aim to achieve a favorable overall risk profile for any targeted portfolio return. |
| · | Scenario analysis– historical and expected return data is analyzed to model how individual asset classes and combinations of asset classes would affect the funds under different economic and market conditions. |
| · | Fundamental analysis – draws upon Madison’s investment teams to judge each asset class against current and forecasted market conditions. Economic, industry and security analysis is used to develop return and risk expectations that may influence asset class selection. In addition, Madison has a flexible mandate which permits the funds, at the sole discretion of Madison, to materially reduce equity risk exposures when and if conditions are deemed to warrant such an action. |
Madison Conservative Allocation Fund
INVESTMENT STRATEGY HIGHLIGHTS
Under normal circumstances, the Madison Conservative Allocation Fund’s total net assets will be allocated among various asset classes and Underlying Funds, including those whose shares trade on a stock exchange (exchange traded funds or “ETFs”), with target allocations over time of approximately 35% equity investments and 65% fixed income investments. Underlying Funds in which the Fund invests may include funds advised by Madison and/or its affiliates, including other Madison Funds (the “Affiliated Underlying Funds”). Generally, Madison will not invest more than 75% of the Fund’s net assets, at the time of purchase, in Affiliated Underlying Funds.
PERFORMANCE DISCUSSION
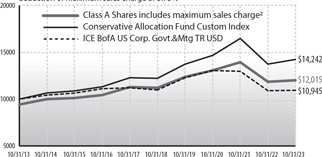
Cumulative Performance of $10,000 Investment1
Class A Shares initial amount invested was $9,425 to reflect deduction of maximum sales charge of 5.75%
Average Annual Total Return through October 31, 20231
| | | % Return Without Sales Charge | | | % Return After Sales Charge | |
| | | 1 Year | | | 3 Years | | | 5 Years | | | 10 Years | | | 1 Year | | | 3 Years | | | 5 Years | | | 10 Years | |
| Class A | | | 1.36 | % | | | -2.76 | % | | | 1.40 | % | | | 2.46 | % | | | -4.47 | % | | | -4.66 | % | | | 0.21 | % | | | 1.85 | % |
| Class C | | | 0.60 | % | | | -3.51 | % | | | 0.63 | % | | | 1.69 | % | | | -0.40 | % | | | -3.51 | % | | | 0.63 | % | | | 1.69 | % |
| ICE Bank of America Merrill Lynch US Corp, Govt & Mortgage Index | | | 0.38 | % | | | -5.71 | % | | | -0.07 | % | | | 0.91 | % | | | NA | | | | NA | | | | NA | | | | NA | |
| Conservative Allocation Fund Custom Index | | | 3.62 | % | | | -0.99 | % | | | 3.10 | % | | | 3.60 | % | | | NA | | | | NA | | | | NA | | | | NA | |
The Madison Conservative Allocation Fund (Class A at NAV) returned 1.36% for the one-year period, underperforming the Conservative Allocation Custom Index return of 3.62%. The Fund underperformed its peers as measured by the Morningstar US Allocation 15%-30% Equity category, which returned 2.22%.
Market returns over the past 12 months easily outpaced consensus expectations going into the period. We entered the period on the heels of substantial declines in both stocks and bonds. There was widespread belief that the economy was on the cusp of recession after being suffocated by the rapid increase in interest rates brought on by the Federal Reserve’s (Fed) tightening campaign. However, as they often do, markets surprised, and rallied throughout most of the period, with a few bouts of downside along the way.
US stocks, as measured by the Russell 3000 Index gained 8.38%, led by a very narrow set of mega cap growth companies, the so called “Magnificent Seven”, a term brought to bear by their outsized gains amongst more modest, and often negative, returns across the rest of the broader market. Maybe more surprising was the 12.07% advance from the international MSCI ACWI ex-USA Index. Again, entering the period it appeared that the European economy was on its death bed with serious questions around energy supplies due to the war in Ukraine, but a mild winter and boost from the reopening of the Chinese economy served to ameliorate the situation. Finally, bonds were flat with the Bloomberg US Aggregate Bond Index advancing just 0.36%, yet a satisfactory result and stemmed the pain brought on by a vicious bear market in bonds over 2021-22.
The Fund underperformed its blended benchmark for the period. Much of the underperformance came from the positioning that served the Fund so well during the previous 12-month period, most notably, an underweight allocation to risky assets. The Fund was underweight stocks relative to the blended benchmark, and while the cash held in-lieu of equities outperformed traditional bonds with a return of over 4% it was no match for the bigger gains in stocks. Compounding the issue was that the underweight to equites was concentrated in the international markets, which as mentioned above outpaced the US market. The other area that really helped in the prior period, but detracted this time around, was in the Fund's exposure to energy, commodities, and dividend paying stocks. Balancing out equity performance were overweight allocations to the technology sector, Japanese equities, and sizeable exposure to high quality US large cap companies. Within fixed income our preference for higher quality US Treasury and mortgage-backed securities detracted from returns, while our slightly underweight allocation to bonds was additive.
While it is never pleasing to underperform, we invest for the longer-term cycle and many leading indicators we follow continue to point to a weakening economy with a serious risk of recession in the near term. Market pricing and expectations are not aligned with these leading indicators. US stock valuations remain at a premium and expectations are for double-digit earnings growth in 2024. Elevated valuations and earnings expectations appear to be at odds with sticky inflation, higher interest rates, and low consumer confidence.
Madison Funds | Management’s Discussion of Fund Performance - continued | October 31, 2023
We readily admit to underappreciating the staying power of past stimulus efforts and consumers willingness to spend more despite savage inflation. However, given the status and breadth of the indicators we follow, we believe a recession has not been avoided, but postponed. As such, we believe the defensive posture we have been employing is still prudent in this highly uncertain environment.
| PORTFOLIO ALLOCATION AS A PERCENTAGE OF NET ASSETS AS OF 10/31/23 | | | |
| Bond Funds | | | 68.6 | % |
| Foreign Stock Funds | | | 4.9 | % |
| Short-Term Investments | | | 2.2 | % |
| Stock Funds | | | 24.7 | % |
| Net Other Assets and Liabilities | | | (0.4 | )% |
| TOP TEN HOLDINGS AS A PERCENTAGE OF NET ASSETS AS OF 10/31/23 | | | |
| Madison Core Bond Fund | | | 29.8 | % |
| iShares 7-10 Year Treasury Bond ETF | | | 9.7 | % |
| Madison Investors Fund | | | 9.0 | % |
| iShares Treasury Floating Rate Bond ETF | | | 8.8 | % |
| Janus Henderson Mortgage-Backed Securities ETF | | | 8.3 | % |
| Schwab Intermediate-Term U.S. Treasury ETF | | | 6.4 | % |
| Distillate U.S. Fundamental Stability & Value ETF | | | 6.0 | % |
| iShares Aaa - A Rated Corporate Bond ETF | | | 3.6 | % |
| Vanguard Information Technology ETF | | | 3.2 | % |
| Invesco Exchange-Traded Fund Trust - Invesco S&P 500 Quality ETF | | | 2.4 | % |
Madison Moderate Allocation Fund
INVESTMENT STRATEGY HIGHLIGHTS
Under normal circumstances, the Madison Moderate Allocation Fund’s total net assets will be allocated among various asset classes and Underlying Funds, including those whose shares trade on a stock exchange (exchange traded funds or “ETFs”), with target allocations over time of approximately 60% equity investments and 40% fixed income investments. Underlying Funds in which the Fund invests may include Affiliated Underlying Funds. Generally, Madison will not invest more than 75% of the Fund’s net assets, at the time of purchase, in Affiliated Underlying Funds.
PERFORMANCE DISCUSSION
Cumulative Performance of $10,000 Investment1
Class A Shares initial amount invested was $9,425 to reflect deduction of maximum sales charge of 5.75%

Average Annual Total Return through October 31, 20231
| | | % Return Without Sales Charge | | | % Return After Sales Charge | |
| | | 1 Year | | | 3 Years | | | 5 Years | | | 10 Years | | | 1 Year | | | 3 Years | | | 5 Years | | | 10 Years | |
| Class A | | | 2.55 | % | | | -0.56 | % | | | 2.66 | % | | | 3.88 | % | | | -3.39 | % | | | -2.49 | % | | | 1.45 | % | | | 3.27 | % |
| Class C | | | 1.79 | % | | | -1.29 | % | | | 1.89 | % | | | 3.10 | % | | | 0.79 | % | | | -1.29 | % | | | 1.89 | % | | | 3.10 | % |
| S&P 500® Index | | | 10.14 | % | | | 10.36 | % | | | 11.01 | % | | | 11.18 | % | | | NA | | | | NA | | | | NA | | | | NA | |
| Moderate Allocation Fund Custom Index | | | 5.94 | % | | | 2.26 | % | | | 5.20 | % | | | 5.43 | % | | | NA | | | | NA | | | | NA | | | | NA | |
The Madison Moderate Allocation Fund (Class A at NAV) returned 2.55% for the one-year period, underperforming its blended benchmark, the Moderate Allocation Custom Index, which returned 5.94%. The Fund underperformed its peers as measured by the Morningstar Allocation 50-70% Equity category, which returned 4.21%.
Market returns over the past 12 months easily outpaced consensus expectations going into the period. We entered the period on the heels of substantial declines in both stocks and bonds. There was widespread belief that the economy was on the cusp of recession after being suffocated by the rapid increase in interest rates brought on by the Federal Reserve’s (Fed) tightening campaign. However, as they often do, markets surprised, and rallied throughout most of the period, with a few bouts of downside along the way.
US stocks, as measured by the Russell 3000 Index gained 8.38%, led by a very narrow set of mega cap growth companies, the so called “Magnificent Seven”, a term brought to bear by their outsized gains amongst more modest, and often negative, returns across the rest of the broader market. Maybe more surprising was the 12.07% advance from the international MSCI ACWI ex-USA Index. Again, entering the period it appeared that the European economy was on its death bed with serious questions around energy supplies due to the war in Ukraine, but a mild winter and boost from the reopening of the Chinese economy served to ameliorate the situation. Finally, bonds were flat with the Bloomberg US Aggregate Bond Index advancing just 0.36%, yet a satisfactory result and stemmed the pain brought on by a vicious bear market in bonds over 2021-22.
The Fund underperformed its blended benchmark for the period. Much of the underperformance came from the positioning that served the Fund so well during the previous 12-month period, most notably, an underweight allocation to risky assets. The Fund was underweight stocks relative to the blended benchmark, and while the cash held in-lieu of equities outperformed traditional bonds with a return of over 4% it was no match for the bigger gains in stocks. Compounding the issue was that the underweight to equites was concentrated in the international markets, which as mentioned above outpaced the US market. The other area that really helped in the prior period, but detracted this time around, was in the Fund's exposure to energy, commodities, and dividend paying stocks. Balancing out equity performance were overweight allocations to the technology sector, Japanese equities, and sizeable exposure to high quality US large cap companies. Within fixed income our preference for higher quality US Treasury and mortgage-backed securities detracted from returns, while our slightly underweight allocation to bonds was additive.
While it is never pleasing to underperform, we invest for the longer-term cycle and many leading indicators we follow continue to point to a weakening economy with a serious risk of recession in the near term. Market pricing and expectations are not aligned with these leading indicators. US stock valuations remain at a premium and expectations are for double-digit earnings growth in 2024. Elevated valuations and earnings expectations appear to be at odds with sticky inflation, higher interest rates, and low consumer confidence.
Madison Funds | Management’s Discussion of Fund Performance - continued | October 31, 2023
We readily admit to underappreciating the staying power of past stimulus efforts and consumers willingness to spend more despite savage inflation. However, given the status and breadth of the indicators we follow, we believe a recession has not been avoided, but postponed. As such, we believe the defensive posture we have been employing is still prudent in this highly uncertain environment.
| PORTFOLIO ALLOCATION AS A PERCENTAGE OF NET ASSETS AS OF 10/31/23 | | | |
| Bond Funds | | | 46.3 | % |
| Foreign Stock Funds | | | 10.6 | % |
| Short-Term Investments | | | 8.6 | % |
| Stock Funds | | | 41.1 | % |
| Net Other Assets and Liabilities | | | (6.6 | )% |
| TOP TEN HOLDINGS AS A PERCENTAGE OF NET ASSETS AS OF 10/31/23 | | | |
| Madison Core Bond Fund | | | 18.9 | % |
| Madison Investors Fund | | | 13.1 | % |
| Distillate U.S. Fundamental Stability & Value ETF | | | 8.9 | % |
| iShares Treasury Floating Rate Bond ETF | | | 8.2 | % |
| iShares 7-10 Year Treasury Bond ETF | | | 6.7 | % |
| Vanguard Information Technology ETF | | | 6.1 | % |
| Invesco Exchange-Traded Fund Trust - Invesco S&P 500 Quality ETF | | | 5.9 | % |
| Janus Henderson Mortgage-Backed Securities ETF | | | 5.0 | % |
| Schwab Intermediate-Term U.S. Treasury ETF | | | 4.2 | % |
| Energy Select Sector SPDR Fund ETF | | | 3.7 | % |
Madison Aggressive Allocation Fund
INVESTMENT STRATEGY HIGHLIGHTS
Under normal circumstances, the Madison Aggressive Allocation Fund’s total net assets will be allocated among various asset classes and Underlying Funds, including those whose shares trade on a stock exchange (exchange traded funds or “ETFs”), with target allocations over time of approximately 80% equity investments and 20% fixed income investments. Underlying Funds in which the Fund invests may include Affiliated Underlying Funds. Generally, Madison will not invest more than 75% of the Fund’s net assets, at the time of purchase, in Affiliated Underlying Funds.
PERFORMANCE DISCUSSION
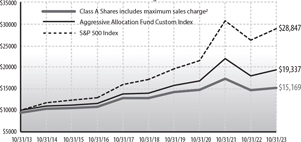
Cumulative Performance of $10,000 Investment1
Class A Shares initial amount invested was $9,425 to reflect deduction of maximum sales charge of 5.75%
Average Annual Total Return through October 31, 20231
| | | % Return Without Sales Charge% | | | Return After Sales Charge5 | |
| | | 1 Year | | | 3 Years | | | 5 Years | | | 10 Years | | | 1 Year | | | 3 Years | | | 5 Years | | | 10 Years | |
| Class A | | | 3.62 | % | | | 1.02 | % | | | 3.44 | % | | | 4.87 | % | | | -2.34 | % | | | -0.96 | % | | | 2.23 | % | | | 4.25 | % |
| Class C | | | 2.83 | % | | | 0.24 | % | | | 2.67 | % | | | 4.08 | % | | | 1.83 | % | | | 0.24 | % | | | 2.67 | % | | | 4.08 | % |
| S&P 500® Index | | | 10.14 | % | | | 10.36 | % | | | 11.01 | % | | | 11.18 | % | | | NA | | | | NA | | | | NA | | | | NA | |
| Aggressive Allocation Fund Custom Index | | | 7.77 | % | | | 4.84 | % | | | 6.77 | % | | | 6.82 | % | | | NA | | | | NA | | | | NA | | | | NA | |
The Madison Aggressive Allocation Fund (Class A at NAV) returned 3.62% for the one-year period, underperforming its blended benchmark, the Aggressive Allocation Fund Custom Index, which returned 7.77%. The Fund underperformed its peers as measured by the Morningstar Allocation: 70-85% Equity category, which returned 4.69%.
Market returns over the past 12 months easily outpaced consensus expectations going into the period. We entered the period on the heels of substantial declines in both stocks and bonds. There was widespread belief that the economy was on the cusp of recession after being suffocated by the rapid increase in interest rates brought on by the Federal Reserve’s (Fed) tightening campaign. However, as they often do, markets surprised, and rallied throughout most of the period, with a few bouts of downside along the way.
US stocks, as measured by the Russell 3000 Index gained 8.38%, led by a very narrow set of mega cap growth companies, the so called “Magnificent Seven”, a term brought to bear by their outsized gains amongst more modest, and often negative, returns across the rest of the broader market. Maybe more surprising was the 12.07% advance
from the international MSCI ACWI ex-USA Index. Again, entering the period it appeared that the European economy was on its death bed with serious questions around energy supplies due to the war in Ukraine, but a mild winter and boost from the reopening of the Chinese economy served to ameliorate the situation. Finally, bonds were flat with the Bloomberg US Aggregate Bond Index advancing just 0.36%, yet a satisfactory result and stemmed the pain brought on by a vicious bear market in bonds over 2021-22.
The Fund underperformed its blended benchmark for the period. Much of the underperformance came from the positioning that served the Fund so well during the previous 12-month period, most notably, an underweight allocation to risky assets. The Fund was underweight stocks relative to the blended benchmark, and while the cash held in-lieu of equities outperformed traditional bonds with a return of over 4% it was no match for the bigger gains in stocks. Compounding the issue was that the underweight to equites was concentrated in the international markets, which as mentioned above outpaced the US market. The other area that really helped in the prior period, but detracted this time around, was in the Fund's exposure to energy, commodities, and dividend paying stocks. Balancing out equity performance were overweight allocations to the technology sector, Japanese equities, and sizeable exposure to high quality US large cap companies. Within fixed income our preference for higher quality US Treasury and mortgage-backed securities detracted from returns, while our slightly underweight allocation to bonds was additive.
While it is never pleasing to underperform, we invest for the longer-term cycle and many leading indicators we follow continue to point to a weakening economy with a serious risk of recession in the near term. Market pricing and expectations are not aligned with these leading indicators. US stock valuations remain at a premium and expectations are for double-digit earnings growth in 2024. Elevated valuations and earnings expectations appear to be at odds with sticky inflation, higher interest rates, and low consumer confidence.
Madison Funds | Management’s Discussion of Fund Performance - continued | October 31, 2023
We readily admit to underappreciating the staying power of past stimulus efforts and consumers willingness to spend more despite savage inflation. However, given the status and breadth of the indicators we follow, we believe a recession has not been avoided, but postponed. As such, we believe the defensive posture we have been employing is still prudent in this highly uncertain environment.
| PORTFOLIO ALLOCATION AS A PERCENTAGE OF NET ASSETS AS OF 10/31/23 | | |
| Bond Funds | | | 28.2 | % |
| Foreign Stock Funds | | | 14.9 | % |
| Short-Term Investments | | | 13.4 | % |
| Stock Funds | | | 54.0 | % |
| Net Other Assets and Liabilities | | | (10.5 | )% |
| TOP TEN HOLDINGS AS A PERCENTAGE OF NET ASSETS AS OF 10/31/23 | | |
| Madison Investors Fund | | | 16.2 | % |
| Distillate U.S. Fundamental Stability & Value ETF | | | 10.0 | % |
| Invesco Exchange-Traded Fund Trust - Invesco S&P 500 Quality ETF | | | 9.9 | % |
| iShares Treasury Floating Rate Bond ETF | | | 9.2 | % |
| Madison Core Bond Fund | | | 8.5 | % |
| Vanguard Information Technology ETF | | | 8.1 | % |
| Vanguard FTSE All-World ex-U.S. ETF | | | 5.0 | % |
| Energy Select Sector SPDR Fund ETF | | | 4.8 | % |
| Franklin FTSE Japan ETF | | | 4.2 | % |
| iShares 7-10 Year Treasury Bonf ETF | | | 3.9 | % |
Diversified Income Fund
INVESTMENT STRATEGY HIGHLIGHTS
On July 31, 2023, the Madison Diversified Income Fund transitioned from a fund that invests in individual stocks and bonds to a fund that invests primarily in shares of other registered investment companies, including those whose shares trade on a stock exchange (exchange traded funds or “ETFs”). In connection with this change, the Fund’s day-to-day portfolio management team and principal investment strategies changed, but the Fund’s investment objective will remain the same. As of the same date, the investment management fee was reduced from 0.65% to 0.20%; however, the Fund's total annual fund operating expenses remained the same.
Under normal circumstances, the Fund’s total net assets will be allocated among various asset classes and underlying funds, including those whose shares trade on a stock exchange (exchange traded funds or “ETFs”), with target allocations over time of approximately 60% equity investments and 40% fixed income investments. Underlying funds in which the Fund invests may include funds advised by Madison and/or its affiliates, including other Madison Funds and ETFs. Generally, Madison will not invest more than 80% of the Fund’s net assets, at the time of purchase, in affiliated underlying funds.
PERFORMANCE DISCUSSION
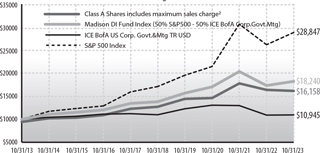
Cumulative Performance of $10,000 Investment1
Class A Shares initial amount invested was $9,425 to reflect deduction of maximum sales charge of 5.75%
Average Annual Total Return through October 31, 20231
| | | % Return Without Sales Charge | | % Return After Sales Charge |
| | | 1 Year | | 3 Years | | 5 Years | | 10 Years | | 1 Year | | 3 Years | | 5 Years | | 10 Years |
| Class A | | | -1.35 | % | | | 3.41 | % | | | 4.92 | % | | | 5.54 | % | | | -7.03 | % | | | 1.38 | % | | | 3.69 | % | | | 4.91 | % |
| Class C | | | -2.14 | % | | | 2.61 | % | | | 4.15 | % | | | 4.75 | % | | | -3.05 | % | | | 2.61 | % | | | 4.15 | % | | | 4.75 | % |
| Custom Blended Index (50% Fixed 50% Equity) | | | 5.29 | % | | | 2.29 | % | | | 5.73 | % | | | 6.19 | % | | | NA | | | | NA | | | | NA | | | | NA | |
| ICE BofA US Corp. Govt. & Mtg. Index | | | 0.38 | % | | | -5.71 | % | | | -0.07 | % | | | 0.91 | % | | | NA | | | | NA | | | | NA | | | | NA | |
| S&P 500® Index | | | 10.14 | % | | | 10.36 | % | | | 11.01 | % | | | 11.18 | % | | | NA | | | | NA | | | | NA | | | | NA | |
The Madison Diversified Income Fund (Class A at NAV) returned -1.35% for the one-year period, underperforming its blended benchmark index (50% Bank of America Merrill Lynch U.S. Corporate, Government and Mortgage Index and 50% S&P 500® Index) which returned 5.29%. The Fund underperformed its peers as measured by the Morningstar Moderate Allocation category, which returned 4.21%.
It was a difficult period for dividend stocks. Prior to the significant rise in interest rates over the past two plus years, rates had spent the time since the end of the Great Financial Crisis of 2008 grinding down to almost zero. This had the perverse effect of sending traditional yield-based investors running to stocks from bonds to grab income via dividends. After enjoying a strong run, the relative valuation differential between dividend paying stocks and fixed income assets (bonds) is no longer favorable for dividend payers. This deterioration of relative valuation weighed on dividend stocks over the course of the past year and pressured the fund’s performance.
The silver lining in the bear market in bonds is that we are now back to some semblance of normalcy in the fixed income markets. Yield-seeking investors can once again find reasonable yields in traditional low-risk bond investments. In turn, during the period we took the opportunity to reallocate a sizable percentage of the stock overweight that has existed, and greatly benefited the fund’s return over the past several years, to the newfound amply yielding bond market.
Another notable change was the introduction of a covered call strategy to augment our high-quality dividend paying stocks. This addition provides the potential for dual positive impacts of materially increasing the fund’s overall yield and is likely to help mitigate volatility should the more challenging market and economic environment we envision come to fruition.
Unfortunately, we expect volatility to stick around. To us, the weight of the evidence is too great in favor of an economy slow-rolling into recession. Most measures point to the exhaustion, or near exhaustion, of the excess savings provided by the massive stimulus payments of years past. At the same time, credit card debt has risen dramatically, and student loan payments must be made once again. With a stressed consumer, we find it unlikely that companies will be able to grow revenues to the degree necessary to
Madison Funds | Management’s Discussion of Fund Performance - continued | October 31, 2023
justify today’s lofty earnings estimates for the year ahead. Yet, equities remain priced at a premium, with the S&P 500 forward price-to-earnings ratio still hovering at nearly 18x, roughly two full multiple points above the 30-year average. In short, we don’t see value in the broad US stock market. That said, we still see value in the energy and commodities sectors where underinvestment provides continued opportunity in these now free cash flow rich companies.
The story is much different within bonds. On an absolute level, yields haven’t been this attractive in decades. Prior to the pandemic, investors were forced to reach for yield by sacrificing credit quality for any hint of yield. The move higher in interest rates offers an opportunity to allocate to sectors of the fixed income market that carry attractive yields without having to sacrifice credit quality. We believe one of the most attractive areas within fixed income can be found in the securitized sector, specifically Agency and non-Agency mortgage-backed securities. Mortgages offer the inherent credit quality of the US Government while simultaneously providing additional yield compared to duration equivalent Treasuries.
| PORTFOLIO ALLOCATION AS A PERCENTAGE OF NET ASSETS AS OF 10/31/23 |
| Asset Backed Securities | | | 0.1 | % |
| Collateralized Mortgage Obligations* | | | 0.0 | % |
| Common Stocks | | | 2.9 | % |
| Investment Companies | | | 96.6 | % |
| Mortgage Backed Securities* | | | 0.0 | % |
| Short-Term Investments | | | 2.1 | % |
| Net Other Assets and Liabilities | | | (1.7 | )% |
*less than 0.05%
| TOP TEN HOLDINGS AS A PERCENTAGE OF NET ASSETS AS OF 10/31/23 |
| Madison Covered Call ETF | | | 25.5 | % |
| Madison Dividend Value ETF | | | 19.5 | % |
| Madison Short-Term Strategic Income ETF | | | 19.2 | % |
| Madison Aggregate Bond ETF | | | 15.2 | % |
| Janus Henderson Mortgage-Backed Securities ETF | | | 9.9 | % |
| iShares Aaa - A Rated Corporate Bond ETF | | | 6.4 | % |
| Global X MLP ETF | | | 1.0 | % |
| CME Group, Inc. | | | 0.2 | % |
| EOG Resources, Inc. | | | 0.2 | % |
| Comcast Corp., Class A | | | 0.2 | % |
Madison Tax-Free Virginia Fund
INVESTMENT STRATEGY HIGHLIGHTS
The Madison Tax-Free Virginia Fund seeks to achieve its investment objectives by investing at least 80% of its net assets in municipal bonds that are exempt from federal and state income tax for residents of Virginia. These securities may be issued by state governments, their political subdivisions (for example, cities and counties) and public authorities (for example, school districts and housing authorities). The Fund may also invest in bonds that, under federal law, are exempt from federal and state income taxation, such as bonds issued by the District of Columbia, Puerto Rico, the Virgin Islands and Guam. The Fund invests in intermediate and long-term bonds having average, aggregate maturities (at the portfolio level) of 7 to 15 years.
PERFORMANCE DISCUSSION

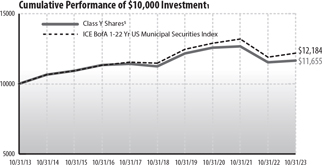
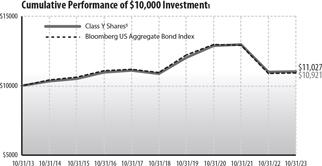
Average Annual Total Return through October 31, 20231
| | | % Return Without Sales Charge | | | |
| | | 1 Year | | 3 Years | | 5 Years | | 10 Years | |
| Class Y | | | 0.56 | % | | | -3.24 | % | | | 0.16 | % | | | 1.09 | % | |
| ICE BofA 1-22 Yr US Municipal Securities Index | | | 2.39 | % | | | -1.87 | % | | | 1.22 | % | | | 1.99 | % | |
The Madison Tax-Free Virginia Fund (Class Y) returned 0.56% for the one-year period, underperforming its benchmark, the ICE BofA 1-22 Yr US Municipal Securities Index which returned 2.39%. The Fund underperformed its peers as measured by the Morningstar Municipal Single State Intermediate category, which returned 0.88% for the period.
The Fund’s relative performance is attributable to yield curve positioning, sector allocation, coupon structure and the overall credit profile of the individual holdings. The Fund has consistently been positioned with a shorter overall maturity structure than the index which was additive to performance except for the fourth quarter of 2022 when the market posted a large positive return. Coupon structure was detractive to performance as interest rates increased due to high inflation data and the Federal Reserve’s tightening cycle to contain it. Specifically, municipal bonds with 3% and 4% coupon rates traded at a discount to par which accelerated book losses due to the Di Minimis tax rule which treats the discount accretion as ordinary income. This was the main driver for the underperformance in the Fund. In addition, the Fund’s “up in quality” bias was detractive to performance as lower quality bonds enhanced overall yield and benefited from tightening spreads leading to price appreciation.
Yield curve positioning was detractive to performance as the combination of lower coupon longer maturity bonds underperformed in a rising rate environment. In addition, the Fund under yielded the benchmark throughout the timeframe as state-specific Virginia bonds inherently yield less than the general market index.
Credit quality in the municipal bond market continued to be a bright spot in the midst of rising interest rates. The unexpectedly resilient economy has bolstered tax revenues with many states reporting record “rainy day” fund balances to offset leaner times that are sure to come at some point in the business cycle. Outside of the health care and higher education sectors, most municipal finances seem to be in pretty good shape. However, we will keep a close eye on any slowing economic trends and the increased borrowing costs that could lead to tighter state and local budgets. Specific to Viginia, the commonwealth continues to garner a top-tier AAA rating by all the independent rating agencies and enjoys a strong and diverse economy.
The outlook for the municipal bond market seems to be trending in a positive direction. Although we were surprised by the upside volatility in interest rates over the summer months of 2023, we believe that most of the interest rate increases are in the rearview mirror. Inflation has come down considerably and the labor market, although very
Madison Funds | Management’s Discussion of Fund Performance - continued | October 31, 2023
strong, is showing signs of moving lower. Generationally high borrowing rates and a broad lending pullback are typical signs of a slowing economy. Municipal bonds typically outperform corporates in a slowing economy as tax revenues and essential service fees are more predictable streams of revenue than pullbacks in consumer spending.
In general, we believe it is prudent to be conservatively positioned in a volatile interest rate environment. We are cognizant of the fact that when the Fed pivots, rates will move lower rather quickly but “the higher for longer” mantra will provide windows of opportunity to add longer maturities and lock in higher yields as economic conditions evolve.
| SECTOR ALLOCATION AS A PERCENTAGE OF NET ASSETS AS OF 10/31/23 |
| Airport | | | 3.7 | % |
| Development | | | 11.2 | % |
| Education | | | 8.2 | % |
| Facilities | | | 9.9 | % |
| General Obligation | | | 40.0 | % |
| Medical | | | 1.6 | % |
| Multifamily Housing | | | 1.0 | % |
| Power | | | 4.8 | % |
| Transportation | | | 9.9 | % |
| Water | | | 8.1 | % |
| Net Other Assets and Liabilities | | | 1.6 | % |
| TOP TEN HOLDINGS AS A PERCENTAGE OF NET ASSETS AS OF 10/31/23 |
| Northern Virginia Transportation Authority, 5.0%, 6/1/30 | | | 4.7 | % |
| Arlington County, 5.0%, 8/15/30 | | | 3.7 | % |
| James City County Economic Development Authority, 5.0%, 6/15/30 | | | 3.2 | % |
| Metropolitan Washington Airports Authority Aviation Revenue, 5.0%, 10/1/43 | | | 2.9 | % |
| Norfolk, 5.0%, 8/1/47 | | | 2.9 | % |
| Hampton Roads Transportation Accountability Commission, 5.0%, 7/1/42 | | | 2.9 | % |
| Loudoun County Economic Development Authority, 4.0%, 12/1/37 | | | 2.8 | % |
| Greater Richmond Convention Center Authority, 5.0%, 6/15/26 | | | 2.8 | % |
| Poquoson, 4.0%, 2/15/29 | | | 2.6 | % |
| Hampton Roads Sanitation District, 5.0%, 10/1/35 | | | 2.6 | % |
Madison Tax-Free National Fund
INVESTMENT STRATEGY HIGHLIGHTS
The Madison Tax-Free National Fund seeks to achieve its investment objective by investing at least 80% of its net assets in municipal bonds that are exempt from federal income taxes. These securities may be issued by state governments, their political subdivisions (for example, cities and counties) and public authorities (for example, school districts and housing authorities). The Fund may also invest in bonds that, under federal law, are exempt from federal and state income taxation, such as bonds issued by the District of Columbia, Puerto Rico, the Virgin Islands and Guam. The Fund invests in intermediate and long-term bonds having average, aggregate maturities (at the portfolio level) of 7 to 15 years. The primary difference between this Fund and the Madison Tax-Free Virginia Fund is that the Madison Tax-Free Virginia Fund will invest in bonds that are exempt from federal and state income tax for residents of Virginia, while this Fund will invest in bonds that are exempt from federal income tax.
PERFORMANCE DISCUSSION
Average Annual Total Return through October 31, 20231
| | | % Return Without Sales Charge | | |
| | | 1 Year | | 3 Years | | 5 Years | | 10 Years |
| Class Y | | | 1.06 | % | | | -2.50 | % | | | 0.72 | % | | | 1.54 | % |
| ICE BofA 1-22 Yr US Municipal Securities Index | | | 2.39 | % | | | -1.87 | % | | | 1.22 | % | | | 1.99 | % |
The Madison Tax-Free National Fund (Class Y) returned 1.06% for the one-year period, underperforming its benchmark, the ICE BofA 1-22 Yr US Municipal Securities Index which returned 2.39%. The Fund underperformed its peers as measured by the Morningstar Municipal National Intermediate category, which returned 2.41%.
The Fund’s relative performance is attributable to yield curve positioning, sector allocation, coupon structure and the overall credit profile of the individual holdings. The Fund has consistently been positioned with a shorter overall maturity structure than the index which was additive to performance except for the fourth quarter of 2022 when the market posted a large positive return. Coupon structure was detractive to performance as interest rates increased due to high inflation data and the Federal Reserve’s tightening cycle to contain it. Specifically, municipal bonds with 3% and 4% coupon rates traded at a discount to par which accelerated book losses due to the Di Minimis tax rule which treats the discount accretion as ordinary income. In addition, the Fund’s “up in quality” bias was detractive to performance as lower quality bonds enhanced overall yield and benefited from tightening spreads leading to price appreciation.
Yield curve positioning was neutral to performance as the uncharacteristically flat municipal yield curve, and at times, inverted curve provided outsized income in the shorter tenors of the curve versus duration risk with little or no additional yield for longer maturities. Finally, even with a relatively shorter duration posture versus the index, the Fund was able to capture a similar portfolio yield as the benchmark.
Credit quality in the municipal bond market continued to be a bright spot in the midst of rising interest rates. The unexpectedly resilient economy has bolstered tax revenues with many states reporting record “rainy day” fund balances to offset leaner times that are sure to come at some point in the business cycle. Outside of the health care and higher education sectors, most municipal finances seem to be in pretty good shape. However, we will keep a close eye on any slowing economic trends and the increased borrowing costs that could lead to tighter state and local budgets.
Madison Funds | Management’s Discussion of Fund Performance - continued | October 31, 2023
The outlook for the municipal bond market seems to be trending in a positive direction. Although we were surprised by the upside volatility in interest rates over the summer months of 2023, we believe that most of the interest rate increases are in the rearview mirror. Inflation has come down considerably and the labor market, although very strong, is showing signs of moving lower. Generationally high borrowing rates and a broad lending pullback are typical signs of a slowing economy. Municipal bonds typically outperform corporates in a slowing economy as tax revenues and essential service fees are more predictable streams of revenue than pullbacks in consumer spending.
In general, we believe it is prudent to be conservatively positioned in a volatile interest rate environment. We are cognizant of the fact that when the Fed pivots, rates will move lower rather quickly but “the higher for longer” mantra will provide windows of opportunity to add longer maturities and lock in higher yields as economic conditions evolve.
| STATE ALLOCATION AS A PERCENTAGE OF NET ASSETS AS OF 10/31/23 |
| Alabama | | | 5.6 | % |
| Arkansas | | | 1.0 | % |
| California | | | 0.7 | % |
| Colorado | | | 3.8 | % |
| Florida | | | 2.1 | % |
| Georgia | | | 2.4 | % |
| Hawaii | | | 2.6 | % |
| Idaho | | | 2.9 | % |
| Illinois | | | 10.7 | % |
| Indiana | | | 6.2 | % |
| Kansas | | | 1.3 | % |
| Kentucky | | | 2.6 | % |
| Louisiana | | | 0.9 | % |
| Michigan | | | 3.2 | % |
| Mississippi | | | 2.9 | % |
| Montana | | | 1.8 | % |
| Nebraska | | | 1.7 | % |
| New Jersey | | | 4.0 | % |
| New Mexico | | | 1.1 | % |
| New York | | | 3.9 | % |
| Oklahoma | | | 4.0 | % |
| Pennsylvania | | | 5.6 | % |
| Texas | | | 6.8 | % |
| Utah | | | 3.2 | % |
| Virginia | | | 6.1 | % |
| Washington | | | 1.2 | % |
| West Virginia | | | 2.7 | % |
| Wisconsin | | | 7.2 | % |
| Net Other Assets and Liabilities | | | 1.8 | % |
| TOP TEN HOLDINGS AS A PERCENTAGE OF NET ASSETS AS OF 10/31/23 |
| Mobile County, 5.0%, 2/1/39 | | | 3.7 | % |
| Cook County School District No. 111 Burbank, 5.0%, 12/1/35 | | | 3.3 | % |
| Austin, 5.0%, 9/1/26 | | | 3.3 | % |
| City of Burlington WI, 4.0%, 4/1/36 | | | 3.2 | % |
| Vanderburgh County Redevelopment District, Tax Allocation, 5.0%, 2/1/26 | | | 3.0 | % |
| Idaho Health Facilities Authority, 5.0%, 3/1/34 | | | 2.9 | % |
| Medical Center Educational Building Corp., 5.0%, 6/1/30 | | | 2.9 | % |
| Southampton County Industrial Development Authority, 5.0%, 6/1/35 | | | 2.7 | % |
| West Virginia Economic Development Authority, 5.0%, 7/1/37 | | | 2.7 | % |
| Du Page County School District No. 45, 4.0%, 1/1/26 | | | 2.7 | % |
High Quality Bond Fund
INVESTMENT STRATEGY HIGHLIGHTS
The Madison High Quality Bond Fund seeks to achieve its investment objective through diversified investments in a broad range of corporate debt securities, obligations of the US Government and its agencies, and money market instruments. In seeking to achieve the Fund’s goals, the Fund’s management will (1) shorten or lengthen the dollar weighted average maturity of the Fund based on its anticipation of the movement of interest rates (the dollar weighted average maturity is expected to be ten years or less), and (2) monitor the yields of the various bonds that satisfy the Fund’s investment guidelines to determine the best combination of yield, credit risk and diversification for the Fund. Under normal market conditions, the Fund will invest at least 80% of its net assets in higher quality bond issues and, therefore, intends to maintain an overall portfolio quality rating of A by Standard & Poor’s and/or A2 by Moody’s.
PERFORMANCE DISCUSSION

Average Annual Total Return through October 31, 20231
| | | % Return Without Sales Charge | | |
| | | 1 Year | | 3 Years | | 5 Years | | 10 Years | | Since
Inception
02/28/2022 |
| Class Y | | | 1.92 | % | | | -2.83 | % | | | 0.33 | % | | | 0.46 | % | | | - | |
| Class I | | | 2.00 | % | | | - | | | | - | | | | - | | | | -4.56 | % |
| Bloomberg US Intermediate Gov’t Credit A+ Bond Index | | | 1.83 | % | | | -3.09 | % | | | 0.78 | % | | | 0.95 | % | | | -6.05 | % |
Madison Funds | Management’s Discussion of Fund Performance - continued | October 31, 2023
The Madison High Quality Bond Fund (Class Y) returned 1.92% for the one-year period, outperforming its benchmark, the Bloomberg US Intermediate Government/Credit A+ Bond Index, which returned 1.83%. The Fund underperformed its peers as measured by the Morningstar Short-Term Bond category, which returned 3.90%.
The past 12 months provided little respite for the bond investors. After a challenging first half featuring a volatile rate environment and credit concerns in the financial sector, the fiscal year closed out with a rapid move to yield levels not seen in over fifteen years providing few places to hide. Though this has been a truly challenging period for fixed income investors, the welcomed silver lining may be how the current environment sets up for favorable bond returns going forward now that the ‘income’ component has at long last returned to the fixed income markets.
The Fed Remains Engaged
The Fed (Federal Reserve) stayed true to their word and reiterated that their restrictive policy stance would remain in place until significant headway is made lowering inflationary pressures. Interest rates marched higher as economic data releases remained surprisingly strong in the face of meaningfully higher mortgage rates, rising energy costs, and faltering consumer confidence. As we begin the final months of 2023, we are likely approaching the end of a historic, nearly two-year, monetary tightening campaign yet lower interest rates may still be some time away.
The Fed met twice, in July and September, and raised the Fed Funds Rate by 25 bps at the July meeting and then paused at the September meeting, perhaps marking the final rate hike in this cycle. The ‘pause’ marks a change in the Fed’s policy normalization campaign, acknowledging that the final hikes may be at hand. Interestingly, both the formal policy statement and subsequent speeches stressed that additional hikes are possible and rate cuts remain a distant possibility, strongly reiterating the ‘higher for longer’ message.
Importantly, Fed members indicated that fewer interest rate cuts will be needed in 2024 and 2025. The policy rate is expected to be 5.125% at the end of 2024 and 3.875% at the end of 2025, both 0.50% higher than what was expected in June. This shift in expectations by the Fed helped push intermediate and long bond yields higher testing levels not seen for nearly a decade.
Focus Remains on Fundamentals
The Fed’s top priority remains inflation, and while progress has been achieved the Fed’s desired target of 2% remains a distant goal. The latest reading on the Core US Personal Consumption Expenditure Pricing Index fell to 3.9%, slightly lower than the last reading of 4.3%. Clearly, some progress has been made on the inflation front but not enough to satisfy Fed members. The US economy has remained surprising strong despite higher interest rates, rising energy prices, and falling consumer savings rates. Stable labor markets and resilient consumers give the Fed additional runway to maintain restrictive monetary policy while battling inflation pressures.
A clear risk to the Fed’s policy outlook would be sharp declines in economic growth while inflation pressures persist. Resultingly, economic data will remain scrutinized as the lagged impact of Fed rate hikes work through the system. While we are skeptical of the Fed’s ability to navigate a ‘soft landing’ we do expect growth to gradually decline as consumers feel the impact of higher interest rates and price levels. As investors embrace the possibility of an economic ‘soft landing,’ risk-based market indicators including credit spreads have performed well. Lower probability of a recession translates in reduced corporate bond credit spreads. Lower quality sectors such as high yield and BBB-rated corporate bonds have performed the best relative to Treasuries so far this year.
Performance and Positioning
In response to the Fed’s continued rate tightening campaign, yields moved higher over the period. However, those same higher yield contributed meaningful yield to total returns helping provide welcome positive returns over the period. During the fiscal year ended October 31, 2023, the Madison High Quality Bond Fund outperformed the benchmark by 29 basis points, returning 2.12% (gross of fees) versus the Bloomberg US Intermediate Government/Credit A+ Bond Index return of 1.83%.
Conservative duration positioning was additive to returns to performance over the course of the period as interest rates moved sharply higher in response to the Fed’s continued tightening campaign in the face of stubborn inflation measures. Sector/quality was additive to performance during the period as credit spreads narrowed following the financial sector concerns easing mid-year. Portfolio yield/income proved to be slightly additive to performance as higher yields contributed positively to performance. The meaningful flattening in the yield curve detracted slightly from performance as yields on shorter maturities rose more than yields on longer maturities. Security selection detracted slightly for returns as risk premiums on high quality names narrowed slightly less than lower quality issues and the portfolio maintained its high-quality bias.
Our conservative approach to portfolio construction remains in place while we look for opportunities to extend portfolio maturities. Conservative duration positioning continues to contribute positive relative performance as interest rates adjust higher. Higher market yields have allowed the strategy to add meaningful long-term yield and we anticipate being able to continue adding to these positions in the months ahead. The past 12 months continues to reinforce the need for portfolio diversification and has rewarded those who have maintained exposure to high quality fixed income within their overall portfolio allocation. With meaningful yield returning to fixed income assets, we are optimistic about the future prospects for bond investors.
| SECTOR ALLOCATION AS A PERCENTAGE OF NET ASSETS AS OF 10/31/23 |
| Communication Services | | | 2.6 | % |
| Consumer Discretionary | | | 1.9 | % |
| Consumer Staples | | | 5.6 | % |
| Fannie Mae | | | 10.1 | % |
| Financials | | | 20.1 | % |
| Health Care | | | 1.3 | % |
| Industrials | | | 3.5 | % |
| Information Technology | | | 1.3 | % |
| Short-Term Investments | | | 5.3 | % |
| U.S. Treasury Notes | | | 50.8 | % |
| Utilities | | | 0.8 | % |
| Net Other Assets and Liabilities | | | (3.3 | )% |
| TOP TEN HOLDINGS AS A PERCENTAGE OF NET ASSETS AS OF 10/31/23 |
| Federal National Mortgage Association, 2.125%, 4/24/26 | | | 4.4 | % |
| Federal National Mortgage Association, 0.750%, 10/8/27 | | | 3.2 | % |
| U.S. Treasury Notes, 2.250%, 11/15/24 | | | 3.2 | % |
| U.S. Treasury Notes, 2.125%, 5/15/25 | | | 3.1 | % |
| U.S. Treasury Notes, 3.875%, 11/30/29 | | | 3.1 | % |
| U.S. Treasury Notes, 3.875%, 12/31/29 | | | 3.1 | % |
| U.S. Treasury Notes, 1.625%, 5/15/26 | | | 3.0 | % |
| U.S. Treasury Notes, 1.500%, 8/15/26 | | | 3.0 | % |
| U.S. Treasury Notes, 2.250%, 11/15/27 | | | 3.0 | % |
| U.S. Treasury Notes, 2.375%, 8/15/24 | | | 2.7 | % |
Madison Funds | Management’s Discussion of Fund Performance - continued | October 31, 2023
Core Bond Fund
INVESTMENT STRATEGY HIGHLIGHTS
Under normal market conditions, the Madison Core Bond Fund invests at least 80% of its net assets in bonds. To keep current income relatively stable and to limit share price volatility, the Fund emphasizes investment grade securities and maintains an intermediate (typically 3-7 year) average portfolio duration, with the goal of being between 85-115% of the market benchmark duration. The Fund strives to add incremental return to the portfolio by making strategic decisions related to credit risk, sector exposure and yield curve positioning. The Fund may invest in corporate debt securities, US Government debt securities, foreign government debt securities, non-rated debt securities, and asset-backed, mortgage-backed, and commercial mortgage-backed securities.
PERFORMANCE DISCUSSION
Average Annual Total Return through October 31, 20231
| | | | % Return Without Sales Charge | | | | % Return After Sales Charge | |
| | | | | | | | | | | | | | | | | | | | Since
Inception | | | | Since
Inception | | | | | | | | | | | | | | | | | |
| | | | 1 Year | | | | 3 Years | | | | 5 Years | | | | 10 Years | | | | 2/26/2021 | | | | 2/28/2022 | | | | 1 Year | | | | 3 Years | | | | 5 Years | | | | 10 Years | |
| Class A | | | 0.07 | % | | | -5.36 | % | | | 0.02 | % | | | 0.71 | % | | | - | | | | - | | | | -4.46 | % | | | -6.81 | % | | | -0.90 | % | | | 0.25 | % |
| Class Y | | | 0.32 | % | | | -5.04 | % | | | 0.31 | % | | | 0.98 | % | | | - | | | | - | | | | - | | | | - | | | | - | | | | - | |
| Class I | | | 0.42 | % | | | - | | | | - | | | | - | | | | -5.51 | % | | | - | | | | - | | | | - | | | | - | | | | - | |
| Class R6 | | | 0.50 | % | | | - | | | | - | | | | - | | | | - | | | | -11.78 | % | | | - | | | | - | | | | - | | | | - | |
| Bloomberg US Aggregate Bond Index | | | 0.36 | % | | | -5.57 | % | | | -0.06 | % | | | 0.88 | % | | | -5.87 | % | | | -12.58 | % | | | NA | | | | NA | | | | NA | | | | NA | |
The Madison Core Bond Fund (Class Y) returned 0.32% for the one-year period, underperforming its benchmark, the Bloomberg US Aggregate Bond Index, which returned 0.36%. The Fund underperformed its peers as measured by the Morningstar Intermediate Core Bond category, which returned 0.43%.
The primary drivers of fund performance versus the benchmark was overweight to higher coupon agency mortgage-backed securities and an overweight to asset-backed securities. Performance was also positively impacted by a yield advantage over the benchmark which averaged 25 basis points (bps) during the last year. The yield advantage has increased over the past year given the additional non-Treasury allocations and steepening of the yield curve.
Looking at the securitized sector, the Fund owned fewer low coupon agency mortgage-backed securities which benefited performance. Mortgages underperformed other sectors due to the impact from the Federal Reserve’s (Fed) quantitative tightening program and banks reducing purchases given liquidity concerns. Additionally, higher interest rate volatility pressured mortgage spreads throughout the last year. The Fund added to its asset-backed securities holdings as valuations improved given concerns about the health of the consumer.
Finally, the Fund's performance was helped by having relatively less duration within the 20 and 30-year part of the yield curve versus the benchmark. Since October 2022, the yield curve has steepened with the two-year, ten-year, and thirty-year Treasury yields increased 61, 88 and 93 basis points, respectively.
In the coming year, the Fund will continue to reduce exposure in corporate bonds given the uncertain economic outlook. The Fund will also continue to allocate towards agency mortgage-backed securities given attractive valuations and will further shift its corporate bond exposure into financials versus industrials given better relative valuations.
| PORTFOLIO ALLOCATION AS A PERCENTAGE OF NET ASSETS AS OF 10/31/23 |
| Asset Backed Securities | | | 6.1 | % |
| Collateralized Mortgage Obligations | | | 5.2 | % |
| Commercial Mortgage-Backed Securities | | | 3.1 | % |
| Corporate Notes and Bonds | | | 28.0 | % |
| Foreign Corporate Bonds | | | 3.2 | % |
| Mortgage Backed Securities | | | 29.0 | % |
| Short-Term Investments | | | 1.6 | % |
| U.S. Government and Agency Obligations | | | 24.0 | % |
| Net Other Assets and Liabilities | | | (0.2 | )% |
| TOP TEN HOLDINGS AS A PERCENTAGE OF NET ASSETS AS OF 10/31/23 | | |
| U.S. Treasury Notes, 2.875%, 5/15/28 | | | 3.0 | % |
| U.S. Treasury Notes, 2.250%, 11/15/25 | | | 2.7 | % |
| U.S. Treasury Notes, 2.625%, 2/15/29 | | | 2.7 | % |
| U.S. Treasury Notes, 2.375%, 5/15/27 | | | 2.5 | % |
| U.S. Treasury Notes, 4.0%, 2/29/28 | | | 2.4 | % |
| U.S. Treasury Bonds, 3.750%, 8/15/41 | | | 1.9 | % |
| Federal Home Loan Mortgage Corp., 2.500%, 1/1/52 | | | 1.6 | % |
| U.S. Treasury Bonds, 2.250%, 5/15/41 | | | 1.5 | % |
| U.S. Treasury Notes, 3.875%, 11/30/29 | | | 1.2 | % |
| U.S. Treasury Bonds, 6.625%, 2/15/27 | | | 1.2 | % |
Madison Covered Call & Equity Income Fund
INVESTMENT STRATEGY HIGHLIGHTS
The Madison Covered Call & Equity Income Fund invests, under normal market conditions, primarily in common stocks of large- and mid-capitalization companies that are, in the view of the Fund’s investment adviser, selling at a reasonable price in relation to their long-term earnings growth rates. The portfolio managers will allocate the Fund’s assets among stocks in sectors of the economy based upon their views on forward earnings growth rates, adjusted to reflect their views on economic and market conditions and sector risk factors. The Fund will seek to generate current earnings from option premiums by writing (selling) covered call options on a substantial portion of its portfolio securities. The extent of option writing activity will depend upon market conditions and the portfolio managers’ ongoing assessment of the attractiveness of writing call options on the Fund’s stock holdings. In addition to providing income, covered call writing helps to reduce the volatility (and risk profile) of the Fund by providing downside protection.
Madison Funds | Management’s Discussion of Fund Performance - continued | October 31, 2023
PERFORMANCE DISCUSSION
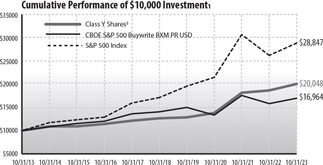
Average Annual Total Return through October 31, 20231
| | | % Return Without Sales Charge | | % Return After Sales Charge |
| | | 1
Year | | 3
Years | | 5
Years | | 10 Years | | Since
Inception
02/28/2022 | | 1
Year | | 3
Years | | 5
Years | | 10
Years |
| Class A | | | 7.18 | % | | | 12.96 | % | | | 9.39 | % | | | 6.94 | % | | | - | | | | 1.03 | % | | | 10.73 | % | | | 8.10 | % | | | 6.31 | % |
| Class C | | | 6.41 | % | | | 12.18 | % | | | 8.61 | % | | | 6.16 | % | | | - | | | | 5.43 | % | | | 12.18 | % | | | 8.61 | % | | | 6.16 | % |
| Class Y | | | 7.49 | % | | | 13.27 | % | | | 9.65 | % | | | 7.20 | % | | | - | | | | - | | | | - | | | | - | | | | - | |
| Class R6 | | | 7.71 | % | | | 13.43 | % | | | 9.82 | % | | | 7.36 | % | | | - | | | | - | | | | - | | | | - | | | | - | |
| Class I | | | 7.61 | % | | | - | | | | - | | | | - | | | | 10.00 | % | | | - | | | | - | | | | - | | | | - | |
| S&P 500® Index | | | 10.14 | % | | | 10.36 | % | | | 11.01 | % | | | 11.18 | % | | | -1.46 | % | | | NA | | | | NA | | | | NA | | | | NA | |
| CBOE S&P 500 BuyWrite Index | | | 7.27 | % | | | 8.30 | % | | | 3.85 | % | | | 5.43 | % | | | -2.44 | % | | | NA | | | | NA | | | | NA | | | | NA | |
Madison Covered Call & Equity Income Fund (Class Y) returned 7.49% for the one-year period, underperforming its benchmark the S&P 500® return of 10.14% and outperforming its benchmark the CBOE S&P 500 BuyWrite Index of 7.27%. The Fund outperformed its peers as measured by the Morningstar Derivative Income category, which returned 7.08%.
Relative to the S&P 500, sector allocation was detractive, stock selection was neutral, and the impact of cash and the options overlay was additive to results. For sector allocation, an underweight position in Technology negatively impacted performance. In terms of stock selection, there were positive results in Energy, Consumer Discretionary, Financials and Materials, which was offset by weakness in Communication Services, Utilities, Health Care and Consumer Staples. Within Energy, deepwater oil drilling company Transocean (RIG) was the most additive stock in the portfolio, and oilfield services firm Baker Hughes (BKR) also outperformed. In Technology, software firm Adobe Systems (ADBE) and semiconductor manufacturer Analog Devices (ADI) contributed nicely to results. Another notable outperforming stock was casino company Las Vegas Sands (LVS) in Consumer Discretionary. In general, these stocks had improving underlying fundamentals that benefited their businesses. On the negative side, in Utilities, power generation and utility service provider AES (AES) was the most detractive stock in the portfolio. In Consumer Discretionary, payments provider PayPal (PYPL) and retailer Target (TGT) negatively impacted performance. Within Health Care, drug retailer and managed care company CVS Health (CVS) was an underperforming stock. Another notable underperforming stock was Lumen Technologies (LUMN) in Communication Services. In general, these stocks had weak earnings results and deterioration in their businesses.
| ALLOCATION AS A PERCENTAGE OF TOTAL INVESTMENTS AS OF 10/31/23 |
| Communication Services | | | 6.3 | % |
| Consumer Discretionary | | | 6.3 | % |
| Consumer Staples | | | 9.9 | % |
| Energy | | | 8.1 | % |
| Equity Real Estate Investment Trusts (REITs) | | | 2.9 | % |
| Exchange Traded Funds | | | 1.7 | % |
| Financials | | | 8.0 | % |
| Health Care | | | 14.1 | % |
| Industrials | | | 3.2 | % |
| Information Technology | | | 4.8 | % |
| Materials | | | 6.4 | % |
| Short-Term Investments | | | 23.8 | % |
| Utilities | | | 4.5 | % |
| TOP TEN EQUITY HOLDINGS AS A PERCENTAGE OF NET ASSETS AS OF 10/31/23 |
| Las Vegas Sands Corp. | | | 4.2 | % |
| Transocean Ltd. | | | 3.3 | % |
| American Tower Corp. | | | 2.9 | % |
| APA Corp. | | | 2.7 | % |
| Barrick Gold Corp. | | | 2.5 | % |
| Medtronic PLC | | | 2.5 | % |
| Elevance Health, Inc. | | | 2.4 | % |
| AES Corp. | | | 2.4 | % |
| BlackRock, Inc. | | | 2.3 | % |
| Abbott Laboratories | | | 2.2 | % |
Dividend Income Fund
INVESTMENT STRATEGY HIGHLIGHTS
The Madison Dividend Income Fund invests in equity securities of companies with a market capitalization of over $1 billion and a history of paying dividends, with the ability to increase dividends over time. Under normal market conditions, at least 80% of the Fund’s net assets will be invested in dividend paying equity securities. The Fund typically owns 30-60 securities which generally have a dividend yield of at least the S&P 500 ® Index’s average yield, a strong balance sheet, a dividend that has been maintained and likely to increase and trades at a high relative dividend yield due to issues viewed by the adviser as temporary, among other characteristics.
PERFORMANCE DISCUSSION

Average Annual Total Return through October 31, 20231
| | | % Return Without Sales Charge | | % Return After Sales Charge |
| | | 1
Year | | 3
Years | | 5
Years | | 10
Years | | Since
Inception
05/29/2020 | | Since
Inception
08/31/2020 | | Since
Inception
02/28/2022 | | 1
Year | | 3
Years | | 5
Years | | 10
Years | | Since
Inception
05/29/2020 |
| Class A | | | -5.23 | % | | | 6.35 | % | | | - | | | | - | | | | 6.92 | % | | | - | | | | - | | | | -10.70 | % | | | 4.27 | % | | | - | | | | - | | | | 5.08 | % |
| Class Y | | | -4.99 | % | | | 6.61 | % | | | 6.64 | % | | | 8.16 | % | | | - | | | | - | | | | - | | | | - | | | | - | | | | - | | | | - | | | | - | |
| Class I | | | -4.90 | % | | | - | | | | - | | | | - | | | | - | | | | 5.15 | % | | | - | | | | - | | | | - | | | | - | | | | - | | | | - | |
| Class R6 | | | -4.82 | % | | | - | | | | - | | | | - | | | | - | | | | - | | | | -8.87 | % | | | - | | | | - | | | | - | | | | - | | | | - | |
| S&P 500® Index | | | 10.14 | % | | | 10.36 | % | | | 11.01 | % | | | 11.18 | % | | | 11.57 | % | | | 7.53 | % | | | -1.46 | % | | | NA | | | | NA | | | | NA | | | | NA | | | | NA | |
| Russell 1000® Value Index | | | 0.13 | % | | | 10.21 | % | | | 6.60 | % | | | 7.60 | % | | | 10.02 | % | | | 8.34 | % | | | -5.94 | % | | | NA | | | | NA | | | | NA | | | | NA | | | | NA | |
| Lipper Equity Income Funds Index | | | 0.77 | % | | | 9.96 | % | | | 7.51 | % | | | 7.87 | % | | | 9.75 | % | | | 7.88 | % | | | -3.89 | % | | | NA | | | | NA | | | | NA | | | | NA | | | | NA | |
Madison Funds | Management’s Discussion of Fund Performance - continued | October 31, 2023
The Madison Dividend Income Fund (Class Y) returned -4.99% for the one-year period, underperforming its benchmark, the S&P 500® Index, which returned 10.14%. The Fund underperformed its peers as measured by the Morningstar US Large Value category, which returned 0.75%.
Relative to the index, sector allocation and stock selection were detractive to results. For sector allocation, an underweight position in Technology and Communication Services negatively impacted performance. In terms of stock selection, there were positive results in Industrials and Energy, which was more than offset by weakness in Health Care, Technology, Utilities, Consumer Staples, and Consumer Discretionary. Within Financials, exchange operator CME Group (CME) was the most additive stock in the portfolio. In Communication Services, media conglomerate Comcast (CMCSA) contributed nicely to results. Within Energy, oilfield services firm Baker Hughes (BKR) was an outperforming stock. Other notable outperforming stocks were industrial distributor Fastenal (FAST) in Industrials and software and router maker Cisco Systems (CSCO) within Technology. In general, these stocks had improving underlying fundamentals that benefited their businesses. On the negative side, in Financials, regional bank US Bancorp (USB) was the most detractive stock in the portfolio. In Consumer Staples, agricultural processor Archer-Daniels-Midland negatively impacted performance. Within Health Care, pharmaceutical companies Bristol Myers-Squibb (BMY) and Pfizer (PFE) were underperforming stocks. Another notable underperforming stock was Utility firm NextEra Energy (NEE). In general, these stocks had weak earnings results and deterioration in their businesses. The fund continues to hold all stocks mentioned above.
| SECTOR ALLOCATION AS A PERCENTAGE OF NET ASSETS AS OF 10/31/23 |
| Communication Services | | | 3.6 | % |
| Consumer Discretionary | | | 8.8 | % |
| Consumer Staples | | | 9.5 | % |
| Energy | | | 14.5 | % |
| Equity Real Estate Investment Trusts (REITs) | | | 1.3 | % |
| Financials | | | 17.8 | % |
| Health Care | | | 12.8 | % |
| Industrials | | | 15.1 | % |
| Information Technology | | | 7.5 | % |
| Materials | | | 3.2 | % |
| Short-Term Investments | | | 2.4 | % |
| Utilities | | | 3.3 | % |
| Net Other Assets and Liabilities | | | 0.2 | % |
| TOP TEN HOLDINGS AS A PERCENTAGE OF NET ASSETS AS OF 10/31/23 |
| CME Group, Inc. | | | 4.1 | % |
| EOG Resources, Inc. | | | 4.1 | % |
| Fastenal Co. | | | 3.8 | % |
| Cisco Systems, Inc. | | | 3.8 | % |
| Baker Hughes Co. | | | 3.6 | % |
| Comcast Corp. | | | 3.6 | % |
| Johnson & Johnson | | | 3.4 | % |
| Home Depot, Inc. | | | 3.4 | % |
| Medtronic PLC | | | 3.3 | % |
| NextEra Energy, Inc. | | | 3.3 | % |
Investors Fund
INVESTMENT STRATEGY HIGHLIGHTS
The Madison Investors Fund invests primarily in the common stocks of established, high-quality growth companies selected via bottom-up fundamental analysis. The Fund typically owns 25-40 securities which have demonstrated stable revenue and earnings growth patterns, have high profitability metrics, and have maintained proportionately low levels of debt. A rigorous analytical process is followed when evaluating companies. The business model, the management team and the valuation of each potential investment are considered. Management strives to purchase securities trading at a discount to their intrinsic value as determined by discounted cash flows. Management corroborates this valuation work with additional valuation methodologies. The Fund typically sells a stock when the valuation target the portfolio managers have set for the stock has been exceeded, the fundamental business prospects for the company have materially changed, or the portfolio managers find a more attractive alternative.
PERFORMANCE DISCUSSION
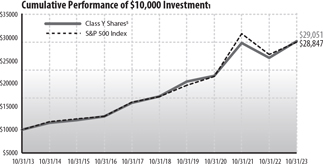
Average Annual Total Return through October 31, 20231
| | | % Return Without Sales Charge | | % Return After Sales Charge |
| | | 1
Year | | 3
Years | | 5
Years | | 10
Years | | Since
Inception
09/23/2013 | | Since
Inception
08/31/2020 | | 1
Year | | 3
Years | | 5
Years | | 10
Years | | Since
Inception
09/23/2013 |
| Class A | | | 13.75 | % | | | 10.11 | % | | | 10.82 | % | | | 10.98 | % | | | 11.06 | % | | | - | | | | 7.22 | % | | | 7.96 | % | | | 9.51 | % | | | 10.32 | % | | | 10.41 | % |
| Class Y | | | 14.03 | % | | | 10.38 | % | | | 11.09 | % | | | 11.25 | % | | | - | | | | - | | | | - | | | | - | | | | - | | | | - | | | | - | |
| Class I | | | 14.17 | % | | | - | | | | - | | | | - | | | | - | | | | 8.97 | % | | | - | | | | - | | | | - | | | | - | | | | - | |
| Class R6 | | | 14.23 | % | | | 10.58 | % | | | 11.29 | % | | | 11.46 | % | | | 11.55 | % | | | - | | | | - | | | | - | | | | - | | | | - | | | | - | |
| S&P 500® Index | | | 10.14 | % | | | 10.36 | % | | | 11.01 | % | | | 11.18 | % | | | 11.42 | % | | | 7.53 | % | | | NA | | | | NA | | | | NA | | | | NA | | | | NA | |
The Madison Investors Fund (Class Y) returned 14.03% for the one-year period, outperforming its benchmark, the S&P 500® Index, which returned 10.14%. The Fund outperformed its peers as measured by the Morningstar US Large Blend category, which returned 7.56%.
True to our bottom-up approach, the Fund's outperformance was entirely driven by stock selection. Overall, the Fund's concentrated yet diverse collection of above average businesses performed well. As is often the case in financial markets, there was no shortage of market-moving narratives during the year. War, inflation, and banking industry instability are just several concerns that captured the attention of investors. Our aim is not to have to react to such concerns, but to assemble an all-weather portfolio of resilient, growing, well-managed, and conservatively capitalized companies that ultimately provides a satisfactory return for investors with below-average risk. In that regard, we are pleased with the results in 2023.
Portfolio turnover was 22%, within our typical annual range of 20%-30%. During the year we exited four portfolio companies and sold a small spin-off from one of our healthcare holdings that we assessed to be appropriately valued. We initiated new positions in four companies: two in the Health Care sector, one in the Financials sector, and
Madison Funds | Management’s Discussion of Fund Performance - continued | October 31, 2023
one in the Information Technology sector. Importantly, each of these companies meets our three investment pillars: good business model, high-quality management, and attractive valuation. We will briefly touch on each.
Elevance, formerly Anthem, is the largest for-profit Blue Cross Blue Shield plan in the country, with 47 million members. In the 14 states where Elevance operates, it has the #1 or #2 market share which provides both national and local scale. We also believe the management team is top-notch. Since joining Elevance from a senior leadership position at peer UnitedHealth Group, CEO Gail Boudreaux has further leveraged the company’s scale advantage by expanding its internal healthcare services capabilities through a newly formed business unit called Carelon. As the industry transitions to a reimbursement system that emphasizes patient outcomes over procedure or testing volume, data analytics will be a crucial tool in managing patient care. Carelon has become the repository for many of these data analytics and healthcare service capabilities, and it should be an attractive growth platform for many years to come. Concerns around a possible slowdown in government-sponsored programs in Medicare Advantage and managed Medicaid gave us an opportunity to invest at a good price.
Charles Schwab has been the runaway winner in attracting investor assets for the past few decades as it has consistently provided fantastic client service at highly competitive prices. Schwab’s many industry awards and accolades attest to the quality of its franchise, and we believe its scale and sticky asset base will allow the company to navigate any changes in industry trends. Founder Charles Schwab is still involved as Co-Chairman with a meaningful 6% ownership stake in the company. Fears of deposit outflows at Schwab’s banking unit provided us with an attractive price to buy into this quality wealth management franchise.
Texas Instruments is a leading supplier of analog and embedded semiconductors which convert and amplify signals, manage and distribute power, and process data. It is a highly profitable business with a terrific growth runway, strong competitive advantages, and large opportunities for reinvestment at very attractive returns. The company combines considerable manufacturing scale with incredible intangible advantages across intellectual property derived from its engineering talent, and a reputation for meeting a huge range of customer needs. Despite a near-term slowdown in the analog industry, management is investing heavily to expand its US production capabilities to further deepen its competitive advantages. We applaud management’s long-term focus on increasing free cash flow per share and are confident that these investments will generate strong returns for long-term shareholders. Concerns around its elevated investment spend during a period of declining revenues allowed us to purchase shares at a discount to our view of intrinsic value.
Agilent is a leading life science tools and diagnostics company with a reputation for highly reliable chromatography and mass spectrometry instruments used for chemical measurement and analysis. Agilent serves a wide range of end markets, the largest of which is pharmaceuticals where its instruments are used not only to discover and develop new drugs but also to assure their quality when being manufactured. Over the long term we believe Agilent’s end markets should grow at above average rates, driven by biopharmaceuticals, electric batteries, semiconductors, and water testing, among others. Although we’ve followed the business for a long time, we decided to initiate a position as investor focus has shifted away from the positive attributes of the business towards the current moderating growth rate which follows a couple years of very strong results. In our view, the souring sentiment presented the opportunity to purchase shares at an attractive price.
| SECTOR ALLOCATION AS A PERCENTAGE OF NET ASSETS AS OF 10/31/23 |
| Communication Services | | | 10.5 | % |
| Consumer Discretionary | | | 13.2 | % |
| Consumer Staples | | | 3.2 | % |
| Financials | | | 32.6 | % |
| Health Care | | | 13.8 | % |
| Industrials | | | 13.4 | % |
| Information Technology | | | 9.1 | % |
| Short-Term Investments | | | 4.0 | % |
| Net Other Assets and Liabilities | | | 0.2 | % |
| TOP TEN HOLDINGS AS A PERCENTAGE OF NET ASSETS AS OF 10/31/23 |
| Alphabet, Inc. | | | 8.3 | % |
| Arch Capital Group Ltd. | | | 7.2 | % |
| PACCAR, Inc. | | | 4.6 | % |
| Amazon.com, Inc. | | | 4.4 | % |
| Becton Dickinson & Co. | | | 4.4 | % |
| Fiserv, Inc. | | | 4.4 | % |
| Berkshire Hathaway, Inc. | | | 4.1 | % |
| TJX Cos., Inc. | | | 4.0 | % |
| Lowe's Cos., Inc. | | | 4.0 | % |
| Alcon, Inc. | | | 3.9 | % |
Madison Sustainable Equity Fund
INVESTMENT STRATEGY HIGHLIGHTS
The Madison Sustainable Equity Fund invests primarily in common stocks of high-quality, large cap companies that Madison believes incorporate sustainability into their overall strategy. Under normal conditions, at least 80% of the Fund’s net assets will be invested in stocks that meet Madison’s fundamental and sustainability criteria. The Fund generally invests in 35-50 companies at any given time. The Fund’s portfolio managers define “high-quality” companies as those businesses that exhibit durable growth, operate in large growing markets, and have strong competitive advantages with high barriers to entry. Stocks that meet these criteria are selected by using an integrated research process that combines bottom-up fundamental analysis and sustainable research. The research process analyzes a company’s sustainable practices using quantitative and qualitative analysis and engagement with the company. Madison follows a rigorous multi-step process when evaluating companies for the Fund, where Madison considers (1) the business model and overall strategy, (2) the company’s sustainable business practices starting with corporate governance, (3) the Board of Directors and the management team, and (4) the risk-reward of each potential investment. Madison seeks to purchase securities trading at a discount to their intrinsic value as determined by applying relative multiples to projected earnings, discounted cash flows, and additional valuation methodologies. Often Madison finds companies that meet our business model and sustainability criteria but not our valuation hurdle. Those companies are monitored for inclusion later when the price may be more appropriate. Madison considers a number of sustainability metrics when reviewing a company for the portfolio, which may include, carbon footprint; waste management; water usage; diversity, equity, and inclusion; product safety; data management; board composition; ethical standards; and regulatory issues. Madison may sell stocks for several reasons, including: (i) excessive valuation, (ii) the fundamental business prospects for the company have materially changed, (iii) the company no longer meets our sustainability criteria or inconsistent or negative changes in sustainability practices or (iv) Madison finds a more attractive alternative.
Madison Funds | Management’s Discussion of Fund Performance - continued | October 31, 2023
PERFORMANCE DISCUSSION
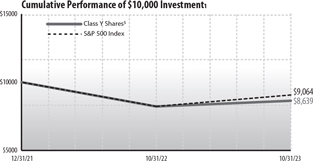
Average Annual Total Return through October 31, 20231
| | | % Return Without Sales Charge |
| | | 1 Year | | Since
Inception
12/31/2021 |
| Class Y | | | 5.00 | % | | | -13.80 | % |
| Class I | | | 5.10 | % | | | -13.61 | % |
| S&P 500®Index | | | 10.14 | % | | | -9.36 | % |
The Madison Sustainable Equity Fund (Class Y) returned 5.00% for the one-year period, underperforming its benchmark, the S&P 500® Index, which returned 10.14%. The Fund underperformed its peers as measured by the Morningstar Large Blend category, which returned 7.56%.
S&P 500 returns were led by strong returns in the Communication Services and Technology sectors due to a surge in companies that are benefiting from Generative Artificial Intelligence. The market sectors that lagged the S&P 500 market for the year include Real Estate, Utilities, Financials, and Consumer Staples. The rapid rise in interest rates impacted these traditionally defensive sectors.
Stock selection and allocation both negatively impacted performance. Sector allocation was negative in Communication Services, Consumer Staples, Financials, Healthcare, Technology, and Materials. Sector allocation was positive in Consumer Discretionary, Industrials, Real Estate and Utilities. Stock selection was positive in Financials, Healthcare, and Materials. Stock selection was negative in the remaining sectors.
Portfolio Activity
We sold our positions in Automatic Data Processing, Bristol-Myers Squibb, and The Walt Disney Company. We added new positions in Texas Instruments and Oracle to the portfolio. We eliminated Automatic Data Processing from the portfolio due to concerns that the economy is close to a peak job market and interest income on the company’s float has also peaked along with interest rates. Bristol-Myers has been dealing with the loss of exclusivity for Revlimid, one of its key products. Although the company is launching new drugs in melanoma, heart failure, and psoriasis it will need additional products to offset the lower revenue in Revlimid. The Walt Disney Company is facing a difficult and uncertain transition in its core media assets. These media assets are cash generative but face secular decline as consumers are cutting their expensive cable subscriptions and moving to alternative streaming options. We added Texas Instruments (TI) to the portfolio. TI is a leading global supplier of analog and embedded semiconductors. We believe increasing analog content growth in Automotive and Industrial will allow TI to grow at a faster pace than in the previous decade. We also established a new position in Oracle as the company’s growth profile has improved from a low single digit revenue growth company to high single digits. The key drivers of improved growth come from the company’s cloud-based applications and the Oracle Cloud Infrastructure (OCI). Oracle’s software applications are growing in the mid-teens. OCI is a differentiated cloud infrastructure provider that is gaining share due to its strong value proposition in speed, performance, and security.
Strategic positioning and forward-looking comments
We are still getting mixed signals from economic data. Interest rates have moved higher throughout the year with the expectation that rates will stay higher for longer. Although inflation has moderated, core inflation of 4.0% remains well above the Federal Reserve’s 2% target. Unemployment remains low but has moved up by 0.5% in recent months. Consumers spending has been resilient, but consumer savings are declining, and credit card debt is increasing. We continue to anticipate a further slowdown in the economy as a result of elevated interest rates for a longer period of time. Earnings estimates have been stable but with higher interest rates and higher oil prices, current estimates for 2024 may be too optimistic. With the Fed nearing the end of its interest rate hiking cycle, the companies we own will adjust to the current environment and reset their strategy for long-term growth. We continue to evaluate high quality companies that integrate sustainability into their operations and strategies for additions to the portfolio.
| SECTOR ALLOCATION AS A PERCENTAGE OF NET ASSETS AS OF 10/31/23 |
| Communication Services | | | 6.4 | % |
| Consumer Discretionary | | | 7.9 | % |
| Consumer Staples | | | 9.8 | % |
| Equity Real Estate Investment Trusts (REITs) | | | 1.2 | % |
| Financials | | | 13.9 | % |
| Health Care | | | 16.4 | % |
| Industrials | | | 6.0 | % |
| Information Technology | | | 26.4 | % |
| Materials | | | 5.3 | % |
| Short-Term Investments | | | 2.2 | % |
| Stock Funds | | | 1.3 | % |
| Utilities | | | 2.9 | % |
| Net Other Assets and Liabilities | | | 0.3 | % |
| TOP TEN HOLDINGS AS A PERCENTAGE OF NET ASSETS AS OF 10/31/23 |
| Microsoft Corp. | | | 8.5 | % |
| Alphabet, Inc. | | | 6.3 | % |
| Eli Lilly & Co. | | | 5.8 | % |
| UnitedHealth Group, Inc. | | | 4.6 | % |
| Apple, Inc. | | | 4.5 | % |
| Visa, Inc. | | | 4.2 | % |
| Costco Wholesale Corp. | | | 4.2 | % |
| Linde PLC | | | 3.3 | % |
| Jacobs Solutions, Inc. | | | 3.1 | % |
| NextEra Energy, Inc. | | | 2.9 | % |
Madison Funds | Management’s Discussion of Fund Performance - continued | October 31, 2023
Madison Mid Cap Fund
INVESTMENT STRATEGY HIGHLIGHTS
The Madison Mid Cap Fund invests generally in common stocks, securities convertible into common stocks and related equity securities of midsize companies and will, under normal market conditions, maintain at least 80% of its net assets in such midcap securities. The Fund seeks attractive long-term returns through bottom-up security selection based on fundamental analysis in a diversified portfolio of high-quality growth companies with attractive valuations. These will typically be industry leading companies in niches with strong growth prospects. The Fund’s portfolio managers believe in selecting stocks for the Fund that show steady, sustainable growth and reasonable valuation. The Fund generally holds 25-40 individual securities in its portfolio at any given time. Stocks are generally sold when target prices are reached, company fundamentals deteriorate, or more attractive stocks are identified.
PERFORMANCE DISCUSSION
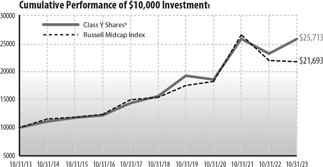
Average Annual Total Return through October 31, 20231
| | | % Return Without Sales Charge | | % Return After Sales Charge |
| | | 1
Year | | 3
Years | | 5
Years | | 10
Years | | Since
Inception
04/19/2013 | | Since
Inception
08/31/2020 | | 1
Year | | 3
Years | | 5
Years | | 10
Years | | Since
Inception
04/19/2013 |
| Class A | | | 10.68 | % | | | 11.00 | % | | | 10.04 | % | | | 9.48 | % | | | 10.22 | % | | | - | | | | 4.34 | % | | | 8.81 | % | | | 8.73 | % | | | 8.83 | % | | | 9.60 | % |
| Class Y | | | 11.20 | % | | | 11.53 | % | | | 10.54 | % | | | 9.90 | % | | | - | | | | - | | | | - | | | | - | | | | - | | | | - | | | | - | |
| Class I | | | 11.26 | % | | | - | | | | - | | | | - | | | | - | | | | 9.99 | % | | | - | | | | - | | | | - | | | | - | | | | - | |
| Class R6 | | | 11.43 | % | | | 11.73 | % | | | 10.75 | % | | | 10.17 | % | | | - | | | | - | | | | - | | | | - | | | | - | | | | - | | | | - | |
| Russell Midcap® Index | | | -1.01 | % | | | 6.04 | % | | | 7.14 | % | | | 8.05 | % | | | 9.16 | % | | | 5.27 | % | | | NA | | | | NA | | | | NA | | | | NA | | | | NA | |
Madison Mid Cap Fund (Class Y) returned 11.20% for the one-year period, outperforming its benchmark, the Russell Midcap® Index, which returned -1.01%. The Fund outperformed its peers as measured by the Morningstar Mid-Cap Blend category, which returned -0.84%.
True to our bottom-up approach, stock selection accounted for the majority of the outperformance. Our strongest contributors came from the Financials sector, and more specifically four insurance companies, who were also among our top ten best performing stocks. This was the second consecutive year that insurance companies contributed meaningfully to our outperformance. Business conditions in the insurance industry remain strong, and the prices of our insurance stocks remain reasonable, giving us confidence to keep the overweight position.
Our other top ten performing stocks came from multiple sectors, including Information Technology, Industrials, and Consumer Discretionary. While each of these companies participate in different industries, there are some common themes, such as providing business customers with mission-critical solutions purchased on a recurring basis, providing business customers with products and services needed to achieve growth goals, and providing shoppers with good merchandise at low price points. These companies are well positioned for however the economic environment unfolds in 2024.
Performance detractors included our zero weighting in the Energy sector and security selection within the Consumer Staples sector.
Portfolio turnover was 10%, which was below our typical annual range of 20% to 30%. We like what we own, so we found it best to mostly stay put in a rapidly changing environment. During the year, we purchased one new position (Waters Corporation) and exited six positions. Three of the exits were small positions that resulted from spinoffs, and the other three – Black Knight, Clarivate, and Cannae Holdings – were below-average position sizes.
Waters Corporation is a leading manufacturer of high-end scientific instruments used for chemical measurements, with strong positions in liquid chromatography and mass spectrometry. These instruments are used especially in the pharma industry, to help develop drugs and assure their quality when being manufactured. We are attracted to the company’s large established instrument installed base which drives attractive recurring consumables and services growth, as well as the concentrated industry structure where Waters has held a leading position for years. Although we’ve followed the business for a long time, we decided to purchase shares this quarter for two reasons: 1) a new CEO joined recently and has reinvigorated the company, enhancing the growth outlook, and, 2) following two years of strong results, investor focus on moderating growth has soured sentiment on the stock and has presented the opportunity to purchase shares at a discount to our appraisal of intrinsic value.
| SECTOR ALLOCATION AS A PERCENTAGE OF NET ASSETS AS OF 10/31/23 |
| Communication Services | | | 5.9 | % |
| Consumer Discretionary | | | 13.3 | % |
| Consumer Staples | | | 5.2 | % |
| Financials | | | 28.7 | % |
| Health Care | | | 4.6 | % |
| Industrials | | | 16.3 | % |
| Information Technology | | | 20.1 | % |
| Short-Term Investments | | | 6.2 | % |
| Net Other Assets and Liabilities | | | (0.3 | )% |
| TOP TEN HOLDINGS AS A PERCENTAGE OF NET ASSETS AS OF 10/31/23 |
| Arch Capital Group Ltd. | | | 9.0 | % |
| Ross Stores, Inc. | | | 5.6 | % |
| Gartner, Inc. | | | 5.6 | % |
| Arista Networks, Inc. | | | 5.0 | % |
| Carlisle Cos., Inc. | | | 4.8 | % |
| Brown & Brown, Inc. | | | 4.5 | % |
| Dollar Tree, Inc. | | | 4.4 | % |
| Copart, Inc. | | | 4.3 | % |
| PACCAR, Inc. | | | 4.1 | % |
| CDW Corp. | | | 3.6 | % |
Madison Funds | Management’s Discussion of Fund Performance - continued | October 31, 2023
Madison Small Cap Fund
INVESTMENT STRATEGY HIGHLIGHTS
The Madison Small Cap Fund invests primarily in a diversified mix of common stocks of small-cap U.S. companies that are believed to be undervalued by various measures and offer sound prospects for capital appreciation. Under normal market conditions, the Fund will maintain at least 80% of its net assets in small-cap securities.
Madison focuses on core growth strategies through bottom-up fundamental research analysis to identify stocks of businesses that are selling at what it believes are substantial discounts to prices that accurately reflect their future earnings prospects. Madison conducts extensive research on each prospective investment using a five-pillar analysis process to evaluate companies as potential investments for the portfolio. Investments that meet most of the criteria are added to a list of similar companies to be monitored by Madison. Companies meeting all five pillars may be added to the portfolio. The five pillars of the analysis are: (1) strong business traits, (2) defendable market niche, (3) attractive growth potential, (4) capable management, and (5) discount to private market value. In reviewing companies, Madison applies the characteristics identified above on a case-by-case basis as the order of importance varies depending on the type of business or industry and the company being reviewed. As a result of employing the five-pillar analysis, the Fund may hold cash opportunistically, particularly during periods of market uncertainty when investments meeting all five pillars may be difficult to identify.
PERFORMANCE DISCUSSION

Average Annual Total Return through October 31, 20231
| | | % Return Without Sales Charge | | % Return After Sales Charge |
| | | 1
Year | | 3
Years | | 5
Years | | 10
Years | | Since
Inception
08/31/2019 | | Since
Inception
02/26/2021 | | Since
Inception
02/28/2022 | | 1
Year | | 3
Years | | 5
Years | | 10
Years | | Since
Inception
08/31/2019 |
| Class A | | | -1.94 | % | | | 3.94 | % | | | - | | | | - | | | | 4.96 | % | | | - | | | | - | | | | -7.55 | % | | | 1.92 | % | | | - | | | | - | | | | 3.49 | % |
| Class Y | | | -1.69 | % | | | 4.19 | % | | | 3.90 | % | | | 4.56 | % | | | - | | | | - | | | | - | | | | - | | | | - | | | | - | | | | - | | | | - | |
| Class I | | | -1.58 | % | | | - | | | | - | | | | - | | | | - | | | | -7.14 | % | | | - | | | | - | | | | - | | | | - | | | | - | | | | - | |
| Class R6 | | | -1.46 | % | | | - | | | | - | | | | - | | | | - | | | | - | | | | -18.38 | % | | | - | | | | - | | | | - | | | | - | | | | - | |
| Russell 2000® Index | | | -8.56 | % | | | 3.95 | % | | | 3.31 | % | | | 5.63 | % | | | 3.95 | % | | | -8.80 | % | | | -16.77 | % | | | NA | | | | NA | | | | NA | | | | NA | | | | NA | |
| Russell 2500™ Index | | | -4.63 | % | | | 5.51 | % | | | 5.48 | % | | | 6.89 | % | | | 5.38 | % | | | -5.49 | % | | | -14.33 | % | | | NA | | | | NA | | | | NA | | | | NA | | | | NA | |
Madison Small Cap Fund (Class Y) returned -1.69% for the one-year period, outperforming its benchmark, the Russell 2000® Index, which returned -8.56%. The Fund outperformed its peers as measured by the Morningstar US Small Blend category, which returned -4.92%.
The three strongest areas of outperformance were Financials, IT, and Healthcare. In financials, the Fund benefited from its lack of exposure to regional banks. The velocity of rate increases led to scare in the regional banking sector as Silicon Valley, First Republic and other west coast regional banks faced dramatic bank runs. Our IT holdings were also outperformed after a tough year in 2022. Lastly in 2023, investors aggressively sold healthcare stocks driven by lack of profitability and concern about reimbursement. This was further exacerbated by the news flow around GLP-1 inhibitors which have broad, potentially negative impacts to cardiovascular, renal, orthopedic, and obviously diabetic healthcare. Our underweight in this sector was also beneficial. We have made some selective investments in this space but remain very underweight.
Our lack of investment in energy continued to be a drag on performance. We continue to evaluate these companies given the strong energy macro backdrop. They do have attractive free cash flow returns and strong balance sheets. As management in this industry has evolved to become more return focused, there may be opportunities here in the future.
Zooming out for greater perspective, the primary factor that drove performance in FY2023 was quality. Buffeted by higher and higher interest rates, declining inflation, poor investor confidence, and a persistently strong economy, investors reached for strong franchises with fortress balance sheets and well-regarded management teams. We feel our portfolio of companies was positioned correctly for this shift to quality. Despite this, small cap performance remains challenged as investors continue to favor mega-cap companies. We believe that very well-run smaller companies are being overlooked in this current environment. In the long run, we think the relative valuation disparity between large companies and small companies will narrow, which should benefit our investors.
Looking forward, the market is unsure if the Fed’s restrictive monetary policy will pull the economy into a recession or if a soft landing can be achieved. While we don’t make calls on cycles or speculate on macro-economic environments, we have seen opportunities in housing-related companies that have multi-year opportunities. While still early, we have made some initial investments. We have also continued to allocate capital to companies that benefit from reshoring and the infrastructure funding from the Inflation Reduction Act. Finally, our investments in Consumer Staples and other defensive, non-cyclical companies have not yet generated significant alpha, but we believe they can provide some stable returns in an uncertain economic environment.
While we are heartened by our FY2023 performance, we have an uncertain road ahead of us. The economy could swing toward recession in 2024, which would be challenging for equities. A soft landing and accommodative federal reserve policy could stimulate demand for riskier and less proven companies. However, uncertainty breeds opportunity and we will continue to invest in strong durable franchises.
Madison Funds | Management’s Discussion of Fund Performance - continued | October 31, 2023
| SECTOR ALLOCATION AS A PERCENTAGE OF NET ASSETS AS OF 10/31/23 |
| Communication Services | | | 5.2 | % |
| Consumer Discretionary | | | 9.7 | % |
| Consumer Staples | | | 9.4 | % |
| Energy | | | 1.3 | % |
| Financials | | | 7.2 | % |
| Health Care | | | 7.5 | % |
| Industrials | | | 21.7 | % |
| Information Technology | | | 26.4 | % |
| Materials | | | 7.5 | % |
| Short-Term Investments | | | 5.2 | % |
| Net Other Assets and Liabilities | | | (1.1 | )% |
| TOP TEN HOLDINGS AS A PERCENTAGE OF NET ASSETS AS OF 10/31/23 |
| Encompass Health Corp. | | | 4.4 | % |
| PTC, Inc. | | | 4.1 | % |
| OneSpaWorld Holdings Ltd. | | | 4.1 | % |
| Primo Water Corp. | | | 4.0 | % |
| WillScot Mobile Mini Holdings Corp. | | | 4.0 | % |
| Axis Capital Holdings Ltd. | | | 3.6 | % |
| Entegris, Inc. | | | 3.1 | % |
| Summit Materials, Inc. | | | 2.9 | % |
| Carlisle Cos., Inc. | | | 2.7 | % |
| FormFactor, Inc. | | | 2.6 | % |
Madison International Stock Fund
INVESTMENT STRATEGY HIGHLIGHTS
The Madison International Stock Fund will invest, under normal market conditions, at least 80% of its net assets in the stock of foreign companies. Typically, a majority of the Fund’s assets are invested in relatively large capitalization stocks of companies located or operating in developed countries. The Fund may also invest up to 30% of its assets in securities of companies whose principal business activities are located in emerging market countries. The portfolio managers typically maintain this segment of the Fund’s portfolio in such stocks which they believe have a low market price relative to their perceived value based on fundamental analysis of the issuing company and its prospects. The Fund may also invest in foreign debt and other income bearing securities at times when the portfolio managers believe that income bearing securities have greater capital appreciation potential than equity securities. The Fund usually holds securities of issuers located in at least three countries other than the US and generally holds 50-70 individual securities in its portfolio at any given time.
PERFORMANCE DISCUSSION
Cumulative Performance of $10,000 Investment1
Class A Shares initial amount invested was $9,425 to reflect deduction of maximum sales charge of 5.75%
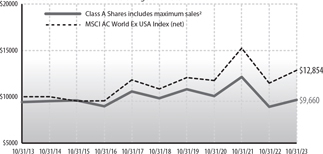
Average Annual Total Return through October 31, 20231
| | | % Return Without Sales Charge | | % Return After Sales Charge5 |
| | | 1 Year | | 3 Years | | 5 Years | | 10 Years | | 1 Year | | 3 Years | | 5 Years | | 10 Years |
| Class A | | | 8.34 | % | | | -1.38 | % | | | -0.36 | % | | | 0.25 | % | | | 2.08 | % | | | -3.30 | % | | | -1.53 | % | | | -0.34 | % |
| Class Y | | | 8.68 | % | | | -1.12 | % | | | -0.11 | % | | | 0.49 | % | | | - | | | | - | | | | - | | | | - | |
| MSCI AC World Ex USA Index (net) | | | 12.07 | % | | | 3.03 | % | | | 3.46 | % | | | 2.54 | % | | | NA | | | | NA | | | | NA | | | | NA | |
Madison International Stock Fund (Class Y) returned 8.68% for the one-year period, underperforming its benchmark, the MSCI ACWI Ex USA Index (net), which returned 12.07%. The Fund underperformed its peers as measured by the Morningstar Foreign Large Blend category, which returned 13.18%.
In general, international equity markets continue to be negatively impacted by the mixture of persistently high inflation levels, major central banks raising interest rates with an aim to tame inflation, disruption caused by Russia’s invasion of Ukraine and now the Israel-Hamas all out conflict, China slowdown, high energy prices, and fears of economic recession.
Upon review of the sector and regional category breakdown that make up the overall benchmark’s performance over the period, all regions except for North America (i.e., Canada) had a total positive return lead by Europe and Japan. In terms of sectors, the largest detractors were Financials and Health Care, while the leading sectors were Information Technology and Industrials.
Over the one-year period, the Fund underperformed relative to the benchmark. The largest regional detractors were Europe and Japan driven by stock selection. From a sector view, Financials and Health Care detracted the most while Energy, Industrials and Materials were the largest contributors, both driven by stock selection. The cash position was a negative relative contribution because the benchmark performance was positive.
Portfolio sector and regional weights are determined through bottom-up stock selection, with internal sector and regional guardrails that keep exposure within modest tilts of the benchmark to ensure diversification and to manage risk. Fund composition did change to some extent over the one year period. Among the three geographic buckets the Portfolio is viewed on relative to the benchmark, there was little difference to the change in relative weightings, but from a sector perspective there were several notable changes. Consumer Discretionary went from underweight to overweight due to incremental adds to existing stocks. Health Care went to more underweight after eliminating 2 names more than offsetting the 1 new buy. Two fewer names more than offsetting one reclassification in Financials increased the underweight for the sector. The Consumer Staples went to overweight from close to neutral because of one new stock, and the Information Technology overweight decreased because of one elimination. Lastly, the Communication Services is now slightly overweight from underweight after adding to existing stock positions. Over the period, three stocks were new buys and five were complete eliminations. Four were sold for a better opportunity and one was sold to manage risk.
Looking ahead, our expectation for global growth in the short-term is that it will remain weak while inflation levels may begin to moderate in countries where central banks are maintaining a more restrictive higher for longer monetary policy. Irrespective of the economic backdrop, our team will continue to manage the Fund so that it is comprised of a diversified collection of high-quality, profitable growth stocks with strong balance sheets.
Madison Funds | Management’s Discussion of Fund Performance - continued | October 31, 2023
| SECTOR ALLOCATION AS A PERCENTAGE OF NET ASSETS AS OF 10/31/23 | | |
| Communication Services | | | 5.8 | % |
| Consumer Discretionary | | | 12.9 | % |
| Consumer Staples | | | 10.4 | % |
| Energy | | | 5.8 | % |
| Financials | | | 16.0 | % |
| Health Care | | | 5.9 | % |
| Industrials | | | 11.5 | % |
| Information Technology | | | 16.8 | % |
| Materials | | | 11.1 | % |
| Short-Term Investments | | | 2.3 | % |
| Stock Funds | | | 1.3 | % |
| Net Other Assets and Liabilities | | | 0.2 | % |
| TOP TEN HOLDINGS AS A PERCENTAGE OF NET ASSETS AS OF 10/31/23 | | |
| Larsen & Toubro Ltd. | | | 3.0 | % |
| Shell PLC | | | 2.9 | % |
| Alibaba Group Holding Ltd. | | | 2.9 | % |
| HDFC Bank Ltd. | | | 2.9 | % |
| Cameco Corp. | | | 2.9 | % |
| Deutsche Telekom AG | | | 2.6 | % |
| Airbus SE | | | 2.5 | % |
| Grupo Mexico SAB de CV | | | 2.4 | % |
| SAP SE | | | 2.2 | % |
| AstraZeneca PLC | | | 2.2 | % |
| GEOGRAPHICAL ALLOCATION AS A PERCENTAGE OF NET ASSETS AS OF 10/31/23 | | |
| Japan | | | 16.3 | % |
| Germany | | | 11.7 | % |
| United Kingdom | | | 10.2 | % |
| France | | | 8.3 | % |
| India | | | 7.8 | % |
| China | | | 7.2 | % |
| Switzerland | | | 6.3 | % |
| Canada | | | 6.2 | % |
| Mexico | | | 5.4 | % |
| Netherlands | | | 4.1 | % |
| United States | | | 3.6 | % |
| Ireland | | | 2.0 | % |
| Australia | | | 1.6 | % |
| Israel | | | 1.6 | % |
| Hong Kong | | | 1.5 | % |
| Taiwan | | | 1.4 | % |
| Brazil | | | 1.2 | % |
| Italy | | | 1.2 | % |
| Norway | | | 1.2 | % |
| Denmark | | | 1.0 | % |
| Other Net Assets | | | 0.2 | % |
Madison Funds | Management’s Discussion of Fund Performance - continued | October 31, 2023
Notes to Management’s Discussion of Fund Performance
NA Not Applicable.
| 1 | Fund returns are calculated after fund expenses have been subtracted and assume that dividends and capital gains are reinvested in additional shares of a fund. Returns do not reflect the deduction of taxes that a shareholder would pay on fund distributions or the redemption of fund shares. Investment return and principal value will fluctuate, so an investor’s shares, when redeemed, may be worth more or less than original cost. Further information relating to the fund’s performance is contained in the prospectus and elsewhere in this report. The fund’s past performance is not indicative of future performance. Current performance may be lower or higher than the performance data cited. For fund performance data current to the most recent month-end, please call 1-800-877-6089 or visit www.madisonfunds.com. Indices are unmanaged and investors cannot invest in them directly. Index returns do not reflect sales charges, fees, or expenses. |
| 2 | Maximum sales charge is 5.75% for class A shares for the Conservative, Moderate and Aggressive Allocation Funds and the Diversified Income, Equity Income, Investors, Mid Cap, Small Cap, and International Stock Funds. The maximum sales charge is 4.50% for the Core Bond Fund Class A shares. |
| 3 | Maximum contingent deferred sales charge (CDSC) is 1% for Class C shares, which is eliminated after one year. |
| 4 | Assumes maximum applicable sales charge. |
| 5 | Class Y shares are only available for purchase by Madison Funds and other affiliated asset allocation funds, in managed account programs, and to certain other investors as described in the current prospectus. |
| 6 | Class R6 and Class I shares are generally only available for purchase by retirement plan investors and certain other institutional investors, as described in the current prospectus. |
BENCHMARK DESCRIPTIONS
Allocation Fund Indexes*
The Conservative Allocation Fund Custom Index consists of 65% Bloomberg Barclays US Aggregate Bond Index, 24.5% Russell 3000® Index and 10.5% MSCI ACWI ex-US Index. See market index descriptions below.
The Moderate Allocation Fund Custom Index consists of 42% Russell 3000® Index, 40% Bloomberg Barclays US Aggregate Bond Index and 18% MSCI ACWI ex-US Index. See market index descriptions below.
The Aggressive Allocation Fund Custom Index consists of 56% Russell 3000® Index, 24% MSCI ACWI ex-US Index and 20% Bloomberg Barclays US Aggregate Bond Index. See market index descriptions below.
Hybrid Fund Indexes*
The Custom Blended Index consists of 50% S&P 500® Index and 50% ICE Bank of America Merrill Lynch US Corporate, Government & Mortgage Index. See market index descriptions below.
Market Indexes
The CBOE S&P 500 BuyWrite® Index (BXM) is a benchmark index designed to track the performance of a hypothetical buy-write strategy (i.e., holding a long position in and selling covered call options on that position) on the S&P 500® Index.
The ICE Bank of America Merrill Lynch 1-22 Year US Municipal Securities Index tracks the performance of US dollar denominated investment grade tax-exempt debt publicly issued by US states and territories, their political subdivisions, in the US domestic market, with a remaining term to final maturity less than 22 years.
The ICE Bank of America Merrill Lynch US Corporate, Government & Mortgage Index is a broad-based measure of the total rate of return performance of the US investment grade bond markets. The index is a capitalization-weighted aggregation of outstanding US treasury, agency, and supranational mortgage pass-through, and investment grade corporate bonds meeting specified selection criteria.
The Bloomberg US Aggregate Bond Index is a broad-based flagship benchmark that measures the investment grade, US dollar-denominated, fixed-rate taxable bond market. The index includes Treasuries, government-related and corporate securities, mortgage backed-securities, asset-backed securities and corporate securities, with maturities greater than one year.
The Bloomberg US Intermediate Government Credit A+ Bond Index measures the performance of US dollar denominated US Treasuries, government related and investment grade US corporate securities with quality ratings of A3/A- or better and maturities between one and 10 years.
The Lipper Equity Income Funds Index tracks the performance of funds that, by prospectus language and portfolio practice, seek relatively high current income and growth of income by investing at least 65% of their portfolio weight in dividend-paying equity securities. The index is composed of the 30 largest funds by asset size in the Lipper investment objective category.
THE MSCI ACWI ex-US Index (net) is a market-capitalization-weighted index maintained by Morgan Stanley Capital International (MSCI) and designed to provide a broad measure of stock performance throughout the world, with the exception of US-based companies. The index includes both developed and emerging markets.
The Russell 1000® Value Index is a large-cap market index which measures the performance of those Russell 1000 companies with lower price-to-book ratios and lower forecasted growth values.
The Russell 2000® Index is a small-cap market index which measures the performance of the smallest 2,000 companies in the Russell 3000® Index.
The Russell 2500™ Index is a broad index, featuring 2,500 stocks that cover the small- and mid-cap market capitalizations of the US equity universe.
The Russell 3000® Index measures the performance of the 3,000 largest US companies based on total market capitalization, which represents 98% of the investable US equity market.
Madison Funds | Management’s Discussion of Fund Performance - continued | October 31, 2023
The Russell Midcap® Index is a mid-cap market index which measures the performance of the mid-cap segment of the US equity universe.
The S&P 500® Index is a large-cap market index which measures the performance of a representative sample of 500 leading companies in leading industries in the US.
*The Custom Indexes are calculated using a monthly re-balancing frequency (i.e., rebalanced back to original constituent weight every calendar month-end).
© 2023 Morningstar, Inc. All rights reserved. The information contained herein:
(1) is proprietary to Morningstar and/or its content providers; (2) may not be copied or distributed; and (3) is not warranted to be accurate, complete, or timely. Neither Morningstar nor its content providers are responsible for any damages or losses arising from any use of this information.
Russell Investment Group is the source and owner of the trademarks, service marks and copyrights related to the Russell Indexes. Russell® is a trademark of Russell Investment Group.
Madison Funds | October 31, 2023
Madison Conservative Allocation Fund Portfolio of Investments
| | | Shares | | | Value (Note 2,3) | |
| INVESTMENT COMPANIES - 98.2% | | | | | | |
| Bond Funds - 68.6% | | | | | | |
| iShares 20+ Year Treasury Bond ETF | | | 10,572 | | | $ | 883,608 | |
| iShares 7-10 Year Treasury Bond ETF | | | 46,781 | | | | 4,191,110 | |
| iShares Aaa - A Rated Corporate Bond ETF | | | 35,221 | | | | 1,554,303 | |
| iShares Treasury Floating Rate Bond ETF | | | 74,281 | | | | 3,769,761 | |
| Janus Henderson Mortgage-Backed Securities ETF | | | 84,420 | | | | 3,565,056 | |
| Madison Core Bond Fund, Class R6 (A) (B) | | | 1,536,974 | | | | 12,818,364 | |
| Schwab Intermediate-Term U.S. Treasury ETF | | | 58,351 | | | | 2,766,421 | |
| | | | | | | | 29,548,623 | |
| Foreign Stock Funds - 4.9% | | | | | | | | |
| Franklin FTSE Japan ETF | | | 24,710 | | | | 639,742 | |
| iShares MSCI China ETF | | | 9,758 | | | | 407,982 | |
| iShares MSCI International Quality Factor ETF | | | 13,086 | | | | 430,006 | |
| Vanguard FTSE All-World ex-U.S. ETF | | | 12,804 | | | | 642,889 | |
| | | | | | | | 2,120,619 | |
| Stock Funds - 24.7% | | | | | | | | |
| Distillate U.S. Fundamental Stability & Value ETF | | | 59,531 | | | | 2,577,394 | |
| Energy Select Sector SPDR Fund ETF | | | 11,432 | | | | 973,892 | |
| Invesco Exchange-Traded Fund Trust - Invesco S&P 500 Quality ETF | | | 21,513 | | | | 1,047,038 | |
| iShares Core S&P Small-Cap ETF | | | 3,511 | | | | 312,093 | |
| Madison Dividend Income Fund, Class R6 (A) | | | 18,349 | | | | 465,139 | |
| Madison Investors Fund, Class R6 (A) | | | 151,759 | | | | 3,880,477 | |
| Vanguard Information Technology ETF | | | 3,355 | | | | 1,368,169 | |
| | | | | | | | 10,624,202 | |
| Total Investment Companies | | | | | | | | |
| (Cost $446,390,997 ) | | | | | | | 42,293,444 | |
| SHORT-TERM INVESTMENTS - 2.2% | | | | | | | | |
| State Street Institutional U.S. Government | | | | | | | | |
| Money Market Fund, Premier Class (C), 5.30% | | | 947,980 | | | | 947,980 | |
| Total Short-Term Investments | | | | | | | | |
| (Cost $947,980 ) | | | | | | | 947,980 | |
| TOTAL INVESTMENTS - 100.4% | | | | | | | | |
| (Cost $47,338,977** ) | | | | | | | 43,241,424 | |
| NET OTHER ASSETS AND LIABILITIES - (0.4%) | | | | | | | (173,266 | ) |
| TOTAL NET ASSETS - 100.0% | | | | | | $ | 43,068,158 | |
| ** | | Aggregate cost for Federal tax purposes was $47,540,148. |
| (A) | | Affiliated Company (see Note 14). |
| (B) | | Greater than 25% of the portfolio. For more information refer to the website madisonfunds.com/individual/core-bondfund. |
| (C) | | 7-day yield. |
| ETF | | Exchange Traded Fund. |
| FTSE | | The Financial Times Stock Exchange. |
| MSCI | | Morgan Stanley Capital International. |
| SPDR | | Standard & Poor’s Depositary Receipt. |
| S&P | | Standard & Poor’s. |
See accompanying Notes to Financial Statements.
Madison Funds | October 31, 2023
Madison Moderate Allocation Fund Portfolio of Investments
| | | Shares | | | Value (Note 2,3) | |
| INVESTMENT COMPANIES - 98.0% | | | | | | |
| Bond Funds - 46.3% | | | | | | |
| iShares 20+ Year Treasury Bond ETF | | | 9,816 | | | $ | 820,421 | |
| iShares 7-10 Year Treasury Bond ETF | | | 67,850 | | | | 6,078,682 | |
| iShares Aaa - A Rated Corporate Bond ETF | | | 47,469 | | | | 2,094,807 | |
| iShares Treasury Floating Rate Bond ETF | | | 147,202 | | | | 7,470,502 | |
| Janus Henderson Mortgage-Backed Securities ETF | | | 108,118 | | | | 4,565,823 | |
| Madison Core Bond Fund, Class R6 (A) | | | 2,055,357 | | | | 17,141,675 | |
| Schwab Intermediate-Term U.S. Treasury ETF | | | 80,179 | | | | 3,801,286 | |
| | | | | | | | 41,973,196 | |
| Foreign Stock Funds - 10.6% | | | | | | | | |
| Franklin FTSE Japan ETF | | | 113,302 | | | | 2,933,389 | |
| iShares MSCI China ETF | | | 40,827 | | | | 1,706,977 | |
| iShares MSCI International Quality Factor ETF | | | 55,385 | | | | 1,819,951 | |
| Vanguard FTSE All-World ex-U.S. ETF | | | 63,334 | | | | 3,180,000 | |
| | | | | | | | 9,640,317 | |
| Stock Funds - 41.1% | | | | | | | | |
| Distillate U.S. Fundamental Stability & | | | | | | | | |
| Value ETF | | | 186,772 | | | | 8,086,294 | |
| Energy Select Sector SPDR Fund ETF | | | 39,568 | | | | 3,370,798 | |
| Invesco Exchange-Traded Fund Trust - Invesco S&P 500 Quality ETF (B) | | | 109,594 | | | | 5,333,940 | |
| iShares Core S&P Small-Cap ETF | | | 19,885 | | | | 1,767,577 | |
| Madison Dividend Income Fund, Class R6 (A) | | | 55,535 | | | | 1,407,817 | |
| Madison Investors Fund, Class R6 (A) | | | 464,373 | | | | 11,874,011 | |
| Vanguard Information Technology ETF (B) | | | 13,473 | | | | 5,494,289 | |
| | | | | | | | 37,334,726 | |
| Total Investment Companies | | | | | | | | |
| (Cost $92,627,338 ) | | | | | | | 88,948,239 | |
| SHORT-TERM INVESTMENTS - 8.6% | | | | | | | | |
| State Street Institutional U.S. Government Money Market Fund, Premier Class (C), 5.30% | | | 2,216,864 | | | | 2,216,864 | |
| State Street Navigator Securities Lending Government Money Market Portfolio (C) (D), 5.36% | | | 5,522,899 | | | | 5,522,899 | |
| Total Short-Term Investments | | | | | | | | |
| (Cost $7,739,763 ) | | | | | | | 7,739,763 | |
| TOTAL INVESTMENTS - 106.6% | | | | | | | | |
| (Cost $100,367,101** ) | | | | | | | 96,688,002 | |
| NET OTHER ASSETS AND LIABILITIES - (6.6%) | | | | | | | (5,951,781 | ) |
| TOTAL NET ASSETS - 100.0% | | | | | | $ | 90,736,221 | |
| ** | | Aggregate cost for Federal tax purposes was $100,570,002. |
| (A) | | Affiliated Company (see Note 14). |
| (B) | | All or a portion of these securities, with an aggregate fair value of $5,431,155, are on loan as part of a securities lending program. See footnote (D) and Note 11 for details on the securities lending program. |
| (C) | | 7-day yield. |
| (D) | | Represents investments of cash collateral received in connection with securities lending. |
| ETF | | Exchange Traded Fund. |
| FTSE | | The Financial Times Stock Exchange. MSCI Morgan Stanley Capital International. SPDR Standard & Poor’s Depositary Receipt. S&P Standard & Poor’s. |
Madison Aggressive Allocation Fund Portfolio of Investments
| | | Shares | | | Value (Note 2,3) | |
| INVESTMENT COMPANIES - 97.1% | | | | | | |
| Bond Funds - 28.2% | | | | | | |
| iShares 20+ Year Treasury Bond ETF | | | 2,728 | | | $ | 228,006 | |
| iShares 7-10 Year Treasury Bond ETF | | | 22,107 | | | | 1,980,566 | |
| iShares Aaa - A Rated Corporate Bond ETF | | | 14,672 | | | | 647,476 | |
| iShares Treasury Floating Rate Bond ETF | | | 92,227 | | | | 4,680,520 | |
| Janus Henderson Mortgage-Backed Securities ETF | | | 33,235 | | | | 1,403,514 | |
| Madison Core Bond Fund, Class R6 (A) | | | 520,677 | | | | 4,342,449 | |
| Schwab Intermediate-Term U.S. Treasury ETF | | | 21,952 | | | | 1,040,744 | |
| | | | | | | | 14,323,275 | |
| Foreign Stock Funds - 14.9% | | | | | | | | |
| Franklin FTSE Japan ETF | | | 82,375 | | | | 2,132,689 | |
| iShares MSCI China ETF | | | 34,160 | | | | 1,428,230 | |
| iShares MSCI International Quality Factor ETF | | | 46,273 | | | | 1,520,531 | |
| Vanguard FTSE All-World ex-U.S. ETF | | | 50,164 | | | | 2,518,734 | |
| | | | | | | | 7,600,184 | |
| Stock Funds - 54.0% | | | | | | | | |
| Distillate U.S. Fundamental Stability & | | | | | | | | |
| Value ETF | | | 117,873 | | | | 5,103,312 | |
| Energy Select Sector SPDR Fund ETF | | | 28,408 | | | | 2,420,077 | |
| Invesco Exchange-Traded Fund Trust - Invesco S&P 500 Quality ETF (B) | | | 103,748 | | | | 5,049,415 | |
| iShares Core S&P Small-Cap ETF | | | 16,723 | | | | 1,486,507 | |
| Madison Dividend Income Fund, Class | | | | | | | | |
| R6 (A) | | | 39,940 | | | | 1,012,479 | |
| Madison Investors Fund, Class R6 (A) | | | 322,758 | | | | 8,252,922 | |
| Vanguard Information Technology ETF | | | 10,067 | | | | 4,105,323 | |
| | | | | | | | 27,430,035 | |
| Total Investment Companies | | | | | | | | |
| (Cost $49,614,155 ) | | | | | | | 49,353,494 | |
| SHORT-TERM INVESTMENTS - 13.4% | | | | | | | | |
| State Street Institutional U.S. Government Money Market Fund, Premier Class (C), 5.30% | | | 1,875,968 | | | | 1,875,968 | |
| State Street Navigator Securities Lending Government Money Market Portfolio (C) (D), 5.36% | | | 4,930,101 | | | | 4,930,101 | |
| Total Short-Term Investments | | | | | | | | |
| (Cost $6,806,069 ) | | | | | | | 6,806,069 | |
| TOTAL INVESTMENTS - 110.5% | | | | | | | | |
| (Cost $56,420,224** ) | | | | | | | 56,159,563 | |
| NET OTHER ASSETS AND LIABILITIES - (10.5%) | | | | | | | (5,314,923 | ) |
| TOTAL NET ASSETS - 100.0% | | | | | | $ | 50,844,640 | |
| ** | | Aggregate cost for Federal tax purposes was $56,533,996. |
| (A) | | Affiliated Company (see Note 14). |
| (B) | | All or a portion of these securities, with an aggregate fair value of $4,847,435, are on loan as part of a securities lending program. See footnote (D) and Note 11 for details on the securities lending program. |
| (C) | | 7-day yield. |
| (D) | | Represents investments of cash collateral received in connection with securities lending. |
| ETF | | Exchange Traded Fund. |
| FTSE | | The Financial Times Stock Exchange. MSCI Morgan Stanley Capital International. SPDR Standard & Poor’s Depositary Receipt. S&P Standard & Poor’s. |
See accompanying Notes to Financial Statements.
Madison Funds | October 31, 2023
Madison Diversified Income Fund Portfolio of Investments
| | | Par Value | | | Value (Note 2,3) | |
| COMMON STOCKS - 2.9% | | | | | | |
| Communication Service - 0.2% | | | | | | |
| Comcast Corp., Class A | | | 6,389 | | | $ | 263,802 | |
| | | | | | | | | |
| Consumer Discretionary - 0.2% | | | | | | | | |
| Home Depot, Inc. | | | 442 | | �� | | 125,833 | |
| McDonald's Corp. | | | 434 | | | | 113,782 | |
| Starbucks Corp. | | | 1,300 | | | | 119,912 | |
| | | | | | | | 359,527 | |
| Consumer Staples - 0.3% | | | | | | | | |
| Archer-Daniels-Midland Co. | | | 2,528 | | | | 180,929 | |
| Coca-Cola Co. | | | 2,213 | | | | 125,012 | |
| PepsiCo, Inc. | | | 768 | | | | 125,399 | |
| | | | | | | | 431,340 | |
| Energy - 0.4% | | | | | | | | |
| Baker Hughes Co. | | | 7,576 | | | | 260,766 | |
| EOG Resources, Inc. | | | 2,361 | | | | 298,076 | |
| | | | | | | | 558,842 | |
| Financials - 0.4% | | | | | | | | |
| Aflac, Inc. | | | 2,201 | | | | 171,920 | |
| CME Group, Inc. | | | 1,420 | | | | 303,113 | |
| Northern Trust Corp. | | | 1,430 | | | | 94,252 | |
| | | | | | | | 569,285 | |
| Health Care - 0.4% | | | | | | | | |
| Bristol-Myers Squibb Co. | | | 3,103 | | | | 159,898 | |
| Johnson & Johnson | | | 1,715 | | | | 254,403 | |
| Medtronic PLC | | | 1,799 | | | | 126,937 | |
| | | | | | | | 541,238 | |
| Industrials - 0.6% | | | | | | | | |
| Automatic Data Processing, Inc. | | | 479 | | | | 104,527 | |
| Caterpillar, Inc. | | | 513 | | | | 115,964 | |
| Emerson Electric Co. | | | 965 | | | | 85,856 | |
| Fastenal Co. | | | 2,756 | | | | 160,785 | |
| Honeywell International, Inc. | | | 1,089 | | | | 199,570 | |
| Paychex, Inc. | | | 766 | | | | 85,064 | |
| Union Pacific Corp. | | | 829 | | | | 172,109 | |
| | | | | | | | 923,875 | |
| Information Technology - 0.2% | | | | | | | | |
| Analog Devices, Inc. | | | 568 | | | | 89,363 | |
| Texas Instruments, Inc. | | | 1,269 | | | | 180,211 | |
| | | | | | | | 269,574 | |
| Materials - 0.2% | | | | | | | | |
| Air Products & Chemicals, Inc. | | | 839 | | | | 236,967 | |
| Total Common Stocks | | | | | | | | |
| ( Cost $3,028,027 ) | | | | | | | 4,154,450 | |
| INVESTMENT COMPANIES - 96.6% | | | | | | | | |
| Bond Funds - 50.7% | | | | | | | | |
| iShares Aaa - A Rated Corporate Bond | | | | | | | | |
| ETF (D) | | | 203,286 | | | | 8,971,011 | |
| Janus Henderson Mortgage-Backed | | | | | | | | |
| Securities ETF (D) | | | 328,420 | | | | 13,869,177 | |
| Madison Aggregate Bond ETF | | | 1,100,000 | | | | 21,300,950 | |
| Madison Short-Term Strategic Income | | | | | | | | |
| ETF (E) | | | 1,362,500 | | | | 26,909,375 | |
| | | | | | | | 71,050,513 | |
| Stock Funds - 45.9% | | | | | | | | |
| Global X MLP ETF (D) | | | 31,924 | | | | 1,413,595 | |
| Madison Covered Call ETF (E) (F) | | | 1,830,000 | | | | 35,705,862 | |
| Madison Dividend Value ETF (E) | | | 1,500,000 | | | | 27,304,650 | |
| | | | | | | | 64,424,107 | |
| Total Investment Companies | | | | | | | | |
| (Cost $141,290,503 ) | | | | | | | 135,474,620 | |
| | | Par Value | | | | |
| ASSET BACKED SECURITIES - 0.1% | | | | | | |
| CCG Receivables Trust, Series 2020-1, Class A2 (A), 0.54%, 12/14/27 | | $ | 14,542 | | | | 14,471 | |
| Chesapeake Funding II LLC, Series 2020- 1A, Class A1 (A), 0.87%, 8/15/32 | | $ | 13,287 | | | $ | 13,160 | |
| Donlen Fleet Lease Funding 2 LLC, Series 2021-2, Class A2 (A), 0.56%, 12/11/34 | | | 33,858 | | | | 33,225 | |
| LAD Auto Receivables Trust, Series 2021- 1A, Class A (A), 1.3%, 8/17/26 | | | 41,366 | | | | 40,691 | |
| Total Asset Backed Securities | | | | | | | | |
| (Cost $103,047 ) | | | | | | | 101,547 | |
| COLLATERALIZED MORTGAGE OBLIGATIONS - 0.0% | | | | | | | | |
| Federal National Mortgage Association REMICS, Series 2016-21, Class BA, 3%, 3/25/42 | | | 6,911 | | | | 6,836 | |
| PSMC Trust, Series 2019-2, Class A1 (A) (B) (C), 3.5%, 10/25/49 | | | 1,029 | | | | 1,008 | |
| Total Collateralized Mortgage Obligations | | | | | | | | |
| (Cost $8,152 ) | | | | | | | 7,844 | |
| COMMERCIAL MORTGAGE-BACKED SECURITIES - 0.0% | | | | | | | | |
| GSAMP Trust, Series 2006-S5, Class M5 (C), 7.488% 9/25/36 | | | 534,000 | | | | - | |
| Total Commercial Mortgage- | | | | | | | | |
| Backed Securities | | | | | | | | |
| (Cost $- ) | | | | | | | - | |
| MORTGAGE BACKED SECURITIES - 0.0% | | | | | | | | |
| Fannie Mae - 0.0% | | | | | | | | |
| 7%, 11/1/31 Pool # 607515 | | | 3,443 | | | | 3,482 | |
| 7%, 5/1/32 Pool # 644591 | | | 580 | | | | 586 | |
| | | | | | | | 4,068 | |
| Freddie Mac - 0.0% | | | | | | | | |
| 4.5%, 2/1/25 Pool # J11722 | | | 2,094 | | | | 2,089 | |
| 4.5%, 5/1/25 Pool # J12247 | | | 2,022 | | | | 2,007 | |
| 8%, 6/1/30 Pool # C01005 | | | 466 | | | | 483 | |
| | | | | | | | 4,579 | |
| Ginnie Mae - 0.0% | | | | | | | | |
| 6.5%, 2/20/29 Pool # 2714 | | | 3,674 | | | | 3,673 | |
| 6.5%, 4/20/31 Pool # 3068 | | | 2,463 | | | | 2,507 | |
| | | | | | | | 6,180 | |
| Total Mortgage Backed Securities | | | | | | | | |
| (Cost $14,832 ) | | | | | | | 14,827 | |
| SHORT-TERM INVESTMENTS - 2.1% | | | | | | | | |
| State Street Institutional U.S. Government Money Market Fund, Premier Class (G), 5.30% | | | 527,678 | | | | 527,678 | |
| State Street Navigator Securities Lending Government Money Market Portfolio (G) (H), 5.36% | | | 2,364,950 | | | | 2,364,950 | |
| Total Short-Term Investments | | | | | | | | |
| (Cost $2,892,628 ) | | | | | | | 2,892,628 | |
| TOTAL INVESTMENTS - 101.7% | | | | | | | | |
| (Cost $147,337,189** ) | | | | | | | 142,645,916 | |
| NET OTHER ASSETS AND LIABILITIES - (1.7%) | | | | | | | (2,416,825 | ) |
| TOTAL NET ASSETS - 100.0% | | | | | | $ | 140,229,091 | |
| ** | | Aggregate cost for Federal tax purposes was $147,385,517. |
| (A) | | Security sold within terms of a private placement memorandum exempt from registration under section 144A of the Securities Act of 1933, as amended, and may be sold only to dealers in that program or other "qualified institutional buyers." |
| (B) | | Coupon rate may change based on changes of the underlying collateral or prepayments of principal. The coupon rate shown represents the rate at October 31, 2023. |
| (C) | | Floating rate or variable rate note. Rate shown is as of October 31, 2023. |
| (D) | | All or a portion of these securities, with an aggregate fair value of $2,308,207, are on loan as part of a securities lending program. See footnote (H) and Note 11 for details on the securities lending program. |
| (E) | | Affiliated Company (see Note 14). |
| (F) | | Greater than 25% of the portfolio. For more information refer to the website https://madisonfunds.com/etfs/madison-covered-call/ (G) 7-day yield. |
| (H) | | Represents investments of cash collateral received in connection with securities lending. |
| BDC | | Business Development Company. |
| CMT | | Constant Maturity Treasury. |
| DAC | | Designated Activity Company. |
| ETF | | Exchange Traded Fund. |
| FREMF | | Freddie Mac Multifamily. |
| IO | | Interest Only. |
| LLC | | Limited Liability Company. |
| LP | | Limited Partnership. |
| PLC | | Public Limited Company. |
| REMIC | | Real Estate Mortgage Investment Conduit. |
| SOFR | | Secured Overnight Financing Rate. |
| STACR | | Structured Agency Credit Risk. |
| USD | | United States Dollar. |
See accompanying Notes to Financial Statements.
Madison Funds | October 31, 2023
Madison Tax-Free Virginia Fund Portfolio of Investments
| | | Par Value | | | Value (Note 2,3) | |
| MUNICIPAL BONDS - 98.4% | | | | | | |
| Airport - 3.7% | | | | | | |
| Metropolitan Washington Airports | | | | | | |
| Authority Aviation Revenue, Series A, AMT, 5%, 10/1/43 | | $ | 500,000 | | | $ | 483,926 | |
| Norfolk Airport Authority, 5%, 7/1/32 | | | 125,000 | | | | 129,801 | |
| | | | | | | | 613,727 | |
| Development - 11.2% | | | | | | | | |
| Fairfax County Economic Development Authority, Series A, (Prerefunded 10/1/24 @ $100), 5%, 10/1/26 | | | 150,000 | | | | 151,610 | |
| Henrico County Economic Development Authority, 5%, 10/1/37 | | | 245,000 | | | | 240,914 | |
| Loudoun County Economic Development Authority, Series A, 5%, 12/1/25 | | | 125,000 | | | | 128,025 | |
| Loudoun County Economic Development Authority, Series A, 5%, 12/1/30 | | | 165,000 | | | | 175,916 | |
| Loudoun County Economic Development Authority, Series A, 4%, 12/1/37 | | | 500,000 | | | | 465,432 | |
| Manassas Park Economic Development Authority, 5%, 12/15/28 | | | 200,000 | | | | 210,187 | |
| Manassas Park Economic Development Authority, 3%, 12/15/44 | | | 345,000 | | | | 232,753 | |
| Roanoke Economic Development Authority, Series A, 5%, 7/1/47 | | | 250,000 | | | | 243,676 | |
| | | | | | | | 1,848,513 | |
| Education - 8.2% | | | | | | | | |
| Campbell County Industrial Development Authority, 3%, 6/1/48 | | | 415,000 | | | | 275,772 | |
| Culpeper County Economic Development Authority, 4%, 6/1/26 | | | 250,000 | | | | 249,166 | |
| Richmond, Series A, (ST AID WITHHLDG), 3%, 7/15/34 | | | 435,000 | | | | 371,338 | |
| Virginia College Building Authority, 5%, 2/1/25 | | | 150,000 | | | | 152,274 | |
| Virginia College Building Authority, Series A, (ST INTERCEPT), 5%, 9/1/34 | | | 125,000 | | | | 130,733 | |
| Virginia Public School Authority, Series A, (ST AID WITHHLDG), 5%, 8/1/30 | | | 175,000 | | | | 188,476 | |
| | | | | | | | 1,367,759 | |
| Facilities - 9.9% | | | | | | | | |
| Henry County Industrial Development Authority, 4.125%, 11/1/50 | | | 250,000 | | | | 200,982 | |
| Lynchburg, (ST AID WITHHLDG), 5%, 6/1/26 | | | 115,000 | | | | 115,888 | |
| New River Valley Regional Jail Authority, 5%, 10/1/25 | | | 100,000 | | | | 101,827 | |
| Prince Edward County Industrial Development Authority, 5%, 9/1/32 | | | 405,000 | | | | 414,099 | |
| Pulaski County, (ST AID WITHHLDG), 5%, 2/1/24 | | | 325,000 | | | | 325,881 | |
| Western Regional Jail Authority, (Prerefunded 12/1/25 @ $100), 3.125%, 12/1/29 | | | 245,000 | | | | 240,814 | |
| Western Regional Jail Authority, 3.125%, 12/1/29 | | | 255,000 | | | | 235,226 | |
| | | | | | | | 1,634,717 | |
| General Obligation - 40.0% | | | | | | | | |
| Alexandria, Series A, (ST AID WITHHLDG), 5%, 7/15/27 | | | 150,000 | | | | 154,717 | |
| Alexandria, Series A, (ST AID WITHHLDG), 5%, 7/15/28 | | | 100,000 | | | | 105,035 | |
| Arlington County, Series B, (Prerefunded 8/15/24 @ $100), (ST AID WITHHLDG), 5%, 8/15/27 | | | 125,000 | | | | 126,145 | |
| Arlington County, Series A, (Prerefunded 8/15/26 @ $100) (A), 5%, 8/15/30 | | | 600,000 | | | | 620,394 | |
| Chesterfield County Economic Development Authority, Series B, 3%, 4/1/38 | | | 285,000 | | | | 218,782 | |
| Commonwealth of Virginia, Series A, 3%, 6/1/32 | | | 300,000 | | | | 271,554 | |
| Fairfax County, Series A, (ST AID WITHHLDG), 5%, 10/1/26 | | | 410,000 | | | | 425,170 | |
| Fairfax County, Series A, (ST AID WITHHLDG), 5%, 10/1/36 | | | 270,000 | | | | 285,797 | |
| Greater Richmond Convention Center Authority, 5%, 6/15/26 | | | 455,000 | | | | 460,896 | |
| James City County Economic Development Authority, 5%, 6/15/30 | | | 500,000 | | | | 529,288 | |
| Loudoun County, Series A, (ST AID WITHHLDG), 5%, 12/1/24 | | | 400,000 | | | | 405,263 | |
| Norfolk, (Prerefunded 8/1/28 @ $100), (ST AID WITHHLDG), 5%, 8/1/47 | | | 455,000 | | | | 482,807 | |
| Poquoson, (ST AID WITHHLDG), 4%, 2/15/29 | | | 425,000 | | | | 431,146 | |
| Spotsylvania County, (ST AID WITHHLDG), 5%, 1/15/24 | | | 200,000 | | | | 200,486 | |
| Suffolk, 5%, 2/1/29 | | | 100,000 | | | | 105,724 | |
| Vienna, (ST AID WITHHLDG), 4%, 3/1/30 | | | 225,000 | | | | 227,815 | |
| Virginia Beach Development Authority, Series A, 3.5%, 5/1/30 | | | 250,000 | | | | 239,995 | |
| Virginia Commonwealth Transportation Board, 4%, 5/15/32 | | | 350,000 | | | | 345,538 | |
| Virginia Public Building Authority, Series A, 5%, 8/1/31 | | | 110,000 | | | | 117,316 | |
| Virginia Public Building Authority, Series B, 5%, 8/1/25 | | | 235,000 | | | | 239,950 | |
| Virginia Resources Authority, Series C, (MORAL OBLG), 4%, 11/1/32 | | | 250,000 | | | | 249,066 | |
| Virginia Resources Authority, Series B, (MORAL OBLG), 5%, 11/1/23 | | | 5,000 | | | | 5,000 | |
| Virginia Resources Authority, Series C, 5%, 11/1/30 | | | 250,000 | | | | 262,730 | |
| Virginia Resources Authority, Series C, (MORAL OBLG), 4%, 11/1/34 | | | 125,000 | | | | 123,620 | |
| | | | | | | | 6,634,234 | |
| Medical - 1.6% | | | | | | | | |
| Stafford County Economic Development | | | | | | | | |
| Authority Revenue, 5%, 6/15/25 | | | 260,000 | | | | 262,877 | |
| | | | | | | | | |
| Multifamily Housing - 1.0% | | | | | | | | |
| Virginia Housing Development Authority, Series K, (GNMA/FNMA/FHLMC COLL), 2.125%, 12/1/36 | | | 245,000 | | | | 170,743 | |
| | | | | | | | | |
| Power - 4.8% | | | | | | | | |
| Puerto Rico Electric Power Authority, Series V, (BHAC-CR, MBIA-RE, FGIC), 5.25%, 7/1/24 | | | 290,000 | | | | 290,814 | |
| Virginia Commonwealth Transportation Board, 5%, 5/15/26 | | | 220,000 | | | | 226,591 | |
| Virginia Small Business Financing Authority, 5%, 11/1/25 | | | 265,000 | | | | 270,269 | |
| | | | | | | | 787,674 | |
| Transportation - 9.9% | | | | | | | | |
| Hampton Roads Transportation Accountability Commission, Series A, 5%, 7/1/37 | | | 170,000 | | | | 177,817 | |
| Hampton Roads Transportation Accountability Commission, Series A, 5%, 7/1/42 | | | 470,000 | | | | 476,057 | |
| Northern Virginia Transportation Authority, 5%, 6/1/30 | | | 780,000 | | | | 784,233 | |
| Virginia Commonwealth Transportation Board, 5%, 9/15/27 | | | 200,000 | | | | 209,496 | |
| | | | | | | | 1,647,603 | |
| Water - 8.1% | | | | | | | | |
| Fairfax Sewer Revenue County, Series A, 4%, 7/15/41 | | | 210,000 | | | | 188,995 | |
| Hampton Roads Sanitation District, Series A, (Prerefunded 10/1/27 @ $100), 5%, 10/1/35 | | | 410,000 | | | | 429,724 | |
| Hampton Roads Sanitation District, Series A, (Prerefunded 10/1/27 @ $100), 5%, 10/1/36 | | | 250,000 | | | | 262,027 | |
| Henrico Water & Sewer Revenue County, (Prerefunded 5/1/26 @ $100), 5%, 5/1/27 | | | 150,000 | | | | 154,526 | |
| Upper Occoquan Sewage Authority, 3%, 7/1/46 | | | 300,000 | | | | 209,834 | |
| Upper Occoquan Sewage Authority, 3%, 7/1/49 | | | 140,000 | | | | 94,833 | |
| | | | | | | | 1,339,939 | |
| TOTAL INVESTMENTS - 98.4% | | | | | | | | |
| (Cost $17,729,706** ) | | | | | | | 16,307,786 | |
| NET OTHER ASSETS AND LIABILITIES - 1.6% | | | | | | | 267,299 | |
| TOTAL NET ASSETS - 100.0% | | | | | | $ | 16,575,085 | |
| ** | | Aggregate cost for Federal tax purposes was $17,728,799. |
| (A) | | Restricted. The cost of the security acquired on 6/13/19 is $653,833. The value is $620,394,representing 3.7% of net assets. |
| AMT | | Alternative Minimum Tax. |
| BHAC-CR | | Berkshire Hathaway Assurance Corp. |
| FGIC | | Financial Guaranty Insurance Co. |
| FHLMC | | Federal Home Loan Mortgage Corp or Freddie Mac. |
| FNMA | | Federal National Mortgage Association. |
| GNMA | | Government National Mortgage Association. |
| MBIA | | MBIA Insurance Corp. |
| MORAL OBLG | | Moral Obligation. |
| ST AID WITHHLDG | | State Aid Withholding. |
| ST INTERCEPT | | State Intercept. |
See accompanying Notes to Financial Statements.
Madison Funds | October 31, 2023
Madison Tax-Free National Fund Portfolio of Investments
| | | Par Value | | | Value (Note 2,3) | |
| MUNICIPAL BONDS - 98.2% | | | | | | |
| Alabama - 5.6% | | | | | | |
| Mobile County, General Obligation, 5%, 2/1/39 | | $ | 610,000 | | | $ | 628,358 | |
| Pike Road, Authority Revenue, 4%, 9/1/31 | | | 170,000 | | | | 165,102 | |
| UAB Medicine Finance Authority Revenue, Series B, 5%, 9/1/27 | | | 150,000 | | | | 155,734 | |
| | | | | | | | 949,194 | |
| Arkansas - 1.0% | | | | | | | | |
| Arkansas Development Finance Authority, 5%, 2/1/26 | | | 175,000 | | | | 175,229 | |
| | | | | | | | | |
| California - 0.7% | | | | | | | | |
| Los Angeles County Metropolitan Transportation Authority Sales Tax Revenue, Series A, 5%, 7/1/40 | | | 120,000 | | | | 123,285 | |
| | | | | | | | | |
| Colorado - 3.8% | | | | | | | | |
| Colorado Springs Utilities System Revenue, Series A, 4%, 11/15/40 | | | 250,000 | | | | 225,034 | |
| El Paso County Facilities Corp., Series A, 5%, 12/1/27 | | | 400,000 | | | | 417,668 | |
| | | | | | | | 642,702 | |
| Florida - 2.1% | | | | | | | | |
| City of South Miami Health Facilities Authority, Inc., 5%, 8/15/24 | | | 100,000 | | | | 100,640 | |
| Port St. Lucie Community Redevelopment Agency Revenue, Tax Allocation, 5%, 1/1/26 | | | 250,000 | | | | 256,053 | |
| | | | | | | | 356,693 | |
| Georgia - 2.4% | | | | | | | | |
| Americus-Sumter Payroll Development Authority, Series A, 3.25%, 6/1/33 | | | 150,000 | | | | 135,802 | |
| Atlanta Water & Wastewater Revenue, (Prerefunded 5/1/25 @ $100), 5%, 11/1/43 | | | 275,000 | | | | 280,100 | |
| | | | | | | | 415,902 | |
| Hawaii - 2.6% | | | | | | | | |
| Hawaii, General Obligation, Series EY, 5%, 10/1/25 | | | 435,000 | | | | 443,916 | |
| | | | | | | | | |
| Idaho - 2.9% | | | | | | | | |
| Idaho Health Facilities Authority, Series A, 5%, 3/1/34 | | | 500,000 | | | | 500,086 | |
| | | | | | | | | |
| Illinois - 10.7% | | | | | | | | |
| Cook County School District No. 111 Burbank, (BAM-TCRS), 5%, 12/1/35 | | | 545,000 | | | | 562,674 | |
| Cook County School District No. 111 Burbank, (BAM-TCRS), 4%, 12/1/37 | | | 200,000 | | | | 181,171 | |
| Du Page County School District No. 45, 4%, 1/1/26 | | | 460,000 | | | | 459,404 | |
| Palatine Village, General Obligation, 2%, 12/1/28 | | | 175,000 | | | | 151,276 | |
| Sales Tax Securitization Corp., Series C, 5%, 1/1/27 | | | 140,000 | | | | 143,861 | |
| Village of Bourbonnais, (BAM), 5.25%, 12/1/46 | | | 325,000 | | | | 327,678 | |
| | | | | | | | 1,826,064 | |
| Indiana - 6.2% | | | | | | | | |
| Lincoln Center Building Corp., 4%, 8/1/28 | | | 285,000 | | | | 285,143 | |
| Vanderburgh County Redevelopment District, Tax Allocation, (AGM), 5%, 2/1/26 | | | 500,000 | | | | 509,707 | |
| Whitestown Redevelopment Authority, 5%, 7/15/38 | | | 260,000 | | | | 262,992 | |
| | | | | | | | 1,057,842 | |
| Kansas - 1.3% | | | | | | | | |
| Shawnee County Unified School District No. 437, General Obligation, 4%, 9/1/24 | | | 220,000 | | | | 220,179 | |
| | | | | | | | | |
| Kentucky - 2.6% | | | | | | | | |
| Eastern Kentucky University, Series A, (ST INTERCEPT), 5%, 4/1/33 | | | 445,000 | | | | 448,169 | |
| | | | | | | | | |
| Louisiana - 0.9% | | | | | | | | |
| Lafourche Parish School Board, 4%, 3/1/33 | | | 150,000 | | | | 146,900 | |
| | | | | | | | | |
| Michigan - 3.2% | | | | | | | | |
| Kalamazoo Public Schools, 5%, 5/1/26 | | | 250,000 | | | | 253,616 | |
| Warren Woods Public Schools, (BAM), 4%, 5/1/35 | | | 300,000 | | | | 293,645 | |
| | | | | | | | 547,261 | |
| Mississippi - 2.9% | | | | | | | | |
| Medical Center Educational Building Corp., Series A, 5%, 6/1/30 | | | 475,000 | | | | 490,206 | |
| | | | | | | | | |
| Montana - 1.8% | | | | | | | | |
| Four Corners County Water & Sewer District, Series A, (AGM), 4%, 7/1/25 | | | 300,000 | | | | 299,597 | |
| | | | | | | | | |
| Nebraska - 1.7% | | | | | | | | |
| Elkhorn School District, 4%, 12/15/36 | | | 315,000 | | | | 292,931 | |
| | | | | | | | | |
| New Jersey - 4.0% | | | | | | | | |
| New Jersey Turnpike Authority, Series A, (BHAC-CR, AGM), 5.25%, 1/1/28 | | | 250,000 | | | | 265,339 | |
| New Jersey Turnpike Authority, Series A, (BHAC-CR, AGM), 5.25%, 1/1/29 | | | 250,000 | | | | 268,741 | |
| Union County Improvement Authority, Series A, 4%, 2/1/25 | | | 150,000 | | | | 150,026 | |
| | | | | | | | 684,106 | |
| New Mexico - 1.1% | | | | | | | | |
| Otero County, (BAM), 4%, 12/1/28 | | | 195,000 | | | | 192,867 | |
| | | | | | | | | |
| New York - 3.9% | | | | | | | | |
| Brookhaven Local Development Corp., 5%, 11/1/24 | | | 110,000 | | | | 109,662 | |
| New York State Dormitory Authority, Series 1, (BHAC-CR), 5.5%, 7/1/31 | | | 250,000 | | | | 267,728 | |
| Port Authority of New York & New Jersey, Series 85th, (GO of AUTH), 5.375%, 3/1/28 | | | 280,000 | | | | 289,261 | |
| | | | | | | | 666,651 | |
| Oklahoma - 4.0% | | | | | | | | |
| Elk City Industrial Authority, 4%, 5/1/30 | | | 335,000 | | | | 324,558 | |
| Tulsa County Industrial Authority, 3%, 2/1/31 | | | 400,000 | | | | 358,112 | |
| | | | | | | | 682,670 | |
| Pennsylvania - 5.6% | | | | | | | | |
| City of Pittsburgh, 4%, 9/1/35 | | | 350,000 | | | | 341,742 | |
| Commonwealth Financing Authority, Series A, 5%, 6/1/35 | | | 370,000 | | | | 372,507 | |
| Waverly Township Municipal Authority, (BAM ST AID WITHHLDG), 4%, 2/15/26 | | | 250,000 | | | | 250,311 | |
| | | | | | | | 964,560 | |
| Texas - 6.8% | | | | | | |
| Austin, General Obligation, 5%, 9/1/26 | | | 550,000 | | | | 559,035 | |
| Center, General Obligation, 3%, 8/15/34 | | | 410,000 | | | | 342,155 | |
| Harris County Toll Road Authority, 4%, 8/15/38 | | | 300,000 | | | | 269,475 | |
| | | | | | | | 1,170,665 | |
| Utah - 3.2% | | | | | | | | |
| Ogden City Sewer & Water Revenue, Series A, 4%, 6/15/31 | | | 250,000 | | | | 249,340 | |
| Utah Transit Authority, Series A, (BHAC-CR), 5%, 6/15/35 | | | 280,000 | | | | 304,321 | |
| | | | | | | | 553,661 | |
| Virginia - 6.1% | | | | | | | | |
| Fairfax County Economic Development Authority, Series A, 5%, 9/1/38 | | | 90,000 | | | | 91,725 | |
| Roanoke Economic Development Authority, Series A, 5%, 7/1/47 | | | 250,000 | | | | 243,676 | |
| Southampton County Industrial Development Authority, 5%, 6/1/35 | | | 440,000 | | | | 459,689 | |
| Western Regional Jail Authority, 5%, 12/1/34 | | | 250,000 | | | | 255,276 | |
| | | | | | | | 1,050,366 | |
| Washington - 1.2% | | | | | | | | |
| Washington, General Obligation, Series E, 5%, 2/1/29 | | | 205,000 | | | | 205,474 | |
| | | | | | | | | |
| West Virginia - 2.7% | | | | | | | | |
| West Virginia Economic Development Authority, Series A, 5%, 7/1/37 | | | 450,000 | | | | 459,414 | |
| | | | | | | | | |
| Wisconsin - 7.2% | | | | | | | | |
| City of Burlington WI, Series A, (BAM), 4%, 4/1/36 | | | 580,000 | | | | 542,114 | |
| Green Bay, Series A, 4%, 4/1/38 | | | 355,000 | | | | 320,586 | |
| Wisconsin Health & Educational Facilities Authority, Series A, 4%, 11/15/35 | | | 400,000 | | | | 375,868 | |
| | | | | | | | 1,238,568 | |
| TOTAL INVESTMENTS - 98.2% | | | | | | | | |
| (Cost $17,953,223** ) | | | | | | | 16,805,158 | |
| NET OTHER ASSETS AND LIABILITIES - 1.8% | | | | | | | 309,172 | |
| TOTAL NET ASSETS - 100.0% | | | | | | $ | 17,114,330 | |
| ** | | Aggregate cost for Federal tax purposes was $17,953,223. |
| AGM | | Assured Guaranty Municipal Corp. |
| BAM | | Build America Mutual Assurance Co. |
| BHAC-CR | | Berkshire Hathaway Assurance Corp. |
| GO of AUTH | | General Obligation of the Authority. |
| HUD SECT 8 | | HUD Insured Multifamily Housing. |
| NATL-RE | | National Public Finance Guarantee Corp. |
| PSF-GTD | | Permanent School Fund Guaranteed. |
| ST AID WITHHLDG | | State Aid Withholding. |
| ST INTERCEPT | | State Intercept. |
| TCRS | | Transferable Custodial Receipts. |
See accompanying Notes to Financial Statements.
Madison Funds | October 31, 2023
Madison High Quality Bond Fund Portfolio of Investments
| | | Par Value | | | Value (Note 2,3) | |
| CORPORATE NOTES AND BONDS - 35.8% | | | | | | |
| Communication Services - 2.6% | | | | | | | | |
| Comcast Corp., 3.15%, 3/1/26 | | $ | 750,000 | | | $ | 711,538 | |
| Walt Disney Co., 3.8%, 3/22/30 | | | 750,000 | | | | 669,825 | |
| | | | | | | | 1,381,363 | |
| Consumer Discretionary - 1.9% | | | | | | | | |
| Cummins, Inc., 1.5%, 9/1/30 | | | 750,000 | | | | 573,895 | |
| NIKE, Inc., 2.75%, 3/27/27 | | | 500,000 | | | | 460,720 | |
| | | | | | | | 1,034,615 | |
| Consumer Staples - 5.6% | | | | | | | | |
| Coca-Cola Co., 1%, 3/15/28 | | | 750,000 | | | | 630,010 | |
| Hershey Co., 1.7%, 6/1/30 | | | 750,000 | | | | 588,154 | |
| Kimberly-Clark Corp., 1.05%, 9/15/27 | | | 750,000 | | | | 637,587 | |
| PepsiCo, Inc. (A), 4.45%, 5/15/28 | | | 500,000 | | | | 487,628 | |
| PepsiCo, Inc., 2.75%, 3/19/30 | | | 750,000 | | | | 640,065 | |
| | | | | | | | 2,983,444 | |
| Financials - 20.1% | | | | | | | | |
| Bank of America Corp., (Secured Overnight Financing Rate + 1.010%) (B), 1.197%, 10/24/26 | | | 750,000 | | | | 677,414 | |
| Bank of New York Mellon Corp., (Secured Overnight Financing Rate Index + 1.802%) (B), 5.802%, 10/25/28 | | | 750,000 | | | | 740,659 | |
| Berkshire Hathaway Finance Corp., 2.875%, 3/15/32 | | | 750,000 | | | | 612,838 | |
| BlackRock, Inc., 3.5%, 3/18/24 | | | 750,000 | | | | 743,721 | |
| Charles Schwab Corp., 0.9%, 3/11/26 | | | 750,000 | | | | 661,397 | |
| JPMorgan Chase & Co., (3 mo. USD Term SOFR + 1.417%) (B), 3.22%, 3/1/25 | | | 750,000 | | | | 741,930 | |
| Mastercard, Inc., 3.3%, 3/26/27 | | | 750,000 | | | | 700,643 | |
| Morgan Stanley, (Secured Overnight Financing Rate + 2.240%) (B), 6.296%, 10/18/28 | | | 750,000 | | | | 748,946 | |
| Public Storage Operating Co., 1.95%, 11/9/28 | | | 750,000 | | | | 628,640 | |
| Simon Property Group LP, 2.45%, 9/13/29 | | | 750,000 | | | | 612,698 | |
| State Street Corp., (Secured Overnight Financing Rate + 0.940%) (B), 2.354%, 11/1/25 | | | 750,000 | | | | 719,678 | |
| Truist Financial Corp., 2.85%, 10/26/24 | | | 750,000 | | | | 724,270 | |
| Truist Financial Corp., (Secured Overnight Financing Rate + 1.435%) (B), 4.873%, 1/26/29 | | | 500,000 | | | | 461,733 | |
| Truist Financial Corp., 1.95%, 6/5/30 | | | 750,000 | | | | 560,092 | |
| U.S. Bancorp, (Secured Overnight Financing Rate + 1.660%) (B), 4.548%, 7/22/28 | | | 750,000 | | | | 696,486 | |
| Wells Fargo & Co., (3 mo. USD Term SOFR + | | | | | | |
| 1.087%) (B), 2.406%, 10/30/25 | | | 750,000 | | | | 719,634 | |
| | | | | | | | 10,750,779 | |
| Industrials - 3.5% | | | | | | | | |
| Caterpillar Financial Services Corp., 4.8%, | | | | | | | | |
| 1/6/26 | | | 500,000 | | | | 493,159 | |
| Emerson Electric Co., 2%, 12/21/28 | | | 750,000 | | | | 635,926 | |
| John Deere Capital Corp., 4.75%, 1/20/28 | | | 750,000 | | | | 729,220 | |
| | | | | | | | 1,858,305 | |
| Information Technology - 1.3% | | | | | | | | |
| Texas Instruments, Inc., 1.375%, 3/12/25 | | | 750,000 | | | | 710,033 | |
| | | | | | | | | |
| Utilities - 0.8% | | | | | | | | |
| National Rural Utilities Cooperative Finance | | | | | | | | |
| Corp., 1%, 6/15/26 | | | 500,000 | | | | 443,981 | |
| Total Corporate Notes and Bonds | | | | | | | | |
| (Cost $21,213,503 ) | | | | | | | 19,162,520 | |
| FOREIGN CORPORATE BONDS - 1.3% | | | | | | | | |
| Health Care - 1.3% | | | | | | | | |
| Pfizer Investment Enterprises Pte. Ltd., | | | | | | | | |
| 4.75%, 5/19/33 | | | 750,000 | | | | 690,830 | |
| Total Foreign Corporate Bonds | | | | | | | | |
| (Cost $744,051 ) | | | | | | | 690,830 | |
| | | | | | | | | |
| U.S. GOVERNMENT AND AGENCY OBLIGATIONS - 60.9% | | | | | | | | |
| | | | | | | | | |
| Fannie Mae - 10.1% | | | | | | | | |
| 0.500%, 11/7/25 | | | 1,500,000 | | | | 1,367,443 | |
| 2.125%, 4/24/26 | | | 2,500,000 | | | | 2,330,643 | |
| 0.750%, 10/8/27 (A) | | | 2,000,000 | | | | 1,702,712 | |
| | | | | | | | 5,400,798 | |
| U.S. Treasury Notes - 50.8% | | | | | | | | |
| 2.375%, 8/15/24 | | | 1,500,000 | | | | 1,463,906 | |
| 1.250%, 8/31/24 | | | 1,250,000 | | | | 1,207,178 | |
| 0.375%, 9/15/24 | | | 1,500,000 | | | | 1,435,137 | |
| 2.250%, 11/15/24 | | | 1,750,000 | | | | 1,693,945 | |
| 2.125%, 5/15/25 | | | 1,750,000 | | | | 1,670,498 | |
| 4.250%, 10/15/25 | | | 750,000 | | | | 738,164 | |
| 3.875%, 1/15/26 | | | 750,000 | | | | 731,982 | |
| 3.750%, 4/15/26 | | | 1,250,000 | | | | 1,214,893 | |
| 1.625%, 5/15/26 | | | 1,750,000 | | | | 1,611,846 | |
| 1.500%, 8/15/26 | | | 1,750,000 | | | | 1,595,098 | |
| 1.500%, 1/31/27 | | | 1,500,000 | | | | 1,349,121 | |
| 0.625%, 3/31/27 | | | 1,000,000 | | | | 867,734 | |
| 2.375%, 5/15/27 | | | 1,500,000 | | | | 1,378,711 | |
| 2.250%, 11/15/27 | | | 1,750,000 | | | | 1,583,682 | |
| 3.625%, 5/31/28 | | | 1,500,000 | | | | 1,426,992 | |
| 1.875%, 2/28/29 | | | 1,500,000 | | | | 1,290,527 | |
| 3.875%, 11/30/29 | | | 1,750,000 | | | | 1,655,596 | |
| 3.875%, 12/31/29 | | | 1,750,000 | | | | 1,654,434 | |
| 1.375%, 11/15/31 | | | 1,750,000 | | | | 1,346,133 | |
| 3.375%, 5/15/33 | | | 1,500,000 | | | | 1,329,609 | |
| | | | | | | | 27,245,186 | |
| Total U.S. Government and Agency | | | | | | | | |
| Obligations | | | | | | | | |
| (Cost $34,942,061 ) | | | | | | | 32,645,984 | |
| | | Shares | | | | |
| SHORT-TERM INVESTMENTS - 5.3% | | | | | | | | |
| State Street Institutional U.S. Government | | | | | | | | |
| Money Market Fund, Premier Class (C), 5.30% | | | 624,189 | | | | 624,189 | |
| State Street Navigator Securities Lending Government Money Market Portfolio (C) (D), 5.36% | | | 2,209,000 | | | | 2,209,000 | |
| Total Short-Term Investments | | | | | | | | |
| (Cost $2,833,189 ) | | | | | | | 2,833,189 | |
| TOTAL INVESTMENTS - 103.3% | | | | | | | | |
| (Cost $59,732,804** ) | | | | | | | 55,332,523 | |
| NET OTHER ASSETS AND LIABILITIES - (3.3%) | | | | | | | (1,777,119 | ) |
| TOTAL NET ASSETS - 100.0% | | | | | | $ | 53,555,404 | |
| ** | | Aggregate cost for Federal tax purposes was $59,856,370. |
| (A) | | All or a portion of these securities, with an aggregate fair value of $2,162,301, are on loan as part of a securities lending program. See footnote (D) and Note 11 for details on the securities lending program. |
| (B) | | Floating rate or variable rate note. Rate shown is as of October 31, 2023. |
| (C) | | 7-day yield. |
| (D) | | Represents investments of cash collateral received in connection with securities lending. |
| | | |
| LP | | Limited Partnership. |
| SOFR | | Secured Overnight Financing Rate. |
| USD | | United States Dollar. |
See accompanying Notes to Financial Statements.
Madison Funds | October 31, 2023
Madison Core Bond Fund Portfolio of Investments
| | | Par Value | | | Value (Note 2,3) | |
| ASSET BACKED SECURITIES - 6.1% | | | | | | | | |
| CarMax Auto Owner Trust, Series 2023-3, Class A3, 5.28%, 5/15/28 | | $ | 500,000 | | | $ | 492,804 | |
| CCG Receivables Trust, Series 2020-1, Class A2 (A), 0.54%, 12/14/27 | | | 31,162 | | | | 31,010 | |
| Chesapeake Funding II LLC, Series 2020- 1A, Class A1 (A), 0.87%, 8/15/32 | | | 26,574 | | | | 26,319 | |
| Chesapeake Funding II LLC, Series 2023- 1A, Class A1 (A), 5.65%, 5/15/35 | | | 874,069 | | | | 867,481 | |
| Chesapeake Funding II LLC, Series 2023- 2A, Class A1 (A), 6.16%, 10/15/35 | | | 572,065 | | | | 570,849 | |
| CNH Equipment Trust, Series 2023-A, Class A3, 4.81%, 8/15/28 | | | 750,000 | | | | 734,472 | |
| Dell Equipment Finance Trust, Series 2023-2, Class A3 (A), 5.65%, 1/22/29 | | | 1,000,000 | | | | 994,647 | |
| Donlen Fleet Lease Funding 2 LLC, Series 2021-2, Class A2 (A), 0.56%, 12/11/34 | | | 158,004 | | | | 155,052 | |
| Enterprise Fleet Financing LLC, Series 2022-1, Class A2 (A), 3.03%, 1/20/28 | | | 581,231 | | | | 567,018 | |
| Enterprise Fleet Financing LLC, Series 2023-1, Class A2 (A), 5.51%, 1/22/29 | | | 500,000 | | | | 495,375 | |
| Enterprise Fleet Financing LLC, Series 2022-4, Class A2 (A), 5.76%, 10/22/29 | | | 1,033,614 | | | | 1,027,737 | |
| GM Financial Consumer Automobile Receivables Trust, Series 2020-2, Class B, 2.54%, 8/18/25 | | | 1,000,000 | | | | 992,812 | |
| Hertz Vehicle Financing LLC, Series 2021- 1A, Class A (A), 1.21%, 12/26/25 | | | 750,000 | | | | 714,739 | |
| John Deere Owner Trust, Series 2023-B, Class A3, 5.18%, 3/15/28 | | | 750,000 | | | | 742,638 | |
| JPMorgan Chase Bank NA, Series 2020-2, Class B (A), 0.84%, 2/25/28 | | | 61,194 | | | | 60,749 | |
| JPMorgan Chase Bank NA, Series 2021-1, Class B (A), 0.875%, 9/25/28 | | | 147,416 | | | | 144,171 | |
| JPMorgan Chase Bank NA, Series 2021-2, Class B (A), 0.889%, 12/26/28 | | | 143,153 | | | | 139,283 | |
| JPMorgan Chase Bank NA, Series 2021-3, Class C (A), 0.86%, 2/26/29 | | | 377,117 | | | | 361,285 | |
| LAD Auto Receivables Trust, Series 2021-1A, Class A (A), 1.3%, 8/17/26 | | | 124,099 | | | | 122,073 | |
| LAD Auto Receivables Trust, Series 2022- 1A, Class A (A), 5.21%, 6/15/27 | | | 604,261 | | | | 598,255 | |
| LAD Auto Receivables Trust, Series 2023- 2A, Class A2 (A), 5.93%, 6/15/27 | | | 345,311 | | | | 344,004 | |
| Nissan Auto Receivables Owner Trust, Series 2022-B, Class A4, 4.45%, 11/15/29 | | | 200,000 | | | | 193,042 | |
| Santander Drive Auto Receivables Trust, Series 2022-2, Class B, 3.44%, 9/15/27 | | | 300,000 | | | | 291,586 | |
| Santander Revolving Auto Loan Trust, Series 2019-A, Class C (A), 3%, 1/26/32 | | | 500,000 | | | | 476,133 | |
| | | | | | | | | |
| Total Asset Backed Securities | | | | | | | | |
| (Cost $11,317,027 ) | | | | | | | 11,143,534 | |
| COLLATERALIZED MORTGAGE OBLIGATIONS - 5.2% | | | | | | | | |
| Bunker Hill Loan Depositary Trust, Series 2019-2, Class A1 (A) (B), 2.879%, 7/25/49 | | | 126,775 | | | | 116,491 | |
| Bunker Hill Loan Depositary Trust, Series 2020-1, Class A1 (A) (C) (D), 1.724%, 2/25/55 | | | 96,292 | | | | 91,125 | |
| CIM Trust, Series 2021-J2, Class A4 (A) (C) (D), 2.5%, 4/25/51 | | | 506,455 | | | | 421,476 | |
| Federal Home Loan Mortgage Corp. REMICS, Series 4066, Class DI, IO, 3%, 6/15/27 | | | 395,858 | | | | 13,389 | |
| Federal Home Loan Mortgage Corp. STACR REMIC Trust, Series 2021-DNA3, Class M1, (30 day USD SOFR Average + 0.750%) (A) (D), 6.071%, 10/25/33 | | | 197,186 | | | | 196,632 | |
| Federal National Mortgage Association Connecticut Avenue Securities, Series 2022-R01, Class 1M1, (30 day USD SOFR Average + 1.000%) (A) (D), 6.321%, 12/25/41 | | | 252,764 | | | | 251,034 | |
| Federal National Mortgage Association REMICS, Series 2015-12, Class NI, IO, 3.5%, 3/25/30 | | | 458,785 | | | | 31,685 | |
| Federal National Mortgage Association REMICS, Series 2011-31, Class DB, 3.5%, 4/25/31 | | | 261,092 | | | | 245,433 | |
| Federal National Mortgage Association REMICS, Series 2011-36, Class QB, 4%, 5/25/31 | | | 347,948 | | | | 331,117 | |
| Federal National Mortgage Association REMICS, Series 2001-73, Class GZ, 6%, 12/25/31 | | | 65,913 | | | | 64,688 | |
| Federal National Mortgage Association REMICS, Series 2005-79, Class LT, 5.5%, 9/25/35 | | | 64,905 | | | | 63,291 | |
| Federal National Mortgage Association REMICS, Series 2020-44, Class TI, IO, 5.5%, 12/25/35 | | | 2,010,744 | | | | 304,887 | |
| Federal National Mortgage Association REMICS, Series 2016-21, Class BA, 3%, 3/25/42 | | | 17,278 | | | | 17,089 | |
| Flagstar Mortgage Trust, Series 2021- 9INV, Class A1 (A) (C) (D), 2.5%, 9/25/41 | | | 533,284 | | | | 435,600 | |
| FREMF Mortgage Trust, Series 2014-K40, Class B (A) (C) (D), 4.052%, 11/25/47 | | | 1,000,000 | | | | 977,641 | |
| GCAT Trust, Series 2021-NQM1, Class A1 (A) (C) (D), 0.874%, 1/25/66 | | | 634,551 | | | | 494,170 | |
| Government National Mortgage Association REMICS, Series 2015-53, Class IL, IO, 3%, 9/20/44 | | | 46,910 | | | | 348 | |
| GS Mortgage-Backed Securities Corp. Trust, Series 2020-PJ6, Class A2 (A) (C) (D), 2.5%, 5/25/51 | | | 479,707 | | | | 351,292 | |
| JP Morgan Mortgage Trust, Series 2019- 5, Class A3 (A) (C) (D), 4%, 11/25/49 | | | 22,358 | | | | 19,573 | |
| JP Morgan Mortgage Trust, Series 2019- 7, Class A3 (A) (C) (D), 3.492%, 2/25/50 | | | 86,342 | | | | 71,771 | |
| JP Morgan Mortgage Trust, Series 2021- 1, Class A3 (A) (C) (D), 2.5%, 6/25/51 | | | 653,096 | | | | 477,874 | |
| JP Morgan Mortgage Trust, Series 2021- 3, Class A3 (A) (C) (D), 2.5%, 7/25/51 | | | 857,752 | | | | 627,622 | |
| JP Morgan Mortgage Trust, Series 2021- 6, Class A4 (A) (C) (D), 2.5%, 10/25/51 | | | 725,362 | | | | 601,611 | |
| JP Morgan Mortgage Trust, Series 2021- 14, Class A4 (A) (C) (D), 2.5%, 5/25/52 | | | 804,407 | | | | 659,791 | |
| JP Morgan Wealth Management, Series 2020-ATR1, Class A3 (A) (C) (D), 3%, 2/25/50 | | | 137,118 | | | | 107,433 | |
| PSMC Trust, Series 2019-2, Class A1 (A) (C) (D), 3.5%, 10/25/49 | | | 5,143 | | | | 5,042 | |
| PSMC Trust, Series 2020-2, Class A2 (A) (C) (D), 3%, 5/25/50 | | | 113,175 | | | | 94,926 | |
| PSMC Trust, Series 2021-1, Class A11 (A) (C) (D), 2.5%, 3/25/51 | | | 845,699 | | | | 705,842 | |
| RCKT Mortgage Trust, Series 2021-6, Class A5 (A) (C) (D), 2.5%, 12/25/51 | | | 627,898 | | | | 513,785 | |
| RCKT Mortgage Trust, Series 2022-1, Class A5 (A) (C) (D), 2.5%, 1/25/52 | | | 429,995 | | | | 351,015 | |
| Sequoia Mortgage Trust, Series 2013-7, Class A2 (C) (D), 3%, 6/25/43 | | | 269,309 | | | | 221,691 | |
| Towd Point HE Trust, Series 2021-HE1, Class A1 (A) (C) (D), 0.918%, 2/25/63 | | | 116,806 | | | | 109,495 | |
| Wells Fargo Mortgage-Backed Securities Trust, Series 2019-2, Class A1 (A) (C) (D), 4%, 4/25/49 | | | 11,753 | | | | 10,547 | |
| Wells Fargo Mortgage-Backed Securities Trust, Series 2021-INV2, Class A2 (A) (C) (D), 2.5%, 9/25/51 | | | 620,970 | | | | 453,963 | |
| | | | | | | | | |
| Total Collateralized Mortgage Obligations | | | | | | | | |
| (Cost $11,684,606 ) | | | | | | | 9,439,369 | |
| COMMERCIAL MORTGAGE-BACKED SECURITIES - 3.1% | | | | | | | | |
| Federal Home Loan Mortgage Corp. | | | | | | | | |
| Multifamily Structured Pass-Through Certificates, Series KJ17, Class A2, 2.982%, 11/25/25 | | | 205,607 | | | | 198,560 | |
| Federal Home Loan Mortgage Corp. | | | | | | | | |
| Multifamily Structured Pass-Through Certificates, Series K059, Class X1, IO (C) (D), 0.3%, 9/25/26 | | | 14,849,393 | | | | 101,454 | |
| Federal Home Loan Mortgage Corp. | | | | | | | | |
| Multifamily Structured Pass-Through Certificates, Series K066, Class A2, 3.117%, 6/25/27 | | | 1,000,000 | | | | 927,453 | |
| Federal Home Loan Mortgage Corp. | | | | | | | | |
| Multifamily Structured Pass-Through Certificates, Series K131, Class A2, 1.853%, 7/25/31 | | | 505,000 | | | | 388,676 | |
| Federal National Mortgage Association- | | | | | | | | |
| Aces, Series 2017-M15, Class ATS2 (C) (D), 3.155%, 11/25/27 | | | 766,460 | | | | 708,379 | |
| Federal National Mortgage Association- | | | | | | | | |
| Aces, Series 2022-M1, Class A2 (C) (D), 1.669%, 10/25/31 | | | 1,250,000 | | | | 934,573 | |
| FREMF Mortgage Trust, Series 2014-K41, | | | | | | | | |
| Class B (A) (C) (D), 3.834%, 11/25/47 | | | 750,000 | | | | 729,939 | |
| FREMF Mortgage Trust, Series 2015-K44, | | | | | | | | |
| Class B (A) (C) (D), 3.719%, 1/25/48 | | | 750,000 | | | | 724,880 | |
| FREMF Mortgage Trust, Series 2016-K58, | | | | | | | | |
| Class B (A) (C) (D), 3.738%, 9/25/49 | | | 320,000 | | | | 299,084 | |
| FREMF Mortgage Trust, Series 2020- | | | | | | | | |
| K106, Class B (A) (C) (D), 3.585%, 3/25/53 | | | 750,000 | | | | 637,350 | |
| GSAMP Trust, Series 2006-S5, Class M5 (C), 7.488% 9/25/36 | | | 722,000 | | | | - | |
| | | | | | | | | |
| Total Commercial Mortgage- | | | | | | | | |
| Backed Securities | | | | | | | | |
| (Cost $6,062,553 ) | | | | | | | 5,650,348 | |
| CORPORATE NOTES AND BONDS - 28.0% | | | | | | | | |
| Communication Services - 1.7% | | | | | | | | |
| AT&T, Inc., 4.75%, 5/15/46 | | | 500,000 | | | | 379,829 | |
| CCO Holdings LLC/CCO Holdings Capital Corp. (A), 4.75%, 3/1/30 | | | 300,000 | | | | 247,958 | |
| Charter Communications Operating LLC/ | | | | | | | | |
| Charter Communications Operating Capital, 4.908%, 7/23/25 | | | 500,000 | | | | 488,745 | |
| Discovery Communications LLC, 5%, 9/20/37 | | | 250,000 | | | | 196,238 | |
| Expedia Group, Inc., 3.25%, 2/15/30 | | | 500,000 | | | | 414,711 | |
| Hughes Satellite Systems Corp., 5.25%, 8/1/26 | | | 200,000 | | | | 178,840 | |
| Meta Platforms, Inc., 3.85%, 8/15/32 | | | 250,000 | | | | 217,773 | |
| SBA Communications Corp., 3.875%, 2/15/27 | | | 350,000 | | | | 318,750 | |
| VeriSign, Inc., 2.7%, 6/15/31 | | | 500,000 | | | | 386,893 | |
See accompanying Notes to Financial Statements.
Madison Funds | October 31, 2023
Madison Core Bond Fund Portfolio of Investments - continued
| | | Par Value | | | Value (Note 2,3) | |
| Verizon Communications, Inc., 3.4%, 3/22/41 | | $ | 500,000 | | | $ | 339,245 | |
| | | | | | | | 3,168,982 | |
| Consumer Discretionary - 2.1% | | | | | | | | |
| 7-Eleven, Inc. (A), 1.8%, 2/10/31 | | | 400,000 | | | | 297,808 | |
| 7-Eleven, Inc. (A), 2.5%, 2/10/41 | | | 250,000 | | | | 146,231 | |
| Advance Auto Parts, Inc., 1.75%, 10/1/27 | | | 250,000 | | | | 202,910 | |
| American Airlines, Inc./AAdvantage | | | | | | | | |
| Loyalty IP Ltd. (A), 5.5%, 4/20/26 | | | 291,667 | | | | 283,661 | |
| General Motors Financial Co., Inc., 5.85%, 4/6/30 | | | 500,000 | | | | 472,866 | |
| Hilton Domestic Operating Co., Inc. (A), 5.375%, 5/1/25 | | | 350,000 | | | | 344,121 | |
| Home Depot, Inc., 3.35%, 4/15/50 | | | 250,000 | | | | 159,501 | |
| Lowe's Cos., Inc., 3%, 10/15/50 | | | 500,000 | | | | 276,775 | |
| Lowe's Cos., Inc., 4.25%, 4/1/52 | | | 750,000 | | | | 523,369 | |
| Southwest Airlines Co., 5.125%, 6/15/27 | | | 500,000 | | | | 482,643 | |
| Tractor Supply Co., 1.75%, 11/1/30 | | | 550,000 | | | | 408,238 | |
| Tractor Supply Co., 5.25%, 5/15/33 | | | 150,000 | | | | 137,610 | |
| | | | | | | | 3,735,733 | |
| Consumer Staples - 0.7% | | | | | | | | |
| Keurig Dr Pepper, Inc., 3.8%, 5/1/50 | | | 300,000 | | | | 200,440 | |
| Lamb Weston Holdings, Inc. (A), 4.875%, 5/15/28 | | | 250,000 | | | | 230,675 | |
| Mars, Inc. (A), 3.875%, 4/1/39 | | | 400,000 | | | | 307,827 | |
| Mars, Inc. (A), 2.375%, 7/16/40 | | | 350,000 | | | | 210,758 | |
| Performance Food Group, Inc. (A), 5.5%, 10/15/27 | | | 325,000 | | | | 303,892 | |
| | | | | | | | 1,253,592 | |
| Energy - 2.6% | | | | | | | | |
| Boardwalk Pipelines LP, 4.45%, 7/15/27 | | | 400,000 | | | | 375,146 | |
| Eastern Gas Transmission & Storage, Inc., 3%, 11/15/29 | | | 350,000 | | | | 293,977 | |
| Energy Transfer LP, 5.25%, 4/15/29 | | | 275,000 | | | | 261,231 | |
| Energy Transfer LP, 6.55%, 12/1/33 | | | 300,000 | | | | 296,234 | |
| EnLink Midstream Partners LP, 5.45%, 6/1/47 | | | 400,000 | | | | 300,684 | |
| Enterprise Products Operating LLC, 5.35%, 1/31/33 | | | 250,000 | | | | 238,806 | |
| Kinder Morgan, Inc., 5.55%, 6/1/45 | | | 400,000 | | | | 330,804 | |
| Marathon Petroleum Corp., 4.7%, 5/1/25 | | | 275,000 | | | | 269,276 | |
| Marathon Petroleum Corp., 3.8%, 4/1/28 | | | 600,000 | | | | 547,784 | |
| MPLX LP, 2.65%, 8/15/30 | | | 350,000 | | | | 277,235 | |
| ONEOK, Inc., 5.85%, 1/15/26 | | | 150,000 | | | | 149,860 | |
| Phillips 66, 0.9%, 2/15/24 | | | 500,000 | | | | 492,298 | |
| Sunoco LP/Sunoco Finance Corp., 6%, 4/15/27 | | | 400,000 | | | | 385,154 | |
| Valero Energy Corp., 6.625%, 6/15/37 | | | 500,000 | | | | 492,314 | |
| Valero Energy Corp., 4%, 6/1/52 | | | 175,000 | | | | 114,490 | |
| | | | | | | | 4,825,293 | |
| Financials - 11.7% | | | | | | | | |
| Air Lease Corp., 2.875%, 1/15/26 | | | 500,000 | | | | 464,042 | |
| Air Lease Corp., 1.875%, 8/15/26 | | | 250,000 | | | | 221,197 | |
| Alexandria Real Estate Equities, Inc., | | | | | | | | |
| 4.75%, 4/15/35 | | | 900,000 | | | | 763,013 | |
| American Express Co., (Secured Overnight | | | | | | | | |
| Financing Rate + 1.940%) (D), 6.489%, | | | | | | | | |
| 10/30/31 | | | 500,000 | | | | 501,694 | |
| American International Group, Inc., | | | | | | | | |
| 4.75%, 4/1/48 | | | 150,000 | | | | 118,204 | |
| Athene Global Funding (A), 1.45%, | | | | | | | | |
| 1/8/26 | | | 500,000 | | | | 447,801 | |
| AvalonBay Communities, Inc., 5%, | | | | | | | | |
| 2/15/33 | | | 250,000 | | | | 232,751 | |
| Bank of America Corp., Series N, (Secured | | | | | | | | |
| Overnight Financing Rate + 0.910%) (D), | | | | | | | | |
| 1.658%, 3/11/27 | | | 400,000 | | | | 357,867 | |
| Bank of America Corp., (Secured | | | | | | | | |
| Overnight Financing Rate + 1.910%) (D), | | | | | | | | |
| 5.288%, 4/25/34 | | | 350,000 | | | | 316,924 | |
| Bank of America Corp., (5 year CMT + | | | | | | | | |
| 2.000%) (D), 3.846%, 3/8/37 | | | 350,000 | | | | 276,808 | |
| Bank of New York Mellon Corp., (Secured | | | | | | | | |
| Overnight Financing Rate Index + | | | | | | | | |
| 2.074%) (D), 5.834%, 10/25/33 | | | 500,000 | | | | 479,951 | |
| Belrose Funding Trust (A), 2.33%, 8/15/30 | | | 350,000 | | | | 254,869 | |
| Berkshire Hathaway Finance Corp., | | | | | | | | |
| 3.85%, 3/15/52 | | | 350,000 | | | | 245,769 | |
| BlackRock, Inc., 2.1%, 2/25/32 | | | 350,000 | | | | 264,457 | |
| Capital One Financial Corp., (Secured | | | | | | | | |
| Overnight Financing Rate + 2.057%) (D), | | | | | | | | |
| 4.927%, 5/10/28 | | | 350,000 | | | | 324,230 | |
| Capital One Financial Corp., (Secured | | | | | | | | |
| Overnight Financing Rate + 2.640%) (D), | | | | | | | | |
| 6.312%, 6/8/29 | | | 400,000 | | | | 383,170 | |
| Capital One Financial Corp., (Secured | | | | | | | | |
| Overnight Financing Rate + 1.790%) (D), | | | | | | | | |
| 3.273%, 3/1/30 | | | 350,000 | | | | 287,183 | |
| Citibank NA, 5.803%, 9/29/28 | | | 250,000 | | | | 247,049 | |
| Citigroup, Inc., (Secured Overnight | | | | | | | | |
| Financing Rate + 2.086%) (D), 4.91%, | | | | | | | | |
| 5/24/33 | | | 350,000 | | | | 310,813 | |
| Discover Financial Services, 6.7%, | | | | | | | | |
| 11/29/32 | | | 500,000 | | | | 464,137 | |
| Empower Finance 2020 LP (A), 3.075%, | | | | | | | | |
| 9/17/51 | | | 350,000 | | | | 198,485 | |
| Fifth Third Bancorp, 2.55%, 5/5/27 | | | 350,000 | | | | 302,416 | |
| Fifth Third Bancorp, (Secured Overnight | | | | | | | | |
| Financing Rate + 2.340%) (D), 6.339%, | | | | | | | | |
| 7/27/29 | | | 400,000 | | | | 387,815 | |
| Fifth Third Bancorp, (Secured Overnight | | | | | | | | |
| Financing Rate + 1.660%) (D), 4.337%, | | | | | | | | |
| 4/25/33 | | | 350,000 | | | | 285,714 | |
| Five Corners Funding Trust II (A), 2.85%, | | | | | | | | |
| 5/15/30 | | | 250,000 | | | | 205,496 | |
| GLP Capital LP/GLP Financing II, Inc., | | | | | | | | |
| 3.25%, 1/15/32 | | | 400,000 | | | | 302,582 | |
| Goldman Sachs BDC, Inc., 2.875%, | | | | | | | | |
| 1/15/26 | | | 400,000 | | | | 368,256 | |
| Goldman Sachs Group, Inc., (Secured | | | | | | | | |
| Overnight Financing Rate + 0.913%) (D), | | | | | | | | |
| 1.948%, 10/21/27 | | | 500,000 | | | | 438,658 | |
| Huntington Bancshares, Inc., (Secured | | | | | | | | |
| Overnight Financing Rate+ 1.830%) (D), | | | | | | | | |
| 6.208%, 8/21/29 | | | 350,000 | | | | 336,641 | |
| Huntington Bancshares, Inc., (5 year CMT | | | | | | | | |
| + 1.170%) (D), 2.487%, 8/15/36 | | | 700,000 | | | | 472,107 | |
| Huntington National Bank, (Secured | | | | | | | | |
| Overnight Financing Rate + 1.205%) (D), | | | | | | | | |
| 4.008%, 5/16/25 | | | 500,000 | | | | 485,588 | |
| Intercontinental Exchange, Inc., 3.75%, | | | | | | | | |
| 9/21/28 | | | 250,000 | | | | 228,028 | |
| Intercontinental Exchange, Inc., 4.6%, | | | | | | | | |
| 3/15/33 | | | 350,000 | | | | 313,220 | |
| Jefferies Financial Group, Inc., 2.625%, | | | | | | | | |
| 10/15/31 | | | 450,000 | | | | 332,560 | |
| JPMorgan Chase & Co., (3 mo. USD SOFR | | | | | | | | |
| + 0.695%) (D), 1.04%, 2/4/27 | | | 650,000 | | | | 577,979 | |
| KeyBank NA, 5%, 1/26/33 | | | 250,000 | | | | 201,718 | |
| KeyCorp, 4.1%, 4/30/28 | | | 400,000 | | | | 343,027 | |
| KKR Group Finance Co. VIII LLC (A), 3.5%, | | | | | | | | |
| 8/25/50 | | | 250,000 | | | | 147,686 | |
| Liberty Mutual Group, Inc. (A), 3.95%, 5/15/60 | | | 150,000 | | | | 88,259 | |
| LPL Holdings, Inc. (A), 4%, 3/15/29 | | | 350,000 | | | | 300,989 | |
| Morgan Stanley, (Secured Overnight | | | | | | | | |
| Financing Rate + 1.990%) (D), 2.188%, | | | | | | | | |
| 4/28/26 | | | 175,000 | | | | 164,616 | |
| Morgan Stanley, (Secured Overnight | | | | | | | | |
| Financing Rate + 1.830%) (D), 6.407%, | | | | | | | | |
| 11/1/29 | | | 300,000 | | | | 299,704 | |
| Morgan Stanley, (Secured Overnight | | | | | | | | |
| Financing Rate + 1.020%) (D), 1.928%, | | | | | | | | |
| 4/28/32 | | | 500,000 | | | | 363,187 | |
| Morgan Stanley, (5 year CMT + 2.430%) | | | | | | | | |
| (D), 5.948%, 1/19/38 | | | 600,000 | | | | 545,791 | |
| Nasdaq, Inc. (E), 1.65%, 1/15/31 | | | 450,000 | | | | 333,213 | |
| Old Republic International Corp., 3.85%, | | | | | | | | |
| 6/11/51 | | | 300,000 | | | | 186,974 | |
| Omega Healthcare Investors, Inc., | | | | | | | | |
| 3.375%, 2/1/31 | | | 250,000 | | | | 192,551 | |
| PNC Bank NA, 2.7%, 10/22/29 | | | 250,000 | | | | 198,755 | |
| PNC Financial Services Group, Inc., | | | | | | | | |
| (Secured Overnight Financing Rate + | | | | | | | | |
| 2.284%) (D), 6.875%, 10/20/34 | | | 300,000 | | | | 300,282 | |
| Realty Income Corp., 4.85%, 3/15/30 | | | 400,000 | | | | 369,924 | |
| Regions Financial Corp., 1.8%, 8/12/28 | | | 500,000 | | | | 391,120 | |
| State Street Corp., (Secured Overnight | | | | | | | | |
| Financing Rate + 1.490%) (D), 3.031%, | | | | | | | | |
| 11/1/34 | | | 250,000 | | | | 206,506 | |
| Synchrony Financial, 7.25%, 2/2/33 | | | 275,000 | | | | 233,641 | |
| Teachers Insurance & Annuity Association | | | | | | | | |
| of America (A), 3.3%, 5/15/50 | | | 300,000 | | | | 181,140 | |
| Truist Bank, 2.25%, 3/11/30 | | | 325,000 | | | | 240,414 | |
| Truist Financial Corp., (Secured Overnight | | | | | | | | |
| Financing Rate + 0.690%) (D), 1.267%, | | | | | | | | |
| 3/2/27 | | | 250,000 | | | | 219,139 | |
| Truist Financial Corp., (Secured Overnight | | | | | | | | |
| Financing Rate + 1.852%) (D), 5.122%, | | | | | | | | |
| 1/26/34 | | | 400,000 | | | | 343,947 | |
| Truist Financial Corp., (Secured Overnight | | | | | | | | |
| Financing Rate + 2.361%) (D), 5.867%, | | | | | | | | |
| 6/8/34 | | | 600,000 | | | | 546,271 | |
| U.S. Bancorp, (Secured Overnight | | | | | | | | |
| Financing Rate + 1.660%) (D), 4.548%, | | | | | | | | |
| 7/22/28 | | | 500,000 | | | | 464,324 | |
| U.S. Bancorp, (Secured Overnight | | | | | | | | |
| Financing Rate + 1.600%) (D), 4.839%, | | | | | | | | |
| 2/1/34 | | | 525,000 | | | | 450,135 | |
| Wells Fargo & Co., (Secured Overnight | | | | | | | | |
| Financing Rate + 2.000%) (D), 2.188%, | | | | | | | | |
| 4/30/26 | | | 350,000 | | | | 329,120 | |
| Wells Fargo & Co., (Secured Overnight | | | | | | | | |
| Financing Rate + 1.740%) (D), 5.574%, | | | | | | | | |
| 7/25/29 | | | 500,000 | | | | 481,854 | |
| Wells Fargo & Co., (Secured Overnight | | | | | | | | |
| Financing Rate + 2.020%) (D), 5.389%, | | | | | | | | |
| 4/24/34 | | | 350,000 | | | | 317,569 | |
| Welltower OP LLC, 2.05%, 1/15/29 | | | 500,000 | | | | 407,492 | |
| Weyerhaeuser Co., 3.375%, 3/9/33 | | | 300,000 | | | | 238,616 | |
| | | | | | | | 21,285,438 | |
| Health Care - 2.3% | | | | | | | | |
| Amgen, Inc., 5.65%, 3/2/53 | | | 400,000 | | | | 354,198 | |
| Block, Inc. (E), 2.75%, 6/1/26 | | | 450,000 | | | | 403,834 | |
| Centene Corp., 2.45%, 7/15/28 | | | 500,000 | | | | 420,150 | |
| Cigna Group, 4.9%, 12/15/48 | | | 500,000 | | | | 403,530 | |
| CVS Health Corp., 5.125%, 7/20/45 | | | 500,000 | | | | 401,214 | |
| Gartner, Inc. (A) (E), 4.5%, 7/1/28 | | | 400,000 | | | | 360,030 | |
| GE HealthCare Technologies, Inc., 5.6%, | | | | | | | | |
| 11/15/25 | | | 750,000 | | | | 745,850 | |
See accompanying Notes to Financial Statements.
Madison Funds | October 31, 2023
Madison Core Bond Fund Portfolio of Investments - continued
| | | Par Value | | | Value (Note 2,3) | |
| GE HealthCare Technologies, Inc., | | | | | | | | |
| 6.377%, 11/22/52 | | $ | 250,000 | | | $ | 243,783 | |
| Health Care Service Corp. A Mutual Legal | | | | | | | | |
| Reserve Co. (A), 2.2%, 6/1/30 | | | 250,000 | | | | 197,990 | |
| J M Smucker Co., 6.2%, 11/15/33 | | | 300,000 | | | | 291,953 | |
| UnitedHealth Group, Inc., 3.7%, 8/15/49 | | | 250,000 | | | | 170,293 | |
| Zoetis, Inc., 3%, 5/15/50 | | | 250,000 | | | | 149,333 | |
| | | | | | | | 4,142,158 | |
| Industrials - 3.0% | | | | | | | | |
| Ashtead Capital, Inc. (A), 2.45%, 8/12/31 | | | 600,000 | | | | 441,934 | |
| Ball Corp., 4.875%, 3/15/26 | | | 475,000 | | | | 456,149 | |
| Boeing Co., 5.805%, 5/1/50 | | | 350,000 | | | | 303,310 | |
| Carrier Global Corp., 3.577%, 4/5/50 | | | 200,000 | | | | 126,269 | |
| Martin Marietta Materials, Inc., 3.2%, | | | | | | | | |
| 7/15/51 | | | 500,000 | | | | 299,285 | |
| Nordson Corp., 5.8%, 9/15/33 | | | 600,000 | | | | 572,527 | |
| Otis Worldwide Corp., 2.565%, 2/15/30 | | | 350,000 | | | | 285,130 | |
| Quanta Services, Inc., 2.9%, 10/1/30 | | | 500,000 | | | | 394,452 | |
| TD SYNNEX Corp., 1.75%, 8/9/26 | | | 500,000 | | | | 437,712 | |
| TD SYNNEX Corp., 2.65%, 8/9/31 | | | 250,000 | | | | 182,710 | |
| Textron, Inc. (E), 2.45%, 3/15/31 | | | 250,000 | | | | 195,342 | |
| TransDigm, Inc. (A), 6.25%, 3/15/26 | | | 475,000 | | | | 463,723 | |
| United Rentals North America, Inc., | | | | | | | | |
| 5.5%, 5/15/27 | | | 500,000 | | | | 483,093 | |
| Vontier Corp., 1.8%, 4/1/26 | | | 300,000 | | | | 267,285 | |
| WRKCo, Inc., 3.9%, 6/1/28 | | | 350,000 | | | | 318,169 | |
| WRKCo, Inc. (E), 3%, 6/15/33 | | | 300,000 | | | | 229,737 | |
| | | | | | | | 5,456,827 | |
| Information Technology - 1.8% | | | | | | | | |
| Broadcom, Inc. (A), 3.187%, 11/15/36 | | | 12,000 | | | | 8,333 | |
| Dell International LLC/EMC Corp., 8.35%, | | | | | | | | |
| 7/15/46 | | | 87,000 | | | | 97,623 | |
| Dell International LLC/EMC Corp., 3.45%, | | | | | | | | |
| 12/15/51 | | | 625,000 | | | | 374,711 | |
| Fiserv, Inc., 3.5%, 7/1/29 | | | 750,000 | | | | 658,476 | |
| HP, Inc., 2.65%, 6/17/31 | | | 600,000 | | | | 458,738 | |
| Intuit, Inc., 5.2%, 9/15/33 | | | 250,000 | | | | 238,355 | |
| Iron Mountain, Inc. (A), 4.5%, 2/15/31 | | | 275,000 | | | | 224,841 | |
| Oracle Corp., 3.95%, 3/25/51 | | | 750,000 | | | | 490,057 | |
| Salesforce, Inc., 2.9%, 7/15/51 | | | 500,000 | | | | 296,471 | |
| VMware, Inc., 2.2%, 8/15/31 | | | 500,000 | | | | 370,535 | |
| | | | | | | | 3,218,140 | |
| Materials - 0.3% | | | | | | | | |
| Celanese U.S. Holdings LLC, 6.165%, | | | | | | | | |
| 7/15/27 | | | 250,000 | | | | 244,146 | |
| LYB International Finance III LLC, 3.625%, | | | | | | | | |
| 4/1/51 | | | 400,000 | | | | 242,734 | |
| | | | | | | | 486,880 | |
| Utilities - 1.8% | | | | | | | | |
| AES Corp., 1.375%, 1/15/26 | | | 400,000 | | | | 355,510 | |
| Berkshire Hathaway Energy Co., 1.65%, | | | | | | | | |
| 5/15/31 | | | 350,000 | | | | 255,825 | |
| DTE Electric Co., 5.4%, 4/1/53 | | | 250,000 | | | | 220,941 | |
| Duke Energy Corp., 3.75%, 9/1/46 | | | 500,000 | | | | 327,539 | |
| Duke Energy Progress LLC, 3.7%, | | | | | | | | |
| 10/15/46 | | | 1,000,000 | | | | 664,405 | |
| Florida Power & Light Co., 2.875%, | | | | | | | | |
| 12/4/51 | | | 700,000 | | | | 399,874 | |
| Interstate Power & Light Co., 3.5%, | | | | | | | | |
| 9/30/49 | | | 250,000 | | | | 156,437 | |
| NextEra Energy Capital Holdings, Inc., | | | | | | | | |
| 1.9%, 6/15/28 | | | 500,000 | | | | 417,504 | |
| PECO Energy Co., 3.05%, 3/15/51 | | | 750,000 | | | | 438,169 | |
| | | | | | | | 3,236,204 | |
| Total Corporate Notes and Bonds | | | | | | | | |
| (Cost $60,888,431 ) | | | | | | | 50,809,247 | |
| FOREIGN CORPORATE BONDS - 3.2% | | | | | | | | |
| Consumer Discretionary - 0.1% | | | | | | | | |
| Delta Air Lines, Inc./SkyMiles IP Ltd. (A), | | | | | | | | |
| 4.75%, 10/20/28 | | | 250,000 | | | | 234,967 | |
| | | | | | | | | |
| Energy - 0.1% | | | | | | | | |
| Enbridge, Inc., 5.7%, 3/8/33 | | | 250,000 | | | | 234,186 | |
| | | | | | | | | |
| Financials - 2.1% | | | | | | | | |
| AerCap Ireland Capital DAC/AerCap Global | | | | | | | | |
| Aviation Trust, 1.75%, 1/30/26 | | | 500,000 | | | | 449,581 | |
| AerCap Ireland Capital DAC/AerCap Global | | | | | | | | |
| Aviation Trust, 4.625%, 10/15/27 | | | 250,000 | | | | 231,794 | |
| Avolon Holdings Funding Ltd. (A), | | | | | | | | |
| 2.125%, 2/21/26 | | | 500,000 | | | | 445,919 | |
| Banco Santander SA, 6.921%, 8/8/33 | | | 400,000 | | | | 372,351 | |
| Bank of Montreal, 5.203%, 2/1/28 | | | 400,000 | | | | 386,041 | |
| Mitsubishi UFJ Financial Group, Inc., | | | | | | | | |
| (1 year CMT + 1.530%) (D), 5.475%, | | | | | | | | |
| 2/22/31 | | | 500,000 | | | | 476,109 | |
| Royal Bank of Canada, 4.9%, 1/12/28 | | | 400,000 | | | | 384,015 | |
| Toronto-Dominion Bank, 5.156%, | | | | | | | | |
| 1/10/28 | | | 400,000 | | | | 386,011 | |
| Toronto-Dominion Bank, 4.456%, 6/8/32 | | | 300,000 | | | | 262,176 | |
| UBS Group AG, (1 year CMT + 2.050%) | | | | | | | | |
| (A) (D), 4.703%, 8/5/27 | | | 400,000 | | | | 381,036 | |
| | | | | | | | 3,775,033 | |
| Health Care - 0.8% | | | | | | | | |
| Pfizer Investment Enterprises Pte. Ltd., | | | | | | | | |
| 5.3%, 5/19/53 | | | 500,000 | | | | 440,897 | |
| Pfizer Investment Enterprises Pte. Ltd., | | | | | | | | |
| 5.34%, 5/19/63 | | | 250,000 | | | | 215,627 | |
| Royalty Pharma PLC, 2.2%, 9/2/30 | | | 200,000 | | | | 152,939 | |
| Royalty Pharma PLC, 3.55%, 9/2/50 | | | 500,000 | | | | 293,658 | |
| STERIS Irish FinCo UnLtd Co., 3.75%, | | | | | | | | |
| 3/15/51 | | | 500,000 | | | | 332,632 | |
| | | | | | | | 1,435,753 | |
| Materials - 0.1% | | | | | | | | |
| Nutrien Ltd., 5.8%, 3/27/53 | | | 250,000 | | | | 219,798 | |
| Total Foreign Corporate Bonds | | | | | | | | |
| (Cost $6,706,893 ) | | | | | | | 5,899,737 | |
| | | | | | | | | |
| MORTGAGE BACKED SECURITIES - 29.0% | | | | | | | | |
| Fannie Mae - 15.4% | | | | | | | | |
| 3%, 9/1/30 Pool # 890696 | | | 251,023 | | | | 235,594 | |
| 3%, 12/1/30 Pool # AL8924 | | | 124,180 | | | | 116,720 | |
| 7%, 11/1/31 Pool # 607515 | | | 3,443 | | | | 3,482 | |
| 3.5%, 12/1/31 Pool # MA0919 | | | 88,941 | | | | 82,883 | |
| 6.5%, 3/1/32 Pool # 889072 | | | 11,123 | | | | 11,185 | |
| 6.5%, 5/1/32 Pool # 636758 | | | 675 | | | | 678 | |
| 7%, 5/1/32 Pool # 644591 | | | 362 | | | | 367 | |
| 6.5%, 6/1/32 Pool # 545691 | | | 17,979 | | | | 18,116 | |
| 3.5%, 8/1/32 Pool # MA3098 | | | 116,824 | | | | 110,469 | |
| 3.5%, 9/1/32 Pool # MA3126 | | | 82,340 | | | | 77,456 | |
| 5.5%, 11/1/33 Pool # 555880 | | | 24,568 | | | | 24,181 | |
| 4%, 2/1/35 Pool # MA2177 | | | 228,101 | | | | 212,685 | |
| 3.5%, 12/1/35 Pool # MA2473 | | | 226,736 | | | | 207,594 | |
| 4.5%, 12/1/35 Pool # 745147 | | | 3,828 | | | | 3,549 | |
| 2.5%, 9/1/36 Pool # FS4049 | | | 684,738 | | | | 606,962 | |
| 6%, 11/1/36 Pool # 902510 | | | 32,793 | | | | 32,897 | |
| 6%, 10/1/37 Pool # 947563 | | | 31,097 | | | | 31,196 | |
| 6.5%, 12/1/37 Pool # 889072 | | | 22,319 | | | | 22,690 | |
| 4.5%, 5/1/38 Pool # MA5013 | | | 1,138,613 | | | | 1,077,896 | |
| 6.5%, 8/1/38 Pool # 987711 | | | 50,784 | | | | 52,777 | |
| 3%, 11/1/39 Pool # MA3831 | | | 98,267 | | | | 84,640 | |
| 4%, 9/1/40 Pool # AE3039 | | | 242,783 | | | | 217,083 | |
| 4%, 1/1/41 Pool # AB2080 | | | 182,499 | | | | 163,404 | |
| 2.5%, 5/1/41 Pool # MA4334 | | | 1,268,575 | | | | 1,004,095 | |
| 5.5%, 7/1/41 Pool # AL6588 | | | 179,946 | | | | 176,882 | |
| 4%, 9/1/41 Pool # AJ1406 | | | 80,694 | | | | 72,275 | |
| 4%, 10/1/41 Pool # AJ4046 | | | 254,738 | | | | 229,332 | |
| 3.5%, 11/1/41 Pool # AB3867 | | | 95,620 | | | | 84,100 | |
| 2.5%, 3/1/42 Pool # MA4571 | | | 1,751,921 | | | | 1,409,441 | |
| 2.5%, 3/1/42 Pool # CB3076 | | | 674,924 | | | | 538,526 | |
| 4%, 3/1/42 Pool # AL1998 | | | 379,272 | | | | 339,577 | |
| 3.5%, 6/1/42 Pool # AO4134 | | | 411,453 | | | | 361,895 | |
| 3.5%, 8/1/42 Pool # AP2133 | | | 197,371 | | | | 172,957 | |
| 3%, 9/1/42 Pool # AP6568 | | | 51,667 | | | | 43,624 | |
| 3.5%, 9/1/42 Pool # AB6228 | | | 117,043 | | | | 102,945 | |
| 4%, 10/1/42 Pool # AP7363 | | | 259,471 | | | | 230,899 | |
| 3.5%, 1/1/43 Pool # AQ9326 | | | 242,762 | | | | 213,503 | |
| 3%, 2/1/43 Pool # AL3072 | | | 393,983 | | | | 332,730 | |
| 3.5%, 3/1/43 Pool # AT0310 | | | 193,436 | | | | 170,121 | |
| 3.5%, 4/1/43 Pool # AT2887 | | | 200,955 | | | | 175,488 | |
| 4%, 1/1/45 Pool # AS4257 | | | 63,272 | | | | 56,141 | |
| 4.5%, 10/1/46 Pool # MA2783 | | | 32,690 | | | | 29,990 | |
| 3%, 1/1/47 Pool # BE0108 | | | 328,097 | | | | 271,914 | |
| 2.5%, 12/1/47 Pool # FM3165 | | | 1,011,938 | | | | 792,468 | |
| 3%, 1/1/48 Pool # FM1303 | | | 1,131,864 | | | | 939,220 | |
| 3%, 8/1/48 Pool # FS0517 | | | 786,462 | | | | 651,337 | |
| 3%, 1/1/49 Pool # FS4296 | | | 753,485 | | | | 634,331 | |
| 4%, 11/1/50 Pool # FM5530 | | | 580,662 | | | | 509,543 | |
| 2%, 1/1/52 Pool # FS0173 | | | 737,656 | | | | 552,659 | |
| 2%, 1/1/52 Pool # CB2601 | | | 355,973 | | | | 266,703 | |
| 2%, 3/1/52 Pool # CB3105 | | | 460,296 | | | | 343,706 | |
| 2.5%, 3/1/52 Pool # BV4133 | | | 567,156 | | | | 435,891 | |
| 3%, 3/1/52 Pool # CB3115 | | | 907,526 | | | | 735,557 | |
| 2.5%, 4/1/52 Pool # FS4138 | | | 713,766 | | | | 551,841 | |
| 3.5%, 5/1/52 Pool # FS1866 | | | 940,393 | | | | 787,180 | |
| 4%, 5/1/52 Pool # CB3627 | | | 1,194,593 | | | | 1,034,257 | |
| 4%, 5/1/52 Pool # CB3678 | | | 936,256 | | | | 810,206 | |
| 4%, 5/1/52 Pool # FS1704 | | | 442,630 | | | | 386,437 | |
| 4%, 5/1/52 Pool # FS1818 | | | 720,190 | | | | 623,674 | |
| 3.5%, 6/1/52 Pool # CB3845 | | | 923,954 | | | | 774,221 | |
| 3.5%, 7/1/52 Pool # FS2812 | | | 585,801 | | | | 496,280 | |
| 3.5%, 8/1/52 Pool # CB4361 | | | 945,436 | | | | 792,260 | |
| 4.5%, 8/1/52 Pool # CB4383 | | | 936,675 | | | | 841,392 | |
| 4.5%, 8/1/52 Pool # FS2605 | | | 490,549 | | | | 439,121 | |
| 4.5%, 9/1/52 Pool # FS2821 | | | 723,127 | | | | 649,500 | |
| 5%, 10/1/52 Pool # MA4785 | | | 921,207 | | | | 850,395 | |
| 5.5%, 10/1/52 Pool # MA4786 | | | 886,124 | | | | 841,599 | |
| 5%, 11/1/52 Pool # MA4806 | | | 937,739 | | | | 865,587 | |
| 5%, 12/1/52 Pool # MA4841 | | | 1,412,444 | | | | 1,303,800 | |
| 5.5%, 9/1/53 Pool # FS5575 | | | 698,117 | | | | 664,811 | |
| | | | | | | | 27,984,915 | |
| Freddie Mac - 13.6% | | | | | | | | |
| 4.5%, 2/1/25 Pool # J11722 | | | 8,376 | | | | 8,355 | |
| 4.5%, 5/1/25 Pool # J12247 | | | 18,873 | | | | 18,736 | |
| 8%, 6/1/30 Pool # C01005 | | | 252 | | | | 261 | |
| 6.5%, 1/1/32 Pool # C62333 | | | 8,127 | | | | 8,173 | |
| 2.5%, 2/1/32 Pool # ZS8641 | | | 194,768 | | | | 178,916 | |
| 3.5%, 8/1/32 Pool # C91485 | | | 104,683 | | | | 97,627 | |
| 4%, 5/1/33 Pool # G18693 | | | 174,580 | | | | 166,463 | |
| 4.5%, 6/1/34 Pool # C01856 | | | 136,375 | | | | 126,787 | |
| 2.5%, 6/1/35 Pool # RC1421 | | | 302,916 | | | | 267,810 | |
| 2%, 1/1/36 Pool # SB0546 | | | 843,766 | | | | 721,149 | |
| 6.5%, 11/1/36 Pool # C02660 | | | 2,721 | | | | 2,790 | |
| 5.5%, 1/1/37 Pool # G04593 | | | 92,710 | | | | 91,268 | |
| 5.5%, 11/1/37 Pool # A68787 | | | 62,555 | | | | 61,581 | |
| 5.5%, 12/1/38 Pool # G05267 | | | 147,922 | | | | 145,467 | |
See accompanying Notes to Financial Statements.
Madison Funds | October 31, 2023
Madison Core Bond Fund Portfolio of Investments - continued
| | | Par Value | | | Value (Note 2,3) | |
| 4.5%, 8/1/39 Pool # G08361 | | $ | 150,089 | | | $ | 138,922 | |
| 3.5%, 11/1/40 Pool # G06168 | | | 137,858 | | | | 121,437 | |
| 2%, 3/1/41 Pool # RB5105 | | | 952,048 | | | | 755,256 | |
| 2.5%, 6/1/41 Pool # SC0151 | | | 772,056 | | | | 626,721 | |
| 4%, 10/1/41 Pool # Q04092 | | | 272,866 | | | | 244,678 | |
| 4.5%, 3/1/42 Pool # G07491 | | | 168,804 | | | | 156,278 | |
| 3%, 9/1/42 Pool # C04233 | | | 238,791 | | | | 201,977 | |
| 3%, 2/1/43 Pool # Q15767 | | | 171,429 | | | | 145,695 | |
| 3%, 4/1/43 Pool # V80025 | | | 303,164 | | | | 255,821 | |
| 3%, 4/1/43 Pool # V80026 | | | 298,104 | | | | 251,427 | |
| 3.5%, 8/1/44 Pool # Q27927 | | | 198,464 | | | | 171,847 | |
| 3%, 7/1/45 Pool # G08653 | | | 282,836 | | | | 235,946 | |
| 3.5%, 8/1/45 Pool # Q35614 | | | 211,681 | | | | 183,287 | |
| 3%, 11/1/45 Pool # G08675 | | | 233,281 | | | | 194,507 | |
| 3%, 1/1/46 Pool # G08686 | | | 294,705 | | | | 245,497 | |
| 3%, 10/1/46 Pool # G60722 | | | 309,019 | | | | 256,267 | |
| 3.5%, 11/1/47 Pool # Q52079 | | | 249,673 | | | | 213,708 | |
| 2.5%, 4/1/48 Pool # QA2240 | | | 976,997 | | | | 765,322 | |
| 3%, 7/1/49 Pool # QA1033 | | | 347,848 | | | | 281,520 | |
| 2.5%, 6/1/51 Pool # QC2842 | | | 919,536 | | | | 709,010 | |
| 2.5%, 1/1/52 Pool # SD7552 | | | 3,735,395 | | | | 2,890,789 | |
| 3.5%, 4/1/52 Pool # SD0960 | | | 1,300,780 | | | | 1,101,893 | |
| 3.5%, 5/1/52 Pool # RA7380 | | | 700,279 | | | | 586,773 | |
| 3.5%, 5/1/52 Pool # QE2363 | | | 686,989 | | | | 573,366 | |
| 3%, 8/1/52 Pool # SD7556 | | | 1,559,940 | | | | 1,263,274 | |
| 5%, 11/1/52 Pool # SD8267 | | | 935,958 | | | | 863,943 | |
| 5.5%, 11/1/52 Pool # SD8268 | | | 1,612,616 | | | | 1,532,213 | |
| 5.5%, 11/1/52 Pool # SD1859 | | | 926,868 | | | | 882,436 | |
| 4.5%, 12/1/52 Pool # SD1921 | | | 1,196,642 | | | | 1,075,098 | |
| 5%, 12/1/52 Pool # RA8278 | | | 1,418,805 | | | | 1,310,036 | |
| 5%, 2/1/53 Pool # SD2334 | | | 339,119 | | | | 313,087 | |
| 5.5%, 2/1/53 Pool # SD2172 | | | 573,186 | | | | 545,589 | |
| 5%, 5/1/53 Pool # SD2875 | | | 1,509,030 | | | | 1,397,385 | |
| 5.5%, 6/1/53 Pool # SD3174 | | | 979,337 | | | | 930,615 | |
| 6%, 9/1/53 Pool # SD8363 | | | 588,831 | | | | 573,672 | |
| 6%, 9/1/53 Pool # SD3739 | | | 744,685 | | | | 727,970 | |
| | | | | | | | 24,618,645 | |
| Ginnie Mae - 0.0% | | | | | | | | |
| 6.5%, 2/20/29 Pool # 2714 | | | 2,624 | | | | 2,624 | |
| 6.5%, 4/20/31 Pool # 3068 | | | 1,478 | | | | 1,504 | |
| 4%, 4/15/39 Pool # 698089 | | | 10,648 | | | | 9,730 | |
| | | | | | | | 13,858 | |
| Total Mortgage Backed Securities | | | | | | | | |
| (Cost $59,005,897 ) | | | | | | | 52,617,418 | |
| U.S. GOVERNMENT AND AGENCY OBLIGATIONS - 24.0% | | | | | | | | |
| U.S. Treasury Bonds - 8.3% | | | | | | | | |
| 6.625%, 2/15/27 | | | 2,000,000 | | | | 2,103,594 | |
| 5.375%, 2/15/31 | | | 1,250,000 | | | | 1,289,014 | |
| 4.500%, 5/15/38 | | | 1,250,000 | | | | 1,180,078 | |
| 2.250%, 5/15/41 | | | 4,000,000 | | | | 2,637,031 | |
| 3.750%, 8/15/41 | | | 4,250,000 | | | | 3,534,805 | |
| 3.000%, 5/15/45 | | | 1,000,000 | | | | 711,172 | |
| 3.000%, 5/15/47 | | | 750,000 | | | | 524,062 | |
| 3.375%, 11/15/48 | | | 500,000 | | | | 372,832 | |
| 1.250%, 5/15/50 | | | 2,000,000 | | | | 888,359 | |
| 1.875%, 2/15/51 | | | 2,000,000 | | | | 1,058,984 | |
| 4.125%, 8/15/53 | | | 790,000 | | | | 681,005 | |
| | | | | | | | 14,980,936 | |
| U.S. Treasury Notes - 15.7% | | | | | | | | |
| 2.250%, 11/15/25 | | | 5,250,000 | | | | 4,965,146 | |
| 2.375%, 5/15/27 | | | 5,000,000 | | | | 4,595,703 | |
| 4.000%, 2/29/28 | | | 4,500,000 | | | | 4,353,047 | |
| 2.875%, 5/15/28 | | | 6,000,000 | | | | 5,521,172 | |
| 2.625%, 2/15/29 | | | 5,500,000 | | | | 4,928,516 | |
| 3.875%, 11/30/29 | | | 2,250,000 | | | | 2,128,623 | |
| 1.375%, 11/15/31 | | | 1,500,000 | | | | 1,153,828 | |
| 4.125%, 11/15/32 | | | 350,000 | | | | 330,463 | |
| 3.375%, 5/15/33 | | | 600,000 | | | | 531,844 | |
| | | | | | | | 28,508,342 | |
| Total U.S. Government and | | | | | | | | |
| Agency Obligations | | | | | | | | |
| (Cost $50,222,427 ) | | | | | | | 43,489,278 | |
| | | Shares | | | | |
| SHORT-TERM INVESTMENTS - 1.6% | | | | | | | | |
| State Street Institutional U.S. | | | | | | | | |
| Government Money Market Fund, | | | | | | | | |
| Premier Class (F), 5.30% | | | 1,811,989 | | | | 1,811,989 | |
| State Street Navigator Securities Lending | | | | | | | | |
| Government Money Market Portfolio (F) (G), 5.36% | | | 1,103,783 | | | | 1,103,783 | |
| Total Short-Term Investments | | | | | | | | |
| (Cost $2,915,772 ) | | | | | | | 2,915,772 | |
| TOTAL INVESTMENTS - 100.2% | | | | | | | | |
| (Cost $208,803,606** ) | | | | | | | 181,964,703 | |
| NET OTHER ASSETS AND LIABILITIES - (0.2%) | | | | | | | (379,166 | ) |
| TOTAL NET ASSETS - 100.0% | | | | | | $ | 181,585,537 | |
| ** | | Aggregate cost for Federal tax purposes was $208,872,687. |
| (A) | | Security sold within terms of a private placement memorandum exempt from registration under section 144A of the Securities Act of 1933, as amended, and may be sold only to dealers in that program or other "qualified institutional buyers." |
| (B) | | Stepped rate security. Rate shown is as of October 31, 2023. |
| (C) | | Coupon rate may change based on changes of the underlying collateral or prepayments of principal. The coupon rate shown represents the rate at October 31,2023. |
| (D) | | Floating rate or variable rate note. Rate shown is as of October 31, 2023. |
| (E) | | All or a portion of these securities, with an aggregate fair value of $1,081,353, are on loan as part of a securities lending program. See footnote (G) and Note 11 for details on the securities lending program. |
| (F) | | 7-day yield. |
| (G) | | Represents investments of cash collateral received in connection with securities lending. |
| | | |
| BDC | | Business Development Company |
| CMT | | Constant Maturity Treasury. |
| DAC | | Designated Activity Company. |
| FREMF | | Freddie Mac Multifamily Securities |
| IO | | Interest Only. |
| LLC | | Limited Liability Company. |
| LP | | Limited Partnership. |
| PLC | | Public Limited Company. |
| REMIC | | Real Estate Mortgage Investment Conduit. |
| SOFR | | Secured Overnight Financing Rate. |
| STACR | | Structured Agency Credit Risk. |
| USD | | United States Dollar. |
See accompanying Notes to Financial Statements.
Madison Funds | October 31, 2023
Madison Covered Call & Equity Income Fund Portfolio of Investments
| | | Shares | | | Value (Note 2,3) | |
| COMMON STOCKS - 75.0% | | | | | | | | |
| Communication Services - 6.3% | | | | | | | | |
| Alphabet, Inc., Class C * (A) | | | 30,000 | | | $ | 3,759,000 | |
| Comcast Corp., Class A | | | 60,000 | | | | 2,477,400 | |
| Meta Platforms, Inc., Class A * (A) | | | 13,000 | | | | 3,916,510 | |
| T-Mobile U.S., Inc. * (A) | | | 36,300 | | | | 5,222,118 | |
| | | | | | | | 15,375,028 | |
| Consumer Discretionary - 6.4% | | | | | | | | |
| Las Vegas Sands Corp. (A) | | | 216,000 | | | | 10,251,360 | |
| Lowe's Cos., Inc. (A) | | | 15,000 | | | | 2,858,550 | |
| Nordstrom, Inc. | | | 168,000 | | | | 2,348,640 | |
| | | | | | | | 15,458,550 | |
| Consumer Staples - 10.0% | | | | | | | | |
| Archer-Daniels-Midland Co. (A) | | | 45,000 | | | | 3,220,650 | |
| Colgate-Palmolive Co. (A) | | | 64,000 | | | | 4,807,680 | |
| Constellation Brands, Inc., Class A (A) | | | 14,500 | | | | 3,395,175 | |
| Keurig Dr Pepper, Inc. (A) | | | 175,000 | | | | 5,307,750 | |
| PepsiCo, Inc. (A) | | | 22,000 | | | | 3,592,160 | |
| Target Corp. (A) | | | 37,000 | | | | 4,099,230 | |
| | | | | | | | 24,422,645 | |
| Energy - 8.2% | | | | | | | | |
| APA Corp. (A) | | | 167,200 | | | | 6,641,184 | |
| EOG Resources, Inc. | | | 43,000 | | | | 5,428,750 | |
| Transocean Ltd. * | | | 1,200,000 | | | | 7,944,000 | |
| | | | | | | | 20,013,934 | |
| Equity Real Estate Investment | | | | | | | | |
| Trusts (REITs) - 2.9% | | | | | | | | |
| American Tower Corp., REIT (A) | | | 39,700 | | | | 7,074,143 | |
| | | | | | | | | |
| Financials - 8.0% | | | | | | | | |
| BlackRock, Inc. (A) | | | 9,200 | | | | 5,632,976 | |
| CME Group, Inc. (A) | | | 19,000 | | | | 4,055,740 | |
| JPMorgan Chase & Co. (A) | | | 25,000 | | | | 3,476,500 | |
| Morgan Stanley (A) | | | 45,500 | | | | 3,222,310 | |
| PayPal Holdings, Inc. * (A) | | | 62,000 | | | | 3,211,600 | |
| | | | | | | | 19,599,126 | |
| Health Care - 14.2% | | | | | | | | |
| Abbott Laboratories | | | 58,000 | | | | 5,483,900 | |
| Agilent Technologies, Inc. (A) | | | 36,000 | | | | 3,721,320 | |
| CVS Health Corp. (A) | | | 69,300 | | | | 4,782,393 | |
| Danaher Corp. (A) | | | 26,200 | | | | 5,030,924 | |
| Elevance Health, Inc. (A) | | | 13,100 | | | | 5,896,179 | |
| Medtronic PLC | | | 86,100 | | | | 6,075,216 | |
| Pfizer, Inc. (A) | | | 123,000 | | | | 3,758,880 | |
| | | | | | | | 34,748,812 | |
| Industrials - 3.2% | | | | | | | | |
| 3M Co. | | | 7,000 | | | | 636,650 | |
| Fastenal Co. (A) | | | 66,000 | | | | 3,850,440 | |
| United Parcel Service, Inc., Class B (A) | | | 19,000 | | | | 2,683,750 | |
| Veralto Corp. * | | | 8,733 | | | | 602,577 | |
| | | | | | | | 7,773,417 | |
| Information Technology - 4.8% | | | | | | | | |
| Ciena Corp. * (A) | | | 55,000 | | | | 2,321,000 | |
| Microsoft Corp. (A) | | | 12,000 | | | | 4,057,320 | |
| Texas Instruments, Inc. (A) | | | 38,000 | | | | 5,396,380 | |
| | | | | | | | 11,774,700 | |
| Materials - 6.5% | | | | | | | | |
| Air Products & Chemicals, Inc. (A) | | | 16,800 | | | | 4,744,992 | |
| Barrick Gold Corp. (A) | | | 385,000 | | | | 6,152,300 | |
| Newmont Corp. (A) | | | 131,000 | | | | 4,908,570 | |
| | | | | | | | 15,805,862 | |
| Utilities - 4.5% | | | | | | | | |
| AES Corp. (A) | | | 387,000 | | | | 5,766,300 | |
| NextEra Energy, Inc. (A) | | | 90,000 | | | | 5,247,000 | |
| | | | | | | | 11,013,300 | |
| Total Common Stocks | | | | | | | | |
| (Cost $210,595,033 ) | | | | | | | 183,059,517 | |
| EXCHANGE TRADED FUNDS - 1.7% | | | | | | | | |
| Stock Funds - 1.7% | | | | | | | | |
| VanEck Gold Miners ETF (A) | | | 148,000 | | | | 4,145,480 | |
| Total Exchange Traded Funds | | | | | | | | |
| (Cost $4,575,493 ) | | | | | | | 4,145,480 | |
| SHORT-TERM INVESTMENTS - 23.9% | | | | | | | | |
| State Street Institutional U.S. | | | | | | | | |
| Government Money Market Fund, | | | | | | | | |
| Premier Class (B), 5.30% | | | 58,470,447 | | | | 58,470,447 | |
| Total Short-Term Investments | | | | | | | | |
| (Cost $58,470,447 ) | | | | | | | 58,470,447 | |
| TOTAL INVESTMENTS - 100.6% | | | | | | | | |
| (Cost $273,640,973** ) | | | | | | | 245,675,444 | |
| TOTAL CALL & PUT OPTIONS | | | | | | | | |
| WRITTEN - (0.9%) | | | | | | | (2,312,793 | ) |
| NET OTHER ASSETS AND LIABILITIES - 0.3% | | | | | | | 925,779 | |
| | | | | | | | | |
| TOTAL NET ASSETS - 100.0% | | | | | | $ | 244,288,430 | |
| * | | Non-income producing. |
| ** | | Aggregate cost for Federal tax purposes was $270,609,104. |
| (A) | | All or a portion of these securities' positions, with a value of $156,207,864, represent covers (directly or through conversion rights) for outstanding options written. |
| (B) | | 7-day yield. |
| ETF | | Exchange Traded Fund. |
| PLC | | Public Limited Company. |
| REIT | | Real Estate Investment Trust. |
Written Option Contracts Outstanding at October 31, 2023
| Description | | Exercise Price | | | Expiration Date | | Number of Contracts | | | Notional Amount | | | Market Value | | | Premiums Paid (Received) | | | Unrealized Appreciation (Depreciation) | |
| Call Options Written | | | | | | | | | | | | | | | | | | | | | | | | | | |
| AES Corp. | | $ | 20.00 | | | 1/19/24 | | | (819 | ) | | $ | (1,638,000 | ) | | $ | (6,142 | ) | | $ | (27,821 | ) | | $ | 21,679 | |
| Agilent Technologies, Inc. | | | 110.00 | | | 12/15/23 | | | (130 | ) | | | (1,430,000 | ) | | | (30,550 | ) | | | (31,067 | ) | | | 517 | |
| Agilent Technologies, Inc. | | | 120.00 | | | 1/19/24 | | | (230 | ) | | | (2,760,000 | ) | | | (28,175 | ) | | | (87,769 | ) | | | 59,594 | |
| Air Products & Chemicals, Inc. | | | 290.00 | | | 12/15/23 | | | (168 | ) | | | (4,872,000 | ) | | | (124,320 | ) | | | (103,988 | ) | | | (20,332 | ) |
| Alphabet, Inc., Class C | | | 135.00 | | | 12/15/23 | | | (300 | ) | | | (4,050,000 | ) | | | (42,600 | ) | | | (53,694 | ) | | | 11,094 | |
| American Tower Corp., REIT | | | 190.00 | | | 1/19/24 | | | (280 | ) | | | (5,320,000 | ) | | | (119,000 | ) | | | (106,114 | ) | | | (12,886 | ) |
| American Tower Corp., REIT | | | 195.00 | | | 1/19/24 | | | (117 | ) | | | (2,281,500 | ) | | | (33,345 | ) | | | (50,189 | ) | | | 16,844 | |
| APA Corp. | | | 47.50 | | | 11/17/23 | | | (550 | ) | | | (2,612,500 | ) | | | (3,850 | ) | | | (48,932 | ) | | | 45,082 | |
| Archer-Daniels-Midland Co. | | | 82.50 | | | 11/17/23 | | | (150 | ) | | | (1,237,500 | ) | | | — | | | | (23,863 | ) | | | 23,863 | |
| Archer-Daniels-Midland Co. | | | 75.00 | | | 12/15/23 | | | (300 | ) | | | (2,250,000 | ) | | | (25,500 | ) | | | (62,694 | ) | | | 37,194 | |
| Barrick Gold Corp. | | | 19.00 | | | 1/19/24 | | | (1,925 | ) | | | (3,657,500 | ) | | | (45,238 | ) | | | (63,466 | ) | | | 18,228 | |
| BlackRock, Inc. | | | 630.00 | | | 12/15/23 | | | (80 | ) | | | (5,040,000 | ) | | | (89,200 | ) | | | (83,918 | ) | | | (5,282 | ) |
| BlackRock, Inc. | | | 700.00 | | | 1/19/24 | | | (12 | ) | | | (840,000 | ) | | | (4,140 | ) | | | (26,387 | ) | | | 22,247 | |
| Ciena Corp. | | | 45.00 | | | 12/15/23 | | | (550 | ) | | | (2,475,000 | ) | | | (79,750 | ) | | | (79,189 | ) | | | (561 | ) |
| CME Group, Inc. | | | 210.00 | | | 12/15/23 | | | (190 | ) | | | (3,990,000 | ) | | | (158,650 | ) | | | (61,447 | ) | | | (97,203 | ) |
| Colgate-Palmolive Co. | | | 75.00 | | | 12/15/23 | | | (640 | ) | | | (4,800,000 | ) | | | (139,200 | ) | | | (95,347 | ) | | | (43,853 | ) |
| Constellation Brands, Inc., Class A | | | 270.00 | | | 1/19/24 | | | (145 | ) | | | (3,915,000 | ) | | | (14,500 | ) | | | (126,004 | ) | | | 111,504 | |
| CVS Health Corp. | | | 72.50 | | | 11/17/23 | | | (693 | ) | | | (5,024,250 | ) | | | (55,440 | ) | | | (93,727 | ) | | | 38,287 | |
| Danaher Corp. | | | 195.00 | | | 12/15/23 | | | (262 | ) | | | (5,109,000 | ) | | | (174,230 | ) | | | (85,404 | ) | | | (88,826 | ) |
| Elevance Health, Inc. | | | 470.00 | | | 12/15/23 | | | (53 | ) | | | (2,491,000 | ) | | | (35,775 | ) | | | (49,316 | ) | | | 13,541 | |
| Elevance Health, Inc. | | | 470.00 | | | 1/19/24 | | | (78 | ) | | | (3,666,000 | ) | | | (95,550 | ) | | | (108,208 | ) | | | 12,658 | |
| Fastenal Co. | | | 60.00 | | | 11/17/23 | | | (660 | ) | | | (3,960,000 | ) | | | (26,400 | ) | | | (104,919 | ) | | | 78,519 | |
See accompanying Notes to Financial Statements.
Madison Funds | October 31, 2023
Madison Covered Call & Equity Income Fund Portfolio of Investments – continued
Written Option Contracts Outstanding at October 31, 2023 (continued)
| Description | | Exercise Price | | | Expiration Date | | Number of Contracts | | | Notional Amount | | | Market Value | | | Premiums Paid (Received) | | | Unrealized Appreciation (Depreciation) | |
| Call Options Written (continued) | | | | | | | | | | |
| JPMorgan Chase & Co. | | $ | 150.00 | | | 12/15/23 | | | (250 | ) | | $ | (3,750,000 | ) | | $ | (19,625 | ) | | $ | (97,242 | ) | | $ | 77,617 | |
| Keurig Dr Pepper, Inc. | | | 35.00 | | | 11/17/23 | | | (191 | ) | | | (668,500 | ) | | | — | | | | (13,173 | ) | | | 13,173 | |
| Keurig Dr Pepper, Inc. | | | 32.00 | | | 1/19/24 | | | (256 | ) | | | (819,200 | ) | | | (14,080 | ) | | | (15,099 | ) | | | 1,019 | |
| Keurig Dr Pepper, Inc. | | | 35.00 | | | 1/19/24 | | | (162 | ) | | | (567,000 | ) | | | (1,620 | ) | | | (9,553 | ) | | | 7,933 | |
| Las Vegas Sands Corp. | | | 50.00 | | | 11/17/23 | | | (2,092 | ) | | | (10,460,000 | ) | | | (83,680 | ) | | | (209,132 | ) | | | 125,452 | |
| Lowe's Cos., Inc. | | | 200.00 | | | 12/15/23 | | | (150 | ) | | | (3,000,000 | ) | | | (65,625 | ) | | | (65,847 | ) | | | 222 | |
| Meta Platforms, Inc., Cass A | | | 320.00 | | | 1/19/24 | | | (130 | ) | | | (4,160,000 | ) | | | (169,000 | ) | | | (149,563 | ) | | | (19,437 | ) |
| Microsoft Corp. | | | 325.00 | | | 11/17/23 | | | (120 | ) | | | (3,900,000 | ) | | | (198,900 | ) | | | (97,076 | ) | | | (101,824 | ) |
| Morgan Stanley | | | 92.50 | | | 1/19/24 | | | (300 | ) | | | (2,775,000 | ) | | | (2,400 | ) | | | (61,079 | ) | | | 58,679 | |
| Newmont Corp. | | | 42.50 | | | 11/17/23 | | | (655 | ) | | | (2,783,750 | ) | | | (5,240 | ) | | | (60,646 | ) | | | 55,406 | |
| Newmont Corp. | | | 45.00 | | | 1/19/24 | | | (655 | ) | | | (2,947,500 | ) | | | (23,907 | ) | | | (65,028 | ) | | | 41,121 | |
| NextEra Energy, Inc. | | | 72.50 | | | 12/15/23 | | | (900 | ) | | | (6,525,000 | ) | | | — | | | | (120,605 | ) | | | 120,605 | |
| PayPal Holdings, Inc. | | | 60.00 | | | 12/15/23 | | | (620 | ) | | | (3,720,000 | ) | | | (57,350 | ) | | | (103,261 | ) | | | 45,911 | |
| PepsiCo, Inc. | | | 180.00 | | | 1/19/24 | | | (220 | ) | | | (3,960,000 | ) | | | (13,420 | ) | | | (107,231 | ) | | | 93,811 | |
| Pfizer, Inc. | | | 37.50 | | | 11/17/23 | | | (312 | ) | | | (1,170,000 | ) | | | — | | | | (23,390 | ) | | | 23,390 | |
| Pfizer, Inc. | | | 38.00 | | | 1/19/24 | | | (918 | ) | | | (3,488,400 | ) | | | (7,803 | ) | | | (58,724 | ) | | | 50,921 | |
| T-Mobile U.S., Inc. | | | 145.00 | | | 11/17/23 | | | (180 | ) | | | (2,610,000 | ) | | | (37,080 | ) | | | (53,814 | ) | | | 16,734 | |
| T-Mobile U.S., Inc. | | | 145.00 | | | 12/15/23 | | | (183 | ) | | | (2,653,500 | ) | | | (67,253 | ) | | | (52,224 | ) | | | (15,029 | ) |
| Target Corp. | | | 120.00 | | | 1/19/24 | | | (370 | ) | | | (4,440,000 | ) | | | (142,450 | ) | | | (106,955 | ) | | | (35,495 | ) |
| Texas Instruments, Inc. | | | 170.00 | | | 12/15/23 | | | (310 | ) | | | (5,270,000 | ) | | | (2,170 | ) | | | (122,898 | ) | | | 120,728 | |
| United Parcel Service, Inc., Class B | | | 160.00 | | | 1/19/24 | | | (190 | ) | | | (3,040,000 | ) | | | (13,395 | ) | | | (63,456 | ) | | | 50,061 | |
| VanEck Gold Miners ETF | | | 33.00 | | | 1/19/24 | | | (1,480 | ) | | | (4,884,000 | ) | | | (56,240 | ) | | | (109,474 | ) | | | 53,234 | |
| Total Call Options Written | | | | | | | | | | | | | | | | $ | (2,312,793 | ) | | $ | (3,338,933 | ) | | $ | 1,026,140 | |
| | | | | | | | | | | | | | | | | | | | | | | | | | | |
| Total Options Written, at Value | | | | | | | | | | | | | | | | $ | (2,312,793 | ) | | $ | (3,338,933 | ) | | $ | 1,026,140 | |
See accompanying Notes to Financial Statements.
Madison Funds | October 31, 2023
Madison Dividend Income Fund Portfolio of Investments
| | | Shares | | | Value (Note 2,3) | |
| COMMON STOCKS - 97.4% | | | | | | | | |
| Communication Service - 3.6% | | | | | | | | |
| Comcast Corp., Class A | | | 170,000 | | | $ | 7,019,300 | |
| | | | | | | | | |
| Consumer Discretionary - 8.8% | | | | | | | | |
| Home Depot, Inc. | | | 23,550 | | | | 6,704,449 | |
| Lowe's Cos., Inc. | | | 23,600 | | | | 4,497,452 | |
| McDonald's Corp. | | | 11,600 | | | | 3,041,172 | |
| Starbucks Corp. | | | 34,800 | | | | 3,209,952 | |
| | | | | | | | 17,453,025 | |
| Consumer Staples - 9.5% | | | | | | | | |
| Archer-Daniels-Midland Co. | | | 68,000 | | | | 4,866,760 | |
| Coca-Cola Co. | | | 58,500 | | | | 3,304,665 | |
| Colgate-Palmolive Co. | | | 49,000 | | | | 3,680,880 | |
| PepsiCo, Inc. | | | 20,300 | | | | 3,314,584 | |
| Procter & Gamble Co. | | | 24,000 | | | | 3,600,720 | |
| | | | | | | | 18,767,609 | |
| Energy - 14.5% | | | | | | | | |
| Baker Hughes Co. | | | 204,000 | | | | 7,021,680 | |
| Chevron Corp. | | | 44,100 | | | | 6,426,693 | |
| ConocoPhillips | | | 18,000 | | | | 2,138,400 | |
| EOG Resources, Inc. | | | 63,500 | | | | 8,016,875 | |
| Kinder Morgan, Inc. | | | 307,000 | | | | 4,973,400 | |
| | | | | | | | 28,577,048 | |
| Equity Real Estate Investment | | | | | | | | |
| Trusts (REITs) - 1.3% | | | | | | | | |
| American Tower Corp., REIT | | | 14,500 | | | | 2,583,755 | |
| | | | | | | | | |
| Financials - 17.8% | | | | | | | | |
| Aflac, Inc. | | | 58,700 | | | | 4,585,057 | |
| BlackRock, Inc. | | | 9,175 | | | | 5,617,669 | |
| CME Group, Inc. | | | 38,000 | | | | 8,111,480 | |
| JPMorgan Chase & Co. | | | 32,700 | | | | 4,547,262 | |
| Morgan Stanley | | | 91,000 | | | | 6,444,620 | |
| Northern Trust Corp. | | | 38,500 | | | | 2,537,535 | |
| U.S. Bancorp | | | 106,200 | | | | 3,385,656 | |
| | | | | | | | 35,229,279 | |
| Health Care - 12.8% | | | | | | | | |
| Abbott Laboratories | | | 36,700 | | | | 3,469,985 | |
| Bristol-Myers Squibb Co. | | | 83,500 | | | | 4,302,755 | |
| Johnson & Johnson | | | 45,500 | | | | 6,749,470 | |
| Medtronic PLC | | | 93,000 | | | | 6,562,080 | |
| Pfizer, Inc. | | | 138,000 | | | | 4,217,280 | |
| | | | | | | | 25,301,570 | |
| Industrials - 15.1% | | | | | | | | |
| Automatic Data Processing, Inc. | | | 13,000 | | | | 2,836,860 | |
| Caterpillar, Inc. | | | 16,800 | | | | 3,797,640 | |
| Fastenal Co. | | | 129,500 | | | | 7,555,030 | |
| Honeywell International, Inc. | | | 29,000 | | | | 5,314,540 | |
| Paychex, Inc. | | | 32,000 | | | | 3,553,600 | |
| Union Pacific Corp. | | | 22,500 | | | | 4,671,225 | |
| United Parcel Service, Inc., Class B | | | 14,500 | | | | 2,048,125 | |
| | | | | | | | 29,777,020 | |
| Information Technology - 7.5% | | | | | | | | |
| Analog Devices, Inc. | | | 15,500 | | | | 2,438,615 | |
| Cisco Systems, Inc. | | | 143,500 | | | | 7,480,655 | |
| Texas Instruments, Inc. | | | 34,000 | | | | 4,828,340 | |
| | | | | | | | 14,747,610 | |
| Materials - 3.2% | | | | | | | | |
| Air Products & Chemicals, Inc. | | | 22,500 | | | | 6,354,900 | |
| Utilities - 3.3% | | | | | | |
| NextEra Energy, Inc. | | | 112,500 | | | | 6,558,750 | |
| Total Common Stocks | | | | | | | | |
| (Cost $169,399,158 ) | | | | | | | 192,369,866 | |
| SHORT-TERM INVESTMENTS - 2.4% | | | | | | | | |
| State Street Institutional U.S. | | | | | | | | |
| Government Money Market Fund, | | | | | | | | |
| Premier Class (A), 5.30% | | | 4,834,761 | | | | 4,834,761 | |
| Total Short-Term Investments | | | | | | | | |
| (Cost $4,834,761 ) | | | | | | | 4,834,761 | |
| TOTAL INVESTMENTS - 99.8% | | | | | | | | |
| (Cost $174,233,919** ) | | | | | | | 197,204,627 | |
| NET OTHER ASSETS AND LIABILITIES - 0.2% | | | | | | | 315,874 | |
| TOTAL NET ASSETS - 100.0% | | | | | | $ | 197,520,501 | |
| ** | | Aggregate cost for Federal tax purposes was $175,527,612. |
| (A) | | 7-day yield. |
| PLC | | Public Limited Company. |
| REIT | | Real Estate Investment Trust. |
See accompanying Notes to Financial Statements.
Madison Funds | October 31, 2023
Madison Investors Fund Portfolio of Investments
| | | Shares | | | Value (Note 2,3) | |
| COMMON STOCKS - 95.8% | | | | | | | | |
| Communication Services - 10.5% | | | | | | | | |
| Alphabet, Inc., Class C * | | | 221,619 | | | $ | 27,768,861 | |
| Liberty Broadband Corp., Class C * | | | 88,869 | | | | 7,403,676 | |
| | | | | | | | 35,172,537 | |
| Consumer Discretionary - 13.2% | | | | | | | | |
| Amazon.com, Inc. * | | | 109,815 | | | | 14,615,278 | |
| Lowe's Cos., Inc. | | | 69,252 | | | | 13,197,354 | |
| NIKE, Inc., Class B | | | 25,777 | | | | 2,649,102 | |
| TJX Cos., Inc. | | | 152,283 | | | | 13,411,564 | |
| | | | | | | | 43,873,298 | |
| Consumer Staples - 3.2% | | | | | | | | |
| Dollar Tree, Inc. * | | | 97,659 | | | | 10,848,938 | |
| | | | | | | | | |
| Financials - 32.6% | | | | | | | | |
| Capital Markets - 4.6% | | | | | | | | |
| Brookfield Asset Management Ltd., | | | | | | | | |
| Class A (A) | | | 58,087 | | | | 1,665,354 | |
| Brookfield Corp., Class A | | | 232,345 | | | | 6,772,857 | |
| Charles Schwab Corp. | | | 133,310 | | | | 6,937,453 | |
| | | | | | | | 15,375,664 | |
| Commercial Banks - 2.6% | | | | | | | | |
| U.S. Bancorp | | | 268,931 | | | | 8,573,520 | |
| Financial Services - 12.0% | | | | | | | | |
| Berkshire Hathaway, Inc., Class B * | | | 40,289 | | | | 13,751,844 | |
| Fiserv, Inc. * | | | 127,714 | | | | 14,527,468 | |
| Visa, Inc., Class A | | | 49,841 | | | | 11,717,619 | |
| | | | | | | | 39,996,931 | |
| Insurance - 13.4% | | | | | | | | |
| Arch Capital Group Ltd. * | | | 275,291 | | | | 23,862,224 | |
| Marsh & McLennan Cos., Inc. | | | 53,109 | | | | 10,072,122 | |
| Progressive Corp. | | | 67,157 | | | | 10,616,850 | |
| | | | | | | | 44,551,196 | |
| | | | | | | | 108,497,311 | |
| Health Care - 13.8% | | | | | | | | |
| Agilent Technologies, Inc. | | | 59,840 | | | | 6,185,661 | |
| Alcon, Inc. | | | 180,375 | | | | 12,864,345 | |
| Becton Dickinson & Co. | | | 57,581 | | | | 14,555,325 | |
| Danaher Corp. | | | 29,845 | | | | 5,730,837 | |
| Elevance Health, Inc. | | | 14,766 | | | | 6,646,029 | |
| | | | | | | | 45,982,197 | |
| Industrials - 13.4% | | | | | | | | |
| Copart, Inc. * | | | 270,380 | | | | 11,766,937 | |
| Ferguson PLC | | | 40,961 | | | | 6,152,342 | |
| PACCAR, Inc. | | | 184,754 | | | | 15,247,748 | |
| Parker-Hannifin Corp. | | | 31,560 | | | | 11,642,800 | |
| | | | | | | | 44,809,827 | |
| Information Technology - 9.1% | | | | | | | | |
| Accenture PLC, Class A | | | 41,852 | | | | 12,433,811 | |
| Analog Devices, Inc. | | | 77,405 | | | | 12,178,128 | |
| Texas Instruments, Inc. | | | 39,600 | | | | 5,623,596 | |
| | | | | | | | 30,235,535 | |
| Total Common Stocks | | | | | | | | |
| (Cost $203,959,531 ) | | | | | | | 319,419,643 | |
| SHORT-TERM INVESTMENTS - 4.0% | | | | | | | | |
| State Street Institutional U.S. | | | | | | | | |
| Government Money Market Fund, | | | | | | | | |
| Premier Class (B), 5.30% | | | 13,263,140 | | | | 13,263,140 | |
| Total Short-Term Investments | | | | | | | | |
| (Cost $13,263,140 ) | | | | | | | 13,263,140 | |
| TOTAL INVESTMENTS - 99.8% | | | | | | | | |
| (Cost $217,222,671** ) | | | | | | | 332,682,783 | |
| NET OTHER ASSETS AND LIABILITIES - 0.2% | | | | | | | 568,595 | |
| | | | | | | | | |
| TOTAL NET ASSETS - 100.0% | | | | | | $ | 333,251,378 | |
| * | | Non-income producing. |
| ** | | Aggregate cost for Federal tax purposes was $218,086,267. |
| (A) | | All or a portion of these securities, with an aggregate fair value of $6,635,120, are on loan as part of a securities lending program. See Note 11 for details on the securities lending program. |
| (B) | | 7-day yield. |
| PLC | | Public Limited Company. |
See accompanying Notes to Financial Statements.
Madison Funds | October 31, 2023
Madison Sustainable Equity Fund Portfolio of Investments
| | | Shares | | | Value (Note 2,3) | |
| COMMON STOCKS - 96.2% | | | | | | | | |
| Communication Service - 6.4% | | | | | | | | |
| Alphabet, Inc., Class C * | | | 4,083 | | | $ | 511,600 | |
| | | | | | | | | |
| Consumer Discretionary - 7.9% | | | | | | | | |
| Home Depot, Inc. | | | 633 | | | | 180,209 | |
| McDonald's Corp. | | | 264 | | | | 69,213 | |
| NIKE, Inc., Class B | | | 1,642 | | | | 168,748 | |
| TJX Cos., Inc. | | | 2,486 | | | | 218,942 | |
| | | | | | | | 637,112 | |
| Consumer Staples - 9.8% | | | | | | | | |
| Costco Wholesale Corp. | | | 611 | | | | 337,541 | |
| Nestle SA, ADR | | | 1,043 | | | | 112,394 | |
| PepsiCo, Inc. | | | 412 | | | | 67,271 | |
| Procter & Gamble Co. | | | 605 | | | | 90,768 | |
| Target Corp. | | | 1,636 | | | | 181,252 | |
| | | | | | | | 789,226 | |
| Equity Real Estate Investment Trusts | | | | | | | | |
| (REITs) - 1.2% | | | | | | | | |
| American Tower Corp., REIT | | | 541 | | | | 96,401 | |
| | | | | | | | | |
| Financials - 13.9% | | | | | | | | |
| BlackRock, Inc. | | | 222 | | | | 135,926 | |
| JPMorgan Chase & Co. | | | 1,563 | | | | 217,351 | |
| Progressive Corp. | | | 1,397 | | | | 220,852 | |
| U.S. Bancorp | | | 6,567 | | | | 209,356 | |
| Visa, Inc., Class A | | | 1,446 | | | | 339,954 | |
| | | | | | | | 1,123,439 | |
| Health Care - 16.4% | | | | | | | | |
| Becton Dickinson & Co. | | | 760 | | | | 192,113 | |
| Danaher Corp. | | | 1,159 | | | | 222,551 | |
| Eli Lilly & Co. | | | 847 | | | | 469,179 | |
| UnitedHealth Group, Inc. | | | 691 | | | | 370,072 | |
| Vertex Pharmaceuticals, Inc. * | | | 177 | | | | 64,093 | |
| | | | | | | | 1,318,008 | |
| Industrials - 6.0% | | | | | | | | |
| Jacobs Solutions, Inc. | | | 1,893 | | | | 252,337 | |
| Union Pacific Corp. | | | 541 | | | | 112,317 | |
| United Parcel Service, Inc., Class B | | | 823 | | | | 116,249 | |
| | | | | | | | 480,903 | |
| Information Technology - 26.4% | | | | | | | | |
| Communications Equipment - 1.2% | | | | | | | | |
| Cisco Systems, Inc. | | | 1,835 | | | | 95,659 | |
| | | | | | | | | |
| Computers & Peripherals - 4.5% | | | | | | | | |
| Apple, Inc. | | | 2,138 | | | | 365,106 | |
| | | | | | | | | |
| Electronic Equipment, Instruments & | | | | | | | | |
| Components - 2.1% | | | | | | | | |
| TE Connectivity Ltd. | | | 1,423 | | | | 167,700 | |
| | | | | | | | | |
| IT Services - 2.1% | | | | | | | | |
| Accenture PLC, Class A | | | 586 | | | | 174,095 | |
| | | | | | | | | |
| Semiconductors & Semiconductor | | | | | | | | |
| Equipment - 5.3% | | | | | | | | |
| Analog Devices, Inc. | | | 1,017 | | | | 160,005 | |
| QUALCOMM, Inc. | | | 1,440 | | | | 156,945 | |
| Texas Instruments, Inc. | | | 765 | | | | 108,638 | |
| | | | | | | | 425,588 | |
| Software - 11.2% | | | | | | | | |
| Microsoft Corp. | | | 2,018 | | | | 682,306 | |
| Oracle Corp. | | | 2,106 | | | | 217,760 | |
| | | | | | | | 900,066 | |
| | | | | | | | 2,128,214 | |
| Materials - 5.3% | | | | | | | | |
| Ecolab, Inc. | | | 979 | | | | 164,218 | |
| Linde PLC | | | 689 | | | | 263,308 | |
| | | | | | | | 427,526 | |
| Utilities - 2.9% | | | | | | | | |
| NextEra Energy, Inc. | | | 4,072 | | | | 237,398 | |
| | | | | | | | | |
| Total Common Stocks | | | | | | | | |
| (Cost $7,657,427 ) | | | | | | | 7,749,827 | |
| | | | | | | | | |
| EXCHANGE TRADED FUNDS - 1.3% | | | | | | | | |
| Stock Funds - 1.3% | | | | | | | | |
| SPDR S&P 500 ETF Trust | | | 261 | | | | 109,150 | |
| | | | | | | | | |
| Total Exchange Traded Funds | | | | | | | | |
| (Cost $117,412 ) | | | | | | | 109,150 | |
| SHORT-TERM INVESTMENTS - 2.2% | | | | | | | | |
| State Street Institutional U.S. Government | | | | | | | | |
| Money Market Fund, Premier Class (A), 5.30% | | | 175,393 | | | | 175,393 | |
| | | | | | | | | |
| Total Short-Term Investments | | | | | | | | |
| (Cost $175,393 ) | | | | | | | 175,393 | |
| | | | | | | | | |
| TOTAL INVESTMENTS - 99.7% | | | | | | | | |
| (Cost $7,950,232** ) | | | | | | | 8,034,370 | |
| NET OTHER ASSETS AND LIABILITIES - 0.3% | | | | | | | 24,302 | |
| TOTAL NET ASSETS - 100.0% | | | | | | $ | 8,058,672 | |
| * | | Non-income producing. |
| ** | | Aggregate cost for Federal tax purposes was $8,029,047. |
| (A) | | 7-day yield. |
| ADR | | American Depositary Receipt. |
| ETF | | Exchange Traded Fund. |
| PLC | | Public Limited Company. |
| REIT | | Real Estate Investment Trust. |
See accompanying Notes to Financial Statements.
Madison Funds | October 31, 2023
Madison Mid Cap Fund Portfolio of Investments
| | | Shares | | | Value (Note 2,3) | |
| COMMON STOCKS - 94.1% | | | | | | | | |
| Communication Services - 5.9% | | | | | | | | |
| Liberty Broadband Corp., Class C * | | | 340,373 | | | $ | 28,356,475 | |
| Liberty Media Corp.-Liberty Formula One, Class A * | | | 147,071 | | | | 8,463,936 | |
| Take-Two Interactive Software, Inc. * | | | 83,790 | | | | 11,206,912 | |
| | | | | | | | 48,027,323 | |
| Consumer Discretionary - 13.3% | | | | | | | | |
| CarMax, Inc. * | | | 430,077 | | | | 26,273,404 | |
| Floor & Decor Holdings, Inc., Class A * (A) | | | 269,339 | | | | 22,193,534 | |
| Ross Stores, Inc. | | | 397,856 | | | | 46,139,360 | |
| Thor Industries, Inc. | | | 162,074 | | | | 14,251,167 | |
| | | | | | | | 108,857,465 | |
| Consumer Staples - 5.2% | | | | | | | | |
| Brown-Forman Corp., Class B | | | 110,166 | | | | 6,186,923 | |
| Dollar Tree, Inc. * | | | 324,832 | | | | 36,085,587 | |
| | | | | | | | 42,272,510 | |
| Financials - 28.7% | | | | | | | | |
| Capital Markets - 4.7% | | | | | | | | |
| Brookfield Asset Management Ltd., | | | | | | | | |
| Class A (A) | | | 108,082 | | | | 3,098,711 | |
| Brookfield Corp., Class A (A) | | | 432,321 | | | | 12,602,157 | |
| Moelis & Co., Class A | | | 553,473 | | | | 23,046,616 | |
| | | | | | | | 38,747,484 | |
| Commercial Banks - 1.7% | | | | | | | | |
| Glacier Bancorp, Inc. | | | 447,275 | | | | 13,503,232 | |
| | | | | | | | | |
| Insurance - 22.3% | | | | | | | | |
| Arch Capital Group Ltd. * | | | 848,531 | | | | 73,550,667 | |
| Brown & Brown, Inc. | | | 531,746 | | | | 36,913,807 | |
| Markel Group, Inc. * | | | 15,452 | | | | 22,722,475 | |
| Progressive Corp. | | | 183,395 | | | | 28,992,916 | |
| W R Berkley Corp. | | | 302,374 | | | | 20,386,055 | |
| | | | | | | | 182,565,920 | |
| | | | | | | | 234,816,636 | |
| Health Care - 4.6% | | | | | | | | |
| Laboratory Corp. of America Holdings | | | 116,124 | | | | 23,193,446 | |
| Waters Corp. * | | | 62,264 | | | | 14,851,832 | |
| | | | | | | | 38,045,278 | |
| Industrials - 16.3% | | | | | | | | |
| Armstrong World Industries, Inc. | | | 143,678 | | | | 10,903,723 | |
| Carlisle Cos., Inc. | | | 153,465 | | | | 38,993,922 | |
| Copart, Inc. * | | | 812,346 | | | | 35,353,298 | |
| Expeditors International of Washington, Inc. | | | 133,775 | | | | 14,614,919 | |
| PACCAR, Inc. | | | 410,159 | | | | 33,850,422 | |
| | | | | | | | 133,716,284 | |
| Information Technology - 20.1% | | | | | | | | |
| Amphenol Corp., Class A | | | 304,122 | | | | 24,497,027 | |
| Arista Networks, Inc. * | | | 203,654 | | | | 40,806,152 | |
| CDW Corp. | | | 146,260 | | | | 29,310,504 | |
| Gartner, Inc. * | | | 137,536 | | | | 45,667,453 | |
| Microchip Technology, Inc. | | | 119,137 | | | | 8,493,277 | |
| MKS Instruments, Inc. | | | 238,410 | | | | 15,654,001 | |
| | | | | | | | 164,428,414 | |
| Total Common Stocks | | | | | | | | |
| (Cost $460,540,818 ) | | | | | | | 770,163,910 | |
| SHORT-TERM INVESTMENTS - 6.2% | | | | | | | | |
| State Street Institutional U.S. | | | | | | | | |
| Government Money Market Fund, | | | | | | | | |
| Premier Class (B), 5.30% | | | 46,516,536 | | | | 46,516,536 | |
| State Street Navigator Securities Lending | | | | | | | | |
| Government Money Market Portfolio (B) (C), 5.36% | | | 3,776,108 | | | | 3,776,108 | |
| Total Short-Term Investments | | | | | | | | |
| (Cost $50,292,644 ) | | | | | | | 50,292,644 | |
| TOTAL INVESTMENTS - 100.3% | | | | | | | | |
| (Cost $510,833,462** ) | | | | | | | 820,456,554 | |
| NET OTHER ASSETS AND LIABILITIES - (0.3%) | | | | | | | (2,277,815 | ) |
| TOTAL NET ASSETS - 100.0% | | | | | | $ | 818,178,739 | |
| * | | Non-income producing. |
| ** | | Aggregate cost for Federal tax purposes was $510,274,755. |
| (A) | | All or a portion of these securities, with an aggregate fair value of $34,397,280, are on loan as part of a securities lending program. See footnote (C) and Note 11 for details on the securities lending program. |
| (B) | | 7-day yield. |
| (C) | | Represents investments of cash collateral received in connection with securities lending. |
See accompanying Notes to Financial Statements.
Madison Funds | October 31, 2023
Madison Small Cap Fund Portfolio of Investments
| | | Shares | | | Value (Note 2,3) | |
| COMMON STOCKS - 95.9% | | | | | | | | |
| Communication Services - 5.2% | | | | | | | | |
| Cogent Communications Holdings, Inc. | | | 52,362 | | | $ | 3,402,482 | |
| Gogo, Inc. * | | | 271,870 | | | | 2,854,635 | |
| Magnite, Inc. * | | | 311,834 | | | | 2,070,578 | |
| | | | | | | | 8,327,695 | |
| Consumer Discretionary - 9.7% | | | | | | | | |
| Fox Factory Holding Corp. * | | | 18,247 | | | | 1,486,583 | |
| Ollie's Bargain Outlet Holdings, Inc. * | | | 40,398 | | | | 3,120,342 | |
| OneSpaWorld Holdings Ltd. * | | | 618,725 | | | | 6,484,238 | |
| Revolve Group, Inc. * (A) | | | 122,623 | | | | 1,686,066 | |
| Shake Shack, Inc., Class A * | | | 47,923 | | | | 2,685,605 | |
| | | | | | | | 15,462,834 | |
| Consumer Staples - 9.4% | | | | | | | | |
| Edgewell Personal Care Co. | | | 100,196 | | | | 3,496,840 | |
| Hain Celestial Group, Inc. * | | | 167,106 | | | | 1,846,521 | |
| Primo Water Corp. | | | 489,186 | | | | 6,388,769 | |
| Simply Good Foods Co. * | | | 85,405 | | | | 3,184,753 | |
| | | | | | | | 14,916,883 | |
| Energy - 1.3% | | | | | | | | |
| Chord Energy Corp. | | | 12,125 | | | | 2,004,505 | |
| | | | | | | | | |
| Financials - 7.2% | | | | | | | | |
| Axis Capital Holdings Ltd. | | | 98,906 | | | | 5,647,533 | |
| BRP Group, Inc., Class A * | | | 147,286 | | | | 3,082,696 | |
| Western Alliance Bancorp | | | 65,153 | | | | 2,677,788 | |
| | | | | | | | 11,408,017 | |
| Health Care - 7.5% | | | | | | | | |
| Encompass Health Corp. | | | 111,458 | | | | 6,972,812 | |
| Globus Medical, Inc., Class A * | | | 66,365 | | | | 3,033,544 | |
| HealthEquity, Inc. * | | | 27,932 | | | | 2,002,166 | |
| | | | | | | | 12,008,522 | |
| Industrials - 21.7% | | | | | | | | |
| Carlisle Cos., Inc. | | | 16,816 | | | | 4,272,777 | |
| Core & Main, Inc., Class A * | | | 105,123 | | | | 3,162,100 | |
| Crane Co. | | | 34,627 | | | | 3,370,246 | |
| Hayward Holdings, Inc. * | | | 188,378 | | | | 1,977,969 | |
| Helios Technologies, Inc. | | | 58,289 | | | | 3,014,707 | |
| Hillman Solutions Corp. * | | | 393,062 | | | | 2,578,487 | |
| Legalzoom.com, Inc. * | | | 116,325 | | | | 1,159,760 | |
| Leonardo DRS, Inc. * | | | 183,252 | | | | 3,494,616 | |
| Saia, Inc. * | | | 8,756 | | | | 3,138,938 | |
| WillScot Mobile Mini Holdings Corp. * | | | 161,900 | | | | 6,380,479 | |
| Xometry, Inc., Class A * | | | 138,854 | | | | 2,020,326 | |
| | | | | | | | 34,570,405 | |
| Information Technology - 26.4% | | | | | | | | |
| Communications Equipment - 1.9% | | | | | | | | |
| Ciena Corp. * | | | 72,612 | | | | 3,064,226 | |
| | | | | | | | | |
| Electronic Equipment, Instruments & | | | | | | | | |
| Components - 3.9% | | | | | | | | |
| Crane NXT Co. | | | 44,380 | | | | 2,307,760 | |
| CTS Corp. | | | 102,909 | | | | 3,849,826 | |
| | | | | | | | 6,157,586 | |
| Semiconductors & Semiconductor | | | | | | | | |
| Equipment - 7.6% | | | | | | | | |
| Entegris, Inc. | | | 56,139 | | | | 4,942,478 | |
| FormFactor, Inc. * | | | 121,122 | | | | 4,103,613 | |
| Power Integrations, Inc. | | | 43,240 | | | | 2,997,829 | |
| | | | | | | | 12,043,920 | |
| Software - 13.0% | | | | | | | | |
| Alteryx, Inc., Class A * | | | 76,508 | | | | 2,449,021 | |
| Box, Inc., Class A * | | | 103,665 | | | | 2,577,112 | |
| CommVault Systems, Inc. * | | | 54,488 | | | | 3,560,791 | |
| JFrog Ltd. * | | | 116,699 | | | | 2,624,561 | |
| Model N, Inc. * | | | 122,925 | | | | 2,962,492 | |
| PTC, Inc. * | | | 46,807 | | | | 6,572,639 | |
| | | | | | | | 20,746,616 | |
| | | | | | | | 42,012,348 | |
| Materials - 7.5% | | | | | | | | |
| Huntsman Corp. | | | 64,478 | | | | 1,504,272 | |
| Olin Corp. | | | 78,250 | | | | 3,342,840 | |
| Scotts Miracle-Gro Co. | | | 53,753 | | | | 2,388,783 | |
| Summit Materials, Inc., Class A * | | | 140,604 | | | | 4,625,872 | |
| | | | | | | | 11,861,767 | |
| Total Common Stocks | | | | | | | | |
| (Cost $135,851,246 ) | | | | | | | 152,572,976 | |
| SHORT-TERM INVESTMENTS - 5.2% | | | | | | | | |
| State Street Institutional U.S. | | | | | | | | |
| Government Money Market Fund, | | | | | | | | |
| Premier Class (B), 5.30% | | | 6,634,260 | | | $ | 6,634,260 | |
| State Street Navigator Securities Lending | | | | | | | | |
| Government Money Market Portfolio (B) (C), 5.36% | | | 1,573,703 | | | | 1,573,703 | |
| | | | | | | | | |
| Total Short-Term Investments | | | | | | | | |
| (Cost $8,207,963 ) | | | | | | | 8,207,963 | |
| TOTAL INVESTMENTS - 101.1% | | | | | | | | |
| (Cost $144,059,209** ) | | | | | | | 160,780,939 | |
| NET OTHER ASSETS AND LIABILITIES - (1.1%) | | | | | | | (1,768,897 | ) |
| TOTAL NET ASSETS - 100.0% | | | | | | $ | 159,012,042 | |
| * | | Non-income producing. |
| ** | | Aggregate cost for Federal tax purposes was $148,088,293. |
| (A) | | All or a portion of these securities, with an aggregate fair value of $1,633,088, are on loan as part of a securities lending program. See footnote (C) and Note 11 for details on the securities lending program. |
| (B) | | 7-day yield. |
| (C) | | Represents investments of cash collateral received in connection with securities lending. |
See accompanying Notes to Financial Statements.
Madison Funds | October 31, 2023
Madison International Stock Fund Portfolio of Investments
| | | Shares | | | Value (Note 2,3) | |
| COMMON STOCKS - 96.2% | | | | | | | | |
| Australia - 1.6% | | | | | | | | |
| Treasury Wine Estates Ltd. (A) | | | 24,424 | | | $ | 188,808 | |
| | | | | | | | | |
| Brazil - 1.2% | | | | | | | | |
| Itau Unibanco Holding SA, ADR | | | 26,901 | | | | 142,844 | |
| | | | | | | | | |
| Canada - 6.2% | | | | | | | | |
| Cameco Corp. | | | 8,249 | | | | 337,466 | |
| Canadian Pacific Kansas City Ltd. | | | 2,671 | | | | 189,561 | |
| Manulife Financial Corp. (B) | | | 11,888 | | | | 207,089 | |
| | | | | | | | 734,116 | |
| | | | | | | | | |
| China - 7.2% | | | | | | | | |
| Alibaba Group Holding Ltd., ADR * | | | 4,103 | | | | 338,662 | |
| Ping An Insurance Group Co. of China Ltd., Class H (A) | | | 49,378 | | | | 249,607 | |
| Tencent Holdings Ltd. (A) | | | 6,840 | | | | 253,387 | |
| | | | | | | | 841,656 | |
| | | | | | | | | |
| Denmark - 1.0% | | | | | | | | |
| Genmab AS * (A) | | | 425 | | | | 120,390 | |
| | | | | | | | | |
| France - 8.3% | | | | | | | | |
| Air Liquide SA (A) | | | 844 | | | | 144,652 | |
| Airbus SE (A) | | | 2,211 | | | | 295,739 | |
| Hermes International SCA (A) | | | 71 | | | | 133,147 | |
| | | | | | | | | |
| LVMH Moet Hennessy Louis Vuitton SE (A) | | | 191 | | | | 136,693 | |
| STMicroelectronics NV (B) | | | 3,486 | | | | 132,398 | |
| Worldline SA *, (A)(C) | | | 10,335 | | | | 130,963 | |
| | | | | | | | 973,592 | |
| | | | | | | | | |
| Germany - 11.7% | | | | | | | | |
| adidas AG (A) | | | 1,434 | | | | 253,644 | |
| Deutsche Telekom AG (A) | | | 14,076 | | | | 305,019 | |
| KION Group AG (A) | | | 6,945 | | | | 211,442 | |
| SAP SE, ADR (A) | | | 1,950 | | | | 261,300 | |
| Siemens AG (A) | | | 1,517 | | | | 200,595 | |
| Symrise AG (A) | | | 1,447 | | | | 147,293 | |
| | | | | | | | 1,379,293 | |
| | | | | | | | | |
| Hong Kong - 1.5% | | | | | | | | |
| AIA Group Ltd. (A) | | | 20,744 | | | | 180,663 | |
| | | | | | | | | |
| India - 7.8% | | | | | | | | |
| HDFC Bank Ltd., ADR | | | 5,971 | | | | 337,660 | |
| Infosys Ltd., ADR | | | 13,823 | | | | 226,974 | |
| Larsen & Toubro Ltd., GDR (A) | | | 10,037 | | | | 354,080 | |
| | | | | | | | 918,714 | |
| | | | | | | | | |
| Ireland - 2.0% | | | | | | | | |
| Kerry Group PLC, Class A (A) | | | 3,017 | | | | 233,737 | |
| | | | | | | | | |
| Israel - 1.6% | | | | | | | | |
| CyberArk Software Ltd. * | | | 1,147 | | | $ | 187,695 | |
| | | | | | | | | |
| Italy - 1.2% | | | | | | | | |
| Ferrari NV | | | 471 | | | | 142,072 | |
| | | | | | | | | |
| Japan - 16.3% (A) | | | | | | | | |
| CyberAgent, Inc. (A) | | | 22,684 | | | | 119,411 | |
| Daiichi Sankyo Co. Ltd. (A) | | | 4,600 | | | | 118,201 | |
| Keyence Corp. (A) | | | 367 | | | | 142,067 | |
| Lasertec Corp. (A) | | | 1,400 | | | | 233,452 | |
| Murata Manufacturing Co. Ltd. (A) | | | 8,964 | | | | 148,811 | |
| Nidec Corp. (A) | | | 3,000 | | | | 109,786 | |
| Pan Pacific International Holdings Corp. (A) | | | 12,900 | | | | 252,663 | |
| Shin-Etsu Chemical Co. Ltd. (A) | | | 6,200 | | | | 185,531 | |
| Shiseido Co. Ltd. (A) | | | 3,600 | | | | 113,962 | |
| Sony Group Corp. (A) | | | 2,946 | | | | 243,822 | |
| Toray Industries, Inc. (A) | | | 49,779 | | | | 243,494 | |
| | | | | | | | 1,911,200 | |
| | | | | | | | | |
| Mexico - 5.4% | | | | | | | | |
| Fomento Economico Mexicano SAB de CV, ADR | | | 1,336 | | | | 151,516 | |
| Grupo Mexico SAB de CV, Series B | | | 68,149 | | | | 283,006 | |
| Wal-Mart de Mexico SAB de CV, ADR | | | 5,602 | | | | 197,246 | |
| | | | | | | | 631,768 | |
| | | | | | | | | |
| Netherlands - 4.1% | | | | | | | | |
| ASML Holding NV | | | 409 | | | | 244,914 | |
| NXP Semiconductors NV | | | 1,375 | | | | 237,091 | |
| | | | | | | | 482,005 | |
| | | | | | | | | |
| Norway - 1.2% | | | | | | | | |
| Norsk Hydro ASA (A) | | | 24,244 | | | | 138,296 | |
| | | | | | | | | |
| Switzerland - 6.3% | | | | | | | | |
| Lonza Group AG (A) | | | 559 | | | | 196,021 | |
| Nestle SA (A) | | | 1,283 | | | | 138,415 | |
| Partners Group Holding AG (A) | | | 228 | | | | 241,540 | |
| Sika AG (A) | | | 675 | | | | 161,141 | |
| | | | | | | | 737,117 | |
| | | | | | | | | |
| Taiwan - 1.4% | | | | | | | | |
| Taiwan Semiconductor Manufacturing Co. Ltd., ADR | | | 1,867 | | | | 161,141 | |
| | | | | | | | | |
| United Kingdom - 10.2% | | | | | | | | |
| AstraZeneca PLC (A) | | | 2,041 | | | | 255,116 | |
| Diageo PLC (A) | | | 4,898 | | | | 185,611 | |
| London Stock Exchange Group PLC (A) | | | 2,231 | | | | 224,384 | |
| | | | | | | | | |
| Prudential PLC | | | 17,708 | | | $ | 185,762 | |
| Shell PLC | | | 10,641 | | | | 341,984 | |
| | | | | | | | 1,192,857 | |
| | | | | | | | | |
| Total Common Stocks | | | | | | | | |
| (Cost $13,135,419 ) | | | | | | | 11,297,964 | |
| | | | | | | | | |
| EXCHANGE TRADED FUNDS - 1.3% | | | | | | | | |
| United States - 1.3% | | | | | | | | |
| iShares MSCI ACWI ex U.S. ETF | | | 3,448 | | | | 157,022 | |
| | | | | | | | | |
| Total Exchange Traded Funds | | | | | | | | |
| (Cost $156,884 ) | | | | | | | 157,022 | |
| SHORT-TERM INVESTMENTS - 2.3% | | | | | | | | |
| State Street Institutional U.S. Government Money Market Fund, Premier Class (D), 5.30% | | | 272,591 | | | | 272,591 | |
| State Street Navigator Securities Lending Government Money Market Portfolio (D) (E), 5.36% | | | 108 | | | | 108 | |
| | | | | | | | | |
| Total Short-Term Investments | | | | | | | | |
| (Cost $272,699 ) | | | | | | | 272,699 | |
| TOTAL INVESTMENTS - 99.8% | | | | | | | | |
| (Cost $13,565,002** ) | | | | | | | 11,727,685 | |
| NET OTHER ASSETS AND LIABILITIES - 0.2% | | | | | | | 21,008 | |
| TOTAL NET ASSETS - 100.0% | | | | | | $ | 11,748,693 | |
| ** | | Aggregate cost for Federal tax purposes was $13,662,452 |
| * | | Non-income producing. |
| (A) | | Due to events that occurred between the close of the exchange on which this security is traded and that of the New York Stock Exchange, fair value was determined for this security using methods determined in good faith by or at the discretion of the Board of Trustees (see Note 3). |
| (B) | | All or a portion of these securities, with an aggregate fair value of $128,854, are on loan as part of a securities lending program. See footnote (E) and Note 11 for details on the securities lending program. |
| (C) | | Security sold within terms of a private placement memorandum exempt from registration under section 144A of the Securities Act of 1933, as amended, and may be sold only to dealers in that program or other "qualified institutional investors." The securities have been determined to be liquid under guidelines established by the Board of Trustees. |
| (D) | | 7-day yield. |
| (E) | | Represents investments of cash collateral received in connection with securities lending. |
| ACWI | | All Country World Index. |
| ADR | | American Depositary Receipt. |
| ETF | | Exchange Traded Fund. |
| GDR | | Global Depositary Receipt. |
| MSCI | | Morgan Stanley Capital International. |
| PLC | | Public Limited Company. |
See accompanying Notes to Financial Statements.
Madison Funds | October 31, 2023
Statements of Assets and Liabilities as of October 31, 2023
| | | Conservative | | | Moderate | | | Aggressive | | | Diversified | | | Tax-Free | | | Tax-Free | | | High Quality | | | Core | |
| | | Allocation | | | Allocation | | | Allocation | | | Income | | | Virginia | | | National | | | Bond | | | Bond | |
| | | Fund | | | Fund | | | Fund | | | Fund | | | Fund | | | Fund | | | Fund | | | Fund | |
| Assets: | | | | | | | | | | | | | | | | | | | | | | | | | | | | | | | | |
| Investments in unaffiliated securities, at fair value†§ | | $ | 26,077,444 | | | $ | 66,264,499 | | | $ | 42,551,713 | | | $ | 31,425,079 | | | $ | 16,307,786 | | | $ | 16,805,158 | | | $ | 55,332,523 | | | $ | 181,964,703 | |
| Investments in affiliated securities, at fair value1‡ | | | 17,163,980 | | | | 30,423,503 | | | | 13,607,850 | | | | 111,220,837 | | | | — | | | �� | — | | | | — | | | | — | |
| Cash | | | — | | | | — | | | | — | | | | 2,807 | | | | 54,808 | | | | 92,491 | | | | — | | | | 272 | |
| Receivables: | | | | | | | | | | | | | | | | | | | | | | | | | | | | | | | | |
| Investments sold | | | — | | | | — | | | | — | | | | 239,119 | | | | — | | | | — | | | | — | | | | — | |
| Fund shares sold | | | 1,173 | | | | 11,071 | | | | 58,171 | | | | 3,313 | | | | — | | | | — | | | | 104,978 | | | | 150,851 | |
| Dividends and Interest | | | 42,465 | | | | 56,787 | | | | 14,386 | | | | 6,657 | | | | 226,670 | | | | 233,194 | | | | 371,648 | | | | 1,398,504 | |
| Total assets | | | 43,285,062 | | | | 96,755,860 | | | | 56,232,120 | | | | 142,897,812 | | | | 16,589,264 | | | | 17,130,843 | | | | 55,809,149 | | | | 183,514,330 | |
| Liabilities: | | | | | | | | | | | | | | | | | | | | | | | | | | | | | | | | |
| Payables: | | | | | | | | | | | | | | | | | | | | | | | | | | | | | | | | |
| Investments purchased | | | 168,649 | | | | 379,991 | | | | 401,626 | | | | — | | | | — | | | | — | | | | — | | | | 300,000 | |
| Fund shares repurchased | | | 14,642 | | | | 59,724 | | | | 24,604 | | | | 206,715 | | | | 1,068 | | | | 2,201 | | | | 23,208 | | | | 132,342 | |
| Upon return of securities loaned | | | — | | | | 5,522,899 | | | | 4,930,101 | | | | 2,364,950 | | | | — | | | | — | | | | 2,209,000 | | | | 1,103,783 | |
| Advisory agreement fees | | | 7,414 | | | | 15,684 | | | | 8,781 | | | | 24,221 | | | | 7,077 | | | | 5,872 | | | | 13,716 | | | | 60,639 | |
| Administrative services agreement fees | | | 9,269 | | | | 19,605 | | | | 10,978 | | | | 24,223 | | | | 4,954 | | | | 5,138 | | | | 7,821 | | | | 12,274 | |
| Distribution fees - Class C | | | 8,108 | | | | 3,505 | | | | 1,273 | | | | 12,884 | | | | — | | | | — | | | | — | | | | — | |
| Shareholder service fees | | | 8,822 | | | | 18,231 | | | | 10,117 | | | | 32,938 | | | | — | | | | — | | | | — | | | | 6,181 | |
| Dividends | | | — | | | | — | | | | — | | | | 2,790 | | | | 1,080 | | | | 3,302 | | | | — | | | | 313,574 | |
| Total liabilities | | | 216,904 | | | | 6,019,639 | | | | 5,387,480 | | | | 2,668,721 | | | | 14,179 | | | | 16,513 | | | | 2,253,745 | | | | 1,928,793 | |
| Net assets applicable to outstanding capital stock | | $ | 43,068,158 | | | $ | 90,736,221 | | | $ | 50,844,640 | | | $ | 140,229,091 | | | $ | 16,575,085 | | | $ | 17,114,330 | | | $ | 53,555,404 | | | $ | 181,585,537 | |
| Net assets consist of: | | | | | | | | | | | | | | | | | | | | | | | | | | | | | | | | |
| Paid-in capital | | $ | 50,172,691 | | | $ | 95,176,759 | | | $ | 51,361,718 | | | $ | 128,340,713 | | | $ | 18,114,969 | | | $ | 18,283,908 | | | $ | 62,344,395 | | | $ | 217,780,243 | |
| Accumulated distributable earnings (loss) | | | (7,104,533 | ) | | | (4,440,538 | ) | | | (517,078 | ) | | | 11,888,378 | | | | (1,539,884 | ) | | | (1,169,578 | ) | | | (8,788,991 | ) | | | (36,194,706 | ) |
| Net Assets | | $ | 43,068,158 | | | $ | 90,736,221 | | | $ | 50,844,640 | | | $ | 140,229,091 | | | $ | 16,575,085 | | | $ | 17,114,330 | | | $ | 53,555,404 | | | $ | 181,585,537 | |
| | | | | | | | | | | | | | | | | | | | | | | | | | | | | | | | | |
| Class A Shares: | | | | | | | | | | | | | | | | | | | | | | | | | | | | | | | | |
| Net Assets | | $ | 30,510,046 | | | $ | 85,229,569 | | | $ | 48,887,950 | | | $ | 119,989,320 | | | | | | | | | | | | | | | $ | 29,452,486 | |
| Shares of beneficial interest outstanding | | | 3,475,347 | | | | 8,784,128 | | | | 4,857,833 | | | | 8,759,351 | | | | | | | | | | | | | | | | 3,495,386 | |
| Net Asset Value and redemption price per share | | $ | 8.78 | | | $ | 9.70 | | | $ | 10.06 | | | $ | 13.70 | | | | | | | | | | | | | | | $ | 8.43 | |
| Sales charge of offering price2 | | | 0.54 | | | | 0.59 | | | | 0.61 | | | | 0.84 | | | | | | | | | | | | | | | | 0.40 | |
| Maximum offering price per share | | $ | 9.32 | | | $ | 10.29 | | | $ | 10.67 | | | $ | 14.54 | | | | | | | | | | | | | | | $ | 8.83 | |
| Class C Shares: | | | | | | | | | | | | | | | | | | | | | | | | | | | | | | | | |
| Net Assets | | $ | 12,558,112 | | | $ | 5,506,652 | | | $ | 1,956,690 | | | $ | 20,239,771 | | | | | | | | | | | | | | | | | |
| Shares of beneficial interest outstanding | | | 1,406,019 | | | | 574,216 | | | | 202,486 | | | | 1,461,973 | | | | | | | | | | | | | | | | | |
| Net Asset Value and redemption price per share3 | | $ | 8.93 | | | $ | 9.59 | | | $ | 9.66 | | | $ | 13.84 | | | | | | | | | | | | | | | | | |
| Class Y Shares: | | | | | | | | | | | | | | | | | | | | | | | | | | | | | | | | |
| Net Assets | | | | | | | | | | | | | | | | | | $ | 16,575,085 | | | $ | 17,114,330 | | | $ | 42,306,891 | | | $ | 6,481,998 | |
| Shares of beneficial interest outstanding | | | | | | | | | | | | | | | | | | | 1,624,293 | | | | 1,788,987 | | | | 4,236,427 | | | | 773,744 | |
| Net Asset Value and redemption price per share3 | | | | | | | | | | | | | | | | | | $ | 10.20 | | | $ | 9.57 | | | $ | 9.99 | | | $ | 8.38 | |
| Class I Shares: | | | | | | | | | | | | | | | | | | | | | | | | | | | | | | | | |
| Net Assets | | | | | | | | | | | | | | | | | | | | | | | | | | $ | 11,248,513 | | | $ | 52,699,165 | |
| Shares of beneficial interest outstanding | | | | | | | | | | | | | | | | | | | | | | | | | | | 1,118,917 | | | | 6,318,931 | |
| Net Asset Value and redemption price per share3 | | | | | | | | | | | | | | | | | | | | | | | | | | $ | 10.05 | | | $ | 8.34 | |
| Class R6 Shares: | | | | | | | | | | | | | | | | | | | | | | | | | | | | | | | | |
| Net Assets | | | | | | | | | | | | | | | | | | | | | | | | | | | | | | $ | 92,951,888 | |
| Shares of beneficial interest outstanding | | | | | | | | | | | | | | | | | | | | | | | | | | | | | | | 11,151,259 | |
| Net Asset Value and redemption price per share3 | | | | | | | | | | | | | | | | | | | | | | | | | | | | | | $ | 8.34 | |
| | | | | | | | | | | | | | | | | | | | | | | | | | | | | | | | | |
| † Cost of Investments in unaffiliated securities | | $ | 27,362,819 | | | $ | 67,945,665 | | | $ | 43,423,745 | | | $ | 31,345,520 | | | $ | 17,729,706 | | | $ | 17,953,223 | | | $ | 59,732,804 | | | $ | 208,803,606 | |
| ‡Cost of investments in affiliated securities1 | | $ | 19,976,158 | | | $ | 32,421,436 | | | $ | 12,996,479 | | | $ | 115,991,669 | | | $ | — | | | $ | — | | | $ | — | | | $ | — | |
| § Fair Value of securities on loan | | $ | — | | | $ | 5,431,155 | | | $ | 4,847,435 | | | $ | 2,308,207 | | | $ | — | | | $ | — | | | $ | 2,162,301 | | | $ | 1,081,353 | |
1 See Note 14 for information on affiliated issuers.
2 Sales charge of offering price is 5.75% for the Conservative Allocation, Moderate Allocation, Aggressive Allocation and Diversified Income Funds and 4.50% for the Core Bond Fund.
3 If applicable, redemption price per share may be reduced by a contingent deferred sales charge.
See accompanying Notes to Financial Statements.
Madison Funds | October 31, 2023
Statements of Assets and Liabilities as of October 31, 2023 - continued
| | | Covered Call & | | | | | | | | | Sustainable | | | | | | | | | | |
| | | Equity Income | | | Dividend Income | | | Investors | | | Equity | | | Mid Cap | | | Small Cap | | | International Stock | |
| | | Fund | | | Fund | | | Fund | | | Fund | | | Fund | | | Fund | | | Fund | |
| Assets: | | | | | | | | | | | | | | | | | | | | | | | | | | | | |
| Investments in unaffiliated securities, at fair value†§ | | $ | 245,675,444 | | | $ | 197,204,627 | | | $ | 332,682,783 | | | $ | 8,034,370 | | | $ | 820,456,554 | | | $ | 160,780,939 | | | $ | 11,727,685 | |
| Investments in affiliated securities, at fair value1‡ | | | — | | | | — | | | | — | | | | — | | | | — | | | | — | | | | — | |
| Foreign currency (cost of $7,206) (Note 2) | | | — | | | | — | | | | — | | | | — | | | | — | | | | — | | | | 7,175 | |
| Receivables: | | | | | | | | | | | | | | | | | | | | | | | | | | | | |
| Investments sold. | | | 157,640 | | | | — | | | | — | | | | 27,058 | | | | — | | | | 711,718 | | | | — | |
| Fund shares sold | | | 1,809,248 | | | | 39,797 | | | | 355,773 | | | | — | | | | 2,507,948 | | | | 995 | | | | 1,688 | |
| Dividends and Interest | | | 367,560 | | | | 492,517 | | | | 539,519 | | | | 2,809 | | | | 146,923 | | | | 11,218 | | | | 61,049 | |
| Total assets | | | 248,009,892 | | | | 197,736,941 | | | | 333,578,075 | | | | 8,064,237 | | | | 823,111,425 | | | | 161,504,870 | | | | 11,797,597 | |
| Liabilities: | | | | | | | | | | | | | | | | | | | | | | | | | | | | |
| Payables: | | | | | | | | | | | | | | | | | | | | | | | | | | | | |
| Investments purchased | | | — | | | | — | | | | — | | | | — | | | | — | | | | 684,798 | | | | — | |
| Fund shares repurchased | | | 1,192,041 | | | | 55,195 | | | | 59,462 | | | | — | | | | 530,165 | | | | 82,891 | | | | 29,320 | |
| Upon return of securities loaned | | | — | | | | — | | | | — | | | | — | | | | 3,776,108 | | | | 1,573,703 | | | | 108 | |
| Advisory agreement fees | | | 176,192 | | | | 121,575 | | | | 205,584 | | | | 4,862 | | | | 510,890 | | | | 123,958 | | | | 10,858 | |
| Administrative services agreement fees | | | 24,537 | | | | 29,468 | | | | 41,625 | | | | 703 | | | | 101,590 | | | | 26,765 | | | | 3,102 | |
| Distribution fees - Class C | | | 8,674 | | | | — | | | | — | | | | — | | | | — | | | | — | | | | — | |
| Shareholder service fees | | | 7,225 | | | | 10,202 | | | | 20,026 | | | | — | | | | 13,933 | | | | 713 | | | | 2,366 | |
| Due to Custodian | | | — | | | | — | | | | — | | | | — | | | | — | | | | — | | | | 3,150 | |
| Options written, at value (premium received $3,338,933) | | | 2,312,793 | | | | — | | | | — | | | | — | | | | — | | | | — | | | | — | |
| Total liabilities | | | 3,721,462 | | | | 216,440 | | | | 326,697 | | | | 5,565 | | | | 4,932,686 | | | | 2,492,828 | | | | 48,904 | |
| Net assets applicable to outstanding capital stock | | $ | 244,288,430 | | | $ | 197,520,501 | | | $ | 333,251,378 | | | $ | 8,058,672 | | | $ | 818,178,739 | | | $ | 159,012,042 | | | $ | 11,748,693 | |
| Net assets consist of: | | | | | | | | | | | | | | | | | | | | | | | | | | | | |
| Paid-in capital. | | $ | 263,748,160 | | | $ | 168,975,873 | | | $ | 190,609,601 | | | $ | 8,754,569 | | | $ | 496,716,039 | | | $ | 146,329,269 | | | $ | 14,727,187 | |
| Accumulated distributable earnings (loss) | | | (19,459,730 | ) | | | 28,544,628 | | | | 142,641,777 | | | | (695,897 | ) | | | 321,462,700 | | | | 12,682,773 | | | | (2,978,494 | ) |
| Net Assets. | | $ | 244,288,430 | | | $ | 197,520,501 | | | $ | 333,251,378 | | | $ | 8,058,672 | | | $ | 818,178,739 | | | $ | 159,012,042 | | | $ | 11,748,693 | |
| | | | | | | | | | | | | | | | | | | | | | | | | | | | | |
| Class A Shares: | | | | | | | | | | | | | | | | | | | | | | | | | | | | |
| Net Assets | | $ | 20,689,960 | | | $ | 48,746,470 | | | $ | 93,710,793 | | | | | | | $ | 66,717,124 | | | $ | 3,275,462 | | | $ | 11,103,741 | |
| Shares of beneficial interest outstanding | | | 2,253,822 | | | | 1,923,450 | | | | 3,706,576 | | | | | | | | 5,268,793 | | | | 382,786 | | | | 1,400,457 | |
| Net Asset Value and redemption price per share | | $ | 9.18 | | | $ | 25.34 | | | $ | 25.28 | | | | | | | $ | 12.66 | | | $ | 8.56 | | | $ | 7.93 | |
| Sales charge of offering price2 | | | 0.56 | | | | 1.55 | | | | 1.54 | | | | | | | | 0.77 | | | | 0.52 | | | | 0.48 | |
| Maximum offering price per share | | $ | 9.74 | | | $ | 26.89 | | | $ | 26.82 | | | | | | | $ | 13.43 | | | $ | 9.08 | | | $ | 8.41 | |
| Class C Shares: | | | | | | | | | | | | | | | | | | | | | | | | | | | | |
| Net Assets | | $ | 14,191,978 | | | | | | | | | | | | | | | | | | | | | | | | | |
| Shares of beneficial interest outstanding | | | 1,742,160 | | | | | | | | | | | | | | | | | | | | | | | | | |
| Net Asset Value and redemption price per share3 | | $ | 8.15 | | | | | | | | | | | | | | | | | | | | | | | | | |
| Class Y Shares: | | | | | | | | | | | | | | | | | | | | | | | | | | | | |
| Net Assets | | $ | 57,276,939 | | | $ | 98,291,416 | | | $ | 97,445,667 | | | $ | 100,755 | | | $ | 260,473,916 | | | $ | 143,591,375 | | | $ | 644,952 | |
| Shares of beneficial interest outstanding | | | 5,958,471 | | | | 3,876,460 | | | | 3,841,860 | | | | 11,737 | | | | 18,983,849 | | | | 16,494,404 | | | | 81,980 | |
| Net Asset Value and redemption price per share3 | | $ | 9.61 | | | $ | 25.36 | | | $ | 25.36 | | | $ | 8.58 | | | $ | 13.72 | | | $ | 8.71 | | | $ | 7.87 | |
| Class I Shares: | | | | | | | | | | | | | | | | | | | | | | | | | | | | |
| Net Assets | | $ | 150,951,331 | | | $ | 38,825,961 | | | $ | 80,307,534 | | | $ | 7,957,917 | | | $ | 376,668,118 | | | $ | 11,924,728 | | | | | |
| Shares of beneficial interest outstanding | | | 15,698,480 | | | | 1,532,149 | | | | 3,177,298 | | | | 926,446 | | | | 27,390,965 | | | | 1,367,245 | | | | | |
| Net Asset Value and redemption price per share3 | | $ | 9.62 | | | $ | 25.34 | | | $ | 25.28 | | | $ | 8.59 | | | $ | 13.75 | | | $ | 8.72 | | | | | |
| Class R6 Shares: | | | | | | | | | | | | | | | | | | | | | | | | | | | | |
| Net Assets | | $ | 1,178,222 | | | $ | 11,656,654 | | | $ | 61,787,384 | | | | | | | $ | 114,319,581 | | | $ | 220,477 | | | | | |
| Shares of beneficial interest outstanding | | | 120,153 | | | | 459,911 | | | | 2,416,038 | | | | | | | | 8,080,765 | | | | 25,234 | | | | | |
| Net Asset Value and redemption price per share3 | | $ | 9.81 | | | $ | 25.35 | | | $ | 25.57 | | | | | | | $ | 14.15 | | | $ | 8.74 | | | | | |
| | | | | | | | | | | | | | | | | | | | | | | | | | | | | |
| † Cost of Investments in unaffiliated securities | | $ | 273,640,973 | | | $ | 174,233,919 | | | $ | 217,222,671 | | | $ | 7,950,232 | | | $ | 510,833,462 | | | $ | 144,059,209 | | | $ | 13,565,002 | |
| ‡Cost of investments in affiliated securities1 | | $ | — | | | $ | — | | | $ | — | | | $ | — | | | $ | — | | | $ | — | | | $ | — | |
| § Fair Value of securities on loan | | $ | — | | | $ | — | | | $ | 6,635,120 | | | $ | — | | | | 34,397,280 | | | | 1,633,088 | | | | 128,854 | |
1 See Note 14 for information on affiliated issuers.
2 Sales charge of offering price is 5.75% for the Covered Call & Equity Income, Dividend Income, Investors, Mid Cap, Small Cap and International Stock funds.
3 If applicable, redemption price per share may be reduced by a contingent deferred sales charge.
See accompanying Notes to Financial Statements.
Madison Funds | October 31, 2023
Statements of Operations for the Year Ended October 31, 2023
| | | | | | | | | | | | Diversified | | | Tax-Free | | | Tax-Free | | | High Quality | | | Core | |
| | | Conservative | | | Moderate | | | Aggressive | | | Income | | | Virginia | | | National | | | Bond | | | Bond | |
| | | Allocation Fund | | | Allocation Fund | | | Allocation Fund | | | Fund | | | Fund | | | Fund | | | Fund | | | Fund | |
| Investment Income: | | | | | | | | | | | | | | | | | | | | | | | | | | | | | | | | |
| Interest | | $ | 85,433 | | | $ | 248,656 | | | $ | 174,653 | | | $ | 1,598,965 | $ | | | 481,506 | | | $ | 495,895 | | | $ | 1,755,471 | | | $ | 6,732,539 | |
| Dividends | | | | | | | | | | | | | | | | | | | | | | | | | | | | | | | | |
| Unaffiliated issuers. | | | 878,773 | | | | 1,735,563 | | | | 925,112 | | | | 2,898,105 | | | | — | | | | — | | | | — | | | | — | |
| Affiliated issuers1 | | | 456,866 | | | | 655,105 | | | | 208,222 | | | | 405,569 | | | | — | | | | — | | | | — | | | | — | |
| Income from securities lending | | | 16,318 | | | | 26,207 | | | | 11,983 | | | | 4,639 | | | | — | | | | — | | | | 7,033 | | | | 10,734 | |
| Total investment income | | | 1,437,390 | | | | 2,665,531 | | | | 1,319,970 | | | | 4,907,278 | | | | 481,506 | | | | 495,895 | | | | 1,762,504 | | | | 6,743,273 | |
| Expenses:2 | | | | | | | | | | | | | | | | | | | | | | | | | | | | | | | | |
| Advisory agreement fees | | | 97,497 | | | | 199,084 | | | | 107,507 | | | | 847,363 | | | | 89,802 | | | | 71,414 | | | | 219,199 | | | | 749,077 | |
| Administrative services agreement fees | | | 121,871 | | | | 248,855 | | | | 134,382 | | | | 312,232 | | | �� | 62,861 | | | | 62,487 | | | | 125,168 | | | | 153,170 | |
| Trustee fees | | | 4,064 | | | | 8,183 | | | | 4,330 | | | | 12,989 | | | | 1,478 | | | | 1,447 | | | | 6,486 | | | | 15,546 | |
| Distribution fees - Class B3 | | | 2,572 | | | | 6,738 | | | | 3,905 | | | | 4,970 | | | | — | | | | — | | | | — | | | | 473 | |
| Distribution fees - Class C | | | 104,085 | | | | 45,829 | | | | 16,311 | | | | 167,220 | | | | — | | | | — | | | | — | | | | — | |
| Shareholder service fees - Class A | | | 83,812 | | | | 223,318 | | | | 122,378 | | | | 328,362 | | | | — | | | | — | | | | — | | | | 80,374 | |
| Shareholder service fees - Class B3 | | | 857 | | | | 2,235 | | | | 1,272 | | | | 1,645 | | | | — | | | | — | | | | — | | | | 158 | |
| Shareholder service fees - Class C | | | 34,695 | | | | 15,171 | | | | 5,431 | | | | 55,516 | | | | — | | | | — | | | | — | | | | — | |
| Other expenses | | | 2,269 | | | | 4,625 | | | | 2,400 | | | | 7,336 | | | | 790 | | | | 785 | | | | 3,399 | | | | 8,048 | |
| Total expenses | | | 451,722 | | | | 754,038 | | | | 397,916 | | | | 1,737,633 | | | | 154,931 | | | | 136,133 | | | | 354,252 | | | | 1,006,846 | |
| Net Investment Income (Loss) | | | 985,668 | | | | 1,911,493 | | | | 922,054 | | | | 3,169,645 | | | | 326,575 | | | | 359,762 | | | | 1,408,252 | | | | 5,736,427 | |
| Net Realized and Unrealized Gain (loss) on Investments | | | | | | | | | | | | | | | | | | | | | | | | | | | | | | | | |
| Net realized gain (loss) on investments (including net realized gain (loss) on foreign currency related transactions) | | | | | | | | | | | | | | | | | | | | | | | | | | | | | | | | |
| Unaffiliated issuers | | | (1,101,363 | ) | | | (858,299 | ) | | | (174,486 | ) | | | 16,701,621 | | | | (3,104 | ) | | | (23,159 | ) | | | (3,293,011 | ) | | | (5,671,173 | ) |
| Affiliated issuers1 | | | (76,190 | ) | | | — | | | | — | | | | — | | | | — | | | | — | | | | — | | | | — | |
| Capital gain distributions received from underlying funds | | | | | | | | | | | | | | | | | | | | | | | | | | | | | | | | |
| Affiliated issuers1. | | | 217,127 | | | | 680,422 | | | | 469,881 | | | | — | | | | — | | | | — | | | | — | | | | — | |
| Net change in unrealized appreciation (depreciation) on investments (including net unrealized appreciation (depreciation) on foreign currency related transactions) | | | | | | | | | | | | | | | | | | | | | | | | | | | | | | | | |
| Unaffiliated issuers | | | 940,032 | | | | 1,147,686 | | | | 538,435 | | | | (16,837,228 | ) | | | (180,392 | ) | | | (131,162 | ) | | | 3,574,224 | | | | 469,693 | |
| Affiliated Issuers1 | | | (111,057 | ) | | | 82,780 | | | | 245,687 | | | | (4,770,832 | ) | | | — | | | | — | | | | — | | | | — | |
| Net Realized and Unrealized Gain (Loss) on Investments | | | (131,451 | ) | | | 1,052,589 | | | | 1,079,517 | | | | (4,906,439 | ) | | | (183,496 | ) | | | (154,321 | ) | | | 281,213 | | | | (5,201,480 | ) |
| Net Increase (Decrease) in Net Assets from Operations | | $ | 854,217 | | | $ | 2,964,082 | | | $ | 2,001,571 | | | $ | (1,736,794 | ) | | $ | 143,079 | | | $ | 205,441 | | | $ | 1,689,465 | | | $ | 534,947 | |
1 See Note 14 for information on affiliated issuers.
2 See Note 5 for information on expense, including any waivers.
3 As of the close of business on February 6, 2023, outstanding Class B shares of the Madison Funds converted into Class A shares of each respective fund, and Class B shares of the Trust were terminated
See accompanying Notes to Financial Statements.
Madison Funds | October 31, 2023
Statements of Operations for the Year Ended October 31, 2023 - continued
| | | Covered Call & | | | | | | | | | | | | | | | | | | | |
| | | Equity
Income | | | Dividend
Income | | | Investors | | | Sustainable Equity | | | Mid Cap | | | Small Cap | | | International
Stock | |
| | | Fund | | | Fund | | | Fund | | | Fund | | | Fund | | | Fund | | | Fund | |
| Investment Income: | | | | | | | | | | | | | | | | | | | | | | | | | | | | |
| Interest | | $ | 2,503,335 | | | $ | 110,617 | $ | | | 431,669 | | | $ | 16,958 | $ | | | 1,999,626 | $ | | | 432,518 | | | $ | 10,404 | |
| Dividends | | | | | | | | | | | | | | | | | | | | | | | | | | | | |
| Unaffiliated issuers | | | 3,073,084 | | | | 8,033,189 | | | | 3,365,490 | | | | 136,646 | | | | 6,655,977 | | | | 1,247,409 | | | | 265,387 | |
| Less: Foreign taxes withheld/reclaimed | | | (18,975 | ) | | | 3,195 | | | | (38,072 | ) | | | (537 | ) | | | (33,462 | ) | | | (19,371 | ) | | | (24,306 | ) |
| Income from securities lending | | | 1,200 | | | | — | | | | 3,472 | | | | 42 | | | | 4,823 | | | | 2,726 | | | | 2,195 | |
| Total investment income | | | 5,558,644 | | | | 8,147,001 | | | | 3,762,559 | | | | 153,109 | | | | 8,626,964 | | | | 1,663,282 | | | | 253,680 | |
| Expenses:1 | | | | | | | | | | | | | | | | | | | | | | | | | | | | |
| Advisory agreement fees | | | 1,709,571 | | | | 1,814,581 | | | | 2,330,567 | | | | 61,364 | | | | 5,561,690 | | | | 1,592,625 | | | | 138,768 | |
| Administrative services agreement fees | | | 239,471 | | | | 440,973 | | | | 475,889 | | | | 8,859 | | | | 1,140,524 | | | | 344,367 | | | | 39,648 | |
| Trustee fees | | | 13,979 | | | | 23,051 | | | | 25,469 | | | | 723 | | | | 57,487 | | | | 14,605 | | | | 1,063 | |
| Distribution fees - Class B2 | | | — | | | | — | | | | — | | | | — | | | | 1,198 | | | | — | | | | 302 | |
| Distribution fees - Class C | | | 85,607 | | | | — | | | | — | | | | — | | | | — | | | | — | | | | — | |
| Shareholder service fees - Class A | | | 43,630 | | | | 133,998 | | | | 234,774 | | | | — | | | | 165,926 | | | | 8,618 | | | | 30,456 | |
| Shareholder service fees - Class B2 | | | — | | | | — | | | | — | | | | — | | | | 398 | | | | — | | | | 100 | |
| Shareholder service fees - Class C | | | 28,535 | | | | — | | | | — | | | | — | | | | — | | | | — | | | | — | |
| Other expenses | | | 6,237 | | | | 13,813 | | | | 13,787 | | | | 419 | | | | 31,280 | | | | 8,286 | | | | 571 | |
| Total expenses | | | 2,127,030 | | | | 2,426,416 | | | | 3,080,486 | | | | 71,365 | | | | 6,958,503 | | | | 1,968,501 | | | | 210,908 | |
| Net Investment Income (Loss) | | | 3,431,614 | | | | 5,720,585 | | | | 682,073 | | | | 81,744 | | | | 1,668,461 | | | | (305,219 | ) | | | 42,772 | |
| Net Realized and Unrealized Gain (loss) on Investments | | | | | | | | | | | | | | | | | | | | | | | | | | | | |
| Net realized gain (loss) on investments (including net realized gain (loss) on foreign currency related transactions) | | | | | | | | | | | | | | | | | | | | | | | | | | | | |
| Options purchased | | | (1,862,039 | ) | | | — | | | | — | | | | — | | | | — | | | | — | | | | — | |
| Options written | | | 11,919,338 | | | | — | | | | — | | | | — | | | | — | | | | — | | | | — | |
| Unaffiliated issuers | | | 4,127,408 | | | | 6,400,352 | | | | 27,794,677 | | | | (644,177 | ) | | | 11,986,430 | | | | (3,387,971 | ) | | | (564,244 | ) |
| Net change in unrealized appreciation (depreciation) on investments (including net unrealized appreciation (depreciation) on foreign currency related transactions) | | | | | | | | | | | | | | | | | | | | | | | | | | | | |
| Options written | | | 2,456,570 | | | | — | | | | — | | | | — | | | | — | | | | — | | | | — | |
| Unaffiliated issuers | | | (10,176,678 | ) | | | (22,005,237 | ) | | | 13,700,734 | | | | 1,011,443 | | | | 61,556,428 | | | | 1,964,433 | | | | 1,552,972 | |
| Affiliated Issuers1 | | | — | | | | — | | | | — | | | | — | | | | — | | | | — | | | | — | |
| Net Realized and Unrealized Gain (Loss) on Investments | | | 6,464,599 | | | | (15,604,885 | ) | | | 41,495,411 | | | | 367,266 | | | | 73,542,858 | | | | (1,423,538 | ) | | | 988,728 | |
| Net Increase (Decrease) in Net Assets from Operations | | $ | 9,896,213 | | | $ | (9,884,300 | ) | | $ | 42,177,484 | | | $ | 449,010 | | | $ | 75,211,319 | | | $ | (1,728,757 | ) | | $ | 1,031,500 | |
1 See Note 5 for information on expense.
2 As of the close of business on February 6, 2023, outstanding Class B shares of the Madison Funds converted into Class A shares of each respective fund, and Class B shares of the Trust were terminated.
See accompanying Notes to Financial Statements.
Madison Funds | October 31, 2023
Statements of Changes in Net Assets
| | | Conservative Allocation Fund | | | Moderate Allocation Fund | | | Aggressive Allocation Fund | |
| Year Ended October 31, | | 2023 | | | 2022 | | | 2023 | | | 2022 | | | 2023 | | | 2022 | |
| Net Assets at beginning of period | | $ | 50,698,246 | | | $ | 68,674,779 | | | $ | 102,432,212 | | | $ | 134,584,040 | | | $ | 53,196,313 | | | $ | 67,457,807 | |
| Increase (decrease) in net assets from operations: | | | | | | | | | | | | | | | | | | | | | | | | |
| Net investment income (loss) | | | 985,668 | | | | 1,046,490 | | | | 1,911,493 | | | | 2,921,677 | | | | 922,054 | | | | 1,723,030 | |
| Net realized gain (loss) | | | (960,426 | ) | | | (2,038,488 | ) | | | (177,877 | ) | | | (1,740,427 | ) | | | 295,395 | | | | (1,076,941 | ) |
| Net change in unrealized appreciation (depreciation) | | | 828,975 | | | | (8,727,716 | ) | | | 1,230,466 | | | | (20,097,682 | ) | | | 784,122 | | | | (10,639,076 | ) |
| Net increase (decrease) in net assets from operations | | | 854,217 | | | | (9,719,714 | ) | | | 2,964,082 | | | | (18,916,432 | ) | | | 2,001,571 | | | | (9,992,987 | ) |
| Distributions to shareholders from: | | | | | | | | | | | | | | | | | | | | | | | | |
| Accumulated earnings (combined net investment income and net realized gains): | | | | | | | | | | | | | | | | | | | | | | | | |
| Class A | | | (736,870 | ) | | | (2,896,934 | ) | | | (1,270,119 | ) | | | (9,265,098 | ) | | | (604,964 | ) | | | (5,578,440 | ) |
| Class B1 | | | (6,339 | ) | | | (124,933 | ) | | | (23,787 | ) | | | (461,958 | ) | | | (11,337 | ) | | | (293,779 | ) |
| Class C | | | (192,312 | ) | | | (1,086,716 | ) | | | (45,348 | ) | | | (630,540 | ) | | | (13,768 | ) | | | (267,464 | ) |
| Total distributions | | | (935,521 | ) | | | (4,108,583 | ) | | | (1,339,254 | ) | | | (10,357,596 | ) | | | (630,069 | ) | | | (6,139,683 | ) |
| Capital Stock transactions: | | | | | | | | | | | | | | | | | | | | | | | | |
| Class A Shares | | | | | | | | | | | | | | | | | | | | | | | | |
| Shares sold | | | 2,691,641 | | | | 3,553,577 | | | | 5,978,139 | | | | 5,228,672 | | | | 4,081,361 | | | | 2,746,022 | |
| Issued to shareholders in reinvestment of distributions | | | 735,740 | | | | 2,893,391 | | | | 1,266,452 | | | | 9,241,256 | | | | 604,612 | | | | 5,574,873 | |
| Shares redeemed | | | (7,898,219 | ) | | | (7,772,703 | ) | | | (16,061,858 | ) | | | (14,743,825 | ) | | | (5,979,015 | ) | | | (5,512,896 | ) |
| Net increase (decrease) from capital stock transactions | | | (4,470,838 | ) | | | (1,325,735 | ) | | | (8,817,267 | ) | | | (273,897 | ) | | | (1,293,042 | ) | | | 2,807,999 | |
| Class B Shares1 | | | | | | | | | | | | | | | | | | | | | | | | |
| Shares sold | | | – | | | | – | | | | 136 | | | | – | | | | – | | | | – | |
| Issued to shareholders in reinvestment of distributions | | | 6,339 | | | | 124,209 | | | | 23,787 | | | | 461,958 | | | | 11,337 | | | | 293,779 | |
| Shares redeemed | | | (1,363,629 | ) | | | (1,001,064 | ) | | | (3,694,652 | ) | | | (2,363,573 | ) | | | (2,050,380 | ) | | | (1,160,857 | ) |
| Net increase (decrease) from capital stock transactions | | | (1,357,290 | ) | | | (876,855 | ) | | | (3,670,729 | ) | | | (1,901,615 | ) | | | (2,039,043 | ) | | | (867,078 | ) |
| Class C Shares | | | | | | | | | | | | | | | | | | | | | | | | |
| Shares sold | | | 112,654 | | | | 148,454 | | | | 96,934 | | | | 198,048 | | | | 32,926 | | | | 58,419 | |
| Issued to shareholders in reinvestment of distributions | | | 192,312 | | | | 1,086,000 | | | | 45,348 | | | | 630,540 | | | | 13,768 | | | | 267,464 | |
| Shares redeemed | | | (2,025,622 | ) | | | (3,180,100 | ) | | | (975,105 | ) | | | (1,530,876 | ) | | | (437,784 | ) | | | (395,628 | ) |
| Net increase (decrease) from capital stock transactions | | | (1,720,656 | ) | | | (1,945,646 | ) | | | (832,823 | ) | | | (702,288 | ) | | | (391,090 | ) | | | (69,745 | ) |
| Total increase (decrease) from capital stock transactions | | | (7,548,784 | ) | | | (4,148,236 | ) | | | (13,320,819 | ) | | | (2,877,800 | ) | | | (3,723,175 | ) | | | 1,871,176 | |
| Total increase (decrease) in net assets | | | (7,630,088 | ) | | | (17,976,533 | ) | | | (11,695,991 | ) | | | (32,151,828 | ) | | | (2,351,673 | ) | | | (14,261,494 | ) |
| Net Assets at end of period | | $ | 43,068,158 | | | $ | 50,698,246 | | | $ | 90,736,221 | | | $ | 102,432,212 | | | $ | 50,844,640 | | | $ | 53,196,313 | |
| Capital Share transactions: | | | | | | | | | | | | | | | | | | | | | | | | |
| Class A Shares | | | | | | | | | | | | | | | | | | | | | | | | |
| Shares sold | | | 292,526 | | | | 347,177 | | | | 600,051 | | | | 487,941 | | | | 398,580 | | | | 247,936 | |
| Issued to shareholders in reinvestment of distributions | | | 80,928 | | | | 277,414 | | | | 131,239 | | | | 809,217 | | | | 61,134 | | | | 472,047 | |
| Shares redeemed | | | (862,523 | ) | | | (790,078 | ) | | | (1,612,376 | ) | | | (1,374,621 | ) | | | (584,751 | ) | | | (507,542 | ) |
| Net increase (decrease) from capital shares transactions | | | (489,069 | ) | | | (165,487 | ) | | | (881,086 | ) | | | (77,463 | ) | | | (125,037 | ) | | | 212,441 | |
| Class B Shares1 | | | | | | | | | | | | | | | | | | | | | | | | |
| Shares sold | | | – | | | | – | | | | 14 | | | | – | | | | – | | | | – | |
| Issued to shareholders in reinvestment of distributions | | | 693 | | | | 11,599 | | | | 2,480 | | | | 40,701 | | | | 1,189 | | | | 25,748 | |
| Shares redeemed | | | (145,166 | ) | | | (96,359 | ) | | | (373,956 | ) | | | (223,984 | ) | | | (207,173 | ) | | | (107,932 | ) |
| Net increase (decrease) from capital shares transactions | | | (144,473 | ) | | | (84,760 | ) | | | (371,462 | ) | | | (183,283 | ) | | | (205,984 | ) | | | (82,184 | ) |
| Class C Shares | | | | | | | | | | | | | | | | | | | | | | | | |
| Shares sold | | | 12,332 | | | | 14,568 | | | | 9,797 | | | | 18,435 | | | | 3,332 | | | | 5,478 | |
| Issued to shareholders in reinvestment of distributions | | | 20,796 | | | | 101,369 | | | | 4,724 | | | | 55,456 | | | | 1,442 | | | | 23,421 | |
| Shares redeemed | | | (217,351 | ) | | | (309,187 | ) | | | (98,599 | ) | | | (147,467 | ) | | | (44,006 | ) | | | (37,876 | ) |
| Net increase (decrease) in shares outstanding | | | (184,223 | ) | | | (193,250 | ) | | | (84,078 | ) | | | (73,576 | ) | | | (39,232 | ) | | | (8,977 | ) |
1 As of the close of business on February 6, 2023, outstanding Class B shares of the Madison Funds converted into Class A shares of each respective fund, and Class B shares of the Trust were terminated ..
See accompanying Notes to Financial Statements.
Madison Funds | October 31, 2023
Statements of Changes in Net Assets - continued
| | | Diversified Income Fund | | | Tax-Free Virginia Fund | | | Tax-Free National Fund | |
| | | 2023 | | | 2022 | | | 2023 | | | 2022 | | | 2023 | | | 2022 | |
| Year Ended October 31, | | | | | | | | | | | | | | | | | | |
| Net Assets at beginning of period | | $ | 161,841,486 | | | $ | 184,230,359 | | | $ | 17,745,739 | | | $ | 20,620,165 | | | $ | 17,620,800 | | | $ | 22,330,541 | |
| Increase (decrease) in net assets from operations: | | | | | | | | | | | | | | | | | | | | | | | | |
| Net investment income (loss) | | | 3,169,645 | | | | 2,637,620 | | | | 326,575 | | | | 319,039 | | | | 359,762 | | | | 330,070 | |
| Net realized gain (loss) | | | 16,701,621 | | | | 9,543,799 | | | | (3,104 | ) | | | (117,216 | ) | | | (23,159 | ) | | | 124,906 | |
| Net change in unrealized appreciation (depreciation) | | | (21,608,060 | ) | | | (26,835,849 | ) | | | (180,392 | ) | | | (2,252,119 | ) | | | (131,162 | ) | | | (2,209,896 | ) |
| Net increase (decrease) in net assets from operations | | | (1,736,794 | ) | | | (14,654,430 | ) | | | 143,079 | | | | (2,050,296 | ) | | | 205,441 | | | | (1,754,920 | ) |
| Distributions to shareholders from: | | | | | | | | | | | | | | | | | | | | | | | | |
| Accumulated earnings (combined net investment income and net realized gains): | | | | | | | | | | | | | | | | | | | | | | | | |
| Class A | | | (10,809,345 | ) | | | (17,995,280 | ) | | | | | | | | | | | | | | | | |
| Class B1 | | | (149,845 | ) | | | (509,475 | ) | | | | | | | | | | | | | | | | |
| Class C | | | (1,631,141 | ) | | | (2,359,561 | ) | | | | | | | | | | | | | | | | |
| Class Y | | | | | | | | | | | (325,626 | ) | | | (386,059 | ) | | | (484,508 | ) | | | (511,811 | ) |
| Class I2 | | | | | | | | | | | | | | | | | | | | | | | | |
| Class R63 | | | | | | | | | | | | | | | | | | | | | | | | |
| Total distributions | | | (12,590,331 | ) | | | (20,864,316 | ) | | | (325,626 | ) | | | (386,059 | ) | | | (484,508 | ) | | | (511,811 | ) |
| Capital Stock transactions: | | | | | | | | | | | | | | | | | | | | | | | | |
| Class A Shares | | | | | | | | | | | | | | | | | | | | | | | | |
| Shares sold | | | 6,374,140 | | | | 5,843,321 | | | | | | | | | | | | | | | | | |
| Issued to shareholders in reinvestment of distributions | | | 10,752,704 | | | | 17,918,652 | | | | | | | | | | | | | | | | | |
| Shares redeemed | | | (21,466,075 | ) | | | (15,332,901 | ) | | | | | | | | | | | | | | | | |
| Net increase (decrease) from capital stock transactions | | | (4,339,231 | ) | | | 8,429,072 | | | | | | | | | | | | | | | | | |
| Class B Shares1 | | | | | | | | | | | | | | | | | | | | | | | | |
| Shares sold | | | - | | | | 6,834 | | | | | | | | | | | | | | | | | |
| Issued to shareholders in reinvestment of distributions | | | 149,845 | | | | 509,475 | | | | | | | | | | | | | | | | | |
| Shares redeemed | | | (2,855,529 | ) | | | (2,044,670 | ) | | | | | | | | | | | | | | | | |
| Net increase (decrease) from capital stock transactions | | | (2,705,684 | ) | | | (1,528,361 | ) | | | | | | | | | | | | | | | | |
| Class C Shares | | | | | | | | | | | | | | | | | | | | | | | | |
| Shares sold | | | 1,398,950 | | | | 5,510,771 | | | | | | | | | | | | | | | | | |
| Issued to shareholders in reinvestment of distributions | | | 1,631,108 | | | | 2,359,561 | | | | | | | | | | | | | | | | | |
| Shares redeemed | | | (3,270,413 | ) | | | (1,641,170 | ) | | | | | | | | | | | | | | | | |
| Net increase (decrease) from capital stock transactions | | | (240,355 | ) | | | 6,229,162 | | | | | | | | | | | | | | | | | |
| Class Y Shares | | | | | | | | | | | | | | | | | | | | | | | | |
| Shares sold | | | | | | | | | | | 325,524 | | | | 1,026,139 | | | | 374,081 | | | | 121,515 | |
| Issued to shareholders in reinvestment of distributions | | | | | | | | | | | 314,288 | | | | 374,618 | | | | 439,238 | | | | 466,025 | |
| Shares redeemed | | | | | | | | | | | (1,627,919 | ) | | | (1,838,828 | ) | | | (1,040,722 | ) | | | (3,030,550 | ) |
| Net increase (decrease) from capital stock transactions | | | | | | | | | | | (988,107 | ) | | | (438,071 | ) | | | (227,403 | ) | | | (2,443,010 | ) |
| Class I Shares2 | | | | | | | | | | | | | | | | | | | | | | | | |
| Shares sold | | | | | | | | | | | | | | | | | | | | | | | | |
| Issued to shareholders in reinvestment of distributions | | | | | | | | | | | | | | | | | | | | | | | | |
| Shares redeemed | | | | | | | | | | | | | | | | | | | | | | | | |
| Net increase (decrease) from capital stock transactions | | | | | | | | | | | | | | | | | | | | | | | | |
| Class R6 Shares3 | | | | | | | | | | | | | | | | | | | | | | | | |
| Shares sold | | | | | | | | | | | | | | | | | | | | | | | | |
| Issued to shareholders in reinvestment of distributions | | | | | | | | | | | | | | | | | | | | | | | | |
| Shares redeemed | | | | | | | | | | | | | | | | | | | | | | | | |
| Net increase (decrease) from capital stock transactions | | | | | | | | | | | | | | | | | | | | | | | | |
| Total increase (decrease) from capital stock transactions | | | (7,285,270 | ) | | | 13,129,873 | | | | (988,107 | ) | | | (438,071 | ) | | | (227,403 | ) | | | (2,443,010 | ) |
| Total increase (decrease) in net assets | | | (21,612,395 | ) | | | (22,388,873 | ) | | | (1,170,654 | ) | | | (2,874,426 | ) | | | (506,470 | ) | | | (4,709,741 | ) |
| Net Assets at end of period | | $ | 140,229,091 | | | $ | 161,841,486 | | | $ | 16,575,085 | | | $ | 17,745,739 | | | $ | 17,114,330 | | | $ | 17,620,800 | |
| Capital Share transactions: | | | | | | | | | | | | | | | | | | | | | | | | |
| Class A Shares | | | | | | | | | | | | | | | | | | | | | | | | |
| Shares sold | | | 432,410 | | | | 356,241 | | | | | | | | | | | | | | | | | |
| Issued to shareholders in reinvestment of distributions | | | 740,491 | | | | 1,068,262 | | | | | | | | | | | | | | | | | |
| Shares redeemed | | | (1,483,158 | ) | | | (949,568 | ) | | | | | | | | | | | | | | | | |
| Net increase (decrease) from capital shares transactions | | | (310,257 | ) | | | 474,935 | | | | | | | | | | | | | | | | | |
| Class B Shares1 | | | | | | | | | | | | | | | | | | | | | | | | |
| Shares sold | | | – | | | | 407 | | | | | | | | | | | | | | | | | |
| Issued to shareholders in reinvestment of distributions | | | 10,174 | | | | 29,941 | | | | | | | | | | | | | | | | | |
| Shares redeemed | | | (190,334 | ) | | | (123,765 | ) | | | | | | | | | | | | | | | | |
| Net increase (decrease) from capital shares transactions | | | (180,160 | ) | | | (93,417 | ) | | | | | | | | | | | | | | | | |
See accompanying Notes to Financial Statements.
Madison Funds | October 31, 2023
Statements of Changes in Net Assets - continued
| | | Diversified Income Fund | | | Tax-Free Virginia Fund | | | Tax-Free National Fund | |
| | | 2023 | | | 2022 | | | 2023 | | | 2022 | | | 2023 | | | 2022 | |
| Class C Shares | | | | | | | | | | | | | | | | | | |
| Shares sold | | | 94,879 | | | | 322,310 | | | | | | | | | | | | | | | | | |
| Issued to shareholders in reinvestment of distributions | | | 111,138 | | | | 138,984 | | | | | | | | | | | | | | | | | |
| Shares redeemed | | | (225,141 | ) | | | (100,492 | ) | | | | | | | | | | | | | | | | |
| Net increase (decrease) in shares outstanding | | | (19,124 | ) | | | 360,802 | | | | | | | | | | | | | | | | | |
| Class Y Shares | | | | | | | | | | | | | | | | | | | | | | | | |
| Shares sold | | | | | | | | | | | 30,434 | | | | 91,964 | | | | 37,538 | | | | 11,444 | |
| Issued to shareholders in reinvestment of distributions | | | | | | | | | | | 29,576 | | | | 33,715 | | | | 44,095 | | | | 44,347 | |
| Shares redeemed | | | | | | | | | | | (152,845 | ) | | | (169,466 | ) | | | (104,332 | ) | | | (278,618 | ) |
| Net increase (decrease) in shares outstanding | | | | | | | | | | | (92,835 | ) | | | (43,787 | ) | | | (22,699 | ) | | | (222,827 | ) |
| Class I Shares2 | | | | | | | | | | | | | | | | | | | | | | | | |
| Shares sold | | | | | | | | | | | | | | | | | | | | | | | | |
| Issued to shareholders in reinvestment of distributions | | | | | | | | | | | | | | | | | | | | | | | | |
| Shares redeemed | | | | | | | | | | | | | | | | | | | | | | | | |
| Net increase (decrease) in shares outstanding | | | | | | | | | | | | | | | | | | | | | | | | |
| Class R6 Shares3 | | | | | | | | | | | | | | | | | | | | | | | | |
| Shares sold | | | | | | | | | | | | | | | | | | | | | | | | |
| Issued to shareholders in reinvestment of distributions | | | | | | | | | | | | | | | | | | | | | | | | |
| Shares redeemed | | | | | | | | | | | | | | | | | | | | | | | | |
| Net increase (decrease) in shares outstanding | | | | | | | | | | | | | | | | | | | | | | | | |
1 As of the close of business on February 6, 2023, outstanding Class B shares of the Madison Funds converted into Class A shares of each respective fund, and Class B shares of the Trust were terminated.
See accompanying Notes to Financial Statements.
Madison Funds | October 31, 2023
Statements of Changes in Net Assets - continued
| | | High Quality Bond Fund | | | Core Bond Fund | | | Covered Call & Equity Income Fund | |
| | | 2023 | | | 2022 | | | 2023 | | | 2022 | | | 2023 | | | 2022 | |
| Year Ended October 31, | | | | | | | | | | | | | | | | | | |
| Net Assets at beginning of period | | $ | 76,785,728 | | | $ | 115,682,091 | | | $ | 179,795,322 | | | $ | 188,561,966 | | | $ | 135,198,709 | | | $ | 90,673,553 | |
| Increase (decrease) in net assets from operations: | | | | | | | | | | | | | | | | | | | | | | | | |
| Net investment income (loss) | | | 1,408,252 | | | | 1,007,456 | | | | 5,736,427 | | | | 3,430,538 | | | | 3,431,614 | | | | 784,696 | |
| Net realized gain (loss) | | | (3,293,011 | ) | | | (1,222,043 | ) | | | (5,671,173 | ) | | | (1,427,445 | ) | | | 14,184,707 | | | | 8,056,553 | |
| Net change in unrealized appreciation (depreciation) | | | 3,574,224 | | | | (8,236,007 | ) | | | 469,693 | | | | (32,166,556 | ) | | | (7,720,108 | ) | | | (5,670,872 | ) |
| Net increase (decrease) in net assets from operations | | | 1,689,465 | | | | (8,450,594 | ) | | | 534,947 | | | | (30,163,463 | ) | | | 9,896,213 | | | | 3,170,377 | |
| Distributions to shareholders from: | | | | | | | | | | | | | | | | | | | | | | | | |
| Accumulated earnings (combined net investment income and net realized gains): | | | | | | | | | | | | | | | | | | | | | | | | |
| Class A | | | | | | | | | | | (853,260 | ) | | | (811,781 | ) | | | (1,205,998 | ) | | | (956,245 | ) |
| Class B1 | | | | | | | | | | | (881 | ) | | | (5,399 | ) | | | | | | | | |
| Class C | | | | | | | | | | | | | | | | | | | (856,454 | ) | | | (604,419 | ) |
| Class Y | | | (1,097,908 | ) | | | (1,548,617 | ) | | | (204,780 | ) | | | (203,820 | ) | | | (3,295,749 | ) | | | (4,920,548 | ) |
| Class I2 | | | (281,440 | ) | | | (48,210 | ) | | | (1,643,723 | ) | | | (2,094,211 | ) | | | (7,834,925 | ) | | | (374,635 | ) |
| Class R63 | | | | | | | | | | | (3,046,353 | ) | | | (1,495,620 | ) | | | (95,856 | ) | | | (38,689 | ) |
| Total distributions | | | (1,379,348 | ) | | | (1,596,827 | ) | | | (5,748,997 | ) | | | (4,610,831 | ) | | | (13,288,982 | ) | | | (6,894,536 | ) |
| Capital Stock transactions: | | | | | | | | | | | | | | | | | | | | | | | | |
| Class A Shares | | | | | | | | | | | | | | | | | | | | | | | | |
| Shares sold | | | | | | | | | | | 860,171 | | | | 1,547,576 | | | | 7,536,257 | | | | 1,383,461 | |
| Issued to shareholders in reinvestment of distributions | | | | | | | | | | | 842,123 | | | | 802,544 | | | | 1,157,932 | | | | 909,181 | |
| Shares redeemed | | | | | | | | | | | (4,533,685 | ) | | | (5,732,779 | ) | | | (1,757,531 | ) | | | (2,447,952 | ) |
| Net increase (decrease) from capital stock transactions | | | | | | | | | | | (2,831,391 | ) | | | (3,382,659 | ) | | | 6,936,658 | | | | (155,310 | ) |
| Class B Shares1 | | | | | | | | | | | | | | | | | | | | | | | | |
| Shares sold | | | | | | | | | | | | | | | | | | | | | | | | |
| Issued to shareholders in reinvestment of distributions | | | | | | | | | | | 881 | | | | 5,399 | | | | | | | | | |
| Shares redeemed | | | | | | | | | | | (259,260 | ) | �� | | (199,292 | ) | | | | | | | | |
| Net increase (decrease) from capital stock transactions | | | | | | | | | | | (258,379 | ) | | | (193,893 | ) | | | | | | | | |
| Class C Shares | | | | | | | | | | | | | | | | | | | | | | | | |
| Shares sold | | | | | | | | | | | | | | | | | | | 6,790,275 | | | | 1,200,319 | |
| Issued to shareholders in reinvestment of distributions | | | | | | | | | | | | | | | | | | | 799,693 | | | | 564,331 | |
| Shares redeemed | | | | | | | | | | | | | | | | | | | (1,410,491 | ) | | | (1,269,549 | ) |
| Net increase (decrease) from capital stock transactions | | | | | | | | | | | | | | | | | | | 6,179,477 | | | | 495,101 | |
| Class Y Shares | | | | | | | | | | | | | | | | | | | | | | | | |
| Shares sold | | | 21,404,374 | | | | 12,678,510 | | | | 872,042 | | | | 1,603,451 | | | | 39,743,118 | | | | 51,694,990 | |
| Issued to shareholders in reinvestment of distributions | | | 1,018,024 | | | | 1,462,216 | | | | 175,012 | | | | 175,815 | | | | 3,138,173 | | | | 4,897,158 | |
| Shares redeemed | | | (41,974,703 | ) | | | (58,547,690 | ) | | | (1,362,413 | ) | | | (4,060,800 | ) | | | (22,010,147 | ) | | | (81,897,013 | ) |
| Net increase (decrease) from capital stock transactions | | | (19,552,305 | ) | | | (44,406,964 | ) | | | (315,359 | ) | | | (2,281,534 | ) | | | 20,871,144 | | | | (25,304,865 | ) |
| Class I Shares2 | | | | | | | | | | | | | | | | | | | | | | | | |
| Shares sold | | | 7,778,965 | | | | 16,591,606 | | | | 17,483,106 | | | | 41,315,224 | | | | 112,619,189 | | | | 74,565,269 | |
| Issued to shareholders in reinvestment of distributions | | | 281,440 | | | | 48,210 | | | | 1,552,119 | | | | 842,112 | | | | 7,834,876 | | | | 374,635 | |
| Shares redeemed | | | (12,048,541 | ) | | | (1,081,794 | ) | | | (10,489,552 | ) | | | (116,800,578 | ) | | | (42,367,448 | ) | | | (1,962,558 | ) |
| Net increase (decrease) from capital stock transactions | | | (3,988,136 | ) | | | 15,558,022 | | | | 8,545,673 | | | | (74,643,242 | ) | | | 78,086,617 | | | | 72,977,346 | |
| Class R6 Shares3 | | | | | | | | | | | | | | | | | | | | | | | | |
| Shares sold | | | | | | | | | | | 2,484,193 | | | | 106,822,028 | | | | 2,082,426 | | | | 778,390 | |
| Issued to shareholders in reinvestment of distributions | | | | | | | | | | | 77,433 | | | | 359,960 | | | | 95,856 | | | | 38,689 | |
| Shares redeemed | | | | | | | | | | | (697,905 | ) | | | (673,010 | ) | | | (1,769,688 | ) | | | (580,036 | ) |
| Net increase (decrease) from capital stock transactions | | | | | | | | | | | 1,863,721 | | | | 106,508,978 | | | | 408,594 | | | | 237,043 | |
| Total increase (decrease) from capital stock transactions | | | (23,540,441 | ) | | | (28,848,942 | ) | | | 7,004,265 | | | | 26,007,650 | | | | 112,482,490 | | | | 48,249,315 | |
| Total increase (decrease) in net assets | | | (23,230,324 | ) | | | (38,896,363 | ) | | | 1,790,215 | | | | (8,766,644 | ) | | | 109,089,721 | | | | 44,525,156 | |
| Net Assets at end of period | | $ | 53,555,404 | $ | | | 76,785,728 | $ | | | 181,585,537 | | | $ | 179,795,322 | | | $ | 244,288,430 | | | $ | 135,198,709 | |
| Capital Share transactions: | | | | | | | | | | | | | | | | | | | | | | | | |
| Class A Shares | | | | | | | | | | | | | | | | | | | | | | | | |
| Shares sold | | | | | | | | | | | 95,994 | | | | 155,132 | | | | 785,843 | | | | 148,304 | |
| Issued to shareholders in reinvestment of distributions | | | | | | | | | | | 94,974 | | | | 82,985 | | | | 123,785 | | | | 99,627 | |
| Shares redeemed | | | | | | | | | | | (510,519 | ) | | | (594,846 | ) | | | (184,664 | ) | | | (262,224 | ) |
| Net increase (decrease) from capital shares transactions | | | | | | | | | | | (319,551 | ) | | | (356,729 | ) | | | 724,964 | | | | (14,293 | ) |
| Class B Shares1 | | | | | | | | | | | | | | | | | | | | | | | | |
| Shares sold | | | | | | | | | | | | | | | | | | | | | | | | |
| Issued to shareholders in reinvestment of distributions | | | | | | | | | | | 98 | | | | 548 | | | | | | | | | |
| Shares redeemed | | | | | | | | | | | (28,766 | ) | | | (20,730 | ) | | | | | | | | |
| Net increase (decrease) from capital shares transactions | | | | | | | | | | | (28,668 | ) | | | (20,182 | ) | | | | | | | | |
See accompanying Notes to Financial Statements.
Madison Funds | October 31, 2023
Statements of Changes in Net Assets - continued
| | | High Quality Bond Fund | | | Core Bond Fund | | | Covered Call & Equity Income Fund | |
| | | 2023 | | | 2022 | | | 2023 | | | 2022 | | | 2023 | | | 2022 | |
| Class C Shares | | | | | | | | | | | | | | | | | | |
| Shares sold | | | | | | | | | | | | | | | | | | | 801,083 | | | | 142,295 | |
| Issued to shareholders in reinvestment of distributions | | | | | | | | | | | | | | | | | | | 95,617 | | | | 68,398 | |
| Shares redeemed | | | | | | | | | | | | | | | | | | | (166,623 | ) | | | (152,399 | ) |
| Net increase (decrease) in shares outstanding | | | | | | | | | | | | | | | | | | | 730,077 | | | | 58,294 | |
| Class Y Shares | | | | | | | | | | | | | | | | | | | | | | | | |
| Shares sold | | | 2,092,042 | | | | 1,188,647 | | | | 98,288 | | | | 161,349 | | | | 3,990,393 | | | | 5,324,240 | |
| Issued to shareholders in reinvestment of distributions | | | 100,447 | | | | 136,655 | | | | 19,853 | | | | 18,215 | | | | 321,091 | | | | 518,816 | |
| Shares redeemed | | | (4,135,130 | ) | | | (5,524,145 | ) | | | (153,024 | ) | | | (408,905 | ) | | | (2,214,734 | ) | | | (8,712,400 | ) |
| Net increase (decrease) in shares outstanding | | | (1,942,641 | ) | | | (4,198,843 | ) | | | (34,883 | ) | | | (229,341 | ) | | | 2,096,750 | | | | (2,869,344 | ) |
| Class I Shares2 | | | | | | | | | | | | | | | | | | | | | | | | |
| Shares sold | | | 762,039 | | | | 1,600,987 | | | | 1,965,156 | | | | 4,414,200 | | | | 11,337,708 | | | | 8,014,034 | |
| Issued to shareholders in reinvestment of distributions | | | 27,560 | | | | 4,751 | | | | 176,906 | | | | 89,031 | | | | 800,066 | | | | 42,128 | |
| Shares redeemed | | | (1,170,901 | ) | | | (105,519 | ) | | | (1,191,201 | ) | | | (12,041,206 | ) | | | (4,281,364 | ) | | | (214,092 | ) |
| Net increase (decrease) in shares outstanding | | | (381,302 | ) | | | 1,500,219 | | | | 950,861 | | | | (7,537,975 | ) | | | 7,856,410 | | | | 7,842,070 | |
| Class R6 Shares3 | | | | | | | | | | | | | | | | | | | | | | | | |
| Shares sold | | | | | | | | | | | 281,358 | | | | 10,977,262 | | | | 204,420 | | | | 79,952 | |
| Issued to shareholders in reinvestment of distributions | | | | | | | | | | | 8,825 | | | | 38,148 | | | | 9,567 | | | | 4,021 | |
| Shares redeemed | | | | | | | | | | | (81,600 | ) | | | (72,734 | ) | | | (172,387 | ) | | | (59,161 | ) |
| Net increase (decrease) in shares outstanding | | | | | | | | | | | 208,583 | | | | 10,942,676 | | | | 41,600 | | | | 24,812 | |
1 As of the close of business on February 6, 2023, outstanding Class B shares of the Madison Funds converted into Class A shares of each respective fund, and Class B shares of the Trust were terminated.
2 The High Quality Bond Fund and the Covered Call & Equity Fund Class I shares commenced operations effective March 1, 2022.
3 The Core Bond Fund Class R6 shares commenced operations effective March 1, 2022.
See accompanying Notes to Financial Statements.
Madison Funds | October 31, 2023
Statements of Changes in Net Assets - continued
| | | Dividend Income Fund | | | Investors Fund | | | Sustainable Equity | |
| | | 2023 | | | 2022 | | | 2023 | | | 2022 | | | 2023 | | | 20221 | |
| Year Ended October 31, | | | | | | | | | | | | | | | | | | |
| Net Assets at beginning of period | | | 301,287,528 | | | | 323,218,081 | | | | 300,404,105 | | | | 409,629,139 | | | | 9,279,877 | | | | – | |
| Increase (decrease) in net assets from operations: | | | | | | | | | | | | | | | | | | | | | | | | |
| Net investment income (loss) | | | 5,720,585 | | | | 5,732,136 | | | | 682,073 | | | | 694,069 | | | | 81,744 | | | | 36,333 | |
| Net realized gain (loss) | | | 6,400,352 | | | | 20,856,681 | | | | 27,794,677 | | | | 17,929,737 | | | | (644,177 | ) | | | (200,624 | ) |
| Net change in unrealized appreciation (depreciation) | | | (22,005,237 | ) | | | (38,239,764 | ) | | | 13,700,734 | | | | (59,414,605 | ) | | | 1,011,443 | | | | (927,305 | ) |
| Net increase (decrease) in net assets from operations | | | (9,884,300 | ) | | | (11,650,947 | ) | | | 42,177,484 | | | | (40,790,799 | ) | | | 449,010 | | | | (1,091,596 | ) |
| Distributions to shareholders from: | | | | | | | | | | | | | | | | | | | | | | | | |
| Accumulated earnings (combined net investment income and net realized gains): | | | | | | | | | | | | | | | | | | | | | | | | |
| Class A | | | (4,905,579 | ) | | | (6,667,407 | ) | | | (5,361,415 | ) | | | (7,952,408 | ) | | | | | | | | |
| Class Y | | | (14,496,468 | ) | | | (20,557,682 | ) | | | (5,634,351 | ) | | | (8,508,606 | ) | | | (384 | ) | | | – | |
| Class I | | | (5,077,817 | ) | | | (7,455,004 | ) | | | (4,540,678 | ) | | | (8,192,065 | ) | | | (52,927 | ) | | | – | |
| Class R62 | | | (1,744,781 | ) | | | (338,133 | ) | | | (3,481,988 | ) | | | (6,338,361 | ) | | | | | | | | |
| Total distributions | | | (26,224,645 | ) | | | (35,018,226 | ) | | | (19,018,432 | ) | | | (30,991,440 | ) | | | (53,311 | ) | | | | |
| Capital Stock transactions: | | | | | | | | | | | | | | | | | | | | | | | | |
| Class A Shares | | | | | | | | | | | | | | | | | | | | | | | | |
| Shares sold | | | 816,977 | | | | 1,353,503 | | | | 2,476,334 | | | | 2,304,397 | | | | | | | | | |
| Issued to shareholders in reinvestment of distributions | | | 4,891,167 | | | | 6,648,315 | | | | 5,343,628 | | | | 7,929,632 | | | | | | | | | |
| Shares redeemed | | | (5,326,138 | ) | | | (5,685,683 | ) | | | (8,996,900 | ) | | | (10,848,230 | ) | | | | | | | | |
| Net increase (decrease) from capital stock transactions | | | 382,006 | | | | 2,316,135 | | | | (1,176,938 | ) | | | (614,201 | ) | | | | | | | | |
| Class Y Shares | | | | | | | | | | | | | | | | | | | | | | | | |
| Shares sold | | | 25,609,814 | | | | 67,297,042 | | | | 12,043,076 | | | | 11,979,387 | | | | 26,518 | | | | 751,690 | |
| Issued to shareholders in reinvestment of distributions | | | 14,302,840 | | | | 20,231,086 | | | | 5,142,831 | | | | 7,809,980 | | | | 384 | | | | – | |
| Shares redeemed | | | (88,386,379 | ) | | | (83,610,162 | ) | | | (15,655,943 | ) | | | (22,273,113 | ) | | | (11,906 | ) | | | (651,589 | ) |
| Net increase (decrease) from capital stock transactions | | | (48,473,725 | ) | | | 3,917,966 | | | | 1,529,964 | | | | (2,483,746 | ) | | | 14,996 | | | | 100,101 | |
| Class I Shares | | | | | | | | | | | | | | | | | | | | | | | | |
| Shares sold | | | 14,973,132 | | | | 40,881,645 | | | | 34,212,763 | | | | 22,998,164 | | | | 884,322 | | | | 10,624,016 | |
| Issued to shareholders in reinvestment of distributions | | | 5,025,920 | | | | 7,378,193 | | | | 4,415,273 | | | | 8,192,065 | | | | 52,927 | | | | – | |
| Shares redeemed | | | (33,903,332 | ) | | | (50,753,760 | ) | | | (36,386,959 | ) | | | (44,840,267 | ) | | | (2,569,149 | ) | | | (352,644 | ) |
| Net increase (decrease) from capital stock transactions | | | (13,904,280 | ) | | | (2,493,922 | ) | | | 2,241,077 | | | | (13,650,038 | ) | | | (1,631,900 | ) | | | 10,271,372 | |
| Class R6 Shares | | | | | | | | | | | | | | | | | | | | | | | | |
| Shares sold | | | 1,257,714 | | | | 31,254,703 | | | | 4,625,714 | | | | 4,409,527 | | | | | | | | | |
| Issued to shareholders in reinvestment of distributions | | | 215,685 | | | | 247,345 | | | | 3,481,988 | | | | 6,338,361 | | | | | | | | | |
| Shares redeemed | | | (7,135,482 | ) | | | (10,503,607 | ) | | | (1,013,584 | ) | | | (31,442,698 | ) | | | | | | | | |
| Net increase (decrease) from capital stock transactions | | | (5,662,083 | ) | | | 20,998,441 | | | | 7,094,118 | | | | (20,694,810 | ) | | | | | | | | |
| Total increase (decrease) from capital stock transactions | | | (67,658,082 | ) | | | 24,738,620 | | | | 9,688,221 | | | | (37,442,795 | ) | | | (1,616,904 | ) | | | 10,371,473 | |
| Total increase (decrease) in net assets | | | (103,767,027 | ) | | | (21,930,553 | ) | | | 32,847,273 | | | | (109,225,034 | ) | | | (1,221,205 | ) | | | 9,279,877 | |
| Net Assets at end of period | | | 197,520,501 | | | | 301,287,528 | | | | 333,251,378 | | | | 300,404,105 | | | | 8,058,672 | | | | 9,279,877 | |
| Capital Share transactions: | | | | | | | | | | | | | | | | | | | | | | | | |
| Class A Shares | | | | | | | | | | | | | | | | | | | | | | | | |
| Shares sold | | | 29,520 | | | | 43,919 | | | | 99,522 | | | | 90,971 | | | | | | | | | |
| Issued to shareholders in reinvestment of distributions | | | 176,849 | | | | 210,630 | | | | 236,026 | | | | 284,624 | | | | | | | | | |
| Shares redeemed | | | (192,547 | ) | | | (182,749 | ) | | | (362,389 | ) | | | (420,299 | ) | | | | | | | | |
| Net increase (decrease) from capital shares transactions | | | 13,822 | | | | 71,800 | | | | (26,841 | ) | | | (44,704 | ) | | | | | | | | |
| Class Y Shares | | | | | | | | | | | | | | | | | | | | | | | | |
| Shares sold | | | 915,937 | | | | 2,212,227 | | | | 479,994 | | | | 454,793 | | | | 3,005 | | | | 75,171 | |
| Issued to shareholders in reinvestment of distributions | | | 516,631 | | | | 640,928 | | | | 226,856 | | | | 280,028 | | | | 47 | | | | – | |
| Shares redeemed | | | (3,223,770 | ) | | | (2,693,339 | ) | | | (633,711 | ) | | | (863,903 | ) | | | (1,327 | ) | | | (65,159 | ) |
| Net increase (decrease) in shares outstanding | | | (1,791,202 | ) | | | 159,816 | | | | 73,139 | | | | (129,082 | ) | | | 1,725 | | | | 10,012 | |
| Class I Shares | | | | | | | | | | | | | | | | | | | | | | | | |
| Shares sold | | | 536,676 | | | | 1,306,452 | | | | 1,384,747 | | | | 912,090 | | | | 103,844 | | | | 1,160,479 | |
| Issued to shareholders in reinvestment of distributions | | | 181,712 | | | | 234,132 | | | | 195,626 | | | | 294,679 | | | | 6,478 | | | | – | |
| Shares redeemed | | | (1,229,444 | ) | | | (1,608,639 | ) | | | (1,440,455 | ) | | | (1,808,445 | ) | | | (302,734 | ) | | | (41,621 | ) |
| Net increase (decrease) in shares outstanding | | | (511,056 | ) | | | (68,055 | ) | | | 139,918 | | | | (601,676 | ) | | | (192,412 | ) | | | 1,118,858 | |
| Class R6 Shares | | | | | | | | | | | | | | | | | | | | | | | | |
| Shares sold | | | 46,642 | | | | 1,012,123 | | | | 182,271 | | | | 180,272 | | | | | | | | | |
| Issued to shareholders in reinvestment of distributions | | | 7,815 | | | | 8,194 | | | | 152,585 | | | | 225,404 | | | | | | | | | |
| Shares redeemed | | | (263,169 | ) | | | (351,693 | ) | | | (41,854 | ) | | | (1,181,769 | ) | | | | | | | | |
| Net increase (decrease) in shares outstanding | | | (208,712 | ) | | | 668,624 | | | | 293,002 | | | | (776,093 | ) | | | | | | | | |
1 The Sustainable Equity Fund was launched on December 31, 2021, with Class Y and Class I shares commencing operations effective January 3, 2022.
2 The Dividend Income Fund Class R6 shares commenced operations effective March 1, 2022.
See accompanying Notes to Financial Statements.
Madison Funds | October 31, 2023
Statements of Changes in Net Assets - continued
| | | Mid Cap Fund | | | Small Cap Fund | | | International Stock Fund | |
| | | 2023 | | | 2022 | | | 2023 | | | 2022 | | | 2023 | | | 2022 | |
| Year Ended October 31, | | | | | | | | | | | | | | | | | | |
| Net Assets at beginning of period | | | 681,139,846 | | | | 733,809,804 | | | | 183,678,969 | | | | 280,340,485 | | | | 11,700,503 | | | | 17,610,653 | |
| Increase (decrease) in net assets from operations: | | | | | | | | | | | | | | | | | | | | | | | | |
| Net investment income (loss) | | | 1,668,461 | | | | (859,725 | ) | | | (305,219 | ) | | | (589,131 | ) | | | 42,772 | | | | 43,445 | |
| Net realized gain (loss) | | | 11,986,430 | | | | 13,753,629 | | | | (3,387,971 | ) | | | 9,386,807 | | | | (564,244 | ) | | | (576,040 | ) |
| Net change in unrealized appreciation (depreciation) | | | 61,556,428 | | | | (87,607,703 | ) | | | 1,964,433 | | | | (70,026,964 | ) | | | 1,552,972 | | | | (3,912,758 | ) |
| Net increase (decrease) in net assets from operations | | | 75,211,319 | | | | (74,713,799 | ) | | | (1,728,757 | ) | | | (61,229,288 | ) | | | 1,031,500 | | | | (4,445,353 | ) |
| Distributions to shareholders from: | | | | | | | | | | | | | | | | | | | | | | | | |
| Accumulated earnings (combined net investment income and net realized gains): | | | | | | | | | | | | | | | | | | | | | | | | |
| Class A | | | (1,324,553 | ) | | | (3,577,154 | ) | | | (179,025 | ) | | | (1,075,866 | ) | | | (32,805 | ) | | | (4,272,257 | ) |
| Class B1 | | | (15,919 | ) | | | (68,390 | ) | | | | | | | | | | | — | | | | (91,028 | ) |
| Class Y | | | (4,921,978 | ) | | | (11,660,270 | ) | | | (8,397,631 | ) | | | (55,515,240 | ) | | | (3,683 | ) | | | (243,016 | ) |
| Class I | | | (5,343,152 | ) | | | (12,986,283 | ) | | | (665,129 | ) | | | (4,955,880 | ) | | | | | | | | |
| Class R652 | | | (1,689,800 | ) | | | (4,870,186 | ) | | | (8,456 | ) | | | — | | | | | | | | | |
| Total distributions | | | (13,295,402 | ) | | | (33,162,283 | ) | | | (9,250,241 | ) | | | (61,546,986 | ) | | | (36,488 | ) | | | (4,606,301 | ) |
| Capital Stock transactions: | | | | | | | | | | | | | | | | | | | | | | | | |
| Class A Shares | | | | | | | | | | | | | | | | | | | | | | | | |
| Shares sold | | | 4,506,231 | | | | 10,602,851 | | | | 279,082 | | | | 258,742 | | | | 456,429 | | | | 424,828 | |
| Issued to shareholders in reinvestment of distributions | | | 1,320,827 | | | | 3,562,690 | | | | 178,626 | | | | 1,073,140 | | | | 32,705 | | | | 4,263,291 | |
| Shares redeemed | | | (7,862,784 | ) | | | (15,290,783 | ) | | | (353,439 | ) | | | (593,902 | ) | | | (1,195,120 | ) | | | (1,761,058 | ) |
| Net increase (decrease) from capital stock transactions | | | (2,035,726 | ) | | | (1,125,242 | ) | | | 104,269 | | | | 737,980 | | | | (705,986 | ) | | | 2,927,061 | |
| Class B Shares1 | | | | | | | | | | | | | | | | | | | | | | | | |
| Shares sold | | | | | | | 1,125 | | | | | | | | | | | | | | | | | |
| Issued to shareholders in reinvestment of distributions | | | 15,919 | | | | 68,390 | | | | | | | | | | | | | | | | | |
| Shares redeemed | | | (659,890 | ) | | | (468,073 | ) | | | | | | | | | | | (164,756 | ) | | | (135,525 | ) |
| Net increase (decrease) from capital stock transactions | | | (643,971 | ) | | | (398,558 | ) | | | | | | | | | | | (164,756 | ) | | | (44,497 | ) |
| Class Y Shares | | | | | | | | | | | | | | | | | | | | | | | | |
| Shares sold | | | 53,812,846 | | | | 66,622,409 | | | | 3,613,982 | | | | 7,861,874 | | | | 171,894 | | | | 89,662 | |
| Issued to shareholders in reinvestment of distributions | | | 4,842,873 | | | | 11,403,175 | | | | 8,224,379 | | | | 54,219,458 | | | | 3,683 | | | | 243,016 | |
| Shares redeemed | | | (72,929,799 | ) | | | (50,798,380 | ) | | | (24,644,757 | ) | | | (38,826,238 | ) | | | (251,657 | ) | | | (73,738 | ) |
| Net increase (decrease) from capital stock transactions | | | (14,274,080 | ) | | | 27,227,204 | | | | (12,806,396 | ) | | | 23,255,094 | | | | (76,080 | ) | | | 258,940 | |
| Class I Shares | | | | | | | | | | | | | | | | | | | | | | | | |
| Shares sold | | | 143,126,817 | | | | 101,753,752 | | | | 3,109,982 | | | | 6,826,690 | | | | | | | | | |
| Issued to shareholders in reinvestment of distributions | | | 5,228,821 | | | | 12,839,515 | | | | 665,129 | | | | 4,955,880 | | | | | | | | | |
| Shares redeemed | | | (73,959,042 | ) | | | (82,754,329 | ) | | | (4,836,229 | ) | | | (9,830,152 | ) | | | | | | | | |
| Net increase (decrease) from capital stock transactions | | | 74,396,596 | | | | 31,838,938 | | | | (1,061,118 | ) | | | 1,952,418 | | | | | | | | | |
| Class R6 Shares2 | | | | | | | | | | | | | | | | | | | | | | | | |
| Shares sold | | | 47,379,398 | | | | 20,457,282 | | | | 76,246 | | | | 188,005 | | | | | | | | | |
| Issued to shareholders in reinvestment of distributions | | | 598,094 | | | | 1,715,908 | | | | 8,456 | | | | | | | | | | | | | |
| Shares redeemed | | | (30,297,335 | ) | | | (24,509,408 | ) | | | (9,386 | ) | | | (18,739 | ) | | | | | | | | |
| Net increase (decrease) from capital stock transactions | | | 17,680,157 | | | | (2,336,218 | ) | | | 75,316 | | | | 169,266 | | | | | | | | | |
| Total increase (decrease) from capital stock transactions | | | 75,122,976 | | | | 55,206,124 | | | | (13,687,929 | ) | | | 26,114,758 | | | | (946,822 | ) | | | 3,141,504 | |
| Total increase (decrease) in net assets | | | 137,038,893 | | | | (52,669,958 | ) | | | (24,666,927 | ) | | | (96,661,516 | ) | | | 48,190 | | | | (5,910,150 | ) |
| Net Assets at end of period | | | 818,178,739 | | | | 681,139,846 | | | | 159,012,042 | | | | 183,678,969 | | | | 11,748,693 | | | | 11,700,503 | |
| Capital Share transactions: | | | | | | | | | | | | | | | | | | | | | | | | |
| Class A Shares | | | | | | | | | | | | | | | | | | | | | | | | |
| Shares sold | | | 358,810 | | | | 853,186 | | | | 30,058 | | | | 24,838 | | | | 52,969 | | | | 48,354 | |
| Issued to shareholders in reinvestment of distributions | | | 113,669 | | | | 259,293 | | | | 20,771 | | | | 88,543 | | | | 4,093 | | | | 433,261 | |
| Shares redeemed | | | (632,007 | ) | | | (1,286,440 | ) | | | (38,672 | ) | | | (54,458 | ) | | | (141,569 | ) | | | (194,563 | ) |
| Net increase (decrease) from capital shares transactions | | | (159,528 | ) | | | (173,961 | ) | | | 12,157 | | | | 58,923 | | | | (84,507 | ) | | | 287,052 | |
| Class B Shares1 | | | | | | | | | | | | | | | | | | | | | | | | |
| Shares sold | | | — | | | | 121 | | | | | | | | | | | | | | | | | |
| Issued to shareholders in reinvestment of distributions | | | 1,836 | | | | 6,576 | | | | | | | | | | | | | | | | | |
| Shares redeemed | | | (70,692 | ) | | | (50,037 | ) | | | | | | | | | | | (19,908 | ) | | | (16,156 | ) |
| Net increase (decrease) from capital shares transactions | | | (68,856 | ) | | | (43,340 | ) | | | | | | | | | | | (19,908 | ) | | | (6,493 | ) |
| Class Y Shares | | | | | | | | | | | | | | | | | | | | | | | | |
| Shares sold | | | 3,986,513 | | | | 5,111,948 | | | | 384,098 | | | | 682,696 | | | | 20,175 | | | | 10,411 | |
| Issued to shareholders in reinvestment of distributions | | | 386,194 | | | | 773,621 | | | | 942,082 | | | | 4,422,468 | | | | 465 | | | | 24,950 | |
| Shares redeemed | | | (5,533,876 | ) | | | (3,784,461 | ) | | | (2,614,987 | ) | | | (3,490,516 | ) | | | (30,086 | ) | | | (9,025 | ) |
| Net increase (decrease) in shares outstanding | | | (1,161,169 | ) | | | 2,101,108 | | | | (1,288,807 | ) | | | 1,614,648 | | | | (9,446 | ) | | | 26,336 | |
See accompanying Notes to Financial Statements.
Madison Funds | October 31, 2023
Statements of Changes in Net Assets - continued
| | | Mid Cap Fund | | | Small Cap Fund | |
| | | 2023 | | | 2022 | | | 2023 | | | 2022 | |
| Class I Shares | | | | | | | | | | | | |
| Shares sold | | | 10,597,649 | | | | 7,687,795 | | | | 325,980 | | | | 588,372 | |
| Issued to shareholders in reinvestment of distributions | | | 416,307 | | | | 870,476 | | | | 76,102 | | | | 404,232 | |
| Shares redeemed | | | (5,445,271 | ) | | | (6,288,127 | ) | | | (516,657 | ) | | | (903,789 | ) |
| Net increase (decrease) in shares outstanding | | | 5,568,685 | | | | 2,270,144 | | | | (114,575 | ) | | | 88,815 | |
| Class R6 Shares2 | | | | | | | | | | | | | | | | |
| Shares sold | | | 3,359,279 | | | | 1,493,443 | | | | 8,066 | | | | 19,316 | |
| Issued to shareholders in reinvestment of distributions | | | 46,328 | | | | 113,336 | | | | 966 | | | | — | |
| Shares redeemed | | | (2,179,297 | ) | | | (1,793,973 | ) | | | (1,021 | ) | | | (2,093 | ) |
| Net increase (decrease) in shares outstanding | | | 1,226,310 | | | | (187,194 | ) | | | 8,011 | | | | 17,223 | |
1 As of the close of business on February 6, 2023, outstanding Class B shares of the Madison Funds converted into Class A shares of each respective fund, and Class B shares of the Trust were terminated.
2 The Small Cap Fund Class R6 shares commenced operations effective March 1, 2022.
See accompanying Notes to Financial Statements.
Madison Funds | October 31, 2023
Financial Highlights for a Share of Beneficial Interest Outstanding
| | | CONSERVATIVE ALLOCATION FUND | |
| | | CLASS A | | | CLASS C | |
| | | Year Ended October 31, | | | Year Ended October 31, | |
| | | 2023 | | | 2022 | | | 2021 | | | 2020 | | | 2019 | | | 2023 | | | 2022 | | | 2021 | | | 2020 | | | 2019 | |
| Net Asset Value at beginning of period | | $ | 8.85 | | | $ | 11.12 | | | $ | 11.15 | | | $ | 10.96 | | | $ | 10.39 | | | $ | 9.00 | | | $ | 11.30 | | | $ | 11.32 | | | $ | 11.11 | | | $ | 10.48 | |
| Income from Investment Operations: | | | | | | | | | | | | | | | | | | | | | | | | | | | | | | | | | | | | | | | | |
| Net investment income | | | 0.21 | | | | 0.20 | | | | 0.10 | | | | 0.13 | 1 | | | 0.36 | 1,2 | | | 0.15 | | | | 0.13 | | | | 0.01 | | | | 0.04 | 1 | | | 0.29 | 1,2 |
| Net realized and unrealized gain (loss) on investments | | | (0.08 | ) | | | (1.77 | ) | | | 0.63 | | | | 0.46 | | | | 0.68 | 2 | | | (0.09 | ) | | | (1.81 | ) | | | 0.64 | | | | 0.48 | | | | 0.68 | 2 |
| Total from investment operations | | | 0.13 | | | | (1.57 | ) | | | 0.73 | | | | 0.59 | | | | 1.04 | | | | 0.06 | | | | (1.68 | ) | | | 0.65 | | | | 0.52 | | | | 0.97 | |
| Less Distributions From: | | | | | | | | | | | | | | | | | | | | | | | | | | | | | | | | | | | | | | | | |
| Net investment income | | | (0.20 | ) | | | (0.19 | ) | | | (0.18 | ) | | | (0.19 | ) | | | (0.18 | ) | | | (0.13 | ) | | | (0.11 | ) | | | (0.09 | ) | | | (0.10 | ) | | | (0.05 | ) |
| Capital gains | | | – | | | | (0.51 | ) | | | (0.58 | ) | | | (0.21 | ) | | | (0.29 | ) | | | – | | | | (0.51 | ) | | | (0.58 | ) | | | (0.21 | ) | | | (0.29 | ) |
| Total distributions | | | (0.20 | ) | | | (0.70 | ) | | | (0.76 | ) | | | (0.40 | ) | | | (0.47 | ) | | | (0.13 | ) | | | (0.62 | ) | | | (0.67 | ) | | | (0.31 | ) | | | (0.34 | ) |
| Net increase (decrease) in net asset value | | | (0.07 | ) | | | (2.27 | ) | | | (0.03 | ) | | | 0.19 | | | | 0.57 | | | | (0.07 | ) | | | (2.30 | ) | | | (0.02 | ) | | | 0.21 | | | | 0.63 | |
| Net Asset Value at end of period | | $ | 8.78 | | | $ | 8.85 | | | $ | 11.12 | | | $ | 11.15 | | | $ | 10.96 | | | $ | 8.93 | | | $ | 9.00 | | | $ | 11.30 | | | $ | 11.32 | | | $ | 11.11 | |
| Total Return (%)3 | | | 1.36 | | | | (15.00 | ) | | | 6.72 | | | | 5.62 | | | | 10.37 | | | | 0.60 | | | | (15.67 | ) | | | 5.91 | | | | 4.89 | | | | 9.50 | |
| Ratios/Supplemental Data: | | | | | | | | | | | | | | | | | | | | | | | | | | | | | | | | | | | | | | | | |
| Net Assets at end of period (in 000’s) | | $ | 30,510 | | | $ | 35,084 | | | $ | 45,932 | | | $ | 44,146 | | | $ | 42,662 | | | $ | 12,558 | | | $ | 14,315 | | | $ | 20,154 | | | $ | 20,137 | | | $ | 20,303 | |
| Ratios of expenses to average net assets (%) | | | 0.71 | | | | 0.71 | | | | 0.71 | | | | 0.70 | | | | 0.70 | | | | 1.46 | | | | 1.46 | | | | 1.46 | | | | 1.45 | | | | 1.45 | |
| Ratio of net investment income to average net assets (%) | | | 2.24 | | | | 1.97 | | | | 0.86 | | | | 1.19 | | | | 3.38 | 2 | | | 1.49 | | | | 1.27 | | | | 0.11 | | | | 0.45 | | | | 2.60 | 2 |
| Portfolio turnover (%)4 | | | 53 | | | | 84 | | | | 63 | | | | 73 | | | | 57 | | | | 53 | | | | 84 | | | | 63 | | | | 73 | | | | 57 | |
1 Net investment income (loss) calculated excluding permanent tax adjustments to undistributed net investment income.
2 In 2019, the Fund reported distributions of capital gains from investment companies as part of net investment income in the financial highlights. Had the Fund reported these capital gains as net realized and unrealized gain (loss) on investments, net investment income, net realized and unrealized gain (loss) on investments, and the ratio of net investment income to average net assets would have been; $0.17, $0.87, and 1.64%, respectively, for the class A Shares and $0.10, $0.87, and 0.89%, respectively, for the class C shares.
3 Total return without applicable sales charge.
4 Portfolio turnover is calculated at the fund level and represents the entire fiscal year or period.
| | | MODERATE ALLOCATION FUND | |
| | | CLASS A | | | CLASS C | |
| | | Year Ended October 31, | | | Year Ended October 31, | |
| | | 2023 | | | 2022 | | | 2021 | | | 2020 | | | 2019 | | | 2023 | | | 2022 | | | 2021 | | | 2020 | | | 2019 | |
| Net Asset Value at beginning of period | | $ | 9.59 | | | $ | 12.22 | | | $ | 11.85 | | | $ | 11.76 | | | $ | 11.59 | | | $ | 9.49 | | | $ | 12.09 | | | $ | 11.70 | | | $ | 11.61 | | | $ | 11.47 | |
| Income from Investment Operations: | | | | | | | | | | | | | | | | | | | | | | | | | | | | | | | | | | | | | | | | |
| Net investment income | | | 0.20 | | | | 0.28 | | | | 0.09 | | | | 0.12 | 1 | | | 0.51 | 1,2 | | | 0.12 | | | | 0.19 | | | | (0.01 | ) | | | 0.02 | 1 | | | 0.42 | 1,2 |
| Net realized and unrealized gain (loss) on investments | | | 0.04 | | | | (1.94 | ) | | | 1.35 | | | | 0.43 | | | | 0.60 | 2 | | | 0.05 | | | | (1.92 | ) | | | 1.34 | | | | 0.44 | | | | 0.59 | 2 |
| Total from investment operations | | | 0.24 | | | | (1.66 | ) | | | 1.44 | | | | 0.55 | | | | 1.11 | | | | 0.17 | | | | (1.73 | ) | | | 1.33 | | | | 0.46 | | | | 1.01 | |
| Less Distributions From: | | | | | | | | | | | | | | | | | | | | | | | | | | | | | | | | | | | | | | | | |
| Net investment income | | | (0.13 | ) | | | (0.29 | ) | | | (0.13 | ) | | | (0.17 | ) | | | (0.17 | ) | | | (0.07 | ) | | | (0.19 | ) | | | – | | | | (0.08 | ) | | | (0.10 | ) |
| Capital gains | | | – | | | | (0.68 | ) | | | (0.94 | ) | | | (0.29 | ) | | | (0.77 | ) | | | – | | | | (0.68 | ) | | | (0.94 | ) | | | (0.29 | ) | | | (0.77 | ) |
| Total distributions | | | (0.13 | ) | | | (0.97 | ) | | | (1.07 | ) | | | (0.46 | ) | | | (0.94 | ) | | | (0.07 | ) | | | (0.87 | ) | | | (0.94 | ) | | | (0.37 | ) | | | (0.87 | ) |
| Net increase (decrease) in net asset value | | | 0.11 | | | | (2.63 | ) | | | 0.37 | | | | 0.09 | | | | 0.17 | | | | 0.10 | | | | (2.60 | ) | | | 0.39 | | | | 0.09 | | | | 0.14 | |
| Net Asset Value at end of period | | $ | 9.70 | | | | 9.59 | $ | | | 12.22 | | | $ | 11.85 | | | $ | 11.76 | | | $ | 9.59 | | | $ | 9.49 | | | $ | 12.09 | $ | | | 11.70 | | | $ | 11.61 | |
| Total Return (%)3 | | | 2.55 | | | | (14.88 | ) | | | 12.66 | | | | 4.75 | | | | 10.69 | | | | 1.79 | | | | (15.47 | ) | | | 11.79 | | | | 3.99 | | | | 9.78 | |
| Ratios/Supplemental Data: | | | | | | | | | | | | | | | | | | | | | | | | | | | | | | | | | | | | | | | | |
| Net Assets at end of period (in 000’s) | | $ | 85,230 | | | $ | 92,669 | | | $ | 119,035 | | | $ | 111,135 | | | $ | 112,916 | | | $ | 5,507 | | | $ | 6,244 | | | $ | 8,849 | | | $ | 9,230 | | | $ | 9,607 | |
| Ratios of expenses to average net assets (%) | | | 0.70 | | | | 0.71 | | | | 0.71 | | | | 0.70 | | | | 0.70 | | | | 1.45 | | | | 1.46 | | | | 1.46 | | | | 1.45 | | | | 1.45 | |
| Ratio of net investment income to average net assets (%) | | | 1.97 | | | | 2.54 | | | | 0.70 | | | | 0.96 | | | | 4.42 | 2 | | | 1.22 | | | | 1.83 | | | | (0.03 | ) | | | 0.22 | | | | 3.68 | 2 |
| Portfolio turnover (%)4 | | | 67 | | | | 95 | | | | 71 | | | | 87 | | | | 64 | | | | 67 | | | | 95 | | | | 71 | | | | 87 | | | | 64 | |
1 Net investment income (loss) calculated excluding permanent tax adjustments to undistributed net investment income.
2 In 2019, the Fund reported distributions of capital gains from investment companies as part of net investment income in the financial highlights. Had the Fund reported these capital gains as net realized and unrealized gain(loss) on investments, net investment income, net realized and unrealized gain (loss) on investments, and the ratio of net investment income to average net assets would have been; $0.17, $0.94, and 1.39%, respectively, for the class A Shares and $0.08, $0.93, and 0.64%, respectively, for the class C shares.
3 Total return without applicable sales charge.
4 Portfolio turnover is calculated at the fund level and represents the entire fiscal year or period.
See accompanying Notes to Financial Statements.
Madison Funds | October 31, 2023
Financial Highlights for a Share of Beneficial Interest Outstanding - continued
| | | AGGRESSIVE ALLOCATION FUND | |
| | | CLASS A | | | CLASS C | |
| | | Year Ended October 31, | | | Year Ended October 31, | |
| | | 2023 | | | 2022 | | | 2021 | | | 2020 | | | 2019 | | | 2023 | | | 2022 | | | 2021 | | | 2020 | | | 2019 | |
| Net Asset Value at beginning of period | | $ | 9.83 | | | $ | 12.75 | | | $ | 11.81 | | | $ | 12.02 | | | $ | 12.01 | | | $ | 9.45 | | | $ | 12.29 | | | $ | 11.42 | | | $ | 11.63 | | | $ | 11.66 | |
| Income from Investment Operations: | | | | | | | | | | | | | | | | | | | | | | | | | | | | | | | | | | | | | | | | |
| Net investment income | | | 0.18 | | | | 0.33 | | | | 0.08 | | | | 0.10 | 1 | | | 0.56 | 1,2 | | | 0.08 | | | | 0.24 | | | | (0.01 | ) | | | 0.03 | 1 | | | 0.48 | 1,2 |
| Net realized and unrealized gain (loss) | | | | | | | | | | | | | | | | | | | | | | | | | | | | | | | | | | | | | | | | |
| on investments | | | 0.17 | | | | (2.07 | ) | | | 1.89 | | | | 0.33 | | | | 0.57 | 2 | | | 0.19 | | | | (2.00 | ) | | | 1.82 | | | | 0.30 | | | | 0.54 | 2 |
| Total from investment operations | | | 0.35 | | | | (1.74 | ) | | | 1.97 | | | | 0.43 | | | | 1.13 | | | | 0.27 | | | | (1.76 | ) | | | 1.81 | | | | 0.33 | | | | 1.02 | |
| Less Distributions From: | | | | | | | | | | | | | | | | | | | | | | | | | | | | | | | | | | | | | | | | |
| Net investment income | | | (0.12 | ) | | | (0.34 | ) | | | (0.09 | ) | | | (0.16 | ) | | | (0.14 | ) | | | (0.06 | ) | | | (0.24 | ) | | | – | | | | (0.06 | ) | | | (0.07 | ) |
| Capital gains | | | – | | | | (0.84 | ) | | | (0.94 | ) | | | (0.48 | ) | | | (0.98 | ) | | | – | | | | (0.84 | ) | | | (0.94 | ) | | | (0.48 | ) | | | (0.98 | ) |
| Total distributions | | | (0.12 | ) | | | (1.18 | ) | | | (1.03 | ) | | | (0.64 | ) | | | (1.12 | ) | | | (0.06 | ) | | | (1.08 | ) | | | (0.94 | ) | | | (0.54 | ) | | | (1.05 | ) |
| Net increase (decrease) in net asset value | | | 0.23 | | | | (2.92 | ) | | | 0.94 | | | | (0.21 | ) | | | 0.01 | | | | 0.21 | | | | (2.84 | ) | | | 0.87 | | | | (0.21 | ) | | | (0.03 | ) |
| Net Asset Value at end of period | | $ | 10.06 | | | $ | 9.83 | | | $ | 12.75 | | | $ | 11.81 | | | $ | 12.02 | | | $ | 9.66 | | | $ | 9.45 | | | $ | 12.29 | | | $ | 11.42 | | | $ | 11.63 | |
| Total Return (%)3 | | | 3.62 | | | | (15.22 | ) | | | 17.33 | | | | 3.59 | | | | 10.93 | | | | 2.83 | | | | (15.84 | ) | | | 16.39 | | | | 2.88 | | | | 10.11 | |
| Ratios/Supplemental Data: | | | | | | | | | | | | | | | | | | | | | | | | | | | | | | | | | | | | | | | | |
| Net Assets at end of period (in 000’s) | | $ | 48,888 | | | $ | 48,969 | | | $ | 60,837 | | | $ | 56,089 | | | $ | 54,974 | | | $ | 1,957 | | | $ | 2,283 | | | $ | 3,082 | | | $ | 2,655 | | | $ | 2,263 | |
| Ratios of expenses to average net assets (%) | | | 0.70 | | | | 0.71 | | | | 0.71 | | | | 0.70 | | | | 0.70 | | | | 1.46 | | | | 1.46 | | | | 1.46 | | | | 1.45 | | | | 1.45 | |
| Ratio of net investment income to average net assets (%) | | | 1.74 | | | | 2.89 | | | | 0.62 | | | | 0.78 | | | | 4.77 | 2 | | | 1.02 | | | | 2.23 | | | | (0.14 | ) | | | (0.01 | ) | | | 4.15 | 2 |
| Portfolio turnover (%)4 | | | 71 | | | | 99 | | | | 84 | | | | 105 | | | | 79 | | | | 71 | | | | 99 | | | | 84 | | | | 105 | | | | 79 | |
1 Net investment income (loss) calculated excluding permanent tax adjustments to undistributed net investment income.
2 In 2019, the Fund reported distributions of capital gains from investment companies as part of net investment income in the financial highlights. Had the Fund reported these capital gains as net realized and unrealized gain(loss) on investments, net investment income, net realized and unrealized gain (loss) on investments, and the ratio of net investment income to average net assets would have been; $0.15, $0.98, and 1.25%, respectively, for the class A Shares and $0.07, $0.95, and 0.50%, respectively, for the class C shares.
3 Total return without applicable sales charge.
4 Portfolio turnover is calculated at the fund level and represents the entire fiscal year or period.
| | | DIVERSIFIED INCOME FUND | |
| | | CLASS A | | | CLASS C | |
| | | Year Ended October 31, | | | Year Ended October 31, | |
| | | 2023 | | | 2022 | | | 2021 | | | 2020 | | | 2019 | | | 2023 | | | 2022 | | | 2021 | | | 2020 | | | 2019 | |
| Net Asset Value at beginning of period | | $ | 15.06 | | | $ | 18.42 | | | $ | 15.52 | | | $ | 16.37 | | | $ | 15.98 | | | $ | 15.21 | | | $ | 18.58 | | | $ | 15.65 | | | $ | 16.48 | | | $ | 16.07 | |
| Income from Investment Operations: | | | | | | | | | | | | | | | | | | | | | | | | | | | | | | | | | | | | | | | | |
| Net investment income | | | 0.31 | | | | 0.27 | | | | 0.23 | | | | 0.26 | 1 | | | 0.28 | 1 | | | 0.20 | | | | 0.14 | | | | 0.09 | | | | 0.15 | 1 | | | 0.16 | 1 |
| Net realized and unrealized gain (loss) on investments | | | (0.47 | ) | | | (1.54 | ) | | | 3.11 | | | | (0.04 | ) | | | 1.64 | | | | (0.48 | ) | | | (1.55 | ) | | | 3.14 | | | | (0.03 | ) | | | 1.66 | |
| Total from investment operations | | | (0.16 | ) | | | (1.27 | ) | | | 3.34 | | | | 0.22 | | | | 1.92 | | | | (0.28 | ) | | | (1.41 | ) | | | 3.23 | | | | 0.12 | | | | 1.82 | |
| Less Distributions From: | | | | | | | | | | | | | | | | | | | | | | | | | | | | | | | | | | | | | | | | |
| Net investment income | | | (0.31 | ) | | | (0.28 | ) | | | (0.24 | ) | | | (0.27 | ) | | | (0.29 | ) | | | (0.20 | ) | | | (0.15 | ) | | | (0.10 | ) | | | (0.15 | ) | | | (0.17 | ) |
| Capital gains | | | (0.89 | ) | | | (1.81 | ) | | | (0.20 | ) | | | (0.80 | ) | | | (1.24 | ) | | | (0.89 | ) | | | (1.81 | ) | | | (0.20 | ) | | | (0.80 | ) | | | (1.24 | ) |
| Total distributions | | | (1.20 | ) | | | (2.09 | ) | | | (0.44 | ) | | | (1.07 | ) | | | (1.53 | ) | | | (1.09 | ) | | | (1.96 | ) | | | (0.30 | ) | | | (0.95 | ) | | | (1.41 | ) |
| Net increase (decrease) in net asset value | | | (1.36 | ) | | | (3.36 | ) | | | 2.90 | | | | (0.85 | ) | | | 0.39 | | | | (1.37 | ) | | | (3.37 | ) | | | 2.93 | | | | (0.83 | ) | | | 0.41 | |
| Net Asset Value at end of period | | $ | 13.70 | | | $ | 15.06 | | | $ | 18.42 | | | $ | 15.52 | | | $ | 16.37 | | | $ | 13.84 | | | $ | 15.21 | | | $ | 18.58 | | | $ | 15.65 | | | $ | 16.48 | |
| Total Return (%)2 | | | (1.35 | ) | | | (7.92 | ) | | | 21.74 | | | | 1.27 | | | | 13.51 | | | | (2.14 | ) | | | (8.62 | ) | | | 20.82 | | | | 0.62 | | | | 12.72 | |
| Ratios/Supplemental Data: | | | | | | | | | | | | | | | | | | | | | | | | | | | | | | | | | | | | | | | | |
| Net Assets at end of period (in 000’s) $ | | | 119,989 | $ | | | 136,578 | $ | | | 158,336 | $ | | | 134,213 | $ | | | 139,683 | | | $ | 20,240 | | | $ | 22,524 | | | $ | 20,812 | | | $ | 16,888 | | | $ | 16,090 | |
| Ratios of expenses to average net assets (%) | | | 1.00 | | | | 1.11 | | | | 1.11 | | | | 1.10 | | | | 1.10 | | | | 1.75 | | | | 1.86 | | | | 1.85 | | | | 1.85 | | | | 1.84 | |
| Ratio of net investment income to average | | | | | | | | | | | | | | | | | | | | | | | | | | | | | | | | | | | | | | | | |
| net assets (%) | | | 2.14 | | | | 1.61 | | | | 1.27 | | | | 1.66 | | | | 1.80 | | | | 1.39 | | | | 0.88 | | | | 0.52 | | | | 0.91 | | | | 1.05 | |
| Portfolio turnover (%)3 | | | 118 | | | | 32 | | | | 34 | | | | 31 | | | | 34 | | | | 118 | | | | 32 | | | | 34 | | | | 31 | | | | 34 | |
1 Net investment income (loss) calculated excluding permanent tax adjustments to undistributed net investment income.
2 Total return without applicable sales charge.
3 Portfolio turnover is calculated at the fund level and represents the entire fiscal year or period.
See accompanying Notes to Financial Statements.
Madison Funds | October 31, 2023
Financial Highlights for a Share of Beneficial Interest Outstanding – continued
| | | TAX-FREE VIRGINIA FUND | | | TAX-FREE NATIONAL FUND | |
| | | CLASS Y | | | CLASS Y | |
| | | Year Ended October 31, | | | Year Ended October 31, | |
| | | 2023 | | | 2022 | | | 2021 | | | 2020 | | | 2019 | | | 2023 | | | 2022 | | | 2021 | | | 2020 | | | 2019 | |
| Net Asset Value at beginning of period | | $ | 10.33 | | | $ | 11.71 | | | $ | 11.89 | | | $ | 11.71 | | | $ | 11.08 | | | $ | 9.73 | | | $ | 10.98 | | | $ | 11.08 | | | $ | 10.96 | | | $ | 10.41 | |
| Income from Investment Operations: | | | | | | | | | | | | | | | | | | | | | | | | | | | | | | | | | | | | | | | | |
| Net investment income | | | 0.19 | | | | 0.18 | | | | 0.19 | | | | 0.20 | 1 | | | 0.23 | 1 | | | 0.20 | | | | 0.18 | | | | 0.18 | | | | 0.21 | 1 | | | 0.24 | 1 |
| Net realized and unrealized gain (loss) on investments | | | (0.13 | ) | | | (1.34 | ) | | | (0.17 | ) | | | 0.18 | | | | 0.63 | | | | (0.09 | ) | | | (1.15 | ) | | | (0.10 | ) | | | 0.15 | | | | 0.61 | |
| Total from investment operations | | | 0.06 | | | | (1.16 | ) | | | 0.02 | | | | 0.38 | | | | 0.86 | | | | 0.11 | | | | (0.97 | ) | | | 0.08 | | | | 0.36 | | | | 0.85 | |
| Less Distributions From: | | | | | | | | | | | | | | | | | | | | | | | | | | | | | | | | | | | | | | | | |
| Net investment income | | | (0.19 | ) | | | (0.18 | ) | | | (0.19 | ) | | | (0.20 | ) | | | (0.23 | ) | | | (0.20 | ) | | | (0.18 | ) | | | (0.18 | ) | | | (0.21 | ) | | | (0.24 | ) |
| Capital gains | | | – | | | | (0.04 | ) | | | (0.01 | ) | | | – | | | | – | | | | (0.07 | ) | | | (0.10 | ) | | | – | | | | (0.03 | ) | | | (0.06 | ) |
| Total distributions | | | (0.19 | ) | | | (0.22 | ) | | | (0.20 | ) | | | (0.20 | ) | | | (0.23 | ) | | | (0.27 | ) | | | (0.28 | ) | | | (0.18 | ) | | | (0.24 | ) | | | (0.30 | ) |
| Net increase (decrease) in net asset value | | | (0.13 | ) | | | (1.38 | ) | | | (0.18 | ) | | | 0.18 | | | | 0.63 | | | | (0.16 | ) | | | (1.25 | ) | | | (0.10 | ) | | | 0.12 | | | | 0.55 | |
| Net Asset Value at end of period | | $ | 10.20 | | | $ | 10.33 | | | $ | 11.71 | | | $ | 11.89 | | | $ | 11.71 | | | $ | 9.57 | | | $ | 9.73 | | | $ | 10.98 | | | $ | 11.08 | | | $ | 10.96 | |
| Total Return (%)2 | | | 0.56 | | | | (10.01 | ) | | | 0.10 | | | | 3.24 | | | | 7.78 | | | | 1.06 | | | | (8.98 | ) | | | 0.75 | | | | 3.36 | | | | 8.20 | |
| Ratios/Supplemental Data: | | | | | | | | | | | | | | | | | | | | | | | | | | | | | | | | | | | | | | | | |
| Net Assets at end of period (in 000’s) | | $ | 16,575 | | | $ | 17,746 | | | $ | 20,620 | | | $ | 21,572 | | | $ | 22,225 | | | $ | 17,114 | | | $ | 17,621 | | | $ | 22,331 | | | $ | 23,377 | | | $ | 23,807 | |
| Ratios of expenses to average net assets (%) | | | 0.86 | | | | 0.86 | | | | 0.86 | | | | 0.85 | | | | 0.85 | | | | 0.76 | | | | 0.76 | | | | 0.76 | | | | 0.75 | | | | 0.75 | |
| Ratio of net investment income to average net assets (%) | | | 1.82 | | | | 1.65 | | | | 1.57 | | | | 1.66 | | | | 1.96 | | | | 2.02 | | | | 1.74 | | | | 1.65 | | | | 1.91 | | | | 2.19 | |
| Portfolio turnover (%)3 | | | 15 | | | | 17 | | | | 10 | | | | 7 | | | | 22 | | | | 16 | | | | 10 | | | | 18 | | | | 13 | | | | 26 | |
1 Net investment income (loss) calculated excluding permanent tax adjustments to undistributed net investment income.
2 Total return without applicable sales charge.
3 Portfolio turnover is calculated at the fund level and represents the entire fiscal year or period.
| | | HIGH QUALITY BOND FUND | |
| | | CLASS Y | |
| | | Year Ended October 31, |
| | | 2023 | | | 2022 | | | 2021 | | | 2020 | | | 2019 | |
| Net Asset Value at beginning of period | | $ | 9.99 | | | $ | 11.15 | | | $ | 11.42 | | | $ | 11.11 | | | $ | 10.64 | |
| Income from Investment Operations: | | | | | | | | | | | | | | | | | | | | |
| Net investment income | | | 0.20 | | | | 0.13 | | | | 0.10 | | | | 0.13 | 1 | | | 0.21 | 1 |
| Net realized and unrealized gain (loss) on investments | | | (0.01 | ) | | | (1.11 | ) | | | (0.24 | ) | | | 0.32 | | | | 0.47 | |
| Total from investment operations | | | 0.19 | | | | (0.98 | ) | | | (0.14 | ) | | | 0.45 | | | | 0.68 | |
| Less Distributions From: | | | | | | | | | | | | | | | | | | | | |
| Net investment income | | | (0.19 | ) | | | (0.12 | ) | | | (0.10 | ) | | | (0.14 | ) | | | (0.21 | ) |
| Capital gains | | | – | | | | (0.06 | ) | | | (0.03 | ) | | | – | | | | – | |
| Total distributions | | | (0.19 | ) | | | (0.18 | ) | | | (0.13 | ) | | | (0.14 | ) | | | (0.21 | ) |
| Net increase (decrease) in net asset value | | | – | | | | (1.16 | ) | | | (0.27 | ) | | | 0.31 | | | | 0.47 | |
| Net Asset Value at end of period | | $ | 9.99 | | | $ | 9.99 | | | $ | 11.15 | | | $ | 11.42 | | | $ | 11.11 | |
| Total Return (%)2 | | | 1.92 | | | | (8.88 | ) | | | (1.21 | ) | | | 4.08 | | | | 6.43 | |
| Ratios/Supplemental Data: | | | | | | | | | | | | | | | | | | | | |
| Net Assets at end of period (in 000’s) | | $ | 42,307 | | | $ | 61,707 | | | $ | 115,682 | | | $ | 184,881 | | | $ | 90,407 | |
| Ratios of expenses to average net assets (%) | | | | | | | | | | | | | | | | | | | | |
| Before reimbursement of expenses by Adviser (%) | | | 0.50 | | | | 0.50 | | | | 0.50 | | | | 0.49 | | | | 0.49 | |
| After reimbursement of expenses by Adviser (%) | | | 0.50 | | | | 0.46 | | | | 0.40 | | | | 0.46 | | | | 0.49 | |
| Ratio of net investment income to average net assets | | | | | | | | | | | | | | | | | | | | |
| Before reimbursement of expenses by Adviser (%) | | | 1.91 | | | | 1.04 | | | | 0.76 | | | | 1.17 | | | | 1.88 | |
| After reimbursement of expenses by Adviser (%) | | | 1.91 | | | | 1.07 | | | | 0.86 | | | | 1.20 | | | | 1.88 | |
| Portfolio turnover (%)3 | | | 45 | | | | 23 | | | | 13 | | | | 21 | | | | 20 | |
1 Net investment income (loss) calculated excluding permanent tax adjustments to undistributed net investment income.
2 Total return without applicable sales charge.
3 Portfolio turnover is calculated at the fund level and represents the entire fiscal year or period.
See accompanying Notes to Financial Statements.
Madison Funds | October 31, 2023
Financial Highlights for a Share of Beneficial Interest Outstanding – continued
| | | HIGH QUALITY BOND FUND | |
| | | CLASS I | |
| | | Year Ended October 31, | | | Period Ended October 31, | |
| | | | 2023 | | | | 2022* | |
| Net Asset Value at beginning of period | | $ | 10.05 | | | $ | 10.84 | |
| Income from Investment Operations: | | | | | | | | |
| Net investment income | | | 0.22 | | | | 0.09 | |
| Net realized and unrealized gain (loss) on investments | | | (0.02 | ) | | | (0.79 | ) |
| Total from investment operations | | | 0.20 | | | | (0.70 | ) |
| Less Distributions From: | | | | | | | | |
| Net investment income | | | (0.20 | ) | | | (0.09 | ) |
| Total distributions | | | (0.20 | ) | | | (0.09 | ) |
| Net increase (decrease) in net asset value | | | – | | | | (0.79 | ) |
| Net Asset Value at end of period | | $ | 10.05 | | | $ | 10.05 | |
| Total Return (%)1 | | | 2.00 | | | | (6.44 | )2 |
| Ratios/Supplemental Data: | | | | | | | | |
| Net Assets at end of period (in 000’s) | | $ | 11,248 | | | $ | 15,078 | |
| Before reimbursement of expenses by Adviser (%) | | | 0.41 | | | | 0.413 | |
| After reimbursement of expenses by Adviser (%) | | | 0.41 | | | | 0.413 | |
| Ratio of net investment income to average net assets | | | | | | | | |
| Before reimbursement of expenses by Adviser (%) | | | 2.00 | | | | 1.32 | 3 |
| After reimbursement of expenses by Adviser (%) | | | 2.00 | | | | 1.32 | 3 |
| Portfolio turnover (%)4 | | | 45 | | | | 23 | 2 |
* Class I shares commenced operations effective March 1, 2022.
1 Total return without applicable sales charge.
2 Not annualized.
3 Annualized.
4 Portfolio turnover is calculated at the fund level and represents the entire fiscal year or period.
| | | CORE BOND FUND | |
| | | CLASS A | | | CLASS Y | |
| | | Year Ended October 31, | | | Year Ended October 31, | |
| | | 2023 | | | 2022 | | | 2021 | | | 2020 | | | 2019 | | | 2023 | | | 2022 | | | 2021 | | | 2020 | | | 2019 | |
| Net Asset Value at beginning of period | | $ | 8.65 | | | $ | 10.45 | | | $ | 10.78 | | | $ | 10.28 | | | $ | 9.55 | | | $ | 8.60 | | | $ | 10.39 | | | $ | 10.71 | | | $ | 10.25 | | | $ | 9.52 | |
| Income from Investment Operations: | | | | | | | | | | | | | | | | | | | | | | | | | | | | | | | | | | | | | | | | |
| Net investment income | | | 0.24 | | | | 0.16 | | | | 0.14 | | | | 0.181 | | | | 0.24 | 1 | | | 0.25 | | | | 0.13 | | | | (0.02 | ) | | | 0.20 | 1 | | | 0.25 | 1 |
| Net realized and unrealized gain (loss) on investments | | | (0.23 | ) | | | (1.75 | ) | | | (0.12 | ) | | | 0.53 | | | | 0.74 | | | | (0.21 | ) | | | (1.69 | ) | | | 0.10 | | | | 0.52 | | | | 0.75 | |
| Total from investment operations | | | 0.01 | | | | (1.59 | ) | | | 0.02 | | | | 0.71 | | | | 0.98 | | | | 0.04 | | | | (1.56 | ) | | | 0.08 | | | | 0.72 | | | | 1.00 | |
| Less Distributions From: | | | | | | | | | | | | | | | | | | | | | | | | | | | | | | | | | | | | | | | | |
| Net investment income | | | (0.23 | ) | | | (0.15 | ) | | | (0.14 | ) | | | (0.19 | ) | | | (0.25 | ) | | | (0.26 | ) | | | (0.17 | ) | | | (0.19 | ) | | | (0.24 | ) | | | (0.27 | ) |
| Capital gains | | | – | | | | (0.06 | ) | | | (0.21 | ) | | | (0.02 | ) | | | – | | | | – | | | | (0.06 | ) | | | (0.21 | ) | | | (0.02 | ) | | | – | |
| Total distributions | | | (0.23 | ) | | | (0.21 | ) | | | (0.35 | ) | | | (0.21 | ) | | | (0.25 | ) | | | (0.26 | ) | | | (0.23 | ) | | | (0.40 | ) | | | (0.26 | ) | | | (0.27 | ) |
| Net increase (decrease) in net asset value | | | (0.22 | ) | | | (1.80 | ) | | | (0.33 | ) | | | 0.50 | | | | 0.73 | | | | (0.22 | ) | | | (1.79 | ) | | | (0.32 | ) | | | 0.46 | | | | 0.73 | |
| Net Asset Value at end of period | | $ | 8.43 | | | $ | 8.65 | | | $ | 10.45 | | | $ | 10.78 | | | $ | 10.28 | | | $ | 8.38 | | | $ | 8.60 | | | $ | 10.39 | | | $ | 10.71 | | | $ | 10.25 | |
| Total Return (%)2 | | | 0.07 | | | | (15.47 | ) | | | 0.21 | | | | 7.00 | | | | 10.37 | | | | 0.32 | | | | (15.25 | ) | | | 0.73 | | | | 7.13 | | | | 10.67 | |
| Ratios/Supplemental Data: | | | | | | | | | | | | | | | | | | | | | | | | | | | | | | | | | | | | | | | | |
| Net Assets at end of period (in 000’s) | | $ | 29,453 | | | $ | 32,990 | | | $ | 43,577 | | | $ | 47,304 | | | $ | 28,902 | | | $ | 6,482 | | | $ | 6,954 | | | $ | 10,783 | | | $ | 102,811 | | | $ | 121,000 | |
| Ratios of expenses to average net assets (%) | | | 0.85 | | | | 0.85 | | | | 0.87 | | | | 0.90 | | | | 0.90 | | | | 0.60 | | | | 0.60 | | | | 0.65 | | | | 0.65 | | | | 0.65 | |
| Ratio of net investment income to average net assets (%) | | | 2.65 | | | | 1.57 | | | | 1.31 | | | | 1.78 | | | | 2.35 | | | | 2.90 | | | | 1.80 | | | | 1.65 | | | | 2.03 | | | | 2.60 | |
| Portfolio turnover (%)3 | | | 30 | | | | 21 | | | | 30 | | | | 61 | | | | 36 | | | | 30 | | | | 21 | | | | 30 | | | | 61 | | | | 36 | |
1 Net investment income (loss) calculated excluding permanent tax adjustments to undistributed net investment income.
2 Total return without applicable sales charge.
3 Portfolio turnover is calculated at the fund level and represents the entire fiscal year or period.
See accompanying Notes to Financial Statements.
Madison Funds | October 31, 2023
Financial Highlights for a Share of Beneficial Interest Outstanding - continued
| | | CORE BOND FUND | |
| | | CLASS I | | | CLASS R6 | |
| | | Year Ended | | | Period Ended | | | Year Ended | | | Period Ended | |
| | | October 31, | | | October 31, | | | October 31, | | | October 31, | |
| | | 2023 | | | 2022 | | | 2021* | | | 2023 | | | 2022** | |
| Net Asset Value at beginning of period | | $ | 8.56 | | | $ | 10.36 | | | $ | 10.39 | | | $ | 8.56 | | | $ | 9.90 | |
| Income from Investment Operations: | | | | | | | | | | | | | | | | | | | | |
| Net investment income | | | 0.27 | | | | 0.17 | | | | 0.11 | | | | 0.27 | | | | 0.13 | |
| Net realized and unrealized gain (loss) on investments | | | (0.22 | ) | | | (1.72 | ) | | | (0.02 | ) | | | (0.22 | ) | | | (1.33 | ) |
| Total from investment operations | | | 0.05 | | | | (1.55 | ) | | | 0.09 | | | | 0.05 | | | | (1.20 | ) |
| Less Distributions From: | | | | | | | | | | | | | | | | | | | | |
| Net investment income | | | (0.27 | ) | | | (0.19 | ) | | | (0.12 | ) | | | (0.27 | ) | | | (0.14 | ) |
| Capital gains | | | – | | | | (0.06 | ) | | | – | | | | – | | | | – | |
| Total distributions | | | (0.27 | ) | | | (0.25 | ) | | | (0.12 | ) | | | (0.27 | ) | | | (0.14 | ) |
| Net increase (decrease) in net asset value | | | (0.22 | ) | | | (1.80 | ) | | | (0.03 | ) | | | (0.22 | ) | | | (1.34 | ) |
| Net Asset Value at end of period | | $ | 8.34 | | | $ | 8.56 | | | $ | 10.36 | | | $ | 8.34 | | | $ | 8.56 | |
| Total Return (%)1 | | | 0.42 | | | | (15.20 | ) | | | 0.88 | 2 | | | 0.50 | | | | (12.22 | )2 |
| Ratios/Supplemental Data: | | | | | | | | | | | | | | | | | | | | |
| Net Assets at end of period (in 000’s) | | $ | 52,699 | | | $ | 45,963 | | | $ | 133,692 | | | $ | 92,952 | | | $ | 93,641 | |
| Ratios of expenses to average net assets (%) | | | 0.50 | | | | 0.50 | | | | 0.50 | 3 | | | 0.42 | | | | 0.42 | 3 |
| Ratio of net investment income to average net assets (%) | | | 3.01 | | | | 1.77 | | | | 1.57 | 3 | | | 3.09 | | | | 2.20 | 3 |
| Portfolio turnover (%)4 | | | 30 | | | | 21 | | | | 30 | 2 | | | 30 | | | | 21 | 2 |
* Class I shares commenced operations effective March 1, 2021.
** Class R6 shares commenced operations effective March 1, 2022.
1 Total return without applicable sales charge.
2 Not annualized.
3 Annualized.
4 Portfolio turnover is calculated at the fund level and represents the entire fiscal year or period.
| | | COVERED CALL & EQUITY INCOME FUND | |
| | | CLASS A | | | CLASS C | | | CLASS Y | |
| | | Year Ended October 31, | | | Year Ended October 31, | | | Year Ended October 31, | |
| | | 2023 | | | 2022 | | | 2021 | | | 2020 | | | 2019 | | | 2023 | | | 2022 | | | 2021 | | | 2020 | | | 2019 | | | 2023 | | | 2022 | | | 2021 | | | 2020 | | | 2019 | |
| Net Asset Value at beginning of period | | $ | 9.19 | | | $ | 9.60 | | | $ | 7.80 | | | $ | 7.84 | | | $ | 8.52 | | | $ | 8.27 | | | $ | 8.74 | | | $ | 7.19 | | | $ | 7.31 | | | $ | 8.04 | | | $ | 9.57 | | | $ | 9.95 | | | $ | 8.05 | | | | 8.06 | | | $ | 8.73 | |
| Income from Investment Operations: | | | | | | | | | | | | | | | | | | | | | | | | | | | | | | | | | | | | | | | | | | | | | | | | | | | | | | | | | | | | |
| Net investment income (loss) | | | 0.32 | | | | 0.05 | | | | 0.02 | | | | (0.09 | )1 | | | 0.03 | 1 | | | 0.59 | | | | 0.05 | | | | (0.08 | ) | | | (0.18 | )1 | | | (0.05 | )1 | | | 0.17 | | | | (0.21 | ) | | | 0.04 | | | | (0.39 | )1 | | | 0.12 | 1 |
| Net realized and unrealized gain (loss) on investments | | | 0.33 | | | | 0.17 | | | | 2.37 | | | | 0.60 | | | | 0.05 | | | | (0.06 | ) | | | 0.10 | | | | 2.21 | | | | 0.60 | | | | 0.07 | | | | 0.54 | | | | 0.46 | | | | 2.45 | | | | 0.94 | | | | (0.02 | ) |
| Total from investment operations | | | 0.65 | | | | 0.22 | | | | 2.39 | | | | 0.51 | | | | 0.08 | | | | 0.53 | | | | 0.15 | | | | 2.13 | | | | 0.42 | | | | 0.02 | | | | 0.71 | | | | 0.25 | | | | 2.49 | | | | 0.55 | | | | 0.10 | |
| Less Distributions From: | | | | | | | | | | | | | | | | | | | | | | | | | | | | | | | | | | | | | | | | | | | | | | | | | | | | | | | | | | | | |
| Net investment income | | | (0.66 | ) | | | (0.43 | ) | | | (0.43 | ) | | | (0.39 | ) | | | (0.44 | ) | | | (0.65 | ) | | | (0.42 | ) | | | (0.42 | ) | | | (0.38 | ) | | | (0.43 | ) | | | (0.67 | ) | | | (0.43 | ) | | | (0.43 | ) | | | (0.40 | ) | | | (0.45 | ) |
| Capital gains | | | – | | | | (0.20 | ) | | | (0.16 | ) | | | (0.16 | ) | | | (0.32 | ) | | | – | | | | (0.20 | ) | | | (0.16 | ) | | | (0.16 | ) | | | (0.32 | ) | | | – | | | | (0.20 | ) | | | (0.16 | ) | | | (0.16 | ) | | | (0.32 | ) |
| Total distributions | | | (0.66 | ) | | | (0.63 | ) | | | (0.59 | ) | | | (0.55 | ) | | | (0.76 | ) | | | (0.65 | ) | | | (0.62 | ) | | | (0.58 | ) | | | (0.54 | ) | | | (0.75 | ) | | | (0.67 | ) | | | (0.63 | ) | | | (0.59 | ) | | | (0.56 | ) | | | (0.77 | ) |
| Net increase (decrease) in net asset value | | | (0.01 | ) | | | (0.41 | ) | | | 1.80 | | | | (0.04 | ) | | | (0.68 | ) | | | (0.12 | ) | | | (0.47 | ) | | | 1.55 | | | | (0.12 | ) | | | (0.73 | ) | | | 0.04 | | | | (0.38 | ) | | | 1.90 | | | | (0.01 | ) | | | (0.67 | ) |
| Net Asset Value at end of period | | $ | 9.18 | | | $ | 9.19 | | | $ | 9.60 | | | $ | 7.80 | | | $ | 7.84 | | | $ | 8.15 | | | $ | 8.27 | | | $ | 8.74 | | | $ | 7.19 | | | $ | 7.31 | | | $ | 9.61 | | | $ | 9.57 | | | $ | 9.95 | | | $ | 8.05 | | | $ | 8.06 | |
| Total Return (%)2 | | | 7.18 | | | | 2.50 | | | | 31.18 | | | | 7.10 | | | | 1.46 | | | | 6.41 | | | | 1.92 | | | | 30.17 | | | | 6.31 | | | | 0.68 | | | | 7.49 | | | | 2.78 | | | | 31.54 | | | | 7.34 | | | | 1.60 | |
| Ratios/Supplemental Data: | | | | | | | | | | | | | | | | | | | | | | | | | | | | | | | | | | | | | | | | | | | | | | | | | | | | | | | | | | | | |
| | | | | | | | | | | | | | | | | | | | | | | | | | | | | | | | | | | | | | | | | | | | | | | | | | | | | | | | | | | | | |
| Net Assets at end of period (in 000’s) | | $ | 20,690 | | | $ | 14,044 | | | $ | 14,811 | | | $ | 11,996 | | | $ | 13,748 | | | $ | 14,192 | | | $ | 8,365 | | | $ | 8,336 | | | $ | 7,156 | | | $ | 8,191 | | | $ | 57,277 | | | $ | 36,964 | | | $ | 66,982 | | | $ | 59,966 | | | $ | 102,018 | |
| Ratios of expenses to average net assets (%) | | | 1.26 | | | | 1.26 | | | | 1.26 | | | | 1.25 | | | | 1.25 | | | | 2.01 | | | | 2.01 | | | | 2.01 | | | | 2.01 | | | | 2.00 | | | | 1.01 | | | | 1.01 | | | | 1.01 | | | | 1.01 | | | | 1.00 | |
| Ratio of net investment income to average net assets (%) | | | 1.50 | | | | 0.57 | | | | 0.09 | | | | 0.70 | | | | 1.05 | | | | 0.75 | | | | (0.18 | ) | | | (0.66 | ) | | | (0.05 | ) | | | 0.29 | | | | 1.75 | | | | 0.84 | | | | 0.34 | | | | 0.98 | | | | 1.28 | |
| Portfolio turnover (%)3 | | | 102 | | | | 99 | | | | 162 | | | | 108 | | | | 116 | | | | 102 | | | | 99 | | | | 162 | | | | 108 | | | | 116 | | | | 102 | | | | 99 | | | | 162 | | | | 108 | | | | 116 | |
1 Net investment income (loss) calculated excluding permanent tax adjustments to undistributed net investment income.
2 Total return without applicable sales charge.
3 Portfolio turnover is calculated at the fund level and represents the entire fiscal year or period.
See accompanying Notes to Financial Statements.
Madison Funds | October 31, 2023
Financial Highlights for a Share of Beneficial Interest Outstanding - continued
| | | COVERED CALL & EQUITY INCOME FUND | |
| | | CLASS I 1 | |
| | | Year Ended October 31, | | | Period Ended October 31, | |
| | | 2023 | | | 2022 | |
| Net Asset Value at beginning of period | | $ | 9.57 | | | $ | 9.79 | |
| Income from Investment Operations: | | | | | | | | |
| Net investment income | | | 0.29 | | | | 0.38 | |
| Net realized and unrealized gain (loss) on investments | | | 0.43 | | | | (0.18 | ) |
| Total from investment operations | | | 0.72 | | | | 0.20 | |
| Less Distributions From: | | | | | | | | |
| Net investment income | | | (0.67 | ) | | | (0.42 | ) |
| Total distributions | | | (0.67 | ) | | | (0.42 | ) |
| Net increase (decrease) in net asset value | | | 0.05 | | | | (0.22 | ) |
| Net Asset Value at end of period | | $ | 9.62 | | | $ | 9.57 | |
| Total Return (%)2 | | | 7.61 | | | | 2.22 | 3 |
| Ratios/Supplemental Data: | | | | | | | | |
| Net Assets at end of period (in 000’s) | | $ | 150,951 | | | $ | 75,060 | |
| Ratios of expenses to average net assets (%) | | | 0.96 | | | | 0.96 | 4 |
| Ratio of net investment income to average net assets (%) | | | 1.80 | | | | 1.06 | 4 |
| Portfolio turnover (%)5 | | | 102 | | | | 99 | 3 |
1 Class I shares commenced operations effective March 1, 2022.
2 Total return without applicable sales charge.
3 Not annualized.
4 Annualized.
5 Portfolio turnover is calculated at the fund level and represents the entire fiscal year or period.
| | | COVERED CALL & EQUITY INCOME FUND | |
| | | CLASS R6 | |
| | | Year Ended October 31, | |
| | | 2023 | | | 2022 | | | 2021 | | | 2020 | | | 2019 | |
| Net Asset Value at beginning of period | | $ | 9.74 | | | $ | 10.12 | | | $ | 8.17 | | | $ | 8.16 | | | $ | 8.81 | |
| Income from Investment Operations: | | | | | | | | | | | | | | | | | | | | |
| Net investment income (loss) | | | 0.03 | | | | 0.04 | | | | 0.17 | | | | (0.45 | )1 | | | 0.18 | 1 |
| Net realized and unrealized gain (loss) on investments | | | 0.71 | | | | 0.23 | | | | 2.37 | | | | 1.02 | | | | (0.06 | ) |
| Total from investment operations | | | 0.74 | | | | 0.27 | | | | 2.54 | | | | 0.57 | | | | 0.12 | |
| Less Distributions From: | | | | | | | | | | | | | | | | | | | | |
| Net investment income | | | (0.67 | ) | | | (0.45 | ) | | | (0.43 | ) | | | (0.40 | ) | | | (0.45 | ) |
| Capital gains. | | | – | | | | (0.20 | ) | | | (0.16 | ) | | | (0.16 | ) | | | (0.32 | ) |
| Total distributions | | | (0.67 | ) | | | (0.65 | ) | | | (0.59 | ) | | | (0.56 | ) | | | (0.77 | ) |
| Net increase (decrease) in net asset value | | | 0.07 | | | | (0.38 | ) | | | 1.95 | | | | 0.01 | | | | (0.65 | ) |
| Net Asset Value at end of period | | $ | 9.81 | | | $ | 9.74 | | | $ | 10.12 | | | $ | 8.17 | | | $ | 8.16 | |
| Total Return (%)2 | | | 7.71 | | | | 2.89 | | | | 31.69 | | | | 7.51 | | | | 1.82 | |
| Ratios/Supplemental Data: | | | | | | | | | | | | | | | | | | | | |
| Net Assets at end of period (in 000’s) | | $ | 1,178 | | | $ | 765 | | | $ | 544 | | | $ | 1,439 | | | $ | 2,385 | |
| Ratios of expenses to average net assets (%) | | | 0.88 | | | | 0.88 | | | | 0.88 | | | | 0.87 | | | | 0.87 | |
| Ratio of net investment income to average net assets (%) | | | 1.85 | | | | 0.95 | | | | 0.60 | | | | 1.10 | | | | 1.41 | |
| Portfolio turnover (%)3 | | | 102 | | | | 99 | | | | 162 | | | | 108 | | | | 116 | |
1 Net investment income (loss) calculated excluding permanent tax adjustments to undistributed net investment income.
2 Total return without applicable sales charge.
3 Portfolio turnover is calculated at the fund level and represents the entire fiscal year or period.
See accompanying Notes to Financial Statements.
Madison Funds | October 31, 2023
Financial Highlights for a Share of Beneficial Interest Outstanding - continued
| | DIVIDEND INCOME FUND |
| | CLASS A* |
|
| Year Ended October 31, |
|
| Period Ended October 31, |
|
| | | 2023 | | | 2022 | | | 2021 | | | 2020 | |
| Net Asset Value at beginning of period | | $ | 29.27 | | | $ | 34.13 | | | $ | 26.10 | | | $ | 25.17 | |
| Income from Investment Operations: | | | | | | | | | | | | | | | | |
| Net investment income | | | 0.56 | | | | 0.52 | | | | 0.39 | | | | 0.16 | 1 |
| Net realized and unrealized gain (loss) on investments | | | (1.90 | ) | | | (1.73 | ) | | | 8.06 | | | | 0.98 | |
| Total from investment operations | | | (1.34 | ) | | | (1. 21) | | | | 8.45 | | | | 1.14 | |
| Less Distributions From: | | | | | | | | | | | | | | | | |
| Net investment income | | | (0.58 | ) | | | (0.44 | ) | | | (0.42 | ) | | | (0.21 | ) |
| Capital gains | | | (2.01 | ) | | | (3.21 | ) | | | – | | | | – | |
| Total distributions | | | (2.59 | ) | | | (3.65 | ) | | | (0.42 | ) | | | (0.21 | ) |
| Net Increase (decrease) in net asset value | | | (3.93 | ) | | | (4.86 | ) | | | 8.03 | | | | 0.93 | |
| Net Asset Value at end of period | | $ | 25.34 | | | $ | 29.27 | | | $ | 34.13 | | | $ | 26.10 | |
| Total Return (%)2 | | | (5.23 | ) | | | (4.23 | ) | | | 32.52 | | | | 4.53 | 3 |
| Ratios/Supplemental Data: | | | | | | | | | | | | | | | | |
| Net Assets at end of period (in 000’s) | | $ | 48,746 | | | $ | 55,902 | | | $ | 62,716 | | | $ | 51,207 | |
| Ratios of expenses to average net assets (%) | | | 1.16 | | | | 1.16 | | | | 1.16 | | | | 1.17 | 4 |
| Ratio of net investment income to average net assets (%) | | | 1.97 | | | | 1.64 | | | | 1.25 | | | | 1.09 | 4 |
| Portfolio turnover (%)5 | | | 26 | | | | 33 | | | | 31 | | | | 33 | 3 |
* Class A shares commenced operations effective June 1, 2020.
1 Net investment income (loss) calculated excluding permanent tax adjustments to undistributed net investment income.
2 Total return without applicable sales charge.
3 Not annualized.
4 Annualized.
5 Portfolio turnover is calculated at the fund level and represents the entire fiscal year or period.
| | | DIVIDEND INCOME FUND | |
| | | CLASS Y | |
| | | Year Ended October 31, | |
| | | 2023 | | | 2022 | | | 2021 | | | 2020 | | | 2019 | |
| Net Asset Value at beginning of period | | $ | 29.29 | | | $ | 34.19 | | | $ | 26.14 | | | $ | 27.65 | | | $ | 27.01 | |
| Income from Investment Operations: | | | | | | | | | | | | | | | | | | | | |
| Net investment income | | | 0.69 | | | | 0.60 | | | | 0.50 | | | | 0.51 | 1 | | | 0.46 | 1 |
| Net realized and unrealized gain (loss) on investments | | | (1.96 | ) | | | (1.73 | ) | | | 8.03 | | | | (0.88 | ) | | | 3.12 | |
| Total from investment operations | | | (1.27 | ) | | | (1. 13) | | | | 8.53 | | | | (0.37 | ) | | | 3.58 | |
| Less Distributions From: | | | | | | | | | | | | | | | | | | | | |
| Net investment income | | | (0.65 | ) | | | (0.56 | ) | | | (0.48 | ) | | | (0.45 | ) | | | (0.43 | ) |
| Capital gains | | | (2.01 | ) | | | (3.21 | ) | | | – | | | | (0.69 | ) | | | (2.51 | ) |
| Total distributions | | | (2.66 | ) | | | (3.77 | ) | | | (0.48 | ) | | | (1.14 | ) | | | (2.94 | ) |
| Net Increase (decrease) in net asset value | | | (3.93 | ) | | | (4.90 | ) | | | 8.05 | | | | (1.51 | ) | | | 0.64 | |
| Net Asset Value at end of period | | $ | 25.36 | | | $ | 29.29 | | | $ | 34.19 | | | $ | 26.14 | | | $ | 27.65 | |
| Total Return (%)2 | | | (4.99 | ) | | | (3.98 | ) | | | 32.81 | | | | (1.42 | ) | | | 15.48 | |
| Ratios/Supplemental Data: | | | | | | | | | | | | | | | | | | | | |
| Net Assets at end of period (in 000’s) | | $ | 98,291 | | | $ | 165,998 | | | $ | 188,287 | | | $ | 171,733 | | | $ | 220,725 | |
| Ratios of expenses to average net assets: | | | | | | | | | | | | | | | | | | | | |
| Before reimbursement of expenses by Adviser (%) | | | 0.91 | | | | 0.91 | | | | 0.91 | | | | 1.02 | | | | 1.10 | |
| After reimbursement of expenses by Adviser (%) | | | 0.91 | | | | 0.91 | | | | 0.91 | | | | 0.93 | | | | 0.95 | |
| Ratio of net investment income (loss) to average net assets | | | | | | | | | | | | | | | | | | | | |
| Before reimbursement of expenses by Adviser (%) | | | 2.23 | | | | 1.89 | | | | 1.50 | | | | 1.72 | | | | 1.64 | |
| After reimbursement and waiver of expenses by Adviser (%) | | | 2.23 | | | | 1.89 | | | | 1.50 | | | | 1.81 | | | | 1.79 | |
| Portfolio turnover (%)3 | | | 26 | | | | 33 | | | | 31 | | | | 33 | | | | 28 | |
1 Net investment income (loss) calculated excluding permanent tax adjustments to undistributed net investment income.
2 Total return without applicable sales charge.
3 Portfolio turnover is calculated at the fund level and represents the entire fiscal year or period.
See accompanying Notes to Financial Statements.
Madison Funds | October 31, 2023
Financial Highlights for a Share of Beneficial Interest Outstanding - continued
| | | DIVIDEND INCOME FUND | |
| | | CLASS I | |
| | | Year Ended October 31, | | | | Period Ended October 31, | |
| | | | 2023 | | | | 2022 | | | | 2021 | | | | 20201 | |
| Net Asset Value at beginning of period | | $ | 29.27 | | | $ | 34.20 | | | $ | 26.14 | | | $ | 27.19 | |
| Income from Investment Operations: | | | | | | | | | | | | | | | | |
| Net investment income | | | 0.67 | | | | 0.63 | | | | 0.52 | | | | 0.06 | 2 |
| Net realized and unrealized gain (loss) on investments | | | (1.91 | ) | | | (1.73 | ) | | | 8.05 | | | | (1.02 | ) |
| Total from investment operations | | | (1.24 | ) | | | (1.10 | ) | | | 8.57 | | | | (0.96 | ) |
| Less Distributions From: | | | | | | | | | | | | | | | | |
| Net investment income | | | (0.68 | ) | | | (0.62 | ) | | | (0.51 | ) | | | (0.09 | ) |
| Capital gains | | | (2.01 | ) | | | (3.21 | ) | | | – | | | | – | |
| Total distributions | | | (2.69 | ) | | | (3.83 | ) | | | (0.51 | ) | | | (0.09 | ) |
| Net Increase (decrease) in net asset value | | | (3.93 | ) | | | (4.93 | ) | | | 8.06 | | | | (1.05 | ) |
| Net Asset Value at end of period | | $ | 25.34 | | | $ | 29.27 | | | $ | 34.20 | | | $ | 26.14 | |
| Total Return (%)3 | | | (4.90 | ) | | | (3.88 | ) | | | 32.95 | | | | (3.53 | )4 |
| Ratios/Supplemental Data: | | | | | | | | | | | | | | | | |
| Net Assets at end of period (in 000’s) | | $ | 38,826 | | | $ | 59,812 | | | $ | 72,215 | | | $ | 51,725 | |
| Ratios of expenses to average net assets: | | | | | | | | | | | | | | | | |
| Before reimbursement of expenses by Adviser (%) | | | 0.81 | | | | 0.81 | | | | 0.81 | | | | 0.82 | 5 |
| After reimbursement of expenses by Adviser (%) | | | 0.81 | | | | 0.81 | | | | 0.81 | | | | 0.82 | 5 |
| Ratio of net investment income (loss) to average net assets | | | | | | | | | | | | | | | | |
| Before reimbursement of expenses by Adviser (%) | | | 2.34 | | | | 2.02 | | | | 1.60 | | | | 1.55 | 5 |
| After reimbursement and waiver of expenses by Adviser (%) | | | 2.34 | | | | 2.02 | | | | 1.60 | | | | 1.55 | 5 |
| Portfolio turnover (%)6 | | | 26 | | | | 33 | | | | 31 | | | | 33 | 4 |
1 Class I shares commenced operations effective September 1, 2020.
2 Net investment income (loss) calculated excluding permanent tax adjustments to undistributed net investment income.
3 Total return without applicable sales charge.
4 Not annualized.
5 Annualized.
6 Portfolio turnover is calculated at the fund level and represents the entire fiscal year or period.
| | | DIVIDEND INCOME FUND | |
| | | CLASS R6 | |
| | | Year Ended | | | Period Ended | |
| | | October 31, | | | October 31, | |
| | | 2023 | | | 2022* | |
| Net Asset Value at beginning of period | | $ | 29.28 | | | $ | 31.05 | |
| Income from Investment Operations: | | | | | | | | |
| Net investment income | | | 0.63 | | | | 0.39 | |
| Net realized and unrealized gain (loss) on investments | | | (1.85 | ) | | | (1.72 | ) |
| Total from investment operations | | | (1.22 | ) | | | (1.33 | ) |
| Less Distributions From: | | | | | | | | |
| Net investment income | | | (0.70 | ) | | | (0.44 | ) |
| Capital gains | | | (2.01 | ) | | | – | |
| Total distributions | | | (2.71 | ) | | | (0.44 | ) |
| Net Increase (decrease) in net asset value | | | (3.93 | ) | | | (1.77 | ) |
| Net Asset Value at end of period | | $ | 25.35 | | | $ | 29.28 | |
| Total Return (%)1 | | | (4.82 | ) | | | (4.25 | )2 |
| Ratios/Supplemental Data: | | | | | | | | |
| Net Assets at end of period (in 000’s) | | $ | 11,657 | | | $ | 19,575 | |
| Ratios of expenses to average net assets: | | | | | | | | |
| Before reimbursement of expenses by Adviser (%) | | | 0.73 | | | | 0.73 | 3 |
| After reimbursement of expenses by Adviser (%) | | | 0.73 | | | | 0.73 | 3 |
| Ratio of net investment income (loss) to average net assets | | | | | | | | |
| After reimbursement and waiver of expenses by Adviser (%) | | | 2.41 | | | | 2.03 | |
| Portfolio turnover (%)4 | | | 26 | | | | 33 | 2 |
* Class R6 shares commenced operations effective March 1, 2022.
1 Total return without applicable sales charge.
2 Not annualized.
3 Annualized.
4 Portfolio turnover is calculated at the fund level and represents the entire fiscal year or period.
See accompanying Notes to Financial Statements.
Madison Funds | October 31, 2023
Financial Highlights for a Share of Beneficial Interest Outstanding – continued
| | | INVESTORS FUND | |
| | | CLASS A | | | CLASS Y | | | CLASS R6 | |
| | | Year Ended October 31, | | | Year Ended October 31, | | | Year Ended October 31, | |
| | | 2023 | | | 2022 | | | 2021 | | | 2020 | | | 2019 | | | 2023 | | | 2022 | | | 2021 | | | 2020 | | | 2019 | | | 2023 | | | 2022 | | | 2021 | | | 2020 | | | 2019 | |
| Net Asset Value at beginning of period | | $ | 23.65 | | | $ | 28.72 | | | $ | 23.81 | | | $ | 23.76 | | | $ | 23.85 | | | $ | 23.72 | | | $ | 28.78 | | | $ | 23.84 | | | $ | 23.83 | | | $ | 23.92 | | | $ | 23.95 | | | $ | 29.09 | | | $ | 24.12 | | | $ | 24.06 | | | $ | 24.07 | |
| Income from Investment Operations: | | | | | | | | | | | | | | | | | | | | | | | | | | | | | | | | | | | | | | | | | | | | | | | | | | | | | | | | | | | | |
| Net investment income (loss) | | | (0.01 | ) | | | (0.01 | ) | | | (0.01 | ) | | | 0.04 | 1 | | | 0.06 | 1 | | | 0.06 | | | | 0.05 | | | | 0.12 | | | | 0.14 | 1 | | | 0.12 | 1 | | | 0.11 | | | | 0.08 | | | | 0.11 | | | | 0.03 | 1 | | | 0.16 | 1 |
| Net realized and unrealized gain (loss) on investments | | | 3.09 | | | | (2.92 | ) | | | 7.29 | | | | 1.31 | | | | 3.39 | | | | 3.09 | | | | (2.93 | ) | | | 7.24 | | | | 1.29 | | | | 3.39 | | | | 3.10 | | | | (2.93 | ) | | | 7.37 | | | | 1.45 | | | | 3.43 | |
| Total from investment operations | | | 3.08 | | | | (2.93 | ) | | | 7.28 | | | | 1.35 | | | | 3.45 | | | | 3.15 | | | | (2.88 | ) | | | 7.36 | | | | 1.43 | | | | 3.51 | | | | 3.21 | | | | (2.85 | ) | | | 7.48 | | | | 1.48 | | | | 3.59 | |
| Less Distributions From: | | | | | | | | | | | | | | | | | | | | | | | | | | | | | | | | | | | | | | | | | | | | | | | | | | | | | | | | | | | | |
| Net investment income | | | – | | | | – | | | | – | | | | – | | | | (0.10 | ) | | | (0.06 | ) | | | (0.04 | ) | | | (0.05 | ) | | | (0.12 | ) | | | (0.16 | ) | | | (0.14 | ) | | | (0.15 | ) | | | (0.14 | ) | | | (0.12 | ) | | | (0.16 | ) |
| Capital gains | | | (1.45 | ) | | | (2.14 | ) | | | (2.37 | ) | | | (1.30 | ) | | | (3.44 | ) | | | (1.45 | ) | | | (2.14 | ) | | | (2.37 | ) | | | (1.30 | ) | | | (3.44 | ) | | | (1.45 | ) | | | (2.14 | ) | | | (2.37 | ) | | | (1.30 | ) | | | (3.44 | ) |
| Total distributions | | | (1.45 | ) | | | (2.14 | ) | | | (2.37 | ) | | | (1.30 | ) | | | (3.54 | ) | | | (1.51 | ) | | | (2.18 | ) | | | (2.42 | ) | | | (1.42 | ) | | | (3.60 | ) | | | (1.59 | ) | | | (2.29 | ) | | | (2.51 | ) | | | (1.42 | ) | | | (3.60 | ) |
| Net increase (decrease) in net asset value | | | 1.63 | | | | (5.07 | ) | | | 4.91 | | | | 0.05 | | | | (0.09 | ) | | | 1.64 | | | | (5.06 | ) | | | 4.94 | | | | 0.01 | | | | (0.09 | ) | | | 1.62 | | | | (5.14 | ) | | | 4.97 | | | | 0.06 | | | | (0.01 | ) |
| Net Asset Value at end of period | | $ | 25.28 | | | $ | 23.65 | | | $ | 28.72 | | | $ | 23.81 | | | $ | 23.76 | | | $ | 25.36 | | | $ | 23.72 | | | $ | 28.78 | | | $ | 23.84 | | | $ | 23.83 | | | $ | 25.57 | | | $ | 23.95 | | | $ | 29.09 | | | $ | 24.12 | | | $ | 24.06 | |
| Total Return (%)2 | | | 13.75 | | | | (11.33 | ) | | | 32.37 | | | | 5.75 | | | | 18.37 | | | | 14.03 | | | | (11.13 | ) | | | 32.72 | | | | 6.06 | | | | 18.63 | | | | 14.23 | | | | (10.96 | ) | | | 32.96 | | | | 6.21 | | | | 18.88 | |
| Ratios/Supplemental Data: | | | | | | | | | | | | | | | | | | | | | | | | | | | | | | | | | | | | | | | | | | | | | | | | | | | | | | | | | | | | |
| Net Assets at end of period (in 000’s) | | $ | 93,711 | | | $ | 88,286 | | | $ | 108,515 | | | $ | 88,934 | | | $ | 86,476 | | | $ | 97,446 | | | $ | 89,391 | | | $ | 112,166 | | | $ | 157,991 | | | $ | 244,443 | | | $ | 61,787 | | | $ | 50,843 | | | $ | 84,331 | | | $ | 70,490 | | | $ | 8,063 | |
| Ratios of expenses to average net | | | | | | | | | | | | | | | | | | | | | | | | | | | | | | | | | | | | | | | | | | | | | | | | | | | | | | | | | | | | |
| assets (%) | | | 1.16 | | | | 1.16 | | | | 1.16 | | | | 1.18 | | | | 1.20 | | | | 0.91 | | | | 0.91 | | | | 0.91 | | | | 0.94 | | | | 0.95 | | | | 0.73 | | | | 0.73 | | | | 0.73 | | | | 0.74 | | | | 0.77 | |
| Ratio of net investment income (loss) to | | | | | | | | | | | | | | | | | | | | | | | | | | | | | | | | | | | | | | | | | | | | | | | | | | | | | | | | | | | | |
| average net assets (%) | | | (0.03 | ) | | | (0.05 | ) | | | (0.03 | ) | | | 0.18 | | | | 0.23 | | | | 0.22 | | | | 0.21 | | | | 0.25 | | | | 0.54 | | | | 0.47 | | | | 0.40 | | | | 0.41 | | | | 0.39 | | | | 0.26 | | | | 0.65 | |
| Portfolio turnover (%)3 | | | 22 | | | | 18 | | | | 17 | | | | 41 | | | | 23 | | | | 22 | | | | 18 | | | | 17 | | | | 41 | | | | 23 | | | | 22 | | | | 18 | | | | 17 | | | | 41 | | | | 23 | |
1 Net investment income (loss) calculated excluding permanent tax adjustments to undistributed net investment income.
2 Total return without applicable sales charge.
3 Portfolio turnover is calculated at the fund level and represents the entire fiscal year or period.
| | | INVESTORS FUND | |
| | | CLASS I | |
| | | Year Ended October 31, | | | Period Ended October 31, | |
| | | 2023 | | | 2022 | | | 2021 | | | 20201 | |
| Net Asset Value at beginning of period | | $ | 23.67 | | | $ | 28.75 | | | $ | 23.84 | | | $ | 24.51 | |
| Income from Investment Operations: | | | | | | | | | | | | | | | | |
| Net investment income | | | 0.10 | | | | 0.07 | | | | 0.10 | | | | 0.00 | 2,3 |
| Net realized and unrealized gain (loss) on investments | | | 3.07 | | | | (2.91 | ) | | | 7.28 | | | | (0.67 | ) |
| Total from investment operations | | | 3.17 | | | | (2.84 | ) | | | 7.38 | | | | (0.67 | ) |
| Less Distributions From: | | | | | | | | | | | | | | | | |
| Net investment income | | | (0.11 | ) | | | (0.10 | ) | | | (0.10 | ) | | | – | |
| Capital gains | | | (1.45 | ) | | | (2.14 | ) | | | (2.37 | ) | | | – | |
| Total distributions | | | (1.56 | ) | | | (2.2 4) | | | | (2.47 | ) | | | – | |
| Net Increase (decrease) in net asset value | | | 1.61 | | | | (5.08 | ) | | | 4.91 | | | | (0.67 | ) |
| Net Asset Value at end of period | | $ | 25.28 | | | $ | 23.67 | | | $ | 28.75 | | | $ | 23.84 | |
| Total Return (%)4 | | | 14.17 | | | | (11.03 | ) | | | 32.87 | | | | (2.73 | )5 |
| Ratios/Supplemental Data: | | | | | | | | | | | | | | | | |
| Net Assets at end of period (in 000’s) | | $ | 80,308 | | | $ | 71,885 | | | $ | 104,617 | | | $ | 20,643 | |
| Ratios of expenses to average net assets (%) | | | 0.81 | | | | 0.81 | | | | 0.81 | | | | 0.826 | |
| Ratio of net investment income (loss) to average net assets (%) | | | 0.31 | | | | 0.31 | | | | 0.30 | | | | 0.026 | |
| Portfolio turnover (%)7 | | | 22 | | | | 18 | | | | 17 | | | | 41 | 5 |
1 Class I shares commenced operations effective September 1, 2020.
2 Amounts represent less than $ 0.005 per share.
3 Net investment income (loss) calculated excluding permanent tax adjustments to undistributed net investment income.
4 Total return without applicable sales charge.
5 Not annualized.
6 Annualized.
7 Portfolio turnover is calculated at the fund level and represents the entire fiscal year or period.
See accompanying Notes to Financial Statements.
Madison Funds | October 31, 2023
Financial Highlights for a Share of Beneficial Interest Outstanding – continued
| | | SUSTAINABLE EQUITY FUND | |
| | | CLASS Y | | | CLASS I | |
| | | Year Ended | | | Period Ended | | | Year Ended | | | Period Ended | |
| | | October 31, | | | October 31, | | | October 31, | | | October 31, | |
| | | 2023 | | | 20221 | | | 2023 | | | 20221 | |
| Net Asset Value at beginning of period | | $ | 8.21 | | | $ | 10.00 | | | $ | 8.22 | | | $ | 10.00 | |
| Income from Investment Operations: | | | | | | | | | | | | | | | | |
| Net investment income | | | 0.07 | | | | 0.03 | | | | 0.09 | | | | 0.03 | |
| Net realized and unrealized gain (loss) on investments | | | 0.34 | | | | (1.82 | ) | | | 0.33 | | | | (1.81 | ) |
| Total from investment operations | | | 0.41 | | | | (1.79 | ) | | | 0.42 | | | | (1.78 | ) |
| Less Distributions From: | | | | | | | | | | | | | | | | |
| Net investment income | | | (0.04 | ) | | | – | | | | (0.05 | ) | | | – | |
| Total distributions | | | (0.04 | ) | | | – | | | | (0.05 | ) | | | – | |
| Net increase (decrease) in net asset value | | | 0.37 | | | | (1.79 | ) | | | 0.37 | | | | (1.78 | ) |
| Net Asset Value at end of period | | $ | 8.58 | | | $ | 8.21 | | | $ | 8.59 | | | $ | 8.22 | |
| Total Return (%)2 | | | 5.00 | | | | (17.90 | )3 | | | 5.10 | | | | (17.80 | )3 |
| Ratios/Supplemental Data: | | | | | | | | | | | | | | | | |
| Net Assets at end of period (in 000’s) | | $ | 101 | | | $ | 82 | | | $ | 7,958 | | | $ | 9,198 | |
| Ratios of expenses to average net assets (%) | | | 0.91 | | | | 0.894 | | | | 0.81 | | | | 0.81 | 4 |
| Ratio of net investment income (loss) to average net assets (%) | | | 0.82 | | | | 0.464 | | | | 0.93 | | | | 0.60 | 4 |
| Portfolio turnover (%)5 | | | 34 | | | | 12 | 3 | | | 34 | | | | 12 | 3 |
1 The Sustainable Equity Fund was launched on December 31, 2021 and commenced operations effective January 3, 2022.
2 Total return without applicable sales charge.
3 Not annualized.
4 Annualized.
5 Portfolio turnover is calculated at the fund level and represents the entire fiscal year or period.
See accompanying Notes to Financial Statements.
Madison Funds | October 31, 2023
Financial Highlights for a Share of Beneficial Interest Outstanding – continued
| | | MID CAP FUND | |
| | | CLASS A | |
| | | Year Ended October 31, | |
| | | 2023 | | | 2022 | | | 2021 | | | 2020 | | | 2019 | |
| Net Asset Value at beginning of period | | $ | 11.68 | | | $ | 13.68 | | | $ | 10.26 | | | $ | 11.09 | | | $ | 9.77 | |
| Income from Investment Operations: | | | | | | | | | | | | | | | | | | | | |
| Net investment loss | | | (0.04 | ) | | | (0.09 | ) | | | (0.07 | ) | | | (0.08 | )1 | | | (0.07 | )1 |
| Net realized and unrealized gain (loss) on investments | | | 1.27 | | | | (1.27 | ) | | | 3.91 | | | | (0.32 | ) | | | 2.07 | |
| Total from investment operations | | | 1.23 | | | | (1.36 | ) | | | 3.84 | | | | (0.40 | ) | | | 2.00 | |
| Less Distributions From: | | | | | | | | | | | | | | | | | | | | |
| Capital gains | | | (0.25 | ) | | | (0.64 | ) | | | (0.42 | ) | | | (0.43 | ) | | | (0.68 | ) |
| Total distributions | | | (0.25 | ) | | | (0.64 | ) | | | (0.42 | ) | | | (0.43 | ) | | | (0.68 | ) |
| Net increase (decrease) in net asset value | | | 0.98 | | | | (2.00 | ) | | | 3.42 | | | | (0.83 | ) | | | 1.32 | |
| Net Asset Value at end of period | | $ | 12.66 | | | $ | 11.68 | | | $ | 13.68 | | | $ | 10.26 | | | $ | 11.09 | |
| Total Return (%)2 | | | 10.68 | | | | (10.62 | ) | | | 38.24 | | | | (3.81 | ) | | | 22.65 | |
| Ratios/Supplemental Data: | | | | | | | | | | | | | | | | | | | | |
| Net Assets at end of period (in 000’s) | | $ | 66,717 | | | $ | 63,417 | | | $ | 76,625 | | | $ | 58,782 | | | $ | 66,250 | |
| Ratios of expenses to average net assets (%) | | | 1.39 | | | | 1.40 | | | | 1.39 | | | | 1.40 | | | | 1.40 | |
| Ratio of net investment income to average net assets (%) | | | (0.25 | ) | | | (0.59 | ) | | | (0.50 | ) | | | (0.64 | ) | | | (0.59 | ) |
| Portfolio turnover (%)3 | | | 10 | | | | 24 | | | | 24 | | | | 24 | | | | 25 | |
1 Net investment income (loss) calculated excluding permanent tax adjustments to undistributed net investment income.
2 Total return without applicable sales charge.
3 Portfolio turnover is calculated at the fund level and represents the entire fiscal year or period.
| | | MID CAP FUND | |
| | | CLASS Y | |
| | | Year Ended October 31, | |
| | | 2023 | | | 2022 | | | 2021 | | | 2020 | | | 2019 | |
| Net Asset Value at beginning of period | | $ | 12.58 | | | $ | 14.62 | | | $ | 10.89 | | | $ | 11.71 | | | $ | 10.23 | |
| Income from Investment Operations: | | | | | | | | | | | | | | | | | | | | |
| Net investment income (loss) | | | 0.03 | | | | (0.03 | ) | | | 0.02 | | | | (0.03 | )1 | | | (0.02 | )1 |
| Net realized and unrealized gain (loss) on investments | | | 1.36 | | | | (1.37 | ) | | | 4.13 | | | | (0.36 | ) | | | 2.18 | |
| Total from investment operations | | | 1.39 | | | | (1.40 | ) | | | 4.15 | | | | (0.39 | ) | | | 2.16 | |
| Less Distributions From: | | | | | | | | | | | | | | | | | | | | |
| Net Investment Income | | | – | | | | (0.00 | )2 | | | – | | | | (0.00 | )2 | | | – | |
| Capital gains | | | (0.25 | ) | | | (0.64 | ) | | | (0.42 | ) | | | (0.43 | ) | | | (0.68 | ) |
| Total distributions | | | (0.25 | ) | | | (0.64 | ) | | | (0.42 | ) | | | (0.43 | ) | | | (0.68 | ) |
| Net increase (decrease) in net asset value | | | 1.14 | | | | (2.04 | ) | | | 3.73 | | | | (0.82 | ) | | | 1.48 | |
| Net Asset Value at end of period | | $ | 13.72 | | | $ | 12.58 | | | $ | 14.62 | | | $ | 10.89 | | | $ | 11.71 | |
| Total Return (%)3 | | | 11.20 | | | | (10.17 | ) | | | 38.89 | | | | (3.52 | ) | | | 23.27 | |
| Ratios/Supplemental Data: | | | | | | | | | | | | | | | | | | | | |
| Net Assets at end of period (in 000’s) | | $ | 260,474 | | | $ | 253,477 | | | $ | 263,892 | | | $ | 323,841 | | | $ | 463,768 | |
| Ratios of expenses to average net assets (%) | | | 0.94 | | | | 0.95 | | | | 0.95 | | | | 0.97 | | | | 0.98 | |
| Ratio of net investment income loss to average net assets (%) | | | 0.20 | | | | (0.14 | ) | | | (0.04 | ) | | | (0.20 | ) | | | (0.18 | ) |
| Portfolio turnover (%)4 | | | 10 | | | | 24 | | | | 24 | | | | 24 | | | | 25 | |
1 Net investment income (loss) calculated excluding permanent tax adjustments to undistributed net investment income.
2 Amounts represent less than $ (0.005) per share.
3 Total return without applicable sales charge.
4 Portfolio turnover is calculated at the fund level and represents the entire fiscal year or period.
See accompanying Notes to Financial Statements.
Madison Funds | October 31, 2023
Financial Highlights for a Share of Beneficial Interest Outstanding - continued
| | | MID CAP FUND | |
| | | CLASS I | |
| | | Year Ended October 31, | | | | Period Ended October 31, | |
| | | | 2023 | | | | 2022 | | | | 2021 | | | | 20201 | |
| Net Asset Value at beginning of period | | $ | 12.60 | | | $ | 14.64 | | | $ | 10.90 | | | $ | 11.21 | |
| Income from Investment Operations: | | | | | | | | | | | | | | | | |
| Net investment income (loss) | | | 0.04 | | | | 0.00 | 2 | | | (0.03 | ) | | | 0.01 | 3 |
| Net realized and unrealized gain (loss) on investments | | | 1.36 | | | | (1.38 | ) | | | 4.19 | | | | (0.30 | ) |
| Total from investment operations | | | 1.40 | | | | (1.38 | ) | | | 4.16 | | | | (0.31 | ) |
| Less Distributions From: | | | | | | | | | | | | | | | | |
| Net Investment Income | | | – | | | | (0.0 2) | | | | (0.00 | )2 | | | – | |
| Capital gains | | | (0.25 | ) | | | (0.64 | ) | | | (0.42 | ) | | | – | |
| Total distributions | | | (0.25 | ) | | | (0.66 | ) | | | (0.42 | ) | | | – | |
| Net increase (decrease) in net asset value | | | 1.15 | | | | (2.04 | ) | | | 3.74 | | | | (0.31 | ) |
| Net Asset Value at end of period | | $ | 13.75 | | | $ | 12.60 | | | $ | 14.64 | | | $ | 10.90 | |
| Total Return (%)4 | | | 11.26 | | | | (10.08 | ) | | | 39.01 | | | | (2.77 | )5 |
| Ratios/Supplemental Data: | | | | | | | | | | | | | | | | |
| Net Assets at end of period (in 000’s) | | $ | 376,668 | | | $ | 274,918 | | | $ | 286,235 | | | $ | 61,805 | |
| Ratios of expenses to average net assets (%) | | | 0.84 | | | | 0.85 | | | | 0.85 | | | | 0.86 | 6 |
| Ratio of net investment income to average net assets (%) | | | 0.28 | | | | (0.04 | ) | | | (0.01 | ) | | | (0.43 | )6 |
| Portfolio turnover (%)7 | | | 10 | | | | 24 | | | | 24 | | | | 24 | 5 |
1 Class I shares commenced operations effective September 1, 2020.
2 Amounts represent less than $ (0.005) per share.
3 Net investment income (loss) calculated excluding permanent tax adjustments to undistributed net investment income.
4 Total return without applicable sales charge.
5 Not annualized.
6 Annualized.
7 Portfolio turnover is calculated at the fund level and represents the entire fiscal year or period.
| | | MID CAP FUND |
| | | CLASS R6 | |
| | | Year Ended October 31, | |
| | | 2023 | | | 2022 | | | 2021 | | | 2020 | | | 2019 | |
| Net Asset Value at beginning of period | | $ | 12.94 | | | $ | 15.04 | | | $ | 11.19 | | | $ | 11.99 | | | $ | 10.44 | |
| Income from Investment Operations: | | | | | | | | | | | | | | | | | | | | |
| Net investment income (loss) | | | 0.04 | | | | 0.01 | | | | 0.02 | | | | (0.02 | )1 | | | (0.10 | )1 |
| Net realized and unrealized gain (loss) on investments | | | 1.42 | | | | (1.43 | ) | | | 4.27 | | | | (0.35 | ) | | | 2.33 | |
| Total from investment operations | | | 1.46 | | | | (1.42 | ) | | | 4.29 | | | | (0.37 | ) | | | 2.23 | |
| Less Distributions From: | | | | | | | | | | | | | | | | | | | | |
| Net Investment Income | | | – | | | | (0.04 | ) | | | (0.02 | ) | | | (0.00 | )2 | | | – | |
| Capital gains | | | (0.25 | ) | | | (0.64 | ) | | | (0.42 | ) | | | (0.43 | ) | | | (0.68 | ) |
| Total distributions | | | (0.25 | ) | | | (0.68 | ) | | | (0.44 | ) | | | (0.43 | ) | | | (0.68 | ) |
| Net increase (decrease) in net asset value | | | 1.21 | | | | (2.10 | ) | | | 3.85 | | | | (0.80 | ) | | | 1.55 | |
| Net Asset Value at end of period | | $ | 14.15 | | | $ | 12.94 | | | $ | 15.04 | | | $ | 11.19 | | | $ | 11.99 | |
| Total Return (%)3 | | | 11.43 | | | | (10.07 | ) | | | 39.20 | | | | (3.26 | ) | | | 23.49 | |
| Ratios/Supplemental Data: | | | | | | | | | | | | | | | | | | | | |
| Net Assets at end of period (in 000’s) | | $ | 114,320 | | | $ | 88,723 | | | $ | 105,878 | | | $ | 91,562 | | | $ | 55,417 | |
| Ratios of expenses to average net assets (%) | | | 0.76 | | | | 0.77 | | | | 0.77 | | | | 0.77 | | | | 0.76 | |
| Ratio of net investment income to average net assets (%) | | | 0.37 | | | | 0.05 | | | | 0.14 | | | | (0.03 | ) | | | (0.06 | ) |
| Portfolio turnover (%)4 | | | 10 | | | | 24 | | | | 24 | | | | 24 | | | | 25 | |
1 Net investment income (loss) calculated excluding permanent tax adjustments to undistributed net investment income.
2 Amounts represent less than $0.005 per share.
3 Total return without applicable sales charge.
4 Portfolio turnover is calculated at the fund level and represents the entire fiscal year or period.
See accompanying Notes to Financial Statements.
Madison Funds | October 31, 2023
Financial Highlights for a Share of Beneficial Interest Outstanding – continued
| | | SMALL CAP FUND | |
| | | CLASS A | |
| | | | | | | | | | | | | | | Period Ended | | | Inception to | |
| | | Year Ended October 31, | | | October 31, | | | September 30, | |
| | | 2023 | | | 2022 | | | 2021 | | | 2020 | | | 20192 | | | 20191 | |
| Net Asset Value at beginning of period | | $ | 9.22 | | | $ | 15.55 | | | $ | 11.04 | | | $ | 11.14 | | | $ | 10.82 | | | $ | 10.53 | |
| Income from Investment Operations: | | | | | | | | | | | | | | | | | | | | | | | | |
| Net investment income (loss) | | | (0.04 | ) | | | (0.05 | ) | | | (0.09 | ) | | | (0.02 | )3 | | | (0.01 | )3 | | | (0.01 | )3 |
| Net realized and unrealized gain (loss) on investments | | | (0.14 | ) | | | (2.81 | ) | | | 5.46 | | | | 0.36 | | | | 0.33 | | | | 0.30 | |
| Total from investment operations | | | (0.18 | ) | | | (2.86 | ) | | | 5.37 | | | | 0.34 | | | | 0.32 | | | | 0.29 | |
| Less Distributions From: | | | | | | | | | | | | | | | | | | | | | | | | |
| Capital gains | | | (0.48 | ) | | | (3.47 | ) | | | (0.86 | ) | | | (0.44 | ) | | | – | | | | – | |
| Total distributions | | | (0.48 | ) | | | (3.47 | ) | | | (0.86 | ) | | | (0.44 | ) | | | – | | | | – | |
| Net increase (decrease) in net asset value | | | (0.66 | ) | | | (6.33 | ) | | | 4.51 | | | | (0.10 | ) | | | 0.32 | | | | 0.29 | |
| Net Asset Value at end of period | | $ | 8.56 | | | $ | 9.22 | | | $ | 15.55 | | | $ | 11.04 | | | $ | 11.14 | | | $ | 10.82 | |
| Total Return (%)4 | | | (1.94 | ) | | | (23.74 | ) | | | 50.17 | | | | 3.02 | | | | 2.96 | 5 | | | 2.75 | 5 |
| Ratios/Supplemental Data: | | | | | | | | | | | | | | | | | | | | | | | | |
| Net Assets at end of period (in 000’s) $ | | | 3,275 | | | $ | 3,417 | | | $ | 4,847 | | | $ | 2,958 | | | $ | 3,457 | | | $ | 3,420 | |
| Ratios of expenses to average net assets: | | | | | | | | | | | | | | | | | | | | | | | | |
| Before reimbursement of expenses by Adviser (%) | | | 1.35 | | | | 1.35 | | | | 1.39 | | | | 1.51 | | | | 1.50 | 6 | | | 1.50 | 6 |
| After reimbursement of expenses by Adviser (%). | | | 1.35 | | | | 1.35 | | | | 1.38 | | | | 1.47 | | | | 1.46 | 6 | | | 1.46 | 6 |
| Ratio of net investment income to average net assets | | | | | | | | | | | | | | | | | | | | | | | | |
| Before reimbursement of expenses by Adviser (%) | | | (0.42 | ) | | | (0.52 | ) | | | (0.67 | ) | | | (0.18 | ) | | | (1.07 | )6 | | | (1.28 | )6 |
| After reimbursement of expenses by Adviser (%). | | | (0.42 | ) | | | (0.52 | ) | | | (0.66 | ) | | | (0.14 | ) | | | (1.03 | )6 | | | (1.24 | )6 |
| Portfolio turnover (%)7 | | | 39 | | | | 41 | | | | 44 | | | | 47 | | | | 3 | | | | 73 | 5 |
1 For accounting purposes, the Small Cap Fund Class A is treated as having commenced investment operations on August 31, 2019.
2 Disclosure represents the period October 1, 2019 to October 31, 2019.
3 Net investment income (loss) calculated excluding permanent tax adjustments to undistributed net investment income.
4 Total return without applicable sales charge.
5 Not annualized.
6 Annualized.
7 Portfolio turnover is calculated at the fund level and is not annualized for periods less than one year.
| | | SMALL CAP FUND | |
| | | CLASS Y | |
| | | | | | | | | | | | | | | Period Ended | | | Year Ended | |
| | | Year Ended October 31, | | | October 31, | | | September 30, | |
| | | 2023 | | | 2022 | | | 2021 | | | 2020 | | | 20191 | | | 2019 | |
| Net Asset Value at beginning of period | | $ | 9.35 | | | $ | 15.69 | | | $ | 11.11 | | | $ | 11.19 | | | $ | 10.87 | | | $ | 15.56 | |
| Income from Investment Operations: | | | | | | | | | | | | | | | | | | | | | | | | |
| Net investment income (loss) | | | (0.02 | ) | | | (0.03 | ) | | | (0.07 | ) | | | 0.02 | 2 | | | (0.01 | )2 | | | (0.04 | )2 |
| Net realized and unrealized gain (loss) on investments | | | (0.14 | ) | | | (2.84 | ) | | | 5.51 | | | | 0.35 | | | | 0.33 | | | | (1.39 | ) |
| Total from investment operations | | | (0.16 | ) | | | (2.87 | ) | | | 5.44 | | | | 0.37 | | | | 0.32 | | | | (1.43 | ) |
| Less Distributions From: | | | | | | | | | | | | | | | | | | | | | | | | |
| Net investment income | | | – | | | | (0.00 | )3 | | | – | | | | (0.01 | ) | | | – | | | | – | |
| Capital gains | | | (0.48 | ) | | | (3.47 | ) | | | (0.86 | ) | | | (0.44 | ) | | | – | | | | (3.26 | ) |
| Total distributions | | | (0.48 | ) | | | (3.47 | ) | | | (0.86 | ) | | | (0.45 | ) | | | – | | | | (3.26 | ) |
| Net increase (decrease) in net asset value | | | (0.64 | ) | | | (6.34 | ) | | | 4.58 | | | | (0.08 | ) | | | 0.32 | | | | (4.69 | ) |
| Net Asset Value at end of period | | $ | 8.71 | | | $ | 9.35 | | | $ | 15.69 | | | $ | 11.11 | | | $ | 11.19 | | | | 10.87 | |
| Total Return (%)4 | | | (1.69 | ) | | | (23.55 | ) | | | 50.50 | | | | 3.27 | | | | 2.94 | 5 | | | (8.81 | ) |
| Ratios/Supplemental Data: | | | | | | | | | | | | | | | | | | | | | | | | |
| Net Assets at end of period (in 000’s) | | $ | 143,591 | | | $ | 166,238 | | | $ | 253,625 | | | $ | 215,890 | | | $ | 263,527 | | | $ | 274,824 | |
| Ratios of expenses to average net assets: | | | | | | | | | | | | | | | | | | | | | | | | |
| Before reimbursement of expenses by Adviser (%) | | | 1.10 | | | | 1.10 | | | | 1.15 | | | | 1.26 | | | | 1.25 | 6 | | | 1.29 | |
| After reimbursement of expenses by Adviser (%). | | | 1.10 | | | | 1.10 | | | | 1.14 | | | | 1.22 | | | | 1.21 | 6 | | | 1.29 | |
| Ratio of net investment income to average net assets | | | | | | | | | | | | | | | | | | | | | | | | |
| Before reimbursement of expenses by Adviser (%) | | | (0.17 | ) | | | (0.27 | ) | | | (0.42 | ) | | | 0.08 | | | | (0.82 | )6 | | | (0.36 | ) |
| After reimbursement of expenses by Adviser (%). | | | (0.17 | ) | | | (0.27 | ) | | | (0.40 | ) | | | 0.12 | | | | (0.78 | )6 | | | (0.36 | ) |
| Portfolio turnover (%)7 | | | 39 | | | | 41 | | | | 44 | | | | 47 | | | | 3 | 5 | | | 73 | |
1 Disclosure represents the period October 1, 2019 to October 31, 2019.
2 Net investment income (loss) calculated excluding permanent tax adjustments to undistributed net investment income.
3 Amounts represent less than $ (0.005) per share.
4 Total return without applicable sales charge.
5 Not annualized.
6 Annualized.
7 Portfolio turnover is calculated at the fund level and is not annualized for periods less than one year.
See accompanying Notes to Financial Statements.
Madison Funds | October 31, 2023
Financial Highlights for a Share of Beneficial Interest Outstanding - continued
| | | SMALL CAP FUND | |
| | | CLASS I | |
| | | Year Ended October 31, | | | Period Ended
October 31, | |
| | | 2023 | | | 2022 | | | 20211 | |
| Net Asset Value at beginning of period | | $ | 9.36 | | | $ | 15.70 | | | $ | 14.41 | |
| Income from Investment Operations: | | | | | | | | | | | | |
| Net investment income (loss) | | | (0.01 | ) | | | (0.02 | ) | | | (0.03 | ) |
| Net realized and unrealized gain (loss) on investments | | | (0.15 | ) | | | (2.83 | ) | | | 1.32 | |
| Total from investment operations | | | (0.16 | ) | | | (2.85 | ) | | | 1.29 | |
| Less Distributions From: | | | | | | | | | | | | |
| Net investment income | | | – | | | | (0.02 | ) | | | – | |
| Capital gains | | | (0.48 | ) | | | (3.47 | ) | | | – | |
| Total distributions | | | (0.48 | ) | | | (3. 49) | | | | – | |
| Net increase (decrease) in net asset value | | | (0.64 | ) | | | (6.34 | ) | | | 1.29 | |
| Net Asset Value at end of period | | $ | 8.72 | | | $ | 9.36 | | | $ | 15.70 | |
| Total Return (%)2 | | | (1.58 | ) | | | (23.52 | ) | | | 8.95 | 3 |
| Ratios/Supplemental Data: | | | | | | | | | | | | |
| Net Assets at end of period (in 000’s) | | $ | 11,925 | | | $ | 13,863 | | | $ | 21,868 | |
| Before reimbursement of expenses by Adviser (%) | | | 1.00 | | | | 1.00 | | | | 1.00 | 4 |
| After reimbursement of expenses by Adviser (%). | | | 1.00 | | | | 1.00 | | | | 1.004 | 4 |
| Ratio of net investment income to average net assets | | | | | | | | | | | | |
| Before reimbursement of expenses by Adviser (%) | | | (0.07 | ) | | | (0.16 | ) | | | (0.36 | )4 |
| After reimbursement of expenses by Adviser (%). | | | (0.07 | ) | | | (0.16 | ) | | | (0.36 | )4 |
| Portfolio turnover (%) | | | 39 | | | | 41 | | | | 44 | 3 |
1 Class I shares commenced operations effective March 1, 2021.
2 Total return without applicable sales charge.
3 Not annualized.
4 Annualized.
| | | SMALL CAP FUND | |
| | | CLASS R6 | |
| | | Year Ended | | | Period Ended | |
| | | October 31, | | | October 31, | |
| | | 2023 | | | 20221 | |
| Net Asset Value at beginning of period | | $ | 9.36 | | | $ | 11.30 | |
| Income from Investment Operations: | | | | | | | | |
| Net investment income (loss) | | | – | | | | (0.00 | )2 |
| Net realized and unrealized gain (loss) on investments | | | (0.14 | ) | | | (1.94 | ) |
| Total from investment operations | | | (0.14 | ) | | | (1.94 | ) |
| Less Distributions From: | | | | | | | | |
| Capital gains | | | (0.48 | ) | | | – | |
| Total distributions | | | (0.48 | ) | | | – | |
| Net increase (decrease) in net asset value | | | (0.62 | ) | | | (1.94 | ) |
| Net Asset Value at end of period | | $ | 8.74 | | | $ | 9.36 | |
| Total Return (%)3 | | | (1.46 | ) | | | (17.17 | )4 |
| Ratios/Supplemental Data: | | | | | | | | |
| Net Assets at end of period (in 000’s) | | $ | 220 | | | $ | 161 | |
| Ratios of expenses to average net assets: | | | | | | | | |
| Before reimbursement of expenses by Adviser (%) | | | 0.92 | | | | 0.925 | |
| After reimbursement of expenses by Adviser (%). | | | 0.92 | | | | 0.925 | |
| Ratio of net investment income to average net assets | | | | | | | | |
| Before reimbursement of expenses by Adviser (%) | | | (0.01 | ) | | | (0.06 | )5 |
| After reimbursement of expenses by Adviser (%). | | | (0.01 | ) | | | (0.06 | )5 |
| Portfolio turnover (%)6 | | | 39 | | | | 41 | 4 |
1 Class R6 shares commenced operations effective March 1, 2022.
2 Amounts represent less than $ (0.005) per share.
3 Total return without applicable sales charge.
4 Not annualized.
5 Annualized.
6 Portfolio turnover is calculated at the fund level and represents the entire fiscal year or period.
See accompanying Notes to Financial Statements.
Madison Funds | October 31, 2023
Financial Highlights for a Share of Beneficial Interest Outstanding - continued
| | | INTERNATIONAL STOCK FUND | |
| | | CLASS A | | | CLASS Y | |
| | | Year Ended October 31, | | | Year Ended October 31, | |
| | | 2023 | | | 2022 | | | 2021 | | | 2020 | | | 2019 | | | 2023 | | | 2022 | | | 2021 | | | 2020 | | | 2019 | |
| Net Asset Value at beginning of period | | $ | 7.34 | | | $ | 13.67 | | | $ | 11.83 | | | $ | 13.53 | | | $ | 12.92 | | | $ | 7.28 | | | $ | 13.64 | | | $ | 11.83 | | | $ | 13.57 | | | $ | 12.96 | |
| Income from Investment Operations: | | | | | | | | | | | | | | | | | | | | | | | | | | | | | | | | | | | | | | | | |
| Net investment income (loss) | | | 0.01 | | | | 0.08 | | | | 0.07 | | | | 0.061 | 1 | | | 0.181 | 1 | | | 0.41 | | | | (1.21 | ) | | | 0.41 | | | | 1.30 | 1 | | | 0.62 | 1 |
| Net realized and unrealized gain (loss) on investments | | | 0.60 | | | | (2.78 | ) | | | 2.35 | | | | (0.89 | ) | | | 0.99 | | | | 0.22 | | | | (1.46 | ) | | | 2.05 | | | | (2.10 | ) | | | 0.58 | |
| Total from investment operations | | | 0.61 | | | | (2.70 | ) | | | 2.42 | | | | (0.83 | ) | | | 1.17 | | | | 0.63 | | | | (2.67 | ) | | | 2.46 | | | | (0.80 | ) | | | 1.20 | |
| Less Distributions From: | | | | | | | | | | | | | | | | | | | | | | | | | | | | | | | | | | | | | | | | |
| Net investment income | | | (0.02 | ) | | | (0.07 | ) | | | (0.06 | ) | | | (0.19 | ) | | | (0.19 | ) | | | (0.04 | ) | | | (0.13 | ) | | | (0.13 | ) | | | (0.26 | ) | | | (0.22 | ) |
| Capital gains | | | – | | | | (3.56 | ) | | | (0.52 | ) | | | (0.68 | ) | | | (0.37 | ) | | | – | | | | (3.56 | ) | | | (0.52 | ) | | | (0.68 | ) | | | (0.37 | ) |
| Total distributions | | | (0.02 | ) | | | (3.63 | ) | | | (0.58 | ) | | | (0.87 | ) | | | (0.56 | ) | | | (0.04 | ) | | | (3.69 | ) | | | (0.65 | ) | | | (0.94 | ) | | | (0.59 | ) |
| Net increase (decrease) in net asset value | | | 0.59 | | | | (6.33 | ) | | | 1.84 | | | | (1.70 | ) | | | 0.61 | | | | 0.59 | | | | (6.36 | ) | | | 1.81 | | | | (1.74 | ) | | | 0.61 | |
| Net Asset Value at end of period | | $ | 7.93 | | | $ | 7.34 | | | $ | 13.67 | | | $ | 11.83 | | | $ | 13.53 | | | $ | 7.87 | | | $ | 7.28 | | | $ | 13.64 | | | $ | 11.83 | | | $ | 13.57 | |
| Total Return (%)2 | | | 8.34 | | | | (26.52 | ) | | | 20.48 | | | | (6.78 | ) | | | 9.85 | | | | 8.68 | | | | (26.39 | ) | | | 20.83 | | | | (6.58 | ) | | | 10.10 | |
| Ratios/Supplemental Data: | | | | | | | | | | | | | | | | | | | | | | | | | | | | | | | | | | | | | | | | |
| Net Assets at end of period (in 000’s) | | $ | 11,104 | | | $ | 10,896 | | | $ | 16,375 | | | $ | 14,602 | | | $ | 17,209 | | | $ | 645 | | | $ | 666 | | | $ | 888 | | | $ | 823 | | | $ | 1,310 | |
| Ratios of expenses to average net assets (%) | | | 1.61 | | | | 1.61 | | | | 1.61 | | | | 1.60 | | | | 1.60 | | | | 1.36 | | | | 1.36 | | | | 1.36 | | | | 1.36 | | | | 1.35 | |
| Ratio of net investment income to average net assets (%) | | | 0.31 | | | | 0.30 | | | | 0.53 | | | | 0.50 | | | | 1.42 | | | | 0.57 | | | | 0.55 | | | | 0.79 | | | | 0.73 | | | | 1.67 | |
| Portfolio turnover (%)3 | | | 22 | | | | 31 | | | | 120 | | | | 34 | | | | 37 | | | | 22 | | | | 31 | | | | 120 | | | | 34 | | | | 37 | |
1 Net investment income (loss) calculated excluding permanent tax adjustments to undistributed net investment income.
2 Total return without applicable sales charge.
3 Portfolio turnover is calculated at the fund level and represents the entire fiscal year or period.
See accompanying Notes to Financial Statements.
Madison Funds | October 31, 2023
Notes to the Financial Statements
1. ORGANIZATION
Madison Funds, a Delaware statutory trust (the “Trust”), is registered under the Investment Company Act of 1940, as amended (the “1940 Act”), as a diversified, open-end management investment company. As of the date of this report, the Trust offers the following funds (individually, a “Fund” collectively, the “Funds”), with the share classes listed:
| Fund | | Share Class(es) Offered1 |
| Conservative Allocation1,2 | | Class A, Class C |
| Moderate Allocation1,2 | | Class A, Class C |
| Aggressive Allocation1,2 | | Class A, Class C |
| Diversified Income1,2 | | Class A, Class C |
| Tax-Free Virginia | | Class Y |
| Tax-Free National | | Class Y |
| High Quality Bond | | Class Y, Class I |
| Core Bond1 | | Class A, Class Y, Class I, Class R6 |
| Covered Call & Equity Income | | Class A, Class C, Class Y, Class I, Class R6 |
| Dividend Income | | Class A, Class Y, Class I, Class R6 |
| Investors | | Class A, Class Y, Class I, Class R6 |
| Sustainable Equity | | Class Y, Class I |
| Mid Cap1 | | Class A, Class Y, Class I, Class R6 |
| Small Cap | | Class A, Class Y, Class I, Class R6 |
| International Stock1 | | Class A, Class Y |
1 As of the close of business on February 6, 2023, outstanding Class B shares of the Madison Funds converted into Class A shares of each respective fund, and Class B shares of the Trust were terminated.
2 The Conservative Allocation, Moderate Allocation, Aggressive Allocation and Diversified Income Funds are collectively referred to herein as the "Allocation Funds".
Each Class of shares represents an interest in the assets of the respective fund and has identical voting, dividend, liquidation and other rights, except that each Class of shares bears its own distribution fees and servicing fees, if any, and its proportional share of fund level expenses; is subject to its own sales charge, if any; and has exclusive voting rights on matters pertaining to Rule 12b-1 of the 1940 Act as it relates to that Class or other Class-specific matters.
The Declaration of Trust permits the Trustees to issue an unlimited number of shares of beneficial interest of the Trust without par value. The Trust has entered into an Investment Advisory Agreement with Madison Asset Management, LLC (the “Investment Adviser” or “Madison”), the Funds’ investment adviser.
2. SIGNIFICANT ACCOUNTING POLICIES
The preparation of financial statements requires management to make estimates and assumptions that affect the reported amounts of assets and liabilities and disclosure of contingent assets and liabilities at the date of the financial statements and the reported amounts of income and expenses during the reported period. Actual results could differ from those estimates.
Each fund is an investment company and accordingly follows the investment company accounting and reporting guidance of the Financial Accounting Standards Board (FASB) Accounting Standard Codification Topic 946 “Financial Services–Investment Companies”.
The following is a summary of significant accounting policies consistently followed by each fund in the preparation of its financial statements.
Portfolio Valuation: Equity securities, including American Depositary Receipts (“ADRs”), Global Depository Receipts (“GDRs”) and exchange-traded funds (“ETFs”) listed on any U.S. or foreign stock exchange or quoted on the National Association of Securities Dealers Automated Quotation System (“NASDAQ”) are valued at the last quoted sale price or official closing price on that exchange or NASDAQ on the valuation day (provided that, for securities traded on NASDAQ, the Funds utilize the NASDAQ Official Closing Price (“NOCP”)). If no sale occurs, equities traded on a U.S. exchange, foreign exchange or on NASDAQ are valued at the last available bid price. Debt securities are valued on the basis of last available bid prices or current market quotations provided by dealers or pricing services approved by the Trust. In determining the value of a particular investment, pricing services may use certain information with respect to transactions in such investments, quotations from dealers, pricing matrixes, market transactions in comparable investments, various relationships observed in the market between investments and calculated yield measurements based on valuation technology commonly employed in the market for such investments.
Municipal debt securities are traded via a network of dealers and brokers that connect buyers and sellers. They are valued on the basis of last available bid prices or current market quotations provided by dealers or pricing services approved by the Trust. There may be little trading in the secondary market for particular bonds and other debt securities, making them more difficult to value or sell. Asset-backed and mortgage-backed securities are valued by independent pricing services using models that consider estimated cash flows of each tranche of the security, establish a benchmark yield and develop an estimated tranche specific spread to the benchmark yield based on the unique attributes of the tranche.
Investments in shares of open-end mutual funds, including money market funds, are valued at their daily net asset value (“NAV”) which is calculated as of the close of regular trading on the New York Stock Exchange (the “NYSE”), usually 4:00 p.m. Eastern Standard Time, on each day on which the NYSE is open for business. NAV per share is determined by dividing each fund’s total net assets by the number of shares of such fund outstanding at the time of calculation. Because the assets of each Allocation Fund consist primarily of shares of other registered investment companies (the “Underlying Funds”), the NAV of each fund is determined based on the NAVs of the Underlying Funds. Total net assets are determined by adding the total current value of portfolio securities, cash, receivables, and other assets and subtracting liabilities. Short-term instruments having maturities of 60 days or less are valued on an amortized cost basis, which approximates fair value.
Madison Funds | October 31, 2023
Notes to the Financial Statements- continued
Over-the-counter securities not listed or traded on NASDAQ are valued at the last sale price on the valuation day. If no sale occurs on the valuation day, an over-the-counter security is valued at the last bid price. Exchange-traded options are valued at the mean of the best bid and ask prices across all option exchanges. Over-the-counter options are valued based upon prices provided by market makers in such securities or dealers in such currencies. Financial futures contracts generally are valued at the settlement price established by the exchange(s) on which the contracts are primarily traded. Spot and forward foreign currency exchange contracts are valued based on quotations supplied by dealers in such contracts. Overnight repurchase agreements are valued at cost, and term repurchase agreements (i.e., those whose maturity exceeds seven days), swaps, caps, collars and floors, if any, are valued at the average of the closing bids obtained daily from at least one dealer.
Through the end of this reporting period, the value of all assets and liabilities expressed in foreign currencies was converted into U.S. dollar values using the then-current exchange rate at the close of regular trading on the NYSE.
All other securities for which either quotations are not readily available, no other sales have occurred, or in the Investment Adviser’s opinion, do not reflect the current fair market value are appraised at their fair values as determined in good faith by the Investment Adviser's Pricing Committee ( the “Committee”) and under the general supervision of the Board of Trustees. When fair value pricing of securities is employed, the prices of securities used by the Funds to calculate NAV may differ from market quotations or NOCP. Because the Allocation Funds primarily invest in Underlying Funds, government securities and short-term paper, it is not anticipated that the Investment Adviser will need to “fair value” any of the investments of these Funds. However, an Underlying Fund may need to “fair value” one or more of its investments, which may, in turn, require an Allocation Fund to do the same because of delays in obtaining the Underlying Fund’s NAV.
Rule 2a-5 under the 1940 Act (the “Valuation Rule”) establishes requirements for determining fair value in good faith, including related oversight and reporting requirements. The Valuation Rule also defines when market quotations are “readily available,” which is the threshold for determining whether a fund must fair value a security. Among other things, the Valuation Rule permits a board of trustees of a fund to designate a fund's investment adviser as valuation designee to perform a fund's fair value determinations subject to board oversight and certain reporting and other requirements intended to ensure that the board receives the information it needs to oversee a fund’s investment adviser fair value determinations. The Board has designated the Funds' investment adviser as Valuation Designee and the Valuation Designee has delegated valuation decisions to the Committee.
A fund’s investments will be valued at fair value if, in the judgment of the Committee, an event impacting the value of an investment occurred between the closing time of a security’s primary market or exchange (for example, a foreign exchange or market) and the time a fund’s share price is calculated as of the close of regular trading on the NYSE. Significant events may include, but are not limited to, the following: (1) significant fluctuations in domestic markets, foreign markets or foreign currencies; (2) occurrences not directly tied to the securities markets such as natural disasters, armed conflicts or significant government actions; and (3) major announcements affecting a single issuer or an entire market or market sector. In responding to a significant event, the Committee would determine the fair value of affected securities considering factors including, but not limited to: fundamental analytical data relating to the investment; the nature and duration of any restrictions on the disposition of the investment; and the forces influencing the market(s) in which the investment is purchased or sold. In addition to the fair value decisions made by the Committee noted above, the Committee also engages an independent fair valuation service to adjust the valuations of foreign equity securities based on specific market-movement parameters established by the Committee and approved by the Board of Trustees. Such adjustments to the valuation of foreign securities are applied automatically upon market close if the parameters established are exceeded. A foreign security is also automatically fair valued if the exchange it is traded on is on holiday.
Recently Issued Accounting Pronouncements:
In June 2022, the FASB issued Accounting Standards Update (“ASU”) No. 2022-03, Fair Value Measurement (Topic 820); Fair Value Measurement of Equity Securities Subject to Contractual Sale Restrictions, which provides clarifying guidance that a contractual restriction on the sale of an equity security is not considered part of the unit of account of the equity security and, therefore, is not considered in measuring fair value. The ASU is effective for fiscal years beginning after December 15, 2023, and interim periods within those fiscal years. The Trust expects the ASU will not have a material impact on the Funds’ financial statements.
Security Transactions and Investment Income: Security transactions are accounted for on a trade date basis. Net realized gains or losses on sales are determined by the identified cost method. Net realized gain on investments in the Statements of Operations also includes realized gain distributions received from the underlying exchangelisted funds. Distributions of net realized gains are recorded on the Funds’ ex-distribution date. Dividend income is recorded on ex-dividend date, except that certain dividends from foreign securities may be recorded after the ex-dividend date based on when the Funds are informed of the dividend. Interest income is recorded on an accrual basis and is increased by the accretion of discount and decreased by the amortization of premium. Amortization and accretion are recorded on the effective yield method.
Expenses: Expenses that are directly related to one fund are charged directly to that fund. Other operating expenses are prorated to the Funds on the basis of relative net assets. Class-specific expenses are borne by that class.
Share Classes: Income and realized and unrealized gains/losses are allocated to the respective classes on the basis of relative net assets.
Foreign Currency Transactions: The Funds' books and records are maintained in US dollars. Foreign currency-denominated transactions (i.e., fair value of investment securities, assets and liabilities, purchases and sales of investment securities, and income and expenses) are translated into U.S. dollars at the current rate of exchange. The Funds enter into contracts on the trade date to settle any securities transactions denominated in foreign currencies on behalf of the Funds at the spot rate at settlement.
Each fund, except the Tax-Free Virginia and Tax-Free National Funds, reports certain foreign currency-related transactions as components of realized gains or losses for financial reporting purposes, whereas such components are treated as ordinary income for federal income tax purposes. Realized gains or losses associated with currency transactions are included in the Statements of Operations under the heading “Net realized gain (loss) on investments”. The International Stock Fund had net realized gains of $99 related to foreign currency transactions.
The Funds do not isolate the portion of gains and losses on investments in securities that is due to changes in the foreign exchange rates from that which is due to change in market prices of securities. Such amounts are categorized as gain or loss on investments for financial reporting purposes.
Madison Funds | October 31, 2023
Notes to the Financial Statements- continued
Forward Foreign Currency Exchange Contracts: Each fund, except the Tax-Free Virginia and Tax-Free National Funds, may purchase and sell forward foreign currency exchange contracts for defensive or hedging purposes. When entering into forward foreign currency exchange contracts, the Funds agree to receive or deliver a fixed quantity of foreign currency for an agreed-upon price on an agreed future date. These contracts are valued daily. The Funds’ net assets reflect unrealized gains or losses on the contracts as measured by the difference between the forward foreign currency exchange rates at the dates of entry into the contracts and the forward rates at the reporting date. The Funds realize a gain or a loss at the time the forward foreign currency exchange contracts are settled or closed out with an offsetting contract. Contracts are traded over-the-counter directly with a counterparty. Realized and unrealized gains and losses are included in the Statements of Operations. During the year ended October 31, 2023, none of the Funds had forward foreign currency exchange contracts.
If a fund enters into a forward foreign currency exchange contract to buy foreign currency for any purpose, a fund will be required to place cash or other liquid assets in a segregated account with a fund’s custodian in an amount equal to the value of a fund’s total assets committed to the consummation of the forward contract. If the value of the securities in the segregated account declines, additional cash or securities will be placed in the segregated account so that the value of the account will equal the amount of a fund’s commitment with respect to the contract.
Cash Concentration: At times, the Funds maintain cash balances at financial institutions in excess of federally insured limits. The Funds monitor this credit risk and have not experienced any losses related to this risk.
Illiquid Securities: Each fund currently limits investments in illiquid investments, as defined by Rule 22e-4 under the 1940 Act, to 15% of net assets at the time of purchase. An illiquid investment is generally defined as a security that a fund reasonably expects cannot be sold or disposed of in current market conditions in seven calendar days or less without the sale or disposition significantly changing the market value of the security. At October 31, 2023, there were no illiquid securities held in the Funds.
Delayed Delivery Securities: Each fund may purchase securities on a when-issued or delayed delivery basis. “When-issued” refers to securities whose terms are available and for which a market exists, but that have not been issued. For when-issued or delayed delivery transactions, no payment is made until delivery date, which is typically longer than the normal course of settlement. When a fund enters into an agreement to purchase securities on a when-issued or delayed delivery basis, a fund may segregate cash or other liquid securities, of any type or maturity, equal in value to a fund’s commitment. Losses may arise due to changes in the fair value of the underlying securities, if the counterparty does not perform under the contract, or if the issuer does not issue the securities due to political, economic or other factors. As of October 31, 2023, none of the Funds had entered into such transactions.
Indemnifications: Under the Funds’ organizational documents, the Funds’ officers and Trustees are indemnified against certain liabilities arising out of the performance of their duties to the Funds. In the normal course of business, the Funds enter into contracts that contain a variety of representations and provide general indemnifications. The Funds’ maximum liability exposure under these arrangements is unknown, as future claims that have not yet occurred may be made against the Funds. However, based on experience, management expects the risk of loss to be remote.
3. Fair Value Measurements
Each fund has adopted FASB guidance on fair value measurements. Fair value is defined as the price that each fund would receive upon selling an investment in a timely transaction to an independent buyer in the principal or most advantageous market of the investment. A three-tier hierarchy is used to maximize the use of observable market data “inputs” and minimize the use of unobservable “inputs” and to establish classification of fair value measurements for disclosure purposes. Inputs refer broadly to the assumptions that market participants would use in pricing the asset or liability, including assumptions about risk (for example, the risk inherent in a particular valuation technique used to measure fair value including such a pricing model and/or the risk inherent in the inputs used in the valuation technique). Inputs may be observable or unobservable.
Observable inputs are inputs that reflect the assumptions market participants would use in pricing the asset or liability developed based on market data obtained from sources independent of the reporting entity. Unobservable inputs are inputs that reflect the reporting entity’s own assumptions about the assumptions market participants would use in pricing the asset or liability developed based on the best information available in the circumstances. The three-tier hierarchy of inputs is summarized in the three broad Levels listed below:
Level 1 - unadjusted quoted prices in active markets for identical investments
Level 2 - other significant observable inputs (including quoted prices for similar investments, interest rate volatilities, prepayment speeds, credit risk, benchmark yields, transactions, bids, offers, new issues, spreads, and other relationships observed in the markets among comparable securities, underlying equity of the issuer; and proprietary pricing models such as yield measures calculated using factors such as cash flows, financial or collateral performance, and other reference data, etc.)
Level 3 - significant unobservable inputs (including a fund’s own assumptions in determining the fair value of investments)
The valuation techniques used by the Funds to measure fair value for the year ended October 31, 2023 maximized the use of observable inputs and minimized the use of unobservable inputs. The Funds estimated the price that would have prevailed in a liquid market for an international equity security given information available at the time of valuation. As of October 31, 2023, none of the Funds held securities deemed as a Level 3, and there were no transfers between classification levels.
Madison Funds | October 31, 2023
Notes to the Financial Statements- continued
The following is a summary of the inputs used as of October 31, 2023, in valuing the Funds’ investments carried at fair value (please see the Portfolio of Investments for each fund for a listing of all securities within each category):
| Fund1 | | Level 1 | | | Level 2 | | | Level 3 | | | Value at
10/31/23 | |
| Conservative Allocation | | | | | | | | | | | | | | | | |
| Investment Companies | | $ | 42,293,444 | | | $ | — | | | $ | — | | | $ | 42,293,444 | |
| Short-Term Investments | | | 947,980 | | | | — | | | | — | | | | 947,980 | |
| | | | 43,241,424 | | | | — | | | | — | | | | 43,241,424 | |
| | | | | | | | | | | | | | | | | |
| Moderate Allocation | | | | | | | | | | | | | | | | |
| Investment Companies | | $ | 88,948,239 | | | $ | — | | | $ | — | | | $ | 88,948,239 | |
| Short-Term Investments | | | 7,739,763 | | | | — | | | | — | | | | 7,739,763 | |
| | | | 96,688,002 | | | | — | | | | — | | | | 96,688,002 | |
| | | | | | | | | | | | | | | | | |
| Aggressive Allocation | | | | | | | | | | | | | | | | |
| Investment Companies | | $ | 49,353,494 | | | $ | — | | | $ | — | | | $ | 49,353,494 | |
| Short-Term Investments | | | 6,806,069 | | | | — | | | | — | | | | 6,806,069 | |
| | | | 56,159,563 | | | | — | | | | — | | | | 56,159,563 | |
| | | | | | | | | | | | | | | | | |
| Diversified Income | | | | | | | | | | | | | | | | |
| Common Stocks | | $ | 4,154,450 | | | $ | — | | | $ | — | | | $ | 4,154,450 | |
| Asset Backed Securities | | | — | | | | 101,547 | | | | — | | | | 101,547 | |
| Collateralized Mortgage Obligations | | | — | | | | 7,844 | | | | — | | | | 7,844 | |
| Mortgage Backed Securities | | | — | | | | 14,827 | | | | — | | | | 14,827 | |
| Investment Companies | | | 135,474,620 | | | | — | | | | — | | | | 135,474,620 | |
| Short-Term Investments | | | 2,892,628 | | | | — | | | | — | | | | 2,892,628 | |
| | | | 142,521,698 | | | | 124,218 | | | | — | | | | 142,645,916 | |
| | | | | | | | | | | | | | | | | |
| Tax-Free Virginia | | | | | | | | | | | | | | | | |
| Municipal Bonds | | $ | — | | | $ | 16,307,786 | | | $ | — | | | $ | 16,307,786 | |
| | | | — | | | | 16,307,786 | | | | | | | | 16,307,786 | |
| Tax-Free National | | | | | | | | | | | | | | | | |
| Municipal Bonds | | $ | — | | | $ | 16,805,158 | | | $ | — | | | $ | 16,805,158 | |
| | | | — | | | | 16,805,158 | | | | | | | | 16,805,158 | |
| High Quality Bond | | | | | | | | | | | | | | | | |
| Corporate Notes and Bonds | | $ | — | | | $ | 19,162,520 | | | $ | — | | | $ | 19,162,520 | |
| Foreign Corporate Bonds | | | — | | | | 690,830 | | | | — | | | | 690,830 | |
| U.S. Government and Agency Obligations | | | — | | | | 32,645,984 | | | | — | | | | 32,645,984 | |
| Short-Term Investments | | | 2,833,189 | | | | — | | | | — | | | | 2,833,189 | |
| | | | 2,833,189 | | | | 52,499,334 | | | | — | | | | 55,332,523 | |
| | | | | | | | | | | | | | | | | |
| Core Bond | | | | | | | | | | | | | | | | |
| Asset Backed Securities | | $ | — | | | $ | 11,143,534 | | | $ | — | | | $ | 11,143,534 | |
| Collateralized Mortgage Obligations | | | — | | | | 9,439,369 | | | | — | | | | 9,439,369 | |
| Commercial Mortgage-Backed Securities | | | — | | | | 5,650,348 | | | | — | | | | 5,650,348 | |
| Corporate Notes and Bonds | | | — | | | | 50,809,247 | | | | — | | | | 50,809,247 | |
| Foreign Corporate Bonds | | | — | | | | 5,899,737 | | | | — | | | | 5,899,737 | |
| Mortgage Backed Securities | | | — | | | | 52,617,418 | | | | — | | | | 52,617,418 | |
| U.S. Government and Agency Obligations | | | — | | | | 43,489,278 | | | | — | | | | 43,489,278 | |
| Short-Term Investments | | | 2,915,772 | | | | — | | | | — | | | | 2,915,772 | |
| | | | 2,915,772 | | | | 179,048,931 | | | | — | | | | 181,964,703 | |
| Covered Call & Equity Income | | | | | | | | | | | | | | | | |
| Assets: | | | | | | | | | | | | | | | | |
| Common Stocks | | $ | 183,059,517 | | | $ | — | | | $ | — | | | $ | 183,059,517 | |
| Exchange Traded Funds | | | 4,145,480 | | | | — | | | | — | | | | 4,145,480 | |
| Short-Term Investments | | | 58,470,447 | | | | — | | | | — | | | | 58,470,447 | |
| | | | 245,675,444 | | | | — | | | | — | | | | 245,675,444 | |
| Liabilities: | | | | | | | | | | | | | | | | |
| Options Written | | $ | (2,312,793 | ) | | $ | — | | | $ | — | | | $ | (2,312,793 | ) |
| | | | | | | | | | | | | | | | | |
| Dividend Income | | | | | | | | | | | | | | | | |
| Common Stocks | | $ | 192,369,866 | | | $ | — | | | $ | — | | | $ | 192,369,866 | |
| Short-Term Investments | | | 4,834,761 | | | | — | | | | — | | | | 4,834,761 | |
| | | | 197,204,627 | | | | — | | | | — | | | | 197,204,627 | |
| Investors | | | | | | | | | | | | | | | | |
| Common Stocks | | $ | 319,419,643 | | | $ | — | | | $ | — | | | $ | 319,419,643 | |
| Short-Term Investments | | | 13,263,140 | | | | — | | | | — | | | | 13,263,140 | |
| | | | 332,682,783 | | | | — | | | | — | | | | 332,682,783 | |
Madison Funds | October 31, 2023
Notes to the Financial Statements- continued
| | | | | | | | | | | | Value at | |
| Fund1 | | Level 1 | | | Level 2 | | | Level 3 | | | 10/31/23 | |
| Sustainable Equity | | | | | | | | | | | | | | | | |
| Common Stocks | | $ | 7,749,827 | | | $ | – | | | $ | – | | | $ | 7,749,827 | |
| Exchange Traded Funds | | | 109,150 | | | | – | | | | – | | | | 109,150 | |
| Short-Term Investments | | | 175,393 | | | | – | | | | – | | | | 175,393 | |
| | | | 8,034,370 | | | | – | | | | – | | | | 8,034,370 | |
| | | | | | | | | | | | | | | | | |
| Mid Cap | | | | | | | | | | | | | | | | |
| Common Stocks | | | 770,163,910 | | | | – | | | | – | | | | 770,163,910 | |
| Short-Term Investments | | | 50,292,644 | | | | – | | | | – | | | | 50,292,644 | |
| | | | 820,456,554 | | | | – | | | | – | | | | 820,456,554 | |
| Small Cap | | | | | | | | | | | | | | | | |
| Common Stocks | | | 152,572,976 | | | | – | | | | – | | | | 152,572,976 | |
| Short-Term Investments | | | 8,207,963 | | | | – | | | | – | | | | 8,207,963 | |
| | | | 160,780,939 | | | | | | | | | | | | 160,780,939 | |
| International Stock | | | | | | | | | | | | |
| Common Stocks | | | | | | | | | | | | | | | | |
| Australia | | | — | | | | 188,808 | | | | — | | | | 188,808 | |
| Brazil | | | 142,844 | | | | — | | | | — | | | | 142,844 | |
| Canada | | | 734,116 | | | | — | | | | — | | | | 734,116 | |
| China | | | 338,662 | | | | 502,994 | | | | — | | | | 841,656 | |
| Denmark | | | — | | | | 120,390 | | | | — | | | | 120,390 | |
| France | | | 132,398 | | | | 841,194 | | | | — | | | | 973,592 | |
| Germany | | | 261,300 | | | | 1,117,993 | | | | — | | | | 1,379,293 | |
| Hong Kong | | | — | | | | 180,663 | | | | — | | | | 180,663 | |
| India | | | 564,634 | | | | 354,080 | | | | — | | | | 918,714 | |
| Ireland | | | — | | | | 233,737 | | | | — | | | | 233,737 | |
| Israel | | | 187,695 | | | | — | | | | — | | | | 187,695 | |
| Italy | | | 142,072 | | | | — | | | | — | | | | 142,072 | |
| Japan | | | — | | | | 1,911,200 | | | | — | | | | 1,911,200 | |
| Mexico | | | 631,768 | | | | — | | | | — | | | | 631,768 | |
| Netherlands | | | 482,005 | | | | — | | | | — | | | | 482,005 | |
| Norway | | | — | | | | 138,296 | | | | — | | | | 138,296 | |
| Switzerland | | | — | | | | 737,117 | | | | — | | | | 737,117 | |
| Taiwan | | | 161,141 | | | | — | | | | — | | | | 161,141 | |
| United Kingdom | | | — | | | | 1,192,857 | | | | — | | | | 1,192,857 | |
| Exchange Traded Funds | | | 157,022 | | | | — | | | | — | | | | 157,022 | |
| Short-Term Investments | | | 272,699 | | | | — | | | | — | | | | 272,699 | |
| | | | 4,208,356 | | | | 7,519,329 | | | | — | | | | 11,727,685 | |
1 See respective Portfolio of Investments for underlying holdings in each fund. For additional information on the Underlying funds held in the Allocation Funds, including shareholder prospectuses and financial reports, please visit each Underlying fund’s website or visit the Securities and Exchange Commission’s website at http://www.sec.gov.
4. Derivatives:
The FASB issued guidance intended to enhance financial statement disclosure for derivative instruments and enable investors to understand: a) how and why a fund uses derivative investments, b) how derivative instruments are accounted for, and c) how derivative instruments affect a fund’s financial position, and results of operations. As of October 31, 2023 the Covered Call & Equity Income Fund has not offset any of the positions and the positions are presented gross on the Statements of Assets and Liabilities.
The following table presents the types of derivatives in the Fund by location and as presented on the Statements of Assets and Liabilities as of October 31, 2023.
| | | Statements of Asset & Liability Presentation of Fair Values of Derivative Instruments | |
| | | Asset Derivatives | | | | | Liability Derivatives | |
| | | | | Statements of Assets and | | | | | Statements of Assets | | | |
| Fund | | Underlying Risk | | Liabilities Location | | Fair Value | | | and Liabilities Location | | Fair Value | |
| Covered Call & Equity Income | | Equity | | Options purchased | | | – | | | Options written | | $ | (2,312,793 | ) |
The following table presents the effect of derivative instruments on the Statements of Operations for the year ended October 31, 2023.
| | | | | | | Realized Gain | | | Change in Unrealized Appreciation | |
| Fund | | Underlying Risk | | Statements of Operations | | (Loss) on Derivatives | | | (Depreciation) on Derivatives | |
| Covered Call & Equity Income | | Equity | | Option Purchased | | $ | (1,862,039 | ) | | $ | – | |
| | | Equity | | Option Written | | | 11,919,338 | | | | 2,456,570 | |
| Total | | | | | | $ | 10,057,299 | | | $ | 2,456,570 | |
Madison Funds | October 31, 2023
Notes to the Financial Statements- continued
The average volume (based on the open positions at each month-end) of derivative activity during the year ended October 31, 2023.
| | | Options Purchased Contracts(1) | | | Options Written Contracts(1) | |
| Covered Call & Equity Income | | | 193 | | | | (18,509 | ) |
(1) Number of Contracts
There is no impact on the financial statement of the other funds as they did not hold derivative investments during the year ended October 31, 2023.
5. ADVISORY, ADMINISTRATION AND DISTRIBUTION AGREEMENTS
Advisory Agreement. For its investment advisory services to the Funds, pursuant to the terms of an Investment Advisory Agreement between Madison and the Trust, Madison is entitled to receive a fee, which is computed daily and paid monthly, at an annualized percentage rate of the average daily value of the net assets of each fund as follows as of October 31, 2023:
| Fund | Management Fee | | Fund | Management Fee |
| Conservative Allocation | 0.20% | | Covered Call & Equity Income | 0.85% |
| Moderate Allocation | 0.20% | | Dividend Income1 | 0.70% |
| Aggressive Allocation | 0.20% | | Investors1 | 0.70% |
| Diversified Income1 | 0.20% | | Sustainable Equity1 | 0.70% |
| Tax-Free Virginia | 0.50% | | Mid Cap1 | 0.75% |
| Tax-Free National | 0.40% | | Small Cap1 | 0.89% |
| High Quality Bond | 0.30% | | International Stock1 | 1.05% |
| Core Bond1 | 0.39% | | | |
1 The Fund’s management fee will be reduced by 0.05% on assets exceeding $500 million, and by another 0.05% on assets exceeding $1 billion.
Following the end of fiscal year covered by this annual report, the Investment Adviser had a change of control which resulted in the assignment of the Investment Advisory Agreement. Because the change of control had been planned in advance, prior to the effective date of the change of control, the Board of Trustees met to review and approve a new investment advisory agreement between the Investment Adviser and the Trust. Please see “Discussion of Contract Renewal Process and Considerations” for more information.
Administrative Services Agreement. In addition to the management fee, the Investment Adviser is entitled to receive an administrative services fee from each fund pursuant to the terms of a separate Administrative Services Agreement. Under this fee agreement, the Investment Adviser provides or arranges for each fund to have all of the necessary operational and support services it needs for a fee. These fees are computed daily and paid monthly, at an annualized percentage rate of the average daily value of the net assets of each fund.
During the year October 31, 2023, the Funds and their respective share classes were charged the following fees under the Administrative Services Agreement:
| Fund | | Class A | | Class C | | Class Y | | Class I | | Class R6 |
| Conservative Allocation | | 0.25% | | 0.25% | | N/A | | N/A | | N/A |
| Moderate Allocation | | 0.25% | | 0.25% | | N/A | | N/A | | N/A |
| Aggressive Allocation | | 0.25% | | 0.25% | | N/A | | N/A | | N/A |
| Diversified Income | | 0.20% | | 0.20% | | N/A | | N/A | | N/A |
| Tax-Free Virginia | | N/A | | N/A | | 0.35% | | N/A | | N/A |
| Tax-Free National | | N/A | | N/A | | 0.35% | | N/A | | N/A |
| High Quality Bond | | N/A | | N/A | | 0.19% | | 0.10% | | N/A |
| Core Bond | | 0.20% | | N/A | | 0.20% | | 0.10% | | 0.02% |
| Covered Call & Equity Income | | 0.15% | | 0.15% | | 0.15% | | 0.10% | | 0.02% |
| Dividend Income | | 0.20% | | N/A | | 0.20% | | 0.10% | | 0.02% |
| Investors | | 0.20% | | N/A | | 0.20% | | 0.10% | | 0.02% |
| Sustainable Equity | | N/A | | N/A | | 0.20% | | 0.10% | | N/A |
| Mid Cap | | 0.40% | | N/A | | 0.20% | | 0.10% | | 0.02% |
| Small Cap | | 0.20% | | N/A | | 0.20% | | 0.10% | | 0.02% |
| International Stock | | 0.30% | | N/A | | 0.30% | | N/A | | N/A |
Expenses that are not included under this fee agreement are paid directly by the Funds. See “Other Expenses”.
The Investment Adviser may from time to time, contractually or voluntarily, agree to waive a portion of it’s the administrative services fees and/or reimburse each fund’s operating expenses to ensure that each fund’s operating expenses do not exceed the expense limitation listed below. Contractual fee agreements may by modified or terminated at any time or for any reason, but only with fund Board approval. Any fees waived will not be subject to later recoupment by Madison.
During the year ended October 31, 2023, the Investment Adviser did not waive Administrative Services fees for any of the Funds.
Shareholder Service and Distribution Plans (Rule 12b-1). The Trust has adopted, on behalf of certain funds and share classes, distribution and/or service plans pursuant to Rule 12b-1 under the 1940 Act. These plans permit the applicable share classes to pay for distribution of their shares and servicing of their shareholders out of fund assets; therefore, the cost of these plans is indirectly borne by all shareholders who own shares of the affected funds and share classes. These plans are described below:
Shareholder Service Fees (Class A and C shares). Service plans have been adopted pursuant to Rule 12b-1 under the 1940 Act for Class A, and C shares of each of the Funds. Under the terms of these plans, each fund pays MFD Distributor, LLC (“MFD”) a service fee equal to 0.25% of the average daily net assets attributable to each class of shares of that fund. The service fee is used by MFD to offset costs of servicing shareholder accounts or to compensate other qualified broker/dealers who sell shares of the Funds pursuant to agreements with MFD for their costs of servicing shareholder accounts. MFD may retain any portion of the service fee for which there is no broker/dealer of record as partial consideration for its services with respect to shareholder accounts.
Madison Funds | October 31, 2023
Notes to the Financial Statements- continued
Distribution Fees (Class C shares only). A distribution plan has been adopted pursuant to Rule 12b-1 under 1940 Act for Class C shares of each of the Funds. Under the terms of the plan, each fund pays its principal distributor, MFD, a fee equal to 0.75% of the average daily net assets attributable to Class C shares of that fund. MFD may use this fee to cover its distribution-related expenses (including commissions paid to broker/dealers for selling Class C shares) or distribution-related expenses of dealers. This fee increases the cost of investment in the Class C shares of a fund and, over time, may cost more than paying the initial sales charge for Class A shares.
The Shareholder Servicing & Distribution Fees are computed daily and paid monthly, at an annualized percentage rate of the average daily value of the net assets of each fund as follows:
| | | | | | | | | Total Shareholder Servicing and |
| | | Shareholder Servicing Fee | | Distribution Fee | | Distribution Fees (Rule 12b-1) |
| Fund | | Class A | | Class C | | Class C | | Class A | | Class C |
| Conservative Allocation | | 0.25% | | 0.25% | | 0.75% | | 0.25% | | 1.00% |
| Moderate Allocation | | 0.25% | | 0.25% | | 0.75% | | 0.25% | | 1.00% |
| Aggressive Allocation | | 0.25% | | 0.25% | | 0.75% | | 0.25% | | 1.00% |
| Diversified Income | | 0.25% | | 0.25% | | 0.75% | | 0.25% | | 1.00% |
| Tax-Free Virginia | | N/A | | N/A | | N/A | | N/A | | N/A |
| Tax-Free National | | N/A | | N/A | | N/A | | N/A | | N/A |
| High Quality Bond | | N/A | | N/A | | N/A | | N/A | | N/A |
| Core Bond | | 0.25% | | N/A | | N/A | | 0.25% | | N/A |
| Covered Call & Equity Income | | 0.25% | | 0.25% | | 0.75% | | 0.25% | | 1.00% |
| Dividend Income | | 0.25% | | N/A | | N/A | | 0.25% | | N/A |
| Investors | | 0.25% | | N/A | | N/A | | 0.25% | | N/A |
| Sustainable Equity | | N/A | | N/A | | N/A | | N/A | | N/A |
| Mid Cap | | 0.25% | | N/A | | N/A | | 0.25% | | N/A |
| Small Cap | | 0.25% | | N/A | | N/A | | 0.25% | | N/A |
| International Stock | | 0.25% | | N/A | | N/A | | 0.25% | | N/A |
MFD may from time to time voluntarily agree to waive a portion of its fees or expenses related to the Funds. For the year October 31, 2023, no fees were waived. MFD does not have the right to recoup waived fees
Front-end sales charges and contingent deferred sales charges (“CDSC”) do not represent expenses of the Funds. Rather, they are deducted from the proceeds of sales of fund shares prior to investment (Class A shares) or from redemption proceeds prior to remittance (Class A and C shares), as applicable. MFD, in turn, uses a portion of these fees to pay financial advisors who sell fund shares, as disclosed in the prospectus. The sales charges and CDSC collected and retained for the year ended October 31, 2023, were as follows:
| | | Amount Collected | | | Amount Retained | |
| Fund | | Class A | | | Class B1 | | | Class C | | | Class A | | | Class B1 | | | Class C | |
| Conservative Allocation | | $ | 14,076 | | | $ | 0 | | | $ | 54 | | | $ | 1,970 | | | $ | 0 | | | $ | 54 | |
| Moderate Allocation | | | 43,888 | | | | 66 | | | | 57 | | | | 5,651 | | | | 66 | | | | 57 | |
| Aggressive Allocation | | | 34,201 | | | | 1 | | | | 71 | | | | 4,190 | | | | 1 | | | | 71 | |
| Diversified Income | | | 43,072 | | | | 58 | | | | 205 | | | | 5,754 | | | | 58 | | | | 205 | |
| Core Bond | | | 3,049 | | | | 0 | | | | N/A | | | | 380 | | | | 0 | | | | N/A | |
| Dividend Income | | | 19,475 | | | | N/A | | | | N/A | | | | 2,301 | | | | N/A | | | | N/A | |
| Covered Call & Equity Income | | | 211,794 | | | | N/A | | | | 1,449 | | | | 26,916 | | | | N/A | | | | 1,449 | |
| Investors | | | 48,861 | | | | N/A | | | | N/A | | | | 6,834 | | | | N/A | | | | N/A | |
| Mid Cap | | | 75,192 | | | | 0 | | | | N/A | | | | 8,601 | | | | 0 | | | | N/A | |
| Small Cap | | | 3,460 | | | | N/A | | | | N/A | | | | 406 | | | | N/A | | | | N/A | |
| International Stock | | | 4,992 | | | | 0 | | | | N/A | | | | 616 | | | | 0 | | | | N/A | |
| | | | | | | | | | | | | | | | | | | | | | | | | |
| | | | 502,060 | | | | 125 | | | | 1,837 | | | | 63,619 | | | | 125 | | | | 1,837 | |
1 After the close of business on February 6, 2023, outstanding Class B shares of the Madison Funds converted into Class A shares of each respective fund, and Class B shares of the Trust were terminated. Amounts collected and retained for the Class B shares represent the period November 1, 2022 through February 6, 2023.
Other Expenses: The Funds are responsible for paying: (i) transaction-related expenses including, but not limited to, brokerage commissions paid in connection with fund transactions, interest or fees in connection with fund indebtedness or taxes paid in connection with portfolio securities held, (ii) Rule 12b-1 distribution and service fees, if any, (iii) acquired fund fees, if any, (iv) any extraordinary or nonrecurring expenses (such as overdraft fees or expenses relating to any temporary line of credit the Funds maintain for emergency or extraordinary purposes), and (v) Independent Trustee compensation, including Lead Independent Trustee compensation.
Officers and Trustees: Certain officers and trustees of the Funds are also officers of the Investment Adviser. The Funds do not compensate their officers or affiliated trustees. Independent Trustees are compensated from the Funds.
6. DIVIDENDS FROM NET INCOME AND DISTRIBUTIONS OF CAPITAL GAINS
With respect to dividends from net investment income, Tax-Free Virginia, Tax-Free National, Core Bond and Diversified Income Funds declare and reinvest dividends, if any, monthly. The Conservative Allocation, High Quality Bond, Dividend Income and Covered Call & Equity Income Funds declare and reinvest dividends, if any, quarterly. The Moderate Allocation, Aggressive Allocation, Investors, Sustainable Equity, Mid Cap, Small Cap and International Stock Funds declare and reinvest dividends, if any, annually. The Funds distribute net realized gains from investment transactions, if any, to shareholders annually.
Madison Funds | October 31, 2023
Notes to the Financial Statements- continued
Income and capital gain distributions, if any, are determined in accordance with federal income tax regulations, which may differ from accounting principles generally accepted in the United States of America. Taxable distributions from income and realized capital gains in the Funds differ from book amounts earned during the period due to differences in the timing of capital gains recognition, and due to the reclassification of certain gains or losses from capital to income. Dividends from net investment income are determined on a class level. Capital gains are determined on a fund level.
7. SECURITIES TRANSACTIONS
For the year ended October 31, 2023, aggregate cost of purchases and proceeds from sales of securities, other than short-term investment, were as follows:
| | | U.S. Government Securities | | | Other Investment Securities | |
| Fund | | Purchases | | | Sales | | | Purchases | | | Sales | |
| Conservative Allocation | | $ | – | | | $ | – | | | | 24,962,160 | | | $ | 30,290,292 | |
| Moderate Allocation | | | – | | | | – | | | | 62,605,340 | | | | 68,206,885 | |
| Aggressive Allocation | | | – | | | | – | | | | 35,232,796 | | | | 35,474,176 | |
| Diversified Income | | | 12,022,747 | | | | 38,623,410 | | | | 169,515,608 | | | | 154,643,549 | |
| Tax-Free Virginia | | | – | | | | – | | | | 2,615,615 | | | | 2,912,640 | |
| Tax-Free National | | | – | | | | – | | | | 2,730,606 | | | | 2,867,622 | |
| High Quality Bond | | | 24,633,118 | | | | 39,770,005 | | | | 7,690,880 | | | | 16,986,015 | |
| Core Bond | | | 51,141,562 | | | | 33,261,002 | | | | 33,880,518 | | | | 21,935,812 | |
| Covered Call & Equity Income | | | – | | | | – | | | | 247,783,872 | | | | 150,830,680 | |
| Dividend Income | | | – | | | | – | | | | 65,487,599 | | | | 154,467,125 | |
| Investors | | | – | | | | – | | | | 69,965,641 | | | | 77,413,896 | |
| Sustainable Equity | | | – | | | | – | | | | 2,850,128 | | | | 3,537,411 | |
| Mid Cap | | | – | | | | – | | | | 129,868,626 | | | | 74,824,821 | |
| Small Cap | | | – | | | | – | | | | 66,738,751 | | | | 82,763,257 | |
| International Stock | | | – | | | | – | | | | 2,857,569 | | | | 3,774,627 | |
8. COVERED CALL AND PUT OPTIONS
An option on a security is a contract that gives the holder of the option, in return for a premium, the right to buy from (in the case of a call) or sell to (in the case of a put) the writer of the option the security underlying the option at a specified exercise or “strike” price. The writer of an option on a security has an obligation upon exercise of the option to deliver the underlying security upon payment of the exercise price (in the case of a call) or pay the exercise price upon delivery of the underlying security (in the case of a put).
The Covered Call & Equity Income Fund pursues its primary objective by employing an option strategy of writing (selling) covered call options on common stocks. The number of call options the fund can write (sell) is limited by the amount of equity securities the fund holds in its portfolio. The fund will not write (sell) “naked” or uncovered call options. The fund seeks to produce a high level of current income and gains generated from option writing premiums and, to a lesser extent, from dividends. Covered call writing also helps to reduce volatility (and risk profile) of the fund by providing protection from declining stock prices.
When an option is written, the premium received is recorded as an asset with an equal liability and is subsequently marked to market to reflect the current fair value of the option written. These liabilities are reflected as options written in the Statements of Assets and Liabilities. Premiums received from writing options which expire unexercised are recorded on the expiration date as a realized gain. The difference between the premium received and the amount paid on effecting a closing purchase transaction, including brokerage commissions, is also treated as a realized gain, or if the premium is less than the amount paid for the closing purchase transactions, as a realized loss. If a call option is exercised, the premium is added to the proceeds from the sale of the underlying security in determining whether there has been a realized gain or loss. See Note 4 for information on derivatives.
9. FUTURES CONTRACTS AND OPTIONS ON FUTURES CONTRACTS
The Core Bond Fund and Covered Call & Equity Fund may purchase and sell futures contracts and purchase and write options on futures contracts on a limited basis. The Fund may purchase and sell futures contracts based on various securities (such as U.S. Government securities), securities indices, foreign currencies and other financial instruments and indices. The Fund will engage in futures or related options transactions on a limited basis only for bona fide hedging purposes or for purposes of seeking to increase total returns to the extent permitted by regulations of the Commodity Futures Trading Commission.
Futures Contracts. The Core Bond Fund and Covered Call & Equity Fund may use futures contracts to manage its exposure to the securities markets or to movements in interest rates and currency values. The primary risks associated with the use of futures contracts are the imperfect correlation between the change in fair value of the securities held by the Fund and the prices of futures contracts and the possibility of an illiquid market. Futures contracts are valued based upon their quoted daily settlement prices. Upon entering into a futures contract, the Fund is required to deposit with its futures broker an amount of cash, US government and agency obligations, or other liquid assets, in accordance with the initial margin requirements of the broker or exchange. Futures contracts are marked to market daily and based on such movements in the price of the contracts, an appropriate payable or receivable for the change in value may be posted or collected by the Fund (“variation margin”). Gains or losses are recognized but not considered realized until the contracts expire or close. Futures contracts involve, to varying degrees, risk of loss in excess of the variation margin disclosed within exchange traded or centrally cleared financial derivative instruments on the Statements of Assets and Liabilities.
During the year ended October 31, 2023, the Fund did not enter into any futures contracts.
Madison Funds | October 31, 2023
Notes to the Financial Statements- continued
Options on Futures Contracts. The acquisition of put and call options on futures contracts will give the Core Bond Fund and Covered Call & Equity Fund the right (but not the obligation) for a specified price, to sell or to purchase, respectively, the underlying futures contract at any time during the option period. As the purchaser of an option on a futures contract, the funds obtain the benefit of the futures position if prices move in a favorable direction but limits its risk of loss in the event of an unfavorable price movement to the loss of the premium and transaction costs.
The writing of a call option on a futures contract generates a premium which may partially offset a decline in the value of the Funds’ assets. By writing a call option, the Funds become obligated, in exchange for the premium, to sell a futures contract which may have a value higher than the exercise price. Conversely, the writing of a put option on a futures contract generates a premium, which may partially offset an increase in the price of securities that the Fund intend to purchase. However, the Funds become obligated to purchase a futures contract, which may have a value lower than the exercise price. Thus, the loss incurred by the Funds in writing options on futures is potentially unlimited and may exceed the amount of the premium received.
During the year ended October 31, 2023, the Funds did not enter into any options on futures contracts.
10. FOREIGN SECURITIES
Each fund, other than the Tax-Free Virginia and Tax-Free National Funds, may invest in foreign securities. Foreign securities are defined as securities that are: (i) issued by companies organized outside the US or whose principal operations are outside the US or issued by foreign governments or their agencies or instrumentalities (“foreign issuers”); (ii) principally traded outside of the US; and (iii) quoted or denominated in a foreign currency (“non-dollar securities”). Foreign securities include ADRs, European Depositary Receipts (“EDRs”), GDRs, Swedish Depositary Receipts (“SDRs”) and foreign money market securities.
Certain of the Funds have reclaims receivable balances, in which the Funds are due a reclaim on the taxes that have been paid to some foreign jurisdictions. The values of all reclaims are not significant for any of the Funds and are reflected in Other Assets on the Statements of Assets and Liabilities. These receivables are reviewed to ensure the current receivable balance is reflective of the amount deemed to be collectible.
11. SECURITIES LENDING
The Board of Trustees has authorized the Funds to engage in securities lending with State Street Bank and Trust Company as securities lending agent pursuant to a Securities Lending Authorization Agreement (the “Agreement”) and subject to certain securities lending policies and procedures. Under the terms of the Agreement, and subject to the policies and procedures, the authorized funds may lend portfolio securities to qualified borrowers in order to generate additional income, while managing risk associated with the securities lending program. The Agreement requires that loans are collateralized at all times by cash or U.S.government securities, initially equal to at least 102% of the value of domestic securities and 105% of non-domestic securities. The loaned securities and collateral are marked to market daily to maintain collateral at 102% of the total loaned portfolio for each broker/borrower. Amounts earned as interest on investments of cash collateral, net of rebates and fees, if any, are included in the Statements of Operations. The primary risk associated with securities lending is loss associated with investment of cash and non-cash collateral. A secondary risk is if the borrower defaults on its obligation to return the securities loaned because of insolvency or other reasons. The Funds could experience delays and costs in recovering securities loaned or in gaining access to the collateral. Under the Agreement, the securities lending agent has provided a limited indemnification in the event of a borrower default. The Funds do not have a master netting agreement.
As of October 31, 2023, the aggregate fair value of securities on loan for the Madison fund family was $58,624,793. Cash collateral received for such loans is reinvested into the State Street Navigator Securities Lending Government Money Market Portfolio. Non-cash collateral is invested in U.S.treasuries or government securities. See below for fair value on loan and collateral breakout for each fund and each respective fund’s portfolio of investments for individual securities identified on loan.
| Fund | | Market Value | | | Cash Collateral* | | | Non-Cash Collateral* | |
| Moderate Allocation | | $ | 5,431,155 | | | $ | 5,522,899 | | | $ | – | |
| Aggressive Allocation | | | 4,847,435 | | | | 4,930,101 | | | | – | |
| Diversified Income | | | 2,308,207 | | | | 2,364,950 | | | | – | |
| High Quality Bond | | | 2,162,301 | | | | 2,209,000 | | | | – | |
| Core Bond | | | 1,081,353 | | | | 1,103,783 | | | | – | |
| Investors | | | 6,635,120 | | | | – | | | | 6,788,665 | |
| Mid Cap | | | 34,397,280 | | | | 3,776,108 | | | | 31,409,810 | |
| Small Cap | | | 1,633,088 | | | | 1,573,703 | | | | – | |
| International Stock | | | 128,854 | | | | 108 | | | | 131,814 | |
*Collateral Represents minimum 102% of the value of domestic securities and 105% of non-domestic securities on loan, based upon the prior days market value for securities loaned.
Madison Funds | October 31, 2023
Notes to the Financial Statements- continued
The following table provides increased transparency about the types of collateral pledged for securities lending transactions that are accounted for as secured borrowing. Non-cash collateral is not reflected in the table because the Funds cannot repledge or resell this collateral.
| | | Remaining Contractual Maturity of the | |
| | | Agreements As of October 31, 2023 | |
| | | Overnight and | | | | | | Between | | | | | | | |
| | | Continuous | | | <30 days | | | 30 & 90 days | | | >90 days | | | Total | |
| Securities Lending Transactions1 | | | | | | | | | | | | | | | | | | | | |
| Moderate Allocation | | | | | | | | | | | | | | | | | | | | |
| Government Money Market | | $ | 5,522,899 | | | $ | – | | | $ | – | | | $ | – | | | $ | 5,522,899 | |
| Total Borrowings | | $ | 5,522,899 | | | $ | – | | | $ | – | | | $ | – | | | $ | 5,522,899 | |
| Gross amount of recognized liabilities for securities lending transactions | | | | | | | | | | | | | | | | | | $ | 5,522,899 | |
| Aggressive Allocation | | | | | | | | | | | | | | | | | | | | |
| Government Money Market | | $ | 4,930,101 | | | $ | – | | | $ | – | | | $ | – | | | $ | 4,930,101 | |
| Total Borrowings | | $ | 4,930,101 | | | $ | – | | | $ | – | | | $ | – | | | $ | 4,930,101 | |
| Gross amount of recognized liabilities for securities lending transactions | | | | | | | | | | | | | | | | | | $ | 4,930,101 | |
| Diversified Income | | | | | | | | | | | | | | | | | | | | |
| Government Money Market | | $ | 2,364,950 | | | $ | – | | | $ | – | | | $ | – | | | $ | 2,364,950 | |
| Total Borrowings | | $ | 2,364,950 | | | $ | – | | | $ | – | | | $ | – | | | $ | 2,364,950 | |
| Gross amount of recognized liabilities for securities lending transactions | | | | | | | | | | | | | | | | | | $ | 2,364,950 | |
| High Quality Bond | | | | | | | | | | | | | | | | | | | | |
| Government Money Market | | $ | 2,209,000 | | | $ | – | | | $ | – | | | $ | – | | | $ | 2,209,000 | |
| Total Borrowings | | $ | 2,209,000 | | | $ | – | | | $ | – | | | $ | – | | | $ | 2,209,000 | |
| Gross amount of recognized liabilities for securities lending transactions | | | | | | | | | | | | | | | | | | $ | 2,209,000 | |
| Core Bond | | | | | | | | | | | | | | | | | | | | |
| Government Money Market | | $ | 1,103,783 | | | $ | – | | | $ | – | | | $ | – | | | $ | 1,103,783 | |
| Total Borrowings | | $ | 1,103,783 | | | $ | – | | | $ | – | | | $ | – | | | $ | 1,103,783 | |
| Gross amount of recognized liabilities for securities lending transactions | | | | | | | | | | | | | | | | | | $ | 1,103,783 | |
| Mid Cap | | | | | | | | | | | | | | | | | | | | |
| Government Money Market | | $ | 3,776,108 | | | $ | – | | | $ | – | | | $ | – | | | $ | 3,776,108 | |
| Total Borrowings | | $ | 3,776,108 | | | $ | – | | | $ | – | | | $ | – | | | $ | 3,776,108 | |
| Gross amount of recognized liabilities for securities lending transactions | | | | | | | | | | | | | | | | | | $ | 3,776,108 | |
| Small Cap | | | | | | | | | | | | | | | | | | | | |
| Government Money Market | | $ | 1,573,703 | | | $ | – | | | $ | – | | | $ | – | | | $ | 1,573,703 | |
| Total Borrowings | | $ | 1,573,703 | | | $ | – | | | $ | – | | | $ | – | | | $ | 1,573,703 | |
| Gross amount of recognized liabilities for securities lending transactions | | | | | | | | | | | | | | | | | | $ | 1,573,703 | |
| International Stock | | | | | | | | | | | | | | | | | | | | |
| Government Money Market | | $ | 108 | | | $ | – | | | $ | – | | | $ | – | | | $ | 108 | |
| Total Borrowings | | $ | 108 | | | $ | – | | | $ | – | | | $ | – | | | $ | 108 | |
| Gross amount of recognized liabilities for securities lending transactions | | | | | | | | | | | | | | | | | | $ | 108 | |
(1) Amounts represent the payable for cash collateral received on securities on loan. This will generally be in the “Overnight and Continuous” column as the securities are typically callable on demand. The payable will be allocated into categories of securities based on the market value of the securities on loan.
12. FEDERAL AND FOREIGN INCOME TAX INFORMATION
It is each Fund’s policy to comply with the requirements of Subchapter M of the Internal Revenue Code of 1986, as amended, applicable to regulated investment companies and to distribute all its taxable income to its shareholders and any net realized capital gains at least annually. Accordingly, no provisions for federal income taxes are recorded in the accompanying statements.
The Funds have not recorded any liabilities for material unrecognized tax benefits as of October 31, 2023. It is each fund’s policy to recognize accrued interest and penalties related to uncertain tax benefits in income taxes, as appropriate. Tax years that remain open to examination by major tax jurisdictions include tax years ended October 31, 2020 through October 31, 2023.
The tax character of distributions paid during the years ended October 31, 2023 and 2022 were as follows:
| | | Tax Exempt Income | | | Ordinary Income | | | Long- Term Capital Gain | |
| Fund | | 2023 | | | 2022 | | | 2023 | | | 2022 | | | 2023 | | | 2022 | |
| Conservative Allocation | | $ | – | | | $ | – | | | $ | 935,521 | | | $ | 1,935,908 | | | $ | – | | | $ | 2,172,675 | |
| Moderate Allocation | | | – | | | | – | | | | 1,339,254 | | | | 5,983,947 | | | | – | | | | 4,373,649 | |
| Aggressive Allocation | | | – | | | | – | | | | 630,069 | | | | 3,544,594 | | | | – | | | | 2,595,089 | |
| Diversified Income | | | – | | | | – | | | | 3,054,490 | | | | 4,789,374 | | | | 9,535,841 | | | | 16,074,942 | |
| Tax-Free Virginia | | | 325,626 | | | | 320,631 | | | | – | | | | – | | | | – | | | | 65,428 | |
| Tax-Free National | | | 359,602 | | | | 331,863 | | | | – | | | | 14,769 | | | | 124,906 | | | | 165,179 | |
| High Quality Bond | | | – | | | | – | | | | 1,379,348 | | | | 1,007,136 | | | | – | | | | 589,691 | |
| Core Bond | | | – | | | | – | | | | 5,748,997 | | | | 3,579,748 | | | | – | | | | 1,031,083 | |
| Covered Call & Equity Income | | | – | | | | – | | | | 13,288,982 | | | | 6,894,536 | | | | – | | | | – | |
| Dividend Income | | | – | | | | – | | | | 5,914,058 | | | | 8,845,416 | | | | 20,310,587 | | | | 26,172,810 | |
| Investors | | | – | | | | – | | | | 837,113 | | | | 1,535,866 | | | | 18,181,319 | | | | 29,455,574 | |
| Sustainable Equity | | | – | | | | – | | | | 53,311 | | | | – | | | | – | | | | – | |
| Mid Cap | | | – | | | | – | | | | – | | | | 890,613 | | | | 13,295,402 | | | | 32,271,670 | |
| Small Cap | | | – | | | | – | | | | – | | | | 12,170,756 | | | | 9,250,241 | | | | 49,376,230 | |
| International Stock | | | – | | | | – | | | | 36,488 | | | | 895,246 | | | | – | | | | 3,711,055 | |
| | | | | | | | | | | | | | | | | | | | | | | | | |
Madison Funds | October 31, 2023
Notes to the Financial Statements- continued
As of October 31, 2023, the components of distributable earnings on a tax basis were as follows:
| Fund | | Tax Exempt Income | | | Ordinary Income | | | Long-Term Capital Gain | |
| Conservative Allocation | | $ | – | | | $ | 109,555 | | | $ | – | |
| Moderate Allocation | | | – | | | | 1,305,922 | | | | – | |
| Aggressive Allocation | | | – | | | | 594,723 | | | | – | |
| Diversified Income | | | – | | | | – | | | | 16,630,770 | |
| Tax-Free Virginia | | | 2,529 | | | | – | | | | – | |
| Tax-Free National | | | 4,948 | | | | – | | | | – | |
| High Quality Bond | | | – | | | | 126,345 | | | | – | |
| Core Bond | | | – | | | | 326,637 | | | | – | |
| Covered Call & Equity Income | | | – | | | | 7,786,723 | | | | – | |
| Dividend Income | | | – | | | | 256,639 | | | | 7,215,772 | |
| Investors | | | – | | | | 2,594,445 | | | | 25,450,814 | |
| Sustainable Equity | | | – | | | | 64,766 | | | | – | |
| Mid Cap | | | – | | | | 1,914,682 | | | | 9,366,219 | |
| Small Cap | | | – | | | | – | | | | 522,295 | |
| International Stock | | | – | | | | 40,656 | | | | – | |
For federal income tax purposes, the Funds listed below have capital loss carryovers as of October 31, 2023, which are available to offset future capital gains, if any, realized through the fiscal year listed:
| | | No Expiration Date | |
| Fund | | Short-Term | | | Long-Term | |
| Conservative Allocation | | $ | (2,680,113 | ) | | $ | (235,248 | ) |
| Moderate Allocation | | | (1,864,459 | ) | | | – | |
| Aggressive Allocation | | | (737,367 | ) | | | – | |
| Tax-Free Virginia | | | (62,710 | ) | | | (57,610 | ) |
| Tax-Free National | | | – | | | | (23,159 | ) |
| High Quality Bond | | | (318,129 | ) | | | (4,073,359 | ) |
| Core Bond | | | (800,665 | ) | | | (8,499,121 | ) |
| Dividend Income | | | (604,799 | ) | | | – | |
| Sustainable Equity | | | (295,865 | ) | | | (470,121 | ) |
| International Stock | | | (23,167 | ) | | | (1,055,243 | ) |
The loss carryovers for Core Bond Fund and Dividend Income Fund include losses pertaining to prior-year mergers. The utilization of these inherited losses are subject to an annual limitation.
For the year-ended October 31, 2023, capital losses utilized for each fund were as follows:
| Fund | | Amount Utilized | |
| Aggressive Allocation | | $ | 205,798 | |
| Core Bond | | | 47,516 | |
| Dividend Income | | | 486,573 | |
| International Stock | | | 12,053 | |
Amount deferred is as follows:
| Fund | | Amount Deferred | |
| Small Cap | | $ | 532,166 | |
At October 31, 2023, the aggregate gross unrealized appreciation (depreciation) and net unrealized appreciation (depreciation) for all securities, as computed on a federal income tax basis for each fund were as follows:
| Fund | | Appreciation | | | Depreciation | | | Net | |
| Conservative Allocation | | $ | 363,822 | $ | | | (4,662,549 | ) | | $ | (4,298,727 | ) |
| Moderate Allocation | | | 2,698,702 | | | | (6,580,703 | ) | | | (3,882,001 | ) |
| Aggressive Allocation | | | 2,183,115 | | | | (2,557,549 | ) | | | (374,434 | ) |
| Diversified Income | | | 1,199,676 | | | | (5,939,278 | ) | | | (4,739,602 | ) |
| Tax-Free Virginia | | | – | | | | (1,421,013 | ) | | | (1,421,013 | ) |
| Tax-Free National | | | 10,626 | | | | (1,158,691 | ) | | | (1,148,065 | ) |
| High quality bond | | | 952 | | | | (4,524,800 | ) | | | (4,523,848 | ) |
| Core Bond | | | 21,902 | | | | (26,929,885 | ) | | | (26,907,983 | ) |
| Covered Call & Equity Income | | | 3,118,204 | | | | (30,364,657 | ) | | | (27,246,453 | ) |
| Dividend Income | | | 33,783,446 | | | | (12,106,430 | ) | | | 21,677,016 | |
| Investors | | | 120,440,378 | | | | (5,843,860 | ) | | | 114,596,518 | |
| Sustainable Equity | | | 674,122 | | | | (668,799 | ) | | | 5,323 | |
| Mid Cap | | | 326,038,756 | | | | (15,856,957 | ) | | | 310,181,799 | |
| Small Cap | | | 29,274,450 | | | | (16,581,806 | ) | | | 12,692,644 | |
| International Stock | | | 1,068,587 | | | | (3,003,354 | ) | | | (1,934,767 | ) |
Madison Funds | October 31, 2023
Notes to the Financial Statements- continued
The differences between cost amounts for book purposes and tax purposes are primarily due to the tax deferral of wash sales.
Reclassification Adjustments. Paid-in capital, undistributed net investment income, and accumulated net realized gain (loss) have been adjusted in the Statements of Assets and Liabilities for permanent book-tax differences for all Funds.
Differences primarily relate to the tax treatment of net operating losses, paydown gains and losses, foreign currency gains and losses, return of capital and other distributions from real estate investment trusts and non-REIT, securities adjustments related to Treasury Inflation Protected securities(TIPS), distribution re-designations from investments in other regulated investment companies and unusable capital carry loss carryforwards.
To the extent these book and tax differences are permanent in nature, such amounts are reclassified at the end of the fiscal year among paid-in capital in excess of par value, accumulated undistributed net investment income (loss) and accumulated net realized gain (loss) on investments and foreign currency translations. Accordingly, at October 31, 2023, reclassifications were recorded as follows
| | | | | | Undistributed | | | Accumulated Net | |
| | | | | | Net Investment | | | Realized | |
| Fund | | Paid-in Capital | | | Income (Loss) | | | Gain (Loss) | |
| Conservative Allocation | | $ | – | | | $ | – | | | $ | – | |
| Moderate Allocation | | | – | | | | – | | | | – | |
| Aggressive Allocation | | | – | | | | – | | | | – | |
| Diversified Income | | | – | | | | (12,254 | ) | | | 12,254 | |
| Tax-Free Virginia | | | – | | | | (907 | ) | | | 907 | |
| Tax-Free National | | | – | | | | – | | | | – | |
| High quality bond | | | – | | | | – | | | | – | |
| Core Bond | | | – | | | | 17,900 | | | | (17,900 | ) |
| Covered Call & Equity Income | | | (2 | ) | | | 9,857,368 | | | | (9,857,366 | ) |
| Dividend Income | | | – | | | | (287,767 | ) | | | 287,767 | |
| Investors | | | – | | | | – | | | | – | |
| Sustainable Equity | | | | | | | | | | | | |
| Mid Cap | | | (1 | ) | | | 303,085 | | | | (303,084 | ) |
| Small Cap | | | (578,287 | ) | | | 401,726 | | | | 176,561 | |
| International Stock | | | – | | | | (2,115 | ) | | | 2,115 | |
13. CERTAIN RISKS
Investing in certain financial instruments, including forward foreign currency contracts, involves certain risks. Risks associated with these instruments include potential for an illiquid secondary market for the instruments or inability of counterparties to perform under the terms of the contracts, changes in the value of foreign currency relative to the US dollar and financial statements’ volatility resulting from an imperfect correlation between the movements in the prices of the instruments and the prices of the underlying securities and interest rates being hedged.
Investing in foreign securities involves certain risks not necessarily found in US markets. These include risks associated with adverse changes in economic, political, regulatory and other conditions, changes in currency exchange rates, exchange control regulations, expropriation of assets or nationalization, imposition of withholding taxes on dividend or interest payments or capital gains, and possible difficulty in obtaining and enforcing judgments against foreign entities. Further, issuers of foreign securities are subject to different, and often less comprehensive, accounting, reporting and disclosure requirements than domestic issuers.
Slowing global economic growth, the possibility of changes to some international trade agreements, tensions or open conflict between nations, such as between Russia and Ukraine, or political or economic dysfunction within some nations that are major producers of oil could affect the economies of many nations, including the United States, in ways that cannot necessarily be foreseen at the present time.
The Funds may be subject to interest rate risk which is the risk that the value of your investment will fluctuate with changes in interest rates. Typically, a rise in interest rates causes a decline in the fair value of income-bearing securities. When interest rates rise, bond prices fall; generally the longer a bond’s maturity, the more sensitive it is to risk. Federal Reserve policy changes may expose fixed-income and related markets to heightened volatility and may reduce liquidity for certain fund investments, which could cause the value of a fund’s investments and share price to decline. The Core Bond Fund may invest in derivatives tied to fixed-income markets and may be more substantially exposed to these risks than a fund that does not invest in derivatives.
The Tax-Free Funds invest in municipal securities. Municipal securities generally are subject to possible default, bankruptcy or insolvency of the issuer. Principal and interest repayment may be affected by federal, state and local legislation, referendums, judicial decisions and executive acts. The tax-exempt status of municipal securities may be affected by future changes in the tax laws, litigation involving the tax status of the securities and errors and omissions by issuers and their counsel. Madison will not attempt
Madison Funds | October 31, 2023
Notes to the Financial Statements- continued
to make an independent determination of the present or future tax-exempt status of municipal securities acquired for the funds. While most municipal securities have a readily available market, a variety of factors, including the scarcity of issues and the fact that tax-free investments are inappropriate for significant numbers of investors, limit the depth of the market for these securities. Accordingly, it may be more difficult for the funds to sell large blocks of municipal securities advantageously than would be the case with comparable taxable securities.
The Core Bond Fund may invest in futures contracts or options on futures contracts. Investing in futures contracts and options on futures entail certain other risks such as: unanticipated changes in interest rates, securities prices or currency exchange rates, and may result in a poorer overall performance for the fund than if it had not entered into any futures contracts or options transactions. In the event of an imperfect correlation between a futures position and portfolio position which is intended to be protected, the desired protection may not be obtained and the fund may be exposed to risk of loss. Perfect correlation between the fund’s futures positions and portfolio positions may be difficult to achieve.
The Covered Call & Equity Income Fund invests in options on securities. As the writer of a covered call option, the fund forgoes, during the option’s life, the opportunity to profit from increases in the fair value of the security covering the call option above the sum of the premium and the strike price of the call but has retained the risk of loss should the price of the underlying security decline. A writer of a put option is exposed to the risk of loss if fair value of the underlying securities declines, but profits only to the extent of the premium received if the underlying security increases in value. The writer of an option has no control over the time when it may be required to fulfill its obligation as writer of the option. Once an option writer has received an exercise notice, it cannot effect a closing purchase transaction in order to terminate its obligation under the option and must deliver the underlying security at the exercise price.
The Allocation Funds are fund of funds, meaning that each invests primarily in Underlying Funds, including ETFs. Thus, each fund’s investment performance and its ability to achieve its investment goal are directly related to the performance of the Underlying Funds in which it invests; and the Underlying Fund’s performance, in turn, depends on the particular securities in which that Underlying Fund invests and the expenses of that fund. Accordingly, the Allocation Funds are subject to the risks of the Underlying Funds in direct proportion to the allocation of their respective assets among the Underlying Funds.
Additionally, the Allocation Funds are subject to asset allocation risk and manager risk. Manager risk (i.e., fund selection risk) is the risk that the Underlying Fund(s) selected to fulfill a particular asset class underperforms their peers. Asset allocation risk is the risk that the allocation of the fund’s assets among the various asset classes and market segments will cause the fund to underperform other funds with a similar investment objective.
The Funds are also subject to cybersecurity risk, which include the risks associated with computer systems, networks and devices to carry out routine business operations. These systems, networks and devices employ a variety of protections that are designed to prevent cyberattacks. Despite the various cyber protections utilized by the Funds the Investment Adviser, and other service providers, their systems, networks, or devices could potentially be breached. The Funds, their shareholders, and the Investment Adviser could be negatively impacted as a result of a cybersecurity breach. The Funds cannot control the cybersecurity plans and systems put in place by service providers or any other third parties whose operations may affect the funds. The funds do monitor this risk closely.
In addition to the other risks described above and in the Prospectus, you should understand what we refer to as “unknown market risks”. While investments in securities have been keystones in wealth building and management, at times these investments have produced surprises. Those who enjoyed growth and income of their investments generally were rewarded for the risks they took by investing in the markets. Although the Investment Adviser seeks to appropriately address and manage the risks identified and disclosed to you in connection with the management of the securities in the Funds, you should understand that the very nature of the securities markets includes the possibility that there may be additional risks of which we are not aware. We certainly seek to identify all applicable risks and then appropriately address them, take appropriate action to reasonably manage them and to make you aware of them so you can determine if they exceed your risk tolerance. Nevertheless, the often volatile nature of the securities markets and the global economy in which we work suggests that the risk of the unknown is something to consider in connection with an investment in securities. Unforeseen events could under certain circumstances produce a material loss of the value of some or all of the securities we manage for you in the Funds.
Madison Funds | October 31, 2023
Notes to the Financial Statements- continued
14. CAPITAL SHARES AND AFFILIATED OWNERSHIP
The Allocation Funds invest in Underlying Funds, certain of which may be deemed to be under common control because of the same or affiliated investment adviser and membership in a common family of investment companies (the “Affiliated Issuers”). A summary of the transactions with each Affiliated Underlying Fund during the year ended October 31, 2023 follows:
| | | | | | | | | | | | | | | Change in | | | | | | | | | | | | | |
| | | Beginning | | | | | | | | | | | | Unrealized | | | | | | | | | | | | | |
| | | value as of | | | Gross | | | Gross | | | Realized | | | Appreciation | | | Value at | | | | | | | | | Distributions | |
| Fund/Underlying Fund | | 10/31/2022 | | | Additions | | | Sales | | | Gain (Loss) | | | (depreciation) | | | 10/31/2023 | | | Shares | | | Dividend Income | | | Received1 | |
| Conservative Allocation Fund | | | | | | | | | | | | | | | | | | | | | | | | | | | | | | | | | | | | |
| Madison Core Bond Fund Class R6 | | $ | 13,431,820 | | | $ | – | | | $ | (274,357 | ) | | $ | (76,190 | ) | | $ | (262,909 | ) | | $ | 12,818,364 | | | $ | 1,536,974 | | | $ | 426,132 | | | $ | – | |
| Madison Dividend Income Fund Class R6 | | | 537,249 | | | | – | | | | – | | | | – | | | | (72,110 | ) | | | 465,139 | | | | 18,349 | | | | 12,794 | | | | 36,809 | |
| Madison Investors Fund Class R6 | | | 2,683,256 | | | | 973,259 | | | | – | | | | – | | | | 223,962 | | | | 3,880,477 | | | | 151,759 | | | | 17,940 | | | | 180,318 | |
| Totals | | $ | 16,652,325 | | | $ | 973,259 | | | $ | (274,357 | ) | | $ | (76,190 | ) | | $ | (111,057 | ) | | $ | 17,163,980 | | | | | | | $ | 456,866 | | | $ | 217,127 | |
| | | | | | | | | | | | | | | | | | | | | | | | | | | | | | | | | | | | | |
| Moderate Allocation Fund | | | | | | | | | | | | | | | | | | | | | | | | | | | | | | | | | | | | |
| Madison Core Bond Fund Class R6 | | $ | 16,609,945 | | | $ | 1,000,000 | | | $ | — | | | $ | — | | | $ | (468,270 | ) | | $ | 17,141,675 | | | $ | 2,055,357 | | | $ | 560,344 | | | $ | — | |
| Madison Dividend Income Fund Class R6 | | | 1,073,409 | | | | 500,000 | | | | — | | | | — | | | | (165,592 | ) | | | 1,407,817 | | | | 55,535 | | | | 34,382 | | | | 73,544 | |
| Madison Investors Fund Class R6 | | | 9,040,113 | | | | 2,117,256 | | | | — | | | | — | | | | 716,642 | | | | 11,874,011 | | | | 464,373 | | | | 60,379 | | | | 606,878 | |
| Totals | | $ | 26,723,467 | | | $ | 3,617,256 | | | $ | — | | | $ | — | | | $ | 82,780 | | | $ | 30,423,503 | | | | | | | $ | 655,105 | | | $ | 680,422 | |
| | | | | | | | | | | | | | | | | | | | | | | | | | | | | | | | | | | | | |
| Aggressive Allocation Fund | | | | | | | | | | | | | | | | | | | | | | | | | | | | | | | | | | | | |
| Madison Core Bond Fund Class R6 | | $ | 4,456,998 | | | $ | — | | | $ | — | | | $ | — | | | $ | (114,549 | ) | | $ | 4,342,449 | | | $ | 520,677 | | | $ | 141,950 | | | $ | — | |
| Madison Dividend Income Fund Class R6 | | | 827,443 | | | | 309,412 | | | | — | | | | — | | | | (124,376 | ) | | | 1,012,479 | | | | 39,940 | | | | 25,163 | | | | 56,692 | |
| Madison Investors Fund Class R6 | | | 6,814,011 | | | | 954,299 | | | | — | | | | — | | | | 484,612 | | | | 8,252,922 | | | | 322,758 | | | | 41,109 | | | | 413,189 | |
| Totals | | $ | 12,098,452 | | | $ | 1,263,711 | | | $ | — | | | $ | — | | | $ | 245,687 | | | $ | 13,607,850 | | | | | | | $ | 208,222 | | | $ | 469,881 | |
| | | | | | | | | | | | | | | | | | | | | | | | | | | | | | | | | | | | | |
| Diversified Income Fund | | | | | | | | | | | | | | | | | | | | | | | | | | | | | | | | | | | | |
| Madison Aggregate Bond ETF | | $ | — | | | $ | 22,044,250 | | | $ | — | | | $ | — | | | $ | (743,300 | ) | | $ | 21,300,950 | | | $ | 1,100,000 | | | $ | 127,380 | | | $ | — | |
| Madison Covered Call ETF | | | — | | | | 37,008,825 | | | | — | | | | — | | | | (1,302,963 | ) | | | 35,705,862 | | | | 1,830,000 | | | | 12,993 | | | | — | |
| Madison Dividend Value ETF | | | — | | | | 29,671,500 | | | | — | | | | — | | | | (2,366,850 | ) | | | 27,304,650 | | | | 1,500,000 | | | | 112,800 | | | | — | |
| Madison Short—Term Strategic Income ETF | | | — | | | | 27,267,094 | | | | — | | | | — | | | | (357,719 | ) | | | 26,909,375 | | | | 1,362,500 | | | | 152,396 | | | | — | |
| Totals | | $ | — | | | $ | 115,991,669 | | | $ | — | | | $ | — | | | $ | (4,770,832 | ) | | $ | 111,220,837 | | | | | | | $ | 405,569 | | | $ | — | |
1 Distributions received include distributions from capital gains from the Underlying Funds.
15. SUBSEQUENT EVENTS
Management has evaluated the impact of all subsequent events on the Funds through the date the financial statements were available for issue. No events have taken place that meet the definition of subsequent event that require adjustment to, or disclosure in the financial statements.
Madison Funds | October 31, 2023
Report of Independent Registered Public Accounting Firm
REPORT OF INDEPENDENT REGISTERED PUBLIC ACCOUNTING FIRM
To the shareholders and the Board of Trustees of Madison Funds:
Opinion on the Financial Statements and Financial Highlights
We have audited the accompanying statements of assets and liabilities of Madison Funds (the “Funds”) comprising Madison Conservative Allocation Fund, Madison Moderate Allocation Fund, Madison Aggressive Allocation Fund, Madison Diversified Income Fund, Madison Tax-Free Virginia Fund, Madison Tax-Free National Fund, Madison High Quality Bond Fund, Madison Core Bond Fund, Madison Covered Call & Equity Income Fund, Madison Dividend Income Fund, Madison Investors Fund, Madison Sustainable Equity Fund, Madison Mid Cap Fund, Madison Small Cap Fund, and Madison International Stock Fund, including the portfolios of investments as of October 31, 2023, the related statements of operations, the statements of changes in net assets, and the financial highlights for the periods indicated in the table below; and the related notes. In our opinion, the financial statements and financial highlights present fairly, in all material respects, the financial position of each of the funds constituting the Madison Funds, as of October 31, 2023, and the results of their operations, the changes in their net assets, and the financial highlights for the periods listed in the table below, in conformity with accounting principles generally accepted in the United States of America.
| Individual Funds Comprising Madison Funds | | Statements of Operations | | Statements of Changes in Net Assets | | Financial Highlights |
| Madison Conservative Allocation Fund | | For the year ended October 31, 2023. | | For the years ended October 31, 2023 and 2022 | | For the years ended October 31, 2023, 2022, 2021, 2020 and 2019 |
| Madison Moderate Allocation Fund | | For the year ended October 31, 2023. | | For the years ended October 31, 2023 and 2022 | | For the years ended October 31, 2023, 2022, 2021, 2020 and 2019 |
| Madison Aggressive Allocation Fund | | For the year ended October 31, 2023. | | For the years ended October 31, 2023 and 2022 | | For the years ended October 31, 2023, 2022, 2021, 2020 and 2019 |
| Madison Diversified Income Fund | | For the year ended October 31, 2023. | | For the years ended October 31, 2023 and 2022 | | For the years ended October 31, 2023, 2022, 2021, 2020 and 2019 |
| Madison Tax-Free Virginia Fund | | For the year ended October 31, 2023. | | For the years ended October 31, 2023 and 2022 | | For the years ended October 31, 2023, 2022, 2021, 2020 and 2019 |
| Madison Tax-Free National Fund | | For the year ended October 31, 2023. | | For the years ended October 31, 2023 and 2022 | | For the years ended October 31, 2023, 2022, 2021, 2020 and 2019 |
| Madison High Quality Bond Fund | | For the year ended October 31, 2023. | | For the years ended October 31, 2023 and 2022 | | For the years ended October 31, 2023, 2022, 2021, 2020 and 2019 |
| Madison Core Bond Fund | | For the year ended October 31, 2023. | | For the years ended October 31, 2023 and 2022 | | For the years ended October 31, 2023, 2022, 2021, 2020 and 2019 |
| Madison Covered Call & Equity Income Fund | | For the year ended October 31, 2023. | | For the years ended October 31, 2023 and 2022 | | For the years ended October 31, 2023, 2022, 2021, 2020 and 2019 |
| Madison Dividend Income Fund | | For the year ended October 31, 2023. | | For the years ended October 31, 2023 and 2022 | | For the years ended October 31, 2023, 2022, 2021, 2020 and 2019 |
| Madison Investors Fund | | For the year ended October 31, 2023. | | For the years ended October 31, 2023 and 2022 | | For the years ended October 31, 2023, 2022, 2021, 2020 and 2019 |
| Madison Sustainable Equity Fund | | For the year ended October 31, 2023. | | For the year ended October 31, 2023, and for the period January 3, 2022 (commencement of operations) through October 31, 2023. |
| Madison Mid Cap Fund | | For the year ended October 31, 2023. | | For the years ended October 31, 2023 and 2022 | | For the years ended October 31, 2023, 2022, 2021, 2020 and 2019 |
| Madison Small Cap Fund | | For the year ended October 31, 2023. | | For the years ended October 31, 2023 and 2022 | | For the years ended October 31, 2023, 2022, 2021, 2020 and for the period from October 1, 2019 through October 31, 2019, and the year ended September 30, 2019. |
| Madison International Stock Fund | | For the year ended October 31, 2023. | | For the years ended October 31, 2023 and 2022 | | For the years ended October 31, 2023, 2022, 2021, 2020 and 2019 |
Basis for Opinion
These financial statements and financial highlights are the responsibility of the Funds’ management. Our responsibility is to express an opinion on the Funds’ financial statements and financial highlights based on our audits. We are a public accounting firm registered with the Public Company Accounting Oversight Board (United States) (PCAOB) and are required to be independent with respect to the Funds in accordance with the U.S. federal securities laws and the applicable rules and regulations of the Securities and Exchange Commission and the PCAOB.
We conducted our audits in accordance with the standards of the PCAOB. Those standards require that we plan and perform the audit to obtain reasonable assurance about whether the financial statements and financial highlights are free of material misstatement, whether due to error or fraud. The Funds are not required to have, nor were we engaged to perform, an audit of their internal control over financial reporting. As part of our audits we are required to obtain an understanding of internal control over financial reporting but not for the purpose of expressing an opinion on the effectiveness of the Funds’ internal control over financial reporting. Accordingly, we express no such opinion.
Our audits included performing procedures to assess the risks of material misstatement of the financial statements and financial highlights, whether due to error or fraud, and performing procedures that respond to those risks. Such procedures included examining, on a test basis, evidence regarding the amounts and disclosures in the financial statements and financial highlights. Our audits also included evaluating the accounting principles used and significant estimates made by management, as well as evaluating the overall presentation of the financial statements and financial highlights. Our procedures included confirmation of securities owned as of October 31, 2023, by correspondence with the custodian and brokers. We believe that our audits provide a reasonable basis for our opinion.
/s/ Deloitte & Touche LLP
Chicago, Illiniois
December 26, 2023
We have served as the auditor of one or more Madison Funds investment companies since 2009.
Madison Funds | October 31, 2023
Discussion of Contract Renewal Process and Considerations
At a special meeting of the Board of Trustees (the “Board” or “Trustees”) of the Madison Funds (the “Trust”) held on September 11, 2023, the Board, and by a separate vote, the Independent Trustees of the Trust, considered and approved a new advisory agreement (the “New Advisory Agreement”), subject to shareholder approval, between the Trust and Madison Asset Management, LLC (the “Adviser”) with respect to the individual series of the Trust (each, a “Fund” and together, the “Funds”). The New Advisory Agreement was considered due to the plan by the parent company of the Adviser, Madison Investment Holdings, Inc. (“MIH”), to buy back a controlling interest in MIH from Frank Burgess, the founder, Chairman of the Board and controlling shareholder of MIH (the “Transaction”). The Transaction, which closed on December 1, 2023, resulted in a direct change of control of MIH and an indirect change of control of the Adviser, and constituted an “assignment” of the existing advisory agreement between the Trust and the Adviser (the “Existing Advisory Agreement”), within the meaning of the Investment Company Act of 1940, as amended (the “1940 Act”). An investment advisory agreement automatically terminates upon its “assignment” under the applicable provisions of the 1940 Act. Therefore, following approval of the New Advisory Agreement by the Board, the Board sought shareholder approval of the agreement, which, for all Funds except the Covered Call & Equity Income Fund (the “Covered Call Fund”), was obtained at a special shareholders’ meeting held on November 30, 2023. The Covered Call Fund had to adjourn its special shareholders’ meeting to solicit additional proxies, and as of the date this report was mailed to shareholders, the Fund is still in the process of gathering the requisite shareholder vote to approve the New Advisory Agreement. Because shareholder approval of the New Advisory Agreement for the Covered Call Fund was not obtained prior to the effective date of the change of control, that Fund has been operating under an interim advisory agreement since December 1, 2023, in compliance with Rule 15a-4 under the 1940 Act.
Prior to the special Board meeting, the Trustees received and considered information from the Adviser designed to provide the Trustees with the information necessary to evaluate the New Advisory Agreement. The information provided to the Board included: (1) data comparing management fees and expense ratios of comparable investment companies; (2) comparative performance information; (3) the Adviser’s and its affiliates’ revenues and costs of providing services to the Funds; and (4) information about the Adviser’s personnel. Before voting to approve the New Advisory Agreement, the Trustees reviewed these materials with management of the Adviser and with counsel to the Independent Trustees, and received advice from such counsel regarding the legal standards for the Trustees’ consideration of the approval of the New Advisory Agreement. This information, together with the information provided to the Board throughout the course of the year – particularly the information provided, presentations made and discussions that transpired during and in preparation for the most recent regular meeting of the Board of Trustees held on August 8, 2023, during which the Board reviewed and renewed the Existing Advisory Agreement for each Fund for another year – formed the primary (but not exclusive) basis for the Board’s determinations.
In determining whether to approve the New Advisory Agreement, the Trustees considered all factors they believed relevant, including the following with respect to each Fund: (1) the nature, extent, and quality of the services to be provided by the Adviser; (2) the Fund’s historical performance under the management of the same portfolio managers who would continue to manage the Fund following the Transaction, and the performance of other investment accounts managed by the Adviser; (3) comparative fee and expense data for each Fund and other peer investment companies; (4) the costs of the services provided by the Adviser and the profits realized by the Adviser from those services; (5) the extent to which economies of scale may be realized as each Fund grows, and whether the management fee for each Fund reflects such economies of scale for the Fund’s benefit; (6) the impact to the Adviser’s operations, if any, as a result of the Transaction; and (7) other financial benefits to the Adviser resulting from services rendered to the Fund. The Trustees also took into account the changes to the New Advisory Agreement from the Existing Advisory Agreement, concluding that such changes were not material and were proposed primarily to conform to the services currently provided by the Adviser, regulatory requirements, and industry best practices. The Board also considered the Adviser’s recommendation that the proposed Transaction was in the best interest of Fund shareholders because it would permit the Adviser to effect an orderly, well planned succession. In their deliberations, the Trustees weighed to varying degrees the importance of the information provided to them, did not identify any particular information that was all-important or controlling, and considered the information and made their determinations for each Fund separately and independently of the other Funds.
Based upon the information provided to the Board of Trustees throughout the course of the year, including a presentation to the Board by representatives of the Adviser and the supporting materials provided at the September 11, 2023 special Board meeting, the Board concluded that the New Advisory Agreement, as it relates to each Fund, is fair and reasonable in light of the services the Adviser performs, the management fees that each Fund pays, and such other matters as the Trustees considered relevant in the exercise of their reasonable business judgment. The material factors and conclusions that formed the basis of the Trustees’ determination to approve the New Advisory Agreement are summarized below.
Nature, Extent and Quality of the Services Provided. The Trustees considered the scope of services that the Adviser would provide under the New Advisory Agreement, noting that such services include but are not limited to investing each Fund’s assets consistent with the Fund’s investment objective and investment policies, determining the portfolio securities to be purchased, sold, or otherwise disposed of and the timing of such transactions, and selecting broker-dealers to execute orders on behalf of each Fund. The Trustees considered the qualifications, experience, and responsibilities of the portfolio managers to each Fund, who were expected to continue to serve under the New Advisory Agreement. The Trustees also considered the Adviser’s resources and compliance structure, including information regarding its compliance program and compliance record, and the Trustees’ familiarity with the Adviser due to the Adviser’s long history of providing investment management services to the Funds.
The Board also discussed the quality of services provided to the Trust by its transfer agent, sub-administrator, and custodian as well as the various administrative services provided by the Adviser pursuant to a separate administrative services agreement (the “Services Agreement”). In addition, the Trustees considered representations from the Adviser that the Transaction was expected to have little impact on the day-to-day operations of the Adviser.
Based on their review of the information provided, the Board determined that the Adviser has the quality and depth of personnel, resources, investment methods and compliance policies and procedures essential to performing its duties under the New Advisory Agreement and that the nature, extent and quality of services to be provided by the Adviser to the Funds would be satisfactory.
Fund Historical Performance and Overall Performance of Adviser. In assessing the quality of the portfolio management delivered by the Adviser, the Trustees reviewed the performance of each Fund on both an absolute basis and in comparison to an appropriate benchmark index and peer group. The Trustees noted the reasons for both outperformance and underperformance compared with benchmarks and peer groups. They recognized that the usefulness of comparative performance data as a frame of reference to measure a Fund’s performance may be limited because the performance peer group, among other things, may not precisely reflect the objectives and strategies of the Fund, may have a different investable universe, or the composition of the peer group may be limited in size or number as well as other factors.
As it relates to the Covered Call Fund and the International Stock Fund in particular, they also noted the unique aspects of the securities markets applicable to these Funds so that the performance of such Funds could be reviewed in context. For each of these Funds, the Trustees considered the following additional factors as part of their review:
Madison Funds | October 31, 2023
Discussion of Contract Renewal Process and Considerations - continued
(A) Covered Call Fund: (i) the use of options, particularly options on single securities, can present timing issues for the Fund in matching options with securities held; (ii) options pricing can be volatile, leading to different performance outcomes among peers; and (iii) the covered call peer group is relatively small with peers employing different investment strategies and investment methodologies, which can lead to wider performance bands; and (B) International Stock Fund: (i) investing and trading foreign securities presents a number of risks, which can impact performance, and create performance dispersion among peers; (ii) market liquidity, individual security valuation, exchange rate, and other exogenous factors relating to global economic, political, and market events create unique considerations when assessing performance of international and foreign funds; and (iii) international and foreign fund peer groups can vary widely based on investment strategies and styles, along with investment in foreign markets (e.g. frontier markets).
The Trustees reviewed both long-term and short-term performance and considered the effect on long-term performance that may have been attributable to any previous investment advisers/sub-advisers/portfolio managers to any Fund or to a different investment strategy. They recognized that the performance data reflects a snapshot in time, in this case as of the end of the most recent calendar year or quarter. They considered that a different performance period, however, could generate significantly different results. Further, they noted that long-term performance can be adversely affected by even one period of significant underperformance so that a single investment decision or theme has the ability to disproportionately affect long-term performance.
The Board also noted that on a quarterly basis, they review detailed information for each Fund, including investment performance results, portfolio composition and investment philosophies, processes, and strategies. In addition, the Board considered the Adviser’s quarterly portfolio commentary and discussion of each Fund’s performance, as well as the overviews provided by the Adviser’s Investment Strategy Oversight Committee. They also considered whether any relative underperformance was appropriate in view of the Adviser’s conservative investment philosophy. The Board noted the type of market environments that favor the Funds’ strategies and discussed the Funds’ performance in such market environments. Representatives of the Adviser discussed with the Board the methodology for arriving at benchmark indices and peer groups used for performance comparisons which, with respect to peer groups, followed the same process as the prior year. The Board also considered that sometimes, the Morningstar categories the Funds fall into do not precisely match a Fund’s investment strategy and philosophy.
Based on their review, the Board determined that, given the totality of the above factors and considerations, each Fund’s overall investment performance had been satisfactory.
Comparative Fee and Expense Data. In considering each Fund’s fees and expenses, the Board reviewed the expense ratios for a variety of other funds in each Fund’s peer group with similar investment objectives. Like the performance comparisons described above, the expense comparisons followed the same methodology as last year in terms of peer group selection.
The Board noted that the Adviser, or its affiliates, provide investment management services to other investment company and/or non-investment company clients and considered the management fees charged by the Adviser to such clients for purposes of determining whether the management fee charged to each Fund under the New Advisory Agreement was disproportionately large under the so-called “Gartenberg” standard traditionally used by investment company boards in connection with advisory contract approval considerations. The Gartenberg opinion and its progeny articulate the standard used to determine whether investment advisers to mutual funds have complied with their statutory fiduciary duty in charging fees for advisory services. The Trustees took those fees into account and considered the differences in services and time required by the various types of clients to which the Adviser provides services, including the Funds. The Board recognized that significant differences may exist between the services provided to one type of client and those provided to others, such as those resulting from a greater frequency of shareholder redemptions in a mutual fund, the higher turnover of mutual fund assets and the additional compliance and regulatory work associated with managing a 1940 Act fund. The Trustees gave such comparisons the weight that they merit in light of the similarities and differences between the services that the various Funds require. They considered that, if the services rendered by the Adviser to one type of client differed significantly from others, then the comparison should be given less weight. In the case of non-investment company clients for which the Adviser acts as an investment adviser, the Board noted that the fee may be lower than the fee charged to one or more Funds. The Trustees noted too the various administrative, operational, compliance, legal and corporate communication services required to be handled by the Adviser which are performed for investment company clients but are not typically performed for non-investment company clients.
The Trustees compared each Fund’s total expense ratio and management fee to those of comparable funds with similar investment objectives and strategies. The Board noted the relatively simple expense structure maintained by the Trust, which consists of a management fee and an administrative services fee, plus expenses for Independent Trustee compensation which are not covered by the administrative services fee. The Trustees reviewed total expense ratios paid by other funds with similar investment objectives and asset size, recognizing that such a comparison, while not dispositive, was an important consideration. The Trustees also considered a new expense limitation agreement that would go into effect at the same time as the New Advisory Agreement, pursuant to which the Adviser contractually agreed to waive its management fees and/or reimburse expenses of each Fund to the extent necessary to limit each class of each Fund’s total operating expenses as specified in the Funds’ prospectus, for a period of no less than two years from the effective date of the New Advisory Agreement.
With regard to the administrative services provided by the Adviser under the Services Agreement, the Board acknowledged that the Adviser is compensated for the administrative services it provides or arranges to provide to each of the Funds and that such compensation does not always cover all costs incurred by the Adviser because the Services Agreement effectively acts as a cap on administrative expenses. Therefore, the Board recognized that some of the administrative, operational, regulatory or compliance fees or costs in excess of the Services Agreement fees are paid by the Adviser from investment management fees earned. In this regard, the Trustees noted that examination of each Fund’s total expense ratio compared to those of other investment companies was more meaningful than a simple comparison of basic “investment management only” fee schedules.
In addition, the Trustees recognized that to the extent a Fund invests in other registered investment companies also managed by the Adviser, the Adviser receives investment management fees from both the Fund and the underlying registered investment company. The Board were satisfied in this regard that the Adviser provides separate services to each “fund of funds” portfolio within the Trust and the underlying registered investment company in which each such Fund invests in exchange for the fees received.
Madison Funds | October 31, 2023
Discussion of Contract Renewal Process and Considerations - continued
While recognizing that it is difficult to compare management fees because the scope of investment management services provided may vary from one investment adviser to another and from one client to another, the Trustees concluded that the Adviser’s management fee with respect to each Fund is reasonable.
Costs of Advisory Services and Profitability. The Trustees considered the management fee that each Fund pays to the Adviser under the Existing Advisory Agreement, which would remain the same under the New Advisory Agreement, as well as the Adviser’s profitability from services rendered to each Fund during the 12-month period ended December 31, 2022. In reviewing costs and profits, the Board noted that for some smaller Funds, the salaries of all portfolio management personnel, trading desk personnel, corporate accounting personnel and employees of the Adviser who serve as Trust officers, as well as facility costs (e.g., rent, etc.), could not be supported by fees received from such portfolios alone. However, the Board recognized that the Trust is profitable to the Adviser because such salaries and fixed costs are already paid in whole or in part from revenue generated by management of other client assets managed by the Adviser, including the Trust as a consolidated family of investment companies. The Trustees noted that total assets managed by the Adviser and its affiliates were approximately $22 billion as of May 31, 2022, and approximately $22.1 billion as of May 31, 2023. As a result, although the fees paid by an individual Fund at its present size might not be sufficient to profitably support a stand-alone fund, each Fund is reasonably profitable to the Adviser as part of its larger, diversified organization. In sum, the Trustees recognized that the Trust is important to the Adviser and is managed with the attention given to the Adviser’s other clients.
Following their review, the Board concluded that the costs for services provided by, and the level of profitability to, the Adviser was reasonable considering the services provided.
Economies of Scale. The Trustees considered whether the Funds would benefit from any economies of scale as each Fund’s assets increase, noting that the management fee schedules for several of the Funds already contain breakpoints. The Trustees noted that at current asset levels, it was not necessary to consider the implementation of fee breakpoints for Funds that do not currently have breakpoints. Based on their review, the Trustees concluded that the current management fee schedules were appropriate.
Other Benefits. In considering the direct and indirect benefits that could be realized by the Adviser from its relationship with the Funds, the Trustees considered the extent to which the Adviser utilizes soft dollar arrangements with respect to portfolio transactions and considered that the Adviser does not utilize any affiliated brokers to execute the Funds’ portfolio transactions. While the Trustees noted Rule 12b-1 fees may be paid for shareholder and distribution services performed on behalf of the Funds, the Trustees also observed that the Adviser was incurring its own distribution expenses on behalf of the Funds. The Trustees considered that the Adviser may receive some form of reputational benefit from services rendered to the Funds, but that such benefits are immaterial and cannot otherwise be quantified. The Trustees concluded that the additional benefits the Adviser receives from its relationship with the Funds are reasonable and appropriate.
Conclusion. In considering the approval of the New Advisory Agreement, the Board, including the Independent Trustees, did not identify any single factor as controlling, and each Trustee may have attributed different weights to the various factors. The Board evaluated all information available to them on a Fund-by-Fund basis, and their determinations were made separately with respect to each Fund. The Trustees reached the following conclusions, among others, regarding the New Advisory Agreement: (i) the Adviser demonstrated that it possesses the capability and resources to perform the duties required of it under the New Advisory Agreement; (ii) the Adviser is qualified to manage the each Fund’s assets in accordance with the Fund’s investment objective and strategies; (iii) the overall investment performance of each Fund is satisfactory relative to the performance of funds with similar investment objectives and relevant benchmark indices; (iv) each Fund’s management fee is reasonable in light of the services received by the Fund from the Adviser and other factors considered; and (v) the Adviser’s investment strategies are appropriate for pursuing the investment objectives of each Fund. Based on all of the information presented to and considered by the Board and the foregoing conclusions, the Board of Trustees, including the Independent Trustees, unanimously approved the New Advisory Agreement on the basis that its terms and conditions are fair and reasonable and in the best interests of the Funds and their respective shareholders.
Madison Funds | October 31, 2023
Other Information (unaudited)
FUND EXPENSES PAID BY SHAREHOLDERS
As shareholders of the Funds, you incur two types of costs: (1) transaction costs, including sales charges (loads) on purchase payments, and redemption fees; and (2) ongoing costs, including management fees; distribution and/or service (12b-1) fees; and other fund expenses. The examples below are intended to help you understand your ongoing costs (in dollars) of investing in the Funds and to compare these costs with the ongoing costs of investing in other mutual funds.
The examples below are based on an investment of $1,000 invested at the beginning of the period and held for the entire six-month period ended October 31, 2023. Expenses paid during the period in the tables below are equal to the Fund’s annualized expense ratio, multiplied by the average account value over the year, multiplied by 184/365 (to reflect the one-half fiscal year period).
Actual Expenses
The table below provides information about actual account values using actual expenses and actual returns for the Funds. You may use the information in this table, together with the amount you invested, to estimate the expenses that you paid over the period. Simply divide your account value by $1,000 (for example, an $8,600 account value divided by $1,000 = 8.6), then multiply the result by the number in the table for the fund you own under the heading entitled “Expenses Paid During Period” to estimate the expenses you paid on your account during this period.
| | | Class A | |
| | | | | | | | | | | | Expenses | |
| | | Beginning | | | Ending | | | Annual | | | Paid | |
| | | Account | | | Account | | | Expense | | | During | |
| Fund | | Value | | | Value | | | Ratio | | | Period | |
| Conservative Allocation* | | $ | 1,000 | | | $ | 953.20 | | | | 0.71 | % | | $ | 3.45 | |
| Moderate Allocation* | | | 1,000 | | | | 963.30 | | | | 0.70 | % | | | 3.46 | |
| Aggressive Allocation* | | | 1,000 | | | | 972.00 | | | | 0.70 | % | | | 3.48 | |
| Diversified Income | | | 1,000 | | | | 961.10 | | | | 1.00 | % | | | 4.35 | |
| Core Bond | | | 1,000 | | | | 942.40 | | | | 0.85 | % | | | 4.16 | |
| Dividend Income | | | 1,000 | | | | 937.00 | | | | 1.16 | % | | | 5.66 | |
| Covered Call & Equity Income | | | 1,000 | | | | 980.80 | | | | 1.26 | % | | | 6.29 | |
| Investors | | | 1,000 | | | | 1,025.60 | | | | 1.16 | % | | | 5.92 | |
| Mid Cap | | | 1,000 | | | | 1,036.90 | | | | 1.39 | % | | | 7.14 | |
| Small Cap | | | 1,000 | | | | 957.50 | | | | 1.35 | % | | | 6.66 | |
| International Stock | | | 1,000 | | | | 892.00 | | | | 1.61 | % | | | 7.68 | |
| | | Class C | |
| | | | | | | | | | | | Expenses | |
| | | Beginning | | | Ending | | | Annual | | | Paid | |
| Fund | | Account
Value | | | Account Value | | | Expense Ratio | | | During Period | |
| Conservative Allocation | | $ | 1,000 | | | $ | 949.40 | | | | 1.46 | % | | $ | 7.17 | |
| Moderate Allocation | | | 1,000 | | | | 960.00 | | | | 1.45 | % | | | 7.16 | |
| Aggressive Allocation | | | 1,000 | | | | 967.90 | | | | 1.46 | % | | | 7.24 | |
| Diversified Income | | | 1,000 | | | | 957.10 | | | | 1.63 | % | | | 8.04 | |
| Covered Call & Equity Income | | | 1,000 | | | | 977.30 | | | | 2.00 | % | | | 9.97 | |
| | | Class Y | |
| | | | | | | | | | | | Expenses | |
| | | Beginning | | | Ending | | | Annual | | | Paid | |
| | | Account | | | Account | | | Expense | | | During | |
| Fund | | Value | | | Value | | | Ratio | | | Period | |
| Tax-Free Virginia | | $ | 1,000 | | | $ | 957.90 | | | | 0.86 | % | | $ | 4.24 | |
| Tax-Free National | | | 1,000 | | | | 961.30 | | | | 0.76 | % | | | 3.76 | |
| High Quality Bond | | | 1,000 | | | | 980.70 | | | | 0.50 | % | | | 2.50 | |
| Core Bond | | | 1,000 | | | | 943.30 | | | | 0.60 | % | | | 2.94 | |
| Covered Call & Equity Income | | | 1,000 | | | | 981.60 | | | | 1.01 | % | | | 5.04 | |
| Dividend Income | | | 1,000 | | | | 938.60 | | | | 0.91 | % | | | 4.45 | |
| Investors | | | 1,000 | | | | 1,027.10 | | | | 0.91 | % | | | 4.65 | |
| Sustainable Equity | | | 1,000 | | | | 993.10 | | | | 0.91 | % | | | 4.57 | |
| Mid Cap | | | 1,000 | | | | 1,039.40 | | | | 0.94 | % | | | 4.83 | |
| Small Cap | | | 1,000 | | | | 959.30 | | | | 1.10 | % | | | 5.43 | |
| International Stock | | | 1,000 | | | | 893.30 | | | | 1.36 | % | | | 6.49 | |
Madison Funds | October 31, 2023
Other Information (unaudited) - continued
FUND EXPENSES PAID BY SHAREHOLDERS – continued
| | | Class I | |
| | | | | | | | | | | | Expenses | |
| | | Beginning | | | Ending | | | Annual | | | Paid | |
| | | Account | | | Account | | | Expense | | | During | |
| Fund | | Value | | | Value | | | Ratio | | | Period | |
| High Quality Bond | | $ | 1,000 | | | $ | 980.30 | | | | 0.41 | % | | $ | 2.05 | |
| Core Bond | | | 1,000 | | | | 943.50 | | | | 0.50 | % | | | 2.45 | |
| Covered Call & Equity Income | | | 1,000 | | | | 982.60 | | | | 0.96 | % | | | 4.80 | |
| Dividend Income | | | 1,000 | | | | 938.60 | | | | 0.81 | % | | | 3.96 | |
| Investors | | | 1,000 | | | | 1,027.60 | | | | 0.81 | % | | | 4.14 | |
| Sustainable Equity | | | 1,000 | | | | 994.20 | | | | 0.81 | % | | | 4.07 | |
| Mid Cap | | | 1,000 | | | | 1,039.30 | | | | 0.84 | % | | | 4.32 | |
| Small Cap | | | 1,000 | | | | 958.20 | | | | 1.00 | % | | | 4.94 | |
| | | Class R6 | |
| | | | | | | | | | | | Expenses | |
| | | Beginning | | | Ending | | | Annual | | | Paid | |
| | | Account | | | Account | | | Expense | | | During | |
| Fund | | Value | | | Value | | | Ratio | | | Period | |
| Core Bond | | $ | 1,000 | | | $ | 944.90 | | | | 0.42 | % | | $ | 2.06 | |
| Covered Call & Equity Income | | | 1,000 | | | | 983.00 | | | | 0.88 | % | | | 4.40 | |
| Dividend Income | | | 1,000 | | | | 939.40 | | | | 0.73 | % | | | 3.73 | |
| Investors | | | 1,000 | | | | 1,027.70 | | | | 0.76 | % | | | 3.91 | |
| Mid Cap | | | 1,000 | | | | 1,040.40 | | | | 0.73 | % | | | 3.57 | |
| Small Cap | | | 1,000 | | | | 959.40 | | | | 0.92 | % | | | 4.54 | |
*The annual expense ratio does not include the expenses of the underlying funds.
Hypothetical Example for Comparison Purposes
The table below provides information about hypothetical account values and hypothetical expenses based on the Funds’ actual expense ratios and an assumed rate of return of 5% per year before expenses, which are not the Funds’ actual returns. The hypothetical account values and expenses may not be used to estimate the actual ending account balance or expenses you paid for the period. You may use this information to compare the ongoing costs of investing in the Funds and other funds. To do so, compare the 5% hypothetical example of the Funds you own with the 5% hypothetical examples that appear in the shareholder reports of other similar funds.
| | | Class A | |
| | | | | | | | | | | | Expenses | |
| | | Beginning | | | Ending | | | Annual | | | Paid | |
| | | Account | | | Account | | | Expense | | | During | |
| Fund | | Value | | | Value | | | Ratio | | | Period | |
| Conservative Allocation* | | $ | 1,000 | | | $ | 1,021.68 | | | | 0.71 | % | | $ | 3.57 | |
| Moderate Allocation* | | | 1,000 | | | | 1,021.68 | | | | 0.70 | % | | | 3.57 | |
| Aggressive Allocation* | | | 1,000 | | | | 1,021.68 | | | | 0.70 | % | | | 3.57 | |
| Diversified Income | | | 1,000 | | | | 1,020.77 | | | | 1.00 | % | | | 4.48 | |
| Core Bond | | | 1,000 | | | | 1,020.92 | | | | 0.85 | % | | | 4.33 | |
| Dividend Income | | | 1,000 | | | | 1,019.36 | | | | 1.16 | % | | | 5.90 | |
| Covered Call & Equity Income | | | 1,000 | | | | 1,018.85 | | | | 1.26 | % | | | 6.41 | |
| Investors | | | 1,000 | | | | 1,019.36 | | | | 1.16 | % | | | 5.90 | |
| Mid Cap | | | 1,000 | | | | 1,018.20 | | | | 1.39 | % | | | 7.07 | |
| Small Cap | | | 1,000 | | | | 1,018.40 | | | | 1.35 | % | | | 6.87 | |
| International Stock | | | 1,000 | | | | 1,017.09 | | | | 1.61 | % | | | 8.19 | |
| | | Class C | |
| | | | | | | | | | | | Expenses | |
| | | Beginning | | | Ending | | | Annual | | | Paid | |
| | | Account | | | Account | | | Expense | | | During | |
| Fund | | Value | | | Value | | | Ratio | | | Period | |
| Conservative Allocation | | $ | 1,000 | | | $ | 1,017.85 | | | | 1.46 | % | | $ | 7.43 | |
| Moderate Allocation | | | 1,000 | | | | 1,017.90 | | | | 1.45 | % | | | 7.38 | |
| Aggressive Allocation | | | 1,000 | | | | 1,017.85 | | | | 1.46 | % | | | 7.43 | |
| Diversified Income | | | 1,000 | | | | 1,016.99 | | | | 1.63 | % | | | 8.29 | |
| Covered Call & Equity Income | | | 1,000 | | | | 1,015.12 | | | | 2.00 | % | | | 10.16 | |
Madison Funds | October 31, 2023
Other Information (unaudited) - continued
FUND EXPENSES PAID BY SHAREHOLDERS – continued
| | | Class Y | |
| | | | | | | | | | | | Expenses | |
Fund | | Beginning Account Value | | | Ending Account Value | | | Annual Expense Ratio | | | Paid During Period | |
| Tax-Free Virginia | | $ | 1,000 | | | $ | 1,020.87 | | | | 0.86 | % | | $ | 4.38 | |
| Tax-Free National | | | 1,000 | | | | 1,021.37 | | | | 0.76 | % | | | 3.87 | |
| High Quality Bond | | | 1,000 | | | | 1,022.68 | | | | 0.50 | % | | | 2.55 | |
| Core Bond | | | 1,000 | | | | 1,022.18 | | | | 0.60 | % | | | 3.06 | |
| Covered Call & Equity Income | | | 1,000 | | | | 1,020.11 | | | | 1.01 | % | | | 5.14 | |
| Dividend Income | | | 1,000 | | | | 1,020.62 | | | | 0.91 | % | | | 4.63 | |
| Investors | | | 1,000 | | | | 1,020.62 | | | | 0.91 | % | | | 4.63 | |
| Sustainable Equity | | | 1,000 | | | | 1,020.62 | | | | 0.91 | % | | | 4.63 | |
| Mid Cap | | | 1,000 | | | | 1,020.47 | | | | 0.94 | % | | | 4.79 | |
| Small Cap | | | 1,000 | | | | 1,019.66 | | | | 1.10 | % | | | 5.60 | |
| International Stock | | | 1,000 | | | | 1,018.35 | | | | 1.36 | % | | | 6.92 | |
| | | Class I | |
| | | | | | | | | | | | Expenses | |
| Fund | | Beginning Account Value | | | Ending Account Value | | | Annual Expense Ratio | | | Paid During Period | |
| High Quality Bond | | $ | 1,000 | | | $ | 1,023.14 | | | | 0.41 | % | | $ | 2.09 | |
| Core Bond | | | 1,000 | | | | 1,022.68 | | | | 0.50 | % | | | 2.55 | |
| Covered Call & Equity Income | | | 1,000 | | | | 1,020.37 | | | | 0.96 | % | | | 4.89 | |
| Dividend Income | | | 1,000 | | | | 1,021.12 | | | | 0.81 | % | | | 4.13 | |
| Investors | | | 1,000 | | | | 1,021.12 | | | | 0.81 | % | | | 4.13 | |
| Sustainable Equity | | | 1,000 | | | | 1,021.12 | | | | 0.81 | % | | | 4.13 | |
| Mid Cap | | | 1,000 | | | | 1,020.97 | | | | 0.84 | % | | | 4.28 | |
| Small Cap | | | 1,000 | | | | 1,020.16 | | | | 1.00 | % | | | 5.09 | |
| | | Class R6 | |
| | | | | | | | | | | | Expenses | |
| Fund | | Beginning Account Value | | | Ending Account Value | | | Annual Expense Ratio | | | Paid During Period | |
| Core Bond | | $ | 1,000 | | | $ | 1,023.09 | | | | 0.42 | % | | $ | 2.14 | |
| Covered Call & Equity Income | | | 1,000 | | | | 1,020.77 | | | | 0.88 | % | | | 4.48 | |
| Dividend Income | | | 1,000 | | | | 1,021.53 | | | | 0.73 | % | | | 3.72 | |
| Investors | | | 1,000 | | | | 1,021.37 | | | | 0.76 | % | | | 3.87 | |
| Mid Cap | | | 1,000 | | | | 1,021.53 | | | | 0.73 | % | | | 3.72 | |
| Small Cap | | | 1,000 | | | | 1,020.57 | | | | 0.92 | % | | | 4.69 | |
*The annual expense ratio does not include the expenses of the underlying funds.
Please note that the expenses shown in the tables are meant to highlight your ongoing costs only and do not reflect any transactional costs, such as sales charges (loads), or redemption fees. The information provided in the hypothetical example table is useful in comparing ongoing costs only, and will not help you determine the relative total costs of owning different funds. In addition, if these transactional costs were included, your costs would have been higher.
STATEMENT REGARDING LIQUIDITY RISK MANAGEMENT PROGRAM
In accordance with Rule 22e-4 under the 1940 Act, the Trust has adopted and implemented a liquidity risk management program (the “Program”). The Program seeks to promote effective liquidity risk management for each Fund and to protect Fund shareholders from dilution of their interests. The Board of Trustees of the Trust has appointed the Funds’ Chief Compliance Officer as the administrator of the Program (the “Program Administrator”). The Program Administrator is required to provide an annual report to the Board regarding the adequacy and effectiveness of the Program, including the operation of the highly liquidity investment minimum (“HLIM”), if applicable, and any material changes to the Program during the review period. The Program Administrator uses State Street Bank and Trust Company (“State Street”), a third-party vendor, to provide portfolio investment classification services.
On May 24, 2023, the Board reviewed the Program Administrator’s annual written report for the period January 1, 2022 through December 31, 2022 (the “2022 Annual Report”). The 2022 Annual Report provided an assessment of each Fund’s liquidity risk, which is assessed under both normal and reasonably foreseeable stressed market conditions. For this purpose, liquidity risk is the risk that a Fund could not meet requests to redeem shares issued by the Fund without significant dilution of the remaining investors’ interests in the Fund. The 2022 Annual Report noted that following a review of each Fund’s redemption history and investment strategies, as well as liquidity reports generated by State Street, the Program Administrator determined that each Fund primarily held investments that were classified as “highly liquid” during the review period. As a result, the Program Administrator concluded that each Fund is a “primarily highly liquid fund” (as defined in the Program), which means that each Fund can continue to rely on the exclusion in Rule 22e-4 from the requirements to determine and review a HLIM for each Fund and to adopt policies and procedures for responding to a HLIM shortfall. The 2022 Annual Report also noted that no material changes had been made to the Program during the review period, and that the Program is functioning properly.
AVAILABILITY OF QUARTERLY PORTFOLIO SCHEDULES
The Funds file their complete schedule of portfolio holdings with the SEC for the first and third quarters of each fiscal year on Form NPORT-EX. Form NPORT-EX is available upon request to shareholders at no cost by calling 1-800-877-6089 or on the SEC’s website at www.sec.gov. Form NPORT-EX may also be reviewed and copied at the SEC’s Public Reference Room in Washington, DC. More information on the operation of the Public Reference Room may be obtained by calling 1-800-SEC-0330.
PROXY VOTING POLICIES, PROCEDURES AND RECORDS
A description of the policies and procedures used by the Funds to vote proxies related to portfolio securities is available to shareholders at no cost on the Funds’ website at www.madisonfunds.com or upon request by calling 1-800-877-6089 or on the SEC’s website at www.sec.gov. The proxy voting records for the Funds for the most recent twelve-month period ended June 30 are available to shareholders at no cost on the SEC’s website at www.sec.gov.
FORWARD-LOOKING STATEMENT DISCLOSURE
One of our most important responsibilities as investment company managers is to communicate with shareholders in an open and direct manner. Some of our comments in the “Management’s Discussion of Fund Performance” are based on current management expectations and are considered “forward-looking statements.” Actual future results, however, may prove to be different from our expectations. You can identify forward-looking statements by words such as estimate, may, will, expect, believe, plan and other similar terms. We cannot promise future returns. Our opinions are a reflection of our best judgment at the time this report is compiled, and we disclaim any obligation to update or alter forward-looking statements as a result of new information, future events, or otherwise.
Madison Funds | October 31, 2023
Other Information (unaudited) - continued
TAX INFORMATION
Foreign Tax Credits: The Funds expect to make an election under Internal Revenue Code Section 853 to pass through foreign taxes paid by the Funds to their shareholders. For the year ended October 31, 2023, the following funds intend to pass through foreign tax credits and have derived gross income from foreign countries amounting to:
| Fund | | Foreign Tax Credit Pass-Through | | | Foreign Source Income | |
| International Stock | | $ | 19,478 | | | $ | 289,693 | |
Complete information regarding the Funds’ foreign tax credit pass through to shareholders for the year ended October 31, 2023, will be reported in conjunction with Form 1099-DIV.
Corporate Dividends Received Deduction: For the taxable year ended October 31, 2023, the following percentage of income dividends paid by the Fund qualify for the dividends received deduction available to corporations:
| Fund | | Percentage | | | Fund | | Percentage | |
| Conservative Allocation | | | 8.71 | % | | Investors | | | 97.06 | % |
| Moderate Allocation | | | 19.28 | % | | Sustainable Equity | | | 100.00 | % |
| Aggressive Allocation | | | 21.69 | % | | | | | | |
| Diversified Income | | | 86.45 | % | | | | | | |
| Covered Call Equity Income | | | 15.32 | % | | | | | | |
| Dividend Income | | | 100.00 | % | | | | | | |
Qualified Dividend Income: For the taxable year ended October 31, 2023, the Funds hereby designate the maximum amount of dividends allowable pursuant to the Internal Revenue Code, as qualified dividend income (“QDI”) eligible for reduced tax rates (the rates range from 5% to 15% depending upon an individual's tax bracket). Complete information regarding each fund’s income distributions paid during the calendar year 2023, including the portion, if any, which qualify as QDI, will be reported in conjunction with Form 1099-DIV.
| Fund | | Amount | | | Fund | | Amount | |
| Conservative Allocation | | $ | 175,095 | | | Investors | | $ | 837,113 | |
| Moderate Allocation | | | 584,616 | | | Sustainable Equity | | | 53,311 | |
| Aggressive Allocation | | | 416,042 | | | | | | | |
| Diversified Income | | | 2,717,858 | | | | | | | |
| Covered Call & Equity Income | | | 2,856,368 | | | International Stock | | | 55,966 | |
| Dividend Income | | | 5,914,058 | | | | | | | |
Madison Funds | October 31, 2023
Trustees and Officers
The address of each Trustee and officer is 550 Science Drive, Madison, WI 53711. The Statement of Additional Information, which includes additional information about the Trustees and officers, is available at no cost on the Funds' website at www.madisonfunds.com or by calling 1 800 877-6089. The following tables provide biographical information regarding the Trustees and officers of the Trust currently serving as such.
| Interested Trustees and Officers | | | |
| | | | | |
| Name and Age | Position(s) Held, Length of Time Served and Term of Office | Principal Occupation(s) During Past Five Years | Portfolios Overseen in Fund Complex by Director/Trustee1 | Other Directorships Held by Director/ Trustee |
| Jill M. Friedow, 592,3 | Trustee, 2023 – Present; Vice President, 2023 – Present | Madison Investment Holdings, Inc. (“MIH”), Madison Investment Advisors, LLC (“MIA”), and Madison Asset Management, LLC (“Madison”), Chief Technology Officer & Director of Operations, 2019-Present; Vice President & Director of Operations, 2010 - 2019; Vice President & Operations Manager, 2003-2010; Operations Manager, 1999-2003 | 30 | Ultra Series Fund (“USF”) (14), 2023 – Present Madison Covered Call & Equity Strategy Fund |
| | | USF (14), Vice President, 2023 – Present; MCN, Vice President, 2023 – Present | | (“MCN”), 2023 – Present |
| Patrick F. Ryan 44 | President, 2020 – Present | MIH, MIA and Madison, Head of Multi-Asset Solutions and Portfolio Manager, 2018 – Present; Co-Head of Multi- Asset Solutions and Portfolio Manager, 2016 – 2017 USF (14) and MCN, President, 2020 – Present; Madison ETFs Trust (“Madison ETFs”) (4), President, June 2023 – Present | N/A | N/A |
| Greg D. Hoppe 54 | Vice President, 2020 – Present; Chief Financial Officer 2019 – Present; Treasurer, 2009 – 2019 | MIH and MIA, Vice President, 1999 - Present; Madison, Vice President, 2009 – Present USF (14), Vice President, 2020 – Present; Chief Financial Officer, 2019 – Present; Treasurer, 2009 - 2019; MCN, Vice President, March 2020 – Present; Chief Financial Officer, 2019 – Present; Treasurer, 2012 – 2019; Madison ETFs (4), Chief Financial Officer, Vice President, Treasurer, June 2023 – Present; Madison Strategic Sector Premium Fund (“MSP), Treasurer, 2009 – 2018 | N/A | N/A |
| Holly S. Baggot 62 | Secretary, 1999 – Present; Assistant Treasurer, 1999 – 2007 and 2009 – Present; Treasurer, 2008 Anti-Money Laundering Officer, 2019-2020 and 2022 - Present | MIH and MIA, Vice President, 2010 – Present; Madison, Vice President, 2009 – Present; MFD Distributor, LLC (“MFD”) (an affiliated brokerage firm of Madison), Vice President, 2012 – Present USF (14), Secretary, 1999 – Present and Assistant Treasurer, 2009 - Present; MCN, Secretary and Assistant Treasurer, 2012 – Present; Madison ETFs (4), Secretary and Assistant Treasurer, June 2023 – Present; USF and MCN, Anti-Money Laundering Officer, 2019 – 2020 and 2022 - Present; MSP, Secretary and Assistant Treasurer, 2010 – 2018 | N/A | N/A |
| Steve J. Fredricks 53 | Chief Compliance Officer and Assistant Secretary, 2018 – Present | MIH, MIA and Madison, Chief Legal Officer, 2020 – Present; Chief Compliance Officer, 2018 – Present USF (14) and MCN, Chief Compliance Officer and Assistant Secretary, 2018 – Present; Madison ETFs (4), Chief Compliance Officer and Assistant Secretary, June 2023 – Present; MSP, Chief Compliance Officer, 2018 Jackson National Asset Management, LLC, Senior Vice President and Chief Compliance Officer, 2005 - 2018 | N/A | N/A |
| Terri A. Wilhelm 54 | Assistant Secretary, 2022 – Present | MIH, MIA and Madison, Senior Compliance Analyst, September 2022 – Present USF (14) and MCN, Assistant Secretary, 2022 – Present; Madison ETFs (4), Assistant Secretary, June 2023 – Present State of Wisconsin Investment Board, Senior Paralegal, 2017 – 2022 | N/A | N/A |
1 As of the date of this report, the fund complex consists of Madison Funds with 15 portfolios, the Ultra Series Fund with 14 portfolios, the Madison Covered Call & Equity Strategy Fund (closed end fund), and the Madison ETFs Trust with 4 active portfolios, for a grand total of 34 separate portfolios in the fund complex. Not every Trustee is a member of the Board of Trustees of every fund in the fund complex, as noted above.
2 “Interested person” as defined in the 1940 Act. Considered an interested Trustee because of the position held with the investment adviser of Madison Funds.
3 There are no term limits or mandatory retirement age for interested trustees.
Madison Funds | October 31, 2023
Trustees and Officers - continued
| Independent Trustees | | | |
| | | | Portfolios Overseen | |
| | Position(s) Held, First | | in Fund Complex by | |
| Name and Age | Elected and Term of Office1 | Principal Occupation(s) During Past Five Years | Director/Trustee2 | Other Directorships Held by Director/ Trustee |
| Scott C. Jones 61 | Trustee, 2019 – 2034 | Managing Director, Carne Global Financial Services (US) LLC (a provider of independent governance and distribution support for the asset management industry), New York, NY, 2013 – Present Managing Director, Park Agency, Inc., (a family investment office), Chicago, IL, 2020 – Present | 16 | XAI Octagon Floating Rate & Alternative Income Term Trust, 2017 – Present Manager Directed Portfolios (open-end fund family, 9 portfolios), 2016 - Present and Lead Independent Trustee since 2017 Guestlogix Inc. (a provider of ancillary-focused technology to the travel industry), 2015 ��� 2016 MCN, 2021 – Present |
| Steven P. Riege 69 | Trustee, 2005 – 2028 | Ovation Leadership (management consulting) Milwaukee, WI, Owner/ President, 2001 – Present Robert W. Baird & Company (financial services), Milwaukee, WI, Senior Vice President-Marketing and Vice President-Human Resources, 1986 – 2001 | 34 | USF (14), 2005 – Present MCN, 2015 – Present Madison ETFs (4), June 2023 – Present |
| Richard E. Struthers 71 | Trustee, 2004 – 2028 | Clearwater Capital Management (investment advisory firm), Naples, FL, Chair and Chief Executive Officer 1998 – Present Park Nicollet Health Services, Minneapolis, MN, Chairman, Finance and Investment Committee, 2006 – 2012 | 34 | USF (14), 2004 – Present MCN, 2017 – Present Madison ETFs (4), June 2023 – Present |
1 An Independent Trustee must retire at the end of the calendar year in which the first of the following two events occurs: (1) they attain the age of seventy-six (76), or (2) they have served on the Board for a total of fifteen
(15) years, subject in the latter case to extension by unanimous vote of the remaining Trustees on an annual basis. The fifteen (15) year term limitation shall commence on the later of April 19, 2013 or the date of the Trustee’s initial election or appointment as a trustee. Board terms end on December 31 of the year noted.
2 As of the date of this report, the fund complex consists of Madison Funds with 15 portfolios, the Ultra Series Fund with 14 portfolios the Madison Covered Call & Equity Strategy Fund (closed end fund), and the Madison ETFs Trust with 4 active portfolios, for a grand total of 34 separate portfolios in the fund complex. Not every Trustee is a member of the Board of Trustees of every fund in the fund complex, as noted above.
Madison Funds | October 31, 2023
This page was intentionally left blank.
Madison Funds | October 31, 2023
This page was intentionally left blank.
Madison Funds | October 31, 2023
This page was intentionally left blank.
4460-P1053
Rev. 1023
Item 2. Code of Ethics.
(a) The Trust has adopted a code of ethics that applies to the Trust’s principal executive officer, principal financial officer, principal accounting officer or controller or persons performing similar functions, regardless of whether these individuals are employed by the Trust or a third party.
(c) During the period covered by the report, registrant did not make any substantive amendments to the Code.
(d) During the period covered by the report, registrant did not grant any waivers, including implicit waivers, from the provisions of the Code.
(f) Any person may obtain a complete copy of the code without charge by calling the Adviser at 800-767-0300 and requesting a copy of "the Madison Funds Sarbanes Oxley Code of Ethics."
Item 3. Audit Committee Financial Expert.
In August 2023, Richard Struthers, an “independent” Trustee and a member of the Trust’s audit committee, was appointed to serve as the Trust’s audit committee financial expert among the three independent Trustees who so qualify to serve in that capacity.
Item 4. Principal Accountant Fees and Services.
(a) Audit Fees. Total audit fees paid (or to be paid) to the registrant's principal accountant for the fiscal years ended October 31, 2023 and 2022, respectively were $232,000 ($465,450 including the Ultra Series Fund and the Madison Covered Call & Equity Strategy Fund, all affiliated investment companies “together, the “Affiliated Funds”) and $225,000 ($451,950 including the Affiliated Funds).
(b) Audit-Related Fees. For the fiscal years ended October 31, 2023 and October 31, 2022, the aggregate fees for professional services rendered by Deloitte & Touche for assurance and related services by such firm that were reasonably related to the performance of the audit of the Trust's annual financial statements other than those referenced in paragraph (a) above, totaled $0 and $0, respectively.
(c) Tax-Fees. For the fiscal years ended October 31, 2023 and October 31, 2022, the aggregate fees paid (or to be paid) for professional services rendered by Deloitte & Touche for tax compliance, tax advice and tax planning are approximately $49,140 ($104,969 including the Affiliated Funds) and $47,732 ($86,625) including the Affiliated Funds), respectively.
In the scope of services comprising the fees disclosed under this Item 4(c) were the following services:
-Review and sign as signature preparer for U.S. Income Tax Return for Regulated Investment Companies, Form 1120-RIC, Return of Excise Tax on Undistributed Income of Regulated Investment Companies, Form 8613 and appropriate State tax returns.
(d) All Other Fees. None.
(e) (1) Before any accountant is engaged by the registrant to render audit or non-audit services, the engagement must be approved by the audit committee as contemplated by paragraph (c)(7)(i)(A) of Rule 2-01of Regulation S-X.
(2) The Audit Committee has pre-approved, as required by Rule 2-01(c)(7)(i)(C) of Regulation S-X, 100% of the services described in this Item 4(b) through (d), which such services are described above.
(f) None.
(g) None.
(h) None.
Item 5. Audit Committee of Listed Registrants.
Not applicable.
Item 6. Schedule of Investments
Schedule included as part of the report to shareholders filed under Item 1 of this Form.
Item 7. Disclosure of Proxy Voting Policies and Procedures for Closed-End Management Investment Companies.
Not applicable.
Item 8. Portfolio Managers of Closed-End Management Investment Companies.
Not applicable.
Item 9. Purchases of Equity Securities by Closed-End Management Investment Company and Affiliated Purchasers.
Not applicable.
Item 10. Submission of Matters to a Vote of Security Holders.
The Trust does not normally hold shareholder meetings. There have been no changes to the Trust's procedures during the period covered by this report.
Item 11. Controls and Procedures.
(a) The Trust’s principal executive officer and principal financial officer determined that the Trust’s disclosure controls and procedures (as defined in Rule 30a-3(c) under the Investment Company Act of 1940 (the "Act")) are effective, based on their evaluation of these controls and procedures required by Rule 30a-3(b) under the Act and Rules 13a-15(b) or 15d-15(b) under the Securities Exchange Act of 1934 within 90 days of the date of this report. There were no significant changes in the Trust’s internal controls or in other factors that could significantly affect these controls subsequent to the date of their evaluation. The officers identified no significant deficiencies or material weaknesses.
(b) There were no changes in the Trust's internal control over financial reporting (as defined in Rule 30a-3(d) under the Act) that occurred during the second fiscal quarter of the period covered by this report that has materially affected, or is reasonably likely to materially affect, the Trust's internal control over financial reporting.
Item 12. Disclosure of Securities Lending Activities for Closed-End Management Investment Companies.
Not applicable.
Item 13. Exhibits.
| (a) | (1) | Code of ethics - See Item 2. |
| | (4) | There was no change in the registrant’s independent public accountant for the period covered by this report. |
SIGNATURES
Pursuant to the requirements of the Securities Exchange Act of 1934 and the Investment Company Act of 1940, the Registrant has duly caused this Report to be signed on its behalf by the undersigned, thereunto duly authorized.
Madison Funds
| /s/ Steve J. Fredricks | |
| Steve J. Fredricks, Chief Legal Officer & Chief Compliance Officer | |
Date: December 29, 2023
Pursuant to the requirements of the Securities Exchange Act of 1934 and the Investment Company Act of 1940, this Report has been signed below by the following persons on behalf of the Registrant and in the capacities and on the dates indicated.
| /s/ Patrick F. Ryan | |
| Patrick F. Ryan, Principal Executive Officer | |
|
Date: December 29, 2023
| /s/ Greg D. Hoppe | |
| Greg D. Hoppe, Principal Financial Officer & Principal Accounting Officer | |
|
Date: December 29, 2023