0001040612 ck0001040612:C000057654Member us-gaap:ShortTermInvestments 2024-10-31
OMB APPROVAL
OMB Number: 3235-0570
Expires: September 30, 2026
Estimated average burden hours per response...7.78
UNITED STATES SECURITIES AND EXCHANGE COMMISSION
Washington, DC 20549
FORM N-CSR
CERTIFIED SHAREHOLDER REPORT OF REGISTERED
MANAGEMENT INVESTMENT COMPANIES
Investment Company Act file number 811-08261
Madison Funds
(Exact name of registrant as specified in charter)
550 Science Drive, Madison, WI 53711
(Address of principal executive offices)(Zip code)
Steve J. Fredricks
Chief Legal Officer & Chief Compliance Officer
550 Science Drive
Madison, WI 53711
(Name and address of agent for service)
Registrant’s telephone number, including area code: 608-274-0300
Date of fiscal year end: October 31
Date of reporting period: October 31, 2024
Form N-CSR is to be used by management investment companies to file reports with the Commission not later than 10 days after the transmission to stockholders of any report that is required to be transmitted to stockholders under Rule 30e-1 under the Investment Company Act of 1940 (17 CFR 270.30e-1). The Commission may use the information provided on Form N-CSR in its regulatory, disclosure review, inspection, and policymaking roles.
A registrant is required to disclose the information specified by Form N-CSR, and the Commission will make this information public. A registrant is not required to respond to the collection of information contained in Form N-CSR unless the Form displays a currently valid Office of Management and Budget (“OMB”) control number. Please direct comments concerning the accuracy of the information collection burden estimate and any suggestions for reducing the burden to Secretary, Securities and Exchange Commission, 450 Fifth Street, NW, Washington, DC 20549-0609. The OMB has reviewed this collection of information under the clearance requirements of 44 U.S.C. § 3507.
Item 1. Reports to Shareholders.
 | Annual Shareholder Report October 31, 2024 |
Conservative Allocation Fund Class A
Madison Conservative Allocation Fund
MCNAX
Fund Overview
This annual shareholder report contains important information about Conservative Allocation Fund Class A for the period of November 1, 2023 to October 31, 2024. You can find additional information about the Fund at www.madisonfunds.com/documents. You can also request this information by contacting us at 1-800-877-6089.
This report describes changes to the Fund that occurred during the reporting period.
What were the Fund costs for last year?
(based on a hypothetical $10,000 investment)
| | | Cost of a $10,000
investment | | | Costs paid as a
percentage of a
$10,000 investment | |
| Class A | | | $75 | | | | 0.70% | |
| | | | | | | | | |
How did the Fund perform last year and what affected its performance?
Entering the period, there was a high level of concern over the health of the economy and many traditional indicators of recession were flashing red. However, the stalling of the inflationary impulse in late 2023 led to an abrupt shift in market expectations for much lower interest rates by the end of 2024. The bellwether 10-year US Treasury yield fell over 1% over the first two months of the period and risk markets were off to the races.
The Fund’s sizeable absolute return was aided by the strong market backdrop across all major asset classes. However, our economic outlook and conservative DNA had us guarded for a more challenging market and the Fund’s underweight to equity risk (overweight to cash) provided the largest headwind to relative performance. Within our US equity allocation, our core positions failed to keep up with the highly concentrated mega cap led market, which compounded the hit to relative performance. Across equities, the Fund benefited from an overweight to the US Technology sector and a heavy preference for domestic versus international stocks. The Fund’s fixed income allocation outperformed the benchmark Bloomberg US Aggregate Bond Index by overweighting the securitized sector, specifically mortgage-backed securities, a big contribution from a long-duration US Treasury holding, and the strong showing from the Fund’s core actively managed bond fund position.
We ended the period cautiously optimistic for the year ahead, and while still a touch defensive overall, we have increased equity exposure by expanding our allocations to smaller cap stocks and the financial sector.
| Conservative Allocation Fund Class A | MCNAX |
Fund Performance
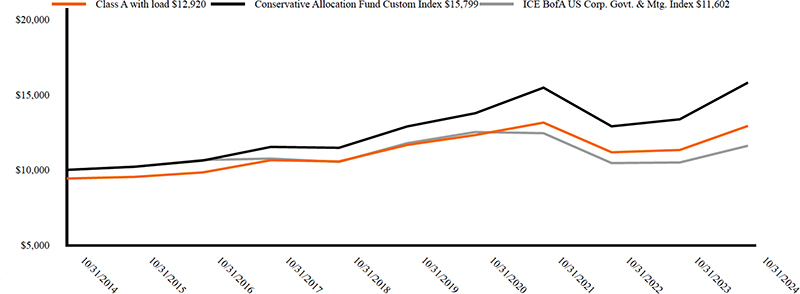
The chart below illustrates the total value of a hypothetical $10,000 investment in the Fund over the past 10 years (or for the life of the Fund if shorter).
| Average Annual Total Returns (%) | |
| | 1 Year | 5 Years | 10 Years |
| Class A | 14.12% | 2.08% | 3.20% |
| Class A with load | 7.51% | 0.87% | 2.59% |
| Conservative Allocation Fund Custom Index | 18.26% | 4.16% | 4.68% |
| ICE BofA US Corp. Govt. & Mtg. Index | 10.58% | (0.29%) | 1.50% |
1. Fund returns are calculated after fund expenses have been subtracted and assume that dividends and capital gains are reinvested in additional shares of a fund. Returns do not reflect the deduction of taxes that a shareholder would pay on fund distributions or the redemption of fund shares. Investment return and principal value will fluctuate, so an investor’s shares, when redeemed, may be worth more or less than original cost. Further information relating to the fund’s performance is contained in the prospectus and elsewhere in this report. The fund’s past performance is not indicative of future performance.
2. Maximum sales charge is 5.75% for Class A shares.
3. The Conservative Allocation Fund Custom Index consists of 65% Bloomberg Barclays US Aggregate Bond Index, 24.5% Russell 3000 Index and 10.5% MSCI ACWI ex-US Index.
4. The ICE BofA U.S. Corporate, Government & Mortgage Index is a broad-based measure of the total rate of return performance of the US investment grade bond markets. The index is a capitalization-weighted aggregation of outstanding US treasury, agency, and supranational mortgage pass-through, and investment grade corporate bonds meeting specified selection criteria.
| Key Fund Statistics (As of October 31, 2024) | | | | | | | | |
| Total Net Assets | | | | | | | $43,095,706 | |
| # of Portfolio Holdings | | | | | | | 15 | |
| Portfolio Turnover Rate | | | | | | | 51% | |
| Total Advisory Fees Paid | | | | | | | $89,059 | |
| Conservative Allocation Fund Class A | MCNAX |
What does the Fund invest in?
The Fund invested primarily in shares of other registered investment companies. The Fund’s total net assets were allocated among various asset classes and underlying funds, with target allocations over time of approximately 35% equity investments and 65% fixed income investments.
| Top Ten Holdings (% of Net Assets) | | | |
| Madison Core Bond Fund, Class R6 | | 38.9 | % |
| Schwab Intermediate-Term U.S. Treasury ETF | | 14.1 | % |
| Madison Investors Fund, Class R6 | | 7.0 | % |
| iShares Aaa - A Rated Corporate Bond ETF | | 5.5 | % |
| Distillate U.S. Fundamental Stability & Value ETF | | 5.3 | % |
| Invesco S&P 500 Quality ETF | | 5.2 | % |
| Janus Henderson Mortgage-Backed Securities ETF | | 5.0 | % |
| iShares Treasury Floating Rate Bond ETF | | 4.1 | % |
| Vanguard Information Technology ETF | | 3.5 | % |
| Vanguard FTSE Europe ETF | | 3.1 | % |
| Portfolio Allocation (% of Net Assets) | | | |
| Exchange Traded Funds | | 52.3 | % |
| Investment Companies | | 45.9 | % |
| Short-Term Investments | | 7.9 | % |
| Other Assets and Liabilities, Net | | (6.1 | %) |
| | | | |
Material Fund Changes
On November 6, 2024, the Board of Trustees of the Trust approved the termination of all outstanding Class C shares of the Madison Funds. Effective after the close of business on Friday, February 14, 2025, all Madison Conservative Allocation Class C shares will be automatically converted to Class A shares. The conversion of Class C to Class A shares of the same fund is not a taxable event, and no contingent deferred sales charges will be assessed, if applicable, on this one-time conversion of shares.
This is a summary of certain planned changes to the Fund since October 31, 2024. For more complete information, you may review the Fund’s next prospectus, which we expect to be available by February 28th, 2025 at www.madisonfunds.com or upon request by calling 1-800-877-6089.
Additional Information If you wish to view additional information about the Fund; including but not limited to financial statements or holdings, please visit www.madisonfunds.com/documents. Phone: 1-800-877-6089 |  |
| | Annual Shareholder Report
October 31, 2024 |
| Conservative Allocation Fund Class A | MCNAX |
 | Annual Shareholder Report October 31, 2024 |
Conservative Allocation Fund Class C
Madison Conservative Allocation Fund
MCOCX
Fund Overview
This annual shareholder report contains important information about Conservative Allocation Fund Class C for the period of November 1, 2023 to October 31, 2024. You can find additional information about the Fund at www.madisonfunds.com/documents. You can also request this information by contacting us at 1-800-877-6089.
This report describes changes to the Fund that occurred during the reporting period.
What were the Fund costs for last year?
(based on a hypothetical $10,000 investment)
| | | Cost of a $10,000
investment | | | Costs paid as a
percentage of a
$10,000 investment | |
| Class C | | | $156 | | | | 1.46% | |
| | | | | | | | | |
How did the Fund perform last year and what affected its performance?
Entering the period, there was a high level of concern over the health of the economy and many traditional indicators of recession were flashing red. However, the stalling of the inflationary impulse in late 2023 led to an abrupt shift in market expectations for much lower interest rates by the end of 2024. The bellwether 10-year US Treasury yield fell over 1% over the first two months of the period and risk markets were off to the races.
The Fund’s sizeable absolute return was aided by the strong market backdrop across all major asset classes. However, our economic outlook and conservative DNA had us guarded for a more challenging market and the Fund’s underweight to equity risk (overweight to cash) provided the largest headwind to relative performance. Within our US equity allocation, our core positions failed to keep up with the highly concentrated mega cap led market, which compounded the hit to relative performance. Across equities, the Fund benefited from an overweight to the US Technology sector and a heavy preference for domestic versus international stocks. The Fund’s fixed income allocation outperformed the benchmark Bloomberg US Aggregate Bond Index by overweighting the securitized sector, specifically mortgage-backed securities, a big contribution from a long-duration US Treasury holding, and the strong showing from the Fund’s core actively managed bond fund position.
We ended the period cautiously optimistic for the year ahead, and while still a touch defensive overall, we have increased equity exposure by expanding our allocations to smaller cap stocks and the financial sector.
| Conservative Allocation Fund Class C | MCOCX |
Fund Performance
The chart below illustrates the total value of a hypothetical $10,000 investment in the Fund over the past 10 years (or for the life of the Fund if shorter).

| Average Annual Total Returns (%) | |
| | 1 Year | 5 Years | 10 Years |
| Class C | 13.26% | 1.31% | 2.42% |
| Conservative Allocation Fund Custom Index | 18.26% | 4.16% | 4.68% |
| ICE BofA US Corp. Govt. & Mtg. Index | 10.58% | (0.29%) | 1.50% |
1. Fund returns are calculated after fund expenses have been subtracted and assume that dividends and capital gains are reinvested in additional shares of a fund. Returns do not reflect the deduction of taxes that a shareholder would pay on fund distributions or the redemption of fund shares. Investment return and principal value will fluctuate, so an investor’s shares, when redeemed, may be worth more or less than original cost. Further information relating to the fund’s performance is contained in the prospectus and elsewhere in this report. The Fund’s past performance is not indicative of future performance.
2. The Conservative Allocation Fund Custom Index consists of 65% Bloomberg Barclays US Aggregate Bond Index, 24.5% Russell 3000 Index and 10.5% MSCI ACWI ex-US Index.
3. The ICE BofA U.S. Corporate, Government & Mortgage Index is a broad-based measure of the total rate of return performance of the US investment grade bond markets. The index is a capitalization-weighted aggregation of outstanding US treasury, agency, and supranational mortgage pass-through, and investment grade corporate bonds meeting specified selection criteria.
| Key Fund Statistics (As of October 31, 2024) | | | | | | | | |
| Total Net Assets | | | | | | | $43,095,706 | |
| # of Portfolio Holdings | | | | | | | 15 | |
| Portfolio Turnover Rate | | | | | | | 51% | |
| Total Advisory Fees Paid | | | | | | | $89,059 | |
| Conservative Allocation Fund Class C | MCOCX |
What does the Fund invest in?
The Fund invested primarily in shares of other registered investment companies. The Fund’s total net assets were allocated among various asset classes and underlying funds, with target allocations over time of approximately 35% equity investments and 65% fixed income investments.
| Top Ten Holdings (% of Net Assets) | | | |
| Madison Core Bond Fund, Class R6 | | 38.9 | % |
| Schwab Intermediate-Term U.S. Treasury ETF | | 14.1 | % |
| Madison Investors Fund, Class R6 | | 7.0 | % |
| iShares Aaa - A Rated Corporate Bond ETF | | 5.5 | % |
| Distillate U.S. Fundamental Stability & Value ETF | | 5.3 | % |
| Invesco S&P 500 Quality ETF | | 5.2 | % |
| Janus Henderson Mortgage-Backed Securities ETF | | 5.0 | % |
| iShares Treasury Floating Rate Bond ETF | | 4.1 | % |
| Vanguard Information Technology ETF | | 3.5 | % |
| Vanguard FTSE Europe ETF | | 3.1 | % |
| Portfolio Allocation (% of Net Assets) | | | |
| Exchange Traded Funds | | 52.3 | % |
| Investment Companies | | 45.9 | % |
| Short-Term Investments | | 7.9 | % |
| Other Assets and Liabilities, Net | | (6.1 | %) |
| | | | |
Material Fund Changes
On November 6, 2024, the Board of Trustees of the Trust approved the termination of all outstanding Class C shares of the Madison Funds. Effective after the close of business on Friday, February 14, 2025, all Madison Conservative Allocation Class C shares will be automatically converted to Class A shares. The conversion of Class C to Class A shares of the same fund is not a taxable event, and no contingent deferred sales charges will be assessed, if applicable, on this one-time conversion of shares.
This is a summary of certain planned changes to the Fund since October 31, 2024. For more complete information, you may review the Fund’s next prospectus, which we expect to be available by February 28th, 2025 at www.madisonfunds.com or upon request by calling 1-800-877-6089.
Additional Information If you wish to view additional information about the Fund; including but not limited to financial statements or holdings, please visit www.madisonfunds.com/documents. Phone: 1-800-877-6089 |  |
| | Annual Shareholder Report
October 31, 2024 |
| Conservative Allocation Fund Class C | MCOCX |
 | Annual Shareholder Report October 31, 2024 |
Moderate Allocation Fund Class A
Madison Moderate Allocation Fund
MMDAX
Fund Overview
This annual shareholder report contains important information about Moderate Allocation Fund Class A for the period of November 1, 2023 to October 31, 2024. You can find additional information about the Fund at www.madisonfunds.com/documents. You can also request this information by contacting us at 1-800-877-6089.
This report describes changes to the Fund that occurred during the reporting period.
What were the Fund costs for last year?
(based on a hypothetical $10,000 investment)
| | | Cost of a $10,000
investment | | | Costs paid as a
percentage of a
$10,000 investment | |
| Class A | | | $76 | | | | 0.70% | |
| | | | | | | | | |
How did the Fund perform last year and what affected its performance?
Entering the period, there was a high level of concern over the health of the economy and many traditional indicators of recession were flashing red. However, the stalling of the inflationary impulse in late 2023 led to an abrupt shift in market expectations for much lower interest rates by the end of 2024. The bellwether 10-year US Treasury yield fell over 1% over the first two months of the period and risk markets were off to the races.
The Fund’s sizeable absolute return was aided by the strong market backdrop across all major asset classes. However, our economic outlook and conservative DNA had us guarded for a more challenging market and the Fund’s underweight to equity risk (overweight to cash) provided the largest headwind to relative performance. Within our US equity allocation, our core positions failed to keep up with the highly concentrated mega cap led market, which compounded the hit to relative performance. Across equities, the Fund benefited from an overweight to the US Technology sector and a heavy preference for domestic versus international stocks. The Fund’s fixed income allocation outperformed the benchmark Bloomberg US Aggregate Bond Index by overweighting the securitized sector, specifically mortgage-backed securities, a big contribution from a long-duration US Treasury holding, and the strong showing from the Fund’s core actively managed bond fund position.
We ended the period cautiously optimistic for the year ahead, and while still a touch defensive overall, we have increased equity exposure by expanding our allocations to smaller cap stocks and the financial sector.
| Moderate Allocation Fund Class A | MMDAX |
Fund Performance
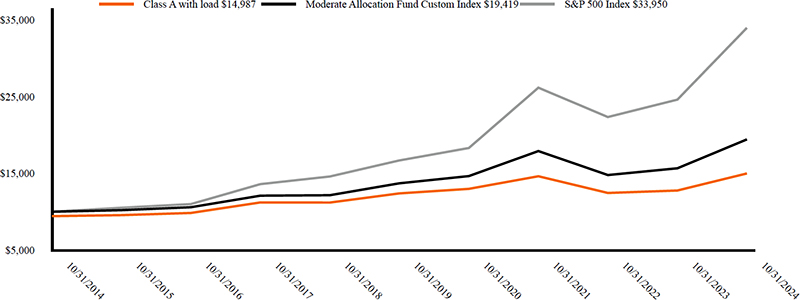
The chart below illustrates the total value of a hypothetical $10,000 investment in the Fund over the past 10 years (or for the life of the Fund if shorter).
| Average Annual Total Returns (%) | |
| | 1 Year | 5 Years | 10 Years |
| Class A | 17.42% | 3.88% | 4.75% |
| Class A with load | 10.69% | 2.65% | 4.13% |
| Moderate Allocation Fund Custom Index | 24.03% | 7.23% | 6.86% |
| S&P 500 Index | 38.02% | 15.27% | 13.00% |
1. Fund returns are calculated after fund expenses have been subtracted and assume that dividends and capital gains are reinvested in additional shares of a fund. Returns do not reflect the deduction of taxes that a shareholder would pay on fund distributions or the redemption of fund shares. Investment return and principal value will fluctuate, so an investor’s shares, when redeemed, may be worth more or less than original cost. Further information relating to the fund’s performance is contained in the prospectus and elsewhere in this report. The fund’s past performance is not indicative of future performance.
2. Maximum sales charge is 5.75% for Class A shares.
3. The Moderate Allocation Fund Custom Index consists of 42% Russell 3000 Index, 40% Bloomberg Barclays US Aggregate Bond Index and 18% MSCI ACWI ex-US Index.
4. The S&P 500 Index is a large-cap market index which measures the performance of a representative sample of 500 leading companies in leading industries in the US.
| Key Fund Statistics (As of October 31, 2024) | | | | | | | | |
| Total Net Assets | | | | | | | $92,341,391 | |
| # of Portfolio Holdings | | | | | | | 15 | |
| Portfolio Turnover Rate | | | | | | | 51% | |
| Total Advisory Fees Paid | | | | | | | $191,611 | |
| Moderate Allocation Fund Class A | MMDAX |
What does the Fund invest in?
The Fund invested primarily in shares of other registered investment companies. The Fund’s total net assets were allocated among various asset classes and underlying funds, with target allocations over time of approximately 60% equity investments and 40% fixed income investments.
| Top Ten Holdings (% of Net Assets) | | | |
| Madison Core Bond Fund, Class R6 | | 25.3 | % |
| Madison Investors Fund, Class R6 | | 12.5 | % |
| Invesco S&P 500 Quality ETF | | 9.5 | % |
| Schwab Intermediate-Term U.S. Treasury ETF | | 9.4 | % |
| Distillate U.S. Fundamental Stability & Value ETF | | 8.3 | % |
| iShares Treasury Floating Rate Bond ETF | | 6.8 | % |
| Vanguard FTSE Europe ETF | | 5.6 | % |
| Vanguard Information Technology ETF | | 5.4 | % |
| iShares MSCI Emerging Markets Asia ETF | | 4.4 | % |
| Franklin FTSE Japan ETF | | 3.7 | % |
| Portfolio Allocation (% of Net Assets) | | | |
| Exchange Traded Funds | | 61.5 | % |
| Investment Companies | | 37.9 | % |
| Short-Term Investments | | 6.4 | % |
| Other Assets and Liabilities, Net | | (5.8 | %) |
| | | | |
Material Fund Changes
On November 6, 2024, the Board of Trustees of the Trust approved the termination of all outstanding Class C shares of the Madison Funds. Effective after the close of business on Friday, February 14, 2025, all Madison Moderate Allocation Class C shares will be automatically converted to Class A shares. The conversion of Class C to Class A shares of the same fund is not a taxable event, and no contingent deferred sales charges will be assessed, if applicable, on this one-time conversion of shares.
This is a summary of certain planned changes to the Fund since October 31, 2024. For more complete information, you may review the Fund’s next prospectus, which we expect to be available by February 28th, 2025 at www.madisonfunds.com or upon request by calling 1-800-877-6089.
Additional Information If you wish to view additional information about the Fund; including but not limited to financial statements or holdings, please visit www.madisonfunds.com/documents. Phone: 1-800-877-6089 |  |
| | Annual Shareholder Report
October 31, 2024 |
| Moderate Allocation Fund Class A | MMDAX |
 | Annual Shareholder Report October 31, 2024 |
Moderate Allocation Fund Class C
Madison Moderate Allocation Fund
MMDCX
Fund Overview
This annual shareholder report contains important information about Moderate Allocation Fund Class C for the period of November 1, 2023 to October 31, 2024. You can find additional information about the Fund at www.madisonfunds.com/documents. You can also request this information by contacting us at 1-800-877-6089.
This report describes changes to the Fund that occurred during the reporting period.
What were the Fund costs for last year?
(based on a hypothetical $10,000 investment)
| | | Cost of a $10,000
investment | | | Costs paid as a
percentage of a
$10,000 investment | |
| Class C | | | $157 | | | | 1.45% | |
| | | | | | | | | |
How did the Fund perform last year and what affected its performance?
Entering the period, there was a high level of concern over the health of the economy and many traditional indicators of recession were flashing red. However, the stalling of the inflationary impulse in late 2023 led to an abrupt shift in market expectations for much lower interest rates by the end of 2024. The bellwether 10-year US Treasury yield fell over 1% over the first two months of the period and risk markets were off to the races.
The Fund’s sizeable absolute return was aided by the strong market backdrop across all major asset classes. However, our economic outlook and conservative DNA had us guarded for a more challenging market and the Fund’s underweight to equity risk (overweight to cash) provided the largest headwind to relative performance. Within our US equity allocation, our core positions failed to keep up with the highly concentrated mega cap led market, which compounded the hit to relative performance. Across equities, the Fund benefited from an overweight to the US Technology sector and a heavy preference for domestic versus international stocks. The Fund’s fixed income allocation outperformed the benchmark Bloomberg US Aggregate Bond Index by overweighting the securitized sector, specifically mortgage-backed securities, a big contribution from a long-duration US Treasury holding, and the strong showing from the Fund’s core actively managed bond fund position.
We ended the period cautiously optimistic for the year ahead, and while still a touch defensive overall, we have increased equity exposure by expanding our allocations to smaller cap stocks and the financial sector.
| Moderate Allocation Fund Class C | MMDCX |
Fund Performance
The chart below illustrates the total value of a hypothetical $10,000 investment in the Fund over the past 10 years (or for the life of the Fund if shorter).

| Average Annual Total Returns (%) | |
| | 1 Year | 5 Years | 10 Years |
| Class C | 16.51% | 3.11% | 3.97% |
| Moderate Allocation Fund Custom Index | 24.03% | 7.23% | 6.86% |
| S&P 500 Index | 38.02% | 15.27% | 13.00% |
1. Fund returns are calculated after fund expenses have been subtracted and assume that dividends and capital gains are reinvested in additional shares of a fund. Returns do not reflect the deduction of taxes that a shareholder would pay on fund distributions or the redemption of fund shares. Investment return and principal value will fluctuate, so an investor’s shares, when redeemed, may be worth more or less than original cost. Further information relating to the fund’s performance is contained in the prospectus and elsewhere in this report. The Fund’s past performance is not indicative of future performance.
2. The Moderate Allocation Fund Custom Index consists of 42% Russell 3000 Index, 40% Bloomberg Barclays US Aggregate Bond Index and 18% MSCI ACWI ex-US Index.
3. The S&P 500 Index is a large-cap market index which measures the performance of a representative sample of 500 leading companies in leading industries in the US.
| Key Fund Statistics (As of October 31, 2024) | | | | | | | | |
| Total Net Assets | | | | | | | $92,341,391 | |
| # of Portfolio Holdings | | | | | | | 15 | |
| Portfolio Turnover Rate | | | | | | | 51% | |
| Total Advisory Fees Paid | | | | | | | $191,611 | |
| Moderate Allocation Fund Class C | MMDCX |
What does the Fund invest in?
The Fund invested primarily in shares of other registered investment companies. The Fund’s total net assets were allocated among various asset classes and underlying funds, with target allocations over time of approximately 60% equity investments and 40% fixed income investments.
| Top Ten Holdings (% of Net Assets) | | | |
| Madison Core Bond Fund, Class R6 | | 25.3 | % |
| Madison Investors Fund, Class R6 | | 12.5 | % |
| Invesco S&P 500 Quality ETF | | 9.5 | % |
| Schwab Intermediate-Term U.S. Treasury ETF | | 9.4 | % |
| Distillate U.S. Fundamental Stability & Value ETF | | 8.3 | % |
| iShares Treasury Floating Rate Bond ETF | | 6.8 | % |
| Vanguard FTSE Europe ETF | | 5.6 | % |
| Vanguard Information Technology ETF | | 5.4 | % |
| iShares MSCI Emerging Markets Asia ETF | | 4.4 | % |
| Franklin FTSE Japan ETF | | 3.7 | % |
| Portfolio Allocation (% of Net Assets) | | | |
| Exchange Traded Funds | | 61.5 | % |
| Investment Companies | | 37.9 | % |
| Short-Term Investments | | 6.4 | % |
| Other Assets and Liabilities, Net | | (5.8 | %) |
| | | | |
Material Fund Changes
On November 6, 2024, the Board of Trustees of the Trust approved the termination of all outstanding Class C shares of the Madison Funds. Effective after the close of business on Friday, February 14, 2025, all Madison Moderate Allocation Class C shares will be automatically converted to Class A shares. The conversion of Class C to Class A shares of the same fund is not a taxable event, and no contingent deferred sales charges will be assessed, if applicable, on this one-time conversion of shares.
This is a summary of certain planned changes to the Fund since October 31, 2024. For more complete information, you may review the Fund’s next prospectus, which we expect to be available by February 28th, 2025 at www.madisonfunds.com or upon request by calling 1-800-877-6089.
Additional Information If you wish to view additional information about the Fund; including but not limited to financial statements or holdings, please visit www.madisonfunds.com/documents. Phone: 1-800-877-6089 |  |
| | Annual Shareholder Report
October 31, 2024 |
| Moderate Allocation Fund Class C | MMDCX |
 | Annual Shareholder Report October 31, 2024 |
Aggressive Allocation Fund Class A
Madison Aggressive Allocation Fund
MAGSX
Fund Overview
This annual shareholder report contains important information about Aggressive Allocation Fund Class A for the period of November 1, 2023 to October 31, 2024. You can find additional information about the Fund at www.madisonfunds.com/documents. You can also request this information by contacting us at 1-800-877-6089.
This report describes changes to the Fund that occurred during the reporting period.
What were the Fund costs for last year?
(based on a hypothetical $10,000 investment)
| | | Cost of a $10,000
investment | | | Costs paid as a
percentage of a
$10,000 investment | |
| Class A | | | $77 | | | | 0.70% | |
| | | | | | | | | |
How did the Fund perform last year and what affected its performance?
Entering the period, there was a high level of concern over the health of the economy and many traditional indicators of recession were flashing red. However, the stalling of the inflationary impulse in late 2023 led to an abrupt shift in market expectations for much lower interest rates by the end of 2024. The bellwether 10-year US Treasury yield fell over 1% over the first two months of the period and risk markets were off to the races.
The Fund’s sizeable absolute return was aided by the strong market backdrop across all major asset classes. However, our economic outlook and conservative DNA had us guarded for a more challenging market and the Fund’s underweight to equity risk (overweight to cash) provided the largest headwind to relative performance. Within our US equity allocation, our core positions failed to keep up with the highly concentrated mega cap led market, which compounded the hit to relative performance. Across equities, the Fund benefited from an overweight to the US Technology sector and a heavy preference for domestic versus international stocks. The Fund’s fixed income allocation outperformed the benchmark Bloomberg US Aggregate Bond Index by overweighting the securitized sector, specifically mortgage-backed securities, a big contribution from a long-duration US Treasury holding, and the strong showing from the Fund’s core actively managed bond fund position.
We ended the period cautiously optimistic for the year ahead, and while still a touch defensive overall, we have increased equity exposure by expanding our allocations to smaller cap stocks and the financial sector.
| Aggressive Allocation Fund Class A | MAGSX |
Fund Performance
The chart below illustrates the total value of a hypothetical $10,000 investment in the Fund over the past 10 years (or for the life of the Fund if shorter).

| Average Annual Total Returns (%) | |
| | 1 Year | 5 Years | 10 Years |
| Class A | 20.11% | 5.10% | 5.83% |
| Class A with load | 13.25% | 3.87% | 5.21% |
| Aggressive Allocation Fund Custom Index | 28.80% | 9.62% | 8.54% |
| S&P 500 Index | 38.02% | 15.27% | 13.00% |
1. Fund returns are calculated after fund expenses have been subtracted and assume that dividends and capital gains are reinvested in additional shares of a fund. Returns do not reflect the deduction of taxes that a shareholder would pay on fund distributions or the redemption of fund shares. Investment return and principal value will fluctuate, so an investor’s shares, when redeemed, may be worth more or less than original cost. Further information relating to the fund’s performance is contained in the prospectus and elsewhere in this report. The fund’s past performance is not indicative of future performance.
2. Maximum sales charge is 5.75% for class A shares.
3. The Aggressive Allocation Fund Custom Index consists of 56% Russell 3000 Index, 24% MSCI ACWI ex-US Index and 20% Bloomberg Barclays US Aggregate Bond Index.
4. The S&P 500 Index is a large-cap market index which measures the performance of a representative sample of 500 leading companies in leading industries in the US.
| Key Fund Statistics (As of October 31, 2024) | | | | | | | | |
| Total Net Assets | | | | | | | $54,212,672 | |
| # of Portfolio Holdings | | | | | | | 14 | |
| Portfolio Turnover Rate | | | | | | | 55% | |
| Total Advisory Fees Paid | | | | | | | $110,318 | |
| Aggressive Allocation Fund Class A | MAGSX |
What does the Fund invest in?
The Fund invested primarily in shares of other registered investment companies. The Fund’s total net assets were allocated among various asset classes and underlying funds, with target allocations over time of approximately 80% equity investments and 20% fixed income investments.
| Top Ten Holdings (% of Net Assets) | | | |
| Madison Investors Fund, Class R6 | | 16.1 | % |
| Invesco S&P 500 Quality ETF | | 13.5 | % |
| Madison Core Bond Fund, Class R6 | | 13.1 | % |
| Distillate U.S. Fundamental Stability & Value ETF | | 10.5 | % |
| Vanguard FTSE Europe ETF | | 8.2 | % |
| Vanguard Information Technology ETF | | 7.6 | % |
| iShares Treasury Floating Rate Bond ETF | | 7.2 | % |
| iShares MSCI Emerging Markets Asia ETF | | 5.8 | % |
| Schwab Intermediate-Term U.S. Treasury ETF | | 5.6 | % |
| Franklin FTSE Japan ETF | | 5.0 | % |
| Portfolio Allocation (% of Net Assets) | | | |
| Exchange Traded Funds | | 68.9 | % |
| Investment Companies | | 29.1 | % |
| Short-Term Investments | | 9.8 | % |
| Other Assets and Liabilities, Net | | (7.8 | %) |
| | | | |
Material Fund Changes
On November 6, 2024, the Board of Trustees of the Trust approved the termination of all outstanding Class C shares of the Madison Funds. Effective after the close of business on Friday, February 14, 2025, all Madison Aggressive Allocation Class C shares will be automatically converted to Class A shares. The conversion of Class C to Class A shares of the same fund is not a taxable event, and no contingent deferred sales charges will be assessed, if applicable, on this one-time conversion of shares.
This is a summary of certain planned changes to the Fund since October 31, 2024. For more complete information, you may review the Fund’s next prospectus, which we expect to be available by February 28th, 2025 at www.madisonfunds.com or upon request by calling 1-800-877-6089.
Additional Information If you wish to view additional information about the Fund; including but not limited to financial statements or holdings, please visit www.madisonfunds.com/documents. Phone: 1-800-877-6089 |  |
| | Annual Shareholder Report
October 31, 2024 |
| Aggressive Allocation Fund Class A | MAGSX |
 | Annual Shareholder Report October 31, 2024 |
Aggressive Allocation Fund Class C
Madison Aggressive Allocation Fund
MAACX
Fund Overview
This annual shareholder report contains important information about Aggressive Allocation Fund Class C for the period of November 1, 2023 to October 31, 2024. You can find additional information about the Fund at www.madisonfunds.com/documents. You can also request this information by contacting us at 1-800-877-6089.
This report describes changes to the Fund that occurred during the reporting period.
What were the Fund costs for last year?
(based on a hypothetical $10,000 investment)
| | | Cost of a $10,000
investment | | | Costs paid as a
percentage of a
$10,000 investment | |
| Class C | | | $160 | | | | 1.46% | |
| | | | | | | | | |
How did the Fund perform last year and what affected its performance?
Entering the period, there was a high level of concern over the health of the economy and many traditional indicators of recession were flashing red. However, the stalling of the inflationary impulse in late 2023 led to an abrupt shift in market expectations for much lower interest rates by the end of 2024. The bellwether 10-year US Treasury yield fell over 1% over the first two months of the period and risk markets were off to the races.
The Fund’s sizeable absolute return was aided by the strong market backdrop across all major asset classes. However, our economic outlook and conservative DNA had us guarded for a more challenging market and the Fund’s underweight to equity risk (overweight to cash) provided the largest headwind to relative performance. Within our US equity allocation, our core positions failed to keep up with the highly concentrated mega cap led market, which compounded the hit to relative performance. Across equities, the Fund benefited from an overweight to the US Technology sector and a heavy preference for domestic versus international stocks. The Fund’s fixed income allocation outperformed the benchmark Bloomberg US Aggregate Bond Index by overweighting the securitized sector, specifically mortgage-backed securities, a big contribution from a long-duration US Treasury holding, and the strong showing from the Fund’s core actively managed bond fund position.
We ended the period cautiously optimistic for the year ahead, and while still a touch defensive overall, we have increased equity exposure by expanding our allocations to smaller cap stocks and the financial sector.
| Aggressive Allocation Fund Class C | MAACX |
Fund Performance
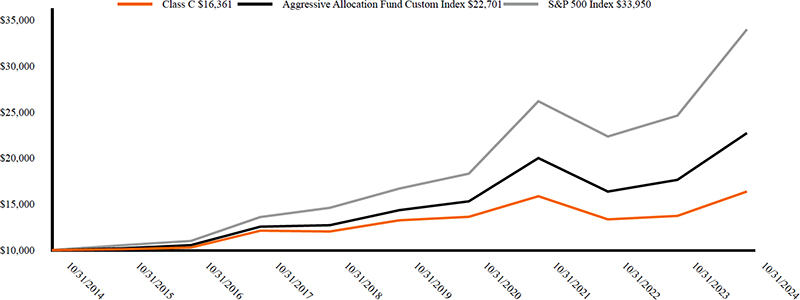
The chart below illustrates the total value of a hypothetical $10,000 investment in the Fund over the past 10 years (or for the life of the Fund if shorter).
| Average Annual Total Returns (%) | |
| | 1 Year | 5 Years | 10 Years |
| Class C | 19.28% | 4.33% | 5.05% |
| Aggressive Allocation Fund Custom Index | 28.80% | 9.62% | 8.54% |
| S&P 500 Index | 38.02% | 15.27% | 13.00% |
1. Fund returns are calculated after fund expenses have been subtracted and assume that dividends and capital gains are reinvested in additional shares of a fund. Returns do not reflect the deduction of taxes that a shareholder would pay on fund distributions or the redemption of fund shares. Investment return and principal value will fluctuate, so an investor’s shares, when redeemed, may be worth more or less than original cost. Further information relating to the fund’s performance is contained in the prospectus and elsewhere in this report. The Fund’s past performance is not indicative of future performance.
2. The Aggressive Allocation Fund Custom Index consists of 56% Russell 3000® Index, 24% MSCI ACWI ex-US Index and 20% Bloomberg Barclays US Aggregate Bond Index.
3. The S&P® 500 Index is a large-cap market index which measures the performance of a representative sample of 500 leading companies in leading industries in the US.
| Key Fund Statistics (As of October 31, 2024) | | | | | | | | |
| Total Net Assets | | | | | | | $54,212,672 | |
| # of Portfolio Holdings | | | | | | | 14 | |
| Portfolio Turnover Rate | | | | | | | 55% | |
| Total Advisory Fees Paid | | | | | | | $110,318 | |
| Aggressive Allocation Fund Class C | MAACX |
What does the Fund invest in?
The Fund invested primarily in shares of other registered investment companies. The Fund’s total net assets were allocated among various asset classes and underlying funds, with target allocations over time of approximately 80% equity investments and 20% fixed income investments.
| Top Ten Holdings (% of Net Assets) | | | |
| Madison Investors Fund, Class R6 | | 16.1 | % |
| Invesco S&P 500 Quality ETF | | 13.5 | % |
| Madison Core Bond Fund, Class R6 | | 13.1 | % |
| Distillate U.S. Fundamental Stability & Value ETF | | 10.5 | % |
| Vanguard FTSE Europe ETF | | 8.2 | % |
| Vanguard Information Technology ETF | | 7.6 | % |
| iShares Treasury Floating Rate Bond ETF | | 7.2 | % |
| iShares MSCI Emerging Markets Asia ETF | | 5.8 | % |
| Schwab Intermediate-Term U.S. Treasury ETF | | 5.6 | % |
| Franklin FTSE Japan ETF | | 5.0 | % |
| Portfolio Allocation (% of Net Assets) | | | |
| Exchange Traded Funds | | 68.9 | % |
| Investment Companies | | 29.1 | % |
| Short-Term Investments | | 9.8 | % |
| Other Assets and Liabilities, Net | | (7.8 | %) |
| | | | |
Material Fund Changes
On November 6, 2024, the Board of Trustees of the Trust approved the termination of all outstanding Class C shares of the Madison Funds. Effective after the close of business on Friday, February 14, 2025, all Madison Aggressive Allocation Class C shares will be automatically converted to Class A shares. The conversion of Class C to Class A shares of the same fund is not a taxable event, and no contingent deferred sales charges will be assessed, if applicable, on this one-time conversion of shares.
This is a summary of certain planned changes to the Fund since October 31, 2024. For more complete information, you may review the Fund’s next prospectus, which we expect to be available by February 28th, 2025 at www.madisonfunds.com or upon request by calling 1-800-877-6089.
Additional Information If you wish to view additional information about the Fund; including but not limited to financial statements or holdings, please visit www.madisonfunds.com/documents. Phone: 1-800-877-6089 |  |
| | Annual Shareholder Report
October 31, 2024 |
| Aggressive Allocation Fund Class C | MAACX |
 | Annual Shareholder Report October 31, 2024 |
Diversified Income Fund Class A
Madison Diversified Income Fund
MBLAX
Fund Overview
This annual shareholder report contains important information about Diversified Income Fund Class A for the period of November 1, 2023 to October 31, 2024. You can find additional information about the Fund at www.madisonfunds.com/documents. You can also request this information by contacting us at 1-800-877-6089.
This report describes changes to the Fund that occurred during the reporting period.
What were the Fund costs for last year?
(based on a hypothetical $10,000 investment)
| | | Cost of a $10,000
investment | | | Costs paid as a
percentage of a
$10,000 investment | |
| Class A | | | $70 | | | | 0.66% | |
| | | | | | | | | |
How did the Fund perform last year and what affected its performance?
It was a phenomenal 12 month stretch for asset markets. That said, equity market gains were heavily skewed toward mega cap growth stocks and not nearly as rewarding to high quality dividend payers.
Contrary to the equity market, where yield seeking detracted from return, yield was the big winner within bonds. Investors poured money into both high yield (“junk”) and investment grade corporates alike, ratcheting their spreads over equivalent US Treasuries to historically low levels.
The Fund’s absolute return was a direct result of the double-digit gains across the asset markets. From a relative standpoint, outside of our dividend focused equity holdings, performance was held back by our core allocation to a hedged equity/covered call strategy. The strategy provides a very high level of income for the Fund but is prone to sizeable underperformance in runaway-up markets, where potential gains get called away. Within bonds, the Fund benefited from allocations to high quality corporate bond and mortgage-backed security ETFs. The Fund’s return per unit of duration was very favorable relative to the Bloomberg US Aggregate Bond Index.
| Diversified Income Fund Class A | MBLAX |
Fund Performance
The chart below illustrates the total value of a hypothetical $10,000 investment in the Fund over the past 10 years (or for the life of the Fund if shorter).

| Average Annual Total Returns (%) | |
| | 1 Year | 5 Years | 10 Years |
| Class A | 13.50% | 4.91% | 6.04% |
| Class A with load | 6.94% | 3.68% | 5.42% |
| Madison DI Fund Index (50% S&P 500 - 50% ICE BofA Corp. Govt. Mtg) | 23.69% | 7.55% | 7.38% |
| ICE BofA US Corp. Govt. & Mtg. Index | 10.58% | (0.29%) | 1.50% |
| S&P 500 Index | 38.02% | 15.27% | 13.00% |
1. Fund returns are calculated after fund expenses have been subtracted and assume that dividends and capital gains are reinvested in additional shares of a fund. Returns do not reflect the deduction of taxes that a shareholder would pay on fund distributions or the redemption of fund shares. Investment return and principal value will fluctuate, so an investor’s shares, when redeemed, may be worth more or less than original cost. Further information relating to the fund’s performance is contained in the prospectus and elsewhere in this report. The fund’s past performance is not indicative of future performance.
2. Maximum sales charge is 5.75% for class A shares.
3. The Madison DI Fund Index consists of 50% S&P 500 Index and 50% ICE Bank of America Merrill Lynch US Corporate, Government & Mortgage Index.
4. The ICE BofA US Corp. Govt. & Mtg USD Index is a broad-based measure of the total rate of return performance of the US investment grade bond markets. The index is a capitalization-weighted aggregation of outstanding US treasury, agency, and supranational mortgage pass-through, and investment grade corporate bonds meeting specified selection criteria.
5. The S&P 500 Index is a large-cap market index which measures the performance of a representative sample of 500 leading companies in leading industries in the US.
| Key Fund Statistics (As of October 31, 2024) | | | | | | | | |
| Total Net Assets | | | | | | | $137,625,353 | |
| # of Portfolio Holdings | | | | | | | 19 | |
| Portfolio Turnover Rate | | | | | | | 8% | |
| Total Advisory Fees Paid | | | | | | | $283,023 | |
| Diversified Income Fund Class A | MBLAX |
What does the Fund invest in?
The Fund invested primarily in shares of other registered investment companies. The Fund’s total net assets were allocated among various asset classes and underlying funds, with target allocations over time of approximately 50% equity investments and 50% fixed income investments.
| Top Ten Holdings (% of Net Assets) | | | |
| Madison Covered Call ETF | | 22.5 | % |
| Madison Short-Term Strategic Income ETF | | 21.4 | % |
| Madison Dividend Value ETF | | 17.5 | % |
| Madison Aggregate Bond ETF | | 17.4 | % |
| Janus Henderson Mortgage-Backed Securities ETF | | 8.3 | % |
| Vanguard Dividend Appreciation ETF | | 4.5 | % |
| Global X MLP ETF | | 3.1 | % |
| iShares Aaa - A Rated Corporate Bond ETF | | 2.6 | % |
| Government National Mortgage Association, 6.500%, due 02/20/29 | | 0.0 | % |
| Federal National Mortgage Association, 7.000%, due 11/01/31 | | 0.0 | % |
| Portfolio Allocation (% of Net Assets) | | | |
| Exchange Traded Funds | | 97.2 | % |
| Short-Term Investments | | 4.0 | % |
| Mortgage Backed Securities | | 0.0 | % |
| Collateralized Mortgage Obligations | | 0.0 | % |
| Commercial Mortgage-Backed Securities | | 0.0 | % |
| Other Assets and Liabilities, Net | | (1.2 | %) |
Material Fund Changes
On November 6, 2024, the Board of Trustees of the Trust approved the termination of all outstanding Class C shares of the Madison Funds. Effective after the close of business on Friday, February 14, 2025, all Madison Diversified Income Class C shares will be automatically converted to Class A shares. The conversion of Class C to Class A shares of the same fund is not a taxable event, and no contingent deferred sales charges will be assessed, if applicable, on this one-time conversion of shares.
This is a summary of certain planned changes to the Fund since October 31, 2024. For more complete information, you may review the Fund’s next prospectus, which we expect to be available by February 28th, 2025 at www.madisonfunds.com or upon request by calling 1-800-877-6089.
Additional Information If you wish to view additional information about the Fund; including but not limited to financial statements or holdings, please visit www.madisonfunds.com/documents. Phone: 1-800-877-6089 |  |
| | Annual Shareholder Report
October 31, 2024 |
| Diversified Income Fund Class A | MBLAX |
 | Annual Shareholder Report October 31, 2024 |
Diversified Income Fund Class C
Madison Diversified Income Fund
MBLCX
Fund Overview
This annual shareholder report contains important information about Diversified Income Fund Class C for the period of November 1, 2023 to October 31, 2024. You can find additional information about the Fund at www.madisonfunds.com/documents. You can also request this information by contacting us at 1-800-877-6089.
This report describes changes to the Fund that occurred during the reporting period.
What were the Fund costs for last year?
(based on a hypothetical $10,000 investment)
| | | Cost of a $10,000
investment | | | Costs paid as a
percentage of a
$10,000 investment | |
| Class C | | | $149 | | | | 1.40% | |
| | | | | | | | | |
How did the Fund perform last year and what affected its performance?
It was a phenomenal 12 month stretch for asset markets. That said, equity market gains were heavily skewed toward mega cap growth stocks and not nearly as rewarding to high quality dividend payers.
Contrary to the equity market, where yield seeking detracted from return, yield was the big winner within bonds. Investors poured money into both high yield (“junk”) and investment grade corporates alike, ratcheting their spreads over equivalent US Treasuries to historically low levels.
The Fund’s absolute return was a direct result of the double-digit gains across the asset markets. From a relative standpoint, outside of our dividend focused equity holdings, performance was held back by our core allocation to a hedged equity/covered call strategy. The strategy provides a very high level of income for the Fund but is prone to sizeable underperformance in runaway-up markets, where potential gains get called away. Within bonds, the Fund benefited from allocations to high quality corporate bond and mortgage-backed security ETFs. The Fund’s return per unit of duration was very favorable relative to the Bloomberg US Aggregate Bond Index.
| Diversified Income Fund Class C | MBLCX |
Fund Performance
The chart below illustrates the total value of a hypothetical $10,000 investment in the Fund over the past 10 years (or for the life of the Fund if shorter).

| Average Annual Total Returns (%) | |
| | 1 Year | 5 Years | 10 Years |
| Class C | 12.74% | 4.15% | 5.27% |
| Madison DI Fund Index (50% S&P 500 - 50% ICE BofA Corp. Govt. Mtg) | 23.69% | 7.55% | 7.38% |
| ICE BofA US Corp. Govt. & Mtg. Index | 10.58% | (0.29%) | 1.50% |
| S&P 500 Index | 38.02% | 15.27% | 13.00% |
1. Fund returns are calculated after fund expenses have been subtracted and assume that dividends and capital gains are reinvested in additional shares of a fund. Returns do not reflect the deduction of taxes that a shareholder would pay on fund distributions or the redemption of fund shares. Investment return and principal value will fluctuate, so an investor’s shares, when redeemed, may be worth more or less than original cost. Further information relating to the fund’s performance is contained in the prospectus and elsewhere in this report. The Fund’s past performance is not indicative of future performance.
2. The Madison DI Fund Index consists of 50% S&P 500 Index and 50% ICE Bank of America Merrill Lynch US Corporate, Government & Mortgage Index.
3. The ICE BofA US Corp. Govt. & Mtg USD Index is a broad-based measure of the total rate of return performance of the US investment grade bond markets. The index is a capitalization-weighted aggregation of outstanding US treasury, agency, and supranational mortgage pass-through, and investment grade corporate bonds meeting specified selection criteria.
4. The S&P 500 Index is a large-cap market index which measures the performance of a representative sample of 500 leading companies in leading industries in the US.
| Key Fund Statistics (As of October 31, 2024) | | | | | | | | |
| Total Net Assets | | | | | | | $137,625,353 | |
| # of Portfolio Holdings | | | | | | | 19 | |
| Portfolio Turnover Rate | | | | | | | 8% | |
| Total Advisory Fees Paid | | | | | | | $283,023 | |
| Diversified Income Fund Class C | MBLCX |
What does the Fund invest in?
The Fund invested primarily in shares of other registered investment companies. The Fund’s total net assets were allocated among various asset classes and underlying funds, with target allocations over time of approximately 50% equity investments and 50% fixed income investments.
| Top Ten Holdings (% of Net Assets) | | | |
| Madison Covered Call ETF | | 22.5 | % |
| Madison Short-Term Strategic Income ETF | | 21.4 | % |
| Madison Dividend Value ETF | | 17.5 | % |
| Madison Aggregate Bond ETF | | 17.4 | % |
| Janus Henderson Mortgage-Backed Securities ETF | | 8.3 | % |
| Vanguard Dividend Appreciation ETF | | 4.5 | % |
| Global X MLP ETF | | 3.1 | % |
| iShares Aaa - A Rated Corporate Bond ETF | | 2.6 | % |
| Government National Mortgage Association, 6.500%, due 02/20/29 | | 0.0 | % |
| Federal National Mortgage Association, 7.000%, due 11/01/31 | | 0.0 | % |
| Portfolio Allocation (% of Net Assets) | | | |
| Exchange Traded Funds | | 97.2 | % |
| Short-Term Investments | | 4.0 | % |
| Mortgage Backed Securities | | 0.0 | % |
| Collateralized Mortgage Obligations | | 0.0 | % |
| Commercial Mortgage-Backed Securities | | 0.0 | % |
| Other Assets and Liabilities, Net | | (1.2 | %) |
Material Fund Changes
On November 6, 2024, the Board of Trustees of the Trust approved the termination of all outstanding Class C shares of the Madison Funds. Effective after the close of business on Friday, February 14, 2025, all Madison Diversified Income Class C shares will be automatically converted to Class A shares. The conversion of Class C to Class A shares of the same fund is not a taxable event, and no contingent deferred sales charges will be assessed, if applicable, on this one-time conversion of shares.
This is a summary of certain planned changes to the Fund since October 31, 2024. For more complete information, you may review the Fund’s next prospectus, which we expect to be available by February 28th, 2025 at www.madisonfunds.com or upon request by calling 1-800-877-6089.
Additional Information If you wish to view additional information about the Fund; including but not limited to financial statements or holdings, please visit www.madisonfunds.com/documents. Phone: 1-800-877-6089 |  |
| | Annual Shareholder Report
October 31, 2024 |
| Diversified Income Fund Class C | MBLCX |
 | Annual Shareholder Report October 31, 2024 |
Tax-Free Virginia Fund Class Y
Madison Tax-Free Virginia Fund
GTVAX
Fund Overview
This annual shareholder report contains important information about Tax-Free Virginia Fund Class Y for the period of November 1, 2023 to October 31, 2024. You can find additional information about the Fund at www.madisonfunds.com/documents. You can also request this information by contacting us at 1-800-877-6089.
This report describes changes to the Fund that occurred during the reporting period.
What were the Fund costs for last year?
(based on a hypothetical $10,000 investment)
| | | Cost of a $10,000
investment | | | Costs paid as a
percentage of a
$10,000 investment | |
| Class Y | | | $89 | | | | 0.86% | |
| | | | | | | | | |
How did the Fund perform last year and what affected its performance?
The Fund’s relative performance is attributable to yield curve positioning, sector allocation, coupon structure and the overall credit profile of the individual holdings. The Fund has consistently been positioned with a shorter overall maturity structure than the index, which was detractive to performance as the municipal bond market posted strong returns for most of the 12-month period. Coupon structure was neutral to performance as interest rates were somewhat rangebound and lower coupon structures with below par pricing were less volatile as the Federal Reserve began to lower the Federal Funds rate. The Di Minimis tax rule creates price declines on municipal bonds trading below par in rising interest rate environments. Although these coupon structures continue to trade below their intrinsic value, stable interest rates and forecasted lower rates will benefit price action on these bonds. In addition, the Fund’s “up in quality” bias was detractive to performance as lower quality bonds enhanced overall yield and benefited from tightening spreads leading to price appreciation.
The Yield curve positioning was detractive to performance as the fund had a lower allocation to longer dated bonds versus its benchmark. The generic municipal yield curve has reoriented from an uncommon “inverted” structure during the Fed’s tightening cycle to a relatively “flat” yield structure in tenors going out to 10-years. Longer dated maturities offer incremental yield gains throughout the 15 to 30-year range, which is the typical structure. Finally, even with a relatively shorter duration posture versus the index, the Fund was able to capture a similar portfolio yield as the benchmark.
Credit quality in the municipal bond market continued to be quite strong. The upgrade to downgrade ratio was 3/2 during the first three quarters of the year as state and local governments benefited to a surprisingly resilient economy, strong income and sales tax collections and solid fund balances built up from Federal transfer payments during the pandemic. Outside of the health care and higher education sectors, most municipal finances seem to be in pretty good shape. However, with most of the Federal relief funds sunsetting in 2025 and record needs for investments in infrastructure and social services, budgets could be challenged if the overall economy slows precipitously.
| Tax-Free Virginia Fund Class Y | GTVAX |
Fund Performance
The chart below illustrates the total value of a hypothetical $10,000 investment in the Fund over the past 10 years (or for the life of the Fund if shorter).

| Average Annual Total Returns (%) | |
| | 1 Year | 5 Years | 10 Years |
| Class Y | 7.21% | 0.05% | 1.23% |
| ICE BofA 1-22 Yr Municipal Securities Index | 8.61% | 1.21% | 2.19% |
1. Fund returns are calculated after fund expenses have been subtracted and assume that dividends and capital gains are reinvested in additional shares of a fund. Returns do not reflect the deduction of taxes that a shareholder would pay on fund distributions or the redemption of fund shares. Investment return and principal value will fluctuate, so an investor’s shares, when redeemed, may be worth more or less than original cost. Further information relating to the fund’s performance is contained in the prospectus and elsewhere in this report. The Fund’s past performance is not indicative of future performance.
2. The ICE BofA 1-22 Yr Municipal Securities Index tracks the performance of US dollar denominated investment grade tax-exempt debt publicly issued by US states and territories, their political subdivisions, in the US domestic market, with a remaining term to final maturity less than 22 years.
| Key Fund Statistics (As of October 31, 2024) | | | | | | | | |
| Total Net Assets | | | | | | | $16,722,742 | |
| # of Portfolio Holdings | | | | | | | 61 | |
| Portfolio Turnover Rate | | | | | | | 12% | |
| Total Advisory Fees Paid | | | | | | | $85,322 | |
| Tax-Free Virginia Fund Class Y | GTVAX |
What does the Fund invest in?
The Fund invested in intermediate and long-term bonds with average aggregate maturities of 7 to 15 years in municipal bonds that were exempt from federal and state income tax for residents of Virginia.
| Top Ten Holdings (% of Net Assets) | | | |
| Northern Virginia Transportation Authority, 5.000%, due 06/01/30 | | 4.6 | % |
| County of Arlington, 5.000%, due 08/15/30 | | 3.7 | % |
| James City County Economic Development Authority, 5.000%, due 06/15/30 | | 3.2 | % |
| Metropolitan Washington Airports Authority Aviation Revenue, 5.000%, due 10/01/43 | | 3.1 | % |
| Loudoun County Economic Development Authority, 4.000%, due 12/01/37 | | 3.0 | % |
| City of Norfolk, 5.000%, due 08/01/47 | | 3.0 | % |
| Hampton Roads Transportation Accountability Commission, 5.000%, due 07/01/42 | | 2.9 | % |
| Greater Richmond Convention Center Authority, 5.000%, due 06/15/26 | | 2.8 | % |
| City of Poquoson, 4.000%, due 02/15/29 | | 2.6 | % |
| Hampton Roads Sanitation District, 5.000%, due 10/01/35 | | 2.6 | % |
| Portfolio Allocation (% of Net Assets) | | | |
| General Obligation | | 39.6 | % |
| Development | | 11.0 | % |
| Transportation | | 10.9 | % |
| Water | | 9.8 | % |
| Education | | 8.8 | % |
| Facilities | | 7.6 | % |
| Airport | | 3.9 | % |
| Power | | 3.0 | % |
| Medical | | 2.3 | % |
| Multifamily Housing | | 1.1 | % |
| Other investments less than 1% | | 0.7 | % |
| Other Assets and Liabilities, Net | | 1.3 | % |
Material Fund Changes
On November 6, 2024, the Board of Trustees of the Madison Funds approved the liquidation of the Madison Tax-Free Virginia. The liquidation is expected to occur on or about February 21, 2025.
This is a summary of certain planned changes to the Fund since October 31, 2024. For more complete information, you may review the Fund’s next prospectus, which we expect to be available by February 28th, 2025 at www.madisonfunds.com or upon request by calling 1-800-877-6089.
Additional Information If you wish to view additional information about the Fund; including but not limited to financial statements or holdings, please visit www.madisonfunds.com/documents. Phone: 1-800-877-6089 |  |
| | Annual Shareholder Report
October 31, 2024 |
| Tax-Free Virginia Fund Class Y | GTVAX |
 | Annual Shareholder Report October 31, 2024 |
Tax-Free National Fund Class Y
MadisonTax-Free National Fund
GTFHX
Fund Overview
This annual shareholder report contains important information about Tax-Free National Fund Class Y for the period of November 1, 2023 to October 31, 2024. You can find additional information about the Fund at www.madisonfunds.com/documents. You can also request this information by contacting us at 1-800-877-6089.
What were the Fund costs for last year?
(based on a hypothetical $10,000 investment)
| | | Cost of a $10,000
investment | | | Costs paid as a
percentage of a
$10,000 investment | |
| Class Y | | | $79 | | | | 0.76% | |
| | | | | | | | | |
How did the Fund perform last year and what affected its performance?
The Fund’s relative performance is attributable to yield curve positioning, sector allocation, coupon structure and the overall credit profile of the individual holdings. The Fund has consistently been positioned with a shorter overall maturity structure than the index, which was detractive to performance as the municipal bond market posted strong returns for most of the 12-month period. Coupon structure was neutral to performance as interest rates were somewhat rangebound and lower coupon structures with below par pricing were less volatile as the Federal Reserve began to lower the Federal Funds rate. The Di Minimis tax rule creates price declines on municipal bonds trading below par in rising interest rate environments. Although these coupon structures continue to trade below their intrinsic value, stable interest rates and forecasted lower rates will benefit price action on these bonds. In addition, the Fund’s “up in quality” bias was detractive to performance as lower quality bonds enhanced overall yield and benefited from tightening spreads leading to price appreciation.
The Yield curve positioning was detractive to performance as the fund had a lower allocation to longer dated bonds versus its benchmark. The generic municipal yield curve has reoriented from an uncommon “inverted” structure during the Fed’s tightening cycle to a relatively “flat” yield structure in tenors going out to 10-years. Longer dated maturities offer incremental yield gains throughout the 15 to 30-year range, which is the typical structure. Finally, even with a relatively shorter duration posture versus the index, the Fund was able to capture a similar portfolio yield as the benchmark.
Credit quality in the municipal bond market continued to be quite strong. The upgrade to downgrade ratio was 3/2 during the first three quarters of the year as state and local governments benefited to a surprisingly resilient economy, strong income and sales tax collections and solid fund balances built up from Federal transfer payments during the pandemic. Outside of the health care and higher education sectors, most municipal finances seem to be in pretty good shape. However, with most of the Federal relief funds sunsetting in 2025 and record needs for investments in infrastructure and social services, budgets could be challenged if the overall economy slows precipitously.
| Tax-Free National Fund Class Y | GTFHX |
Fund Performance
The chart below illustrates the total value of a hypothetical $10,000 investment in the Fund over the past 10 years (or for the life of the Fund if shorter).

| Average Annual Total Returns (%) | |
| | 1 Year | 5 Years | 10 Years |
| Class Y | 6.66% | 0.43% | 1.56% |
| ICE BofA 1-22 Yr Municipal Securities Index | 8.61% | 1.21% | 2.19% |
1. Fund returns are calculated after fund expenses have been subtracted and assume that dividends and capital gains are reinvested in additional shares of a fund. Returns do not reflect the deduction of taxes that a shareholder would pay on fund distributions or the redemption of fund shares. Investment return and principal value will fluctuate, so an investor’s shares, when redeemed, may be worth more or less than original cost. Further information relating to the fund’s performance is contained in the prospectus and elsewhere in this report. The Fund’s past performance is not indicative of future performance.
2. The ICE BofA 1-22 Yr Municipal Securities Index tracks the performance of US dollar denominated investment grade tax-exempt debt publicly issued by US states and territories, their political subdivisions, in the US domestic market, with a remaining term to final maturity less than 22 years.
| Key Fund Statistics (As of October 31, 2024) | | | | | | | | |
| Total Net Assets | | | | | | | $17,478,684 | |
| # of Portfolio Holdings | | | | | | | 56 | |
| Portfolio Turnover Rate | | | | | | | 13% | |
| Total Advisory Fees Paid | | | | | | | $71,080 | |
| Tax-Free National Fund Class Y | GTFHX |
What does the Fund invest in?
The Fund invested in intermediate and long-term bonds with average aggregate maturities of 7 to 15 years in municipal bonds that were exempt from federal income taxes.
| Top Ten Holdings (% of Net Assets) | | | |
| County of Mobile, 5.000%, due 02/01/39 | | 3.7 | % |
| City of Burlington, 4.000%, due 04/01/36 | | 3.3 | % |
| Cook County School District No. 111 Burbank, 5.000%, due 12/01/35 | | 3.3 | % |
| Vanderburgh County Redevelopment District, 5.000%, due 02/01/26 | | 2.9 | % |
| Idaho Health Facilities Authority, 5.000%, due 03/01/34 | | 2.9 | % |
| Medical Center Educational Building Corp., 5.000%, due 06/01/30 | | 2.8 | % |
| Southampton County Industrial Development Authority, 5.000%, due 06/01/35 | | 2.8 | % |
| West Virginia Economic Development Authority, 5.000%, due 07/01/37 | | 2.7 | % |
| Eastern Kentucky University, 5.000%, due 04/01/33 | | 2.6 | % |
| City of Hialeah Utility System, 5.000%, due 10/01/35 | | 2.5 | % |
| Portfolio Allocation (% of Net Assets) | | | |
| Government | | 69.4 | % |
| General | | 7.0 | % |
| Development | | 4.9 | % |
| Health Care | | 4.2 | % |
| General Obligation | | 3.0 | % |
| Education | | 2.4 | % |
| Financials | | 2.1 | % |
| Facilities | | 1.5 | % |
| Utilities | | 1.4 | % |
| Transportation | | 1.4 | % |
| Water | | 1.2 | % |
| Other Assets and Liabilities, Net | | 1.5 | % |
Additional Information If you wish to view additional information about the Fund; including but not limited to financial statements or holdings, please visit www.madisonfunds.com/documents. Phone: 1-800-877-6089 |  |
| | Annual Shareholder Report
October 31, 2024 |
| Tax-Free National Fund Class Y | GTFHX |
 | Annual Shareholder Report October 31, 2024 |
High Quality Bond Fund Class Y
Madison High Quality Bond Fund
MIIBX
Fund Overview
This annual shareholder report contains important information about High Quality Bond Fund Class Y for the period of November 1, 2023 to October 31, 2024. You can find additional information about the Fund at www.madisonfunds.com/documents. You can also request this information by contacting us at 1-800-877-6089.
What were the Fund costs for last year?
(based on a hypothetical $10,000 investment)
| | | Cost of a $10,000
investment | | | Costs paid as a
percentage of a
$10,000 investment | |
| Class Y | | | $52 | | | | 0.50% | |
| | | | | | | | | |
How did the Fund perform last year and what affected its performance?
In response to the Fed’s shift away from restrictive monetary policy, yields stabilized and moved lower in recent months. Higher yield levels and some improved price movement over the period aided in providing a positive return environment for fixed income assets. In recent months the debate has evolved from whether the Fed has achieved a ‘soft landing’ to how to maintain it. The Fed, far from proclaiming a ‘mission accomplished’ moment has shifted their focus to avoiding labor market deterioration. This new focus was clear during the September FOMC meeting and the resulting 50 basis point cut.
While their direction is increasingly clear, the path forward is far from obvious. Continued data volatility and changing market expectations will drive markets until a clear policy end point emerges. The challenge to continue reducing inflation without materially slowing the economy will dictate policy changes over the coming months. We are pleased to see fixed income portfolios benefitting as yields decline but current yield levels, while still offering value, are less attractive than earlier this year. We are pleased to have increased duration exposure and yield in portfolio’s while we evaluate future Fed policy. We expect further yield movement will be dictated by changing economic fundamentals and stand ready to take further action as expectations for monetary policy adjust in the months ahead.
| High Quality Bond Fund Class Y | MIIBX |
Fund Performance
The chart below illustrates the total value of a hypothetical $10,000 investment in the Fund over the past 10 years (or for the life of the Fund if shorter).

| Average Annual Total Returns (%) | |
| | 1 Year | 5 Years | 10 Years |
| Class Y | 7.20% | 0.47% | 1.05% |
| Bloomberg US Intermediate Gov’t/Credit A+ Index | 7.58% | 0.67% | 1.51% |
1. Fund returns are calculated after fund expenses have been subtracted and assume that dividends and capital gains are reinvested in additional shares of a fund. Returns do not reflect the deduction of taxes that a shareholder would pay on fund distributions or the redemption of fund shares. Investment return and principal value will fluctuate, so an investor’s shares, when redeemed, may be worth more or less than original cost. Further information relating to the fund’s performance is contained in the prospectus and elsewhere in this report. The Fund’s past performance is not indicative of future performance.
2. The Bloomberg US Intermediate Govt/Credit A+ Index measures the performance of US dollar denominated US Treasuries, government related and investment grade US corporate securities with quality ratings of A3/A- or better and maturities between one and 10 years.
| Key Fund Statistics (As of October 31, 2024) | | | | | | | | |
| Total Net Assets | | | | | | | $61,517,774 | |
| # of Portfolio Holdings | | | | | | | 58 | |
| Portfolio Turnover Rate | | | | | | | 33% | |
| Total Advisory Fees Paid | | | | | | | $180,522 | |
| High Quality Bond Fund Class Y | MIIBX |
What does the Fund invest in?
The Fund invested in a broad range of corporate debt securities, obligations of the U.S. Government and its agencies, and money market instruments, while maintaining an overall portfolio quality rating of A by Standard & Poor’s and/or A2 by Moody’s.
| Top Ten Holdings (% of Net Assets) | | | |
| U.S. Treasury Notes, 4.875%, due 10/31/28 | | 4.2 | % |
| U.S. Treasury Notes, 3.625%, due 05/31/28 | | 4.0 | % |
| Federal National Mortgage Association, 2.125%, due 04/24/26 | | 3.7 | % |
| U.S. Treasury Notes, 4.000%, due 07/31/30 | | 3.6 | % |
| U.S. Treasury Notes, 3.875%, due 11/30/29 | | 3.6 | % |
| U.S. Treasury Notes, 3.875%, due 12/31/29 | | 3.6 | % |
| U.S. Treasury Notes, 4.000%, due 02/29/28 | | 3.2 | % |
| U.S. Treasury Notes, 4.000%, due 06/30/28 | | 3.2 | % |
| U.S. Treasury Notes, 3.875%, due 09/30/29 | | 3.2 | % |
| U.S. Treasury Notes, 3.250%, due 06/30/27 | | 3.2 | % |
| Portfolio Allocation (% of Net Assets) | | | |
| U.S. Government and Agency Obligations | | 63.0 | % |
| Corporate Notes and Bonds | | 34.0 | % |
| Short-Term Investments | | 6.1 | % |
| Foreign Corporate Bonds | | 1.6 | % |
| Other Assets and Liabilities, Net | | (4.7 | %) |
| | | | |
Additional Information If you wish to view additional information about the Fund; including but not limited to financial statements or holdings, please visit www.madisonfunds.com/documents. Phone: 1-800-877-6089 |  |
| | Annual Shareholder Report
October 31, 2024 |
| High Quality Bond Fund Class Y | MIIBX |
 | Annual Shareholder Report October 31, 2024 |
High Quality Bond Fund Class I
Madison High Quality Bond Fund
MIIRX
Fund Overview
This annual shareholder report contains important information about High Quality Bond Fund Class I for the period of November 1, 2023 to October 31, 2024. You can find additional information about the Fund at www.madisonfunds.com/documents. You can also request this information by contacting us at 1-800-877-6089.
What were the Fund costs for last year?
(based on a hypothetical $10,000 investment)
| | | Cost of a $10,000
investment | | | Costs paid as a
percentage of a
$10,000 investment | |
| Class I | | | $43 | | | | 0.41% | |
| | | | | | | | | |
How did the Fund perform last year and what affected its performance?
In response to the Fed’s shift away from restrictive monetary policy, yields stabilized and moved lower in recent months. Higher yield levels and some improved price movement over the period aided in providing a positive return environment for fixed income assets. In recent months the debate has evolved from whether the Fed has achieved a ‘soft landing’ to how to maintain it. The Fed, far from proclaiming a ‘mission accomplished’ moment has shifted their focus to avoiding labor market deterioration. This new focus was clear during the September FOMC meeting and the resulting 50 basis point cut.
While their direction is increasingly clear, the path forward is far from obvious. Continued data volatility and changing market expectations will drive markets until a clear policy end point emerges. The challenge to continue reducing inflation without materially slowing the economy will dictate policy changes over the coming months. We are pleased to see fixed income portfolios benefitting as yields decline but current yield levels, while still offering value, are less attractive than earlier this year. We are pleased to have increased duration exposure and yield in portfolio’s while we evaluate future Fed policy. We expect further yield movement will be dictated by changing economic fundamentals and stand ready to take further action as expectations for monetary policy adjust in the months ahead.
| High Quality Bond Fund Class I | MIIRX |
Fund Performance
The chart below illustrates the total value of a hypothetical $250,000 investment in the Fund over the past 10 years (or for the life of the Fund if shorter).

| Average Annual Total Returns (%) | |
| | 1 Year | Since Inception 2/28/22 |
| Class I | 7.35% | 0.91% |
| Bloomberg US Intermediate Gov’t/Credit A+ Index | 7.58% | 0.40% |
1. Fund returns are calculated after fund expenses have been subtracted and assume that dividends and capital gains are reinvested in additional shares of a fund. Returns do not reflect the deduction of taxes that a shareholder would pay on fund distributions or the redemption of fund shares. Investment return and principal value will fluctuate, so an investor’s shares, when redeemed, may be worth more or less than original cost. Further information relating to the fund’s performance is contained in the prospectus and elsewhere in this report. The Fund’s past performance is not indicative of future performance.
2. The Bloomberg US Intermediate Govt/Credit A+ Index measures the performance of US dollar denominated US Treasuries, government related and investment grade US corporate securities with quality ratings of A3/A- or better and maturities between one and 10 years.
| Key Fund Statistics (As of October 31, 2024) | | | | | | | | |
| Total Net Assets | | | | | | | $61,517,774 | |
| # of Portfolio Holdings | | | | | | | 58 | |
| Portfolio Turnover Rate | | | | | | | 33% | |
| Total Advisory Fees Paid | | | | | | | $180,522 | |
| High Quality Bond Fund Class I | MIIRX |
What does the Fund invest in?
The Fund invested in a broad range of corporate debt securities, obligations of the U.S. Government and its agencies, and money market instruments, while maintaining an overall portfolio quality rating of A by Standard & Poor’s and/or A2 by Moody’s.
| Top Ten Holdings (% of Net Assets) | | | |
| U.S. Treasury Notes , 4.875%, due 10/31/28 | | 4.2 | % |
| U.S. Treasury Notes , 3.625%, due 05/31/28 | | 4.0 | % |
| Federal National Mortgage Association , 2.125%, due 04/24/26 | | 3.7 | % |
| U.S. Treasury Notes , 4.000%, due 07/31/30 | | 3.6 | % |
| U.S. Treasury Notes , 3.875%, due 11/30/29 | | 3.6 | % |
| U.S. Treasury Notes , 3.875%, due 12/31/29 | | 3.6 | % |
| U.S. Treasury Notes , 4.000%, due 02/29/28 | | 3.2 | % |
| U.S. Treasury Notes , 4.000%, due 06/30/28 | | 3.2 | % |
| U.S. Treasury Notes , 3.875%, due 09/30/29 | | 3.2 | % |
| U.S. Treasury Notes , 3.250%, due 06/30/27 | | 3.2 | % |
| Portfolio Allocation (% of Net Assets) | | | |
| U.S. Government and Agency Obligations | | 63.0 | % |
| Corporate Notes and Bonds | | 34.0 | % |
| Short-Term Investments | | 6.1 | % |
| Foreign Corporate Bonds | | 1.6 | % |
| Other Assets and Liabilities, Net | | (4.7 | %) |
| | | | |
Additional Information If you wish to view additional information about the Fund; including but not limited to financial statements or holdings, please visit www.madisonfunds.com/documents. Phone: 1-800-877-6089 |  |
| | Annual Shareholder Report
October 31, 2024 |
| High Quality Bond Fund Class I | MIIRX |
 | Annual Shareholder Report October 31, 2024 |
Core Bond Fund Class A
Madison Core Bond Fund
MBOAX
Fund Overview
This annual shareholder report contains important information about Core Bond Fund Class A for the period of November 1, 2023 to October 31, 2024. You can find additional information about the Fund at www.madisonfunds.com/documents. You can also request this information by contacting us at 1-800-877-6089.
What were the Fund costs for last year?
(based on a hypothetical $10,000 investment)
| | | Cost of a $10,000
investment | | | Costs paid as a
percentage of a
$10,000 investment | |
| Class A | | | $89 | | | | 0.85% | |
| | | | | | | | | |
How did the Fund perform last year and what affected its performance?
The primary drivers of Fund performance versus the benchmark were an overweight to corporate bonds and the mortgage-backed securities (MBS) sector. Performance was also positively impacted by a yield advantage over the benchmark during the last year.
The Fund selectively added corporate bonds through the new issue market which continued to be robust but with lower new issue concessions. The Fund was overweight the financial sector versus the benchmark which helped relative corporate performance. Finally, the Fund owned high yield bonds which have performed well given an overall trend of tighter corporate spreads.
Within the securitized sector, the Fund was overweight thirty-year agency MBS versus the benchmark, especially the 4.5% to 5.5% coupon securities given wide nominal spreads. The Fund was underweight lower coupon MBS which hurt performance slightly given falling interest rates. The Fund is overweight asset-backed securities given attractive spreads versus short investment grade corporate bonds and Treasuries.
The Fund’s Treasury allocation had a slightly longer duration versus the benchmark, which helped performance over the trailing one-year period due to falling rates. Since October 2023, the two-year, ten-year and thirty-year Treasury yields decreased 92, 65 and 62 basis points, respectively.
Looking forward, the Fund will look to reduce exposure to corporate bonds given tight valuations. The Fund also will continue to shift into MBS as both relative and absolute valuations are attractive. Finally, the Fund will continue to have an underweight to the 20yr and 30yr section of the yield curve given the expectation of a steeper yield curve over the next 12 months.
| Core Bond Fund Class A | MBOAX |
Fund Performance
The chart below illustrates the total value of a hypothetical $10,000 investment in the Fund over the past 10 years (or for the life of the Fund if shorter).
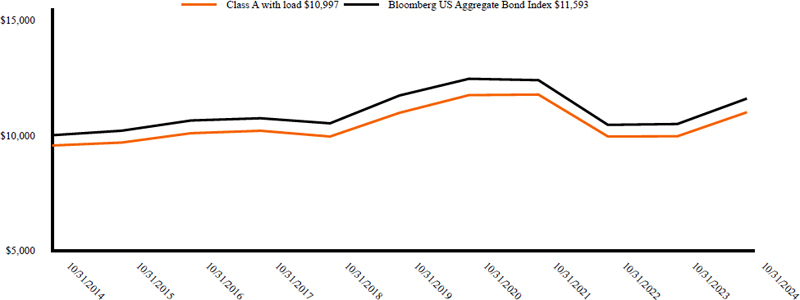
| Average Annual Total Returns (%) | |
| | 1 Year | 5 Years | 10 Years |
| Class A | 10.48% | 0.04% | 1.42% |
| Class A with load | 5.48% | (0.87%) | 0.95% |
| Bloomberg US Aggregate Bond Index | 10.55% | (0.23%) | 1.49% |
1. Fund returns are calculated after fund expenses have been subtracted and assume that dividends and capital gains are reinvested in additional shares of a fund. Returns do not reflect the deduction of taxes that a shareholder would pay on fund distributions or the redemption of fund shares. Investment return and principal value will fluctuate, so an investor's shares, when redeemed, may be worth more or less than original cost. Further information relating to the fund's performance is contained in the prospectus and elsewhere in this report. The fund's past performance is not indicative of future performance.
2. Maximum sales charge is 4.50% for Class A shares.
3. The Bloomberg US Aggregate Bond Index is a broad-based flagship benchmark that measures the investment grade, US dollar-denominated, fixed-rate taxable bond market.The index includes Treasuries, government-related and corporate securities, mortgage backed-securities, asset-backed securities and corporate securities, with maturities greater than one year.
| Key Fund Statistics (As of October 31, 2024) | | | | | | | | |
| Total Net Assets | | | | | | | $196,092,853 | |
| # of Portfolio Holdings | | | | | | | 371 | |
| Portfolio Turnover Rate | | | | | | | 23% | |
| Total Advisory Fees Paid | | | | | | | $740,044 | |
| Core Bond Fund Class A | MBOAX |
What does the Fund invest in?
The Fund invested primary in fixed income securities such as Corporate, U.S. Government, Foreign, Non-Rated debt securities. In additional the fund also invested in asset backed, mortgage-backed and commercial mortgage-backed securities.
| Top Ten Holdings (% of Net Assets) | | | |
| U.S. Treasury Notes, 4.000%, due 02/29/28 | | 2.8 | % |
| U.S. Treasury Notes, 4.625%, due 09/30/28 | | 2.5 | % |
| U.S. Treasury Notes, 2.625%, due 02/15/29 | | 2.2 | % |
| U.S. Treasury Notes, 3.875%, due 11/30/29 | | 2.0 | % |
| U.S. Treasury Bonds, 3.750%, due 08/15/41 | | 2.0 | % |
| U.S. Treasury Notes, 4.000%, due 02/15/34 | | 1.7 | % |
| Federal National Mortgage Association, 5.000%, due 12/01/52 | | 1.6 | % |
| Federal Home Loan Mortgage Corp., 2.500%, due 01/01/52 | | 1.5 | % |
| U.S. Treasury Notes, 2.875%, due 05/15/28 | | 1.5 | % |
| U.S. Treasury Notes, 4.375%, due 05/15/34 | | 1.4 | % |
| Portfolio Allocation (% of Net Assets) | | | |
| Mortgage Backed Securities | | 32.0 | % |
| U.S. Government and Agency Obligations | | 27.6 | % |
| Corporate Notes and Bonds | | 23.7 | % |
| Collateralized Mortgage Obligations | | 5.5 | % |
| Asset Backed Securities | | 4.0 | % |
| Foreign Corporate Bonds | | 2.7 | % |
| Short-Term Investments | | 2.4 | % |
| Commercial Mortgage-Backed Securities | | 2.1 | % |
| Other Assets and Liabilities, Net | | 0.0 | % |
Additional Information If you wish to view additional information about the Fund; including but not limited to financial statements or holdings, please visit www.madisonfunds.com/documents. Phone: 1-800-877-6089 |  |
| | Annual Shareholder Report
October 31, 2024 |
| Core Bond Fund Class A | MBOAX |
 | Annual Shareholder Report October 31, 2024 |
Core Bond Fund Class Y
Madison Core Bond Fund
MBOYX
Fund Overview
This annual shareholder report contains important information about Core Bond Fund Class Y for the period of November 1, 2023 to October 31, 2024. You can find additional information about the Fund at www.madisonfunds.com/documents. You can also request this information by contacting us at 1-800-877-6089.
What were the Fund costs for last year?
(based on a hypothetical $10,000 investment)
| | | Cost of a $10,000
investment | | | Costs paid as a
percentage of a
$10,000 investment | |
| Class Y | | | $63 | | | | 0.60% | |
| | | | | | | | | |
How did the Fund perform last year and what affected its performance?
The primary drivers of Fund performance versus the benchmark were an overweight to corporate bonds and the mortgage-backed securities (MBS) sector. Performance was also positively impacted by a yield advantage over the benchmark during the last year.
The Fund selectively added corporate bonds through the new issue market which continued to be robust but with lower new issue concessions. The Fund was overweight the financial sector versus the benchmark which helped relative corporate performance. Finally, the Fund owned high yield bonds which have performed well given an overall trend of tighter corporate spreads.
Within the securitized sector, the Fund was overweight thirty-year agency MBS versus the benchmark, especially the 4.5% to 5.5% coupon securities given wide nominal spreads. The Fund was underweight lower coupon MBS which hurt performance slightly given falling interest rates. The Fund is overweight asset-backed securities given attractive spreads versus short investment grade corporate bonds and Treasuries.
The Fund’s Treasury allocation had a slightly longer duration versus the benchmark, which helped performance over the trailing one-year period due to falling rates. Since October 2023, the two-year, ten-year and thirty-year Treasury yields decreased 92, 65 and 62 basis points, respectively.
Looking forward, the Fund will look to reduce exposure to corporate bonds given tight valuations. The Fund also will continue to shift into MBS as both relative and absolute valuations are attractive. Finally, the Fund will continue to have an underweight to the 20yr and 30yr section of the yield curve given the expectation of a steeper yield curve over the next 12 months.
| Core Bond Fund Class Y | MBOYX |
Fund Performance
The chart below illustrates the total value of a hypothetical $10,000 investment in the Fund over the past 10 years (or for the life of the Fund if shorter).
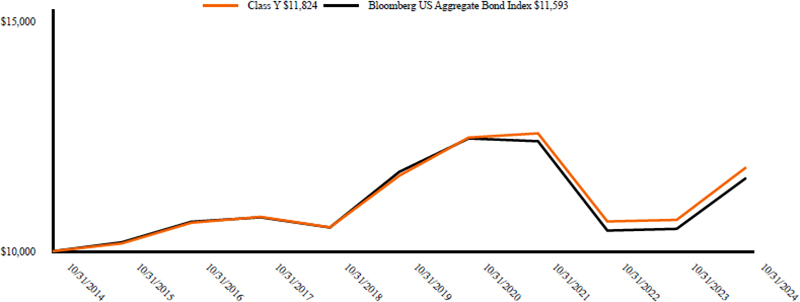
Average Annual Total Returns (%)
| | 1 Year | 5 Years | 10 Years |
| Class Y | 10.70% | 0.31% | 1.69% |
| Bloomberg US Aggregate Bond Index | 10.55% | (0.23%) | 1.49% |
1. Fund returns are calculated after fund expenses have been subtracted and assume that dividends and capital gains are reinvested in additional shares of a fund. Returns do not reflect the deduction of taxes that a shareholder would pay on fund distributions or the redemption of fund shares. Investment return and principal value will fluctuate, so an investor’s shares, when redeemed, may be worth more or less than original cost. Further information relating to the fund’s performance is contained in the prospectus and elsewhere in this report. The Fund’s past performance is not indicative of future performance.
2. The Bloomberg US Aggregate Bond Index is a broad-based flagship benchmark that measures the investment grade, US dollar-denominated, fixed-rate taxable bond market.The index includes Treasuries, government-related and corporate securities, mortgage backed-securities, asset-backed securities and corporate securities, with maturities greater than one year.
Key Fund Statistics (As of October 31, 2024)
| Total Net Assets | | | | | | | $196,092,853 | |
| # of Portfolio Holdings | | | | | | | 371 | |
| Portfolio Turnover Rate | | | | | | | 23% | |
| Total Advisory Fees Paid | | | | | | | $740,044 | |
| Core Bond Fund Class Y | MBOYX |
What does the Fund invest in?
The Fund invested primary in fixed income securities such as Corporate, U.S. Government, Foreign, Non-Rated debt securities. In additional the fund also invested in asset backed, mortgage-backed and commercial mortgage-backed securities.
Top Ten Holdings (% of Net Assets)
| U.S. Treasury Notes , 4.000%, due 02/29/28 | 2.8% |
| U.S. Treasury Notes , 4.625%, due 09/30/28 | 2.5% |
| U.S. Treasury Notes , 2.625%, due 02/15/29 | 2.2% |
| U.S. Treasury Notes , 3.875%, due 11/30/29 | 2.0% |
| U.S. Treasury Bonds , 3.750%, due 08/15/41 | 2.0% |
| U.S. Treasury Notes , 4.000%, due 02/15/34 | 1.7% |
| Federal National Mortgage Association , 5.000%, due 12/01/52 | 1.6% |
| Federal Home Loan Mortgage Corp. , 2.500%, due 01/01/52 | 1.5% |
| U.S. Treasury Notes , 2.875%, due 05/15/28 | 1.5% |
| U.S. Treasury Notes , 4.375%, due 05/15/34 | 1.4% |
Portfolio Allocation (% of Net Assets)
| Mortgage Backed Securities | 32.0% |
| U.S. Government and Agency Obligations | 27.6% |
| Corporate Notes and Bonds | 23.7% |
| Collateralized Mortgage Obligations | 5.5% |
| Asset Backed Securities | 4.0% |
| Foreign Corporate Bonds | 2.7% |
| Short-Term Investments | 2.4% |
| Commercial Mortgage-Backed Securities | 2.1% |
| Other Assets and Liabilities, Net | 0.0% |
Additional Information If you wish to view additional information about the Fund; including but not limited to financial statements or holdings, please visit www.madisonfunds.com/documents. Phone: 1-800-877-6089 |  |
| | Annual Shareholder Report
October 31, 2024 |
| Core Bond Fund Class Y | MBOYX |
 | Annual Shareholder Report October 31, 2024 |
| | |
Core Bond Fund Class I
Madison Core Bond Fund
MBOIX
Fund Overview
This annual shareholder report contains important information about Core Bond Fund Class I for the period of November 1, 2023 to October 31, 2024. You can find additional information about the Fund at www.madisonfunds.com/documents. You can also request this information by contacting us at 1-800-877-6089.
What were the Fund costs for last year?
(based on a hypothetical $10,000 investment)
| | | Cost of a $10,000
investment | | | Costs paid as a
percentage of a
$10,000 investment | |
| Class I | | | $53 | | | | 0.50% | |
| | | | | | | | | |
How did the Fund perform last year and what affected its performance?
The primary drivers of Fund performance versus the benchmark were an overweight to corporate bonds and the mortgage-backed securities (MBS) sector. Performance was also positively impacted by a yield advantage over the benchmark during the last year.
The Fund selectively added corporate bonds through the new issue market which continued to be robust but with lower new issue concessions. The Fund was overweight the financial sector versus the benchmark which helped relative corporate performance. Finally, the Fund owned high yield bonds which have performed well given an overall trend of tighter corporate spreads.
Within the securitized sector, the Fund was overweight thirty-year agency MBS versus the benchmark, especially the 4.5% to 5.5% coupon securities given wide nominal spreads. The Fund was underweight lower coupon MBS which hurt performance slightly given falling interest rates. The Fund is overweight asset-backed securities given attractive spreads versus short investment grade corporate bonds and Treasuries.
The Fund’s Treasury allocation had a slightly longer duration versus the benchmark, which helped performance over the trailing one-year period due to falling rates. Since October 2023, the two-year, ten-year and thirty-year Treasury yields decreased 92, 65 and 62 basis points, respectively.
Looking forward, the Fund will look to reduce exposure to corporate bonds given tight valuations. The Fund also will continue to shift into MBS as both relative and absolute valuations are attractive. Finally, the Fund will continue to have an underweight to the 20yr and 30yr section of the yield curve given the expectation of a steeper yield curve over the next 12 months.
| Core Bond Fund Class I | MBOIX |
Fund Performance
The chart below illustrates the total value of a hypothetical $250,000 investment in the Fund over the past 10 years (or for the life of the Fund if shorter).
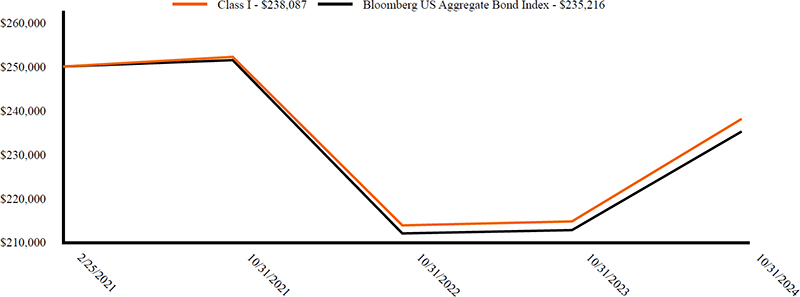
| Average Annual Total Returns (%) | |
| | |
| | 1 Year | Since Inception 2/26/21 |
| Class I | 10.86% | (1.32%) |
| Bloomberg US Aggregate Bond Index | 10.55% | (1.65%) |
1. Fund returns are calculated after fund expenses have been subtracted and assume that dividends and capital gains are reinvested in additional shares of a fund. Returns do not reflect the deduction of taxes that a shareholder would pay on fund distributions or the redemption of fund shares. Investment return and principal value will fluctuate, so an investor’s shares, when redeemed, may be worth more or less than original cost. Further information relating to the fund’s performance is contained in the prospectus and elsewhere in this report. The Fund’s past performance is not indicative of future performance.
2. The Bloomberg US Aggregate Bond Index is a broad-based flagship benchmark that measures the investment grade, US dollar-denominated, fixed-rate taxable bond market.The index includes Treasuries, government-related and corporate securities, mortgage backed-securities, asset-backed securities and corporate securities, with maturities greater than one year.
| Key Fund Statistics (As of October 31, 2024) | | | | | | | | |
| Total Net Assets | | | | | | | $196,092,853 | |
| # of Portfolio Holdings | | | | | | | 371 | |
| Portfolio Turnover Rate | | | | | | | 23% | |
| Total Advisory Fees Paid | | | | | | | $740,044 | |
| Core Bond Fund Class I | MBOIX |
What does the Fund invest in?
The Fund invested primary in fixed income securities such as Corporate, U.S. Government, Foreign, Non-Rated debt securities. In additional the fund also invested in asset backed, mortgage-backed and commercial mortgage-backed securities.
| Top Ten Holdings (% of Net Assets) | | | |
| U.S. Treasury Notes , 4.000%, due 02/29/28 | | 2.8 | % |
| U.S. Treasury Notes , 4.625%, due 09/30/28 | | 2.5 | % |
| U.S. Treasury Notes , 2.625%, due 02/15/29 | | 2.2 | % |
| U.S. Treasury Notes , 3.875%, due 11/30/29 | | 2.0 | % |
| U.S. Treasury Bonds , 3.750%, due 08/15/41 | | 2.0 | % |
| U.S. Treasury Notes , 4.000%, due 02/15/34 | | 1.7 | % |
| Federal National Mortgage Association , 5.000%, due 12/01/52 | | 1.6 | % |
| Federal Home Loan Mortgage Corp. , 2.500%, due 01/01/52 | | 1.5 | % |
| U.S. Treasury Notes , 2.875%, due 05/15/28 | | 1.5 | % |
| U.S. Treasury Notes , 4.375%, due 05/15/34 | | 1.4 | % |
| Portfolio Allocation (% of Net Assets) | | | |
| Mortgage Backed Securities | | 32.0 | % |
| U.S. Government and Agency Obligations | | 27.6 | % |
| Corporate Notes and Bonds | | 23.7 | % |
| Collateralized Mortgage Obligations | | 5.5 | % |
| Asset Backed Securities | | 4.0 | % |
| Foreign Corporate Bonds | | 2.7 | % |
| Short-Term Investments | | 2.4 | % |
| Commercial Mortgage-Backed Securities | | 2.1 | % |
| Other Assets and Liabilities, Net | | 0.0 | % |
Additional Information If you wish to view additional information about the Fund; including but not limited to financial statements or holdings, please visit www.madisonfunds.com/documents. Phone: 1-800-877-6089 |  |
| | Annual Shareholder Report
October 31, 2024 |
| Core Bond Fund Class I | MBOIX |
 | Annual Shareholder Report October 31, 2024 |
Core Bond Fund Class R6
Madison Core Bond Fund
MBORX
Fund Overview
This annual shareholder report contains important information about Core Bond Fund Class R6 for the period of November 1, 2023 to October 31, 2024. You can find additional information about the Fund at www.madisonfunds.com/documents. You can also request this information by contacting us at 1-800-877-6089.
What were the Fund costs for last year?
(based on a hypothetical $10,000 investment)
| | | Cost of a $10,000
investment | | | Costs paid as a
percentage of a
$10,000 investment | |
| Class R6 | | | $44 | | | | 0.42% | |
| | | | | | | | | |
How did the Fund perform last year and what affected its performance?
The primary drivers of Fund performance versus the benchmark were an overweight to corporate bonds and the mortgage-backed securities (MBS) sector. Performance was also positively impacted by a yield advantage over the benchmark during the last year.
The Fund selectively added corporate bonds through the new issue market which continued to be robust but with lower new issue concessions. The Fund was overweight the financial sector versus the benchmark which helped relative corporate performance. Finally, the Fund owned high yield bonds which have performed well given an overall trend of tighter corporate spreads.
Within the securitized sector, the Fund was overweight thirty-year agency MBS versus the benchmark, especially the 4.5% to 5.5% coupon securities given wide nominal spreads. The Fund was underweight lower coupon MBS which hurt performance slightly given falling interest rates. The Fund is overweight asset-backed securities given attractive spreads versus short investment grade corporate bonds and Treasuries.
The Fund’s Treasury allocation had a slightly longer duration versus the benchmark, which helped performance over the trailing one-year period due to falling rates. Since October 2023, the two-year, ten-year and thirty-year Treasury yields decreased 92, 65 and 62 basis points, respectively.
Looking forward, the Fund will look to reduce exposure to corporate bonds given tight valuations. The Fund also will continue to shift into MBS as both relative and absolute valuations are attractive. Finally, the Fund will continue to have an underweight to the 20yr and 30yr section of the yield curve given the expectation of a steeper yield curve over the next 12 months.
| Core Bond Fund Class R6 | MBORX |
Fund Performance
The chart below illustrates the total value of a hypothetical $500,000 investment in the Fund over the past 10 years (or for the life of the Fund if shorter).

Average Annual Total Returns (%)
| 1 Year | Since Inception 2/28/22 |
| Class R6 | 10.95% | (0.80%) |
| Bloomberg US Aggregate Bond Index | 10.55% | (1.27%) |
1. Fund returns are calculated after fund expenses have been subtracted and assume that dividends and capital gains are reinvested in additional shares of a fund. Returns do not reflect the deduction of taxes that a shareholder would pay on fund distributions or the redemption of fund shares. Investment return and principal value will fluctuate, so an investor's shares, when redeemed, may be worth more or less than original cost. Further information relating to the fund's performance is contained in the prospectus and elsewhere in this report. The Fund's past performance is not indicative of future performance.
2. The Bloomberg US Aggregate Bond Index is a broad-based flagship benchmark that measures the investment grade, US dollar-denominated, fixed-rate taxable bond market.The index includes Treasuries, government-related and corporate securities, mortgage backed-securities, asset-backed securities and corporate securities, with maturities greater than one year.
Key Fund Statistics (As of October 31, 2024)
| Total Net Assets | | | | | | | $196,092,853 |
| # of Portfolio Holdings | | | | | | | 371 | |
| Portfolio Turnover Rate | | | | | | | 23% | |
| Total Advisory Fees Paid | | | | | | | $740,044 | |
| Core Bond Fund Class R6 | MBORX |
What does the Fund invest in?
The Fund invested primary in fixed income securities such as Corporate, U.S. Government, Foreign, Non-Rated debt securities. In additional the fund also invested in asset backed, mortgage-backed and commercial mortgage-backed securities.
Top Ten Holdings (% of Net Assets)
| U.S. Treasury Notes , 4.000%, due 02/29/28 | 2.8% |
| U.S. Treasury Notes , 4.625%, due 09/30/28 | 2.5% |
| U.S. Treasury Notes , 2.625%, due 02/15/29 | 2.2% |
| U.S. Treasury Notes , 3.875%, due 11/30/29 | 2.0% |
| U.S. Treasury Bonds , 3.750%, due 08/15/41 | 2.0% |
| U.S. Treasury Notes , 4.000%, due 02/15/34 | 1.7% |
| Federal National Mortgage Association , 5.000%, due 12/01/52 | 1.6% |
| Federal Home Loan Mortgage Corp. , 2.500%, due 01/01/52 | 1.5% |
| U.S. Treasury Notes , 2.875%, due 05/15/28 | 1.5% |
| U.S. Treasury Notes , 4.375%, due 05/15/34 | 1.4% |
Portfolio Allocation (% of Net Assets)
| Mortgage Backed Securities | 32.0% |
| U.S. Government and Agency Obligations | 27.6% |
| Corporate Notes and Bonds | 23.7% |
| Collateralized Mortgage Obligations | 5.5% |
| Asset Backed Securities | 4.0% |
| Foreign Corporate Bonds | 2.7% |
| Short-Term Investments | 2.4% |
| Commercial Mortgage-Backed Securities | 2.1% |
| Other Assets and Liabilities, Net | 0.0% |
Additional Information If you wish to view additional information about the Fund; including but not limited to financial statements or holdings, please visit www.madisonfunds.com/documents. Phone: 1-800-877-6089 |  |
| | Annual Shareholder Report
October 31, 2024 |
| Core Bond Fund Class R6 | MBORX |
 | Annual Shareholder Report October 31, 2024 |
Covered Call & Equity Income Fund Class A
Madison Covered Call & Equity Income Fund
MENAX
Fund Overview
This annual shareholder report contains important information about Covered Call & Equity Income Fund Class A for the period of November 1, 2023 to October 31, 2024. You can find additional information about the Fund at www.madisonfunds.com/documents. You can also request this information by contacting us at 1-800-877-6089.
This report describes changes to the Fund that occurred during the reporting period.
What were the Fund costs for last year?
(based on a hypothetical $10,000 investment)
| | | Cost of a $10,000
investment | | | Costs paid as a
percentage of a
$10,000 investment | |
| Class A | | | $133 | | | | 1.26% | |
| | | | | | | | | |
How did the Fund perform last year and what affected its performance?
Both the S&P 500 and the S&P 500 BuyWrite Index were largely driven by an exceptional surge in a handful of the largest companies in the index. The Magnificent 7, as they have become known, rocketed higher by more that 66% over the period and, given their historically outsized weighting in the index, were the most prominent reason for the overall market’s significant rise. Given the Fund’s belief that these mega-cap companies are excessively valued, the Fund was meaningfully underweighted in the “Mag 7” stocks and this accounted a large portion of the Fund’s underperformance.
Relative to the S&P 500, sector allocation was detractive. The Fund’s underweight positions in the Technology sector and overweight positions in the Consumer Staples and Energy sectors were the primary culprits. Stock selection was also detractive; however, it was mainly due to what the Fund did not own, “Mag 7”. Among the Fund holdings that lagged, energy holdings, Apache and Transocean, underperformed as crude oil prices fell by 11% over the period. Archer Daniels Midland also lagged on weaker agricultural commodity prices and a lowering of growth forecasts in their nutrition segment. Health care and retail pharmacy company CVS was weaker on higher than expected medical cost in their HMO segment. Las Vegas Sand also lagged due to concerns over the potential stagnation of economic growth in China. The laggards were somewhat offset by strong performance from Microsoft, Target, Nordstrom, Starbucks and Danaher.
The Fund’s defensive call writing strategy was also detractive in such a strong, upward moving market as was the Fund’s cash positioning which was consistently pressure by a very high level of option assignments through the period. These areas are typically expected to lag in a very strong market environment.
| Covered Call & Equity Income Fund Class A | MENAX |
Fund Performance
The chart below illustrates the total value of a hypothetical $10,000 investment in the Fund over the past 10 years (or for the life of the Fund if shorter).

Average Annual Total Returns (%)
| | 1 Year | 5 Years | 10 Years |
| Class A | 11.01% | 11.37% | 7.14% |
| Class A with load | 4.63% | 10.06% | 6.51% |
| CBOE S&P 500 BuyWrite BXM PR USD | 18.52% | 6.05% | 6.39% |
| S&P 500 Index | 38.02% | 15.27% | 13.00% |
1. Fund returns are calculated after fund expenses have been subtracted and assume that dividends and capital gains are reinvested in additional shares of a fund. Returns do not reflect the deduction of taxes that a shareholder would pay on fund distributions or the redemption of fund shares. Investment return and principal value will fluctuate, so an investor's shares, when redeemed, may be worth more or less than original cost. Further information relating to the fund's performance is contained in the prospectus and elsewhere in this report. The fund's past performance is not indicative of future performance.
2. Maximum sales charge is 5.75% for Class A shares.
3. The CBOE S&P 500 BuyWrite Index (BXM) is a benchmark index designed to track the performance of a hypothetical buy-write strategy (i.e., holding a long position in and selling covered call options on that position) on the S&P 500 Index.
4. The S&P 500 Index is a large-cap market index which measures the performance of a representative sample of 500 leading companies in leading industries in the US .
Key Fund Statistics (As of October 31, 2024)
| Total Net Assets | | | | | | | $251,965,586 |
| # of Portfolio Holdings | | | | | | | 82 | |
| Portfolio Turnover Rate | | | | | | | 144% | |
| Total Advisory Fees Paid | | | | | | | $2,158,124 | |
| Covered Call & Equity Income Fund Class A | MENAX |
What does the Fund invest in?
The Fund invested in large- and mid-cap U.S. equities, as defined by the S&P 500 and Russell Midcap Index, respectively. To generate additional income, the Fund employed a covered call strategy, selling call options on some of its holdings to provide investment income and downside protection while maintaining equity exposure.
| Top Ten Holdings (% of Net Assets) | | | |
| Las Vegas Sands Corp. | | 4.4 | % |
| Medtronic PLC | | 3.0 | % |
| ConocoPhillips | | 3.0 | % |
| Barrick Gold Corp. | | 3.0 | % |
| Transocean Ltd. | | 2.9 | % |
| Honeywell International, Inc. | | 2.9 | % |
| Matador Resources Co. | | 2.8 | % |
| CME Group, Inc. | | 2.7 | % |
| PayPal Holdings, Inc. | | 2.6 | % |
| AES Corp. | | 2.5 | % |
| Portfolio Allocation (% of Net Assets) | | | |
| Short-Term Investments | | 24.2 | % |
| Health Care | | 15.5 | % |
| Consumer Staples | | 10.7 | % |
| Energy | | 10.7 | % |
| Industrials | | 8.7 | % |
| Financials | | 7.5 | % |
| Consumer Discretionary | | 5.8 | % |
| Communication Services | | 5.3 | % |
| Information Technology | | 4.9 | % |
| Materials | | 3.0 | % |
| Utilities | | 2.5 | % |
| Equity Real Estate Investment Trusts (REITs) | | 2.5 | % |
| Call Options Written | | (1.4 | %) |
| Other Assets and Liabilities, Net | | 0.1 | % |
Material Fund Changes
On November 6, 2024, the Board of Trustees of the Trust approved the termination of all outstanding Class C shares of the Madison Funds. Effective after the close of business on Friday, February 14, 2025, all Madison Covered Call & Equity Income Class C shares will be automatically converted to Class A shares. The conversion of Class C to Class A shares of the same fund is not a taxable event, and no contingent deferred sales charges will be assessed, if applicable, on this one-time conversion of shares.
This is a summary of certain planned changes to the Fund since October 31, 2024. For more complete information, you may review the Fund’s next prospectus, which we expect to be available by February 28th, 2025 at www.madisonfunds.com or upon request by calling 1-800-877-6089.
Additional Information If you wish to view additional information about the Fund; including but not limited to financial statements or holdings, please visit www.madisonfunds.com/documents. Phone: 1-800-877-6089 |  |
| | Annual Shareholder Report
October 31, 2024 |
| Covered Call & Equity Income Fund Class A | MENAX |
 | Annual Shareholder Report October 31, 2024 |
Covered Call & Equity Income Fund Class C
Madison Covered Call & Equity Income Fund
MENCX
Fund Overview
This annual shareholder report contains important information about Covered Call & Equity Income Fund Class C for the period of November 1, 2023 to October 31, 2024. You can find additional information about the Fund at www.madisonfunds.com/documents. You can also request this information by contacting us at 1-800-877-6089.
This report describes changes to the Fund that occurred during the reporting period.
What were the Fund costs for last year?
(based on a hypothetical $10,000 investment)
| | | Cost of a $10,000
investment | | | Costs paid as a
percentage of a
$10,000 investment | |
| Class C | | | $211 | | | | 2.01% | |
| | | | | | | | | |
How did the Fund perform last year and what affected its performance?
Both the S&P 500 and the S&P 500 BuyWrite Index were largely driven by an exceptional surge in a handful of the largest companies in the index. The Magnificent 7, as they have become known, rocketed higher by more that 66% over the period and, given their historically outsized weighting in the index, were the most prominent reason for the overall market’s significant rise. Given the Fund’s belief that these mega-cap companies are excessively valued, the Fund was meaningfully underweighted in the “Mag 7” stocks and this accounted a large portion of the Fund’s underperformance.
Relative to the S&P 500, sector allocation was detractive. The Fund’s underweight positions in the Technology sector and overweight positions in the Consumer Staples and Energy sectors were the primary culprits. Stock selection was also detractive; however, it was mainly due to what the Fund did not own, “Mag 7”. Among the Fund holdings that lagged, energy holdings, Apache and Transocean, underperformed as crude oil prices fell by 11% over the period. Archer Daniels Midland also lagged on weaker agricultural commodity prices and a lowering of growth forecasts in their nutrition segment. Health care and retail pharmacy company CVS was weaker on higher than expected medical cost in their HMO segment. Las Vegas Sand also lagged due to concerns over the potential stagnation of economic growth in China. The laggards were somewhat offset by strong performance from Microsoft, Target, Nordstrom, Starbucks and Danaher.
The Fund’s defensive call writing strategy was also detractive in such a strong, upward moving market as was the Fund’s cash positioning which was consistently pressure by a very high level of option assignments through the period. These areas are typically expected to lag in a very strong market environment.
| Covered Call & Equity Income Fund Class C | MENCX |
Fund Performance
The chart below illustrates the total value of a hypothetical $10,000 investment in the Fund over the past 10 years (or for the life of the Fund if shorter).
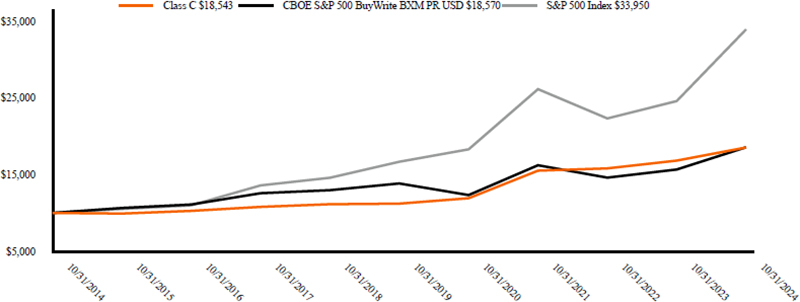
Average Annual Total Returns (%)
| | 1 Year | 5 Years | 10 Years |
| Class C | 10.19% | 10.58% | 6.37% |
| CBOE S&P 500 BuyWrite BXM PR USD | 18.52% | 6.05% | 6.39% |
| S&P 500 Index | 38.02% | 15.27% | 13.00% |
1. Fund returns are calculated after fund expenses have been subtracted and assume that dividends and capital gains are reinvested in additional shares of a fund. Returns do not reflect the deduction of taxes that a shareholder would pay on fund distributions or the redemption of fund shares. Investment return and principal value will fluctuate, so an investor’s shares, when redeemed, may be worth more or less than original cost. Further information relating to the fund’s performance is contained in the prospectus and elsewhere in this report. The Fund’s past performance is not indicative of future performance.
2. The CBOE S&P 500 BuyWrite Index (BXM) is a benchmark index designed to track the performance of a hypothetical buy-write strategy (i.e., holding a long position in and selling covered call options on that position) on the S&P 500 Index.
3. The S&P 500 Index is a large-cap market index which measures the performance of a representative sample of 500 leading companies in leading industries in the US .
Key Fund Statistics (As of October 31, 2024)
| Total Net Assets | | | | | | | $251,965,586 |
| # of Portfolio Holdings | | | | | | | 82 | |
| Portfolio Turnover Rate | | | | | | | 144% | |
| Total Advisory Fees Paid | | | | | | | $2,158,124 | |
| Covered Call & Equity Income Fund Class C | MENCX |
What does the Fund invest in?
The Fund invested in large- and mid-cap U.S. equities, as defined by the S&P 500 and Russell Midcap Index, respectively. To generate additional income, the Fund employed a covered call strategy, selling call options on some of its holdings to provide investment income and downside protection while maintaining equity exposure.
| Top Ten Holdings (% of Net Assets) | | | |
| Las Vegas Sands Corp. | | 4.4 | % |
| Medtronic PLC | | 3.0 | % |
| ConocoPhillips | | 3.0 | % |
| Barrick Gold Corp. | | 3.0 | % |
| Transocean Ltd. | | 2.9 | % |
| Honeywell International, Inc. | | 2.9 | % |
| Matador Resources Co. | | 2.8 | % |
| CME Group, Inc. | | 2.7 | % |
| PayPal Holdings, Inc. | | 2.6 | % |
| AES Corp. | | 2.5 | % |
| Portfolio Allocation (% of Net Assets) | | | |
| Short-Term Investments | | 24.2 | % |
| Health Care | | 15.5 | % |
| Consumer Staples | | 10.7 | % |
| Energy | | 10.7 | % |
| Industrials | | 8.7 | % |
| Financials | | 7.5 | % |
| Consumer Discretionary | | 5.8 | % |
| Communication Services | | 5.3 | % |
| Information Technology | | 4.9 | % |
| Materials | | 3.0 | % |
| Utilities | | 2.5 | % |
| Equity Real Estate Investment Trusts (REITs) | | 2.5 | % |
| Call Options Written | | (1.4 | %) |
| Other Assets and Liabilities, Net | | 0.1 | % |
Material Fund Changes
On November 6, 2024, the Board of Trustees of the Trust approved the termination of all outstanding Class C shares of the Madison Funds. Effective after the close of business on Friday, February 14, 2025, all Madison Covered Call & Equity Income Class C shares will be automatically converted to Class A shares. The conversion of Class C to Class A shares of the same fund is not a taxable event, and no contingent deferred sales charges will be assessed, if applicable, on this one-time conversion of shares.
This is a summary of certain planned changes to the Fund since October 31, 2024. For more complete information, you may review the Fund’s next prospectus, which we expect to be available by February 28th, 2025 at www.madisonfunds.com or upon request by calling 1-800-877-6089.
Additional Information If you wish to view additional information about the Fund; including but not limited to financial statements or holdings, please visit www.madisonfunds.com/documents. Phone: 1-800-877-6089 |  |
| | Annual Shareholder Report
October 31, 2024 |
| Covered Call & Equity Income Fund Class C | MENCX |
 | Annual Shareholder Report October 31, 2024 |
Covered Call & Equity Income Fund Class Y
Madison Covered Call & Equity Income Fund
MENYX
Fund Overview
This annual shareholder report contains important information about Covered Call & Equity Income Fund Class Y for the period of November 1, 2023 to October 31, 2024. You can find additional information about the Fund at www.madisonfunds.com/documents. You can also request this information by contacting us at 1-800-877-6089.
What were the Fund costs for last year?
(based on a hypothetical $10,000 investment)
| | | Cost of a $10,000
investment | | | Costs paid as a
percentage of a
$10,000 investment | |
| Class Y | | | $107 | | | | 1.01% | |
| | | | | | | | | |
How did the Fund perform last year and what affected its performance?
Both the S&P 500 and the S&P 500 BuyWrite Index were largely driven by an exceptional surge in a handful of the largest companies in the index. The Magnificent 7, as they have become known, rocketed higher by more that 66% over the period and, given their historically outsized weighting in the index, were the most prominent reason for the overall market’s significant rise. Given the Fund’s belief that these mega-cap companies are excessively valued, the Fund was meaningfully underweighted in the “Mag 7” stocks and this accounted a large portion of the Fund’s underperformance.
Relative to the S&P 500, sector allocation was detractive. The Fund’s underweight positions in the Technology sector and overweight positions in the Consumer Staples and Energy sectors were the primary culprits. Stock selection was also detractive; however, it was mainly due to what the Fund did not own, “Mag 7”. Among the Fund holdings that lagged, energy holdings, Apache and Transocean, underperformed as crude oil prices fell by 11% over the period. Archer Daniels Midland also lagged on weaker agricultural commodity prices and a lowering of growth forecasts in their nutrition segment. Health care and retail pharmacy company CVS was weaker on higher than expected medical cost in their HMO segment. Las Vegas Sand also lagged due to concerns over the potential stagnation of economic growth in China. The laggards were somewhat offset by strong performance from Microsoft, Target, Nordstrom, Starbucks and Danaher.
The Fund’s defensive call writing strategy was also detractive in such a strong, upward moving market as was the Fund’s cash positioning which was consistently pressure by a very high level of option assignments through the period. These areas are typically expected to lag in a very strong market environment.
| Covered Call & Equity Income Fund Class Y | MENYX |
Fund Performance
The chart below illustrates the total value of a hypothetical $10,000 investment in the Fund over the past 10 years (or for the life of the Fund if shorter).

| Average Annual Total Returns (%) | |
| | 1 Year | 5 Years | 10 Years |
| Class Y | 11.32% | 11.67% | 7.42% |
| CBOE S&P 500 BuyWrite BXM PR USD | 18.52% | 6.05% | 6.39% |
| S&P 500 Index | 38.02% | 15.27% | 13.00% |
1. Fund returns are calculated after fund expenses have been subtracted and assume that dividends and capital gains are reinvested in additional shares of a fund. Returns do not reflect the deduction of taxes that a shareholder would pay on fund distributions or the redemption of fund shares. Investment return and principal value will fluctuate, so an investor’s shares, when redeemed, may be worth more or less than original cost. Further information relating to the fund’s performance is contained in the prospectus and elsewhere in this report. The Fund’s past performance is not indicative of future performance.
2. The CBOE S&P 500 BuyWrite Index (BXM) is a benchmark index designed to track the performance of a hypothetical buy-write strategy (i.e., holding a long position in and selling covered call options on that position) on the S&P 500 Index.
3. The S&P 500 Index is a large-cap market index which measures the performance of a representative sample of 500 leading companies in leading industries in the US.
| Key Fund Statistics (As of October 31, 2024) | | | | | | | | |
| Total Net Assets | | | | | | | $251,965,586 | |
| # of Portfolio Holdings | | | | | | | 82 | |
| Portfolio Turnover Rate | | | | | | | 144% | |
| Total Advisory Fees Paid | | | | | | | $2,158,124 | |
| Covered Call & Equity Income Fund Class Y | MENYX |
What does the Fund invest in?
The Fund invested in large- and mid-cap U.S. equities, as defined by the S&P 500 and Russell Midcap Index, respectively. To generate additional income, the Fund employed a covered call strategy, selling call options on some of its holdings to provide investment income and downside protection while maintaining equity exposure.
| Top Ten Holdings (% of Net Assets) | | | |
| Las Vegas Sands Corp. | | 4.4 | % |
| Medtronic PLC | | 3.0 | % |
| ConocoPhillips | | 3.0 | % |
| Barrick Gold Corp. | | 3.0 | % |
| Transocean Ltd. | | 2.9 | % |
| Honeywell International, Inc. | | 2.9 | % |
| Matador Resources Co. | | 2.8 | % |
| CME Group, Inc. | | 2.7 | % |
| PayPal Holdings, Inc. | | 2.6 | % |
| AES Corp. | | 2.5 | % |
| Portfolio Allocation (% of Net Assets) | | | |
| Short-Term Investments | | 24.2 | % |
| Health Care | | 15.5 | % |
| Consumer Staples | | 10.7 | % |
| Energy | | 10.7 | % |
| Industrials | | 8.7 | % |
| Financials | | 7.5 | % |
| Consumer Discretionary | | 5.8 | % |
| Communication Services | | 5.3 | % |
| Information Technology | | 4.9 | % |
| Materials | | 3.0 | % |
| Utilities | | 2.5 | % |
| Equity Real Estate Investment Trusts (REITs) | | 2.5 | % |
| Call Options Written | | (1.4 | %) |
| Other Assets and Liabilities, Net | | 0.1 | % |
Additional Information If you wish to view additional information about the Fund; including but not limited to financial statements or holdings, please visit www.madisonfunds.com/documents. Phone: 1-800-877-6089 |  |
| | Annual Shareholder Report
October 31, 2024 |
| Covered Call & Equity Income Fund Class Y | MENYX |
| Annual Shareholder Report October 31, 2024 |
Covered Call & Equity Income Fund Class I
Madison Covered Call & Equity Income Fund
MENIX
Fund Overview
This annual shareholder report contains important information about Covered Call & Equity Income Fund Class I for the period of November 1, 2023 to October 31, 2024. You can find additional information about the Fund at www.madisonfunds.com/documents. You can also request this information by contacting us at 1-800-877-6089.
What were the Fund costs for last year?
(based on a hypothetical $10,000 investment)
| | | | Cost of a $10,000 investment | | | Costs paid as a percentage of a $10,000 investment | |
| Class I | | | $101 | | | 0.96% | |
| | | | | | | | |
How did the Fund perform last year and what affected its performance?
Both the S&P 500 and the S&P 500 BuyWrite Index were largely driven by an exceptional surge in a handful of the largest companies in the index. The Magnificent 7, as they have become known, rocketed higher by more that 66% over the period and, given their historically outsized weighting in the index, were the most prominent reason for the overall market’s significant rise. Given the Fund’s belief that these mega-cap companies are excessively valued, the Fund was meaningfully underweighted in the “Mag 7” stocks and this accounted a large portion of the Fund’s underperformance.
Relative to the S&P 500, sector allocation was detractive. The Fund’s underweight positions in the Technology sector and overweight positions in the Consumer Staples and Energy sectors were the primary culprits. Stock selection was also detractive; however, it was mainly due to what the Fund did not own, “Mag 7”. Among the Fund holdings that lagged, energy holdings, Apache and Transocean, underperformed as crude oil prices fell by 11% over the period. Archer Daniels Midland also lagged on weaker agricultural commodity prices and a lowering of growth forecasts in their nutrition segment. Health care and retail pharmacy company CVS was weaker on higher than expected medical cost in their HMO segment. Las Vegas Sand also lagged due to concerns over the potential stagnation of economic growth in China. The laggards were somewhat offset by strong performance from Microsoft, Target, Nordstrom, Starbucks and Danaher.
The Fund’s defensive call writing strategy was also detractive in such a strong, upward moving market as was the Fund’s cash positioning which was consistently pressure by a very high level of option assignments through the period. These areas are typically expected to lag in a very strong market environment.
| Covered Call & Equity Income Fund Class I | MENIX |
Fund Performance
The chart below illustrates the total value of a hypothetical $250,000 investment in the Fund over the past 10 years (or for the life of the Fund if shorter).
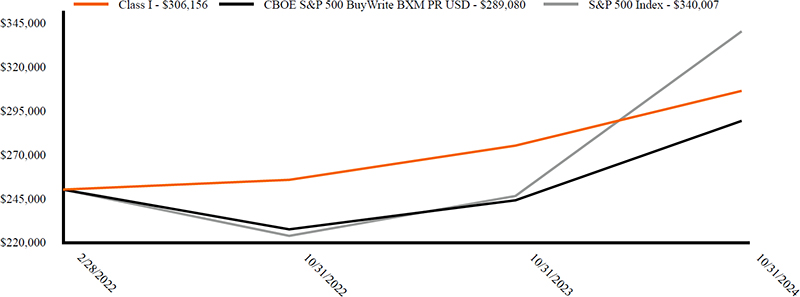
| Average Annual Total Returns (%) | | |
| | 1 Year | Since Inception 2/28/22 |
| Class I | 11.33% | 7.88% |
| CBOE S&P 500 BuyWrite BXM PR USD | 18.52% | 5.60% |
| S&P 500 Index | 38.02% | 12.22% |
1. Fund returns are calculated after fund expenses have been subtracted and assume that dividends and capital gains are reinvested in additional shares of a fund. Returns do not reflect the deduction of taxes that a shareholder would pay on fund distributions or the redemption of fund shares. Investment return and principal value will fluctuate, so an investor’s shares, when redeemed, may be worth more or less than original cost. Further information relating to the fund’s performance is contained in the prospectus and elsewhere in this report. The Fund’s past performance is not indicative of future performance.
2. The CBOE S&P 500 BuyWrite Index (BXM) is a benchmark index designed to track the performance of a hypothetical buy-write strategy (i.e., holding a long position in and selling covered call options on that position) on the S&P 500 Index.
3. The S&P 500 Index is a large-cap market index which measures the performance of a representative sample of 500 leading companies in leading industries in the US .
| Key Fund Statistics (As of October 31, 2024) | | | | | | | | |
| Total Net Assets | | | | | | | $251,965,586 | |
| # of Portfolio Holdings | | | | | | | 82 | |
| Portfolio Turnover Rate | | | | | | | 144% | |
| Total Advisory Fees Paid | | | | | | | $2,158,124 | |
| Covered Call & Equity Income Fund Class I | MENIX |
What does the Fund invest in?
The Fund invested in large- and mid-cap U.S. equities, as defined by the S&P 500 and Russell Midcap Index, respectively. To generate additional income, the Fund employed a covered call strategy, selling call options on some of its holdings to provide investment income and downside protection while maintaining equity exposure.
| Top Ten Holdings (% of Net Assets) | | | |
| Las Vegas Sands Corp. | | 4.4 | % |
| Medtronic PLC | | 3.0 | % |
| ConocoPhillips | | 3.0 | % |
| Barrick Gold Corp. | | 3.0 | % |
| Transocean Ltd. | | 2.9 | % |
| Honeywell International, Inc. | | 2.9 | % |
| Matador Resources Co. | | 2.8 | % |
| CME Group, Inc. | | 2.7 | % |
| PayPal Holdings, Inc. | | 2.6 | % |
| AES Corp. | | 2.5 | % |
| Portfolio Allocation (% of Net Assets) | | | |
| Short-Term Investments | | 24.2 | % |
| Health Care | | 15.5 | % |
| Consumer Staples | | 10.7 | % |
| Energy | | 10.7 | % |
| Industrials | | 8.7 | % |
| Financials | | 7.5 | % |
| Consumer Discretionary | | 5.8 | % |
| Communication Services | | 5.3 | % |
| Information Technology | | 4.9 | % |
| Materials | | 3.0 | % |
| Utilities | | 2.5 | % |
| Equity Real Estate Investment Trusts (REITs) | | 2.5 | % |
| Call Options Written | | (1.4 | %) |
| Other Assets and Liabilities, Net | | 0.1 | % |
Additional Information If you wish to view additional information about the Fund; including but not limited to financial statements or holdings, please visit www.madisonfunds.com/documents. Phone: 1-800-877-6089 |  |
| | Annual Shareholder Report October 31, 2024 |
| Covered Call & Equity Income Fund Class I | MENIX |
| Annual Shareholder Report October 31, 2024 |
Covered Call & Equity Income Fund Class R6
Madison Covered Call & Equity Income Fund
MENRX
Fund Overview
This annual shareholder report contains important information about Covered Call & Equity Income Fund Class R6 for the period of November 1, 2023 to October 31, 2024. You can find additional information about the Fund at www.madisonfunds.com/documents. You can also request this information by contacting us at 1-800-877-6089.
What were the Fund costs for last year?
(based on a hypothetical $10,000 investment)
| | | Cost of a $10,000
investment | | | Costs paid as a
percentage of a
$10,000 investment | |
| Class R6 | | | $93 | | | | 0.88% | |
| | | | | | | | | |
How did the Fund perform last year and what affected its performance?
Both the S&P 500 and the S&P 500 BuyWrite Index were largely driven by an exceptional surge in a handful of the largest companies in the index. The Magnificent 7, as they have become known, rocketed higher by more that 66% over the period and, given their historically outsized weighting in the index, were the most prominent reason for the overall market’s significant rise. Given the Fund’s belief that these mega-cap companies are excessively valued, the Fund was meaningfully underweighted in the “Mag 7” stocks and this accounted a large portion of the Fund’s underperformance.
Relative to the S&P 500, sector allocation was detractive. The Fund’s underweight positions in the Technology sector and overweight positions in the Consumer Staples and Energy sectors were the primary culprits. Stock selection was also detractive; however, it was mainly due to what the Fund did not own, “Mag 7”. Among the Fund holdings that lagged, energy holdings, Apache and Transocean, underperformed as crude oil prices fell by 11% over the period. Archer Daniels Midland also lagged on weaker agricultural commodity prices and a lowering of growth forecasts in their nutrition segment. Health care and retail pharmacy company CVS was weaker on higher than expected medical cost in their HMO segment. Las Vegas Sand also lagged due to concerns over the potential stagnation of economic growth in China. The laggards were somewhat offset by strong performance from Microsoft, Target, Nordstrom, Starbucks and Danaher.
The Fund’s defensive call writing strategy was also detractive in such a strong, upward moving market as was the Fund’s cash positioning which was consistently pressure by a very high level of option assignments through the period. These areas are typically expected to lag in a very strong market environment.
| Covered Call & Equity Income Fund Class R6 | MENRX |
Fund Performance
The chart below illustrates the total value of a hypothetical $500,000 investment in the Fund over the past 10 years (or for the life of the Fund if shorter).

| Average Annual Total Returns (%) | | | |
| | | | |
| | 1 Year | 5 Years | 10 Years |
| Class R6 | 11.44% | 11.82% | 7.57% |
| CBOE S&P 500 BuyWrite BXM PR USD | 18.52% | 6.05% | 6.39% |
| S&P 500 Index | 38.02% | 15.27% | 13.00% |
1. Fund returns are calculated after fund expenses have been subtracted and assume that dividends and capital gains are reinvested in additional shares of a fund. Returns do not reflect the deduction of taxes that a shareholder would pay on fund distributions or the redemption of fund shares. Investment return and principal value will fluctuate, so an investor’s shares, when redeemed, may be worth more or less than original cost. Further information relating to the fund’s performance is contained in the prospectus and elsewhere in this report. The Fund’s past performance is not indicative of future performance.
2. The CBOE S&P 500 BuyWrite Index (BXM) is a benchmark index designed to track the performance of a hypothetical buy-write strategy (i.e., holding a long position in and selling covered call options on that position) on the S&P 500 Index.
3. The S&P 500 Index is a large-cap market index which measures the performance of a representative sample of 500 leading companies in leading industries in the US .
| Key Fund Statistics (As of October 31, 2024) | | | | | | | | |
| Total Net Assets | | | | | | | $251,965,586 | |
| # of Portfolio Holdings | | | | | | | 82 | |
| Portfolio Turnover Rate | | | | | | | 144% | |
| Total Advisory Fees Paid | | | | | | | $2,158,124 | |
| Covered Call & Equity Income Fund Class R6 | MENRX |
What does the Fund invest in?
The Fund invested in large- and mid-cap U.S. equities, as defined by the S&P 500 and Russell Midcap Index, respectively. To generate additional income, the Fund employed a covered call strategy, selling call options on some of its holdings to provide investment income and downside protection while maintaining equity exposure.
| Top Ten Holdings (% of Net Assets) | | | |
| Las Vegas Sands Corp. | | 4.4 | % |
| Medtronic PLC | | 3.0 | % |
| ConocoPhillips | | 3.0 | % |
| Barrick Gold Corp. | | 3.0 | % |
| Transocean Ltd. | | 2.9 | % |
| Honeywell International, Inc. | | 2.9 | % |
| Matador Resources Co. | | 2.8 | % |
| CME Group, Inc. | | 2.7 | % |
| PayPal Holdings, Inc. | | 2.6 | % |
| AES Corp. | | 2.5 | % |
| Portfolio Allocation (% of Net Assets) | | | |
| Short-Term Investments | | 24.2 | % |
| Health Care | | 15.5 | % |
| Consumer Staples | | 10.7 | % |
| Energy | | 10.7 | % |
| Industrials | | 8.7 | % |
| Financials | | 7.5 | % |
| Consumer Discretionary | | 5.8 | % |
| Communication Services | | 5.3 | % |
| Information Technology | | 4.9 | % |
| Materials | | 3.0 | % |
| Utilities | | 2.5 | % |
| Equity Real Estate Investment Trusts (REITs) | | 2.5 | % |
| Call Options Written | | (1.4 | %) |
| Other Assets and Liabilities, Net | | 0.1 | % |
Additional Information If you wish to view additional information about the Fund; including but not limited to financial statements or holdings, please visit www.madisonfunds.com/documents. Phone: 1-800-877-6089 |  |
| | Annual Shareholder Report October 31, 2024 |
| Covered Call & Equity Income Fund Class R6 | MENRX |
 | Annual Shareholder Report October 31, 2024 |
Dividend Income Fund Class A
Madison Dividend Income Fund
MADAX
Fund Overview
This annual shareholder report contains important information about Dividend Income Fund Class A for the period of November 1, 2023 to October 31, 2024. You can find additional information about the Fund at www.madisonfunds.com/documents. You can also request this information by contacting us at 1-800-877-6089.
What were the Fund costs for last year?
(based on a hypothetical $10,000 investment)
| | | Cost of a $10,000
investment | | | Costs paid as a
percentage of a
$10,000 investment | |
| Class A | | | $128 | | | | 1.16% | |
| | | | | | | | | |
How did the Fund perform last year and what affected its performance?
Relative to the index, sector allocation and stock selection were detractive to results. For sector allocation, an overweight position in Energy and an underweight position in Technology negatively impacted performance. In terms of stock selection, there were positive results in Financials and Utilities, which was more than offset by weakness in Consumer Staples, Technology, Communication Services, Industrials, Health Care and Materials. Within Financials, wealth management firm Morgan Stanley (MS) was the most additive stock in the portfolio, and asset manager BlackRock (BLK) and regional bank U.S. Bancorp (USB) also contributed nicely to results. In Health Care, pharmaceutical maker AbbVie (ABBV) was a notable outperforming stock. Another outperforming stock was construction equipment manufacturer Caterpillar (CAT) in Industrials.
In general, these stocks had improved underlying fundamentals that benefited their businesses. On the negative side, in Consumer Staples, agricultural processor Archer-Daniels-Midland (ADM) was the most detractive stock in the portfolio. In Energy, exploration and production firm EOG Resources (EOG) negatively impacted performance. Within Health Care, pharmaceutical companies Bristol Myers-Squibb (BMY) was a notable underperforming stock. Other notable underperforming stocks were exchange operator CME Group (CME) in Financials and industrial gas supplier Air Products (APD) in Materials. In general, these stocks had weak earnings results and deterioration in their businesses. The fund continues to hold all stocks mentioned above except for ADM and BMY.
| Dividend Income Fund Class A | MADAX |
Fund Performance
The chart below illustrates the total value of a hypothetical $10,000 investment in the Fund over the past 10 years (or for the life of the Fund if shorter).

| Average Annual Total Returns (%) |
| | 1 Year | Since Inception 5/29/2020 |
| Class A | 21.41% | 10.04% |
| Class A with load | 14.41% | 8.57% |
| Russell 1000 Value Index | 30.98% | 14.45% |
| Lipper Equity Income Funds Index | 29.06% | 13.85% |
| S&P 500 Index | 38.02% | 17.07% |
1. Fund returns are calculated after fund expenses have been subtracted and assume that dividends and capital gains are reinvested in additional shares of a fund. Returns do not reflect the deduction of taxes that a shareholder would pay on fund distributions or the redemption of fund shares. Investment return and principal value will fluctuate, so an investor’s shares, when redeemed, may be worth more or less than original cost. Further information relating to the fund’s performance is contained in the prospectus and elsewhere in this report. The fund’s past performance is not indicative of future performance.
2. Maximum sales charge is 5.75% for Class A shares.
3. The Russell 1000 Value Index is a large-cap market index which measures the performance of those Russell 1000 companies with lower price-to-book ratios and lower forecasted growth values.
4. The Lipper US Index - Equity Income Funds Index tracks the performance of funds that, by prospectus language and portfolio practice, seek relatively high current income and growth of income by investing at least 65% of their portfolio weight in dividend-paying equity securities. The index is composed of the 30 largest funds by asset size in the Lipper investment objective category.
5. The S&P 500 Index is a large-cap market index which measures the performance of a representative sample of 500 leading companies in leading industries in the US.
| Key Fund Statistics (As of October 31, 2024) | | | | | | | | |
| Total Net Assets | | | | | | | $148,930,034 | |
| # of Portfolio Holdings | | | | | | | 38 | |
| Portfolio Turnover Rate | | | | | | | 28% | |
| Total Advisory Fees Paid | | | | | | | $1,183,103 | |
| Dividend Income Fund Class A | MADAX |
What does the Fund invest in?
The Fund invested in equity securities with a market capitalization of over a $1 billion and a history of paying dividends.
| Top Ten Holdings (% of Net Assets) | | | |
| Automatic Data Processing, Inc. | | 4.3 | % |
| Morgan Stanley | | 4.2 | % |
| NextEra Energy, Inc. | | 4.2 | % |
| Fastenal Co. | | 4.1 | % |
| Home Depot, Inc. | | 3.8 | % |
| Blackrock, Inc. | | 3.7 | % |
| Medtronic PLC | | 3.7 | % |
| Texas Instruments, Inc. | | 3.5 | % |
| CME Group, Inc. | | 3.5 | % |
| Johnson & Johnson | | 3.4 | % |
| Portfolio Allocation (% of Net Assets) | | | |
| Financials | | 20.8 | % |
| Industrials | | 19.4 | % |
| Health Care | | 12.2 | % |
| Energy | | 10.0 | % |
| Consumer Discretionary | | 9.7 | % |
| Consumer Staples | | 7.8 | % |
| Information Technology | | 6.0 | % |
| Utilities | | 4.2 | % |
| Communication Services | | 3.4 | % |
| Equity Real Estate Investment Trusts (REITs) | | 2.8 | % |
| Materials | | 2.2 | % |
| Short-Term Investments | | 1.6 | % |
| Other Assets and Liabilities, Net | | (0.1 | %) |
Additional Information If you wish to view additional information about the Fund; including but not limited to financial statements or holdings, please visit www.madisonfunds.com/documents. Phone: 1-800-877-6089 |  |
| | Annual Shareholder Report
October 31, 2024 |
| Dividend Income Fund Class A | MADAX |
 | Annual Shareholder Report October 31, 2024 |
Dividend Income Fund Class Y
Madison Dividend Income Fund
BHBFX
Fund Overview
This annual shareholder report contains important information about Dividend Income Fund Class Y for the period of November 1, 2023 to October 31, 2024. You can find additional information about the Fund at www.madisonfunds.com/documents. You can also request this information by contacting us at 1-800-877-6089.
What were the Fund costs for last year?
(based on a hypothetical $10,000 investment)
| | | Cost of a $10,000
investment | | | Costs paid as a
percentage of a
$10,000 investment | |
| Class Y | | | $101 | | | | 0.91% | |
| | | | | | | | | |
How did the Fund perform last year and what affected its performance?
Relative to the index, sector allocation and stock selection were detractive to results. For sector allocation, an overweight position in Energy and an underweight position in Technology negatively impacted performance. In terms of stock selection, there were positive results in Financials and Utilities, which was more than offset by weakness in Consumer Staples, Technology, Communication Services, Industrials, Health Care and Materials. Within Financials, wealth management firm Morgan Stanley (MS) was the most additive stock in the portfolio, and asset manager BlackRock (BLK) and regional bank U.S. Bancorp (USB) also contributed nicely to results. In Health Care, pharmaceutical maker AbbVie (ABBV) was a notable outperforming stock. Another outperforming stock was construction equipment manufacturer Caterpillar (CAT) in Industrials.
In general, these stocks had improved underlying fundamentals that benefited their businesses. On the negative side, in Consumer Staples, agricultural processor Archer-Daniels-Midland (ADM) was the most detractive stock in the portfolio. In Energy, exploration and production firm EOG Resources (EOG) negatively impacted performance. Within Health Care, pharmaceutical companies Bristol Myers-Squibb (BMY) was a notable underperforming stock. Other notable underperforming stocks were exchange operator CME Group (CME) in Financials and industrial gas supplier Air Products (APD) in Materials. In general, these stocks had weak earnings results and deterioration in their businesses. The fund continues to hold all stocks mentioned above except for ADM and BMY.
| Dividend Income Fund Class Y | BHBFX |
Fund Performance
The chart below illustrates the total value of a hypothetical $10,000 investment in the Fund over the past 10 years (or for the life of the Fund if shorter).

| Average Annual Total Returns (%) | |
| | |
| | 1 Year | 5 Years | 10 Years |
| Class Y | 21.65% | 7.76% | 9.02% |
| Russell 1000 Value Index | 30.98% | 10.14% | 9.25% |
| Lipper Equity Income Funds Index | 29.06% | 10.46% | 9.25% |
| S&P 500 Index | 38.02% | 15.27% | 13.00% |
1. Fund returns are calculated after fund expenses have been subtracted and assume that dividends and capital gains are reinvested in additional shares of a fund. Returns do not reflect the deduction of taxes that a shareholder would pay on fund distributions or the redemption of fund shares. Investment return and principal value will fluctuate, so an investor’s shares, when redeemed, may be worth more or less than original cost. Further information relating to the fund’s performance is contained in the prospectus and elsewhere in this report. The Fund’s past performance is not indicative of future performance.
2. The Russell 1000 Value Index is a large-cap market index which measures the performance of those Russell 1000 companies with lower price-to-book ratios and lower forecasted growth values.
3. The Lipper US Index - Equity Income Funds Index tracks the performance of funds that, by prospectus language and portfolio practice, seek relatively high current income and growth of income by investing at least 65% of their portfolio weight in dividend-paying equity securities. The index is composed of the 30 largest funds by asset size in the Lipper investment objective category.
4. The S&P 500 Index is a large-cap market index which measures the performance of a representative sample of 500 leading companies in leading industries in the US .
| Key Fund Statistics (As of October 31, 2024) | | | | | | | | |
| Total Net Assets | | | | | | | $148,930,034 | |
| # of Portfolio Holdings | | | | | | | 38 | |
| Portfolio Turnover Rate | | | | | | | 28% | |
| Total Advisory Fees Paid | | | | | | | $1,183,103 | |
| Dividend Income Fund Class Y | BHBFX |
What does the Fund invest in?
The Fund invested in equity securities with a market capitalization of over a $1 billion and a history of paying dividends.
| Top Ten Holdings (% of Net Assets) | | | |
| Automatic Data Processing, Inc. | | 4.3 | % |
| Morgan Stanley | | 4.2 | % |
| NextEra Energy, Inc. | | 4.2 | % |
| Fastenal Co. | | 4.1 | % |
| Home Depot, Inc. | | 3.8 | % |
| Blackrock, Inc. | | 3.7 | % |
| Medtronic PLC | | 3.7 | % |
| Texas Instruments, Inc. | | 3.5 | % |
| CME Group, Inc. | | 3.5 | % |
| Johnson & Johnson | | 3.4 | % |
| Portfolio Allocation (% of Net Assets) | | | |
| Financials | | 20.8 | % |
| Industrials | | 19.4 | % |
| Health Care | | 12.2 | % |
| Energy | | 10.0 | % |
| Consumer Discretionary | | 9.7 | % |
| Consumer Staples | | 7.8 | % |
| Information Technology | | 6.0 | % |
| Utilities | | 4.2 | % |
| Communication Services | | 3.4 | % |
| Equity Real Estate Investment Trusts (REITs) | | 2.8 | % |
| Materials | | 2.2 | % |
| Short-Term Investments | | 1.6 | % |
| Other Assets and Liabilities, Net | | (0.1 | %) |
Additional Information If you wish to view additional information about the Fund; including but not limited to financial statements or holdings, please visit www.madisonfunds.com/documents. Phone: 1-800-877-6089 |  |
| | Annual Shareholder Report
October 31, 2024 |
| Dividend Income Fund Class Y | BHBFX |
 | Annual Shareholder Report October 31, 2024 |
Dividend Income Fund Class I
Madison Dividend Income Fund
MDMIX
Fund Overview
This annual shareholder report contains important information about Dividend Income Fund Class I for the period of November 1, 2023 to October 31, 2024. You can find additional information about the Fund at www.madisonfunds.com/documents. You can also request this information by contacting us at 1-800-877-6089.
What were the Fund costs for last year?
(based on a hypothetical $10,000 investment)
| | | Cost of a $10,000
investment | | | Costs paid as a
percentage of a
$10,000 investment | |
| Class I | | | $90 | | | | 0.81% | |
| | | | | | | | | |
How did the Fund perform last year and what affected its performance?
Relative to the index, sector allocation and stock selection were detractive to results. For sector allocation, an overweight position in Energy and an underweight position in Technology negatively impacted performance. In terms of stock selection, there were positive results in Financials and Utilities, which was more than offset by weakness in Consumer Staples, Technology, Communication Services, Industrials, Health Care and Materials. Within Financials, wealth management firm Morgan Stanley (MS) was the most additive stock in the portfolio, and asset manager BlackRock (BLK) and regional bank U.S. Bancorp (USB) also contributed nicely to results. In Health Care, pharmaceutical maker AbbVie (ABBV) was a notable outperforming stock. Another outperforming stock was construction equipment manufacturer Caterpillar (CAT) in Industrials.
In general, these stocks had improved underlying fundamentals that benefited their businesses. On the negative side, in Consumer Staples, agricultural processor Archer-Daniels-Midland (ADM) was the most detractive stock in the portfolio. In Energy, exploration and production firm EOG Resources (EOG) negatively impacted performance. Within Health Care, pharmaceutical companies Bristol Myers-Squibb (BMY) was a notable underperforming stock. Other notable underperforming stocks were exchange operator CME Group (CME) in Financials and industrial gas supplier Air Products (APD) in Materials. In general, these stocks had weak earnings results and deterioration in their businesses. The fund continues to hold all stocks mentioned above except for ADM and BMY.
| Dividend Income Fund Class I | MDMIX |
Fund Performance
The chart below illustrates the total value of a hypothetical $250,000 investment in the Fund over the past 10 years (or for the life of the Fund if shorter).
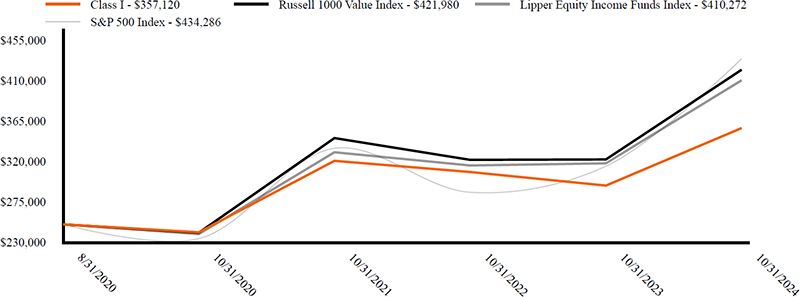
| Average Annual Total Returns (%) |
| |
| | 1 Year | Since Inception 8/31/20 |
| Class I | 21.84% | 8.93% |
| Russell 1000 Value Index | 30.98% | 13.39% |
| Lipper Equity Income Funds Index | 29.06% | 12.62% |
| S&P 500 Index | 38.02% | 14.17% |
1. Fund returns are calculated after fund expenses have been subtracted and assume that dividends and capital gains are reinvested in additional shares of a fund. Returns do not reflect the deduction of taxes that a shareholder would pay on fund distributions or the redemption of fund shares. Investment return and principal value will fluctuate, so an investor’s shares, when redeemed, may be worth more or less than original cost. Further information relating to the fund’s performance is contained in the prospectus and elsewhere in this report. The Fund’s past performance is not indicative of future performance.
2. The Russell 1000 Value Index is a large-cap market index which measures the performance of those Russell 1000 companies with lower price-to-book ratios and lower forecasted growth values.
3. The Lipper US Index - Equity Income Funds Index tracks the performance of funds that, by prospectus language and portfolio practice, seek relatively high current income and growth of income by investing at least 65% of their portfolio weight in dividend-paying equity securities. The index is composed of the 30 largest funds by asset size in the Lipper investment objective category.
4. The S&P 500 Index is a large-cap market index which measures the performance of a representative sample of 500 leading companies in leading industries in the US.
| Key Fund Statistics (As of October 31, 2024) | | | | | | | | |
| Total Net Assets | | | | | | | $148,930,034 | |
| # of Portfolio Holdings | | | | | | | 38 | |
| Portfolio Turnover Rate | | | | | | | 28% | |
| Total Advisory Fees Paid | | | | | | | $1,183,103 | |
| Dividend Income Fund Class I | MDMIX |
What does the Fund invest in?
The Fund invested in equity securities with a market capitalization of over a $1 billion and a history of paying dividends.
| Top Ten Holdings (% of Net Assets) | | | |
| Automatic Data Processing, Inc. | | 4.3 | % |
| Morgan Stanley | | 4.2 | % |
| NextEra Energy, Inc. | | 4.2 | % |
| Fastenal Co. | | 4.1 | % |
| Home Depot, Inc. | | 3.8 | % |
| Blackrock, Inc. | | 3.7 | % |
| Medtronic PLC | | 3.7 | % |
| Texas Instruments, Inc. | | 3.5 | % |
| CME Group, Inc. | | 3.5 | % |
| Johnson & Johnson | | 3.4 | % |
| Portfolio Allocation (% of Net Assets) | | | |
| Financials | | 20.8 | % |
| Industrials | | 19.4 | % |
| Health Care | | 12.2 | % |
| Energy | | 10.0 | % |
| Consumer Discretionary | | 9.7 | % |
| Consumer Staples | | 7.8 | % |
| Information Technology | | 6.0 | % |
| Utilities | | 4.2 | % |
| Communication Services | | 3.4 | % |
| Equity Real Estate Investment Trusts (REITs) | | 2.8 | % |
| Materials | | 2.2 | % |
| Short-Term Investments | | 1.6 | % |
| Other Assets and Liabilities, Net | | (0.1 | %) |
Additional Information If you wish to view additional information about the Fund; including but not limited to financial statements or holdings, please visit www.madisonfunds.com/documents. Phone: 1-800-877-6089 |  |
| | Annual Shareholder Report
October 31, 2024 |
| Dividend Income Fund Class I | MDMIX |
 | Annual Shareholder Report October 31, 2024 |
Dividend Income Fund Class R6
Madison Dividend Income Fund
MADRX
Fund Overview
This annual shareholder report contains important information about Dividend Income Fund Class R6 for the period of November 1, 2023 to October 31, 2024. You can find additional information about the Fund at www.madisonfunds.com/documents. You can also request this information by contacting us at 1-800-877-6089.
What were the Fund costs for last year?
(based on a hypothetical $10,000 investment)
| | | Cost of a $10,000
investment | | | Costs paid as a
percentage of a
$10,000 investment | |
| Class R6 | | | $81 | | | | 0.73% | |
| | | | | | | | | |
How did the Fund perform last year and what affected its performance?
Relative to the index, sector allocation and stock selection were detractive to results. For sector allocation, an overweight position in Energy and an underweight position in Technology negatively impacted performance. In terms of stock selection, there were positive results in Financials and Utilities, which was more than offset by weakness in Consumer Staples, Technology, Communication Services, Industrials, Health Care and Materials. Within Financials, wealth management firm Morgan Stanley (MS) was the most additive stock in the portfolio, and asset manager BlackRock (BLK) and regional bank U.S. Bancorp (USB) also contributed nicely to results. In Health Care, pharmaceutical maker AbbVie (ABBV) was a notable outperforming stock. Another outperforming stock was construction equipment manufacturer Caterpillar (CAT) in Industrials.
In general, these stocks had improved underlying fundamentals that benefited their businesses. On the negative side, in Consumer Staples, agricultural processor Archer-Daniels-Midland (ADM) was the most detractive stock in the portfolio. In Energy, exploration and production firm EOG Resources (EOG) negatively impacted performance. Within Health Care, pharmaceutical companies Bristol Myers-Squibb (BMY) was a notable underperforming stock. Other notable underperforming stocks were exchange operator CME Group (CME) in Financials and industrial gas supplier Air Products (APD) in Materials. In general, these stocks had weak earnings results and deterioration in their businesses. The fund continues to hold all stocks mentioned above except for ADM and BMY.
| Dividend Income Fund Class R6 | MADRX |
Fund Performance
The chart below illustrates the total value of a hypothetical $500,000 investment in the Fund over the past 10 years (or for the life of the Fund if shorter).

| Average Annual Total Returns (%) |
| |
| | 1 Year | Since Inception 2/28/22 |
| Class R6 | 21.88% | 4.01% |
| Russell 1000 Value Index | 30.98% | 8.14% |
| Lipper Equity Income Funds Index | 29.06% | 8.41% |
| S&P 500 Index | 38.02% | 12.22% |
1. Fund returns are calculated after fund expenses have been subtracted and assume that dividends and capital gains are reinvested in additional shares of a fund. Returns do not reflect the deduction of taxes that a shareholder would pay on fund distributions or the redemption of fund shares. Investment return and principal value will fluctuate, so an investor’s shares, when redeemed, may be worth more or less than original cost. Further information relating to the fund’s performance is contained in the prospectus and elsewhere in this report. The Fund’s past performance is not indicative of future performance.
2. The Russell 1000 Value Index is a large-cap market index which measures the performance of those Russell 1000 companies with lower price-to-book ratios and lower forecasted growth values.
3. The Lipper US Index - Equity Income Funds Index tracks the performance of funds that, by prospectus language and portfolio practice, seek relatively high current income and growth of income by investing at least 65% of their portfolio weight in dividend-paying equity securities. The index is composed of the 30 largest funds by asset size in the Lipper investment objective category.
4. The S&P 500 Index is a large-cap market index which measures the performance of a representative sample of 500 leading companies in leading industries in the US.
| Key Fund Statistics (As of October 31, 2024) | | | | | | | | |
| Total Net Assets | | | | | | | $148,930,034 | |
| # of Portfolio Holdings | | | | | | | 38 | |
| Portfolio Turnover Rate | | | | | | | 28% | |
| Total Advisory Fees Paid | | | | | | | $1,183,103 | |
| Dividend Income Fund Class R6 | MADRX |
What does the Fund invest in?
The Fund invested in equity securities with a market capitalization of over a $1 billion and a history of paying dividends.
| Top Ten Holdings (% of Net Assets) | | | |
| Automatic Data Processing, Inc. | | 4.3 | % |
| Morgan Stanley | | 4.2 | % |
| NextEra Energy, Inc. | | 4.2 | % |
| Fastenal Co. | | 4.1 | % |
| Home Depot, Inc. | | 3.8 | % |
| Blackrock, Inc. | | 3.7 | % |
| Medtronic PLC | | 3.7 | % |
| Texas Instruments, Inc. | | 3.5 | % |
| CME Group, Inc. | | 3.5 | % |
| Johnson & Johnson | | 3.4 | % |
| Portfolio Allocation (% of Net Assets) | | | |
| Financials | | 20.8 | % |
| Industrials | | 19.4 | % |
| Health Care | | 12.2 | % |
| Energy | | 10.0 | % |
| Consumer Discretionary | | 9.7 | % |
| Consumer Staples | | 7.8 | % |
| Information Technology | | 6.0 | % |
| Utilities | | 4.2 | % |
| Communication Services | | 3.4 | % |
| Equity Real Estate Investment Trusts (REITs) | | 2.8 | % |
| Materials | | 2.2 | % |
| Short-Term Investments | | 1.6 | % |
| Other Assets and Liabilities, Net | | (0.1 | %) |
Additional Information If you wish to view additional information about the Fund; including but not limited to financial statements or holdings, please visit www.madisonfunds.com/documents. Phone: 1-800-877-6089 |  |
| | Annual Shareholder Report
October 31, 2024 |
| Dividend Income Fund Class R6 | MADRX |
 | Annual Shareholder Report October 31, 2024 |
Investors Fund Class A
Madison Investors Fund
MNVAX
Fund Overview
This annual shareholder report contains important information about Investors Fund Class A for the period of November 1, 2023 to October 31, 2024. You can find additional information about the Fund at www.madisonfunds.com/documents. You can also request this information by contacting us at 1-800-877-6089.
What were the Fund costs for last year?
(based on a hypothetical $10,000 investment)
| | | Cost of a $10,000
investment | | | Costs paid as a
percentage of a
$10,000 investment | |
| Class A | | | $133 | | | | 1.16% | |
| | | | | | | | | |
How did the Fund perform last year and what affected its performance?
Overall, our concentrated yet diverse collection of above-average businesses performed well, and the Fund’s returns were strong for the year, but they were less than the index’s returns. We are disappointed to have trailed our benchmark, but we remain focused on producing good results through a full market cycle rather than individual years. Our aim is to assemble an all-weather portfolio of resilient, growing, well-managed, and conservatively capitalized companies.
We believe the sentiment in financial markets for the period is best characterized as speculative or risk seeking. The Fund’s returns have historically trailed those of broader market indices during periods when the prevailing sentiment is risk-seeking.
Portfolio turnover was 16%, slightly below our typical annual range of 20%-30%. During the period, we exited two portfolio companies and initiated new positions in Deere & Company, Keysight Technologies Inc., and Starbucks Corporation. Each of these additions aligns with our three core investment pillars: a strong business model, high-quality management, and an attractive valuation. These criteria, in searching for new positions, supports our strategy for long-term growth.
| Investors Fund Class A | MNVAX |
Fund Performance
The chart below illustrates the total value of a hypothetical $10,000 investment in the Fund over the past 10 years (or for the life of the Fund if shorter).

| Average Annual Total Returns (%) | |
| | |
| | 1 Year | 5 Years | 10 Years |
| Class A | 29.08% | 12.75% | 12.31% |
| Class A with load | 21.67% | 11.42% | 11.65% |
| S&P 500 Index | 38.02% | 15.27% | 13.00% |
1. Fund returns are calculated after fund expenses have been subtracted and assume that dividends and capital gains are reinvested in additional shares of a fund. Returns do not reflect the deduction of taxes that a shareholder would pay on fund distributions or the redemption of fund shares. Investment return and principal value will fluctuate, so an investor’s shares, when redeemed, may be worth more or less than original cost. Further information relating to the fund’s performance is contained in the prospectus and elsewhere in this report. The fund’s past performance is not indicative of future performance.
2. Maximum sales charge is 5.75% for Class A shares.
3. The S&P 500 Index is a large-cap market index which measures the performance of a representative sample of 500 leading companies in leading industries in the US .
| Key Fund Statistics (As of October 31, 2024) | | | | | | | | |
| Total Net Assets | | | | | | | $418,113,988 | |
| # of Portfolio Holdings | | | | | | | 31 | |
| Portfolio Turnover Rate | | | | | | | 16% | |
| Total Advisory Fees Paid | | | | | | | $2,825,823 | |
| Investors Fund Class A | MNVAX |
What does the Fund invest in?
The Fund invested primarily in common stocks of large-cap companies as defined as those in the S&P 500 Index.
| Top Ten Holdings (% of Net Assets) | | | |
| Alphabet, Inc., Class C | | 7.8 | % |
| Arch Capital Group Ltd. | | 6.1 | % |
| Fiserv, Inc. | | 5.7 | % |
| Amazon.com, Inc. | | 4.6 | % |
| PACCAR, Inc. | | 4.4 | % |
| Berkshire Hathaway, Inc., Class B | | 4.1 | % |
| Lowe’s Cos., Inc. | | 4.1 | % |
| Analog Devices, Inc. | | 3.9 | % |
| Alcon AG | | 3.8 | % |
| Progressive Corp. | | 3.6 | % |
| Portfolio Allocation (% of Net Assets) | | | |
| Financials | | 33.3 | % |
| Industrials | | 16.0 | % |
| Consumer Discretionary | | 14.2 | % |
| Information Technology | | 13.7 | % |
| Health Care | | 9.8 | % |
| Communication Services | | 9.5 | % |
| Short-Term Investments | | 1.9 | % |
| Consumer Staples | | 1.4 | % |
| Other Assets and Liabilities, Net | | 0.2 | % |
Additional Information If you wish to view additional information about the Fund; including but not limited to financial statements or holdings, please visit www.madisonfunds.com/documents. Phone: 1-800-877-6089 |  |
| | Annual Shareholder Report
October 31, 2024 |
| Investors Fund Class A | MNVAX |
 | Annual Shareholder Report October 31, 2024 |
Investors Fund Class Y
Madison Investors Fund
MINVX
Fund Overview
This annual shareholder report contains important information about Investors Fund Class Y for the period of November 1, 2023 to October 31, 2024. You can find additional information about the Fund at www.madisonfunds.com/documents. You can also request this information by contacting us at 1-800-877-6089.
What were the Fund costs for last year?
(based on a hypothetical $10,000 investment)
| | | Cost of a $10,000
investment | | | Costs paid as a
percentage of a
$10,000 investment | |
| Class Y | | | $104 | | | | 0.91% | |
| | | | | | | | | |
| | | | | | | | | |
How did the Fund perform last year and what affected its performance?
Overall, our concentrated yet diverse collection of above-average businesses performed well, and the Fund’s returns were strong for the year, but they were less than the index’s returns. We are disappointed to have trailed our benchmark, but we remain focused on producing good results through a full market cycle rather than individual years. Our aim is to assemble an all-weather portfolio of resilient, growing, well-managed, and conservatively capitalized companies.
We believe the sentiment in financial markets for the period is best characterized as speculative or risk seeking. The Fund’s returns have historically trailed those of broader market indices during periods when the prevailing sentiment is risk-seeking.
Portfolio turnover was 16%, slightly below our typical annual range of 20%-30%. During the period, we exited two portfolio companies and initiated new positions in Deere & Company, Keysight Technologies Inc., and Starbucks Corporation. Each of these additions aligns with our three core investment pillars: a strong business model, high-quality management, and an attractive valuation. These criteria, in searching for new positions, supports our strategy for long-term growth.
| Investors Fund Class Y | MINVX |
Fund Performance
The chart below illustrates the total value of a hypothetical $10,000 investment in the Fund over the past 10 years (or for the life of the Fund if shorter).
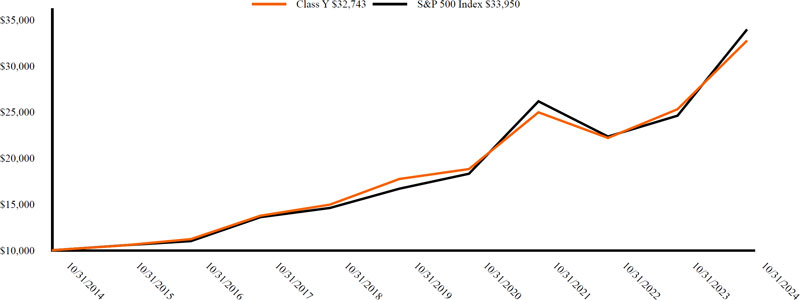
| Average Annual Total Returns (%) | | | |
| | 1 Year | 5 Years | 10 Years |
| Class Y | 29.43% | 13.05% | 12.59% |
| S&P 500 Index | 38.02% | 15.27% | 13.00% |
1. Fund returns are calculated after fund expenses have been subtracted and assume that dividends and capital gains are reinvested in additional shares of a fund. Returns do not reflect the deduction of taxes that a shareholder would pay on fund distributions or the redemption of fund shares. Investment return and principal value will fluctuate, so an investor’s shares, when redeemed, may be worth more or less than original cost. Further information relating to the fund’s performance is contained in the prospectus and elsewhere in this report. The Fund’s past performance is not indicative of future performance.
2. The S&P 500 Index is a large-cap market index which measures the performance of a representative sample of 500 leading companies in leading industries in the US .
| Key Fund Statistics (As of October 31, 2024) | | | | | | | | |
| Total Net Assets | | | | | | | $418,113,988 | |
| # of Portfolio Holdings | | | | | | | 31 | |
| Portfolio Turnover Rate | | | | | | | 16% | |
| Total Advisory Fees Paid | | | | | | | $2,825,823 | |
| Investors Fund Class Y | MINVX |
What does the Fund invest in?
The Fund invested primarily in common stocks of large-cap companies as defined as those in the S&P 500 Index.
| Top Ten Holdings (% of Net Assets) | | | |
| Alphabet, Inc., Class C | | 7.8 | % |
| Arch Capital Group Ltd. | | 6.1 | % |
| Fiserv, Inc. | | 5.7 | % |
| Amazon.com, Inc. | | 4.6 | % |
| PACCAR, Inc. | | 4.4 | % |
| Berkshire Hathaway, Inc., Class B | | 4.1 | % |
| Lowe’s Cos., Inc. | | 4.1 | % |
| Analog Devices, Inc. | | 3.9 | % |
| Alcon AG | | 3.8 | % |
| Progressive Corp. | | 3.6 | % |
| Portfolio Allocation (% of Net Assets) | | | |
| Financials | | 33.3 | % |
| Industrials | | 16.0 | % |
| Consumer Discretionary | | 14.2 | % |
| Information Technology | | 13.7 | % |
| Health Care | | 9.8 | % |
| Communication Services | | 9.5 | % |
| Short-Term Investments | | 1.9 | % |
| Consumer Staples | | 1.4 | % |
| Other Assets and Liabilities, Net | | 0.2 | % |
| | | | |
Additional Information If you wish to view additional information about the Fund; including but not limited to financial statements or holdings, please visit www.madisonfunds.com/documents. Phone: 1-800-877-6089
|  |
| | Annual Shareholder Report October 31, 2024 |
| Investors Fund Class Y | MINVX |
 | Annual Shareholder Report October 31, 2024 |
Investors Fund Class I
Madison Investors Fund
MIVIX
Fund Overview
This annual shareholder report contains important information about Investors Fund Class I for the period of November 1, 2023 to October 31, 2024. You can find additional information about the Fund at www.madisonfunds.com/documents. You can also request this information by contacting us at 1-800-877-6089.
What were the Fund costs for last year?
(based on a hypothetical $10,000 investment)
| | | Cost of a $10,000
investment | | | Costs paid as a
percentage of a
$10,000 investment | |
| Class I | | | $93 | | | | 0.81% | |
| | | | | | | | | |
| | | | | | | | | |
How did the Fund perform last year and what affected its performance?
Overall, our concentrated yet diverse collection of above-average businesses performed well, and the Fund’s returns were strong for the year, but they were less than the index’s returns. We are disappointed to have trailed our benchmark, but we remain focused on producing good results through a full market cycle rather than individual years. Our aim is to assemble an all-weather portfolio of resilient, growing, well-managed, and conservatively capitalized companies.
We believe the sentiment in financial markets for the period is best characterized as speculative or risk seeking. The Fund’s returns have historically trailed those of broader market indices during periods when the prevailing sentiment is risk-seeking.
Portfolio turnover was 16%, slightly below our typical annual range of 20%-30%. During the period, we exited two portfolio companies and initiated new positions in Deere & Company, Keysight Technologies Inc., and Starbucks Corporation. Each of these additions aligns with our three core investment pillars: a strong business model, high-quality management, and an attractive valuation. These criteria, in searching for new positions, supports our strategy for long-term growth.
| Investors Fund Class I | MIVIX |
Fund Performance
The chart below illustrates the total value of a hypothetical $250,000 investment in the Fund over the past 10 years (or for the life of the Fund if shorter).

| Average Annual Total Returns (%) | |
| | |
| | 1 Year | Since Inception 8/31/20 |
| Class I | 29.51% | 13.57% |
| S&P 500 Index | 38.02% | 14.17% |
1. Fund returns are calculated after fund expenses have been subtracted and assume that dividends and capital gains are reinvested in additional shares of a fund. Returns do not reflect the deduction of taxes that a shareholder would pay on fund distributions or the redemption of fund shares. Investment return and principal value will fluctuate, so an investor's shares, when redeemed, may be worth more or less than original cost. Further information relating to the fund's performance is contained in the prospectus and elsewhere in this report. The Fund's past performance is not indicative of future performance.
2. The S&P 500 Index is a large-cap market index which measures the performance of a representative sample of 500 leading companies in leading industries in the US .
| Key Fund Statistics (As of October 31, 2024) | | | | | | | | |
| Total Net Assets | | | | | | | $418,113,988 | |
| # of Portfolio Holdings | | | | | | | 31 | |
| Portfolio Turnover Rate | | | | | | | 16% | |
| Total Advisory Fees Paid | | | | | | | $2,825,823 | |
| Investors Fund Class I | MIVIX |
What does the Fund invest in?
The Fund invested primarily in common stocks of large-cap companies as defined as those in the S&P 500 Index.
| Top Ten Holdings (% of Net Assets) | | | |
| Alphabet, Inc., Class C | | 7.8 | % |
| Arch Capital Group Ltd. | | 6.1 | % |
| Fiserv, Inc. | | 5.7 | % |
| Amazon.com, Inc. | | 4.6 | % |
| PACCAR, Inc. | | 4.4 | % |
| Berkshire Hathaway, Inc., Class B | | 4.1 | % |
| Lowe's Cos., Inc. | | 4.1 | % |
| Analog Devices, Inc. | | 3.9 | % |
| Alcon AG | | 3.8 | % |
| Progressive Corp. | | 3.6 | % |
| Portfolio Allocation (% of Net Assets) | | | |
| Financials | | 33.3 | % |
| Industrials | | 16.0 | % |
| Consumer Discretionary | | 14.2 | % |
| Information Technology | | 13.7 | % |
| Health Care | | 9.8 | % |
| Communication Services | | 9.5 | % |
| Short-Term Investments | | 1.9 | % |
| Consumer Staples | | 1.4 | % |
| Other Assets and Liabilities, Net | | 0.2 | % |
Additional Information If you wish to view additional information about the Fund; including but not limited to financial statements or holdings, please visit www.madisonfunds.com/documents. Phone: 1-800-877-6089 |  |
| | Annual Shareholder Report
October 31, 2024 |
| Investors Fund Class I | MIVIX |
 | Annual Shareholder Report October 31, 2024 |
Investors Fund Class R6
Madison Investors Fund
MNVRX
Fund Overview
This annual shareholder report contains important information about Investors Fund Class R6 for the period of November 1, 2023 to October 31, 2024. You can find additional information about the Fund at www.madisonfunds.com/documents. You can also request this information by contacting us at 1-800-877-6089.
What were the Fund costs for last year?
(based on a hypothetical $10,000 investment)
| | | Cost of a $10,000
investment | | | Costs paid as a
percentage of a
$10,000 investment | |
| Class R6 | | | $84 | | | | 0.73% | |
| | | | | | | | | |
| | | | | | | | | |
How did the Fund perform last year and what affected its performance?
Overall, our concentrated yet diverse collection of above-average businesses performed well, and the Fund’s returns were strong for the year, but they were less than the index’s returns. We are disappointed to have trailed our benchmark, but we remain focused on producing good results through a full market cycle rather than individual years. Our aim is to assemble an all-weather portfolio of resilient, growing, well-managed, and conservatively capitalized companies.
We believe the sentiment in financial markets for the period is best characterized as speculative or risk seeking. The Fund’s returns have historically trailed those of broader market indices during periods when the prevailing sentiment is risk-seeking.
Portfolio turnover was 16%, slightly below our typical annual range of 20%-30%. During the period, we exited two portfolio companies and initiated new positions in Deere & Company, Keysight Technologies Inc., and Starbucks Corporation. Each of these additions aligns with our three core investment pillars: a strong business model, high-quality management, and an attractive valuation. These criteria, in searching for new positions, supports our strategy for long-term growth.
| Investors Fund Class R6 | MNVRX |
Fund Performance
The chart below illustrates the total value of a hypothetical $500,000 investment in the Fund over the past 10 years (or for the life of the Fund if shorter).
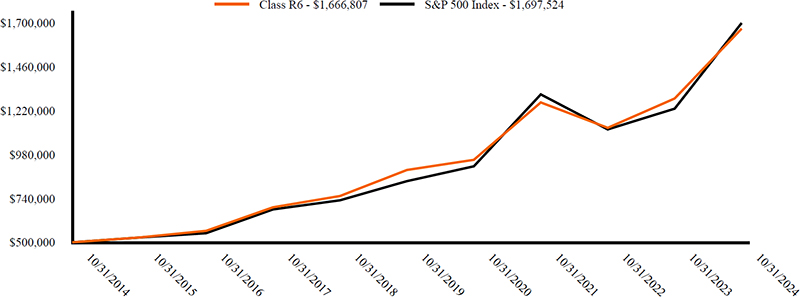
| Average Annual Total Returns (%) | |
| | |
| | 1 Year | 5 Years | 10 Years |
| Class R6 | 29.66% | 13.24% | 12.80% |
| S&P 500 Index | 38.02% | 15.27% | 13.00% |
1. Fund returns are calculated after fund expenses have been subtracted and assume that dividends and capital gains are reinvested in additional shares of a fund. Returns do not reflect the deduction of taxes that a shareholder would pay on fund distributions or the redemption of fund shares. Investment return and principal value will fluctuate, so an investor’s shares, when redeemed, may be worth more or less than original cost. Further information relating to the fund’s performance is contained in the prospectus and elsewhere in this report. The Fund’s past performance is not indicative of future performance.
2. The S&P 500 Index is a large-cap market index which measures the performance of a representative sample of 500 leading companies in leading industries in the US .
| Key Fund Statistics (As of October 31, 2024) | | | | | | | | |
| Total Net Assets | | | | | | | $418,113,988 | |
| # of Portfolio Holdings | | | | | | | 31 | |
| Portfolio Turnover Rate | | | | | | | 16% | |
| Total Advisory Fees Paid | | | | | | | $2,825,823 | |
| Investors Fund Class R6 | MNVRX |
What does the Fund invest in?
The Fund invested primarily in common stocks of large-cap companies as defined as those in the S&P 500 Index.
| Top Ten Holdings (% of Net Assets) | | | |
| Alphabet, Inc., Class C | | 7.8 | % |
| Arch Capital Group Ltd. | | 6.1 | % |
| Fiserv, Inc. | | 5.7 | % |
| Amazon.com, Inc. | | 4.6 | % |
| PACCAR, Inc. | | 4.4 | % |
| Berkshire Hathaway, Inc., Class B | | 4.1 | % |
| Lowe’s Cos., Inc. | | 4.1 | % |
| Analog Devices, Inc. | | 3.9 | % |
| Alcon AG | | 3.8 | % |
| Progressive Corp. | | 3.6 | % |
| Portfolio Allocation (% of Net Assets) | | | |
| Financials | | 33.3 | % |
| Industrials | | 16.0 | % |
| Consumer Discretionary | | 14.2 | % |
| Information Technology | | 13.7 | % |
| Health Care | | 9.8 | % |
| Communication Services | | 9.5 | % |
| Short-Term Investments | | 1.9 | % |
| Consumer Staples | | 1.4 | % |
| Other Assets and Liabilities, Net | | 0.2 | % |
Additional Information If you wish to view additional information about the Fund; including but not limited to financial statements or holdings, please visit www.madisonfunds.com/documents. Phone: 1-800-877-6089 |  |
| | Annual Shareholder Report
October 31, 2024 |
| Investors Fund Class R6 | MNVRX |
 | Annual Shareholder Report October 31, 2024 |
Sustainable Equity Fund Class Y
Madison Sustainable Equity Fund
MFSYX
Fund Overview
This annual shareholder report contains important information about Sustainable Equity Fund Class Y for the period of November 1, 2023 to October 31, 2024. You can find additional information about the Fund at www.madisonfunds.com/documents. You can also request this information by contacting us at 1-800-877-6089.
This report describes changes to the Fund that occurred during the reporting period.
What were the Fund costs for last year?
(based on a hypothetical $10,000 investment)
| | | Cost of a $10,000
investment | | | Costs paid as a
percentage of a
$10,000 investment | |
| Class Y | | | $105 | | | | 0.91% | |
| | | | | | | | | |
How did the Fund perform last year and what affected its performance?
Returns were led by in Communication Services, Financials, Industrials, and Utilities. The Energy, Healthcare, and Consumer Staples sectors underperformed the S&P 500 this year, likely due to slower-than-expected growth in these areas.
Stock selection and allocation both negatively impacted performance. Sector allocation was negative in Healthcare, Consumer Staples, Materials, Comm Services, and Technology. Sector allocation was positive in Energy, Utilities, Financials, Industrials, and Consumer Discretionary. Stock selection was positive in Consumer Staples, Healthcare, Financials, Materials, and Utilities. Stock selection was negative in Industrials and Technology.
Equities have remained strong underpinned by an economy that is growing just under 3%. Inflation has stalled recently but is not re-accelerating and the Federal Reserve has started to cut rates. Valuations have continued to move higher, and the S&P 500 now trades at 22x consensus 2025 calendar earnings. The mega cap stocks have a valuation premium due to their robust growth but if you look more broadly, there are still opportunities at attractive valuations. We are redoubling our efforts when it comes to stock selection, looking for high quality companies with strong long-term growth prospects that are trading at attractive valuations and will use volatility to add to companies in our portfolio that have become more attractively valued.
| Sustainable Equity Fund Class Y | MFSYX |
Fund Performance
The chart below illustrates the total value of a hypothetical $10,000 investment in the Fund over the past 10 years (or for the life of the Fund if shorter).
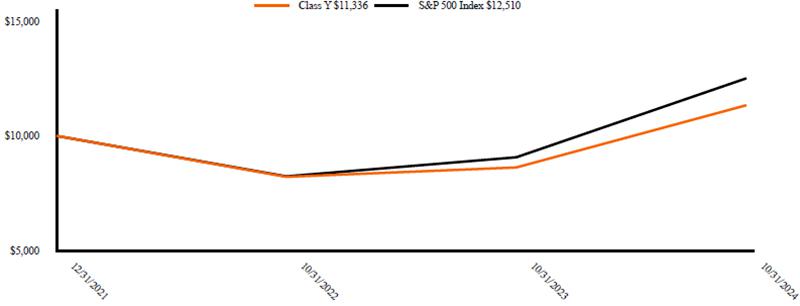
Average Annual Total Returns (%)
| | 1 Year | Since Inception 12/31/21 |
| Class Y | 31.51% | 4.53% |
| S&P 500 Index | 38.02% | 8.23% |
1. Fund returns are calculated after fund expenses have been subtracted and assume that dividends and capital gains are reinvested in additional shares of a fund. Returns do not reflect the deduction of taxes that a shareholder would pay on fund distributions or the redemption of fund shares. Investment return and principal value will fluctuate, so an investor’s shares, when redeemed, may be worth more or less than original cost. Further information relating to the fund’s performance is contained in the prospectus and elsewhere in this report. The Fund’s past performance is not indicative of future performance.
2. The S&P® 500 Index is a large-cap market index which measures the performance of a representative sample of 500 leading companies in leading industries in the US.
Key Fund Statistics (As of October 31, 2024)
| Total Net Assets | | | | | | | $9,883,245 |
| # of Portfolio Holdings | | | | | | | 34 | |
| Portfolio Turnover Rate | | | | | | | 33% | |
| Total Advisory Fees Paid | | | | | | | $68,324 | |
| Sustainable Equity Fund Class Y | MFSYX |
What does the Fund invest in?
The Fund invested in common stocks of high-quality, large cap companies (generally, stocks with a market capitalization of greater than $10 billion) that incorporate sustainability into their overall strategy.
Top Ten Holdings (% of Net Assets)
| Microsoft Corp. | 7.8% |
| Alphabet, Inc., Class C | 6.7% |
| Eli Lilly & Co. | 6.7% |
| Costco Wholesale Corp. | 5.1% |
| Apple, Inc. | 4.6% |
| NextEra Energy, Inc. | 4.2% |
| Visa, Inc., Class A | 4.0% |
| Oracle Corp. | 3.9% |
| Amazon.com, Inc. | 3.7% |
| UnitedHealth Group, Inc. | 3.7% |
Portfolio Allocation (% of Net Assets)
| Information Technology | 29.5% |
| Financials | 16.7% |
| Health Care | 16.3% |
| Consumer Discretionary | 9.5% |
| Communication Services | 6.7% |
| Consumer Staples | 6.1% |
| Materials | 5.2% |
| Industrials | 4.3% |
| Utilities | 4.2% |
| Short-Term Investments | 1.5% |
| Other Assets and Liabilities, Net | -% |
Material Fund Changes
On November 6, 2024, the Board of Trustees of the Madison Funds approved the liquidation of the Madison Sustainable Equity Fund. The liquidation is expected to occur on or about February 21, 2025.
This is a summary of certain planned changes to the Fund since October 31, 2024. For more complete information, you may review the Fund’s next prospectus, which we expect to be available by February 28th, 2025 at www.madisonfunds.com or upon request by calling 1-800-877-6089.
Additional Information If you wish to view additional information about the Fund; including but not limited to financial statements or holdings, please visit www.madisonfunds.com/documents. Phone: 1-800-877-6089 |  |
| | Annual Shareholder Report
October 31, 2024 |
| Sustainable Equity Fund Class Y | MFSYX |
 | Annual Shareholder Report October 31, 2024 |
Sustainable Equity Fund Class I
Madison Sustainable Equity Fund
MFSIX
Fund Overview
This annual shareholder report contains important information about Sustainable Equity Fund Class I for the period of November 1, 2023 to October 31, 2024. You can find additional information about the Fund at www.madisonfunds.com/documents. You can also request this information by contacting us at 1-800-877-6089.
This report describes changes to the Fund that occurred during the reporting period.
What were the Fund costs for last year?
(based on a hypothetical $10,000 investment)
| | | Cost of a $10,000 investment | | | Costs paid as a percentage of a $10,000 investment | |
| Class I | | | $94 | | | | 0.81% | |
| | | | | | | | | |
How did the Fund perform last year and what affected its performance?
Returns were led by in Communication Services, Financials, Industrials, and Utilities. The Energy, Healthcare, and Consumer Staples sectors underperformed the S&P 500 this year, likely due to slower-than-expected growth in these areas.
Stock selection and allocation both negatively impacted performance. Sector allocation was negative in Healthcare, Consumer Staples, Materials, Comm Services, and Technology. Sector allocation was positive in Energy, Utilities, Financials, Industrials, and Consumer Discretionary. Stock selection was positive in Consumer Staples, Healthcare, Financials, Materials, and Utilities. Stock selection was negative in Industrials and Technology.
Equities have remained strong underpinned by an economy that is growing just under 3%. Inflation has stalled recently but is not re-accelerating and the Federal Reserve has started to cut rates. Valuations have continued to move higher, and the S&P 500 now trades at 22x consensus 2025 calendar earnings. The mega cap stocks have a valuation premium due to their robust growth but if you look more broadly, there are still opportunities at attractive valuations. We are redoubling our efforts when it comes to stock selection, looking for high quality companies with strong long-term growth prospects that are trading at attractive valuations and will use volatility to add to companies in our portfolio that have become more attractively valued.
| Sustainable Equity Fund Class I | MFSIX |
Fund Performance
The chart below illustrates the total value of a hypothetical $250,000 investment in the Fund over the past 10 years (or for the life of the Fund if shorter).

Average Annual Total Returns (%) | | |
| | 1 Year | Since Inception 12/31/21 |
| Class I | 31.50% | 4.60% |
| S&P 500 Index | 38.02% | 8.23% |
1. Fund returns are calculated after fund expenses have been subtracted and assume that dividends and capital gains are reinvested in additional shares of a fund. Returns do not reflect the deduction of taxes that a shareholder would pay on fund distributions or the redemption of fund shares. Investment return and principal value will fluctuate, so an investor’s shares, when redeemed, may be worth more or less than original cost. Further information relating to the fund’s performance is contained in the prospectus and elsewhere in this report. The Fund’s past performance is not indicative of future performance.
2. The S&P® 500 Index is a large-cap market index which measures the performance of a representative sample of 500 leading companies in leading industries in the US.
| Key Fund Statistics (As of October 31, 2024) | | | | | | | | |
| Total Net Assets | | | | | | | $9,883,245 | |
| # of Portfolio Holdings | | | | | | | 34 | |
| Portfolio Turnover Rate | | | | | | | 33% | |
| Total Advisory Fees Paid | | | | | | | $68,324 | |
| Sustainable Equity Fund Class I | MFSIX |
What does the Fund invest in?
The Fund invested in common stocks of high-quality, large cap companies (generally, stocks with a market capitalization of greater than $10 billion) that incorporate sustainability into their overall strategy.
| Top Ten Holdings (% of Net Assets) | | | |
| Microsoft Corp. | | 7.8 | % |
| Alphabet, Inc., Class C | | 6.7 | % |
| Eli Lilly & Co. | | 6.7 | % |
| Costco Wholesale Corp. | | 5.1 | % |
| Apple, Inc. | | 4.6 | % |
| NextEra Energy, Inc. | | 4.2 | % |
| Visa, Inc., Class A | | 4.0 | % |
| Oracle Corp. | | 3.9 | % |
| Amazon.com, Inc. | | 3.7 | % |
| UnitedHealth Group, Inc. | | 3.7 | % |
Portfolio Allocation (% of Net Assets) | | | |
| Information Technology | | 29.5 | % |
| Financials | | 16.7 | % |
| Health Care | | 16.3 | % |
| Consumer Discretionary | | 9.5 | % |
| Communication Services | | 6.7 | % |
| Consumer Staples | | 6.1 | % |
| Materials | | 5.2 | % |
| Industrials | | 4.3 | % |
| Utilities | | 4.2 | % |
| Short-Term Investments | | 1.5 | % |
| Other Assets and Liabilities, Net | | - | % |
Material Fund Changes
On November 6, 2024, the Board of Trustees of the Madison Funds approved the liquidation of the Madison Sustainable Equity Fund. The liquidation is expected to occur on or about February 21, 2025.
This is a summary of certain planned changes to the Fund since October 31, 2024. For more complete information, you may review the Fund’s next prospectus, which we expect to be available by February 28th, 2025 at www.madisonfunds.com or upon request by calling 1-800-877-6089.
Additional Information If you wish to view additional information about the Fund; including but not limited to financial statements or holdings, please visit www.madisonfunds.com/documents. Phone: 1-800-877-6089 |  |
| | Annual Shareholder Report October 31, 2024 |
| Sustainable Equity Fund Class I | MFSIX |
 | Annual Shareholder Report October 31, 2024 |
Mid Cap Fund Class A
Madison Mid Cap Fund
MERAX
Fund Overview
This annual shareholder report contains important information about Mid Cap Fund Class A for the period of November 1, 2023 to October 31, 2024. You can find additional information about the Fund at www.madisonfunds.com/documents. You can also request this information by contacting us at 1-800-877-6089.
What were the Fund costs for last year?
(based on a hypothetical $10,000 investment)
| | | Cost of a $10,000
investment | | | Costs paid as a
percentage of a
$10,000 investment | |
| Class A | | | $153 | | | | 1.36% | |
| | | | | | | | | |
How did the Fund perform last year and what affected its performance?
Security selection accounted for most of the underperformance. The most notable performance detractors were companies from the Consumer Staples and Communication Services sectors. In addition, the total return from some of our larger holdings, while positive, didn’t keep pace with the RMC. The portfolio’s strongest performance contributors were companies from the Information Technology sector. The underweight in Health Care, Energy, and Materials also helped performance.
Insurance companies, after contributing meaningfully to the portfolio’s outperformance in the previous two years, continued to deliver positive total returns this year but only one exceeded the RMC’s total return. Business conditions in the insurance industry remain strong, and the stock prices of our insurance companies remain reasonable, giving us confidence to keep the overweight position.
Portfolio turnover was 16%, which was below our typical annual range of 20% to 30%. During the year, we purchased five new positions and exited four positions.
New Positions: Cullen/Frost Bankers is a high-quality regional bank based in San Antonio, led by a strong team that has demonstrated the ability to successfully enter new markets. Teledyne Technologies is a well-managed sensor and instrumentation manufacturer, with a track record of shareholder-oriented actions. Graco is a leading manufacturer of premium fluid handling equipment, with a strong customer value proposition that has resulted in high returns on invested capital. Asbury Automotive and Lithia Motors are two of the largest auto franchise dealer groups in the country. Investors tend to pay a lot of attention new car sales, but dealers actually earn more in profits from parts and service, and this steady business provides a nice ballast throughout the economic cycle.
Exited positions: Markel Group was sold as a risk management effort to reduce our portfolio allocation to property and casualty insurers following a period of strong performance. Auto insurer Progressive was sold because its market cap had risen significantly above the mid cap range. Brookfield Corp, which was spun out of its asset management business, Brookfield Asset Management (BAM), was sold because we decided to concentrate our investment in BAM, given its cleaner balance sheet. We sold Take-Two Interactive Software after the stock had advanced to a level that adequately reflected the risks and rewards of the large slate of new game launches expected in 2025 and 2026.
| Mid Cap Fund Class A | MERAX |
Fund Performance
The chart below illustrates the total value of a hypothetical $10,000 investment in the Fund over the past 10 years (or for the life of the Fund if shorter).
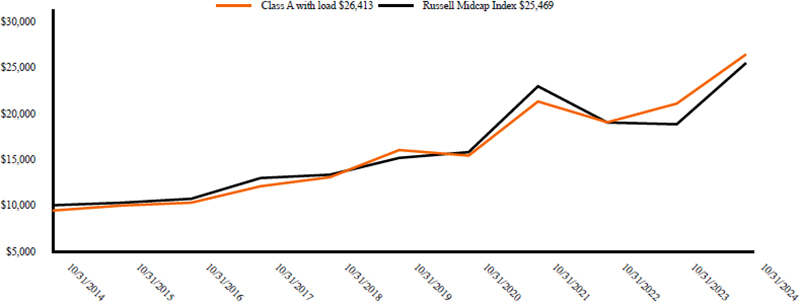
Average Annual Total Returns (%)
| | 1 Year | 5 Years | 10 Years |
| Class A | 25.43% | 10.53% | 10.86% |
| Class A with load | 18.24% | 9.22% | 10.20% |
| Russell Midcap Index | 35.39% | 10.94% | 9.80% |
1. Fund returns are calculated after fund expenses have been subtracted and assume that dividends and capital gains are reinvested in additional shares of a fund. Returns do not reflect the deduction of taxes that a shareholder would pay on fund distributions or the redemption of fund shares. Investment return and principal value will fluctuate, so an investor’s shares, when redeemed, may be worth more or less than original cost. Further information relating to the fund’s performance is contained in the prospectus and elsewhere in this report. The fund’s past performance is not indicative of future performance.
2. Maximum sales charge is 5.75% for Class A shares.
3. The Russell Midcap Index is a mid-cap market index which measures the performance of the mid-cap segment of the US equity universe.
Key Fund Statistics (As of October 31, 2024)
| Total Net Assets | | | | | | | $1,885,497,410 |
| # of Portfolio Holdings | | | | | | | 35 | |
| Portfolio Turnover Rate | | | | | | | 16% | |
| Total Advisory Fees Paid | | | | | | | $9,855,137 | |
| Mid Cap Fund Class A | MERAX |
What does the Fund invest in?
The Fund invested in common stocks, securities convertible into common stocks and related equity securities of midsize companies defined as those companies with market capitalizations of between $500 million and $70 billion.
Top Ten Holdings (% of Net Assets)
| Arch Capital Group Ltd. | 8.1% |
| Gartner, Inc. | 6.7% |
| Ross Stores, Inc. | 5.4% |
| Brown & Brown, Inc. | 4.9% |
| Carlisle Cos., Inc. | 4.3% |
| PACCAR, Inc. | 4.2% |
| Copart, Inc. | 4.1% |
| Amphenol Corp., Class A | 3.9% |
| Labcorp Holdings, Inc. | 3.1% |
| Arista Networks, Inc. | 3.0% |
Portfolio Allocation (% of Net Assets)
| Information Technology | 22.5% |
| Financials | 22.4% |
| Industrials | 17.0% |
| Consumer Discretionary | 16.7% |
| Short-Term Investments | 7.9% |
| Health Care | 5.5% |
| Communication Services | 5.4% |
| Consumer Staples | 4.6% |
| Other Assets and Liabilities, Net | (2.0%) |
Additional Information If you wish to view additional information about the Fund; including but not limited to financial statements or holdings, please visit www.madisonfunds.com/documents. Phone: 1-800-877-6089 |  |
| | Annual Shareholder Report
October 31, 2024 |
| Mid Cap Fund Class A | MERAX |
 | Annual Shareholder Report October 31, 2024 |
Mid Cap Fund Class Y
Madison Mid Cap Fund
GTSGX
Fund Overview
This annual shareholder report contains important information about Mid Cap Fund Class Y for the period of November 1, 2023 to October 31, 2024. You can find additional information about the Fund at www.madisonfunds.com/documents. You can also request this information by contacting us at 1-800-877-6089.
What were the Fund costs for last year?
(based on a hypothetical $10,000 investment)
| | | Cost of a $10,000
investment | | | Costs paid as a
percentage of a
$10,000 investment | |
| Class Y | | | $103 | | | | 0.91% | |
| | | | | | | | | |
How did the Fund perform last year and what affected its performance?
Security selection accounted for most of the underperformance. The most notable performance detractors were companies from the Consumer Staples and Communication Services sectors. In addition, the total return from some of our larger holdings, while positive, didn’t keep pace with the RMC. The portfolio’s strongest performance contributors were companies from the Information Technology sector. The underweight in Health Care, Energy, and Materials also helped performance.
Insurance companies, after contributing meaningfully to the portfolio’s outperformance in the previous two years, continued to deliver positive total returns this year but only one exceeded the RMC’s total return. Business conditions in the insurance industry remain strong, and the stock prices of our insurance companies remain reasonable, giving us confidence to keep the overweight position.
Portfolio turnover was 16%, which was below our typical annual range of 20% to 30%. During the year, we purchased five new positions and exited four positions.
New Positions: Cullen/Frost Bankers is a high-quality regional bank based in San Antonio, led by a strong team that has demonstrated the ability to successfully enter new markets. Teledyne Technologies is a well-managed sensor and instrumentation manufacturer, with a track record of shareholder-oriented actions. Graco is a leading manufacturer of premium fluid handling equipment, with a strong customer value proposition that has resulted in high returns on invested capital. Asbury Automotive and Lithia Motors are two of the largest auto franchise dealer groups in the country. Investors tend to pay a lot of attention new car sales, but dealers actually earn more in profits from parts and service, and this steady business provides a nice ballast throughout the economic cycle.
Exited positions: Markel Group was sold as a risk management effort to reduce our portfolio allocation to property and casualty insurers following a period of strong performance. Auto insurer Progressive was sold because its market cap had risen significantly above the mid cap range. Brookfield Corp, which was spun out of its asset management business, Brookfield Asset Management (BAM), was sold because we decided to concentrate our investment in BAM, given its cleaner balance sheet. We sold Take-Two Interactive Software after the stock had advanced to a level that adequately reflected the risks and rewards of the large slate of new game launches expected in 2025 and 2026.
| Mid Cap Fund Class Y | GTSGX |
Fund Performance
The chart below illustrates the total value of a hypothetical $10,000 investment in the Fund over the past 10 years (or for the life of the Fund if shorter).

| Average Annual Total Returns (%) |
| | 1 Year | 5 Years | 10 Years |
| Class Y | 25.97% | 11.02% | 11.32% |
| Russell Midcap Index | 35.39% | 10.94% | 9.80% |
1. Fund returns are calculated after fund expenses have been subtracted and assume that dividends and capital gains are reinvested in additional shares of a fund. Returns do not reflect the deduction of taxes that a shareholder would pay on fund distributions or the redemption of fund shares. Investment return and principal value will fluctuate, so an investor’s shares, when redeemed, may be worth more or less than original cost. Further information relating to the fund’s performance is contained in the prospectus and elsewhere in this report. The Fund’s past performance is not indicative of future performance.
2. The Russell Midcap Index is a mid-cap market index which measures the performance of the mid-cap segment of the US equity universe.
| Key Fund Statistics (As of October 31, 2024) | | | | | | | | |
| Total Net Assets | | | | | | | $1,885,497,410 | |
| # of Portfolio Holdings | | | | | | | 35 | |
| Portfolio Turnover Rate | | | | | | | 16% | |
| Total Advisory Fees Paid | | | | | | | $9,855,137 | |
| Mid Cap Fund Class Y | GTSGX |
What does the Fund invest in?
The Fund invested in common stocks, securities convertible into common stocks and related equity securities of midsize companies defined as those companies with market capitalizations of between $500 million and $70 billion.
| Top Ten Holdings (% of Net Assets) | | | |
| Arch Capital Group Ltd. | | 8.1 | % |
| Gartner, Inc. | | 6.7 | % |
| Ross Stores, Inc. | | 5.4 | % |
| Brown & Brown, Inc. | | 4.9 | % |
| Carlisle Cos., Inc. | | 4.3 | % |
| PACCAR, Inc. | | 4.2 | % |
| Copart, Inc. | | 4.1 | % |
| Amphenol Corp., Class A | | 3.9 | % |
| Labcorp Holdings, Inc. | | 3.1 | % |
| Arista Networks, Inc. | | 3.0 | % |
| Portfolio Allocation (% of Net Assets) | | | |
| Information Technology | | 22.5 | % |
| Financials | | 22.4 | % |
| Industrials | | 17.0 | % |
| Consumer Discretionary | | 16.7 | % |
| Short-Term Investments | | 7.9 | % |
| Health Care | | 5.5 | % |
| Communication Services | | 5.4 | % |
| Consumer Staples | | 4.6 | % |
| Other Assets and Liabilities, Net | | (2.0 | %) |
Additional Information If you wish to view additional information about the Fund; including but not limited to financial statements or holdings, please visit www.madisonfunds.com/documents. Phone: 1-800-877-6089 |  |
| | Annual Shareholder Report
October 31, 2024 |
| Mid Cap Fund Class Y | GTSGX |
 | Annual Shareholder Report October 31, 2024 |
Mid Cap Fund Class I
Madison Mid Cap Fund
MDCIX
Fund Overview
This annual shareholder report contains important information about Mid Cap Fund Class I for the period of November 1, 2023 to October 31, 2024. You can find additional information about the Fund at www.madisonfunds.com/documents. You can also request this information by contacting us at 1-800-877-6089.
What were the Fund costs for last year?
(based on a hypothetical $10,000 investment)
| | | Cost of a $10,000
investment | | | Costs paid as a
percentage of a
$10,000 investment | |
| Class I | | | $92 | | | | 0.81% | |
| | | | | | | | | |
How did the Fund perform last year and what affected its performance?
Security selection accounted for most of the underperformance. The most notable performance detractors were companies from the Consumer Staples and Communication Services sectors. In addition, the total return from some of our larger holdings, while positive, didn’t keep pace with the RMC. The portfolio’s strongest performance contributors were companies from the Information Technology sector. The underweight in Health Care, Energy, and Materials also helped performance.
Insurance companies, after contributing meaningfully to the portfolio’s outperformance in the previous two years, continued to deliver positive total returns this year but only one exceeded the RMC’s total return. Business conditions in the insurance industry remain strong, and the stock prices of our insurance companies remain reasonable, giving us confidence to keep the overweight position.
Portfolio turnover was 16%, which was below our typical annual range of 20% to 30%. During the year, we purchased five new positions and exited four positions.
New Positions: Cullen/Frost Bankers is a high-quality regional bank based in San Antonio, led by a strong team that has demonstrated the ability to successfully enter new markets. Teledyne Technologies is a well-managed sensor and instrumentation manufacturer, with a track record of shareholder-oriented actions. Graco is a leading manufacturer of premium fluid handling equipment, with a strong customer value proposition that has resulted in high returns on invested capital. Asbury Automotive and Lithia Motors are two of the largest auto franchise dealer groups in the country. Investors tend to pay a lot of attention new car sales, but dealers actually earn more in profits from parts and service, and this steady business provides a nice ballast throughout the economic cycle.
Exited positions: Markel Group was sold as a risk management effort to reduce our portfolio allocation to property and casualty insurers following a period of strong performance. Auto insurer Progressive was sold because its market cap had risen significantly above the mid cap range. Brookfield Corp, which was spun out of its asset management business, Brookfield Asset Management (BAM), was sold because we decided to concentrate our investment in BAM, given its cleaner balance sheet. We sold Take-Two Interactive Software after the stock had advanced to a level that adequately reflected the risks and rewards of the large slate of new game launches expected in 2025 and 2026.
| Mid Cap Fund Class I | MDCIX |
Fund Performance
The chart below illustrates the total value of a hypothetical $250,000 investment in the Fund over the past 10 years (or for the life of the Fund if shorter).

Average Annual Total Returns (%)
| | 1 Year | Since Inception 8/31/20 |
| Class I | 26.09% | 13.65% |
| Russell Midcap Index | 35.39% | 11.82% |
1. Fund returns are calculated after fund expenses have been subtracted and assume that dividends and capital gains are reinvested in additional shares of a fund. Returns do not reflect the deduction of taxes that a shareholder would pay on fund distributions or the redemption of fund shares. Investment return and principal value will fluctuate, so an investor’s shares, when redeemed, may be worth more or less than original cost. Further information relating to the fund’s performance is contained in the prospectus and elsewhere in this report. The Fund’s past performance is not indicative of future performance.
2. The Russell Midcap Index is a mid-cap market index which measures the performance of the mid-cap segment of the US equity universe.
Key Fund Statistics (As of October 31, 2024)
| Total Net Assets | | | | | | | $1,885,497,410 |
| # of Portfolio Holdings | | | | | | | 35 | |
| Portfolio Turnover Rate | | | | | | | 16% | |
| Total Advisory Fees Paid | | | | | | | $9,855,137 | |
| Mid Cap Fund Class I | MDCIX |
What does the Fund invest in?
The Fund invested in common stocks, securities convertible into common stocks and related equity securities of midsize companies defined as those companies with market capitalizations of between $500 million and $70 billion.
Top Ten Holdings (% of Net Assets)
| Arch Capital Group Ltd. | 8.1% |
| Gartner, Inc. | 6.7% |
| Ross Stores, Inc. | 5.4% |
| Brown & Brown, Inc. | 4.9% |
| Carlisle Cos., Inc. | 4.3% |
| PACCAR, Inc. | 4.2% |
| Copart, Inc. | 4.1% |
| Amphenol Corp., Class A | 3.9% |
| Labcorp Holdings, Inc. | 3.1% |
| Arista Networks, Inc. | 3.0% |
Portfolio Allocation (% of Net Assets)
| Information Technology | 22.5% |
| Financials | 22.4% |
| Industrials | 17.0% |
| Consumer Discretionary | 16.7% |
| Short-Term Investments | 7.9% |
| Health Care | 5.5% |
| Communication Services | 5.4% |
| Consumer Staples | 4.6% |
| Other Assets and Liabilities, Net | (2.0%) |
Additional Information If you wish to view additional information about the Fund; including but not limited to financial statements or holdings, please visit www.madisonfunds.com/documents. Phone: 1-800-877-6089 |  |
| | Annual Shareholder Report
October 31, 2024 |
| Mid Cap Fund Class I | MDCIX |
 | Annual Shareholder Report October 31, 2024 |
Mid Cap Fund Class R6
Madison Mid Cap Fund
MMCRX
Fund Overview
This annual shareholder report contains important information about Mid Cap Fund Class R6 for the period of November 1, 2023 to October 31, 2024. You can find additional information about the Fund at www.madisonfunds.com/documents. You can also request this information by contacting us at 1-800-877-6089.
What were the Fund costs for last year?
(based on a hypothetical $10,000 investment)
| | | Cost of a $10,000
investment | | | Costs paid as a
percentage of a
$10,000 investment | |
| Class R6 | | | $83 | | | | 0.73% | |
| | | | | | | | | |
How did the Fund perform last year and what affected its performance?
Security selection accounted for most of the underperformance. The most notable performance detractors were companies from the Consumer Staples and Communication Services sectors. In addition, the total return from some of our larger holdings, while positive, didn’t keep pace with the RMC. The portfolio’s strongest performance contributors were companies from the Information Technology sector. The underweight in Health Care, Energy, and Materials also helped performance.
Insurance companies, after contributing meaningfully to the portfolio’s outperformance in the previous two years, continued to deliver positive total returns this year but only one exceeded the RMC’s total return. Business conditions in the insurance industry remain strong, and the stock prices of our insurance companies remain reasonable, giving us confidence to keep the overweight position.
Portfolio turnover was 16%, which was below our typical annual range of 20% to 30%. During the year, we purchased five new positions and exited four positions.
New Positions: Cullen/Frost Bankers is a high-quality regional bank based in San Antonio, led by a strong team that has demonstrated the ability to successfully enter new markets. Teledyne Technologies is a well-managed sensor and instrumentation manufacturer, with a track record of shareholder-oriented actions. Graco is a leading manufacturer of premium fluid handling equipment, with a strong customer value proposition that has resulted in high returns on invested capital. Asbury Automotive and Lithia Motors are two of the largest auto franchise dealer groups in the country. Investors tend to pay a lot of attention new car sales, but dealers actually earn more in profits from parts and service, and this steady business provides a nice ballast throughout the economic cycle.
Exited positions: Markel Group was sold as a risk management effort to reduce our portfolio allocation to property and casualty insurers following a period of strong performance. Auto insurer Progressive was sold because its market cap had risen significantly above the mid cap range. Brookfield Corp, which was spun out of its asset management business, Brookfield Asset Management (BAM), was sold because we decided to concentrate our investment in BAM, given its cleaner balance sheet. We sold Take-Two Interactive Software after the stock had advanced to a level that adequately reflected the risks and rewards of the large slate of new game launches expected in 2025 and 2026.
| Mid Cap Fund Class R6 | MMCRX |
Fund Performance
The chart below illustrates the total value of a hypothetical $500,000 investment in the Fund over the past 10 years (or for the life of the Fund if shorter).
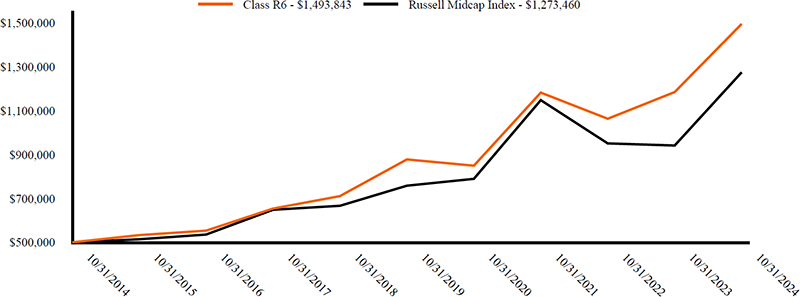
Average Annual Total Returns (%)
| | 1 Year | 5 Years | 10 Years |
| Class R6 | 26.18% | 11.23% | 11.57% |
| Russell Midcap Index | 35.39% | 10.94% | 9.80% |
1. Fund returns are calculated after fund expenses have been subtracted and assume that dividends and capital gains are reinvested in additional shares of a fund. Returns do not reflect the deduction of taxes that a shareholder would pay on fund distributions or the redemption of fund shares. Investment return and principal value will fluctuate, so an investor’s shares, when redeemed, may be worth more or less than original cost. Further information relating to the fund’s performance is contained in the prospectus and elsewhere in this report. The Fund’s past performance is not indicative of future performance.
2. The Russell Midcap Index is a mid-cap market index which measures the performance of the mid-cap segment of the US equity universe.
Key Fund Statistics (As of October 31, 2024)
| Total Net Assets | | | | | | | $1,885,497,410 |
| # of Portfolio Holdings | | | | | | | 35 | |
| Portfolio Turnover Rate | | | | | | | 16% | |
| Total Advisory Fees Paid | | | | | | | $9,855,137 | |
| Mid Cap Fund Class R6 | MMCRX |
What does the Fund invest in?
The Fund invested in common stocks, securities convertible into common stocks and related equity securities of midsize companies defined as those companies with market capitalizations of between $500 million and $70 billion.
Top Ten Holdings (% of Net Assets)
| Arch Capital Group Ltd. | 8.1% |
| Gartner, Inc. | 6.7% |
| Ross Stores, Inc. | 5.4% |
| Brown & Brown, Inc. | 4.9% |
| Carlisle Cos., Inc. | 4.3% |
| PACCAR, Inc. | 4.2% |
| Copart, Inc. | 4.1% |
| Amphenol Corp., Class A | 3.9% |
| Labcorp Holdings, Inc. | 3.1% |
| Arista Networks, Inc. | 3.0% |
Portfolio Allocation (% of Net Assets)
| Information Technology | 22.5% |
| Financials | 22.4% |
| Industrials | 17.0% |
| Consumer Discretionary | 16.7% |
| Short-Term Investments | 7.9% |
| Health Care | 5.5% |
| Communication Services | 5.4% |
| Consumer Staples | 4.6% |
| Other Assets and Liabilities, Net | (2.0%) |
Additional Information If you wish to view additional information about the Fund; including but not limited to financial statements or holdings, please visit www.madisonfunds.com/documents. Phone: 1-800-877-6089 |  |
| | Annual Shareholder Report
October 31, 2024 |
| Mid Cap Fund Class R6 | MMCRX |
 | Annual Shareholder Report October 31, 2024 |
Small Cap Fund Class A
Madison Small Cap Fund
MASMX
Fund Overview
This annual shareholder report contains important information about Small Cap Fund Class A for the period of November 1, 2023 to October 31, 2024. You can find additional information about the Fund at www.madisonfunds.com/documents. You can also request this information by contacting us at 1-800-877-6089.
What were the Fund costs for last year?
(based on a hypothetical $10,000 investment)
| | | Cost of a $10,000
investment | | | Costs paid as a
percentage of a
$10,000 investment | |
| Class A | | | $160 | | | | 1.35% | |
| | | | | | | | | |
How did the Fund perform last year and what affected its performance?
The three strongest areas of outperformance were Consumer Discretionary Information Technology, and Materials. In consumer discretionary, driven by strong stock selection. Our IT holdings built on the strong 2023 performance after a tough year in 2022 which provided us with many opportunities to invest in attractive companies at distressed prices. While this benefit continued, software investment was largely weak in 2024 which provided us with several investment opportunities in software. Materials also benefited from strong stock selection as two core investments delivered strong returns
Consumer Staples, financials and cash were our largest detractors from performance, Although or investments in both financials and staples delivered positive returns, we still lagged the benchmark, especially in staples. In financials, our lack of exposure in REITS.
Generally, stock selection continued to be a very strong driver of performance for the Madison small cap fund. We attribute much of this to our conviction in our investments. Our strongest absolute returns generally came from our largest positions, and our largest positions are our highest quality franchises. Quality organizations in the small cap universe are scarce; especially now, as higher interest rates and an uncertain economic backdrop are stressors for smaller companies.
Looking ahead, investors are reaping the benefits of a very strong stretch of performance in mega cap companies. The Russell 2000 is still trading below its November 2021 high, while the S&P has enjoyed two strong years of 20% plus returns. Although we can’t say small caps are cheap anymore, we do believe they still represent material relative value as opposed to large and mega caps.
The currently easing interest rate environment could benefit our housing-related investments and our industrial investments. Combined with the anticipated benefits of reshoring and infrastructure funding from the IRA, we may see improving demand in this part of the economy. The consumer remains resilient and with inflation now largely subdued, the focus now turns to employment and other macro factors. Our investments in Consumer Staples and other defensive, non-cyclical companies can provide some stable returns if the environment becomes uncertain.
Overall, 2024 was a strong year for the Madison small cap fund. Our challenge is to build upon this performance in an increasingly strong bull market, while protecting our investors backs from downside risks. We intend to do this by sticking to our long tenured investment philosophy of convicted investment in high quality franchises at attractive valuations.
| Small Cap Fund Class A | MASMX |
Fund Performance
The chart below illustrates the total value of a hypothetical $10,000 investment in the Fund over the past 10 years (or for the life of the Fund if shorter).

| Average Annual Total Returns (%) |
| | 1 Year | 5 Years | Since Inception 8/31/19 |
| Class A | 37.67% | 9.76% | 10.62% |
| Class A with load | 29.79% | 8.46% | 9.36% |
| Russell 2000 Index | 34.07% | 8.50% | 9.20% |
| Russell 2500 Index | 33.08% | 9.81% | 10.25% |
1. Fund returns are calculated after fund expenses have been subtracted and assume that dividends and capital gains are reinvested in additional shares of a fund. Returns do not reflect the deduction of taxes that a shareholder would pay on fund distributions or the redemption of fund shares. Investment return and principal value will fluctuate, so an investor’s shares, when redeemed, may be worth more or less than original cost. Further information relating to the fund’s performance is contained in the prospectus and elsewhere in this report. The fund’s past performance is not indicative of future performance.
2. Maximum sales charge is 5.75% for Class A shares.
3. The Russell 2000 Index is a small-cap market index which measures the performance of the smallest 2,000 companies in the Russell 3000 Index.
4. The Russell 2500 Index is a broad index, featuring 2,500 stocks that cover the small- and mid-cap market capitalizations of the US equity universe.
| Key Fund Statistics (As of October 31, 2024) | | | | | | | | |
| Total Net Assets | | | | | | | $188,004,390 | |
| # of Portfolio Holdings | | | | | | | 46 | |
| Portfolio Turnover Rate | | | | | | | 39% | |
| Total Advisory Fees Paid | | | | | | | $1,604,722 | |
| Small Cap Fund Class A | MASMX |
What does the Fund invest in?
The Fund invested primarily in a diversified mix of common stocks of small cap U.S. companies that is defined as those companies with market capitalization of between $100 million and $15 billion.
| Top Ten Holdings (% of Net Assets) | | | |
| Encompass Health Corp. | | 4.5 | % |
| Summit Materials, Inc., Class A | | 4.5 | % |
| OneSpaWorld Holdings Ltd. | | 3.9 | % |
| Cogent Communications Holdings, Inc. | | 3.4 | % |
| Core & Main, Inc., Class A | | 3.2 | % |
| Box, Inc., Class A | | 3.1 | % |
| Carlisle Cos., Inc. | | 3.0 | % |
| Scotts Miracle-Gro Co. | | 3.0 | % |
| Crane Co. | | 2.9 | % |
| Ciena Corp. | | 2.9 | % |
| Portfolio Allocation (% of Net Assets) | | | |
| Information Technology | | 21.6 | % |
| Industrials | | 19.8 | % |
| Health Care | | 9.9 | % |
| Materials | | 9.9 | % |
| Consumer Discretionary | | 9.9 | % |
| Financials | | 9.2 | % |
| Consumer Staples | | 8.4 | % |
| Short-Term Investments | | 6.4 | % |
| Communication Services | | 3.4 | % |
| Energy | | 1.6 | % |
| Other Assets and Liabilities, Net | | (0.1 | %) |
Additional Information If you wish to view additional information about the Fund; including but not limited to financial statements or holdings, please visit www.madisonfunds.com/documents. Phone: 1-800-877-6089 |  |
| | Annual Shareholder Report
October 31, 2024 |
| Small Cap Fund Class A | MASMX |
 | Annual Shareholder Report October 31, 2024 |
| | |
Small Cap Fund Class Y
Madison Small Cap Fund
BVAOX
Fund Overview
This annual shareholder report contains important information about Small Cap Fund Class Y for the period of November 1, 2023 to October 31, 2024. You can find additional information about the Fund at www.madisonfunds.com/documents. You can also request this information by contacting us at 1-800-877-6089.
What were the Fund costs for last year?
(based on a hypothetical $10,000 investment)
| | | Cost of a $10,000
investment | | | Costs paid as a
percentage of a
$10,000 investment | |
| Class Y | | | $131 | | | | 1.10% | |
| | | | | | | | | |
How did the Fund perform last year and what affected its performance?
The three strongest areas of outperformance were Consumer Discretionary Information Technology, and Materials. In consumer discretionary, driven by strong stock selection. Our IT holdings built on the strong 2023 performance after a tough year in 2022 which provided us with many opportunities to invest in attractive companies at distressed prices. While this benefit continued, software investment was largely weak in 2024 which provided us with several investment opportunities in software. Materials also benefited from strong stock selection as two core investments delivered strong returns Consumer Staples, financials and cash were our largest detractors from performance, Although or investments in both financials and staples delivered positive returns, we still lagged the benchmark, especially in staples. In financials, our lack of exposure in REITS.
Generally, stock selection continued to be a very strong driver of performance for the Madison small cap fund. We attribute much of this to our conviction in our investments. Our strongest absolute returns generally came from our largest positions, and our largest positions are our highest quality franchises. Quality organizations in the small cap universe are scarce; especially now, as higher interest rates and an uncertain economic backdrop are stressors for smaller companies.
Looking ahead, investors are reaping the benefits of a very strong stretch of performance in mega cap companies. The Russell 2000 is still trading below its November 2021 high, while the S&P has enjoyed two strong years of 20% plus returns. Although we can’t say small caps are cheap anymore, we do believe they still represent material relative value as opposed to large and mega caps.
The currently easing interest rate environment could benefit our housing-related investments and our industrial investments. Combined with the anticipated benefits of reshoring and infrastructure funding from the IRA, we may see improving demand in this part of the economy. The consumer remains resilient and with inflation now largely subdued, the focus now turns to employment and other macro factors. Our investments in Consumer Staples and other defensive, non-cyclical companies can provide some stable returns if the environment becomes uncertain.
Overall, 2024 was a strong year for the Madison small cap fund. Our challenge is to build upon this performance in an increasingly strong bull market, while protecting our investors backs from downside risks. We intend to do this by sticking to our long tenured investment philosophy of convicted investment in high quality franchises at attractive valuations.
| Small Cap Fund Class Y | BVAOX |
Fund Performance
The chart below illustrates the total value of a hypothetical $10,000 investment in the Fund over the past 10 years (or for the life of the Fund if shorter).

| Average Annual Total Returns (%) | |
| | 1 Year | 5 Years | 10 Years |
| Class Y | 38.06% | 10.03% | 7.43% |
| Russell 2000 Index | 34.07% | 8.50% | 7.94% |
| Russell 2500 Index | 33.08% | 9.81% | 8.92% |
1. Fund returns are calculated after fund expenses have been subtracted and assume that dividends and capital gains are reinvested in additional shares of a fund. Returns do not reflect the deduction of taxes that a shareholder would pay on fund distributions or the redemption of fund shares. Investment return and principal value will fluctuate, so an investor’s shares, when redeemed, may be worth more or less than original cost. Further information relating to the fund’s performance is contained in the prospectus and elsewhere in this report. The Fund’s past performance is not indicative of future performance.
2. The Russell 2000 Index is a small-cap market index which measures the performance of the smallest 2,000 companies in the Russell 3000 Index.
3. The Russell 2500 Index is a broad index, featuring 2,500 stocks that cover the small- and mid-cap market capitalizations of the US equity universe.
| Key Fund Statistics (As of October 31, 2024) | | | | | | | | |
| Total Net Assets | | | | | | | $188,004,390 | |
| # of Portfolio Holdings | | | | | | | 46 | |
| Portfolio Turnover Rate | | | | | | | 39% | |
| Total Advisory Fees Paid | | | | | | | $1,604,722 | |
| Small Cap Fund Class Y | BVAOX |
What does the Fund invest in?
The Fund invested primarily in a diversified mix of common stocks of small cap U.S. companies that is defined as those companies with market capitalization of between $100 million and $15 billion.
| Top Ten Holdings (% of Net Assets) | | | |
| Encompass Health Corp. | | 4.5 | % |
| Summit Materials, Inc., Class A | | 4.5 | % |
| OneSpaWorld Holdings Ltd. | | 3.9 | % |
| Cogent Communications Holdings, Inc. | | 3.4 | % |
| Core & Main, Inc., Class A | | 3.2 | % |
| Box, Inc., Class A | | 3.1 | % |
| Carlisle Cos., Inc. | | 3.0 | % |
| Scotts Miracle-Gro Co. | | 3.0 | % |
| Crane Co. | | 2.9 | % |
| Ciena Corp. | | 2.9 | % |
| Portfolio Allocation (% of Net Assets) | | | |
| Information Technology | | 21.6 | % |
| Industrials | | 19.8 | % |
| Health Care | | 9.9 | % |
| Materials | | 9.9 | % |
| Consumer Discretionary | | 9.9 | % |
| Financials | | 9.2 | % |
| Consumer Staples | | 8.4 | % |
| Short-Term Investments | | 6.4 | % |
| Communication Services | | 3.4 | % |
| Energy | | 1.6 | % |
| Other Assets and Liabilities, Net | | (0.1 | %) |
Additional Information If you wish to view additional information about the Fund; including but not limited to financial statements or holdings, please visit www.madisonfunds.com/documents. Phone: 1-800-877-6089 |  |
| | Annual Shareholder Report
October 31, 2024 |
| Small Cap Fund Class Y | BVAOX |
 | Annual Shareholder Report October 31, 2024 |
Small Cap Fund Class I
Madison Small Cap Fund
MSCIX
Fund Overview
This annual shareholder report contains important information about Small Cap Fund Class I for the period of November 1, 2023 to October 31, 2024. You can find additional information about the Fund at www.madisonfunds.com/documents. You can also request this information by contacting us at 1-800-877-6089.
What were the Fund costs for last year?
(based on a hypothetical $10,000 investment)
| | | Cost of a $10,000
investment | | | Costs paid as a
percentage of a
$10,000 investment | |
| Class I | | | $119 | | | | 1.00% | |
| | | | | | | | | |
How did the Fund perform last year and what affected its performance?
The three strongest areas of outperformance were Consumer Discretionary Information Technology, and Materials. In consumer discretionary, driven by strong stock selection. Our IT holdings built on the strong 2023 performance after a tough year in 2022 which provided us with many opportunities to invest in attractive companies at distressed prices. While this benefit continued, software investment was largely weak in 2024 which provided us with several investment opportunities in software. Materials also benefited from strong stock selection as two core investments delivered strong returns
Consumer Staples, financials and cash were our largest detractors from performance, Although or investments in both financials and staples delivered positive returns, we still lagged the benchmark, especially in staples. In financials, our lack of exposure in REITS.
Generally, stock selection continued to be a very strong driver of performance for the Madison small cap fund. We attribute much of this to our conviction in our investments. Our strongest absolute returns generally came from our largest positions, and our largest positions are our highest quality franchises. Quality organizations in the small cap universe are scarce; especially now, as higher interest rates and an uncertain economic backdrop are stressors for smaller companies.
Looking ahead, investors are reaping the benefits of a very strong stretch of performance in mega cap companies. The Russell 2000 is still trading below its November 2021 high, while the S&P has enjoyed two strong years of 20% plus returns. Although we can’t say small caps are cheap anymore, we do believe they still represent material relative value as opposed to large and mega caps.
The currently easing interest rate environment could benefit our housing-related investments and our industrial investments. Combined with the anticipated benefits of reshoring and infrastructure funding from the IRA, we may see improving demand in this part of the economy. The consumer remains resilient and with inflation now largely subdued, the focus now turns to employment and other macro factors. Our investments in Consumer Staples and other defensive, non-cyclical companies can provide some stable returns if the environment becomes uncertain.
Overall, 2024 was a strong year for the Madison small cap fund. Our challenge is to build upon this performance in an increasingly strong bull market, while protecting our investors backs from downside risks. We intend to do this by sticking to our long tenured investment philosophy of convicted investment in high quality franchises at attractive valuations.
| Small Cap Fund Class I | MSCIX |
Fund Performance
The chart below illustrates the total value of a hypothetical $250,000 investment in the Fund over the past 10 years (or for the life of the Fund if shorter).

| Average Annual Total Returns (%) |
| | 1 Year | Since Inception 2/26/21 |
| Class I | 38.24% | 3.47% |
| Russell 2000 Index | 34.07% | 1.31% |
| Russell 2500 Index | 33.08% | 3.75% |
1. Fund returns are calculated after fund expenses have been subtracted and assume that dividends and capital gains are reinvested in additional shares of a fund. Returns do not reflect the deduction of taxes that a shareholder would pay on fund distributions or the redemption of fund shares. Investment return and principal value will fluctuate, so an investor’s shares, when redeemed, may be worth more or less than original cost. Further information relating to the fund’s performance is contained in the prospectus and elsewhere in this report. The Fund’s past performance is not indicative of future performance.
2. The Russell 2000 Index is a small-cap market index which measures the performance of the smallest 2,000 companies in the Russell 3000 Index.
3. The Russell 2500 Index is a broad index, featuring 2,500 stocks that cover the small- and mid-cap market capitalizations of the US equity universe.
| Key Fund Statistics (As of October 31, 2024) | | | | | | | | |
| Total Net Assets | | | | | | | $188,004,390 | |
| # of Portfolio Holdings | | | | | | | 46 | |
| Portfolio Turnover Rate | | | | | | | 39% | |
| Total Advisory Fees Paid | | | | | | | $1,604,722 | |
| Small Cap Fund Class I | MSCIX |
What does the Fund invest in?
The Fund invested primarily in a diversified mix of common stocks of small cap U.S. companies that is defined as those companies with market capitalization of between $100 million and $15 billion.
| Top Ten Holdings (% of Net Assets) | | | |
| Encompass Health Corp. | | 4.5 | % |
| Summit Materials, Inc., Class A | | 4.5 | % |
| OneSpaWorld Holdings Ltd. | | 3.9 | % |
| Cogent Communications Holdings, Inc. | | 3.4 | % |
| Core & Main, Inc., Class A | | 3.2 | % |
| Box, Inc., Class A | | 3.1 | % |
| Carlisle Cos., Inc. | | 3.0 | % |
| Scotts Miracle-Gro Co. | | 3.0 | % |
| Crane Co. | | 2.9 | % |
| Ciena Corp. | | 2.9 | % |
| Portfolio Allocation (% of Net Assets) | | | |
| Information Technology | | 21.6 | % |
| Industrials | | 19.8 | % |
| Health Care | | 9.9 | % |
| Materials | | 9.9 | % |
| Consumer Discretionary | | 9.9 | % |
| Financials | | 9.2 | % |
| Consumer Staples | | 8.4 | % |
| Short-Term Investments | | 6.4 | % |
| Communication Services | | 3.4 | % |
| Energy | | 1.6 | % |
| Other Assets and Liabilities, Net | | (0.1 | %) |
Additional Information If you wish to view additional information about the Fund; including but not limited to financial statements or holdings, please visit www.madisonfunds.com/documents. Phone: 1-800-877-6089 |  |
| | Annual Shareholder Report
October 31, 2024 |
| Small Cap Fund Class I | MSCIX |
 | Annual Shareholder Report October 31, 2024 |
Small Cap Fund Class R6
Madison Small Cap Fund
MSCRX
Fund Overview
This annual shareholder report contains important information about Small Cap Fund Class R6 for the period of November 1, 2023 to October 31, 2024. You can find additional information about the Fund at www.madisonfunds.com/documents. You can also request this information by contacting us at 1-800-877-6089.
What were the Fund costs for last year?
(based on a hypothetical $10,000 investment)
| | | Cost of a $10,000
investment | | | Costs paid as a
percentage of a
$10,000 investment | |
| Class R6 | | | $110 | | | | 0.92% | |
| | | | | | | | | |
How did the Fund perform last year and what affected its performance?
The three strongest areas of outperformance were Consumer Discretionary Information Technology, and Materials. In consumer discretionary, driven by strong stock selection. Our IT holdings built on the strong 2023 performance after a tough year in 2022 which provided us with many opportunities to invest in attractive companies at distressed prices. While this benefit continued, software investment was largely weak in 2024 which provided us with several investment opportunities in software. Materials also benefited from strong stock selection as two core investments delivered strong returns
Consumer Staples, financials and cash were our largest detractors from performance, Although or investments in both financials and staples delivered positive returns, we still lagged the benchmark, especially in staples. In financials, our lack of exposure in REITS.
Generally, stock selection continued to be a very strong driver of performance for the Madison small cap fund. We attribute much of this to our conviction in our investments. Our strongest absolute returns generally came from our largest positions, and our largest positions are our highest quality franchises. Quality organizations in the small cap universe are scarce; especially now, as higher interest rates and an uncertain economic backdrop are stressors for smaller companies.
Looking ahead, investors are reaping the benefits of a very strong stretch of performance in mega cap companies. The Russell 2000 is still trading below its November 2021 high, while the S&P has enjoyed two strong years of 20% plus returns. Although we can’t say small caps are cheap anymore, we do believe they still represent material relative value as opposed to large and mega caps.
The currently easing interest rate environment could benefit our housing-related investments and our industrial investments. Combined with the anticipated benefits of reshoring and infrastructure funding from the IRA, we may see improving demand in this part of the economy. The consumer remains resilient and with inflation now largely subdued, the focus now turns to employment and other macro factors. Our investments in Consumer Staples and other defensive, non-cyclical companies can provide some stable returns if the environment becomes uncertain.
Overall, 2024 was a strong year for the Madison small cap fund. Our challenge is to build upon this performance in an increasingly strong bull market, while protecting our investors backs from downside risks. We intend to do this by sticking to our long tenured investment philosophy of convicted investment in high quality franchises at attractive valuations.
| Small Cap Fund Class R6 | MSCRX |
Fund Performance
The chart below illustrates the total value of a hypothetical $500,000 investment in the Fund over the past 10 years (or for the life of the Fund if shorter).

| Average Annual Total Returns (%) |
| | 1 Year | Since Inception 2/28/22 |
| Class R6 | 38.27% | 4.63% |
| Russell 2000 Index | 34.07% | 4.20% |
| Russell 2500 Index | 33.08% | 5.04% |
1. Fund returns are calculated after fund expenses have been subtracted and assume that dividends and capital gains are reinvested in additional shares of a fund. Returns do not reflect the deduction of taxes that a shareholder would pay on fund distributions or the redemption of fund shares. Investment return and principal value will fluctuate, so an investor’s shares, when redeemed, may be worth more or less than original cost. Further information relating to the fund’s performance is contained in the prospectus and elsewhere in this report. The Fund’s past performance is not indicative of future performance.
2. The Russell 2000 Index is a small-cap market index which measures the performance of the smallest 2,000 companies in the Russell 3000 Index.
3. The Russell 2500 Index is a broad index, featuring 2,500 stocks that cover the small- and mid-cap market capitalizations of the US equity universe.
| Key Fund Statistics (As of October 31, 2024) | | | | | | | | |
| Total Net Assets | | | | | | | $188,004,390 | |
| # of Portfolio Holdings | | | | | | | 46 | |
| Portfolio Turnover Rate | | | | | | | 39% | |
| Total Advisory Fees Paid | | | | | | | $1,604,722 | |
| Small Cap Fund Class R6 | MSCRX |
What does the Fund invest in?
The Fund invested primarily in a diversified mix of common stocks of small cap U.S. companies that is defined as those companies with market capitalization of between $100 million and $15 billion.
| Top Ten Holdings (% of Net Assets) | | | |
| Encompass Health Corp. | | 4.5 | % |
| Summit Materials, Inc., Class A | | 4.5 | % |
| OneSpaWorld Holdings Ltd. | | 3.9 | % |
| Cogent Communications Holdings, Inc. | | 3.4 | % |
| Core & Main, Inc., Class A | | 3.2 | % |
| Box, Inc., Class A | | 3.1 | % |
| Carlisle Cos., Inc. | | 3.0 | % |
| Scotts Miracle-Gro Co. | | 3.0 | % |
| Crane Co. | | 2.9 | % |
| Ciena Corp. | | 2.9 | % |
| Portfolio Allocation (% of Net Assets) | | | |
| Information Technology | | 21.6 | % |
| Industrials | | 19.8 | % |
| Health Care | | 9.9 | % |
| Materials | | 9.9 | % |
| Consumer Discretionary | | 9.9 | % |
| Financials | | 9.2 | % |
| Consumer Staples | | 8.4 | % |
| Short-Term Investments | | 6.4 | % |
| Communication Services | | 3.4 | % |
| Energy | | 1.6 | % |
| Other Assets and Liabilities, Net | | (0.1 | %) |
Additional Information If you wish to view additional information about the Fund; including but not limited to financial statements or holdings, please visit www.madisonfunds.com/documents. Phone: 1-800-877-6089 |  |
| | Annual Shareholder Report
October 31, 2024 |
| Small Cap Fund Class R6 | MSCRX |
 | Annual Shareholder Report October 31, 2024 |
| | |
International Stock Fund Class A
Madison International Stock Fund
MINAX
Fund Overview
This annual shareholder report contains important information about International Stock Fund Class A for the period of November 1, 2023 to October 31, 2024. You can find additional information about the Fund at www.madisonfunds.com/documents. You can also request this information by contacting us at 1-800-877-6089. This report describes changes to the Fund that occurred during the reporting period.
What were the Fund costs for last year?
(based on a hypothetical $10,000 investment)
| | | Cost of a $10,000
investment | | | Costs paid as a
percentage of a
$10,000 investment | |
| Class A | | | $176 | | | | 1.61% | |
| | | | | | | | | |
How did the Fund perform last year and what affected its performance?
International equity markets were broadly very strong over the period. Declining inflation levels and other reassuring economic data gave most major central banks the confidence to initiate interest rate cuts. China also stepped up stimulus efforts to tackle its economic malaise. Concurrently, the military situations in Ukraine and the Middle East continued to elevate geopolitical risk, and political elections in many countries impacted sentiment and volatility.
Looking at the relative underperformance of the Portfolio, all regions except for North America detracted, led by Pacific ex- Japan and Japan because of negative stock selection. Among economic sectors, Financials was a clear weak point, followed by Consumer Staples from negative allocation, stock selection, and currency effects. Among the contributors, Communication Services, Consumer Discretionary, and Energy led, all driven by positive allocation and stock selection effects.
Portfolio structure is determined using bottom-up stock selection within a risk-controlled framework, and positioning shifted somewhat in certain regions and sectors over the one-year period. Of the three geographic buckets the Portfolio is viewed on relative to the benchmark, the Developed Europe overweight narrowed because of adjustments to existing positions, while the Other Developed underweight reduced to an almost equal weight from adding one new name and adjustments to existing positions. During the fiscal year, two stocks were new buys, and one was a complete elimination to take profits, all within the Financials sector. The relative underweight in this sector increased despite the one net addition because the index performance was so strong, raising the sector weight. There was also some movement in the relative positioning of other sectors including Consumer Staples, Communication Services, Health Care, and Information Technology through adjustments to existing positions and/or index weight movement.
| International Stock Fund Class A | |
Fund Performance
The chart below illustrates the total value of a hypothetical $10,000 investment in the Fund over the past 10 years (or for the life of the Fund if shorter).
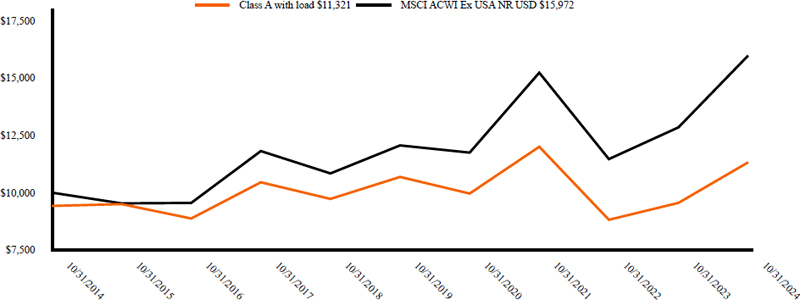
| Average Annual Total Returns (%) | |
| | 1 Year | 5 Years | 10 Years |
| Class A | 18.51% | 1.16% | 1.85% |
| Class A with load | 11.74% | (0.03%) | 1.25% |
| MSCI ACWI Ex USA NR USD | 24.33% | 5.78% | 4.79% |
1. Fund returns are calculated after fund expenses have been subtracted and assume that dividends and capital gains are reinvested in additional shares of a fund. Returns do not reflect the deduction of taxes that a shareholder would pay on fund distributions or the redemption of fund shares. Investment return and principal value will fluctuate, so an investor’s shares, when redeemed, may be worth more or less than original cost. Further information relating to the fund’s performance is contained in the prospectus and elsewhere in this report. The fund’s past performance is not indicative of future performance.
2. Maximum sales charge is 5.75% for class A shares.
3. The MSCI ACWI ex-US Index (net) is a market-capitalization-weighted index maintained by Morgan Stanley Capital International (MSCI) and designed to provide a broad measure of stock performance throughout the world, with the exception of US -based companies. The index includes both developed and emerging markets.
| Key Fund Statistics (As of October 31, 2024) | | | | | | | | |
| Total Net Assets | | | | | | | $12,121,140 | |
| # of Portfolio Holdings | | | | | | | 58 | |
| Portfolio Turnover Rate | | | | | | | 20% | |
| Total Advisory Fees Paid | | | | | | | $133,791 | |
| International Stock Fund Class A | |
What does the Fund invest in?
The Fund invested in stocks of foreign companies, defined as those with principal operations, organization, or trading outside the U.S., or whose securities are in foreign currencies. This includes common stocks, convertible securities, preferred stocks, and equity interests such as ADRs, EDRs, GDRs, and SDRs.
| Top Ten Holdings (% of Net Assets) | | | |
| Deutsche Telekom AG | | 3.4 | % |
| Tencent Holdings Ltd. | | 3.2 | % |
| HDFC Bank Ltd. | | 2.9 | % |
| Alibaba Group Holding Ltd. | | 2.9 | % |
| Larsen & Toubro Ltd. | | 2.9 | % |
| Airbus SE | | 2.5 | % |
| AstraZeneca PLC | | 2.6 | % |
| Kerry Group PLC, Class A | | 2.4 | % |
| AIA Group Ltd. | | 2.4 | % |
| Cameco Corp. | | 2.4 | % |
| Sector Allocation (% of Net Assets) | | | |
| Financials | | 17.2 | % |
| Information Technology | | 15.4 | % |
| Consumer Discretionary | | 12.6 | % |
| Industrials | | 11.8 | % |
| Consumer Staples | | 10.3 | % |
| Materials | | 10.3 | % |
| Communication Services | | 8.1 | % |
| Health Care | | 7.8 | % |
| Short-Term Investments | | 5.4 | % |
| Energy | | 4.3 | % |
| Other Assets and Liabilities, Net | | (3.2 | %) |
| Geographical Allocation (% of Net Assets) | | | |
| Japan | | 18.1 | % |
| Germany | | 12.0 | % |
| France | | 8.4 | % |
| China | | 8.3 | % |
| United Kingdom | | 8.3 | % |
| India | | 7.6 | % |
| Switzerland | | 6.4 | % |
| United States | | 5.4 | % |
| Canada | | 5.2 | % |
| Mexico | | 5.1 | % |
| Netherlands | | 3.0 | % |
| Ireland | | 2.4 | % |
| Hong Kong | | 2.4 | % |
| Taiwan | | 2.2 | % |
| Australia | | 1.8 | % |
| Israel | | 1.7 | % |
| Brazil | | 1.4 | % |
| Norway | | 1.3 | % |
| Denmark | | 1.1 | % |
| Italy | | 1.1 | % |
Material Fund Changes
On November 6, 2024, the Board of Trustees of the Madison Funds approved the liquidation of the Madison International Stock Fund. The liquidation is expected to occur on or about February 21, 2025.
This is a summary of certain planned changes to the Fund since October 31, 2024. For more complete information, you may review the Fund’s next prospectus, which we expect to be available by February 28th, 2025 at www.madisonfunds.com or upon request by calling 1-800-877-6089.
Additional Information If you wish to view additional information about the Fund; including but not limited to financial statements or holdings, please visit www.madisonfunds.com/documents. Phone: 1-800-877-6089 |  |
| | Annual Shareholder Report
October 31, 2024 |
| International Stock Fund Class A | |
 | Annual Shareholder Report October 31, 2024 |
| | |
International Stock Fund Class Y
Madison International Stock Fund
MINYX
Fund Overview
This annual shareholder report contains important information about International Stock Fund Class Y for the period of November 1, 2023 to October 31, 2024. You can find additional information about the Fund at www.madisonfunds.com/documents. You can also request this information by contacting us at 1-800-877-6089. This report describes changes to the Fund that occurred during the reporting period.
What were the Fund costs for last year?
(based on a hypothetical $10,000 investment)
| | | Cost of a $10,000
investment | | | Costs paid as a
percentage of a
$10,000 investment | |
| Class Y | | | $149 | | | | 1.36% | |
| | | | | | | | | |
How did the Fund perform last year and what affected its performance?
International equity markets were broadly very strong over the period. Declining inflation levels and other reassuring economic data gave most major central banks the confidence to initiate interest rate cuts. China also stepped up stimulus efforts to tackle its economic malaise. Concurrently, the military situations in Ukraine and the Middle East continued to elevate geopolitical risk, and political elections in many countries impacted sentiment and volatility.
Looking at the relative underperformance of the Portfolio, all regions except for North America detracted, led by Pacific ex- Japan and Japan because of negative stock selection. Among economic sectors, Financials was a clear weak point, followed by Consumer Staples from negative allocation, stock selection, and currency effects. Among the contributors, Communication Services, Consumer Discretionary, and Energy led, all driven by positive allocation and stock selection effects.
Portfolio structure is determined using bottom-up stock selection within a risk-controlled framework, and positioning shifted somewhat in certain regions and sectors over the one-year period. Of the three geographic buckets the Portfolio is viewed on relative to the benchmark, the Developed Europe overweight narrowed because of adjustments to existing positions, while the Other Developed underweight reduced to an almost equal weight from adding one new name and adjustments to existing positions. During the fiscal year, two stocks were new buys, and one was a complete elimination to take profits, all within the Financials sector. The relative underweight in this sector increased despite the one net addition because the index performance was so strong, raising the sector weight. There was also some movement in the relative positioning of other sectors including Consumer Staples, Communication Services, Health Care, and Information Technology through adjustments to existing positions and/or index weight movement.
| International Stock Fund Class Y | |
Fund Performance
The chart below illustrates the total value of a hypothetical $10,000 investment in the Fund over the past 10 years (or for the life of the Fund if shorter).
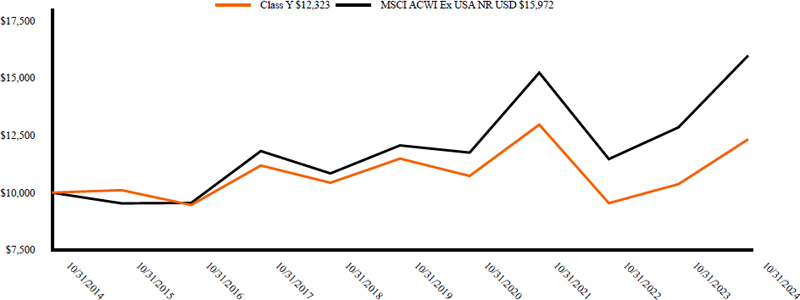
| Average Annual Total Returns (%) | |
| | 1 Year | 5 Years | 10 Years |
| Class Y | 18.82% | 1.42% | 2.11% |
| MSCI ACWI Ex USA NR USD | 24.33% | 5.78% | 4.79% |
1. Fund returns are calculated after fund expenses have been subtracted and assume that dividends and capital gains are reinvested in additional shares of a fund. Returns do not reflect the deduction of taxes that a shareholder would pay on fund distributions or the redemption of fund shares. Investment return and principal value will fluctuate, so an investor’s shares, when redeemed, may be worth more or less than original cost. Further information relating to the fund’s performance is contained in the prospectus and elsewhere in this report. The Fund’s past performance is not indicative of future performance.
2. The MSCI ACWI ex-US Index (net) is a market-capitalization-weighted index maintained by Morgan Stanley Capital International (MSCI) and designed to provide a broad measure of stock performance throughout the world, with the exception of US-based companies. The index includes both developed and emerging markets.
| Key Fund Statistics (As of October 31, 2024) | | | | | | | | |
| Total Net Assets | | | | | | | $12,121,140 | |
| # of Portfolio Holdings | | | | | | | 58 | |
| Portfolio Turnover Rate | | | | | | | 20% | |
| Total Advisory Fees Paid | | | | | | | $133,791 | |
| International Stock Fund Class Y | |
What does the Fund invest in?
The Fund invested in stocks of foreign companies, defined as those with principal operations, organization, or trading outside the U.S., or whose securities are in foreign currencies. This includes common stocks, convertible securities, preferred stocks, and equity interests such as ADRs, EDRs, GDRs, and SDRs.
| Top Ten Holdings (% of Net Assets) | | | |
| Deutsche Telekom AG | | 3.4 | % |
| Tencent Holdings Ltd. | | 3.2 | % |
| HDFC Bank Ltd. | | 2.9 | % |
| Alibaba Group Holding Ltd. | | 2.9 | % |
| Larsen & Toubro Ltd. | | 2.9 | % |
| Airbus SE | | 2.5 | % |
| AstraZeneca PLC | | 2.6 | % |
| Kerry Group PLC, Class A | | 2.4 | % |
| AIA Group Ltd. | | 2.4 | % |
| Cameco Corp. | | 2.4 | % |
| Sector Allocation (% of Net Assets) | | | |
| Financials | | 17.2 | % |
| Information Technology | | 15.4 | % |
| Consumer Discretionary | | 12.6 | % |
| Industrials | | 11.8 | % |
| Consumer Staples | | 10.3 | % |
| Materials | | 10.3 | % |
| Communication Services | | 8.1 | % |
| Health Care | | 7.8 | % |
| Short-Term Investments | | 5.4 | % |
| Energy | | 4.3 | % |
| Other Assets and Liabilities, Net | | (3.2 | %) |
| Geographical Allocation (% of Net Assets) | | | |
| Japan | | 18.1 | % |
| Germany | | 12.0 | % |
| France | | 8.4 | % |
| China | | 8.3 | % |
| United Kingdom | | 8.3 | % |
| India | | 7.6 | % |
| Switzerland | | 6.4 | % |
| United States | | 5.4 | % |
| Canada | | 5.2 | % |
| Mexico | | 5.1 | % |
| Netherlands | | 3.0 | % |
| Ireland | | 2.4 | % |
| Hong Kong | | 2.4 | % |
| Taiwan | | 2.2 | % |
| Australia | | 1.8 | % |
| Israel | | 1.7 | % |
| Brazil | | 1.4 | % |
| Norway | | 1.3 | % |
| Denmark | | 1.1 | % |
| Italy | | 1.1 | % |
Material Fund Changes
On November 6, 2024, the Board of Trustees of the Madison Funds approved the liquidation of the Madison International Stock Fund. The liquidation is expected to occur on or about February 21, 2025.
This is a summary of certain planned changes to the Fund since October 31, 2024. For more complete information, you may review the Fund’s next prospectus, which we expect to be available by February 28th, 2025 at www.madisonfunds.com or upon request by calling 1-800-877-6089.
Additional Information If you wish to view additional information about the Fund; including but not limited to financial statements or holdings, please visit www.madisonfunds.com/documents. Phone: 1-800-877-6089 |  |
| | Annual Shareholder Report
October 31, 2024 |
| International Stock Fund Class Y | |
Item 2. Code of Ethics.
| (a) | The registrant has adopted a code of ethics that applies to the registrant’s principal executive officer, principal financial officer, principal accounting officer or controller or persons performing similar functions, regardless of whether these individuals are employed by the registrant or a third party. |
| (b) | The code of ethics is filed as an exhibit to this Form N-CSR. |
| (c) | During the period covered by the report, registrant did not make any substantive amendments to the Code. |
| (d) | During the period covered by the report, registrant did not grant any waivers, including implicit waivers, from the provisions of the Code. |
| (e) | Any person may obtain a complete copy of the code without charge by calling the Adviser at 800-767-0300 and requesting a copy of “the Madison Funds Sarbanes Oxley Code of Ethics.” |
Item 3. Audit Committee Financial Expert.
In August 2024, Scott Jones, Richard Struthers and Anita Zagrodnik, “independent” Trustees, and members of the registrant’s audit committee, were appointed to serve as the registrant’s audit committee financial experts among the four independent Trustees who so qualify to serve in that capacity.
Item 4. Principal Accountant Fees and Services.
| (a) | Audit Fees. Total audit fees paid (or to be paid) to the registrant’s principal accountant for the fiscal years ended October 31, 2024, and 2023, respectively were $244,000 ($458,910 including the Ultra Series Fund, all affiliated investment companies “together, the “Affiliated Funds”) and $232,000 ($465,450 including the Affiliated Funds). |
| (b) | Audit-Related Fees. For the fiscal years ended October 31, 2024 and October 31, 2023, the aggregate fees for professional services rendered by Deloitte & Touche for assurance and related services by such firm that were reasonably related to the performance of the audit of the registrant’s annual financial statements other than those referenced in paragraph (a) above, totaled $0 and $0, respectively. |
| (c) | Tax-Fees. For the fiscal years ended October 31, 2024 and October 31, 2023, the aggregate fees paid (or to be paid) for professional services rendered by Deloitte & Touche for tax compliance, tax advice and tax planning are approximately $50,636 ($86,945 including the Affiliated Funds) and $49,140 ($104,969) including the Affiliated Funds), respectively. |
In the scope of services comprising the fees disclosed under this Item 4(c) were the following services:
| - | Review and sign as signature preparer for U.S. Income Tax Return for Regulated Investment Companies, Form 1120-RIC, Return of Excise Tax on Undistributed Income of Regulated Investment Companies, Form 8613 and appropriate State tax returns. |
| (e) | (1) Before any accountant is engaged by the registrant to render audit or non-audit services, the engagement must be approved by the audit committee as contemplated by paragraph (c)(7)(i)(A) of Rule 2-01of Regulation S-X. |
| (e) | (2) The Audit Committee has pre-approved, as required by Rule 2-01(c)(7)(i)(C) of Regulation S-X, 100% of the services described in this Item 4(b) through (d), which such services are described above. |
| (f) | All of the principal accountant’s hours spent on auditing the registrant’s financial statements were attributed to work performed by full-time permanent employees of the principal accountant. |
| (h) | The audit committee of the board of trustees/directors has considered whether the provision of non-audit services that were rendered to the registrant’s investment adviser is compatible with maintaining the principal accountant’s independence and has concluded that the provision of such non-audit services by the accountant has not compromised the accountant’s independence. |
| (i) | The registrant has not been identified by the U.S. Securities and Exchange Commission as having filed an annual report issued by a registered public accounting firm branch or office that is located in a foreign jurisdiction where the Public Company Accounting Oversight Board is unable to inspect or completely investigate because of a position taken by an authority in that jurisdiction. |
| (j) | The registrant is not a foreign issuer. |
Item 5. Audit Committee of Listed Registrants.
Item 6. Schedule of Investments
| (a) | Schedule of Investments is included as part of the Financial Statement and Financial Highlights for Open-End Management Investment Companies filed under Item 7 of this Form. |
Item 7. Financial Statements and Financial Highlights for Open-End Management Investment Companies.
| (a) | The registrant’s Financial Statements are attached herewith. |
| (b) | The registrant’s Financial Highlights are attached herewith. |
 | Annual Financial Statements and Other Information October 31, 2024 |
| | Madison Conservative Allocation Fund |
| | |
| | Madison Moderate Allocation Fund |
| | |
| | Madison Aggressive Allocation Fund |
| | |
| | Madison Diversified Income Fund |
| | |
| | Madison Tax-Free Virginia Fund |
| | |
| | Madison Tax-Free National Fund |
| | |
| | Madison High Quality Bond Fund |
| | |
| | Madison Core Bond Fund |
| | |
| | Madison Covered Call & Equity Income Fund |
| | |
| | Madison Dividend Income Fund |
| | |
| | Madison Investors Fund |
| | |
| | Madison Sustainable Equity Fund |
| | |
| | Madison Mid Cap Fund |
| | |
| | Madison Small Cap Fund |
| | |
| | Madison International Stock Fund |
55O SCIENCE DRIVE, MADISON, WI 53711 | 800.877.6089 | MADISONFUNDS.COM
Madison Funds | October 31, 2024
Table of Contents
Madison Funds | October 31, 2024
Conservative Allocation Fund Portfolio of Investments
| | | Shares | | | Value (Note 2, 3) | |
| EXCHANGE TRADED FUNDS - 52.3% | | | | | | |
| Bond Funds - 28.7% | | | | | | |
| iShares Aaa - A Rated Corporate Bond ETF | | | 49,981 | | | $ | 2,382,094 | |
| iShares Treasury Floating Rate Bond ETF | | | 35,132 | | | | 1,778,031 | |
| Janus Henderson Mortgage-Backed Securities ETF | | | 48,149 | | | | 2,166,224 | |
| Schwab Intermediate-Term U.S. Treasury ETF (A) | | | 246,350 | | | | 6,065,137 | |
| | | | | | | | 12,391,486 | |
| | | | | | | | | |
| Foreign Stock Funds - 7.7% | | | | | | | | |
| Franklin FTSE Japan ETF | | | 32,230 | | | | 930,158 | |
| iShares MSCI Emerging Markets Asia ETF | | | 13,928 | | | | 1,054,767 | |
| Vanguard FTSE Europe ETF (A) | | | 19,638 | | | | 1,319,281 | |
| | | | | | | | 3,304,206 | |
| | | | | | | | | |
| Stock Funds - 15.9% | | | | | | | | |
| Distillate U.S. Fundamental Stability & Value ETF | | | 40,946 | | | | 2,271,070 | |
| Energy Select Sector SPDR Fund ETF | | | 9,177 | | | | 812,990 | |
| Invesco S&P 500 Quality ETF | | | 34,438 | | | | 2,261,543 | |
| Vanguard Information Technology ETF (A) | | | 2,612 | | | | 1,520,968 | |
| | | | | | | | 6,866,571 | |
| Total Exchange Traded Funds | | | | | | | | |
| (Cost $21,434,775) | | | | | | | 22,562,263 | |
| | | | | | | | | |
| INVESTMENT COMPANIES - 45.9% | | | | | | | | |
| Bond Funds - 38.9% | | | | | | | | |
| Madison Core Bond Fund, Class R6 (B) (C) | | | 1,877,543 | | | | 16,747,681 | |
| | | | | | | | | |
| Stock Funds - 7.0% | | | | | | | | |
| Madison Investors Fund, Class R6 (C) | | | 98,920 | | | | 3,022,004 | |
| | | | | | | | | |
| Total Investment Companies | | | | | | | | |
| (Cost $21,035,611) | | | | | | | 19,769,685 | |
| | | | | | | | | |
| SHORT-TERM INVESTMENTS - 7.9% | | | | | | | | |
| State Street Institutional U.S. Government Money Market Fund, Premier Class (D), 4.82% | | | 761,170 | | | | 761,170 | |
| State Street Navigator Securities Lending Government Money Market Portfolio (D) (E), 4.86% | | | 2,651,855 | | | | 2,651,855 | |
| | | | | | | | | |
| Total Short-Term Investments | | | | | | | | |
| (Cost $3,413,025) | | | | | | | 3,413,025 | |
| | | | | | | | | |
| TOTAL INVESTMENTS - 106.1% | | | | | | | | |
| (Cost $45,883,411**) | | | | | | | 45,744,973 | |
| NET OTHER ASSETS AND LIABILITIES - (6.1%) | | | | | | | (2,649,267 | ) |
| TOTAL NET ASSETS - 100.0% | | | | | | $ | 43,095,706 | |
| ** | Aggregate cost for Federal tax purposes was $46,053,940. |
| (A) | All or a portion of these securities, with an aggregate fair value of $2,582,109, are on loan as part of a securities lending program. See footnote (E) and Note 11 for details on the securities lending program. |
| (B) | Greater than 25% of the portfolio. For more information refer to the website madisonfunds.com/individual/core-bond-fund/. |
| (C) | Affiliated Company (see Note 14). |
| (D) | 7-day yield. |
| (E) | Represents investments of cash collateral received in connection with securities lending. |
| | |
| ETF | Exchange Traded Fund. |
| FTSE | The Financial Times Stock Exchange. |
| MSCI | Morgan Stanley Capital International. |
| S&P | Standard & Poor's |
| SPDR | Standard & Poor’s Depositary Receipt. |
See accompanying Notes to Financial Statements.
Madison Funds | October 31, 2024
Moderate Allocation Fund Portfolio of Investments
| | | Shares | | | Value (Note 2, 3) | |
| EXCHANGE TRADED FUNDS - 61.5% | | | | | | |
| Bond Funds - 21.2% | | | | | | |
| iShares Aaa - A Rated Corporate Bond ETF | | | 48,817 | | | $ | 2,326,618 | |
| iShares Treasury Floating Rate Bond ETF | | | 123,491 | | | | 6,249,880 | |
| Janus Henderson Mortgage-Backed Securities ETF | | | 51,707 | | | | 2,326,298 | |
| Schwab Intermediate-Term U.S. Treasury ETF (A) | | | 352,434 | | | | 8,676,925 | |
| | | | | | | | 19,579,721 | |
| | | | | | | | | |
| Foreign Stock Funds - 13.8% | | | | | | | | |
| Franklin FTSE Japan ETF | | | 118,807 | | | | 3,428,770 | |
| iShares MSCI Emerging Markets Asia ETF | | | 54,259 | | | | 4,109,034 | |
| Vanguard FTSE Europe ETF (A) | | | 77,276 | | | | 5,191,402 | |
| | | | | | | | 12,729,206 | |
| | | | | | | | | |
| Stock Funds - 26.5% | | | | | | | | |
| Distillate U.S. Fundamental Stability & Value ETF | | | 138,238 | | | | 7,667,371 | |
| Energy Select Sector SPDR Fund ETF | | | 34,741 | | | | 3,077,705 | |
| Invesco S&P 500 Quality ETF | | | 133,883 | | | | 8,792,096 | |
| Vanguard Information Technology ETF | | | 8,500 | | | | 4,949,550 | |
| | | | | | | | 24,486,722 | |
| | | | | | | | | |
| Total Exchange Traded Funds | | | | | | | | |
| (Cost $51,799,262) | | | | | | | 56,795,649 | |
| | | | | | | | | |
| INVESTMENT COMPANIES - 37.9% | | | | | | | | |
| Bond Funds - 25.3% | | | | | | | | |
| Madison Core Bond Fund, Class R6 (B) (C) | | | 2,618,062 | | | | 23,353,112 | |
| | | | | | | | | |
| Stock Funds - 12.6% | | | | | | | | |
| Madison Investors Fund, Class R6 (B) | | | 379,321 | | | | 11,588,254 | |
| | | | | | | | | |
| Total Investment Companies | | | | | | | | |
| (Cost $33,524,677) | | | | | | | 34,941,366 | |
| | | | | | | | | |
| SHORT-TERM INVESTMENTS - 6.4% | | | | | | | | |
| State Street Institutional U.S. Government Money Market Fund, Premier Class (D), 4.82% | | | 606,546 | | | | 606,546 | |
| State Street Navigator Securities Lending Government Money Market Portfolio (D) (E), 4.86% | | | 5,311,220 | | | | 5,311,220 | |
| | | | | | | | | |
| Total Short-Term Investments | | | | | | | | |
| (Cost $5,917,766) | | | | | | | 5,917,766 | |
| | | | | | | | | |
| TOTAL INVESTMENTS - 105.8% | | | | | | | | |
| (Cost $91,241,705**) | | | | | | | 97,654,781 | |
| | | | | | | | | |
| NET OTHER ASSETS AND LIABILITIES - (5.8%) | | | | | | | (5,313,390 | ) |
| | | | | | | | | |
| TOTAL NET ASSETS - 100.0% | | | | | | $ | 92,341,391 | |
| ** | Aggregate cost for Federal tax purposes was $91,510,642. |
| (A) | All or a portion of these securities, with an aggregate fair value of $5,171,249, are on loan as part of a securities lending program. See footnote (E) and Note 11 for details on the securities lending program. |
| (B) | Affiliated Company (see Note 14). |
| (C) | Greater than 25% of the portfolio. For more information refer to the website madisonfunds.com/individual/core-bond-fund/. |
| (D) | 7-day yield. |
| (E) | Represents investments of cash collateral received in connection with securities lending. |
| | |
| ETF | Exchange Traded Fund. |
| FTSE | The Financial Times Stock Exchange. |
| MSCI | Morgan Stanley Capital International. |
| S&P | Standard & Poor's |
| SPDR | Standard & Poor’s Depositary Receipt. |
Aggressive Allocation Fund Portfolio of Investments
| | | Shares | | | Value (Note 2, 3) | |
| EXCHANGE TRADED FUNDS - 68.9% | | | | | | |
| Bond Funds - 14.1% | | | | | | |
| iShares Treasury Floating Rate Bond ETF | | | 77,591 | | | $ | 3,926,881 | |
| Janus Henderson Mortgage-Backed Securities ETF | | | 15,158 | | | | 681,958 | |
| Schwab Intermediate-Term U.S. Treasury ETF (A) | | | 123,066 | | | | 3,029,885 | |
| | | | | | | | 7,638,724 | |
| | | | | | | | | |
| Foreign Stock Funds - 19.0% | | | | | | | | |
| Franklin FTSE Japan ETF | | | 94,559 | | | | 2,728,973 | |
| iShares MSCI Emerging Markets Asia ETF | | | 41,233 | | | | 3,122,575 | |
| Vanguard FTSE Europe ETF (A) | | | 65,919 | | | | 4,428,438 | |
| | | | | | | | 10,279,986 | |
| | | | | | | | | |
| Stock Funds - 35.8% | | | | | | | | |
| Distillate U.S. Fundamental Stability & Value ETF | | | 103,082 | | | | 5,717,443 | |
| Energy Select Sector SPDR Fund ETF | | | 25,706 | | | | 2,277,295 | |
| Invesco S&P 500 Quality ETF | | | 111,470 | | | | 7,320,235 | |
| Vanguard Information Technology ETF | | | 7,060 | | | | 4,111,038 | |
| | | | | | | | 19,426,011 | |
| | | | | | | | | |
| Total Exchange Traded Funds | | | | | | | | |
| (Cost $33,115,683) | | | | | | | 37,344,721 | |
| | | | | | | | | |
| INVESTMENT COMPANIES - 29.1% | | | | | | | | |
| Bond Funds - 13.1% | | | | | | | | |
| Madison Core Bond Fund, Class R6 (B) | | | 796,102 | | | | 7,101,233 | |
| | | | | | | | | |
| Stock Funds - 16.0% | | | | | | | | |
| Madison Investors Fund, Class R6 (B) | | | 284,946 | | | | 8,705,111 | |
| | | | | | | | | |
| Total Investment Companies | | | | | | | | |
| (Cost $13,409,574) | | | | | | | 15,806,344 | |
| | | | | | | | | |
| SHORT-TERM INVESTMENTS - 9.8% | | | | | | | | |
| State Street Institutional U.S. Government Money Market Fund, Premier Class (C), 4.82% | | | 1,069,574 | | | | 1,069,574 | |
| State Street Navigator Securities Lending Government Money Market Portfolio (C) (D), 4.86% | | | 4,230,319 | | | | 4,230,319 | |
| | | | | | | | | |
| Total Short-Term Investments | | | | | | | | |
| (Cost $5,299,893) | | | | | | | 5,299,893 | |
| | | | | | | | | |
| TOTAL INVESTMENTS - 107.8% | | | | | | | | |
| (Cost $51,825,150**) | | | | | | | 58,450,958 | |
| NET OTHER ASSETS AND LIABILITIES - (7.8%) | | | | | | | (4,238,286 | ) |
| TOTAL NET ASSETS - 100.0% | | | | | | $ | 54,212,672 | |
| ** | Aggregate cost for Federal tax purposes was $51,911,147. |
| (A) | All or a portion of these securities, with an aggregate fair value of $4,115,778, are on loan as part of a securities lending program. See footnote (D) and Note 11 for details on the securities lending program. |
| (B) | Affiliated Company (see Note 14). |
| (C) | 7-day yield. |
| (D) | Represents investments of cash collateral received in connection with securities lending. |
| | |
| ETF | Exchange Traded Fund. |
| FTSE | The Financial Times Stock Exchange. |
| MSCI | Morgan Stanley Capital International. |
| S&P | Standard & Poor's |
| SPDR | Standard & Poor’s Depositary Receipt. |
See accompanying Notes to Financial Statements.
Madison Funds | October 31, 2024
Diversified Income Fund Portfolio of Investments
| | | Par Value | | | Value (Note 2, 3) | |
| COLLATERALIZED MORTGAGE OBLIGATION - 0.0% | | | | | | |
| Financials - 0.0% | | | | | | |
| PSMC Trust, Series 2019-2, Class A1 (A) (B) (C), 3.5%, 10/25/49 | | $ | 329 | | | $ | 326 | |
| | | | | | | | | |
| Total Collateralized Mortgage | | | | | | | | |
| Obligations (Cost $335) | | | | | | | 326 | |
| | | | | | | | | |
| COMMERCIAL MORTGAGE-BACKED SECURITY - 0.0% | | | | | | | | |
| GSAMP Trust, Series 2006-S5, Class M5 (A) (C) (H), 7.488%, 9/25/36 | | | 534,000 | | | | — | |
| | | | | | | | | |
| Total Commercial Mortgage- Backed Securities (Cost $—) | | | | | | | — | |
| | | | | | | | | |
| MORTGAGE BACKED SECURITIES - 0.0% | | | | | | | | |
| Fannie Mae - 0.0% | | | | | | | | |
| 7%, 11/1/31 Pool # 607515 | | | 2,148 | | | | 2,230 | |
| 7%, 5/1/32 Pool # 644591 | | | 213 | | | | 221 | |
| | | | | | | | 2,451 | |
| | | | | | | | | |
| Freddie Mac - 0.0% | | | | | | | | |
| 4.5%, 2/1/25 Pool # J11722 | | | 342 | | | | 341 | |
| 4.5%, 5/1/25 Pool # J12247 | | | 527 | | | | 526 | |
| 8%, 6/1/30 Pool # C01005 | | | 394 | | | | 411 | |
| | | | | | | | 1,278 | |
| | | | | | | | | |
| Ginnie Mae - 0.0% | | | | | | | | |
| 6.5%, 2/20/29 Pool # 2714 | | | 2,563 | | | | 2,610 | |
| 6.5%, 4/20/31 Pool # 3068 | | | 1,964 | | | | 2,035 | |
| | | | | | | | 4,645 | |
| | | | | | | | | |
| Total Mortgage Backed Securities | | | | | | | | |
| (Cost $8,169) | | | | | | | 8,374 | |
| | | | | | | | | |
| EXCHANGE TRADED FUNDS - 97.2% | | | | | | | | |
| Bond Funds - 49.6% | | | | | | | | |
| iShares Aaa - A Rated Corporate Bond ETF (D) | | | 76,301 | | | | 3,636,506 | |
| Janus Henderson Mortgage-Backed Securities ETF | | | 253,143 | | | | 11,388,903 | |
| Madison Aggregate Bond ETF (E) | | | 1,175,000 | | | | 23,903,730 | |
| Madison Short-Term Strategic Income ETF (E) | | | 1,437,500 | | | | 29,390,981 | |
| | | | | | | | 68,320,120 | |
| | | | | | | | | |
| Stock Funds - 47.6% | | | | | | | | |
| Global X MLP ETF (D) | | | 90,087 | | | | 4,273,727 | |
| Madison Covered Call ETF (D) (E) | | | 1,595,000 | | | | 30,897,224 | |
| Madison Dividend Value ETF (E) | | | 1,100,000 | | | | 24,090,000 | |
| Vanguard Dividend Appreciation ETF | | | 32,041 | | | | 6,222,042 | |
| | | | | | | | 65,482,993 | |
| Total Exchange Traded Funds | | | | | | | | |
| (Cost $130,508,791) | | | | | | | 133,803,113 | |
| | | | | | | | | |
| SHORT-TERM INVESTMENTS - 4.0% | | | | | | | | |
| State Street Institutional U.S. Government Money Market Fund, Premier Class (F), 4.82% | | | 3,937,401 | | | | 3,937,401 | |
| State Street Navigator Securities Lending Government Money Market Portfolio (F) (G), 4.86% | | | 1,518,125 | | | | 1,518,125 | |
| | | | | | | | | |
| Total Short-Term Investments | | | | | | | | |
| (Cost $5,455,526) | | | | | | | 5,455,526 | |
| | | | | | | | | |
| TOTAL INVESTMENTS - 101.2% | | | | | | | | |
| (Cost $135,972,821**) | | | | | | | 139,267,339 | |
| | | | | | | | | |
| NET OTHER ASSETS AND LIABILITIES - (1.2%) | | | | | | | (1,641,986 | ) |
| TOTAL NET ASSETS - 100.0% | | | | | | $ | 137,625,353 | |
| ** | Aggregate cost for Federal tax purposes was $135,972,821. |
| (A) | Coupon rate may change based on changes of the underlying collateral or prepayments of principal. The coupon rate shown represents the rate at October 31, 2024. |
| (B) | Security sold within terms of a private placement memorandum exempt from registration under section 144A of the Securities Act of 1933, as amended, and may be sold only to dealers in that program or other "qualified institutional buyers." |
| (C) | Floating rate or variable rate note. Rate shown is as of October 31, 2024. |
| (D) | All or a portion of these securities, with an aggregate fair value of $1,482,579, are on loan as part of a securities lending program. See footnote (G) and Note 11 for details on the securities lending program. |
| (E) | Affiliated Company (see Note 14). |
| (F) | 7-day yield. |
| (G) | Represents investments of cash collateral received in connection with securities lending. |
| (H) | Defaulted Security. Security was deemed illiquid by Madison. Interest is not being accrued. |
| | |
| ETF | Exchange Traded Fund. |
| LLC | Limited Liability Company. |
| REMIC | Real Estate Mortgage Investment Conduit. |
See accompanying Notes to Financial Statements.
Madison Funds | October 31, 2024
Tax-Free Virginia Fund Portfolio of Investments
| | | Par Value | | | Value (Note 2, 3) | |
| MUNICIPAL BONDS - 98.7% | | | | | | |
| Airport - 3.9% | | | | | | |
| Metropolitan Washington Airports Authority Aviation Revenue, Series A, AMT, 5%, 10/1/43 | | $ | 500,000 | | | $ | 510,877 | |
| Norfolk Airport Authority, 5%, 7/1/32 | | | 125,000 | | | | 134,155 | |
| | | | | | | | 645,032 | |
| | | | | | | | | |
| Development - 11.0% | | | | | | | | |
| Henrico County Economic Development Authority, 5%, 10/1/37 | | | 245,000 | | | | 252,199 | |
| Loudoun County Economic Development Authority, Series A, 5%, 12/1/25 | | | 125,000 | | | | 127,530 | |
| Loudoun County Economic Development Authority, Series A, 5%, 12/1/30 | | | 165,000 | | | | 180,916 | |
| Loudoun County Economic Development Authority, Series A, 4%, 12/1/37 | | | 500,000 | | | | 509,346 | |
| Manassas Park Economic Development Authority, 5%, 12/15/28 | | | 200,000 | | | | 215,725 | |
| Manassas Park Economic Development Authority, 3%, 12/15/44 | | | 345,000 | | | | 279,557 | |
| Roanoke Economic Development Authority, Series A, 5%, 7/1/47 | | | 250,000 | | | | 278,931 | |
| | | | | | | | 1,844,204 | |
| | | | | | | | | |
| Education - 8.8% | | | | | | | | |
| Campbell County Industrial Development Authority, 3%, 6/1/48 | | | 415,000 | | | | 331,189 | |
| Culpeper County Economic Development Authority, 4%, 6/1/26 | | | 250,000 | | | | 250,136 | |
| Richmond, Series A, (ST AID WITHHLDG), 3%, 7/15/34 | | | 435,000 | | | | 409,287 | |
| Virginia College Building Authority, Series E, 5%, 2/1/25 | | | 150,000 | | | | 150,566 | |
| Virginia College Building Authority, Series A, (ST INTERCEPT), 5%, 9/1/34 | | | 125,000 | | | | 132,699 | |
| Virginia Public School Authority, Series A, (ST AID WITHHLDG), 5%, 8/1/30 | | | 175,000 | | | | 194,996 | |
| | | | | | | | 1,468,873 | |
| | | | | | | | | |
| Facilities - 7.6% | | | | | | | | |
| Henry County Industrial Development Authority, 4.125%, 11/1/50 | | | 250,000 | | | | 239,048 | |
| New River Valley Regional Jail Authority, 5%, 10/1/25 | | | 100,000 | | | | 101,545 | |
| Prince Edward County Industrial Development Authority, 5%, 9/1/32 | | | 405,000 | | | | 424,538 | |
| Western Regional Jail Authority, (Prerefunded 12/1/25 @ $100), 3.125%, 12/1/29 | | | 245,000 | | | | 244,721 | |
| Western Regional Jail Authority, 3.125%, 12/1/29 | | | 255,000 | | | | 253,374 | |
| | | | | | | | 1,263,226 | |
| | | | | | | | | |
| General Obligation - 39.6% | | | | | | | | |
| Alexandria, Series A, (ST AID WITHHLDG), 5%, 7/15/27 | | | 150,000 | | | | 155,482 | |
| Alexandria, Series A, (ST AID WITHHLDG), 5%, 7/15/28 | | | 100,000 | | | | 105,972 | |
| Arlington County, Series A, (Prerefunded 8/15/26 @ $100) (A), 5%, 8/15/30 | | | 600,000 | | | | 622,476 | |
| Chesterfield County Economic Development Authority, Series B, 3%, 4/1/38 | | | 285,000 | | | | 256,935 | |
| Chesterfield County Economic Development Authority, 4%, 4/1/50 | | | 300,000 | | | | 291,317 | |
| City of Chesapeake, Series A, 5%, 8/1/31 | | | 300,000 | | | | 314,939 | |
| Commonwealth of Virginia, Series A, 3%, 6/1/32 | | | 300,000 | | | | 295,427 | |
| Fairfax County, Series A, (ST AID WITHHLDG), 5%, 10/1/26 | | | 410,000 | | | | 427,054 | |
| Fairfax County, Series A, (ST AID WITHHLDG), 5%, 10/1/36 | | | 270,000 | | | | 295,234 | |
| Fauquier County Economic Development Authority, 5%, 8/15/39 | | | 210,000 | | | | 236,610 | |
| Greater Richmond Convention Center Authority, 5%, 6/15/26 | | | 455,000 | | | | 459,667 | |
| James City County Economic Development Authority, 5%, 6/15/30 | | | 500,000 | | | | 537,404 | |
| Norfolk, (Prerefunded 8/1/28 @ $100), (ST AID WITHHLDG), 5%, 8/1/47 | | | 455,000 | | | | 492,912 | |
| Petersburg, (ST AID WITHHLDG), 4.25%, 9/1/53 | | | 145,000 | | | | 146,452 | |
| Poquoson, (ST AID WITHHLDG), 4%, 2/15/29 | | | 425,000 | | | | 442,061 | |
| Suffolk, 5%, 2/1/29 | | | 100,000 | | | | 107,245 | |
| Vienna, (ST AID WITHHLDG), 4%, 3/1/30 | | | 225,000 | | | | 233,565 | |
| Virginia Commonwealth Transportation Board, 4%, 5/15/48 | | | 200,000 | | | | 199,812 | |
| Virginia Public Building Authority, Series A, 5%, 8/1/31 | | | 110,000 | | | | 119,234 | |
| Virginia Public Building Authority, Series B, 5%, 8/1/25 | | | 235,000 | | | | 238,233 | |
| Virginia Resources Authority, Series C, (MORAL OBLG), 4%, 11/1/32 | | | 250,000 | | | | 255,615 | |
| Virginia Resources Authority, Series C, 5%, 11/1/30 | | | 250,000 | | | | 264,937 | |
| Virginia Resources Authority, Series C, (MORAL OBLG), 4%, 11/1/34 | | | 125,000 | | | | 125,670 | |
| | | | | | | | 6,624,253 | |
| | | | | | | | | |
| Medical - 2.3% | | | | | | | | |
| Lynchburg Economic Development Authority, Series A, 5%, 1/1/31 | | | 125,000 | | | | 128,549 | |
| Stafford County Economic Development Authority Revenue, 5%, 6/15/25 | | | 260,000 | | | | 262,022 | |
| | | | | | | | 390,571 | |
| | | | | | | | | |
| Multifamily Housing - 1.1% | | | | | | | | |
| Virginia Housing Development Authority, Series K, (GNMA/FNMA/FHLMC COLL), 2.125%, 12/1/36 | | | 245,000 | | | | 191,308 | |
| | | | | | | | | |
| Power - 3.0% | | | | | | | | |
| Virginia Commonwealth Transportation Board, 5%, 5/15/26 | | | 220,000 | | | | 227,112 | |
| Virginia Small Business Financing Authority, 5%, 11/1/25 | | | 265,000 | | | | 269,645 | |
| | | | | | | | 496,757 | |
| | | | | | | | | |
| Transportation - 10.9% | | | | | | | | |
| Hampton Roads Transportation Accountability Commission, Series A, 5%, 7/1/37 | | | 170,000 | | | | 184,459 | |
| Hampton Roads Transportation Accountability Commission, Series A, 5%, 7/1/42 | | | 470,000 | | | | 488,101 | |
| Northern Virginia Transportation Authority, 5%, 6/1/30 | | | 780,000 | | | | 780,967 | |
| Virginia Commonwealth Transportation Board, 5%, 9/15/27 | | | 200,000 | | | | 212,592 | |
| Virginia Small Business Financing Authority, 4%, 7/1/39 | | | 170,000 | | | | 164,323 | |
| | | | | | | | 1,830,442 | |
| | | | | | | | | |
| Utilities - 0.7% | | | | | | | | |
| City of Richmond Public Utility Revenue, Series A, 5%, 1/15/34 | | | 100,000 | | | | 109,130 | |
| | | | | | | | | |
| Water - 9.8% | | | | | | | | |
| Alexandria Sanitation Authority, 5%, 7/15/54 | | | 200,000 | | | | 217,910 | |
| Fairfax Sewer Revenue County, Series A, 4%, 7/15/41 | | | 210,000 | | | | 212,949 | |
| Hampton Roads Sanitation District, Series A, (Prerefunded 10/1/27 @ $100), 5%, 10/1/35 | | | 410,000 | | | | 434,916 | |
| Hampton Roads Sanitation District, Series A, (Prerefunded 10/1/27 @ $100), 5%, 10/1/36 | | | 250,000 | | | | 265,193 | |
| Henrico Water & Sewer Revenue County, (Prerefunded 5/1/26 @ $100), 5%, 5/1/27 | | | 150,000 | | | | 154,486 | |
| Upper Occoquan Sewage Authority, 3%, 7/1/46 | | | 300,000 | | | | 243,965 | |
| Upper Occoquan Sewage Authority, 3%, 7/1/49 | | | 140,000 | | | | 110,812 | |
| | | | | | | | 1,640,231 | |
| Total Municipal Bonds | | | | | | | | |
| (Cost $17,091,830) | | | | | | | 16,504,027 | |
| | | | | | | | | |
| TOTAL INVESTMENTS - 98.7% | | | | | | | | |
| (Cost $17,091,830**) | | | | | | | 16,504,027 | |
| NET OTHER ASSETS AND LIABILITIES - 1.3% | | | | | | | 218,715 | |
| TOTAL NET ASSETS - 100.0% | | | | | | $ | 16,722,742 | |
| ** | Aggregate cost for Federal tax purposes was $17,089,665. |
| (A) | Restricted. The aggregate cost of such securities is $634,811. The aggregate value is $622,476,representing 3.7% of net assets. |
| | |
| AMT | Alternative Minimum Tax. |
| FHLMC | Federal Home Loan Mortgage Corp or Freddie Mac. |
| MORAL OBLG | Moral Obligation. |
| FNMA | Federal National Mortgage Association. |
| GNMA | Government National Mortgage Association. |
| ST AID WITHHLDG | State Aid Withholding. |
| ST INTERCEPT | State Intercept. |
See accompanying Notes to Financial Statements.
Madison Funds | October 31, 2024
Tax-Free National Fund Portfolio of Investments
| | | Par Value | | | Value (Note 2, 3) | |
| MUNICIPAL BONDS - 98.5% | | | | | | |
| Alabama - 7.6% | | | | | | |
| Mobile County, General Obligation, 5%, 2/1/39 | | $ | 610,000 | | | $ | 659,472 | |
| Montgomery Water Works & Sanitary Sewer Board, 5%, 9/1/42 | | | 315,000 | | | | 345,411 | |
| Pike Road, Authority Revenue, 4%, 9/1/31 | | | 170,000 | | | | 170,233 | |
| UAB Medicine Finance Authority Revenue, Series B, 5%, 9/1/27 | | | 150,000 | | | | 158,095 | |
| | | | | | | | 1,333,211 | |
| | | | | | | | | |
| Arkansas - 1.0% | | | | | | | | |
| Arkansas Development Finance Authority, 5%, 2/1/26 | | | 175,000 | | | | 176,232 | |
| | | | | | | | | |
| California - 0.7% | | | | | | | | |
| Los Angeles County Metropolitan Transportation Authority Sales Tax Revenue, Series A, 5%, 7/1/40 | | | 120,000 | | | | 125,488 | |
| | | | | | | | | |
| Colorado - 3.9% | | | | | | | | |
| Colorado Springs Utilities System Revenue, Series A, 4%, 11/15/40 | | | 250,000 | | | | 251,577 | |
| El Paso County Facilities Corp., Series A, 5%, 12/1/27 | | | 400,000 | | | | 424,523 | |
| | | | | | | | 676,100 | |
| | | | | | | | | |
| Florida - 3.9% | | | | | | | | |
| Hialeah Utility System, 5%, 10/1/35 | | | 400,000 | | | | 433,566 | |
| Port St. Lucie Community Redevelopment Agency Revenue, Tax Allocation, 5%, 1/1/26 | | | 250,000 | | | | 255,586 | |
| | | | | | | | 689,152 | |
| | | | | | | | | |
| Georgia - 0.8% | | | | | | | | |
| Americus-Sumter Payroll Development Authority, Series A, 3.25%, 6/1/33 | | | 150,000 | | | | 145,469 | |
| | | | | | | | | |
| Idaho - 2.9% | | | | | | | | |
| Idaho Health Facilities Authority, Series A, 5%, 3/1/34 | | | 500,000 | | | | 500,201 | |
| | | | | | | | | |
| Illinois - 10.4% | | | | | | | | |
| Cook County School District No. 111 Burbank, (BAM-TCRS), 5%, 12/1/35 | | | 545,000 | | | | 569,267 | |
| Cook County School District No. 111 Burbank, (BAM-TCRS), 4%, 12/1/37 | | | 200,000 | | | | 201,470 | |
| Du Page County School District No. 45, 4%, 1/1/26 | | | 400,000 | | | | 403,244 | |
| Palatine Village, General Obligation, 2%, 12/1/28 | | | 175,000 | | | | 161,384 | |
| Sales Tax Securitization Corp., Series C, 5%, 1/1/27 | | | 140,000 | | | | 145,742 | |
| Village of Bourbonnais, (BAM), 5.25%, 12/1/46 | | | 325,000 | | | | 343,711 | |
| | | | | | | | 1,824,818 | |
| | | | | | | | | |
| Indiana - 6.2% | | | | | | | | |
| Lincoln Center Building Corp., 4%, 8/1/28 | | | 285,000 | | | | 293,526 | |
| Vanderburgh County Redevelopment District, Tax Allocation, (AGM), 5%, 2/1/26 | | | 500,000 | | | | 510,351 | |
| Whitestown Redevelopment Authority, 5%, 7/15/38 | | | 260,000 | | | | 273,590 | |
| | | | | | | | 1,077,467 | |
| Kansas - 1.5% | | | | | | | | |
| Sedgwick County, Series A, 4%, 8/1/40 | | | 250,000 | | | | 252,421 | |
| | | | | | | | | |
| Kentucky - 2.6% | | | | | | | | |
| Eastern Kentucky University, Series A, (ST INTERCEPT), 5%, 4/1/33 | | | 445,000 | | | | 447,302 | |
| | | | | | | | | |
| Louisiana - 0.9% | | | | | | | | |
| Lafourche Parish School Board, 4%, 3/1/33 | | | 150,000 | | | | 155,536 | |
| | | | | | | | | |
| Michigan - 4.3% | | | | | | | | |
| City of Wayland MI, (AGC), 4%, 10/1/40 | | | 185,000 | | | | 184,923 | |
| Kalamazoo Public Schools, 5%, 5/1/26 | | | 250,000 | | | | 252,091 | |
| Warren Woods Public Schools, (BAM), 4%, 5/1/35 | | | 300,000 | | | | 309,723 | |
| | | | | | | | 746,737 | |
| | | | | | | | | |
| Mississippi - 2.8% | | | | | | | | |
| Medical Center Educational Building Corp., Series A, 5%, 6/1/30 | | | 475,000 | | | | 496,789 | |
| | | | | | | | | |
| Nebraska - 1.8% | | | | | | | | |
| Elkhorn School District, 4%, 12/15/36 | | | 315,000 | | | | 318,837 | |
| | | | | | | | | |
| New Jersey - 3.1% | | | | | | | | |
| New Jersey Turnpike Authority, Series A, (BHAC-CR, AGM), 5.25%, 1/1/28 | | | 250,000 | | | | 269,041 | |
| New Jersey Turnpike Authority, Series A, (BHAC-CR, AGM), 5.25%, 1/1/29 | | | 250,000 | | | | 274,231 | |
| | | | | | | | 543,272 | |
| | | | | | | | | |
| New Mexico - 1.1% | | | | | | | | |
| Otero County, (BAM), 4%, 12/1/28 | | | 195,000 | | | | 199,503 | |
| | | | | | | | | |
| New York - 3.6% | | | | | | | | |
| Brookhaven Local Development Corp., 5%, 11/1/24 | | | 110,000 | | | | 110,000 | |
| New York State Dormitory Authority, Series 1, (BHAC-CR), 5.5%, 7/1/31 | | | 250,000 | | | | 275,669 | |
| Port Authority of New York & New Jersey, Series 85th, (GO of AUTH), 5.375%, 3/1/28 | | | 230,000 | | | | 241,893 | |
| | | | | | | | 627,562 | |
| | | | | | | | | |
| Oklahoma - 4.2% | | | | | | | | |
| Elk City Industrial Authority, 4%, 5/1/30 | | | 335,000 | | | | 343,085 | |
| Tulsa County Industrial Authority, 3%, 2/1/31 | | | 400,000 | | | | 389,413 | |
| | | | | | | | 732,498 | |
| | | | | | | | | |
| Pennsylvania - 5.6% | | | | | | | | |
| City of Pittsburgh, 4%, 9/1/35 | | | 350,000 | | | | 355,382 | |
| Commonwealth Financing Authority, Series A, 5%, 6/1/35 | | | 370,000 | | | | 372,582 | |
| Waverly Township Municipal Authority, (BAM ST AID WITHHLDG), 4%, 2/15/26 | | | 250,000 | | | | 252,683 | |
| | | | | | | | 980,647 | |
| | | | | | | | | |
| Texas - 3.8% | | | | | | | | |
| Center, General Obligation, 3%, 8/15/34 | | | 410,000 | | | | 360,787 | |
| Harris County Toll Road Authority, 4%, 8/15/38 | | | 300,000 | | | | 301,919 | |
| | | | | | | | 662,706 | |
| Utah - 3.3% | | | | | | | | |
| Ogden City Sewer & Water Revenue, Series A, 4%, 6/15/31 | | | 250,000 | | | | 260,711 | |
| Utah Transit Authority, Series A, (BHAC- CR), 5%, 6/15/35 | | | 280,000 | | | | 316,572 | |
| | | | | | | | 577,283 | |
| | | | | | | | | |
| Virginia - 7.6% | | | | | | | | |
| Alexandria Sanitation Authority, 5%, 7/15/54 | | | 200,000 | | | | 217,910 | |
| Fairfax County Economic Development Authority, Series A, 5%, 9/1/38 | | | 90,000 | | | | 94,533 | |
| Roanoke Economic Development Authority, Series A, 5%, 7/1/47 | | | 250,000 | | | | 278,931 | |
| Southampton County Industrial Development Authority, 5%, 6/1/35 | | | 440,000 | | | | 483,030 | |
| Western Regional Jail Authority, 5%, 12/1/34 | | | 250,000 | | | | 259,073 | |
| | | | | | | | 1,333,477 | |
| | | | | | | | | |
| West Virginia - 4.2% | | | | | | | | |
| West Virginia Economic Development Authority, Series A, 5%, 7/1/37 | | | 450,000 | | | | 462,559 | |
| West Virginia University, Series A, 4%, 10/1/39 | | | 265,000 | | | | 266,357 | |
| | | | | | | | 728,916 | |
| | | | | | | | | |
| Wisconsin - 10.7% | | | | | | | | |
| City of Burlington WI, Series A, (BAM), 4%, 4/1/36 | | | 580,000 | | | | 584,524 | |
| City of Green Bay WI, Series A, 4%, 4/1/38 | | | 355,000 | | | | 358,716 | |
| City of Whitewater, Series A, (BAM), 5%, 6/1/38 | | | 290,000 | | | | 315,768 | |
| Public Finance Authority, Series A, 5%, 10/1/32 | | | 200,000 | | | | 213,210 | |
| Wisconsin Health & Educational Facilities Authority, Series A, 4%, 11/15/35 | | | 400,000 | | | | 400,456 | |
| | | | | | | | 1,872,674 | |
| | | | | | | | | |
| TOTAL INVESTMENTS - 98.5% | | | | | | | | |
| (Cost $17,585,107**) | | | | | | | 17,224,298 | |
| NET OTHER ASSETS AND LIABILITIES - 1.5% | | | | | | | 254,386 | |
| | | | | | | | | |
| TOTAL NET ASSETS - 100.0% | | | | | | $ | 17,478,684 | |
| ** | Aggregate cost for Federal tax purposes was $17,585,107. |
| | |
| AGM | Assured Guaranty Municipal Corp. |
| BAM | Build America Mutual Assurance Co. |
| BHAC-CR | Berkshire Hathaway Assurance Corp. |
| GO of AUTH | General Obligation of the Authority. |
| ST AID WITHHLDG | State Aid Withholding. |
| ST INTERCEPT | State Intercept. |
| TCRS | Transferable Custodial Receipts. |
See accompanying Notes to Financial Statements.
Madison Funds | October 31, 2024
High Quality Bond Fund Portfolio of Investments
| | | Par Value | | | Value (Note 2, 3) | |
| CORPORATE NOTES AND BONDS - 34.0% | | | | | | |
| Communication Services - 2.6% | | | | | | |
| Cisco Systems, Inc., 4.95%, 2/26/31 | | $ | 125,000 | | | $ | 126,686 | |
| Comcast Corp., 3.15%, 3/1/26 | | | 750,000 | | | | 736,487 | |
| Walt Disney Co., 3.8%, 3/22/30 | | | 750,000 | | | | 720,001 | |
| | | | | | | | 1,583,174 | |
| | | | | | | | | |
| Consumer Discretionary - 2.6% | | | | | | | | |
| Cummins, Inc., 1.5%, 9/1/30 | | | 750,000 | | | | 631,363 | |
| Home Depot, Inc., 4.5%, 9/15/32 | | | 500,000 | | | | 494,024 | |
| NIKE, Inc., 2.75%, 3/27/27 | | | 500,000 | | | | 481,673 | |
| | | | | | | | 1,607,060 | |
| | | | | | | | | |
| Consumer Staples - 5.2% | | | | | | | | |
| Coca-Cola Co., 1%, 3/15/28 | | | 750,000 | | | | 673,967 | |
| Hershey Co., 1.7%, 6/1/30 | | | 750,000 | | | | 643,621 | |
| Kimberly-Clark Corp., 1.05%, 9/15/27 | | | 750,000 | | | | 682,574 | |
| PepsiCo, Inc. (A), 4.45%, 5/15/28 | | | 500,000 | | | | 502,293 | |
| PepsiCo, Inc., 2.75%, 3/19/30 | | | 750,000 | | | | 684,482 | |
| | | | | | | | 3,186,937 | |
| Financials - 16.4% | | | | | | | | |
| Bank of America Corp., (Secured Overnight Financing Rate + 1.010%) (B), 1.197%, 10/24/26 | | | 250,000 | | | | 241,171 | |
| Bank of America Corp., (3 mo. USD Term SOFR + 1.442%) (B), 3.194%, 7/23/30 | | | 750,000 | | | | 694,013 | |
| Bank of New York Mellon Corp., (Secured Overnight Financing Rate Index + 1.802%) (B), 5.802%, 10/25/28 | | | 750,000 | | | | 774,053 | |
| Berkshire Hathaway Finance Corp., 2.875%, 3/15/32 | | | 750,000 | | | | 668,078 | |
| Charles Schwab Corp., 0.9%, 3/11/26 | | | 750,000 | | | | 712,577 | |
| JPMorgan Chase & Co., (Secured Overnight Financing Rate + 1.310%) (B), 5.012%, 1/23/30 | | | 750,000 | | | | 752,943 | |
| Mastercard, Inc., 3.3%, 3/26/27 | | | 750,000 | | | | 731,314 | |
| Morgan Stanley, (Secured Overnight Financing Rate + 2.240%) (B), 6.296%, 10/18/28 | | | 750,000 | | | | 781,263 | |
| PNC Financial Services Group, Inc., (Secured Overnight Financing Rate + 1.841%) (B), 5.582%, 6/12/29 | | | 750,000 | | | | 766,465 | |
| Public Storage Operating Co., 1.95%, 11/9/28 | | | 750,000 | | | | 677,715 | |
| Simon Property Group LP, 2.45%, 9/13/29 | | | 750,000 | | | | 675,819 | |
| State Street Corp., (Secured Overnight Financing Rate + 0.940%) (B), 2.354%, 11/1/25 | | | 750,000 | | | | 750,000 | |
| Truist Financial Corp., (Secured Overnight Financing Rate + 1.435%) (B), 4.873%, 1/26/29 | | | 500,000 | | | | 498,135 | |
| Truist Financial Corp., 1.95%, 6/5/30 | | | 750,000 | | | | 641,391 | |
| U.S. Bancorp, (Secured Overnight Financing Rate + 1.660%) (B), 4.548%, 7/22/28 | | | 750,000 | | | | 745,413 | |
| | | | | | | | 10,110,350 | |
| Health Care - 1.6% | | | | | | | | |
| UnitedHealth Group, Inc., 5.25%, 2/15/28 | | | 1,000,000 | | | | 1,022,476 | |
| | | | | | | | | |
| Industrials - 4.0% | | | | | | | | |
| Caterpillar Financial Services Corp., 4.8%, 1/6/26 | | | 750,000 | | | | 752,963 | |
| Emerson Electric Co., 2%, 12/21/28 | | | 750,000 | | | | 678,631 | |
| John Deere Capital Corp. (A), 4.75%, 1/20/28 | | | 1,000,000 | | | | 1,008,653 | |
| | | | | | | | 2,440,247 | |
| Information Technology - 1.2% | | | | | | | | |
| Texas Instruments, Inc., 1.375%, 3/12/25 | | | 750,000 | | | | 740,973 | |
| | | | | | | | | |
| Utilities - 0.4% | | | | | | | | |
| National Rural Utilities Cooperative Finance Corp., 1%, 6/15/26 | | | 250,000 | | | | 236,376 | |
| Total Corporate Notes and Bonds | | | | | | | | |
| (Cost $21,794,164) | | | | | | | 20,927,593 | |
| | | | | | | | | |
| FOREIGN CORPORATE BONDS - 1.6% | | | | | | | | |
| | | | | | | | | |
| Health Care - 1.6% | | | | | | | | |
| Pfizer Investment Enterprises Pte. Ltd., 4.75%, 5/19/33 | | | 1,000,000 | | | | 985,229 | |
| | | | | | | | | |
| Total Foreign Corporate Bonds | | | | | | | | |
| (Cost $992,394) | | | | | | | 985,229 | |
| | | | | | | | | |
| U.S. GOVERNMENT AND AGENCY OBLIGATIONS - 63.0% | | | | | | | | |
| | | | | | | | | |
| Fannie Mae - 9.1% | | | | | | | | |
| 0.500%, 11/7/25 (A) | | | 1,500,000 | | | | 1,443,899 | |
| 2.125%, 4/24/26 | | | 2,375,000 | | | | 2,305,556 | |
| 0.750%, 10/8/27 (A) | | | 2,000,000 | | | | 1,814,699 | |
| | | | | | | | 5,564,154 | |
| | | | | | | | | |
| U.S. Treasury Notes - 53.9% | | | | | | | | |
| 2.125%, 5/15/25 | | | 250,000 | | | | 246,926 | |
| 4.250%, 10/15/25 | | | 1,500,000 | | | | 1,498,934 | |
| 4.500%, 11/15/25 | | | 1,500,000 | | | | 1,502,519 | |
| 3.875%, 1/15/26 | | | 1,250,000 | | | | 1,244,336 | |
| 3.750%, 4/15/26 | | | 1,250,000 | | | | 1,241,504 | |
| 2.375%, 5/15/27 | | | 1,500,000 | | | | 1,436,543 | |
| 3.250%, 6/30/27 | | | 2,000,000 | | | | 1,955,859 | |
| 2.250%, 11/15/27 | | | 1,250,000 | | | | 1,182,812 | |
| 4.000%, 2/29/28 | | | 2,000,000 | | | | 1,990,547 | |
| 3.625%, 5/31/28 | | | 2,500,000 | | | | 2,456,055 | |
| 4.000%, 6/30/28 | | | 2,000,000 | | | | 1,989,453 | |
| 4.875%, 10/31/28 | | | 2,500,000 | | | | 2,564,258 | |
| 4.000%, 7/31/29 | | | 1,000,000 | | | | 993,086 | |
| 3.875%, 9/30/29 | | | 2,000,000 | | | | 1,973,281 | |
| 3.875%, 11/30/29 | | | 2,250,000 | | | | 2,219,062 | |
| 3.875%, 12/31/29 | | | 2,250,000 | | | | 2,218,184 | |
| 4.000%, 7/31/30 | | | 2,250,000 | | | | 2,227,324 | |
| 1.375%, 11/15/31 | | | 1,000,000 | | | | 827,227 | |
| 3.375%, 5/15/33 | | | 2,000,000 | | | | 1,873,359 | |
| 4.000%, 2/15/34 | | | 1,550,000 | | | | 1,516,578 | |
| | | | | | | | 33,157,847 | |
| | | | | | | | | |
| Total U.S. Government and Agency Obligations | | | | | | | | |
| (Cost $39,345,865) | | | | | | | 38,722,001 | |
| | | Shares | | | | |
| SHORT-TERM INVESTMENTS - 6.1% | | | | | | |
| State Street Institutional U.S. Government Money Market Fund, Premier Class (C), 4.82% | | | 1,441,809 | | | | 1,441,809 | |
| State Street Navigator Securities Lending Government Money Market Portfolio (C) (D), 4.86% | | | 2,317,770 | | | | 2,317,770 | |
| | | | | | | | | |
| Total Short-Term Investments | | | | | | | | |
| (Cost $3,759,579) | | | | | | | 3,759,579 | |
| | | | | | | | | |
| TOTAL INVESTMENTS - 104.7% | | | | | | | | |
| (Cost $65,892,002**) | | | | | | | 64,394,402 | |
| NET OTHER ASSETS AND LIABILITIES - (4.7%) | | | | | | | (2,876,628 | ) |
| TOTAL NET ASSETS - 100.0% | | | | | | $ | 61,517,774 | |
| ** | Aggregate cost for Federal tax purposes was $65,958,684. |
| (A) | All or a portion of these securities, with an aggregate fair value of $2,268,742, are on loan as part of a securities lending program. See footnote (D) and Note 11 for details on the securities lending program. |
| (B) | Floating rate or variable rate note. Rate shown is as of October 31, 2024. |
| (C) | 7-day yield. |
| (D) | Represents investments of cash collateral received in connection with securities lending. |
See accompanying Notes to Financial Statements.
Madison Funds | October 31, 2024
Core Bond Fund Portfolio of Investments
| | | Par Value | | | Value (Note 2, 3) | |
| ASSET BACKED SECURITIES - 4.0% | | | | | | |
| CarMax Auto Owner Trust, Series 2023-3, Class A3, 5.28%, 5/15/28 | | $ | 500,000 | | | $ | 503,948 | |
| Chesapeake Funding II LLC, Series 2023-1A, Class A1 (A), 5.65%, 5/15/35 | | | 624,133 | | | | 627,639 | |
| Chesapeake Funding II LLC, Series 2023-2A, Class A1 (A), 6.16%, 10/15/35 | | | 423,819 | | | | 428,969 | |
| CNH Equipment Trust, Series 2023-A, Class A3, 4.81%, 8/15/28 | | | 750,000 | | | | 751,801 | |
| Dell Equipment Finance Trust, Series 2023-2, Class A3 (A), 5.65%, 1/22/29 | | | 1,000,000 | | | | 1,006,732 | |
| Enterprise Fleet Financing LLC, Series 2022-1, Class A2 (A), 3.03%, 1/20/28 | | | 173,981 | | | | 173,185 | |
| Enterprise Fleet Financing LLC, Series 2023-1, Class A2 (A), 5.51%, 1/22/29 | | | 301,625 | | | | 303,041 | |
| Enterprise Fleet Financing LLC, Series 2022-4, Class A2 (A), 5.76%, 10/22/29 | | | 581,344 | | | | 585,091 | |
| Hertz Vehicle Financing LLC, Series 2021-1A, Class A (A), 1.21%, 12/26/25 | | | 250,000 | | | | 248,958 | |
| John Deere Owner Trust, Series 2023-B, Class A3, 5.18%, 3/15/28 | | | 750,000 | | | | 754,901 | |
| JPMorgan Chase Bank NA, Series 2021-2, Class B (A), 0.889%, 12/26/28 | | | 7,444 | | | | 7,422 | |
| JPMorgan Chase Bank NA, Series 2021-3, Class C (A), 0.86%, 2/26/29 | | | 104,646 | | | | 103,350 | |
| LAD Auto Receivables Trust, Series 2022-1A, Class A (A), 5.21%, 6/15/27 | | | 253,933 | | | | 254,172 | |
| LAD Auto Receivables Trust, Series 2023-2A, Class A2 (A), 5.93%, 6/15/27 | | | 124,020 | | | | 124,364 | |
| Nissan Auto Receivables Owner Trust, Series 2022-B, Class A4, 4.45%, 11/15/29 | | | 200,000 | | | | 199,386 | |
| Santander Drive Auto Receivables Trust, Series 2022-2, Class B, 3.44%, 9/15/27 | | | 179,537 | | | | 178,567 | |
| Towd Point HE Trust, Series 2021-HE1, Class A1 (A) (B) (C), 0.918%, 2/25/63 | | | 62,391 | | | | 60,539 | |
| Towd Point Mortgage Trust, Series 2024-CES1, Class A1A (A) (B) (C), 5.848%, 1/25/64 | | | 1,072,281 | | | | 1,071,326 | |
| Verizon Master Trust, Series 2024-3, Class B, 5.54%, 4/22/30 | | | 500,000 | | | | 508,785 | |
| Total Asset Backed Securities | | | | | | | | |
| (Cost $7,858,310) | | | | | | | 7,892,176 | |
| | | | | | | | | |
| COLLATERALIZED MORTGAGE OBLIGATIONS - 5.5% | | | | | | | | |
| Bunker Hill Loan Depositary Trust, Series 2019-2, Class A1 (A) (D), 2.879%, 7/25/49 | | | 87,068 | | | | 83,798 | |
| Bunker Hill Loan Depositary Trust, Series 2020-1, Class A1 (A) (B) (C), 1.724%, 2/25/55 | | | 54,317 | | | | 52,822 | |
| CIM Trust, Series 2021-J2, Class A4 (A) (B) (C), 2.5%, 4/25/51 | | | 459,418 | | | | 405,629 | |
| Federal Home Loan Mortgage Corp. REMICS, Series 4066, Class DI, IO, 3%, 6/15/27 | | | 223,104 | | | | 5,312 | |
| Federal Home Loan Mortgage Corp. REMICS, Series 5451, Class A, CMO, 5%, 5/25/49 | | | 347,914 | | | | 343,083 | |
| Federal National Mortgage Association Connecticut Avenue Securities Trust, Series 2022-R01, Class 1M1, (30 day USD SOFR Average + 1.000%) (A) (C), 5.857%, 12/25/41 | | | 160,906 | | | | 160,857 | |
| Federal National Mortgage Association REMICS, Series 2015-12, Class NI, IO, 3.5%, 3/25/30 | | | 343,577 | | | | 18,919 | |
| Federal National Mortgage Association REMICS, Series 2011-31, Class DB, 3.5%, 4/25/31 | | | 204,894 | | | | 198,707 | |
| Federal National Mortgage Association REMICS, Series 2011-36, Class QB, 4%, 5/25/31 | | | 278,208 | | | | 274,837 | |
| Federal National Mortgage Association REMICS, Series 2001-73, Class GZ, 6%, 12/25/31 | | | 54,017 | | | | 55,385 | |
| Federal National Mortgage Association REMICS, Series 2005-79, Class LT, 5.5%, 9/25/35 | | | 57,616 | | | | 59,264 | |
| Federal National Mortgage Association REMICS, Series 2020-44, Class TI, IO, 5.5%, 12/25/35 | | | 1,547,871 | | | | 230,166 | |
| Flagstar Mortgage Trust, Series 2021-9INV, Class A1 (A) (B) (C), 2.5%, 9/25/41 | | | 477,612 | | | | 422,818 | |
| GCAT Trust, Series 2021-NQM1, Class A1 (A) (B) (C), 0.874%, 1/25/66 | | | 544,414 | | | | 471,779 | |
| Government National Mortgage Association REMICS, Series 2015-53, Class IL, IO, 3%, 9/20/44 | | | 30,808 | | | | 106 | |
| GS Mortgage-Backed Securities Corp. Trust, Series 2020-PJ6, Class A2 (A) (B) (C), 2.5%, 5/25/51 | | | 456,845 | | | | 370,292 | |
| JP Morgan Mortgage Trust, Series 2019- 5, Class A3 (A) (B) (C), 4%, 11/25/49 | | | 19,109 | | | | 17,761 | |
| JP Morgan Mortgage Trust, Series 2019-7, Class A3 (A) (B) (C), 3.463%, 2/25/50 | | | 76,078 | | | | 67,735 | |
| JP Morgan Mortgage Trust, Series 2021-1, Class A3 (A) (B) (C), 2.5%, 6/25/51 | | | 615,065 | | | | 500,779 | |
| JP Morgan Mortgage Trust, Series 2021-3, Class A3 (A) (B) (C), 2.5%, 7/25/51 | | | 814,382 | | | | 658,398 | |
| JP Morgan Mortgage Trust, Series 2021-6, Class A4 (A) (B) (C), 2.5%, 10/25/51 | | | 664,575 | | | | 586,331 | |
| JP Morgan Mortgage Trust, Series 2021-14, Class A4 (A) (B) (C), 2.5%, 5/25/52 | | | 722,867 | | | | 632,523 | |
| JP Morgan Mortgage Trust, Series 2024-5, Class A4 (A) (B) (C), 6%, 11/25/54 | | | 914,959 | | | | 916,468 | |
| JP Morgan Wealth Management, Series 2020-ATR1, Class A3 (A) (B) (C), 3%, 2/25/50 | | | 127,480 | | | | 109,314 | |
| PSMC Trust, Series 2019-2, Class A1 (A) (B) (C), 3.5%, 10/25/49 | | | 1,645 | | | | 1,631 | |
| PSMC Trust, Series 2020-2, Class A2 (A) (B) (C), 3%, 5/25/50 | | | 99,359 | | | | 87,520 | |
| PSMC Trust, Series 2021-1, Class A11 (A) (B) (C), 2.5%, 3/25/51 | | | 776,539 | | | | 682,248 | |
| RCKT Mortgage Trust, Series 2021-6, Class A5 (A) (B) (C), 2.5%, 12/25/51 | | | 582,494 | | | | 508,787 | |
| RCKT Mortgage Trust, Series 2022-1, Class A5 (A) (B) (C), 2.5%, 1/25/52 | | | 397,339 | | | | 345,176 | |
| Sequoia Mortgage Trust, Series 2013-7, Class A2 (B) (C), 3%, 6/25/43 | | | 247,797 | | | | 217,309 | |
| Towd Point Mortgage Trust, Series 2024-4, Class A1A, CMO, (A) (B) (C), 4.381%, 10/27/64 | | | 1,750,000 | | | | 1,695,884 | |
| Wells Fargo Mortgage-Backed Securities Trust, Series 2019-2, Class A1 (A) (B) (C), 4%, 4/25/49 | | | 10,031 | | | | 9,408 | |
| Wells Fargo Mortgage-Backed Securities Trust, Series 2021-INV2, Class A2 (A) (B) (C), 2.5%, 9/25/51 | | | 572,060 | | | | 462,475 | |
| | | | | | | | | |
| Total Collateralized Mortgage Obligations | | | | | | | | |
| (Cost $12,188,408) | | | | | | | 10,653,521 | |
| | | | | | | | | |
| COMMERCIAL MORTGAGE-BACKED SECURITIES - 2.1% | | | | | | | | |
| Federal Home Loan Mortgage Corp. Multifamily Structured Pass-Through Certificates, Series KJ17, Class A2, 2.982%, 11/25/25 | | | 124,724 | | | | 123,857 | |
| Federal Home Loan Mortgage Corp. Multifamily Structured Pass-Through Certificates, Series K059, Class X1, IO (B) (C), 0.294%, 9/25/26 | | | 14,536,731 | | | | 58,728 | |
| Federal Home Loan Mortgage Corp. Multifamily Structured Pass-Through Certificates, Series K131, Class A2, 1.853%, 7/25/31 | | | 505,000 | | | | 426,029 | |
| Federal National Mortgage Association- ACES, Series 2022-M1, Class A2 (B) (C), 1.668%, 10/25/31 | | | 1,250,000 | | | | 1,024,449 | |
| FREMF Mortgage Trust, Series 2014-K41, Class B (A) (B) (C), 3.795%, 11/25/47 | | | 53,640 | | | | 53,437 | |
| FREMF Mortgage Trust, Series 2015-K44, Class B (A) (B) (C), 3.717%, 1/25/48 | | | 750,000 | | | | 745,305 | |
| FREMF Mortgage Trust, Series 2016-K58, Class B (A) (B) (C), 3.737%, 9/25/49 | | | 320,000 | | | | 312,152 | |
| FREMF Mortgage Trust, Series 2020-K106, Class B (A) (B) (C), 3.562%, 3/25/53 | | | 750,000 | | | | 686,350 | |
| Government National Mortgage Association, Series 2024-153, Class AB, 4.5%, 3/16/65 | | | 749,671 | | | | 735,747 | |
| GSAMP Trust, Series 2006-S5, Class M5 (B) (C) (H), 0.488%, 9/25/36 | | | 772,000 | | | | — | |
| | | | | | | | | |
| Total Commercial Mortgage- Backed Securities | | | | | | | | |
| (Cost $4,253,923) | | | | | | | 4,166,054 | |
| | | | | | | | | |
| CORPORATE NOTES AND BONDS - 23.7% | | | | | | | | |
| Communication Services - 0.9% | | | | | | | | |
| AT&T, Inc., 4.75%, 5/15/46 | | | 500,000 | | | | 444,888 | |
| Expedia Group, Inc., 3.25%, 2/15/30 | | | 250,000 | | | | 231,058 | |
| SBA Communications Corp., 3.875%, 2/15/27 | | | 350,000 | | | | 338,762 | |
| VeriSign, Inc., 2.7%, 6/15/31 | | | 500,000 | | | | 428,325 | |
| Verizon Communications, Inc., 3.4%, 3/22/41 | | | 500,000 | | | | 386,960 | |
| | | | | | | | 1,829,993 | |
| | | | | | | | | |
| Consumer Discretionary - 1.3% | | | | | | | | |
| Advance Auto Parts, Inc., 1.75%, 10/1/27 | | | 250,000 | | | | 221,822 | |
| American Airlines, Inc./AAdvantage Loyalty IP Ltd. (A), 5.5%, 4/20/26 | | | 175,000 | | | | 174,444 | |
| BorgWarner, Inc., 5.4%, 8/15/34 | | | 250,000 | | | | 248,683 | |
| Hilton Domestic Operating Co., Inc. (A), 5.375%, 5/1/25 | | | 350,000 | | | | 349,972 | |
| Home Depot, Inc., 3.35%, 4/15/50 | | | 250,000 | | | | 181,587 | |
| Lowe's Cos., Inc., 3%, 10/15/50 | | | 500,000 | | | | 323,471 | |
| Lowe's Cos., Inc., 4.25%, 4/1/52 | | | 750,000 | | | | 605,647 | |
| Royal Caribbean Cruises Ltd. (E), 7.5%, 10/15/27 | | | 250,000 | | | | 264,965 | |
| Tractor Supply Co., 5.25%, 5/15/33 | | | 150,000 | | | | 150,644 | |
| | | | | | | | 2,521,235 | |
| | | | | | | | | |
| Consumer Staples - 0.7% | | | | | | | | |
| GE HealthCare Technologies, Inc., 4.8%, 8/14/29 | | | 500,000 | | | | 499,064 | |
| Keurig Dr. Pepper, Inc., 3.8%, 5/1/50 | | | 300,000 | | | | 230,482 | |
See accompanying Notes to Financial Statements.
Madison Funds | October 31, 2024
Core Bond Fund Portfolio of Investments - continued
| | | Par Value | | | Value (Note 2, 3) | |
| Lamb Weston Holdings, Inc. (A) (E), 4.875%, 5/15/28 | | $ | 250,000 | | | $ | 244,887 | |
| Performance Food Group, Inc. (A), 5.5%, 10/15/27 | | | 325,000 | | | | 322,219 | |
| | | | | | | | 1,296,652 | |
| | | | | | | | | |
| Energy - 2.8% | | | | | | | | |
| Boardwalk Pipelines LP, 4.45%, 7/15/27 | | | 400,000 | | | | 395,592 | |
| Devon Energy Corp., 5.2%, 9/15/34 | | | 800,000 | | | | 769,751 | |
| Diamondback Energy, Inc., 5.4%, 4/18/34 | | | 550,000 | | | | 548,543 | |
| Eastern Gas Transmission & Storage, Inc., 3%, 11/15/29 | | | 350,000 | | | | 321,300 | |
| Energy Transfer LP, 5.25%, 4/15/29 | | | 275,000 | | | | 277,377 | |
| Energy Transfer LP, 6.55%, 12/1/33 | | | 300,000 | | | | 322,111 | |
| EnLink Midstream Partners LP, 5.45%, 6/1/47 | | | 400,000 | | | | 365,126 | |
| Kinder Morgan, Inc., 5.55%, 6/1/45 | | | 400,000 | | | | 378,599 | |
| Marathon Petroleum Corp., 4.7%, 5/1/25 | | | 275,000 | | | | 274,642 | |
| Marathon Petroleum Corp., 3.8%, 4/1/28 | | | 350,000 | | | | 338,854 | |
| MPLX LP, 2.65%, 8/15/30 | | | 350,000 | | | | 307,856 | |
| ONEOK, Inc., 5.85%, 1/15/26 | | | 150,000 | | | | 151,522 | |
| Sunoco LP/Sunoco Finance Corp., 6%, 4/15/27 | | | 400,000 | | | | 400,394 | |
| Valero Energy Corp., 6.625%, 6/15/37 | | | 500,000 | | | | 538,879 | |
| Valero Energy Corp., 4%, 6/1/52 | | | 175,000 | | | | 130,164 | |
| | | | | | | | 5,520,710 | |
| | | | | | | | | |
| Financials - 10.2% | | | | | | | | |
| Air Lease Corp., 2.875%, 1/15/26 | | | 500,000 | | | | 488,171 | |
| Air Lease Corp., 1.875%, 8/15/26 | | | 250,000 | | | | 237,574 | |
| American Express Co., (Secured Overnight Financing Rate + 1.940%) (C), 6.489%, 10/30/31 | | | 500,000 | | | | 538,577 | |
| American International Group, Inc., 4.75%, 4/1/48 | | | 150,000 | | | | 136,157 | |
| Athene Holding Ltd., 6.25%, 4/1/54 | | | 250,000 | | | | 256,872 | |
| Bank of America Corp., Series N, (Secured Overnight Financing Rate + 0.910%) (C), 1.658%, 3/11/27 | | | 400,000 | | | | 383,216 | |
| Bank of America Corp., (Secured Overnight Financing Rate + 1.910%) (C), 5.288%, 4/25/34 | | | 350,000 | | | | 351,685 | |
| Bank of America Corp., (Secured Overnight Financing Rate + 1.650%) (C), 5.468%, 1/23/35 | | | 250,000 | | | | 253,809 | |
| Bank of New York Mellon Corp., (Secured Overnight Financing Rate Index + 2.074%) (C), 5.834%, 10/25/33 | | | 500,000 | | | | 526,491 | |
| Berkshire Hathaway Finance Corp., 3.85%, 3/15/52 | | | 350,000 | | | | 276,868 | |
| Capital One Financial Corp., (Secured Overnight Financing Rate + 2.057%) (C), 4.927%, 5/10/28 | | | 350,000 | | | | 350,496 | |
| Capital One Financial Corp., (Secured Overnight Financing Rate + 2.640%) (C), 6.312%, 6/8/29 | | | 400,000 | | | | 415,371 | |
| Capital One Financial Corp., (Secured Overnight Financing Rate + 1.790%) (C), 3.273%, 3/1/30 | | | 350,000 | | | | 324,487 | |
| Citibank NA, 5.803%, 9/29/28 | | | 250,000 | | | | 259,716 | |
| Citigroup, Inc., (Secured Overnight Financing Rate + 2.086%) (C), 4.91%, 5/24/33 | | | 350,000 | | | | 342,705 | |
| Citigroup, Inc., (5 year CMT + 1.730%) (C), 5.411%, 9/19/39 | | | 400,000 | | | | 387,248 | |
| Empower Finance 2020 LP (A), 3.075%, 9/17/51 | | | 350,000 | | | | 227,190 | |
| Fifth Third Bancorp, 2.55%, 5/5/27 | | | 350,000 | | | | 332,475 | |
| Fifth Third Bancorp, (Secured Overnight Financing Rate + 2.340%) (C), 6.339%, 7/27/29 | | | 400,000 | | | | 417,324 | |
| Fifth Third Bancorp, (Secured Overnight Financing Rate + 1.660%) (C), 4.337%, 4/25/33 | | | 350,000 | | | | 327,668 | |
| Five Corners Funding Trust II (A), 2.85%, 5/15/30 | | | 250,000 | | | | 224,071 | |
| GLP Capital LP/GLP Financing II, Inc., 3.25%, 1/15/32 | | | 400,000 | | | | 345,532 | |
| Goldman Sachs BDC, Inc., 2.875%, 1/15/26 | | | 400,000 | | | | 389,661 | |
| Goldman Sachs Group, Inc., (Secured Overnight Financing Rate + 0.913%) (C), 1.948%, 10/21/27 | | | 500,000 | | | | 472,750 | |
| Huntington Bancshares, Inc., (Secured Overnight Financing Rate + 2.020%) (C), 6.208%, 8/21/29 | | | 350,000 | | | | 363,369 | |
| Intercontinental Exchange, Inc., 4.6%, 3/15/33 | | | 350,000 | | | | 341,847 | |
| Jefferies Financial Group, Inc., 2.625%, 10/15/31 | | | 450,000 | | | | 380,910 | |
| Jefferies Financial Group, Inc., 6.2%, 4/14/34 | | | 200,000 | | | | 208,267 | |
| JPMorgan Chase & Co., (Secured Overnight Financing Rate + 1.620%) (C), 5.336%, 1/23/35 | | | 500,000 | | | | 504,310 | |
| KeyBank NA, 5%, 1/26/33 | | | 250,000 | | | | 241,299 | |
| KeyCorp, 4.1%, 4/30/28 | | | 400,000 | | | | 388,759 | |
| KKR Group Finance Co. VIII LLC (A), 3.5%, 8/25/50 | | | 250,000 | | | | 175,942 | |
| Liberty Mutual Group, Inc. (A), 3.95%, 5/15/60 | | | 150,000 | | | | 105,038 | |
| LPL Holdings, Inc. (A), 4%, 3/15/29 | | | 350,000 | | | | 329,111 | |
| Morgan Stanley, (Secured Overnight Financing Rate + 1.830%) (C), 6.407%, 11/1/29 | | | 450,000 | | | | 473,808 | |
| Morgan Stanley, (Secured Overnight Financing Rate + 1.020%) (C), 1.928%, 4/28/32 | | | 500,000 | | | | 413,188 | |
| Morgan Stanley, (Secured Overnight Financing Rate + 1.730%) (C), 5.466%, 1/18/35 | | | 500,000 | | | | 506,497 | |
| Nasdaq, Inc., 1.65%, 1/15/31 | | | 450,000 | | | | 374,793 | |
| Old Republic International Corp., 3.85%, 6/11/51 | | | 300,000 | | | | 217,305 | |
| Omega Healthcare Investors, Inc., 3.375%, 2/1/31 | | | 250,000 | | | | 222,469 | |
| PNC Bank NA, 2.7%, 10/22/29 | | | 250,000 | | | | 223,703 | |
| PNC Financial Services Group, Inc., (Secured Overnight Financing Rate + 2.284%) (C), 6.875%, 10/20/34 | | | 300,000 | | | | 333,427 | |
| Realty Income Corp., 4.85%, 3/15/30 | | | 400,000 | | | | 399,905 | |
| Regions Financial Corp., 1.8%, 8/12/28 | | | 500,000 | | | | 444,931 | |
| State Street Corp., (Secured Overnight Financing Rate + 1.490%) (C), 3.031%, 11/1/34 | | | 250,000 | | | | 223,838 | |
| Teachers Insurance & Annuity Association of America (A), 3.3%, 5/15/50 | | | 300,000 | | | | 210,036 | |
| Truist Bank, 2.25%, 3/11/30 | | | 325,000 | | | | 279,838 | |
| Truist Financial Corp., (Secured Overnight Financing Rate + 1.852%) (C), 5.122%, 1/26/34 | | | 400,000 | | | | 392,565 | |
| Truist Financial Corp., (Secured Overnight Financing Rate + 2.361%) (C), 5.867%, 6/8/34 | | | 600,000 | | | | 617,020 | |
| U.S. Bancorp, (Secured Overnight Financing Rate + 1.660%) (C), 4.548%, 7/22/28 | | | 500,000 | | | | 496,942 | |
| U.S. Bancorp, (Secured Overnight Financing Rate + 1.560%) (C), 5.384%, 1/23/30 | | | 250,000 | | | | 253,966 | |
| U.S. Bancorp, (Secured Overnight Financing Rate + 1.600%) (C), 4.839%, 2/1/34 | | | 525,000 | | | | 508,118 | |
| Wells Fargo & Co., (Secured Overnight Financing Rate + 1.740%) (C), 5.574%, 7/25/29 | | | 500,000 | | | | 510,589 | |
| Wells Fargo & Co., (Secured Overnight Financing Rate + 1.500%) (C) (E), 5.198%, 1/23/30 | | | 600,000 | | | | 605,729 | |
| Wells Fargo & Co., (Secured Overnight Financing Rate + 2.020%) (C), 5.389%, 4/24/34 | | | 350,000 | | | | 352,731 | |
| Welltower OP LLC, 2.05%, 1/15/29 | | | 500,000 | | | | 448,877 | |
| Weyerhaeuser Co., 3.375%, 3/9/33 | | | 300,000 | | | | 265,684 | |
| | | | | | | | 20,080,925 | |
| | | | | | | | | |
| Health Care - 2.0% | | | | | | | | |
| AbbVie, Inc., 5.4%, 3/15/54 | | | 675,000 | | | | 680,669 | |
| Amgen, Inc., 5.65%, 3/2/53 | | | 150,000 | | | | 151,104 | |
| Block, Inc. (E), 2.75%, 6/1/26 | | | 450,000 | | | | 433,255 | |
| Centene Corp., 2.45%, 7/15/28 | | | 500,000 | | | | 450,042 | |
| Cigna Group, 4.9%, 12/15/48 | | | 500,000 | | | | 444,108 | |
| GE HealthCare Technologies, Inc., 5.6%, 11/15/25 | | | 750,000 | | | | 756,170 | |
| GE HealthCare Technologies, Inc., 6.377%, 11/22/52 | | | 250,000 | | | | 279,162 | |
| Health Care Service Corp. A Mutual Legal Reserve Co. (A), 2.2%, 6/1/30 | | | 250,000 | | | | 216,893 | |
| Humana, Inc., 5.375%, 4/15/31 | | | 250,000 | | | | 250,908 | |
| UnitedHealth Group, Inc., 3.7%, 8/15/49 | | | 250,000 | | | | 191,033 | |
| | | | | | | | 3,853,344 | |
| | | | | | | | | |
| Industrials - 2.2% | | | | | | | | |
| Ashtead Capital, Inc. (A), 2.45%, 8/12/31 | | | 600,000 | | | | 498,870 | |
| Ball Corp., 4.875%, 3/15/26 | | | 475,000 | | | | 472,416 | |
| Boeing Co. (A), 6.858%, 5/1/54 | | | 500,000 | | | | 536,439 | |
| Carrier Global Corp., 3.577%, 4/5/50 | | | 68,000 | | | | 50,879 | |
| Carrier Global Corp., 6.2%, 3/15/54 | | | 174,000 | | | | 191,302 | |
| Nordson Corp., 5.8%, 9/15/33 | | | 100,000 | | | | 104,710 | |
| Norfolk Southern Corp., 5.95%, 3/15/64 | | | 250,000 | | | | 264,712 | |
| Otis Worldwide Corp., 2.565%, 2/15/30 | | | 350,000 | | | | 312,288 | |
| Quanta Services, Inc., 2.9%, 10/1/30 | | | 500,000 | | | | 449,775 | |
| TD SYNNEX Corp., 1.75%, 8/9/26 | | | 500,000 | | | | 473,361 | |
| Textron, Inc., 2.45%, 3/15/31 | | | 250,000 | | | | 213,575 | |
| United Rentals North America, Inc., 5.5%, 5/15/27 | | | 500,000 | | | | 499,211 | |
| Vontier Corp., 1.8%, 4/1/26 | | | 300,000 | | | | 286,364 | |
| | | | | | | | 4,353,902 | |
| | | | | | | | | |
| Information Technology - 1.6% | | | | | | | | |
| Broadcom, Inc. (A), 3.187%, 11/15/36 | | | 12,000 | | | | 9,753 | |
| Dell International LLC/EMC Corp., 8.35%, 7/15/46 | | | 87,000 | | | | 113,730 | |
| Dell International LLC/EMC Corp., 3.45%, 12/15/51 | | | 625,000 | | | | 437,310 | |
| Fiserv, Inc., 3.5%, 7/1/29 | | | 250,000 | | | | 236,265 | |
| Gartner, Inc. (A), 4.5%, 7/1/28 | | | 400,000 | | | | 390,325 | |
| HP, Inc., 2.65%, 6/17/31 | | | 600,000 | | | | 518,316 | |
| Intuit, Inc., 5.2%, 9/15/33 | | | 250,000 | | | | 254,789 | |
| Iron Mountain, Inc. (A), 4.5%, 2/15/31 | | | 275,000 | | | | 255,338 | |
| Oracle Corp., 3.95%, 3/25/51 | | | 750,000 | | | | 572,513 | |
| VMware LLC, 2.2%, 8/15/31 | | | 500,000 | | | | 417,499 | |
| | | | | | | | 3,205,838 | |
See accompanying Notes to Financial Statements.
Madison Funds | October 31, 2024
Core Bond Fund Portfolio of Investments - continued
| | | Par Value | | | Value (Note 2, 3) | |
| Materials - 0.3% | | | | | | |
| Celanese U.S. Holdings LLC, 6.165%, 7/15/27 | | $ | 250,000 | | | $ | 255,653 | |
| LYB International Finance III LLC, 3.625%, 4/1/51 | | | 400,000 | | | | 282,274 | |
| | | | | | | | 537,927 | |
| | | | | | | | | |
| Utilities - 1.7% | | | | | | | | |
| AES Corp., 1.375%, 1/15/26 | | | 400,000 | | | | 383,084 | |
| Berkshire Hathaway Energy Co., 1.65%, 5/15/31 | | | 350,000 | | | | 289,003 | |
| DTE Electric Co., 5.4%, 4/1/53 | | | 250,000 | | | | 251,712 | |
| Duke Energy Corp., 3.75%, 9/1/46 | | | 500,000 | | | | 375,669 | |
| Duke Energy Progress LLC, 3.7%, 10/15/46 | | | 500,000 | | | | 380,693 | |
| Florida Power & Light Co., 2.875%, 12/4/51 | | | 700,000 | | | | 459,421 | |
| Interstate Power & Light Co., 3.5%, 9/30/49 | | | 250,000 | | | | 181,981 | |
| NextEra Energy Capital Holdings, Inc., 1.9%, 6/15/28 | | | 500,000 | | | | 452,693 | |
| PECO Energy Co., 3.05%, 3/15/51 | | | 750,000 | | | | 507,530 | |
| | | | | | | | 3,281,786 | |
| | | | | | | | | |
| Total Corporate Notes and Bonds | | | | | | | | |
| (Cost $49,926,549) | | | | | | | 46,482,312 | |
| | | | | | | | | |
| FOREIGN CORPORATE BONDS - 2.7% | | | | | | | | |
| | | | | | | | | |
| Consumer Discretionary - 0.1% | | | | | | | | |
| Delta Air Lines, Inc./SkyMiles IP Ltd. (A), 4.75%, 10/20/28 | | | 250,000 | | | | 247,100 | |
| | | | | | | | | |
| Energy - 0.1% | | | | | | | | |
| Enbridge, Inc., 5.7%, 3/8/33 | | | 250,000 | | | | 256,391 | |
| | | | | | | | | |
| Financials - 1.5% | | | | | | | | |
| AerCap Ireland Capital DAC/AerCap Global Aviation Trust, 1.75%, 1/30/26 | | | 500,000 | | | | 480,765 | |
| AerCap Ireland Capital DAC/AerCap Global Aviation Trust, 4.625%, 10/15/27 | | | 250,000 | | | | 248,157 | |
| Avolon Holdings Funding Ltd. (A), 2.125%, 2/21/26 | | | 500,000 | | | | 479,589 | |
| Mitsubishi UFJ Financial Group, Inc., (1 year CMT + 1.530%) (C), 5.475%, 2/22/31 | | | 500,000 | | | | 512,943 | |
| Royal Bank of Canada, 5.15%, 2/1/34 | | | 400,000 | | | | 402,431 | |
| Toronto-Dominion Bank, 4.456%, 6/8/32 | | | 300,000 | | | | 288,143 | |
| UBS Group AG, (1 year CMT + 2.050%) (A) (C), 4.703%, 8/5/27 | | | 400,000 | | | | 398,079 | |
| | | | | | | | 2,810,107 | |
| | | | | | | | | |
| Health Care - 0.6% | | | | | | | | |
| Pfizer Investment Enterprises Pte. Ltd., 5.3%, 5/19/53 | | | 400,000 | | | | 391,848 | |
| Pfizer Investment Enterprises Pte. Ltd., 5.34%, 5/19/63 | | | 250,000 | | | | 240,873 | |
| Royalty Pharma PLC, 2.2%, 9/2/30 | | | 200,000 | | | | 170,772 | |
| STERIS Irish FinCo UnLtd Co., 3.75%, 3/15/51 | | | 500,000 | | | | 367,685 | |
| | | | | | | | 1,171,178 | |
| | | | | | | | | |
| Industrials - 0.3% | | | | | | | | |
| BAE Systems PLC (A), 5.3%, 3/26/34 | | | 500,000 | | | | 505,869 | |
| | | | | | | | | |
| Materials - 0.1% | | | | | | | | |
| Nutrien Ltd., 5.8%, 3/27/53 | | | 250,000 | | | | 255,452 | |
| | | | | | | | | |
| Total Foreign Corporate Bonds | | | | | | | | |
| (Cost $5,429,508) | | | | | | | 5,246,097 | |
| | | | | | | | | |
| MORTGAGE BACKED SECURITIES - 32.0% | | | | | | | | |
| | | | | | | | | |
| Fannie Mae - 16.5% | | | | | | | | |
| 3%, 9/1/30 Pool # 890696 | | | 193,058 | | | | 186,380 | |
| 3%, 12/1/30 Pool # AL8924 | | | 90,189 | | | | 87,672 | |
| 7%, 11/1/31 Pool # 607515 | | | 2,148 | | | | 2,230 | |
| 3.5%, 12/1/31 Pool # MA0919 | | | 71,161 | | | | 68,960 | |
| 6.5%, 3/1/32 Pool # 631377 | | | 8,766 | | | | 9,041 | |
| 6.5%, 5/1/32 Pool # 636758 | | | 514 | | | | 527 | |
| 7%, 5/1/32 Pool # 644591 | | | 133 | | | | 138 | |
| 6.5%, 6/1/32 Pool # 545691 | | | 15,305 | | | | 15,782 | |
| 3.5%, 8/1/32 Pool # MA3098 | | | 95,443 | | | | 92,625 | |
| 3.5%, 9/1/32 Pool # MA3126 | | | 65,501 | | | | 63,654 | |
| 5.5%, 11/1/33 Pool # 555880 | | | 20,523 | | | | 20,784 | |
| 4%, 2/1/35 Pool # MA2177 | | | 198,052 | | | | 193,134 | |
| 3.5%, 12/1/35 Pool # MA2473 | | | 195,015 | | | | 186,500 | |
| 4.5%, 12/1/35 Pool # 745147 | | | 3,260 | | | | 3,179 | |
| 2.5%, 9/1/36 Pool # FS4049 | | | 578,726 | | | | 532,347 | |
| 6%, 11/1/36 Pool # 902510 | | | 28,552 | | | | 29,558 | |
| 6%, 10/1/37 Pool # 947563 | | | 29,066 | | | | 30,182 | |
| 6.5%, 12/1/37 Pool # 889072 | | | 19,436 | | | | 20,306 | |
| 4.5%, 5/1/38 Pool # MA5013 | | | 983,043 | | | | 965,821 | |
| 6.5%, 8/1/38 Pool # 987711 | | | 48,634 | | | | 51,718 | |
| 3%, 11/1/39 Pool # MA3831 | | | 88,235 | | | | 80,504 | |
| 4%, 9/1/40 Pool # AE3039 | | | 208,880 | | | | 199,224 | |
| 4%, 1/1/41 Pool # AB2080 | | | 158,691 | | | | 151,355 | |
| 2.5%, 5/1/41 Pool # MA4334 | | | 1,165,950 | | | | 1,008,239 | |
| 5.5%, 7/1/41 Pool # AL6588 | | | 154,152 | | | | 156,383 | |
| 4%, 9/1/41 Pool # AJ1406 | | | 69,690 | | | | 66,489 | |
| 4%, 10/1/41 Pool # AJ4046 | | | 226,380 | | | | 217,026 | |
| 3.5%, 11/1/41 Pool # AB3867 | | | 84,872 | | | | 78,207 | |
| 2.5%, 3/1/42 Pool # MA4571 | | | 1,596,579 | | | | 1,378,527 | |
| 2.5%, 3/1/42 Pool # CB3076 | | | 603,456 | | | | 518,405 | |
| 4%, 3/1/42 Pool # AL1998 | | | 345,745 | | | | 329,769 | |
| 3.5%, 6/1/42 Pool # AO4134 | | | 357,837 | | | | 329,372 | |
| 3.5%, 8/1/42 Pool # AP2133 | | | 181,549 | | | | 167,032 | |
| 3%, 9/1/42 Pool # AP6568 | | | 46,818 | | | | 41,745 | |
| 3.5%, 9/1/42 Pool # AB6228 | | | 104,409 | | | | 95,952 | |
| 4%, 10/1/42 Pool # AP7363 | | | 236,681 | | | | 224,571 | |
| 3.5%, 1/1/43 Pool # AQ9326 | | | 217,167 | | | | 200,141 | |
| 3%, 2/1/43 Pool # AL3072 | | | 348,070 | | | | 310,491 | |
| 3.5%, 3/1/43 Pool # AT0310 | | | 177,045 | | | | 162,954 | |
| 3.5%, 4/1/43 Pool # AT2887 | | | 179,136 | | | | 164,618 | |
| 5%, 11/1/44 Pool # MA5539 | | | 750,000 | | | | 736,569 | |
| 4%, 1/1/45 Pool # AS4257 | | | 53,053 | | | | 49,942 | |
| 4.5%, 10/1/46 Pool # MA2783 | | | 29,920 | | | | 28,987 | |
| 3%, 1/1/47 Pool # BE0108 | | | 307,499 | | | | 271,075 | |
| 2.5%, 12/1/47 Pool # FM3165 | | | 917,242 | | | | 779,265 | |
| 3%, 1/1/48 Pool # FM1303 | | | 1,026,869 | | | | 905,457 | |
| 3%, 8/1/48 Pool # FS0517 | | | 714,142 | | | | 628,818 | |
| 3%, 1/1/49 Pool # FS4296 | | | 689,364 | | | | 614,733 | |
| 4%, 11/1/50 Pool # FM5530 | | | 522,791 | | | | 488,302 | |
| 2%, 1/1/52 Pool # FS0173 | | | 687,625 | | | | 557,176 | |
| 2%, 1/1/52 Pool # CB2601 | | | 334,499 | | | | 271,042 | |
| 2%, 3/1/52 Pool # CB3105 | | | 424,760 | | | | 343,983 | |
| 2.5%, 3/1/52 Pool # BV4133 | | | 531,765 | | | | 443,808 | |
| 3%, 3/1/52 Pool # CB3115 | | | 833,774 | | | | 725,875 | |
| 2.5%, 4/1/52 Pool # FS4138 | | | 664,691 | | | | 555,929 | |
| 3.5%, 5/1/52 Pool # FS1866 | | | 887,970 | | | | 798,969 | |
| 4%, 5/1/52 Pool # CB3627 | | | 1,142,746 | | | | 1,058,987 | |
| 4%, 5/1/52 Pool # CB3678 | | | 884,267 | | | | 820,320 | |
| 4%, 5/1/52 Pool # FS1704 | | | 401,252 | | | | 374,546 | |
| 4%, 5/1/52 Pool # FS1818 | | | 675,916 | | | | 627,035 | |
| 3.5%, 6/1/52 Pool # CB3845 | | | 860,887 | | | | 774,534 | |
| 3.5%, 7/1/52 Pool # FS2812 | | | 543,647 | | | | 492,997 | |
| 3.5%, 8/1/52 Pool # CB4361 | | | 891,646 | | | | 802,206 | |
| 4.5%, 8/1/52 Pool # FS2605 | | | 456,544 | | | | 434,554 | |
| 4.5%, 8/1/52 Pool # CB4383 | | | 885,771 | | | | 846,707 | |
| 4%, 9/1/52 Pool # MA4732 | | | 439,620 | | | | 407,022 | |
| 4.5%, 9/1/52 Pool # FS2821 | | | 650,692 | | | | 622,615 | |
| 5%, 10/1/52 Pool # MA4785 | | | 835,978 | | | | 813,685 | |
| 5.5%, 10/1/52 Pool # MA4786 | | | 794,560 | | | | 788,208 | |
| 5%, 11/1/52 Pool # MA4806 | | | 867,818 | | | | 845,507 | |
| 5%, 12/1/52 Pool # MA4841 | | | 3,118,359 | | | | 3,038,129 | |
| 5.5%, 12/1/52 Pool # MA4842 | | | 858,284 | | | | 851,952 | |
| 4.5%, 7/1/53 Pool # FS4996 | | | 599,159 | | | | 571,504 | |
| 5.5%, 9/1/53 Pool # FS5575 | | | 640,979 | | | | 639,903 | |
| 5.5%, 5/1/54 Pool # FS7759 | | | 983,504 | | | | 975,986 | |
| | | | | | | | 32,427,869 | |
| | | | | | | | | |
| Freddie Mac - 15.5% | | | | | | | | |
| 4.5%, 2/1/25 Pool # J11722 | | | 1,369 | | | | 1,365 | |
| 4.5%, 5/1/25 Pool # J12247 | | | 4,917 | | | | 4,912 | |
| 8%, 6/1/30 Pool # C01005 | | | 213 | | | | 222 | |
| 6.5%, 1/1/32 Pool # C62333 | | | 4,812 | | | | 4,935 | |
| 2.5%, 2/1/32 Pool # ZS8641 | | | 159,995 | | | | 151,154 | |
| 3.5%, 8/1/32 Pool # C91485 | | | 87,697 | | | | 84,855 | |
| 4%, 5/1/33 Pool # G18693 | | | 142,331 | | | | 140,129 | |
| 4.5%, 6/1/34 Pool # C01856 | | | 118,504 | | | | 115,721 | |
| 2.5%, 6/1/35 Pool # RC1421 | | | 268,772 | | | | 247,242 | |
| 2%, 1/1/36 Pool # SB0546 | | | 707,009 | | | | 635,186 | |
| 6.5%, 11/1/36 Pool # C02660 | | | 2,455 | | | | 2,556 | |
| 5.5%, 1/1/37 Pool # G04593 | | | 73,084 | | | | 74,272 | |
| 5.5%, 11/1/37 Pool # A68787 | | | 48,090 | | | | 48,856 | |
| 5.5%, 12/1/38 Pool # G05267 | | | 132,975 | | | | 134,171 | |
| 4.5%, 8/1/39 Pool # G08361 | | | 132,363 | | | | 129,736 | |
| 3.5%, 11/1/40 Pool # G06168 | | | 123,051 | | | | 113,534 | |
| 2%, 3/1/41 Pool # RB5105 | | | 875,712 | | | | 739,864 | |
| 2.5%, 6/1/41 Pool # SC0151 | | | 703,961 | | | | 611,334 | |
| 4%, 10/1/41 Pool # Q04092 | | | 299,370 | | | | 285,887 | |
| 4.5%, 3/1/42 Pool # G07491 | | | 146,333 | | | | 143,428 | |
| 3%, 9/1/42 Pool # C04233 | | | 217,430 | | | | 194,297 | |
| 3%, 2/1/43 Pool # Q15767 | | | 153,767 | | | | 137,854 | |
| 3%, 4/1/43 Pool # V80026 | | | 271,179 | | | | 242,095 | |
| 3%, 4/1/43 Pool # V80025 | | | 274,854 | | | | 245,051 | |
| 3.5%, 8/1/44 Pool # Q27927 | | | 183,487 | | | | 167,996 | |
| 3%, 7/1/45 Pool # G08653 | | | 259,447 | | | | 230,419 | |
| 3.5%, 8/1/45 Pool # Q35614 | | | 183,380 | | | | 167,518 | |
| 3%, 11/1/45 Pool # G08675 | | | 213,240 | | | | 189,293 | |
| 3%, 1/1/46 Pool # G08686 | | | 270,206 | | | | 239,563 | |
| 3%, 10/1/46 Pool # G60722 | | | 277,890 | | | | 244,990 | |
| 3.5%, 11/1/47 Pool # Q52079 | | | 228,197 | | | | 207,430 | |
| 2.5%, 4/1/48 Pool # QA2240 | | | 909,555 | | | | 771,903 | |
| 3%, 7/1/49 Pool # QA1033 | | | 319,262 | | | | 279,958 | |
| 2.5%, 6/1/51 Pool # QC2842 | | | 857,463 | | | | 717,274 | |
| 2.5%, 1/1/52 Pool # SD7552 | | | 3,441,851 | | | | 2,892,416 | |
| 3.5%, 4/1/52 Pool # SD0960 | | | 1,198,613 | | | | 1,088,814 | |
| 3.5%, 5/1/52 Pool # RA7380 | | | 621,858 | | | | 559,464 | |
See accompanying Notes to Financial Statements.
Madison Funds | October 31, 2024
Core Bond Fund Portfolio of Investments - concluded
| | | Par Value | | | Value (Note 2, 3) | |
| 3.5%, 5/1/52 Pool # QE2363 | | $ | 648,469 | | | $ | 580,918 | |
| 3%, 8/1/52 Pool # SD7556 | | | 1,430,789 | | | | 1,246,347 | |
| 4.5%, 9/1/52 Pool # SD8245 | | | 654,977 | | | | 622,583 | |
| 4.5%, 11/1/52 Pool # SD8266 | | | 1,781,113 | | | | 1,693,021 | |
| 5%, 11/1/52 Pool # SD8267 | | | 2,577,420 | | | | 2,508,159 | |
| 5.5%, 11/1/52 Pool # SD1859 | | | 857,512 | | | | 857,045 | |
| 5.5%, 11/1/52 Pool # SD8268 | | | 1,478,472 | | | | 1,464,327 | |
| 4.5%, 12/1/52 Pool # SD1921 | | | 1,096,523 | | | | 1,050,945 | |
| 5%, 12/1/52 Pool # SD8276 | | | 1,327,176 | | | | 1,291,511 | |
| 5%, 12/1/52 Pool # RA8278 | | | 1,322,562 | | | | 1,287,395 | |
| 5%, 2/1/53 Pool # SD2334 | | | 319,393 | | | | 310,678 | |
| 5%, 2/1/53 Pool # SD8299 | | | 452,243 | | | | 439,902 | |
| 5.5%, 2/1/53 Pool # SD2172 | | | 541,447 | | | | 541,514 | |
| 5%, 5/1/53 Pool # SD2875 | | | 1,406,654 | | | | 1,384,925 | |
| 5.5%, 6/1/53 Pool # SD3174 | | | 922,578 | | | | 919,872 | |
| 6%, 9/1/53 Pool # SD3739 | | | 684,726 | | | | 695,056 | |
| 6%, 9/1/53 Pool # SD8363 | | | 535,575 | | | | 539,032 | |
| 5.5%, 2/1/54 Pool # SD4901 | | | 674,502 | | | | 670,659 | |
| | | | | | | | 30,349,583 | |
| | | | | | | | | |
| Ginnie Mae - 0.0% | | | | | | | | |
| 6.5%, 2/20/29 Pool # 2714 | | | 1,831 | | | | 1,864 | |
| 6.5%, 4/20/31 Pool # 3068 | | | 1,178 | | | | 1,221 | |
| 4%, 4/15/39 Pool # 698089 | | | 9,299 | | | | 8,874 | |
| | | | | | | | 11,959 | |
| | | | | | | | | |
| Total Mortgage Backed Securities | | | | | | | | |
| (Cost $65,765,082) | | | | | | | 62,789,411 | |
| | | | | | | | | |
| U.S. GOVERNMENT AND AGENCY OBLIGATIONS - 27.6% | | | | | | | | |
| | | | | | | | | |
| Federal Home Loan Bank - 0.2% | | | | | | | | |
| 6.050%, 11/21/31 | | | 500,000 | | | | 499,765 | |
| | | | | | | | | |
| U.S. Treasury Bonds - 8.9% | | | | | | | | |
| 6.625%, 2/15/27 | | | 2,000,000 | | | | 2,115,703 | |
| 5.375%, 2/15/31 | | | 1,250,000 | | | | 1,333,350 | |
| 4.500%, 5/15/38 | | | 1,250,000 | | | | 1,269,043 | |
| 2.250%, 5/15/41 | | | 3,000,000 | | | | 2,204,766 | |
| 3.750%, 8/15/41 | | | 4,250,000 | | | | 3,879,287 | |
| 4.625%, 5/15/44 | | | 750,000 | | | | 753,867 | |
| 3.000%, 5/15/45 | | | 1,000,000 | | | | 785,117 | |
| 3.000%, 5/15/47 | | | 750,000 | | | | 579,199 | |
| 3.375%, 11/15/48 | | | 500,000 | | | | 409,297 | |
| 1.250%, 5/15/50 | | | 2,000,000 | | | | 1,006,016 | |
| 1.875%, 2/15/51 | | | 1,600,000 | | | | 943,562 | |
| 4.125%, 8/15/53 | | | 2,250,000 | | | | 2,116,055 | |
| | | | | | | | 17,395,262 | |
| | | | | | | | | |
| U.S. Treasury Notes - 18.5% | | | | | | | | |
| 2.375%, 5/15/27 | | | 1,500,000 | | | | 1,436,543 | |
| 4.625%, 6/15/27 | | | 2,500,000 | | | | 2,530,273 | |
| 4.000%, 2/29/28 | | | 5,500,000 | | | | 5,474,004 | |
| 2.875%, 5/15/28 | | | 3,000,000 | | | | 2,873,555 | |
| 4.625%, 9/30/28 | | | 4,750,000 | | | | 4,827,187 | |
| 2.625%, 2/15/29 | | | 4,500,000 | | | | 4,229,297 | |
| 3.875%, 11/30/29 | | | 4,000,000 | | | | 3,945,000 | |
| 4.000%, 7/31/30 | | | 1,750,000 | | | | 1,732,363 | |
| 4.250%, 6/30/31 | | | 2,250,000 | | | | 2,252,812 | |
| 4.125%, 11/15/32 | | | 750,000 | | | | 744,346 | |
| 3.375%, 5/15/33 | | | 100,000 | | | | 93,668 | |
| 4.000%, 2/15/34 | | | 3,360,000 | | | | 3,287,550 | |
| 4.375%, 5/15/34 | | | 2,750,000 | | | | 2,769,766 | |
| | | | | | | | 36,196,364 | |
| | | | | | | | | |
| Total U.S. Government and Agency Obligations | | | | | | | | |
| (Cost $57,200,502) | | | | | | | 54,091,391 | |
| | | Shares | | | | |
| SHORT-TERM INVESTMENTS - 2.4% | | | | | | |
| State Street Institutional U.S. Government Money Market Fund, Premier Class (F), 4.82% | | | 3,624,464 | | | | 3,624,464 | |
| State Street Navigator Securities Lending Government Money Market Portfolio (F) (G), 4.86% | | | 1,115,975 | | | | 1,115,975 | |
| | | | | | | | | |
| Total Short-Term Investments | | | | | | | | |
| (Cost $4,740,439) | | | | | | | | |
| | | | | | | | 4,740,439 | |
| | | | | | | | | |
| TOTAL INVESTMENTS - 100.0% | | | | | | | | |
| (Cost $207,362,721**) | | | | | | | 196,061,401 | |
| NET OTHER ASSETS AND | | | | | | | | |
| LIABILITIES - 0.0% | | | | | | | 31,452 | |
| TOTAL NET ASSETS - 100.0% | | | | | | $ | 196,092,853 | |
| ** | Aggregate cost for Federal tax purposes was $207,437,779. |
| (A) | Security sold within terms of a private placement memorandum exempt from registration under section 144A of the Securities Act of 1933, as amended, and may be sold only to dealers in that program or other "qualified institutional buyers." |
| (B) | Coupon rate may change based on changes of the underlying collateral or prepayments of principal. The coupon rate shown represents the rate at October 31, 2024. |
| (C) | Floating rate or variable rate note. Rate shown is as of October 31, 2024. |
| (D) | Stepped rate security. Rate shown is as of October 31, 2024. |
| (E) | All or a portion of these securities, with an aggregate fair value of $1,090,904, are on loan as part of a securities lending program. See footnote (G) and Note 11 for details on the securities lending program. |
| (F) | 7-day yield. |
| (G) | Represents investments of cash collateral received in connection with securities lending. |
| (H) | Defaulted Security. Security was deemed illiquid by Madison. Interest is not being accrued. |
| | |
| BDC | Business Development Company |
| CMT | Constant Maturity Treasury. |
| DAC | Designated Activity Company. |
| FREMF | Freddie Mac Multifamily Securities |
| IO | Interest Only. |
| LLC | Limited Liability Company. |
| LP | Limited Partnership. |
| PLC | Public Limited Company. |
| REMIC | Real Estate Mortgage Investment Conduit. |
| SOFR | Secured Overnight Financing Rate. |
| STACR | Structured Agency Credit Risk. |
| USD | United States Dollar. |
See accompanying Notes to Financial Statements.
Madison Funds | October 31, 2024
Covered Call & Equity Income Fund Portfolio of Investments
| | | Shares | | | Value (Note 2, 3) | |
| COMMON STOCKS - 77.1% | | | | | | |
| Communication Services - 5.3% | | | | | | |
| Alphabet, Inc., Class C (A) | | | 32,000 | | | $ | 5,526,080 | |
| Comcast Corp., Class A (A) | | | 60,000 | | | | 2,620,200 | |
| T-Mobile U.S., Inc. (A) | | | 23,000 | | | | 5,132,680 | |
| | | | | | | | 13,278,960 | |
| Consumer Discretionary - 5.8% | | | | | | | | |
| Las Vegas Sands Corp. (A) | | | 216,000 | | | | 11,199,600 | |
| Ross Stores, Inc. (A) | | | 25,000 | | | | 3,493,000 | |
| | | | | | | | 14,692,600 | |
| Consumer Staples - 10.7% | | | | | | | | |
| Archer-Daniels-Midland Co. | | | 96,000 | | | | 5,300,160 | |
| Constellation Brands, Inc., Class A (A) | | | 22,100 | | | | 5,134,714 | |
| Dollar Tree, Inc. * (A) | | | 73,000 | | | | 4,718,720 | |
| Hershey Co. (A) | | | 31,000 | | | | 5,504,980 | |
| PepsiCo, Inc. (A) | | | 38,100 | | | | 6,327,648 | |
| | | | | | | | 26,986,222 | |
| Energy - 10.7% | | | | | | | | |
| APA Corp. | | | 205,000 | | | | 4,838,000 | |
| ConocoPhillips | | | 69,200 | | | | 7,580,168 | |
| Matador Resources Co. (A) | | | 137,000 | | | | 7,139,070 | |
| Transocean Ltd. * | | | 1,700,000 | | | | 7,378,000 | |
| | | | | | | | 26,935,238 | |
| Equity Real Estate Investment | | | | | | | | |
| Trusts (REITs) - 2.5% | | | | | | | | |
| American Tower Corp., REIT (A) | | | 29,500 | | | | 6,299,430 | |
| Financials - 7.5% | | | | | | | | |
| CME Group, Inc. (A) | | | 30,000 | | | | 6,760,800 | |
| PayPal Holdings, Inc. * (A) | | | 82,000 | | | | 6,502,600 | |
| Visa, Inc., Class A (A) | | | 19,500 | | | | 5,652,075 | |
| | | | | | | | 18,915,475 | |
| Health Care - 15.5% | | | | | | | | |
| Abbott Laboratories (A) | | | 45,000 | | | | 5,101,650 | |
| Agilent Technologies, Inc. (A) | | | 43,000 | | | | 5,603,330 | |
| CVS Health Corp. (A) | | | 90,300 | | | | 5,098,338 | |
| Danaher Corp. (A) | | | 16,000 | | | | 3,930,560 | |
| Johnson & Johnson (A) | | | 25,000 | | | | 3,996,500 | |
| Labcorp Holdings, Inc. (A) | | | 18,000 | | | | 4,108,860 | |
| Medtronic PLC (A) | | | 86,100 | | | | 7,684,425 | |
| Pfizer, Inc. (A) | | | 123,000 | | | | 3,480,900 | |
| Solventum Corp. * | | | 1,750 | | | | 127,015 | |
| | | | | | | | 39,131,578 | |
| Industrials - 8.7% | | | | | | | | |
| Automatic Data Processing, Inc. (A) | | | 15,000 | | | | 4,338,600 | |
| Emerson Electric Co. (A) | | | 36,000 | | | | 3,897,720 | |
| Fastenal Co. (A) | | | 81,000 | | | | 6,332,580 | |
| Honeywell International, Inc. (A) | | | 35,700 | | | | 7,342,776 | |
| | | | | | | | 21,911,676 | |
| Information Technology - 4.9% | | | | | | | | |
| Accenture PLC, Class A (A) | | | 7,000 | | | | 2,413,740 | |
| Adobe, Inc. * (A) | | | 8,000 | | | | 3,824,640 | |
| Advanced Micro Devices, Inc. * (A) | | | 17,000 | | | | 2,449,190 | |
| Microchip Technology, Inc. (A) | | | 50,000 | | | | 3,668,500 | |
| | | | | | | | 12,356,070 | |
| Materials - 3.0% | | | | | | | | |
| Barrick Gold Corp. (A) | | | 385,000 | | | | 7,438,200 | |
| Utilities - 2.5% | | | | | | | | |
| AES Corp. (A) | | | 387,000 | | | | 6,381,630 | |
| | | | | | | | | |
| Total Common Stocks | | | | | | | | |
| (Cost $213,653,780) | | | | | | | 194,327,079 | |
| | | | | | | | | |
| SHORT-TERM INVESTMENTS - 24.2% | | | | | | | | |
| State Street Institutional U.S. Government Money Market Fund, Premier Class (B), 4.82% | | | 60,932,574 | | | | 60,932,574 | |
| | | | | | | | | |
| Total Short-Term Investments | | | | | | | | |
| (Cost $60,932,574) | | | | | | | 60,932,574 | |
| TOTAL INVESTMENTS - 101.3% | | | | | | | | |
| (Cost $274,586,354**) | | | | | | | 255,259,653 | |
| TOTAL CALL OPTIONS WRITTEN - (1.4%) | | | | | | | (3,534,139 | ) |
| NET OTHER ASSETS AND LIABILITIES - 0.1% | | | | | | | 240,072 | |
| TOTAL NET ASSETS - 100.0% | | | | | | $ | 251,965,586 | |
| * | Non-income producing. |
| ** | Aggregate cost for Federal tax purposes was $270,720,388. |
| (A) | All or a portion of these securities' positions, with a value of $169,103,736, represent covers (directly or through conversion rights) for outstanding options written. |
| (B) | 7-day yield. |
| | |
| PLC | Public Limited Company. |
| REIT | Real Estate Investment Trust. |
Written Option Contracts Outstanding at October 31, 2024
| | | | | | | | Number of | | | | | | | | | Premiums Paid | | | Unrealized Appreciation | |
| Description | | Exercise Price | | | Expiration Date | | Contracts | | | Notional Amount | | | Market Value | | | (Received) | | | (Depreciation) | |
| Call Options Written | | | | | | | | | | | | | | | | | | | | | | | | | | |
| Abbott Laboratories | | $ | 120.00 | | | 12/20/24 | | | (450 | ) | | $ | (5,400,000 | ) | | $ | (68,175 | ) | | $ | (105,578 | ) | | $ | 37,403 | |
| Accenture PLC, Class A | | | 350.00 | | | 11/15/24 | | | (70 | ) | | | (2,450,000 | ) | | | (33,250 | ) | | | (55,926 | ) | | | 22,676 | |
| Adobe, Inc. | | | 530.00 | | | 11/15/24 | | | (80 | ) | | | (4,240,000 | ) | | | (5,880 | ) | | | (111,115 | ) | | | 105,235 | |
| Advanced Micro Devices, Inc. | | | 170.00 | | | 12/20/24 | | | (170 | ) | | | (2,890,000 | ) | | | (40,885 | ) | | | (69,523 | ) | | | 28,638 | |
| AES Corp. | | | 20.00 | | | 11/15/24 | | | (1,935 | ) | | | (3,870,000 | ) | | | (33,862 | ) | | | (95,534 | ) | | | 61,672 | |
| AES Corp. | | | 21.00 | | | 11/15/24 | | | (1,935 | ) | | | (4,063,500 | ) | | | (19,350 | ) | | | (114,688 | ) | | | 95,338 | |
| Agilent Technologies, Inc. | | | 150.00 | | | 11/15/24 | | | (215 | ) | | | (3,225,000 | ) | | | — | | | | (83,627 | ) | | | 83,627 | |
| Agilent Technologies, Inc. | | | 150.00 | | | 12/20/24 | | | (215 | ) | | | (3,225,000 | ) | | | (17,737 | ) | | | (71,503 | ) | | | 53,766 | |
| Alphabet, Inc., Class C | | | 175.00 | | | 11/15/24 | | | (320 | ) | | | (5,600,000 | ) | | | (104,800 | ) | | | (105,268 | ) | | | 468 | |
| American Tower Corp., REIT | | | 230.00 | | | 1/17/25 | | | (65 | ) | | | (1,495,000 | ) | | | (22,100 | ) | | | (22,683 | ) | | | 583 | |
| American Tower Corp., REIT | | | 240.00 | | | 1/17/25 | | | (230 | ) | | | (5,520,000 | ) | | | (37,950 | ) | | | (110,160 | ) | | | 72,210 | |
| Automatic Data Processing, Inc. | | | 290.00 | | | 1/17/25 | | | (150 | ) | | | (4,350,000 | ) | | | (153,000 | ) | | | (92,276 | ) | | | (60,724 | ) |
| Barrick Gold Corp. | | | 23.00 | | | 12/20/24 | | | (1,925 | ) | | | (4,427,500 | ) | | | (28,875 | ) | | | (90,418 | ) | | | 61,543 | |
| Barrick Gold Corp. | | | 23.00 | | | 1/17/25 | | | (1,925 | ) | | | (4,427,500 | ) | | | (56,788 | ) | | | (146,954 | ) | | | 90,166 | |
| CME Group, Inc. | | | 220.00 | | | 12/20/24 | | | (300 | ) | | | (6,600,000 | ) | | | (297,000 | ) | | | (166,392 | ) | | | (130,608 | ) |
| Comcast Corp., Class A | | | 42.50 | | | 11/15/24 | | | (600 | ) | | | (2,550,000 | ) | | | (109,800 | ) | | | (49,782 | ) | | | (60,018 | ) |
| Constellation Brands, Inc., Class A | | | 260.00 | | | 11/15/24 | | | (61 | ) | | | (1,586,000 | ) | | | (3,050 | ) | | | (43,856 | ) | | | 40,806 | |
| Constellation Brands, Inc., Class A | | | 250.00 | | | 1/17/25 | | | (160 | ) | | | (4,000,000 | ) | | | (71,200 | ) | | | (100,633 | ) | | | 29,433 | |
| CVS Health Corp. | | | 65.00 | | | 11/15/24 | | | (453 | ) | | | (2,944,500 | ) | | | (12,004 | ) | | | (73,308 | ) | | | 61,304 | |
| CVS Health Corp. | | | 70.00 | | | 11/15/24 | | | (450 | ) | | | (3,150,000 | ) | | | (3,375 | ) | | | (65,654 | ) | | | 62,279 | |
| Danaher Corp. | | | 250.00 | | | 12/20/24 | | | (160 | ) | | | (4,000,000 | ) | | | (120,000 | ) | | | (91,033 | ) | | | (28,967 | ) |
| Dollar Tree, Inc. | | | 80.00 | | | 12/20/24 | | | (523 | ) | | | (4,184,000 | ) | | | (127,351 | ) | | | (134,133 | ) | | | 6,782 | |
| Emerson Electric Co. | | | 115.00 | | | 12/20/24 | | | (360 | ) | | | (4,140,000 | ) | | | (77,400 | ) | | | (102,083 | ) | | | 24,683 | |
| Fastenal Co. | | | 70.00 | | | 11/15/24 | | | (495 | ) | | | (3,465,000 | ) | | | (435,600 | ) | | | (71,631 | ) | | | (363,969 | ) |
| Fastenal Co. | | | 72.50 | | | 11/15/24 | | | (315 | ) | | | (2,283,750 | ) | | | (211,050 | ) | | | (51,650 | ) | | | (159,400 | ) |
| Hershey Co. | | | 210.00 | | | 11/15/24 | | | (190 | ) | | | (3,990,000 | ) | | | (4,750 | ) | | | (100,502 | ) | | | 95,752 | |
| Hershey Co. | | | 200.00 | | | 12/20/24 | | | (120 | ) | | | (2,400,000 | ) | | | (8,400 | ) | | | (68,275 | ) | | | 59,875 | |
| Honeywell International, Inc. | | | 210.00 | | | 12/20/24 | | | (357 | ) | | | (7,497,000 | ) | | | (151,725 | ) | | | (241,376 | ) | | | 89,651 | |
See accompanying Notes to Financial Statements.
Madison Funds | October 31, 2024
Covered Call & Equity Income Fund Portfolio of Investments – concluded
Written Option Contracts Outstanding at October 31, 2024 (continued)
| | | | | | | | | | | | | | | | | Premiums Paid | | | Unrealized Appreciation | |
| Description | | Exercise Price | | | Expiration Date | | Number of Contracts | | | Notional Amount | | | Market Value | | | (Received) | | | (Depreciation) | |
| Call Options Written (continued) | | | | | | | | | | | | | | | | | | | | | | | | | | |
| Johnson & Johnson | | $ | 170.00 | | | 1/17/25 | | | (250 | ) | | $ | (4,250,000 | ) | | $ | (41,500 | ) | | $ | (65,991 | ) | | $ | 24,491 | |
| Labcorp Holdings, Inc. | | | 230.00 | | | 11/15/24 | | | (180 | ) | | | (4,140,000 | ) | | | (75,600 | ) | | | (89,002 | ) | | | 13,402 | |
| Las Vegas Sands Corp. | | | 57.50 | | | 12/20/24 | | | (2,160 | ) | | | (12,420,000 | ) | | | (156,600 | ) | | | (280,273 | ) | | | 123,673 | |
| Matador Resources Co. | | | 60.00 | | | 12/20/24 | | | (1,120 | ) | | | (6,720,000 | ) | | | (98,000 | ) | | | (128,550 | ) | | | 30,550 | |
| Matador Resources Co. | | | 60.00 | | | 1/17/25 | | | (250 | ) | | | (1,500,000 | ) | | | (35,625 | ) | | | (27,242 | ) | | | (8,383 | ) |
| Medtronic PLC | | | 92.50 | | | 12/20/24 | | | (861 | ) | | | (7,964,250 | ) | | | (164,021 | ) | | | (181,039 | ) | | | 17,018 | |
| Microchip Technology, Inc. | | | 85.00 | | | 11/15/24 | | | (500 | ) | | | (4,250,000 | ) | | | (30,000 | ) | | | (149,482 | ) | | | 119,482 | |
| PayPal Holdings, Inc. | | | 87.50 | | | 12/20/24 | | | (200 | ) | | | (1,750,000 | ) | | | (25,300 | ) | | | (64,644 | ) | | | 39,344 | |
| PepsiCo, Inc. | | | 175.00 | | | 12/20/24 | | | (95 | ) | | | (1,662,500 | ) | | | (11,020 | ) | | | (39,326 | ) | | | 28,306 | |
| PepsiCo, Inc. | | | 175.00 | | | 1/17/25 | | | (160 | ) | | | (2,800,000 | ) | | | (31,840 | ) | | | (34,235 | ) | | | 2,395 | |
| PepsiCo, Inc. | | | 180.00 | | | 1/17/25 | | | (126 | ) | | | (2,268,000 | ) | | | (12,096 | ) | | | (45,859 | ) | | | 33,763 | |
| Pfizer, Inc. | | | 32.00 | | | 12/20/24 | | | (1,230 | ) | | | (3,936,000 | ) | | | (16,605 | ) | | | (83,603 | ) | | | 66,998 | |
| Ross Stores, Inc. | | | 150.00 | | | 1/17/25 | | | (250 | ) | | | (3,750,000 | ) | | | (93,750 | ) | | | (91,315 | ) | | | (2,435 | ) |
| T-Mobile U.S., Inc. | | | 210.00 | | | 11/15/24 | | | (130 | ) | | | (2,730,000 | ) | | | (183,950 | ) | | | (65,282 | ) | | | (118,668 | ) |
| T-Mobile U.S., Inc. | | | 230.00 | | | 1/17/25 | | | (100 | ) | | | (2,300,000 | ) | | | (64,000 | ) | | | (60,896 | ) | | | (3,104 | ) |
| Visa, Inc., Class A | | | 285.00 | | | 12/20/24 | | | (195 | ) | | | (5,557,500 | ) | | | (238,875 | ) | | | (113,887 | ) | | | (124,988 | ) |
| Total Call Options Written | | | | | | | | | | | | | | | | $ | (3,534,139 | ) | | $ | (4,156,187 | ) | | $ | 622,048 | |
| Total Options Written, at Value | | | | | | | | | | | | | | | | $ | (3,534,139 | ) | | $ | (4,156,187 | ) | | $ | 622,048 | |
See accompanying Notes to Financial Statements.
Madison Funds | October 31, 2024
Dividend Income Fund Portfolio of Investments
| | | Shares | | | Value (Note 2, 3) | |
| COMMON STOCKS - 98.5% | | | | | | | | |
| Communication Service - 3.4% | | | | | | | | |
| Comcast Corp., Class A | | | 117,000 | | | $ | 5,109,390 | |
| | | | | | | | | |
| Consumer Discretionary - 9.7% | | | | | | | | |
| Home Depot, Inc. | | | 14,300 | | | | 5,630,625 | |
| Lowe's Cos., Inc. | | | 17,700 | | | | 4,634,391 | |
| McDonald's Corp. | | | 7,300 | | | | 2,132,403 | |
| Starbucks Corp. | | | 21,200 | | | | 2,071,240 | |
| | | | | | | | 14,468,659 | |
| Consumer Staples - 7.8% | | | | | | | | |
| Colgate-Palmolive Co. | | | 30,900 | | | | 2,895,639 | |
| Hershey Co. | | | 14,400 | | | | 2,557,152 | |
| PepsiCo, Inc. | | | 22,400 | | | | 3,720,192 | |
| Procter & Gamble Co. | | | 14,300 | | | | 2,362,074 | |
| | | | | | | | 11,535,057 | |
| | | | | | | | | |
| Energy - 10.0% | | | | | | | | |
| Chevron Corp. | | | 27,000 | | | | 4,018,140 | |
| ConocoPhillips | | | 25,500 | | | | 2,793,270 | |
| EOG Resources, Inc. | | | 39,000 | | | | 4,756,440 | |
| Exxon Mobil Corp. | | | 27,900 | | | | 3,258,162 | |
| | | | | | | | 14,826,012 | |
| Equity Real Estate Investment | | | | | | | | |
| Trusts (REITs) - 2.8% | | | | | | | | |
| American Tower Corp., REIT | | | 19,800 | | | | 4,228,092 | |
| | | | | | | | | |
| Financials - 20.8% | | | | | | | | |
| Bank of America Corp. | | | 88,900 | | | | 3,717,798 | |
| Blackrock, Inc. | | | 5,550 | | | | 5,444,717 | |
| CME Group, Inc. | | | 22,800 | | | | 5,138,208 | |
| JPMorgan Chase & Co. | | | 17,000 | | | | 3,772,640 | |
| Morgan Stanley | | | 54,300 | | | | 6,312,375 | |
| Northern Trust Corp. | | | 22,900 | | | | 2,301,908 | |
| U.S. Bancorp | | | 89,000 | | | | 4,299,590 | |
| | | | | | | | 30,987,236 | |
| Health Care - 12.2% | | | | | | | | |
| Abbott Laboratories | | | 29,000 | | | | 3,287,730 | |
| AbbVie, Inc. | | | 21,100 | | | | 4,301,657 | |
| Johnson & Johnson | | | 32,100 | | | | 5,131,506 | |
| Medtronic PLC | | | 61,000 | | | | 5,444,250 | |
| | | | | | | | 18,165,143 | |
| Industrials - 19.4% | | | | | | | | |
| Automatic Data Processing, Inc. | | | 22,000 | | | | 6,363,280 | |
| Caterpillar, Inc. | | | 4,250 | | | | 1,598,850 | |
| Cummins, Inc. | | | 8,550 | | | | 2,812,779 | |
| Fastenal Co. | | | 79,000 | | | | 6,176,220 | |
| Honeywell International, Inc. | | | 24,700 | | | | 5,080,296 | |
| Paychex, Inc. | | | 19,100 | | | | 2,661,203 | |
| Union Pacific Corp. | | | 17,900 | | | | 4,154,053 | |
| | | | | | | | 28,846,681 | |
| Information Technology - 6.0% | | | | | | | | |
| Accenture PLC, Class A | | | 4,800 | | | | 1,655,136 | |
| Analog Devices, Inc. | | | 9,100 | | | | 2,030,301 | |
| Texas Instruments, Inc. | | | 25,900 | | | | 5,261,844 | |
| | | | | | | | 8,947,281 | |
| Materials - 2.2% | | | | | | | | |
| Air Products & Chemicals, Inc. | | | 10,600 | | | | 3,291,618 | |
| | | | | | | | | |
| Utilities - 4.2% | | | | | | | | |
| NextEra Energy, Inc. | | | 79,400 | | | | 6,292,450 | |
| | | | | | | | | |
| Total Common Stocks | | | | | | | | |
| (Cost $107,987,853) | | | | | | | 146,697,619 | |
| SHORT-TERM INVESTMENTS - 1.6% | | | | | | | | |
| State Street Institutional U.S. | | | | | | | | |
| Government Money Market Fund, | | | | | | | | |
| Premier Class (A), 4.82% | | | 2,372,375 | | | | 2,372,375 | |
| | | | | | | | | |
| Total Short-Term Investments | | | | | | | | |
| (Cost $2,372,375) | | | | | | | 2,372,375 | |
| TOTAL INVESTMENTS - 100.1% | | | | | | | | |
| (Cost $110,360,228**) | | | | | | | 149,069,994 | |
| NET OTHER ASSETS AND | | | | | | | | |
| LIABILITIES - (0.1%) | | | | | | | (139,960 | ) |
| TOTAL NET ASSETS - 100.0% | | | | | | $ | 148,930,034 | |
| ** | Aggregate cost for Federal tax purposes was $111,847,294. |
| (A) | 7-day yield. |
| | |
| PLC | Public Limited Company. |
| REIT | Real Estate Investment Trust. |
Investors Fund Portfolio of Investments
| | | Shares | | | Value (Note 2, 3) | |
| COMMON STOCKS - 97.9% | | | | | | | | |
| Communication Services - 9.5% | | | | | | | | |
| Alphabet, Inc., Class C | | | 189,415 | | | $ | 32,710,077 | |
| Liberty Broadband Corp., Class C * | | | 84,704 | | | | 6,845,777 | |
| | | | | | | | 39,555,854 | |
| Consumer Discretionary - 14.2% | | | | | | | | |
| Amazon.com, Inc. * | | | 104,034 | | | | 19,391,938 | |
| Lowe's Cos., Inc. | | | 65,356 | | | | 17,112,161 | |
| NIKE, Inc., Class B | | | 80,268 | | | | 6,191,071 | |
| Starbucks Corp. | | | 89,360 | | | | 8,730,472 | |
| TJX Cos., Inc. | | | 71,332 | | | | 8,062,656 | |
| | | | | | | | 59,488,298 | |
| Consumer Staples - 1.4% | | | | | | | | |
| Dollar Tree, Inc. * | | | 92,539 | | | | 5,981,721 | |
| | | | | | | | | |
| Financials - 33.3% | | | | | | | | |
| Capital Markets - 4.9% | | | | | | | | |
| Brookfield Corp. | | | 220,189 | | | | 11,670,017 | |
| Charles Schwab Corp. | | | 122,974 | | | | 8,710,248 | |
| | | | | | | | 20,380,265 | |
| Commercial Banks - 3.0% | | | | | | | | |
| U.S. Bancorp | | | 255,223 | | | | 12,329,823 | |
| | | | | | | | | |
| Financial Services - 13.1% | | | | | | | | |
| Berkshire Hathaway, Inc., Class B * | | | 38,181 | | | | 17,216,577 | |
| Fiserv, Inc. * | | | 120,951 | | | | 23,936,203 | |
| Visa, Inc., Class A | | | 47,237 | | | | 13,691,644 | |
| | | | | | | | 54,844,424 | |
| | | | | | | | | |
| Insurance - 12.3% | | | | | | | | |
| Arch Capital Group Ltd. * | | | 258,504 | | | | 25,478,154 | |
| Marsh & McLennan Cos., Inc. | | | 49,867 | | | | 10,882,974 | |
| Progressive Corp. | | | 62,444 | | | | 15,163,277 | |
| | | | | | | | 51,524,405 | |
| | | | | | | | 139,078,917 | |
| Health Care - 9.8% | | | | | | | | |
| Agilent Technologies, Inc. | | | 95,854 | | | | 12,490,735 | |
| Alcon AG | | | 170,864 | | | | 15,710,945 | |
| Danaher Corp. | | | 28,452 | | | | 6,989,518 | |
| Elevance Health, Inc. | | | 13,865 | | | | 5,625,862 | |
| | | | | | | | 40,817,060 | |
| Industrials - 16.0% | | | | | | | | |
| Copart, Inc. * | | | 257,126 | | | | 13,234,275 | |
| Deere & Co. | | | 21,786 | | | | 8,816,576 | |
| Ferguson Enterprises, Inc. | | | 60,906 | | | | 11,982,646 | |
| PACCAR, Inc. | | | 175,098 | | | | 18,259,220 | |
| Parker-Hannifin Corp. | | | 23,112 | | | | 14,654,626 | |
| | | | | | | | 66,947,343 | |
| Information Technology - 13.7% | | | | | | | | |
| Accenture PLC, Class A | | | 38,045 | | | | 13,118,677 | |
| Analog Devices, Inc. | | | 73,358 | | | | 16,366,903 | |
| Keysight Technologies, Inc. * | | | 94,253 | | | | 14,044,640 | |
| Texas Instruments, Inc. | | | 67,982 | | | | 13,811,223 | |
| | | | | | | | 57,341,443 | |
| Total Common Stocks | | | | | | | | |
| (Cost $218,136,867) | | | | | | | 409,210,636 | |
| SHORT-TERM INVESTMENTS - 1.9% | | | | | | | | |
| | | | | | | | | |
| State Street Institutional U.S. Government Money Market Fund, Premier Class (A), 4.82% | | | 8,085,826 | | | | 8,085,826 | |
| | | | | | | | | |
| Total Short-Term Investments | | | | | | | | |
| (Cost $8,085,826) | | | | | | | 8,085,826 | |
| TOTAL INVESTMENTS - 99.8% | | | | | | | | |
| (Cost $226,222,693**) | | | | | | | 417,296,462 | |
| NET OTHER ASSETS AND | | | | | | | | |
| LIABILITIES - 0.2% | | | | | | | 817,526 | |
| TOTAL NET ASSETS - 100.0% | | | | | | $ | 418,113,988 | |
| * | Non-income producing. |
| ** | Aggregate cost for Federal tax purposes was $227,204,185. |
| (A) | 7-day yield. |
| | |
| PLC | Public Limited Company. |
See accompanying Notes to Financial Statements.
Madison Funds | October 31, 2024
Sustainable Equity Fund Portfolio of Investments
| | | Shares | | | Value (Note 2, 3) | |
| COMMON STOCKS - 98.5% | | | | | | | | |
| Communication Service - 6.7% | | | | | | | | |
| Alphabet, Inc., Class C | | | 3,819 | | | $ | 659,503 | |
| | | | | | | | | |
| Consumer Discretionary - 9.5% | | | | | | | | |
| Amazon.com, Inc. * | | | 1,972 | | | | 367,581 | |
| Home Depot, Inc. | | | 593 | | | | 233,494 | |
| McDonald's Corp. | | | 250 | | | | 73,027 | |
| TJX Cos., Inc. | | | 2,325 | | | | 262,795 | |
| | | | | | | | 936,897 | |
| Consumer Staples - 6.1% | | | | | | | | |
| Costco Wholesale Corp. | | | 572 | | | | 500,031 | |
| Target Corp. | | | 666 | | | | 99,927 | |
| | | | | | | | 599,958 | |
| Financials - 16.7% | | | | | | | | |
| Blackrock, Inc. | | | 208 | | | | 204,054 | |
| Charles Schwab Corp. | | | 2,316 | | | | 164,042 | |
| JPMorgan Chase & Co. | | | 1,462 | | | | 324,447 | |
| Progressive Corp. | | | 1,307 | | | | 317,379 | |
| U.S. Bancorp | | | 5,186 | | | | 250,536 | |
| Visa, Inc., Class A | | | 1,353 | | | | 392,167 | |
| | | | | | | | 1,652,625 | |
| Health Care - 16.3% | | | | | | | | |
| Agilent Technologies, Inc. | | | 1,850 | | | | 241,074 | |
| Danaher Corp. | | | 1,084 | | | | 266,295 | |
| Eli Lilly & Co. | | | 793 | | | | 657,984 | |
| UnitedHealth Group, Inc. | | | 647 | | | | 365,231 | |
| Vertex Pharmaceuticals, Inc. * | | | 166 | | | | 79,013 | |
| | | | | | | | 1,609,597 | |
| Industrials - 4.3% | | | | | | | | |
| Equifax, Inc. | | | 772 | | | | 204,596 | |
| Union Pacific Corp. | | | 506 | | | | 117,427 | |
| United Parcel Service, Inc., Class B | | | 770 | | | | 103,226 | |
| | | | | | | | 425,249 | |
| Information Technology - 29.5% | | | | | | | | |
| Computers & Peripherals - 4.6% | | | | | | | | |
| Apple, Inc. | | | 2,000 | | | | 451,820 | |
| Electronic Equipment, Instruments & Components - 3.6% | | | | | | | | |
| Keysight Technologies, Inc. * | | | 1,105 | | | | 164,656 | |
| TE Connectivity PLC | | | 1,331 | | | | 196,216 | |
| | | | | | | | 360,872 | |
| IT Services - 2.8% | | | | | | | | |
| Accenture PLC, Class A | | | 791 | | | | 272,753 | |
| Semiconductors & Semiconductor Equipment - 6.9% | | | | | | | | |
| Analog Devices, Inc. | | | 952 | | | | 212,401 | |
| QUALCOMM, Inc. | | | 1,347 | | | | 219,251 | |
| Texas Instruments, Inc. | | | 1,243 | | | | 252,528 | |
| | | | | | | | 684,180 | |
| Software - 11.6% | | | | | | | | |
| Microsoft Corp. | | | 1,888 | | | | 767,189 | |
| Oracle Corp. | | | 2,283 | | | | 383,178 | |
| | | | | | | | 1,150,367 | |
| | | | | | | | 2,919,992 | |
| Materials - 5.2% | | | | | | | | |
| Ecolab, Inc. | | | 916 | | | | 225,089 | |
| Linde PLC | | | 644 | | | | 293,760 | |
| | | | | | | | 518,849 | |
| Utilities - 4.2% | | | | | | | | |
| NextEra Energy, Inc. | | | 5,263 | | | | 417,093 | |
| | | | | | | | | |
| Total Common Stocks | | | | | | | | |
| (Cost $7,210,489) | | | | | | | 9,739,763 | |
| | | | | | | | | |
| SHORT-TERM INVESTMENTS - 1.5% | | | | | | | | |
| State Street Institutional U.S. Government Money Market Fund, Premier Class (A), 4.82% | | | 146,854 | | | | 146,854 | |
| | | | | | | | | |
| Total Short-Term Investments | | | | | | | | |
| (Cost $146,854) | | | | | | | 146,854 | |
| | | | | | | | | |
| TOTAL INVESTMENTS - 100.0% | | | | | | | | |
| (Cost $7,357,343**) | | | | | | | 9,886,617 | |
| NET OTHER ASSETS AND LIABILITIES – (0.0)% | | | | | | | (3,372 | ) |
| TOTAL NET ASSETS - 100.0% | | | | | | $ | 9,883,245 | |
| * | Non-income producing. |
| ** | Aggregate cost for Federal tax purposes was $7,453,414. |
| (A) | 7-day yield. |
| | |
| PLC | Public Limited Company. |
Mid Cap Fund Portfolio of Investments
| | | Shares | | | Value (Note 2, 3) | |
| COMMON STOCKS - 94.1% | | | | | | | | |
| Communication Services - 5.4% | | | | | | | | |
| Liberty Broadband Corp., Class C * | | | 622,194 | | | $ | 50,285,719 | |
| Liberty Media Corp.-Liberty Formula | | | | | | | | |
| One, Class A * | | | 454,863 | | | | 33,769,029 | |
| Liberty Media Corp.-Liberty Formula | | | | | | | | |
| One, Class C * | | | 215,397 | | | | 17,197,297 | |
| | | | | | | | 101,252,045 | |
| Consumer Discretionary - 16.7% | | | | | | | | |
| Asbury Automotive Group, Inc. * | | | 172,468 | | | | 39,295,109 | |
| CarMax, Inc. * | | | 392,029 | | | | 28,375,059 | |
| Floor & Decor Holdings, Inc., Class A * | | | 492,346 | | | | 50,736,255 | |
| Lithia Motors, Inc. | | | 130,221 | | | | 43,281,554 | |
| Ross Stores, Inc. | | | 727,274 | | | | 101,614,723 | |
| Thor Industries, Inc. | | | 505,848 | | | | 52,648,660 | |
| | | | | | | | 315,951,360 | |
| Consumer Staples - 4.6% | | | | | | | | |
| Brown-Forman Corp., Class B | | | 872,944 | | | | 38,435,724 | |
| Dollar Tree, Inc. * | | | 743,220 | | | | 48,041,741 | |
| | | | | | | | 86,477,465 | |
| Financials - 22.4% | | | | | | | | |
| Arch Capital Group Ltd. * | | | 1,551,095 | | | | 152,875,923 | |
| Brookfield Asset Management Ltd., | | | | | | | | |
| Class A (B) | | | 870,542 | | | | 46,173,548 | |
| Brown & Brown, Inc. | | | 876,095 | | | | 91,674,581 | |
| Cullen/Frost Bankers, Inc. | | | 173,504 | | | | 22,095,734 | |
| Glacier Bancorp, Inc. | | | 473,873 | | | | 24,712,477 | |
| Moelis & Co., Class A | | | 557,374 | | | | 37,009,634 | |
| W.R. Berkley Corp. | | | 829,081 | | | | 47,398,561 | |
| | | | | | | | 421,940,458 | |
| Health Care - 5.5% | | | | | | | | |
| Labcorp Holdings, Inc. | | | 251,827 | | | | 57,484,549 | |
| Waters Corp. * | | | 141,445 | | | | 45,702,294 | |
| | | | | | | | 103,186,843 | |
| Industrials - 17.0% | | | | | | | | |
| Armstrong World Industries, Inc. | | | 262,637 | | | | 36,650,993 | |
| Carlisle Cos., Inc. | | | 193,633 | | | | 81,757,662 | |
| Copart, Inc. * | | | 1,484,949 | | | | 76,430,325 | |
| Expeditors International of Washington, | | | | | | | | |
| Inc. | | | 244,537 | | | | 29,099,903 | |
| Graco, Inc. | | | 227,887 | | | | 18,561,396 | |
| PACCAR, Inc. | | | 749,764 | | | | 78,185,390 | |
| | | | | | | | 320,685,669 | |
| Information Technology - 22.5% | | | | | | | | |
| Amphenol Corp., Class A | | | 1,111,848 | | | | 74,516,053 | |
| Arista Networks, Inc. * | | | 148,735 | | | | 57,477,153 | |
| CDW Corp. | | | 267,359 | | | | 50,324,985 | |
| Gartner, Inc. * | | | 251,412 | | | | 126,334,530 | |
| Microchip Technology, Inc. | | | 363,078 | | | | 26,639,033 | |
| MKS Instruments, Inc. | | | 435,809 | | | | 43,288,908 | |
| Teledyne Technologies, Inc. * | | | 101,973 | | | | 46,430,346 | |
| | | | | | | | 425,011,008 | |
| Total Common Stocks | | | | | | | | |
| (Cost $1,313,830,562) | | | | | | | 1,774,504,848 | |
| SHORT-TERM INVESTMENTS - 7.9% | | | | | | | | |
| State Street Institutional U.S. Government Money Market Fund, Premier Class (A), 4.82% | | | 109,277,821 | | | | 109,277,821 | |
| State Street Navigator Securities Lending Government Money Market Portfolio (A) (C), 4.86% | | | 40,191,635 | | | | 40,191,635 | |
| Total Short-Term Investments | | | | | | | | |
| (Cost $149,469,456) | | | | | | | 149,469,456 | |
| | | | | | | | | |
| TOTAL INVESTMENTS - 102.0% | | | | | | | | |
| (Cost $1,463,300,018**) | | | | | | | 1,923,974,304 | |
| NET OTHER ASSETS AND LIABILITIES - (2.0%) | | | | | | | (38,476,894 | ) |
| TOTAL NET ASSETS - 100.0% | | | | | | $ | 1,885,497,410 | |
| ** | Aggregate cost for Federal tax purposes was $1,463,988,367. |
| * | Non-income producing. |
| (B) | All or a portion of these securities, with an aggregate fair value of $38,759,351, are on loan as part of a securities lending program. See footnote (C) and Note 11 for details on the securities lending program. |
| (A) | 7-day yield. |
| (C) | Represents investments of cash collateral received in connection with securities lending. |
See accompanying Notes to Financial Statements.
Madison Funds | October 31, 2024
Small Cap Fund Portfolio of Investments
| | | Shares | | | Value (Note 2, 3) | |
| COMMON STOCKS - 93.7% | | | | | | | | |
| Communication Service - 3.4% | | | | | | | | |
| Cogent Communications Holdings, Inc. | | | 80,357 | | | $ | 6,450,256 | |
| Consumer Discretionary - 9.9% | | | | | | | | |
| Ollie's Bargain Outlet Holdings, Inc. * | | | 27,727 | | | | 2,546,170 | |
| OneSpaWorld Holdings Ltd. | | | 421,740 | | | | 7,384,667 | |
| Revolve Group, Inc. * | | | 117,152 | | | | 2,907,713 | |
| Shake Shack, Inc., Class A * | | | 38,619 | | | | 4,698,774 | |
| VF Corp. | | | 48,514 | | | | 1,004,725 | |
| | | | | | | | 18,542,049 | |
| Consumer Staples - 8.4% | | | | | | | | |
| Edgewell Personal Care Co. | | | 100,196 | | | | 3,501,850 | |
| Hain Celestial Group, Inc. * | | | 361,583 | | | | 3,156,620 | |
| Primo Water Corp. | | | 147,030 | | | | 3,856,597 | |
| Simply Good Foods Co. * | | | 159,020 | | | | 5,352,613 | |
| | | | | | | | 15,867,680 | |
| Energy - 1.6% | | | | | | | | |
| Chord Energy Corp. | | | 23,269 | | | | 2,910,952 | |
| Financials - 9.2% | | | | | | | | |
| Axis Capital Holdings Ltd. | | | 53,982 | | | | 4,224,631 | |
| Baldwin Insurance Group, Inc. * | | | 63,707 | | | | 2,947,086 | |
| Moelis & Co., Class A | | | 45,215 | | | | 3,002,276 | |
| Texas Capital Bancshares, Inc. * | | | 48,282 | | | | 3,715,300 | |
| Western Alliance Bancorp | | | 40,890 | | | | 3,402,457 | |
| | | | | | | | 17,291,750 | |
| Health Care - 9.9% | | | | | | | | |
| Encompass Health Corp. | | | 84,290 | | | | 8,383,484 | |
| Globus Medical, Inc., Class A * | | | 39,671 | | | | 2,917,405 | |
| HealthEquity, Inc. * | | | 57,101 | | | | 4,867,860 | |
| Option Care Health, Inc. * | | | 108,042 | | | | 2,489,288 | |
| | | | | | | | 18,658,037 | |
| Industrials - 19.8% | | | | | | | | |
| Carlisle Cos., Inc. | | | 13,336 | | | | 5,630,859 | |
| Core & Main, Inc., Class A * | | | 137,311 | | | | 6,080,131 | |
| Crane Co. | | | 34,627 | | | | 5,446,135 | |
| Hayward Holdings, Inc. * | | | 253,577 | | | | 4,123,162 | |
| Hillman Solutions Corp. * | | | 88,342 | | | | 936,425 | |
| Legalzoom.com, Inc. * | | | 165,705 | | | | 1,189,762 | |
| Leonardo DRS, Inc. * | | | 130,693 | | | | 3,929,939 | |
| Mueller Water Products, Inc., Class A | | | 87,599 | | | | 1,891,262 | |
| Saia, Inc. * | | | 6,680 | | | | 3,263,915 | |
| WillScot Holdings Corp. * | | | 145,006 | | | | 4,805,499 | |
| | | | | | | | 37,297,089 | |
| Information Technology - 21.6% | | | | | | | | |
| Box, Inc., Class A * | | | 185,404 | | | | 5,888,431 | |
| Ciena Corp. * | | | 85,037 | | | | 5,400,700 | |
| CommVault Systems, Inc. * | | | 23,119 | | | | 3,610,957 | |
| Confluent, Inc., Class A * | | | 157,586 | | | | 4,124,026 | |
| Crane NXT Co. | | | 50,000 | | | | 2,713,500 | |
| CTS Corp. | | | 71,055 | | | | 3,516,512 | |
| Entegris, Inc. | | | 40,040 | | | | 4,192,588 | |
| FormFactor, Inc. * | | | 71,640 | | | | 2,720,887 | |
| JFrog Ltd. * | | | 60,981 | | | | 1,779,425 | |
| Power Integrations, Inc. | | | 62,511 | | | | 3,777,540 | |
| Workiva, Inc. * | | | 35,945 | | | | 2,866,973 | |
| | | | | | | | 40,591,539 | |
| Materials - 9.9% | | | | | | | | |
| Huntsman Corp. | | | 64,478 | | | | 1,418,516 | |
| Olin Corp. | | | 78,250 | | | | 3,210,597 | |
| Scotts Miracle-Gro Co. | | | 63,890 | | | | 5,557,152 | |
| Summit Materials, Inc., Class A * | | | 176,792 | | | | 8,381,710 | |
| | | | | | | | 18,567,975 | |
| | | | | | | | | |
| Total Common Stocks | | | | | | | | |
| (Cost $121,556,224) | | | | | | | 176,177,327 | |
| SHORT-TERM INVESTMENTS - 6.4% | | | | | | | | |
| State Street Institutional U.S. | | | | | | | | |
| Government Money Market Fund, | | | | | | | | |
| Premier Class (A), 4.82% | | | 11,927,219 | | | | 11,927,219 | |
| | | | | | | | | |
| Total Short-Term Investments | | | | | | | | |
| (Cost $11,927,219) | | | | | | | 11,927,219 | |
| TOTAL INVESTMENTS - 100.1% | | | | | | | | |
| (Cost $133,483,443**) | | | | | | | 188,104,546 | |
| NET OTHER ASSETS AND LIABILITIES - (0.1%) | | | | | | | (100,156 | ) |
| TOTAL NET ASSETS - 100.0% | | | | | | $ | 188,004,390 | |
| * | Non-income producing. |
| ** | Aggregate cost for Federal tax purposes was $135,569,516. |
| (A) | 7-day yield. |
See accompanying Notes to Financial Statements.
Madison Funds | October 31, 2024
International Stock Fund Portfolio of Investments
| | | Shares | | | Value (Note 2, 3) | |
| COMMON STOCKS - 97.8% | | | | | | | | |
| Australia - 1.8% | | | | | | | | |
| Treasury Wine Estates Ltd. (A) | | | 29,209 | | | $ | 216,202 | |
| | | | | | | | | |
| Brazil - 1.4% | | | | | | | | |
| Itau Unibanco Holding SA, ADR | | | 27,642 | | | | 167,234 | |
| | | | | | | | | |
| Canada - 5.2% | | | | | | | | |
| Cameco Corp. | | | 5,494 | | | | 286,897 | |
| Canadian Pacific Kansas City Ltd. | | | 2,319 | | | | 178,934 | |
| Manulife Financial Corp. | | | 5,519 | | | | 161,210 | |
| | | | | | | | 627,041 | |
| China - 8.3% | | | | | | | | |
| Alibaba Group Holding Ltd., ADR | | | 3,562 | | | | 349,005 | |
| Ping An Insurance Group Co. of China Ltd., Class H (A) | | | 42,878 | | | | 266,182 | |
| Tencent Holdings Ltd. (A) | | | 7,440 | | | | 387,087 | |
| | | | | | | | 1,002,274 | |
| Denmark - 1.1% | | | | | | | | |
| Genmab AS * (A) | | | 599 | | | | 133,682 | |
| | | | | | | | | |
| France - 8.4% | | | | | | | | |
| Air Liquide SA (A) | | | 806 | | | | 144,431 | |
| Airbus SE (A) | | | 2,104 | | | | 320,626 | |
| Hermes International SCA (A) | | | 65 | | | | 147,577 | |
| LVMH Moet Hennessy Louis Vuitton SE (A) | | | 212 | | | | 140,669 | |
| STMicroelectronics NV | | | 5,208 | | | | 141,345 | |
| Worldline SA * (A) (B) | | | 18,805 | | | | 130,700 | |
| | | | | | | | 1,025,348 | |
| Germany - 12.0% | | | | | | | | |
| adidas AG (A) | | | 1,094 | | | | 260,820 | |
| Deutsche Telekom AG (A) | | | 13,516 | | | | 409,278 | |
| KION Group AG (A) | | | 6,030 | | | | 233,752 | |
| SAP SE, ADR | | | 914 | | | | 213,547 | |
| Siemens AG (A) | | | 1,123 | | | | 217,993 | |
| Symrise AG (A) | | | 1,012 | | | | 121,851 | |
| | | | | | | | 1,457,241 | |
| Hong Kong - 2.4% | | | | | | | | |
| AIA Group Ltd. (A) | | | 36,544 | | | | 290,788 | |
| | | | | | | | | |
| India - 7.6% | | | | | | | | |
| HDFC Bank Ltd., ADR | | | 5,616 | | | | 353,976 | |
| Infosys Ltd., ADR (C) | | | 10,632 | | | | 222,315 | |
| Larsen & Toubro Ltd., GDR (A) | | | 8,010 | | | | 344,295 | |
| | | | | | | | 920,586 | |
| Ireland - 2.4% | | | | | | | | |
| Kerry Group PLC, Class A (A) | | | 2,977 | | | | 296,369 | |
| | | | | | | | | |
| Israel - 1.7% | | | | | | | | |
| CyberArk Software Ltd. * | | | 744 | | | | 205,731 | |
| | | | | | | | | |
| Italy - 1.1% | | | | | | | | |
| Ferrari NV | | | 277 | | | | 131,819 | |
| | | | | | | | | |
| Japan - 18.1% | | | | | | | | |
| CyberAgent, Inc. (A) | | | 28,684 | | | | 187,442 | |
| Daiichi Sankyo Co. Ltd. (A) | | | 6,800 | | | | 220,000 | |
| Keyence Corp. (A) | | | 317 | | | | 142,150 | |
| Lasertec Corp. (A) | | | 1,000 | | | | 149,286 | |
| Mitsubishi UFJ Financial Group, Inc. (A) | | | 15,500 | | | | 161,814 | |
| Murata Manufacturing Co. Ltd. (A) | | | 9,364 | | | | 162,942 | |
| NIDEC Corp. (A) | | | 6,600 | | | | 131,112 | |
| Pan Pacific International Holdings Corp. (A) | | | 11,300 | | | | 280,288 | |
| Shin-Etsu Chemical Co. Ltd. (A) | | | 3,800 | | | | 140,650 | |
| Shiseido Co. Ltd. (A) | | | 6,100 | | | | 128,365 | |
| Sony Group Corp. (A) | | | 12,730 | | | | 223,797 | |
| Toray Industries, Inc. (A) | | | 48,479 | | | | 263,443 | |
| | | | | | | | 2,191,289 | |
| Mexico - 5.1% | | | | | | | | |
| Fomento Economico Mexicano SAB de CV, ADR | | | 1,600 | | | | 155,024 | |
| Grupo Mexico SAB de CV, Series B | | | 48,049 | | | | 252,113 | |
| Wal-Mart de Mexico SAB de CV, ADR (C) | | | 7,574 | | | | 208,058 | |
| | | | | | | | 615,195 | |
| Netherlands - 3.0% | | | | | | | | |
| ASML Holding NV | | | 322 | | | | 216,561 | |
| NXP Semiconductors NV | | | 612 | | | | 143,514 | |
| | | | | | | | 360,075 | |
| Norway - 1.3% | | | | | | | | |
| Norsk Hydro ASA (A) | | | 26,654 | | | | 164,171 | |
| | | | | | | | | |
| Switzerland - 6.4% | | | | | | | | |
| Lonza Group AG (A) | | | 437 | | | | 270,310 | |
| Nestle SA (A) | | | 1,225 | | | | 115,836 | |
| Partners Group Holding AG (A) | | | 166 | | | | 230,218 | |
| Sika AG (A) | | | 586 | | | | 163,473 | |
| | | | | | | | 779,837 | |
| Taiwan - 2.2% | | | | | | | | |
| Taiwan Semiconductor Manufacturing Co. Ltd., ADR | | | 1,419 | | | | 270,376 | |
| | | | | | | | | |
| United Kingdom - 8.3% | | | | | | | | |
| AstraZeneca PLC (A) | | | 2,232 | | | | 317,328 | |
| Diageo PLC (A) | | | 4,253 | | | | 132,607 | |
| Prudential PLC (A) | | | 21,164 | | | | 174,380 | |
| Shell PLC (A) | | | 7,029 | | | | 233,821 | |
| Wise PLC, Class A * (A) | | | 15,687 | | | | 143,869 | |
| | | | | | | | 1,002,005 | |
| | | | | | | | | |
| Total Common Stocks ( Cost $11,787,008 ) | | | | | | | 11,857,263 | |
| Short-Term Investments - 5.4% | | | | | | | | |
| | | | | | | | | |
| United States - 5.4% | | | | | | | | |
| State Street Institutional U.S. Government Money Market Fund, Premier Class, 4.82% (D) | | | 213,453 | | | | 213,453 | |
| State Street Navigator Securities Lending Government Money Market Portfolio, 4.86% (D) (E) | | | 434,429 | | | | 434,429 | |
| | | | | | | | 647,882 | |
| | | | | | | | | |
| Total Short-Term Investments ( Cost $647,882 ) | | | | | | | 647,882 | |
| | | | | | | | | |
| TOTAL INVESTMENTS - 103.2% ( Cost $12,434,890** ) | | | | | | | 12,505,145 | |
| NET OTHER ASSETS AND LIABILITIES - (3.2%) | | | | | | | (384,005 | ) |
| | | | | | | | | |
| TOTAL NET ASSETS - 100.0% | | | | | | $ | 12,121,140 | |
| * | Non-income producing. |
| ** | Aggregate cost for Federal tax purposes was $12,534,174. |
| (A) | Due to events that occurred between the close of the exchange on which this security is traded and that of the New York Stock Exchange, fair value was determined for this security using methods determined in good faith by or at the discretion of the Board of Trustees (see Note 3). |
| (B) | Security sold within terms of a private placement memorandum exempt from registration under section 144A of the Securities Act of 1933, as amended, and may be sold only to dealers in that program or other “qualified institutional investors.” The securities have been determined to be liquid under guidelines established by the Board of Trustees. |
| (C) | All or a portion of these securities, with an aggregate fair value of $421,744, are on loan as part of a securities lending program. See footnote (E) and Note 11 for details on the securities lending program. |
| (D) | 7-day yield. |
| (E) | Represents investments of cash collateral received in connection with securities lending. |
| | |
| ADR | American Depositary Receipt. |
| GDR | Global Depositary Receipt. |
| PLC | Public Limited Company. |
See accompanying Notes to Financial Statements.
Madison Funds | October 31, 2024
Statements of Assets and Liabilities as of October 31, 2024
| | | Conservative | | | Moderate | | | Aggressive | | | Diversified | | | Tax-Free | | | Tax-Free | | | High Quality | | | Core | |
| | | Allocation | | | Allocation | | | Allocation | | | Income | | | Virginia | | | National | | | Bond | | | Bond | |
| | | Fund | | | Fund | | | Fund | | | Fund | | | Fund | | | Fund | | | Fund | | | Fund | |
| Assets: | | | | | | | | | | | | | | | | | | | | | | | | | | | | | | | | |
| Investments in unaffiliated securities, at fair value†§ | | $ | 25,975,288 | | | $ | 62,713,415 | | | $ | 42,644,614 | | | $ | 30,985,404 | | | $ | 16,504,027 | | | $ | 17,224,298 | | | $ | 64,394,402 | | | $ | 196,061,401 | |
| Investments in affiliated securities, at fair value1‡ | | | 19,769,685 | | | | 34,941,366 | | | | 15,806,344 | | | | 108,281,935 | | | | — | | | | — | | | | — | | | | — | |
| Cash | | | — | | | | — | | | | — | | | | — | | | | — | | | | 43,473 | | | | — | | | | 8 | |
| Receivables: | | | | | | | | | | | | | | | | | | | | | | | | | | | | | | | | |
| Investments sold | | | — | | | | — | | | | — | | | | — | | | | 102,128 | | | | — | | | | — | | | | — | |
| Fund shares sold | | | 1,749 | | | | 1,968 | | | | 3,734 | | | | 2,866 | | | | — | | | | — | | | | 681 | | | | 187,132 | |
| Dividends and Interest | | | 53,132 | | | | 74,088 | | | | 22,529 | | | | 45 | | | | 211,001 | | | | 227,298 | | | | 526,294 | | | | 1,464,426 | |
| Total assets | | | 45,799,854 | | | | 97,730,837 | | | | 58,477,221 | | | | 139,270,250 | | | | 16,817,156 | | | | 17,495,069 | | | | 64,921,377 | | | | 197,712,967 | |
| Liabilities: | | | | | | | | | | | | | | | | | | | | | | | | | | | | | | | | |
| Payables: | | | | | | | | | | | | | | | | | | | | | | | | | | | | | | | | |
| Investments purchased | | | — | | | | — | | | | — | | | | — | | | | — | | | | — | | | | 1,002,846 | | | | — | |
| Fund shares repurchased | | | 18,466 | | | | 19,868 | | | | 909 | | | | 31,290 | | | | 65,161 | | | | 1,708 | | | | 58,667 | | | | 92,435 | |
| Upon return of securities loaned | | | 2,651,855 | | | | 5,311,220 | | | | 4,230,319 | | | | 1,518,125 | | | | — | | | | — | | | | 2,317,770 | | | | 1,115,975 | |
| Advisory agreement fees | | | 7,453 | | | | 16,005 | | | | 9,375 | | | | 23,638 | | | | 7,214 | | | | 5,981 | | | | 15,569 | | | | 64,898 | |
| Administrative services agreement fees | | | 9,316 | | | | 20,008 | | | | 11,720 | | | | 23,638 | | | | 5,049 | | | | 5,233 | | | | 8,751 | | | | 12,693 | |
| Distribution fees - Class C | | | 8,123 | | | | 3,648 | | | | 1,359 | | | | 13,640 | | | | — | | | | — | | | | — | | | | — | |
| Shareholder service fees | | | 8,935 | | | | 18,697 | | | | 10,867 | | | | 32,267 | | | | — | | | | — | | | | — | | | | 6,135 | |
| Due to Custodian | | | — | | | | — | | | | — | | | | — | | | | 15,957 | | | | — | | | | — | | | | — | |
| Dividends | | | — | | | | — | | | | — | | | | 2,299 | | | | 1,033 | | | | 3,463 | | | | — | | | | 327,978 | |
| Total liabilities | | | 2,704,148 | | | | 5,389,446 | | | | 4,264,549 | | | | 1,644,897 | | | | 94,414 | | | | 16,385 | | | | 3,403,603 | | | | 1,620,114 | |
| Net assets applicable to outstanding capital stock | | $ | 43,095,706 | | | $ | 92,341,391 | | | $ | 54,212,672 | | | $ | 137,625,353 | | | $ | 16,722,742 | | | $ | 17,478,684 | | | $ | 61,517,774 | | | $ | 196,092,853 | |
| Net assets consist of: | | | | | | | | | | | | | | | | | | | | | | | | | | | | | | | | |
| Paid-in capital | | $ | 45,496,819 | | | $ | 83,542,750 | | | $ | 45,792,411 | | | $ | 133,179,613 | | | $ | 17,432,195 | | | $ | 17,883,367 | | | $ | 68,036,479 | | | $ | 220,166,244 | |
| Accumulated distributable earnings (loss) | | | (2,401,113 | ) | | | 8,798,641 | | | | 8,420,261 | | | | 4,445,740 | | | | (709,453 | ) | | | (404,683 | ) | | | (6,518,705 | ) | | | (24,073,391 | ) |
| Net Assets | | $ | 43,095,706 | | | $ | 92,341,391 | | | $ | 54,212,672 | | | $ | 137,625,353 | | | $ | 16,722,742 | | | $ | 17,478,684 | | | $ | 61,517,774 | | | $ | 196,092,853 | |
| | | | | | | | | | | | | | | | | | | | | | | | | | | | | | | | | |
| Class A Shares: | | | | | | | | | | | | | | | | | | | | | | | | | | | | | | | | |
| Net Assets | | $ | 30,554,605 | | | $ | 86,640,312 | | | $ | 52,115,692 | | | $ | 116,186,822 | | | | | | | | | | | | | | | $ | 29,007,213 | |
| Shares of beneficial interest outstanding | | | 3,130,205 | | | | 7,768,494 | | | | 4,392,769 | | | | 8,964,271 | | | | | | | | | | | | | | | | 3,216,781 | |
| Net Asset Value and redemption price per share | | $ | 9.76 | | | $ | 11.15 | | | $ | 11.86 | | | $ | 12.96 | | | | | | | | | | | | | | | $ | 9.02 | |
| Sales charge of offering price2 | | | 0.60 | | | | 0.68 | | | | 0.72 | | | | 0.79 | | | | | | | | | | | | | | | | 0.43 | |
| Maximum offering price per share | | $ | 10.36 | | | $ | 11.83 | | | $ | 12.58 | | | $ | 13.75 | | | | | | | | | | | | | | | $ | 9.45 | |
| Class C Shares: | | | | | | | | | | | | | | | | | | | | | | | | | | | | | | | | |
| Net Assets | | $ | 12,541,101 | | | $ | 5,701,079 | | | $ | 2,096,980 | | | $ | 21,438,531 | | | | | | | | | | | | | | | | | |
| Shares of beneficial interest outstanding | | | 1,262,370 | | | | 517,220 | | | | 184,152 | | | | 1,633,242 | | | | | | | | | | | | | | | | | |
| Net Asset Value and redemption price per share3 | | $ | 9.93 | | | $ | 11.02 | | | $ | 11.39 | | | $ | 13.13 | | | | | | | | | | | | | | | | | |
| Class Y Shares: | | | | | | | | | | | | | | | | | | | | | | | | | | | | | | | | |
| Net Assets | | | | | | | | | | | | | | | | | | $ | 16,722,742 | | | $ | 17,478,684 | | | $ | 47,051,290 | | | $ | 5,320,214 | |
| Shares of beneficial interest outstanding | | | | | | | | | | | | | | | | | | | 1,560,337 | | | | 1,748,804 | | | | 4,520,513 | | | | 593,585 | |
| Net Asset Value and redemption price per share3 | | | | | | | | | | | | | | | | | | $ | 10.72 | | | $ | 9.99 | | | $ | 10.41 | | | $ | 8.96 | |
| Class I Shares: | | | | | | | | | | | | | | | | | | | | | | | | | | | | | | | | |
| Net Assets | | | | | | | | | | | | | | | | | | | | | | | | | | $ | 14,466,484 | | | $ | 59,133,902 | |
| Shares of beneficial interest outstanding | | | | | | | | | | | | | | | | | | | | | | | | | | | 1,380,358 | | | | 6,627,972 | |
| Net Asset Value and redemption price per share3 | | | | | | | | | | | | | | | | | | | | | | | | | | $ | 10.48 | | | $ | 8.92 | |
| Class R6 Shares: | | | | | | | | | | | | | | | | | | | | | | | | | | | | | | | | |
| Net Assets | | | | | | | | | | | | | | | | | | | | | | | | | | | | | | $ | 102,631,524 | |
| Shares of beneficial interest outstanding | | | | | | | | | | | | | | | | | | | | | | | | | | | | | | | 11,509,205 | |
| Net Asset Value and redemption price per share3 | | | | | | | | | | | | | | | | | | | | | | | | | | | | | | $ | 8.92 | |
| | | | | | | | | | | | | | | | | | | | | | | | | | | | | | | | | |
| † Cost of Investments in unaffiliated securities | | $ | 24,847,800 | | | $ | 57,717,028 | | | $ | 38,415,576 | | | $ | 29,666,140 | | | $ | 17,091,830 | | | $ | 17,585,107 | | | $ | 65,892,002 | | | $ | 207,362,721 | |
| ‡ Cost of investments in affiliated securities1 | | $ | 21,035,611 | | | $ | 33,524,677 | | | $ | 13,409,574 | | | $ | 106,306,681 | | | $ | — | | | $ | — | | | $ | — | | | $ | — | |
| § Fair Value of securities on loan | | $ | 2,582,109 | | | $ | 5,171,249 | | | $ | 4,115,778 | | | $ | 1,482,579 | | | $ | — | | | $ | — | | | $ | 2,268,742 | | | $ | 1,090,904 | |
| 1 | See Note 14 for information on affiliated issuers. |
| 2 | Sales charge of offering price is 5.75% for the Conservative Allocation, Moderate Allocation, Aggressive Allocation and Diversified Income Funds and 4.50% for the Core Bond Fund. |
| 3 | If applicable, redemption price per share may be reduced by a contingent deferred sales charge. |
See accompanying Notes to Financial Statements.
Madison Funds | October 31, 2024
Statements of Assets and Liabilities as of October 31, 2024 - concluded
| | | Covered Call & | | | Dividend | | | | | | Sustainable | | | | | | | | | | |
| | | Equity Income | | | Income | | | Investors | | | Equity | | | Mid-Cap | | | Small Cap | | | International Stock | |
| | | Fund | | | Fund | | | Fund | | | Fund | | | Fund | | | Fund | | | Fund | |
| Assets: | | | | | | | | | | | | | | | | | | | | | | | | | | | | |
| Investments in unaffiliated securities, at fair value†§ | | $ | 255,259,653 | | | $ | 149,069,994 | | | $ | 417,296,462 | | | $ | 9,886,617 | | | $ | 1,923,974,304 | | | $ | 188,104,546 | | | $ | 12,505,145 | |
| Investments in affiliated securities, at fair value1‡ | | | — | | | | — | | | | — | | | | — | | | | — | | | | — | | | | — | |
| Foreign currency (cost of $6,935) (Note 2) | | | — | | | | — | | | | — | | | | — | | | | — | | | | — | | | | 6,605 | |
| Receivables: | | | | | | | | | | | | | | | | | | | | | | | | | | | | |
| Fund shares sold | | | 327,933 | | | | 342,257 | | | | 610,690 | | | | — | | | | 4,058,917 | | | | 77,840 | | | | 971 | |
| Dividends and Interest | | | 184,300 | | | | 303,786 | | | | 652,831 | | | | 3,568 | | | | 57,091 | | | | 4,004 | | | | 62,446 | |
| Total assets | | | 255,771,886 | | | | 149,716,037 | | | | 418,559,983 | | | | 9,890,185 | | | | 1,928,090,312 | | | | 188,186,390 | | | | 12,575,167 | |
| Liabilities: | | | | | | | | | | | | | | | | | | | | | | | | | | | | |
| Payables: | | | | | | | | | | | | | | | | | | | | | | | | | | | | |
| Fund shares repurchased | | | 42,500 | | | | 661,197 | | | | 115,854 | | | | — | | | | 1,061,102 | | | | 8,361 | | | | 2,460 | |
| Upon return of securities loaned | | | — | | | | — | | | | — | | | | — | | | | 40,191,635 | | | | — | | | | 434,429 | |
| Advisory agreement fees | | | 185,576 | | | | 90,623 | | | | 253,594 | | | | 6,061 | | | | 1,117,228 | | | | 142,171 | | | | 11,181 | |
| Administrative services agreement fees | | | 25,076 | | | | 23,306 | | | | 52,552 | | | | 879 | | | | 204,203 | | | | 30,625 | | | | 3,194 | |
| Distribution fees - Class C | | | 10,730 | | | | — | | | | — | | | | — | | | | — | | | | — | | | | — | |
| Shareholder service fees | | | 8,279 | | | | 10,877 | | | | 23,995 | | | | — | | | | 18,734 | | | | 843 | | | | 2,447 | |
| Due to Custodian | | | — | | | | — | | | | — | | | | — | | | | — | | | | — | | | | 316 | |
| Options written, at value (premium received $4,156,187) | | | 3,534,139 | | | | — | | | | — | | | | — | | | | — | | | | — | | | | — | |
| Total liabilities | | | 3,806,300 | | | | 786,003 | | | | 445,995 | | | | 6,940 | | | | 42,592,902 | | | | 182,000 | | | | 454,027 | |
| Net assets applicable to outstanding capital stock | | $ | 251,965,586 | | | $ | 148,930,034 | | | $ | 418,113,988 | | | $ | 9,883,245 | | | $ | 1,885,497,410 | | | $ | 188,004,390 | | | $ | 12,121,140 | |
| Net assets consist of: | | | | | | | | | | | | | | | | | | | | | | | | | | | | |
| Paid-in capital | | $ | 264,453,547 | | | $ | 96,891,830 | | | $ | 205,554,469 | | | $ | 8,131,479 | | | $ | 1,328,478,423 | | | $ | 118,729,649 | | | $ | 12,988,729 | |
| Accumulated distributable earnings (loss) | | | (12,487,961 | ) | | | 52,038,204 | | | | 212,559,519 | | | | 1,751,766 | | | | 557,018,987 | | | | 69,274,741 | | | | (867,589 | ) |
| Net Assets | | $ | 251,965,586 | | | $ | 148,930,034 | | | $ | 418,113,988 | | | $ | 9,883,245 | | | $ | 1,885,497,410 | | | $ | 188,004,390 | | | $ | 12,121,140 | |
| | | | | | | | | | | | | | | | | | | | | | | | | | | | | |
| Class A Shares: | | | | | | | | | | | | | | | | | | | | | | | | | | | | |
| Net Assets | | $ | 21,991,308 | | | $ | 52,719,897 | | | $ | 112,453,797 | | | | | | | $ | 88,044,427 | | | $ | 4,014,350 | | | $ | 11,513,551 | |
| Shares of beneficial interest outstanding | | | 2,336,968 | | | | 1,811,097 | | | | 3,719,869 | | | | | | | | 5,611,347 | | | | 341,535 | | | | 1,228,673 | |
| Net Asset Value and redemption price per share | | $ | 9.41 | | | $ | 29.11 | | | $ | 30.23 | | | | | | | $ | 15.69 | | | $ | 11.75 | | | $ | 9.37 | |
| Sales charge of offering price2 | | | 0.57 | | | | 1.78 | | | | 1.84 | | | | | | | | 0.96 | | | | 0.72 | | | | 0.57 | |
| Maximum offering price per share | | $ | 9.98 | | | $ | 30.89 | | | $ | 32.07 | | | | | | | $ | 16.65 | | | $ | 12.47 | | | $ | 9.94 | |
| Class C Shares: | | | | | | | | | | | | | | | | | | | | | | | | | | | | |
| Net Assets | | $ | 16,634,745 | | | | | | | | | | | | | | | | | | | | | | | | | |
| Shares of beneficial interest outstanding | | | 2,024,683 | | | | | | | | | | | | | | | | | | | | | | | | | |
| Net Asset Value and redemption price per share3 | | $ | 8.22 | | | | | | | | | | | | | | | | | | | | | | | | | |
| Class Y Shares: | | | | | | | | | | | | | | | | | | | | | | | | | | | | |
| Net Assets | | $ | 37,801,305 | | | $ | 69,409,276 | | | $ | 131,141,993 | | | $ | 152,769 | | | $ | 479,997,706 | | | $ | 168,664,044 | | | $ | 607,589 | |
| Shares of beneficial interest outstanding | | | 3,814,088 | | | | 2,383,195 | | | | 4,322,910 | | | | 13,656 | | | | 28,117,602 | | | | 14,068,694 | | | | 65,349 | |
| Net Asset Value and redemption price per share3 | | $ | 9.91 | | | $ | 29.12 | | | $ | 30.34 | | | $ | 11.19 | | | $ | 17.07 | | | $ | 11.99 | | | $ | 9.30 | |
| Class I Shares: | | | | | | | | | | | | | | | | | | | | | | | | | | | | |
| Net Assets | | $ | 174,678,283 | | | $ | 24,274,112 | | | $ | 107,830,920 | | | $ | 9,730,476 | | | $ | 987,984,306 | | | $ | 14,828,103 | | | | | |
| Shares of beneficial interest outstanding | | | 17,612,869 | | | | 833,991 | | | | 3,571,976 | | | | 870,057 | | | | 57,734,204 | | | | 1,233,197 | | | | | |
| Net Asset Value and redemption price per share3 | | $ | 9.92 | | | $ | 29.11 | | | $ | 30.19 | | | $ | 11.18 | | | $ | 17.11 | | | $ | 12.02 | | | | | |
| Class R6 Shares: | | | | | | | | | | | | | | | | | | | | | | | | | | | | |
| Net Assets | | $ | 859,945 | | | $ | 2,526,749 | | | $ | 66,687,278 | | | | | | | $ | 329,470,971 | | | $ | 497,893 | | | | | |
| Shares of beneficial interest outstanding | | | 84,838 | | | | 86,801 | | | | 2,183,083 | | | | | | | | 18,723,051 | | | | 41,303 | | | | | |
| Net Asset Value and redemption price per share3 | | $ | 10.14 | | | $ | 29.11 | | | $ | 30.55 | | | | | | | $ | 17.60 | | | $ | 12.05 | | | | | |
| | | | | | | | | | | | | | | | | | | | | | | | | | | | | |
| † Cost of Investments in unaffiliated securities | | $ | 274,586,354 | | | $ | 110,360,228 | | | $ | 226,222,693 | | | $ | 7,357,343 | | | $ | 1,463,300,018 | | | $ | 133,483,443 | | | $ | 12,434,890 | |
| ‡ Cost of investments in affiliated securities | | $ | — | | | $ | — | | | $ | — | | | $ | — | | | $ | — | | | $ | — | | | $ | — | |
| § Fair Value of securities on loan | | $ | — | | | $ | — | | | $ | — | | | $ | — | | | $ | 38,759,351 | | | $ | — | | | $ | 421,744 | |
| 1 | See Note 14 for information on affiliated issuers. |
| 2 | Sales charge of offering price is 5.75% for the Covered Call & Equity Income, Dividend Income, Investors, Mid Cap, Small Cap and International Stock funds. |
| 3 | If applicable, redemption price per share may be reduced by a contingent deferred sales charge. |
See accompanying Notes to Financial Statements.
Madison Funds | October 31, 2024
Statements of Operations for the Year Ended October 31, 2024
| | | | | | | | | | | | Diversified | | | Tax-Free | | | Tax-Free | | | High Quality | | | Core | |
| | | Conservative | | | Moderate | | | Aggressive | | | Income | | | Virginia | | | National | | | Bond | | | Bond | |
| | | Allocation Fund | | | Allocation Fund | | | Allocation Fund | | | Fund | | | Fund | | | Fund | | | Fund | | | Fund | |
| Investment Income: | | | | | | | | | | | | | | | | | | | | | | | | | | | | | | | | |
| Interest | | $ | 82,508 | | | $ | 194,327 | | | $ | 114,643 | | | $ | 144,085 | | | $ | 486,671 | | | $ | 517,241 | | | $ | 2,003,158 | | | $ | 7,919,644 | |
| Dividends | | | | | | | | | | | | | | | | | | | | | | | | | | | | | | | | |
| Unaffiliated issuers | | | 870,728 | | | | 1,836,312 | | | | 1,083,205 | | | | 1,217,301 | | | | — | | | | — | | | | — | | | | — | |
| Affiliated issuers1 | | | 570,635 | | | | 827,808 | | | | 265,822 | | | | 7,785,875 | | | | — | | | | — | | | | — | | | | — | |
| Less: Foreign taxes withheld/reclaimed | | | — | | | | — | | | | — | | | | — | | | | — | | | | — | | | | — | | | | — | |
| Income from securities lending | | | 4,917 | | | | 13,226 | | | | 8,933 | | | | 64,997 | | | | — | | | | — | | | | 8,740 | | | | 3,445 | |
| Total investment income | | | 1,528,788 | | | | 2,871,673 | | | | 1,472,603 | | | | 9,212,258 | | | | 486,671 | | | | 517,241 | | | | 2,011,898 | | | | 7,923,089 | |
| Expenses:2 | | | | | | | | | | | | | | | | | | | | | | | | | | | | | | | | |
| Advisory agreement fees | | | 89,059 | | | | 191,611 | | | | 110,318 | | | | 283,023 | | | | 85,322 | | | | 71,080 | | | | 180,522 | | | | 740,044 | |
| Administrative services agreement fees | | | 111,323 | | | | 239,514 | | | | 137,898 | | | | 283,023 | | | | 59,725 | | | | 62,195 | | | | 101,743 | | | | 148,652 | |
| Trustee fees | | | 3,724 | | | | 8,033 | | | | 4,584 | | | | 11,912 | | | | 1,422 | | | | 1,482 | | | | 4,986 | | | | 15,763 | |
| Distribution fees - Class C | | | 95,424 | | | | 43,620 | | | | 16,091 | | | | 159,300 | | | | — | | | | — | | | | — | | | | — | |
| Shareholder service fees - Class A | | | 77,962 | | | | 219,785 | | | | 129,153 | | | | 297,783 | | | | — | | | | — | | | | — | | | | 74,968 | |
| Shareholder service fees - Class C | | | 31,808 | | | | 14,540 | | | | 5,364 | | | | 53,100 | | | | — | | | | — | | | | — | | | | — | |
| Other expenses | | | 97 | | | | 211 | | | | 122 | | | | 310 | | | | 38 | | | | 39 | | | | 136 | | | | 426 | |
| Total expenses | | | 409,397 | | | | 717,314 | | | | 403,530 | | | | 1,088,451 | | | | 146,507 | | | | 134,796 | | | | 287,387 | | | | 979,853 | |
| Net Investment Income | | | 1,119,391 | | | | 2,154,359 | | | | 1,069,073 | | | | 8,123,807 | | | | 340,164 | | | | 382,445 | | | | 1,724,511 | | | | 6,943,236 | |
| Net Realized and Unrealized Gain (loss) on Investments | | | | | | | | | | | | | | | | | | | | | | | | | | | | | | | | |
| Net realized gain (loss) on investments (including net realized gain (loss) on foreign currency related transactions) | | | | | | | | | | | | | | | | | | | | | | | | | | | | | | | | |
| Unaffiliated issuers | | | 283,253 | | | | 1,798,287 | | | | 1,090,650 | | | | 1,501,815 | | | | (5,034 | ) | | | (22,466 | ) | | | (670,019 | ) | | | (3,597,252 | ) |
| Affiliated issuers1 | | | 112,026 | | | | 246,748 | | | | 243,976 | | | | (99,139 | ) | | | — | | | | — | | | | — | | | | — | |
| Capital gain distributions received from underlying funds | | | | | | | | | | | | | | | | | | | | | | | | | | | | | | | | |
| Affiliated issuers1 | | | 309,020 | | | | 963,660 | | | | 658,396 | | | | 367,775 | | | | — | | | | — | | | | — | | | | — | |
| Net change in unrealized appreciation (depreciation) on investments (including net unrealized appreciation (depreciation) on foreign currency related transactions) | | | | | | | | | | | | | | | | | | | | | | | | | | | | | | | | |
| Unaffiliated issuers | | | 2,412,863 | | | | 6,677,553 | | | | 5,101,070 | | | | 1,239,705 | | | | 834,117 | | | | 787,256 | | | | 2,902,681 | | | | 15,537,583 | |
| Affiliated Issuers1 | | | 1,546,252 | | | | 3,414,622 | | | | 1,785,399 | | | | 6,746,086 | | | | — | | | | — | | | | — | | | | — | |
| Net Realized and Unrealized Gain on Investments | | | 4,663,414 | | | | 13,100,870 | | | | 8,879,491 | | | | 9,756,242 | | | | 829,083 | | | | 764,790 | | | | 2,232,662 | | | | 11,940,331 | |
| Net Increase in Net Assets from Operations | | $ | 5,782,805 | | | $ | 15,255,229 | | | $ | 9,948,564 | | | $ | 17,880,049 | | | $ | 1,169,247 | | | $ | 1,147,235 | | | $ | 3,957,173 | | | $ | 18,883,567 | |
| 1 | See Note 14 for information on affiliated issuers. |
| 2 | See Note 5 for information on expense, including any waivers. |
See accompanying Notes to Financial Statements.
Madison Funds | October 31, 2024
Statements of Operations for the Year Ended October 31, 2024 - concluded
| | | Covered Call & | | | | | | | | | Sustainable | | | | | | | | | | |
| | | Equity Income | | | Dividend Income | | | Investors | | | Equity | | | Mid-Cap | | | Small Cap | | | International Stock | |
| | | Fund | | | Fund | | | Fund | | | Fund | | | Fund | | | Fund | | | Fund | |
| Investment Income: | | | | | | | | | | | | | | | | | | | | | | | | | | | | |
| Interest | | $ | 3,831,109 | | | $ | 99,877 | | | $ | 659,176 | | | $ | 11,275 | | | $ | 5,856,185 | | | $ | 518,646 | | | $ | 10,729 | |
| Dividends | | | | | | | | | | | | | | | | | | | | | | | | | | | | |
| Unaffiliated issuers | | | 3,987,913 | | | | 5,024,150 | | | | 4,349,723 | | | | 139,607 | | | | 11,438,284 | | | | 1,483,594 | | | | 248,919 | |
| Affiliated issuers1 | | | — | | | | — | | | | — | | | | — | | | | — | | | | — | | | | — | |
| Less: Foreign taxes withheld/reclaimed | | | (23,100 | ) | | | — | | | | (13,401 | ) | | | (519 | ) | | | (82,593 | ) | | | (16,991 | ) | | | (22,502 | ) |
| Income from securities lending | | | 572 | | | | 8,452 | | | | 3,701 | | | | 8 | | | | 21,214 | | | | 1,835 | | | | 1,762 | |
| Total investment income | | | 7,796,494 | | | | 5,132,479 | | | | 4,999,199 | | | | 150,371 | | | | 17,233,090 | | | | 1,987,084 | | | | 238,908 | |
| Expenses:2 | | | | | | | | | | | | | | | | | | | | | | | | | | | | |
| Advisory agreement fees | | | 2,158,124 | | | | 1,183,103 | | | | 2,825,823 | | | | 68,324 | | | | 9,855,137 | | | | 1,604,722 | | | | 133,791 | |
| Administrative services agreement fees | | | 295,455 | | | | 294,386 | | | | 579,052 | | | | 9,890 | | | | 1,886,949 | | | | 346,527 | | | | 38,226 | |
| Trustee fees | | | 21,093 | | | | 14,952 | | | | 32,801 | | | | 789 | | | | 99,949 | | | | 14,840 | | | | 1,071 | |
| Distribution fees - Class C | | | 121,721 | | | | — | | | | — | | | | — | | | | — | | | | — | | | | — | |
| Shareholder service fees - Class A | | | 55,267 | | | | 127,184 | | | | 269,129 | | | | — | | | | 204,159 | | | | 9,680 | | | | 29,946 | |
| Shareholder service fees - Class C | | | 40,574 | | | | — | | | | — | | | | — | | | | — | | | | — | | | | — | |
| Other expenses | | | 556 | | | | 357 | | | | 909 | | | | 22 | | | | 3,433 | | | | 398 | | | | 28 | |
| Total expenses | | | 2,692,790 | | | | 1,619,982 | | | | 3,707,714 | | | | 79,025 | | | | 12,049,627 | | | | 1,976,167 | | | | 203,062 | |
| Net Investment Income | | | 5,103,704 | | | | 3,512,497 | | | | 1,291,485 | | | | 71,346 | | | | 5,183,463 | | | | 10,917 | | | | 35,846 | |
| Net Realized and Unrealized Gain (loss) on Investments | | | | | | | | | | | | | | | | | | | | | | | | | | | | |
| Net realized gain (loss) on investments (including net realized gain (loss) on foreign currency related transactions) | | | | | | | | | | | | | | | | | | | | | | | | | | | | |
| Options purchased | | | (3,591,871 | ) | | | — | | | | — | | | | — | | | | — | | | | — | | | | — | |
| Options written | | | 6,218,882 | | | | — | | | | — | | | | — | | | | — | | | | — | | | | — | |
| Unaffiliated issuers | | | 10,810,480 | | | | 14,910,125 | | | | 21,811,552 | | | | 19,077 | | | | 92,580,444 | | | | 18,708,098 | | | | 207,829 | |
| Affiliated issuers1 | | | — | | | | — | | | | — | | | | — | | | | — | | | | — | | | | — | |
| Capital gain distributions received from underlying funds | | | | | | | | | | | | | | | | | | | | | | | | | | | | |
| Affiliated issuers | | | — | | | | — | | | | — | | | | — | | | | — | | | | — | | | | — | |
| Net change in unrealized appreciation (depreciation) on investments (including net unrealized appreciation (depreciation) on foreign currency related transactions) | | | | | | | | | | | | | | | | | | | | | | | | | | | | |
| Options written | | | (404,092 | ) | | | — | | | | — | | | | — | | | | — | | | | — | | | | — | |
| Unaffiliated issuers | | | 8,638,828 | | | | 15,739,058 | | | | 75,613,657 | | | | 2,445,136 | | | | 151,051,194 | | | | 37,899,373 | | | | 1,907,886 | |
| Affiliated Issuers1 | | | — | | | | — | | | | — | | | | — | | | | — | | | | — | | | | — | |
| Net Realized and Unrealized Gain on Investments | | | 21,672,227 | | | | 30,649,183 | | | | 97,425,209 | | | | 2,464,213 | | | | 243,631,638 | | | | 56,607,471 | | | | 2,115,715 | |
| Net Increase in Net Assets from Operations | | $ | 26,775,931 | | | $ | 34,161,680 | | | $ | 98,716,694 | | | $ | 2,535,559 | | | $ | 248,815,101 | | | $ | 56,618,388 | | | $ | 2,151,561 | |
| 1 | See Note 14 for information on affiliated issuers. |
| 2 | See Note 5 for information on expense, including any waivers. |
See accompanying Notes to Financial Statements.
Madison Funds | October 31, 2024
Statements of Changes in Net Assets
| | | Conservative Allocation Fund | | | Moderate Allocation Fund | | | Aggressive Allocation Fund | |
| Year Ended October 31, | | 2024 | | | 2023 | | | 2024 | | | 2023 | | | 2024 | | | 2023 | |
| Net Assets at beginning of period | | $ | 43,068,158 | | | $ | 50,698,246 | | | $ | 90,736,221 | | | $ | 102,432,212 | | | $ | 50,844,640 | | | $ | 53,196,313 | |
| Increase (decrease) in net assets from operations: | | | | | | | | | | | | | | | | | | | | | | | | |
| Net investment income (loss) | | | 1,119,391 | | | | 985,668 | | | | 2,154,359 | | | | 1,911,493 | | | | 1,069,073 | | | | 922,054 | |
| Net realized gain (loss) | | | 704,299 | | | | (960,426 | ) | | | 3,008,695 | | | | (177,877 | ) | | | 1,993,022 | | | | 295,395 | |
| Net change in unrealized appreciation (depreciation) | | | 3,959,115 | | | | 828,975 | | | | 10,092,175 | | | | 1,230,466 | | | | 6,886,469 | | | | 784,122 | |
| Net increase (decrease) in net assets from operations | | | 5,782,805 | | | | 854,217 | | | | 15,255,229 | | | | 2,964,082 | | | | 9,948,564 | | | | 2,001,571 | |
| Distributions to shareholders from: | | | | | | | | | | | | | | | | | | | | | | | | |
| Accumulated earnings (combined net investment income and net realized gains): | | | | | | | | | | | | | | | | | | | | | | | | |
| Class A | | | (839,705 | ) | | | (736,870 | ) | | | (1,934,212 | ) | | | (1,270,119 | ) | | | (986,302 | ) | | | (604,964 | ) |
| Class B1 | | | — | | | | (6,339 | ) | | | — | | | | (23,787 | ) | | | — | | | | (11,337 | ) |
| Class C | | | (234,687 | ) | | | (192,312 | ) | | | (81,838 | ) | | | (45,348 | ) | | | (24,923 | ) | | | (13,768 | ) |
| Total distributions | | | (1,074,392 | ) | | | (935,521 | ) | | | (2,016,050 | ) | | | (1,339,254 | ) | | | (1,011,225 | ) | | | (630,069 | ) |
| Capital Stock transactions: | | | | | | | | | | | | | | | | | | | | | | | | |
| Class A Shares | | | | | | | | | | | | | | | | | | | | | | | | |
| Shares sold | | | 1,124,442 | | | | 2,691,641 | | | | 3,578,914 | | | | 5,978,139 | | | | 2,362,924 | | | | 4,081,361 | |
| Issued to shareholders in reinvestment of distributions | | | 838,187 | | | | 735,740 | | | | 1,929,329 | | | | 1,266,452 | | | | 985,451 | | | | 604,612 | |
| Shares redeemed | | | (5,274,909 | ) | | | (7,898,219 | ) | | | (16,527,990 | ) | | | (16,061,858 | ) | | | (8,711,190 | ) | | | (5,979,015 | ) |
| Net increase (decrease) from capital stock transactions | | | (3,312,280 | ) | | | (4,470,838 | ) | | | (11,019,747 | ) | | | (8,817,267 | ) | | | (5,362,815 | ) | | | (1,293,042 | ) |
| Class B Shares1 | | | | | | | | | | | | | | | | | | | | | | | | |
| Shares sold | | | — | | | | — | | | | — | | | | 136 | | | | — | | | | — | |
| Issued to shareholders in reinvestment of distributions | | | — | | | | 6,339 | | | | — | | | | 23,787 | | | | — | | | | 11,337 | |
| Shares redeemed | | | — | | | | (1,363,629 | ) | | | — | | | | (3,694,652 | ) | | | — | | | | (2,050,380 | ) |
| Net increase (decrease) from capital stock transactions | | | — | | | | (1,357,290 | ) | | | — | | | | (3,670,729 | ) | | | — | | | | (2,039,043 | ) |
| Class C Shares | | | | | | | | | | | | | | | | | | | | | | | | |
| Shares sold | | | 24,965 | | | | 112,654 | | | | 238,501 | | | | 96,934 | | | | 52,699 | | | | 32,926 | |
| Issued to shareholders in reinvestment of distributions | | | 234,687 | | | | 192,312 | | | | 81,838 | | | | 45,348 | | | | 24,923 | | | | 13,768 | |
| Shares redeemed | | | (1,628,237 | ) | | | (2,025,622 | ) | | | (934,601 | ) | | | (975,105 | ) | | | (284,114 | ) | | | (437,784 | ) |
| Net increase (decrease) from capital stock transactions | | | (1,368,585 | ) | | | (1,720,656 | ) | | | (614,262 | ) | | | (832,823 | ) | | | (206,492 | ) | | | (391,090 | ) |
| Total increase (decrease) from capital stock transactions | | | (4,680,865 | ) | | | (7,548,784 | ) | | | (11,634,009 | ) | | | (13,320,819 | ) | | | (5,569,307 | ) | | | (3,723,175 | ) |
| Total increase (decrease) in net assets | | | 27,548 | | | | (7,630,088 | ) | | | 1,605,170 | | | | (11,695,991 | ) | | | 3,368,032 | | | | (2,351,673 | ) |
| Net Assets at end of period | | $ | 43,095,706 | | | $ | 43,068,158 | | | $ | 92,341,391 | | | $ | 90,736,221 | | | $ | 54,212,672 | | | $ | 50,844,640 | |
| Capital Share transactions: | | | | | | | | | | | | | | | | | | | | | | | | |
| Class A Shares | | | | | | | | | | | | | | | | | | | | | | | | |
| Shares sold | | | 117,061 | | | | 292,526 | | | | 333,691 | | | | 600,051 | | | | 208,301 | | | | 398,580 | |
| Issued to shareholders in reinvestment of distributions | | | 87,076 | | | | 80,928 | | | | 185,157 | | | | 131,239 | | | | 90,493 | | | | 61,134 | |
| Shares redeemed | | | (549,279 | ) | | | (862,523 | ) | | | (1,534,482 | ) | | | (1,612,376 | ) | | | (763,858 | ) | | | (584,751 | ) |
| Net increase (decrease) from capital shares transactions | | | (345,142 | ) | | | (489,069 | ) | | | (1,015,634 | ) | | | (881,086 | ) | | | (465,064 | ) | | | (125,037 | ) |
| Class B Shares1 | | | | | | | | | | | | | | | | | | | | | | | | |
| Shares sold | | | — | | | | — | | | | — | | | | 14 | | | | — | | | | — | |
| Issued to shareholders in reinvestment of distributions | | | — | | | | 693 | | | | — | | | | 2,480 | | | | — | | | | 1,189 | |
| Shares redeemed | | | — | | | | (145,166 | ) | | | — | | | | (373,956 | ) | | | — | | | | (207,173 | ) |
| Net increase (decrease) from capital shares transactions | | | — | | | | (144,473 | ) | | | — | | | | (371,462 | ) | | | — | | | | (205,984 | ) |
| Class C Shares | | | | | | | | | | | | | | | | | | | | | | | | |
| Shares sold | | | 2,569 | | | | 12,332 | | | | 22,394 | | | | 9,797 | | | | 5,011 | | | | 3,332 | |
| Issued to shareholders in reinvestment of distributions | | | 23,974 | | | | 20,796 | | | | 7,899 | | | | 4,724 | | | | 2,371 | | | | 1,442 | |
| Shares redeemed | | | (170,192 | ) | | | (217,351 | ) | | | (87,289 | ) | | | (98,599 | ) | | | (25,716 | ) | | | (44,006 | ) |
| Net increase (decrease) in shares outstanding | | | (143,649 | ) | | | (184,223 | ) | | | (56,996 | ) | | | (84,078 | ) | | | (18,334 | ) | | | (39,232 | ) |
| 1 | As of the close of business on February 6, 2023, outstanding Class B shares of the Madison Funds converted into Class A shares of each respective fund, and Class B shares of the Trust were terminated. |
See accompanying Notes to Financial Statements.
Madison Funds | October 31, 2024
Statements of Changes in Net Assets - continued
| | | Diversified Income Fund | | | Tax-Free Virginia Fund | | | Tax-Free National Fund | |
| Year Ended October 31, | | 2024 | | | 2023 | | | 2024 | | | 2023 | | | 2024 | | | 2023 | |
| Net Assets at beginning of period | | $ | 140,229,091 | | | $ | 161,841,486 | | | $ | 16,575,085 | | | $ | 17,745,739 | | | $ | 17,114,330 | | | $ | 17,620,800 | |
| Increase (decrease) in net assets from operations: | | | | | | | | | | | | | | | | | | | | | | | | |
| Net investment income (loss) | | | 8,123,807 | | | | 3,169,645 | | | | 340,164 | | | | 326,575 | | | | 382,445 | | | | 359,762 | |
| Net realized gain (loss) | | | 1,770,451 | | | | 16,701,621 | | | | (5,034 | ) | | | (3,104 | ) | | | (22,466 | ) | | | (23,159 | ) |
| Net change in unrealized appreciation (depreciation) | | | 7,985,791 | | | | (21,608,060 | ) | | | 834,117 | | | | (180,392 | ) | | | 787,256 | | | | (131,162 | ) |
| Net increase (decrease) in net assets from operations | | | 17,880,049 | | | | (1,736,794 | ) | | | 1,169,247 | | | | 143,079 | | | | 1,147,235 | | | | 205,441 | |
| Distributions to shareholders from: | | | | | | | | | | | | | | | | | | | | | | | | |
| Accumulated earnings (combined net investment income and net realized gains): | | | | | | | | | | | | | | | | | | | | | | | | |
| Class A | | | (21,591,879 | ) | | | (10,809,345 | ) | | | — | | | | — | | | | — | | | | — | |
| Class B1 | | | — | | | | (149,845 | ) | | | — | | | | — | | | | — | | | | — | |
| Class C | | | (3,525,283 | ) | | | (1,631,141 | ) | | | — | | | | — | | | | — | | | | — | |
| Class Y | | | — | | | | — | | | | (338,816 | ) | | | (325,626 | ) | | | (382,340 | ) | | | (484,508 | ) |
| Total distributions | | | (25,117,162 | ) | | | (12,590,331 | ) | | | (338,816 | ) | | | (325,626 | ) | | | (382,340 | ) | | | (484,508 | ) |
| Capital Stock transactions: | | | | | | | | | | | | | | | | | | | | | | | | |
| Class A Shares | | | | | | | | | | | | | | | | | | | | | | | | |
| Shares sold | | | 1,327,885 | | | | 6,374,140 | | | | | | | | | | | | | | | | | |
| Issued to shareholders in reinvestment of distributions | | | 21,457,591 | | | | 10,752,704 | | | | | | | | | | | | | | | | | |
| Shares redeemed | | | (20,366,378 | ) | | | (21,466,075 | ) | | | | | | | | | | | | | | | | |
| Net increase (decrease) from capital stock transactions | | | 2,419,098 | | | | (4,339,231 | ) | | | | | | | | | | | | | | | | |
| Class B Shares1 | | | | | | | | | | | | | | | | | | | | | | | | |
| Shares sold | | | — | | | | — | | | | | | | | | | | | | | | | | |
| Issued to shareholders in reinvestment of distributions | | | — | | | | 149,845 | | | | | | | | | | | | | | | | | |
| Shares redeemed | | | — | | | | (2,855,529 | ) | | | | | | | | | | | | | | | | |
| Net increase (decrease) from capital stock transactions | | | — | | | | (2,705,684 | ) | | | | | | | | | | | | | | | | |
| Class C Shares | | | | | | | | | | | | | | | | | | | | | | | | |
| Shares sold | | | 1,441,637 | | | | 1,398,950 | | | | | | | | | | | | | | | | | |
| Issued to shareholders in reinvestment of distributions | | | 3,525,283 | | | | 1,631,108 | | | | | | | | | | | | | | | | | |
| Shares redeemed | | | (2,752,643 | ) | | | (3,270,413 | ) | | | | | | | | | | | | | | | | |
| Net increase (decrease) from capital stock transactions | | | 2,214,277 | | | | (240,355 | ) | | | | | | | | | | | | | | | | |
| Class Y Shares | | | | | | | | | | | | | | | | | | | | | | | | |
| Shares sold | | | | | | | | | | | 73,064 | | | | 325,524 | | | | 48,204 | | | | 374,081 | |
| Issued to shareholders in reinvestment of distributions | | | | | | | | | | | 326,345 | | | | 314,288 | | | | 342,563 | | | | 439,238 | |
| Shares redeemed | | | | | | | | | | | (1,082,183 | ) | | | (1,627,919 | ) | | | (791,308 | ) | | | (1,040,722 | ) |
| Net increase (decrease) from capital stock transactions | | | | | | | | | | | (682,774 | ) | | | (988,107 | ) | | | (400,541 | ) | | | (227,403 | ) |
| Total increase (decrease) from capital stock transactions | | | 4,633,375 | | | | (7,285,270 | ) | | | (682,774 | ) | | | (988,107 | ) | | | (400,541 | ) | | | (227,403 | ) |
| Total increase (decrease) in net assets | | | (2,603,738 | ) | | | (21,612,395 | ) | | | 147,657 | | | | (1,170,654 | ) | | | 364,354 | | | | (506,470 | ) |
| Net Assets at end of period | | $ | 137,625,353 | | | $ | 140,229,091 | | | $ | 16,722,742 | | | $ | 16,575,085 | | | $ | 17,478,684 | | | $ | 17,114,330 | |
| Capital Share transactions: | | | | | | | | | | | | | | | | | | | | | | | | |
| Class A Shares | | | | | | | | | | | | | | | | | | | | | | | | |
| Shares sold | | | 101,496 | | | | 432,410 | | | | | | | | | | | | | | | | | |
| Issued to shareholders in reinvestment of distributions | | | 1,656,435 | | | | 740,491 | | | | | | | | | | | | | | | | | |
| Shares redeemed | | | (1,553,011 | ) | | | (1,483,158 | ) | | | | | | | | | | | | | | | | |
| Net increase (decrease) from capital shares transactions | | | 204,920 | | | | (310,257 | ) | | | | | | | | | | | | | | | | |
| Class B Shares1 | | | | | | | | | | | | | | | | | | | | | | | | |
| Shares sold | | | — | | | | — | | | | | | | | | | | | | | | | | |
| Issued to shareholders in reinvestment of distributions | | | — | | | | 10,174 | | | | | | | | | | | | | | | | | |
| Shares redeemed | | | — | | | | (190,334 | ) | | | | | | | | | | | | | | | | |
| Net increase (decrease) from capital shares transactions | | | — | | | | (180,160 | ) | | | | | | | | | | | | | | | | |
| Class C Shares | | | | | | | | | | | | | | | | | | | | | | | | |
| Shares sold | | | 106,938 | | | | 94,879 | | | | | | | | | | | | | | | | | |
| Issued to shareholders in reinvestment of distributions | | | 268,884 | | | | 111,138 | | | | | | | | | | | | | | | | | |
| Shares redeemed | | | (204,553 | ) | | | (225,141 | ) | | | | | | | | | | | | | | | | |
| Net increase (decrease) in shares outstanding | | | 171,269 | | | | (19,124 | ) | | | | | | | | | | | | | | | | |
| Class Y Shares | | | | | | | | | | | | | | | | | | | | | | | | |
| Shares sold | | | | | | | | | | | 6,804 | | | | 30,434 | | | | 4,763 | | | | 37,538 | |
| Issued to shareholders in reinvestment of distributions | | | | | | | | | | | 30,417 | | | | 29,576 | | | | 34,099 | | | | 44,095 | |
| Shares redeemed | | | | | | | | | | | (101,177 | ) | | | (152,845 | ) | | | (79,045 | ) | | | (104,332 | ) |
| Net increase (decrease) in shares outstanding | | | | | | | | | | | (63,956 | ) | | | (92,835 | ) | | | (40,183 | ) | | | (22,699 | ) |
| 1 | As of the close of business on February 6, 2023, outstanding Class B shares of the Madison Funds converted into Class A shares of each respective fund, and Class B shares of the Trust were terminated. |
See accompanying Notes to Financial Statements.
Madison Funds | October 31, 2024
Statements of Changes in Net Assets - continued
| | | High Quality Bond Fund | | | Core Bond Fund | | | Covered Call & Equity Income Fund | |
| Year Ended October 31, | | 2024 | | | 2023 | | | 2024 | | | 2023 | | | 2024 | | | 2023 | |
| Net Assets at beginning of period | | $ | 53,555,404 | | | $ | 76,785,728 | | | $ | 181,585,537 | | | $ | 179,795,322 | | | $ | 244,288,430 | | | $ | 135,198,709 | |
| Increase (decrease) in net assets from operations: | | | | | | | | | | | | | | | | | | | | | | | | |
| Net investment income (loss) | | | 1,724,511 | | | | 1,408,252 | | | | 6,943,236 | | | | 5,736,427 | | | | 5,103,704 | | | | 3,431,614 | |
| Net realized gain (loss) | | | (670,019 | ) | | | (3,293,011 | ) | | | (3,597,252 | ) | | | (5,671,173 | ) | | | 13,437,491 | | | | 14,184,707 | |
| Net change in unrealized appreciation (depreciation) | | | 2,902,681 | | | | 3,574,224 | | | | 15,537,583 | | | | 469,693 | | | | 8,234,736 | | | | (7,720,108 | ) |
| Net increase (decrease) in net assets from operations | | | 3,957,173 | | | | 1,689,465 | | | | 18,883,567 | | | | 534,947 | | | | 26,775,931 | | | | 9,896,213 | |
| Distributions to shareholders from: | | | | | | | | | | | | | | | | | | | | | | | | |
| Accumulated earnings (combined net investment income and net realized gains): | | | | | | | | | | | | | | | | | | | | | | | | |
| Class A | | | — | | | | — | | | | (963,636 | ) | | | (853,260 | ) | | | (1,753,271 | ) | | | (1,205,998 | ) |
| Class B1 | | | — | | | | — | | | | — | | | | (881 | ) | | | — | | | | — | |
| Class C | | | — | | | | — | | | | — | | | | — | | | | (1,431,825 | ) | | | (856,454 | ) |
| Class Y | | | (1,288,219 | ) | | | (1,097,908 | ) | | | (212,476 | ) | | | (204,780 | ) | | | (3,775,564 | ) | | | (3,295,749 | ) |
| Class I | | | (398,668 | ) | | | (281,440 | ) | | | (2,030,406 | ) | | | (1,643,723 | ) | | | (12,761,040 | ) | | | (7,834,925 | ) |
| Class R6 | | | — | | | | — | | | | (3,555,734 | ) | | | (3,046,353 | ) | | | (82,462 | ) | | | (95,856 | ) |
| Total distributions | | | (1,686,887 | ) | | | (1,379,348 | ) | | | (6,762,252 | ) | | | (5,748,997 | ) | | | (19,804,162 | ) | | | (13,288,982 | ) |
| Capital Stock transactions: | | | | | | | | | | | | | | | | | | | | | | | | |
| Class A Shares | | | | | | | | | | | | | | | | | | | | | | | | |
| Shares sold | | | | | | | | | | | 677,669 | | | | 860,171 | | | | 3,937,498 | | | | 7,536,257 | |
| Issued to shareholders in reinvestment of distributions | | | | | | | | | | | 950,092 | | | | 842,123 | | | | 1,690,012 | | | | 1,157,932 | |
| Shares redeemed | | | | | | | | | | | (4,133,261 | ) | | | (4,533,685 | ) | | | (4,849,189 | ) | | | (1,757,531 | ) |
| Net increase (decrease) from capital stock transactions | | | | | | | | | | | (2,505,500 | ) | | | (2,831,391 | ) | | | 778,321 | | | | 6,936,658 | |
| Class B Shares1 | | | | | | | | | | | | | | | | | | | | | | | | |
| Shares sold | | | | | | | | | | | — | | | | — | | | | | | | | | |
| Issued to shareholders in reinvestment of distributions | | | | | | | | | | | — | | | | 881 | | | | | | | | | |
| Shares redeemed | | | | | | | | | | | — | | | | (259,260 | ) | | | | | | | | |
| Net increase (decrease) from capital stock transactions | | | | | | | | | | | — | | | | (258,379 | ) | | | | | | | | |
| Class C Shares | | | | | | | | | | | | | | | | | | | | | | | | |
| Shares sold | | | | | | | | | | | | | | | | | | | 3,308,936 | | | | 6,790,275 | |
| Issued to shareholders in reinvestment of distributions | | | | | | | | | | | | | | | | | | | 1,380,200 | | | | 799,693 | |
| Shares redeemed | | | | | | | | | | | | | | | | | | | (2,342,152 | ) | | | (1,410,491 | ) |
| Net increase (decrease) from capital stock transactions | | | | | | | | | | | | | | | | | | | 2,346,984 | | | | 6,179,477 | |
| Class Y Shares | | | | | | | | | | | | | | | | | | | | | | | | |
| Shares sold | | | 15,120,191 | | | | 21,404,374 | | | | 375,095 | | | | 872,042 | | | | 18,593,662 | | | | 39,743,118 | |
| Issued to shareholders in reinvestment of distributions | | | 1,188,877 | | | | 1,018,024 | | | | 191,280 | | | | 175,012 | | | | 3,606,025 | | | | 3,138,173 | |
| Shares redeemed | | | (13,334,123 | ) | | | (41,974,703 | ) | | | (2,171,078 | ) | | | (1,362,413 | ) | | | (42,804,065 | ) | | | (22,010,147 | ) |
| Net increase (decrease) from capital stock transactions | | | 2,974,945 | | | | (19,552,305 | ) | | | (1,604,703 | ) | | | (315,359 | ) | | | (20,604,378 | ) | | | 20,871,144 | |
| Class I Shares | | | | | | | | | | | | | | | | | | | | | | | | |
| Shares sold | | | 4,028,101 | | | | 7,778,965 | | | | 11,025,905 | | | | 17,483,106 | | | | 82,010,196 | | | | 112,619,189 | |
| Issued to shareholders in reinvestment of distributions | | | 398,668 | | | | 281,440 | | | | 1,922,222 | | | | 1,552,119 | | | | 12,760,484 | | | | 7,834,876 | |
| Shares redeemed | | | (1,709,630 | ) | | | (12,048,541 | ) | | | (10,092,065 | ) | | | (10,489,552 | ) | | | (76,233,129 | ) | | | (42,367,448 | ) |
| Net increase (decrease) from capital stock transactions | | | 2,717,139 | | | | (3,988,136 | ) | | | 2,856,062 | | | | 8,545,673 | | | | 18,537,551 | | | | 78,086,617 | |
| Class R6 Shares | | | | | | | | | | | | | | | | | | | | | | | | |
| Shares sold | | | | | | | | | | | 18,581,724 | | | | 2,484,193 | | | | 131,654 | | | | 2,082,426 | |
| Issued to shareholders in reinvestment of distributions | | | | | | | | | | | 98,287 | | | | 77,433 | | | | 82,462 | | | | 95,856 | |
| Shares redeemed | | | | | | | | | | | (15,039,869 | ) | | | (697,905 | ) | | | (567,207 | ) | | | (1,769,688 | ) |
| Net increase (decrease) from capital stock transactions | | | | | | | | | | | 3,640,142 | | | | 1,863,721 | | | | (353,091 | ) | | | 408,594 | |
| Total increase (decrease) from capital stock transactions | | | 5,692,084 | | | | (23,540,441 | ) | | | 2,386,001 | | | | 7,004,265 | | | | 705,387 | | | | 112,482,490 | |
| Total increase (decrease) in net assets | | | 7,962,370 | | | | (23,230,324 | ) | | | 14,507,316 | | | | 1,790,215 | | | | 7,677,156 | | | | 109,089,721 | |
| Net Assets at end of period | | $ | 61,517,774 | | | $ | 53,555,404 | | | $ | 196,092,853 | | | $ | 181,585,537 | | | $ | 251,965,586 | | | $ | 244,288,430 | |
| Capital Share transactions: | | | | | | | | | | | | | | | | | | | | | | | | |
| Class A Shares | | | | | | | | | | | | | | | | | | | | | | | | |
| Shares sold | | | | | | | | | | | 75,294 | | | | 95,994 | | | | 421,432 | | | | 785,843 | |
| Issued to shareholders in reinvestment of distributions | | | | | | | | | | | 105,792 | | | | 94,974 | | | | 180,948 | | | | 123,785 | |
| Shares redeemed | | | | | | | | | | | (459,691 | ) | | | (510,519 | ) | | | (519,234 | ) | | | (184,664 | ) |
| Net increase (decrease) from capital shares transactions | | | | | | | | | | | (278,605 | ) | | | (319,551 | ) | | | 83,146 | | | | 724,964 | |
| Class B Shares1 | | | | | | | | | | | | | | | | | | | | | | | | |
| Shares sold | | | | | | | | | | | — | | | | — | | | | | | | | | |
| Issued to shareholders in reinvestment of distributions | | | | | | | | | | | — | | | | 98 | | | | | | | | | |
| Shares redeemed | | | | | | | | | | | — | | | | (28,766 | ) | | | | | | | | |
| Net increase (decrease) from capital shares transactions | | | | | | | | | | | — | | | | (28,668 | ) | | | | | | | | |
See accompanying Notes to Financial Statements.
Madison Funds | October 31, 2024
Statements of Changes in Net Assets - continued
| | | High Quality Bond Fund | | | Core Bond Fund | | | Covered Call & Equity Income Fund | |
| Year Ended October 31, | | 2024 | | | 2023 | | | 2024 | | | 2023 | | | 2024 | | | 2023 | |
| Class C Shares | | | | | | | | | | | | | | | | | | | | | | | | |
| Shares sold | | | | | | | | | | | | | | | | | | | 399,739 | | | | 801,083 | |
| Issued to shareholders in reinvestment of distributions | | | | | | | | | | | | | | | | | | | 167,977 | | | | 95,617 | |
| Shares redeemed | | | | | | | | | | | | | | | | | | | (285,193 | ) | | | (166,623 | ) |
| Net increase (decrease) in shares outstanding | | | | | | | | | | | | | | | | | | | 282,523 | | | | 730,077 | |
| Class Y Shares | | | | | | | | | | | | | | | | | | | | | | | | |
| Shares sold | | | 1,462,617 | | | | 2,092,042 | | | | 41,967 | | | | 98,288 | | | | 1,888,146 | | | | 3,990,393 | |
| Issued to shareholders in reinvestment of distributions | | | 114,874 | | | | 100,447 | | | | 21,431 | | | | 19,853 | | | | 368,090 | | | | 321,091 | |
| Shares redeemed | | | (1,293,405 | ) | | | (4,135,130 | ) | | | (243,557 | ) | | | (153,024 | ) | | | (4,400,619 | ) | | | (2,214,734 | ) |
| Net increase (decrease) in shares outstanding | | | 284,086 | | | | (1,942,641 | ) | | | (180,159 | ) | | | (34,883 | ) | | | (2,144,383 | ) | | | 2,096,750 | |
| Class I Shares | | | | | | | | | | | | | | | | | | | | | | | | |
| Shares sold | | | 387,641 | | | | 762,039 | | | | 1,228,231 | | | | 1,965,156 | | | | 8,368,172 | | | | 11,337,708 | |
| Issued to shareholders in reinvestment of distributions | | | 38,257 | | | | 27,560 | | | | 216,196 | | | | 176,906 | | | | 1,300,815 | | | | 800,066 | |
| Shares redeemed | | | (164,457 | ) | | | (1,170,901 | ) | | | (1,135,386 | ) | | | (1,191,201 | ) | | | (7,754,598 | ) | | | (4,281,364 | ) |
| Net increase (decrease) in shares outstanding | | | 261,441 | | | | (381,302 | ) | | | 309,041 | | | | 950,861 | | | | 1,914,389 | | | | 7,856,410 | |
| Class R6 Shares | | | | | | | | | | | | | | | | | | | | | | | | |
| Shares sold | | | | | | | | | | | 2,076,996 | | | | 281,358 | | | | 13,153 | | | | 204,420 | |
| Issued to shareholders in reinvestment of distributions | | | | | | | | | | | 11,057 | | | | 8,825 | | | | 8,240 | | | | 9,567 | |
| Shares redeemed | | | | | | | | | | | (1,730,107 | ) | | | (81,600 | ) | | | (56,708 | ) | | | (172,387 | ) |
| Net increase (decrease) in shares outstanding | | | | | | | | | | | 357,946 | | | | 208,583 | | | | (35,315 | ) | | | 41,600 | |
| 1 | As of the close of business on February 6, 2023, outstanding Class B shares of the Madison Funds converted into Class A shares of each respective fund, and Class B shares of the Trust were terminated. |
See accompanying Notes to Financial Statements.
Madison Funds | October 31, 2024
Statements of Changes in Net Assets - continued
| | | Dividend Income Fund | | | Investors Fund | | | Sustainable Equity | |
| Year Ended October 31, | | 2024 | | | 2023 | | | 2024 | | | 2023 | | | 2024 | | | 2023 | |
| Net Assets at beginning of period | | $ | 197,520,501 | | | $ | 301,287,528 | | | $ | 333,251,378 | | | $ | 300,404,105 | | | $ | 8,058,672 | | | $ | 9,279,877 | |
| Increase (decrease) in net assets from operations: | | | | | | | | | | | | | | | | | | | | | | | | |
| Net investment income (loss) | | | 3,512,497 | | | | 5,720,585 | | | | 1,291,485 | | | | 682,073 | | | | 71,346 | | | | 81,744 | |
| Net realized gain (loss) | | | 14,910,125 | | | | 6,400,352 | | | | 21,811,552 | | | | 27,794,677 | | | | 19,077 | | | | (644,177 | ) |
| Net change in unrealized appreciation (depreciation) | | | 15,739,058 | | | | (22,005,237 | ) | | | 75,613,657 | | | | 13,700,734 | | | | 2,445,136 | | | | 1,011,443 | |
| Net increase (decrease) in net assets from operations | | | 34,161,680 | | | | (9,884,300 | ) | | | 98,716,694 | | | | 42,177,484 | | | | 2,535,559 | | | | 449,010 | |
| Distributions to shareholders from: | | | | | | | | | | | | | | | | | | | | | | | | |
| Accumulated earnings (combined net investment income and net realized gains): | | | | | | | | | | | | | | | | | | | | | | | | |
| Class A | | | (2,860,161 | ) | | | (4,905,579 | ) | | | (7,677,989 | ) | | | (5,361,415 | ) | | | — | | | | — | |
| Class Y | | | (5,054,599 | ) | | | (14,496,468 | ) | | | (8,573,541 | ) | | | (5,634,351 | ) | | | (937 | ) | | | (384 | ) |
| Class I | | | (2,203,122 | ) | | | (5,077,817 | ) | | | (7,275,766 | ) | | | (4,540,678 | ) | | | (86,959 | ) | | | (52,927 | ) |
| Class R6 | | | (550,222 | ) | | | (1,744,781 | ) | | | (5,271,656 | ) | | | (3,481,988 | ) | | | — | | | | — | |
| Total distributions | | | (10,668,104 | ) | | | (26,224,645 | ) | | | (28,798,952 | ) | | | (19,018,432 | ) | | | (87,896 | ) | | | (53,311 | ) |
| Capital Stock transactions: | | | | | | | | | | | | | | | | | | | | | | | | |
| Class A Shares | | | | | | | | | | | | | | | | | | | | | | | | |
| Shares sold | | | 797,271 | | | | 816,977 | | | | 3,411,398 | | | | 2,476,334 | | | | | | | | | |
| Issued to shareholders in reinvestment of distributions | | | 2,848,427 | | | | 4,891,167 | | | | 7,630,977 | | | | 5,343,628 | | | | | | | | | |
| Shares redeemed | | | (6,734,953 | ) | | | (5,326,138 | ) | | | (11,218,364 | ) | | | (8,996,900 | ) | | | | | | | | |
| Net increase (decrease) from capital stock transactions | | | (3,089,255 | ) | | | 382,006 | | | | (175,989 | ) | | | (1,176,938 | ) | | | | | | | | |
| Class Y Shares | | | | | | | | | | | | | | | | | | | | | | | | |
| Shares sold | | | 11,874,471 | | | | 25,609,814 | | | | 25,895,387 | | | | 12,043,076 | | | | 20,013 | | | | 26,518 | |
| Issued to shareholders in reinvestment of distributions | | | 4,925,453 | | | | 14,302,840 | | | | 7,829,873 | | | | 5,142,831 | | | | 937 | | | | 384 | |
| Shares redeemed | | | (56,981,653 | ) | | | (88,386,379 | ) | | | (21,354,862 | ) | | | (15,655,943 | ) | | | (134 | ) | | | (11,906 | ) |
| Net increase (decrease) from capital stock transactions | | | (40,181,729 | ) | | | (48,473,725 | ) | | | 12,370,398 | | | | 1,529,964 | | | | 20,816 | | | | 14,996 | |
| Class I Shares | | | | | | | | | | | | | | | | | | | | | | | | |
| Shares sold | | | 8,528,699 | | | | 14,973,132 | | | | 32,570,300 | | | | 34,212,763 | | | | 1,567,339 | | | | 884,322 | |
| Issued to shareholders in reinvestment of distributions | | | 2,180,144 | | | | 5,025,920 | | | | 7,087,145 | | | | 4,415,273 | | | | 86,959 | | | | 52,927 | |
| Shares redeemed | | | (29,662,824 | ) | | | (33,903,332 | ) | | | (29,268,742 | ) | | | (36,386,959 | ) | | | (2,298,204 | ) | | | (2,569,149 | ) |
| Net increase (decrease) from capital stock transactions | | | (18,953,981 | ) | | | (13,904,280 | ) | | | 10,388,703 | | | | 2,241,077 | | | | (643,906 | ) | | | (1,631,900 | ) |
| Class R6 Shares | | | | | | | | | | | | | | | | | | | | | | | | |
| Shares sold | | | 348,063 | | | | 1,257,714 | | | | 11,322,207 | | | | 4,625,714 | | | | | | | | | |
| Issued to shareholders in reinvestment of distributions | | | 159,794 | | | | 215,685 | | | | 5,271,656 | | | | 3,481,988 | | | | | | | | | |
| Shares redeemed | | | (10,366,935 | ) | | | (7,135,482 | ) | | | (24,232,107 | ) | | | (1,013,584 | ) | | | | | | | | |
| Net increase (decrease) from capital stock transactions | | | (9,859,078 | ) | | | (5,662,083 | ) | | | (7,638,244 | ) | | | 7,094,118 | | | | | | | | | |
| Total increase (decrease) from capital stock transactions | | | (72,084,043 | ) | | | (67,658,082 | ) | | | 14,944,868 | | | | 9,688,221 | | | | (623,090 | ) | | | (1,616,904 | ) |
| Total increase (decrease) in net assets | | | (48,590,467 | ) | | | (103,767,027 | ) | | | 84,862,610 | | | | 32,847,273 | | | | 1,824,573 | | | | (1,221,205 | ) |
| Net Assets at end of period | | $ | 148,930,034 | | | $ | 197,520,501 | | | $ | 418,113,988 | | | $ | 333,251,378 | | | $ | 9,883,245 | | | $ | 8,058,672 | |
| Capital Share transactions: | | | | | | | | | | | | | | | | | | | | | | | | |
| Class A Shares | | | | | | | | | | | | | | | | | | | | | | | | |
| Shares sold | | | 29,505 | | | | 29,520 | | | | 119,633 | | | | 99,522 | | | | | | | | | |
| Issued to shareholders in reinvestment of distributions | | | 106,342 | | | | 176,849 | | | | 288,621 | | | | 236,026 | | | | | | | | | |
| Shares redeemed | | | (248,200 | ) | | | (192,547 | ) | | | (394,961 | ) | | | (362,389 | ) | | | | | | | | |
| Net increase (decrease) from capital shares transactions | | | (112,353 | ) | | | 13,822 | | | | 13,293 | | | | (26,841 | ) | | | | | | | | |
| Class Y Shares | | | | | | | | | | | | | | | | | | | | | | | | |
| Shares sold | | | 439,594 | | | | 915,937 | | | | 930,821 | | | | 479,994 | | | | 1,835 | | | | 3,005 | |
| Issued to shareholders in reinvestment of distributions | | | 183,942 | | | | 516,631 | | | | 295,802 | | | | 226,856 | | | | 98 | | | | 47 | |
| Shares redeemed | | | (2,116,801 | ) | | | (3,223,770 | ) | | | (745,573 | ) | | | (633,711 | ) | | | (14 | ) | | | (1,327 | ) |
| Net increase (decrease) in shares outstanding | | | (1,493,265 | ) | | | (1,791,202 | ) | | | 481,050 | | | | 73,139 | | | | 1,919 | | | | 1,725 | |
| Class I Shares | | | | | | | | | | | | | | | | | | | | | | | | |
| Shares sold | | | 320,517 | | | | 536,676 | | | | 1,166,586 | | | | 1,384,747 | | | | 161,349 | | | | 103,844 | |
| Issued to shareholders in reinvestment of distributions | | | 81,507 | | | | 181,712 | | | | 269,268 | | | | 195,626 | | | | 9,106 | | | | 6,478 | |
| Shares redeemed | | | (1,100,182 | ) | | | (1,229,444 | ) | | | (1,041,176 | ) | | | (1,440,455 | ) | | | (226,844 | ) | | | (302,734 | ) |
| Net increase (decrease) in shares outstanding | | | (698,158 | ) | | | (511,056 | ) | | | 394,678 | | | | 139,918 | | | | (56,389 | ) | | | (192,412 | ) |
| Class R6 Shares | | | | | | | | | | | | | | | | | | | | | | | | |
| Shares sold | | | 12,859 | | | | 46,642 | | | | 407,765 | | | | 182,271 | | | | | | | | | |
| Issued to shareholders in reinvestment of distributions | | | 5,956 | | | | 7,815 | | | | 198,034 | | | | 152,585 | | | | | | | | | |
| Shares redeemed | | | (391,925 | ) | | | (263,169 | ) | | | (838,754 | ) | | | (41,854 | ) | | | | | | | | |
| Net increase (decrease) in shares outstanding | | | (373,110 | ) | | | (208,712 | ) | | | (232,955 | ) | | | 293,002 | | | | | | | | | |
See accompanying Notes to Financial Statements.
Madison Funds | October 31, 2024
Statements of Changes in Net Assets - continued
| | | Mid Cap Fund | | | Small Cap Fund | | | International Stock Fund | |
| Year Ended October 31, | | 2024 | | | 2023 | | | 2024 | | | 2023 | | | 2024 | | | 2023 | |
| Net Assets at beginning of period | | $ | 818,178,739 | | | $ | 681,139,846 | | | $ | 159,012,042 | | | $ | 183,678,969 | | | $ | 11,748,693 | | | $ | 11,700,503 | |
| Increase (decrease) in net assets from operations: | | | | | | | | | | | | | | | | | | | | | | | | |
| Net investment income (loss) | | | 5,183,463 | | | | 1,668,461 | | | | 10,917 | | | | (305,219 | ) | | | 35,846 | | | | 42,772 | |
| Net realized gain (loss) | | | 92,580,444 | | | | 11,986,430 | | | | 18,708,098 | | | | (3,387,971 | ) | | | 207,829 | | | | (564,244 | ) |
| Net change in unrealized appreciation (depreciation) | | | 151,051,194 | | | | 61,556,428 | | | | 37,899,373 | | | | 1,964,433 | | | | 1,907,886 | | | | 1,552,972 | |
| Net increase (decrease) in net assets from operations | | | 248,815,101 | | | | 75,211,319 | | | | 56,618,388 | | | | (1,728,757 | ) | | | 2,151,561 | | | | 1,031,500 | |
| Distributions to shareholders from: | | | | | | | | | | | | | | | | | | | | | | | | |
| Accumulated earnings (combined net investment income and net realized gains): | | | | | | | | | | | | | | | | | | | | | | | | |
| Class A | | | (922,221 | ) | | | (1,324,553 | ) | | | (11,238 | ) | | | (179,025 | ) | | | (36,754 | ) | | | (32,805 | ) |
| Class B1 | | | — | | | | (15,919 | ) | | | — | | | | — | | | | — | | | | — | |
| Class Y | | | (4,031,088 | ) | | | (4,921,978 | ) | | | (472,024 | ) | | | (8,397,631 | ) | | | (3,902 | ) | | | (3,683 | ) |
| Class I | | | (6,314,641 | ) | | | (5,343,152 | ) | | | (38,271 | ) | | | (665,129 | ) | | | — | | | | — | |
| Class R6 | | | (1,990,864 | ) | | | (1,689,800 | ) | | | (762 | ) | | | (8,456 | ) | | | — | | | | — | |
| Total distributions | | | (13,258,814 | ) | | | (13,295,402 | ) | | | (522,295 | ) | | | (9,250,241 | ) | | | (40,656 | ) | | | (36,488 | ) |
| Capital Stock transactions: | | | | | | | | | | | | | | | | | | | | | | | | |
| Class A Shares | | | | | | | | | | | | | | | | | | | | | | | | |
| Shares sold | | | 15,243,003 | | | | 4,506,231 | | | | 272,005 | | | | 279,082 | | | | 199,182 | | | | 456,429 | |
| Issued to shareholders in reinvestment of distributions | | | 917,461 | | | | 1,320,827 | | | | 11,197 | | | | 178,626 | | | | 36,616 | | | | 32,705 | |
| Shares redeemed | | | (10,928,286 | ) | | | (7,862,784 | ) | | | (723,805 | ) | | | (353,439 | ) | | | (1,822,617 | ) | | | (1,195,120 | ) |
| Net increase (decrease) from capital stock transactions | | | 5,232,178 | | | | (2,035,726 | ) | | | (440,603 | ) | | | 104,269 | | | | (1,586,819 | ) | | | (705,986 | ) |
| Class B Shares1 | | | | | | | | | | | | | | | | | | | | | | | | |
| Shares sold | | | — | | | | — | | | | | | | | | | | | — | | | | — | |
| Issued to shareholders in reinvestment of distributions | | | — | | | | 15,919 | | | | | | | | | | | | — | | | | — | |
| Shares redeemed | | | — | | | | (659,890 | ) | | | | | | | | | | | — | | | | (164,756 | ) |
| Net increase (decrease) from capital stock transactions | | | — | | | | (643,971 | ) | | | | | | | | | | | — | | | | (164,756 | ) |
| Class Y Shares | | | | | | | | | | | | | | | | | | | | | | | | |
| Shares sold | | | 249,264,325 | | | | 53,812,846 | | | | 6,098,137 | | | | 3,613,982 | | | | 149,413 | | | | 171,894 | |
| Issued to shareholders in reinvestment of distributions | | | 3,945,121 | | | | 4,842,873 | | | | 460,853 | | | | 8,224,379 | | | | 3,902 | | | | 3,683 | |
| Shares redeemed | | | (104,769,135 | ) | | | (72,929,799 | ) | | | (32,180,477 | ) | | | (24,644,757 | ) | | | (304,954 | ) | | | (251,657 | ) |
| Net increase (decrease) from capital stock transactions | | | 148,440,311 | | | | (14,274,080 | ) | | | (25,621,487 | ) | | | (12,806,396 | ) | | | (151,639 | ) | | | (76,080 | ) |
| Class I Shares | | | | | | | | | | | | | | | | | | | | | | | | |
| Shares sold | | | 670,718,017 | | | | 143,126,817 | | | | 4,545,491 | | | | 3,109,982 | | | | | | | | | |
| Issued to shareholders in reinvestment of distributions | | | 6,189,298 | | | | 5,228,821 | | | | 38,271 | | | | 665,129 | | | | | | | | | |
| Shares redeemed | | | (181,335,879 | ) | | | (73,959,042 | ) | | | (5,814,930 | ) | | | (4,836,229 | ) | | | | | | | | |
| Net increase (decrease) from capital stock transactions | | | 495,571,436 | | | | 74,396,596 | | | | (1,231,168 | ) | | | (1,061,118 | ) | | | | | | | | |
| Class R6 Shares | | | | | | | | | | | | | | | | | | | | | | | | |
| Shares sold | | | 219,018,810 | | | | 47,379,398 | | | | 265,362 | | | | 76,246 | | | | | | | | | |
| Issued to shareholders in reinvestment of distributions | | | 846,593 | | | | 598,094 | | | | 762 | | | | 8,456 | | | | | | | | | |
| Shares redeemed | | | (37,346,944 | ) | | | (30,297,335 | ) | | | (76,611 | ) | | | (9,386 | ) | | | | | | | | |
| Net increase (decrease) from capital stock transactions | | | 182,518,459 | | | | 17,680,157 | | | | 189,513 | | | | 75,316 | | | | | | | | | |
| Total increase (decrease) from capital stock transactions | | | 831,762,384 | | | | 75,122,976 | | | | (27,103,745 | ) | | | (13,687,929 | ) | | | (1,738,458 | ) | | | (946,822 | ) |
| Total increase (decrease) in net assets | | | 1,067,318,671 | | | | 137,038,893 | | | | 28,992,348 | | | | (24,666,927 | ) | | | 372,447 | | | | 48,190 | |
| Net Assets at end of period | | $ | 1,885,497,410 | | | $ | 818,178,739 | | | $ | 188,004,390 | | | $ | 159,012,042 | | | $ | 12,121,140 | | | $ | 11,748,693 | |
| Capital Share transactions: | | | | | | | | | | | | | | | | | | | | | | | | |
| Class A Shares | | | | | | | | | | | | | | | | | | | | | | | | |
| Shares sold | | | 1,010,839 | | | | 358,810 | | | | 26,003 | | | | 30,058 | | | | 21,567 | | | | 52,969 | |
| Issued to shareholders in reinvestment of distributions | | | 63,361 | | | | 113,669 | | | | 1,111 | | | | 20,771 | | | | 4,019 | | | | 4,093 | |
| Shares redeemed | | | (731,646 | ) | | | (632,007 | ) | | | (68,365 | ) | | | (38,672 | ) | | | (197,370 | ) | | | (141,569 | ) |
| Net increase (decrease) from capital shares transactions | | | 342,554 | | | | (159,528 | ) | | | (41,251 | ) | | | 12,157 | | | | (171,784 | ) | | | (84,507 | ) |
| Class B Shares1 | | | | | | | | | | | | | | | | | | | | | | | | |
| Shares sold | | | — | | | | — | | | | | | | | | | | | — | | | | — | |
| Issued to shareholders in reinvestment of distributions | | | — | | | | 1,836 | | | | | | | | | | | | — | | | | — | |
| Shares redeemed | | | — | | | | (70,692 | ) | | | | | | | | | | | — | | | | (19,908 | ) |
| Net increase (decrease) from capital shares transactions | | | — | | | | (68,856 | ) | | | | | | | | | | | — | | | | (19,908 | ) |
| Class Y Shares | | | | | | | | | | | | | | | | | | | | | | | | |
| Shares sold | | | 15,264,555 | | | | 3,986,513 | | | | 568,853 | | | | 384,098 | | | | 16,418 | | | | 20,175 | |
| Issued to shareholders in reinvestment of distributions | | | 251,282 | | | | 386,194 | | | | 44,917 | | | | 942,082 | | | | 433 | | | | 465 | |
| Shares redeemed | | | (6,382,084 | ) | | | (5,533,876 | ) | | | (3,039,480 | ) | | | (2,614,987 | ) | | | (33,482 | ) | | | (30,086 | ) |
| Net increase (decrease) in shares outstanding | | | 9,133,753 | | | | (1,161,169 | ) | | | (2,425,710 | ) | | | (1,288,807 | ) | | | (16,631 | ) | | | (9,446 | ) |
See accompanying Notes to Financial Statements.
Madison Funds | October 31, 2024
Statements of Changes in Net Assets - concluded
| | | Mid Cap Fund | | | Small Cap Fund | |
| | | 2024 | | | 2023 | | | 2024 | | | 2023 | |
| Class I Shares | | | | | | | | | | | | | | | | |
| Shares sold | | | 40,898,038 | | | | 10,597,649 | | | | 424,466 | | | | 325,980 | |
| Issued to shareholders in reinvestment of distributions | | | 393,721 | | | | 416,307 | | | | 3,723 | | | | 76,102 | |
| Shares redeemed | | | (10,948,520 | ) | | | (5,445,271 | ) | | | (562,237 | ) | | | (516,657 | ) |
| Net increase (decrease) in shares outstanding | | | 30,343,239 | | | | 5,568,685 | | | | (134,048 | ) | | | (114,575 | ) |
| Class R6 Shares | | | | | | | | | | | | | | | | |
| Shares sold | | | 12,774,619 | | | | 3,359,279 | | | | 22,854 | | | | 8,066 | |
| Issued to shareholders in reinvestment of distributions | | | 52,388 | | | | 46,328 | | | | 74 | | | | 966 | |
| Shares redeemed | | | (2,184,721 | ) | | | (2,179,297 | ) | | | (6,859 | ) | | | (1,021 | ) |
| Net increase (decrease) in shares outstanding | | | 10,642,286 | | | | 1,226,310 | | | | 16,069 | | | | 8,011 | |
| 1 | As of the close of business on February 6, 2023, outstanding Class B shares of the Madison Funds converted into Class A shares of each respective fund, and Class B shares of the Trust were terminated. |
See accompanying Notes to Financial Statements.
Madison Funds | October 31, 2024
Financial Highlights for a Share of Beneficial Interest Outstanding
| | | CONSERVATIVE ALLOCATION FUND | |
| | | CLASS A | | | CLASS C | |
| | | Year Ended October 31, | | | Year Ended October 31, | |
| | | 2024 | | | 2023 | | | 2022 | | | 2021 | | | 2020 | | | 2024 | | | 2023 | | | 2022 | | | 2021 | | | 2020 | |
| Net Asset Value at beginning of period | | $ | 8.78 | | | $ | 8.85 | | | $ | 11.12 | | | $ | 11.15 | | | $ | 10.96 | | | $ | 8.93 | | | $ | 9.00 | | | $ | 11.30 | | | $ | 11.32 | | | $ | 11.11 | |
| Income from Investment Operations: | | | | | | | | | | | | | | | | | | | | | | | | | | | | | | | | | | | | | | | | |
| Net investment income | | | 0.26 | 1 | | | 0.21 | | | | 0.20 | | | | 0.10 | | | | 0.13 | 2 | | | 0.19 | 1 | | | 0.15 | | | | 0.13 | | | | 0.01 | | | | 0.04 | 2 |
| Net realized and unrealized gain (loss) on investments | | | 0.97 | | | | (0.08 | ) | | | (1.77 | ) | | | 0.63 | | | | 0.46 | | | | 0.99 | | | | (0.09 | ) | | | (1.81 | ) | | | 0.64 | | | | 0.48 | |
| Total from investment operations | | | 1.23 | | | | 0.13 | | | | (1.57 | ) | | | 0.73 | | | | 0.59 | | | | 1.18 | | | | 0.06 | | | | (1.68 | ) | | | 0.65 | | | | 0.52 | |
| Less Distributions From: | | | | | | | | | | | | | | | | | | | | | | | | | | | | | | | | | | | | | | | | |
| Net investment income | | | (0.25 | ) | | | (0.20 | ) | | | (0.19 | ) | | | (0.18 | ) | | | (0.19 | ) | | | (0.18 | ) | | | (0.13 | ) | | | (0.11 | ) | | | (0.09 | ) | | | (0.10 | ) |
| Capital gains | | | – | | | | – | | | | (0.51 | ) | | | (0.58 | ) | | | (0.21 | ) | | | – | | | | – | | | | (0.51 | ) | | | (0.58 | ) | | | (0.21 | ) |
| Total distributions | | | (0.25 | ) | | | (0.20 | ) | | | (0.70 | ) | | | (0.76 | ) | | | (0.40 | ) | | | (0.18 | ) | | | (0.13 | ) | | | (0.62 | ) | | | (0.67 | ) | | | (0.31 | ) |
| Net increase (decrease) in net asset value | | | 0.98 | | | | (0.07 | ) | | | (2.27 | ) | | | (0.03 | ) | | | 0.19 | | | | 1.00 | | | | (0.07 | ) | | | (2.30 | ) | | | (0.02 | ) | | | 0.21 | |
| Net Asset Value at end of period | | $ | 9.76 | | | $ | 8.78 | | | $ | 8.85 | | | $ | 11.12 | | | $ | 11.15 | | | $ | 9.93 | | | $ | 8.93 | | | $ | 9.00 | | | $ | 11.30 | | | $ | 11.32 | |
| Total Return (%)3 | | | 14.12 | | | | 1.36 | | | | (15.00 | ) | | | 6.72 | | | | 5.62 | | | | 13.26 | | | | 0.60 | | | | (15.67 | ) | | | 5.91 | | | | 4.89 | |
| Ratios/Supplemental Data: | | | | | | | | | | | | | | | | | | | | | | | | | | | | | | | | | | | | | | | | |
| Net Assets at end of period (in 000’s) | | $ | 30,555 | | | $ | 30,510 | | | $ | 35,084 | | | $ | 45,932 | | | $ | 44,146 | | | $ | 12,541 | | | $ | 12,558 | | | $ | 14,315 | | | $ | 20,154 | | | $ | 20,137 | |
| Ratios of expenses to average net assets (%) | | | 0.70 | | | | 0.71 | | | | 0.71 | | | | 0.71 | | | | 0.70 | | | | 1.46 | | | | 1.46 | | | | 1.46 | | | | 1.46 | | | | 1.45 | |
| Ratio of net investment income to average net assets (%) | | | 2.73 | | | | 2.24 | | | | 1.97 | | | | 0.86 | | | | 1.19 | | | | 1.97 | | | | 1.49 | | | | 1.27 | | | | 0.11 | | | | 0.45 | |
| Portfolio turnover (%)4 | | | 51 | | | | 53 | | | | 84 | | | | 63 | | | | 73 | | | | 51 | | | | 53 | | | | 84 | | | | 63 | | | | 73 | |
| 1 | Per share amounts have been calculated using the average shares method. |
| 2 | Net investment income (loss) calculated excluding permanent tax adjustments to undistributed net investment income. |
| 3 | Total return without applicable sales charge. |
| 4 | Portfolio turnover is calculated at the fund level and represents the entire fiscal year or period. |
| | | MODERATE ALLOCATION FUND | |
| | | CLASS A | | | CLASS C | |
| | | Year Ended October 31, | | | Year Ended October 31, | |
| | | 2024 | | | 2023 | | | 2022 | | | 2021 | | | 2020 | | | 2024 | | | 2023 | | | 2022 | | | 2021 | | | 2020 | |
| Net Asset Value at beginning of period | | $ | 9.70 | | | $ | 9.59 | | | $ | 12.22 | | | $ | 11.85 | | | $ | 11.76 | | | $ | 9.59 | | | $ | 9.49 | | | $ | 12.09 | | | $ | 11.70 | | | $ | 11.61 | |
| Income from Investment Operations: | | | | | | | | | | | | | | | | | | | | | | | | | | | | | | | | | | | | | | | | |
| Net investment income (loss) | | | 0.25 | 1 | | | 0.20 | | | | 0.28 | | | | 0.09 | | | | 0.12 | 2 | | | 0.16 | 1 | | | 0.12 | | | | 0.19 | | | | (0.01 | ) | | | 0.02 | 2 |
| Net realized and unrealized gain (loss) on investments | | | 1.42 | | | | 0.04 | | | | (1.94 | ) | | | 1.35 | | | | 0.43 | | | | 1.41 | | | | 0.05 | | | | (1.92 | ) | | | 1.34 | | | | 0.44 | |
| Total from investment operations | | | 1.67 | | | | 0.24 | | | | (1.66 | ) | | | 1.44 | | | | 0.55 | | | | 1.57 | | | | 0.17 | | | | (1.73 | ) | | | 1.33 | | | | 0.46 | |
| Less Distributions From: | | | | | | | | | | | | | | | | | | | | | | | | | | | | | | | | | | | | | | | | |
| Net investment income | | | (0.22 | ) | | | (0.13 | ) | | | (0.29 | ) | | | (0.13 | ) | | | (0.17 | ) | | | (0.14 | ) | | | (0.07 | ) | | | (0.19 | ) | | | – | | | | (0.08 | ) |
| Capital gains | | | – | | | | – | | | | (0.68 | ) | | | (0.94 | ) | | | (0.29 | ) | | | – | | | | – | | | | (0.68 | ) | | | (0.94 | ) | | | (0.29 | ) |
| Total distributions | | | (0.22 | ) | | | (0.13 | ) | | | (0.97 | ) | | | (1.07 | ) | | | (0.46 | ) | | | (0.14 | ) | | | (0.07 | ) | | | (0.87 | ) | | | (0.94 | ) | | | (0.37 | ) |
| Net increase (decrease) in net asset value | | | 1.45 | | | | 0.11 | | | | (2.63 | ) | | | 0.37 | | | | 0.09 | | | | 1.43 | | | | 0.10 | | | | (2.60 | ) | | | 0.39 | | | | 0.09 | |
| Net Asset Value at end of period | | $ | 11.15 | | | $ | 9.70 | | | $ | 9.59 | | | $ | 12.22 | | | $ | 11.85 | | | $ | 11.02 | | | $ | 9.59 | | | $ | 9.49 | | | $ | 12.09 | | | $ | 11.70 | |
| Total Return (%)3 | | | 17.42 | | | | 2.55 | | | | (14.88 | ) | | | 12.66 | | | | 4.75 | | | | 16.51 | | | | 1.79 | | | | (15.47 | ) | | | 11.79 | | | | 3.99 | |
| Ratios/Supplemental Data: | | | | | | | | | | | | | | | | | | | | | | | | | | | | | | | | | | | | | | | | |
| Net Assets at end of period (in 000’s) | | $ | 86,640 | | | $ | 85,230 | | | $ | 92,669 | | | $ | 119,035 | | | $ | 111,135 | | | $ | 5,701 | | | $ | 5,507 | | | $ | 6,244 | | | $ | 8,849 | | | $ | 9,230 | |
| Ratios of expenses to average net assets (%) | | | 0.70 | | | | 0.70 | | | | 0.71 | | | | 0.71 | | | | 0.70 | | | | 1.45 | | | | 1.45 | | | | 1.46 | | | | 1.46 | | | | 1.45 | |
| Ratio of net investment income to average net assets (%) | | | 2.29 | | | | 1.97 | | | | 2.54 | | | | 0.70 | | | | 0.96 | | | | 1.54 | | | | 1.22 | | | | 1.83 | | | | (0.03 | ) | | | 0.22 | |
| Portfolio turnover (%)4 | | | 51 | | | | 67 | | | | 95 | | | | 71 | | | | 87 | | | | 51 | | | | 67 | | | | 95 | | | | 71 | | | | 87 | |
| 1 | Per share amounts have been calculated using the average shares method. |
| 2 | Net investment income (loss) calculated excluding permanent tax adjustments to undistributed net investment income. |
| 3 | Total return without applicable sales charge. |
| 4 | Portfolio turnover is calculated at the fund level and represents the entire fiscal year or period. |
See accompanying Notes to Financial Statements.
Madison Funds | October 31, 2024
Financial Highlights for a Share of Beneficial Interest Outstanding - continued
| | | AGGRESSIVE ALLOCATION FUND | |
| | | CLASS A | | | CLASS C | |
| | | Year Ended October 31, | | | Year Ended October 31, | |
| | | 2024 | | | 2023 | | | 2022 | | | 2021 | | | 2020 | | | 2024 | | | 2023 | | | 2022 | | | 2021 | | | 2020 | |
| Net Asset Value at beginning of period | | $ | 10.06 | | | $ | 9.83 | | | $ | 12.75 | | | $ | 11.81 | | | $ | 12.02 | | | $ | 9.66 | | | $ | 9.45 | | | $ | 12.29 | | | $ | 11.42 | | | $ | 11.63 | |
| Income from Investment Operations: | | | | | | | | | | | | | | | | | | | | | | | | | | | | | | | | | | | | | | | | |
| Net investment income (loss) | | | 0.22 | 1 | | | 0.18 | | | | 0.33 | | | | 0.08 | | | | 0.10 | 2 | | | 0.13 | 1 | | | 0.08 | | | | 0.24 | | | | (0.01 | ) | | | 0.03 | 2 |
| Net realized and unrealized gain (loss) on investments | | | 1.79 | | | | 0.17 | | | | (2.07 | ) | | | 1.89 | | | | 0.33 | | | | 1.72 | | | | 0.19 | | | | (2.00 | ) | | | 1.82 | | | | 0.30 | |
| Total from investment operations | | | 2.01 | | | | 0.35 | | | | (1.74 | ) | | | 1.97 | | | | 0.43 | | | | 1.85 | | | | 0.27 | | | | (1.76 | ) | | | 1.81 | | | | 0.33 | |
| Less Distributions From: | | | | | | | | | | | | | | | | | | | | | | | | | | | | | | | | | | | | | | | | |
| Net investment income | | | (0.21 | ) | | | (0.12 | ) | | | (0.34 | ) | | | (0.09 | ) | | | (0.16 | ) | | | (0.12 | ) | | | (0.06 | ) | | | (0.24 | ) | | | – | | | | (0.06 | ) |
| Capital gains | | | – | | | | – | | | | (0.84 | ) | | | (0.94 | ) | | | (0.48 | ) | | | – | | | | – | | | | (0.84 | ) | | | (0.94 | ) | | | (0.48 | ) |
| Total distributions | | | (0.21 | ) | | | (0.12 | ) | | | (1.18 | ) | | | (1.03 | ) | | | (0.64 | ) | | | (0.12 | ) | | | (0.06 | ) | | | (1.08 | ) | | | (0.94 | ) | | | (0.54 | ) |
| Net increase (decrease) in net asset value | | | 1.80 | | | | 0.23 | | | | (2.92 | ) | | | 0.94 | | | | (0.21 | ) | | | 1.73 | | | | 0.21 | | | | (2.84 | ) | | | 0.87 | | | | (0.21 | ) |
| Net Asset Value at end of period | | $ | 11.86 | | | $ | 10.06 | | | $ | 9.83 | | | $ | 12.75 | | | $ | 11.81 | | | $ | 11.39 | | | $ | 9.66 | | | $ | 9.45 | | | $ | 12.29 | | | $ | 11.42 | |
| Total Return (%)3 | | | 20.11 | | | | 3.62 | | | | (15.22 | ) | | | 17.33 | | | | 3.59 | | | | 19.28 | | | | 2.83 | | | | (15.84 | ) | | | 16.39 | | | | 2.88 | |
| Ratios/Supplemental Data: | | | | | | | | | | | | | | | | | | | | | | | | | | | | | | | | | | | | | | | | |
| Net Assets at end of period (in 000’s) | | $ | 52,116 | | | $ | 48,888 | | | $ | 48,969 | | | $ | 60,837 | | | $ | 56,089 | | | $ | 2,097 | | | $ | 1,957 | | | $ | 2,283 | | | $ | 3,082 | | | $ | 2,655 | |
| Ratios of expenses to average net assets (%) | | | 0.70 | | | | 0.70 | | | | 0.71 | | | | 0.71 | | | | 0.70 | | | | 1.46 | | | | 1.46 | | | | 1.46 | | | | 1.46 | | | | 1.45 | |
| Ratio of net investment income to average net assets (%) | | | 1.97 | | | | 1.74 | | | | 2.89 | | | | 0.62 | | | | 0.78 | | | | 1.23 | | | | 1.02 | | | | 2.23 | | | | (0.14 | ) | | | (0.01 | ) |
| Portfolio turnover (%)4 | | | 55 | | | | 71 | | | | 99 | | | | 84 | | | | 105 | | | | 55 | | | | 71 | | | | 99 | | | | 84 | | | | 105 | |
| 1 | Per share amounts have been calculated using the average shares method. |
| 2 | Net investment income (loss) calculated excluding permanent tax adjustments to undistributed net investment income. |
| 3 | Total return without applicable sales charge. |
| 4 | Portfolio turnover is calculated at the fund level and represents the entire fiscal year or period. |
| | | DIVERSIFIED INCOME FUND | |
| | | CLASS A | | | CLASS C | |
| | | Year Ended October 31, | | | Year Ended October 31, | |
| | | 2024 | | | 2023 | | | 2022 | | | 2021 | | | 2020 | | | 2024 | | | 2023 | | | 2022 | | | 2021 | | | 2020 | |
| Net Asset Value at beginning of period | | $ | 13.70 | | | $ | 15.06 | | | $ | 18.42 | | | $ | 15.52 | | | $ | 16.37 | | | $ | 13.84 | | | $ | 15.21 | | | $ | 18.58 | | | $ | 15.65 | | | $ | 16.48 | |
| Income from Investment Operations: | | | | | | | | | | | | | | | | | | | | | | | | | | | | | | | | | | | | | | | | |
| Net investment income | | | 0.76 | 1 | | | 0.31 | | | | 0.27 | | | | 0.23 | | | | 0.26 | 2 | | | 0.68 | 1 | | | 0.20 | | | | 0.14 | | | | 0.09 | | | | 0.15 | 2 |
| Net realized and unrealized gain (loss) on investments | | | 0.97 | | | | (0.47 | ) | | | (1.54 | ) | | | 3.11 | | | | (0.04 | ) | | | 0.98 | | | | (0.48 | ) | | | (1.55 | ) | | | 3.14 | | | | (0.03 | ) |
| Total from investment operations | | | 1.73 | | | | (0.16 | ) | | | (1.27 | ) | | | 3.34 | | | | 0.22 | | | | 1.66 | | | | (0.28 | ) | | | (1.41 | ) | | | 3.23 | | | | 0.12 | |
| Less Distributions From: | | | | | | | | | | | | | | | | | | | | | | | | | | | | | | | | | | | | | | | | |
| Net investment income | | | (0.80 | ) | | | (0.31 | ) | | | (0.28 | ) | | | (0.24 | ) | | | (0.27 | ) | | | (0.70 | ) | | | (0.20 | ) | | | (0.15 | ) | | | (0.10 | ) | | | (0.15 | ) |
| Capital gains | | | (1.67 | ) | | | (0.89 | ) | | | (1.81 | ) | | | (0.20 | ) | | | (0.80 | ) | | | (1.67 | ) | | | (0.89 | ) | | | (1.81 | ) | | | (0.20 | ) | | | (0.80 | ) |
| Total distributions | | | (2.47 | ) | | | (1.20 | ) | | | (2.09 | ) | | | (0.44 | ) | | | (1.07 | ) | | | (2.37 | ) | | | (1.09 | ) | | | (1.96 | ) | | | (0.30 | ) | | | (0.95 | ) |
| Net increase (decrease) in net asset value | | | (0.74 | ) | | | (1.36 | ) | | | (3.36 | ) | | | 2.90 | | | | (0.85 | ) | | | (0.71 | ) | | | (1.37 | ) | | | (3.37 | ) | | | 2.93 | | | | (0.83 | ) |
| Net Asset Value at end of period | | $ | 12.96 | | | $ | 13.70 | | | $ | 15.06 | | | $ | 18.42 | | | $ | 15.52 | | | $ | 13.13 | | | $ | 13.84 | | | $ | 15.21 | | | $ | 18.58 | | | $ | 15.65 | |
| Total Return (%)3 | | | 13.50 | | | | (1.35 | ) | | | (7.92 | ) | | | 21.74 | | | | 1.27 | | | | 12.74 | | | | (2.14 | ) | | | (8.62 | ) | | | 20.82 | | | | 0.62 | |
| Ratios/Supplemental Data: | | | | | | | | | | | | | | | | | | | | | | | | | | | | | | | | | | | | | | | | |
| Net Assets at end of period (in 000’s) | | $ | 116,187 | | | $ | 119,989 | | | $ | 136,578 | | | $ | 158,336 | | | $ | 134,213 | | | $ | 21,439 | | | $ | 20,240 | | | $ | 22,524 | | | $ | 20,812 | | | $ | 16,888 | |
| Ratios of expenses to average net assets (%) | | | 0.66 | | | | 1.00 | | | | 1.11 | | | | 1.11 | | | | 1.10 | | | | 1.40 | | | | 1.75 | | | | 1.86 | | | | 1.85 | | | | 1.85 | |
| Ratio of net investment income to average net assets (%) | | | 5.85 | | | | 2.14 | | | | 1.61 | | | | 1.27 | | | | 1.66 | | | | 5.12 | | | | 1.39 | | | | 0.88 | | | | 0.52 | | | | 0.91 | |
| Portfolio turnover (%)4 | | | 8 | | | | 118 | | | | 32 | | | | 34 | | | | 31 | | | | 8 | | | | 118 | | | | 32 | | | | 34 | | | | 31 | |
| 1 | Per share amounts have been calculated using the average shares method. |
| 2 | Net investment income (loss) calculated excluding permanent tax adjustments to undistributed net investment income. |
| 3 | Total return without applicable sales charge. |
| 4 | Portfolio turnover is calculated at the fund level and represents the entire fiscal year or period. |
See accompanying Notes to Financial Statements.
Madison Funds | October 31, 2024
Financial Highlights for a Share of Beneficial Interest Outstanding - continued
| | | TAX-FREE VIRGINIA FUND | | | TAX-FREE NATIONAL FUND | |
| | | CLASS Y | | | CLASS Y | |
| | | Year Ended October 31, | | | Year Ended October 31, | |
| | | 2024 | | | 2023 | | | 2022 | | | 2021 | | | 2020 | | | 2024 | | | 2023 | | | 2022 | | | 2021 | | | 2020 | |
| Net Asset Value at beginning of period | | $ | 10.20 | | | $ | 10.33 | | | $ | 11.71 | | | $ | 11.89 | | | $ | 11.71 | | | $ | 9.57 | | | $ | 9.73 | | | $ | 10.98 | | | $ | 11.08 | | | $ | 10.96 | |
| Income from Investment Operations: | | | | | | | | | | | | | | | | | | | | | | | | | | | | | | | | | | | | | | | | |
| Net investment income | | | 0.21 | 1 | | | 0.19 | | | | 0.18 | | | | 0.19 | | | | 0.20 | 2 | | | 0.22 | 1 | | | 0.20 | | | | 0.18 | | | | 0.18 | | | | 0.21 | 2 |
| Net realized and unrealized gain (loss) on investments | | | 0.52 | | | | (0.13 | ) | | | (1.34 | ) | | | (0.17 | ) | | | 0.18 | | | | 0.42 | | | | (0.09 | ) | | | (1.15 | ) | | | (0.10 | ) | | | 0.15 | |
| Total from investment operations | | | 0.73 | | | | 0.06 | | | | (1.16 | ) | | | 0.02 | | | | 0.38 | | | | 0.64 | | | | 0.11 | | | | (0.97 | ) | | | 0.08 | | | | 0.36 | |
| Less Distributions From: | | | | | | | | | | | | | | | | | | | | | | | | | | | | | | | | | | | | | | | | |
| Net investment income | | | (0.21 | ) | | | (0.19 | ) | | | (0.18 | ) | | | (0.19 | ) | | | (0.20 | ) | | | (0.22 | ) | | | (0.20 | ) | | | (0.18 | ) | | | (0.18 | ) | | | (0.21 | ) |
| Capital gains | | | – | | | | – | | | | (0.04 | ) | | | (0.01 | ) | | | – | | | | – | | | | (0.07 | ) | | | (0.10 | ) | | | – | | | | (0.03 | ) |
| Total distributions | | | (0.21 | ) | | | (0.19 | ) | | | (0.22 | ) | | | (0.20 | ) | | | (0.20 | ) | | | (0.22 | ) | | | (0.27 | ) | | | (0.28 | ) | | | (0.18 | ) | | | (0.24 | ) |
| Net increase (decrease) in net asset value | | | 0.52 | | | | (0.13 | ) | | | (1.38 | ) | | | (0.18 | ) | | | 0.18 | | | | 0.42 | | | | (0.16 | ) | | | (1.25 | ) | | | (0.10 | ) | | | 0.12 | |
| Net Asset Value at end of period | | $ | 10.72 | | | $ | 10.20 | | | $ | 10.33 | | | $ | 11.71 | | | $ | 11.89 | | | $ | 9.99 | | | $ | 9.57 | | | $ | 9.73 | | | $ | 10.98 | | | $ | 11.08 | |
| Total Return (%)3 | | | 7.21 | | | | 0.56 | | | | (10.01 | ) | | | 0.10 | | | | 3.24 | | | | 6.66 | | | | 1.06 | | | | (8.98 | ) | | | 0.75 | | | | 3.36 | |
| Ratios/Supplemental Data: | | | | | | | | | | | | | | | | | | | | | | | | | | | | | | | | | | | | | | | | |
| Net Assets at end of period (in 000’s) | | $ | 16,723 | | | $ | 16,575 | | | $ | 17,746 | | | $ | 20,620 | | | $ | 21,572 | | | $ | 17,479 | | | $ | 17,114 | | | $ | 17,621 | | | $ | 22,331 | | | $ | 23,377 | |
| Ratios of expenses to average net assets (%) | | | 0.86 | | | | 0.86 | | | | 0.86 | | | | 0.86 | | | | 0.85 | | | | 0.76 | | | | 0.76 | | | | 0.76 | | | | 0.76 | | | | 0.75 | |
| Ratio of net investment income to average net assets (%) | | | 1.99 | | | | 1.82 | | | | 1.65 | | | | 1.57 | | | | 1.66 | | | | 2.15 | | | | 2.02 | | | | 1.74 | | | | 1.65 | | | | 1.91 | |
| Portfolio turnover (%)4 | | | 12 | | | | 15 | | | | 17 | | | | 10 | | | | 7 | | | | 13 | | | | 16 | | | | 10 | | | | 18 | | | | 13 | |
| 1 | Per share amounts have been calculated using the average shares method. |
| 2 | Net investment income (loss) calculated excluding permanent tax adjustments to undistributed net investment income. |
| 3 | Total return without applicable sales charge. |
| 4 | Portfolio turnover is calculated at the fund level and represents the entire fiscal year or period. |
| | | HIGH QUALITY BOND FUND | |
| | | CLASS Y | |
| | | Year Ended October 31, | |
| | | 2024 | | | 2023 | | | 2022 | | | 2021 | | | 2020 | |
| Net Asset Value at beginning of period | | $ | 9.99 | | | $ | 9.99 | | | $ | 11.15 | | | $ | 11.42 | | | $ | 11.11 | |
| Income from Investment Operations: | | | | | | | | | | | | | | | | | | | | |
| Net investment income | | | 0.29 | 1 | | | 0.20 | | | | 0.13 | | | | 0.10 | | | | 0.13 | 2 |
| Net realized and unrealized gain (loss) on investments | | | 0.42 | | | | (0.01 | ) | | | (1.11 | ) | | | (0.24 | ) | | | 0.32 | |
| Total from investment operations | | | 0.71 | | | | 0.19 | | | | (0.98 | ) | | | (0.14 | ) | | | 0.45 | |
| Less Distributions From: | | | | | | | | | | | | | | | | | | | | |
| Net investment income | | | (0.29 | ) | | | (0.19 | ) | | | (0.12 | ) | | | (0.10 | ) | | | (0.14 | ) |
| Capital gains | | | – | | | | – | | | | (0.06 | ) | | | (0.03 | ) | | | – | |
| Total distributions | | | (0.29 | ) | | | (0.19 | ) | | | (0.18 | ) | | | (0.13 | ) | | | (0.14 | ) |
| Net increase (decrease) in net asset value | | | 0.42 | | | | – | | | | (1.16 | ) | | | (0.27 | ) | | | 0.31 | |
| Net Asset Value at end of period | | $ | 10.41 | | | $ | 9.99 | | | $ | 9.99 | | | $ | 11.15 | | | $ | 11.42 | |
| Total Return (%)3 | | | 7.20 | | | | 1.92 | | | | (8.88 | ) | | | (1.21 | ) | | | 4.08 | |
| Ratios/Supplemental Data: | | | | | | | | | | | | | | | | | | | | |
| Net Assets at end of period (in 000’s) | | $ | 47,051 | | | $ | 42,307 | | | $ | 61,707 | | | $ | 115,682 | | | $ | 184,881 | |
| Ratios of expenses to average net assets: | | | | | | | | | | | | | | | | | | | | |
| Before reimbursement of expenses by Adviser (%) | | | 0.50 | | | | 0.50 | | | | 0.50 | | | | 0.50 | | | | 0.49 | |
| After reimbursement of expenses by Adviser (%) | | | 0.50 | | | | 0.50 | | | | 0.46 | | | | 0.40 | | | | 0.46 | |
| Ratio of net investment income to average net assets | | | | | | | | | | | | | | | | | | | | |
| Before reimbursement of expenses by Adviser (%) | | | 2.84 | | | | 1.91 | | | | 1.04 | | | | 0.76 | | | | 1.17 | |
| After reimbursement of expenses by Adviser (%) | | | 2.84 | | | | 1.91 | | | | 1.07 | | | | 0.86 | | | | 1.20 | |
| Portfolio turnover (%)4 | | | 33 | | | | 45 | | | | 23 | | | | 13 | | | | 21 | |
| 1 | Per share amounts have been calculated using the average shares method. |
| 2 | Net investment income (loss) calculated excluding permanent tax adjustments to undistributed net investment income. |
| 3 | Total return without applicable sales charge. |
| 4 | Portfolio turnover is calculated at the fund level and represents the entire fiscal year or period. |
See accompanying Notes to Financial Statements.
Madison Funds | October 31, 2024
Financial Highlights for a Share of Beneficial Interest Outstanding - continued
| | | HIGH QUALITY BOND FUND | |
| | | CLASS I | |
| | | Year Ended October 31, | | | Period Ended October 31, | |
| | | 2024 | | | 2023 | | | 2022* | |
| Net Asset Value at beginning of period | | $ | 10.05 | | | $ | 10.05 | | | $ | 10.84 | |
| Income from Investment Operations: | | | | | | | | | | | | |
| Net investment income | | | 0.31 | 1 | | | 0.22 | | | | 0.09 | |
| Net realized and unrealized gain (loss) on investments | | | 0.42 | | | | (0.02 | ) | | | (0.79 | ) |
| Total from investment operations | | | 0.73 | | | | 0.20 | | | | (0.70 | ) |
| Less Distributions From: | | | | | | | | | | | | |
| Net investment income | | | (0.30 | ) | | | (0.20 | ) | | | (0.09 | ) |
| Total distributions | | | (0.30 | ) | | | (0.20 | ) | | | (0.09 | ) |
| Net increase (decrease) in net asset value | | | 0.43 | | | | – | | | | (0.79 | ) |
| Net Asset Value at end of period | | $ | 10.48 | | | $ | 10.05 | | | $ | 10.05 | |
| Total Return (%)2 | | | 7.35 | | | | 2.00 | | | | (6.44 | )3 |
| Ratios/Supplemental Data: | | | | | | | | | | | | |
| Net Assets at end of period (in 000’s) | | $ | 14,466 | | | $ | 11,248 | | | $ | 15,078 | |
| Ratios of expenses to average net assets: | | | | | | | | | | | | |
| Before reimbursement of expenses by Adviser (%) | | | 0.41 | | | | 0.41 | | | | 0.41 | 4 |
| After reimbursement of expenses by Adviser (%) | | | 0.41 | | | | 0.41 | | | | 0.41 | 4 |
| Ratio of net investment income to average net assets | | | | | | | | | | | | |
| Before reimbursement of expenses by Adviser (%) | | | 2.94 | | | | 2.00 | | | | 1.32 | 4 |
| After reimbursement of expenses by Adviser (%) | | | 2.94 | | | | 2.00 | | | | 1.32 | 4 |
| Portfolio turnover (%)5 | | | 33 | | | | 45 | | | | 23 | 3 |
| * | Class I shares commenced operations effective March 1, 2022. |
| 1 | Per share amounts have been calculated using the average shares method. |
| 2 | Total return without applicable sales charge. |
| 5 | Portfolio turnover is calculated at the fund level and represents the entire fiscal year or period. |
| | | CORE BOND FUND | |
| | | CLASS A | | | CLASS Y | |
| | | Year Ended October 31, | | | Year Ended October 31, | |
| | | 2024 | | | 2023 | | | 2022 | | | 2021 | | | 2020 | | | 2024 | | | 2023 | | | 2022 | | | 2021 | | | 2020 | |
| Net Asset Value at beginning of period | | $ | 8.43 | | | $ | 8.65 | | | $ | 10.45 | | | $ | 10.78 | | | $ | 10.28 | | | $ | 8.38 | | | $ | 8.60 | | | $ | 10.39 | | | $ | 10.71 | | | $ | 10.25 | |
| Income from Investment Operations: | | | | | | | | | | | | | | | | | | | | | | | | | | | | | | | | | | | | | | | | |
| Net investment income (loss) | | | 0.30 | 1 | | | 0.24 | | | | 0.16 | | | | 0.14 | | | | 0.18 | 2 | | | 0.32 | 1 | | | 0.25 | | | | 0.13 | | | | (0.02 | ) | | | 0.20 | 2 |
| Net realized and unrealized gain (loss) on investments | | | 0.58 | | | | (0.23 | ) | | | (1.75 | ) | | | (0.12 | ) | | | 0.53 | | | | 0.57 | | | | (0.21 | ) | | | (1.69 | ) | | | 0.10 | | | | 0.52 | |
| Total from investment operations | | | 0.88 | | | | 0.01 | | | | (1.59 | ) | | | 0.02 | | | | 0.71 | | | | 0.89 | | | | 0.04 | | | | (1.56 | ) | | | 0.08 | | | | 0.72 | |
| Less Distributions From: | | | | | | | | | | | | | | | | | | | | | | | | | | | | | | | | | | | | | | | | |
| Net investment income | | | (0.29 | ) | | | (0.23 | ) | | | (0.15 | ) | | | (0.14 | ) | | | (0.19 | ) | | | (0.31 | ) | | | (0.26 | ) | | | (0.17 | ) | | | (0.19 | ) | | | (0.24 | ) |
| Capital gains | | | – | | | | – | | | | (0.06 | ) | | | (0.21 | ) | | | (0.02 | ) | | | – | | | | – | | | | (0.06 | ) | | | (0.21 | ) | | | (0.02 | ) |
| Total distributions | | | (0.29 | ) | | | (0.23 | ) | | | (0.21 | ) | | | (0.35 | ) | | | (0.21 | ) | | | (0.31 | ) | | | (0.26 | ) | | | (0.23 | ) | | | (0.40 | ) | | | (0.26 | ) |
| Net increase (decrease) in net asset value | | | 0.59 | | | | (0.22 | ) | | | (1.80 | ) | | | (0.33 | ) | | | 0.50 | | | | 0.58 | | | | (0.22 | ) | | | (1.79 | ) | | | (0.32 | ) | | | 0.46 | |
| Net Asset Value at end of period | | $ | 9.02 | | | $ | 8.43 | | | $ | 8.65 | | | $ | 10.45 | | | $ | 10.78 | | | $ | 8.96 | | | $ | 8.38 | | | $ | 8.60 | | | $ | 10.39 | | | $ | 10.71 | |
| Total Return (%)3 | | | 10.48 | | | | 0.07 | | | | (15.47 | ) | | | 0.21 | | | | 7.00 | | | | 10.70 | | | | 0.32 | | | | (15.25 | ) | | | 0.73 | | | | 7.13 | |
| Ratios/Supplemental Data: | | | | | | | | | | | | | | | | | | | | | | | | | | | | | | | | | | | | | | | | |
| Net Assets at end of period (in 000’s) | | $ | 29,007 | | | $ | 29,453 | | | $ | 32,990 | | | $ | 43,577 | | | $ | 47,304 | | | $ | 5,320 | | | $ | 6,482 | | | $ | 6,954 | | | $ | 10,783 | | | $ | 102,811 | |
| Ratios of expenses to average net assets (%) | | | 0.85 | | | | 0.85 | | | | 0.85 | | | | 0.87 | | | | 0.90 | | | | 0.60 | | | | 0.60 | | | | 0.60 | | | | 0.65 | | | | 0.65 | |
| Ratio of net investment income to average net assets (%) | | | 3.33 | | | | 2.65 | | | | 1.57 | | | | 1.31 | | | | 1.78 | | | | 3.57 | | | | 2.90 | | | | 1.80 | | | | 1.65 | | | | 2.03 | |
| Portfolio turnover (%)4 | | | 23 | | | | 30 | | | | 21 | | | | 30 | | | | 61 | | | | 23 | | | | 30 | | | | 21 | | | | 30 | | | | 61 | |
| 1 | Per share amounts have been calculated using the average shares method. |
| 2 | Net investment income (loss) calculated excluding permanent tax adjustments to undistributed net investment income. |
| 3 | Total return without applicable sales charge. |
| 4 | Portfolio turnover is calculated at the fund level and represents the entire fiscal year or period. |
See accompanying Notes to Financial Statements.
Madison Funds | October 31, 2024
Financial Highlights for a Share of Beneficial Interest Outstanding - continued
| | | CORE BOND FUND | |
| | | CLASS I | | | CLASS R6 | |
| | | | | | Period Ended | | | | | | Period Ended | |
| | | Year Ended October 31, | | | October 31, | | | Year Ended October 31, | | | October 31, | |
| | | 2024 | | | 2023 | | | 2022 | | | 2021* | | | 2024 | | | 2023 | | | 2022** | |
| Net Asset Value at beginning of period | | $ | 8.34 | | | $ | 8.56 | | | $ | 10.36 | | | $ | 10.39 | | | $ | 8.34 | | | $ | 8.56 | | | $ | 9.90 | |
| Income from Investment Operations: | | | | | | | | | | | | | | | | | | | | | | | | | | | | |
| Net investment income | | | 0.33 | 1 | | | 0.27 | | | | 0.17 | | | | 0.11 | | | | 0.33 | 1 | | | 0.27 | | | | 0.13 | |
| Net realized and unrealized gain (loss) on investments | | | 0.57 | | | | (0.22 | ) | | | (1.72 | ) | | | (0.02 | ) | | | 0.58 | | | | (0.22 | ) | | | (1.33 | ) |
| Total from investment operations | | | 0.90 | | | | 0.05 | | | | (1.55 | ) | | | 0.09 | | | | 0.91 | | | | 0.05 | | | | (1.20 | ) |
| Less Distributions From: | | | | | | | | | | | | | | | | | | | | | | | | | | | | |
| Net investment income | | | (0.32 | ) | | | (0.27 | ) | | | (0.19 | ) | | | (0.12 | ) | | | (0.33 | ) | | | (0.27 | ) | | | (0.14 | ) |
| Capital gains | | | – | | | | – | | | | (0.06 | ) | | | – | | | | – | | | | – | | | | – | |
| Total distributions | | | (0.32 | ) | | | (0.27 | ) | | | (0.25 | ) | | | (0.12 | ) | | | (0.33 | ) | | | (0.27 | ) | | | (0.14 | ) |
| Net increase (decrease) in net asset value | | | 0.58 | | | | (0.22 | ) | | | (1.80 | ) | | | (0.03 | ) | | | 0.58 | | | | (0.22 | ) | | | (1.34 | ) |
| Net Asset Value at end of period | | $ | 8.92 | | | $ | 8.34 | | | $ | 8.56 | | | $ | 10.36 | | | $ | 8.92 | | | $ | 8.34 | | | $ | 8.56 | |
| Total Return (%)2 | | | 10.86 | | | | 0.42 | | | | (15.20 | ) | | | 0.883 | | | | 10.95 | | | | 0.50 | | | | (12.22 | )3 |
| Ratios/Supplemental Data: | | | | | | | | | | | | | | | | | | | | | | | | | | | | |
| Net Assets at end of period (in 000’s) | | $ | 59,134 | | | $ | 52,699 | | | $ | 45,963 | | | $ | 133,692 | | | $ | 102,632 | | | $ | 92,952 | | | $ | 93,64 | 1 |
| Ratios of expenses to average net assets (%) | | | 0.50 | | | | 0.50 | | | | 0.50 | | | | 0.50 | 4 | | | 0.42 | | | | 0.42 | | | | 0.42 | 4 |
| Ratio of net investment income to average net assets (%) | | | 3.68 | | | | 3.01 | | | | 1.77 | | | | 1.57 | 4 | | | 3.75 | | | | 3.09 | | | | 2.20 | 4 |
| Portfolio turnover (%)5 | | | 23 | | | | 30 | | | | 21 | | | | 30 | 3 | | | 23 | | | | 30 | | | | 21 | 3 |
| * | Class I shares commenced operations effective March 1, 2021. |
| ** | Class R6 shares commenced operations effective March 1, 2022. |
| 1 | Per share amounts have been calculated using the average shares method. |
| 2 | Total return without applicable sales charge. |
| 5 | Portfolio turnover is calculated at the fund level and represents the entire fiscal year or period. |
| | | COVERED CALL & EQUITY INCOME FUND | |
| | | CLASS A | | | CLASS C | | | CLASS Y | |
| | | Year Ended October 31, | | | Year Ended October 31, | | | Year Ended October 31, | |
| | | 2024 | | | 2023 | | | 2022 | | | 2021 | | | 2020 | | | 2024 | | | 2023 | | | 2022 | | | 2021 | | | 2020 | | | 2024 | | | 2023 | | | 2022 | | | 2021 | | | 2020 | |
| Net Asset Value at beginning of period | | $ | 9.18 | | | $ | 9.19 | | | $ | 9.60 | | | $ | 7.80 | | | $ | 7.84 | | | $ | 8.15 | | | $ | 8.27 | | | $ | 8.74 | | | $ | 7.19 | | | $ | 7.31 | | | $ | 9.61 | | | $ | 9.57 | | | $ | 9.95 | | | $ | 8.05 | | | $ | 8.06 | |
| Income from Investment Operations: | | | | | | | | | | | | | | | | | | | | | | | | | | | | | | | | | | | | | | | | | | | | | | | | | | | | | | | | | | | | |
| Net investment income (loss) | | | 0.17 | 1 | | | 0.32 | | | | 0.05 | | | | 0.02 | | | | (0.09 | )2 | | | 0.09 | 1 | | | 0.59 | | | | 0.05 | | | | (0.08 | ) | | | (0.18 | )2 | | | 0.21 | 1 | | | 0.17 | | | | (0.21 | ) | | | 0.04 | | | | (0.39 | )2 |
| Net realized and unrealized gain (loss) on investments | | | 0.81 | | | | 0.33 | | | | 0.17 | | | | 2.37 | | | | 0.60 | | | | 0.72 | | | | (0.06 | ) | | | 0.10 | | | | 2.21 | | | | 0.60 | | | | 0.85 | | | | 0.54 | | | | 0.46 | | | | 2.45 | | | | 0.94 | |
| Total from investment operations | | | 0.98 | | | | 0.65 | | | | 0.22 | | | | 2.39 | | | | 0.51 | | | | 0.81 | | | | 0.53 | | | | 0.15 | | | | 2.13 | | | | 0.42 | | | | 1.06 | | | | 0.71 | | | | 0.25 | | | | 2.49 | | | | 0.55 | |
| Less Distributions From: | | | | | | | | | | | | | | | | | | | | | | | | | | | | | | | | | | | | | | | | | | | | | | | | | | | | | | | | | | | | |
| Net investment income | | | (0.75 | ) | | | (0.66 | ) | | | (0.43 | ) | | | (0.43 | ) | | | (0.39 | ) | | | (0.74 | ) | | | (0.65 | ) | | | (0.42 | ) | | | (0.42 | ) | | | (0.38 | ) | | | (0.76 | ) | | | (0.67 | ) | | | (0.43 | ) | | | (0.43 | ) | | | (0.40 | ) |
| Capital gains | | | – | | | | – | | | | (0.20 | ) | | | (0.16 | ) | | | (0.16 | ) | | | – | | | | – | | | | (0.20 | ) | | | (0.16 | ) | | | (0.16 | ) | | | – | | | | – | | | | (0.20 | ) | | | (0.16 | ) | | | (0.16 | ) |
| Total distributions | | | (0.75 | ) | | | (0.66 | ) | | | (0.63 | ) | | | (0.59 | ) | | | (0.55 | ) | | | (0.74 | ) | | | (0.65 | ) | | | (0.62 | ) | | | (0.58 | ) | | | (0.54 | ) | | | (0.76 | ) | | | (0.67 | ) | | | (0.63 | ) | | | (0.59 | ) | | | (0.56 | ) |
| Net increase (decrease) in net asset value | | | 0.23 | | | | (0.01 | ) | | | (0.41 | ) | | | 1.80 | | | | (0.04 | ) | | | 0.07 | | | | (0.12 | ) | | | (0.47 | ) | | | 1.55 | | | | (0.12 | ) | | | 0.30 | | | | 0.04 | | | | (0.38 | ) | | | 1.90 | | | | (0.01 | ) |
| Net Asset Value at end of period | | $ | 9.41 | | | $ | 9.18 | | | $ | 9.19 | | | $ | 9.60 | | | $ | 7.80 | | | $ | 8.22 | | | $ | 8.15 | | | $ | 8.27 | | | $ | 8.74 | | | $ | 7.19 | | | $ | 9.91 | | | $ | 9.61 | | | $ | 9.57 | | | $ | 9.95 | | | $ | 8.05 | |
| Total Return (%)3 | | | 11.01 | | | | 7.18 | | | | 2.50 | | | | 31.18 | | | | 7.10 | | | | 10.19 | | | | 6.41 | | | | 1.92 | | | | 30.17 | | | | 6.31 | | | | 11.32 | | | | 7.49 | | | | 2.78 | | | | 31.54 | | | | 7.34 | |
| Ratios/Supplemental Data: | | | | | | | | | | | | | | | | | | | | | | | | | | | | | | | | | | | | | | | | | | | | | | | | | | | | | | | | | | | | |
| Net Assets at end of period (in 000’s) | | $ | 21,991 | | | $ | 20,690 | | | $ | 14,044 | | | $ | 14,811 | | | $ | 11,996 | | | $ | 16,635 | | | $ | 14,192 | | | $ | 8,365 | | | $ | 8,336 | | | $ | 7,156 | | | $ | 37,801 | | | $ | 57,277 | | | $ | 36,964 | | | $ | 66,982 | | | $ | 59,966 | |
| Ratios of expenses to average net assets (%) | | | 1.26 | | | | 1.26 | | | | 1.26 | | | | 1.26 | | | | 1.25 | | | | 2.01 | | | | 2.01 | | | | 2.01 | | | | 2.01 | | | | 2.01 | | | | 1.01 | | | | 1.01 | | | | 1.01 | | | | 1.01 | | | | 1.01 | |
| Ratio of net investment income to average net assets (%) | | | 1.81 | | | | 1.50 | | | | 0.57 | | | | 0.09 | | | | 0.70 | | | | 1.05 | | | | 0.75 | | | | (0.18 | ) | | | (0.66 | ) | | | (0.05 | ) | | | 2.14 | | | | 1.75 | | | | 0.84 | | | | 0.34 | | | | 0.98 | |
| Portfolio turnover (%)4 | | | 144 | | | | 102 | | | | 99 | | | | 162 | | | | 108 | | | | 144 | | | | 102 | | | | 99 | | | | 162 | | | | 108 | | | | 144 | | | | 102 | | | | 99 | | | | 162 | | | | 108 | |
| 1 | Per share amounts have been calculated using the average shares method. |
| 2 | Net investment income (loss) calculated excluding permanent tax adjustments to undistributed net investment income. |
| 3 | Total return without applicable sales charge. |
| 4 | Portfolio turnover is calculated at the fund level and represents the entire fiscal year or period. |
See accompanying Notes to Financial Statements.
Madison Funds | October 31, 2024
Financial Highlights for a Share of Beneficial Interest Outstanding - continued
| | | COVERED CALL & EQUITY INCOME FUND | |
| | | CLASS I | |
| | | Year Ended October 31, | | | Period Ended October 31, | |
| | | 2024 | | | 2023 | | | 2022* | |
| Net Asset Value at beginning of period | | $ | 9.62 | | | $ | 9.57 | | | $ | 9.79 | |
| Income from Investment Operations: | | | | | | | | | | | | |
| Net investment income | | | 0.21 | 1 | | | 0.29 | | | | 0.38 | |
| Net realized and unrealized gain (loss) on investments | | | 0.85 | | | | 0.43 | | | | (0.18 | ) |
| Total from investment operations | | | 1.06 | | | | 0.72 | | | | 0.20 | |
| Less Distributions From: | | | | | | | | | | | | |
| Net investment income | | | (0.76 | ) | | | (0.67 | ) | | | (0.42 | ) |
| Total distributions | | | (0.76 | ) | | | (0.67 | ) | | | (0.42 | ) |
| Net increase (decrease) in net asset value | | | 0.30 | | | | 0.05 | | | | (0.22 | ) |
| Net Asset Value at end of period | | $ | 9.92 | | | $ | 9.62 | | | $ | 9.57 | |
| Total Return (%)2 | | | 11.33 | | | | 7.61 | | | | 2.223 | |
| Ratios/Supplemental Data: | | | | | | | | | | | | |
| Net Assets at end of period (in 000’s) | | $ | 174,678 | | | $ | 150,951 | | | $ | 75,060 | |
| Ratios of expenses to average net assets (%) | | | 0.96 | | | | 0.96 | | | | 0.96 | 4 |
| Ratio of net investment income to average net assets (%) | | | 2.09 | | | | 1.80 | | | | 1.06 | 4 |
| Portfolio turnover (%)5 | | | 144 | | | | 102 | | | | 99 | 3 |
| * | Class I shares commenced operations effective March 1, 2022. |
| 1 | Per share amounts have been calculated using the average shares method. |
| 2 | Total return without applicable sales charge. |
| 5 | Portfolio turnover is calculated at the fund level and represents the entire fiscal year or period. |
| | | COVERED CALL & EQUITY INCOME FUND | |
| | | CLASS R6 | |
| | | Year Ended October 31, | |
| | | 2024 | | | 2023 | | | 2022 | | | 2021 | | | 2020 | |
| Net Asset Value at beginning of period | | $ | 9.81 | | | $ | 9.74 | | | $ | 10.12 | | | $ | 8.17 | | | $ | 8.16 | |
| Income from Investment Operations: | | | | | | | | | | | | | | | | | | | | |
| Net investment income (loss) | | | 0.22 | 1 | | | 0.03 | | | | 0.04 | | | | 0.17 | | | | (0.45 | )2 |
| Net realized and unrealized gain (loss) on investments | | | 0.87 | | | | 0.71 | | | | 0.23 | | | | 2.37 | | | | 1.02 | |
| Total from investment operations | | | 1.09 | | | | 0.74 | | | | 0.27 | | | | 2.54 | | | | 0.57 | |
| Less Distributions From: | | | | | | | | | | | | | | | | | | | | |
| Net investment income | | | (0.76 | ) | | | (0.67 | ) | | | (0.45 | ) | | | (0.43 | ) | | | (0.40 | ) |
| Capital gains | | | – | | | | – | | | | (0.20 | ) | | | (0.16 | ) | | | (0.16 | ) |
| Total distributions | | | (0.76 | ) | | | (0.67 | ) | | | (0.65 | ) | | | (0.59 | ) | | | (0.56 | ) |
| Net increase (decrease) in net asset value | | | 0.33 | | | | 0.07 | | | | (0.38 | ) | | | 1.95 | | | | 0.01 | |
| Net Asset Value at end of period | | $ | 10.14 | | | $ | 9.81 | | | $ | 9.74 | | | $ | 10.12 | | | $ | 8.17 | |
| Total Return (%)3 | | | 11.44 | | | | 7.71 | | | | 2.89 | | | | 31.69 | | | | 7.51 | |
| Ratios/Supplemental Data: | | | | | | | | | | | | | | | | | | | | |
| Net Assets at end of period (in 000’s) | | $ | 860 | | | $ | 1,178 | | | $ | 765 | | | $ | 544 | | | $ | 1,439 | |
| Ratios of expenses to average net assets (%) | | | 0.88 | | | | 0.88 | | | | 0.88 | | | | 0.88 | | | | 0.87 | |
| Ratio of net investment income to average net assets (%) | | | 2.23 | | | | 1.85 | | | | 0.95 | | | | 0.60 | | | | 1.10 | |
| Portfolio turnover (%)4 | | | 144 | | | | 102 | | | | 99 | | | | 162 | | | | 108 | |
| 1 | Per share amounts have been calculated using the average shares method. |
| 2 | Net investment income (loss) calculated excluding permanent tax adjustments to undistributed net investment income. |
| 3 | Total return without applicable sales charge. |
| 4 | Portfolio turnover is calculated at the fund level and represents the entire fiscal year or period. |
See accompanying Notes to Financial Statements.
Madison Funds | October 31, 2024
Financial Highlights for a Share of Beneficial Interest Outstanding - continued
| | | DIVIDEND INCOME FUND | |
| | | CLASS A | |
| | | | | | | | | | | | | | | Period Ended | |
| | | Year Ended October 31, | | | October 31, | |
| | | 2024 | | | 2023 | | | 2022 | | | 2021 | | | 2020* | |
| Net Asset Value at beginning of period | | $ | 25.34 | | | $ | 29.27 | | | $ | 34.13 | | | $ | 26.10 | | | $ | 25.17 | |
| Income from Investment Operations: | | | | | | | | | | | | | | | | | | | | |
| Net investment income | | | 0.50 | 1 | | | 0.56 | | | | 0.52 | | | | 0.39 | | | | 0.16 | 2 |
| Net realized and unrealized gain (loss) on investments | | | 4.77 | | | | (1.90 | ) | | | (1.73 | ) | | | 8.06 | | | | 0.98 | |
| Total from investment operations | | | 5.27 | | | | (1.34 | ) | | | (1.21 | ) | | | 8.45 | | | | 1.14 | |
| Less Distributions From: | | | | | | | | | | | | | | | | | | | | |
| Net investment income | | | (0.50 | ) | | | (0.58 | ) | | | (0.44 | ) | | | (0.42 | ) | | | (0.21 | ) |
| Capital gains | | | (1.00 | ) | | | (2.01 | ) | | | (3.21 | ) | | | – | | | | – | |
| Total distributions | | | (1.50 | ) | | | (2.59 | ) | | | (3.65 | ) | | | (0.42 | ) | | | (0.21 | ) |
| Net Increase (decrease) in net asset value | | | 3.77 | | | | (3.93 | ) | | | (4.86 | ) | | | 8.03 | | | | 0.93 | |
| Net Asset Value at end of period | | $ | 29.11 | | | $ | 25.34 | | | $ | 29.27 | | | $ | 34.13 | | | $ | 26.10 | |
| Total Return (%)3 | | | 21.41 | | | | (5.23 | ) | | | (4.23 | ) | | | 32.52 | | | | 4.53 | 4 |
| Ratios/Supplemental Data: | | | | | | | | | | | | | | | | | | | | |
| Net Assets at end of period (in 000’s) | | $ | 52,720 | | | $ | 48,746 | | | $ | 55,902 | | | $ | 62,716 | | | $ | 51,207 | |
| Ratios of expenses to average net assets (%) | | | 1.16 | | | | 1.16 | | | | 1.16 | | | | 1.16 | | | | 1.17 | 5 |
| Ratio of net investment income to average net assets (%) | | | 1.85 | | | | 1.97 | | | | 1.64 | | | | 1.25 | | | | 1.09 | 5 |
| Portfolio turnover (%)6 | | | 28 | | | | 26 | | | | 33 | | | | 31 | | | | 33 | 4 |
| * | Class A shares commenced operations effective June 1, 2020. |
| 1 | Per share amounts have been calculated using the average shares method. |
| 2 | Net investment income (loss) calculated excluding permanent tax adjustments to undistributed net investment income. |
| 3 | Total return without applicable sales charge. |
| 6 | Portfolio turnover is calculated at the fund level and represents the entire fiscal year or period. |
| | | DIVIDEND INCOME FUND | |
| | | CLASS Y | |
| | | Year Ended October 31, | |
| | | 2024 | | | 2023 | | | 2022 | | | 2021 | | | 2020 | |
| Net Asset Value at beginning of period | | $ | 25.36 | | | $ | 29.29 | | | $ | 34.19 | | | $ | 26.14 | | | $ | 27.65 | |
| Income from Investment Operations: | | | | | | | | | | | | | | | | | | | | |
| Net investment income | | | 0.58 | 1 | | | 0.69 | | | | 0.60 | | | | 0.50 | | | | 0.51 | 2 |
| Net realized and unrealized gain (loss) on investments | | | 4.75 | | | | (1.96 | ) | | | (1.73 | ) | | | 8.03 | | | | (0.88 | ) |
| Total from investment operations | | | 5.33 | | | | (1.27 | ) | | | (1.13 | ) | | | 8.53 | | | | (0.37 | ) |
| Less Distributions From: | | | | | | | | | | | | | | | | | | | | |
| Net investment income | | | (0.57 | ) | | | (0.65 | ) | | | (0.56 | ) | | | (0.48 | ) | | | (0.45 | ) |
| Capital gains | | | (1.00 | ) | | | (2.01 | ) | | | (3.21 | ) | | | – | | | | (0.69 | ) |
| Total distributions | | | (1.57 | ) | | | (2.66 | ) | | | (3.77 | ) | | | (0.48 | ) | | | (1.14 | ) |
| Net Increase (decrease) in net asset value | | | 3.76 | | | | (3.93 | ) | | | (4.90 | ) | | | 8.05 | | | | (1.51 | ) |
| Net Asset Value at end of period | | $ | 29.12 | | | $ | 25.36 | | | $ | 29.29 | | | $ | 34.19 | | | $ | 26.14 | |
| Total Return (%)3 | | | 21.65 | | | | (4.99 | ) | | | (3.98 | ) | | | 32.81 | | | | (1.42 | ) |
| Ratios/Supplemental Data: | | | | | | | | | | | | | | | | | | | | |
| Net Assets at end of period (in 000’s) | | $ | 69,409 | | | $ | 98,291 | | | $ | 165,998 | | | $ | 188,287 | | | $ | 171,733 | |
| Ratios of expenses to average net assets: | | | | | | | | | | | | | | | | | | | | |
| Before reimbursement of expenses by Adviser (%) | | | 0.91 | | | | 0.91 | | | | 0.91 | | | | 0.91 | | | | 1.02 | |
| After reimbursement of expenses by Adviser (%) | | | 0.91 | | | | 0.91 | | | | 0.91 | | | | 0.91 | | | | 0.93 | |
| Ratio of net investment income (loss) to average net assets | | | | | | | | | | | | | | | | | | | | |
| Before reimbursement of expenses by Adviser (%) | | | 2.13 | | | | 2.23 | | | | 1.89 | | | | 1.50 | | | | 1.72 | |
| After reimbursement of expenses by Adviser (%) | | | 2.13 | | | | 2.23 | | | | 1.89 | | | | 1.50 | | | | 1.81 | |
| Portfolio turnover (%)4 | | | 28 | | | | 26 | | | | 33 | | | | 31 | | | | 33 | |
| 1 | Per share amounts have been calculated using the average shares method. |
| 2 | Net investment income (loss) calculated excluding permanent tax adjustments to undistributed net investment income. |
| 3 | Total return without applicable sales charge. |
| 4 | Portfolio turnover is calculated at the fund level and represents the entire fiscal year or period. |
See accompanying Notes to Financial Statements.
Madison Funds | October 31, 2024
Financial Highlights for a Share of Beneficial Interest Outstanding - continued
| | | DIVIDEND INCOME FUND | |
| | | CLASS I | |
| | | | | | | | | | | | | | | Period Ended | |
| | | Year Ended October 31, | | | October 31, | |
| | | 2024 | | | 2023 | | | 2022 | | | 2021 | | | 2020* | |
| Net Asset Value at beginning of period | | $ | 25.34 | | | $ | 29.27 | | | $ | 34.20 | | | $ | 26.14 | | | $ | 27.19 | |
| Income from Investment Operations: | | | | | | | | | | | | | | | | | | | | |
| Net investment income | | | 0.61 | 1 | | | 0.67 | | | | 0.63 | | | | 0.52 | | | | 0.06 | 2 |
| Net realized and unrealized gain (loss) on investments | | | 4.76 | | | | (1.91 | ) | | | (1.73 | ) | | | 8.05 | | | | (1.02 | ) |
| Total from investment operations | | | 5.37 | | | | (1.24 | ) | | | (1.10 | ) | | | 8.57 | | | | (0.96 | ) |
| Less Distributions From: | | | | | | | | | | | | | | | | | | | | |
| Net investment income | | | (0.60 | ) | | | (0.68 | ) | | | (0.62 | ) | | | (0.51 | ) | | | (0.09 | ) |
| Capital gains | | | (1.00 | ) | | | (2.01 | ) | | | (3.21 | ) | | | – | | | | – | |
| Total distributions | | | (1.60 | ) | | | (2.69 | ) | | | (3.83 | ) | | | (0.51 | ) | | | (0.09 | ) |
| Net Increase (decrease) in net asset value | | | 3.77 | | | | (3.93 | ) | | | (4.93 | ) | | | 8.06 | | | | (1.05 | ) |
| Net Asset Value at end of period | | $ | 29.11 | | | $ | 25.34 | | | $ | 29.27 | | | $ | 34.20 | | | $ | 26.14 | |
| Total Return (%)3 | | | 21.84 | | | | (4.90 | ) | | | (3.88 | ) | | | 32.95 | | | | (3.53 | )4 |
| Ratios/Supplemental Data: | | | | | | | | | | | | | | | | | | | | |
| Net Assets at end of period (in 000’s) | | $ | 24,274 | | | $ | 38,826 | | | $ | 59,812 | | | $ | 72,215 | | | $ | 51,725 | |
| Ratios of expenses to average net assets (%) | | | 0.81 | | | | 0.81 | | | | 0.81 | | | | 0.81 | | | | 0.82 | 5 |
| Ratio of net investment income to average net assets (%) | | | 2.24 | | | | 2.34 | | | | 2.02 | | | | 1.60 | | | | 1.55 | 5 |
| Portfolio turnover (%)6 | | | 28 | | | | 26 | | | | 33 | | | | 31 | | | | 33 | 4 |
| * | Class I shares commenced operations effective September 1, 2020. |
| 1 | Per share amounts have been calculated using the average shares method. |
| 2 | Net investment income (loss) calculated excluding permanent tax adjustments to undistributed net investment income. |
| 3 | Total return without applicable sales charge. |
| 6 | Portfolio turnover is calculated at the fund level and represents the entire fiscal year or period. |
| | | DIVIDEND INCOME FUND | |
| | | CLASS R6 | |
| | | Year Ended | | | Period Ended | |
| | | October 31, | | | October 31, | |
| | | 2024 | | | 2023 | | | 2022* | |
| Net Asset Value at beginning of period | | $ | 25.35 | | | $ | 29.28 | | | $ | 31.05 | |
| Income from Investment Operations: | | | | | | | | | | | | |
| Net investment income | | | 0.65 | 1 | | | 0.63 | | | | 0.39 | |
| Net realized and unrealized gain (loss) on investments | | | 4.73 | | | | (1.85 | ) | | | (1.72 | ) |
| Total from investment operations | | | 5.38 | | | | (1.22 | ) | | | (1.33 | ) |
| Less Distributions From: | | | | | | | | | | | | |
| Net investment income | | | (0.62 | ) | | | (0.70 | ) | | | (0.44 | ) |
| Capital gains | | | (1.00 | ) | | | (2.01 | ) | | | – | |
| Total distributions | | | (1.62 | ) | | | (2.71 | ) | | | (0.44 | ) |
| Net Increase (decrease) in net asset value | | | 3.76 | | | | (3.93 | ) | | | (1.77 | ) |
| Net Asset Value at end of period | | $ | 29.11 | | | $ | 25.35 | | | $ | 29.28 | |
| Total Return (%)2 | | | 21.88 | | | | (4.82 | ) | | | (4.25 | )3 |
| Ratios/Supplemental Data: | | | | | | | | | | | | |
| Net Assets at end of period (in 000’s) | | $ | 2,527 | | | $ | 11,657 | | | $ | 19,575 | |
| Ratios of expenses to average net assets (%): | | | 0.73 | | | | 0.73 | | | | 0.73 | 4 |
| Ratio of net investment income to average net assets (%) | | | 2.42 | | | | 2.41 | | | | 2.03 | 4 |
| Portfolio turnover (%)5 | | | 28 | | | | 26 | | | | 33 | 3 |
| * | Class R6 shares commenced operations effective March 1, 2022. |
| 1 | Per share amounts have been calculated using the average shares method. |
| 2 | Total return without applicable sales charge. |
| 5 | Portfolio turnover is calculated at the fund level and represents the entire fiscal year or period. |
See accompanying Notes to Financial Statements.
Madison Funds | October 31, 2024
Financial Highlights for a Share of Beneficial Interest Outstanding - continued
| | | INVESTORS FUND | |
| | | CLASS A | | | CLASS Y | | | CLASS R6 | |
| | | Year Ended October 31, | | | Year Ended October 31, | | | Year Ended October 31, | |
| | | 2024 | | | 2023 | | | 2022 | | | 2021 | | | 2020 | | | 2024 | | | 2023 | | | 2022 | | | 2021 | | | 2020 | | | 2024 | | | 2023 | | | 2022 | | | 2021 | | | 2020 | |
| Net Asset Value at beginning of period | | $ | 25.28 | | | $ | 23.65 | | | $ | 28.72 | | | $ | 23.81 | | | $ | 23.76 | | | $ | 25.36 | | | $ | 23.72 | | | $ | 28.78 | | | $ | 23.84 | | | $ | 23.83 | | | $ | 25.57 | | | $ | 23.95 | | | $ | 29.09 | | | $ | 24.12 | | | $ | 24.06 | |
| Income from Investment Operations: | | | | | | | | | | | | | | | | | | | | | | | | | | | | | | | | | | | | | | | | | | | | | | | | | | | | | | | | | | | | |
| Net investment income (loss) | | | 0.02 | 1 | | | (0.01 | ) | | | (0.01 | ) | | | (0.01 | ) | | | 0.04 | 2 | | | 0.09 | 1 | | | 0.06 | | | | 0.05 | | | | 0.12 | | | | 0.14 | 2 | | | 0.15 | 1 | | | 0.11 | | | | 0.08 | | | | 0.11 | | | | 0.03 | 2 |
| Net realized and unrealized gain (loss) | | | | | | | | | | | | | | | | | | | | | | | | | | | | | | | | | | | | | | | | | | | | | | | | | | | | | | | | | | | | |
| on investments | | | 7.03 | | | | 3.09 | | | | (2.92 | ) | | | 7.29 | | | | 1.31 | | | | 7.06 | | | | 3.09 | | | | (2.93 | ) | | | 7.24 | | | | 1.29 | | | | 7.10 | | | | 3.10 | | | | (2.93 | ) | | | 7.37 | | | | 1.45 | |
| Total from investment operations | | | 7.05 | | | | 3.08 | | | | (2.93 | ) | | | 7.28 | | | | 1.35 | | | | 7.15 | | | | 3.15 | | | | (2.88 | ) | | | 7.36 | | | | 1.43 | | | | 7.25 | | | | 3.21 | | | | (2.85 | ) | | | 7.48 | | | | 1.48 | |
| Less Distributions From: | | | | | | | | | | | | | | | | | | | | | | | | | | | | | | | | | | | | | | | | | | | | | | | | | | | | | | | | | | | | |
| Net investment income | | | – | | | | – | | | | – | | | | – | | | | – | | | | (0.07 | ) | | | (0.06 | ) | | | (0.04 | ) | | | (0.05 | ) | | | (0.12 | ) | | | (0.17 | ) | | | (0.14 | ) | | | (0.15 | ) | | | (0.14 | ) | | | (0.12 | ) |
| Capital gains | | | (2.10 | ) | | | (1.45 | ) | | | (2.14 | ) | | | (2.37 | ) | | | (1.30 | ) | | | (2.10 | ) | | | (1.45 | ) | | | (2.14 | ) | | | (2.37 | ) | | | (1.30 | ) | | | (2.10 | ) | | | (1.45 | ) | | | (2.14 | ) | | | (2.37 | ) | | | (1.30 | ) |
| Total distributions | | | (2.10 | ) | | | (1.45 | ) | | | (2.14 | ) | | | (2.37 | ) | | | (1.30 | ) | | | (2.17 | ) | | | (1.51 | ) | | | (2.18 | ) | | | (2.42 | ) | | | (1.42 | ) | | | (2.27 | ) | | | (1.59 | ) | | | (2.29 | ) | | | (2.51 | ) | | | (1.42 | ) |
| Net increase (decrease) in net asset value | | | 4.95 | | | | 1.63 | | | | (5.07 | ) | | | 4.91 | | | | 0.05 | | | | 4.98 | | | | 1.64 | | | | (5.06 | ) | | | 4.94 | | | | 0.01 | | | | 4.98 | | | | 1.62 | | | | (5.14 | ) | | | 4.97 | | | | 0.06 | |
| Net Asset Value at end of period | | $ | 30.23 | | | $ | 25.28 | | | $ | 23.65 | | | $ | 28.72 | | | $ | 23.81 | | | $ | 30.34 | | | $ | 25.36 | | | $ | 23.72 | | | $ | 28.78 | | | $ | 23.84 | | | $ | 30.55 | | | $ | 25.57 | | | $ | 23.95 | | | $ | 29.09 | | | $ | 24.12 | |
| Total Return (%)3 | | | 29.08 | | | | 13.75 | | | | (11.33 | ) | | | 32.37 | | | | 5.75 | | | | 29.43 | | | | 14.03 | | | | (11.13 | ) | | | 32.72 | | | | 6.06 | | | | 29.66 | | | | 14.23 | | | | (10.96 | ) | | | 32.96 | | | | 6.21 | |
| Ratios/Supplemental Data: | | | | | | | | | | | | | | | | | | | | | | | | | | | | | | | | | | | | | | | | | | | | | | | | | | | | | | | | | | | | |
| Net Assets at end of period (in 000’s) | | $ | 112,454 | | | $ | 93,711 | | | $ | 88,286 | | | $ | 108,515 | | | $ | 88,934 | | | $ | 131,142 | | | $ | 97,446 | | | $ | 89,391 | | | $ | 112,166 | | | $ | 157,991 | | | $ | 66,687 | | | $ | 61,787 | | | $ | 50,843 | | | $ | 84,331 | | | $ | 70,490 | |
| Ratios of expenses to average net | | | | | | | | | | | | | | | | | | | | | | | | | | | | | | | | | | | | | | | | | | | | | | | | | | | | | | | | | | | | |
| assets (%) | | | 1.16 | | | | 1.16 | | | | 1.16 | | | | 1.16 | | | | 1.18 | | | | 0.91 | | | | 0.91 | | | | 0.91 | | | | 0.91 | | | | 0.94 | | | | 0.73 | | | | 0.73 | | | | 0.73 | | | | 0.73 | | | | 0.74 | |
| Ratio of net investment income (loss) to | | | | | | | | | | | | | | | | | | | | | | | | | | | | | | | | | | | | | | | | | | | | | | | | | | | | | | | | | | | | |
| average net assets (%) | | | 0.09 | | | | (0.03 | ) | | | (0.05 | ) | | | (0.03 | ) | | | 0.18 | | | | 0.32 | | | | 0.22 | | | | 0.21 | | | | 0.25 | | | | 0.54 | | | | 0.52 | | | | 0.40 | | | | 0.41 | | | | 0.39 | | | | 0.26 | |
| Portfolio turnover (%)4 | | | 16 | | | | 22 | | | | 18 | | | | 17 | | | | 41 | | | | 16 | | | | 22 | | | | 18 | | | | 17 | | | | 41 | | | | 16 | | | | 22 | | | | 18 | | | | 17 | | | | 41 | |
| 1 | Per share amounts have been calculated using the average shares method. |
| 2 | Net investment income (loss) calculated excluding permanent tax adjustments to undistributed net investment income. |
| 3 | Total return without applicable sales charge. |
| 4 | Portfolio turnover is calculated at the fund level and represents the entire fiscal year or period. |
| | | INVESTORS FUND | |
| | | CLASS I | |
| | | Year Ended October 31, | |
| | | 2024 | | | 2023 | | | 2022 | | | 2021 | | | 2020* | |
| Net Asset Value at beginning of period | | $ | 25.28 | | | $ | 23.67 | | | $ | 28.75 | | | $ | 23.84 | | | $ | 24.51 | |
| Income from Investment Operations: | | | | | | | | | | | | | | | | | | | | |
| Net investment income | | | 0.12 | 1 | | | 0.10 | | | | 0.07 | | | | 0.10 | | | | 0.00 | 2,3 |
| Net realized and unrealized gain (loss) on investments | | | 7.01 | | | | 3.07 | | | | (2.91 | ) | | | 7.28 | | | | (0.67 | ) |
| Total from investment operations | | | 7.13 | | | | 3.17 | | | | (2.84 | ) | | | 7.38 | | | | (0.67 | ) |
| Less Distributions From: | | | | | | | | | | | | | | | | | | | | |
| Net investment income | | | (0.12 | ) | | | (0.11 | ) | | | (0.10 | ) | | | (0.10 | ) | | | – | |
| Capital gains | | | (2.10 | ) | | | (1.45 | ) | | | (2.14 | ) | | | (2.37 | ) | | | – | |
| Total distributions | | | (2.22 | ) | | | (1.56 | ) | | | (2.24 | ) | | | (2.47 | ) | | | – | |
| Net Increase (decrease) in net asset value | | | 4.91 | | | | 1.61 | | | | (5.08 | ) | | | 4.91 | | | | (0.67 | ) |
| Net Asset Value at end of period | | $ | 30.19 | | | $ | 25.28 | | | $ | 23.67 | | | $ | 28.75 | | | $ | 23.84 | |
| Total Return (%)4 | | | 29.51 | | | | 14.17 | | | | (11.03 | ) | | | 32.87 | | | | (2.73 | )5 |
| Ratios/Supplemental Data: | | | | | | | | | | | | | | | | | | | | |
| Net Assets at end of period (in 000’s) | | $ | 107,831 | | | $ | 80,308 | | | $ | 71,885 | | | $ | 104,617 | | | $ | 20,643 | |
| Ratios of expenses to average net assets (%) | | | 0.81 | | | | 0.81 | | | | 0.81 | | | | 0.81 | | | | 0.82 | 6 |
| Ratio of net investment income (loss) to average net assets (%) | | | 0.42 | | | | 0.31 | | | | 0.31 | | | | 0.30 | | | | 0.02 | 6 |
| Portfolio turnover (%)7 | | | 16 | | | | 22 | | | | 18 | | | | 17 | | | | 41 | 5 |
| * | Class I shares commenced operations effective September 1, 2020. |
| 1 | Per share amounts have been calculated using the average shares method. |
| 2 | Amounts represent less than $ 0.005 per share. |
| 3 | Net investment income (loss) calculated excluding permanent tax adjustments to undistributed net investment income. |
| 4 | Total return without applicable sales charge. |
| 7 | Portfolio turnover is calculated at the fund level and represents the entire fiscal year or period. |
See accompanying Notes to Financial Statements.
Madison Funds | October 31, 2024
Financial Highlights for a Share of Beneficial Interest Outstanding - continued
| | | SUSTAINABLE EQUITY FUND | |
| | | CLASS Y | | | CLASS I | |
| | | Year Ended | | | Period Ended | | | Year Ended | | | Period Ended | |
| | | October 31, | | | October 31, | | | October 31, | | | October 31, | |
| | | 2024 | | | 2023 | | | 2022* | | | 2024 | | | 2023 | | | 2022* | |
| Net Asset Value at beginning of period | | $ | 8.58 | | | $ | 8.21 | | | $ | 10.00 | | | $ | 8.59 | | | $ | 8.22 | | | $ | 10.00 | |
| Income from Investment Operations: | | | | | | | | | | | | | | | | | | | | | | | | |
| Net investment income | | | 0.06 | 1 | | | 0.07 | | | | 0.03 | | | | 0.08 | 1 | | | 0.09 | | | | 0.03 | |
| Net realized and unrealized gain (loss) on investments | | | 2.63 | | | | 0.34 | | | | (1.82 | ) | | | 2.61 | | | | 0.33 | | | | (1.81 | ) |
| Total from investment operations | | | 2.69 | | | | 0.41 | | | | (1.79 | ) | | | 2.69 | | | | 0.42 | | | | (1.78 | ) |
| Less Distributions From: | | | | | | | | | | | | | | | | | | | | | | | | |
| Net investment income | | | (0.08 | ) | | | (0.04 | ) | | | – | | | | (0.10 | ) | | | (0.05 | ) | | | – | |
| Total distributions | | | (0.08 | ) | | | (0.04 | ) | | | – | | | | (0.10 | ) | | | (0.05 | ) | | | – | |
| Net increase (decrease) in net asset value | | | 2.61 | | | | 0.37 | | | | (1.79 | ) | | | 2.59 | | | | 0.37 | | | | (1.78 | ) |
| Net Asset Value at end of period | | $ | 11.19 | | | $ | 8.58 | | | $ | 8.21 | | | $ | 11.18 | | | $ | 8.59 | | | $ | 8.22 | |
| Total Return (%)2 | | | 31.51 | | | | 5.00 | | | | (17.90 | )3 | | | 31.50 | | | | 5.10 | | | | (17.80 | )3 |
| Ratios/Supplemental Data: | | | | | | | | | | | | | | | | | | | | | | | | |
| Net Assets at end of period (in 000’s) | | $ | 153 | | | $ | 101 | | | $ | 82 | | | $ | 9,730 | | | $ | 7,958 | | | $ | 9,198 | |
| Ratios of expenses to average net assets (%) | | | 0.91 | | | | 0.91 | | | | 0.89 | 4 | | | 0.81 | | | | 0.81 | | | | 0.81 | 4 |
| Ratio of net investment income (loss) to average net assets (%) | | | 0.61 | | | | 0.82 | | | | 0.46 | 4 | | | 0.73 | | | | 0.93 | | | | 0.60 | 4 |
| Portfolio turnover (%)5 | | | 33 | | | | 34 | | | | 12 | 3 | | | 33 | | | | 34 | | | | 12 | 3 |
| * | The Sustainable Equity Fund was launched on December 31, 2021 and commenced operations effective January 3, 2022. |
| 1 | Per share amounts have been calculated using the average shares method. |
| 2 | Total return without applicable sales charge. |
| 5 | Portfolio turnover is calculated at the fund level and represents the entire fiscal year or period. |
See accompanying Notes to Financial Statements.
Madison Funds | October 31, 2024
Financial Highlights for a Share of Beneficial Interest Outstanding - continued
| | | MID CAP FUND | |
| | | CLASS A | |
| | | Year Ended October 31, | |
| | | 2024 | | | 2023 | | | 2022 | | | 2021 | | | 2020 | |
| Net Asset Value at beginning of period | | $ | 12.66 | | | $ | 11.68 | | | $ | 13.68 | | | $ | 10.26 | | | $ | 11.09 | |
| Income from Investment Operations: | | | | | | | | | | | | | | | | | | | | |
| Net investment loss | | | (0.01 | )1 | | | (0.04 | ) | | | (0.09 | ) | | | (0.07 | ) | | | (0.08 | )2 |
| Net realized and unrealized gain (loss) on investments | | | 3.21 | | | | 1.27 | | | | (1.27 | ) | | | 3.91 | | | | (0.32 | ) |
| Total from investment operations | | | 3.20 | | | | 1.23 | | | | (1.36 | ) | | | 3.84 | | | | (0.40 | ) |
| Less Distributions From: | | | | | | | | | | | | | | | | | | | | |
| Capital gains | | | (0.17 | ) | | | (0.25 | ) | | | (0.64 | ) | | | (0.42 | ) | | | (0.43 | ) |
| Total distributions | | | (0.17 | ) | | | (0.25 | ) | | | (0.64 | ) | | | (0.42 | ) | | | (0.43 | ) |
| Net increase (decrease) in net asset value | | | 3.03 | | | | 0.98 | | | | (2.00 | ) | | | 3.42 | | | | (0.83 | ) |
| Net Asset Value at end of period | | $ | 15.69 | | | $ | 12.66 | | | $ | 11.68 | | | $ | 13.68 | | | $ | 10.26 | |
| Total Return (%)3 | | | 25.43 | | | | 10.68 | | | | (10.62 | ) | | | 38.24 | | | | (3.81 | ) |
| Ratios/Supplemental Data: | | | | | | | | | | | | | | | | | | | | |
| Net Assets at end of period (in 000’s) | | $ | 88,044 | | | $ | 66,717 | | | $ | 63,417 | | | $ | 76,625 | | | $ | 58,782 | |
| Ratios of expenses to average net assets (%) | | | 1.36 | | | | 1.39 | | | | 1.40 | | | | 1.39 | | | | 1.40 | |
| Ratio of net investment income loss to average net assets (%) | | | (0.08 | ) | | | (0.25 | ) | | | (0.59 | ) | | | (0.50 | ) | | | (0.64 | ) |
| Portfolio turnover (%)4 | | | 16 | | | | 10 | | | | 24 | | | | 24 | | | | 24 | |
| 1 | Per share amounts have been calculated using the average shares method. |
| 2 | Net investment income (loss) calculated excluding permanent tax adjustments to undistributed net investment income. |
| 3 | Total return without applicable sales charge. |
| 4 | Portfolio turnover is calculated at the fund level and represents the entire fiscal year or period. |
| | | MID CAP FUND | |
| | | CLASS Y | |
| | | Year Ended October 31, | |
| | | 2024 | | | 2023 | | | 2022 | | | 2021 | | | 2020 | |
| Net Asset Value at beginning of period | | $ | 13.72 | | | $ | 12.58 | | | $ | 14.62 | | | $ | 10.89 | | | $ | 11.71 | |
| Income from Investment Operations: | | | | | | | | | | | | | | | | | | | | |
| Net investment income (loss) | | | 0.06 | 1 | | | 0.03 | | | | (0.03 | ) | | | 0.02 | | | | (0.03 | )2 |
| Net realized and unrealized gain (loss) on investments | | | 3.48 | | | | 1.36 | | | | (1.37 | ) | | | 4.13 | | | | (0.36 | ) |
| Total from investment operations | | | 3.54 | | | | 1.39 | | | | (1.40 | ) | | | 4.15 | | | | (0.39 | ) |
| Less Distributions From: | | | | | | | | | | | | | | | | | | | | |
| Net Investment Income | | | (0.02 | ) | | | – | | | | (0.00 | )3 | | | – | | | | (0.00 | )3 |
| Capital gains | | | (0.17 | ) | | | (0.25 | ) | | | (0.64 | ) | | | (0.42 | ) | | | (0.43 | ) |
| Total distributions | | | (0.19 | ) | | | (0.25 | ) | | | (0.64 | ) | | | (0.42 | ) | | | (0.43 | ) |
| Net increase (decrease) in net asset value | | | 3.35 | | | | 1.14 | | | | (2.04 | ) | | | 3.73 | | | | (0.82 | ) |
| Net Asset Value at end of period | | $ | 17.07 | | | $ | 13.72 | | | $ | 12.58 | | | $ | 14.62 | | | $ | 10.89 | |
| Total Return (%)4 | | | 25.97 | | | | 11.20 | | | | (10.17 | ) | | | 38.89 | | | | (3.52 | ) |
| Ratios/Supplemental Data: | | | | | | | | | | | | | | | | | | | | |
| Net Assets at end of period (in 000’s) | | $ | 479,998 | | | $ | 260,474 | | | $ | 253,477 | | | $ | 263,892 | | | $ | 323,841 | |
| Ratios of expenses to average net assets (%) | | | 0.91 | | | | 0.94 | | | | 0.95 | | | | 0.95 | | | | 0.97 | |
| Ratio of net investment income (loss) to average net | | | | | | | | | | | | | | | | | | | | |
| assets (%) | | | 0.34 | | | | 0.20 | | | | (0.14 | ) | | | (0.04 | ) | | | (0.20 | ) |
| Portfolio turnover (%)5 | | | 16 | | | | 10 | | | | 24 | | | | 24 | | | | 24 | |
| 1 | Per share amounts have been calculated using the average shares method. |
| 2 | Net investment income (loss) calculated excluding permanent tax adjustments to undistributed net investment income. |
| 3 | Amounts represent less than $ (0.005) per share. |
| 4 | Total return without applicable sales charge. |
| 5 | Portfolio turnover is calculated at the fund level and represents the entire fiscal year or period. |
See accompanying Notes to Financial Statements.
Madison Funds | October 31, 2024
Financial Highlights for a Share of Beneficial Interest Outstanding - continued
| | | MID CAP FUND | |
| | | CLASS I | |
| | | | | | Period Ended | |
| | | Year Ended October 31, | | | October 31, | |
| | | 2024 | | | 2023 | | | 2022 | | | 2021 | | | 2020* | |
| Net Asset Value at beginning of period | | $ | 13.75 | | | $ | 12.60 | | | $ | 14.64 | | | $ | 10.90 | | | $ | 11.21 | |
| Income from Investment Operations: | | | | | | | | | | | | | | | | | | | | |
| Net investment income (loss) | | | 0.07 | 1 | | | 0.04 | | | | 0.00 | 2 | | | (0.03 | ) | | | (0.01 | )3 |
| Net realized and unrealized gain (loss) on investments | | | 3.49 | | | | 1.36 | | | | (1.38 | ) | | | 4.19 | | | | (0.30 | ) |
| Total from investment operations | | | 3.56 | | | | 1.40 | | | | (1.38 | ) | | | 4.16 | | | | (0.31 | ) |
| Less Distributions From: | | | | | | | | | | | | | | | | | | | | |
| Net Investment Income | | | (0.03 | ) | | | – | | | | (0.02 | ) | | | (0.00 | )2 | | | – | |
| Capital gains | | | (0.17 | ) | | | (0.25 | ) | | | (0.64 | ) | | | (0.42 | ) | | | – | |
| Total distributions | | | (0.20 | ) | | | (0.25 | ) | | | (0.66 | ) | | | (0.42 | ) | | | – | |
| Net increase (decrease) in net asset value | | | 3.36 | | | | 1.15 | | | | (2.04 | ) | | | 3.74 | | | | (0.31 | ) |
| Net Asset Value at end of period | | $ | 17.11 | | | $ | 13.75 | | | $ | 12.60 | | | $ | 14.64 | | | $ | 10.90 | |
| Total Return (%)4 | | | 26.09 | | | | 11.26 | | | | (10.08 | ) | | | 39.01 | | | | (2.77 | )5 |
| Ratios/Supplemental Data: | | | | | | | | | | | | | | | | | | | | |
| Net Assets at end of period (in 000’s) | | $ | 987,984 | | | $ | 376,668 | | | $ | 274,918 | | | $ | 286,235 | | | $ | 61,805 | |
| Ratios of expenses to average net assets (%) | | | 0.81 | | | | 0.84 | | | | 0.85 | | | | 0.85 | | | | 0.86 | 6 |
| Ratio of net investment income to average net assets (%) | | | 0.41 | | | | 0.28 | | | | (0.04 | ) | | | (0.01 | ) | | | (0.43 | )6 |
| Portfolio turnover (%)7 | | | 16 | | | | 10 | | | | 24 | | | | 24 | | | | 24 | 5 |
| * | Class I shares commenced operations effective September 1, 2020. |
| 1 | Per share amounts have been calculated using the average shares method. |
| 2 | Amounts represent less than $0.005 per share. |
| 3 | Net investment income (loss) calculated excluding permanent tax adjustments to undistributed net investment income. |
| 4 | Total return without applicable sales charge. |
| 7 | Portfolio turnover is calculated at the fund level and represents the entire fiscal year or period. |
| | | MID CAP FUND | |
| | | CLASS R6 | |
| | | Year Ended October 31, | |
| | | 2024 | | | 2023 | | | 2022 | | | 2021 | | | 2020 | |
| Net Asset Value at beginning of period | | $ | 14.15 | | | $ | 12.94 | | | $ | 15.04 | | | $ | 11.19 | | | $ | 11.99 | |
| Income from Investment Operations: | | | | | | | | | | | | | | | | | | | | |
| Net investment income (loss) | | | 0.08 | 1 | | | 0.04 | | | | 0.01 | | | | 0.02 | | | | (0.02 | )2 |
| Net realized and unrealized gain (loss) on investments | | | 3.60 | | | | 1.42 | | | | (1.43 | ) | | | 4.27 | | | | (0.35 | ) |
| Total from investment operations | | | 3.68 | | | | 1.46 | | | | (1.42 | ) | | | 4.29 | | | | (0.37 | ) |
| Less Distributions From: | | | | | | | | | | | | | | | | | | | | |
| Net Investment Income | | | (0.06 | ) | | | – | | | | (0.04 | ) | | | (0.02 | ) | | | (0.00 | )3 |
| Capital gains | | | (0.17 | ) | | | (0.25 | ) | | | (0.64 | ) | | | (0.42 | ) | | | (0.43 | ) |
| Total distributions | | | (0.23 | ) | | | (0.25 | ) | | | (0.68 | ) | | | (0.44 | ) | | | (0.43 | ) |
| Net increase (decrease) in net asset value | | | 3.45 | | | | 1.21 | | | | (2.10 | ) | | | 3.85 | | | | (0.80 | ) |
| Net Asset Value at end of period | | $ | 17.60 | | | $ | 14.15 | | | $ | 12.94 | | | $ | 15.04 | | | $ | 11.19 | |
| Total Return (%)4 | | | 26.18 | | | | 11.43 | | | | (10.07 | ) | | | 39.20 | | | | (3.26 | ) |
| Ratios/Supplemental Data: | | | | | | | | | | | | | | | | | | | | |
| Net Assets at end of period (in 000’s) | | $ | 329,471 | | | $ | 114,320 | | | $ | 88,723 | | | $ | 105,878 | | | $ | 91,562 | |
| Ratios of expenses to average net assets (%) | | | 0.73 | | | | 0.76 | | | | 0.77 | | | | 0.77 | | | | 0.77 | |
| Ratio of net investment income to average net assets (%) | | | 0.48 | | | | 0.37 | | | | 0.05 | | | | 0.14 | | | | (0.03 | ) |
| Portfolio turnover (%)5 | | | 16 | | | | 10 | | | | 24 | | | | 24 | | | | 24 | |
| 1 | Per share amounts have been calculated using the average shares method. |
| 2 | Net investment income (loss) calculated excluding permanent tax adjustments to undistributed net investment income. |
| 3 | Amounts represent less than $0.005 per share. |
| 4 | Total return without applicable sales charge. |
| 5 | Portfolio turnover is calculated at the fund level and represents the entire fiscal year or period. |
See accompanying Notes to Financial Statements.
Madison Funds | October 31, 2024
Financial Highlights for a Share of Beneficial Interest Outstanding - continued
| | | SMALL CAP FUND | |
| | | CLASS A | |
| | | Year Ended October 31, | |
| | | 2024 | | | 2023 | | | 2022 | | | 2021 | | | 2020 | |
| Net Asset Value at beginning of period | | $ | 8.56 | | | $ | 9.22 | | | $ | 15.55 | | | $ | 11.04 | | | $ | 11.14 | |
| Income from Investment Operations: | | | | | | | | | | | | | | | | | | | | |
| Net investment (loss) | | | (0.03 | )1 | | | (0.04 | ) | | | (0.05 | ) | | | (0.09 | ) | | | (0.02 | )2 |
| Net realized and unrealized gain (loss) on investments | | | 3.25 | | | | (0.14 | ) | | | (2.81 | ) | | | 5.46 | | | | 0.36 | |
| Total from investment operations | | | 3.22 | | | | (0.18 | ) | | | (2.86 | ) | | | 5.37 | | | | 0.34 | |
| Less Distributions From: | | | | | | | | | | | | | | | | | | | | |
| Capital gains | | | (0.03 | ) | | | (0.48 | ) | | | (3.47 | ) | | | (0.86 | ) | | | (0.44 | ) |
| Total distributions | | | (0.03 | ) | | | (0.48 | ) | | | (3.47 | ) | | | (0.86 | ) | | | (0.44 | ) |
| Net increase (decrease) in net asset value | | | 3.19 | | | | (0.66 | ) | | | (6.33 | ) | | | 4.51 | | | | (0.10 | ) |
| Net Asset Value at end of period | | $ | 11.75 | | | $ | 8.56 | | | $ | 9.22 | | | $ | 15.55 | | | $ | 11.04 | |
| Total Return (%)3 | | | 37.67 | | | | (1.94 | ) | | | (23.74 | ) | | | 50.17 | | | | 3.02 | |
| Ratios/Supplemental Data: | | | | | | | | | | | | | | | | | | | | |
| Net Assets at end of period (in 000’s) | | $ | 4,014 | | | $ | 3,275 | | | $ | 3,417 | | | $ | 4,847 | | | $ | 2,958 | |
| Ratios of expenses to average net assets: | | | | | | | | | | | | | | | | | | | | |
| Before reimbursement of expenses by Adviser (%) | | | 1.35 | | | | 1.35 | | | | 1.35 | | | | 1.39 | | | | 1.51 | |
| After reimbursement of expenses by Adviser (%) | | | 1.35 | | | | 1.35 | | | | 1.35 | | | | 1.38 | | | | 1.47 | |
| Ratio of net investment income to average net assets | | | | | | | | | | | | | | | | | | | | |
| Before reimbursement of expenses by Adviser (%) | | | (0.25 | ) | | | (0.42 | ) | | | (0.52 | ) | | | (0.67 | ) | | | (0.18 | ) |
| After reimbursement of expenses by Adviser (%) | | | (0.25 | ) | | | (0.42 | ) | | | (0.52 | ) | | | (0.66 | ) | | | (0.14 | ) |
| Portfolio turnover (%)4 | | | 39 | | | | 39 | | | | 41 | | | | 44 | | | | 47 | |
| 1 | Per share amounts have been calculated using the average shares method. |
| 2 | Net investment income (loss) calculated excluding permanent tax adjustments to undistributed net investment income. |
| 3 | Total return without applicable sales charge. |
| 4 | Portfolio turnover is calculated at the fund level and is not annualized for periods less than one year. |
| | | SMALL CAP FUND | |
| | | CLASS Y | |
| | | Year Ended October 31, | |
| | | 2024 | | | 2023 | | | 2022 | | | 2021 | | | 2020 | |
| Net Asset Value at beginning of period | | $ | 8.71 | | | $ | 9.35 | | | $ | 15.69 | | | $ | 11.11 | | | $ | 11.19 | |
| Income from Investment Operations: | | | | | | | | | | | | | | | | | | | | |
| Net investment income (loss) | | | 0.00 | 1,2 | | | (0.02 | ) | | | (0.03 | ) | | | (0.07 | ) | | | 0.02 | 3 |
| Net realized and unrealized gain (loss) on investments | | | 3.31 | | | | (0.14 | ) | | | (2.84 | ) | | | 5.51 | | | | 0.35 | |
| Total from investment operations | | | 3.31 | | | | (0.16 | ) | | | (2.87 | ) | | | 5.44 | | | | 0.37 | |
| Less Distributions From: | | | | | | | | | | | | | | | | | | | | |
| Net investment income | | | – | | | | – | | | | (0.00 | )2 | | | – | | | | (0.01 | ) |
| Capital gains | | | (0.03 | ) | | | (0.48 | ) | | | (3.47 | ) | | | (0.86 | ) | | | (0.44 | ) |
| Total distributions | | | (0.03 | ) | | | (0.48 | ) | | | (3.47 | ) | | | (0.86 | ) | | | (0.45 | ) |
| Net increase (decrease) in net asset value | | | 3.28 | | | | (0.64 | ) | | | (6.34 | ) | | | 4.58 | | | | (0.08 | ) |
| Net Asset Value at end of period | | $ | 11.99 | | | $ | 8.71 | | | $ | 9.35 | | | $ | 15.69 | | | $ | 11.11 | |
| Total Return (%)4 | | | 38.06 | | | | (1.69 | ) | | | (23.55 | ) | | | 50.50 | | | | 3.27 | |
| Ratios/Supplemental Data: | | | | | | | | | | | | | | | | | | | | |
| Net Assets at end of period (in 000’s) | | $ | 168,664 | | | $ | 143,591 | | | $ | 166,238 | | | $ | 253,625 | | | $ | 215,890 | |
| Ratios of expenses to average net assets: | | | | | | | | | | | | | | | | | | | | |
| Before reimbursement of expenses by Adviser (%) | | | 1.10 | | | | 1.10 | | | | 1.10 | | | | 1.15 | | | | 1.26 | |
| After reimbursement of expenses by Adviser (%) | | | 1.10 | | | | 1.10 | | | | 1.10 | | | | 1.14 | | | | 1.22 | |
| Ratio of net investment income to average net assets | | | | | | | | | | | | | | | | | | | | |
| Before reimbursement of expenses by Adviser (%) | | | 0.005 | | | | (0.17 | ) | | | (0.27 | ) | | | (0.42 | ) | | | 0.08 | |
| After reimbursement of expenses by Adviser (%) | | | 0.005 | | | | (0.17 | ) | | | (0.27 | ) | | | (0.40 | ) | | | 0.12 | |
| Portfolio turnover (%)6 | | | 39 | | | | 39 | | | | 41 | | | | 44 | | | | 47 | |
| 1 | Per share amounts have been calculated using the average shares method. |
| 2 | Amounts represent less than $0.005 or $ (0.005) per share. |
| 3 | Net investment income (loss) calculated excluding permanent tax adjustments to undistributed net investment income. |
| 4 | Total return without applicable sales charge. |
| 5 | Amounts represent less than 0.005%. |
| 6 | Portfolio turnover is calculated at the fund level and represents the entire fiscal year or period. |
See accompanying Notes to Financial Statements.
Madison Funds | October 31, 2024
Financial Highlights for a Share of Beneficial Interest Outstanding - continued
| | | SMALL CAP FUND | |
| | | CLASS I | |
| | | | | | | | | | | | Period Ended | |
| | | Year Ended October 31, | | | October 31, | |
| | | 2024 | | | 2023 | | | 2022 | | | 2020* | |
| Net Asset Value at beginning of period | | $ | 8.72 | | | $ | 9.36 | | | $ | 15.70 | | | $ | 14.41 | |
| Income from Investment Operations: | | | | | | | | | | | | | | | | |
| Net investment income (loss) | | | 0.01 | 1 | | | (0.01 | ) | | | (0.02 | ) | | | (0.03 | ) |
| Net realized and unrealized gain (loss) on investments | | | 3.32 | | | | (0.15 | ) | | | (2.83 | ) | | | 1.32 | |
| Total from investment operations | | | 3.33 | | | | (0.16 | ) | | | (2.85 | ) | | | 1.29 | |
| Less Distributions From: | | | | | | | | | | | | | | | | |
| Net investment income | | | – | | | | – | | | | (0.02 | ) | | | – | |
| Capital gains | | | (0.03 | ) | | | (0.48 | ) | | | (3.47 | ) | | | – | |
| Total distributions | | | (0.03 | ) | | | (0.48 | ) | | | (3.49 | ) | | | – | |
| Net increase (decrease) in net asset value | | | 3.30 | | | | (0.64 | ) | | | (6.34 | ) | | | 1.29 | |
| Net Asset Value at end of period | | $ | 12.02 | | | $ | 8.72 | | | $ | 9.36 | | | $ | 15.70 | |
| Total Return (%)2 | | | 38.24 | | | | (1.58 | ) | | | (23.52 | ) | | | 8.95 | 3 |
| Ratios/Supplemental Data: | | | | | | | | | | | | | | | | |
| Net Assets at end of period (in 000’s) | | $ | 14,828 | | | $ | 11,925 | | | $ | 13,863 | | | $ | 21,868 | |
| Ratio of expenses to average net assets (%) | | | 1.00 | | | | 1.00 | | | | 1.00 | | | | 1.00 | 4 |
| Ratio of net investment income to average net assets (%) | | | 0.10 | | | | (0.07 | ) | | | (0.16 | ) | | | (0.36 | )4 |
| Portfolio turnover (%)5 | | | 39 | | | | 39 | | | | 41 | | | | 44 | 3 |
| * | Class I shares commenced operations effective March 1, 2021. |
| 1 | Per share amounts have been calculated using the average shares method. |
| 2 | Total return without applicable sales charge. |
| 5 | Portfolio turnover is calculated at the fund level and represents the entire fiscal year or period. |
| | | SMALL CAP FUND | |
| | | CLASS R6 | |
| | | | | | Period Ended | |
| | | Year Ended October 31, | | | October 31, | |
| | | 2024 | | | 2023 | | | 2022* | |
| Net Asset Value at beginning of period | | $ | 8.74 | | | $ | 9.36 | | | $ | 11.30 | |
| Income from Investment Operations: | | | | | | | | | | | | |
| Net investment income (loss) | | | 0.02 | 1 | | | – | | | | (0.00 | )2 |
| Net realized and unrealized gain (loss) on investments | | | 3.32 | | | | (0.14 | ) | | | (1.94 | ) |
| Total from investment operations | | | 3.34 | | | | (0.14 | ) | | | (1.94 | ) |
| Less Distributions From: | | | | | | | | | | | | |
| Capital gains | | | (0.03 | ) | | | (0.48 | ) | | | – | |
| Total distributions | | | (0.03 | ) | | | (0.48 | ) | | | – | |
| Net increase (decrease) in net asset value | | | 3.31 | | | | (0.62 | ) | | | (1.94 | ) |
| Net Asset Value at end of period | | $ | 12.05 | | | $ | 8.74 | | | $ | 9.36 | |
| Total Return (%)3 | | | 38.27 | | | | (1.46 | ) | | | (17.17 | )4 |
| Ratios/Supplemental Data: | | | | | | | | | | | | |
| Net Assets at end of period (in 000’s) | | $ | 498 | | | $ | 220 | | | $ | 161 | |
| Ratios of expenses to average net assets (%) | | | 0.92 | | | | 0.92 | | | | 0.92 | 5 |
| Ratio of net investment income to average net assets (%) | | | 0.16 | | | | (0.01 | ) | | | (0.06 | )5 |
| Portfolio turnover (%)6 | | | 39 | | | | 39 | | | | 41 | 4 |
| * | Class R6 shares commenced operations effective March 1, 2022. |
| 1 | Per share amounts have been calculated using the average shares method. |
| 2 | Amounts represent less than $(0.005) per share. |
| 3 | Total return without applicable sales charge. |
| 6 | Portfolio turnover is calculated at the fund level and represents the entire fiscal year or period. |
See accompanying Notes to Financial Statements.
Madison Funds | October 31, 2024
Financial Highlights for a Share of Beneficial Interest Outstanding - concluded
| | | INTERNATIONAL STOCK FUND | |
| | | CLASS A | | | CLASS Y | |
| | | Year Ended October 31, | | | Year Ended October 31, | |
| | | 2024 | | | 2023 | | | 2022 | | | 2021 | | | 2020 | | | 2024 | | | 2023 | | | 2022 | | | 2021 | | | 2020 | |
| Net Asset Value at beginning of period | | $ | 7.93 | | | $ | 7.34 | | | $ | 13.67 | | | $ | 11.83 | | | $ | 13.53 | | | $ | 7.87 | | | $ | 7.28 | | | $ | 13.64 | | | $ | 11.83 | | | $ | 13.57 | |
| Income from Investment Operations: | | | | | | | | | | | | | | | | | | | | | | | | | | | | | | | | | | | | | | | | |
| Net investment income (loss) | | | 0.03 | 1 | | | 0.01 | | | | 0.08 | | | | 0.07 | | | | 0.06 | 2 | | | 0.05 | 1 | | | 0.41 | | | | (1.21 | ) | | | 0.41 | | | | 1.30 | 2 |
| Net realized and unrealized gain (loss) on investments | | | 1.44 | | | | 0.60 | | | | (2.78 | ) | | | 2.35 | | | | (0.89 | ) | | | 1.43 | | | | 0.22 | | | | (1.46 | ) | | | 2.05 | | | | (2.10 | ) |
| Total from investment operations | | | 1.47 | | | | 0.61 | | | | (2.70 | ) | | | 2.42 | | | | (0.83 | ) | | | 1.48 | | | | 0.63 | | | | (2.67 | ) | | | 2.46 | | | | (0.80 | ) |
| Less Distributions From: | | | | | | | | | | | | | | | | | | | | | | | | | | | | | | | | | | | | | | | | |
| Net investment income | | | (0.03 | ) | | | (0.02 | ) | | | (0.07 | ) | | | (0.06 | ) | | | (0.19 | ) | | | (0.05 | ) | | | (0.04 | ) | | | (0.13 | ) | | | (0.13 | ) | | | (0.26 | ) |
| Capital gains | | | – | | | | – | | | | (3.56 | ) | | | (0.52 | ) | | | (0.68 | ) | | | – | | | | – | | | | (3.56 | ) | | | (0.52 | ) | | | (0.68 | ) |
| Total distributions | | | (0.03 | ) | | | (0.02 | ) | | | (3.63 | ) | | | (0.58 | ) | | | (0.87 | ) | | | (0.05 | ) | | | (0.04 | ) | | | (3.69 | ) | | | (0.65 | ) | | | (0.94 | ) |
| Net increase (decrease) in net asset value | | | 1.44 | | | | 0.59 | | | | (6.33 | ) | | | 1.84 | | | | (1.70 | ) | | | 1.43 | | | | 0.59 | | | | (6.36 | ) | | | 1.81 | | | | (1.74 | ) |
| Net Asset Value at end of period | | $ | 9.37 | | | $ | 7.93 | | | $ | 7.34 | | | $ | 13.67 | | | $ | 11.83 | | | $ | 9.30 | | | $ | 7.87 | | | $ | 7.28 | | | $ | 13.64 | | | $ | 11.83 | |
| Total Return (%)3 | | | 18.51 | | | | 8.34 | | | | (26.52 | ) | | | 20.48 | | | | (6.78 | ) | | | 18.82 | | | | 8.68 | | | | (26.39 | ) | | | 20.83 | | | | (6.58 | ) |
| Ratios/Supplemental Data: | | | | | | | | | | | | | | | | | | | | | | | | | | | | | | | | | | | | | | | | |
| Net Assets at end of period (in 000’s) | | $ | 11,514 | | | $ | 11,104 | | | $ | 10,896 | | | $ | 16,375 | | | $ | 14,602 | | | $ | 608 | | | $ | 645 | | | $ | 666 | | | $ | 888 | | | $ | 823 | |
| Ratios of expenses to average net assets (%) | | | 1.61 | | | | 1.61 | | | | 1.61 | | | | 1.61 | | | | 1.60 | | | | 1.36 | | | | 1.36 | | | | 1.36 | | | | 1.36 | | | | 1.36 | |
| Ratio of net investment income to average net assets (%) | | | 0.27 | | | | 0.31 | | | | 0.30 | | | | 0.53 | | | | 0.50 | | | | 0.49 | | | | 0.57 | | | | 0.55 | | | | 0.79 | | | | 0.73 | |
| Portfolio turnover (%)4 | | | 20 | | | | 22 | | | | 31 | | | | 120 | | | | 34 | | | | 20 | | | | 22 | | | | 31 | | | | 120 | | | | 34 | |
| 1 | Per share amounts have been calculated using the average shares method. |
| 2 | Net investment income (loss) calculated excluding permanent tax adjustments to undistributed net investment income. |
| 3 | Total return without applicable sales charge. |
| 4 | Portfolio turnover is calculated at the fund level and represents the entire fiscal year or period. |
See accompanying Notes to Financial Statements.
Madison Funds | October 31, 2024
Notes to the Financial Statements
1. ORGANIZATION
Madison Funds, a Delaware statutory trust (the “Trust”), is registered under the Investment Company Act of 1940, as amended (the “1940 Act”), as a diversified, open-end management investment company. As of the date of this report, the Trust offers the following funds (individually, a “Fund,” collectively, the “Funds”), with the share classes listed:
| Fund | | Share Class(es) Offered1 |
| Conservative Allocation1 | | Class A, Class C |
| Moderate Allocation1 | | Class A, Class C |
| Aggressive Allocation1 | | Class A, Class C |
| Diversified Income1 | | Class A, Class C |
| Tax-Free Virginia | | Class Y |
| Tax-Free National | | Class Y |
| High Quality Bond | | Class Y, Class I |
| Core Bond | | Class A, Class Y, Class I, Class R6 |
| Covered Call & Equity Income | | Class A, Class C, Class Y, Class I, Class R6 |
| Dividend Income | | Class A, Class Y, Class I, Class R6 |
| Investors | | Class A, Class Y, Class I, Class R6 |
| Sustainable Equity | | Class Y, Class I |
| Mid Cap | | Class A, Class Y, Class I, Class R6 |
| Small Cap | | Class A, Class Y, Class I, Class R6 |
| International Stock | | Class A, Class Y |
| 1 | The Conservative Allocation, Moderate Allocation, Aggressive Allocation and Diversified Income Funds are collectively referred to herein as the “Allocation Funds”. |
Each Class of shares represents an interest in the net assets of the respective fund and has identical voting, dividend, liquidation and other rights, except that each Class of shares bears its own distribution fees and servicing fees, if any, and its proportional share of fund level expenses; is subject to its own sales charge, if any; and has exclusive voting rights on matters pertaining to Rule 12b-1 of the 1940 Act as it relates to that Class or other Class-specific matters.
The Declaration of Trust permits the Trustees to issue an unlimited number of shares of beneficial interest of the Trust without par value. The Trust has entered into an Investment Advisory Agreement with Madison Asset Management, LLC (the “Investment Adviser” or “Madison”), the Funds’ investment adviser.
2. SIGNIFICANT ACCOUNTING POLICIES
The preparation of financial statements requires management to make estimates and assumptions that affect the reported amounts of assets and liabilities and disclosure of contingent assets and liabilities at the date of the financial statements and the reported amounts of income and expenses during the reported period. Actual results could differ from those estimates.
Each fund is an investment company and accordingly follows the investment company accounting and reporting guidance of the Financial Accounting Standards Board (FASB) Accounting Standard Codification Topic 946 “Financial Services—Investment Companies”.
The following is a summary of significant accounting policies consistently followed by each fund in the preparation of its financial statements.
Portfolio Valuation: Equity securities, including American Depositary Receipts (“ADRs”), Global Depository Receipts (“GDRs”) and Exchange-Traded Funds (“ETFs”) listed on any U.S. or foreign stock exchange or quoted on the National Association of Securities Dealers Automated Quotation System (“NASDAQ”) are valued at the last quoted sale price or official closing price on that exchange or NASDAQ on the valuation day (provided that, for securities traded on NASDAQ, the Funds utilize the NASDAQ Official Closing Price (“NOCP”)). If no sale occurs, equities traded on a U.S. exchange, foreign exchange or on NASDAQ are valued at the last available bid price. Debt securities purchased (other than short-term obligations) with a remaining maturity of 61 days or more are valued on the basis of last available bid prices or current market quotations provided by dealers or pricing services approved by the Trust. In determining the value of a particular investment, pricing services approved by the Trust may use certain information with respect to transactions in such investments, quotations from dealers, pricing matrixes, market transactions in comparable investments, various relationships observed in the market between investments and calculated yield measurements based on valuation technology commonly employed in the market for such investments.
Municipal debt securities are traded via a network of dealers and brokers that connect buyers and sellers. They are valued on the basis of last available bid prices or current market quotations provided by dealers or pricing services approved by the Trust. There may be little trading in the secondary market for particular bonds and other debt securities, making them more difficult to value or sell. Asset-backed and mortgage-backed securities are valued by independent pricing services using models that consider estimated cash flows of each tranche of the security, establish a benchmark yield and develop an estimated tranche specific spread to the benchmark yield based on the unique attributes of the tranche.
Investments in shares of open-end mutual funds, including money market funds, are valued at their daily net asset value (“NAV”) which is calculated as of the close of regular trading on the New York Stock Exchange (the “NYSE”), usually 4:00 p.m. Eastern Standard Time, on each day on which the NYSE is open for business. NAV per share is determined by dividing each fund’s total net assets by the number of shares of such fund outstanding at the time of calculation. Because the assets of each Allocation Fund consist primarily of shares of other registered investment companies (the “Underlying Funds”), the NAV of each fund is determined based on the NAVs of the Underlying Funds. Total net assets are determined by adding the total current value of portfolio securities, cash, receivables, and other assets and subtracting liabilities. Short-term instruments having maturities of 60 days or less are valued on an amortized cost basis, which approximates fair value.
Over-the-counter securities not listed or traded on NASDAQ are valued at the last sale price on the valuation day. If no sale occurs on the valuation day, an over-the-counter security is valued at the last bid price. Exchange-traded options are valued at the mean of the best bid and ask prices across all option exchanges. Over-the-counter options
Madison Funds | October 31, 2024
Notes to the Financial Statements - continued
are valued based upon prices provided by market makers in such securities or dealers in such currencies. Financial futures contracts generally are valued at the settlement price established by the exchange(s) on which the contracts are primarily traded. Spot and forward foreign currency exchange contracts are valued based on quotations supplied by dealers in such contracts. Overnight repurchase agreements are valued at cost, and term repurchase agreements (i.e., those whose maturity exceeds seven days), swaps, caps, collars and floors, if any, are valued at the average of the closing bids obtained daily from at least one dealer.
Through the end of this reporting period, the value of all assets and liabilities expressed in foreign currencies was converted into U.S. dollar values using the then-current exchange rate at the close of regular trading on the NYSE.
All other securities for which either quotations are not readily available, no other sales have occurred, or in the Investment Adviser’s opinion, do not reflect the current fair value, are appraised at their fair values as determined in good faith by the Investment Adviser’s Pricing Committee ( the “Committee”) and under the general supervision of the Board of Trustees. When fair market value pricing of securities is employed, the prices of securities used by the Funds to calculate NAV may differ from market quotations or NOCP. Because the Allocation Funds primarily invest in Underlying Funds, government securities and short-term paper, it is not anticipated that the Investment Adviser will need to “fair value” any of the investments of these funds. However, an Underlying Fund may need to “fair value” one or more of its investments, which may, in turn, require an Allocation Fund to do the same because of delays in obtaining the Underlying Fund’s NAV.
Rule 2a-5 under the 1940 Act (the “Valuation Rule”) establishes requirements for determining fair value in good faith, including related oversight and reporting requirements. The Valuation Rule also defines when market quotations are “readily available,” which is the threshold for determining whether a fund must fair value a security. Among other things, the Valuation Rule permits a board of trustees of a fund to designate a fund’s investment adviser as valuation designee to perform a fund’s fair value determinations subject to board oversight and certain reporting and other requirements intended to ensure that the board receives the information it needs to oversee a fund’s investment adviser fair value determinations. The Board has designated the Funds’ Investment Adviser as Valuation Designee and the Valuation Designee has delegated valuation decisions to the Committee
A Fund’s investments will be valued at fair value if, in the judgment of the Committee, an event impacting the value of an investment occurred between the closing time of a security’s primary market or exchange (for example, a foreign exchange or market) and a time the fund’s share price is calculated as of the close of regular trading on the NYSE. Significant events may include, but are not limited to, the following: (1) significant fluctuations in domestic markets, foreign markets or foreign currencies; (2) occurrences not directly tied to the securities markets such as natural disasters, armed conflicts or significant government actions; and (3) major announcements affecting a single issuer or an entire market or market sector. In responding to a significant event, the Committee would determine the fair value of affected securities considering factors including, but not limited to: fundamental analytical data relating to the investment; the nature and duration of any restrictions on the disposition of the investment; and the forces influencing the market(s) in which the investment is purchased or sold. In addition to the fair value decisions made by the Committee noted above, the Committee also engages an independent fair valuation service to adjust the valuations of foreign equity securities based on specific market-movement parameters established by the Committee and approved by the Board of Trustees. Such adjustments to the valuation of foreign securities are applied automatically upon market close if the parameters established are exceeded. A foreign security is also automatically fair valued if the exchange it is traded on is on holiday.
Recently Issued Accounting Pronouncements:
In June 2022, the FASB issued Accounting Standards Update (“ASU”) No. 2022-03, Fair Value Measurement (Topic 820); Fair Value Measurement of Equity Securities Subject to Contractual Sale Restrictions, which provides clarifying guidance that a contractual restriction on the sale of an equity security is not considered part of the unit of account of the equity security and, therefore, is not considered in measuring fair value. The ASU is effective for fiscal years beginning after December 15, 2023, and interim periods within those fiscal years. The Trust expects the ASU will not have a material impact on the Funds’ financial statements.
Security Transactions and Investment Income: Security transactions are accounted for on a trade date basis. Net realized gains or losses on sales are determined by the identified cost method. Net realized gain on investments in the Statements of Operations also includes realized gain distributions received from the underlying exchange-listed funds. Distributions of net realized gains are recorded on the Fund’s ex-distribution date. Dividend income is recorded on ex-dividend date, except that certain dividends from foreign securities may be recorded after the ex-dividend date based on when the Funds are informed of the dividend. Interest income is recorded on an accrual basis and is increased by the accretion of discount and decreased by the amortization of premium. Amortization and accretion are recorded on the effective yield method.
Expenses: Expenses that are directly related to one fund are charged directly to that fund. Other operating expenses are prorated to the funds on the basis of relative net assets. Class-specific expenses are borne by that class.
Share Classes: Income and realized and unrealized gains/losses are allocated to the respective classes on the basis of relative net assets.
Foreign Currency Transactions: The Funds’ books and records are maintained in U.S. dollars. Foreign currency-denominated transactions (i.e., fair value of investment securities, assets and liabilities, purchases and sales of investment securities, and income and expenses) are translated into U.S. dollars at the current rate of exchange. The Funds enter into contracts on the trade date to settle any securities transactions denominated in foreign currencies on behalf of the Funds at the spot rate at settlement.
Each Fund, except the Tax-Free Virginia and Tax-Free National Funds, may invest in foreign currency transactions. Such funds report certain foreign currency-related transactions as components of realized gains or losses for financial reporting purposes, whereas such components are treated as ordinary income for federal income tax purposes. Realized gains or losses associated with currency transactions are included in the Statements of Operations under the heading “Net realized gain (loss) on investments”. The International Stock Fund had net realized loss of $(611) related to foreign currency transactions.
The Funds do not isolate the portion of gains and losses on investments in securities that is due to changes in the foreign exchange rates from that which is due to change in market prices of securities. Such amounts are categorized as gain or loss on investments for financial reporting purposes.
Madison Funds | October 31, 2024
Notes to the Financial Statements - continued
Forward Foreign Currency Exchange Contracts: Each Fund, except the Tax-Free Virginia and Tax-Free National Funds, may purchase and sell forward foreign currency exchange contracts for defensive or hedging purposes. When entering into forward foreign currency exchange contracts, the Funds agree to receive or deliver a fixed quantity of foreign currency for an agreed-upon price on an agreed future date. These contracts are valued daily. The Funds’ net assets reflect unrealized gains or losses on the contracts as measured by the difference between the forward foreign currency exchange rates at the dates of entry into the contracts and the forward rates at the reporting date. The Funds realize a gain or a loss at the time the forward foreign currency exchange contracts are settled or closed out with an offsetting contract. Contracts are traded over-the-counter directly with a counterparty. Realized and unrealized gains and losses are included in the Statements of Operations. During the year ended October 31, 2024, none of the Funds had open forward foreign currency exchange contracts.
If a Fund enters into a forward foreign currency exchange contract to buy foreign currency for any purpose, a Fund will be required to place cash or other liquid assets in a segregated account with a fund’s custodian in an amount equal to the value of a fund’s total assets committed to the consummation of the forward contract. If the value of the securities in the segregated account declines, additional cash or securities will be placed in the segregated account so that the value of the account will equal the amount of a fund’s commitment with respect to the contract.
Cash Concentration: At times, the Funds maintain cash balances at financial institutions in excess of federally insured limits. The Funds monitor this credit risk and have not experienced any losses related to this risk.
Illiquid Securities: Each Fund currently limits investments in illiquid investments, as defined by Rule 22e-4 under the 1940 Act, to 15% of net assets at the time of purchase. An illiquid investment is generally defined as a security that a fund reasonably expects cannot be sold or disposed of in current market conditions in seven calendar days or less without the sale or disposition significantly changing the market value of the security. At October 31, 2024, there was one illiquid defaulted security, held in the Diversified Income Fund.
Delayed Delivery Securities: Each Fund may purchase securities on a when-issued or delayed delivery basis. “When-issued” refers to securities whose terms are available and for which a market exists, but that have not been issued. For when-issued or delayed delivery transactions, no payment is made until delivery date, which is typically longer than the normal course of settlement. When a fund enters into an agreement to purchase securities on a when-issued or delayed delivery basis, a fund may segregate cash or other liquid securities, of any type or maturity, equal in value to a fund’s commitment. Losses may arise due to changes in the fair value of the underlying securities, if the counterparty does not perform under the contract, or if the issuer does not issue the securities due to political, economic or other factors. As of October 31, 2024, none of the Funds had entered into such transactions.
Indemnifications: Under the Funds’ organizational documents, the Funds’ officers and Trustees are indemnified against certain liabilities arising out of the performance of their duties to the Funds. In the normal course of business, the Funds enter into contracts that contain a variety of representations and provide general indemnifications. The Funds’ maximum liability exposure under these arrangements is unknown, as future claims that have not yet occurred may be made against the Funds. However, based on experience, management expects the risk of loss to be remote.
3. FAIR VALUE MEASUREMENTS:
Each Fund has adopted FASB guidance on fair value measurements. Fair value is defined as the price that each fund would receive upon selling an investment in a timely transaction to an independent buyer in the principal or most advantageous market of the investment. A three-tier hierarchy is used to maximize the use of observable market data “inputs” and minimize the use of unobservable “inputs” and to establish classification of fair value measurements for disclosure purposes. Inputs refer broadly to the assumptions that market participants would use in pricing the asset or liability, including assumptions about risk (for example, the risk inherent in a particular valuation technique used to measure fair value including such a pricing model and/or the risk inherent in the inputs used in the valuation technique). Inputs may be observable or unobservable.
Observable inputs are inputs that reflect the assumptions market participants would use in pricing the asset or liability developed based on market data obtained from sources independent of the reporting entity. Unobservable inputs are inputs that reflect the reporting entity’s own assumptions about the assumptions market participants would use in pricing the asset or liability developed based on the best information available in the circumstances. The three-tier hierarchy of inputs is summarized in the three broad Levels listed below:
Level 1 - unadjusted quoted prices in active markets for identical investments
Level 2 - other significant observable inputs (including quoted prices for similar investments, interest rate volatilities, prepayment speeds, credit risk, benchmark yields, transactions, bids, offers, new issues, spreads, and other relationships observed in the markets among comparable securities, underlying equity of the issuer; and proprietary pricing models such as yield measures calculated using factors such as cash flows, financial or collateral performance, and other reference data, etc.)
Level 3 - significant unobservable inputs (including a fund’s own assumptions in determining the fair value of investments)
The valuation techniques used by the Funds to measure fair value for the year ended October 31, 2024 maximized the use of observable inputs and minimized the use of unobservable inputs. The Funds estimated the price that would have prevailed in a liquid market for an international equity security given information available at the time of valuation. As of October 31, 2024, none of the Funds held securities deemed as a Level 3, and there were no transfers between classification levels.
Madison Funds | October 31, 2024
Notes to the Financial Statements - continued
The following is a summary of the inputs used as of October 31, 2024, in valuing the Funds’ investments carried at fair value (please see the Portfolio of Investments for each fund for a listing of all securities within each category):
| | | | | | | | | | | | Value at | |
| Fund1 | | Level 1 | | | Level 2 | | | Level 3 | | | 10/31/24 | |
| Conservative Allocation | | | | | | | | | | | | | | | | |
| Exchange Traded Funds | | $ | 22,562,263 | | | $ | — | | | $ | — | | | $ | 22,562,263 | |
| Investment Companies | | | 19,769,685 | | | | — | | | | — | | | | 19,769,685 | |
| Short-Term Investments | | | 3,413,025 | | | | — | | | | — | | | | 3,413,025 | |
| | | | 45,744,973 | | | | — | | | | — | | | | 45,744,973 | |
| Moderate Allocation | | | | | | | | | | | | | | | | |
| Exchange Traded Funds | | | 56,795,649 | | | | — | | | | — | | | | 56,795,649 | |
| Investment Companies | | | 34,941,366 | | | | — | | | | — | | | | 34,941,366 | |
| Short-Term Investments | | | 5,917,766 | | | | — | | | | — | | | | 5,917,766 | |
| | | | 97,654,781 | | | | — | | | | — | | | | 97,654,781 | |
| Aggressive Allocation | | | | | | | | | | | | | | | | |
| Exchange Traded Funds | | | 37,344,721 | | | | — | | | | — | | | | 37,344,721 | |
| Investment Companies | | | 15,806,344 | | | | — | | | | — | | | | 15,806,344 | |
| Short-Term Investments | | | 5,299,893 | | | | — | | | | — | | | | 5,299,893 | |
| | | | 58,450,958 | | | | — | | | | — | | | | 58,450,958 | |
| Diversified Income | | | | | | | | | | | | | | | | |
| Collateralized Mortgage Obligations | | | — | | | | 326 | | | | — | | | | 326 | |
| Mortgage Backed Securities | | | — | | | | 8,374 | | | | — | | | | 8,374 | |
| Exchange Traded Funds | | | 133,803,113 | | | | — | | | | — | | | | 133,803,113 | |
| Short-Term Investments | | | 5,455,526 | | | | — | | | | — | | | | 5,455,526 | |
| | | | 139,258,639 | | | | 8,700 | | | | — | | | | 139,267,339 | |
| Tax-Free Virginia | | | | | | | | | | | | | | | | |
| Municipal Bonds | | | — | | | | 16,504,027 | | | | — | | | | 16,504,027 | |
| | | | | | | | | | | | | | | | | |
| Tax-Free National | | | | | | | | | | | | | | | | |
| Municipal Bonds | | | — | | | | 17,224,298 | | | | — | | | | 17,224,298 | |
| | | | | | | | | | | | | | | | | |
| High Quality Bond | | | | | | | | | | | | | | | | |
| Corporate Notes and Bonds | | | — | | | | 20,927,593 | | | | — | | | | 20,927,593 | |
| Foreign Corporate Bonds | | | — | | | | 985,229 | | | | — | | | | 985,229 | |
| U.S. Government and Agency Obligations | | | — | | | | 38,722,001 | | | | — | | | | 38,722,001 | |
| Short-Term Investments | | | 3,759,579 | | | | — | | | | — | | | | 3,759,579 | |
| | | | 3,759,579 | | | | 60,634,823 | | | | — | | | | 64,394,402 | |
| Core Bond | | | | | | | | | | | | | | | | |
| Asset Backed Securities | | | — | | | | 7,892,176 | | | | — | | | | 7,892,176 | |
| Collateralized Mortgage Obligations | | | — | | | | 10,653,521 | | | | — | | | | 10,653,521 | |
| Commercial Mortgage-Backed Securities | | | — | | | | 4,166,054 | | | | — | | | | 4,166,054 | |
| Corporate Notes and Bonds | | | — | | | | 46,482,312 | | | | — | | | | 46,482,312 | |
| Foreign Corporate Bonds | | | — | | | | 5,246,097 | | | | — | | | | 5,246,097 | |
| Mortgage Backed Securities | | | — | | | | 62,789,411 | | | | — | | | | 62,789,411 | |
| U.S. Government and Agency Obligations | | | — | | | | 54,091,391 | | | | — | | | | 54,091,391 | |
| Short-Term Investments | | | 4,740,439 | | | | — | | | | — | | | | 4,740,439 | |
| | | | 4,740,439 | | | | 191,320,962 | | | | — | | | | 196,061,401 | |
| | | | | | | | | | | | | | | | | |
| Covered Call & Equity Income | | | | | | | | | | | | | | | | |
| Assets: | | | | | | | | | | | | | | | | |
| Common Stocks | | | 194,327,079 | | | | — | | | | — | | | | 194,327,079 | |
| Short-Term Investments | | | 60,932,574 | | | | — | | | | — | | | | 60,932,574 | |
| | | | 255,259,653 | | | | — | | | | — | | | | 255,259,653 | |
| Liabilities: | | | | | | | | | | | | | | | | |
| Options Written | | | (3,534,139 | ) | | | — | | | | — | | | | (3,534,139 | ) |
| | | | | | | | | | | | | | | | | |
| Dividend Income | | | | | | | | | | | | | | | | |
| Common Stocks | | | 146,697,619 | | | | — | | | | — | | | | 146,697,619 | |
| Short-Term Investments | | | 2,372,375 | | | | — | | | | — | | | | 2,372,375 | |
| | | | 149,069,994 | | | | — | | | | — | | | | 149,069,994 | |
| Investors | | | | | | | | | | | | | | | | |
| Common Stocks | | | 409,210,636 | | | | — | | | | — | | | | 409,210,636 | |
| Short-Term Investments | | | 8,085,826 | | | | — | | | | — | | | | 8,085,826 | |
| | | | 417,296,462 | | | | — | | | | — | | | | 417,296,462 | |
Madison Funds | October 31, 2024
Notes to the Financial Statements - continued
| | | | | | | | | | | | Value at | |
| Fund1 | | Level 1 | | | Level 2 | | | Level 3 | | | 10/31/24 | |
| Sustainable Equity | | | | | | | | | | | | | | | | |
| Common Stocks | | | 9,739,763 | | | | — | | | | — | | | | 9,739,763 | |
| Short-Term Investments | | | 146,854 | | | | — | | | | — | | | | 146,854 | |
| | | | 9,886,617 | | | | — | | | | — | | | | 9,886,617 | |
| Mid Cap | | | | | | | | | | | | | | | | |
| Common Stocks | | | 1,774,504,848 | | | | — | | | | — | | | | 1,774,504,848 | |
| Short-Term Investments | | | 149,469,456 | | | | — | | | | — | | | | 149,469,456 | |
| | | | 1,923,974,304 | | | | — | | | | — | | | | 1,923,974,304 | |
| Small Cap | | | | | | | | | | | | | | | | |
| Common Stocks | | | 176,177,327 | | | | — | | | | — | | | | 176,177,327 | |
| Short-Term Investments | | | 11,927,219 | | | | — | | | | — | | | | 11,927,219 | |
| | | | 188,104,546 | | | | — | | | | — | | | | 188,104,546 | |
| Madison International Stock Fund | | | | | | | | | | | | | | | | |
| Common Stocks | | | | | | | | | | | | | | | | |
| Australia | | | — | | | | 216,202 | | | | — | | | | 216,202 | |
| Brazil | | | 167,234 | | | | — | | | | — | | | | 167,234 | |
| Canada | | | 627,041 | | | | — | | | | — | | | | 627,041 | |
| China | | | 349,005 | | | | 653,269 | | | | — | | | | 1,002,274 | |
| Denmark | | | — | | | | 133,682 | | | | — | | | | 133,682 | |
| France | | | 141,345 | | | | 884,003 | | | | — | | | | 1,025,348 | |
| Germany | | | 213,547 | | | | 1,243,694 | | | | — | | | | 1,457,241 | |
| Hong Kong | | | — | | | | 290,788 | | | | — | | | | 290,788 | |
| India | | | 576,291 | | | | 344,295 | | | | — | | | | 920,586 | |
| Ireland | | | — | | | | 296,369 | | | | — | | | | 296,369 | |
| Israel | | | 205,731 | | | | — | | | | — | | | | 205,731 | |
| Italy | | | 131,819 | | | | — | | | | — | | | | 131,819 | |
| Japan | | | — | | | | 2,191,289 | | | | — | | | | 2,191,289 | |
| Mexico | | | 615,195 | | | | — | | | | — | | | | 615,195 | |
| Netherlands | | | 360,075 | | | | — | | | | — | | | | 360,075 | |
| Norway | | | — | | | | 164,171 | | | | — | | | | 164,171 | |
| Switzerland | | | — | | | | 779,837 | | | | — | | | | 779,837 | |
| Taiwan | | | 270,376 | | | | — | | | | — | | | | 270,376 | |
| United Kingdom | | | — | | | | 1,002,005 | | | | — | | | | 1,002,005 | |
| Short-Term Investments | | | 647,882 | | | | — | | | | — | | | | 647,882 | |
| | | | 4,305,541 | | | | 8,199,604 | | | | — | | | | 12,505,145 | |
| 1 | See respective Portfolio of Investments for underlying holdings in each fund. For additional information on the Underlying Funds held in the Allocation Funds, including shareholder prospectuses and financial reports, please visit each Underlying fund’s website or visit the Securities and Exchange Commission’s website at http://www.sec.gov. |
4. DERIVATIVES
The FASB issued guidance intended to enhance financial statement disclosure for derivative instruments and enable investors to understand: a) how and why a fund uses derivative investments, b) how derivative instruments are accounted for, and c) how derivative instruments affect a fund’s financial position, and results of operations. As of October 31, 2024 the Covered Call & Equity Income Fund has not offset any of the positions and the positions are presented gross on the Statements of Assets and Liabilities.
The following table presents the types of derivatives in the Fund by location and as presented on the Statements of Assets and Liabilities as of October 31, 2024.
| | | Statements of Asset & Liability Presentation of Fair Values of Derivative Instruments | |
| | | | | Asset Derivatives | | | Liability Derivatives | |
| | | | | Statements of Assets and | | | | | Statements of Assets and | | | |
| Fund | | Underlying Risk | | Liabilities Location | | Fair Value | | | Liabilities Location | | Fair Value | |
| Covered Call & Equity Income | | Equity | | Options purchased | | $ | — | | | Options written | | $ | (3,534,139 | ) |
The following table presents the effect of derivative instruments on the Statements of Operations for the year ended October 31, 2024.
| | | | | | | Realized Gain | | | Change in Unrealized Appreciation | |
| Fund | | Underlying Risk | | Statements of Operations | | (Loss) on Derivatives | | | (Depreciation) on Derivatives | |
| Covered Call & Equity Income | | Equity | | Option Purchased | | $ | (3,591,871 | ) | | $ | — | |
| | | Equity | | Option Written | | | 6,218,882 | | | | (404,092 | ) |
| Total | | | | | | $ | 2,627,011 | | | $ | (404,092 | ) |
Madison Funds | October 31, 2024
Notes to the Financial Statements - continued
The average volume (based on the open positions at each month-end) of derivative activity during the year ended October 31, 2024.
| | | Options Purchased Contracts(1) | | | Options Written Contracts(1) | |
| Madison Covered Call & Equity Strategy Fund | | | 105 | | | | (23,610 | ) |
There is no impact on the financial statement of the other funds as they did not hold derivative investments during the year end October 31, 2024.
5. ADVISORY, ADMINISTRATION AND DISTRIBUTION AGREEMENTS
Advisory Agreement: For its investment advisory services to the Funds, pursuant to the terms of an Investment Advisory Agreement between Madison and the Trust, Madison is entitled to receive a fee, which is computed daily and paid monthly, at an annualized percentage rate of the average daily value of the net assets of each fund as follows as of October 31, 2024:
| Fund | | Management Fee | | Fund | | Management Fee |
| Conservative Allocation | | 0.20% | | Covered Call & Equity Income | | 0.85% |
| Moderate Allocation | | 0.20% | | Dividend Income1 | | 0.70% |
| Aggressive Allocation | | 0.20% | | Investors1 | | 0.70% |
| Diversified Income1 | | 0.20% | | Sustainable Equity1 | | 0.70% |
| Tax-Free Virginia | | 0.50% | | Mid Cap1 | | 0.75% |
| Tax-Free National | | 0.40% | | Small Cap1 | | 0.89% |
| High Quality Bond | | 0.30% | | International Stock1 | | 1.05% |
| Core Bond1 | | 0.39% | | | | |
| 1 | The Fund’s management fee will be reduced by 0.05% on assets exceeding $500 million, and by another 0.05% on assets exceeding $1 billion. |
Administrative Services Agreement: In addition to the management fee, the Investment Adviser is entitled to receive an administrative services fee from each Fund pursuant to the terms of a separate Administrative Services Agreement. Under this fee agreement, the Investment Adviser provides or arranges for each fund to have all of the necessary operational and support services it needs for a fee. These fees are computed daily and paid monthly, at an annualized percentage rate of the average daily value of the net assets of each Fund.
During the year October 31, 2024, the Funds and their respective share classes were charged the following fees under the Administrative Services Agreement:
| Fund | | Class A | | | Class C | | | Class Y | | | Class I | | | Class R6 | |
| Conservative Allocation | | | 0.25 | % | | | 0.25 | % | | | N/A | | | | N/A | | | | N/A | |
| Moderate Allocation | | | 0.25 | % | | | 0.25 | % | | | N/A | | | | N/A | | | | N/A | |
| Aggressive Allocation | | | 0.25 | % | | | 0.25 | % | | | N/A | | | | N/A | | | | N/A | |
| Diversified Income | | | 0.20 | % | | | 0.20 | % | | | N/A | | | | N/A | | | | N/A | |
| Tax-Free Virginia | | | N/A | | | | N/A | | | | 0.35 | % | | | N/A | | | | N/A | |
| Tax-Free National | | | N/A | | | | N/A | | | | 0.35 | % | | | N/A | | | | N/A | |
| High Quality Bond | | | N/A | | | | N/A | | | | 0.19 | % | | | 0.10 | % | | | N/A | |
| Core Bond | | | 0.20 | % | | | N/A | | | | 0.20 | % | | | 0.10 | % | | | 0.02 | % |
| Covered Call & Equity Income | | | 0.15 | % | | | 0.15 | % | | | 0.15 | % | | | 0.10 | % | | | 0.02 | % |
| Dividend Income | | | 0.20 | % | | | N/A | | | | 0.20 | % | | | 0.10 | % | | | 0.02 | % |
| Investors | | | 0.20 | % | | | N/A | | | | 0.20 | % | | | 0.10 | % | | | 0.02 | % |
| Sustainable Equity | | | N/A | | | | N/A | | | | 0.20 | % | | | 0.10 | % | | | N/A | |
| Mid Cap | | | 0.40 | % | | | N/A | | | | 0.20 | % | | | 0.10 | % | | | 0.02 | % |
| Small Cap | | | 0.20 | % | | | N/A | | | | 0.20 | % | | | 0.10 | % | | | 0.02 | % |
| International Stock | | | 0.30 | % | | | N/A | | | | 0.30 | % | | | N/A | | | | N/A | |
Expenses that are not included under this fee agreement are paid directly by the Funds. See “Other Expenses”.
Shareholder Service and Distribution Plans (Rule 12b-1): The Trust has adopted, on behalf of certain funds and share classes, distribution and/or service plans pursuant to Rule 12b-1 under the 1940 Act. These plans permit the applicable share classes to pay for distribution of their shares and servicing of their shareholders out of fund assets; therefore, the cost of these plans is indirectly borne by all shareholders who own shares of the affected funds and share classes. These plans are described below:
Shareholder Service Fees (Class A and C shares): Service plans have been adopted pursuant to Rule 12b-1 under the 1940 Act for Class A and C shares of each of the Funds. Under the terms of these plans, each fund pays MFD Distributor, LLC (“MFD”) a service fee equal to 0.25% of the average daily net assets attributable to each class of shares of that fund. The service fee is used by MFD to offset costs of servicing shareholder accounts or to compensate other qualified broker/dealers who sell shares of the Funds pursuant to agreements with MFD for their costs of servicing shareholder accounts. MFD may retain any portion of the service fee for which there is no broker/dealer of record as partial consideration for its services with respect to shareholder accounts.
Madison Funds | October 31, 2024
Notes to the Financial Statements - continued
Distribution Fees (Class C shares only). A distribution plan has been adopted pursuant to Rule 12b-1 under 1940 Act for Class C shares of each of the Funds. Under the terms of each plan, each Fund pays its principal distributor, MFD, a fee equal to 0.75% of the average daily net assets attributable to Class C shares of that fund. MFD may use this fee to cover its distribution-related expenses (including commissions paid to broker/dealers for selling Class C shares) or distribution-related expenses of dealers. This fee increases the cost of investment in the Class C shares of a fund and, over time, may cost more than paying the initial sales charge for Class A shares.
The Shareholder Servicing & Distribution Fees are computed daily and paid monthly, at an annualized percentage rate of the average daily value of the net assets of each Fund as follows:
| | | | | | | | | | | | Total Shareholder Servicing and | |
| | | Shareholder Servicing Fee | | | Distribution Fee | | | Distribution Fees (Rule 12b-1) | |
| Fund | | Class A | | | Class C | | | Class C | | | Class A | | | Class C | |
| Conservative Allocation | | | 0.25 | % | | | 0.25 | % | | | 0.75 | % | | | 0.25 | % | | | 1.00 | % |
| Moderate Allocation | | | 0.25 | % | | | 0.25 | % | | | 0.75 | % | | | 0.25 | % | | | 1.00 | % |
| Aggressive Allocation | | | 0.25 | % | | | 0.25 | % | | | 0.75 | % | | | 0.25 | % | | | 1.00 | % |
| Diversified Income | | | 0.25 | % | | | 0.25 | % | | | 0.75 | % | | | 0.25 | % | | | 1.00 | % |
| Tax-Free Virginia | | | N/A | | | | N/A | | | | N/A | | | | N/A | | | | N/A | |
| Tax-Free National | | | N/A | | | | N/A | | | | N/A | | | | N/A | | | | N/A | |
| High Quality Bond | | | N/A | | | | N/A | | | | N/A | | | | N/A | | | | N/A | |
| Core Bond | | | 0.25 | % | | | N/A | | | | N/A | | | | 0.25 | % | | | N/A | |
| Covered Call & Equity Income | | | 0.25 | % | | | 0.25 | % | | | 0.75 | % | | | 0.25 | % | | | 1.00 | % |
| Dividend Income | | | 0.25 | % | | | N/A | | | | N/A | | | | 0.25 | % | | | N/A | |
| Investors | | | 0.25 | % | | | N/A | | | | N/A | | | | 0.25 | % | | | N/A | |
| Sustainable Equity | | | N/A | | | | N/A | | | | N/A | | | | N/A | | | | N/A | |
| Mid Cap | | | 0.25 | % | | | N/A | | | | N/A | | | | 0.25 | % | | | N/A | |
| Small Cap | | | 0.25 | % | | | N/A | | | | N/A | | | | 0.25 | % | | | N/A | |
| International Stock | | | 0.25 | % | | | N/A | | | | N/A | | | | 0.25 | % | | | N/A | |
Front-end sales charges and contingent deferred sales charges (“CDSC”) do not represent expenses of the Funds. Rather, they are deducted from the proceeds of sales of Fund shares prior to investment (Class A shares) or from redemption proceeds prior to remittance (Class A and C shares), as applicable. MFD, in turn, uses a portion of these fees to pay financial advisors who sell Fund shares, as disclosed in the prospectus. The sales charges and CDSC collected and retained by MFD for the year ended October 31, 2024, were as follows:
| | | Amount Collected | | | Amount Retained | |
| Fund | | Class A | | | Class C | | | Class A | | | Class C | |
| Conservative Allocation | | $ | 9,724 | | | $ | 40 | | | $ | 1,304 | | | $ | 40 | |
| Moderate Allocation | | | 33,552 | | | | 132 | | | | 4,270 | | | | 132 | |
| Aggressive Allocation | | | 37,161 | | | | 0 | | | | 4,611 | | | | 0 | |
| Diversified Income | | | 27,444 | | | | 435 | | | | 3,565 | | | | 435 | |
| Core Bond | | | 3,527 | | | | n/a | | | | 451 | | | | n/a | |
| Covered Call & Equity Income | | | 116,385 | | | | 2,496 | | | | 13,549 | | | | 2,496 | |
| Dividend Income | | | 9,673 | | | | n/a | | | | 1,267 | | | | n/a | |
| Investors | | | 44,555 | | | | n/a | | | | 5,931 | | | | n/a | |
| Mid Cap | | | 333,463 | | | | n/a | | | | 38,817 | | | | n/a | |
| Small Cap | | | 2,560 | | | | n/a | | | | 288 | | | | n/a | |
| International Stock | | | 3,807 | | | | n/a | | | | 482 | | | | n/a | |
Other Expenses: The Funds are responsible for paying: (i) transaction-related expenses including, but not limited to, brokerage commissions paid in connection with fund transactions, interest or fees in connection with fund indebtedness or taxes paid in connection with portfolio securities held, (ii) Rule 12b-1 distribution and service fees, if any, (iii) acquired fund fees, if any, (iv) any extraordinary or nonrecurring expenses (such as overdraft fees or expenses relating to any temporary line of credit the Funds maintain for emergency or extraordinary purposes), and (v) Independent Trustee compensation, including Lead Independent Trustee compensation.
Officers and Trustees: Certain officers and trustees of the Funds are also officers of the Investment Adviser. The Funds do not compensate their officers or affiliated trustees. Independent Trustees are compensated by the Funds.
6. DIVIDENDS FROM NET INCOME AND DISTRIBUTIONS OF CAPITAL GAINS
With respect to dividends from net investment income, Tax-Free Virginia, Tax-Free National, Core Bond and Diversified Income Funds declare and reinvest dividends, if any, monthly. The Conservative Allocation, High Quality Bond, Dividend Income and Covered Call & Equity Income Funds declare and reinvest dividends, if any, quarterly. The Moderate Allocation, Aggressive Allocation, Investors, Sustainable Equity, Mid Cap, Small Cap and International Stock Funds declare and reinvest dividends, if any, annually. The Funds distribute net realized gains from investment transactions, if any, to shareholders annually.
Madison Funds | October 31, 2024
Notes to the Financial Statements - continued
Income and capital gain distributions, if any, are determined in accordance with federal income tax regulations, which may differ from accounting principles generally accepted in the United States of America. Taxable distributions from income and realized capital gains in the Funds differ from book amounts earned during the period due to differences in the timing of capital gains recognition, and due to the reclassification of certain gains or losses from capital to income. Dividends from net investment income are determined on a class level. Capital gains are determined on a fund level.
7. SECURITIES TRANSACTIONS
For the year ended October 31, 2024, aggregate cost of purchases and proceeds from sales of securities, other than short-term investment, were as follows:
| | | U.S. Government Securities | | | Other Investment Securities | |
| Fund | | Purchases | | | Sales | | | Purchases | | | Sales | |
| Conservative Allocation | | $ | — | | | $ | — | | | $ | 21,681,284 | | | $ | 25,997,175 | |
| Moderate Allocation | | | — | | | | — | | | | 46,464,626 | | | | 55,813,059 | |
| Aggressive Allocation | | | — | | | | — | | | | 29,178,525 | | | | 33,602,048 | |
| Diversified Income | | | — | | | | — | | | | 11,670,335 | | | | 26,890,492 | |
| Tax-Free Virginia | | | — | | | | — | | | | 1,940,743 | | | | 2,327,244 | |
| Tax-Free National | | | — | | | | — | | | | 2,271,923 | | | | 2,370,124 | |
| High Quality Bond | | | 20,309,251 | | | | 15,409,458 | | | | 4,838,517 | | | | 3,910,910 | |
| Core Bond | | | 37,617,833 | | | | 18,353,852 | | | | 17,530,362 | | | | 24,922,333 | |
| Covered Call & Equity Income | | | — | | | | — | | | | 270,878,479 | | | | 277,512,625 | |
| Dividend Income | | | — | | | | — | | | | 45,981,332 | | | | 122,302,636 | |
| Investors | | | — | | | | — | | | | 62,878,969 | | | | 70,512,809 | |
| Sustainable Equity | | | — | | | | — | | | | 3,105,072 | | | | 3,688,498 | |
| Mid Cap | | | — | | | | — | | | | 963,131,562 | | | | 202,422,260 | |
| Small Cap | | | — | | | | — | | | | 65,511,143 | | | | 98,513,375 | |
| International Stock | | | — | | | | — | | | | 2,474,517 | | | | 4,191,781 | |
8. COVERED CALL AND PUT OPTIONS
An option on a security is a contract that gives the holder of the option, in return for a premium, the right to buy from (in the case of a call) or sell to (in the case of a put) the writer of the option the security underlying the option at a specified exercise or “strike” price. The writer of an option on a security has an obligation upon exercise of the option to deliver the underlying security upon payment of the exercise price (in the case of a call) or pay the exercise price upon delivery of the underlying security (in the case of a put).
The Covered Call & Equity Income Fund pursues its primary objective by employing an option strategy of writing (selling) covered call options on common stocks. The number of call options the Fund can write (sell) is limited by the amount of equity securities the Fund holds in its portfolio. The Fund will not write (sell) “naked” or uncovered call options. The Fund seeks to produce a high level of current income and gains generated from option writing premiums and, to a lesser extent, from dividends. Covered call writing also helps to reduce volatility (and risk profile) of the Fund by providing protection from declining stock prices.
When an option is written, the premium received is recorded as an asset with an equal liability and is subsequently marked to market to reflect the current fair value of the option written. These liabilities are reflected as options written in the Statements of Assets and Liabilities. Premiums received from writing options which expire unexercised are recorded on the expiration date as a realized gain. The difference between the premium received and the amount paid on effecting a closing purchase transaction, including brokerage commissions, is also treated as a realized gain, or if the premium is less than the amount paid for the closing purchase transactions, as a realized loss. If a call option is exercised, the premium is added to the proceeds from the sale of the underlying security in determining whether there has been a realized gain or loss. See Note 4 for information on derivatives.
9. FUTURES CONTRACTS AND OPTIONS ON FUTURES CONTRACTS
The Core Bond Fund may purchase and sell futures contracts and purchase and write options on futures contracts on a limited basis. The Fund may purchase and sell futures contracts based on various securities (such as U.S. Government securities), securities indices, foreign currencies and other financial instruments and indices. The Fund will engage in futures or related options transactions on a limited basis only for bona fide hedging purposes or for purposes of seeking to increase total returns to the extent permitted by regulations of the Commodity Futures Trading Commission.
Futures Contracts. The Core Bond Fund may use futures contracts to manage its exposure to the securities markets or to movements in interest rates and currency values. The primary risks associated with the use of futures contracts are the imperfect correlation between the change in fair value of the securities held by the Funds and the prices of futures contracts and the possibility of an illiquid market. Futures contracts are valued based upon their quoted daily settlement prices. Upon entering into a futures contract, the Fund is required to deposit with its futures broker an amount of cash, US government and agency obligations, or other liquid assets, in accordance with the initial margin requirements of the broker or exchange. Futures contracts are marked to market daily and based on such movements in the price of the contracts, an appropriate payable or receivable for the change in value may be posted or collected by the Fund (“variation margin”). Gains or losses are recognized but not considered realized until the contracts expire or close. Futures contracts involve, to varying degrees, risk of loss in excess of the variation margin disclosed within exchange traded or centrally cleared financial derivative instruments on the Statements of Assets and Liabilities.
During the year ended October 31, 2024, the Funds did not enter into any futures contracts.
Madison Funds | October 31, 2024
Notes to the Financial Statements - continued
Options on Futures Contracts. The acquisition of put and call options on futures contracts will give The Core Bond Fund and Covered Call & Equity Fund the right (but not the obligation) for a specified price, to sell or to purchase, respectively, the underlying futures contract at any time during the option period. As the purchaser of an option on a futures contract, the Funds obtain the benefit of the futures position if prices move in a favorable direction but limits its risk of loss in the event of an unfavorable price movement to the loss of the premium and transaction costs.
The writing of a call option on a futures contract generates a premium which may partially offset a decline in the value of the Funds’ assets. By writing a call option, the Funds become obligated, in exchange for the premium, to sell a futures contract which may have a value higher than the exercise price. Conversely, the writing of a put option on a futures contract generates a premium, which may partially offset an increase in the price of securities that the Funds intend to purchase. However, the Funds become obligated to purchase a futures contract, which may have a value lower than the exercise price. Thus, the loss incurred by the Funds in writing options on futures is potentially unlimited and may exceed the amount of the premium received.
During the year ended October 31, 2024, the Funds did not enter into any options on futures contracts.
10. FOREIGN SECURITIES
Each Fund, other than the Tax-Free Virginia and Tax-Free National Funds, may invest in foreign securities. Foreign securities are defined as securities that are: (i) issued by companies organized outside the US or whose principal operations are outside the US, or issued by foreign governments or their agencies or instrumentalities (“foreign issuers”); (ii) principally traded outside of the US; and (iii) quoted or denominated in a foreign currency (“non-dollar securities”). Foreign securities include ADRs, European Depositary Receipts (“EDRs”), GDRs, Swedish Depositary Receipts (“SDRs”) and foreign money market securities.
Certain of the Funds have reclaims receivable balances, in which the Funds are due a reclaim on the taxes that have been paid to some foreign jurisdictions. The values of all reclaims are not significant for any of the Funds and are reflected in Other Assets on the Statements of Assets and Liabilities. These receivables are reviewed to ensure the current receivable balance is reflective of the amount deemed to be collectible.
11. SECURITIES LENDING
The Board of Trustees has authorized the Funds to engage in securities lending with State Street Bank and Trust Company as securities lending agent pursuant to a Securities Lending Authorization Agreement (the “Agreement”) and subject to certain securities lending policies and procedures. Under the terms of the Agreement, and subject to the policies and procedures, the authorized funds may lend portfolio securities to qualified borrowers in order to generate additional income, while managing risk associated with the securities lending program. The Agreement requires that loans are collateralized at all times by cash or US government securities, initially equal to at least 102% of the value of domestic securities and 105% of non-domestic securities. The loaned securities and collateral are marked to market daily to maintain collateral at 102% of the total loaned portfolio for each broker/borrower. Amounts earned as interest on investments of cash collateral, net of rebates and fees, if any, are included in the Statements of Operations. The primary risk associated with securities lending is loss associated with investment of cash and non-cash collateral. A secondary risk is if the borrower defaults on its obligation to return the securities loaned because of insolvency or other reasons. The Fund could experience delays and costs in recovering securities loaned or in gaining access to the collateral. Under the Agreement, the securities lending agent has provided a limited indemnification in the event of a borrower default. The Funds do not have a master netting agreement.
As of October 31, 2024, the aggregate fair value of securities on loan for the Trust was $55,892,456. Cash collateral received for such loans is reinvested into the State Street Navigator Securities Lending Government Money Market Portfolio. Non-cash collateral is invested in US treasuries or other US government securities. See below for fair value on loan and collateral breakout for each fund and each respective Fund’s portfolio of investments for individual securities identified on loan.
| Fund | | Market Value | | | Cash Collateral* | | | Non-Cash Collateral* | |
| Conservative Allocation | | $ | 2,582,109 | | | $ | 2,651,855 | | | $ | — | |
| Moderate Allocation | | | 5,171,249 | | | | 5,311,220 | | | | — | |
| Aggressive Allocation | | | 4,115,778 | | | | 4,230,319 | | | | — | |
| Diversified Income | | | 1,482,579 | | | | 1,518,125 | | | | — | |
| High Quality Bond | | | 2,268,742 | | | | 2,317,770 | | | | — | |
| Core Bond | | | 1,090,904 | | | | 1,115,975 | | | | — | |
| Mid Cap | | | 38,759,351 | | | | 40,191,635 | | | | — | |
| International Stock | | | 421,744 | | | | 434,429 | | | | — | |
| * | Collateral Represents minimum 102% of the value of domestic securities and 105% of non-domestic securities on loan, based upon the prior days market value for securities loaned. |
The following table provides increased transparency about the types of collateral pledged for securities lending transactions that are accounted for as secured borrowing. Non-cash collateral is not reflected in the table because the Funds cannot repledge or resell this collateral.
Madison Funds | October 31, 2024
Notes to the Financial Statements - continued
| | | Remaining Contractual Maturity of the Agreements | |
| | | As of October 31, 2024 | |
| | | Overnight and | | | | | | Between | | | | | | | |
| | | Continuous | | | <30 days | | | 30 & 90 days | | | >90 days | | | Total | |
| | | | | | | | | | | | | | | | |
| Securities Lending Transactions(1) | | | | | | | | | | | | | | | | | | | | |
| Conservative Allocation | | | | | | | | | | | | | | | | | | | | |
| Common Stocks | | $ | 2,651,855 | | | $ | — | | | $ | — | | | $ | — | | | $ | 2,651,855 | |
| Total Borrowings | | $ | 2,651,855 | | | $ | — | | | $ | — | | | $ | — | | | $ | 2,651,855 | |
| Gross amount of recognized liabilities for securities lending transactions | | | | | | | | | | | | | | | | | | $ | 2,651,855 | |
| Moderate Allocation | | | | | | | | | | | | | | | | | | | | |
| Common Stocks | | $ | 5,311,220 | | | $ | — | | | $ | — | | | $ | — | | | $ | 5,311,220 | |
| Total Borrowings | | $ | 5,311,220 | | | $ | — | | | $ | — | | | $ | — | | | $ | 5,311,220 | |
| Gross amount of recognized liabilities for securities lending transactions | | | | | | | | | | | | | | | | | | $ | 5,311,220 | |
| Aggressive Allocation | | | | | | | | | | | | | | | | | | | | |
| Common Stocks | | $ | 4,230,319 | | | $ | — | | | $ | — | | | $ | — | | | $ | 4,230,319 | |
| Total Borrowings | | $ | 4,230,319 | | | $ | — | | | $ | — | | | $ | — | | | $ | 4,230,319 | |
| Gross amount of recognized liabilities for securities lending transactions | | | | | | | | | | | | | | | | | | | 4,230,319 | |
| Diversified Income | | | | | | | | | | | | | | | | | | | | |
| Common Stocks | | $ | 1,518,125 | | | $ | — | | | $ | — | | | $ | — | | | $ | 1,518,125 | |
| Total Borrowings | | $ | 1,518,125 | | | $ | — | | | $ | — | | | $ | — | | | $ | 1,518,125 | |
| Gross amount of recognized liabilities for securities lending transactions | | | | | | | | | | | | | | | | | | $ | 1,518,125 | |
| High Quality Bond | | | | | | | | | | | | | | | | | | | | |
| Common Stocks | | $ | 2,317,770 | | | $ | — | | | $ | — | | | $ | — | | | $ | 2,317,770 | |
| Total Borrowings | | $ | 2,317,770 | | | $ | — | | | $ | — | | | $ | — | | | $ | 2,317,770 | |
| Gross amount of recognized liabilities for securities lending transactions | | | | | | | | | | | | | | | | | | $ | 2,317,770 | |
| Core Bond | | | | | | | | | | | | | | | | | | | | |
| Common Stocks | | $ | 1,115,975 | | | $ | — | | | $ | — | | | $ | — | | | $ | 1,115,975 | |
| Total Borrowings | | $ | 1,115,975 | | | $ | — | | | $ | — | | | $ | — | | | $ | 1,115,975 | |
| Gross amount of recognized liabilities for securities lending transactions | | | | | | | | | | | | | | | | | | $ | 1,115,975 | |
| Mid Cap | | | | | | | | | | | | | | | | | | | | |
| Common Stocks | | $ | 40,191,635 | | | $ | — | | | $ | — | | | $ | — | | | $ | 40,191,635 | |
| Total Borrowings | | $ | 40,191,635 | | | $ | — | | | $ | — | | | $ | — | | | $ | 40,191,635 | |
| Gross amount of recognized liabilities for securities lending transactions | | | | | | | | | | | | | | | | | | $ | 40,191,635 | |
| Small Cap | | | | | | | | | | | | | | | | | | | | |
| Common Stocks | | $ | 434,429 | | | $ | — | | | $ | — | | | $ | — | | | $ | 434,429 | |
| Total Borrowings | | $ | 434,429 | | | $ | — | | | $ | — | | | $ | — | | | $ | 434,429 | |
| Gross amount of recognized liabilities for securities lending transactions | | | | | | | | | | | | | | | | | | $ | 434,429 | |
| (1) | Amounts represent the payable for cash collateral received on securities on loan. This will generally be in the “Overnight and Continuous” column as the securities are typically callable on demand. The payable will be allocated into categories of securities based on the market value of the securities on loan. |
12. FEDERAL AND FOREIGN INCOME TAX INFORMATION
It is each Fund’s policy to comply with the requirements of Subchapter M of the Internal Revenue Code of 1986, as amended, applicable to regulated investment companies and to distribute all its taxable income to its shareholders and any net realized capital gains at least annually. Accordingly, no provisions for federal income taxes are recorded in the accompanying statements.
The Funds have not recorded any liabilities for material unrecognized tax benefits as of October 31, 2024. It is each Fund’s policy to recognize accrued interest and penalties related to uncertain tax benefits in income taxes, as appropriate. Tax years that remain open to examination by major tax jurisdictions include tax years ended October 31, 2021 through October 31, 2024.
The tax character of distributions paid during the years ended October 31, 2024 and 2023 were as follows:
| | | Tax Exempt Income | | | Ordinary Income | | | Long- Term Capital Gain | |
| Fund | | 2024 | | | 2023 | | | 2024 | | | 2023 | | | 2024 | | | 2023 | |
| Conservative Allocation | | $ | — | | | $ | — | | | $ | 1,074,392 | | | $ | 935,521 | | | $ | — | | | $ | — | |
| Moderate Allocation | | | — | | | | — | | | | 2,016,050 | | | | 1,339,254 | | | | — | | | | — | |
| Aggressive Allocation | | | — | | | | — | | | | 1,011,225 | | | | 630,069 | | | | — | | | | — | |
| Diversified Income | | | — | | | | — | | | | 8,486,392 | | | | 3,054,490 | | | | 16,630,770 | | | | 9,535,841 | |
| Tax-Free Virginia | | | 338,816 | | | | 325,626 | | | | — | | | | — | | | | — | | | | — | |
| Tax-Free National | | | 382,340 | | | | 359,602 | | | | — | | | | — | | | | — | | | | 124,906 | |
| High Quality Bond | | | — | | | | — | | | | 1,686,887 | | | | 1,379,348 | | | | — | | | | — | |
| Core Bond | | | — | | | | — | | | | 6,762,252 | | | | 5,748,997 | | | | — | | | | — | |
| Covered Call & Equity Income | | | — | | | | — | | | | 19,804,162 | | | | 13,288,982 | | | | — | | | | — | |
| Dividend Income | | | — | | | | — | | | | 3,452,332 | | | | 5,914,058 | | | | 7,215,772 | | | | 20,310,587 | |
| Investors | | | — | | | | — | | | | 3,348,138 | | | | 837,113 | | | | 25,450,814 | | | | 18,181,319 | |
| Sustainable Equity | | | — | | | | — | | | | 87,896 | | | | 53,311 | | | | — | | | | — | |
| Mid Cap | | | — | | | | — | | | | 3,892,595 | | | | — | | | | 9,366,219 | | | | 13,295,402 | |
| Small Cap | | | — | | | | — | | | | — | | | | — | | | | 522,295 | | | | 9,250,241 | |
| International Stock | | | — | | | | — | | | | 40,656 | | | | 36,488 | | | | — | | | | — | |
Madison Funds | October 31, 2024
Notes to the Financial Statements - continued
As of October 31, 2024, the components of distributable earnings on a tax basis were as follows:
| Fund | | Tax Exempt Income | | | Ordinary Income | | | Long-Term Capital Gain | |
| | | | | | | | | | |
| Conservative Allocation | | $ | — | | | $ | 179,262 | | | $ | — | |
| Moderate Allocation | | | — | | | | 1,520,536 | | | | 1,133,966 | |
| Aggressive Allocation | | | — | | | | 704,249 | | | | 1,176,201 | |
| Diversified Income* | | | — | | | | 57,103 | | | | 1,096,419 | |
| Tax-Free Virginia* | | | 2,572 | | | | — | | | | — | |
| Tax-Free National* | | | 5,214 | | | | — | | | | — | |
| High Quality Bond | | | — | | | | 163,969 | | | | — | |
| Core Bond* | | | — | | | | 343,202 | | | | — | |
| Covered Call & Equity Income | | | — | | | | 6,506,913 | | | | — | |
| Dividend Income | | | — | | | | 316,804 | | | | 14,616,925 | |
| Investors | | | — | | | | 866,172 | | | | 21,601,068 | |
| Sustainable Equity | | | — | | | | 48,216 | | | | — | |
| Mid Cap | | | — | | | | 3,490,221 | | | | 93,542,829 | |
| Small Cap | | | — | | | | — | | | | 16,815,093 | |
| International Stock | | | — | | | | 31,472 | | | | — | |
*The difference between the accumulated distributable earning on the Statement of Asset and Liability and the components of distributable earnings on a tax basis is due to Other temporary differences not included on this table.
For federal income tax purposes, the Funds listed below have capital loss carryovers as of October 31, 2024, which are available to offset future capital gains, if any, realized through the fiscal year listed:
| | | No Expiration Date | |
| Fund | | Short-Term | | | Long-Term | |
| Conservative Allocation | | $ | 2,271,405 | | | $ | — | |
| Tax-Free Virginia | | | 62,710 | | | | 62,644 | |
| Tax-Free National | | | — | | | | 45,625 | |
| High Quality Bond | | | 339,111 | | | | 4,779,280 | |
| Core Bond | | | 580,526 | | | | 12,131,712 | |
| Dividend Income | | | 118,226 | | | | — | |
| Sustainable Equity | | | 313,328 | | | | 416,325 | |
| International Stock | | | — | | | | 864,373 | |
The loss carryovers for Core Bond Fund and Dividend Income Fund include losses from prior-year mergers. The utilization of these inherited losses are subject to an annual limitation. For the year-ended October 31, 2024, capital losses utilized for each Fund were as follows:
| Fund | | Amount Utilized | |
| Conservative Allocation | | $ | 643,956 | |
| Moderate Allocation | | | 1,864,459 | |
| Aggressive Allocation | | | 737,367 | |
| Core Bond | | | 220,139 | |
| Dividend Income | | | 486,573 | |
| Sustainable Equity | | | 53,796 | |
| International Stock | | | 214,037 | |
Amount deferred is as follows:
| Fund | | Amount Deferred | |
| Small Cap | | $ | 75,380 | |
At October 31, 2024, the aggregate gross unrealized appreciation (depreciation) and net unrealized appreciation (depreciation) for all securities, as computed on a federal income tax basis for each fund were as follows:
| Fund | | Appreciation | | | Depreciation | | | Net | |
| Conservative Allocation | | $ | 1,833,977 | | | $ | (2,142,947 | ) | | $ | (308,970 | ) |
| Moderate Allocation | | | 8,831,726 | | | | (2,687,587 | ) | | | 6,144,139 | |
| Aggressive Allocation | | | 7,354,458 | | | | (814,647 | ) | | | 6,539,811 | |
| Diversified Income | | | 4,608,021 | | | | (1,313,504 | ) | | | 3,294,517 | |
| Tax-Free Virginia | | | 37,354 | | | | (622,992 | ) | | | (585,638 | ) |
| Tax-Free National | | | 82,652 | | | | (443,461 | ) | | | (360,809 | ) |
| High Quality Bond | | | 159,370 | | | | (1,723,653 | ) | | | (1,564,283 | ) |
| Core Bond | | | 805,529 | | | | (12,181,906 | ) | | | (11,376,377 | ) |
| Covered Call & Equity Income | | | 5,135,612 | | | | (24,130,486 | ) | | | (18,994,874 | ) |
| Dividend Income | | | 39,383,090 | | | | (2,160,389 | ) | | | 37,222,701 | |
| Investors | | | 195,275,107 | | | | (5,182,828 | ) | | | 190,092,279 | |
| Sustainable Equity | | | 2,573,438 | | | | (140,235 | ) | | | 2,433,203 | |
| Mid Cap | | | 503,034,322 | | | | (43,048,385 | ) | | | 459,985,937 | |
| Small Cap | | | 58,661,154 | | | | (6,126,126 | ) | | | 52,535,028 | |
| International Stock | | | 1,938,646 | | | | (1,967,675 | ) | | | (29,029 | ) |
Madison Funds | October 31, 2024
Notes to the Financial Statements - continued
The differences between cost amounts for book purposes and tax purposes are primarily due to the tax deferral of wash sales.
Reclassification Adjustments. Paid-in capital, undistributed net investment income, and accumulated net realized gain (loss) have been adjusted in the Statements of Assets and Liabilities for permanent book-tax differences for all funds.
Differences primarily relate to the tax treatment of net operating losses, paydown gains and losses, foreign currency gains and losses, return of capital and other distributions from real estate investment trusts and non-REIT, securities adjustments related to Treasury Inflation Protected securities (TIPS), distribution re-designations from investments in other regulated investment companies and unusable capital carry loss carryforwards.
To the extent these book and tax differences are permanent in nature, such amounts are reclassified at the end of the fiscal year among paid-in capital in excess of par value, accumulated undistributed net investment income (loss) and accumulated net realized gain (loss) on investments and foreign currency translations. Accordingly, at October 31, 2024, reclassifications were recorded as follows:
| | | | | | Undistributed | | | Accumulated | |
| | | | | | Net Investment | | | Net Realized | |
| Fund | | Paid-in Capital | | | Income (Loss) | | | Gain (Loss) | |
| Conservative Allocation | | $ | 4,993 | | | $ | 24,708 | | | $ | (29,701 | ) |
| Moderate Allocation | | | — | | | | 76,305 | | | | (76,305 | ) |
| Aggressive Allocation | | | — | | | | 51,678 | | | | (51,678 | ) |
| Diversified Income | | | 205,525 | | | | 367,950 | | | | (573,475 | ) |
| Tax-Free Virginia | | | — | | | | (1,258 | ) | | | 1,258 | |
| Core Bond Fund | | | — | | | | (178,823 | ) | | | 178,823 | |
| Covered Call & Equity Income | | | — | | | | 14,700,458 | | | | (14,700,458 | ) |
| Mid Cap | | | — | | | | (332,084 | ) | | | 332,084 | |
| Small Cap | | | (495,875 | ) | | | 445,869 | | | | 50,006 | |
| International Stock | | | — | | | | (4,374 | ) | | | 4,374 | |
13. CERTAIN RISKS
Investing in certain financial instruments, including forward foreign currency contracts, involves certain risks. Risks associated with these instruments include potential for an illiquid secondary market for the instruments or inability of counterparties to perform under the terms of the contracts, changes in the value of foreign currency relative to the US dollar and financial statements’ volatility resulting from an imperfect correlation between the movements in the prices of the instruments and the prices of the underlying securities and interest rates being hedged.
Investing in foreign securities involves certain risks not necessarily found in US markets. These include risks associated with adverse changes in economic, political, regulatory and other conditions, changes in currency exchange rates, exchange control regulations, expropriation of assets or nationalization, imposition of withholding taxes on dividend or interest payments or capital gains, and possible difficulty in obtaining and enforcing judgments against foreign entities. Further, issuers of foreign securities are subject to different, and often less comprehensive, accounting, reporting and disclosure requirements than domestic issuers.
Slowing global economic growth, the possibility of changes to some international trade agreements, tensions or open conflict between nations, such as between Russia and Ukraine, or political or economic dysfunction within some nations that are major producers of oil could affect the economies of many nations, including the United States, in ways that cannot necessarily be foreseen at the present time.
The Funds may be subject to interest rate risk which is the risk that the value of your investment will fluctuate with changes in interest rates. Typically, a rise in interest rates causes a decline in the fair value of income-bearing securities. When interest rates rise, bond prices fall; generally the longer a bond’s maturity, the more sensitive it is to risk. Federal Reserve policy changes may expose fixed-income and related markets to heightened volatility and may reduce liquidity for certain fund investments, which could cause the value of a fund’s investments and share price to decline. The Core Bond Fund may invest in derivatives tied to fixed-income markets and may be more substantially exposed to these risks than a fund that does not invest in derivatives.
The Tax-Free Funds invest in municipal securities. Municipal securities generally are subject to possible default, bankruptcy or insolvency of the issuer. Principal and interest repayment may be affected by federal, state and local legislation, referendums, judicial decisions and executive acts. The tax-exempt status of municipal securities may be affected by future changes in the tax laws, litigation involving the tax status of the securities and errors and omissions by issuers and their counsel. Madison will not attempt to make an independent determination of the present or future tax-exempt status of municipal securities acquired for the funds. While most municipal securities have a readily available market, a variety of factors, including the scarcity of issues and the fact that tax-free investments are inappropriate for significant numbers of investors, limit the depth of the market for these securities. Accordingly, it may be more difficult for the funds to sell large blocks of municipal securities advantageously than would be the case with comparable taxable securities.
The Core Bond Fund may invest in futures contracts or options on futures contracts. Investing in futures contracts and options on futures entail certain other risks such as: unanticipated changes in interest rates, securities prices or currency exchange rates, and may result in a poorer overall performance for the Fund than if it had not entered into any futures contracts or options transactions. In the event of an imperfect correlation between a futures position and portfolio position which is intended to be protected, the desired protection may not be obtained and the Fund may be exposed to risk of loss. Perfect correlation between the Fund’s futures positions and portfolio positions may be difficult to achieve.
Madison Funds | October 31, 2024
Notes to the Financial Statements - continued
The Covered Call & Equity Income Fund invests in options on securities. As the writer of a covered call option, the Fund forgoes, during the option’s life, the opportunity to profit from increases in the fair value of the security covering the call option above the sum of the premium and the strike price of the call but has retained the risk of loss should the price of the underlying security decline. A writer of a put option is exposed to the risk of loss if fair value of the underlying securities declines, but profits only to the extent of the premium received if the underlying security increases in value. The writer of an option has no control over the time when it may be required to fulfill its obligation as writer of the option. Once an option writer has received an exercise notice, it cannot effect a closing purchase transaction in order to terminate its obligation under the option and must deliver the underlying security at the exercise price.
The Allocation Funds are fund of funds, meaning that each invests primarily in Underlying Funds, including ETFs. Thus, each Fund’s investment performance and its ability to achieve its investment goal are directly related to the performance of the Underlying Funds in which it invests; and the Underlying Fund’s performance, in turn, depends on the particular securities in which that Underlying Fund invests and the expenses of that fund. Accordingly, the Allocation Funds are subject to the risks of the Underlying Funds in direct proportion to the allocation of their respective assets among the Underlying Funds.
Additionally, the Allocation Funds are subject to asset allocation risk and manager risk. Manager risk (i.e., fund selection risk) is the risk that the Underlying Fund(s) selected to fulfill a particular asset class underperforms their peers. Asset allocation risk is the risk that the allocation of the fund’s assets among the various asset classes and market segments will cause the Fund to underperform other funds with a similar investment objective.
The Funds are also subject to cybersecurity risk, which include the risks associated with computer systems, networks and devices to carry out routine business operations. These systems, networks and devices employ a variety of protections that are designed to prevent cyberattacks. Despite the various cyber protections utilized by the Funds, the Investment Adviser, and other service providers, their systems, networks, or devices could potentially be breached. The Funds, their shareholders, and the Investment Adviser could be negatively impacted as a result of a cybersecurity breach. The Funds cannot control the cybersecurity plans and systems put in place by service providers or any other third parties whose operations may affect the funds. The Funds do monitor this risk closely.
In addition to the other risks described above and in the Prospectus, you should understand what we refer to as “unknown market risks”. While investments in securities have been keystones in wealth building and management, at times these investments have produced surprises. Those who enjoyed growth and income of their investments generally were rewarded for the risks they took by investing in the markets. Although the Investment Adviser seeks to appropriately address and manage the risks identified and disclosed to you in connection with the management of the securities in the Funds, you should understand that the very nature of the securities markets includes the possibility that there may be additional risks of which we are not aware. We certainly seek to identify all applicable risks and then appropriately address them, take appropriate action to reasonably manage them and to make you aware of them so you can determine if they exceed your risk tolerance. Nevertheless, the often volatile nature of the securities markets and the global economy in which we work suggests that the risk of the unknown is something to consider in connection with an investment in securities. Unforeseen events could under certain circumstances produce a material loss of the value of some or all of the securities we manage for you in the Funds.
14. CAPITAL SHARES AND AFFILIATED OWNERSHIP
The Allocation Funds invest in Underlying Funds, certain of which may be deemed to be under common control because of the same or affiliated investment adviser and membership in a common family of investment companies (the “Affiliated Issuers”). A summary of the transactions with each Affiliated Underlying Fund during the year ended October 31, 2024 follows:
| | | Beginning | | | | | | | | | | | | Change in | | | | | | | | | | | | | |
| | | value | | | | | | | | | Realized | | | Unrealized | | | | | | | | | | | | | |
| | | as of | | | Gross | | | Gross | | | Gain | | | Appreciation | | | Value at | | | | | | | | | Distributions | |
| Fund/Underlying Fund | | 10/31/2023 | | | Additions | | | Sales | | | (Loss) | | | (depreciation) | | | 10/31/2024 | | | Shares | | | Dividend Income | | | Received1 | |
| Conservative Allocation Fund | | | | | | | | | | | | | | | | | | | | | | | | | | | | | | | | | | | | |
| Madison Core Bond Fund Class R6 | | $ | 12,818,364 | | | $ | 3,025,000 | | | $ | – | | | $ | – | | | $ | 904,317 | | | $ | 16,747,681 | | | | 1,877,543 | | | $ | 544,792 | | | $ | – | |
| Madison Dividend Income Fund Class R6 | | | 465,139 | | | | – | | | | (479,371 | ) | | | (11,486 | ) | | | 25,718 | | | | – | | | | – | | | | 1,643 | | | | 8,818 | |
| Madison Investors Fund Class R6 | | | 3,880,477 | | | | 704,586 | | | | (2,302,788 | ) | | | 123,512 | | | | 616,217 | | | | 3,022,004 | | | | 98,920 | | | | 24,200 | | | | 300,202 | |
| Totals | | $ | 17,163,980 | | | $ | 3,729,586 | | | $ | (2,782,159 | ) | | $ | 112,026 | | | $ | 1,546,252 | | | $ | 19,769,685 | | | | | | | $ | 570,635 | | | $ | 309,020 | |
| | | | | | | | | | | | | | | | | | | | | | | | | | | | | | | | | | | | | |
| Moderate Allocation Fund | | | | | | | | | | | | | | | | | | | | | | | | | | | | | | | | | | | | |
| Madison Core Bond Fund Class R6 | | $ | 17,141,675 | | | $ | 5,038,949 | | | $ | – | | | $ | – | | | $ | 1,172,488 | | | $ | 23,353,112 | | | | 2,618,062 | | | $ | 746,258 | | | $ | – | |
| Madison Dividend Income Fund Class R6 | | | 1,407,817 | | | | – | | | | (1,455,344 | ) | | | (101,808 | ) | | | 149,335 | | | | – | | | | – | | | | 6,813 | | | | 36,567 | |
| Madison Investors Fund Class R6 | | | 11,874,011 | | | | 2,801,830 | | | | (5,528,942 | ) | | | 348,556 | | | | 2,092,799 | | | | 11,588,254 | | | | 379,321 | | | | 74,737 | | | | 927,093 | |
| Totals | | $ | 30,423,503 | | | $ | 7,840,779 | | | $ | (6,984,286 | ) | | $ | 246,748 | | | $ | 3,414,622 | | | $ | 34,941,366 | | | | | | | $ | 827,808 | | | $ | 963,660 | |
| | | | | | | | | | | | | | | | | | | | | | | | | | | | | | | | | | | | | |
| Aggressive Allocation Fund | | | | | | | | | | | | | | | | | | | | | | | | | | | | | | | | | | | | |
| Madison Core Bond Fund Class R6 | | $ | 4,342,449 | | | $ | 2,467,500 | | | $ | – | | | $ | – | | | $ | 291,284 | | | $ | 7,101,233 | | | | 796,102 | | | $ | 209,521 | | | $ | – | |
| Madison Dividend Income Fund Class R6 | | | 1,012,479 | | | | – | | | | (1,049,243 | ) | | | 23,229 | | | | 13,535 | | | | – | | | | – | | | | 5,685 | | | | 30,516 | |
| Madison Investors Fund Class R6 | | | 8,252,922 | | | | 1,953,496 | | | | (3,202,634 | ) | | | 220,747 | | | | 1,480,580 | | | | 8,705,111 | | | | 284,946 | | | | 50,616 | | | | 627,880 | |
| Totals | | $ | 13,607,850 | | | $ | 4,420,996 | | | $ | (4,251,877 | ) | | $ | 243,976 | | | $ | 1,785,399 | | | $ | 15,806,344 | | | | | | | $ | 265,822 | | | $ | 658,396 | |
Madison Funds | October 31, 2024
Notes to the Financial Statements - concluded
| | | Beginning | | | | | | | | | | | | Change in | | | | | | | | | | | | | |
| | | value | | | | | | | | | Realized | | | Unrealized | | | | | | | | | | | | | |
| | | as of | | | Gross | | | Gross | | | Gain | | | Appreciation | | | Value at | | | | | | | | | Distributions | |
| Fund/Underlying Fund | | 10/31/2023 | | | Additions | | | Sales | | | (Loss) | | | (depreciation) | | | 10/31/2024 | | | Shares | | | Dividend Income | | | Received1 | |
| Diversified Income Fund | | | | | | | | | | | | | | | | | | | | | | | | | | | | | | | | | | | | |
| Madison Aggregate Bond ETF | | $ | 21,300,950 | | | $ | 1,532,563 | | | $ | – | | | $ | – | | | $ | 1,070,217 | | | $ | 23,903,730 | | | | 1,175,000 | | | $ | 1,118,334 | | | $ | – | |
| Madison Covered Call ETF | | | 35,705,862 | | | | - | | | | (4,662,599 | ) | | | (135,514 | ) | | | (10,525 | ) | | | 30,897,224 | | | | 1,595,000 | | | | 4,567,746 | | | | 367,775 | |
| Madison Dividend Value ETF | | | 27,304,650 | | | | - | | | | (8,004,375 | ) | | | 36,375 | | | | 4,753,350 | | | | 24,090,000 | | | | 1,100,000 | | | | 624,076 | | | | – | |
| Madison Short Term Strategic Income ETF | | | 26,909,375 | | | | 1,548,562 | | | | – | | | | – | | | | 933,044 | | | | 29,390,981 | | | | 1,437,500 | | | | 1,475,719 | | | | – | |
| Totals | | $ | 111,220,837 | | | $ | 3,081,125 | | | $ | (12,666,974 | ) | | $ | (99,139 | ) | | $ | 6,746,086 | | | $ | 108,281,935 | | | | | | | $ | 7,785,875 | | | $ | 367,775 | |
| 1 | Distributions received include distributions from capital gains from the Underlying Funds. |
15. SUBSEQUENT EVENTS
Management has evaluated the impact of all subsequent events on the Funds through the date the financial statements were available for issue. Effective on or about after market close on February 14, 2025, the Class C shares of the Conservative Allocation, Moderate Allocation, Aggressive Allocation, Diversified Income and Covered Call & Equity Income Funds will be automatically converted into Class A shares of each respective fund.
Effective on or about after market close on February 21, 2025, the Madison Tax-Free Virginia, Sustainable Equity and International Stock Funds will be liquidated.
No other events have taken place that meet the definition of subsequent event that require adjustment to, or disclosure in the financial statements.
Madison Funds | October 31, 2024
Report of Independent Registered Public Accounting Firm
Report Of Independent Registered Public Accounting Firm
To the shareholders and the Board of Trustees of Madison Funds:
Opinion on the Financial Statements and Financial Highlights
We have audited the accompanying statements of assets and liabilities of Madison Funds (the “Funds”) comprising Madison Conservative Allocation Fund, Madison Moderate Allocation Fund, Madison Aggressive Allocation Fund, Madison Diversified Income Fund, Madison Tax-Free Virginia Fund, Madison Tax-Free National Fund, Madison High Quality Bond Fund, Madison Core Bond Fund, Madison Covered Call & Equity Income Fund, Madison Dividend Income Fund, Madison Investors Fund, Madison Sustainable Equity Fund, Madison Mid Cap Fund, Madison Small Cap Fund, and Madison International Stock Fund, including the portfolios of investments as of October 31, 2024, the related statements of operations, the statements of changes in net assets, and the financial highlights for the periods indicated in the table below; and the related notes. In our opinion, the financial statements and financial highlights present fairly, in all material respects, the financial position of each of the funds constituting the Madison Funds, as of October 31, 2024, and the results of their operations, the changes in their net assets, and the financial highlights for the periods listed in the table below, in conformity with accounting principles generally accepted in the United States of America.
Individual Funds Comprising Madison Funds | | Statements of Operations | | Statements of Changes in Net Assets | | Financial Highlights |
| Madison Conservative Allocation Fund | | For the year ended October 31, 2024 | | For the years ended October 31, 2024 and 2023 | | For the years ended October 31, 2024, 2023, 2022, 2021 and 2020 |
| Madison Moderate Allocation Fund | | For the year ended October 31, 2024 | | For the years ended October 31, 2024 and 2023 | | For the years ended October 31, 2024, 2023, 2022, 2021 and 2020 |
| Madison Aggressive Allocation Fund | | For the year ended October 31, 2024 | | For the years ended October 31, 2024 and 2023 | | For the years ended October 31, 2024, 2023, 2022, 2021 and 2020 |
| Madison Diversified Income Fund | | For the year ended October 31, 2024 | | For the years ended October 31, 2024 and 2023 | | For the years ended October 31, 2024, 2023, 2022, 2021 and 2020 |
| Madison Tax-Free Virginia Fund | | For the year ended October 31, 2024 | | For the years ended October 31, 2024 and 2023 | | For the years ended October 31, 2024, 2023, 2022, 2021 and 2020 |
| Madison Tax-Free National Fund | | For the year ended October 31, 2024 | | For the years ended October 31, 2024 and 2023 | | For the years ended October 31, 2024, 2023, 2022, 2021 and 2020 |
| Madison High Quality Bond Fund | | For the year ended October 31, 2024 | | For the years ended October 31, 2024 and 2023 | | For the years ended October 31, 2024, 2023, 2022, 2021 and 2020 |
| Madison Core Bond Fund | | For the year ended October 31, 2024 | | For the years ended October 31, 2024 and 2023 | | For the years ended October 31, 2024, 2023, 2022, 2021 and 2020 |
| Madison Covered Call & Equity Income Fund | | For the year ended October 31, 2024 | | For the years ended October 31, 2024 and 2023 | | For the years ended October 31, 2024, 2023, 2022, 2021 and 2020 |
| Madison Dividend Income Fund | | For the year ended October 31, 2024 | | For the years ended October 31, 2024 and 2023 | | For the years ended October 31, 2024, 2023, 2022, 2021 and 2020 |
| Madison Investors Fund | | For the year ended October 31, 2024 | | For the years ended October 31, 2024 and 2023 | | For the years ended October 31, 2024, 2023, 2022, 2021 and 2020 |
| Madison Sustainable Equity Fund | | For the year ended October 31, 2024 | | For the years ended October 31, 2024 and 2023 | | For the years ended October 31, 2024, 2023 and for the period January 3, 2022 (commencement of operations) through October 31, 2022. |
| Madison Mid Cap Fund | | For the year ended October 31, 2024 | | For the years ended October 31, 2024 and 2023 | | For the years ended October 31, 2024, 2023, 2022, 2021 and 2020 |
| Madison Small Cap Fund | | For the year ended October 31, 2024 | | For the years ended October 31, 2024 and 2023 | | For the years ended October 31, 2024, 2023, 2022, 2021 and 2020 |
| Madison International Stock Fund | | For the year ended October 31, 2024 | | For the years ended October 31, 2024 and 2023 | | For the years ended October 31, 2024, 2023, 2022, 2021 and 2020 |
Madison Funds | October 31, 2024
Report of Independent Registered Public Accounting Firm
Basis for Opinion
These financial statements and financial highlights are the responsibility of the Funds’ management. Our responsibility is to express an opinion on the Funds’ financial statements and financial highlights based on our audits. We are a public accounting firm registered with the Public Company Accounting Oversight Board (United States) (PCAOB) and are required to be independent with respect to the Funds in accordance with the U.S. federal securities laws and the applicable rules and regulations of the Securities and Exchange Commission and the PCAOB.
We conducted our audits in accordance with the standards of the PCAOB. Those standards require that we plan and perform the audit to obtain reasonable assurance about whether the financial statements and financial highlights are free of material misstatement, whether due to error or fraud. The Funds are not required to have, nor were we engaged to perform, an audit of their internal control over financial reporting. As part of our audits we are required to obtain an understanding of internal control over financial reporting but not for the purpose of expressing an opinion on the effectiveness of the Funds’ internal control over financial reporting. Accordingly, we express no such opinion.
Our audits included performing procedures to assess the risks of material misstatement of the financial statements and financial highlights, whether due to error or fraud, and performing procedures that respond to those risks. Such procedures included examining, on a test basis, evidence regarding the amounts and disclosures in the financial statements and financial highlights. Our audits also included evaluating the accounting principles used and significant estimates made by management, as well as evaluating the overall presentation of the financial statements and financial highlights. Our procedures included confirmation of securities owned as of October 31, 2024, by correspondence with the custodian and brokers. We believe that our audits provide a reasonable basis for our opinion.
/s/ Deloitte & Touche LLP
Chicago, Illinois
December 30, 2024
We have served as the auditor of one or more Madison Funds investment companies since 2009.
Madison Funds | October 31, 2024
Other Information (unaudited)
AVAILABILITY OF QUARTERLY PORTFOLIO SCHEDULES
The Fund files a complete schedule of portfolio holdings with the SEC for the first and third quarters of each fiscal year on Form NPORT-EX. Form NPORT-EX is available upon request to shareholders at no cost on the Fund’s website at www.madisonfunds.com, on the SEC’s website at www.sec.gov, or by calling 1-800-767-0300. Form NPORT-EX may also be reviewed and copied at the SEC’s Public Reference Room in Washington, DC. More information on the operation of the Public Reference Room may be obtained by calling 1-800-SEC-0330.
PROXY VOTING POLICIES, PROCEDURES AND RECORDS
A description of the policies and procedures used by the Funds to vote proxies related to portfolio securities is available to shareholders on the Funds’ website at www.madisonfunds.com or upon request by calling 1-800-877-6089 or on the SEC’s website at www.sec.gov. The proxy voting records for the Funds for the most recent twelve month period ended June 30 are available to shareholders at no cost on the SEC’s website at www.sec.gov.
PROXY VOTING RESULTS
At the special meeting of shareholders held November 30, 2023, shareholders of each Fund, except the Madison Covered Call and Equity Income Fund, approved a new investment advisory agreement between Madison and the Trust, on behalf of each Fund, which took effect on December 1, 2023. The voting results are described in the table below.
| | | Outstanding Shares | | | | | | | |
| Fund | | (O/S) Voted | | | % O/S | | | % Voted | |
| Conservative Allocation Fund | | | | | | | | | | | | |
| For: | | | 2,160,396.58 | | | | 43.695 | % | | | 74.860 | % |
| Against/Withhold: | | | 128,292.67 | | | | 2.595 | % | | | 4.445 | % |
| Abstain: | | | 215,909.20 | | | | 4.367 | % | | | 7.482 | % |
| BNV*: | | | 381,302.00 | | | | 7.712 | % | | | 13.213 | % |
| Moderate Allocation Fund | | | | | | | | | | | | |
| For: | | | 4,468,254.06 | | | | 46.922 | % | | | 84.893 | % |
| Against/Withhold: | | | 393,666.91 | | | | 4.134 | % | | | 7.479 | % |
| Abstain: | | | 101,260.31 | | | | 1.063 | % | | | 1.924 | % |
| BNV*: | | | 300,201.00 | | | | 3.152 | % | | | 5.704 | % |
| Aggressive Allocation Fund | | | | | | | | | | | | |
| For: | | | 2,684,031.09 | | | | 52.688 | % | | | 82.138 | % |
| Against/Withhold: | | | 193,707.40 | | | | 3.802 | % | | | 5.928 | % |
| Abstain: | | | 112,660.69 | | | | 2.212 | % | | | 3.448 | % |
| BNV*: | | | 277,312.00 | | | | 5.444 | % | | | 8.486 | % |
| Diversified Income Fund | | | | | | | | | | | | |
| For: | | | 4,506,350.51 | | | | 43.380 | % | | | 75.087 | % |
| Against/Withhold: | | | 155,401.35 | | | | 1.496 | % | | | 2.589 | % |
| Abstain: | | | 165,461.23 | | | | 1.593 | % | | | 2.757 | % |
| BNV*: | | | 1,174,277.00 | | | | 11.304 | % | | | 19.566 | % |
| Tax-Free Virginia Fund | | | | | | | | | | | | |
| For: | | | 1,011,770.84 | | | | 62.272 | % | | | 87.273 | % |
| Against/Withhold: | | | 33,044.56 | | | | 2.034 | % | | | 2.850 | % |
| Abstain: | | | 20,413.21 | | | | 1.256 | % | | | 1.761 | % |
| BNV*: | | | 94,083.00 | | | | 5.791 | % | | | 8.115 | % |
| Tax-Free National Fund | | | | | | | | | | | | |
| For: | | | 1,060,468.45 | | | | 59.506 | % | | | 89.936 | % |
| Against/Withhold: | | | 34,187.54 | | | | 1.918 | % | | | 2.899 | % |
| Abstain: | | | 47,098.32 | | | | 2.643 | % | | | 3.994 | % |
| BNV*: | | | 37,385.00 | | | | 2.098 | % | | | 3.171 | % |
| High Quality Bond Fund | | | | | | | | | | | | |
| For: | | | 3,420,861.44 | | | | 63.199 | % | | | 74.571 | % |
| Against/Withhold: | | | 13,588.00 | | | | 0.251 | % | | | 0.296 | % |
| Abstain: | | | 37,131.00 | | | | 0.686 | % | | | 0.809 | % |
| BNV*: | | | 1,115,782.00 | | | | 20.614 | % | | | 24.323 | % |
| Core Bond Fund | | | | | | | | | | | | |
| For: | | | 16,607,522.23 | | | | 75.968 | % | | | 84.684 | % |
| Against/Withhold: | | | 117,843.75 | | | | 0.539 | % | | | 0.601 | % |
| Abstain: | | | 32,732.24 | | | | 0.150 | % | | | 0.167 | % |
| BNV*: | | | 2,853,107.00 | | | | 13.051 | % | | | 14.548 | % |
| Dividend Income Fund | | | | | | | | | | | | |
| For: | | | 3,554,050.73 | | | | 43.911 | % | | | 69.562 | % |
| Against/Withhold: | | | 114,266.12 | | | | 1.412 | % | | | 2.236 | % |
| Abstain: | | | 161,180.48 | | | | 1.991 | % | | | 3.155 | % |
| BNV*: | | | 1,279,710.00 | | | | 15.811 | % | | | 25.047 | % |
Madison Funds | October 31, 2024
Other Information (unaudited) - continued
| | | Outstanding Shares | | | | | | | |
| Fund | | (O/S) Voted | | | % O/S | | | % Voted | |
| Investors Fund | | | | | | | | | |
| For: | | | 8,598,998.35 | | | | 63.785 | % | | | 82.629 | % |
| Against/Withhold: | | | 106,200.74 | | | | 0.788 | % | | | 1.020 | % |
| Abstain: | | | 169,069.73 | | | | 1.254 | % | | | 1.625 | % |
| BNV*: | | | 1,532,519.00 | | | | 11.368 | % | | | 14.726 | % |
| Sustainable Equity Fund | | | | | | | | | | | | |
| For: | | | 943,593.28 | | | | 99.087 | % | | | 100.000 | % |
| Against/Withhold: | | | — | | | | 0.000 | % | | | 0.000 | % |
| Abstain: | | | — | | | | 0.000 | % | | | 0.000 | % |
| BNV*: | | | — | | | | 0.000 | % | | | 0.000 | % |
| Mid Cap Fund | | | | | | | | | | | | |
| For: | | | 37,633,780.51 | | | | 63.855 | % | | | 78.405 | % |
| Against/Withhold: | | | 279,341.54 | | | | 0.474 | % | | | 0.582 | % |
| Abstain: | | | 519,805.38 | | | | 0.882 | % | | | 1.083 | % |
| BNV*: | | | 9,566,498.00 | | | | 16.232 | % | | | 19.930 | % |
| Small Cap Fund | | | | | | | | | | | | |
| For: | | | 8,966,612.89 | | | | 48.483 | % | | | 77.466 | % |
| Against/Withhold: | | | 95,275.81 | | | | 0.515 | % | | | 0.823 | % |
| Abstain: | | | 236,180.63 | | | | 1.277 | % | | | 2.040 | % |
| BNV*: | | | 2,276,818.00 | | | | 12.311 | % | | | 19.670 | % |
| International Stock Fund | | | | | | | | | | | | |
| For: | | | 786,466.68 | | | | 51.861 | % | | | 84.098 | % |
| Against/Withhold: | | | 50,892.16 | | | | 3.356 | % | | | 5.442 | % |
| Abstain: | | | 23,168.59 | | | | 1.528 | % | | | 2.477 | % |
| BNV*: | | | 74,647.00 | | | | 4.922 | % | | | 7.982 | % |
At the special meeting of shareholders held January 29, 2024, shareholders of the Madison Covered Call and Equity Income Fund approved a new investment advisory agreement between Madison and the Trust, on behalf of the fund. The voting results are described in the table below.
| | | Outstanding Shares | | | | | | | |
| Fund | | (O/S) Voted | | | % O/S | | | % Voted | |
| Covered Call & Equity Income Fund | | | | | | | | | | | | |
| For: | | | 11,875,871.00 | | | | 47.477 | % | | | 68.465 | % |
| Against/Withhold: | | | 293,537.05 | | | | 1.174 | % | | | 1.692 | % |
| Abstain: | | | 554,923.00 | | | | 2.218 | % | | | 3.199 | % |
| BNV*: | | | 4,621,827.05 | | | | 18.476 | % | | | 26.643 | % |
At the special meeting of shareholders held on November 30, 2023, shareholders of the Funds voting as a single group, approved the appointment of Jill Friedow as an Interested Trustee to the Board of Trustees, to serve until her successor shall have been elected and qualified. The voting results are described in the table below.
| | | Outstanding Shares | | | | | | | |
| Fund | | (O/S) Voted | | | % O/S | | | % Voted | |
| Madison Funds ("Trust") | | | | | | | | | | | | |
| For: | | | 132,603,978.24 | | | | 70.867 | % | | | 96.671 | % |
| Withhold: | | | 4,565,750.62 | | | | 2.440 | % | | | 3.329 | % |
| * | Broker Non-Votes (“BNV”): For purposes of determining the presence of a quorum for a proposal, abstentions and broker “non-votes” were counted as shares present. Broker “non-votes” occur when a nominee holding shares for a beneficial owner does not vote on a proposal because the nominee does not have discretionary voting powers with respect to that proposal and has not received instructions from the beneficial owner. Abstentions and broker non-votes had the effect of an “against” vote on approval of new advisory agreement since such shares are not voted in favor of this Proposal. Abstentions and broker non-votes had no effect on the vote on approval of election of Jill Friedow as an Interested Trustee. |
TAX INFORMATION
Foreign Tax Credits: The Funds expect to make an election under Internal Revenue Code Section 853 to pass through foreign taxes paid by the Funds to their shareholders. For the year ended October 31, 2024, the following funds intend to pass through foreign tax credits and have derived gross income from foreign countries amounting to:
| Fund | | Foreign Tax Credit Pass-Through | | | Foreign Source Income | |
| International Stock Fund | | $ | 21,163 | | | $ | 271,421 | |
Madison Funds | October 31, 2024
Other Information (unaudited) - concluded
Corporate Dividends Received Deduction: For the taxable year ended October 31, 2024, the following percentage of income dividends paid by the fund qualify for the dividends received deduction available to corporations:
| Fund | | Percentage | |
| Conservative Allocation | | | 8.89 | % |
| Moderate Allocation | | | 15.71 | % |
| Aggressive Allocation | | | 26.23 | % |
| Diversified Income | | | 0.02 | % |
| Covered Call & Equity Income | | | 16.90 | % |
| Dividend Income | | | 100.00 | % |
| Fund | | Percentage | |
| Investors | | | 94.85 | % |
| Sustainable Equity | | | 100.00 | % |
| Mid Cap | | | 50.81 | % |
Qualified Dividend Income: For the taxable year ended October 31, 2024, the funds hereby designate the maximum amount of dividends allowable pursuant to the Internal Revenue Code, as qualified dividend income (“QDI”) eligible for reduced tax rates (the rates range from 5% to 15% depending upon individual’s tax bracket). Complete information regarding each fund’s income distributions paid during the calendar year 2024, including the portion, if any, which qualify as QDI, will be reported in conjunction with Form 1099-DIV.
| Fund | | Amount | |
| Conservative Allocation | | $ | 187,215 | |
| Moderate Allocation | | | 629,755 | |
| Aggressive Allocation | | | 522,904 | |
| Diversified Income | | | 358,185 | |
| Covered Call Equity Income | | | 3,685,795 | |
| Dividend Income | | | 3,452,332 | |
| Fund | | Amount | |
| Investors | | $ | 3,348,138 | |
| Sustainable Equity | | | 87,896 | |
| Mid Cap | | | 1,977,913 | |
| International Stock Fund | | | 61,820 | |
4460-P1060
Rev.1024
Item 8. Changes in and Disagreements with Accountants for Open-End Management Investment Companies.
The registrant has had no changes in or disagreements with accountants and on accounting and financial disclosure required by Item 304 of Regulation S-K [17 CFR 229.304].
Item 9. Proxy Disclosures for Open-End Management Investment Companies.
The registrant had matters submitted during the period covered by the report to a vote of shareholders of an open-end management investment company registered on Form N-1A [17 CFR 239.15A and 17 CFR 274.11A], though the solicitation of proxies or otherwise. Proxy voting results are included as part of the Financial Statement and Financial Highlights for Open-End Management Investment Companies filed under Item 7 of this Form.
Item 10. Remuneration Paid to Directors, Officers, and Others of Open-End Management Investment Companies.
The registrant discloses remuneration paid to directors, officers, and others as part of the financial statements included in item 7 of this Form.
Item 11. Statement Regarding Basis for Approval of Investment Advisory Contract.
There were no investment advisory contracts for the registrant’s board of directors to approve during the Fund’s most recent fiscal half-year.
Item 12. Disclosure of Proxy Voting Policies and Procedures for Closed-End Management Investment Companies.
Not applicable.
Item 13. Portfolio Managers of Closed-End Management Investment Companies.
Not applicable.
Item 14. Purchases of Equity Securities by Closed-End Management Investment Company and Affiliated Purchasers.
Not applicable.
Item 15. Submission of Matters to a Vote of Security Holders.
The registrant does not normally hold shareholder meetings. There have been no changes to the registrant’s procedures during the period covered by this report.
Item 16. Controls and Procedures.
| (a) | The registrant’s President (principal executive officer) and Treasurer (principal financial officer) determined that the registrant’s disclosure controls and procedures (as defined in Rule 30a-3(c) under the Investment Company Act of 1940 (the “Act”)) are effective, based on their evaluation of these controls and procedures required by Rule 30a-3(b) under the Act and Rules 13a-15(b) or 15d-15(b) under the Securities Exchange Act of 1934 within 90 days of the date of this report. There were no significant changes in the registrant’s internal controls or in other factors that could significantly affect these controls subsequent to the date of their evaluation. The officers identified no significant deficiencies or material weaknesses. |
| (b) | There were no changes in the registrant’s internal control over financial reporting (as defined in Rule 30a-3(d) under the Act) that occurred during the period covered by this report that has materially affected, or is reasonably likely to materially affect, the registrant’s internal control over financial reporting. |
Item 17. Disclosure of Securities Lending Activities for Closed-End Management Investment Companies.
Not applicable.
Item 18. Recovery of Erroneously Awarded Compensation.
The registrant did not require an accounting restatement that required recovery of erroneously awarded compensation pursuant to the registrant’s compensation recovery policy required by the listing standards adopted pursuant to 17 CFR 240.10D-1.
Item 19. Exhibits.
| (a) | (1) Code of ethics – See Item 2. |
(2) Not applicable.
(3) Certifications of principal executive and principal financial officers as required by Rule 30a-2(a) under the Act. – Filed herewith.
(4) Not applicable.
(5) There was no change in the registrant’s independent public accountant for the period covered by this report.
CERTIFICATIONS
REPORT OF INDEPENDENT REGISTERED PUBLIC ACCOUNTING FIRM
To the shareholders and the Board of Trustees of Madison Funds:
In planning and performing our audits of the financial statements of Madison Funds (the “Funds”) comprising the Madison Conservative Allocation Fund, Madison Moderate Allocation Fund, Madison Aggressive Allocation Fund, Madison Diversified Income Fund, Madison Tax-Free Virginia Fund, Madison Tax-Free National Fund, Madison High Quality Bond Fund, Madison Core Bond Fund, Madison Covered Call & Equity Income Fund, Madison Dividend Income Fund, Madison Investors Fund, Madison Sustainable Equity Fund, Madison Mid Cap Fund, Madison Small Cap Fund, and Madison International Stock Fund as of and for the year ended October 31, 2024, in accordance with the standards of the Public Company Accounting Oversight Board (United States) (PCAOB), we considered the Funds’ internal control over financial reporting, including controls over safeguarding securities, as a basis for designing our auditing procedures for the purpose of expressing our opinion on the financial statements and to comply with the requirements of Form N-CEN, but not for the purpose of expressing an opinion on the effectiveness of the Funds’ internal control over financial reporting. Accordingly, we express no such opinion.
The management of the Funds is responsible for establishing and maintaining effective internal control over financial reporting. In fulfilling this responsibility, estimates and judgments by management are required to assess the expected benefits and related costs of controls. A fund’s internal control over financial reporting is a process designed to provide reasonable assurance regarding the reliability of financial reporting and the preparation of financial statements for external purposes in accordance with generally accepted accounting principles. A fund’s internal control over financial reporting includes those policies and procedures that (1) pertain to the maintenance of records that, in reasonable detail, accurately and fairly reflect the transactions and dispositions of the assets of the fund; (2) provide reasonable assurance that transactions are recorded as necessary to permit preparation of financial statements in accordance with generally accepted accounting principles, and that receipts and expenditures of the fund are being made only in accordance with authorizations of management and directors of the fund; and (3) provide reasonable assurance regarding prevention or timely detection of unauthorized acquisition, use, or disposition of a fund’s assets that could have a material effect on the financial statements.
Because of its inherent limitations, internal control over financial reporting may not prevent or detect misstatements. Also, projections of any evaluation of effectiveness to future periods are subject to the risk that controls may become inadequate because of changes in conditions, or that the degree of compliance with the policies or procedures may deteriorate.
A deficiency in internal control over financial reporting exists when the design or operation of a control does not allow management or employees, in the normal course of performing their assigned functions, to prevent or detect misstatements on a timely basis. A material weakness is a deficiency, or a combination of deficiencies, in internal control over financial reporting, such that there is a reasonable possibility that a material misstatement of the funds’ annual or interim financial statements will not be prevented or detected on a timely basis.
Our consideration of the Funds’ internal control over financial reporting was for the limited purpose described in the first paragraph and would not necessarily disclose all deficiencies in internal control that might be material weaknesses under standards established by the PCAOB. However, we noted no deficiencies in the Funds’ internal control over financial reporting and its operation, including controls for safeguarding securities that we consider to be a material weakness, as defined above, as of October 31, 2024.
This report is intended solely for the information and use of management and the Board of Trustees of the Funds and the Securities and Exchange Commission and is not intended to be and should not be used by anyone other than these specified parties.
/s/ Deloitte & Touche LLP
Chicago, Illinois
December 30, 2024
SIGNATURES
Pursuant to the requirements of the Securities Exchange Act of 1934 and the Investment Company Act of 1940, the Registrant has duly caused this Report to be signed on its behalf by the undersigned, thereunto duly authorized.
Madison Funds
Steve J. Fredricks, Chief Legal Officer & Chief Compliance Officer
Date: December 30, 2024
Pursuant to the requirements of the Securities Exchange Act of 1934 and the Investment Company Act of 1940, this Report has been signed below by the following persons on behalf of the Registrant and in the capacities and on the dates indicated.
Patrick F. Ryan, Principal Executive Officer
Date: December 30, 2024
Greg D. Hoppe, Principal Financial Officer & Principal Accounting Officer
Date: December 30, 2024