united states
securities and exchange commission
washington, d.c. 20549
form n-csr
certified shareholder report of registered management
investment companies
Investment Company Act file number 811-08253
The Boyar Value Fund, Inc.
(Exact name of registrant as specified in charter)
35 East 21st Street, New York, NY 10010
(Address of principal executive offices) (Zip code)
James Ash, Gemini Fund Services, LLC
80 Arkay Drive Suite 110, Hauppauge, NY 11788
(Name and address of agent for service)
Registrant's telephone number, including area code: 212 995-8300
Date of fiscal year end: 12/31
Date of reporting period: 6/30/22
Item 1. Reports to Stockholders.
 | Our favorite holding period is forever.
-- Warren Buffett |
Dear Boyar Value Fund Shareholder:
After a ~21% decline in the S&P 500 during the first half of 2022, the P/E multiple of the index has declined from 21.2x to ~15.9x (slightly less than the 25-year forward average of 16.9x). Although energy stocks advanced by 31.8%, the 10 other S&P 500 sectors declined in value, with consumer discretionary, communication services, and technology shares the biggest laggards at -32.8%, -30.2%, and -26.9%, respectively. The reasons for the decrease have included a smorgasbord of investor concerns, from inflation and interest rates to recession fears, the war in Ukraine, supply chain disruptions, and an economic slowdown in China.
The resulting wealth destruction has been severe, with the Financial Times reporting the evisceration of more than $9 trillion in U.S. stock market value during the first half of 2022. All major asset classes except commodities decreased in value, with even “safe” fixed-income investments declining precipitously amid a sharp increase in interest rates. According to JP Morgan, investors in 30-year Treasuries lost ~23%, investors in investment-grade corporate debt almost 15%, and municipal bond holders ~9%. Cryptocurrencies (the epitome of pure speculation, in our view) were decimated, with Bitcoin, the most popular cryptocurrency, losing nearly 60% in the first half of 2022.
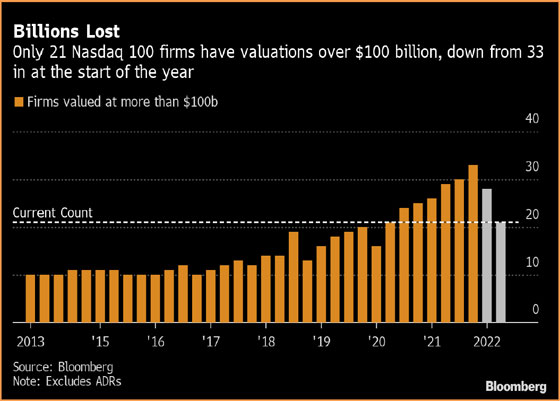
The performance of the Nasdaq 100 was particularly painful, with almost a third of its value lost. By the end of June, only 21 Nasdaq 100 firms were valued above $100 billion, down from 33 at the beginning of 2022.
32 West 39th Street ● 9th Floor ● New York, NY 10018 ● P. 212.995.8300 ● F. 212.995.5636
www.BoyarAssetManagement.com
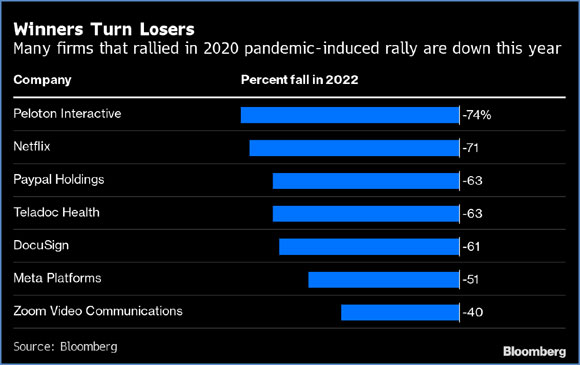
Many pandemic darlings, like Teladoc, DocuSign, and Peloton, were among the biggest decliners during the first half of 2022. We make no predictions about the performance of specific pandemic highflyers, but we do expect the current period to be reminiscent of the dotcom crash, when many former market leaders lost 75%-90% of their value, never again to approach their previous highs. It is worth remembering that after the Nasdaq peaked in March 2000, it took 15 years to surpass its 2000 high. Even if a few of the pandemic era’s “fallen angels” surpass their former highs, we believe that they will be the exception, not the rule—so to those seeing these former pandemic darlings as bargains for having lost 60%-70% of their value, we say only caveat emptor.
Market Gyrations and Current Sentiment
This year’s daily market gyrations have been dizzying, with the S&P 500 moving 1% (up or down) on nearly half of trading days. If this trend continues, it will be the second time that this high a percentage of “1% days” has occurred in the past 25 years. (Notably, the other time was 2008.) Investor sentiment is at multiyear lows (Bank of America’s bull-and-bear indicator of trader sentiment recently registered “maximum bearishness” 3 weeks running), and consumer confidence is even lower than after the September 11 attacks, during the 2008–2009 financial crisis, and during the coronavirus lockdowns. Both these markers have historically been great contraindicators for future stock market returns.
Consumer Confidence and the Stock Market
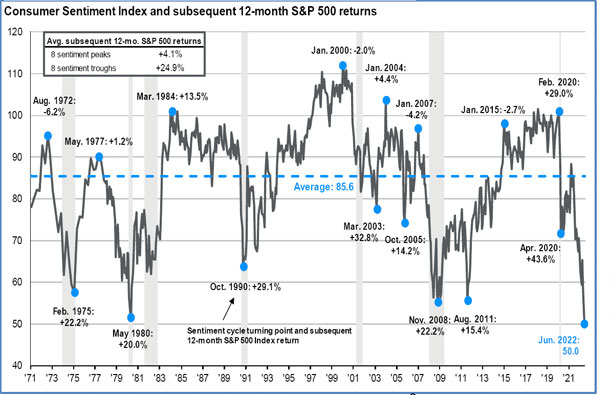
Source: JP Morgan Guide to the Markets.
Consumer confidence could certainly decrease further, but according to JP Morgan, the S&P 500’s average 12-month return after the eight consumer confidence troughs since 1971 has been +24.9%. No one knows how much further consumer confidence will erode, but historically periods of extreme weakness in consumer confidence have been some of equity investors’ best buying opportunities. In its midyear
outlook, JP Morgan Global Research summed up the situation by saying, “Positioning and sentiment of investors is at multi-decade lows. So, it is not that we think that the world and economies are in great shape, but just that an average investor expects an economic disaster, and if that does not materialize risky assets classes could recover most of their losses from the first half.” Admittedly, predicting the timing of a recovery is all but impossible, but we’ve found that the best buying opportunities often come when investors feel worst about the prospects for equities.
Why Don’t You Sell Now, Then Buy When the Situation Stabilizes?
With so many negative headlines, clients have asked us why we don’t sell in a downturn and wait for the situation to “stabilize.” As simple as it might sound, such an idea is impossible to implement and poses a serious risk to investors’ financial well-being. As famed investor Howard Marks pointed out in a recent memo, missing just a few days could significantly eat into your long-term return. According to data from JP Morgan, from 1999 to 2018, the S&P 500’s annual return was 5.6%, a figure that dropped to only 2.0% for investors who missed the 10 best trading days (roughly 0.4% of the total trading days during the period). Investors who were unfortunate enough to miss the best 20 trading days made no money at all. The market’s best days tend to follow its worst days, and investors who sell out at these times of maximum pessimism are likely to miss the rebound.
We haven’t decreased our equity exposure, and we don’t plan to; instead, we like to take advantage of these moments of market dislocation to increase our equity holdings. We’re pained at the thought of losing money for our clients, but we see this year’s losses thus far as “paper losses,” not as a permanent loss of capital. After all, the price of a stock on any given day is simply what people are willing to pay for a business at that moment. But we believe that over the long term, either the stock market will come to reflect the business’s true value or an acquirer will purchase it for its true worth, as we’ve seen so many times before. We have no reason to believe that this time will be any different.
Putting Returns in Context
This year’s results for equity investors have been painful, but they’re hardly unprecedented, and they should be viewed in their proper context. The media have taken to calling the first half of 2022 the worst beginning to a year since 1970, but that’s only one way of comparing current and historical stock market performance. Historically, a 20% drop has not been uncommon: according to Adviser Investments, since 1957 the S&P 500 has declined by 20%+ on 13 occasions (roughly once every 5 years), and according to JP Morgan, since 1980 the average intrayear drop has been ~14%. What’s more, Ned Davis Research reports, first -half starts where the S&P 500 has lost a significant amount historically have been followed by second-half rebounds (18.7% on average).
| Year | Through Mid-June | Rest of Year | Full Year | Bear End Date |
| 2022 | -23.1% | ? | ? | ? |
| 1970 | -17.3% | 21.0% | 0.1% | 5/26/1970 |
| 1962 | -22.1% | 13.2% | -11.8% | 6/26/1962 |
| 1940 | | -20.1% | | 6.0% | | -15.3% | 4/28/1942 |
| 1932 | -36.9% | 34.6% | -15.1% | 2/27/1933 |
Source: Ned Davis Research
Performance
The Boyar Value Fund lost 15.93% for the second quarter versus an 11.43% decline for the S&P 1500 Value Index. For the year, The Boyar Value Fund has lost 23.06% versus an 11.63% decline for the S&P 1500 Value index.
Reasons for Optimism
Historically, investors who have purchased stocks during a bear market have tended to eventually be richly rewarded (if they had a long-term horizon and held on to their positions even through the worst of times). The folks at Miller Value Partners, a highly respected value investing firm, recently published an analysis of all the U.S. bear markets since 1939 that contained some interesting findings:
The Good News
| ● | Regardless of whether a bear market led to a recession, in most cases the subsequent 1-, 3-, and 5-year results were significantly above the “average” long-term stock market return. |
| ● | The median 1-, 3-, and 5-year returns of bear markets that also coincided with recessions (with 3- and 5-year returns annualized) were 34%, 14%, and 9%, respectively. When the bear market did not result in a recession, the 1-, 3-, and 5-year median returns were 8%, 11%, and 13%, respectively. Interestingly, the 1- and 3-year median returns were higher in recessions, but those periods experienced a deeper total drop (in percentage terms) and took longer to bottom. |
The Bad News
| ● | The median drawdown (investors’ percentage loss from high to low) was 34% during bear markets that were accompanied by a recession and 30% when no recession occurred. |
| ● | As of July 12, the S&P 500 was down ~18.5% from its highs, so if history is any guide, we may have a significant amount of downside still to come. However, many stocks in the S&P 500 and Russell 2000 are down 40% or more from their all-time highs, so although the overall market might not have bottomed, many individual stocks might have already done so. |
| SPX Drawdown Analysis Starting in 1939 with a Minimum Decline of -20% |
| | | | | | | | | | | Forward Performance following -20% Drawdown* |
| Start Date | End Date | Duration
(Mo.) | Drawdown
(Peak to Trough) | Trough Forward P/E | Forward P/E at -20% Drawdown | Peak CPI | Recession/Non-
Recession | Additional Drawdown After -20% Decline | Months from Trough | 1-YR | 3-YR | 5-YR |
| 10/25/1939 | 6/10/1940 | 8 Months | -32% | 8.5x | 9.7x | 2.2% | No Recession | -15% | 1 Months | -4% | 11% | 13% |
| 11/7/1940 | 4/28/1942 | 18 Months | -34% | 7.0x | 9.6x | 12.7% | No Recession | -18% | 5 Months | 9% | 19% | 16% |
| 5/29/1946 | 5/19/1947 | 12 Months | 28% | 8.1x | 10.4x | 19.7% | No Recession | -11% | 8 Months | 2% | 6% | 17% |
| 6/15/1948 | 6/13/1949 | 12 Months | -21% | 5.7x | 5.7x | 9.9% | Recession | -1% | 0 Months | 59% | 32% | 25% |
| 8/2/1956 | 10/22/1957 | 15 Months | -22% | 13.5x | 13.6x | 3.7% | Recession | -2% | 0 Months | 34% | 14% | 11% |
| 12/12/1961 | 6/26/1962 | 7 Months | -28% | 14.1x | 15.0x | 1.3% | No Recession | -10% | 1 Months | 25% | 19% | 13% |
| 2/9/1966 | 10/7/1966 | 8 Months | -22% | 13.8x | 14.0x | 3.8% | No Recession | -3% | 1 Months | 28% | 12% | 10% |
| 11/29/1968 | 5/26/1970 | 18 Months | -36% | 13.3x | 16.7x | 6.2% | Recession | -20% | 4 Months | 15% | 14% | 1% |
| 1/11/1973 | 10/3/1974 | 21 Months | -48% | 8.0x | 10.5x | 12.1% | Recession | -35% | 10 Months | -24% | 7% | 5% |
| 11/28/1980 | 8/12/1982 | 21 Months | -27% | 7.7x | 9.0x | 12.6% | Recession | -9% | 6 Months | 37% | 23% | 26% |
| 8/25/1987 | 12/4/1987 | 3 Months | -34% | 9.4x | 9.5x | 4.5% | No Recession | -17% | 2 Months | 7% | 9% | 13% |
| 7/16/1990 | 10/11/1990 | 3 Months | -20% | 18.5x | 18.5x | 6.3% | Recession | 0% | 0 Months | 34% | 20% | 18% |
| 3/24/2000 | 10/9/2002 | 31 Months | -49% | 15.9x | 47.8x | 3.8% | Recession | -36% | 19 Months | -3% | -1% | 3% |
| 10/9/2007 | 3/9/2009 | 17 Months | -57% | 11.1x | 99.3x | 5.6% | Recession | -46% | 8 Months | -28% | 5% | 8% |
| 2/19/2020 | 3/23/2020 | 1 Months | -34% | 23.8x | 26.4x | 2.3% | Recession | -17% | 0 Months | 48% | N/A | N/A |
| Average | 13 Months | -33% | 11.9x | 21.0x | 7.1% | | | -16% | 4 Months | 16% | 13% | 13% |
| Median | 12 Months | -32% | 11.1x | 13.6x | 5.6% | | | -15% | 2 Months | 15% | 13% | 13% |
| | | | | | | | | | | | | |
| Avg Recession | 15 Months | -35% | 13.lx | 27.5x | 6.9% | 60% | | -19% | 5 Months | 19% | 14% | 12% |
| Median | 17 Months | -34% | 13.3x | 16.7x | 6.2% | | | -17% | 4 Months | 34% | 14% | 9% |
| | | | | | | | | | | | | |
| Avg No Recession | 9 Months | -30% | 10.1x | 11.4x | 7.4% | 40% | | -12% | 3 Months | 11% | 12% | 14% |
| Median | 8 Months | -30% | 9.0x | 10.1x | 4.2% | | | -13% | 1 Months | 8% | 11% | 13% |
| Current Period |
| 1/3/2022 | 6/16/2022 | 5 Months | -24% | 15.5x | 15.9x | 8.6% | N/A | -4% | 0 Months | N/A | N/A | N/A |
| * The 3 and 5 year returns reflected above are annualized |
| |
** The 1990 bear market fell -19.92% vs the typical definition of a -20% drawdown which we believe should qualify as a bear market and is therefore included in the analysis |
| |
| Source: Miller Value Partners, Bloomberg, and Birinyi Associates |
Source: Miller Value Partners
Where Do We Go from Here?
Going through a bear market is painful, both monetarily and psychologically, but investors should remind themselves that periods of substantial declines have historically been followed by outsized gains. Investors who have the patience, and the financial strength, to stick with their positions during difficult times (and the cash to add to existing positions or initiate new ones) have typically been handsomely rewarded. Each bear market is difficult in its own way, but we see no reason the next 3- to 5-year period should differ substantially from previous bear markets. Remember—the most dangerous words in investing are “It’s different this time.”
Items to Monitor
This year’s headlines have been dominated by fears of runaway inflation and the question of whether the Federal Reserve can navigate a soft landing by raising interest rates just enough to quell inflation but not so much as to cause a severe recession. Whether or not we will eventually meet the commonly thought of definition of a recession (two straight quarters of negative real GDP growth) is academic; stock market investors should assess whether individual equities are already pricing in a significant downturn in their business and whether a given company has the financial wherewithal to withstand a prolonged period of a decline in its business activity. They should then make their investment decisions accordingly.
We’re far from being macroeconomic investors, and we try our best to filter out the geopolitical noise (since the horizon is never free of threats, waiting for all risk to subside is a recipe for poor long-term financial health) so that we can focus on the individual businesses we’re buying or thinking of buying for our clients. Even so, we are paying attention to certain metrics:
| ● | Savings rate: According to Moody’s Analytics, U.S. households built up $2.7 trillion in extra savings from the start of the pandemic through the end of last year. This extra savings propped up consumers during the worst of the outbreak and saved the U.S. from economic collapse but also—combined with factors like the war in Ukraine and severe supply chain disruptions—helped spur a bad case of inflation. Consumer wages are no longer keeping up with inflation, forcing families to draw on savings so that they can pay for groceries, gasoline, and other necessities. The savings rate, which stood at 8.7% in December 2021, had dropped to 5.4% by May. If consumers start pulling back as their savings are depleted, our largely consumer-driven economy (consumption accounts for over two-thirds of our GDP) could feel the effects. Thus far, at least, consumers still seem to be spending, with Bank of America reporting that credit and debit card spending was up 11% from last June (vs. 13% up in April and 9% in May), although for lower-income households, total card spending (excluding gas and groceries) fell 1%. |
| ● | Commodity costs: The Bloomberg commodity index was up 17.38% through July 11 from the end of last year, with commodities such as oil and natural gas advancing ~43% and ~76%, respectively— which has contributed to the significant bout of inflation we’re experiencing. However, over the past month (as of July 11) the commodity index has declined by 14%, with oil and gas down 14% and 27%, respectively. The price of copper has decreased by almost 20% over the same period. If these declines continue, the Federal Reserve might not raise rates as high as investors currently fear, a development that we believe would be positive for equities. However, many other factors could significantly alter the price of commodities—the war in Ukraine, decreases in refinery capacity due to severe hurricanes, or a faster-than-expected reopening of China, to name a few—so investors should watch the news closely. |
| ● | U.S. Housing: Since housing accounts for about 4.8% of the U.S. GDP, investors should be following the sector closely. U.S. mortgage rates started 2022 at approximately 3.1%, and by the week of July 4, the average 30-year fixed rate mortgage had increased to 5.3%—still low by historical standards (considering that the average 30-year rate over the past 40 years has been 7.1%) but the highest figure seen since 2009. The increase in rates has significantly increased potential homebuyers’ monthly mortgage payments (a primary factor in what most homebuyers are willing to pay for a home), and according to mortgage data provider Black Knight, the average price of a home is now more than 6x the median household income, the highest multiple since the early 1970s. With monthly payments having increased so dramatically (according to Prashant Gopal of Bloomberg, a borrower with a $300,000 mortgage today would pay ~$1,665 a month, $383 more than at the end of 2021), housing prices might be expected to decrease. So far, however, this has not happened (although according to Black Knight, in May home price growth slowed in 97 of the 100 largest U.S. housing markets), most likely because the U.S. supply of homes is historically low. In May 2022, there were 1,474,000 single-family homes for sale, versus an average of 2,405,000 since 1982. It should be interesting to see what happens to home prices under these two competing dynamics (higher monthly costs vs. a low supply of homes). A housing downturn, should one occur, would likely have a negative impact on the economy, but we do not believe that we will see a repeat of 2008 (when a housing downturn sparked a financial crisis), as banks have become significantly more selective in assessing borrowers’ |
creditworthiness and homebuyers’ credit scores have improved dramatically since the prior housing bust.
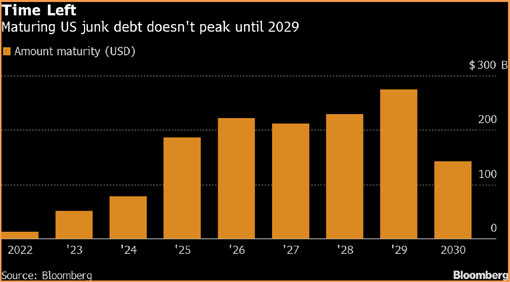
Maturity Issues
One of the major problems of the 2007-2008 financial crisis was that many companies were highly indebted, with their debt due at the worst possible time. It now seems that corporate America has largely learned its lesson, having used the ensuing years of ultra-low interest rates to significantly reduce interest costs while spreading debt maturities far into the future. According to Bloomberg, only ~8% of U.S. dollar company high-yield bonds are due by the end of 2024, with maturities peaking in 2029. By contrast, in the fourth quarter of 2008, fully 18% of the U.S. high-yield market was due to mature in 3 years.
The Wisdom of Taking a Long-Term View
We’ve said it before, and we’ll say it again: individual investors stack the odds of investment success in their favor when they stay the course and take a long-term view. Data from Dalbar tells us that over the past 20 years, when the S&P 500 averaged a 9.5% annual advance, the average investor gained a mere 3.6%, barely beating the 2.2% inflation over the period. Why such a degree of underperformance? Partly because investors let their emotions get the better of them and chase the latest investment fad (or pile into equities at market peaks and sell out at market troughs)—and partly because they sell for nonfundamental reasons, such as a rise in a company’s share price (or in an index).
But history tells us that taking a multiyear view instead would tilt the odds of success in investors’ favor. According to data from JP Morgan, since 1950 annual S&P 500 returns have ranged from +47% to -39%. For any given 5-year period, however, that range narrows to +28% to -3%—and for any given 20-year period, it is +17% to +6%. In short, since 1950, there has never been a 20-year period when investors did not make at least 6% per year in the stock market. In addition, it is worth noting that from 1950 through 2021, investors in the S&P 500 have compounded their capital at 11.5%. Past performance is certainly no guarantee of future returns, but history does show that the longer a time frame you give yourself, the better your chances become of earning a satisfactory return.
Best regards,
Mark A. Boyar

Jonathan I. Boyar

Competitive Returns (Unaudited)
As you can see from the chart below, our buy and hold philosophy has enabled the Fund to produce after tax returns that pretty much mirror our pre-tax returns. The returns used in the illustration exclude loads, but are inclusive of all fees, and assumes the highest rates when calculating after tax returns.
Average Annual Returns
(Through 6/30/22)
| | | | | Since |
| | 1 Year | 5 Year | 10 Year | Inception* |
| At NAV | (20.24)% | 2.67% | 7.44% | 5.81% |
| Inclusive of sales charges | (24.24)% | 1.62% | 6.89% | 5.58% |
| After taxes on distribution | (24.31)% | 1.00% | 6.37% | 5.02% |
| After taxes on distribution and the sale of shares | (14.27)% | 1.23% | 5.53% | 4.49% |
| S&P Composite 1500 Value Index | (5.36)% | 8.08% | 10.98% | N/A |
| *(5/5/98) | | | | |
The Boyar Value Fund has a maximum sales charge of 5.00%. After-tax returns are calculated using the highest historical individual Federal income tax rate and do not reflect the additional impact of state and local taxes. Actual after-tax returns depend on a shareholder’s tax situation and may differ from those shown. After-tax returns are not relevant for shareholders who hold Fund shares in tax-deferred accounts or for shares held by non-taxable entities. The Fund may invest in stocks of several different capitalization levels and it is important to note that historically, small- and mid-cap stocks have experienced greater volatility than stocks of larger, more established companies. Additionally, value-based investments are subject to the risk that the broad market may not recognize their intrinsic value. As portfolio and market conditions change future distributions and yields will vary, dividends are not guaranteed. Distribution amount may include net investment income, capital gains and or return of capital. Distribution amount is not indicative of Fund performance. Individual performance results will vary and may include the reinvestment of income/dividends and capital gains distributions. Performance figures for periods greater than one year are annualized.
The S&P Composite 1500 Value Index combines three leading indices, the S&P 500®, the S&P MidCap 400®, and the S&P SmallCap 600®, to cover approximately 90% of U.S. market capitalization.
The performance of the indices includes reinvestment of dividends and capital gains, however, it does not include any expenses or a deduction for Federal income taxes. A shareholder cannot invest in an index. This information is provided for comparison purposes only.
Comparisons to indices have limitations because indices have volatility and other material characteristics that may differ from a particular investment. Any indices and other financial benchmarks are provided for illustrative purposes only. Particularly, an Investment Index has results that do not represent actual trading or any material economic and market factors that might have had an impact on the advisor’s decision-making. An investment cannot be made directly in an index. Index performance does not reflect the deduction of any management fees, taxes or expenses.
The total annual operating expense ratio for the Boyar Value Fund as stated in the fee table in the Fund’s prospectus dated May 1, 2022 was 1.56%. [An updated total annual operating expenses figure will appear in the Fund’s next prospectus update.]
| ^ | The performance data quoted represents past performance. Past performance does not guarantee future results, and except where noted as after-tax, does not reflect the deduction of taxes that a shareholder would pay on Fund distributions or the redemption of Fund shares. The investment return and principal value of an investment will fluctuate. Consequently, an investor’s shares, when redeemed, may be worth more or less than their original cost. Returns for periods greater than one year are annualized. Current performance may be lower or higher than the performance data quoted. To obtain performance information current to the most recent month end, please call 1-800-266-5566. |
Comparison of the Change in Value of a $10,000 Investment (Unaudited)
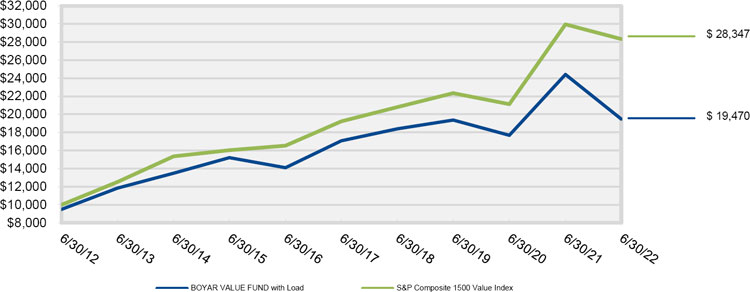
The Chart above represents historical performance of a hypothetical investment of $10,000 in the Boyar Value Fund from inception. The performance of the Fund includes the reinvestment of all dividend and capital gain distributions and has been adjusted for the maximum applicable sales charge of 5.00%. The performance of the Fund as reflected in the chart does not include the effect of taxes incurred on Fund distributions or on the redemption of Fund shares.
Portfolio Diversification By Sector (as of June 30, 2022)
(as a percentage of total net assets) (Unaudited)
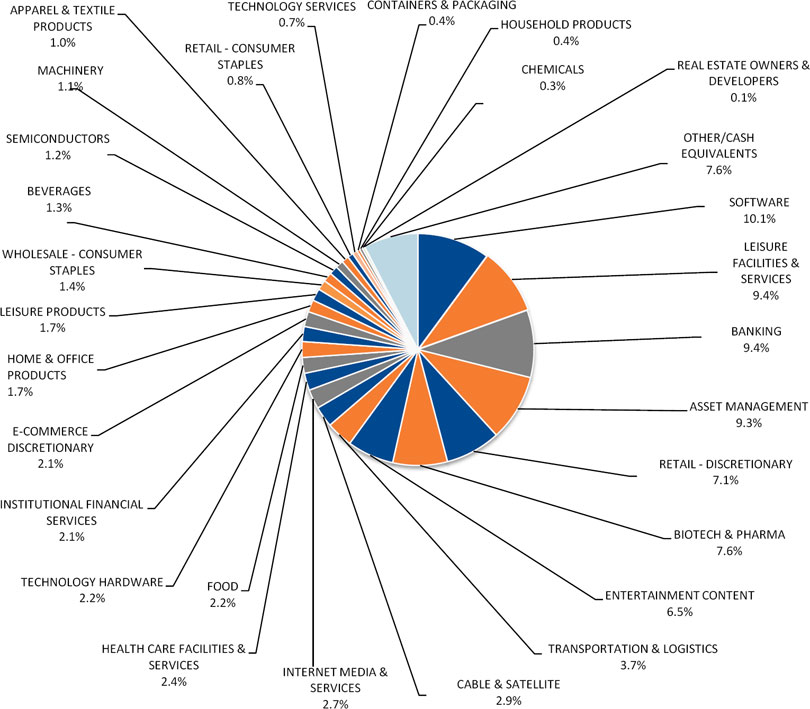
The composition of the Fund’s portfolio is subject to change.
Please refer to the Schedule of Investments in this annual report for a detailed analysis of the Fund’s holdings.
The mention of specific securities or asset classes is not a recommendation or solicitation for any person to buy, sell or hold any particular security or asset class.
It’s not what you make; it’s what you keep – Taxes are potentially the biggest expense an individual mutual fund investor will experience.
By holding stocks for long periods of time, you postpone paying taxes, which positively impacts long-term returns. Buying and holding stocks for long periods may sound stodgy, but it postpones the payment of capital gains taxes with the added positive effects on the compounding rate. Since profit taking involves transactions, it obliges you to take the IRS in as a partner. With profits not taken, there is a future tax liability, but all the money is still working for its owner. No transactions, no tax. The Boyar Value Fund believes that holding stocks for long periods of time is the best way for an individual investor to create wealth.
This letter seeks to describe the Fund managers’ current view of the market. Statements referring to future events or actions, such as future financial performance, are based on current expectations and projections about future events provided by various sources, including the Fund’s management. These statements are not guarantees of future performance, and actual events and results may differ materially from those discussed herein. The mention of specific securities or asset classes is not a recommendation or solicitation for any person to buy, sell or hold any particular security or asset class.
Past performance is no guarantee of future results. Investing in equities and fixed income involves risk, including the possible loss of principal. The S&P 500 Index is included to allow you to compare your returns against an unmanaged capitalization-weighted index of 500 stocks designed to measure performance of the broad domestic economy through changes in the aggregate market value of the 500 stocks representing all major industries. The Russell 2000® Value Index measures the performance of the small-cap value segment of the U.S. equity universe. It includes those Russell 2000® companies with lower price-to-book ratios and lower forecasted growth values. The S&P 1500 Value Index measures value stocks using three factors, the ratios of book value, earnings, and sales to price, and the constituents are drawn from the S&P 500, S&P Midcap 400, and S&P SmallCap 600. The Dow Jones Industrial Average is a price-weighted average of 30 significant stocks traded on the New York Stock Exchange and the NASDAQ. The volatility of the above-referenced indices may materially differ from that of your account(s), and the holdings in your account(s) may differ significantly from the securities that constitute the above-referenced indices. Your results are reported gross of fees. The collection of fees produces a compounding effect on the total rate of return net of management fees. As an example, the effect of investment management fees on the total value of a client’s portfolio assuming (a) quarterly fee assessment, (b) $1,000,000 investment, (c) portfolio return of 8% a year, and (d) 1.50% annual investment advisory fee would be $15,566 in the first year, with cumulative effects of $88,488 over five years and $209,051 over ten years. This material is intended as a broad overview of Boyar Asset Management’s philosophy and process and is subject to change without notice. Account holdings and characteristics may vary, since investment objectives, tax considerations, and other factors differ from account to account.
1881-NLD-07272022
| BOYAR VALUE FUND, INC. |
| SCHEDULE OF INVESTMENTS (Unaudited) |
| June 30, 2022 |
| Shares | | | | | Fair Value | |
| | | | | COMMON STOCKS — 91.8% | | | | |
| | | | | APPAREL & TEXTILE PRODUCTS - 1.0% | | | | |
| | 24,070 | | | Hanesbrands, Inc. | | $ | 247,680 | |
| | | | | | | | | |
| | | | | ASSET MANAGEMENT - 9.3% | | | | |
| | 8,500 | | | Ameriprise Financial, Inc. | | | 2,020,280 | |
| | 12,359 | | | Franklin Resources, Inc. | | | 288,088 | |
| | | | | | | | 2,308,368 | |
| | | | | BANKING - 9.4% | | | | |
| | 29,221 | | | Bank of America Corporation | | | 909,650 | |
| | 4,430 | | | Citigroup, Inc. | | | 203,736 | |
| | 10,750 | | | JPMorgan Chase & Company | | | 1,210,557 | |
| | | | | | | | 2,323,943 | |
| | | | | BEVERAGES - 1.3% | | | | |
| | 5,226 | | | Coca-Cola Company (The) | | | 328,768 | |
| | | | | | | | | |
| | | | | BIOTECH & PHARMA - 7.6% | | | | |
| | 7,500 | | | Bristol-Myers Squibb Company | | | 577,500 | |
| | 2,500 | | | Johnson & Johnson | | | 443,775 | |
| | 16,000 | | | Pfizer, Inc. | | | 838,880 | |
| | 1,985 | | | Viatris, Inc. | | | 20,783 | |
| | | | | | | | 1,880,938 | |
| | | | | CABLE & SATELLITE - 2.9% | | | | |
| | 18,268 | | | Comcast Corporation, Class A | | | 716,836 | |
| | | | | | | | | |
| | | | | CHEMICALS - 0.3% | | | | |
| | 3,000 | | | Univar Solutions, Inc.(a) | | | 74,610 | |
| | | | | | | | | |
| | | | | CONTAINERS & PACKAGING - 0.4% | | | | |
| | 7,215 | | | O-I Glass, Inc.(a) | | | 101,010 | |
| | | | | | | | | |
| | | | | E-COMMERCE DISCRETIONARY - 2.1% | | | | |
| | 12,500 | | | eBay, Inc. | | | 520,875 | |
| | | | | | | | | |
| | | | | ENTERTAINMENT CONTENT - 6.5% | | | | |
| | 2,641 | | | AMC Networks, Inc., Class A(a) | | | 76,906 | |
See accompanying notes to financial statements.
| BOYAR VALUE FUND, INC. |
| SCHEDULE OF INVESTMENTS (Unaudited) (Continued) |
| June 30, 2022 |
| Shares | | | | | Fair Value | |
| | | | | COMMON STOCKS — 91.8% (Continued) | | | | |
| | | | | ENTERTAINMENT CONTENT - 6.5% (Continued) | | | | |
| | 8,842 | | | Madison Square Garden Entertainment Corporation(a) | | $ | 465,266 | |
| | 9,500 | | | Walt Disney Company (The)(a) | | | 896,800 | |
| | 12,687 | | | Warner Bros Discovery, Inc.(a) | | | 170,260 | |
| | | | | | | | 1,609,232 | |
| | | | | FOOD - 2.2% | | | | |
| | 9,000 | | | Mondelez International, Inc., Class A | | | 558,809 | |
| | | | | | | | | |
| | | | | HEALTH CARE FACILITIES & SERVICES - 2.4% | | | | |
| | 6,500 | | | CVS Health Corporation | | | 602,290 | |
| | | | | | | | | |
| | | | | HOME & OFFICE PRODUCTS - 1.7% | | | | |
| | 6,701 | | | Newell Brands, Inc. | | | 127,587 | |
| | 3,700 | | | Scotts Miracle-Gro Company (The) | | | 292,263 | |
| | | | | | | | 419,850 | |
| | | | | HOUSEHOLD PRODUCTS - 0.4% | | | | |
| | 3,200 | | | Energizer Holdings, Inc. | | | 90,720 | |
| | | | | | | | | |
| | | | | INSTITUTIONAL FINANCIAL SERVICES - 2.1% | | | | |
| | 12,707 | | | Bank of New York Mellon Corporation (The) | | | 530,009 | |
| | | | | | | | | |
| | | | | INTERNET MEDIA & SERVICES - 2.7% | | | | |
| | 28,752 | | | Angi, Inc., Class A(a) | | | 131,684 | |
| | 2,815 | | | IAC/InterActiveCorporation(a) | | | 213,856 | |
| | 15,748 | | | Uber Technologies, Inc.(a) | | | 322,204 | |
| | | | | | | | 667,744 | |
| | | | | LEISURE FACILITIES & SERVICES - 9.4% | | | | |
| | 19,227 | | | Liberty Media Corp-Liberty Braves - Series C(a) | | | 461,448 | |
| | 4,934 | | | Madison Square Garden Sports Corporation(a) | | | 745,035 | |
| | 8 | | | Marriott International, Inc., Class A | | | 1,088 | |
| | 3,000 | | | McDonald’s Corporation | | | 740,640 | |
| | 9,500 | | | MGM Resorts International | | | 275,025 | |
| | 1,500 | | | Starbucks Corporation | | | 114,585 | |
| | | | | | | | 2,337,821 | |
See accompanying notes to financial statements.
| BOYAR VALUE FUND, INC. |
| SCHEDULE OF INVESTMENTS (Unaudited) (Continued) |
| June 30, 2022 |
| Shares | | | | | Fair Value | |
| | | | | COMMON STOCKS — 91.8% (Continued) | | | | |
| | | | | LEISURE PRODUCTS - 1.7% | | | | |
| | 10,000 | | | Acushnet Holdings Corporation | | $ | 416,800 | |
| | | | | | | | | |
| | | | | MACHINERY - 1.1% | | | | |
| | 22,554 | | | Mueller Water Products, Inc. - Series A | | | 264,558 | |
| | | | | | | | | |
| | | | | REAL ESTATE OWNERS & DEVELOPERS - 0.1% | | | | |
| | 21,539 | | | Trinity Place Holdings, Inc.(a) | | | 21,754 | |
| | | | | | | | | |
| | | | | RETAIL - CONSUMER STAPLES - 0.8% | | | | |
| | 1,425 | | | Target Corporation | | | 201,253 | |
| | | | | | | | | |
| | | | | RETAIL - DISCRETIONARY - 7.1% | | | | |
| | 6,385 | | | Home Depot, Inc. (The) | | | 1,751,214 | |
| | | | | | | | | |
| | | | | SEMICONDUCTORS - 1.2% | | | | |
| | 8,000 | | | Intel Corporation | | | 299,280 | |
| | | | | | | | | |
| | | | | SOFTWARE - 10.1% | | | | |
| | 9,734 | | | Microsoft Corporation | | | 2,499,984 | |
| | 4,570 | | | Vimeo, Inc.(a) | | | 27,511 | |
| | | | | | | | 2,527,495 | |
| | | | | TECHNOLOGY HARDWARE - 2.2% | | | | |
| | 12,500 | | | Cisco Systems, Inc. | | | 533,000 | |
| | | | | | | | | |
| | | | | TECHNOLOGY SERVICES - 0.7% | | | | |
| | 37,500 | | | Conduent, Inc.(a) | | | 162,000 | |
| | | | | | | | | |
| | | | | TRANSPORTATION & LOGISTICS - 3.7% | | | | |
| | 5,000 | | | United Parcel Service, Inc., Class B | | | 912,700 | |
| | | | | | | | | |
| | | | | WHOLESALE - CONSUMER STAPLES - 1.4% | | | | |
| | 4,000 | | | Sysco Corporation | | | 338,840 | |
See accompanying notes to financial statements.
| BOYAR VALUE FUND, INC. |
| SCHEDULE OF INVESTMENTS (Unaudited) (Continued) |
| June 30, 2022 |
| Shares | | | | | Fair Value | |
| | | | | COMMON STOCKS — 91.8% (Continued) | | | | |
| | | | | | | | | |
| | | | | TOTAL COMMON STOCKS (Cost $10,919,428) | | $ | 22,748,397 | |
| | | | | | | | | |
| | | | | PREFERRED STOCKS — 0.6% | | | | |
| | | | | RETAIL - DISCRETIONARY — 0.6% | | | | |
| | 2,573 | | | Qurate Retail, Inc. (Cost $240,993) | | | 150,392 | |
| | | | | | | | | |
| | | | | SHORT-TERM INVESTMENTS — 7.7% | | | | |
| | | | | MONEY MARKET FUNDS - 7.7% | | | | |
| | 1,917,567 | | | Dreyfus Institutional Preferred Government, Hamilton Class, 1.36% (Cost $1,917,567)(b) | | | 1,917,567 | |
| | | | | | | | | |
| | | | | TOTAL INVESTMENTS - 100.1% (Cost $13,077,988) | | $ | 24,816,356 | |
| | | | | LIABILITIES IN EXCESS OF OTHER ASSETS - (0.1)% | | | (33,741 | ) |
| | | | | NET ASSETS - 100.0% | | $ | 24,782,615 | |
| (a) | Non-income producing security. |
| (b) | Rate disclosed is the seven day effective yield as of June 30, 2022. |
See accompanying notes to financial statements.
| BOYAR VALUE FUND, INC. |
| STATEMENT OF ASSETS AND LIABILITIES (Unaudited) |
| June 30, 2022 |
| ASSETS | | | | |
| Investment securities, at cost | | $ | 13,077,988 | |
| Investment securities, at value | | $ | 24,816,356 | |
| Dividends and interest receivable | | | 16,390 | |
| Prepaid expenses and other assets | | | 21,811 | |
| TOTAL ASSETS | | | 24,854,557 | |
| | | | | |
| LIABILITIES | | | | |
| Advisory fees payable | | | 10,673 | |
| Distribution fees (12b-1) payable | | | 11,604 | |
| Payable to service providers | | | 17,518 | |
| Audit fees payable | | | 8,589 | |
| Accrued Director/Trustee fees | | | 1,187 | |
| Accrued legal fees | | | 19,883 | |
| Accrued expenses and other liabilities | | | 2,488 | |
| TOTAL LIABILITIES | | | 71,942 | |
| NET ASSETS | | $ | 24,782,615 | |
| | | | | |
| Net Assets Consist Of: | | | | |
| Paid in capital | | $ | 12,886,644 | |
| Accumulated earnings | | | 11,895,971 | |
| NET ASSETS | | $ | 24,782,615 | |
| | | | | |
| Shares of capital stock outstanding (1,000,000,000 shares authorized, $0.001 par value) | | | 990,350 | |
| Net asset value and redemption price per share (Net assets ÷ shares outstanding) (a) | | $ | 25.02 | |
| Maximum offering price per share (maximum sales charge of 5.00%) (b) | | $ | 26.34 | |
| (a) | For certain purchases of $1 million or more, a 1.00% contingent deferred sales charge may apply to redemptions made within twelve months of purchase. Redemptions made within 60 days of purchase may be assessed a redemption fee of 2.00%. |
| (b) | On investments of $50,000 or more, the offering price is reduced. |
See accompanying notes to financial statements.
| BOYAR VALUE FUND, INC. |
| STATEMENT OF OPERATIONS (Unaudited) |
| For the Six Months Ended June 30, 2022 |
| INVESTMENT INCOME | | | | |
| Dividends | | $ | 256,729 | |
| Interest | | | 2,888 | |
| TOTAL INVESTMENT INCOME | | | 259,617 | |
| | | | | |
| EXPENSES | | | | |
| Investment advisory fees | | | 71,905 | |
| Distribution (12b-1) fees | | | 35,953 | |
| Administrative services fees | | | 25,100 | |
| Legal fees | | | 21,767 | |
| Transfer agent fees | | | 21,164 | |
| Accounting services fees | | | 12,426 | |
| Audit fees | | | 8,603 | |
| Compliance officer fees | | | 7,081 | |
| Directors’ fees and expenses | | | 6,892 | |
| Insurance expense | | | 6,335 | |
| Registration fees | | | 4,432 | |
| Printing and postage expenses | | | 3,184 | |
| Custodian fees | | | 2,131 | |
| Other expenses | | | 3,812 | |
| TOTAL EXPENSES | | | 230,785 | |
| NET INVESTMENT INCOME | | | 28,832 | |
| | | | | |
| REALIZED AND UNREALIZED GAIN (LOSS) ON INVESTMENTS | | | | |
| Net realized gain from security transactions | | | 122,412 | |
| Net change in unrealized appreciation (depreciation) of investments | | | (7,652,909 | ) |
| NET REALIZED AND UNREALIZED LOSS ON INVESTMENTS | | | (7,530,497 | ) |
| | | | | |
| NET DECREASE IN NET ASSETS RESULTING FROM OPERATIONS | | $ | (7,501,665 | ) |
See accompanying notes to financial statements.
| BOYAR VALUE FUND, INC. |
| STATEMENTS OF CHANGES IN NET ASSETS |
| | | For the Six Months | | | For the Year | |
| | | Ended | | | Ended | |
| | | June 30, 2022 | | | December 31, 2021 | |
| | | (Unaudited) | | | | | |
| FROM OPERATIONS | | | | | | | | |
| Net investment income (loss) | | $ | 28,832 | | | $ | (25,915 | ) |
| Net realized gain from security transactions | | | 122,412 | | | | 137,547 | |
| Net change in unrealized appreciation (depreciation) on investments | | | (7,652,909 | ) | | | 5,093,716 | |
| Net increase (decrease) in net assets resulting from operations | | | (7,501,665 | ) | | | 5,205,348 | |
| | | | | | | | | |
| DISTRIBUTIONS TO SHAREHOLDERS | | | | | | | | |
| Total distributions paid | | | — | | | | (132,771 | ) |
| | | | | | | | | |
| FROM CAPITAL SHARE TRANSACTIONS | | | | | | | | |
| Proceeds from shares sold | | | 133,570 | | | | 598,366 | |
| Net asset value of shares issued in | | | | | | | | |
| reinvestment of distributions to shareholders | | | — | | | | 125,968 | |
| Payments for shares redeemed | | | (611,425 | ) | | | (1,107,026 | ) |
| Net decrease in net assets from capital share transactions | | | (477,855 | ) | | | (382,692 | ) |
| | | | | | | | | |
| TOTAL INCREASE (DECREASE) IN NET ASSETS | | | (7,979,520 | ) | | | 4,689,885 | |
| | | | | | | | | |
| NET ASSETS | | | | | | | | |
| Beginning of period | | | 32,762,135 | | | | 28,072,250 | |
| End of period | | $ | 24,782,615 | | | $ | 32,762,135 | |
| | | | | | | | | |
| CAPITAL SHARE ACTIVITY | | | | | | | | |
| Shares Sold | | | 4,507 | | | | 19,286 | |
| Shares Reinvested | | | — | | | | 3,930 | |
| Shares Redeemed | | | (21,527 | ) | | | (35,671 | ) |
| Net decrease in shares outstanding | | | (17,020 | ) | | | (12,455 | ) |
See accompanying notes to financial statements.
| BOYAR VALUE FUND, INC. |
| FINANCIAL HIGHLIGHTS |
Per Share Data and Ratios for a Share of Capital Stock Outstanding Throughout Each Period Presented
| | | Six Months | | | Year | | | Year | | | Year | | | Year | | | Year | |
| | | Ended | | | Ended | | | Ended | | | Ended | | | Ended | | | Ended | |
| | | June 30, | | | December 31, | | | December 31, | | | December 31, | | | December 31, | | | December 31, | |
| | | 2022 | | | 2021 | | | 2020 | | | 2019 | | | 2018 | | | 2017 | |
| | | | (Unaudited) | | | | | | | | | | | | | | | | | | | | | |
| Net Asset Value, Beginning of Period | | $ | 32.52 | | | $ | 27.53 | | | $ | 26.92 | | | $ | 23.48 | | | $ | 26.54 | | | $ | 23.37 | |
| Activity from investment operations: | | | | | | | | | | | | | | | | | | | | | | | | |
| Net investment income (loss) (1) | | | 0.03 | | | | (0.03 | ) | | | 0.04 | | | | 0.11 | | | | 0.08 | | | | 0.10 | |
| Net realized and unrealized gain (loss) on investments | | | (7.53 | ) | | | 5.15 | | | | 1.08 | | | | 4.37 | | | | (1.92 | ) | | | 3.52 | |
| Total from investment operations | | | (7.50 | ) | | | 5.12 | | | | 1.12 | | | | 4.48 | | | | (1.84 | ) | | | 3.62 | |
| Paid-in-Capital from Redemption Fees (1) | | | — | | | | — | | | | — | | | | 0.00 | (2) | | | — | | | | — | |
| Less distributions from: | | | | | | | | | | | | | | | | | | | | | | | | |
| Net investment income | | | — | | | | — | | | | (0.04 | ) | | | (0.11 | ) | | | (0.08 | ) | | | (0.11 | ) |
| Net realized gains | | | — | | | | (0.13 | ) | | | (0.47 | ) | | | (0.93 | ) | | | (1.14 | ) | | | (0.34 | ) |
| Total distributions | | | — | | | | (0.13 | ) | | | (0.51 | ) | | | (1.04 | ) | | | (1.22 | ) | | | (0.45 | ) |
| Net Asset Value, End of Period | | $ | 25.02 | | | $ | 32.52 | | | $ | 27.53 | | | $ | 26.92 | | | $ | 23.48 | | | $ | 26.54 | |
| Total Return (3) | | | (23.06 | )% (6) | | | 18.61 | % | | | 4.23 | % | | | 19.15 | % | | | (7.12 | )% | | | 15.48 | % |
| Net Assets, End of Period | | $ | 24,782,615 | | | $ | 32,762,135 | | | $ | 28,072,250 | | | $ | 27,942,062 | | | $ | 24,389,769 | | | $ | 27,219,974 | |
| Ratio of gross expenses to average net assets | | | 1.61 | % (7) | | | 1.53 | % | | | 1.78 | %(4) | | | 1.75 | % (4) | | | 2.11 | % (4) | | | 2.22 | % (4) |
| Ratio of net expenses to average net assets | | | 1.61 | % (7) | | | 1.55 | % (5) | | | 1.75 | % | | | 1.75 | % | | | 1.75 | % | | | 1.75 | % |
| Ratio of net investment income (loss) to average net assets | | | 0.20 | % (7) | | | (0.08 | )% | | | 0.15 | % | | | 0.42 | % | | | 0.30 | % | | | 0.42 | % |
| Portfolio Turnover Rate | | | 0 | % (6) | | | 1 | % | | | 14 | % | | | 9 | % | | | 7 | % | | | 2 | % |
| (1) | Per share amounts calculated using the average shares method. |
| (2) | Amount represents less than $0.005 per share. |
| (3) | Total returns shown are historical in nature and assume changes in share price, reinvestment of dividends and capital gains distributions, if any, and exclude the effect of applicable sales loads/redemption fees. Had the Adviser not waived their fees and/or reimbursed expenses for the years ended 2017, 2018, 2019 and 2020, total returns would have been lower. |
| (4) | Represents the ratio of expenses to average net assets absent fee waivers and/or expense reimbursements by the Adviser. |
| (5) | Represents the ratio of expenses to average net assets inclusive of expense recapture by the Adviser. |
See accompanying notes to financial statements.
BOYAR VALUE FUND, INC.
NOTES TO FINANCIAL STATEMENTS (Unaudited)
June 30, 2022
Boyar Value Fund, Inc. (the “Fund”) was incorporated on February 28, 1997 under the laws of the State of Maryland and is registered under the Investment Company Act of 1940, as amended (the “1940 Act”), as an open-end, diversified management investment company. The Fund’s investment objective is long-term capital appreciation.
Under the Fund’s organizational documents, its officers and Directors are indemnified against certain liabilities arising out of the performance of their duties to the Fund. In addition, in the normal course of business, the Fund enters into contracts with its vendors and others that provide for general indemnifications. The Fund’s maximum exposure under these arrangements is unknown as this would involve future claims that may be made against the Fund. However, based on experience, the Fund expects that risk of loss to be remote.
| 2. | SIGNIFICANT ACCOUNTING POLICIES |
The following is a summary of significant accounting policies followed by the Fund in preparation of its financial statements. These policies are in conformity with accounting principles generally accepted in the United States of America (“GAAP”). The Fund is an investment company and accordingly follows the investment company accounting and reporting guidance of the Financial Accounting Standards Board (FASB) Accounting Standard Codification Topic 946 “Financial Services – Investment Companies”.
Securities valuation – Securities listed on an exchange are valued at the last reported sale price at the close of the regular trading session of the primary exchange on the business day the value is being determined, or in the case of securities listed on NASDAQ at the NASDAQ Official Closing Price. In the absence of a sale such securities shall be valued at the mean between the current bid and ask prices on the day of valuation. Short-term debt obligations having 60 days or less remaining until maturity, at time of purchase, may be valued at amortized cost.
The Fund may hold securities, such as private investments, other non-traded securities or temporarily illiquid securities, for which market quotations are not readily available or are determined to be unreliable. These securities will be valued using the “fair value” procedures approved by the Fund’s Board of Directors (the “Board”). The Board has delegated execution of these procedures to a Fair Value committee composed of one or more representatives from each of the (i) Trust, (ii) administrator, and (iii) adviser.
Fair Valuation Process – As noted above, the Fair Value committee is composed of one or more representatives from each of the (i) Trust, (ii) administrator, and (iii) adviser. The applicable investments are valued collectively via inputs from each of these groups. For example, fair value
BOYAR VALUE FUND, INC.
NOTES TO FINANCIAL STATEMENTS (Unaudited) (Continued)
June 30, 2022
determinations are required for the following securities: (i) securities for which market quotations are insufficient or not readily available on a particular business day (including securities for which there is a short and temporary lapse in the provision of a price by the regular pricing source), (ii) securities for which, in the judgment of the adviser, the prices or values available do not represent the fair value of the instrument. Factors which may cause the adviser to make such a judgment include, but are not limited to, the following: only a bid price or an ask price is available; the spread between bid and asked prices is substantial; the frequency of sales; the thinness of the market; the size of reported trades; and actions of the securities markets, such as the suspension or limitation of trading; (iii) securities determined to be illiquid; (iv) securities with respect to which an event that will affect the value thereof has occurred (a “significant event”) since the closing prices were established on the principal exchange on which they are traded, but prior to the Fund’s calculation of its net asset value.
The Fund utilizes various methods to measure the fair value of all of its investments on a recurring basis. GAAP establishes a hierarchy that prioritizes inputs to valuation methods. The three levels of input are:
Level 1 – Unadjusted quoted prices in active markets for identical assets and liabilities that the Fund has the ability to access.
Level 2 – Observable inputs other than quoted prices included in Level 1 that are observable for the asset or liability, either directly or indirectly. These inputs may include quoted prices for the identical instrument in an inactive market, prices for similar instruments, interest rates, prepayment speeds, credit risk, yield curves, default rates and similar data.
Level 3 – Unobservable inputs for the asset or liability, to the extent relevant observable inputs are not available, representing the Fund’s own assumptions about the assumptions a market participant would use in valuing the asset or liability, and based on the best information available.
The availability of observable inputs can vary from security to security and is affected by a wide variety of factors, including, for example, the type of security, whether the security is new and not yet established in the marketplace, the liquidity of markets, and other characteristics particular to the security. To the extent that valuation is based on models or inputs that are less observable or unobservable in the market, the determination of fair value requires more judgment. Accordingly, the degree of judgment exercised in determining fair value is greatest for instruments categorized in Level 3.
The inputs used to measure fair value may fall into different levels of the fair value hierarchy. In such cases, for disclosure purposes, the level in the fair value hierarchy within which the fair value measurement falls in its entirety, is determined based on the lowest level input that is significant to the fair value measurement in its entirety.
BOYAR VALUE FUND, INC.
NOTES TO FINANCIAL STATEMENTS (Unaudited) (Continued)
June 30, 2022
The inputs or methodology used for valuing securities are not necessarily an indication of the risk associated with investing in those securities. The following table summarizes the inputs used as of June 30, 2022 for the Fund’s investments measured at fair value:
| Assets* | | Level 1 | | | Level 2 | | | Level 3 | | | Total | |
| Common Stock | | $ | 22,748,397 | | | $ | — | | | $ | — | | | $ | 22,748,397 | |
| Preferred Stock | | | 150,392 | | | | — | | | | — | | | | 150,392 | |
| Short-Term Investment | | | 1,917,567 | | | | — | | | | — | | | | 1,917,567 | |
| Total | | $ | 24,816,356 | | | $ | — | | | $ | — | | | $ | 24,816,356 | |
The Fund did not hold any Level 3 securities during the period.
| * | Refer to the Schedule of Investments for security classifications. |
Security Transactions and Related Income – Security transactions are accounted for on trade date. Interest income is recognized on an accrual basis. Dividend income is recorded on the ex-dividend date. Realized gains or losses from sales of securities are determined by comparing the identified cost of the security lot sold with the net sales proceeds.
Dividends and Distributions to Shareholders – Dividends from net investment income, if any, are declared and paid annually. Distributable net realized capital gains, if any, are declared and distributed annually. Dividends and distributions paid and distributed to shareholders are recorded on ex-dividend date.
Dividends from net investment income and distributions from net realized gains are determined in accordance with Federal income tax regulations, which may differ from GAAP. These “book/tax” differences are considered either temporary (i.e., deferred losses) or permanent in nature. To the extent these differences are permanent in nature, such amounts are reclassified within the composition of net assets based on their Federal tax-basis treatment; temporary differences do not require reclassification.
Federal Income Taxes – The Fund intends to continue to comply with the requirements of the Internal Revenue Code applicable to regulated investment companies and to distribute all of its taxable income to its shareholders. Therefore, no provision for Federal income tax is required. The Fund will recognize the tax benefits of uncertain tax positions only where the position is “more likely than not” to be sustained assuming examination by tax authorities. Management has analyzed the Fund’s tax positions and has concluded that no liability for unrecognized tax benefits should be recorded related to uncertain tax positions taken on returns filed for open tax years ended December 31, 2019 to December 31, 2021, or expected to be taken in the Fund’s December 31, 2022 year-end tax returns. The Fund identifies its major tax jurisdictions as U.S. Federal, Maryland and foreign jurisdictions where the Fund makes significant investments. The Fund is not aware of any tax positions for which it is
BOYAR VALUE FUND, INC.
NOTES TO FINANCIAL STATEMENTS (Unaudited) (Continued)
June 30, 2022
reasonably possible that the total amounts of unrecognized tax benefits will change materially in the next twelve months.
Use of Estimates – The preparation of financial statements in accordance with GAAP requires management to make estimates and assumptions that affect the reported amounts of assets and liabilities and disclosure of contingent assets and liabilities at the date of the financial statements and the reported amounts of income and expenses for the reporting period. Actual results could differ from those estimates.
| 3. | INVESTMENT TRANSACTIONS |
For the six months ended June 30, 2022, cost of purchases and proceeds from sales of portfolio securities, other than short-term investments, amounted to $0 and $364,784, respectively.
| 4. | AGGREGATE UNREALIZED APPRECIATION AND DEPRECIATION |
At June 30, 2022, the tax cost of investments and unrealized appreciation (depreciation) are as follows:
| | | | | | | Gross Unrealized | | | Gross Unrealized | | | Net Unrealized | |
| Fund | | | Tax Cost | | | Appreciation | | | Depreciation | | | Appreciation | |
| Boyar Value Fund | | | $ | 13,077,988 | | | $ | 13,035,319 | | | $ | (1,296,951 | ) | | $ | 11,738,368 | |
| 5. | INVESTMENT ADVISORY AGREEMENT AND TRANSACTIONS WITH SERVICE PROVIDERS |
Boyar Asset Management, Inc. (the “Adviser”) provides continuous advisory services to the Fund and Northern Lights Distributors, LLC (the “Distributor”) acts as distributor of the Fund’s shares.
Pursuant to an Investment Advisory Agreement among the Adviser and the Fund, the Adviser agrees to furnish continuous investment advisory services to the Fund. For these services, the Fund pays the Adviser an investment advisory fee, which is computed and accrued daily and paid monthly, at an annual rate of 0.50% of the Fund’s average daily net assets. For the six months ended June 30, 2022, the Fund incurred $71,905 in advisory fees.
Pursuant to a written contract, the Adviser has agreed to waive a portion of its advisory fees and the to reimburse certain expenses of the Fund (excluding interest, taxes, brokerage commissions, other expenditures which are capitalized in accordance with generally accepted accounting principles, Underlying or Acquired Fund Fees and Expenses, and other extraordinary expenses not incurred in the ordinary course of the Fund’s business) to the extent necessary to limit the Fund’s total annual operating expenses (subject to the same exclusions) to 1.75% of the Fund’s average daily net assets
BOYAR VALUE FUND, INC.
NOTES TO FINANCIAL STATEMENTS (Unaudited) (Continued)
June 30, 2022
(the “expense limitation”). The Adviser is permitted to subsequently recover reimbursed expenses and/or waived fees (within 2 years after the fiscal year end in which the waiver/reimbursement occurred) from the Fund to the extent that the Fund’s expense ratio is less than the expense limitation. The Adviser has agreed to maintain this expense limitation through at least May 1, 2023. At June 30, 2022 the Fund had no available recapture.
The Fund has adopted a Shareholder Servicing and Distribution Plan (the “Plan”) pursuant to Rule 12b-1 under the 1940 Act. The Plan provides that a monthly service fee is calculated by the Fund at an annual rate of 0.25% of its average daily net assets and is paid to the Distributor, to provide compensation for ongoing services and/or maintenance of the Fund’s shareholder accounts, not otherwise required to be provided by the Adviser. For the six months ended June 30, 2022, the Distributor received $400 from front-end sales charges, of which $40 was retained by the principal underwriter or other affiliated broker-dealers.
Ultimus Fund Solutions, LLC (“UFS”)
UFS, an affiliate of the Distributor, provides administration, fund accounting, and transfer agent services to the Trust. Pursuant to a separate servicing agreement with UFS, the Fund pays UFS customary fees for providing administration, fund accounting and transfer agency services to the Fund. Certain Directors and officers of the Trust are also officers of the Adviser or UFS, and are not paid any fees directly by the Fund for serving in such capacities.
In addition, certain affiliates of UFS provide services to the Fund as follows:
Northern Lights Compliance Services, LLC (“NLCS”)
NLCS, an affiliate of UFS and the Distributor, provides a Chief Compliance Officer to the Fund, as well as related compliance services, pursuant to a consulting agreement between NLCS and the Fund. Under the terms of such agreement, NLCS receives customary fees from the Fund.
Blu Giant, LLC (“Blu Giant”)
Blu Giant, an affiliate of UFS and the Distributor, provides EDGAR conversion and filing services as well as print management services for the Fund on an ad-hoc basis. For the provision of these services, Blu Giant receives customary fees from the Fund.
Custody Administration
Pursuant to the terms of the Fund’s Custody Agreement with Bank of New York Mellon (the “Custody Agreement”), the Fund pays an asset-based custody fee in decreasing amounts as Fund assets reach certain breakpoints. The Fund also pays certain transaction fees and out-of-pocket expenses pursuant to the Custody Agreement. UFS receives a portion of these fees for performing certain custody administration services. UFS’s share of such fees collected for the six months ended June 30, 2022
BOYAR VALUE FUND, INC.
NOTES TO FINANCIAL STATEMENTS (Unaudited) (Continued)
June 30, 2022
was $2,131. The Custodian fees listed in the Statement of Operations include the fees paid to UFS as Custody Administrator.
Directors
The Fund pays each Director an annual fee of $3,000 and $500 for each meeting attended. Expenses incurred in connection with attendance at board meetings may be reimbursed. No employee of the Adviser, UFS or any of their respective affiliates will receive any compensation from the Fund for acting as either an officer or Director. None of the executive officers receive any compensation from the Fund.
The beneficial ownership, either directly or indirectly, of more than 25% of the voting securities of a Fund creates presumption of control of the Fund, under Section 2(a)(9) of the 1940 Act. As of June 30, 2022, Vector Group Ltd. held approximately 38.4% while National Financial Services LLC held 44.4% of the voting securities of the Boyar Value Fund.
The Fund may assess a short-term redemption fee of 2.00% of the total redemption amount if a shareholder sells their shares after holding them for less than 60 days. The redemption fee is paid directly to the Fund. This fee does not apply to shares acquired through reinvestment of dividends and other distributions. For certain purchases of $1 million or more the Fund may also assess a contingent deferred sales charge of 1.00% to redemptions made within twelve months of purchase. For the six months ended June 30, 2022, the Fund had no redemption fees.
| 8. | DISTRIBUTIONS TO SHAREHOLDERS AND TAX COMPONENTS OF CAPITAL |
The tax character of fund distributions paid for the year ended December 31, 2021 and December 31,
2020 was as follows:
| | | Fiscal Year Ended | | | Fiscal Year Ended | |
| | | December 31, 2021 | | | December 31, 2020 | |
| Ordinary Income | | $ | — | | | $ | 38,641 | |
| Long-Term Capital Gain | | | 132,771 | | | | 469,615 | |
| | | $ | 132,771 | | | $ | 508,256 | |
BOYAR VALUE FUND, INC.
NOTES TO FINANCIAL STATEMENTS (Unaudited) (Continued)
June 30, 2022
As of December 31, 2021, the components of accumulated earnings/(deficit) on a tax basis were as follows:
| Undistributed | | | Unrealized | | | Total | |
| Long-Term | | | Appreciation/ | | | Accumulated | |
| Gains | | | (Depreciation) | | | Earnings/(Deficits) | |
| $ | 6,359 | | | $ | 19,391,277 | | | $ | 19,397,636 | |
Permanent book and tax differences, primarily attributable to the book/tax basis treatment of net operating losses, resulted in reclassifications for the Fund for the fiscal year ended December 31, 2021 as follows:
| Paid | | | Accumulated | |
| In | | | Earnings | |
| Capital | | | (Losses) | |
| $ | (25,912 | ) | | $ | 25,912 | |
| 9. | MARKET AND GEOPOLITICAL RISK |
The increasing interconnectivity between global economies and financial markets increases the likelihood that events or conditions in one region or financial market may adversely impact issuers in a different country, region or financial market. Securities in the Fund’s portfolio may underperform due to inflation (or expectations for inflation), interest rates, global demand for particular products or resources, natural disasters, pandemics, epidemics, terrorism, regulatory events and governmental or quasi-governmental actions. The occurrence of global events similar to those in recent years may result in market volatility and may have long term effects on both the U.S. and global financial markets. The current novel coronavirus (COVID-19) global pandemic and the aggressive responses taken by many governments, including closing borders, restricting international and domestic travel, and the imposition of prolonged quarantines or similar restrictions, as well as the forced or voluntary closure of, or operational changes to, many retail and other businesses, has had negative impacts, and in many cases severe negative impacts, on markets worldwide. It is not known how long such impacts, or any future impacts of other significant events described above, will or would last, but there could be a prolonged period of global economic slowdown, which may impact your Fund investment.
Subsequent events after the date of the Statement of Assets and Liabilities have been evaluated through the date the financial statements were issued. Management has determined that no events or transactions occurred requiring adjustment or disclosure in the financial statements.
BOYAR VALUE FUND, INC.
EXPENSE EXAMPLES (Unaudited)
June 30, 2022
As a shareholder of the Boyar Value Fund, you incur two types of costs: (1) transaction costs, including sales charges (loads) on purchases and redemption fees; (2) ongoing costs, including management fees and distribution fees; and other Fund expenses. This example is intended to help you understand your ongoing costs (in dollars) of investing in the Boyar Value Fund and to compare these costs with the ongoing costs of investing in other mutual funds.
The example is based on an investment of $1,000 invested at the beginning of the period and held for the entire period from January 1, 2022 through June 30, 2022.
Actual Expenses
The “Actual” expenses line in the table below provides information about actual account values and actual expenses. You may use the information below, together with the amount you invested, to estimate the expenses that you paid over the period. Simply divide your account value by $1,000 (for example, an $8,600 account value divided by $1,000 = 8.6), then multiply the result by the number in the table under the heading entitled “Expenses Paid During Period” to estimate the expenses you paid on your account during this period.
Hypothetical Example for Comparison Purposes
The “Hypothetical” line in the table below provides information about hypothetical account values and hypothetical expenses based on the Boyar Value Fund’s actual expense ratio and an assumed rate of return of 5% per year before expenses, which is not the Fund’s actual return. The hypothetical account values and expenses may not be used to estimate the actual ending account balances or expenses you paid for the period. You may use this information to compare this 5% hypothetical example with the 5% hypothetical examples that appear in the shareholder reports of other funds.
Please note that the expenses shown in the table are meant to highlight your ongoing costs only and do not reflect any transactional costs, such as sales charges (loads), or redemption fees. Therefore, the table is useful in comparing ongoing costs only, and will not help you determine the relative total costs of owning different funds. In addition, if these transactional costs were included, your costs would have been higher.
| | Beginning | Ending | Expenses Paid | Expense Ratio |
| | Account Value | Account Value | During Period* | During Period ** |
| | 1/1/22 | 6/30/22 | 1/1/22 – 6/30/22 | 1/1/22 – 6/30/22 |
| Actual | $1,000.00 | $769.40 | $7.06 | 1.61% |
| Hypothetical (5% return before expenses) | $1,000.00 | $1,016.81 | $8.05 | 1.61% |
| * | Expenses are equal to the average account value times the Fund’s annualized expense ratio multiplied by the number of days in the most recent fiscal half-year [181] divided by the number of days in the fiscal year [365]. |
PRIVACY NOTICE
Rev. June 2011
| FACTS | WHAT DOES BOYAR VALUE FUND, INC. DO WITH YOUR PERSONAL INFORMATION? |
| | | |
| Why? | Financial companies choose how they share your personal information. Federal law gives consumers the right to limit some but not all sharing. Federal law also requires us to tell you how we collect, share, and protect your personal information. Please read this notice carefully to understand what we do. |
| | | |
| What? | The types of personal information we collect and share depend on the product or service you have with us. This information can include: |
| | |
| | ■ Social Security number | ■ Purchase History |
| | | |
| | ■ Assets | ■ Account Balances |
| | | |
| | ■ Retirement Assets | ■ Account Transactions |
| | | |
| | ■ Transaction History | ■ Wire Transfer Instructions |
| | | |
| | ■ Checking Account Information | |
| | | |
| | When you are no longer our customer, we continue to share your information as described in this notice. |
| | | |
| How? | All financial companies need to share customers’ personal information to run their everyday business. In the section below, we list the reasons financial companies can share their customers’ personal information; the reasons Boyar Value Fund, Inc. chooses to share; and whether you can limit this sharing. |
| Reasons we can share your personal information | Does Boyar
Value Fund, Inc,
share? | Can you limit this sharing? |
| For our everyday business purposes – | | |
| such as to process your transactions, maintain your account(s), respond to court orders and legal investigations, or report to credit bureaus | Yes | No |
| | | |
| For our marketing purposes – | | |
| to offer our products and services to you | No | We don’t share |
| | | |
| For joint marketing with other financial companies | No | We don’t share |
| | | |
| For our affiliates’ everyday business purposes – | | |
| information about your transactions and experiences | No | We don’t share |
| | | |
| For our affiliates’ everyday business purposes – | | |
| information about your creditworthiness | No | We don’t share |
| | | |
| For nonaffiliates to market to you | No | We don’t share |
| Questions? | Call 1-402-493-4603 |
Rev. June 2011
| Who we are | |
Who is providing this notice? | Boyar Value Fund, Inc. |
| What we do | |
How does Boyar Value
Fund, Inc. protect my
personal information? | To protect your personal information from unauthorized access and use, we use security measures that comply with federal law. These measures include computer safeguards and secured files and buildings. |
| | Our service providers are held accountable for adhering to strict policies and procedures to prevent any misuse of your nonpublic personal information. |
How does Boyar Value
Fund, Inc. collect my
personal information? | We collect your personal information, for example, when you ■ Open an account ■ Provide account information ■ Give us your contact information ■ Make deposits or withdrawals from your account ■ Make a wire transfer ■ Tell us where to send the money ■ Tells us who receives the money ■ Show your government-issued ID ■ Show your driver’s license We also collect your personal information from other companies. |
Why can’t I limit all
sharing? | Federal law gives you the right to limit only ■ Sharing for affiliates’ everyday business purposes – information about your creditworthiness ■ Affiliates from using your information to market to you ■ Sharing for nonaffiliates to market to you State laws and individual companies may give you additional rights to limit sharing. |
| Definitions | |
| Affiliates | Companies related by common ownership or control. They can be financial and nonfinancial companies. ■ Boyar Value Fund, Inc. does not share with our affiliates. |
| Nonaffiliates | Companies not related by common ownership or control. They can be financial and nonfinancial companies ■ Boyar Value Fund, Inc. does not share with nonaffiliates so they can market to you. |
| Joint marketing | A formal agreement between nonaffiliated financial companies that together market financial products or services to you. ■ Boyar Value Fund, Inc. does not jointly market. |
PROXY VOTING POLICY
Information regarding how the Fund voted proxies relating to portfolio securities for the most recent twelve month period ended June 30 as well as a description of the policies and procedures that the Fund uses to determine how to vote proxies is available without charge, upon request, by calling 1-800-266-5566 or by referring to the Securities and Exchange Commission’s (“SEC”) website at http://www.sec.gov.
PORTFOLIO HOLDINGS
Funds file a complete schedule of portfolio holdings with the Securities and Exchange Commission (the “SEC”) for the first and third quarters of each fiscal year as an exhibit to its reports on Form N-PORT, within sixty days after the end of the period. Form N-PORT reports are available at the SEC’s website at www.sec.gov.
| INVESTMENT ADVISOR |
| Boyar Asset Management, Inc. |
| 32 West 39th Street, 9th Floor |
| New York, New York 10018 |
| |
| ADMINISTRATOR |
| Ultimus Fund Solutions, LLC |
| 225 Pictoria Drive, Suite 450 |
| Cincinnati, OH 45246 |
BVF-SAR22
(a) Include a copy of the report transmitted to stockholders pursuant to Rule 30e-1 under the Act (17 CFR 270.30e-1).
(b) Include a copy of each notice transmitted to stockholders in reliance on Rule 30e-3 under the Act (17 CFR 270.30e-3) that contains disclosures specified by paragraph (c)(3) of that rule. Not applicable
Item 2. Code of Ethics.
Not applicable for semi-annual reports.
Item 3. Audit Committee Financial Expert.
Not applicable for semi-annual reports.
Item 4. Principal Accountant Fees and Services.
Not applicable for semi-annual reports.
Item 5. Audit Committee of Listed Companies. Not applicable to open-end investment companies.
Item 6. Schedule of Investments. See Item 1.
Item 7. Disclosure of Proxy Voting Policies and Procedures for Closed-End Funds. Not applicable to open-end investment companies.
Item 8. Portfolio Managers of Closed-End Management Investment Companies. Not applicable to open-end investment companies.
Item 9. Purchases of Equity Securities by Closed-End Management Investment Company and Affiliated Purchasers. Not applicable to open-end investment companies.
Item 10. Submission of Matters to a Vote of Security Holder. None.
Item 11. Controls and Procedures.
(a) Based on an evaluation of the Registrant’s disclosure controls and procedures as of a date within 90 days of filing date of this Form N-CSR, the disclosure controls and procedures are reasonably designed to ensure that the information required in filings on Forms N-CSR is recorded, processed, summarized, and reported on a timely basis.
(b) There were no significant changes in the registrant’s internal control over financial reporting that occurred during the period covered by this report that has materially affected, or is reasonably likely to materially affect, the registrant’s internal control over financial reporting.
Item 12. Disclosure of Securities Lending Activities for Closed-End Management Investment Companies. Not applicable
Item 13. Exhibits.
(a)(1) Not applicable.
(a)(2) Certification(s) required by Section 302 of the Sarbanes-Oxley Act of 2002 (and Item 11(a)(2) of Form N-CSR) are filed herewith.
(a)(3) Not applicable.
(b) Certification(s) required by Section 906 of the Sarbanes-Oxley Act of 2002 (and Item 11(b) of Form N-CSR) are filed herewith.
SIGNATURES
Pursuant to the requirements of the Securities Exchange Act of 1934 and the Investment Company Act of 1940, the registrant has duly caused this report to be signed on its behalf by the undersigned, thereunto duly authorized.
(Registrant) The Boyar Value Fund, Inc.
By (Signature and Title)
* /s/ Sam Singh
Sam Singh, Principal Executive Officer/President
Date 8/30/22
Pursuant to the requirements of the Securities Exchange Act of 1934 and the Investment Company Act of 1940, this report has been signed below by the following persons on behalf of the registrant and in the capacities and on the dates indicated.
By (Signature and Title)
* /s/ Sam Singh
Sam Singh, Principal Executive Officer/President
Date 8/30/22
By (Signature and Title)
* /s/ Dawn Borelli
Dawn Borelli, Principal Financial Officer/Treasurer
Date 8/30/22
* Print the name and title of each signing officer under his or her signature.