As filed with the Securities and Exchange Commission on July 2, 2013
File No. 333-
SECURITIES AND EXCHANGE COMMISSION
Washington, D.C. 20549
FORM N-14
REGISTRATION STATEMENT
UNDER
THE SECURITIES ACT OF 1933
¨ Pre-Effective Amendment No.
¨ Post-Effective Amendment No.
NUVEEN INVESTMENT TRUST II
(Exact Name of Registrant as Specified in Charter)
333 West Wacker Drive
Chicago, Illinois 60606
(Address of Principal Executive Offices, Zip Code)
Registrant’s Telephone Number, including Area Code (312) 917-7700
Kevin J. McCarthy
Vice President and Secretary
333 West Wacker Drive
Chicago, Illinois 60606
(Name and Address of Agent for Service)
Copy to:
| | |
Deborah Bielicke Eades
Vedder Price P.C.
222 North LaSalle Street
Chicago, Illinois 60601 | | Eric F. Fess
Chapman and Cutler LLP
111 West Monroe Street
Chicago, Illinois 60603 |
Approximate date of proposed public offering: As soon as practicable after the effective date of this Registration Statement.
TITLE OF SECURITIES BEING REGISTERED: Shares of Beneficial Interest (par value $0.01 per share) of the Registrant.
No filing fee is required because of reliance on Section 24(f) and an indefinite number of shares have previously been registered pursuant to Rule 24f-2 under the Investment Company Act of 1940.
It is proposed that this filing will become effective on August 1, 2013 pursuant to Rule 488 under the Securities Act of 1933.

Important Information for
Nuveen Mid Cap Select Fund Shareholders
At a special meeting of shareholders of Nuveen Mid Cap Select Fund (the “Target Fund”), a series of Nuveen Investment Funds, Inc. (the “Corporation”), you will be asked to vote upon an important change affecting your fund. The purpose of the special meeting is to allow you to vote on a reorganization of your fund into Nuveen Symphony Mid-Cap Core Fund (the “Acquiring Fund”), a series of Nuveen Investment Trust II, a Massachusetts business trust (the “Trust”). If the reorganization is approved and completed, you will become a shareholder of the Acquiring Fund. The Target Fund and the Acquiring Fund are collectively referred to herein as the “Funds” or individually as a “Fund.”
Although we recommend that you read the complete Proxy Statement/Prospectus, for your convenience, we have provided the following brief overview of the matter to be voted on.
| Q. | Why am I receiving this Proxy Statement/Prospectus? |
| A. | The shareholders of the Target Fund are being asked to approve a reorganization between the Target Fund and the Acquiring Fund pursuant to an Agreement and Plan of Reorganization, as described in more detail in this Proxy Statement/Prospectus. |
| Q. | Why has the reorganization been proposed for the Target Fund? |
| A. | Nuveen Fund Advisors, LLC (“Nuveen Fund Advisors”), each Fund’s investment adviser, has proposed the reorganization of the Target Fund into the Acquiring Fund as part of an initiative to eliminate certain redundancies among the products it offers and in an effort to achieve certain operating efficiencies. Although the Acquiring Fund has higher gross operating expenses than the Target Fund, the reorganization may result in slightly lower operating expenses for Target Fund shareholders after taking into account the lower expense limitation that will be in effect for the Acquiring Fund through September 30, 2014 if the reorganization is completed. In addition, Nuveen Fund Advisors and the Board of Directors of the Corporation believe that distribution opportunities for the Acquiring Fund are more attractive than those for the Target Fund and may result in economies of scale over time. |
| Q. | What are the similarities between the principal investment strategies of the Funds? |
| A. | The investment objectives of the Funds are substantially similar. The investment objective of the Target Fund is long-term growth of capital, and the investment objective of the Acquiring Fund is long-term capital appreciation. The Funds also have similar investment strategies. The Target Fund invests, under normal market conditions, at least 80% of its net assets, plus the amount of any borrowings for investment purposes, in common stocks of mid-capitalization companies, defined as companies that have market capitalizations at the time of purchase within the market capitalization range of the companies in the Russell Midcap® Index immediately after its most recent reconstitution prior to such purchase. The Acquiring Fund invests, under normal market conditions, at least 80% of the sum of its net assets and the amount of any borrowings for investment purposes in equity securities of companies with market capitalizations at the time of investment comparable to companies in the Russell Midcap® Index. There are, however, some differences in investment strategies. The Target Fund may invest in non-U.S. and emerging |
| | markets securities and may utilize derivatives as principal investment strategies. Such investments are not principal investment strategies of the Acquiring Fund. A more detailed comparison of the investment objectives, strategies and risks of the Funds is contained in the Proxy Statement/Prospectus. |
| Q. | Are the Funds managed by the same sub-adviser? |
| A. | No. The Target Fund is sub-advised by Nuveen Asset Management, LLC, and the Acquiring Fund is sub-advised by Symphony Asset Management LLC. These sub-advisers manage the Funds using different investment processes, which are described in the Proxy Statement/Prospectus. |
| Q. | What will happen if shareholders do not approve the reorganization? |
| A. | If the reorganization is not approved by shareholders, the Board of Directors will take such actions as it deems to be in the best interests of the Target Fund, which may include additional solicitation, continuing to operate the Target Fund as a stand-alone fund, or liquidating the Target Fund. |
| Q. | Will Target Fund shareholders receive new shares in exchange for their current shares? |
| A. | Yes. If shareholders approve the reorganization and it is completed, each Target Fund shareholder will receive shares of the Acquiring Fund in an amount equal in total value to the total value of the Target Fund shares surrendered by such shareholder. |
| Q. | Will this reorganization create a taxable event for Target Fund shareholders? |
| A. | No. The reorganization is intended to qualify as a tax-free reorganization for federal income tax purposes. It is expected that Target Fund shareholders will recognize no gain or loss for federal income tax purposes as a direct result of the reorganization. Prior to the closing of the reorganization, the Target Fund expects to distribute all of its net investment income and net capital gains, if any. Such a distribution may be taxable to the Target Fund’s shareholders for federal income tax purposes. Due to the Target Fund’s capital loss carryforwards, a net capital gain distribution is not expected. However, in light of unrealized capital gains currently in each Fund’s portfolio, Target Fund shareholders may be subject to higher capital gain distributions in the future than they would have been absent the reorganization. |
| Q. | How do total operating expenses compare between the two Funds? |
| A. | While the current gross total operating expenses of the Acquiring Fund are higher than the current gross total operating expenses of the Target Fund, the net total operating expenses of the Acquiring Fund immediately following the reorganization are expected to be slightly lower than the net total operating expenses of the Target Fund for all share classes as a result of the expense cap that will be in effect for the Acquiring Fund through September 30, 2014 if the reorganization is completed. |
| Q. | Who will bear the costs of the reorganization? |
| A. | Each Fund will be allocated the costs of the reorganization in an amount up to its projected cost savings, if any, during the first year following the reorganization. Nuveen Fund Advisors estimates that the costs of the reorganization will be approximately $159,000 and that the cost savings during the first year following the reorganization will be approximately $2,600 for the Target Fund. The Acquiring Fund is not expected to realize cost savings and therefore will not be |
| | charged any costs of the reorganization. Based on current expense levels, it is anticipated that Nuveen Fund Advisors or its affiliates (“Nuveen”) will absorb all expenses charged to the Target Fund because payment of such amount would cause the Target Fund to exceed its current expense cap. If the reorganization is not approved or completed, Nuveen will pay all such reorganization expenses. |
| Q. | What is the timetable for the reorganization? |
| A. | If approved by shareholders on , 2013, the reorganization is expected to occur at the close of business on , 2013. |
| Q. | Whom do I call if I have questions? |
| A. | If you need any assistance, or have any questions regarding the proposal or how to vote your shares, please call Computershare Fund Services, your proxy solicitor, at ( ) - from 8 a.m. to 10 p.m. Central time on Monday through Friday or 11 a.m. to 5 p.m. Central time on Saturday. Please have your proxy materials available when you call. |
| Q. | How do I vote my shares? |
| A. | You may vote by mail, telephone or over the Internet: |
| | • | | To vote by mail, please mark, sign, date and mail the enclosed proxy card. No postage is required if mailed in the United States. |
| | • | | To vote by telephone, please call the toll-free number located on your proxy card and follow the recorded instructions, using your proxy card as a guide. |
| | • | | To vote over the Internet, go to the Internet address provided on your proxy card and follow the instructions, using your proxy card as a guide. |
| Q. | Will Nuveen contact me? |
| A. | You may receive a call from representatives of Computershare Fund Services, the proxy solicitation firm retained by Nuveen, to verify that you received your proxy materials and to answer any questions you may have about the reorganization. |
| Q. | How does the Board of Directors suggest that I vote? |
| A. | After careful consideration, the Board of Directors has agreed unanimously that the reorganization is in the best interests of your Fund and recommends that you vote “FOR” the reorganization. |

, 2013
Dear Shareholders:
We are pleased to invite you to the special meeting of shareholders of Nuveen Mid Cap Select Fund (the “Special Meeting”). The Special Meeting is scheduled for , 2013, at [ : ] p.m., Central time, at the offices of Nuveen Investments, Inc., 333 West Wacker Drive, Chicago, Illinois 60606.
At the Special Meeting, you will be asked to consider and approve a very important proposal. Subject to shareholder approval, Nuveen Symphony Mid-Cap Core Fund (the “Acquiring Fund”) will acquire all the assets and liabilities of Nuveen Mid Cap Select Fund (the “Target Fund” and together with the Acquiring Fund, the “Funds” and each a “Fund”) in exchange solely for shares of the Acquiring Fund, which will be distributed in complete liquidation and termination of the Target Fund to the shareholders of the Target Fund (the “Reorganization”).
Nuveen Fund Advisors, LLC (“Nuveen Fund Advisors”), each Fund’s investment adviser, has proposed the Reorganization involving the Target Fund, as well as a number of other reorganizations involving other funds advised by Nuveen Fund Advisors, to eliminate certain redundancies among the products it offers and in an effort to achieve certain operating efficiencies.
The Reorganization is being proposed because Nuveen Fund Advisors and the Board of Directors of Nuveen Investment Funds, Inc. believe that distribution opportunities for the Acquiring Fund are more attractive than those for the Target Fund and may result in economies of scale over time. In addition, following the Reorganization, the Acquiring Fund is expected to have slightly lower net total operating expenses than the Target Fund had prior to the Reorganization. The Board of Directors believes the Reorganization is in the best interests of the Target Fund and recommends that you vote “For” the proposed Reorganization.
The attached Proxy Statement/Prospectus has been prepared to give you information about this proposal.
All shareholders are cordially invited to attend the Special Meeting. In order to avoid delay and additional expense, and to assure that your shares are represented, please vote as promptly as possible, whether or not you plan to attend the Special Meeting. You may vote by mail, telephone or over the Internet.
| | • | | To vote by mail, please mark, sign, date and mail the enclosed proxy card. No postage is required if mailed in the United States. |
| | • | | To vote by telephone, please call the toll-free number located on your proxy card and follow the recorded instructions, using your proxy card as a guide. |
| | • | | To vote over the Internet, go to the Internet address provided on your proxy card and follow the instructions, using your proxy card as a guide. |
We appreciate your continued support and confidence in Nuveen and our family of funds.
Very truly yours,
Kevin J. McCarthy
Vice President and Secretary
, 2013
NUVEEN MID CAP SELECT FUND
NOTICE OF SPECIAL MEETING OF SHAREHOLDERS TO BE HELD ON , 2013
To the Shareholders:
Notice is hereby given that a special meeting of shareholders of Nuveen Mid Cap Select Fund (the “Target Fund”), a series of Nuveen Investment Funds, Inc. (the “Corporation”), a Maryland corporation, will be held at the offices of Nuveen Investments, Inc., 333 West Wacker Drive, Chicago, Illinois 60606, on , 2013 at [ : p.m.], Central time (the “Special Meeting”), for the following purposes:
1. To approve an Agreement and Plan of Reorganization (and the related transactions) which provides for (i) the transfer of all the assets of the Target Fund to Nuveen Symphony Mid-Cap Core Fund (the “Acquiring Fund”) in exchange solely for shares of beneficial interest of the Acquiring Fund and the assumption by the Acquiring Fund of all the liabilities of the Target Fund; and (ii) the distribution by the Target Fund of Class A, Class C and Class I shares of the Acquiring Fund to the shareholders of Class A, Class C and Class I shares, respectively, of the Target Fund in complete liquidation and termination of the Target Fund (the “Reorganization”). A vote in favor of the Reorganization will be considered a vote in favor of an amendment to the Corporation’s Articles of Incorporation effecting the Reorganization.
2. To transact such other business as may properly come before the Special Meeting.
Only shareholders of record as of the close of business on , 2013 are entitled to vote at the Special Meeting or any adjournments or postponements thereof.
All shareholders are cordially invited to attend the Special Meeting. In order to avoid delay and additional expense, and to assure that your shares are represented, please vote as promptly as possible, whether or not you plan to attend the Special Meeting. You may vote by mail, telephone or over the Internet.
| | • | | To vote by mail, please mark, sign, date and mail the enclosed proxy card. No postage is required if mailed in the United States. |
| | • | | To vote by telephone, please call the toll-free number located on your proxy card and follow the recorded instructions, using your proxy card as a guide. |
| | • | | To vote over the Internet, go to the Internet address provided on your proxy card and follow the instructions, using your proxy card as a guide. |
Kevin J. McCarthy
Vice President and Secretary
Proxy Statement/Prospectus
Dated , 2013
Relating to the Acquisition of the Assets and Liabilities of
NUVEEN MID CAP SELECT FUND
by NUVEEN SYMPHONY MID-CAP CORE FUND
This Proxy Statement/Prospectus is being furnished to shareholders of Nuveen Mid Cap Select Fund (the “Target Fund”), a series of Nuveen Investment Funds, Inc. (the “Corporation”), a Maryland corporation and an open-end investment company registered under the Investment Company Act of 1940, as amended (the “1940 Act”), and relates to the special meeting of shareholders of the Target Fund to be held at the offices of Nuveen Investments, Inc., 333 West Wacker Drive, Chicago, Illinois 60606, on , 2013 at [ : p.m.], Central time and at any and all adjournments and postponements thereof (the “Special Meeting”). This Proxy Statement/Prospectus is provided in connection with the solicitation by the Board of Directors of the Corporation of proxies to be voted at the Special Meeting, and any and all adjournments or postponements thereof. The purpose of the Special Meeting is to consider the proposed reorganization (the “Reorganization”) of the Target Fund into Nuveen Symphony Mid-Cap Core Fund (the “Acquiring Fund”), a series of Nuveen Investment Trust II, a Massachusetts business trust (the “Trust”) and an open-end investment company registered under the 1940 Act. The Target Fund and the Acquiring Fund are referred to herein collectively as the “Funds” and individually as a “Fund.” The Board of Directors of the Corporation and the Board of Trustees of the Trust, which are made up of the same individuals, are referred to herein as the “Board.” If shareholders approve the Reorganization and it is completed, shareholders of the Target Fund will receive shares of the corresponding class of the Acquiring Fund with the same total value as the total value of the Target Fund shares surrendered by such shareholders. The Board has determined that the Reorganization is in the best interests of the Target Fund. The address, principal executive office and telephone number of the Funds, the Trust and the Corporation is 333 West Wacker Drive, Chicago, Illinois 60606, (800) 257-8787.
A vote in favor of the Reorganization will be considered a vote in favor of an amendment to the Corporation’s Articles of Incorporation effecting the Reorganization.
The enclosed proxy and this Proxy Statement/Prospectus are first being sent to shareholders of the Target Fund on or about , 2013. Shareholders of record as of the close of business on , 2013 are entitled to vote at the Special Meeting and any adjournments or postponements thereof.
The Securities and Exchange Commission has not approved or disapproved these securities or determined whether the information in this Proxy Statement/Prospectus is truthful or complete. Any representation to the contrary is a criminal offense.
This Proxy Statement/Prospectus concisely sets forth the information shareholders of the Target Fund should know before voting on the Reorganization (in effect, investing in Class A, Class C and Class I shares of the Acquiring Fund) and constitutes an offering of Class A, Class C and Class I shares of beneficial interest, par value $0.01 per share, of the Acquiring Fund. Please read it carefully and retain it for future reference.
The following documents have been filed with the Securities and Exchange Commission (“SEC”) and are incorporated into this Proxy Statement/Prospectus by reference and also accompany this Proxy Statement/Prospectus:
| | (i) | the Trust’s prospectus dated January 31, 2013, as supplemented through the date of this Proxy Statement/Prospectus, relating to the Acquiring Fund; and |
| | (ii) | the unaudited financial statements contained in the Trust’s Semi-Annual Report, relating to the Acquiring Fund for the six-month period ended March 31, 2013. |
The following documents contain additional information about the Funds, have been filed with the SEC and are incorporated into this Proxy Statement/Prospectus by reference:
| | (i) | the Statement of Additional Information relating to the proposed Reorganization, dated , 2013 (the “Reorganization SAI”); |
| | (ii) | the Corporation’s prospectus dated February 28, 2013, as supplemented through the date of this Proxy Statement/Prospectus, relating to the Target Fund; |
| | (iii) | the Trust’s statement of additional information dated January 31, 2013, as supplemented through the date of this Proxy Statement/Prospectus, relating to the Acquiring Fund; |
| | (iv) | the Corporation’s statement of additional information dated February 28, 2013, as supplemented through the date of this Proxy Statement/Prospectus, relating to the Target Fund; |
| | (v) | the audited financial statements contained in the Trust’s Annual Report, relating to the Acquiring Fund for the fiscal year ended September 30, 2012; |
| | (vi) | the audited financial statements contained in the Corporation’s Annual Report, relating to the Target Fund for the fiscal year ended October 31, 2012; and |
| | (vii) | the unaudited financial statements contained in the Corporation’s Semi-Annual Report, relating to the Target Fund for the six-month period ended April 30, 2013. |
No other parts of the documents referenced above are incorporated by reference herein.
Copies of the foregoing may be obtained without charge by calling or writing the Funds at the telephone number or address shown above. If you wish to request the Reorganization SAI, please ask for the “Reorganization SAI.” In addition, the Acquiring Fund will furnish, without charge, a copy of its most recent annual report and semi-annual report to a shareholder upon request. Any such request should be directed to the Acquiring Fund by calling (800) 257-8787 or by writing the Acquiring Fund at 333 West Wacker Drive, Chicago, Illinois 60606.
The Corporation and the Trust are subject to the informational requirements of the Securities Exchange Act of 1934, as amended, and the 1940 Act, and in accordance therewith file reports and other information with the SEC. Reports, proxy statements, registration statements and other information filed by the Corporation or the Trust (including the registration statement relating to the Acquiring Fund on Form N-14 of which this Proxy Statement/Prospectus is a part) may be inspected without charge and copied (for a duplication fee at prescribed rates) at the SEC’s Public Reference
Room at 100 F Street, N.E., Washington, D.C. 20549 or at the SEC’s Northeast Regional Office (3 World Financial Center, New York, New York 10281) or Midwest Regional Office (175 W. Jackson Boulevard, Suite 900, Chicago, Illinois 60604). You may call the SEC at (202) 551-8090 for information about the operation of the Public Reference Room. You may obtain copies of this information, with payment of a duplication fee, by electronic request at the following e-mail address: publicinfo@sec.gov, or by writing the SEC’s Public Reference Branch, Office of Consumer Affairs and Information Services, Securities and Exchange Commission, Washington, D.C. 20549. You may also access reports and other information about the Funds on the EDGAR database on the SEC’s Internet site at http://www.sec.gov.
TABLE OF CONTENTS
-i-
TABLE OF CONTENTS
(continued)
-ii-
SUMMARY
The following is a summary of, and is qualified by reference to, the more complete information contained in this Proxy Statement/Prospectus and the information attached hereto or incorporated herein by reference, including the Agreement and Plan of Reorganization. As discussed more fully below and elsewhere in this Proxy Statement/Prospectus, the Board believes the proposed Reorganization is in the best interests of each Fund and that the interests of each Fund’s existing shareholders would not be diluted as a result of the Reorganization. If the Reorganization is approved and completed, shareholders of the Target Fund will become shareholders of the Acquiring Fund and will cease to be shareholders of the Target Fund.
Shareholders should read the entire Proxy Statement/Prospectus carefully together with the Acquiring Fund’s Prospectus that accompanies this Proxy Statement/Prospectus, which is incorporated herein by reference. This Proxy Statement/Prospectus constitutes an offering of Class A, Class C and Class I shares of the Acquiring Fund only.
Background
Nuveen Fund Advisors, LLC (“Nuveen Fund Advisors” or the “Adviser”), each Fund’s investment adviser, has proposed the reorganization of the Target Fund into the Acquiring Fund, as well as a number of other reorganizations involving other funds advised by Nuveen Fund Advisors, as part of an initiative to eliminate certain redundancies among the products it offers and in an effort to achieve certain operating efficiencies.
The Reorganization
This Proxy Statement/Prospectus is being furnished to shareholders of the Target Fund in connection with the proposed combination of the Target Fund with and into the Acquiring Fund pursuant to the terms and conditions of the Agreement and Plan of Reorganization among the Corporation, on behalf of the Target Fund, the Trust, on behalf of the Acquiring Fund, and Nuveen Fund Advisors (the “Agreement”). The Agreement provides for (i) the transfer of all the assets of the Target Fund to the Acquiring Fund in exchange solely for Class A, Class C and Class I shares of beneficial interest, par value $0.01 per share, of the Acquiring Fund and the assumption by the Acquiring Fund of all the liabilities of the Target Fund; and (ii) the distribution by the Target Fund of Class A, Class C and Class I shares of the Acquiring Fund to the shareholders of the corresponding class of the Target Fund in complete liquidation and termination of the Target Fund.
If shareholders approve the Reorganization and it is completed, Target Fund shareholders will become shareholders of the Acquiring Fund. The Board has determined that the Reorganization is in the best interests of the Target Fund and that the interests of existing shareholders will not be diluted as a result of the Reorganization. The Board unanimously approved the Reorganization and the Agreement at a meeting held on April 17-18, 2013. The Board recommends a vote “FOR” the Reorganization.
Each Fund will be allocated the costs of the Reorganization in an amount up to its projected cost savings, if any, during the first year following the Reorganization, subject to expense cap limitations. Nuveen Fund Advisors estimates that the costs of the Reorganization will be approximately $159,000 and that the cost savings during the first year following the Reorganization will be approximately $2,600 for the Target Fund. The Acquiring Fund is not expected to realize any cost savings. As a result,
1
the Target Fund is expected to be charged approximately $2,600 of the costs of the Reorganization, and the Acquiring Fund will not be charged any of the Reorganization costs. To the extent that payment of such Reorganization expenses causes the Target Fund to exceed the per share expense cap currently in effect, Nuveen Fund Advisors or its affiliates (“Nuveen”) will absorb the portion of the expenses necessary for the Target Fund to operate within the cap. Based on current expense levels, it is anticipated that Nuveen will absorb all expenses charged to the Target Fund. If the Reorganization is not approved or completed, Nuveen will pay all such Reorganization expenses.
The Board is asking shareholders of the Target Fund to approve the Reorganization at the Special Meeting to be held on , 2013. Approval of the Reorganization requires the affirmative vote of the holders of a majority of the total number of shares outstanding and entitled to vote. See “Voting Information and Requirements” below.
If shareholders of the Target Fund approve the Reorganization, it is expected that the closing of the Reorganization (the “Closing”) will occur at the close of business on , 2013 (the “Closing Date”), but it may be at a different time as described herein. If the Reorganization is not approved, the Board will take such action as it deems to be in the best interests of the Target Fund. The Closing may be delayed and the Reorganization may be abandoned at any time by the mutual agreement of the parties. In addition, either Fund may at its option terminate the Agreement at or before the Closing due to (i) a breach by any other party of any representation, warranty, or agreement contained in the Agreement to be performed at or before the Closing, if not cured within 30 days, (ii) a condition precedent to the obligations of the terminating party that has not been met and it reasonably appears that it will not or cannot be met, or (iii) a determination by the Board that the consummation of the transactions contemplated by the Agreement is not in the best interests of a Fund.
Reasons for the Proposed Reorganization
The Board believes that the proposed Reorganization would be in the best interests of each Fund. In approving the Reorganization, the Board considered a number of principal factors in reaching its determination, including the following:
| | • | | the similarities and differences in the Funds’ investment objectives and principal investment strategies; |
| | • | | the Funds’ relative risks; |
| | • | | the Funds’ relative sizes; |
| | • | | the relative investment performance of the Funds; |
| | • | | the relative fees and expense ratios of the Funds, including caps on the Funds’ expenses agreed to by the Adviser; |
| | • | | the anticipated federal income tax-free nature of the Reorganization; |
| | • | | the expected costs of the Reorganization and the extent to which the Funds would bear any such costs; |
| | • | | the terms of the Reorganization and whether the Reorganization would dilute the interests of shareholders of the Funds; |
2
| | • | | the effect of the Reorganization on shareholder services and shareholder rights; |
| | • | | alternatives to the Reorganization; and |
| | • | | any potential benefits of the Reorganization to the Adviser and its affiliates as a result of the Reorganization. |
For a more detailed discussion of the Board’s considerations regarding the approval of the Reorganization, see “The Board’s Approval of the Reorganization.”
Distribution, Purchase, Redemption, Exchange of Shares and Dividends
The Funds have identical procedures for purchasing, exchanging and redeeming shares. The Target Fund offers three classes of shares: Class A, Class C and Class I Shares. The Acquiring Fund offers four classes of shares: Class A, Class C, Class R3 and Class I Shares. The corresponding classes of each Fund have the same investment eligibility criteria. Each Fund normally declares and pays dividends from net investment income, if any, annually. Each Fund declares and pays any taxable capital gains or other taxable distributions once a year at year end. See “Comparison of the Funds—Distribution, Purchase, Redemption, Exchange of Shares and Dividends” below for a more detailed discussion.
Material Federal Income Tax Consequences of the Reorganization
As a condition to closing, the Funds will receive an opinion from Vedder Price P.C. (which will be based on certain factual representations and certain customary assumptions and exclusions) substantially to the effect that the Reorganization will qualify as a tax-free reorganization under Section 368(a) of the Internal Revenue Code of 1986, as amended (the “Code”). Accordingly, it is expected that neither Fund will recognize gain or loss for federal income tax purposes as a direct result of the Reorganization. In connection with the Reorganization, it is expected that a substantial portion of the Target Fund’s portfolio assets may be sold prior to the Reorganization, which may result in the Target Fund realizing capital gains prior to the Reorganization. However, due to the Target Fund’s capital loss carryforwards, it is not expected that any such portfolio sales would result in capital gain distributions to Target Fund shareholders. For a more detailed discussion of the federal income tax consequences of the Reorganization, please see “The Proposed Reorganization—Material Federal Income Tax Consequences” below.
3
COMPARISON OF THE FUNDS
Investment Objectives
The Funds have substantially similar investment objectives. The Target Fund’s investment objective is long-term growth of capital. The Acquiring Fund’s investment objective is long-term capital appreciation. The Acquiring Fund’s investment objective is fundamental and may not be changed without shareholder approval. The Target Fund’s investment objective may be changed without shareholder approval upon providing notice at least 60 days in advance.
Investment Strategies
The Target Fund and the Acquiring Fund also have similar principal investment strategies and risks. The similarities and differences of the principal investment strategies of the Funds are:
| | |
Target Fund | | Acquiring Fund |
| |
• Under normal market conditions, the Fund invests at least 80% of net assets, plus the amount of any borrowings for investment purposes, in common stocks of mid-capitalization companies, defined as companies that have market capitalizations at the time of purchase within the market capitalization range of the companies in the Russell Midcap® Index immediately after its most recent reconstitution prior to such purchase. | | • Under normal market conditions, the Fund invests at least 80% of the sum of its net assets and the amount of any borrowings for investment purposes in equity securities of companies with market capitalizations at the time of investment comparable to companies in the Russell Midcap® Index. |
| |
• In selecting stocks, the Fund’s sub-adviser invests in companies that it believes are attractively valued relative to other companies in the same industry or market; exhibit strong or improving cash flows, revenue and earnings growth or other fundamentals; maintain a strong competitive position; and/or exhibit an identifiable catalyst that could increase the value of the company’s stock over the next two years. | | • The sub-adviser’s investment process begins by identifying candidates with excess return potential from two complementary, separate sources: quantitative analysis and fundamental analysis. Investment ideas from these sources then undergo rigorous fundamental analysis. Through this bottom up stock selection process, the team seeks to identify companies likely to outperform their industry peers in the Russell Midcap® Index. Quantitative tools are used to optimize pre-determined risk factors and upside potential within set parameters, with ultimate allocation decisions made by the portfolio management team. |
| |
• The Fund may invest up to 15% of its total assets in non-dollar denominated equity securities of non-U.S. issuers. | | |
4
| | |
Target Fund | | Acquiring Fund |
| |
• The Fund may invest up to 25% of its assets, collectively, in non-dollar denominated equity securities of non-U.S. issuers and in dollar-denominated equity securities of non-U.S. issuers that are either listed on a U.S. stock exchange or represented by depositary receipts that may or may not be sponsored by a domestic bank. | | |
| |
• Up to 15% of the Fund’s total assets may be invested in equity securities of emerging market issuers. A country is considered to be an “emerging market” if it is defined as such by Morgan Stanley Capital International Inc. | | |
| |
• The Fund may utilize options, futures contracts, options on futures contracts, and forward foreign currency exchange contracts (“derivatives”). The Fund may use these derivatives to manage market or business risk, enhance the Fund’s return, or hedge against adverse movements in currency exchange rates. | | |
Comparison of Principal Investment Strategies
Although the investment objectives of the Funds are not the same, they are substantially similar and the Funds employ similar investment strategies to achieve their investment objectives. Both Funds focus on investing in securities of mid-capitalization companies, and particularly in companies within the market capitalization range of the Russell Midcap® Index. As of January 31, 2013, the Acquiring Fund had a weighted average market capitalization of $9.6 billion, and the Target Fund had a weighted average market capitalization of $8.3 billion.
The Funds have different sub-advisers. The Target Fund is sub-advised by Nuveen Asset Management, LLC (“Nuveen Asset Management”), and the Acquiring Fund is sub-advised by Symphony Asset Management LLC (“Symphony”). The two sub-advisers utilize different investment processes, as described above.
Also, the Target Fund has principal investment strategies that the Acquiring Fund does not. These principal investment strategies permit the Target Fund to (i) invest up to 15% of its total assets in non-dollar denominated equity securities of non-U.S. issuers and (ii) invest up to 25% of its assets, collectively, in non-dollar denominated equity securities of non-U.S. issuers and in dollar-denominated equity securities of non-U.S. issuers that are either listed on a U.S. stock exchange or represented by depositary receipts that may or may not be sponsored by a domestic bank. The Target Fund also may invest up to 15% of its total assets in equity securities of emerging market issuers. The Acquiring Fund does not have principal investment strategies with respect to investments in equity securities of non-U.S. or emerging market issuers.
5
In addition, the Target Fund may utilize options, futures contracts, options on futures contracts and forward foreign currency exchange contracts as a principal investment strategy. The Acquiring Fund does not have a similar principal investment strategy, but may utilize such financial instruments as a non-principal strategy.
In evaluating the Reorganization, each Target Fund shareholder should consider the risks of investing in the Acquiring Fund. The principal risks of investing in the Acquiring Fund are described in the section below entitled “Risk Factors.”
The Reorganization may result in one-time brokerage costs for the Target Fund to the extent it is necessary for the Target Fund to sell holdings prior to the Reorganization so that the Acquiring Fund’s portfolio immediately following the Reorganization remains in compliance with its investment policies and restrictions or to the extent that portfolio adjustments are deemed appropriate in light of the different investment processes of the sub-advisers described above. If the Reorganization had occurred as of March 31, 2013, the Target Fund would not have been required to dispose of any of its securities in order to comply with the Acquiring Fund’s investment policies and restrictions. However, based on the Funds’ portfolios as of March 31, 2013, it is estimated that the Target Fund will sell approximately 85% of its portfolio prior to the Reorganization because of the different investment processes utilized by the sub-advisers. Actual portfolio sales may be more or less than this amount, depending on the composition of the Funds’ portfolios at the time of the realignment. Any portfolio sales that occur prior to the Reorganization may result in the Target Fund realizing capital gains. However, due to the Target Fund’s capital loss carryforwards, it is not expected that any such portfolio sales would result in capital gain distributions to Target Fund shareholders. See “The Proposed Reorganization—Material Federal Income Tax Consequences” below.
Fees and Expenses
The tables below provide information about the fees and expenses attributable to each class of shares of the Funds, and the pro forma fees and expenses of the combined fund. You may qualify for sales charge discounts on purchases of Class A shares if you and your family invest, or agree to invest in the future, at least $50,000 in a Fund or other Nuveen mutual funds. Shareholder fees reflect the fees currently in effect for each Fund. Annual Fund Operating Expenses for the Acquiring Fund reflect the Fund’s fees and expenses as of its fiscal year ended September 30, 2012. Annual Fund Operating Expenses for the Target Fund reflect the Fund’s fees and expenses as of its fiscal year ended October 31, 2012. The pro forma fees and expenses are based on the amounts shown in the table for each Fund, assuming the Reorganization occurred as of September 30, 2012.
Shareholder Fees
(paid directly from your investment)
| | | | | | | | | | | | |
| | | Target
Fund
10/31/12 | | | Acquiring
Fund
9/30/12 | | | Combined
Fund Pro
Forma
9/30/12 | |
Maximum Sales Charge (Load) Imposed on Purchases (as a percentage of offering price) | | | | | | | | | | | | |
Class A | | | 5.75% | | | | 5.75% | | | | 5.75% | |
Class C | | | None | | | | None | | | | None | |
Class I | | | None | | | | None | | | | None | |
6
| | | | | | | | | | | | |
| | | Target
Fund
10/31/12 | | | Acquiring
Fund
9/30/12 | | | Combined
Fund Pro
Forma
9/30/12 | |
Maximum Deferred Sales Charge (Load) (as a percentage of the lesser of purchase price or redemption proceeds) | | | | | | | | | | | | |
Class A | | | None | | | | None | | | | None | |
Class C1 | | | 1.00% | | | | 1.00% | | | | 1.00% | |
Class I | | | None | | | | None | | | | None | |
Maximum Sales Charge (Load) Imposed on Reinvested Dividends | | | | | | | | | | | | |
Class A | | | None | | | | None | | | | None | |
Class C | | | None | | | | None | | | | None | |
Class I | | | None | | | | None | | | | None | |
Exchange Fees | | | | | | | | | | | | |
Class A | | | None | | | | None | | | | None | |
Class C | | | None | | | | None | | | | None | |
Class I | | | None | | | | None | | | | None | |
Annual Low Balance Account fee (for accounts under $1,000)2 | | | | | | | | | | | | |
Class A | | | $15 | | | | $15 | | | | $15 | |
Class C | | | $15 | | | | $15 | | | | $15 | |
Class I | | | $15 | | | | $15 | | | | $15 | |
| 1 | The contingent deferred sales charge on Class C shares applies only to redemptions within 12 months of purchase. |
| 2 | Fee applies to the following types of accounts under $1,000 held directly with the Fund: individual retirement accounts (IRAs), Coverdell Education Savings Accounts and accounts established pursuant to the Uniform Transfers to Minors Act (UTMA) or Uniform Gifts to Minors Act (UGMA). |
Annual Fund Operating Expenses
(expenses that you pay each year as a percentage of the value of your investment)
| | | | | | | | | | | | |
| | | Target
Fund
10/31/12 | | | Acquiring
Fund
9/30/12 | | | Combined
Fund Pro
Forma1
9/30/12 | |
Management Fees | | | | | | | | | | | | |
Class A | | | 0.90% | | | | 0.72% | | | | 0.75% | |
Class C | | | 0.90% | | | | 0.72% | | | | 0.75% | |
Class I | | | 0.90% | | | | 0.72% | | | | 0.75% | |
Distribution and Service (12b-1) Fees | | | | | | | | | | | | |
Class A | | | 0.25% | | | | 0.25% | | | | 0.25% | |
Class C | | | 1.00% | | | | 1.00% | | | | 1.00% | |
Class I | | | 0.00% | | | | 0.00% | | | | 0.00% | |
Other Expenses2 | | | | | | | | | | | | |
Class A | | | 0.69% | | | | 3.07% | | | | 0.81% | |
Class C | | | 0.69% | | | | 3.18% | | | | 0.81% | |
Class I | | | 0.69% | | | | 2.63% | | | | 0.81% | |
Total Annual Fund Operating Expenses | | | | | | | | | | | | |
Class A | | | 1.84% | | | | 4.04% | | | | 1.81% | |
Class C | | | 2.59% | | | | 4.90% | | | | 2.56% | |
Class I | | | 1.59% | | | | 3.35% | | | | 1.56% | |
Fee Waivers and/or Expense Reimbursements | | | | | | | | | | | | |
Class A | | | (0.43% | )3 | | | (2.67% | )4 | | | (0.41% | )5 |
Class C | | | (0.43% | )3 | | | (2.78% | )4 | | | (0.41% | )5 |
Class I | | | (0.43% | )3 | | | (2.23% | )4 | | | (0.41% | )5 |
7
| | | | | | | | | | | | |
| | | Target
Fund
10/31/12 | | | Acquiring
Fund
9/30/12 | | | Combined
Fund Pro
Forma1
9/30/12 | |
Total Annual Fund Operating Expenses–After Fee Waivers and/or Expense Reimbursements | | | | | | | | | | | | |
Class A | | | 1.41% | | | | 1.37% | | | | 1.40% | |
Class C | | | 2.16% | | | | 2.12% | | | | 2.15% | |
Class I | | | 1.16% | | | | 1.12% | | | | 1.15% | |
| 1 | Pro forma expenses do not include the expenses to be charged to the Target Fund in connection with the Reorganization. See “The Proposed Reorganization—Reorganization Expenses” for additional information about these expenses. |
| 2 | Other Expenses have been restated to reflect current contractual fees. |
| 3 | Nuveen Fund Advisors has contractually agreed to waive fees and/or reimburse other Target Fund expenses through February 28, 2014 so that total annual fund operating expenses, after fee waivers and/or expense reimbursements and excluding acquired fund fees and expenses, do not exceed 1.41%, 2.16% and 1.16% for Class A, Class C and Class I shares, respectively. Fee waivers and/or expense reimbursements will not be terminated prior to that time without the approval of the Board. |
| 4 | Nuveen Fund Advisors has agreed to waive fees and/or reimburse Acquiring Fund expenses through January 31, 2014 so that total annual fund operating expenses (excluding 12b-1 distribution and/or service fees, interest expenses, taxes, acquired fund fees and expenses, fees incurred in acquiring and disposing of portfolio securities and extraordinary expenses) do not exceed 1.15% (1.40% after January 31, 2014) of the average daily net assets of any class of Acquiring Fund shares. The expense limitation expiring January 31, 2014 may be terminated or modified prior to that date only with the approval of the Board. The expense limitation of 1.40% in effect thereafter may be terminated or modified only with the approval of shareholders of the Acquiring Fund. |
| 5 | If the Reorganization is approved by shareholders and completed, Nuveen Fund Advisors has agreed to waive fees and/or reimburse expenses commencing the first business day following the closing through September 30, 2014 so that total annual fund operating expenses (excluding 12b-1 distribution and/or service fees, interest expenses, taxes, fees incurred in acquiring and disposing of portfolio securities and extraordinary expenses) do not exceed 1.15% (1.40% after September 30, 2014) of the average daily net assets of any class of Acquiring Fund shares. The expense limitation expiring September 30, 2014 may be terminated or modified prior to that date only with the approval of the Board. The expense limitation of 1.40% in effect thereafter may be terminated or modified only with the approval of shareholders of the Acquiring Fund. |
Example
The example below is intended to help you compare the cost of investing in each Fund and the pro forma cost of investing in the combined fund. The example assumes you invest $10,000 in a Fund for the time periods indicated (based on information in the tables above) and then either redeem or do not redeem your shares at the end of a period. The example assumes that your investment has a 5% return each year and that a Fund’s expenses remain at the level shown in the table above. Expense caps are taken into account for the periods stated in the table above, including the permanent expense cap applicable to the Acquiring Fund. Although your actual costs may be higher or lower, based on these assumptions your costs would be:
| | | | | | | | | | | | |
| | | Target
Fund | | | Acquiring
Fund | | | Combined
Fund Pro
Forma | |
1 Year | | | | | | | | | | | | |
| | | |
Assuming you sold your shares at the end of each period | | | | | | | | | | | | |
Class A | | $ | 710 | | | $ | 706 | | | $ | 711 | |
Class C | | $ | 219 | | | $ | 215 | | | $ | 220 | |
Class I | | $ | 118 | | | $ | 114 | | | $ | 119 | |
8
| | | | | | | | | | | | |
| | | Target
Fund | | | Acquiring
Fund | | | Combined
Fund Pro
Forma | |
Assuming you kept your shares | | | | | | | | | | | | |
Class A | | $ | 710 | | | $ | 706 | | | $ | 711 | |
Class C | | $ | 219 | | | $ | 215 | | | $ | 220 | |
Class I | | $ | 118 | | | $ | 114 | | | $ | 119 | |
| | | |
3 Years | | | | | | | | | | | | |
Assuming you sold your shares at the end of each period | | | | | | | | | | | | |
Class A | | $ | 1,081 | | | $ | 1,034 | | | $ | 1,044 | |
Class C | | $ | 765 | | | $ | 716 | | | $ | 727 | |
Class I | | $ | 460 | | | $ | 409 | | | $ | 421 | |
Assuming you kept your shares | | | | | | | | | | | | |
Class A | | $ | 1,081 | | | $ | 1,034 | | | $ | 1,044 | |
Class C | | $ | 765 | | | $ | 716 | | | $ | 727 | |
Class I | | $ | 460 | | | $ | 409 | | | $ | 421 | |
| | | |
5 Years | | | | | | | | | | | | |
Assuming you sold your shares at the end of each period | | | | | | | | | | | | |
Class A | | $ | 1,476 | | | $ | 1,383 | | | $ | 1,400 | |
Class C | | $ | 1,337 | | | $ | 1,243 | | | $ | 1,260 | |
Class I | | $ | 825 | | | $ | 726 | | | $ | 744 | |
Assuming you kept your shares | | | | | | | | | | | | |
Class A | | $ | 1,476 | | | $ | 1,383 | | | $ | 1,400 | |
Class C | | $ | 1,337 | | | $ | 1,243 | | | $ | 1,260 | |
Class I | | $ | 825 | | | $ | 726 | | | $ | 744 | |
| | | |
10 Years | | | | | | | | | | | | |
Assuming you sold your shares at the end of each period | | | | | | | | | | | | |
Class A | | $ | 2,576 | | | $ | 2,367 | | | $ | 2,399 | |
Class C | | $ | 2,893 | | | $ | 2,687 | | | $ | 2,719 | |
Class I | | $ | 1,853 | | | $ | 1,625 | | | $ | 1,660 | |
Assuming you kept your shares | | | | | | | | | | | | |
Class A | | $ | 2,576 | | | $ | 2,367 | | | $ | 2,399 | |
Class C | | $ | 2,893 | | | $ | 2,687 | | | $ | 2,719 | |
Class I | | $ | 1,853 | | | $ | 1,625 | | | $ | 1,660 | |
Portfolio Turnover
Each Fund pays transaction costs, such as commissions, when it buys and sells securities (or “turns over” its portfolio). A higher portfolio turnover rate may indicate higher transaction costs and may result in higher taxes when Fund shares are held in a taxable account. These costs, which are not reflected in annual fund operating expenses or in the example, affect each Fund’s performance. The Funds’ portfolio turnover rates for the most recent fiscal periods for which financial statements are available are set forth below. The portfolio turnover rates for the semi-annual periods are not annualized.
| | | | | | | | | | | | | | | | |
Fund | | Fiscal Year Ended | | | Rate | | | Semi-Annual Period Ended | | | Rate | |
Target Fund | | | 10/31/12 | | | | 198% | | | | 4/30/13 | | | | 57% | |
Acquiring Fund | | | 9/30/12 | | | | 138% | | | | 3/31/13 | | | | 99% | |
After the Reorganization is completed, the portfolio managers of the Acquiring Fund may, in their discretion, sell securities acquired from the Target Fund. To the extent that the portfolio managers
9
choose to sell a significant percentage of such securities, the Acquiring Fund’s portfolio turnover rate and brokerage costs may be higher than they otherwise would have been. In addition, such sales may result in taxable distributions to shareholders of the Acquiring Fund.
Risk Factors
In evaluating the Reorganization, you should consider carefully the risks of the Acquiring Fund to which you will be subject if the Reorganization is approved and completed. Investing in a mutual fund involves risk, including the risk that you may receive little or no return on your investment or even that you may lose part or all of your investment. Because of these and other risks, you should consider an investment in the Acquiring Fund to be a long-term investment. An investment in the Acquiring Fund may not be appropriate for all shareholders. For a complete description of the risks of an investment in the Acquiring Fund, see the section in the Acquiring Fund’s Prospectus entitled “Principal Risks.”
Because the Funds have similar investment strategies, the principal risks of each Fund are similar. The principal risks of investing in the Acquiring Fund are described below. An investment in the Target Fund is also subject to these risks. In addition, the principal risks of the Target Fund include derivatives risk and non-U.S./emerging markets risk.
Equity Security Risk. Equity securities may decline significantly in price over short or extended periods of time, and such declines may occur in the equity market as a whole, or they may occur in only a particular country, company, industry, or sector of the market.
Mid-Cap Stock Risk. Stocks of mid-cap companies may be subject to more abrupt or erratic market movements than those of larger, more established companies or the market averages in general.
Fundamental Investment Restrictions
The Funds have substantially similar fundamental investment restrictions that cannot be changed without shareholder approval, with the exception that the Target Fund’s investment objective may be changed by the Board without shareholder approval. In addition, each Fund is a diversified fund. As a diversified fund, each Fund, with respect to 75% of its assets, may not invest more than 5% of its total assets in the securities of any one issuer (other than securities issued by other investment companies or by the U.S. government, its agencies, instrumentalities or authorities) and may not purchase more than 10% of the outstanding voting securities of any one issuer.
Performance Information
The total returns of the Funds for the periods ended December 31, 2012, based on historical fees and expenses for each period, are set forth in the bar charts and tables below.
The following bar charts and tables provide some indication of the potential risks of investing in each Fund. Each Fund’s past performance (before and after taxes) is not necessarily an indication of how the Fund will perform in the future. Updated performance information is available at www.nuveen.com/performance or by calling (800) 257-8787.
The bar charts below show the annual calendar year returns for each Fund’s Class A shares. The performance of the other share classes will differ due to their different expense structures. The bar charts and highest/lowest quarterly and year-to-date returns that follow do not reflect sales charges, and
10
if these charges were reflected, the returns would be less than those shown. The tables below show the average annual returns for the periods ended December 31, 2012 for each Fund. The tables also show how each Fund’s performance compares with the returns of a broad measure of market performance and an index of funds with similar investment objectives. This information is intended to help you assess the variability of Fund returns (and consequently, the potential risks of a Fund investment).
All after-tax returns are calculated using the historical highest individual federal marginal income tax rates and do not reflect the impact of state and local taxes. After-tax returns are shown for Class A shares only; after-tax returns for Class C and Class I shares will vary. Your own actual after-tax returns will depend on your specific tax situation and may differ from what is shown here. After-tax returns are not relevant to investors who hold fund shares in tax-deferred accounts such as IRAs or employer-sponsored retirement plans.
Both the bar charts and the tables assume that all distributions have been reinvested. Performance reflects fee waivers, if any, in effect during the periods presented. If any such waivers were not in place, performance would be reduced.
The Target Fund’s performance for periods prior to May 4, 2009 reflects the Fund’s operations using different investment strategies than are currently in place. Effective October 3, 2005, the Target Fund’s principal investment strategy was changed from investing primarily in technology stocks to investing primarily in common stocks of small- and mid-capitalization companies, and the Target Fund’s name changed from First American Technology Fund to First American Small-Mid Cap Core Fund. Thereafter, effective May 4, 2009, the Target Fund’s principal investment strategy was changed from investing primarily in common stocks of small- and mid-capitalization companies to investing primarily in common stocks of mid-capitalization companies, and the Fund’s name changed from First American Small-Mid Cap Core Fund to First American Mid Cap Select Fund.
Target Fund – Class A Annual Total Return
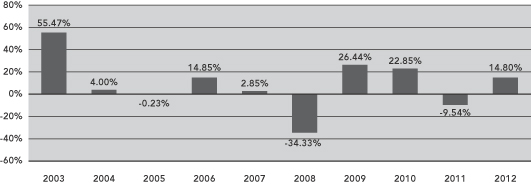
During the periods shown in the bar chart, the Target Fund’s Class A shares highest and lowest calendar quarter returns were 28.88% and -22.43%, respectively, for the quarters ended June 30, 2003 and December 31, 2008. The Target Fund’s Class A shares year-to-date return through March 31, 2013 was 10.74%.
11
Acquiring Fund – Class A Total Return
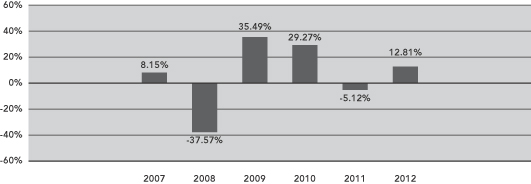
During the periods shown in the bar chart, the Acquiring Fund’s Class A shares highest and lowest calendar quarter returns were 17.70% and -25.85%, respectively, for the quarters ended September 30, 2009 and December 31, 2008. The Acquiring Fund’s Class A shares year-to-date return through March 31, 2013 was 11.43%.
| | | | | | | | | | | | |
| | | Average Annual Total Returns for the Periods Ended
December 31, 2012 | |
Target Fund | | 1 Year | | | 5 Years | | | 10 Years | |
Class A (return before taxes) | | | 8.16 | % | | | (0.04 | %) | | | 6.65 | % |
Class A (return after taxes on distributions) | | | 8.08 | % | | | (0.07 | %) | | | 6.64 | % |
Class A (return after taxes on distributions and sale of fund shares) | | | 5.41 | % | | | (0.04 | %) | | | 5.86 | % |
Class C (return before taxes) | | | 13.97 | % | | | 0.40 | % | | | 6.49 | % |
Class I (return before taxes) | | | 15.07 | % | | | 1.39 | % | | | 7.55 | % |
Russell Midcap® Index (reflects no deduction for fees, expenses or taxes) | | | 17.28 | % | | | 3.57 | % | | | 10.65 | % |
Lipper Mid-Cap Core Classification Average (reflects no deduction for taxes or certain expenses) | | | 15.59 | % | | | 2.23 | % | | | 8.89 | % |
| | | | | | | | | | | | |
| | | Average Annual Total Returns for the Periods Ended
December 31, 2012 | |
Acquiring Fund | | 1 Year | | | 5 Years | | | Since Inception
(May 31, 2006) | |
Class A (return before taxes) | | | 6.31 | % | | | 1.98 | % | | | 3.76 | % |
Class A (return after taxes on distributions) | | | 6.19 | % | | | 1.95 | % | | | 3.42 | % |
Class A (return after taxes on distributions and sale of fund shares) | | | 4.26 | % | | | 1.69 | % | | | 3.05 | % |
Class C (return before taxes) | | | 11.96 | % | | | 2.43 | % | | | 3.91 | % |
Class I (return before taxes) | | | 13.14 | % | | | 3.46 | % | | | 4.96 | % |
Russell Midcap® Index (reflects no deduction for fees, expenses or taxes) | | | 17.28 | % | | | 3.57 | % | | | 5.07 | % |
Lipper Mid-Cap Core Classification Average (reflects no deduction for taxes or certain expenses) | | | 15.59 | % | | | 2.23 | % | | | 4.07 | % |
Investment Adviser and Sub-Adviser
Both Funds are managed by Nuveen Fund Advisors, which offers advisory and investment management services to a broad range of mutual fund clients. Nuveen Fund Advisors has overall responsibility for management of the Funds, oversees the management of the Funds’ portfolios, manages the Funds’ business affairs and provides certain clerical, bookkeeping and other administrative services. Nuveen Fund Advisors is located at 333 West Wacker Drive, Chicago,
12
Illinois 60606. Nuveen Fund Advisors is a subsidiary of Nuveen Investments, LLC (“Nuveen Investments”). On November 13, 2007, Nuveen Investments was acquired by investors led by Madison Dearborn Partners, LLC, which is a private equity investment firm based in Chicago, Illinois. The Nuveen family of advisers has been providing advice to investment companies since 1976.
Nuveen Fund Advisors has selected its affiliate, Nuveen Asset Management, located at 333 West Wacker Drive, Chicago, Illinois 60606, to serve as a sub-adviser to the Target Fund. Nuveen Asset Management manages the investment of the Target Fund’s assets on a discretionary basis, subject to the supervision of Nuveen Fund Advisors. Anthony R. Burger and Scott M. Tonneson are the portfolio managers for the Target Fund.
Anthony R. Burger, CFA, has been a portfolio manager of the Target Fund since May 2005. Mr. Burger entered the financial services industry in 1994 and joined FAF Advisors, Inc. (“FAF”) in 2003. He joined Nuveen Asset Management as a Senior Vice President on January 1, 2011 in connection with the firm’s acquisition of a portion of FAF’s asset management business. Prior to joining Nuveen Asset Management, he was Director of Quantitative Equity Research at FAF.
Scott M. Tonneson, CFA, has been a portfolio manager of the Target Fund since February 2012. Mr. Tonneson entered the financial services industry in 1994 and joined FAF in 2007. Prior to his current portfolio management role, he was a senior equity research analyst responsible for building quantitative models to deliver relevant data to the equity portfolio teams. He joined Nuveen Asset Management as a Vice President and Senior Research Analyst on January 1, 2011 in connection with the firm’s acquisition of a portion of FAF’s asset management business.
Nuveen Fund Advisors has selected its affiliate, Symphony, located at 555 California Street, Suite 2975, San Francisco, California 94104, to serve as sub-adviser to the Acquiring Fund, and Symphony will continue to serve as sub-adviser to the Acquiring Fund following the Reorganization. Symphony manages the investment of the Acquiring Fund’s assets on a discretionary basis, subject to the supervision of Nuveen Fund Advisors. Gunther Stein, Ross Sakamoto and Joel Drescher are the portfolio managers for the Acquiring Fund.
Gunther Stein, Chief Investment Officer and Chief Executive Officer at Symphony, has managed the Acquiring Fund since June 2010. Mr. Stein is responsible for leading Symphony’s fixed-income and equity investments strategies and research and overseeing firm trading. Prior to joining Symphony in 1999, Mr. Stein was a high yield portfolio manager at Wells Fargo Bank, where he managed a high yield portfolio, was responsible for investing in public high yield bonds and bank loans and managed a team of credit analysts.
Ross Sakamoto, Co-Director of Equity at Symphony, has managed the Acquiring Fund since July 2010. He is responsible for co-heading Symphony’s equity investment strategies along with Joel Drescher and overseeing the equity trading and research activities. Mr. Sakamoto has over twenty years of industry experience and returned to Symphony after having spent six years with Symphony from 1996 to 2002 as an Equity Portfolio Manager of long-only and hedged strategies. Most recently, Mr. Sakamoto was a Director in the Quantitative Services group at Deutsche Bank Advisors focusing on business development. Prior to joining Deutsche Bank in 2008, he focused on program trading at Bear Stearns & Company from 2002 to 2007.
Joel Drescher, Co-Director of Equity at Symphony, has managed the Acquiring Fund since June 2012. He is responsible for co-heading Symphony’s equity investment strategies along with Ross
13
Sakamoto. Prior to joining Symphony in 2012, Mr. Drescher was a Sector Manager at Ascend Capital, where he was responsible for managing all aspects of the investment process for the firm’s consumer discretionary portfolio. Previously, he was the Chief Operations Officer and a Senior Research Analyst at Odyssey Value Advisors and earlier in his career a Financial Analyst in the investment banking group at ING Barings, LLC.
For a complete description of the advisory services provided to the Acquiring Fund, see the section of the Acquiring Fund’s Prospectus entitled “Who Manages the Funds” and the sections of the Acquiring Fund’s Statement of Additional Information entitled “Investment Adviser” and “Sub-Adviser.” Additional information about the portfolio manager compensation structure, other accounts managed by the portfolio managers and the portfolio managers’ ownership of securities in the respective Fund is provided in such Fund’s Statement of Additional Information.
Advisory and Other Fees
Pursuant to investment management agreements between Nuveen Fund Advisors and the Trust, on behalf of the Acquiring Fund, and Nuveen Fund Advisors and the Corporation, on behalf of the Target Fund, each Fund pays Nuveen Fund Advisors a fund-level fee, payable monthly, at the annual rates set forth below:
| | | | | | | | | | |
Target Fund - Management Fee | | | Acquiring Fund - Management Fee | |
Average Daily Net Assets | | Fee Rate | | | Average Daily Net Assets | | Fee Rate | |
For the first $125 million | | | 0.7000% | | | For the first $125 million | | | 0.5500% | |
For the next $125 million | | | 0.6875% | | | For the next $125 million | | | 0.5375% | |
For the next $250 million | | | 0.6750% | | | For the next $250 million | | | 0.5250% | |
For the next $500 million | | | 0.6625% | | | For the next $500 million | | | 0.5125% | |
For the next $1 billion | | | 0.6500% | | | For the next $1 billion | | | 0.5000% | |
For net assets over $2 billion | | | 0.6250% | | | For net assets over $2 billion | | | 0.4750% | |
In addition to the fund-level fee, each Fund pays a complex-level fee. The maximum complex level fee is 0.20% of the Fund’s average daily net assets, based upon complex-level “eligible assets” of $55 billion. Therefore, the maximum management fee rate for each Fund is the fund-level fee rate plus 0.20%. As complex-level eligible assets increase, the complex-level fee rate decreases pursuant to a breakpoint schedule. Each Fund’s individual complex-level fee rate is determined by taking the current overall complex-level fee rate, which is based on the aggregate amount of the “eligible assets” of all Nuveen funds, and making an upward adjustment to that rate (subject to the maximum 0.20% rate noted above) based upon the percentage of the Fund’s assets, if any, that are not “eligible assets.” For each Nuveen Fund that was formerly a First American Fund, including the Target Fund, the portion of the Fund’s assets classified as “eligible assets” excludes some or all of the Fund’s assets, based on the Fund’s size relative to its size at the time Nuveen Fund Advisors became the Fund’s investment adviser. As a result, the Target Fund’s complex-level fee rate is higher than the complex-level fee rate for the Acquiring Fund. As of March 31, 2013 the complex-level fee rate applicable to the Acquiring Fund was 0.1668%, and the complex-level fee rate applicable to the Target Fund was 0.2000%. Because the Target Fund has experienced net redemptions subsequent to the time Nuveen Fund Advisors became the Fund’s investment adviser, none of the Target Fund’s assets are eligible assets. The Acquiring Fund’s assets after the Reorganization attributable to the Target Fund will retain their status as ineligible assets for purposes of calculating the combined fund’s complex-level fee. As a result, the combined fund will have a higher complex-level fee rate than the Acquiring Fund. Information regarding the considerations by the Board with respect to the approval of the investment
14
management agreements for the Funds is currently available in the Target Fund’s and Acquiring Fund’s annual reports to shareholders for the fiscal year ended October 31, 2012 and September 30, 2012, respectively.
If the Reorganization is approved by shareholders and completed, Nuveen Fund Advisors has agreed to waive fees and/or reimburse expenses for the combined fund so that total annual fund operating expenses, excluding 12b-1 distribution and/or service fees, interest expenses, taxes, fees incurred in acquiring and disposing of portfolio securities and extraordinary expenses, after fee waivers and/or expense reimbursements do not exceed 1.15% (1.40% after September 30, 2014) of the average daily net assets of any share class. The expense limitation expiring September 30, 2014 may not be terminated or modified prior to that date without approval of the Board. The expense limitation of 1.40% in effect thereafter may be terminated or modified only with the approval of shareholders of the Acquiring Fund.
For the Acquiring Fund’s fiscal year ended September 30, 2012 and for the Target Fund’s fiscal year ended October 31, 2012, each Fund paid its investment adviser the following management fees (net of any fee waivers and expense reimbursements) as a percentage of average net assets:
| | | | |
| | | Management Fee Rate | |
Target Fund | | | 0.41 | % |
Acquiring Fund | | | — | * |
| * | For the most recent fiscal year, Nuveen Fund Advisors reimbursed expenses in excess of management fees. |
Each Fund has adopted a distribution and service plan (the “Plans”) pursuant to Rule 12b-1 under the 1940 Act. Under the Plans, for each Fund (a) Class A shares are subject to an annual service fee of 0.25% of the average daily net assets of Class A shares and (b) Class C shares are subject to (i) an annual distribution fee of 0.75% of the average daily net assets of Class C shares and (ii) an annual service fee of 0.25% of the average daily net assets of Class C shares. Class I shares are not subject to either distribution or service fees.
For a complete description of these arrangements for the Acquiring Fund, see the section of the Fund’s Prospectus entitled “What Share Classes We Offer” and the section of the Fund’s Statement of Additional Information entitled “Distributor.”
Board Members and Officers
The same individuals constitute the Board of each Fund, and the Funds have the same officers. The management of each Fund, including general oversight of the duties performed by Nuveen Fund Advisors under the Investment Management Agreement for each Fund, is the responsibility of the Board. There are currently ten members of the Board, one of whom is an “interested person” (as defined in the 1940 Act) and nine of whom are not interested persons (the “independent board members”). The names and business addresses of the board members and officers of the Acquiring Fund and their principal occupations and other affiliations during the past five years are set forth under “Management” in the Statement of Additional Information for the Acquiring Fund, which is incorporated herein by reference.
Distribution, Purchase, Redemption, Exchange of Shares and Dividends
The Target Fund offers three classes of shares: Class A, Class C and Class I shares. The Acquiring Fund offers four classes of shares: Class A, Class C, Class R3 and Class I shares. You may
15
purchase, redeem or exchange shares of the Funds on any business day, which is any day the New York Stock Exchange is open for business. You may purchase, redeem or exchange shares of each Fund through a financial advisor or other financial intermediary or directly from such Fund. No initial sales charge or contingent deferred sales charges will be imposed on shares of the Acquiring Fund received or shares of the Target Fund exchanged in connection with the Reorganization. Any purchases of any class of shares made after the Reorganization will be subject to the standard fee structure applicable to such class. Class R3 shares of the Acquiring Fund are available only through certain retirement plans and are not offered through this Proxy Statement/Prospectus. The Acquiring Fund’s initial and subsequent investment minimums generally are set forth in the following table, although the Fund may reduce or waive the minimums in some cases. The Target Fund’s investment minimums for Class A, Class C and Class I shares are identical to the Acquiring Fund’s investment minimums for Class A, Class C and Class I shares, respectively.
| | | | |
| | | Class A and Class C | | Class I |
| Eligibility and Minimum Initial Investment | | $3,000 for all accounts except: • $2,500 for Traditional/Roth IRA accounts. • $2,000 for Coverdell Education Savings Accounts. • $250 for accounts opened through fee-based programs. • No minimum for retirement plans. | | Available only through fee-based programs and certain retirement plans, and to other limited categories of investors as described in the prospectus. $100,000 for all accounts except: • $250 for clients of financial intermediaries and family offices that have accounts holding Class I shares with an aggregate value of at least $100,000 (or that are expected to reach this level). • No minimum for eligible retirement plans and certain other categories of eligible investors as described in the prospectus. |
| Minimum Additional Investment | | $ 100 | | No minimum. |
For a complete description of purchase, redemption and exchange options, see the section of the Acquiring Fund’s Prospectus entitled “How You Can Buy and Sell Shares,” and “General Information,” and the section of the Acquiring Fund’s Statement of Additional Information entitled “Purchase and Redemption of Fund Shares.”
Each Fund normally declares and pays dividends from net investment income, if any, annually. Each Fund declares and pays any taxable capital gains or other taxable distributions once a year at year end. If the Reorganization is approved by the shareholders of the Target Fund, the Target Fund intends to distribute to its shareholders, prior to the closing of the Reorganization, all its net investment income and net capital gains, if any, for the fiscal period ending on the Closing Date. Due to the Target Fund’s capital loss carryforwards, a net capital gain distribution is not expected. However, in light of unrealized capital gains currently in each Fund’s portfolio, Target Fund shareholders may be subject to higher capital gain distributions in the future than they would have been absent the Reorganization. See “The Proposed Reorganization—Material Federal Income Tax Consequences” below.
16
Tax Information
The Funds’ distributions are taxable and will generally be taxed as ordinary income or capital gains, unless you are investing through a tax-deferred account, such as an IRA or 401(k) plan.
Payments to Broker-Dealers and Other Financial Intermediaries
If you purchase shares of a Fund through a broker-dealer or other financial intermediary (such as a bank or financial advisor), the Fund, its distributor or its investment adviser may pay the intermediary for the sale of Fund shares and related services. These payments may create a conflict of interest by influencing the broker-dealer or other financial intermediary and your salesperson to recommend the Fund over another investment. Ask your financial advisor or visit your financial intermediary’s website for more information.
Further Information
Additional information concerning the Acquiring Fund and Target Fund is contained in this Proxy Statement/Prospectus and additional information regarding the Acquiring Fund is contained in the accompanying Acquiring Fund prospectus. The cover page of this Proxy Statement/Prospectus describes how you may obtain further information.
THE PROPOSED REORGANIZATION
The proposed Reorganization will be governed by the Agreement, a form of which is attached as Appendix I. The Agreement provides that the Target Fund will transfer all of its assets to the Acquiring Fund solely in exchange for the issuance of full and fractional shares of the Acquiring Fund and the assumption by the Acquiring Fund of all the liabilities of the Target Fund. The closing of the Reorganization will take place at the close of business on the Closing Date. The following discussion of the Agreement is qualified in its entirety by the full text of the Agreement.
The Target Fund will transfer all of its assets to the Acquiring Fund, and in exchange, the Acquiring Fund will assume all the liabilities of the Target Fund and deliver to the Target Fund a number of full and fractional shares of the Acquiring Fund having a net asset value equal to the value of the assets of the Target Fund less the liabilities of the Target Fund assumed by the Acquiring Fund. At the designated time on the Closing Date as set forth in the Agreement, the Target Fund will distribute in complete liquidation and termination of the Target Fund, pro rata to its shareholders of record, by class, all Acquiring Fund shares received by the Target Fund. This distribution will be accomplished by the transfer of the Acquiring Fund shares credited to the account of the Target Fund on the books of the Acquiring Fund to open accounts on the share records of the Acquiring Fund in the name of the Target Fund shareholders, and representing the respective pro rata number of Acquiring Fund shares due such shareholders. All issued and outstanding shares of the Target Fund will be canceled on the books of the Target Fund. As a result of the proposed Reorganization, each Target Fund Class A, Class C and Class I shareholder will receive a number of Acquiring Fund Class A, Class C and Class I shares, respectively, equal in value, as of the close of regular trading on the New York Stock Exchange on the Closing Date, to the value of the Target Fund Class A, Class C and Class I shares surrendered by such shareholder.
The consummation of the Reorganization is subject to the terms and conditions of, and the representations and warranties being true as set forth in, the Agreement. The Agreement may be
17
terminated by mutual agreement of the Funds. In addition, either Fund may at its option terminate the Agreement at or before the Closing due to (i) a breach by any other party of any representation, warranty, or agreement to be performed at or before the Closing, if not cured within 30 days, (ii) a condition precedent to the obligations of the terminating party that has not been met and it reasonably appears that it will not or cannot be met, or (iii) a determination by the Board that the consummation of the transactions contemplated by the Agreement is not in the best interests of a Fund.
The Target Fund will, within a reasonable period of time before the Closing Date, furnish the Acquiring Fund with a list of the Target Fund’s portfolio securities and other investments. The Acquiring Fund will, within a reasonable period of time before the Closing Date, furnish the Target Fund with a list of the securities, if any, on the Target Fund’s list referred to above that do not conform to the Acquiring Fund’s investment objective, policies, and restrictions. The Target Fund, if requested by the Acquiring Fund, will dispose of securities on the Acquiring Fund’s list before the Closing Date. In addition, if it is determined that the portfolios of the Funds, when aggregated, would contain investments exceeding certain percentage limitations imposed upon the Acquiring Fund with respect to such investments, the Target Fund, if requested by the Acquiring Fund, will dispose of a sufficient amount of such investments as may be necessary to avoid violating such limitations as of the Closing Date. The sale of such investments could result in taxable distributions to shareholders of the Target Fund prior to the Reorganization. Notwithstanding the foregoing, nothing in the Agreement will require the Target Fund to dispose of any investments or securities if, in the reasonable judgment of the Board or the Adviser, such disposition would adversely affect the tax-free nature of the Reorganization for federal income tax purposes or would otherwise not be in the best interests of the Target Fund. If the Reorganization had occurred as of March 31, 2013, the Target Fund would not have been required to dispose of any of its securities to comply with the Acquiring Fund’s investment policies and restrictions. Based on the Funds’ portfolios as of March 31, 2013, it is estimated that the Target Fund will sell approximately 85% of its portfolio prior to the Reorganization because of the different investment processes utilized by the sub-advisers. Any portfolio sales that occur prior to the Reorganization may result in additional portfolio transaction costs to the Target Fund, and may result in the Target Fund realizing capital gains prior to the Reorganization. However, due to the Target Fund’s capital loss carryforwards, it is not expected that any such portfolio sales would result in capital gain distributions to Target Fund shareholders. See “—Material Federal Income Tax Consequences” below.
Description of Securities to be Issued
Shares of Beneficial Interest. The Acquiring Fund has established and designated four classes of shares, par value $0.01 per share, including Class A, Class C, Class R3 and Class I shares. The Trust’s declaration of trust (the “Declaration of Trust”) permits the Board, in its sole discretion, and subject to compliance with the 1940 Act, to further subdivide the shares of the Acquiring Fund into one or more other classes of shares.
Voting Rights of Shareholders. Holders of shares of the Acquiring Fund are entitled to one vote per share on matters as to which they are entitled to vote, with fractional shares voting proportionally. The Acquiring Fund operates as a series of the Trust, an open-end management investment company registered with the SEC under the 1940 Act. The Trust currently has 18 series, including the Acquiring Fund, and the Board may, in its sole discretion, create additional series from time to time. Separate votes generally are taken by each series on matters affecting an individual series. In addition to the specific voting rights described above, shareholders of the Acquiring Fund are entitled, under current law, to vote with respect to certain other matters, including changes in fundamental investment policies and restrictions. Moreover, shareholders owning at least 10% of the outstanding shares entitled to vote may request that the Board call a shareholders’ meeting.
18
Continuation of Shareholder Accounts and Plans; Share Certificates
If the Reorganization is approved, the Acquiring Fund will establish an account for each Target Fund shareholder containing the appropriate number of shares of the appropriate class of the Acquiring Fund. The shareholder services and shareholder programs of the Funds are substantially the same. Shareholders of the Target Fund who are accumulating shares through systematic investing, or who are receiving payments under the systematic withdrawal plan, will retain the same rights and privileges after the Reorganization through plans maintained by the Acquiring Fund. No certificates for Acquiring Fund shares will be issued as part of the Reorganization.
Service Providers
U.S. Bank National Association and State Street Bank & Trust Company serve as the custodians for the assets of the Target Fund and the Acquiring Fund, respectively. Boston Financial Data Services, Inc. serves as the Funds’ transfer, shareholder services, and dividend paying agent. PricewaterhouseCoopers LLP serves as the independent auditors for each Fund.
Material Federal Income Tax Consequences
As a condition to each Fund’s obligation to consummate the Reorganization, each Fund will receive a tax opinion from Vedder Price P.C. (which opinion will be based on certain factual representations and certain customary assumptions and exclusions) substantially to the effect that, on the basis of the existing provisions of the Code, current administrative rules and court decisions, for federal income tax purposes:
| | 1. | The transfer by the Target Fund of all its assets to the Acquiring Fund solely in exchange for Acquiring Fund shares and the assumption by the Acquiring Fund of all the liabilities of the Target Fund, followed by the pro rata, by class, distribution of all the Acquiring Fund shares received by the Target Fund to the Target Fund shareholders in complete liquidation of the Target Fund as soon as practicable thereafter, will constitute “a reorganization” within the meaning of Section 368(a) of the Code, and the Acquiring Fund and the Target Fund will each be a “party to a reorganization” within the meaning of Section 368(b) of the Code with respect to the Reorganization. |
| | 2. | No gain or loss will be recognized by the Acquiring Fund upon the receipt of all the assets of the Target Fund solely in exchange for Acquiring Fund shares and the assumption by the Acquiring Fund of all the liabilities of the Target Fund. |
| | 3. | No gain or loss will be recognized by the Target Fund upon the transfer of all the Target Fund’s assets to the Acquiring Fund solely in exchange for Acquiring Fund shares and the assumption by the Acquiring Fund of all the liabilities of the Target Fund or upon the distribution (whether actual or constructive) of the Acquiring Fund shares so received to the Target Fund shareholders solely in exchange for such shareholders’ shares of the Target Fund in complete liquidation of the Target Fund. |
| | 4. | No gain or loss will be recognized by Target Fund shareholders upon the exchange, pursuant to the Reorganization, of all their shares of the Target Fund solely for Acquiring Fund shares. |
19
| | 5. | The aggregate basis of the Acquiring Fund shares received by each Target Fund shareholder pursuant to the Reorganization will be the same as the aggregate basis of the shares of the Target Fund exchanged therefor by such shareholder. |
| | 6. | The holding period of the Acquiring Fund shares received by each Target Fund shareholder in the Reorganization will include the period during which the shares of the Target Fund exchanged therefor were held by such shareholder, provided such Target Fund shares are held as capital assets at the effective time of the Reorganization. |
| | 7. | The basis of the assets of the Target Fund received by the Acquiring Fund will be the same as the basis of such assets in the hands of the Target Fund immediately before the effective time of the Reorganization. |
| | 8. | The holding period of the assets of the Target Fund received by the Acquiring Fund will include the period during which such assets were held by the Target Fund. |
No opinion will be expressed as to (1) the effect of the Reorganization on the Target Fund, the Acquiring Fund or any Target Fund shareholder with respect to any asset (including without limitation any stock held in a passive foreign investment company as defined in Section 1297(a) of the Code) as to which any unrealized gain or loss is required to be recognized under federal income tax principles (i) at the end of a taxable year (or on the termination thereof) or (ii) upon the transfer of such asset regardless of whether such transfer would otherwise be a non-taxable transaction under the Code or (2) any other federal tax issues (except those set forth above) and all state, local or foreign tax issues of any kind.
Prior to the closing of the Reorganization, the Target Fund will declare a distribution to its shareholders, which together with all previous distributions, will have the effect of distributing to shareholders at least all its net investment income and realized net capital gains (after reduction by any available capital loss carryforwards), if any, through the Closing Date of the Reorganization. This distribution will be taxable to shareholders who are subject to federal income tax and may include net capital gains resulting from the sale of portfolio assets discussed below. Additional distributions may be made if necessary. However, due to the Target Fund’s capital loss carryforwards, a net capital gain distribution is not expected to be made. All dividends and distributions will be reinvested in additional shares of the Target Fund unless a shareholder has made an election to receive dividends and distributions in cash. Dividends and distributions are treated the same for federal income tax purposes whether received in cash or additional shares.
To the extent that a portion of the Target Fund’s portfolio assets are sold prior to the Reorganization, the federal income tax effect of such sales would depend on the holding periods of such assets and the difference between the price at which such portfolio assets were sold and the Target Fund’s basis in such assets. Any net capital gains (net long-term capital gain in excess of any net short-term capital loss) recognized in these sales, after the application of any available capital loss carryforwards (capital losses from prior taxable years that may be used to offset future capital gains), would be distributed to the Target Fund’s shareholders as capital gain dividends. Any net short-term capital gains (in excess of any net long-term capital loss and after application of any available capital loss carryforwards) would be distributed as ordinary dividends. All such distributions would be made during or with respect to the Target Fund’s taxable year in which the sale occurs and would be taxable to shareholders who are subject to federal income tax. However, due to the Target Fund’s capital loss carryforwards, it is not expected that any such portfolio sales would result in capital gain distributions to Target Fund shareholders.
20
After the Reorganization, the Acquiring Fund’s ability to use the Target Fund’s or the Acquiring Fund’s pre-Reorganization capital losses, if any, may be limited under certain federal income tax rules applicable to reorganizations of this type. Therefore, in certain circumstances, shareholders may pay federal income tax sooner, or may pay more federal income taxes, than they would have had the Reorganization not occurred. The effect of these potential limitations will depend on a number of factors, including the amount of the losses, the amount of gains to be offset, the exact timing of the Reorganization and the amount of unrealized capital gains in the Funds at the time of the Reorganization. However, even if the Reorganization did not occur, it is likely that the Target Fund would be unable to utilize a significant portion of its carryforwards.
At March 31, 2013, the Acquiring Fund had no unused capital loss carryforwards, while the Target Fund had unused capital loss carryforwards available for federal income tax purposes to be applied against future capital gains, if any. If not applied, the capital loss carryforwards will expire as follows:
| | | | |
| | | Target Fund | |
Expiration Date: | | | | |
October 31, 2016 | | $ | 3,329,146 | |
October 31, 2017 | | | 15,708,192 | |
| | | | |
Total | | $ | 19,037,338 | |
| | | | |
For net capital losses arising in taxable years beginning after December 22, 2010 (“post-enactment losses”), a Fund will generally be able to carryforward such capital losses indefinitely. A Fund’s net capital losses from taxable years beginning on or prior to December 22, 2010, however, will remain subject to their current expiration dates and can be used only after the post-enactment losses.
In addition, shareholders of the Target Fund will receive a proportionate share of any taxable income and gains realized by the Acquiring Fund and not distributed to its shareholders prior to the Reorganization when such income and gains are eventually distributed by the Acquiring Fund. As a result, shareholders of the Target Fund may receive a greater amount of taxable distributions than they would have had the Reorganization not occurred.
This description of the federal income tax consequences of the Reorganization is made without regard to the particular facts and circumstances of any shareholder. Shareholders are urged to consult their own tax advisors as to the specific consequences to them of the Reorganization, including the applicability and effect of state, local, non-U.S. and other tax laws.
Reorganization Expenses
The expenses associated with the Reorganization include, but are not limited to, legal and auditing fees, the costs of printing and distributing this Proxy Statement/Prospectus, and the solicitation expenses discussed below. Each Fund will be allocated the costs of the Reorganization in an amount up to its projected cost savings, if any, during the first year following the Reorganization. Nuveen Fund Advisors estimates that the costs of the Reorganization will be approximately $159,000 and that the cost savings during the first year following the Reorganization will be approximately $2,600 for the Target Fund. The Acquiring Fund is not expected to realize any cost savings. As a result, the Target Fund is expected to be charged approximately $2,600 of the costs of the Reorganization, and the Acquiring Fund will not be charged any of the Reorganization costs. To the
21
extent that such Reorganization expenses exceed the projected cost savings for the Target Fund during the first year following the Reorganization, Nuveen will pay such expenses. In addition, to the extent that the payment of Reorganization expenses would cause the Target Fund’s expenses to exceed the Fund’s current expense cap, Nuveen will reimburse such expenses to the extent necessary to operate within the cap. Based on current expense levels, it is anticipated that Nuveen will absorb all expenses charged to the Target Fund. If the Reorganization is not approved or completed, Nuveen will pay all such Reorganization expenses.
The Target Fund has engaged Computershare Fund Services to assist in the solicitation of proxies at an estimated cost of $12,000, which is included in the expense estimate above.
Comparison of Massachusetts Business Trusts and Maryland Corporations
The following description is based on relevant provisions of applicable Massachusetts law and the Maryland General Corporation Law (the “MGCL”) and each Fund’s operative documents. This summary does not purport to be complete and we refer you to applicable Massachusetts law, the MGCL and each Fund’s operative documents.
In General
The Acquiring Fund is a series of a Massachusetts business trust. A fund organized as a series of a Massachusetts business trust is governed by the trust’s declaration of trust or similar instrument. Massachusetts law allows the trustees of a business trust to set the terms of a fund’s governance in its declaration. All power and authority to manage the fund and its affairs generally reside with the trustees, and shareholder voting and other rights are limited to those provided to the shareholders in the declaration. Because Massachusetts law governing business trusts provides more flexibility compared to typical state corporate statutes, the Massachusetts business trust has become a common form of organization for mutual funds. However, some consider it less desirable than other entities because it relies on the terms of the applicable declaration and judicial interpretations rather than statutory provisions for substantive issues, such as the personal liability of shareholders and trustees, and does not provide the level of certitude that corporate laws like those of Maryland, or newer statutory trust laws, such as those of Delaware, provide.
The Target Fund is a series of a Maryland corporation. A fund organized as a series of a Maryland corporation is governed both by the MGCL and the Maryland corporation’s charter and bylaws. For a Maryland corporation, unlike a Massachusetts trust, the MGCL prescribes many aspects of corporate governance.
Shareholders of a Maryland corporation generally are shielded from personal liability for the corporation’s debts or obligations. Shareholders of a Massachusetts business trust, on the other hand, are not afforded the statutory limitation of personal liability generally afforded to shareholders of a corporation from the trust’s liabilities. Instead, the declaration of trust of a fund organized as a Massachusetts business trust typically provides that a shareholder will not be personally liable, and further provides for indemnification to the extent that a shareholder is found personally liable, for the fund’s acts or obligations. The Trust’s declaration of trust (the “Declaration of Trust”) contains such provisions.
Similarly, the trustees of a Massachusetts business trust are not afforded statutory protection from personal liability for the obligations of the trust. The directors of a Maryland corporation, on the other
22
hand, generally are shielded from personal liability for the corporation’s acts or obligations by the MGCL. Courts in Massachusetts have, however, recognized limitations of a trustee’s personal liability in contract actions for the obligations of a trust contained in the trust’s declaration, and declarations may also provide that trustees may be indemnified out of the assets of the trust to the extent held personally liable. The Declaration of Trust contains such provisions.
Massachusetts Business Trusts
The Acquiring Fund is governed by the Declaration of Trust and the Trust’s amended and restated by-laws (the “By-Laws”). Under the Declaration of Trust, any determination as to what is in the interests of the Trust made by the trustees in good faith is conclusive, and in construing the provisions of the Declaration of Trust, there is a presumption in favor of a grant of power to the trustees. Further, the Declaration of Trust provides that certain determinations made in good faith by the trustees are binding upon the Trust and all shareholders, and shares are issued and sold on the condition and understanding, evidenced by the purchase of shares, that any and all such determinations shall be so binding. The following is a summary of some of the key provisions of the Acquiring Fund’s governing documents.
Shareholder Voting
The 1940 Act requires a vote of shareholders on matters that Congress has determined might have a material effect on shareholders and their investments. For example, shareholder consent is required under the 1940 Act to approve new investment advisory agreements in many cases, an increase in an advisory fee or a 12b-1 fee, changes to fundamental policies, the election of directors or trustees in certain circumstances, and the merger or reorganization of a fund in certain circumstances, particularly where the merger or consolidation involves an affiliated party. The Declaration of Trust requires a shareholder vote on matters in addition to those required under the 1940 Act, such as certain mergers, consolidations and sales of assets, derivative actions (to the same extent as shareholders of a Massachusetts business corporation) and certain amendments to the Declaration of Trust. Shareholders have no power to vote on any matter except as required by applicable law, the governing documents, or as otherwise determined by the trustees.
There are ordinarily no annual meetings of shareholders, but special meetings may be called by the Trustees or certain officers and by the written request of shareholders owning at least 10% of the outstanding shares entitled to vote. The By-Laws provide that the holders of a majority of the voting power of the shares of beneficial interest of the Acquiring Fund entitled to vote at a meeting shall constitute a quorum for the transaction of business. Except as may otherwise be required by the 1940 Act, the Declaration of Trust or the By-Laws, the Declaration of Trust provides that the affirmative vote of the holders of a majority, except in the case of the election of trustees which shall only require a plurality, of the shares present in person or by proxy and entitled to vote at a meeting of shareholders at which a quorum is present is required to approve a matter.
Election and Removal of Trustees
The Declaration of Trust provides that the trustees determine the size of the Board, subject to a minimum of two and a maximum of twelve, may set and alter the terms of office of the trustees, and may make their terms of unlimited duration. It also provides that vacancies on the Board may be filled by the remaining trustees, except when election by the shareholders is required under the 1940 Act.
23
Therefore, there will normally be no meetings of shareholders for the purpose of electing trustees unless and until such time as required by law. Trustees are then elected by a plurality vote of the shareholders. A trustee may only be removed for cause by action of at least two-thirds of the remaining trustees or by action of at least two-thirds of the outstanding shares.
Issuance of Shares
Under the Declaration of Trust, the trustees are permitted to issue an unlimited number of shares for such consideration and on such terms as the trustees may determine. Shares are subject to such other preferences, conversion, exchange or similar rights, as the trustees may determine.
Series and Classes
The Declaration of Trust gives broad authority to the trustees to establish series and classes in addition to those currently established and to determine the rights and preferences, conversion rights, voting powers, restrictions, limitations, qualifications or terms or conditions of redemptions of the shares of the series and classes. The trustees are also authorized to merge or terminate a series or a class without a vote of shareholders under certain circumstances.
Amendments to Declaration of Trust
Amendments to the Declaration of Trust generally require the consent of shareholders owning more than 50% of shares entitled to vote, voting in the aggregate and not by class except to the extent that applicable law may require voting by class, although certain amendments may be made by the trustees without a shareholder vote.
Shareholder, Trustee and Officer Liability
The Declaration of Trust provides that shareholders have no personal liability for any debt or obligation of the Trust and requires the Trust to indemnify a shareholder from any loss or expense arising solely by reason of his or her being or having been a shareholder and not because of his or her acts or omissions or for some other reasons. In addition, the Trust will assume the defense of any claim against a shareholder for personal liability at the request of the shareholder. Similarly, the Declaration of Trust provides that any person who is a trustee, officer or employee of the Trust is not personally liable to any person in connection with the affairs of the Trust, other than to the Trust and its shareholders arising from bad faith, willful misfeasance, gross negligence or reckless disregard for his or her duty. The Declaration of Trust further provides for indemnification of such persons and advancement of the expenses of defending any such actions for which indemnification might be sought. The Declaration of Trust also provides that the trustees may rely in good faith on expert advice.
Preemptive Rights
Pursuant to the Declaration of Trust, shareholders of the Acquiring Fund have no preemptive rights or other rights to subscribe to additional shares.
Derivative Actions
Massachusetts has what is commonly referred to as a “universal demand statute,” which requires that a shareholder make a written demand upon the board, requesting the board members to bring an
24
action, and requires the expiration of a waiting period before the shareholder is entitled to bring or maintain a court action or claim on behalf of the entity.
Maryland Corporations
A Maryland corporation is governed by the MGCL, its charter and bylaws. Some of the key provisions of the MGCL are summarized below.
Shareholder Voting
Under the MGCL, a Maryland corporation generally cannot dissolve, amend its charter, or engage in a statutory share exchange, merger or consolidation unless approved by a vote of shareholders. Depending on the circumstances and the charter of the corporation, there may be various exceptions to these votes. Shareholders of Maryland corporations are generally entitled to one vote per share and fractional votes for fractional shares held. The Corporation’s charter (the “Charter”) and bylaws contain such provisions.
Election and Removal of Directors
Shareholders of a Maryland corporation generally are entitled to elect and remove directors. Shareholders of the Corporation may elect directors at any annual meeting or a special meeting in lieu thereof. Provided the charter or bylaws so provide, the MGCL does not require a corporation registered as an open-end investment company to hold an annual meeting in any year in which the election of directors is not required by the 1940 Act. The Charter contains such a provision. Under the bylaws of the Corporation, a special meeting of shareholders shall be called upon the written request of the holders of shares entitled to cast not less than 10% of all votes entitled to vote at such meeting. The bylaws of the Corporation provide that shareholders may, at any meeting of shareholders duly called and at which a quorum is present, by the affirmative vote of the holders of a majority of the votes entitled to be cast thereon, remove any director or directors from office and may elect a successor or successors to fill any resulting vacancies.
Amendments to the Charter
Under the MGCL, shareholders of corporations generally are entitled to vote on amendments to the charter. However, the board of directors of a Maryland corporation is authorized, without a vote of the shareholders, to amend the charter to change the name of the corporation, to change the name or other designation of any class or series of stock and to change the par value of any class or series of stock. Under the MGCL, generally a change in the name or other designation of a class or series of stock, however, may not change the preferences, conversion or other rights, voting powers, restrictions, limitations as to dividends, or terms or conditions of redemption. The board of directors of a Maryland corporation may, however, if permitted by the charter, without a vote of the shareholders, classify or reclassify any unissued stock by setting or changing the preferences, conversion or other rights, voting powers, restrictions, limitations as to dividends, qualifications, or terms or conditions of redemption. The Charter permits the Board to do so. The MGCL permits the board of directors of an open-end investment company to supplement the charter without a vote of the shareholders to increase the aggregate number of authorized shares or the number of shares in any class or series, unless prohibited by the charter. The Charter does not prohibit the Board from doing so.
25
Issuance of Shares
The board of directors of a Maryland corporation has the power to authorize the issuance of stock and, prior to issuance of shares of each class or series, the board of directors of a Maryland corporation is required by Maryland law to set the terms, preferences, conversion or other rights, voting powers, restrictions, limitations as to dividends or other distributions, qualifications and terms or conditions of redemption for each class or series.
Shareholder, Director and Officer Liability
Under Maryland law, shareholders generally are not personally liable for debts or obligations of a corporation. Maryland law provides that a director who has met his or her statutory standard of conduct has no liability for reason of being or having been a director. Maryland law provides that a corporation may indemnify and advance expenses to its directors for acts and omissions in their official capacity, subject to certain exceptions, and the Charter requires the Corporation to do so. The indemnification provisions and the limitation on liability are both subject to any limitations of the 1940 Act, which generally provides that no director or officer shall be protected from liability to the corporation or its shareholders by reason of willful misfeasance, bad faith, gross negligence or reckless disregard of the duties involved in the conduct of his or her office. The provisions governing the advance of expenses are subject to applicable requirements of the 1940 Act or rules thereunder.
Preemptive Rights
Pursuant to the Charter, shareholders of the Target Fund have no preemptive rights.
Derivative Actions
Under Maryland law, applicable case law at the time of a particular derivative action will establish any requirements or limitations with respect to shareholder derivative actions.
The foregoing is only a summary of certain rights of shareholders under the governing documents of the Trust and the Corporation and under applicable state law, and is not a complete description of provisions contained in those sources. Shareholders should refer to the provisions of those documents and state law directly for a more thorough description.
Capitalization
The following table sets forth the capitalization of the Target Fund and the Acquiring Fund as of March 31, 2013, and the pro forma capitalization of the combined fund as if the Reorganization had occurred on that date. These numbers may differ at the Closing Date.
Capitalization Table as of March 31, 2013 (Unaudited)
| | | | | | | | | | | | | | | | |
| | | Target Fund | | | Acquiring Fund | | | Pro Forma
Adjustments | | | Pro Forma
Combined Fund | |
Net Assets | | | | | | | | | | | | | | | | |
Class A | | $ | 11,236,178 | | | $ | 2,589,202 | | | $ | (32,795 | )(a) | | $ | 13,792,585 | (a) |
Class C | | | 1,821,185 | | | | 714,245 | | | | (5,316 | )(a) | | | 2,530,114 | (a) |
Class R3 | | | N/A | | | | 389,193 | | | | — | | | | 389,193 | (a) |
Class I | | | 13,912,388 | | | | 1,520,412 | | | | (40,606 | )(a) | | | 15,392,194 | (a) |
| | | | | | | | | | | | | | | | |
Total | | $ | 26,969,751 | | | $ | 5,213,052 | | | $ | (78,717 | ) | | $ | 32,104,086 | |
| | | | | | | | | | | | | | | | |
26
| | | | | | | | | | | | | | | | |
| | | Target Fund | | | Acquiring Fund | | | Pro Forma
Adjustments | | | Pro Forma
Combined Fund | |
Shares Outstanding | | | | | | | | | | | | | | | | |
Class A | | | 956,332 | | | | 92,577 | | | | (555,755 | )(b) | | | 493,154 | (b) |
Class C | | | 169,739 | | | | 26,657 | | | | (101,967 | )(b) | | | 94,429 | (b) |
Class R3 | | | N/A | | | | 13,913 | | | | — | | | | 13,913 | (b) |
Class I | | | 1,131,138 | | | | 53,739 | | | | (640,840 | )(b) | | | 544,037 | (b) |
| | | | | | | | | | | | | | | | |
Total | | | 2,257,209 | | | | 186,886 | | | | 1,298,562 | | | | 1,145,533 | |
| | | | | | | | | | | | | | | | |
Net Asset Value Per Share | | | | | | | | | | | | | | | | |
Class A | | | $11.75 | | | | $27.97 | | | | | | | | $27.97 | |
Class C | | | $10.73 | | | | $26.79 | | | | | | | | $26.79 | |
Class R3 | | | N/A | | | | $27.97 | | | | | | | | $27.97 | |
Class I | | | $12.30 | | | | $28.29 | | | | | | | | $28.29 | |
Shares Authorized | | | | | | | | | | | | | | | | |
Class A | | | 2 billion | | | | Unlimited | | | | | | | | Unlimited | |
Class C | | | 2 billion | | | | Unlimited | | | | | | | | Unlimited | |
Class R3 | | | N/A | | | | Unlimited | | | | | | | | Unlimited | |
Class I | | | 2 billion | | | | Unlimited | | | | | | | | Unlimited | |
| (a) | The costs associated with the proposed Reorganization are estimated to be approximately $159,000, of which $2,600 will be charged to the Target Fund based on the expected cost savings during the first year following the Reorganization. The Acquiring Fund is not expected to realize cost savings from the Reorganization, and therefore no costs will be charged to the Acquiring Fund. All remaining Reorganization costs will be paid by Nuveen. Based on current expense levels, it is anticipated that the Target Fund’s expenses will exceed its expense cap and Nuveen will reimburse all of the Reorganization expenses charged to the Target Fund, and, therefore, the figures do not reflect the $2,600 to be charged to the Target Fund or the other costs of the Reorganization described above. Furthermore, figures assume the Target Fund distributes its undistributed net investment income of $78,717 to its shareholders prior to the Reorganization. |
| (b) | Figures reflect the issuance by the Acquiring Fund of approximately 400,577 Class A shares, 67,772 Class C Shares, and 490,298 Class I shares to shareholders of the corresponding share class of the Target Fund in connection with the proposed Reorganization. |
Legal Matters
Certain legal matters concerning the issuance of Class A, Class C and Class I shares of the Acquiring Fund, and the federal income tax consequences of the Reorganization will be passed on by Vedder Price P.C., 222 North LaSalle Street, Chicago, Illinois 60601.
Information Filed with the Securities and Exchange Commission
This Proxy Statement/Prospectus and the related Statement of Additional Information do not contain all the information set forth in the registration statements and the exhibits relating thereto and the annual and semi-annual reports which the Funds have filed with the SEC pursuant to the requirements of the Securities Act of 1933, as amended, and the 1940 Act, to which reference is hereby made. The SEC file number for the registration statement containing the current Prospectus and Statement of Additional Information for the Target Fund is Registration No. 811-05309, and the SEC file number for the registration statement containing the current Prospectus and Statement of Additional Information for the Acquiring Fund is Registration No. 811-08333. Such Prospectuses and Statements of Additional Information relating to the Funds are incorporated herein by reference.
27
THE BOARD’S APPROVAL OF THE REORGANIZATION
Based on the considerations described below, the Board of each Fund has determined that the Reorganization would be in the best interests of each Fund and that the interests of each Fund’s existing shareholders would not be diluted as a result of the Reorganization. The Board has approved the Reorganization and recommends that the Target Fund shareholders vote in favor of the Reorganization.
In preparation for the meeting of the Board held on April 17-18, 2013 (the “Meeting”) at which the Reorganization was considered, the Adviser provided the Board with information for the Meeting or at prior meetings regarding the proposed Reorganization, including the rationale therefor and alternatives considered to the Reorganization of the Funds. Prior to approving the Reorganization, the independent board members reviewed the foregoing information with their independent legal counsel and with management, reviewed with independent legal counsel applicable law and their duties in considering such matters, and met with independent legal counsel in a private session without management present. In approving the Reorganization, the Board considered a number of principal factors in reaching its determination, including the following:
| | • | | the similarities and differences in the Funds’ investment objectives and principal investment strategies; |
| | • | | the Funds’ relative risks; |
| | • | | the Funds’ relative sizes; |
| | • | | the relative investment performance of the Funds; |
| | • | | the relative fees and expense ratios of the Funds, including caps on the Funds’ expenses agreed to by the Adviser; |
| | • | | the anticipated federal income tax-free nature of the Reorganization; |
| | • | | the expected costs of the Reorganization and the extent to which the Funds would bear any such costs; |
| | • | | the terms of the Reorganization and whether the Reorganization would dilute the interests of shareholders of the Funds; |
| | • | | the effect of the Reorganization on shareholder services and shareholder rights; |
| | • | | alternatives to the Reorganization; and |
| | • | | any potential benefits of the Reorganization to the Adviser and its affiliates as a result of the Reorganization. |
Investment Similarities and Differences
Based on the information presented, the Board noted that the Funds have similar investment objectives. In this regard, the investment objective of the Acquiring Fund is to seek long-term capital
28
appreciation and the investment objective of the Target Fund is long-term growth of capital. The Board further noted that the principal investment strategies of the Target Fund and Acquiring Fund appear similar, although there are certain differences. Under normal market conditions, the Acquiring Fund invests at least 80% of the sum of its net assets and the amount of any borrowings for investment purposes in equity securities of companies with market capitalizations at the time of investment comparable to companies in the Russell MidCap® Index. Under normal market conditions, the Target Fund invests at least 80% of its net assets, plus the amount of any borrowings for investment purposes, in common stocks of mid-capitalization companies, defined as companies that have market capitalizations at the time of purchase within the market capitalization range of the companies in the Russell MidCap® Index immediately after its most recent reconstitution prior to such purchase. In terms of similarities, the Board recognized that both Funds focus on investing in securities of mid-capitalization companies, and particularly in companies within the market capitalization range of the Russell MidCap® Index. In terms of differences, however, the Board noted that the Target Fund has certain principal investment strategies that the Acquiring Fund does not. These principal investment strategies permit the Target Fund to (i) invest up to 15% of its total assets in non-dollar denominated equity securities of non-U.S. issuers and (ii) invest up to 25% of its assets, collectively, in non-dollar denominated equity securities of non-U.S. issuers and in dollar-denominated equity securities of non-U.S. issuers that are either listed on a U.S. stock exchange or represented by depositary receipts that may or may not be sponsored by a domestic bank. The Board observed that the Target Fund may also invest up to 15% of its total assets in equity securities of emerging market issuers. The Acquiring Fund, in contrast, does not have principal investment strategies with respect to investments in equity securities of non-U.S. or emerging market issuers. Further, the Board noted that the Target Fund may utilize options, futures contracts, options on futures contracts and forward foreign currency exchange contracts as a principal investment strategy while the Acquiring Fund does not have a similar principal investment strategy (although the Acquiring Fund may utilize a variety of financial instruments as a non-principal investment strategy). Moreover, the Board recognized that the Funds have different sub-advisers that utilize different investment processes for the respective Funds.
Relative Risks
The Board noted that because the Funds’ investment strategies are similar, the principal risks of investing in the Funds are also similar, although there are certain differences. An investment in the Acquiring Fund is subject to equity security risk and mid-cap stock risk. An investment in the Target Fund is also subject to such risks, as well as derivatives risk and non-U.S./emerging markets risk.
Relative Sizes
The Board noted that the Target Fund was larger than the Acquiring Fund and that combining the Funds should provide additional benefits to shareholders of the Acquiring Fund as fixed operating expenses of the Acquiring Fund following the Reorganization will be spread over a larger asset base. See “Fees and Expense Ratios” below.
Investment Performance and Portfolio Managers
The Board considered the investment performance of the Funds over various periods and noted that they were managed by different sub-advisers and portfolio managers, and that, following the Reorganization, the sub-adviser and portfolio managers of the Acquiring Fund would manage the combined fund. The Board observed, among other things, that with respect to Class A shares, the
29
Acquiring Fund has outperformed the Target Fund over the three- and five-year periods and for three of the past four calendar years as of February 28, 2013.
Fees and Expense Ratios
The Board considered the fees and expense ratios of each class of the Funds (including estimated expenses of the Acquiring Fund following the Reorganization) and the impact of expense caps, if any. The Board noted that the management fees of the Acquiring Fund were lower than those of the Target Fund and that net total operating expenses for the combined fund were expected to be slightly lower than the net total operating expenses of the Target Fund after expense reimbursement. For the Acquiring Fund, gross expenses were expected to decrease, and the independent board members noted that the Adviser had agreed to extend the current expense cap for the Acquiring Fund until September 30, 2014 if the Reorganization is approved by shareholders of the Target Fund and completed.
The Board recognized that the management fees for the Funds are comprised of fund-level and complex-level fees. Pursuant to the complex-wide fee arrangement, the fees of funds in the Nuveen complex are reduced as assets in the fund complex reach certain levels. The complex-wide fee arrangement seeks to provide the benefits of economies of scale to fund shareholders when total fund complex assets increase, even if assets of a particular fund are unchanged or decrease. The Board observed that complex-level fees were lower for the Acquiring Fund than for the Target Fund. When the Target Fund became part of the Nuveen complex, a portion of such Fund’s assets were deemed ineligible for purposes of calculating the effective complex-wide fee rate. Because the Target Fund has experienced net redemptions since it became part of the Nuveen complex, all of such Fund’s assets are currently ineligible assets. Accordingly, the combined fund will participate in complex-wide fee savings to a lesser extent than the Acquiring Fund.
Tax Consequences of the Reorganization
The Board considered the tax implications of the Reorganization. The Board noted that the Reorganization will be structured with the intention that it qualify as a tax-free reorganization for federal income tax purposes. The Board further recognized that with fund reorganizations, applicable tax laws could impose limits on the amount of capital loss carryforwards that an acquiring fund may use in any one year. In this regard, because the Target Fund had significant capital loss carryforwards, the Board recognized that the limits may preclude the Acquiring Fund from fully utilizing the Target Fund’s capital loss carryforwards (although it was likely that the Target Fund would be unable to use a significant portion of its carryforwards even if the Reorganization did not occur). Moreover, the Board recognized that the Target Fund’s capital loss carryforwards may be a potential benefit to Acquiring Fund shareholders. The Board further noted that there may be some gains or losses resulting from portfolio realignment related to the Reorganization. The Board also considered that Target Fund and Acquiring Fund shareholders were subject to similar exposure to unrealized portfolio net appreciation and that, depending on market conditions and portfolio turnover, Target Fund shareholders may be subject to higher capital gains distributions in the future than they would have been absent the Reorganization as a result of the annual limit on the use of capital loss carryforwards.
30
Costs of the Reorganization
The Board considered the projected cost savings (if any) of each Fund during the first year following the Reorganization. The Board noted that each Fund will be allocated the costs of the Reorganization in an amount up to its projected cost savings, if any, during the first year following the Reorganization, subject to expense cap limitations. In this regard, the Board recognized that no material cost savings were anticipated for the shareholders of the Acquiring Fund. If the Reorganization is not ultimately completed, Nuveen will bear all the expenses incurred in connection with the proposed Reorganization.
Dilution
The terms of the Reorganization are intended to avoid dilution of the interests of the shareholders of the Funds. In this regard, shareholders of each class of shares of the Target Fund will receive the same class of shares in the Acquiring Fund, equal in total value to the total value of the shares of the Target Fund held.
Effect on Shareholder Services and Shareholder Rights
The Board noted that shareholders of the Target Fund will receive the same class of shares of the Acquiring Fund, which are subject to the same distribution and service fees. The Board also considered that the Target Fund is a series of a Maryland corporation, whereas the Acquiring Fund is a series of a Massachusetts business trust. In this regard, the rights of Target Fund shareholders differ in certain respects from those of Acquiring Fund shareholders. Notwithstanding the foregoing, the principal attributes of a share in each Fund are comparable as a share in each Fund is entitled to one vote per share held and fractional votes for fractional shares held.
Alternatives to the Reorganization
The Board recognized that the Target Fund, which had been in net redemptions in recent years, was expected to continue to see further redemptions and that the development of future distribution opportunities for it as a separate fund were unlikely. The Board could have decided to liquidate the Target Fund; however, the Board did not believe this option was in the best interests of shareholders of the Target Fund as liquidation is a taxable event which could result in the realization of taxable capital gains to shareholders depending on the shareholder’s cost basis and the loss of any potential benefit that the Fund’s capital loss carryforwards might have provided.
Potential Benefits to Nuveen Fund Advisors and Affiliates
The Board recognized that the Reorganization may result in some benefits and economies for the Adviser and its affiliates. These may include, for example, a reduction in the level of operational expenses incurred for administrative, compliance and portfolio management services as a result of the elimination of the Target Fund as a separate fund in the Nuveen complex.
Conclusion
The Board, including the independent board members, approved the Reorganization, concluding that the Reorganization is in the best interests of both Funds and that the interests of existing shareholders of the Funds will not be diluted as a result of the Reorganization. The Board did not identify any single factor discussed above as all-important or controlling, but considered all such factors together in approving the Reorganization.
31
OTHER INFORMATION
Shareholders of the Funds
The following tables set forth the percentage of ownership of each person who, as of , 2013, the record date with respect to the Special Meeting, owns of record, or is known by the Funds to own of record or beneficially, 5% or more of any class of shares of either Fund. The tables also set forth the estimated percentage of shares of the combined fund that would have been owned by such parties if the Reorganization had occurred on , 2013. These amounts may differ on the Closing Date. Shareholders who have the power to vote a larger percentage of shares (at least 25% of the voting shares) of a Fund can control the Fund and determine the outcome of a shareholder meeting.
| | | | | | |
Target Fund |
Class | | Name and Address of Owner | | Percentage of
Ownership | | Estimated Pro
Forma Percentage of
Ownership of the
Combined Fund
After the
Reorganization |
Class_Shares | | | | ___.__% | | ___.__% |
| | | | | | |
| | | | | | |
Acquiring Fund |
Class | | Name and Address of Owner | | Percentage of
Ownership | | Estimated Pro
Forma Percentage of
Ownership of the
Combined Fund
After the
Reorganization |
Class_Shares | | | | ___.__% | | ___.__% |
| | | | | | |
[At the close of business on , 2013, there were Class A shares, Class C shares and Class I shares of the Target Fund outstanding. As of , 2013, the board members and officers of the Target Fund as a group owned less than 1% of the total outstanding shares of the Target Fund and as a group owned less than 1% of each class of shares of the Target Fund.
At the close of business on , 2013, there were Class A shares, Class C shares, Class R3 and Class I shares of the Acquiring Fund outstanding. As of , 2013, the board members and officers of the Acquiring Fund as a group owned less than 1% of the total outstanding shares of the Acquiring Fund and as a group owned less than 1% of each class of shares of the Acquiring Fund.]
Shareholder Proposals
The Funds generally do not hold annual shareholders’ meetings, but will hold special meetings as required or deemed desirable. Because the Funds do not hold regular meetings of shareholders, the anticipated date of the next shareholder meeting cannot be provided. To be considered for inclusion in the proxy statement for any meeting of shareholders, a shareholder proposal must be submitted a reasonable time before the proxy statement for the meeting is mailed. Whether a proposal is included
32
in the proxy statement will be determined in accordance with applicable federal and state laws. The timely submission of a proposal does not guarantee its inclusion. Shareholders wishing to submit proposals for inclusion in a proxy statement for a shareholder meeting should send their written proposal to the respective Fund at 333 West Wacker Drive, Chicago, Illinois 60606.
Shareholder Communications
Shareholders who want to communicate with the Board or any individual board member should write to their Fund, to the attention of Lorna Ferguson, Manager of Fund Board Relations, Nuveen Investments, 333 West Wacker Drive, Chicago, Illinois 60606. The letter should indicate that you are a Fund shareholder, and identify the Fund (or Funds). If the communication is intended for a specific board member and so indicates, it will be sent only to that board member. If a communication does not indicate a specific board member, it will be sent to the chair of the nominating and governance committee and to the Board’s independent legal counsel for further distribution as deemed appropriate by such persons.
Proxy Statement/Prospectus Delivery
Please note that only one Proxy Statement/Prospectus may be delivered to two or more shareholders of the Target Fund who share an address, unless the Fund has received instructions to the contrary. To request a separate copy of the Proxy Statement/Prospectus, or for instructions as to how to request a separate copy of such document or as to how to request a single copy if multiple copies of such document are received, shareholders should contact the Target Fund at 333 West Wacker Drive, Chicago, Illinois 60606 or by calling (800) 257-8787.
VOTING INFORMATION AND REQUIREMENTS
Holders of shares of the Target Fund are entitled to one vote per share on matters as to which they are entitled to vote, with fractional shares voting proportionally.
Approval of the Reorganization will require the affirmative vote of the holders of a majority of the total number of shares outstanding and entitled to vote of the Target Fund. A vote in favor of the Reorganization will also be considered a vote in favor of an amendment to the Corporation’s Articles of Incorporation effecting the Reorganization.
Each valid proxy given by a shareholder of the Target Fund will be voted by the persons named in the proxy in accordance with the instructions marked thereon and as the persons named in the proxy may determine on such other business as may come before the Special Meeting on which shareholders are entitled to vote. If no designation is made, the proxy will be voted by the persons named in the proxy, as recommended by the Board, “FOR” approval of the Reorganization. Abstentions and broker non-votes (i.e., shares held by brokers or nominees, typically in “street name,” as to which (i) instructions have not been received from beneficial owners or persons entitled to vote and (ii) the broker or nominee does not have discretionary voting power on a particular matter) count as present for purposes of determining a quorum but do not count as votes “FOR” the proposal and have the same effect as a vote “AGAINST” the proposal. The presence in person or by proxy of the holders of ten percent (10%) of the shares of the Target Fund issued and outstanding and entitled to vote at the Special Meeting shall constitute a quorum for the transaction of any business.
33
Shareholders who execute proxies may revoke them at any time before they are voted by filing with the Target Fund a written notice of revocation, by delivering a duly executed proxy bearing a later date, or by attending the Special Meeting and voting in person. The giving of a proxy will not affect your right to vote in person if you attend the Special Meeting and wish to do so.
It is not anticipated that any action will be asked of the shareholders of the Target Fund other than as indicated above, but if other matters are properly brought before the Special Meeting, it is intended that the persons named in the proxy will vote in accordance with their judgment.
If a quorum is not obtained or if a quorum is present but sufficient votes in favor of a proposal are not received by the scheduled time of the Special Meeting, the holders of a majority of shares present in person or by proxy and entitled to vote shall have the power to adjourn the Special Meeting to permit further solicitation of proxies. The Special Meeting may be adjourned without notice other than announcement at the Special Meeting for not more than 120 days after the Record Date for the Special Meeting. At such adjourned meeting at which the requisite shares entitled to vote thereat shall be represented, any business may be transacted which could have been transacted at the meeting as originally notified. Prior to being convened, the Special Meeting may be postponed for not more than 120 days after the Record Date for the Special Meeting.
Proxies of shareholders of the Target Fund are solicited by the Board. Additional solicitation may be made by mail, telephone, telegraph or personal interview by representatives of the Adviser or Nuveen, or by dealers or their representatives.
, 2013
Please sign and return your proxy promptly.
Your vote is important and your participation
in the affairs of your Fund does make a difference.
34
APPENDIX I
AGREEMENT AND PLAN OF REORGANIZATION
THIS AGREEMENT AND PLAN OF REORGANIZATION (the “Agreement”) is made as of this th day of , 2013 by Nuveen Investment Trust II, a Massachusetts business trust (the “Trust”), on behalf of Nuveen Symphony Mid-Cap Core Fund, a series of the Trust (the “Acquiring Fund”), and Nuveen Investment Funds, Inc., a Maryland corporation (the “Corporation”), on behalf of Nuveen Mid Cap Select Fund, a series of the Corporation (the “Target Fund” and, together with the Acquiring Fund, the “Funds”), and Nuveen Fund Advisors, LLC, the investment adviser to the Funds (the “Adviser”) (for purposes of Section 9.1 of the Agreement only).
This Agreement is intended to be, and is adopted as, a plan of reorganization within the meaning of Section 368(a) of the Internal Revenue Code of 1986, as amended (the “Code”), and the Treasury Regulations promulgated thereunder. The reorganization will consist of: (i) the transfer of all the assets of the Target Fund to the Acquiring Fund in exchange solely for Class A, Class C and Class I shares of beneficial interest, par value $0.01 per share, of the Acquiring Fund (“Acquiring Fund Shares”) and the assumption by the Acquiring Fund of all the liabilities of the Target Fund; and (ii) the pro rata distribution, by class, of all the Acquiring Fund Shares to the shareholders of each corresponding class of the Target Fund, in complete liquidation and termination of the Target Fund as provided herein, all upon the terms and conditions set forth in this Agreement (the “Reorganization”). The foregoing will be effected pursuant to this Agreement and an amendment to the Corporation’s Amended and Restated Articles of Incorporation (“Articles of Incorporation”) in substantially the form attached hereto as Exhibit A (the “Amendment”) to be adopted in accordance with the Maryland General Corporation Law.
WHEREAS, the Target Fund is a separate series of the Corporation and the Acquiring Fund is a separate series of the Trust, and the Corporation and the Trust are each an open-end, management investment company registered under the Investment Company Act of 1940, as amended (the “1940 Act”);
WHEREAS, the Target Fund owns securities that generally are assets of the character in which the Acquiring Fund is permitted to invest;
WHEREAS, the Acquiring Fund is authorized to issue the Acquiring Fund Shares; and
WHEREAS, the Board of Directors of the Corporation (the “Target Fund Board”) and the Board of Trustees of the Trust (the “Acquiring Fund Board”) have made the determinations required by Rule 17a-8 under the 1940 Act with respect to the Target Fund and Acquiring Fund, respectively.
NOW, THEREFORE, in consideration of the premises and of the covenants and agreements hereinafter set forth, the parties hereto covenant and agree as follows:
ARTICLE I
TRANSFER OF ASSETS OF THE TARGET FUND IN EXCHANGE FOR ACQUIRING FUND SHARES AND THE ASSUMPTION OF THE TARGET FUND LIABILITIES AND TERMINATION AND LIQUIDATION OF THE TARGET FUND
1.1 THE EXCHANGE. Subject to the terms and conditions contained herein and on the basis of the representations and warranties contained herein, the Target Fund agrees to transfer all of its
I-1
assets, as set forth in Section 1.2, to the Acquiring Fund. In consideration therefor, the Acquiring Fund agrees: (i) to deliver to the Target Fund the number of full and fractional Class A, Class C and Class I Acquiring Fund Shares, computed in the manner set forth in Section 2.3 herein; and (ii) to assume all the liabilities of the Target Fund, as set forth in Section 1.3. All Acquiring Fund Shares delivered to the Target Fund shall be delivered at net asset value without a sales load, commission or other similar fee being imposed. In the event that Class A shares of the Acquiring Fund are transferred in the Reorganization to former holders of Class A shares of the Target Fund with respect to which the front-end sales charge was waived due to a purchase of $1 million or more, the Acquiring Fund agrees that, in determining whether a deferred sales charge is payable upon the sale of such Class A shares of the Acquiring Fund, it shall give credit for the period during which the holder thereof held such Target Fund shares. Such transactions shall take place at the closing provided for in Section 3.1 (the “Closing”).
1.2 ASSETS TO BE TRANSFERRED. The Target Fund shall transfer all of its assets to the Acquiring Fund, including, without limitation, all cash, securities, commodities, interests in futures, dividends or interest receivables owned by the Target Fund and any deferred or prepaid expenses shown as an asset on the books of the Target Fund at the Valuation Time, as such term is defined in Section 2.1.
The Target Fund will, within a reasonable period of time before the Closing Date, furnish the Acquiring Fund with a list of the Target Fund’s portfolio securities and other investments. The Acquiring Fund will, within a reasonable period of time before the Closing Date, furnish the Target Fund with a list of the securities, if any, on the Target Fund’s list referred to above that do not conform to the Acquiring Fund’s investment objective, policies, and restrictions. The Target Fund, if requested by the Acquiring Fund, will dispose of securities on the Acquiring Fund’s list before the Closing Date. In addition, if it is determined that the portfolios of the Target Fund and the Acquiring Fund, when aggregated, would contain investments exceeding certain percentage limitations imposed upon the Acquiring Fund with respect to such investments, the Target Fund, if requested by the Acquiring Fund, will dispose of a sufficient amount of such investments as may be necessary to avoid violating such limitations as of the Closing Date. Notwithstanding the foregoing, nothing herein will require the Target Fund to dispose of any investments or securities if, in the reasonable judgment of the Target Fund Board or the Adviser, such disposition would adversely affect the status of the Reorganization as a “reorganization” as such term is used in the Code or would otherwise not be in the best interests of the Target Fund.
1.3 LIABILITIES TO BE ASSUMED. The Target Fund will endeavor to discharge all of its known liabilities and obligations to the extent possible before the Closing Date. Notwithstanding the foregoing, any liabilities not so discharged shall be assumed by the Acquiring Fund, which assumed liabilities shall include all of the Target Fund’s liabilities, debts, obligations, and duties of whatever kind or nature, whether absolute, accrued, contingent, or otherwise, whether or not arising in the ordinary course of business, whether or not determinable at the Closing Date, and whether or not specifically referred to in this Agreement.
1.4 LIQUIDATING DISTRIBUTION. As of the Effective Time, as such term is defined in Section 3.1, the Target Fund will make a liquidating distribution of each class of the Acquiring Fund Shares received pursuant to Section 1.1 to its shareholders of record of each corresponding class of shares, determined as of the close of business on the Closing Date, as such term is defined in Section 3.1 (collectively, the “Target Fund Shareholders”), on a pro rata basis within that class. Such distribution will be accomplished with respect to each class of shares of the Target Fund by the transfer
I-2
of the Acquiring Fund Shares of the corresponding class then credited to the account of the Target Fund on the books of the Acquiring Fund to open accounts on the share records of the Acquiring Fund in the names of Target Fund Shareholders of such class. The Acquiring Fund shall not issue certificates representing Acquiring Fund Shares in connection with such transfer. As of the Effective Time, all issued and outstanding shares of the Target Fund shall be cancelled on the books of the Target Fund and retired.
1.5 OWNERSHIP OF SHARES. Ownership of Acquiring Fund Shares will be shown on the books of the Acquiring Fund’s transfer agent. Acquiring Fund Shares will be issued to the Target Fund, as set forth in Section 1.1.
1.6 TRANSFER TAXES. Any transfer taxes payable upon the issuance of Acquiring Fund Shares in a name other than the registered holder of the Target Fund shares on the books of the Target Fund as of that time shall, as a condition of such issuance and transfer, be paid by the person to whom such Acquiring Fund Shares are to be issued and transferred.
1.7 LIQUIDATION AND TERMINATION. The Target Fund shall completely liquidate and be terminated and have its affairs wound up in accordance with Maryland state law, as soon as practicable following the Closing Date and the making of all distributions pursuant to Section 1.4, but in no event later than 12 months following the Closing Date.
1.8 BOARD REPORTING. Any reporting responsibility of the Target Fund including, without limitation, the responsibility for filing of regulatory reports, tax returns or other documents with the Securities and Exchange Commission (the “Commission”), any state securities commission and any federal, state or local tax authorities or any other relevant regulatory authority, is and shall remain the responsibility of the Target Fund.
1.9 BOOKS AND RECORDS. All books and records of the Target Fund, including all books and records required to be maintained under the 1940 Act, and the rules and regulations thereunder, shall be available to the Acquiring Fund from and after the Closing Date and shall be turned over to the Acquiring Fund as soon as practicable following the Closing Date.
ARTICLE II
VALUATION
2.1 VALUATION OF ASSETS. The value of the net assets of the Target Fund shall be the value of its assets, less its liabilities, computed as of the close of regular trading on the New York Stock Exchange (“NYSE”) on the Closing Date (such time and date being hereinafter called the “Valuation Time”), using the valuation procedures of the Nuveen open-end funds adopted by the Target Fund Board or such other valuation procedures as shall be mutually agreed upon by the parties.
2.2 VALUATION OF SHARES. The net asset value per share per class of Acquiring Fund Shares shall be the net asset value per share for such class computed as of the Valuation Time, using the valuation procedures set forth in Section 2.1.
2.3 SHARES TO BE ISSUED. The number of Acquiring Fund Shares to be issued (including fractional shares, if any) in consideration for the net assets as described in Article I, shall be determined with respect to each class by dividing the value of the assets net of liabilities with respect to each class of shares of the Target Fund determined in accordance with Section 2.1 by the net asset value of an Acquiring Fund share of the corresponding class determined in accordance with Section 2.2.
I-3
2.4 EFFECT OF SUSPENSION IN TRADING. In the event that on the Closing Date, either: (a) the NYSE or another primary exchange on which the portfolio securities of the Acquiring Fund or the Target Fund are purchased or sold shall be closed to trading or trading on such exchange shall be restricted; or (b) trading or the reporting of trading on the NYSE or elsewhere shall be disrupted so that accurate appraisal of the value of the net assets of the Acquiring Fund or the Target Fund is impracticable, the Closing Date shall be postponed until the first business day when trading is fully resumed and reporting is restored.
ARTICLE III
CLOSING AND CLOSING DATE
3.1 CLOSING DATE. The Closing shall occur on , 2013 or such other date as the parties may agree (the “Closing Date”). Unless otherwise provided, all acts taking place at the Closing shall be deemed to take place as of immediately after the Valuation Time on the Closing Date (the “Effective Time”). The Closing shall be held as of the close of business at the offices of Vedder Price P.C. in Chicago, Illinois or at such other time and/or place as the parties may agree.
3.2 CUSTODIAN’S CERTIFICATE. The Target Fund shall cause the custodian for the Target Fund to deliver to the Acquiring Fund at the Closing a certificate of an authorized officer stating that: (a) the Target Fund’s portfolio securities, cash, and any other assets shall have been delivered in proper form to the Acquiring Fund on the Closing Date; and (b) all necessary taxes, including all applicable federal and state stock transfer stamps, if any, shall have been paid, or provision for payment shall have been made, in conjunction with the delivery of portfolio securities by the Target Fund.
3.3 TRANSFER AGENT’S CERTIFICATE. The Target Fund shall cause the transfer agent for the Target Fund to deliver to the Acquiring Fund at the Closing a certificate of an authorized officer stating that its records contain the names and addresses of all the Class A, Class C and Class I Target Fund Shareholders, and the number and percentage ownership of outstanding shares per class owned by each such shareholder immediately prior to the Closing. The Acquiring Fund shall issue and deliver or cause its transfer agent to issue and deliver to the Target Fund a confirmation evidencing the Class A, Class C and Class I Acquiring Fund Shares to be credited on the Closing Date to the Secretary of the Corporation or provide evidence satisfactory to the Target Fund that such Acquiring Fund Shares have been credited to the Target Fund’s account on the books of the Acquiring Fund.
3.4 DELIVERY OF ADDITIONAL ITEMS. At the Closing, each party shall deliver to the other such bills of sale, checks, assignments, share certificates, receipts and other documents, if any, as such other party or its counsel may reasonably request to effect the transactions contemplated by this Agreement.
ARTICLE IV
REPRESENTATIONS AND WARRANTIES
4.1 REPRESENTATIONS OF THE TARGET FUND. The Corporation, on behalf of the Target Fund, represents and warrants as follows:
(a) The Corporation is a corporation duly organized, validly existing and in good standing under the laws of the State of Maryland.
I-4
(b) The Target Fund is a separate series of the Corporation duly authorized in accordance with the applicable provisions of the Corporation’s Articles of Incorporation.
(c) The Corporation is registered as an open-end management investment company under the 1940 Act, and such registration is in full force and effect.
(d) The Target Fund is not, and the execution, delivery, and performance of this Agreement (subject to shareholder approval) will not result, in the violation of any provision of the Corporation’s Articles of Incorporation or By-Laws or of any material agreement, indenture, instrument, contract, lease, or other undertaking to which the Target Fund is a party or by which it is bound.
(e) Except as otherwise disclosed in writing to and accepted by the Acquiring Fund, the Target Fund has no material contracts or other commitments that will be terminated with liability to it on or before the Closing Date.
(f) No litigation, administrative proceeding, or investigation of or before any court or governmental body is presently pending or to its knowledge threatened against the Target Fund or any of its properties or assets, which, if adversely determined, would materially and adversely affect its financial condition, the conduct of its business, or the ability of the Target Fund to carry out the transactions contemplated by this Agreement. The Target Fund knows of no facts that might form the basis for the institution of such proceedings and is not a party to or subject to the provisions of any order, decree, or judgment of any court or governmental body that materially and adversely affects its business or its ability to consummate the transactions contemplated herein.
(g) The financial statements of the Target Fund as of October 31, 2012, and for the fiscal year then ended have been prepared in accordance with generally accepted accounting principles and have been audited by independent auditors, and such statements (copies of which have been furnished to the Acquiring Fund) fairly reflect the financial condition of the Target Fund as of October 31, 2012, and there are no known contingent liabilities of the Target Fund as of such date that are not disclosed in such statements.
(h) The financial statements of the Target Fund as of April 30, 2013, and for the period then ended have been prepared in accordance with generally accepted accounting principles, and such statements (copies of which have been furnished to the Acquiring Fund) fairly reflect the financial condition of the Target Fund as of April 30, 2013, and there are no known contingent liabilities of the Target Fund as of such date that are not disclosed in such statements.
(i) Since the date of the financial statements referred to in subsection (h) above, there have been no material adverse changes in the Target Fund’s financial condition, assets, liabilities or business (other than changes occurring in the ordinary course of business) and there are no known contingent liabilities of the Target Fund arising after such date. For the purposes of this subsection (i), a decline in the net asset value of the Target Fund shall not constitute a material adverse change.
(j) All federal, state, local and other tax returns and reports of the Target Fund required by law to be filed by it (taking into account permitted extensions for filing) have been timely filed and are complete and correct in all material respects. All federal, state, local and other taxes of the Target Fund required to be paid (whether or not shown on any such return or report) have been paid, or provision shall have been made for the payment thereof and any such unpaid
I-5
taxes are properly reflected on the financial statements referred to in subsection (h) above. To the best of the Target Fund’s knowledge, no tax authority is currently auditing or preparing to audit the Target Fund, and no assessment for taxes, interest, additions to tax or penalties has been asserted against the Target Fund.
(k) All issued and outstanding shares of the Target Fund are, and as of the Closing Date will be, duly and validly issued, fully paid and non-assessable by the Target Fund. All the issued and outstanding shares of the Target Fund will, at the time of the Closing, be held by the persons and in the amounts set forth in the records of the Target Fund’s transfer agent as provided in Section 3.3. The Target Fund has no outstanding options, warrants or other rights to subscribe for or purchase any shares of the Target Fund, and has no outstanding securities convertible into shares of the Target Fund.
(l) At the Closing, the Target Fund will have good and marketable title to the Target Fund’s assets to be transferred to the Acquiring Fund pursuant to Section 1.2, and full right, power, and authority to sell, assign, transfer, and deliver such assets, and the Acquiring Fund will acquire good and marketable title thereto, subject to no restrictions on the full transfer thereof, including such restrictions as might arise under the Securities Act of 1933, as amended (the “1933 Act”), except those restrictions as to which the Acquiring Fund has received notice and necessary documentation at or prior to the Closing.
(m) The execution, delivery and performance of this Agreement have been duly authorized by all necessary action on the part of the Target Fund including the determinations of the Target Fund Board required by Rule 17a-8(a) of the 1940 Act. Subject to approval by the Target Fund shareholders, this Agreement constitutes a valid and binding obligation of the Target Fund, enforceable in accordance with its terms, subject as to enforcement, to bankruptcy, insolvency, reorganization, moratorium, and other laws relating to or affecting creditors’ rights and to general equity principles.
(n) The information to be furnished by the Target Fund for use in no-action letters, applications for orders, registration statements, proxy materials and other documents that may be necessary in connection with the transactions contemplated herein shall be accurate and complete in all material respects and shall comply in all material respects with federal securities and other laws and regulations.
(o) From the effective date of the Registration Statement (as defined in Section 5.7), through the time of the meeting of the Target Fund shareholders and on the Closing Date, any written information furnished by the Corporation with respect to the Target Fund for use in the Proxy Materials (as defined in Section 5.7), or any other materials provided in connection with the Reorganization, does not and will not contain any untrue statement of a material fact or omit to state a material fact required to be stated or necessary to make the statements, in light of the circumstances under which such statements were made, not misleading.
(p) For each taxable year of its operations (including the taxable year ending on the Closing Date), the Target Fund has been or will be treated as a separate corporation for federal income tax purposes pursuant to Section 851(g) of the Code, has met or will meet the requirements of Subchapter M of the Code for qualification as a regulated investment company and has elected to be treated as such, has been and will be eligible to compute and has computed and will compute its federal income tax under Section 852 of the Code, and will have distributed on or prior to the
I-6
Closing Date all its investment company taxable income (determined without regard to the deduction for dividends paid), the excess of its interest income excludable from gross income under Section 103(a) of the Code over its deductions disallowed under Sections 265 and 171(a)(2) of the Code, and its net capital gain (as such terms are defined in the Code) that has accrued or will accrue on or prior to the Closing Date.
4.2 REPRESENTATIONS OF THE ACQUIRING FUND. The Trust, on behalf of the Acquiring Fund, represents and warrants as follows:
(a) The Trust is a business trust duly organized, validly existing and in good standing under the laws of the Commonwealth of Massachusetts.
(b) The Acquiring Fund is a separate series of the Trust duly authorized in accordance with the applicable provisions of the Trust’s Declaration of Trust (“Declaration of Trust”).
(c) The Trust is registered as an open-end management investment company under the 1940 Act, and such registration is in full force and effect.
(d) The Acquiring Fund is not, and the execution, delivery and performance of this Agreement will not result, in a violation of the Trust’s Declaration of Trust or By-Laws or of any material agreement, indenture, instrument, contract, lease, or other undertaking to which the Acquiring Fund is a party or by which it is bound.
(e) No litigation, administrative proceeding or investigation of or before any court or governmental body is presently pending or to its knowledge threatened against the Acquiring Fund or any of its properties or assets, which, if adversely determined, would materially and adversely affect its financial condition, the conduct of its business or the ability of the Acquiring Fund to carry out the transactions contemplated by this Agreement. The Acquiring Fund knows of no facts that might form the basis for the institution of such proceedings and it is not a party to or subject to the provisions of any order, decree, or judgment of any court or governmental body that materially and adversely affects its business or its ability to consummate the transaction contemplated herein.
(f) The financial statements of the Acquiring Fund as of September 30, 2012 and for the fiscal year then ended have been prepared in accordance with generally accepted accounting principles and have been audited by independent auditors, and such statements (copies of which have been furnished to the Target Fund) fairly reflect the financial condition of the Acquiring Fund as of September 30, 2012, and there are no known contingent liabilities of the Acquiring Fund as of such date that are not disclosed in such statements.
(g) The financial statements of the Acquiring Fund as of March 31, 2013 and for the period then ended have been prepared in accordance with generally accepted accounting principles, and such statements (copies of which have been furnished to the Target Fund) fairly reflect the financial condition of the Acquiring Fund as of March 31, 2013, and there are no known contingent liabilities of the Acquiring Fund as of such date that are not disclosed in such statements.
(h) Since the date of the financial statements referred to in subsection (g) above, there have been no material adverse changes in the Acquiring Fund’s financial condition, assets, liabilities or business (other than changes occurring in the ordinary course of business) and there are no known contingent liabilities of the Acquiring Fund arising after such date. For the purposes of this subsection (h), a decline in the net asset value of the Acquiring Fund shall not constitute a material adverse change.
I-7
(i) All federal, state, local and other tax returns and reports of the Acquiring Fund required by law to be filed by it (taking into account permitted extensions for filing) have been timely filed and are complete and correct in all material respects. All federal, state, local and other taxes of the Acquiring Fund required to be paid (whether or not shown on any such return or report) have been paid or provision shall have been made for their payment and any such unpaid taxes are properly reflected on the financial statements referred to in subsection (g) above. To the best of the Acquiring Fund’s knowledge, no tax authority is currently auditing or preparing to audit the Acquiring Fund, and no assessment for taxes, interest, additions to tax or penalties has been asserted against the Acquiring Fund.
(j) All issued and outstanding shares of the Acquiring Fund are, and, as of the Closing Date will be, duly and validly issued, fully paid and non-assessable by the Acquiring Fund (recognizing that under Massachusetts law, Acquiring Fund shareholders, under certain circumstances, could be held personally liable for the obligations of the Acquiring Fund). The Acquiring Fund has no outstanding options, warrants, or other rights to subscribe for or purchase shares of the Acquiring Fund, and there are no outstanding securities convertible into shares of the Acquiring Fund.
(k) The execution, delivery and performance of this Agreement have been duly authorized by all necessary action on the part of the Acquiring Fund, including the determinations of the Acquiring Fund Board required pursuant to Rule 17a-8(a) of the 1940 Act. This Agreement constitutes a valid and binding obligation of the Acquiring Fund, enforceable in accordance with its terms, subject as to enforcement, to bankruptcy, insolvency, reorganization, moratorium, and other laws relating to or affecting creditors’ rights and to general equity principles.
(l) The Acquiring Fund Shares to be issued and delivered to the Target Fund for the account of the Target Fund Shareholders pursuant to the terms of this Agreement will, at the Closing Date, have been duly authorized. When so issued and delivered, such shares will be duly and validly issued shares of the Acquiring Fund, and will be fully paid and non-assessable.
(m) The information to be furnished by the Acquiring Fund for use in no-action letters, applications for orders, registration statements, proxy materials, and other documents that may be necessary in connection with the transactions contemplated herein shall be accurate and complete in all material respects and shall comply in all material respects with federal securities and other laws and regulations.
(n) From the effective date of the Registration Statement (as defined in Section 5.7), through the time of the meeting of the Target Fund shareholders and on the Closing Date, any written information furnished by the Trust with respect to the Acquiring Fund for use in the Proxy Materials (as defined in Section 5.7), or any other materials provided in connection with the Reorganization, does not and will not contain any untrue statement of a material fact or omit to state a material fact required to be stated or necessary to make the statements, in light of the circumstances under which such statements were made, not misleading.
(o) For each taxable year of its operation, the Acquiring Fund has been treated as a separate corporation for federal income tax purposes pursuant to Section 851(g) of the Code, has met the requirements of Subchapter M of the Code for qualification as a regulated investment company and has elected to be treated as such, has been eligible to compute and has computed its federal
I-8
income tax under Section 852 of the Code. In addition, the Acquiring Fund will satisfy each of the foregoing with respect to its taxable year that includes the Closing Date.
(p) The Acquiring Fund agrees to use all reasonable efforts to obtain the approvals and authorizations required by the 1933 Act, the 1940 Act, and any state securities laws as it may deem appropriate in order to continue its operations after the Closing Date.
ARTICLE V
COVENANTS OF THE FUNDS
5.1 OPERATION IN ORDINARY COURSE. Subject to Sections 1.2 and 8.5, each of the Acquiring Fund and the Target Fund will operate its respective business in the ordinary course from the date of this Agreement through the Closing, it being understood that such ordinary course of business will include customary dividends and distributions, any other distribution necessary or desirable to avoid federal income or excise taxes, and shareholder purchases and redemptions.
5.2 APPROVAL OF SHAREHOLDERS. The Corporation will call a special meeting of the Target Fund shareholders to consider and act upon this Agreement (or transactions contemplated thereby) and to take all other appropriate action necessary to obtain approval of the transactions contemplated herein.
5.3 INVESTMENT REPRESENTATION. The Target Fund covenants that the Acquiring Fund Shares to be issued pursuant to this Agreement are not being acquired for the purpose of making any distribution, other than in connection with the Reorganization and in accordance with the terms of this Agreement.
5.4 ADDITIONAL INFORMATION. The Target Fund will assist the Acquiring Fund in obtaining such information as the Acquiring Fund reasonably requests concerning the beneficial ownership of the Target Fund’s shares.
5.5 FURTHER ACTION. Subject to the provisions of this Agreement, each Fund will take or cause to be taken, all action, and do or cause to be done, all things reasonably necessary, proper or advisable to consummate and make effective the transactions contemplated by this Agreement, including any actions required to be taken after the Closing Date.
5.6 STATEMENT OF EARNINGS AND PROFITS. As promptly as practicable, but in any case within 60 days after the Closing Date, the Target Fund shall furnish the Acquiring Fund, in such form as is reasonably satisfactory to the Acquiring Fund and which shall be certified by the Corporation’s Controller or Treasurer, a statement of the earnings and profits of the Target Fund for federal income tax purposes, as well as any net operating loss carryovers and capital loss carryovers, that will be carried over to the Acquiring Fund pursuant to Section 381 of the Code.
5.7 PREPARATION OF REGISTRATION STATEMENT AND PROXY MATERIALS. The Trust will prepare and file with the Commission a registration statement on Form N-14 relating to the Acquiring Fund Shares to be issued to the Target Fund Shareholders (the “Registration Statement”). The Registration Statement shall include a proxy statement of the Target Fund and a prospectus of the Acquiring Fund relating to the transaction contemplated by this Agreement. The Registration Statement shall be in compliance with the 1933 Act, the Securities
I-9
Exchange Act of 1934, as amended (the “1934 Act”), and the 1940 Act, as applicable. Each party will provide the other party with the materials and information necessary to prepare the proxy statement and related materials (the “Proxy Materials”), for inclusion therein, in connection with the meeting of the Target Fund’s shareholders to consider the approval of this Agreement and the transactions contemplated herein.
5.8 TAX STATUS OF REORGANIZATION. The intention of the parties is that the Reorganization will qualify as a reorganization within the meaning of Section 368(a) of the Code. None of the Target Fund, the Corporation, the Acquiring Fund or the Trust shall take any action, or cause any action to be taken (including, without limitation, the filing of any tax return), that is inconsistent with such treatment or results in the failure of the transaction to qualify as a reorganization within the meaning of Section 368(a) of the Code. At or prior to the Closing, the Target Fund, the Corporation, the Acquiring Fund and the Trust will take such action, or cause such action to be taken, as is reasonably necessary to enable counsel to render the tax opinion contemplated herein in Section 8.9.
ARTICLE VI
CONDITION PRECEDENT TO OBLIGATIONS OF THE TARGET FUND
The obligations of the Target Fund to consummate the transactions provided for herein shall be subject to the following condition:
6.1 All representations, covenants, and warranties of the Acquiring Fund contained in this Agreement shall be true and correct in all material respects as of the date hereof and as of the Closing, with the same force and effect as if made on and as of the Closing. The Acquiring Fund shall have delivered to the Target Fund a certificate executed in the Acquiring Fund’s name by the Trust’s Chief Administrative Officer or Vice President and its Controller or Treasurer, in form and substance satisfactory to the Target Fund and dated as of the Closing Date, to such effect and as to such other matters as the Target Fund shall reasonably request.
ARTICLE VII
CONDITIONS PRECEDENT TO OBLIGATIONS OF THE ACQUIRING FUND
The obligations of the Acquiring Fund to consummate the transactions provided for herein shall be subject to the following conditions:
7.1 All representations, covenants, and warranties of the Target Fund contained in this Agreement shall be true and correct in all material respects as of the date hereof and as of the Closing, with the same force and effect as if made on and as of the Closing. The Target Fund shall have delivered to the Acquiring Fund on the Closing Date a certificate executed in the Target Fund’s name by the Corporation’s President or Vice President and the Controller or Treasurer, in form and substance satisfactory to the Acquiring Fund and dated as of the Closing Date, to such effect and as to such other matters as the Acquiring Fund shall reasonably request.
7.2 The Target Fund shall have delivered to the Acquiring Fund a statement of the Target Fund’s assets and liabilities, together with a list of the Target Fund’s portfolio securities showing the tax basis of such securities by lot and the holding periods of such securities, as of the Closing, certified by the Controller or Treasurer of the Corporation.
I-10
ARTICLE VIII
FURTHER CONDITIONS PRECEDENT
The obligations of the Target Fund and the Acquiring Fund hereunder shall also be subject to the following:
8.1 This Agreement and the transactions contemplated herein, with respect to the Target Fund, shall have been approved by the requisite vote of the holders of the outstanding shares of the Target Fund in accordance with applicable law and the provisions of the Corporation’s Articles of Incorporation and By-Laws. Notwithstanding anything herein to the contrary, neither the Acquiring Fund nor the Target Fund may waive the conditions set forth in this Section 8.1.
8.2 On the Closing Date, the Commission shall not have issued an unfavorable report under Section 25(b) of the 1940 Act, or instituted any proceeding seeking to enjoin the consummation of the transactions contemplated by this Agreement under Section 25(c) of the 1940 Act. Furthermore, no action, suit or other proceeding shall be threatened or pending before any court or governmental agency in which it is sought to restrain or prohibit, or obtain damages or other relief in connection with this Agreement or the transactions contemplated herein.
8.3 All required consents of other parties and all other consents, orders, and permits of federal, state and local regulatory authorities (including those of the Commission and of state securities authorities, including any necessary “no-action” positions and exemptive orders from such federal and state authorities) to permit consummation of the transactions contemplated herein shall have been obtained.
8.4 The Registration Statement shall have become effective under the 1933 Act, and no stop orders suspending the effectiveness thereof shall have been issued. To the best knowledge of the parties to this Agreement, no investigation or proceeding for that purpose shall have been instituted or be pending, threatened or contemplated under the 1933 Act.
8.5 The Target Fund shall have declared and paid a dividend or dividends which, together with all previous such dividends, shall have the effect of distributing to its shareholders at least all of the Target Fund’s investment company taxable income for all taxable periods ending on or before the Closing Date (computed without regard to any deduction for dividends paid), if any, plus the excess of its interest income excludible from gross income under Section 103(a) of the Code, if any, over its deductions disallowed under Sections 265 and 171(a)(2) of the Code for all taxable periods ending on or before the Closing Date and all of its net capital gains realized in all taxable periods ending on or before the Closing Date (after reduction for any available capital loss carryforward).
8.6 The Target Fund shall have delivered to the Acquiring Fund on the Closing Date a certificate executed in its name by the Corporation’s President or Vice President, in a form reasonably satisfactory to the Acquiring Fund and dated as of the Closing Date, to the effect that the representations and warranties of the Corporation, on behalf of the Target Fund, made in this Agreement are true and correct on and as of the Closing and as to such other matters as the Acquiring Fund shall reasonably request. The Acquiring Fund shall have delivered to the Target Fund on the Closing Date a certificate executed in its name by the Trust’s Chief Administrative Officer or Vice President, in a form reasonably satisfactory to the Target Fund and dated as of the Closing Date, to the
I-11
effect that the representations and warranties of the Trust, on behalf of the Acquiring Fund, made in this Agreement are true and correct on and as of the Closing and as to such other matters as the Target Fund shall reasonably request.
8.7 The Acquiring Fund shall have received on the Closing Date an opinion from counsel, dated as of the Closing Date, substantially to the effect that:
(a) The Corporation is a corporation validly existing and in good standing under the laws of the State of Maryland.
(b) The Agreement has been duly authorized, executed and delivered by the Corporation, on behalf of the Target Fund, and constitutes a valid and legally binding obligation of the Corporation, on behalf of the Target Fund, enforceable in accordance with its terms.
(c) The execution and delivery of the Agreement by the Corporation, on behalf of the Target Fund, did not, and the exchange of the Target Fund’s assets for Acquiring Fund Shares pursuant to the Agreement will not, violate the Corporation’s Articles of Incorporation or By-Laws.
(d) To the knowledge of such counsel, and without any independent investigation, (i) the Corporation is registered as an investment company with the Commission and is not subject to any stop order; and (ii) all regulatory consents, authorizations, approvals or filings required to be obtained or made by the Target Fund under the federal laws of the United States of America or the laws of the State of Maryland for the transfer of the Target Fund’s assets and liabilities for Acquiring Fund Shares pursuant to the Agreement have been obtained or made.
8.8 The Target Fund shall have received on the Closing Date an opinion from counsel, dated as of the Closing Date, substantially to the effect that:
(a) The Trust is a validly existing voluntary association with transferable shares of beneficial interest under the laws of the Commonwealth of Massachusetts.
(b) The Agreement has been duly authorized, executed and delivered by the Trust, on behalf of the Acquiring Fund, and constitutes a valid and legally binding obligation of the Trust, on behalf of the Acquiring Fund, enforceable in accordance with its terms.
(c) The execution and delivery of the Agreement by the Trust, on behalf of the Acquiring Fund, did not, and the issuance of Acquiring Fund Shares pursuant to the Agreement will not, violate the Trust’s Declaration of Trust or By-Laws.
(d) To the knowledge of such counsel, and without any independent investigation, (i) the Trust is registered as an investment company with the Commission and is not subject to any stop order; and (ii) all regulatory consents, authorizations, approvals or filings required to be obtained or made by the Acquiring Fund under the federal laws of the United States of America or the laws of the Commonwealth of Massachusetts for the issuance of Acquiring Fund Shares pursuant to the Agreement have been obtained or made.
8.9 The Funds shall have received an opinion of Vedder Price P.C. addressed to the Acquiring Fund and the Target Fund substantially to the effect that for federal income tax purposes:
(a) The transfer by the Target Fund of all its assets to the Acquiring Fund solely in exchange for Acquiring Fund Shares and the assumption by the Acquiring Fund of all the liabilities
I-12
of the Target Fund, followed by the pro rata, by class, distribution of all the Acquiring Fund Shares so received by the Target Fund to the Target Fund Shareholders in complete liquidation of the Target Fund as soon as practicable thereafter, will constitute a “reorganization” within the meaning of Section 368(a)(1) of the Code and the Acquiring Fund and the Target Fund will each be “a party to a reorganization,” within the meaning of Section 368(b) of the Code, with respect to the Reorganization.
(b) No gain or loss will be recognized by the Acquiring Fund upon the receipt of all the assets of the Target Fund solely in exchange for Acquiring Fund Shares and the assumption by the Acquiring Fund of all the liabilities of the Target Fund.
(c) No gain or loss will be recognized by the Target Fund upon the transfer of all the Target Fund’s assets to the Acquiring Fund solely in exchange for Acquiring Fund Shares and the assumption by the Acquiring Fund of all the liabilities of the Target Fund or upon the distribution (whether actual or constructive) of the Acquiring Fund Shares so received to the Target Fund Shareholders solely in exchange for such shareholders’ shares of the Target Fund in complete liquidation of the Target Fund.
(d) No gain or loss will be recognized by the Target Fund Shareholders upon the exchange, pursuant to the Reorganization, of all their shares of the Target Fund solely for Acquiring Fund Shares.
(e) The aggregate basis of the Acquiring Fund Shares received by each Target Fund Shareholder pursuant to the Reorganization will be the same as the aggregate basis of the shares of the Target Fund exchanged therefor by such shareholder.
(f) The holding period of the Acquiring Fund Shares received by each Target Fund Shareholder in the Reorganization will include the period during which the shares of the Target Fund exchanged therefor were held by such shareholder, provided such Target Fund shares are held as capital assets at the Effective Time.
(g) The basis of the assets of the Target Fund received by the Acquiring Fund will be the same as the basis of such assets in the hands of the Target Fund immediately before the Effective Time.
(h) The holding period of the assets of the Target Fund received by the Acquiring Fund will include the period during which such assets were held by the Target Fund.
No opinion will be expressed as to (1) the effect of the Reorganization on the Target Fund, the Acquiring Fund or any Target Fund Shareholder with respect to any asset (including without limitation any stock held in a passive foreign investment company as defined in Section 1297(a) of the Code) as to which any unrealized gain or loss is required to be recognized under federal income tax principles (i) at the end of a taxable year (or on the termination thereof) or (ii) upon the transfer of such asset regardless of whether such transfer would otherwise be a non-taxable transaction under the Code, or (2) any other federal tax issues (except those set forth above) and all state, local or foreign tax issues of any kind.
Such opinion shall be based on customary assumptions and such representations as Vedder Price P.C. may reasonably request of the Funds, and the Target Fund and the Acquiring Fund will cooperate to make and certify the accuracy of such representations. Notwithstanding anything herein to the contrary, neither the Acquiring Fund nor the Target Fund may waive the conditions set forth in this Section 8.9.
I-13
ARTICLE IX
EXPENSES
9.1 Each of the Target Fund and the Acquiring Fund will pay expenses incurred in connection with the Reorganization based on its portion of the projected cost savings during the first year following the Reorganization. Reorganization expenses include, without limitation: (a) expenses associated with the preparation and filing of the Registration Statement and other Proxy Materials; (b) postage; (c) printing; (d) accounting fees; (e) legal fees incurred by each Fund; (f) solicitation costs of the transaction; and (g) other related administrative or operational costs. To the extent that the payment of Reorganization expenses would cause the Target Fund or the Acquiring Fund to exceed its expense cap then in effect, the Adviser or an affiliate will reimburse the portion of expenses necessary for the Fund to operate within its cap. The Adviser or an affiliate will pay the expenses incurred in connection with the Reorganization to the extent such expenses exceed the projected cost savings. If the Reorganization is not consummated, the Adviser or an affiliate will bear the expenses incurred in connection with the Reorganization.
9.2 Each Fund represents and warrants to the other Fund that there is no person or entity entitled to receive any broker’s fees or similar fees or commission payments in connection with the transactions provided for herein.
9.3 Notwithstanding the foregoing, expenses will in any event be paid by the party directly incurring such expenses if and to the extent that the payment by another party of such expenses would result in the disqualification of the Target Fund or the Acquiring Fund, as the case may be, as a regulated investment company within the meaning of Section 851 of the Code.
ARTICLE X
ENTIRE AGREEMENT; SURVIVAL OF WARRANTIES
10.1 The parties agree that no party has made to the other parties any representation, warranty and/or covenant not set forth herein, and that this Agreement constitutes the entire agreement between and among the parties.
10.2 The representations, warranties, and covenants contained in this Agreement or in any document delivered pursuant to or in connection with this Agreement shall not survive the consummation of the transactions contemplated hereunder.
ARTICLE XI
TERMINATION
11.1 This Agreement may be terminated by the mutual agreement of the parties and such termination may be effected by the Corporation’s President or Vice President and the Trust’s Chief Administrative Officer or Vice President without further action by the Target Fund Board or Acquiring Fund Board. In addition, either Fund may, at its option, terminate this Agreement at or before the Closing due to:
(a) a breach by any other party of any representation, warranty, or agreement contained herein to be performed at or before the Closing, if not cured within 30 days;
I-14
(b) a condition precedent to the obligations of the terminating party that has not been met and it reasonably appears that it will not or cannot be met; or
(c) a determination by the Target Fund Board or Acquiring Fund Board that the consummation of the transactions contemplated herein is not in the best interests of the Target Fund or Acquiring Fund, respectively.
11.2 In the event of any such termination, in the absence of willful default, there shall be no liability for damages on the part of the Corporation, the Directors of the Corporation, the Target Fund, the Trust, the Trustees of the Trust, the Acquiring Fund, the Adviser, or the Corporation’s, Trust’s or Adviser’s officers.
ARTICLE XII
AMENDMENTS
12.1 This Agreement may be amended, modified, or supplemented in such manner as may be mutually agreed upon in writing by the officers of the Corporation and officers of the Trust as specifically authorized by the Target Fund Board or Acquiring Fund Board; provided, however, that following the meeting of the Target Fund shareholders called by the Target Fund pursuant to Section 5.2 of this Agreement, no such amendment may have the effect of changing the provisions for determining the number of Acquiring Fund Shares to be issued to the Target Fund Shareholders under this Agreement to the detriment of such shareholders without their further approval.
ARTICLE XIII
HEADINGS; COUNTERPARTS; GOVERNING LAW; ASSIGNMENT;
LIMITATION OF LIABILITY
13.1 The article and section headings contained in this Agreement are for reference purposes only and shall not affect in any way the meaning or interpretation of this Agreement.
13.2 This Agreement may be executed in any number of counterparts, each of which shall be deemed an original.
13.3 This Agreement shall be governed by and construed in accordance with the laws of the Commonwealth of Massachusetts.
13.4 This Agreement shall bind and inure to the benefit of the parties hereto and their respective successors and assigns, but, except as provided in this section, no assignment or transfer hereof or of any rights or obligations hereunder shall be made by any party without the written consent of the other parties. Nothing herein expressed or implied is intended or shall be construed to confer upon or give any person, firm, or corporation, other than the parties hereto and their respective successors and assigns, any rights or remedies under or by reason of this Agreement.
13.5 It is expressly agreed that the obligations of the Acquiring Fund hereunder shall not be binding upon any of the Trustees, shareholders, nominees, officers, agents, or employees of the Trust personally, but shall bind only the property of the Acquiring Fund, as provided in the Trust’s Declaration of Trust. The execution and delivery of this Agreement have been authorized by the
I-15
Trustees of the Trust, on behalf of the Acquiring Fund, and signed by authorized officers of the Trust acting as such. Neither the authorization by such Trustees nor the execution and delivery by such officers shall be deemed to have been made by any of them individually or to impose any liability on any of them personally, but shall bind only the property of the Acquiring Fund as provided in the Trust’s Declaration of Trust.
[SIGNATURE PAGE FOLLOWS]
I-16
IN WITNESS WHEREOF, the parties have duly executed this Agreement, all as of the date first written above.
| | |
NUVEEN INVESTMENT TRUST II, on behalf of Nuveen Symphony Mid-Cap Core Fund |
| |
| By: | | |
| Name: | | Kathleen Prudhomme |
| Title: | | Vice President and Assistant Secretary |
| | |
| ACKNOWLEDGED: |
| |
| By: | | |
| Name: | | |
| Title: | | |
| | |
NUVEEN INVESTMENT FUNDS, INC., on behalf of Nuveen Mid Cap Select Fund |
| |
| By: | | |
| Name: | | Kathleen Prudhomme |
| Title: | | Vice President and Assistant Secretary |
| | |
| ACKNOWLEDGED: |
| |
| By: | | |
| Name: | | |
| Title: | | |
| | |
| The undersigned is a party to this Agreement for the purposes of Section 9.1 only: |
|
| NUVEEN FUND ADVISORS, LLC |
| |
| By: | | |
| Name: | | Kevin J. McCarthy |
| Title: | | Managing Director |
| | |
| ACKNOWLEDGED: |
| |
| By: | | |
| Name: | | |
| Title: | | |
I-17
EXHIBIT A TO AGREEMENT AND PLAN OF REORGANIZATION
ARTICLES OF AMENDMENT
TO
AMENDED AND RESTATED ARTICLES OF INCORPORATION
OF
NUVEEN INVESTMENT FUNDS, INC.
The undersigned officer of Nuveen Investment Funds, Inc. (the “Corporation”), a Maryland corporation, hereby certifies that the following amendments to the Corporation’s Amended and Restated Articles of Incorporation have been advised by the Corporation’s Board of Directors and approved by the Corporation’s stockholders in the manner required by the Maryland General Corporation Law, such amendment to become effective , 2013 at the Effective Time referred to below:
WHEREAS, the Corporation is registered as an open-end management investment company (i.e., a mutual fund) under the Investment Company Act of 1940 and offers its shares to the public in several classes (i.e., series), each of which represents a separate and distinct portfolio of assets;
WHEREAS, it is desirable and in the best interests of the holders of the Class P shares of the Corporation (also known as “Nuveen Mid Cap Select Fund”) that the assets belonging to such class be transferred to Nuveen Symphony Mid-Cap Core Fund, a series of Nuveen Investment Trust II, a Massachusetts business trust (the “Trust”), in exchange for Class A, Class C and Class I shares of beneficial interest in Nuveen Symphony Mid-Cap Core Fund, which are to be delivered to former Nuveen Mid Cap Select Fund holders;
WHEREAS, Nuveen Mid Cap Select Fund and Nuveen Symphony Mid-Cap Core Fund have entered into an Agreement and Plan of Reorganization providing for the foregoing transactions; and
WHEREAS, in order to bind all holders of shares of Nuveen Mid Cap Select Fund to the foregoing transactions and as set forth in the Agreement and Plan of Reorganization, and in particular to bind such holders to the exchange of their shares of Nuveen Mid Cap Select Fund for Class A, Class C and Class I shares of beneficial interest in Nuveen Symphony Mid-Cap Core Fund, it is necessary to adopt an amendment to the Corporation’s Amended and Restated Articles of Incorporation.
NOW, THEREFORE, BE IT RESOLVED, that effective as of the Effective Time referred to below, the Corporation’s Amended and Restated Articles of Incorporation be, and the same hereby are, amended to add the following Article IV(FF) immediately following Article IV(EE) thereof:
Article IV(FF). (a) For purposes of this Article IV(FF), the following terms shall have the following meanings:
“Acquiring Fund” means Nuveen Symphony Mid-Cap Core Fund, a series of the Trust.
“Class A Acquiring Fund Shares” means the Acquiring Fund’s Class A shares of beneficial interest.
A-1
“Class C Acquiring Fund Shares” means the Acquiring Fund’s Class C shares of beneficial interest.
“Class I Acquiring Fund Shares” means the Acquiring Fund’s Class I shares of beneficial interest.
“Class A Target Fund Shares” means the Corporation’s Class P Common Shares.
“Class C Target Fund Shares” means the Corporation’s Class P, Series 4 Common Shares.
“Class I Target Fund Shares” means the Corporation’s Class P, Series 2 Common Shares.
“Closing” means the occurrence of the transactions set forth in (b) and (c) below on the Closing Date.
“Closing Date” means , 2013.
“Corporation” means this corporation.
“Effective Time” means immediately after the Valuation Time on the Closing Date.
“Plan” means the Agreement and Plan of Reorganization dated , 2013 on behalf of the Acquiring Fund and the Target Fund.
“Target Fund” means the Corporation’s Nuveen Mid Cap Select Fund, which is represented by the Corporation’s Class P shares.
“Trust” means Nuveen Investment Trust II, a Massachusetts business trust.
“Valuation Time” means the close of regular trading on the New York Stock Exchange on the Closing Date.
(b) As of the Effective Time, the Target Fund will transfer all of its assets to the Acquiring Fund, including, without limitation, all cash, securities, commodities, interests in futures, dividends or interest receivables owned by the Target Fund and any deferred or prepaid expenses shown as an asset on the books of the Target Fund at the Valuation Time.
(c) As of the Effective Time, the Acquiring Fund will: (i) deliver to the Target Fund the number of full and fractional Class A, Class C and Class I Acquiring Fund Shares, computed in the manner set forth in (d) below; and (ii) assume all the liabilities of the Target Fund not discharged by the Target Fund, which assumed liabilities shall include all of the Target Fund’s liabilities, debts, obligations, and duties of whatever kind or nature, whether absolute, accrued, contingent, or otherwise, whether or not arising in the ordinary course of business, whether or not determinable at the Closing Date, and whether or not specifically referred to in the Plan or herein.
(d) The number of Class A, Class C and Class I Acquiring Fund Shares to be delivered to holders of Class A Target Fund Shares, Class C Target Fund Shares and Class I Target Fund Shares, respectively, shall be determined as follows:
(i) Acquiring Fund Shares to be issued (including fractional shares, if any) in consideration for the Target Fund’s net assets as described in (b) and (c) above, shall be
A-2
determined with respect to Class A, Class C and Class I of the Target Fund Shares by dividing the value of the assets net of liabilities with respect to each such class of shares determined in accordance with (ii) below by the net asset value of an Acquiring Fund share of the corresponding class determined in accordance with (iii) below.
(ii) The value of the Target Fund’s assets and liabilities shall be computed as of the Valuation Time, using the valuation procedures of the Nuveen open-end funds adopted by the Board of Directors of the Corporation or such other valuation procedures as shall be mutually agreed upon by the parties.
(iii) As of the Effective Time, the Target Fund will distribute the Acquiring Fund Shares received pursuant to (c) above to its shareholders of record with respect to each corresponding class of shares, determined as of the close of business on the Closing Date (the “Target Fund Shareholders”), on a pro rata basis within that class. Such distribution will be accomplished with respect to Class A, Class C and Class I Target Fund Shares by the transfer of the Acquiring Fund Shares of the corresponding class then credited to the account of the Target Fund on the books of the Acquiring Fund to open accounts on the share records of the Acquiring Fund in the names of Target Fund Shareholders of such class. The Acquiring Fund shall not issue certificates representing Acquiring Fund Shares in connection with such transfer. As of the Effective Time, all issued and outstanding shares of the Target Fund shall be cancelled on the books of the Target Fund and retired.
(e) From and after the Effective Time, the Target Fund shares cancelled and retired pursuant to paragraph (d)(iii) above shall have the status of authorized and unissued common shares of the Corporation, without designation as to series.
The undersigned officer of the Corporation hereby acknowledges, in the name and on behalf of the Corporation, the foregoing Articles of Amendment to be the corporate act of the Corporation and further certifies that, to the best of his or her knowledge, information and belief, the matters and facts set forth therein with respect to the approval thereof are true in all material respects, under the penalties of perjury.
IN WITNESS WHEREOF, the Corporation has caused these Articles of Amendment to be signed in its name and on its behalf by its President or a Vice President and witnessed by its Secretary or an Assistant Secretary on , 2013.
| | |
| NUVEEN INVESTMENT FUNDS, INC. |
| |
| By: | | |
| | [Name] |
| Its: | | [Title] |
A-3

Nuveen Investments
333 West Wacker Drive
Chicago, IL 60606-1286
(800) 257-8787
www.nuveen.com
XXX-0813
EVERY SHAREHOLDER’S VOTE IS IMPORTANT
| | | | |
| | EASY VOTING OPTIONS: |
| | |
| |  | | VOTE ON THE INTERNET Log on to: www.proxy-direct.com Follow the on-screen instructions available 24 hours |
| | |
| |  | | VOTE BY PHONE Call 1-800- - Follow the recorded instructions available 24 hours |
| | |
| |  | | VOTE BY MAIL Vote, sign and date this Proxy Card and return in the postage-paid envelope |
| | |
| |  | | VOTE IN PERSON Attend Shareholder Meeting 333 West Wacker Dr. Chicago, IL 60606 on , 2013 |
Please detach at perforation before mailing.
| | | | |
| PROXY | | NUVEEN MID CAP SELECT FUND SPECIAL MEETING OF SHAREHOLDERS TO BE HELD ON , 2013 | | PROXY |
THIS PROXY IS BEING SOLICITED BY THE BOARD OF DIRECTORS. The undersigned shareholder(s) of the Nuveen Mid Cap Select Fund, revoking previous proxies, hereby appoints Kevin J. McCarthy, Kathleen Prudhomme and Christopher Rohrbacher, or any one of them true and lawful attorneys with power of substitution of each, to vote all shares of Nuveen Mid Cap Select Fund which the undersigned is entitled to vote, at the Special Meeting of Shareholders to be held on , 2013, at : p.m. Central time, at the offices of Nuveen Investments, Inc., 333 West Wacker Drive, Chicago, Illinois, 60606, and at any adjournment or postponement thereof as indicated on the reverse side. In their discretion, the proxy holders named above are authorized to vote upon such other matters as may properly come before the meeting.
Receipt of the Notice of the Special Meeting and the accompanying Proxy Statement/Prospectus is hereby acknowledged. The shares of Nuveen Mid Cap Select Fund represented hereby will be voted as indicated or FOR the proposal if no choice is indicated.
| | | | | | | | |
| | | | VOTE VIA THE INTERNET: www.proxy-direct.com |
| | | | VOTE VIA THE TELEPHONE: 1-800- - |
| | | | | | | | |
| | | | Note: Please sign exactly as your name(s) appear(s) on this card. When signing as attorney, executor, administrator, trustee, guardian or as custodian for a minor, please sign your name and give your full title as such. If signing on behalf of a corporation, please sign the full corporate name and your name and indicate your title. If you are a partner signing for a partnership, please sign the partnership name, your name and indicate your title. Joint owners should each sign these instructions. Please sign, date and return. |
| | | | |
| | | | Signature and Title, if applicable |
| | | | |
| | | | Signature (if held jointly) |
| | | | |
| | | | Date [CFS Doc Code] |
EVERY SHAREHOLDER’S VOTE IS IMPORTANT
Important Notice Regarding the Availability of Proxy Materials for the
Nuveen Mid Cap Select Fund
Shareholders Meeting to Be Held on , 2013.
The Proxy Statement and Proxy Card for this meeting are available at: www.proxy-direct.com/nuv
IF YOU VOTE ON THE INTERNET OR BY TELEPHONE,
YOU NEED NOT RETURN THIS PROXY CARD
Please detach at perforation before mailing.
The Board of Directors recommends a vote “FOR” the following proposal.
| | | | |
TO VOTE, MARK BLOCKS BELOW IN BLUE OR BLACK INK. Example: | | ¡ | | |
| | | | | | | | |
| | | | FOR | | AGAINST | | ABSTAIN |
| 1. | | To approve an Agreement and Plan of Reorganization (and the related transactions) which provides for (i) the transfer of all the assets of Nuveen Mid Cap Select Fund (the “Target Fund”) to Nuveen Symphony Mid-Cap Core Fund (the “Acquiring Fund”) in exchange solely for shares of beneficial interest of the Acquiring Fund and the assumption by the Acquiring Fund of all the liabilities of the Target Fund; and (ii) the distribution by the Target Fund of all the shares of each class of the Acquiring Fund to the holders of shares of the corresponding class of the Target Fund in complete liquidation and termination of the Target Fund (the “Reorganization”). A vote in favor of the Reorganization will be considered a vote in favor of an amendment to the Corporation’s Articles of Incorporation effecting the Reorganization. | | ¨ | | ¨ | | ¨ |
| | | | |
| 2. | | To transact such other business as may properly come before the Special Meeting or any adjournment or postponement thereof. | | | | | | |
PLEASE SIGN AND DATE ON THE REVERSE SIDE
[CFS Doc Code]
Mutual Funds
Prospectus
January 31, 2013, as supplemented May 31, 2013
Nuveen Equity Funds
For investors seeking long-term capital appreciation.
| | | | | | | | |
| | | Class / Ticker Symbol |
| | | | |
| Fund Name | | Class A | | Class C | | Class R3 | | Class I |
Nuveen Symphony International Equity Fund | | NSIAX | | NSECX | | NSREX | | NSIEX |
Nuveen Symphony Large-Cap Growth Fund | | NCGAX | | NCGCX | | NSGQX | | NSGIX |
Nuveen Symphony Low Volatility Equity Fund | | NOPAX | | NOPCX | | — | | NOPRX |
Nuveen Symphony Mid-Cap Core Fund | | NCCAX | | NCCCX | | NMCRX | | NCCIX |
The Securities and Exchange Commission has not approved or disapproved these securities or passed upon the adequacy of this prospectus. Any representation to the contrary is a criminal offense.
Table of Contents
NOT FDIC OR GOVERNMENT INSURED MAY LOSE VALUE NO BANK GUARANTEE
Section 1 Fund Summaries
Nuveen Symphony International Equity Fund
Investment Objective
The investment objective of the Fund is to seek long-term capital appreciation.
Fees and Expenses of the Fund
This table describes the fees and expenses that you may pay if you buy and hold shares of the Fund. You may qualify for sales charge discounts if you and your family invest, or agree to invest in the future, at least $50,000 in the Fund or in other Nuveen Mutual Funds. More information about these and other discounts, as well as eligibility requirements for each share class, is available from your financial advisor and in “What Share Classes We Offer” on page 26 of the Fund’s prospectus, “How to Reduce Your Sales Charge” on page 28 of the prospectus and “Purchase and Redemption of Fund Shares” on page S-55 of the Fund’s statement of additional information.
Shareholder Fees
(fees paid directly from your investment)
| | | | | | | | | | | | | | | | |
| | | Class A | | | Class C | | | Class R3 | | | Class I | |
| Maximum Sales Charge (Load) Imposed on Purchases (as a percentage of offering price) | | | 5.75% | | | | None | | | | None | | | | None | |
Maximum Deferred Sales Charge (Load)
(as a percentage of the lesser of purchase price or redemption proceeds)1 | | | None | | | | 1.00% | | | | None | | | | None | |
| Maximum Sales Charge (Load) Imposed on Reinvested Dividends | | | None | | | | None | | | | None | | | | None | |
| Exchange Fee | | | None | | | | None | | | | None | | | | None | |
| Annual Low Balance Account Fee (for accounts under $1,000)2 | | | $15 | | | | $15 | | | | None | | | | $15 | |
| | | | |
| Annual Fund Operating Expenses | | | | | | | | | | | | | | | | |
| (expenses that you pay each year as a percentage of the value of your investment) | |
| | | Class A | | | Class C | | | Class R3 | | | Class I | |
| Management Fees | | | 0.77% | | | | 0.77% | | | | 0.77% | | | | 0.77% | |
| Distribution and/or Service (12b-1) Fees | | | 0.25% | | | | 1.00% | | | | 0.50% | | | | 0.00% | |
| Other Expenses3 | | | 8.33% | | | | 7.87% | | | | 6.86% | | | | 5.54% | |
| Acquired Fund Fees and Expenses | | | 0.01% | | | | 0.01% | | | | 0.01% | | | | 0.01% | |
| Total Annual Fund Operating Expenses | | | 9.36% | | | | 9.65% | | | | 8.14% | | | | 6.32% | |
| Fee Waivers and/or Expense Reimbursements4 | | | (8.00)% | | | | (7.54)% | | | | (6.53)% | | | | (5.21)% | |
| Total Annual Fund Operating Expenses After Fee Waivers and/or Expense Reimbursements | | | 1.36% | | | | 2.11% | | | | 1.61% | | | | 1.11% | |
| 1 | The contingent deferred sales charge on Class C shares applies only to redemptions within 12 months of purchase. |
| 2 | Fee applies to the following types of accounts under $1,000 held directly with the Fund: individual retirement accounts (IRAs), Coverdell Education Savings Accounts and accounts established pursuant to the Uniform Transfers to Minors Act (UTMA) or Uniform Gifts to Minors Act (UGMA). |
| 3 | Other Expenses have been restated to reflect current contractual fees. |
| 4 | The Fund’s investment adviser has agreed to waive fees and/or reimburse expenses through January 31, 2014 so that Total Annual Fund Operating Expenses (excluding 12b-1 distribution and/or service fees, interest expenses, taxes, acquired fund fees and expenses, fees incurred in acquiring and disposing of portfolio securities and extraordinary expenses) do not exceed 1.13% (1.38% after January 31, 2014) of the average daily net assets of any class of Fund shares. The expense limitation expiring January 31, 2014 may be terminated or modified prior to that date only with the approval of the Board of Trustees of the Fund. The expense limitation in effect thereafter may be terminated or modified only with the approval of shareholders of the Fund. |
Example
The following example is intended to help you compare the cost of investing in the Fund with the cost of investing in other mutual funds. The example assumes that you invest $10,000 in the Fund for the time periods indicated and then either redeem or do not redeem your shares at the end of a period. The example also assumes that your investment
2
Section 1 Fund Summaries
has a 5% return each year and that the Fund’s operating expenses are at the applicable expense limitation. Although your actual costs may be higher or lower, based on these assumptions your costs would be:
| | | | | | | | | | | | | | | | | | | | | | | | | | | | | | | | | | | | |
| | | Redemption | | | | | No Redemption | | | |
| | | A | | | C | | | R3 | | | I | | | | | A | | | C | | | R3 | | | I | | | |
| 1 Year | | $ | 706 | | | $ | 214 | | | $ | 164 | | | $ | 113 | | | | | $ | 706 | | | $ | 214 | | | $ | 164 | | | $ | 113 | | | |
| 3 Years | | $ | 1,031 | | | $ | 713 | | | $ | 561 | | | $ | 406 | | | | | $ | 1,031 | | | $ | 713 | | | $ | 561 | | | $ | 406 | | | |
| 5 Years | | $ | 1,379 | | | $ | 1,238 | | | $ | 983 | | | $ | 721 | | | | | $ | 1,379 | | | $ | 1,238 | | | $ | 983 | | | $ | 721 | | | |
| 10 Years | | $ | 2,356 | | | $ | 2,677 | | | $ | 2,159 | | | $ | 1,613 | | | | | $ | 2,356 | | | $ | 2,677 | | | $ | 2,159 | | | $ | 1,613 | | | |
Portfolio Turnover
The Fund pays transaction costs, such as commissions, when it buys and sells securities (or “turns over” its portfolio). A higher portfolio turnover rate may indicate higher transaction costs and may result in higher taxes when Fund shares are held in a taxable account. These costs, which are not reflected in annual fund operating expenses or in the example, affect the Fund’s performance. During the most recent fiscal year, the Fund’s portfolio turnover rate was 22% of the average value of its portfolio.
Principal Investment Strategies
Under normal market conditions, the Fund invests at least 80% of the sum of its net assets and the amount of any borrowings for investment purposes in equity securities, and at least 80% of its net assets in non-U.S. equity securities. The Fund primarily invests in developed countries, but it may invest up to 15% of its net assets in equity securities of companies located in emerging market countries.
The goal of the portfolio construction process is to build a well-diversified portfolio that reflects the Fund’s benchmark, the MSCI EAFE Index, in terms of its risk characteristics and that simultaneously seeks to generate a return in excess of that benchmark. The sub-adviser’s investment process begins by identifying candidates with excess return potential from two complementary, separate sources: quantitative analysis and fundamental analysis. Investment ideas from these sources then undergo rigorous fundamental analysis. Through this bottom up stock selection process, the team seeks to identify companies likely to outperform their industry peers in the MSCI EAFE Index. Quantitative tools are used to optimize pre-determined risk factors and upside potential within set parameters, with ultimate allocation decisions made by the portfolio management team. Individual positions and risk parameters are continually monitored. A security will typically be sold when its risk/return profile becomes unattractive compared with other securities in the investment universe.
Principal Risks
The value of your investment in this Fund will change daily, which means you could lose money. An investment in the Fund is not a deposit of a bank and is not insured or guaranteed by the Federal Deposit Insurance Corporation or any other government agency. The principal risks of investing in the Fund include:
Equity Security Risk—Equity securities may decline significantly in price over short or extended periods of time, and such declines may occur in the equity market as a whole, or they may occur in only a particular country, company, industry, or sector of the market.
Non-U.S./Emerging Markets Risk—Non-U.S. issuers or U.S. issuers with significant non-U.S. operations may be subject to risks in addition to those of issuers located in or that principally operate in the United States as a result of, among other things, political, social and economic developments abroad and different legal, regulatory and tax environments. These additional risks may be heightened for securities of issuers located in, or with significant operations in, emerging market countries. Also, changes in currency exchange rates may affect the Fund’s net asset value, the value of dividends and interest earned, and gains and losses realized on the sale of securities.
Smaller Company Risk—Small-cap stocks involve substantial risk. Prices of small-cap stocks may be subject to more abrupt or erratic movements, and to wider fluctuations, than stock prices of larger, more established companies or the market averages in general. It may be difficult to sell small-cap stocks at the desired time and price. While mid-cap stocks may be slightly less volatile than small-cap stocks, they still involve similar risks.
Section 1 Fund Summaries
3
Fund Performance
The following bar chart and table provide some indication of the potential risks of investing in the Fund. The Fund’s past performance (before and after taxes) is not necessarily an indication of how the Fund will perform in the future. Updated performance information is available at www.nuveen.com/performance or by calling (800) 257-8787.
The bar chart below shows the variability of the Fund’s performance from year to year for Class A shares. The performance of the other share classes will differ due to their different expense structures. The bar chart and highest/lowest quarterly returns that follow do not reflect sales charges, and if these charges were reflected, the returns would be less than those shown.
Class A Annual Total Return
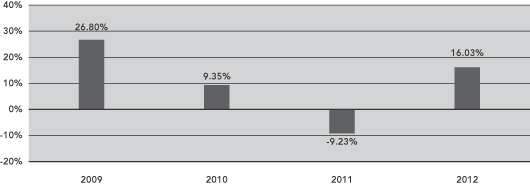
During the four-year period ended December 31, 2012, the Fund’s highest and lowest quarterly returns were 19.94% and -20.37%, respectively, for the quarters ended June 30, 2009 and September 30, 2011.
The table below shows the variability of the Fund’s average annual returns and how they compare over the time periods indicated with those of a broad measure of market performance and an index of funds with similar investment objectives. Class R3 shares commenced operations on October 5, 2010. The returns for Class R3 shares shown below reflect Class I performance prior to October 5, 2010 adjusted for the difference in fees between the classes. All after-tax returns are calculated using the historical highest individual federal marginal income tax rates and do not reflect the impact of state and local taxes. After-tax returns are shown for Class A shares only; after-tax returns for other share classes will vary. Your own actual after-tax returns will depend on your specific tax situation and may differ from what is shown here. After-tax returns are not relevant to investors who hold Fund shares in tax-deferred accounts such as IRAs or employer-sponsored retirement plans.
Both the bar chart and the table assume that all distributions have been reinvested. Performance reflects fee waivers, if any, in effect during the periods presented. If any such waivers were not in place, returns would be reduced.
| | | | | | |
| | | Average Annual Total Returns
for the Periods Ended
December 31, 2012 |
| | | 1 Year | | | Since Inception
(May 30, 2008) |
| Class A (return before taxes) | | | 9.33 | % | | (5.06)% |
| Class A (return after taxes on distributions) | | | 9.27 | % | | (5.23)% |
| Class A (return after taxes on distributions and sale of Fund shares) | | | 6.14 | % | | (4.25)% |
| Class C (return before taxes) | | | 15.08 | % | | (4.54)% |
| Class R3 (return before taxes) | | | 15.70 | % | | (4.05)% |
| Class I (return before taxes) | | | 16.32 | % | | (3.57)% |
| MSCI EAFE Index (reflects no deduction for fees, expenses or taxes) | | | 17.32 | % | | (3.37)% |
| Lipper International Multi-Cap Growth Classification Average (reflects no deduction for taxes or certain expenses) | | | 18.03 | % | | (2.67)% |
4
Section 1 Fund Summaries
Management
Investment Adviser
Nuveen Fund Advisors, LLC
Sub-Adviser
Symphony Asset Management LLC
Portfolio Managers
| | | | |
Name | | Title | | Portfolio Manager of Fund Since |
| Gunther Stein | | Chief Executive Officer and Chief Investment Officer | | June 2010 |
| Ross Sakamoto | | Co-Director of Equity | | July 2010 |
| Joel Drescher | | Co-Director of Equity | | June 2012 |
Purchase and Sale of Fund Shares
You may purchase, redeem or exchange shares of the Fund on any business day, which is any day the New York Stock Exchange is open for business. You may purchase, redeem or exchange shares of the Fund either through a financial advisor or other financial intermediary or directly from the Fund. The Fund’s initial and subsequent investment minimums generally are as follows, although the Fund may reduce or waive the minimums in some cases:
| | | | | | |
| | | Class A and Class C | | Class R3 | | Class I |
| Eligibility and Minimum Initial Investment | | $3,000 for all accounts except: •$2,500 for Traditional/Roth IRA accounts. •$2,000 for Coverdell Education Savings Accounts. •$250 for accounts opened through fee-based programs. •No minimum for retirement plans. | | Available only through certain retirement plans. No minimum. | | Available only through fee-based programs and certain retirement plans, and to other limited categories of investors as described in the prospectus. $100,000 for all accounts except: •$250 for clients of financial intermediaries and family offices that have accounts holding Class I shares with an aggregate value of at least $100,000 (or that are expected to reach this level). •No minimum for eligible retirement plans and certain other categories of eligible investors as described in the prospectus. |
| Minimum Additional Investment | | $100 | | No minimum. | | No minimum. |
Tax Information
The Fund’s distributions are taxable and will generally be taxed as ordinary income or capital gains, unless you are investing through a tax-deferred account, such as an IRA or 401(k) plan.
Payments to Broker-Dealers and Other Financial Intermediaries
If you purchase shares of the Fund through a broker-dealer or other financial intermediary (such as a bank or financial advisor), the Fund, its distributor or its investment adviser may pay the intermediary for the sale of Fund shares and related services. These payments may create a conflict of interest by influencing the broker-dealer or other financial intermediary and your salesperson to recommend the Fund over another investment. Ask your financial advisor or visit your financial intermediary’s website for more information.
Section 1 Fund Summaries
5
Nuveen Symphony Large-Cap Growth Fund
Investment Objective
The investment objective of the Fund is to seek long-term capital appreciation.
Fees and Expenses of the Fund
This table describes the fees and expenses that you may pay if you buy and hold shares of the Fund. You may qualify for sales charge discounts if you and your family invest, or agree to invest in the future, at least $50,000 in the Fund or in other Nuveen Mutual Funds. More information about these and other discounts, as well as eligibility requirements for each share class, is available from your financial advisor and in “What Share Classes We Offer” on page 26 of the Fund’s prospectus, “How to Reduce Your Sales Charge” on page 28 of the prospectus and “Purchase and Redemption of Fund Shares” on page S-55 of the Fund’s statement of additional information.
Shareholder Fees
(fees paid directly from your investment)
| | | | | | | | | | | | | | | | |
| | | Class A | | | Class C | | | Class R3 | | | Class I | |
| Maximum Sales Charge (Load) Imposed on Purchases (as a percentage of offering price) | | | 5.75% | | | | None | | | | None | | | | None | |
Maximum Deferred Sales Charge (Load)
(as a percentage of the lesser of purchase price or redemption proceeds)1 | | | None | | | | 1.00% | | | | None | | | | None | |
| Maximum Sales Charge (Load) Imposed on Reinvested Dividends | | | None | | | | None | | | | None | | | | None | |
| Exchange Fee | | | None | | | | None | | | | None | | | | None | |
| Annual Low Balance Account Fee (for accounts under $1,000)2 | | | $15 | | | | $15 | | | | None | | | | $15 | |
| | | | |
Annual Fund Operating Expenses (expenses that you pay each year as a percentage of the value of your investment) | | | | | | | | | | | | |
| | | Class A | | | Class C | | | Class R3 | | | Class I | |
| Management Fees | | | 0.67% | | | | 0.67% | | | | 0.67% | | | | 0.67% | |
| Distribution and/or Service (12b-1) Fees | | | 0.25% | | | | 1.00% | | | | 0.50% | | | | 0.00% | |
| Other Expenses3 | | | 0.86% | | | | 0.89% | | | | 0.81% | | | | 0.93% | |
| Total Annual Fund Operating Expenses | | | 1.78% | | | | 2.56% | | | | 1.98% | | | | 1.60% | |
| Fee Waivers and/or Expense Reimbursements4 | | | (0.56)% | | | | (0.59)% | | | | (0.51)% | | | | (0.63)% | |
| Total Annual Fund Operating Expenses After Fee Waivers and/or Expense Reimbursements | | | 1.22% | | | | 1.97% | | | | 1.47% | | | | 0.97% | |
| 1 | The contingent deferred sales charge on Class C shares applies only to redemptions within 12 months of purchase. |
| 2 | Fee applies to the following types of accounts under $1,000 held directly with the Fund: individual retirement accounts (IRAs), Coverdell Education Savings Accounts and accounts established pursuant to the Uniform Transfers to Minors Act (UTMA) or Uniform Gifts to Minors Act (UGMA). |
| 3 | Other Expenses have been restated to reflect current contractual fees. |
| 4 | The Fund’s investment adviser has agreed to waive fees and/or reimburse expenses through January 31, 2014 so that Total Annual Fund Operating Expenses (excluding 12b-1 distribution and/or service fees, interest expenses, taxes, acquired fund fees and expenses, fees incurred in acquiring and disposing of portfolio securities and extraordinary expenses) do not exceed 1.00% (1.35% after January 31, 2014) of the average daily net assets of any class of Fund shares. The expense limitation expiring January 31, 2014 may be terminated or modified prior to that date only with the approval of the Board of Trustees of the Fund. The expense limitation in effect thereafter may be terminated or modified only with the approval of shareholders of the Fund. |
6
Section 1 Fund Summaries
Example
The following example is intended to help you compare the cost of investing in the Fund with the cost of investing in other mutual funds. The example assumes that you invest $10,000 in the Fund for the time periods indicated and then either redeem or do not redeem your shares at the end of a period. The example also assumes that your investment has a 5% return each year and that the Fund’s operating expenses are at the applicable expense limitation. Although your actual costs may be higher or lower, based on these assumptions your costs would be:
| | | | | | | | | | | | | | | | | | | | | | | | | | | | | | | | | | | | |
| | | Redemption | | | | | No Redemption | | | |
| | | A | | | C | | | R3 | | | I | | | | | A | | | C | | | R3 | | | I | | | |
| 1 Year | | $ | 692 | | | $ | 200 | | | $ | 150 | | | $ | 99 | | | | | $ | 692 | | | $ | 200 | | | $ | 150 | | | $ | 99 | | | |
| 3 Years | | $ | 1,010 | | | $ | 691 | | | $ | 539 | | | $ | 384 | | | | | $ | 1,010 | | | $ | 691 | | | $ | 539 | | | $ | 384 | | | |
| 5 Years | | $ | 1,350 | | | $ | 1,209 | | | $ | 953 | | | $ | 690 | | | | | $ | 1,350 | | | $ | 1,209 | | | $ | 953 | | | $ | 690 | | | |
| 10 Years | | $ | 2,307 | | | $ | 2,629 | | | $ | 2,109 | | | $ | 1,560 | | | | | $ | 2,307 | | | $ | 2,629 | | | $ | 2,109 | | | $ | 1,560 | | | |
Portfolio Turnover
The Fund pays transaction costs, such as commissions, when it buys and sells securities (or “turns over” its portfolio). A higher portfolio turnover rate may indicate higher transaction costs and may result in higher taxes when Fund shares are held in a taxable account. These costs, which are not reflected in annual fund operating expenses or in the example, affect the Fund’s performance. During the most recent fiscal year, the Fund’s portfolio turnover rate was 106% of the average value of its portfolio.
Principal Investment Strategies
Under normal market conditions, the Fund invests at least 80% of the sum of its net assets and the amount of any borrowings for investment purposes in equity securities of companies with market capitalizations at the time of investment comparable to companies in the Russell 1000® Growth Index. The Fund will not be forced to sell a security because a company has exceeded or fallen below the current market capitalization range.
The goal of the portfolio construction process is to build a well-diversified portfolio that reflects the Fund’s benchmark, the Russell 1000® Growth Index, in terms of its risk characteristics and that simultaneously seeks to generate a return in excess of that benchmark. The sub-adviser’s investment process begins by identifying candidates with excess return potential from two complementary, separate sources: quantitative analysis and fundamental analysis. Investment ideas from these sources then undergo rigorous fundamental analysis. Through this bottom up stock selection process, the team seeks to identify companies likely to outperform their industry peers in the Russell 1000® Growth Index. Quantitative tools are used to optimize pre-determined risk factors and upside potential within set parameters, with ultimate allocation decisions made by the portfolio management team. Individual positions and risk parameters are continually monitored. A security will typically be sold when its risk/return profile becomes unattractive compared with other securities in the investment universe.
Principal Risks
The value of your investment in this Fund will change daily, which means you could lose money. An investment in the Fund is not a deposit of a bank and is not insured or guaranteed by the Federal Deposit Insurance Corporation or any other government agency. The principal risks of investing in the Fund include:
Equity Security Risk—Equity securities may decline significantly in price over short or extended periods of time, and such declines may occur in the equity market as a whole, or they may occur in only a particular country, company, industry, or sector of the market.
Investment Focus Risk—Different types of stocks tend to shift in and out of favor depending on market and economic conditions. The Fund emphasizes a growth style of investing and therefore seeks companies experiencing high rates of current growth; such companies may be more volatile than other types of investments. Furthermore, because the Fund focuses its investments in large-cap stocks, the Fund may not benefit from gains in smaller cap sectors of the market.
Section 1 Fund Summaries
7
Fund Performance
The following bar chart and table provide some indication of the potential risks of investing in the Fund. The Fund’s past performance (before and after taxes) is not necessarily an indication of how the Fund will perform in the future. Updated performance information is available at www.nuveen.com/performance or by calling (800) 257-8787.
The bar chart below shows the variability of the Fund’s performance from year to year for Class A shares. The performance of the other share classes will differ due to their different expense structures. The bar chart and highest/lowest quarterly returns that follow do not reflect sales charges, and if these charges were reflected, the returns would be less than those shown.
Class A Annual Total Return
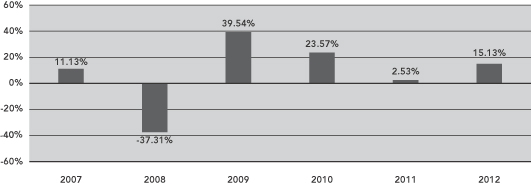
During the six-year period ended December 31, 2012, the Fund’s highest and lowest quarterly returns were 17.05% and -23.09%, respectively, for the quarters ended March 31, 2012 and December 31, 2008.
The table below shows the variability of the Fund’s average annual returns and how they compare over the time periods indicated with those of a broad measure of market performance and an index of funds with similar investment objectives. Class R3 shares commenced operations on September 29, 2009. The returns for Class R3 shares shown below reflect Class I performance prior to September 29, 2009 adjusted for the difference in fees between the classes. All after-tax returns are calculated using the historical highest individual federal marginal income tax rates and do not reflect the impact of state and local taxes. After-tax returns are shown for Class A shares only; after-tax returns for other share classes will vary. Your own actual after-tax returns will depend on your specific tax situation and may differ from what is shown here. After-tax returns are not relevant to investors who hold Fund shares in tax-deferred accounts such as IRAs or employer-sponsored retirement plans.
Both the bar chart and the table assume that all distributions have been reinvested. Performance reflects fee waivers, if any, in effect during the periods presented. If any such waivers were not in place, returns would be reduced.
| | | | | | | | | | |
| | | Average Annual Total Returns
for the Periods Ended
December 31, 2012 |
| | | 1 Year | | | 5 Years | | | Since Inception
(December 15, 2006) |
| Class A (return before taxes) | | | 8.51 | % | | | 3.76 | % | | 4.65% |
| Class A (return after taxes on distributions) | | | 8.36 | % | | | 3.38 | % | | 4.31% |
| Class A (return after taxes on distributions and sale of Fund shares) | | | 5.72 | % | | | 3.17 | % | | 3.95% |
| Class C (return before taxes) | | | 14.27 | % | | | 4.22 | % | | 4.90% |
| Class R3 (return before taxes) | | | 14.82 | % | | | 4.72 | % | | 5.40% |
| Class I (return before taxes) | | | 15.41 | % | | | 5.24 | % | | 5.94% |
| Russell 1000® Growth Index (reflects no deduction for fees, expenses or taxes) | | | 15.26 | % | | | 3.12 | % | | 4.31% |
| Lipper Multi-Cap Growth Classification Average (reflects no deduction for taxes or certain expenses) | | | 15.25 | % | | | 0.94 | % | | 3.06% |
8
Section 1 Fund Summaries
Management
Investment Adviser
Nuveen Fund Advisors, LLC
Sub-Adviser
Symphony Asset Management LLC
Portfolio Managers
| | | | |
Name | | Title | | Portfolio Manager of Fund Since |
| Gunther Stein | | Chief Executive Officer and Chief Investment Officer | | June 2010 |
| Ross Sakamoto | | Co-Director of Equity | | July 2010 |
| Joel Drescher | | Co-Director of Equity | | June 2012 |
Purchase and Sale of Fund Shares
You may purchase, redeem or exchange shares of the Fund on any business day, which is any day the New York Stock Exchange is open for business. You may purchase, redeem or exchange shares of the Fund either through a financial advisor or other financial intermediary or directly from the Fund. The Fund’s initial and subsequent investment minimums generally are as follows, although the Fund may reduce or waive the minimums in some cases:
| | | | | | |
| | | Class A and Class C | | Class R3 | | Class I |
| Eligibility and Minimum Initial Investment | | $3,000 for all accounts except: •$2,500 for Traditional/Roth IRA accounts. •$2,000 for Coverdell Education Savings Accounts. •$250 for accounts opened through fee-based programs. •No minimum for retirement plans. | | Available only through certain retirement plans. No minimum. | | Available only through fee-based programs and certain retirement plans, and to other limited categories of investors as described in the prospectus. $100,000 for all accounts except: •$250 for clients of financial intermediaries and family offices that have accounts holding Class I shares with an aggregate value of at least $100,000 (or that are expected to reach this level). •No minimum for eligible retirement plans and certain other categories of eligible investors as described in the prospectus. |
| Minimum Additional Investment | | $100 | | No minimum. | | No minimum. |
Tax Information
The Fund’s distributions are taxable and will generally be taxed as ordinary income or capital gains, unless you are investing through a tax-deferred account, such as an IRA or 401(k) plan.
Payments to Broker-Dealers and Other Financial Intermediaries
If you purchase shares of the Fund through a broker-dealer or other financial intermediary (such as a bank or financial advisor), the Fund, its distributor or its investment adviser may pay the intermediary for the sale of Fund shares and related services. These payments may create a conflict of interest by influencing the broker-dealer or other financial intermediary and your salesperson to recommend the Fund over another investment. Ask your financial advisor or visit your financial intermediary’s website for more information.
Section 1 Fund Summaries
9
Nuveen Symphony Low Volatility Equity Fund
(formerly Nuveen Symphony Optimized Alpha Fund)
Investment Objective
The investment objective of the Fund is to seek long-term capital appreciation with lower absolute volatility than the broad equity market.
Fees and Expenses of the Fund
This table describes the fees and expenses that you may pay if you buy and hold shares of the Fund. You may qualify for sales charge discounts if you and your family invest, or agree to invest in the future, at least $50,000 in the Fund or in other Nuveen Mutual Funds. More information about these and other discounts, as well as eligibility requirements for each share class, is available from your financial advisor and in “What Share Classes We Offer” on page 26 of the Fund’s prospectus, “How to Reduce Your Sales Charge” on page 28 of the prospectus and “Purchase and Redemption of Fund Shares” on page S-55 of the Fund’s statement of additional information.
Shareholder Fees
(fees paid directly from your investment)
| | | | | | | | | | | | |
| | | Class A | | | Class C | | | Class I | |
Maximum Sales Charge (Load) Imposed on Purchases
(as a percentage of offering price) | | | 5.75% | | | | None | | | | None | |
Maximum Deferred Sales Charge (Load)
(as a percentage of the lesser of purchase price or redemption proceeds)1 | | | None | | | | 1.00% | | | | None | |
| Maximum Sales Charge (Load) Imposed on Reinvested Dividends | | | None | | | | None | | | | None | |
| Exchange Fee | | | None | | | | None | | | | None | |
| Annual Low Balance Account Fee (for accounts under $1,000)2 | | | $15 | | | | $15 | | | | $15 | |
Annual Fund Operating Expenses (expenses that you pay each year as a percentage of the value of your investment) | | | | | | | | | |
| | | Class A | | | Class C | | | Class I | |
| Management Fees | | | 0.67% | | | | 0.67% | | | | 0.67% | |
| Distribution and/or Service (12b-1) Fees | | | 0.25% | | | | 1.00% | | | | 0.00% | |
| Other Expenses3 | | | 3.07% | | | | 3.86% | | | | 2.59% | |
| Total Annual Fund Operating Expenses | | | 3.99% | | | | 5.53% | | | | 3.26% | |
| Fee Waivers and/or Expense Reimbursements4 | | | (2.76)% | | | | (3.55)% | | | | (2.28)% | |
| Total Annual Fund Operating Expenses After Fee Waivers and/or Expense Reimbursements | | | 1.23% | | | | 1.98% | | | | 0.98% | |
| 1 | The contingent deferred sales charge on Class C shares applies only to redemptions within 12 months of purchase. |
| 2 | Fee applies to the following types of accounts under $1,000 held directly with the Fund: individual retirement accounts (IRAs), Coverdell Education Savings Accounts and accounts established pursuant to the Uniform Transfers to Minors Act (UTMA) or Uniform Gifts to Minors Act (UGMA). |
| 3 | Other Expenses have been restated to reflect current contractual fees. |
| 4 | The Fund’s investment adviser has agreed to waive fees and/or reimburse expenses through January 31, 2014 so that Total Annual Fund Operating Expenses (excluding 12b-1 distribution and/or service fees, interest expenses, taxes, acquired fund fees and expenses, fees incurred in acquiring and disposing of portfolio securities and extraordinary expenses) do not exceed 1.00% (1.45% after January 31, 2014) of the average daily net assets of any class of Fund shares. The expense limitation expiring January 31, 2014 may be terminated or modified prior to that date only with the approval of the Board of Trustees of the Fund. The expense limitation in effect thereafter may be terminated or modified only with the approval of shareholders of the Fund. |
Example
The following example is intended to help you compare the cost of investing in the Fund with the cost of investing in other mutual funds. The example assumes that you invest $10,000 in the Fund for the time periods indicated and then either redeem or do not redeem your shares at the end of a period. The example also assumes that your investment
10
Section 1 Fund Summaries
has a 5% return each year and that the Fund’s operating expenses are at the applicable expense limitation. Although your actual costs may be higher or lower, based on these assumptions your costs would be:
| | | | | | | | | | | | | | | | | | | | | | | | | | | | |
| | | Redemption | | | | | No Redemption | | | |
| | | A | | | C | | | I | | | | | A | | | C | | | I | | | |
| 1 Year | | $ | 693 | | | $ | 201 | | | $ | 100 | | | | | $ | 693 | | | $ | 201 | | | $ | 100 | | | |
| 3 Years | | $ | 1,033 | | | $ | 715 | | | $ | 408 | | | | | $ | 1,033 | | | $ | 715 | | | $ | 408 | | | |
| 5 Years | | $ | 1,395 | | | $ | 1,255 | | | $ | 739 | | | | | $ | 1,395 | | | $ | 1,255 | | | $ | 739 | | | |
| 10 Years | | $ | 2,412 | | | $ | 2,732 | | | $ | 1,674 | | | | | $ | 2,412 | | | $ | 2,732 | | | $ | 1,674 | | | |
Portfolio Turnover
The Fund pays transaction costs, such as commissions, when it buys and sells securities (or “turns over” its portfolio). A higher portfolio turnover rate may indicate higher transaction costs and may result in higher taxes when Fund shares are held in a taxable account. These costs, which are not reflected in annual fund operating expenses or in the example, affect the Fund’s performance. During the most recent fiscal year, the Fund’s portfolio turnover rate was 85% of the average value of its portfolio.
Principal Investment Strategies
Under normal market conditions, the Fund invests at least 80% of the sum of its net assets and the amount of any borrowings for investment purposes in equity securities. The Fund may invest in companies of any size.
The Fund seeks to produce long-term returns superior to the market with lower absolute volatility. Volatility is one way to measure risk and, in this context, refers to the variability of the Fund’s or the market’s returns. Through stock selection and the use of risk controls, Symphony believes it can reduce volatility while preserving the Fund’s potential to generate returns in excess of the market over the long term. Symphony targets a volatility level that is 90% of the volatility of the Fund’s benchmark index, although there is no guarantee that this can be achieved.
The Fund is constructed from the sub-adviser’s best U.S. equity ideas in a way that seeks to provide the highest projected return per unit of volatility. This objective is pursued by selecting securities with favorable risk-adjusted return potential across diverse sectors of the market. The portfolio construction process seeks to optimally weight these securities in order to produce a portfolio with a defined level of market risk and the highest projected return for the risk taken.
Principal Risks
The value of your investment in this Fund will change daily, which means you could lose money. An investment in the Fund is not a deposit of a bank and is not insured or guaranteed by the Federal Deposit Insurance Corporation or any other government agency. The principal risks of investing in the Fund include:
Equity Security Risk—Even if the Fund is able to maintain a portfolio with lower volatility than the broad equity market, the Fund’s returns and the value of the Fund’s shares will be volatile. The Fund invests in equity securities, which are more volatile than certain other asset classes such as fixed income securities. Equity securities may decline significantly in price over short or extended periods of time, and such declines may occur in the equity market as a whole, or they may occur in only a particular country, company, industry, or sector of the market.
Investment Strategy Risk—In an attempt to construct a portfolio with lower absolute volatility than the broad equity market, historical data is used to produce a portfolio expected to have a defined level of market risk and the highest projected return for the risk taken. However, individual stock behavior may change in the future, and therefore there is no guarantee that this strategy will be successful.
Smaller Company Risk—Small-cap stocks involve substantial risk. Prices of small-cap stocks may be subject to more abrupt or erratic movements, and to wider fluctuations, than stock prices of larger, more established companies or the market averages in general. It may be difficult to sell small-cap stocks at the desired time and price. While mid-cap stocks may be slightly less volatile than small-cap stocks, they still involve similar risks.
Section 1 Fund Summaries
11
Fund Performance
The following bar chart and table provide some indication of the potential risks of investing in the Fund. The Fund’s past performance (before and after taxes) is not necessarily an indication of how the Fund will perform in the future. Updated performance information is available at www.nuveen.com/performance or by calling (800) 257-8787.
The bar chart below shows the variability of the Fund’s performance from year to year for Class A shares. The performance of the other share classes will differ due to their different expense structures. The bar chart and highest/lowest quarterly returns that follow do not reflect sales charges, and if these charges were reflected, the returns would be less than those shown.
Class A Annual Total Return
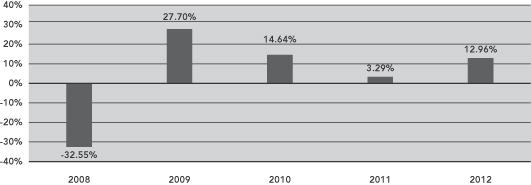
During the five-year period ended December 31, 2012, the Fund’s highest and lowest quarterly returns were 12.19% and -20.65%, respectively, for the quarters ended June 30, 2009 and December 31, 2008.
The table below shows the variability of the Fund’s average annual returns and how they compare over the time periods indicated with those of a broad measure of market performance and an index of funds with similar investment objectives. Previously, the Fund used the S&P 500 Index as its benchmark. Going forward, the Russell 1000 Index will be the Fund’s primary benchmark because it better reflects how the Fund is being managed. The S&P 500 Index will be a secondary benchmark for the Fund. All after-tax returns are calculated using the historical highest individual federal marginal income tax rates and do not reflect the impact of state and local taxes. After-tax returns are shown for Class A shares only; after-tax returns for other share classes will vary. Your own actual after-tax returns will depend on your specific tax situation and may differ from what is shown here. After-tax returns are not relevant to investors who hold Fund shares in tax-deferred accounts such as IRAs or employer-sponsored retirement plans.
Both the bar chart and the table assume that all distributions have been reinvested. Performance reflects fee waivers, if any, in effect during the periods presented. If any such waivers were not in place, returns would be reduced.
| | | | | | | | | | |
| | | Average Annual Total Returns
for the Periods Ended
December 31, 2012 |
| | | 1 Year | | | 5 Years | | | Since Inception
(September 28, 2007) |
| Class A (return before taxes) | | | 6.44 | % | | | 1.66 | % | | 1.19% |
| Class A (return after taxes on distributions) | | | 5.95 | % | | | 1.50 | % | | 1.04% |
| Class A (return after taxes on distributions and sale of Fund shares) | | | 4.84 | % | | | 1.40 | % | | 1.00% |
| Class C (return before taxes) | | | 12.04 | % | | | 2.09 | % | | 1.56% |
| Class I (return before taxes) | | | 13.19 | % | | | 3.12 | % | | 2.58% |
| Russell 1000® Index (reflects no deduction for fees, expenses or taxes) | | | 16.42 | % | | | 1.92 | % | | 1.19% |
| S&P 500® Index (reflects no deduction for fees, expenses or taxes) | | | 16.00 | % | | | 1.66 | % | | 0.93% |
| Lipper Large-Cap Core Classification Average (reflects no deduction for taxes or certain expenses) | | | 14.95 | % | | | 0.68 | % | | 0.13% |
12
Section 1 Fund Summaries
Management
Investment Adviser
Nuveen Fund Advisors, LLC
Sub-Adviser
Symphony Asset Management LLC
Portfolio Managers
| | | | |
Name | | Title | | Portfolio Manager of Fund Since |
| Gunther Stein | | Chief Executive Officer and Chief Investment Officer | | June 2010 |
| Ross Sakamoto | | Co-Director of Equity | | July 2010 |
| Joel Drescher | | Co-Director of Equity | | June 2012 |
Purchase and Sale of Fund Shares
You may purchase, redeem or exchange shares of the Fund on any business day, which is any day the New York Stock Exchange is open for business. You may purchase, redeem or exchange shares of the Fund either through a financial advisor or other financial intermediary or directly from the Fund. The Fund’s initial and subsequent investment minimums generally are as follows, although the Fund may reduce or waive the minimums in some cases:
| | | | |
| | | Class A and Class C | | Class I |
| Eligibility and Minimum Initial Investment | | $3,000 for all accounts except: •$2,500 for Traditional/Roth IRA accounts. •$2,000 for Coverdell Education Savings Accounts. •$250 for accounts opened through fee-based programs. •No minimum for retirement plans. | | Available only through fee-based programs and certain retirement plans, and to other limited categories of investors as described in the prospectus. $100,000 for all accounts except: •$250 for clients of financial intermediaries and family offices that have accounts holding Class I shares with an aggregate value of at least $100,000 (or that are expected to reach this level). •No minimum for eligible retirement plans and certain other categories of eligible investors as described in the prospectus. |
| Minimum Additional Investment | | $100 | | No minimum. |
Tax Information
The Fund’s distributions are taxable and will generally be taxed as ordinary income or capital gains, unless you are investing through a tax-deferred account, such as an IRA or 401(k) plan.
Payments to Broker-Dealers and Other Financial Intermediaries
If you purchase shares of the Fund through a broker-dealer or other financial intermediary (such as a bank or financial advisor), the Fund, its distributor or its investment adviser may pay the intermediary for the sale of Fund shares and related services. These payments may create a conflict of interest by influencing the broker-dealer or other financial intermediary and your salesperson to recommend the Fund over another investment. Ask your financial advisor or visit your financial intermediary’s website for more information.
Section 1 Fund Summaries
13
Nuveen Symphony Mid-Cap Core Fund
Investment Objective
The investment objective of the Fund is to seek long-term capital appreciation.
Fees and Expenses of the Fund
This table describes the fees and expenses that you may pay if you buy and hold shares of the Fund. You may qualify for sales charge discounts if you and your family invest, or agree to invest in the future, at least $50,000 in the Fund or in other Nuveen Mutual Funds. More information about these and other discounts, as well as eligibility requirements for each share class, is available from your financial advisor and in “What Share Classes We Offer” on page 26 of the Fund’s prospectus, “How to Reduce Your Sales Charge” on page 28 of the prospectus and “Purchase and Redemption of Fund Shares” on page S-55 of the Fund’s statement of additional information.
Shareholder Fees
(fees paid directly from your investment)
| | | | | | | | | | | | | | | | |
| | | Class A | | | Class C | | | Class R3 | | | Class I | |
| Maximum Sales Charge (Load) Imposed on Purchases (as a percentage of offering price) | | | 5.75% | | | | None | | | | None | | | | None | |
Maximum Deferred Sales Charge (Load)
(as a percentage of the lesser of purchase price or redemption proceeds)1 | | | None | | | | 1.00% | | | | None | | | | None | |
| Maximum Sales Charge (Load) Imposed on Reinvested Dividends | | | None | | | | None | | | | None | | | | None | |
| Exchange Fee | | | None | | | | None | | | | None | | | | None | |
| Annual Low Balance Account Fee (for accounts under $1,000)2 | | | $15 | | | | $15 | | | | None | | | | $15 | |
Annual Fund Operating Expenses
(expenses that you pay each year as a percentage of the value of your investment)
| | | | | | | | | | | | | | | | |
| | | Class A | | | Class C | | | Class R3 | | | Class I | |
| Management Fees | | | 0.72% | | | | 0.72% | | | | 0.72% | | | | 0.72% | |
| Distribution and/or Service (12b-1) Fees | | | 0.25% | | | | 1.00% | | | | 0.50% | | | | 0.00% | |
| Other Expenses3 | | | 3.07% | | | | 3.18% | | | | 3.09% | | | | 2.63% | |
| Total Annual Fund Operating Expenses | | | 4.04% | | | | 4.90% | | | | 4.31% | | | | 3.35% | |
| Fee Waivers and/or Expense Reimbursements4 | | | (2.67)% | | | | (2.78)% | | | | (2.69)% | | | | (2.23)% | |
| Total Annual Fund Operating Expenses After Fee Waivers and/or Expense Reimbursements | | | 1.37% | | | | 2.12% | | | | 1.62% | | | | 1.12% | |
| 1 | The contingent deferred sales charge on Class C shares applies only to redemptions within 12 months of purchase. |
| 2 | Fee applies to the following types of accounts under $1,000 held directly with the Fund: individual retirement accounts (IRAs), Coverdell Education Savings Accounts and accounts established pursuant to the Uniform Transfers to Minors Act (UTMA) or Uniform Gifts to Minors Act (UGMA). |
| 3 | Other Expenses have been restated to reflect current contractual fees. |
| 4 | The Fund’s investment adviser has agreed to waive fees and/or reimburse expenses through January 31, 2014 so that Total Annual Fund Operating Expenses (excluding 12b-1 distribution and/or service fees, interest expenses, taxes, acquired fund fees and expenses, fees incurred in acquiring and disposing of portfolio securities and extraordinary expenses) do not exceed 1.15% (1.40% after January 31, 2014) of the average daily net assets of any class of Fund shares. The expense limitation expiring January 31, 2014 may be terminated or modified prior to that date only with the approval of the Board of Trustees of the Fund. The expense limitation in effect thereafter may be terminated or modified only with the approval of shareholders of the Fund. |
14
Section 1 Fund Summaries
Example
The following example is intended to help you compare the cost of investing in the Fund with the cost of investing in other mutual funds. The example assumes that you invest $10,000 in the Fund for the time periods indicated and then either redeem or do not redeem your shares at the end of a period. The example also assumes that your investment has a 5% return each year and that the Fund’s operating expenses are at the applicable expense limitation. Although your actual costs may be higher or lower, based on these assumptions your costs would be:
| | | | | | | | | | | | | | | | | | | | | | | | | | | | | | | | | | | | |
| | | Redemption | | | | | No Redemption | | | |
| | | A | | | C | | | R3 | | | I | | | | | A | | | C | | | R3 | | | I | | | |
| 1 Year | | $ | 706 | | | $ | 215 | | | $ | 165 | | | $ | 114 | | | | | $ | 706 | | | $ | 215 | | | $ | 165 | | | $ | 114 | | | |
| 3 Years | | $ | 1,034 | | | $ | 716 | | | $ | 564 | | | $ | 409 | | | | | $ | 1,034 | | | $ | 716 | | | $ | 564 | | | $ | 409 | | | |
| 5 Years | | $ | 1,383 | | | $ | 1,243 | | | $ | 988 | | | $ | 726 | | | | | $ | 1,383 | | | $ | 1,243 | | | $ | 988 | | | $ | 726 | | | |
| 10 Years | | $ | 2,367 | | | $ | 2,687 | | | $ | 2,170 | | | $ | 1,625 | | | | | $ | 2,367 | | | $ | 2,687 | | | $ | 2,170 | | | $ | 1,625 | | | |
Portfolio Turnover
The Fund pays transaction costs, such as commissions, when it buys and sells securities (or “turns over” its portfolio). A higher portfolio turnover rate may indicate higher transaction costs and may result in higher taxes when Fund shares are held in a taxable account. These costs, which are not reflected in annual fund operating expenses or in the example, affect the Fund’s performance. During the most recent fiscal year, the Fund’s portfolio turnover rate was 138% of the average value of its portfolio.
Principal Investment Strategies
Under normal market conditions, the Fund invests at least 80% of the sum of its net assets and the amount of any borrowings for investment purposes in equity securities of companies with market capitalizations at the time of investment comparable to companies in the Russell Midcap® Index. The Fund will not be forced to sell a security because a company has exceeded or fallen below the current market capitalization range.
The goal of the portfolio construction process is to build a well-diversified portfolio that reflects the Fund’s benchmark, the Russell Midcap® Index, in terms of its risk characteristics and that simultaneously seeks to generate a return in excess of that benchmark. The sub-adviser’s investment process begins by identifying candidates with excess return potential from two complementary, separate sources: quantitative analysis and fundamental analysis. Investment ideas from these sources then undergo rigorous fundamental analysis. Through this bottom up stock selection process, the team seeks to identify companies likely to outperform their industry peers in the Russell Midcap® Index. Quantitative tools are used to optimize pre-determined risk factors and upside potential within set parameters, with ultimate allocation decisions made by the portfolio management team. Individual positions and risk parameters are continually monitored. A security will typically be sold when its risk/return profile becomes unattractive compared with other securities in the investment universe.
Principal Risks
The value of your investment in this Fund will change daily, which means you could lose money. An investment in the Fund is not a deposit of a bank and is not insured or guaranteed by the Federal Deposit Insurance Corporation or any other government agency. The principal risks of investing in the Fund include:
Equity Security Risk—Equity securities may decline significantly in price over short or extended periods of time, and such declines may occur in the equity market as a whole, or they may occur in only a particular country, company, industry, or sector of the market.
Mid-Cap Stock Risk—Stocks of mid-cap companies may be subject to more abrupt or erratic market movements than those of larger, more established companies or the market averages in general.
Section 1 Fund Summaries
15
Fund Performance
The following bar chart and table provide some indication of the potential risks of investing in the Fund. The Fund’s past performance (before and after taxes) is not necessarily an indication of how the Fund will perform in the future. Updated performance information is available at www.nuveen.com/performance or by calling (800) 257-8787.
The bar chart below shows the variability of the Fund’s performance from year to year for Class A shares. The performance of the other share classes will differ due to their different expense structures. The bar chart and highest/lowest quarterly returns that follow do not reflect sales charges, and if these charges were reflected, the returns would be less than those shown.
Class A Annual Total Return
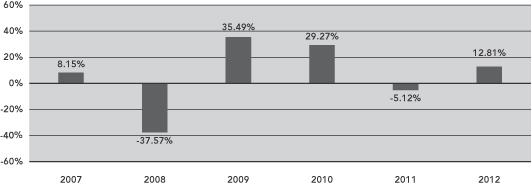
During the six-year period ended December 31, 2012, the Fund’s highest and lowest quarterly returns were 17.70% and -25.85%, respectively, for the quarters ended September 30, 2009 and December 31, 2008.
The table below shows the variability of the Fund’s average annual returns and how they compare over the time periods indicated with those of a broad measure of market performance and an index of funds with similar investment objectives. Class R3 shares commenced operations on May 5, 2009. The returns for Class R3 shares shown below reflect Class I performance prior to May 5, 2009 adjusted for the difference in fees between the classes. All after-tax returns are calculated using the historical highest individual federal marginal income tax rates and do not reflect the impact of state and local taxes. After-tax returns are shown for Class A shares only; after-tax returns for other share classes will vary. Your own actual after-tax returns will depend on your specific tax situation and may differ from what is shown here. After-tax returns are not relevant to investors who hold Fund shares in tax-deferred accounts such as IRAs or employer-sponsored retirement plans.
Both the bar chart and the table assume that all distributions have been reinvested. Performance reflects fee waivers, if any, in effect during the periods presented. If any such waivers were not in place, returns would be reduced.
| | | | | | | | | | |
| | | Average Annual Total Returns
for the Periods Ended
December 31, 2012 |
| | | 1 Year | | | 5 Years | | | Since Inception
(May 31, 2006) |
| Class A (return before taxes) | | | 6.31 | % | | | 1.98 | % | | 3.76% |
| Class A (return after taxes on distributions) | | | 6.19 | % | | | 1.95 | % | | 3.42% |
| Class A (return after taxes on distributions and sale of Fund shares) | | | 4.26 | % | | | 1.69 | % | | 3.05% |
| Class C (return before taxes) | | | 11.96 | % | | | 2.43 | % | | 3.91% |
| Class R3 (return before taxes) | | | 12.57 | % | | | 2.93 | % | | 4.42% |
| Class I (return before taxes) | | | 13.14 | % | | | 3.46 | % | | 4.96% |
| Russell Midcap® Index (reflects no deduction for fees, expenses or taxes) | | | 17.28 | % | | | 3.57 | % | | 5.07% |
| Lipper Mid-Cap Core Classification Average (reflects no deduction for taxes or certain expenses) | | | 15.59 | % | | | 2.23 | % | | 4.07% |
16
Section 1 Fund Summaries
Management
Investment Adviser
Nuveen Fund Advisors, LLC
Sub-Adviser
Symphony Asset Management LLC
Portfolio Managers
| | | | |
Name | | Title | | Portfolio Manager of Fund Since |
| Gunther Stein | | Chief Executive Officer and Chief Investment Officer | | June 2010 |
| Ross Sakamoto | | Co-Director of Equity | | July 2010 |
| Joel Drescher | | Co-Director of Equity | | June 2012 |
Purchase and Sale of Fund Shares
You may purchase, redeem or exchange shares of the Fund on any business day, which is any day the New York Stock Exchange is open for business. You may purchase, redeem or exchange shares of the Fund either through a financial advisor or other financial intermediary or directly from the Fund. The Fund’s initial and subsequent investment minimums generally are as follows, although the Fund may reduce or waive the minimums in some cases:
| | | | | | |
| | | Class A and Class C | | Class R3 | | Class I |
| Eligibility and Minimum Initial Investment | | $3,000 for all accounts except: •$2,500 for Traditional/Roth IRA accounts. •$2,000 for Coverdell Education Savings Accounts. •$250 for accounts opened through fee-based programs. •No minimum for retirement plans. | | Available only through certain retirement plans. No minimum. | | Available only through fee-based programs and certain retirement plans, and to other limited categories of investors as described in the prospectus. $100,000 for all accounts except: •$250 for clients of financial intermediaries and family offices that have accounts holding Class I shares with an aggregate value of at least $100,000 (or that are expected to reach this level). •No minimum for eligible retirement plans and certain other categories of eligible investors as described in the prospectus. |
| Minimum Additional Investment | | $100 | | No minimum. | | No minimum. |
Tax Information
The Fund’s distributions are taxable and will generally be taxed as ordinary income or capital gains, unless you are investing through a tax-deferred account, such as an IRA or 401(k) plan.
Payments to Broker-Dealers and Other Financial Intermediaries
If you purchase shares of the Fund through a broker-dealer or other financial intermediary (such as a bank or financial advisor), the Fund, its distributor or its investment adviser may pay the intermediary for the sale of Fund shares and related services. These payments may create a conflict of interest by influencing the broker-dealer or other financial intermediary and your salesperson to recommend the Fund over another investment. Ask your financial advisor or visit your financial intermediary’s website for more information.
Section 1 Fund Summaries
17
Section 2 How We Manage Your Money
To help you better understand the Funds, this section includes a detailed discussion of the Funds’ investment and risk management strategies. For a more complete discussion of these matters, please see the statement of additional information, which is available by calling (800) 257-8787 or by visiting Nuveen’s website at www.nuveen.com.

Nuveen Fund Advisors, LLC (“Nuveen Fund Advisors”), the Funds’ investment adviser, offers advisory and investment management services to a broad range of mutual fund clients. Nuveen Fund Advisors has overall responsibility for management of the Funds, oversees the management of the Funds’ portfolios, manages the Funds’ business affairs and provides certain clerical, bookkeeping and other administrative services. Nuveen Fund Advisors is located at 333 West Wacker Drive, Chicago, Illinois 60606. Nuveen Fund Advisors is a subsidiary of Nuveen Investments, Inc. (“Nuveen Investments”). On November 13, 2007, Nuveen Investments was acquired by investors led by Madison Dearborn Partners, LLC, which is a private equity investment firm based in Chicago, Illinois. The Nuveen family of advisers has been providing advice to investment companies since 1976, and had $220 billion of assets under management as of September 30, 2012.
Nuveen Fund Advisors has selected its affiliate, Symphony Asset Management LLC (“Symphony”), located at 555 California Street, Suite 2975, San Francisco, California 94104, to serve as sub-adviser to each Fund. Symphony manages the investment of the Funds’ assets on a discretionary basis, subject to the supervision of Nuveen Fund Advisors.
The portfolio managers for the funds are Gunther Stein, Ross Sakamoto and Joel Drescher.
| | • | | Gunther Stein is Chief Investment Officer and Chief Executive Officer at Symphony. Mr. Stein is responsible for leading Symphony’s fixed-income and equity investments strategies and research and overseeing firm trading. Prior to joining Symphony in 1999, Mr. Stein was a high yield portfolio manager at Wells Fargo Bank, where he managed a high yield portfolio, was responsible for investing in public high yield bonds and bank loans and managed a team of credit analysts. |
| | • | | Ross Sakamoto, Co-Director of Equity at Symphony, has managed the Funds since July 2010. He is responsible for co-heading Symphony’s equity investment strategies along with Joel Drescher and overseeing the equity trading and research activities. Mr. Sakamoto has over twenty years of industry experience and returns to Symphony after having spent six years with Symphony from 1996 to 2002 as an Equity Portfolio Manager of long-only and hedged strategies. Most recently, Mr. Sakamoto was a Director in the Quantitative Services group at Deutsche Bank Advisors focusing on business development. Prior to joining Deutsche Bank in 2008, he focused on program trading at Bear Stearns & Company from 2002 to 2007. |
| | • | | Joel Drescher is Co-Director of Equity at Symphony. He is responsible for co-heading Symphony’s equity investment strategies along with Ross |
18
Section 2 How We Manage Your Money
| | Sakamoto. Prior to joining Symphony in 2012, Mr. Drescher was a Sector Manager at Ascend Capital, where he was responsible for managing all aspects of the investment process for the firm’s consumer discretionary portfolio. Previously, he was the Chief Operations Officer and a Senior Research Analyst at Odyssey Value Advisors and earlier in his career a Financial Analyst in the investment banking group at ING Barings, LLC. |
Additional information about the portfolio managers’ compensation, other accounts managed by the portfolio managers and the portfolio managers’ ownership of securities in the Funds is provided in the statement of additional information.
Management Fees
The management fee schedule for each Fund consists of two components: a Fund-level fee, based only on the amount of assets within a Fund, and a complex-level fee, based on the aggregate amount of all eligible fund assets managed by Nuveen Fund Advisors.
The annual Fund-level fee, payable monthly, is based upon the average daily net assets of each Fund as follows:
| | | | | | | | | | | | | | | | |
| Average Daily Net Assets | | Nuveen
Symphony
International
Equity Fund | | | Nuveen
Symphony
Large-Cap
Growth Fund | | | Nuveen
Symphony
Low Volatility
Equity Fund | | | Nuveen
Symphony
Mid-Cap
Core Fund | |
| For the first $125 million | | | 0.6000 | % | | | 0.5000 | % | | | 0.5000 | % | | | 0.5500 | % |
| For the next $125 million | | | 0.5875 | % | | | 0.4875 | % | | | 0.4875 | % | | | 0.5375 | % |
| For the next $250 million | | | 0.5750 | % | | | 0.4750 | % | | | 0.4750 | % | | | 0.5250 | % |
| For the next $500 million | | | 0.5625 | % | | | 0.4625 | % | | | 0.4625 | % | | | 0.5125 | % |
| For the next $1 billion | | | 0.5500 | % | | | 0.4500 | % | | | 0.4500 | % | | | 0.5000 | % |
| For net assets over $2 billion | | | 0.5250 | % | | | 0.4250 | % | | | 0.4250 | % | | | 0.4750 | % |
The complex-level fee is the same for each Fund. It begins at a maximum rate of 0.2000% of each Fund’s average daily net assets, based upon complex-level assets of $55 billion, with breakpoints for eligible assets above that level. Therefore, the maximum management fee rate for each Fund is the Fund-level fee plus 0.2000%. As of September 30, 2012, the effective complex-level fee for each Fund was 0.1695% of the Fund’s average daily net assets.
For the most recent fiscal year, each Fund paid Nuveen Fund Advisors the following management fees (net of fee waivers and expense reimbursements, where applicable) as a percentage of average daily net assets:
| | | | |
| Nuveen Symphony International Equity Fund* | | | — | % |
| Nuveen Symphony Large-Cap Growth Fund | | | 0.09 | |
| Nuveen Symphony Low Volatility Equity Fund* | | | — | |
| Nuveen Symphony Mid-Cap Core Fund* | | | — | |
| | * | For the most recent fiscal year, Nuveen Fund Advisors reimbursed expenses in excess of management fees. |
Nuveen Fund Advisors has agreed to waive fees and/or reimburse expenses so that total annual fund operating expenses (excluding 12b-1 distribution and/or service fees, interest expenses, taxes, acquired fund fees and expenses, fees incurred in acquiring and disposing of portfolio securities and
Section 2 How We Manage Your Money
19
extraordinary expenses) for the Funds do not exceed the percentages of the average daily net assets listed below of any class of Fund shares.
| | |
| Nuveen Symphony International Equity Fund | | 1.13% through January 31, 2014 and 1.38% thereafter |
| Nuveen Symphony Large-Cap Growth Fund | | 1.00% through January 31, 2014 and 1.35% thereafter |
| Nuveen Symphony Low Volatility Equity Fund | | 1.00% through January 31, 2014 and 1.45% thereafter |
| Nuveen Symphony Mid-Cap Core Fund | | 1.15% through January 31, 2014 and 1.40% thereafter |
The expense limitations that expire may be terminated or modified prior to that date only with the approval of the Board of Trustees of the Funds. The expense limitations in effect thereafter may be terminated or modified only with the approval of shareholders of the Funds.
Information regarding the Board of Trustees’ approval of the investment management agreements is available in the Funds’ annual report for the fiscal year ended September 30, 2012.

The Funds’ investment objectives, which are described in the “Fund Summaries” section, may not be changed without shareholder approval. Nuveen Symphony International Equity Fund has adopted a non-fundamental investment policy pursuant to Rule 35d-1 under the 1940 Act (a “Name Policy”) whereby Nuveen Symphony International Equity Fund, under normal market conditions, will invest at least 80% of the sum of its net assets and the amount of any borrowings for investment purposes in equity securities. Nuveen Symphony Large-Cap Growth Fund has adopted a Name Policy whereby Nuveen Symphony Large-Cap Growth Fund, under normal market conditions, will invest at least 80% of the sum of its net assets and the amount of any borrowings for investment purposes in equity securities of companies with market capitalizations at the time of investment comparable to companies in the Russell 1000 Growth Index. Nuveen Symphony Low Volatility Equity Fund has adopted a Name Policy whereby Nuveen Symphony Low Volatility Equity Fund, under normal market conditions, will invest at least 80% of the sum of its net assets and the amount of any borrowings for investment purposes in equity securities. Nuveen Symphony Mid-Cap Core Fund has adopted a Name Policy whereby Nuveen Symphony Mid-Cap Core Fund, under normal market conditions, will invest at least 80% of the sum of its net assets and the amount of any borrowings for investment purposes in equity securities of companies with market capitalizations at the time of investment comparable to companies in the Russell Midcap Index. As a result, each Fund must provide shareholders with a notice meeting the requirement of Rule 35d-1(c) at least 60 days prior to any change of their Fund’s Name Policy. The Funds’ investment policies may be changed by the Board of Trustees without shareholder approval unless otherwise noted in this prospectus or the statement of additional information.
The Funds’ principal investment strategies are discussed in the “Fund Summaries” section. These are the strategies that the Funds’ investment adviser and sub-adviser believe are most likely to be important in trying to achieve the Funds’ investment objectives. This section provides more information about these strategies, as well as information about some
20
Section 2 How We Manage Your Money
additional strategies that the Funds’ sub-adviser uses, or may use, to achieve the Funds’ objectives. You should be aware that each Fund may also use strategies and invest in securities that are not described in this prospectus, but that are described in the statement of additional information. For a copy of the statement of additional information, call Nuveen Investor Services at (800) 257-8787 or visit Nuveen’s website at www.nuveen.com.
Equity Securities
Under normal market conditions, each Fund primarily invests in equity securities. Equity securities include common stocks; preferred securities; warrants to purchase common stocks or preferred securities; securities convertible into common stocks or preferred securities; and other securities with equity characteristics.
Non-U.S. Investments
Under normal market conditions, Nuveen Symphony International Equity Fund primarily invests in a variety of equity securities of companies organized or located outside the United States and doing a substantial amount of business outside the United States. Nuveen Symphony International Equity Fund considers a company that derives at least 50% of its revenue from business outside the United States or has at least 50% of its assets outside the United States as doing a substantial amount of business outside the United States. Nuveen Symphony International Equity Fund invests in non-U.S. equity securities, including direct investment in securities of non-U.S. companies traded overseas as well as American Depositary Receipts (“ADRs”) and other types of depositary receipts.
Cash Equivalents and Short-Term Investments
Under normal market conditions, the Funds may hold up to 10% of their net assets in cash or cash equivalents, money market funds and short-term fixed-income securities. The percentage of each Fund invested in such holdings varies and depends on several factors, including market conditions. Nevertheless, for temporary defensive purposes and during periods of high cash inflows or outflows, the Funds may depart from their principal investment strategies and invest part or all of their assets in such holdings. During such periods, the Funds may not be able to achieve their investment objectives. A Fund may adopt a defensive strategy when its sub-adviser believes securities in which it normally invests have elevated risks due to political or economic factors and in other extraordinary circumstances. For more information on eligible short-term investments, see the statement of additional information.
Investment Companies and Other Pooled Investment Vehicles
Under normal market conditions, the Funds may invest up to 10% of their total assets in securities of other open-end or closed-end investment companies, including exchange-traded funds (“ETFs”), that invest primarily in securities of the types in which the Funds may invest directly. In addition, the Funds may invest a portion of their assets in pooled investment vehicles (other than investment companies) that invest primarily in securities of the types in which the Funds may invest directly. Nevertheless, during periods of high cash inflows or outflows, the Funds may invest in the securities of certain ETFs in excess of the limits above and the limits imposed under the Investment Company Act of 1940, as amended (the “1940 Act”), pursuant to exemptive orders obtained by certain ETFs and their sponsors from the Securities and Exchange Commission. An ETF is a fund that holds a portfolio of securities generally designed to track the performance of a securities
Section 2 How We Manage Your Money
21
index, including industry, sector, country and region indexes. ETFs trade on a securities exchange and their shares may, at times, trade at a premium or discount to their net asset value.
As a shareholder in a pooled investment vehicle, the Funds will bear their ratable share of that vehicle’s expenses, and would remain subject to payment of the Funds’ advisory and administrative fees with respect to assets so invested. Shareholders would therefore be subject to duplicative expenses to the extent the Funds invest in other pooled investment vehicles. In addition, the Funds will incur brokerage costs when purchasing and selling shares of ETFs. Securities of other pooled investment vehicles may be leveraged, in which case the value and/or yield of such securities will tend to be more volatile than securities of unleveraged vehicles.
Portfolio Holdings
A description of the Funds’ policies and procedures with respect to the disclosure of the Funds’ portfolio holdings is available in the Funds’ statement of additional information. Certain portfolio holdings information for each Fund is available on the Funds’ website—www.nuveen.com/mf—by navigating to your Fund using the “Mutual Fund Finder” and clicking on the “Holdings & Detail” tab. By following these links, you can obtain a list of your Fund’s top ten holdings as of the end of the most recent month. A complete list of portfolio holdings information is generally made available on the Funds’ website ten business days after the end of the month. This information will remain available on the website until the Funds file with the Securities and Exchange Commission their annual, semi-annual or quarterly holdings report for the fiscal period that includes the date(s) as of which the website information is current.

Symphony believes that bottom-up stock selection is the most consistent way to achieve superior risk-adjusted returns through various market cycles. The equity team utilizes a comprehensive process that incorporates complementary quantitative and fundamental investment methods to efficiently identify companies likely to outperform their industry peers and combine them in risk-managed portfolios.
Symphony’s investment process begins by identifying candidates with excess return potential from two separate sources.
| | • | | Quantitative Idea Generation. Quantitative analysis serves as the starting point for security selection and narrows the investable universe in a disciplined, objective and efficient manner based on factors that Symphony has identified and researched over the past 15 years. |
| | • | | Analyst-Driven Idea Generation. Symphony’s fundamental analysts provide additional investment ideas outside of the trades recommended by the quantitative process. |
Investment ideas undergo rigorous fundamental analysis as part of the team’s ongoing security selection and portfolio monitoring processes. Fundamental analysis seeks to identify factors relevant to the attractiveness of investing in each company, some of which may be industry-specific. Analyst-driven ideas and quantitative signals are cross-checked as part of Symphony’s deeper diligence process. Valuation is assessed and any upcoming catalysts are identified. Through this process, the team seeks to identify the best risk-adjusted ideas within each sector.
22
Section 2 How We Manage Your Money
Each portfolio is built from the bottom-up and seeks the optimal balance of upside potential and risk management. Each name selected in a Fund represents a balance between these two objectives. Quantitative tools are used to optimize the balance of risk and upside potential within the parameters set forth in the following paragraph, with ultimate allocation decisions made by the portfolio management team.
For each of the Funds except the Nuveen Symphony Low Volatility Equity Fund, the goal of the portfolio construction process is to build a well-diversified portfolio that reflects the given benchmark in terms of its risk characteristics and that simultaneously seeks to generate a return in excess of that benchmark. For the Nuveen Symphony Low Volatility Equity Fund, the goal of the portfolio construction process is to build a well-diversified portfolio with volatility that is 90% of the volatility of the Fund’s benchmark index, while generating returns in excess of the market over the long term.
Individual positions and risk parameters are continually monitored. A security will typically be sold when its risk/return profile becomes unattractive compared with other securities in the investment universe. Changes in a security’s risk/return profile may be identified by Symphony’s quantitative models or fundamental analysts.

Risk is inherent in all investing. Investing in a mutual fund involves risk, including the risk that you may receive little or no return on your investment or even that you may lose part or all of your investment. Therefore, before investing you should consider carefully the principal risks and certain other risks that you assume when you invest in the Funds. These risks are listed alphabetically below. Because of these risks, you should consider an investment in the Funds to be a long-term investment.
Principal Risks
Equity security risk: Equity securities may decline significantly in price over short or extended periods of time. Price changes may occur in the market as a whole, or they may occur in only a particular country, company, industry, or sector of the market. In addition, the types of securities in which a particular Fund invests, such as value stocks, growth stocks, large-capitalization stocks, mid-capitalization stocks, small-capitalization stocks and/or micro-capitalization stocks, may underperform the market as a whole.
Investment strategy risk: For Nuveen Symphony Low Volatility Equity Fund, Symphony seeks to construct a portfolio with lower absolute volatility than the broad equity market. It does so by using historical data to produce a portfolio expected to have a defined level of market risk and the highest projected return for the risk taken. However, individual stock behavior may change in the future, and therefore there is no guaranty that this strategy will be successful.
Non-U.S./emerging markets risk: With respect to the Nuveen Symphony International Equity Fund, non-U.S. issuers or U.S. issuers with significant non-U.S. operations may be subject to risks in addition to those of issuers located in or that principally operate in the United States due to political, social and economic developments abroad, different regulatory environments and laws, potential seizure by the government of company assets, higher taxation, withholding taxes on dividends and interest and limitations on the use or transfer of portfolio assets. To the extent the Fund is
Section 2 How We Manage Your Money
23
allowed to invest in depositary receipts, the Fund will be subject to many of the same risks as when investing directly in non-U.S. securities. The holder of an unsponsored depositary receipt may have limited voting rights and may not receive as much information about the issuer of the underlying securities as would the holder of a sponsored depositary receipt.
Other non-U.S. investment risks include the following:
| | • | | Enforcing legal rights may be difficult, costly and slow in non-U.S. countries, and there may be special problems enforcing claims against non-U.S. governments. |
| | • | | Non-U.S. companies may not be subject to accounting standards or governmental supervision comparable to U.S. companies, and there may be less public information about their operations. |
| | • | | Non-U.S. markets may be less liquid and more volatile than U.S. markets. |
| | • | | The U.S. and non-U.S. equity markets often rise and fall at different times or by different amounts due to economic or other developments particular to a given country or region. This phenomenon would tend to lower the overall price volatility of a portfolio that included both U.S. and non-U.S. stocks. Sometimes, however, global trends will cause the U.S. and non-U.S. markets to move in the same direction, reducing or eliminating the risk reduction benefit of international investing. |
| | • | | Because the non-U.S. securities in which the Fund invests, with the exception of American Depositary Receipts, generally trade in currencies other than the U.S. dollar, changes in currency exchange rates will affect the Fund’s net asset value, the value of dividends and interest earned, and gains and losses realized on the sale of securities. A strong U.S. dollar relative to these other currencies will adversely affect the value of the Fund. |
| | • | | Securities of companies traded in many countries outside the United States, particularly emerging markets countries, may be subject to further risks due to the inexperience of local investment professionals and financial institutions, the possibility of permanent or temporary termination of trading, and greater spreads between bid and asked prices for securities. In addition, non-U.S. stock exchanges and investment professionals are subject to less governmental regulation, and commissions may be higher than in the United States. Also, there may be delays in the settlement of non-U.S. stock exchange transactions. |
| | • | | The Fund’s income from non-U.S. issuers may be subject to non-U.S. withholding taxes. In some countries, the Fund also may be subject to taxes on trading profits and, on certain securities transactions, transfer or stamp duties tax. To the extent non-U.S. income taxes are paid by the Fund, U.S. shareholders may be entitled to a credit or deduction for U.S. tax purposes. |
| | • | | Some countries, particularly emerging markets, restrict to varying degrees foreign investment in their securities markets. In some circumstances, these restrictions may limit or preclude investment in certain countries or may increase the cost of investing in securities of particular companies. |
| | • | | Emerging markets generally do not have the level of market efficiency and strict standards in accounting and securities regulation to be on par with advanced economies. Investments in emerging markets come with much greater risk due to political instability, domestic infrastructure |
24
Section 2 How We Manage Your Money
| | problems, currency volatility and limited equity opportunities (many large companies may still be “state-run” or private). Also, local stock exchanges may not offer liquid markets for outside investors. |
Smaller company risk: Nuveen Symphony Mid-Cap Core Fund, Nuveen Symphony International Equity Fund and Nuveen Symphony Low Volatility Equity Fund invest in smaller companies. Prices of small-cap stocks may be subject to more abrupt or erratic movements, and to wider fluctuations, than stock prices of larger, more established companies or the market averages in general. It may be difficult to sell small-cap stocks at the desired time and price. While mid-cap stocks may be slightly less volatile than small-cap stocks, they still involve similar risks.
Other Risks
Inflation risk: The value of assets or income from investments may be less in the future as inflation decreases the value of money. As inflation increases, the value of a Fund’s assets can decline, as can the value of a Fund’s distributions.
Investment companies risk: Each Fund may invest in securities of other open-end or closed-end investment companies, including ETFs. As a shareholder in a pooled investment vehicle, the Funds will bear their ratable share of that vehicle’s expenses, and would remain subject to payment of the Funds’ advisory and administrative fees with respect to assets so invested. Shareholders would therefore be subject to duplicative expenses to the extent the Funds invest in other pooled investment vehicles. In addition, the Funds will incur brokerage costs when purchasing and selling shares of ETFs. Securities of other pooled investment vehicles may be leveraged, in which case the value and/or yield of such securities will tend to be more volatile than securities of unleveraged vehicles.
Small fund risk: The Funds currently have less assets than similar funds, and like other relatively small funds, large inflows and outflows may impact a Fund’s market exposure for limited periods of time, causing the Fund’s performance to vary from that of the Fund’s model portfolio. This impact may be positive or negative, depending on the direction of market movement during the period affected. The Funds have policies in place which seek to reduce the impact of these flows where Nuveen Fund Advisors has prior knowledge of them.
Section 2 How We Manage Your Money
25
Section 3 How You Can Buy and Sell Shares
The Funds offer multiple classes of shares, each with a different combination of sales charges, fees, eligibility requirements and other features. Your financial advisor can help you determine which class is best for you. For further details, please see the statement of additional information.

Class A Shares
You can purchase Class A shares at the offering price, which is the net asset value per share plus an up-front sales charge. You may qualify for a reduced sales charge, or the sales charge may be waived, as described in “How to Reduce Your Sales Charge.” Class A shares are also subject to an annual service fee of 0.25% of your Fund’s average daily net assets, which compensates your financial advisor or other financial intermediary for providing ongoing service to you. Nuveen Securities, LLC (the “Distributor”), a subsidiary of Nuveen Investments and the distributor of the Funds, retains the up-front sales charge and the service fee on accounts with no financial intermediary of record. The up-front Class A sales charges for the Funds are as follows:
| | | | | | | | | | | | |
| Amount of Purchase | | Sales Charge as
% of Public
Offering Price | | | Sales Charge as %
of Net Amount
Invested | | | Maximum
Financial Intermediary
Commission as % of
Public Offering Price | |
| Less than $50,000 | | | 5.75 | % | | | 6.10 | % | | | 5.00 | % |
| $50,000 but less than $100,000 | | | 4.50 | | | | 4.71 | | | | 4.00 | |
| $100,000 but less than $250,000 | | | 3.75 | | | | 3.90 | | | | 3.25 | |
| $250,000 but less than $500,000 | | | 2.75 | | | | 2.83 | | | | 2.50 | |
| $500,000 but less than $1,000,000 | | | 2.00 | | | | 2.04 | | | | 1.75 | |
| $1,000,000 and over* | | | — | | | | — | | | | 1.00 | |
| | * | You can purchase $1 million or more of Class A shares at net asset value without an up-front sales charge. The Distributor pays financial intermediaries of record a commission equal to 1% of the first $2.5 million, plus 0.75% of the next $2.5 million, plus 0.50% of the amount over $5 million. Unless you are eligible for a waiver, you may be assessed a contingent deferred sales charge (“CDSC”) of 1% if you redeem any of your shares within 12 months of purchase. See “How to Sell Shares—Contingent Deferred Sales Charge” below for more information. |
Class C Shares
You can purchase Class C shares at the offering price, which is the net asset value per share without any up-front sales charge. Class C shares are subject to annual distribution and service fees of 1% of your Fund’s average daily net assets. The annual 0.25% service fee compensates your financial advisor or other financial intermediary for providing ongoing service to you. The annual 0.75% distribution fee compensates the Distributor for paying your financial advisor or other financial intermediary an ongoing sales commission as well as an advance of the first year’s service and distribution fees. The Distributor retains the service and distribution fees on accounts with no financial intermediary of record. If you redeem your shares within 12 months of purchase, you will normally pay a 1% CDSC, which is calculated on the lower of your purchase price or redemption proceeds. You do not pay a CDSC on any Class C shares you purchase by reinvesting dividends.
26
Section 3 How You Can Buy and Sell Shares
The Funds have established a limit to the amount of Class C shares that may be purchased by an individual investor. See the statement of additional information for more information.
Class R3 Shares
For each Fund other than Nuveen Symphony Low Volatility Equity Fund you can purchase Class R3 shares at the offering price, which is the net asset value per share without any up-front sales charge. Class R3 shares are subject to annual distribution and service fees of 0.50% of your Fund’s average daily net assets.
Class R3 shares are only available for purchase by eligible retirement plans. Class R3 shares are not available to traditional and Roth IRAs, Coverdell Education Savings Accounts, SEPs, SAR-SEPs, SIMPLE IRAs or individual 403(b) plans. See the statement of additional information for more information.
Class I Shares
You can purchase Class I shares at the offering price, which is the net asset value per share without any up-front sales charge. As Class I shares are not subject to sales charges or ongoing service or distribution fees, they have lower ongoing expenses than the other classes.
Class I shares are available for purchase by clients of financial intermediaries who charge such clients an ongoing fee for advisory, investment, consulting or related services. Such clients may include individuals, corporations, endowments and foundations. The minimum initial investment for such clients is $100,000, but this minimum will be lowered to $250 for clients of financial intermediaries that have accounts holding Class I shares with an aggregate value of at least $100,000. The Distributor may also lower the minimum to $250 for clients of financial intermediaries anticipated to reach this Class I share holdings level.
Class I shares are also available for purchase by family offices and their clients. A family office is a company that provides certain financial and other services to a high net worth family or families. The minimum initial investment for family offices and their clients is $100,000, but this minimum will be lowered to $250 for clients of family offices that have accounts holding Class I shares with an aggregate value of at least $100,000. The Distributor may also lower the minimum to $250 for clients of family offices anticipated to reach this Class I share holdings level.
Class I shares are also available for purchase, with no minimum initial investment, by the following categories of investors:
| | • | | Certain employer-sponsored retirement plans. |
| | • | | Certain bank or broker-affiliated trust departments. |
| | • | | Advisory accounts of Nuveen Fund Advisors and its affiliates. |
| | • | | Current and former trustees/directors of any Nuveen Fund, and their immediate family members (as defined in the statement of additional information). |
| | • | | Officers, directors and former directors of Nuveen Investments and its affiliates, and their immediate family members. |
| | • | | Full-time and retired employees of Nuveen Investments and its affiliates, and their immediate family members. |
| | • | | Certain financial intermediary personnel, and their immediate family members. |
Section 3 How You Can Buy and Sell Shares
27
| | • | | Certain other institutional investors described in the statement of additional information. |
Please refer to the statement of additional information for more information about Class A, Class C, Class R3 and Class I shares, including more detailed program descriptions and eligibility requirements. Additional information is also available from your financial advisor, who can also help you prepare any necessary application forms.

The Funds offer a number of ways to reduce or eliminate the up-front sales charge on Class A shares. See “What Share Classes We Offer” (above) for a discussion of eligibility requirements for purchasing Class I shares.
Class A Sales Charge Reductions
| | • | | Rights of Accumulation. In calculating the appropriate sales charge on a purchase of Class A shares of a Fund, you may be able to add the amount of your purchase to the value, based on the current net asset value per share, of all of your prior purchases of any Nuveen Mutual Fund. |
| | • | | Letter of Intent. Subject to certain requirements, you may purchase Class A shares of a Fund at the sales charge rate applicable to the total amount of the purchases you intend to make over a 13-month period. |
For purposes of calculating the appropriate sales charge as described under Rights of Accumulation and Letter of Intent above, you may include purchases by (i) you, (ii) your spouse or domestic partner and children under the age of 21 years, and (iii) a corporation, partnership or sole proprietorship that is 100% owned by any of the persons in (i) or (ii). In addition, a trustee or other fiduciary can count all shares purchased for a single trust, estate or other single fiduciary account that has multiple accounts (including one or more employee benefit plans of the same employer).
Class A Sales Charge Waivers
Class A shares of a Fund may be purchased at net asset value without a sales charge as follows:
| | • | | Purchases of $1,000,000 or more. |
| | • | | Monies representing reinvestment of Nuveen Mutual Fund distributions. |
| | • | | Certain employer-sponsored retirement plans. |
| | • | | Employees of Nuveen Investments and its affiliates. Purchases by full-time and retired employees of Nuveen Investments and its affiliates and such employees’ immediate family members (as defined in the statement of additional information). |
| | • | | Current and former trustees/directors of the Nuveen Funds. |
| | • | | Financial intermediary personnel. Purchases by any person who, for at least the last 90 days, has been an officer, director, or employee of any financial intermediary or any such person’s immediate family member. |
| | • | | Certain trust departments. Purchases by bank or broker-affiliated trust departments investing funds over which they exercise exclusive discretionary investment authority and that are held in a fiduciary, agency, advisory, custodial or similar capacity. |
28
Section 3 How You Can Buy and Sell Shares
| | • | | Additional categories of investors. Purchases made (i) by investors purchasing on a periodic fee, asset-based fee or no transaction fee basis through a broker-dealer sponsored mutual fund purchase program; (ii) by clients of investment advisers, financial planners or other financial intermediaries that charge periodic or asset-based fees for their services; and (iii) through a financial intermediary that has entered into an agreement with the Distributor to offer the Funds’ shares to self-directed investment brokerage accounts and that may or may not charge a transaction fee to its customers. |
In order to obtain a sales charge reduction or waiver, it may be necessary at the time of purchase for you to inform the Funds or your financial advisor of the existence of other accounts in which there are holdings eligible to be aggregated for such purposes. You may need to provide the Funds or your financial advisor information or records, such as account statements, in order to verify your eligibility for a sales charge reduction or waiver. This may include account statements of family members and information regarding Nuveen Mutual Fund shares held in accounts with other financial advisors. You or your financial advisor must notify the Distributor at the time of each purchase if you are eligible for any of these programs. The Funds may modify or discontinue these programs at any time.

Fund shares may be purchased on any business day, which is any day the New York Stock Exchange (the “NYSE”) is open for business. Generally, the NYSE is closed on weekends and national holidays. The share price you pay depends on when the Distributor receives your order and on the share class you are purchasing. Orders received before the close of trading on a business day (normally, 4:00 p.m. New York time) will receive that day’s closing share price; otherwise, you will receive the next business day’s price.
You may purchase Fund shares (1) through a financial advisor or (2) directly from the Funds.
Through a Financial Advisor
You may buy shares through your financial advisor, who can handle all the details for you, including opening a new account. Financial advisors can also help you review your financial needs and formulate long-term investment goals and objectives. In addition, financial advisors generally can help you develop a customized financial plan, select investments and monitor and review your portfolio on an ongoing basis to help assure your investments continue to meet your needs as circumstances change. Financial advisors (including brokers or agents) are paid for providing ongoing investment advice and services, either from Fund sales charges and fees or by charging you a separate fee in lieu of a sales charge.
Financial advisors or other dealer firms may charge their customers a processing or service fee in connection with the purchase or redemption of Fund shares. The amount and applicability of such a fee is determined and disclosed to customers by each individual dealer. Processing or service fees typically are fixed, nominal dollar amounts and are in addition to the sales and other charges described in this prospectus and the statement of additional information. Your dealer will provide you with specific information about any processing or service fees you will be charged. Shares you purchase through your financial advisor or other intermediary will normally be held with that firm. For more information, please contact your financial advisor.
Section 3 How You Can Buy and Sell Shares
29
Directly from the Funds
Eligible investors may purchase shares directly from the Funds.
| | • | | By wire. You can purchase shares by making a wire transfer from your bank. Before making an initial investment by wire, you must submit a new account form to a Fund. After receiving your form, a service representative will contact you with your account number and wiring instructions. Your order will be priced at the next closing share price based on the share class of your Fund, calculated after your Fund’s custodian receives your payment by wire. Wired funds must be received prior to 4:00 p.m. New York time to be eligible for same day pricing. Neither your Fund nor the transfer agent is responsible for the consequences of delays resulting from the banking or Federal Reserve wire system, or from incomplete wiring instructions. Before making any additional purchases by wire, you should call Nuveen Investor Services at (800) 257-8787. You cannot purchase shares by wire on days when federally chartered banks are closed. |
| | • | | By mail. You may open an account directly with the Funds and buy shares by completing an application and mailing it along with your check to: Nuveen Investor Services, P.O. Box 8530, Boston, Massachusetts 02266-8530. Applications may be obtained at www.nuveen.com or by calling (800) 257-8787. No third party checks will be accepted. |
The Funds do not consider the U.S. Postal Service or other independent delivery services to be their agents. Therefore, deposit in the mail or with such services, or receipt at the post office box above, of purchase orders or redemption requests does not constitute receipt by the transfer agent of the Funds.
| | • | | On-line. Existing shareholders with direct accounts may process certain account transactions on-line. You may purchase additional shares or exchange shares between existing, identically registered direct accounts. You can also look up your account balance, history and dividend information, as well as order duplicate account statements and tax forms from the Funds’ website. To access your account, click the “Individual Investors” link on www.nuveen.com and then choose “Account Access” under the “Resources” tab. The system will walk you through the log-in process. To purchase shares on-line, you must have established Fund Direct privileges on your account prior to the requested transaction. See “Special Services—Fund Direct” below. |
| | • | | By telephone. Existing shareholders with direct accounts may also process account transactions via the Funds’ automated information line. Simply call (800) 257-8787, press 1 for mutual funds and the voice menu will walk you through the process. To purchase shares by telephone, you must have established Fund Direct privileges on your account prior to the requested transaction. See “Special Services—Fund Direct” below. |

To help make your investing with us easy and efficient, we offer you the following services at no extra cost. Your financial advisor can help you complete the forms for these services, or you can call Nuveen Investor Services at (800) 257-8787 for copies of the necessary forms.
30
Section 3 How You Can Buy and Sell Shares
Systematic Investing
Once you have opened an account satisfying the applicable investment minimum, systematic investing allows you to make regular additional investments through automatic deductions from your bank account, directly from your paycheck or from exchanging shares from another mutual fund account. The minimum automatic deduction is $100 per month. There is no charge to participate in your Fund’s systematic investment plan. You can stop the deductions at any time by notifying your Fund in writing.
| | • | | From your bank account. You can make systematic investments of $100 or more per month by authorizing your Fund to draw pre-authorized checks on your bank account. |
| | • | | From your paycheck. With your employer’s consent, you can make systematic investments each pay period (collectively meeting the monthly minimum of $100) by authorizing your employer to deduct monies from your paycheck. |
| | • | | Systematic exchanging. You can make systematic investments by authorizing the Distributor to exchange shares from one Nuveen Mutual Fund account into another identically registered Nuveen Mutual Fund account of the same share class. |
Systematic Withdrawal
If the value of your Fund account is at least $10,000, you may request to have $50 or more withdrawn automatically from your account. You may elect to receive payments monthly, quarterly, semi-annually or annually, and may choose to receive a check, have the monies transferred directly into your bank account (see “Fund Direct” below), paid to a third party or sent payable to you at an address other than your address of record. You must complete the appropriate section of the account application or Account Update Form to participate in each Fund’s systematic withdrawal plan.
You should not establish systematic withdrawals if you intend to make concurrent purchases of Class A or Class C shares because you may unnecessarily pay a sales charge or CDSC on these purchases.
Exchanging Shares
You may exchange Fund shares into an identically registered account for the same class of another Nuveen Mutual Fund available in your state. Your exchange must meet the minimum purchase requirements of the fund into which you are exchanging. You may also, under certain limited circumstances, exchange between certain classes of shares of the same fund, subject to the payment of any applicable CDSC. Please consult the statement of additional information for details.
Each Fund reserves the right to revise or suspend the exchange privilege, limit the amount or number of exchanges, or reject any exchange. Shareholders will be provided with at least 60 days’ notice of any material revision to or termination of the exchange privilege.
Because an exchange between funds is treated for tax purposes as a purchase and sale, any gain may be subject to tax. An exchange between classes of shares of the same fund may not be considered a taxable event. You should consult your tax advisor about the tax consequences of exchanging your shares.
Section 3 How You Can Buy and Sell Shares
31
Fund DirectSM
The Fund Direct Program allows you to link your Fund account to your bank account, transfer money electronically between these accounts and perform a variety of account transactions, including purchasing shares by telephone and investing through a systematic investment plan. You may also have dividends, distributions, redemption payments or systematic withdrawal plan payments sent directly to your bank account.
Reinstatement Privilege
If you redeem Fund shares, you may reinvest all or part of your redemption proceeds up to one year later without incurring any additional charges. You may only reinvest into the same share class you redeemed. If you paid a CDSC, your Fund will refund your CDSC and reinstate your holding period for purposes of calculating the CDSC. You may use this reinstatement privilege only once for any redemption.

You may sell (redeem) your shares on any business day, which is any day the NYSE is open for business. You will receive the share price next determined after your Fund has received your properly completed redemption request. Your redemption request must be received before the close of trading on the NYSE (normally, 4:00 p.m. New York time) for you to receive that day’s price. The Fund will normally mail your check the next business day after a redemption request is received, but in no event more than seven days after your request is received. If you are selling shares purchased recently with a check, your redemption proceeds will not be mailed until your check has cleared, which may take up to ten business days from your purchase date.
You may sell your shares (1) through a financial advisor or (2) directly to the Funds.
Through a Financial Advisor
You may sell your shares through your financial advisor, who can prepare the necessary documentation. Your financial advisor may charge for this service.
Directly to the Funds
| | • | | By mail. You can sell your shares at any time by sending a written request to the appropriate Fund, c/o Nuveen Investor Services, P.O. Box 8530, Boston, Massachusetts 02266-8530. Your request must include the following information: |
| | • | | Your name and account number; |
| | • | | The dollar or share amount you wish to redeem; |
| | • | | The signature of each owner exactly as it appears on the account; |
| | • | | The name of the person to whom you want your redemption proceeds paid (if other than to the shareholder of record); |
| | • | | The address where you want your redemption proceeds sent (if other than the address of record); |
| | • | | Any certificates you have for the shares; and |
| | • | | Any required signature guarantees. |
32
Section 3 How You Can Buy and Sell Shares
An Important Note About Telephone Transactions
Although Nuveen Investor Services has certain safeguards and procedures to confirm the identity of callers, it will not be liable for losses resulting from following telephone instructions it reasonably believes to be genuine. Also, you should verify your trade confirmations immediately upon receipt.
After you have established your account, signatures on a written request must be guaranteed if:
| | • | | You would like redemption proceeds payable or sent to any person, address or bank account other than that on record; |
| | • | | You have changed the address on your Fund’s records within the last 30 days; |
| | • | | Your redemption request is in excess of $50,000; or |
| | • | | You are requesting a change in ownership on your account. |
Non-financial transactions, including establishing or modifying certain services such as changing bank information on an account, will require a signature guarantee or signature verification from a Medallion Signature Guarantee Program member or other acceptable form of authentication from a financial institution source. In addition to the situations described above, the Funds reserve the right to require a signature guarantee, or another acceptable form of signature verification, in other instances based on the circumstances of a particular situation.
A signature guarantee assures that a signature is genuine and protects shareholders from unauthorized account transfers. Banks, savings and loan associations, trust companies, credit unions, broker-dealers and member firms of a national securities exchange may guarantee signatures. Call your financial intermediary to determine if it has this capability. A notary public is not an acceptable signature guarantor. Proceeds from a written redemption request will be sent to you by check unless another form of payment is requested.
| | • | | On-line. You may redeem shares or exchange shares between existing, identically registered accounts on-line. To access your account, click the “Individual Investors” link on www.nuveen.com and then choose “Account Access” under the “Resources” tab. The system will walk you through the log-in process. On-line redemptions are not available for shares owned in certificate form and, with respect to redemptions where the proceeds are payable by check, may not exceed $50,000. Checks will only be issued to you as the shareholder of record and mailed to your address of record. If you have established Fund Direct privileges, you may have redemption proceeds transferred electronically to your bank account. |
| | • | | By telephone. If your account is held with your Fund and not in your brokerage account, and you have authorized telephone redemption privileges, call (800) 257-8787 to redeem your shares, press 1 for mutual funds and the voice menu will walk you through the process. Telephone redemptions are not available for shares owned in certificate form and, with respect to redemptions where the proceeds are payable by check, may not exceed $50,000. Checks will only be issued to you as the shareholder of record and mailed to your address of record, normally the next business day after the redemption request is received. If you have established Fund Direct privileges, you may have redemption proceeds transferred electronically to your bank account. In this case, the redemption proceeds will be transferred to your bank on the next business day after the redemption request is received. You should contact your bank for further information concerning the timing of the credit of the redemption proceeds in your bank account. |
Section 3 How You Can Buy and Sell Shares
33
Contingent Deferred Sales Charge
If you redeem Class A or Class C shares that are subject to a CDSC, you may be assessed a CDSC upon redemption. When you redeem Class A or Class C shares subject to a CDSC, your Fund will first redeem any shares that are not subject to a CDSC, and then redeem the shares you have owned for the longest period of time, unless you ask the Fund to redeem your shares in a different order. No CDSC is imposed on shares you buy through the reinvestment of dividends and capital gains. The CDSC holding period is calculated on a monthly basis and begins on the first day of the month in which the purchase was made. When you redeem shares subject to a CDSC, the CDSC is calculated on the lower of your purchase price or redemption proceeds, deducted from your redemption proceeds, and paid to the Distributor. The CDSC may be waived under certain special circumstances as described in the statement of additional information.
Accounts with Low Balances
The Funds reserve the right to liquidate or assess a low balance fee on any account (other than accounts holding Class R3 shares) held directly with the Funds that has a balance that has fallen below the account balance minimum of $1,000 for any reason, including market fluctuations.
If a Fund elects to exercise the right to assess a low balance fee, then annually the Fund will assess a $15 low balance account fee on certain accounts with balances under the account balance minimum that are IRAs, Coverdell Education Savings Accounts or accounts established pursuant to the UTMA or UGMA. At the same time, other accounts with balances under the account balance minimum will be liquidated, with proceeds being mailed to the address of record. Prior to the assessment of any low balance fee or liquidation of low balance accounts, affected shareholders will receive a communication notifying them of the pending action, thereby providing time to ensure that balances are at or above the account balance minimum prior to any fee assessment or account liquidation. You will not be assessed a CDSC if your account is liquidated.
Redemptions In-Kind
The Funds generally pay redemption proceeds in cash. However, if a Fund determines that it would be detrimental to its remaining shareholders to make payment of a redemption order wholly in cash, that Fund may pay a portion of your redemption proceeds in securities or other Fund assets. Although it is unlikely that your shares would be redeemed in-kind, you would probably have to pay brokerage costs to sell the securities or other assets distributed to you, as well as taxes on any capital gains from that sale.
34
Section 3 How You Can Buy and Sell Shares
Section 4 General Information
To help you understand the tax implications of investing in the Funds, this section includes important details about how the Funds make distributions to shareholders. We discuss some other Fund policies as well. Please consult the statement of additional information and your tax advisor for more information about taxes.

The Funds intend to pay income dividends and any taxable gains annually.
Payment and Reinvestment Options
The Funds automatically reinvest your dividends in additional Fund shares unless you request otherwise. You may request to have your dividends paid to you by check, sent via electronic funds transfer through Automated Clearing House network or reinvested in shares of another Nuveen Mutual Fund. For further information, contact your financial advisor or call Nuveen Investor Services at (800) 257-8787. If you request that your distributions be paid by check but those distributions cannot be delivered because of an incorrect mailing address, or if a distribution check remains uncashed for six months, the undelivered or uncashed distributions and all future distributions will be reinvested in Fund shares at the current net asset value.
Non-U.S. Income Tax Considerations
Investment income that Nuveen Symphony International Equity Fund receives from its non-U.S. investments may be subject to non-U.S. income taxes, which generally will reduce Fund distributions. However, the United States has entered into tax treaties with many non-U.S. countries that may entitle you to certain tax benefits.
Taxes and Tax Reporting
The Funds will make distributions that may be taxed as ordinary income (which may be taxable at different rates, depending on the sources of the distributions) or capital gains (which may be taxable at different rates, depending on the length of time a Fund holds its assets). Dividends from a Fund’s long-term capital gains are generally taxable as capital gains, while dividends from short-term capital gains and net investment income are generally taxable as ordinary income. However, certain ordinary income distributions received from a Fund that are determined to be qualified dividend income may be taxed at tax rates equal to those applicable to long-term capital gains. The tax you pay on a given capital gains distribution depends generally on how long the Fund has held the portfolio securities it sold. It does not depend on how long you have owned your Fund shares. Dividends generally do not qualify for a dividends received deduction if you are a corporate shareholder.
Early in each year, you will receive a statement detailing the amount and nature of all dividends and capital gains that you were paid during the prior year. If you hold your investment at the firm where you purchased your Fund shares, you will receive the statement from that firm. If you hold your shares directly with the Fund, the Distributor will send you the statement. The tax status of your dividends is the same whether you reinvest your dividends or elect to receive them in cash. The sale of shares in your account may
Section 4 General Information
35
produce a gain or loss, and is a taxable event. For tax purposes, an exchange of shares between funds is generally the same as a sale.
Please note that if you do not furnish your Fund with your correct Social Security number or employer identification number, you fail to provide certain certifications to your Fund, you fail to certify whether you are a U.S. citizen or a U.S. resident alien, or the Internal Revenue Service notifies the Fund to withhold, federal law requires your Fund to withhold federal income tax from your distributions and redemption proceeds at the applicable withholding rate.
Buying or Selling Shares Close to a Record Date
Buying Fund shares shortly before the record date for a taxable dividend or capital gain distribution is commonly known as “buying the dividend.” The entire distribution may be taxable to you even though a portion of the distribution effectively represents a return of your purchase price.
Non-U.S. Tax Credits
A regulated investment company with more than 50% of the value of its assets in stock or other securities of non-U.S. corporations at the close of a taxable year or that is a qualified fund of funds may, for such taxable year, elect to pass the regulated investment company’s non-U.S. tax credits through to its investors.
Cost Basis Method
For shares acquired on or after January 1, 2012, you may elect a cost basis method to apply to all existing and future accounts you may establish. The cost basis method you select will determine the order in which shares are redeemed and how your cost basis information is calculated and subsequently reported to you and to the Internal Revenue Service. Please consult your tax advisor to determine which cost basis method best suits your specific situation. If you hold your account directly with a Fund, please contact Nuveen Investor Services at (800) 257-8787 for instructions on how to make your election. If you hold your account with a financial intermediary, please contact that financial intermediary for instructions on how to make your election. If you hold your account directly with a Fund and do not elect a cost basis method, your account will default to the average cost basis method. For a definition of “average cost basis method,” please see the glossary. Financial intermediaries choose their own default method.

The Distributor serves as the selling agent and distributor of the Funds’ shares. In this capacity, the Distributor manages the offering of the Funds’ shares and is responsible for all sales and promotional activities. In order to reimburse the Distributor for its costs in connection with these activities, including compensation paid to financial intermediaries, each Fund has adopted a distribution and service plan under Rule 12b-1 under the 1940 Act. See “How You Can Buy and Sell Shares—What Share Classes We Offer” for a description of the distribution and service fees paid under this plan.
Under the plan, the Distributor receives a distribution fee for Class C and Class R3 shares primarily for providing compensation to financial intermediaries, including the Distributor, in connection with the distribution of shares. The Distributor receives a service fee for Class A, Class C and Class R3 shares to compensate financial intermediaries, including the
36
Section 4 General Information
Distributor, for providing ongoing account services to shareholders. These services may include establishing and maintaining shareholder accounts, answering shareholder inquiries and providing other personal services to shareholders. These fees also compensate the Distributor for other expenses, including printing and distributing prospectuses to persons other than shareholders, and preparing, printing, and distributing advertising materials, sales literature and reports to shareholders used in connection with the sale of shares. Because these fees are paid out of a Fund’s assets on an ongoing basis, over time these fees will increase the cost of your investment and may cost you more than paying other types of sales charges. Long-term holders of Class C and Class R3 shares may pay more in distribution and service fees and CDSCs (Class C shares only) than the economic equivalent of the maximum front-end sales charge permitted under the Financial Industry Regulatory Authority Conduct Rules.
Other Payments to Financial Intermediaries
In addition to the sales commissions and certain payments from distribution and service fees to financial intermediaries as previously described, the Distributor may from time to time make additional payments, out of its own resources, to certain financial intermediaries that sell shares of Nuveen Mutual Funds in order to promote the sales and retention of Fund shares by those firms and their customers. The amounts of these payments vary by financial intermediary and, with respect to a given firm, are typically calculated by reference to the amount of the firm’s recent gross sales of Nuveen Mutual Fund shares and/or total assets of Nuveen Mutual Funds held by the firm’s customers. The level of payments that the Distributor is willing to provide to a particular financial intermediary may be affected by, among other factors, the firm’s total assets held in and recent net investments into Nuveen Mutual Funds, the firm’s level of participation in Nuveen Mutual Fund sales and marketing programs, the firm’s compensation program for its registered representatives who sell Fund shares and provide services to Fund shareholders, and the asset class of the Nuveen Mutual Funds for which these payments are provided. For 2012, these payments in the aggregate were approximately 0.060% to 0.063% of the assets in the Nuveen Mutual Funds, although payments to particular financial intermediaries can be significantly higher. The statement of additional information contains additional information about these payments, including the names of the firms to which payments are made. The Distributor may also make payments to financial intermediaries in connection with sales meetings, due diligence meetings, prospecting seminars and other meetings at which the Distributor promotes its products and services.
In connection with the availability of Nuveen Mutual Funds within selected mutual fund no-transaction fee institutional platforms and fee-based wrap programs (together, “Platform Programs”) at certain financial intermediaries, the Distributor also makes payments out of its own assets to those firms as compensation for certain recordkeeping, shareholder communications and other account administration services provided to Nuveen Mutual Fund shareholders who own their Fund shares in these Platform Programs. These payments are in addition to the service fee and any applicable omnibus sub-accounting fees paid to these firms with respect to these services by the Nuveen Mutual Funds out of Fund assets.
The amounts of payments to a financial intermediary could be significant, and may create an incentive for the intermediary or its representatives to recommend or offer shares of the Funds to you. The intermediary may
Section 4 General Information
37
elevate the prominence or profile of the Funds within the intermediary’s organization by, for example, placing the Funds on a list of preferred or recommended funds and/or granting the Distributor and/or its affiliates preferential or enhanced opportunities to promote the Funds in various ways within the intermediary’s organization.

The price you pay for your shares is based on your Fund’s net asset value per share, which is determined as of the close of trading (normally 4:00 p.m. New York time) on each day the NYSE is open for business. Net asset value is calculated for each class of each Fund by taking the value of the class’s total assets, including interest or dividends accrued but not yet collected, less all liabilities, and dividing by the total number of shares outstanding. The result, rounded to the nearest cent, is the net asset value per share. All valuations are subject to review by the Funds’ Board of Trustees or its designee; however, the Board of Trustees retains oversight responsibility for valuing the Funds’ portfolio securities.
In determining net asset value, portfolio instruments generally are valued using prices provided by independent pricing services or obtained from other sources, such as broker-dealer quotations, all as approved by the Board of Trustees. Exchange-traded instruments generally are valued at the last reported sales price or official closing price on an exchange, if available. Independent pricing services typically value non-exchange-traded instruments utilizing a range of market-based inputs and assumptions, including readily available market quotations obtained from broker-dealers making markets in such instruments, cash flows, and transactions for comparable instruments. In pricing certain instruments, the pricing services may consider information about an instrument’s issuer or market activity provided by the Funds’ investment adviser or sub-adviser. Non-U.S. securities and currency are valued in U.S. dollars based on non-U.S. currency exchange rate quotations supplied by an independent quotation service.
If a price cannot be obtained from a pricing service or other pre-approved source, or if Nuveen Fund Advisors deems such price to be unreliable, a portfolio instrument may be valued by a Fund at its fair value as determined in good faith by the Board of Trustees or its designee. Nuveen Fund Advisors might find a price obtained from a pricing service or other pre-approved source to be unreliable if, for example, the price has not changed for an identified period of time, or because it differs from the previous day’s price by a threshold amount, and Nuveen Fund Advisors determines that recent transactions and/or broker-dealer price quotations differ materially from such price. As a general principle, the fair value of a portfolio instrument is the amount that an owner might reasonably expect to receive upon the instrument’s current sale. A range of factors and analysis may be considered when determining fair value, including relevant market data, interest rates, credit considerations and/or issuer-specific news. For non-U.S. traded securities whose principal local markets close before the close of the NYSE, a Fund may adjust the local closing price based upon such factors as developments in non-U.S. markets, the performance of U.S. securities markets and the performance of instruments trading in U.S. markets that represent non-U.S. securities. A Fund may rely on an independent fair valuation service in making any such fair value determinations. A security that is fair valued may be valued at a price higher or lower than actual market
38
Section 4 General Information
quotations, the last price determined by the pricing service, the last bid or ask price in the market or the value determined by other funds using their own fair valuation procedures.
If a Fund holds portfolio instruments that are primarily listed on non-U.S. exchanges, the value of such instruments may change on days when shareholders will not be able to purchase or redeem the Fund’s shares.

The Funds are intended for long-term investment and should not be used for excessive trading. Excessive trading in the Funds’ shares can disrupt portfolio management, lead to higher operating costs, and cause other operating inefficiencies for the Funds. However, the Funds are also mindful that shareholders may have valid reasons for periodically purchasing and redeeming Fund shares.
Accordingly, the Funds have adopted a Frequent Trading Policy that seeks to balance the Funds’ need to prevent excessive trading in Fund shares while offering investors the flexibility in managing their financial affairs to make periodic purchases and redemptions of Fund shares.
The Funds’ Frequent Trading Policy generally limits an investor to two “round trip” trades in a 60-day period. A “round trip” is the purchase and subsequent redemption of Fund shares, including by exchange. Each side of a round trip may be comprised of either a single transaction or a series of closely-spaced transactions.
The Funds primarily receive share purchase and redemption orders through third-party financial intermediaries, some of whom rely on the use of omnibus accounts. An omnibus account typically includes multiple investors and provides the Funds only with a net purchase or redemption amount on any given day where multiple purchases, redemptions and exchanges of shares occur in the account. The identity of individual purchasers, redeemers and exchangers whose orders are aggregated in omnibus accounts, and the size of their orders, will generally not be known by the Funds. Despite the Funds’ efforts to detect and prevent frequent trading, the Funds may be unable to identify frequent trading because the netting effect in omnibus accounts often makes it more difficult to identify frequent traders. The Distributor has entered into agreements with financial intermediaries that maintain omnibus accounts with the Funds’ transfer agent. Under the terms of these agreements, the financial intermediaries undertake to cooperate with the Distributor in monitoring purchase, exchange and redemption orders by their customers in order to detect and prevent frequent trading in the Funds through such accounts. Technical limitations in operational systems at such intermediaries or at the Distributor may also limit the Funds’ ability to detect and prevent frequent trading. In addition, the Funds may permit certain financial intermediaries, including broker-dealer and retirement plan administrators, among others, to enforce their own internal policies and procedures concerning frequent trading. Such policies may differ from the Funds’ Frequent Trading Policy and may be approved for use in instances where the Funds reasonably believe that the intermediary’s policies and procedures effectively discourage inappropriate trading activity. Shareholders holding their accounts with such intermediaries may wish to contact the intermediary for information regarding its frequent trading policy. Although the Funds do not knowingly permit frequent trading, they cannot guarantee that they will be able to identify and restrict all frequent trading activity.
Section 4 General Information
39
The Funds reserve the right in their sole discretion to waive unintentional or minor violations (including transactions below certain dollar thresholds) if they determine that doing so would not harm the interests of Fund shareholders. In addition, certain categories of redemptions may be excluded from the application of the Frequent Trading Policy, as described in more detail in the statement of additional information. These include, among others, redemptions pursuant to systematic withdrawal plans, redemptions in connection with the total disability or death of the investor, involuntary redemptions by operation of law, redemptions in payment of account or plan fees, and certain redemptions by retirement plans, including redemptions in connection with qualifying loans or hardship withdrawals, termination of plan participation, return of excess contributions, and required minimum distributions. The Funds may also modify or suspend the Frequent Trading Policy without notice during periods of market stress or other unusual circumstances.
The Funds reserve the right to impose restrictions on purchases or exchanges that are more restrictive than those stated above if they determine, in their sole discretion, that a transaction or a series of transactions involves market timing or excessive trading that may be detrimental to Fund shareholders. The Funds also reserve the right to reject any purchase order, including exchange purchases, for any reason. For example, a Fund may refuse purchase orders if the Fund would be unable to invest the proceeds from the purchase order in accordance with the Fund’s investment policies and/or objective, or if the Fund would be adversely affected by the size of the transaction, the frequency of trading in the account or various other factors. For more information about the Funds’ Frequent Trading Policy and its enforcement, see “Purchase and Redemption of Fund Shares—Frequent Trading Policy” in the statement of additional information.

The custodian of the assets of the Funds is State Street Bank & Trust Company, P.O. Box 5043, Boston, Massachusetts 02206-5043. The custodian also provides certain accounting services to the Funds. The Funds’ transfer, shareholder services and dividend paying agent, Boston Financial Data Services, Inc., P.O. Box 8530, Boston, Massachusetts 02266-8530, performs bookkeeping, data processing and administrative services for the maintenance of shareholder accounts.
40
Section 4 General Information
Section 5 Financial Highlights
The financial highlights table is intended to help you understand a Fund’s financial performance for the life of the Fund. Certain information reflects financial results for a single Fund share. The total returns in the table represent the rate that an investor would have earned (or lost) on an investment in a Fund (assuming reinvestment of all dividends and distributions). The information has been audited by PricewaterhouseCoopers LLP, whose report for the most recent fiscal year, along with the Funds’ financial statements, are included in the annual report, which is available upon request.
Nuveen Symphony International Equity Fund
| | | | | | | | | | | | | | | | | | | | | | | | | | | | | | | | | | | | | | | | | | | | | | | | | | | | |
Class
(Commencement
Date) | | | | | Investment Operations | | | Less Distributions | | | | | | | | | Ratios/Supplemental Data | |
| | | Beginning
Net Asset
Value | | | Net
Investment
Income (Loss)(a) | | | Net
Realized/
Unrealized
Gain (Loss) | | | Total | | | Net
Investment
Income | | | Capital
Gains(b) | | | Total | | | Ending
Net
Asset
Value | | | Total
Return(c) | | | Ending
Net
Assets
(000) | | | Ratios of
Expenses
to Average
Net
Assets(d)(e) | | | Ratios of
Net
Investment
Income
(Loss) to
Average
Net
Assets(d)(e) | | | Portfolio
Turnover
Rate | |
| | | | | | | | | | | | |
| Class A (5/08) | | | | | | | | | | | | | | | | | | | | | | | | | | | | | | | | | | | | | | | | | | | | | | | | | |
Year Ended 9/30: | | | | | | | | | | | | | | | | | | | | | | | | | | | | | | | | | | | | | | | | | | | | | | | | | |
| 2012 | | $ | 12.97 | | | $ | .23 | | | $ | 1.98 | | | $ | 2.21 | | | $ | (.21 | ) | | $ | — | | | $ | (.21 | ) | | $ | 14.97 | | | | 17.07 | % | | $ | 110 | | | | 1.35 | % | | | 1.60 | % | | | 22 | % |
| 2011 | | | 14.44 | | | | .22 | | | | (1.45 | ) | | | (1.23 | ) | | | (.24 | ) | | | — | | | | (.24 | ) | | | 12.97 | | | | (8.70 | ) | | | 270 | | | | 1.36 | | | | 1.41 | | | | 34 | |
| 2010 | | | 13.98 | | | | .19 | | | | .53 | | | | .72 | | | | (.26 | ) | | | — | | | | (.26 | ) | | | 14.44 | | | | 5.20 | | | | 231 | | | | 1.37 | | | | 1.38 | | | | 100 | |
| 2009(g) | | | 12.81 | | | | .01 | | | | 1.16 | | | | 1.17 | | | | — | | | | — | | | | — | | | | 13.98 | | | | 9.13 | | | | 175 | | | | 1.37 | * | | | .45 | * | | | 2 | |
Year Ended 7/31: | | | | | | | | | | | | | | | | | | | | | | | | | | | | | | | | | | | | | | | | | | | | | | | | | |
| 2009 | | | 17.52 | | | | .24 | | | | (4.93 | ) | | | (4.69 | ) | | | (.02 | ) | | | — | | | | (.02 | ) | | | 12.81 | | | | (26.76 | ) | | | 160 | | | | 1.38 | | | | 2.17 | | | | 117 | |
| 2008(f) | | | 20.00 | | | | — | ** | | | (2.48 | ) | | | (2.48 | ) | | | — | | | | — | | | | — | | | | 17.52 | | | | (12.40 | ) | | | 219 | | �� | | 1.37 | * | | | (.11 | )* | | | 6 | |
| | | | | | | | | | | | |
| Class C (5/08) | | | | | | | | | | | | | | | | | | | | | | | | | | | | | | | | | | | | | | | | | | | | | | | | | |
Year Ended 9/30: | | | | | | | | | | | | | | | | | | | | | | | | | | | | | | | | | | | | | | | | | | | | | | | | | |
| 2012 | | | 12.84 | | | | .10 | | | | 1.98 | | | | 2.08 | | | | (.09 | ) | | | — | | | | (.09 | ) | | | 14.83 | | | | 16.18 | | | | 137 | | | | 2.10 | | | | .73 | | | | 22 | |
| 2011 | | | 14.31 | | | | .11 | | | | (1.45 | ) | | | (1.34 | ) | | | (.13 | ) | | | — | | | | (.13 | ) | | | 12.84 | | | | (9.41 | ) | | | 314 | | | | 2.11 | | | | .75 | | | | 34 | |
| 2010 | | | 13.87 | | | | .10 | | | | .51 | | | | .61 | | | | (.17 | ) | | | — | | | | (.17 | ) | | | 14.31 | | | | 4.43 | | | | 179 | | | | 2.12 | | | | .73 | | | | 100 | |
| 2009(g) | | | 12.73 | | | | (.01 | ) | | | 1.15 | | | | 1.14 | | | | — | | | | — | | | | — | | | | 13.87 | | | | 8.96 | | | | 173 | | | | 2.13 | * | | | (.30 | )* | | | 2 | |
Year Ended 7/31: | | | | | | | | | | | | | | | | | | | | | | | | | | | | | | | | | | | | | | | | | | | | | | | | | |
| 2009 | | | 17.49 | | | | .15 | | | | (4.91 | ) | | | (4.76 | ) | | | — | | | | — | | | | — | | | | 12.73 | | | | (27.22 | ) | | | 159 | | | | 2.13 | | | | 1.25 | | | | 117 | |
| 2008(f) | | | 20.00 | | | | (.03 | ) | | | (2.48 | ) | | | (2.51 | ) | | | — | | | | — | | | | — | | | | 17.49 | | | | (12.55 | ) | | | 219 | | | | 2.13 | * | | | (.87 | )* | | | 6 | |
| | | | | | | | | | | | |
| Class R3 (10/10) | | | | | | | | | | | | | | | | | | | | | | | | | | | | | | | | | | | | | | | | | | | | | | | | | |
Year Ended 9/30: | | | | | | | | | | | | | | | | | | | | | | | | | | | | | | | | | | | | | | | | | | | | | | | | | |
| 2012 | | | 12.98 | | | | .21 | | | | 1.97 | | | | 2.18 | | | | (.17 | ) | | | — | | | | (.17 | ) | | | 14.99 | | | | 16.81 | | | | 52 | | | | 1.60 | | | | 1.47 | | | | 22 | |
| 2011(h) | | | 14.50 | | | | .18 | | | | (1.50 | ) | | | (1.32 | ) | | | (.20 | ) | | | — | | | | (.20 | ) | | | 12.98 | | | | (9.22 | ) | | | 45 | | | | 1.61 | * | | | 1.17 | * | | | 34 | |
| | | | | | | | | | | | |
| Class I (5/08) | | | | | | | | | | | | | | | | | | | | | | | | | | | | | | | | | | | | | | | | | | | | | | | | | |
Year Ended 9/30: | | | | | | | | | | | | | | | | | | | | | | | | | | | | | | | | | | | | | | | | | | | | | | | | | |
| 2012 | | | 12.98 | | | | .30 | | | | 1.94 | | | | 2.24 | | | | (.24 | ) | | | — | | | | (.24 | ) | | | 14.98 | | | | 17.38 | | | | 793 | | | | 1.10 | | | | 2.07 | | | | 22 | |
| 2011 | | | 14.45 | | | | .26 | | | | (1.46 | ) | | | (1.20 | ) | | | (.27 | ) | | | — | | | | (.27 | ) | | | 12.98 | | | | (8.49 | ) | | | 335 | | | | 1.11 | | | | 1.66 | | | | 34 | |
| 2010 | | | 13.98 | | | | .25 | | | | .51 | | | | .76 | | | | (.29 | ) | | | — | | | | (.29 | ) | | | 14.45 | | | | 5.50 | | | | 405 | | | | 1.12 | | | | 1.82 | | | | 100 | |
| 2009(g) | | | 12.81 | | | | .02 | | | | 1.15 | | | | 1.17 | | | | — | | | | — | | | | — | | | | 13.98 | | | | 9.13 | | | | 520 | | | | 1.12 | * | | | .70 | * | | | 2 | |
Year Ended 7/31: | | | | | | | | | | | | | | | | | | | | | | | | | | | | | | | | | | | | | | | | | | | | | | | | | |
| 2009 | | | 17.52 | | | | .28 | | | | (4.93 | ) | | | (4.65 | ) | | | (.06 | ) | | | — | | | | (.06 | ) | | | 12.81 | | | | (26.52 | ) | | | 476 | | | | 1.13 | | | | 2.39 | | | | 117 | |
| 2008(f) | | | 20.00 | | | | .01 | | | | (2.49 | ) | | | (2.48 | ) | | | — | | | | — | | | | — | | | | 17.52 | | | | (12.40 | ) | | | 438 | | | | 1.11 | * | | | .14 | * | | | 6 | |
| (a) | Per share Net Investment Income (Loss) is calculated using the average daily shares method. |
| (b) | Distributions from Capital Gains include short-term capital gains, if any. |
| (c) | Total Return is the combination of changes in net asset value without any sales charge, reinvested dividend income at net asset value and reinvested capital gains distributions at net asset value, if any. Total Return is not annualized. |
| (d) | After expense reimbursement from Nuveen Fund Advisors, where applicable. |
| (e) | Ratios do not reflect the effect of custodian fee credits earned on the Fund’s net cash on deposit with the custodian bank, where applicable. |
| (f) | For the period May 30, 2008 (commencement of operations) through July 31, 2008. |
| (g) | For the two months ended September 30, 2009. |
| (h) | For the period October 5, 2010 (commencement of operations) through September 30, 2011. |
| ** | Rounds to less than $.01 per share. |
Section 5 Financial Highlights
41
Nuveen Symphony Large-Cap Growth Fund
| | | | | | | | | | | | | | | | | | | | | | | | | | | | | | | | | | | | | | | | | | | | | | | | | | | | | | | | |
Class
(Commencement
Date) | | | | | Investment Operations | | | Less Distributions | | | | | | | | | Ratios/Supplemental Data | |
| | | Beginning
Net Asset
Value | | | Net
Investment
Income
(Loss)(a) | | | Net
Realized/
Unrealized
Investment
Gain (Loss) | | | Total | | | Net
Investment
Income | | | Capital
Gains(b) | | | Return
of Capital | | | Total | | | Ending
Net
Asset
Value | | | Total
Return(c) | | | Ending
Net
Assets
(000) | | | Ratios of
Expenses
to Average
Net
Assets(d)(e) | | | Ratios of Net
Investment
Income
(Loss) to
Average
Net
Assets(d)(e) | | | Portfolio
Turnover
Rate | |
| | | | | | | | | | | | | |
| Class A (12/06) | | | | | | | | | | | | | | | | | | | | | | | | | | | | | | | | | | | | | | | | | | | | | | | | | | | | | |
Year Ended 9/30: | | | | | | | | | | | | | | | | | | | | | | | | | | | | | | | | | | | | | | | | | | | | | | | | | | | | | |
| 2012 | | $ | 21.34 | | | $ | .12 | | | $ | 6.23 | | | $ | 6.35 | | | $ | — | | | $ | (2.50 | ) | | $ | — | | | $ | (2.50 | ) | | $ | 25.19 | | | | 32.70 | % | | $ | 36,680 | | | | 1.22 | % | | | .51 | % | | | 106 | % |
| 2011 | | | 20.63 | | | | — | ** | | | .71 | | | | .71 | | | | — | | | | — | | | | — | | | | — | | | | 21.34 | | | | 3.44 | | | | 2,107 | | | | 1.23 | | | | (.02 | ) | | | 151 | |
| 2010 | | | 17.50 | | | | — | ** | | | 3.14 | | | | 3.14 | | | | (.01 | ) | | | — | | | | — | | | | (.01 | ) | | | 20.63 | | | | 17.96 | | | | 1,063 | | | | 1.29 | | | | — | *** | | | 70 | |
| 2009(g) | | | 16.43 | | | | .01 | | | | 1.06 | | | | 1.07 | | | | — | | | | — | | | | — | | | | — | | | | 17.50 | | | | 6.51 | | | | 236 | | | | 1.35 | * | | | .25 | * | | | 10 | |
Year Ended 7/31: | | | | | | | | | | | | | | | | | | | | | | | | | | | | | | | | | | | | | | | | | | | | | | | | | | | | | |
| 2009 | | | 20.57 | | | | .01 | | | | (4.15 | ) | | | (4.14 | ) | | | — | | | | — | | | | — | | | | — | | | | 16.43 | | | | (20.13 | ) | | | 215 | | | | 1.35 | | | | .06 | | | | 109 | |
| 2008 | | | 20.78 | | | | (.07 | ) | | | (.04 | ) | | | (.11 | ) | | | — | | | | (.04 | ) | | | (.06 | ) | | | (.10 | ) | | | 20.57 | | | | (.55 | ) | | | 257 | | | | 1.33 | | | | (.35 | ) | | | 110 | |
| | | | | | | | | | | | | |
| Class C (12/06) | | | | | | | | | | | | | | | | | | | | | | | | | | | | | | | | | | | | | | | | | | | | | | | | | | | | | |
| Year Ended 9/30: | | | | | | | | | | | | | | | | | | | | | | | | | | | | | | | | | | | | | | | | | | | | | | | | | | | | | | | | |
| 2012 | | | 20.61 | | | | (.05 | ) | | | 5.97 | | | | 5.92 | | | | — | | | | (2.50 | ) | | | — | | | | (2.50 | ) | | | 24.03 | | | | 31.68 | | | | 11,841 | | | | 1.97 | | | | (.22 | ) | | | 106 | |
| 2011 | | | 20.07 | | | | (.19 | ) | | | .73 | | | | .54 | | | | — | | | | — | | | | — | | | | — | | | | 20.61 | | | | 2.69 | | | | 1,326 | | | | 1.98 | | | | (.80 | ) | | | 151 | |
| 2010 | | | 17.15 | | | | (.17 | ) | | | 3.09 | | | | 2.92 | | | | — | | | | — | | | | — | | | | — | | | | 20.07 | | | | 17.03 | | | | 367 | | | | 2.06 | | | | (.89 | ) | | | 70 | |
| 2009(g) | | | 16.11 | | | | (.01 | ) | | | 1.05 | | | | 1.04 | | | | — | | | | — | | | | — | | | | — | | | | 17.15 | | | | 6.46 | | | | 661 | | | | 2.09 | * | | | (.50 | )* | | | 10 | |
| Year Ended 7/31: | | | | | | | | | | | | | | | | | | | | | | | | | | | | | | | | | | | | | | | | | | | | | | | | | | | | | | | | |
| 2009 | | | 20.32 | | | | (.11 | ) | | | (4.10 | ) | | | (4.21 | ) | | | — | | | | — | | | | — | | | | — | | | | 16.11 | | | | (20.72 | ) | | | 621 | | | | 2.10 | | | | (.75 | ) | | | 109 | |
| 2008 | | | 20.68 | | | | (.22 | ) | | | (.04 | ) | | | (.26 | ) | | | — | | | | (.04 | ) | | | (.06 | ) | | | (.10 | ) | | | 20.32 | | | | (1.28 | ) | | | 254 | | | | 2.09 | | | | (1.11 | ) | | | 110 | |
| | | | | | | | | | | | | |
| Class R3 (9/09) | | | | | | | | | | | | | | | | | | | | | | | | | | | | | | | | | | | | | | | | | | | | | | | | | | | | | |
| Year Ended 9/30: | | | | | | | | | | | | | | | | | | | | | | | | | | | | | | | | | | | | | | | | | | | | | | | | | | | | | | | | |
| 2012 | | | 21.38 | | | | .09 | | | | 6.20 | | | | 6.29 | | | | — | | | | (2.50 | ) | | | — | | | | (2.50 | ) | | | 25.17 | | | | 32.32 | | | | 2,372 | | | | 1.47 | | | | .38 | | | | 106 | |
| 2011 | | | 20.72 | | | | (.07 | ) | | | .73 | | | | .66 | | | | — | | | | — | | | | — | | | | — | | | | 21.38 | | | | 3.19 | | | | 60 | | | | 1.48 | | | | (.31 | ) | | | 151 | |
| 2010 | | | 17.61 | | | | (.08 | ) | | | 3.19 | | | | 3.11 | | | | — | | | | — | | | | — | | | | — | | | | 20.72 | | | | 17.66 | | | | 59 | | | | 1.56 | | | | (.41 | ) | | | 70 | |
| 2009(f) | | | 17.69 | | | | — | ** | | | (.08 | ) | | | (.08 | ) | | | — | | | | — | | | | — | | | | — | | | | 17.61 | | | | (.45 | ) | | | 50 | | | | 1.59 | * | | | (1.59 | )* | | | 10 | |
| | | | | | | | | | | | | |
| Class I (12/06) | | | | | | | | | | | | | | | | | | | | | | | | | | | | | | | | | | | | | | | | | | | | | | | | | | | | | |
| Year Ended 9/30: | | | | | | | | | | | | | | | | | | | | | | | | | | | | | | | | | | | | | | | | | | | | | | | | | | | | | | | | |
| 2012 | | | 21.53 | | | | .21 | | | | 6.26 | | | | 6.47 | | | | — | | | | (2.50 | ) | | | — | | | | (2.50 | ) | | | 25.50 | | | | 33.00 | | | | 14,004 | | | | .97 | | | | .89 | | | | 106 | |
| 2011 | | | 20.77 | | | | .04 | | | | .72 | | | | .76 | | | | — | | | | — | | | | — | | | | — | | | | 21.53 | | | | 3.66 | | | | 2,460 | | | | .98 | | | | .16 | | | | 151 | |
| 2010 | | | 17.62 | | | | .02 | | | | 3.18 | | | | 3.20 | | | | (.05 | ) | | | — | | | | — | | | | (.05 | ) | | | 20.77 | | | | 18.19 | | | | 7,080 | | | | 1.06 | | | | .09 | | | | 70 | |
| 2009(g) | | | 16.53 | | | | .01 | | | | 1.08 | | | | 1.09 | | | | — | | | | — | | | | — | | | | — | | | | 17.62 | | | | 6.59 | | | | 5,831 | | | | 1.09 | * | | | .51 | * | | | 10 | |
| Year Ended 7/31: | | | | | | | | | | | | | | | | | | | | | | | | | | | | | | | | | | | | | | | | | | | | | | | | | | | | | | | | |
| 2009 | | | 20.63 | | | | .05 | | | | (4.15 | ) | | | (4.10 | ) | | | — | | | | — | | | | — | | | | — | | | | 16.53 | | | | (19.91 | ) | | | 5,709 | | | | 1.10 | | | | .31 | | | | 109 | |
| 2008 | | | 20.81 | | | | (.04 | ) | | | (.02 | ) | | | (.06 | ) | | | (.02 | ) | | | (.04 | ) | | | (.06 | ) | | | (.12 | ) | | | 20.63 | | | | (.28 | ) | | | 3,011 | | | | 1.09 | | | | (.25 | ) | | | 110 | |
| (a) | Per share Net Investment Income (Loss) is calculated using the average daily shares method. |
| (b) | Distributions from Capital Gains include short-term capital gains, if any. |
| (c) | Total Return is the combination of changes in net asset value without any sales charge, reinvested dividend income at net asset value and reinvested capital gains distributions at net asset value, if any. Total Return is not annualized. |
| (d) | After expense reimbursement from Nuveen Fund Advisors, where applicable. |
| (e) | Ratios do not reflect the effect of custodian fee credits earned on the Fund’s net cash on deposit with the custodian bank, where applicable. |
| (f) | For the period September 29, 2009 (commencement of operations) through September 30, 2009. |
| (g) | For the two months ended September 30, 2009. |
| ** | Rounds to less than $.01 per share. |
| *** | Rounds to less than .01%. |
42
Section 5 Financial Highlights
Nuveen Symphony Low Volatility Equity Fund
| | | | | | | | | | | | | | | | | | | | | | | | | | | | | | | | | | | | | | | | | | | | | | | | | | | | |
Class
(Commencement
Date) | | | | | Investment Operations | | | Less Distributions | | | | | | | | | Ratios/Supplemental Data | |
| | | Beginning
Net Asset
Value | | | Net
Investment
Income
(Loss)(a) | | | Net
Realized/
Unrealized
Gain (Loss) | | | Total | | | Net
Investment
Income | | | Capital
Gains(b) | | | Total | | | Ending
Net
Asset
Value | | | Total
Return(c) | | | Ending
Net
Assets
(000) | | | Ratios of
Expenses
to Average
Net
Assets(d)(e) | | | Ratios of
Net
Investment
Income
(Loss) to
Average
Net
Assets(d)(e) | | | Portfolio
Turnover
Rate | |
| | | | | | | | | | | | |
| Class A (9/07) | | | | | | | | | | | | | | | | | | | | | | | | | | | | | | | | | | | | | | | | | | | | | | | | | |
Year Ended 9/30: | | | | | | | | | | | | | | | | | | | | | | | | | | | | | | | | | | | | | | | | | | | | | | | | | |
| 2012 | | $ | 17.94 | | | $ | .29 | | | $ | 4.38 | | | $ | 4.67 | | | $ | (.18 | ) | | $ | — | | | $ | (.18 | ) | | $ | 22.43 | | | | 26.17 | % | | $ | 877 | | | | 1.23 | % | | | 1.42 | % | | | 85 | % |
| 2011 | | | 17.40 | | | | .20 | | | | .45 | | | | .65 | | | | (.11 | ) | | | — | | | | (.11 | ) | | | 17.94 | | | | 3.69 | | | | 702 | | | | 1.23 | | | | 1.02 | | | | 80 | |
| 2010 | | | 15.33 | | | | .05 | | | | 2.05 | | | | 2.10 | | | | (.03 | ) | | | — | | | | (.03 | ) | | | 17.40 | | | | 13.69 | | | | 376 | | | | 1.39 | | | | .30 | | | | 59 | |
| 2009(g) | | | 14.61 | | | | .01 | | | | .71 | | | | .72 | | | | — | | | | — | | | | — | | | | 15.33 | | | | 4.93 | | | | 310 | | | | 1.44 | * | | | .39 | * | | | 7 | |
Year Ended 7/31: | | | | | | | | | | | | | | | | | | | | | | | | | | | | | | | | | | | | | | | | | | | | | | | | | |
| 2009 | | | 18.27 | | �� | | .09 | | | | (3.70 | ) | | | (3.61 | ) | | | (.04 | ) | | | (.01 | ) | | | (.05 | ) | | | 14.61 | | | | (19.73 | ) | | | 277 | | | | 1.45 | | | | .65 | | | | 89 | |
| 2008(f) | | | 20.00 | | | | .01 | | | | (1.74 | ) | | | (1.73 | ) | | | — | | | | — | | | | — | | | | 18.27 | | | | (8.65 | ) | | | 278 | | | | 1.43 | * | | | .02 | * | | | 88 | |
| | | | | | | | | | | | |
| Class C (9/07) | | | | | | | | | | | | | | | | | | | | | | | | | | | | | | | | | | | | | | | | | | | | | | | | | |
Year Ended 9/30: | | | | | | | | | | | | | | | | | | | | | | | | | | | | | | | | | | | | | | | | | | | | | | | | | |
| 2012 | | | 17.58 | | | | .13 | | | | 4.30 | | | | 4.43 | | | | (.03 | ) | | | — | | | | (.03 | ) | | | 21.98 | | | | 25.24 | | | | 170 | | | | 1.98 | | | | .64 | | | | 85 | |
| 2011 | | | 17.08 | | | | .05 | | | | .45 | | | | .50 | | | | — | | | | — | | | | — | | | | 17.58 | | | | 2.93 | | | | 363 | | | | 1.98 | | | | .25 | | | | 80 | |
| 2010 | | | 15.14 | | | | (.08 | ) | | | 2.02 | | | | 1.94 | | | | — | | | | — | | | | — | | | | 17.08 | | | | 12.81 | | | | 221 | | | | 2.14 | | | | (.51 | ) | | | 59 | |
| 2009(g) | | | 14.45 | | | | (.01 | ) | | | .70 | | | | .69 | | | | — | | | | — | | | | — | | | | 15.14 | | | | 4.78 | | | | 296 | | | | 2.20 | * | | | (.39 | )* | | | 7 | |
Year Ended 7/31: | | | | | | | | | | | | | | | | | | | | | | | | | | | | | | | | | | | | | | | | | | | | | | | | | |
| 2009 | | | 18.16 | | | | (.01 | ) | | | (3.69 | ) | | | (3.70 | ) | | | — | | | | (.01 | ) | | | (.01 | ) | | | 14.45 | | | | (20.35 | ) | | | 282 | | | | 2.20 | | | | (.08 | ) | | | 89 | |
| 2008(f) | | | 20.00 | | | | (.11 | ) | | | (1.73 | ) | | | (1.84 | ) | | | — | | | | — | | | | — | | | | 18.16 | | | | (9.20 | ) | | | 227 | | | | 2.19 | * | | | (.74 | )* | | | 88 | |
| | | | | | | | | | | | |
| Class I (9/07) | | | | | | | | | | | | | | | | | | | | | | | | | | | | | | | | | | | | | | | | | | | | | | | | | |
Year Ended 9/30: | | | | | | | | | | | | | | | | | | | | | | | | | | | | | | | | | | | | | | | | | | | | | | | | | |
| 2012 | | | 17.97 | | | | .36 | | | | 4.38 | | | | 4.74 | | | | (.23 | ) | | | — | | | | (.23 | ) | | | 22.48 | | | | 26.56 | | | | 1,852 | | | | .98 | | | | 1.71 | | | | 85 | |
| 2011 | | | 17.43 | | | | .23 | | | | .46 | | | | .69 | | | | (.15 | ) | | | — | | | | (.15 | ) | | | 17.97 | | | | 3.91 | | | | 1,099 | | | | .98 | | | | 1.19 | | | | 80 | |
| 2010 | | | 15.35 | | | | .09 | | | | 2.05 | | | | 2.14 | | | | (.06 | ) | | | — | | | | (.06 | ) | | | 17.43 | | | | 13.97 | | | | 1,835 | | | | 1.14 | | | | .51 | | | | 59 | |
| 2009(g) | | | 14.63 | | | | .02 | | | | .70 | | | | .72 | | | | — | | | | — | | | | — | | | | 15.35 | | | | 4.92 | | | | 2,177 | | | | 1.19 | * | | | .61 | * | | | 7 | |
Year Ended 7/31: | | | | | | | | | | | | | | | | | | | | | | | | | | | | | | | | | | | | | | | | | | | | | | | | | |
| 2009 | | | 18.30 | | | | .12 | | | | (3.70 | ) | | | (3.58 | ) | | | (.08 | ) | | | (.01 | ) | | | (.09 | ) | | | 14.63 | | | | (19.49 | ) | | | 2,077 | | | | 1.20 | | | | .84 | | | | 89 | |
| 2008(f) | | | 20.00 | | | | .05 | | | | (1.75 | ) | | | (1.70 | ) | | | — | | | | — | | | | — | | | | 18.30 | | | | (8.50 | ) | | | 1,763 | | | | 1.19 | * | | | .30 | * | | | 88 | |
| (a) | Per share Net Investment Income (Loss) is calculated using the average daily shares method. |
| (b) | Distributions from Capital Gains include short-term capital gains, if any. |
| (c) | Total Return is the combination of changes in net asset value without any sales charge, reinvested dividend income at net asset value and reinvested capital gains distributions at net asset value, if any. Total Return is not annualized. |
| (d) | After expense reimbursement from Nuveen Fund Advisors, where applicable. |
| (e) | Ratios do not reflect the effect of custodian fee credits earned on the Fund’s net cash on deposit with the custodian bank, where applicable. |
| (f) | For the period September 28, 2007 (commencement of operations) through July 31, 2008. |
| (g) | For the two months ended September 30, 2009. |
Section 5 Financial Highlights
43
Nuveen Symphony Mid-Cap Core Fund
| | | | | | | | | | | | | | | | | | | | | | | | | | | | | | | | | | | | | | | | | | | | | | | | | | | | |
Class
(Commencement
Date) | | | | | Investment Operations | | | Less Distributions | | | | | | | | | Ratios/Supplemental Data | |
| | | Beginning
Net Asset
Value | | | Net
Investment
Income
(Loss)(a) | | | Net
Realized/
Unrealized
Gain (Loss) | | | Total | | | Net
Investment
Income | | | Capital
Gains(b) | | | Total | | | Ending
Net
Asset
Value | | | Total
Return(c) | | | Ending
Net
Assets
(000) | | | Ratios of
Expenses
to Average
Net
Assets(d)(e) | | | Ratios of Net
Investment
Income
(Loss) to
Average
Net
Assets(d)(e) | | | Portfolio
Turnover
Rate | |
| | | | | | | | | | | | |
| Class A (5/06) | | | | | | | | | | | | | | | | | | | | | | | | | | | | | | | | | | | | | | | | | | | | | | | | | |
Year Ended 9/30: | | | | | | | | | | | | | | | | | | | | | | | | | | | | | | | | | | | | | | | | | | | | | | | | | |
| 2012 | | $ | 19.95 | | | $ | .09 | | | $ | 5.02 | | | $ | 5.11 | | | $ | — | | | $ | — | | | $ | — | | | $ | 25.06 | | | | 25.66 | % | | $ | 2,026 | | | | 1.37 | % | | | .36 | % | | | 138 | % |
| 2011 | | | 20.54 | | | | .01 | | | | (.60 | ) | | | (.59 | ) | | | — | | | | — | | | | — | | | | 19.95 | | | | (2.87 | ) | | | 1,591 | | | | 1.38 | | | | .02 | | | | 93 | |
| 2010 | | | 17.29 | | | | — | ** | | | 3.28 | | | | 3.28 | | | | (.03 | ) | | | — | | | | (.03 | ) | | | 20.54 | | | | 18.96 | | | | 339 | | | | 1.39 | | | | .01 | | | | 82 | |
| 2009(g) | | | 15.87 | | | | .01 | | | | 1.41 | | | | 1.42 | | | | — | | | | — | | | | — | | | | 17.29 | | | | 8.95 | | | | 233 | | | | 1.40 | * | | | .54 | * | | | 17 | |
Year Ended 7/31: | | | | | | | | | | | | | | | | | | | | | | | | | | | | | | | | | | | | | | | | | | | | | | | | | |
| 2009 | | | 20.84 | | | | .02 | | | | (4.99 | ) | | | (4.97 | ) | | | — | | | | — | | | | — | | | | 15.87 | | | | (23.85 | ) | | | 214 | | | | 1.40 | | | | .08 | | | | 118 | |
| 2008 | | | 22.44 | | | | (.08 | ) | | | (.11 | ) | | | (.19 | ) | | | — | | | | (1.41 | ) | | | (1.41 | ) | | | 20.84 | | | | (.95 | ) | | | 261 | | | | 1.38 | | | | (.44 | ) | | | 99 | |
| | | | | | | | | | | | |
| Class C (5/06) | | | | | | | | | | | | | | | | | | | | | | | | | | | | | | | | | | | | | | | | | | | | | | | | | |
Year Ended 9/30: | | | | | | | | | | | | | | | | | | | | | | | | | | | | | | | | | | | | | | | | | | | | | | | | | |
| 2012 | | | 19.18 | | | | (.12 | ) | | | 4.86 | | | | 4.74 | | | | — | | | | — | | | | — | | | | 23.92 | | | | 24.77 | | | | 548 | | | | 2.12 | | | | (.54 | ) | | | 138 | |
| 2011 | | | 19.90 | | | | (.17 | ) | | | (.55 | ) | | | (.72 | ) | | | — | | | | — | | | | — | | | | 19.18 | | | | (3.62 | ) | | | 674 | | | | 2.13 | | | | (.75 | ) | | | 93 | |
| 2010 | | | 16.85 | | | | (.13 | ) | | | 3.18 | | | | 3.05 | | | | — | | | | — | | | | — | | | | 19.90 | | | | 18.10 | | | | 314 | | | | 2.14 | | | | (.74 | ) | | | 82 | |
| 2009(g) | | | 15.49 | | | | (.01 | ) | | | 1.37 | | | | 1.36 | | | | — | | | | — | | | | — | | | | 16.85 | | | | 8.78 | | | | 211 | | | | 2.14 | * | | | (.21 | )* | | | 17 | |
Year Ended 7/31: | | | | | | | | | | | | | | | | | | | | | | | | | | | | | | | | | | | | | | | | | | | | | | | | | |
| 2009 | | | 20.50 | | | | (.09 | ) | | | (4.92 | ) | | | (5.01 | ) | | | — | | | | — | | | | — | | | | 15.49 | | | | (24.44 | ) | | | 194 | | | | 2.15 | | | | (.66 | ) | | | 118 | |
| 2008 | | | 22.25 | | | | (.24 | ) | | | (.10 | ) | | | (.34 | ) | | | — | | | | (1.41 | ) | | | (1.41 | ) | | | 20.50 | | | | (1.66 | ) | | | 256 | | | | 2.14 | | | | (1.20 | ) | | | 99 | |
| | | | | | | | | | | | |
| Class R3 (5/09) | | | | | | | | | | | | | | | | | | | | | | | | | | | | | | | | | | | | | | | | | | | | | | | | | |
Year Ended 9/30: | | | | | | | | | | | | | | | | | | | | | | | | | | | | | | | | | | | | | | | | | | | | | | | | | |
| 2012 | | | 19.98 | | | | .02 | | | | 5.04 | | | | 5.06 | | | | — | | | | — | | | | — | | | | 25.04 | | | | 25.38 | | | | 272 | | | | 1.62 | | | | .10 | | | | 138 | |
| 2011 | | | 20.62 | | | | (.07 | ) | | | (.57 | ) | | | (.64 | ) | | | — | | | | — | | | | — | | | | 19.98 | | | | (3.10 | ) | | | 207 | | | | 1.63 | | | | (.28 | ) | | | 93 | |
| 2010 | | | 17.37 | | | | (.05 | ) | | | 3.30 | | | | 3.25 | | | | — | | | | — | | | | — | | | | 20.62 | | | | 18.71 | | | | 210 | | | | 1.64 | | | | (.25 | ) | | | 82 | |
| 2009(g) | | | 15.95 | | | | .01 | | | | 1.41 | | | | 1.42 | | | | — | | | | — | | | | — | | | | 17.37 | | | | 8.83 | | | | 177 | | | | 1.64 | * | | | .29 | * | | | 17 | |
Year Ended 7/31: | | | | | | | | | | | | | | | | | | | | | | | | | | | | | | | | | | | | | | | | | | | | | | | | | |
| 2009(f) | | | 14.73 | | | | (.02 | ) | | | 1.24 | | | | 1.22 | | | | — | | | | — | | | | — | | | | 15.95 | | | | 8.35 | | | | 162 | | | | 1.65 | * | | | (.69 | )* | | | 118 | |
| | | | | | | | | | | | |
| Class I (5/06) | | | | | | | | | | | | | | | | | | | | | | | | | | | | | | | | | | | | | | | | | | | | | | | | | |
Year Ended 9/30: | | | | | | | | | | | | | | | | | | | | | | | | | | | | | | | | | | | | | | | | | | | | | | | | | |
| 2012 | | | 20.15 | | | | .23 | | | | 5.01 | | | | 5.24 | | | | — | | | | — | | | | — | | | | 25.39 | | | | 26.00 | | | | 1,334 | | | | 1.12 | | | | .97 | | | | 138 | |
| 2011 | | | 20.70 | | | | .06 | | | | (.61 | ) | | | (.55 | ) | | | — | | | | — | | | | — | | | | 20.15 | | | | (2.66 | ) | | | 358 | | | | 1.13 | | | | .23 | | | | 93 | |
| 2010 | | | 17.41 | | | | .05 | | | | 3.30 | | | | 3.35 | | | | (.06 | ) | | | — | | | | (.06 | ) | | | 20.70 | | | | 19.30 | | | | 302 | | | | 1.14 | | | | .25 | | | | 82 | |
| 2009(g) | | | 15.98 | | | | .02 | | | | 1.41 | | | | 1.43 | | | | — | | | | — | | | | — | | | | 17.41 | | | | 8.95 | | | | 262 | | | | 1.14 | * | | | .79 | * | | | 17 | |
Year Ended 7/31: | | | | | | | | | | | | | | | | | | | | | | | | | | | | | | | | | | | | | | | | | | | | | | | | | |
| 2009 | | | 20.93 | | | | .06 | | | | (5.01 | ) | | | (4.95 | ) | | | — | | | | — | | | | — | | | | 15.98 | | | | (23.65 | ) | | | 233 | | | | 1.15 | | | | .40 | | | | 118 | |
| 2008 | | | 22.47 | | | | (.02 | ) | | | (.11 | ) | | | (.13 | ) | | | — | | | | (1.41 | ) | | | (1.41 | ) | | | 20.93 | | | | (.68 | ) | | | 518 | | | | 1.14 | | | | (.19 | ) | | | 99 | |
| (a) | Per share Net Investment Income (Loss) is calculated using the average daily shares method. |
| (b) | Distributions from Capital Gains include short-term capital gains, if any. |
| (c) | Total Return is the combination of changes in net asset value without any sales charge, reinvested dividend income at net asset value and reinvested capital gains distributions at net asset value, if any. Total Return is not annualized. |
| (d) | After expense reimbursement from Nuveen Fund Advisors, where applicable. |
| (e) | Ratios do not reflect the effect of custodian fee credits earned on the Fund’s net cash on deposit with the custodian bank, where applicable. |
| (f) | For the period May 5, 2009 (commencement of operations) through July 31, 2009. |
| (g) | For the two months ended September 30, 2009. |
| ** | Rounds to less than $.01 per share. |
44
Section 5 Financial Highlights
Section 6 Glossary of Investment Terms
| | • | | American Depositary Receipts (“ADRs”): Certificates issued by a U.S. depositary bank that represent a bank’s holdings of a stated number of shares of a non-U.S. company. ADRs are typically bought and sold in the same manner as U.S. securities (although investors can also purchase the non-U.S. securities overseas and convert them to ADRs, and likewise can convert an ADR to its underlying non-U.S. security and sell it overseas) and are priced in U.S. dollars. ADRs carry most of the risks of investing directly in non-U.S. equity securities. |
| | • | | Average cost basis method: Calculating cost basis by determining the average price paid for Fund shares that may have been purchased at different times for different prices. |
| | • | | Emerging markets: The financial markets of developing economies in countries with low per capita income in the initial stages of their industrialization cycles. They generally do not have the level of market efficiency and strict standards in accounting and securities regulation to be on par with advanced economies. Investments in emerging markets come with much greater risk due to political instability, domestic infrastructure problems, currency volatility and limited equity opportunities (many large companies may still be “state-run” or private). Also, local stock exchanges may not offer liquid markets for outside investors. |
| | • | | Lipper International Multi-Cap Growth Classification Average: Represents the average annualized total return for all reporting funds in the Lipper International Multi-Cap Growth Funds Classification. |
| | • | | Lipper Large-Cap Core Classification Average: Represents the average annualized total return for all reporting funds in the Lipper Large-Cap Core Funds Classification. |
| | • | | Lipper Mid-Cap Core Classification Average: Represents the average annualized total return for all reporting funds in the Lipper Mid-Cap Core Funds Classification. |
| | • | | Lipper Multi-Cap Growth Classification Average: Represents the average annualized total return for all reporting funds in the Lipper Multi-Cap Growth Funds Classification. |
| | • | | MSCI EAFE Index: The MSCI (Morgan Stanley Capital International) EAFE (Europe, Australasia, Far East) Index is a free float-adjusted market capitalization weighted index designed to measure developed market equity performance, excluding the U.S. and Canada. |
| | • | | Russell 1000® Growth Index: An index that measures the performance of those Russell 1000 companies with higher price-to-book ratios and higher forecasted growth values. |
| | • | | Russell 1000® Index: An index that measures the performance of the large cap segment of the U.S. equity universe which includes approximately 1000 of the largest securities based on a contribution of their market cap and current index measurement. |
| | • | | Russell Midcap® Index: An index constructed to provide a comprehensive and unbiased barometer for the mid-cap segment of the equity market which includes the smallest 800 securities within the Russell 1000® Index. |
| | • | | S&P 500® Index: An unmanaged index generally considered representative of the U.S. stock market. |
Section 6 Glossary of Investment Terms
45
Nuveen Mutual Funds
Nuveen offers a variety of mutual funds designed to help you reach your financial goals. The funds below are grouped by category.
Municipal-National
All-American Municipal Bond
High Yield Municipal Bond
Inflation Protected Municipal Bond
Intermediate Duration Municipal Bond
Limited Term Municipal Bond
Short Duration High Yield Municipal Bond
Short Term Municipal Bond
Municipal-State
Arizona Municipal Bond
California High Yield Municipal Bond
California Municipal Bond
Colorado Municipal Bond
Connecticut Municipal Bond
Georgia Municipal Bond
Kansas Municipal Bond
Kentucky Municipal Bond
Louisiana Municipal Bond
Maryland Municipal Bond
Massachusetts Municipal Bond
Michigan Municipal Bond
Minnesota Intermediate Municipal Bond
Minnesota Municipal Bond
Missouri Municipal Bond
Nebraska Municipal Bond
New Jersey Municipal Bond
New Mexico Municipal Bond
New York Municipal Bond
North Carolina Municipal Bond
Municipal-State (continued)
Ohio Municipal Bond
Oregon Intermediate Municipal Bond
Pennsylvania Municipal Bond
Tennessee Municipal Bond
Virginia Municipal Bond
Wisconsin Municipal Bond
Taxable Fixed Income
Core Bond
Core Plus Bond
Global Total Return Bond
High Income Bond
Inflation Protected Securities
Intermediate Government Bond
NWQ Flexible Income
Preferred Securities
Short Term Bond
Strategic Income
Symphony Credit Opportunities
Symphony Floating Rate Income
Symphony High Yield Bond
Global/International
Global Growth
International
International Growth
International Select
Santa Barbara Global Dividend Growth
Santa Barbara International Dividend Growth
Symphony International Equity
Global/International (continued)
Tradewinds Emerging Markets
Tradewinds Global All-Cap
Tradewinds Global Resources
Tradewinds International Value
Tradewinds Japan
Tradewinds Small-Cap Opportunities
Value
Dividend Value
Mid Cap Value
Multi-Manager Large-Cap Value
NWQ Large-Cap Value
NWQ Multi-Cap Value
NWQ Small-Cap Value
NWQ Small/Mid-Cap Value
Small Cap Value
Tradewinds Value Opportunities
Growth
Growth
Large Cap Growth Opportunities
Mid Cap Growth Opportunities
Small Cap Growth Opportunities
Symphony Large-Cap Growth
Winslow Large-Cap Growth
Core
Large Cap Select
Mid Cap Select
Santa Barbara Dividend Growth
Small Cap Select
Core (continued)
Symphony Low Volatility Equity
Symphony Mid-Cap Core
Real Assets
Global Infrastructure
Gresham Diversified Commodity Strategy
Real Asset Income
Real Estate Securities
Asset Allocation
Strategy Aggressive Growth Allocation
Strategy Balanced Allocation
Strategy Conservative Allocation
Strategy Growth Allocation
Quantitative/Enhanced
Quantitative Enhanced Core Equity
Index
Equity Index
Mid Cap Index
Small Cap Index
Non-Traditional Strategies
Gresham Long/Short Commodity Strategy
Intelligent Risk Conservative Allocation
Intelligent Risk Growth Allocation
Intelligent Risk Moderate Allocation
Tactical Market Opportunities
Several additional sources of information are available to you, including the codes of ethics adopted by the Funds, Nuveen Investments, Nuveen Fund Advisors and Symphony. The statement of additional information, incorporated by reference into this prospectus, contains detailed information on the policies and operation of the Funds included in this prospectus. Additional information about the Funds’ investments is available in the annual and semi-annual reports to shareholders. In the Funds’ annual reports, you will find a discussion of the market conditions and investment strategies that significantly affected the Funds’ performance during their last fiscal year. The Funds’ most recent statement of additional information, annual and semi-annual reports and certain other information are available, free of charge, by calling Nuveen Investor Services at (800) 257-8787, on the Funds’ website at www.nuveen.com, or through your financial advisor. Shareholders may call the toll free number above with any inquiries. The best sources for information regarding sales charges and distribution arrangements are the Funds’ prospectus and statement of additional information. The Funds have chosen to not separately disclose such information on their website because the prospectus and statement of additional information are made available free of charge on the website at www.nuveen.com.
You may also obtain this and other Fund information directly from the Securities and Exchange Commission (“SEC”). Reports and other information about the Funds are available on the EDGAR Database on the SEC’s website at http://www.sec.gov or in person at the SEC’s Public Reference Room in Washington, D.C. Call the SEC at (202) 551-8090 for room hours and operation. You may also request Fund information by sending an e-mail request to publicinfo@sec.gov or by writing to the SEC’s Public Reference Section at 100 F Street, NE, Washington, D.C. 20549-1520. The SEC may charge a copying fee for this information.
The Funds are series of Nuveen Investment Trust II, whose Investment Company Act file number is 811-08333.
Distributed by
Nuveen Securities, LLC
333 West Wacker Drive
Chicago, Illinois 60606
(800) 257-8787
www.nuveen.com
MPR-SYMPH-0513P
NUVEEN MID CAP SELECT FUND
SUPPLEMENT DATED APRIL 19, 2013
TO THE PROSPECTUS DATED FEBRUARY 28, 2013
Proposed Reorganization of
Nuveen Mid Cap Select Fund into
Nuveen Symphony Mid-Cap Core Fund
The Board of Directors/Trustees of Nuveen Investment Funds, Inc. (“NIF”) and Nuveen Investment Trust II (“NIT II”) has approved the reorganization of Nuveen Mid Cap Select Fund (the “Acquired Fund”), a series of NIF, into Nuveen Symphony Mid-Cap Core Fund (the “Acquiring Fund”), a series of NIT II. In order for the reorganization to occur, it must be approved by the shareholders of the Acquired Fund.
If the Acquired Fund’s shareholders approve the reorganization, the Acquired Fund will transfer all of its assets and liabilities to the Acquiring Fund in exchange for Acquiring Fund shares of equal value. These Acquiring Fund shares will then be distributed to Acquired Fund shareholders and the Acquired Fund will be terminated. As a result of these transactions, Acquired Fund shareholders will become shareholders of the Acquiring Fund and will cease to be shareholders of the Acquired Fund. Each Acquired Fund shareholder will receive Acquiring Fund shares with a total value equal to the total value of that shareholder’s Acquired Fund shares immediately prior to the closing of the reorganization.
A special meeting of the Acquired Fund’s shareholders for the purpose of voting on the reorganization is expected to be held in late August 2013. If the required approval is obtained, it is anticipated that the reorganization will be consummated shortly after the special shareholder meeting. Further information regarding the proposed reorganization will be contained in proxy materials that are expected to be sent to shareholders of the Acquired Fund in late July 2013.
The Acquired Fund will continue sales and redemptions of its shares as described in the prospectus until shortly before its reorganization. However, holders of shares purchased after the record date set for the Acquired Fund’s special meeting of shareholders will not be entitled to vote those shares at the special meeting.
PLEASE KEEP THIS WITH YOUR
PROSPECTUS
FOR FUTURE REFERENCE
MGN-MCSP-0413P
Mutual Funds
Prospectus
February 28, 2013, as supplemented June 24, 2013
Nuveen Equity Funds
For investors seeking the potential for long-term capital appreciation.
| | | | | | | | | | | | |
| | | Class / Ticker Symbol |
| | | | | | |
| Fund Name | | Class A | | Class B | | Class C | | Class R3 | | Class R6 | | Class I |
Nuveen Dividend Value Fund | | FFEIX | | FAEBX | | FFECX | | FEISX | | FFEFX | | FAQIX |
Nuveen Equity Index Fund | | FAEIX | | FAEQX | | FCEIX | | FADSX | | — | | FEIIX |
Nuveen International Fund | | FAIAX | | — | | FIACX | | ARQIX | | — | | FAICX |
Nuveen International Select Fund | | ISACX | | — | | ICCSX | | — | | — | | ISYCX |
Nuveen Large Cap Growth Opportunities Fund | | FRGWX | | FETBX | | FAWCX | | FLCYX | | FLCFX | | FIGWX |
Nuveen Large Cap Select Fund | | FLRAX | | — | | FLYCX | | — | | — | | FLRYX |
Nuveen Mid Cap Growth Opportunities Fund | | FRSLX | | FMQBX | | FMECX | | FMEYX | | FMEFX | | FISGX |
Nuveen Mid Cap Index Fund | | FDXAX | | — | | FDXCX | | FMCYX | | — | | FIMEX |
Nuveen Mid Cap Select Fund | | FATAX | | — | | FTACX | | — | | — | | FATCX |
Nuveen Mid Cap Value Fund | | FASEX | | FAESX | | FACSX | | FMVSX | | — | | FSEIX |
Nuveen Quantitative Enhanced Core Equity Fund | | FQCAX | | — | | FQCCX | | — | | — | | FQCYX |
Nuveen Small Cap Growth Opportunities Fund | | FRMPX | | FROBX | | FMPCX | | FMPYX | | — | | FIMPX |
Nuveen Small Cap Index Fund | | FMDAX | | — | | FPXCX | | ARSCX | | — | | ASETX |
Nuveen Small Cap Select Fund | | EMGRX | | ARSBX | | FHMCX | | ASEIX | | — | | ARSTX |
Nuveen Small Cap Value Fund | | FSCAX | | — | | FSCVX | | FSVSX | | — | | FSCCX |
Nuveen Tactical Market Opportunities Fund | | NTMAX | | — | | NTMCX | | — | | — | | FGTYX |
The Securities and Exchange Commission has not approved or disapproved these securities or passed upon the adequacy of this prospectus. Any representation to the contrary is a criminal offense.

Table of Contents
NOT FDIC OR GOVERNMENT INSURED MAY LOSE VALUE NO BANK GUARANTEE
ii
Section 1 Fund Summaries
Nuveen Dividend Value Fund
Investment Objective
The investment objective of the Fund is long-term growth of capital and income.
Fees and Expenses of the Fund
This table describes the fees and expenses that you may pay if you buy and hold shares of the Fund. You may qualify for sales charge discounts if you and your family invest, or agree to invest in the future, at least $50,000 in the Fund or in other Nuveen Mutual Funds. More information about these and other discounts, as well as eligibility requirements for each share class, is available from your financial advisor and in “What Share Classes We Offer” on page 99 of the Fund’s prospectus, “How to Reduce Your Sales Charge” on page 102 of the prospectus and “Purchase and Redemption of Fund Shares” on page S-99 of the Fund’s statement of additional information.
Shareholder Fees
(fees paid directly from your investment)
| | | | | | | | | | | | | | | | | | | | | | | | |
| | | Class A | | | Class B | | | Class C | | | Class R3 | | | Class R6 | | | Class I | |
Maximum Sales Charge (Load) Imposed on Purchases
(as a percentage of offering price) | | | 5.75% | | | | None | | | | None | | | | None | | | | None | | | | None | |
Maximum Deferred Sales Charge (Load)
(as a percentage of the lesser of purchase price or redemption proceeds)1 | | | None | | | | 5.00% | | | | 1.00% | | | | None | | | | None | | | | None | |
| Maximum Sales Charge (Load) Imposed on Reinvested Dividends | | | None | | | | None | | | | None | | | | None | | | | None | | | | None | |
| Exchange Fee | | | None | | | | None | | | | None | | | | None | | | | None | | | | None | |
| Annual Low Balance Account Fee (for accounts under $1,000)2 | | | $15 | | | | $15 | | | | $15 | | | | None | | | | None | | | | $15 | |
Annual Fund Operating Expenses
(expenses that you pay each year as a percentage of the value of your investment)
| | | | | | | | | | | | | | | | | | | | | | | | |
| | | Class A | | | Class B | | | Class C | | | Class R3 | | | Class R63 | | | Class I | |
| Management Fees | | | 0.76% | | | | 0.76% | | | | 0.76% | | | | 0.76% | | | | 0.76% | | | | 0.76% | |
| Distribution and/or Service (12b-1) Fees | | | 0.25% | | | | 1.00% | | | | 1.00% | | | | 0.50% | | | | 0.00% | | | | 0.00% | |
| Other Expenses4 | | | 0.14% | | | | 0.14% | | | | 0.14% | | | | 0.14% | | | | 0.09% | | | | 0.14% | |
| Total Annual Fund Operating Expenses | | | 1.15% | | | | 1.90% | | | | 1.90% | | | | 1.40% | | | | 0.85% | | | | 0.90% | |
| 1 | The contingent deferred sales charge (“CDSC”) on Class B shares declines over a six-year period from purchase. The CDSC on Class C shares applies only to redemptions within 12 months of purchase. |
| 2 | Fee applies to the following types of accounts under $1,000 held directly with the Fund: individual retirement accounts (IRAs), Coverdell Education Savings Accounts and accounts established pursuant to the Uniform Transfers to Minors Act (UTMA) or Uniform Gifts to Minors Act (UGMA). |
| 3 | Class R6 shares were established on February 28, 2013. Accordingly, expenses are based upon the actual expenses incurred by the other share classes; adjusted to reflect anticipated savings resulting from the fact that sub-transfer agent and similar fees are not charged to Class R6 shares. |
| 4 | Other Expenses have been restated to reflect current contractual fees. |
Example
The following example is intended to help you compare the cost of investing in the Fund with the cost of investing in other mutual funds. The example assumes that you invest $10,000 in the Fund for the time periods indicated and then either redeem or do not redeem your shares at the end of a period. The example also assumes that your investment has a 5% return each year and that the Fund’s operating expenses remain the same. Although your actual costs may be higher or lower, based on these assumptions your costs would be:
| | | | | | | | | | | | | | | | | | | | | | | | | | | | | | | | | | | | | | | | | | | | | | | | | | | | |
| | | Redemption | | | | | No Redemption | | | |
| | | A | | | B | | | C | | | R3 | | | R6 | | | I | | | | | A | | | B | | | C | | | R3 | | | R6 | | | I | | | |
| 1 Year | | $ | 685 | | | $ | 693 | | | $ | 193 | | | $ | 143 | | | $ | 87 | | | $ | 92 | | | | | $ | 685 | | | $ | 193 | | | $ | 193 | | | $ | 143 | | | $ | 87 | | | $ | 92 | | | |
| 3 Years | | $ | 919 | | | $ | 897 | | | $ | 597 | | | $ | 443 | | | $ | 271 | | | $ | 287 | | | | | $ | 919 | | | $ | 597 | | | $ | 597 | | | $ | 443 | | | $ | 271 | | | $ | 287 | | | |
| 5 Years | | $ | 1,172 | | | $ | 1,126 | | | $ | 1,026 | | | $ | 766 | | | $ | 471 | | | $ | 498 | | | | | $ | 1,172 | | | $ | 1,026 | | | $ | 1,026 | | | $ | 766 | | | $ | 471 | | | $ | 498 | | | |
| 10 Years | | $ | 1,892 | | | $ | 2,027 | | | $ | 2,222 | | | $ | 1,680 | | | $ | 1,049 | | | $ | 1,108 | | | | | $ | 1,892 | | | $ | 2,027 | | | $ | 2,222 | | | $ | 1,680 | | | $ | 1,049 | | | $ | 1,108 | | | |
2
Section 1 Fund Summaries
Portfolio Turnover
The Fund pays transaction costs, such as commissions, when it buys and sells securities (or “turns over” its portfolio). A higher portfolio turnover rate may indicate higher transaction costs and may result in higher taxes when Fund shares are held in a taxable account. These costs, which are not reflected in annual fund operating expenses or in the example, affect the Fund’s performance. During the most recent fiscal year, the Fund’s portfolio turnover rate was 24% of the average value of its portfolio.
Principal Investment Strategies
Under normal market conditions, the Fund invests at least 80% of its net assets, plus the amount of any borrowings for investment purposes, in equity securities. In selecting securities, the Fund’s sub-adviser will invest in companies that it believes have the ability to pay above average dividends and finance expected growth and are trading at attractive valuations. The Fund’s sub-adviser will generally sell a security if the security is no longer expected to meet the sub-adviser’s dividend or growth expectations or if a better alternative exists in the marketplace.
The Fund will attempt to maintain a dividend that will grow over time. As a result, higher-yielding equity securities will generally represent the core holdings of the Fund. However, the Fund also may invest in lower-yielding, higher-growth equity securities if the sub-adviser believes they will help balance the portfolio. The Fund’s equity securities include common stocks, convertible preferred stocks, and corporate debt securities that are convertible into common stocks. All such equity securities will provide current income at the time of purchase.
The Fund invests in convertible debt securities in pursuit of both long-term growth of capital and income. The securities’ conversion features provide long-term growth potential, while interest payments on the securities provide income. The Fund may invest in convertible debt securities without regard to their ratings, and therefore may hold convertible debt securities which are rated lower than investment grade.
The Fund may invest up to 15% of its total assets in non-dollar denominated equity securities of non-U.S. issuers. In addition, the Fund may invest up to 25% of its assets, collectively, in non-dollar denominated equity securities of non-U.S. issuers and in dollar-denominated equity securities of non-U.S. issuers that are either listed on a U.S. stock exchange or represented by depositary receipts that may or may not be sponsored by a domestic bank. Up to 15% of the Fund’s total assets may be invested in equity securities of emerging market issuers. A country is considered to be an “emerging market” if it is defined as such by Morgan Stanley Capital International Inc.
The Fund may utilize options, futures contracts, options on futures contracts, and forward foreign currency exchange contracts (“derivatives”). The Fund may use these derivatives to manage market or business risk, enhance the Fund’s return, or hedge against adverse movements in currency exchange rates.
Principal Risks
The value of your investment in this Fund will change daily, which means you could lose money. An investment in the Fund is not a deposit of a bank and is not insured or guaranteed by the Federal Deposit Insurance Corporation or any other government agency. The principal risks of investing in the Fund include:
Credit Risk—Credit risk is the risk that an issuer of a debt security may be unable or unwilling to make interest and principal payments when due and the related risk that the value of a debt security may decline because of concerns about the issuer’s ability or willingness to make such payments. In addition, parties to other financial contracts with the Fund could default on their obligations.
Derivatives Risk—The use of derivatives involves additional risks, such as liquidity, interest rate, counterparty, market, credit and management risks, and transaction costs which could leave the Fund in a worse position than if it had not used these instruments. Derivatives may entail investment exposures that are greater than their cost would suggest. As a result, a small investment in derivatives could have a large impact on performance. Recent legislation requires the development of a new regulatory framework for the derivatives market. The impact of the new regulations is still unknown, but has the potential to increase the costs of using derivatives, may limit the availability of some forms of derivatives or the Fund’s ability to use derivatives, and may adversely affect the performance of some derivative instruments used by the Fund as well as the Fund’s ability to pursue its investment objective through the use of such instruments.
Section 1 Fund Summaries
3
Equity Security Risk—Equity securities may decline significantly in price over short or extended periods of time, and such declines may occur in the equity market as a whole, or they may occur in only a particular country, company, industry, or sector of the market.
High Yield Securities Risk—High yield securities are high risk investments that may cause income and principal losses for the Fund. They generally have greater credit risk, are less liquid and have more volatile prices than investment grade securities.
Interest Rate Risk—Interest rate risk is the risk that the value of the Fund’s portfolio will decline because of rising interest rates. When interest rates change, the values of longer-duration debt securities usually change more than the values of shorter-duration debt securities.
Non-U.S./Emerging Markets Risk—Non-U.S. issuers or U.S. issuers with significant non-U.S. operations may be subject to risks in addition to those of issuers located in or that principally operate in the United States as a result of, among other things, political, social and economic developments abroad and different legal, regulatory and tax environments. These additional risks may be heightened for securities of issuers located in, or with significant operations in, emerging market countries. Also, changes in currency exchange rates may affect the Fund’s net asset value, the value of dividends and interest earned, and gains and losses realized on the sale of securities.
Fund Performance
The following bar chart and table provide some indication of the potential risks of investing in the Fund. The Fund’s past performance (before and after taxes) is not necessarily an indication of how the Fund will perform in the future. Updated performance information is available at www.nuveen.com/performance or by calling (800) 257-8787.
The bar chart below shows the variability of the Fund’s performance from year to year for Class A shares. The performance of the other share classes will differ due to their different expense structures. The bar chart and highest/lowest quarterly returns that follow do not reflect sales charges, and if these charges were reflected, the returns would be less than those shown.
Class A Annual Total Return
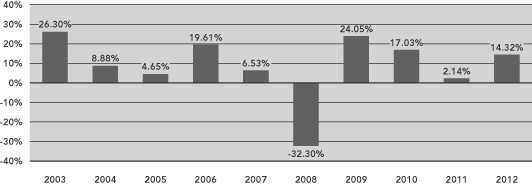
During the ten-year period ended December 31, 2012, the Fund’s highest and lowest quarterly returns were 16.68% and -17.11%, respectively, for the quarters ended June 30, 2003 and December 31, 2008.
The table below shows the variability of the Fund’s average annual returns and how they compare over the time periods indicated with those of a broad measure of market performance and an index of funds with similar investment objectives. All after-tax returns are calculated using the historical highest individual federal marginal income tax rates and do not reflect the impact of state and local taxes. After-tax returns are shown for Class A shares only; after-tax returns for other share classes will vary. Your own actual after-tax returns will depend on your specific tax situation and may differ from what is shown here. After-tax returns are not relevant to investors who hold Fund shares in tax-deferred accounts such as IRAs or employer-sponsored retirement plans.
4
Section 1 Fund Summaries
Both the bar chart and the table assume that all distributions have been reinvested. Performance reflects fee waivers, if any, in effect during the periods presented. If any such waivers were not in place, returns would be reduced.
Prior to July 1, 2004, Class R3 shares were designated Class S shares, which had lower fees and expenses. The performance information in the table prior to July 1, 2004 is based on the performance of the Class S shares. If current fees and expenses had been in effect, performance would have been lower.
Performance is not shown for Class R6 shares, which have not been offered for a full calendar year.
| | | | | | | | | | | | |
| | | Average Annual Total Returns
for the Periods Ended December 31, 2012 | |
| | | 1 Year | | | 5 Years | | | 10 Years | |
| Class A (return before taxes) | | | 7.72 | % | | | 1.59 | % | | | 7.08 | % |
| Class A (return after taxes on distributions) | | | 6.95 | % | | | 1.11 | % | | | 6.42 | % |
| Class A (return after taxes on distributions and sale of Fund shares) | | | 6.02 | % | | | 1.27 | % | | | 6.12 | % |
| Class B (return before taxes) | | | 8.52 | % | | | 1.84 | % | | | 6.92 | % |
| Class C (return before taxes) | | | 12.50 | % | | | 1.85 | % | | | 6.83 | % |
| Class R3 (return before taxes) | | | 14.06 | % | | | 2.52 | % | | | 7.49 | % |
| Class I (return before taxes) | | | 14.59 | % | | | 3.04 | % | | | 7.99 | % |
Russell 1000® Value Index
(reflects no deduction for fees, expenses or taxes) | | | 17.51 | % | | | 0.59 | % | | | 7.38 | % |
Lipper Equity Income Classification Average
(reflects no deduction for taxes or certain expenses) | | | 12.45 | % | | | 1.81 | % | | | 7.46 | % |
Management
Investment Adviser
Nuveen Fund Advisors, LLC
Sub-Adviser
Nuveen Asset Management, LLC
Portfolio Managers
| | | | |
Name | | Title | | Portfolio Manager of Fund Since |
| Cori B. Johnson, CFA | | Senior Vice President | | August 1994 |
| Derek M. Sadowsky | | Vice President | | February 2012 |
Section 1 Fund Summaries
5
Purchase and Sale of Fund Shares
You may purchase, redeem or exchange shares of the Fund on any business day, which is any day the New York Stock Exchange is open for business. You may purchase, redeem or exchange shares of the Fund either through a financial advisor or other financial intermediary or directly from the Fund. Class B shares are available only through exchanges and dividend reinvestments by current Class B shareholders. The Fund’s initial and subsequent investment minimums generally are as follows, although the Fund may reduce or waive the minimums in some cases:
| | | | | | | | |
| | | Class A and Class C | | Class R3 | | Class R6 | | Class I |
| Eligibility and Minimum Initial Investment | | $3,000 for all accounts except: •$2,500 for Traditional/Roth IRA accounts. •$2,000 for Coverdell Education Savings Accounts. •$250 for accounts opened
through fee-based programs. •No minimum for retirement
plans. | | Available only
through certain
retirement plans. No minimum. | | Available only to certain qualified retirement plans and other investors as described in the prospectus. $5 million for all accounts except: •No minimum for certain qualified retirement plans as described in the prospectus. | | Available only through fee-based programs and certain retirement plans, and to other limited categories of investors as described in the prospectus. $100,000 for all accounts except: •$250 for clients of financial intermediaries and family offices that have accounts holding Class I shares with an aggregate value of at least $100,000 (or that are expected to reach this level). •No minimum for eligible retirement plans and certain other categories of eligible investors as described in the prospectus. |
| Minimum Additional Investment | | $100 | | No minimum. | | No minimum. | | No minimum. |
Tax Information
The Fund’s distributions are taxable and will generally be taxed as ordinary income or capital gains, unless you are investing through a tax-deferred account, such as an IRA or 401(k) plan.
Payments to Broker-Dealers and Other Financial Intermediaries
If you purchase shares of the Fund through a broker-dealer or other financial intermediary (such as a bank or financial advisor), the Fund, its distributor or its investment adviser may pay the intermediary for the sale of Fund shares and related services. These payments may create a conflict of interest by influencing the broker-dealer or other financial intermediary and your salesperson to recommend the Fund over another investment. Ask your financial advisor or visit your financial intermediary’s website for more information.
6
Section 1 Fund Summaries
Nuveen Equity Index Fund
Investment Objective
The investment objective of the Fund is to provide investment results that correspond to the performance of the Standard & Poor’s 500® Index (S&P 500 Index).
Fees and Expenses of the Fund
This table describes the fees and expenses that you may pay if you buy and hold shares of the Fund. You may qualify for sales charge discounts if you and your family invest, or agree to invest in the future, at least $50,000 in the Fund or in other Nuveen Mutual Funds. More information about these and other discounts, as well as eligibility requirements for each share class, is available from your financial advisor and in “What Share Classes We Offer” on page 99 of the Fund’s prospectus and “Purchase and Redemption of Fund Shares” on page S-99 of the Fund’s statement of additional information.
Shareholder Fees
(fees paid directly from your investment)
| | | | | | | | | | | | | | | | | | | | |
| | | Class A | | | Class B | | | Class C | | | Class R3 | | | Class I | |
Maximum Sales Charge (Load) Imposed on Purchases
(as a percentage of offering price) | | | None | | | | None | | | | None | | | | None | | | | None | |
Maximum Deferred Sales Charge (Load)
(as a percentage of the lesser of purchase price or redemption proceeds)1 | | | None | | | | 5.00% | | | | 1.00% | | | | None | | | | None | |
| Maximum Sales Charge (Load) Imposed on Reinvested Dividends | | | None | | | | None | | | | None | | | | None | | | | None | |
| Exchange Fee | | | None | | | | None | | | | None | | | | None | | | | None | |
| Annual Low Balance Account Fee (for accounts under $1,000)2 | | | $15 | | | | $15 | | | | $15 | | | | None | | | | $15 | |
Annual Fund Operating Expenses
(expenses that you pay each year as a percentage of the value of your investment)
| | | | | | | | | | | | | | | | | | | | |
| | | Class A | | | Class B | | | Class C | | | Class R3 | | | Class I | |
| Management Fees | | | 0.28% | | | | 0.28% | | | | 0.28% | | | | 0.28% | | | | 0.28% | |
| Distribution and/or Service (12b-1) Fees | | | 0.25% | | | | 1.00% | | | | 1.00% | | | | 0.50% | | | | 0.00% | |
| Other Expenses | | | 0.16% | | | | 0.16% | | | | 0.16% | | | | 0.16% | | | | 0.16% | |
| Total Annual Fund Operating Expenses | | | 0.69% | | | | 1.44% | | | | 1.44% | | | | 0.94% | | | | 0.44% | |
| Fee Waivers and/or Expense Reimbursements3 | | | (0.07)% | | | | (0.07)% | | | | (0.07)% | | | | (0.07)% | | | | (0.07)% | |
| Total Annual Fund Operating Expenses After Fee Waivers and/or Expense Reimbursements | | | 0.62% | | | | 1.37% | | | | 1.37% | | | | 0.87% | | | | 0.37% | |
| 1 | The contingent deferred sales charge (“CDSC”) on Class B shares declines over a six-year period from purchase. The CDSC on Class C shares applies only to redemptions within 12 months of purchase. |
| 2 | Fee applies to the following types of accounts under $1,000 held directly with the Fund: individual retirement accounts (IRAs), Coverdell Education Savings Accounts and accounts established pursuant to the Uniform Transfers to Minors Act (UTMA) or Uniform Gifts to Minors Act (UGMA). |
| 3 | The Fund’s investment adviser has contractually agreed to waive fees and/or reimburse other Fund expenses through February 28, 2014 so that total annual fund operating expenses, after fee waivers and/or expense reimbursements and excluding Acquired Fund Fees and Expenses, do not exceed 0.62%, 1.37%, 1.37%, 0.87%, and 0.37% for Class A, Class B, Class C, Class R3 and Class I shares, respectively. Fee waivers and/or expense reimbursements will not be terminated prior to that time without the approval of the Fund’s board of directors. |
Section 1 Fund Summaries
7
Example
The following example is intended to help you compare the cost of investing in the Fund with the cost of investing in other mutual funds. The example assumes that you invest $10,000 in the Fund for the time periods indicated and then either redeem or do not redeem your shares at the end of a period. The example also assumes that your investment has a 5% return each year, that the Fund’s operating expenses remain the same, and the contractual fee waivers currently in place are not renewed beyond February 28, 2014. Although your actual costs may be higher or lower, based on these assumptions your costs would be:
| | | | | | | | | | | | | | | | | | | | | | | | | | | | | | | | | | | | | | | | | | | | |
| | | Redemption | | No Redemption | | | |
| | | A | | | B | | | C | | | R3 | | | I | | | | | A | | | B | | | C | | | R3 | | | I | | | |
| 1 Year | | $ | 63 | | | $ | 639 | | | $ | 139 | | | $ | 89 | | | $ | 38 | | | | | $ | 63 | | | $ | 139 | | | $ | 139 | | | $ | 89 | | | $ | 38 | | | |
| 3 Years | | $ | 214 | | | $ | 749 | | | $ | 449 | | | $ | 293 | | | $ | 134 | | | | | $ | 214 | | | $ | 449 | | | $ | 449 | | | $ | 293 | | | $ | 134 | | | |
| 5 Years | | $ | 377 | | | $ | 880 | | | $ | 780 | | | $ | 513 | | | $ | 239 | | | | | $ | 377 | | | $ | 780 | | | $ | 780 | | | $ | 513 | | | $ | 239 | | | |
| 10 Years | | $ | 852 | | | $ | 1,514 | | | $ | 1,718 | | | $ | 1,148 | | | $ | 548 | | | | | $ | 852 | | | $ | 1,514 | | | $ | 1,718 | | | $ | 1,148 | | | $ | 548 | | | |
Portfolio Turnover
The Fund pays transaction costs, such as commissions, when it buys and sells securities (or “turns over” its portfolio). A higher portfolio turnover rate may indicate higher transaction costs and may result in higher taxes when Fund shares are held in a taxable account. These costs, which are not reflected in annual fund operating expenses or in the example, affect the Fund’s performance. During the most recent fiscal year, the Fund’s portfolio turnover rate was 1% of the average value of its portfolio.
Principal Investment Strategies
Under normal market conditions, the Fund generally invests at least 90% of its net assets, plus the amount of any borrowings for investment purposes, in common stocks included in the S&P 500 Index. The S&P 500 Index is an unmanaged market-value weighted index consisting of 500 stocks chosen for market size, liquidity, sector performance and other factors. The index tracks the performance of the large cap U.S. equity market. Reconstitution of the index occurs both on a quarterly and ongoing basis. As of January 31, 2013, market capitalizations of companies in the S&P 500 Index ranged from approximately $1.8 billion to $427.7 billion.
The Fund’s sub-adviser believes that the Fund’s objective can best be achieved by investing in common stocks of approximately 90% to 100% of the issues included in the S&P 500 Index, depending on the size of the Fund. A computer program is used to identify which stocks should be purchased or sold in order to replicate, as closely as possible, the composition of the S&P 500 Index.
Because the Fund may not always hold all of the stocks included in the S&P 500 Index, and because the Fund has expenses and the index does not, the Fund will not duplicate the index’s performance precisely. However, the Fund’s sub-adviser believes there should be a close correlation between the Fund’s performance and that of the S&P 500 Index in both rising and falling markets. The Fund will attempt to achieve a correlation between the performance of its portfolio and that of the S&P 500 Index of at least 95%, without taking into account expenses of the Fund. A perfect correlation would be indicated by a figure of 100%, which would be achieved if the Fund’s net asset value, including the value of its dividends and capital gains distributions, increased or decreased in exact proportion to changes in the S&P 500 Index. If the Fund is unable to achieve a correlation of 95% over time, the Fund’s board of directors will consider alternative strategies for the Fund.
The Fund may invest in stock index futures contracts, options on stock indices, and options on stock index futures (“derivatives”) on the S&P 500 Index. The Fund makes these investments to maintain the liquidity needed to meet redemption requests, to increase the level of Fund assets devoted to replicating the composition of the S&P 500 Index, and to reduce transaction costs.
8
Section 1 Fund Summaries
Principal Risks
The value of your investment in this Fund will change daily, which means you could lose money. An investment in the Fund is not a deposit of a bank and is not insured or guaranteed by the Federal Deposit Insurance Corporation or any other government agency. The principal risks of investing in the Fund include:
Derivatives Risk—The use of derivatives involves additional risks, such as liquidity, interest rate, counterparty, market, credit and management risks, and transaction costs which could leave the Fund in a worse position than if it had not used these instruments. Derivatives may entail investment exposures that are greater than their cost would suggest. As a result, a small investment in derivatives could have a large impact on performance. Recent legislation requires the development of a new regulatory framework for the derivatives market. The impact of the new regulations is still unknown, but has the potential to increase the costs of using derivatives, may limit the availability of some forms of derivatives or the Fund’s ability to use derivatives, and may adversely affect the performance of some derivative instruments used by the Fund as well as the Fund’s ability to pursue its investment objective through the use of such instruments.
Equity Security Risk—Equity securities may decline significantly in price over short or extended periods of time, and such declines may occur in the equity market as a whole, or they may occur in only a particular country, company, industry, or sector of the market.
Failure to Match Index Performance—The Fund may not replicate the performance of the S&P 500 Index.
Fund Performance
The following bar chart and table provide some indication of the potential risks of investing in the Fund. The Fund’s past performance (before and after taxes) is not necessarily an indication of how the Fund will perform in the future. Updated performance information is available at www.nuveen.com/performance or by calling (800) 257-8787.
The bar chart below shows the variability of the Fund’s performance from year to year for Class A shares. The performance of the other share classes will differ due to their different expense structures.
Class A Annual Total Return
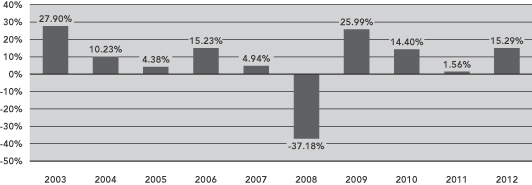
During the ten-year period ended December 31, 2012, the Fund’s highest and lowest quarterly returns were 15.79% and -22.00%, respectively, for the quarters ended June 30, 2009 and December 31, 2008.
The table below shows the variability of the Fund’s average annual returns and how they compare over the time periods indicated with those of a broad measure of market performance and an index of funds with similar investment objectives. All after-tax returns are calculated using the historical highest individual federal marginal income tax rates and do not reflect the impact of state and local taxes. After-tax returns are shown for Class A shares only; after-tax returns for other share classes will vary. Your own actual after-tax returns will depend on your specific tax situation and may differ from what is shown here. After-tax returns are not relevant to investors who hold Fund shares in tax-deferred accounts such as IRAs or employer-sponsored retirement plans.
Section 1 Fund Summaries
9
Both the bar chart and the table assume that all distributions have been reinvested. Performance reflects fee waivers, if any, in effect during the periods presented. If any such waivers were not in place, returns would be reduced.
Prior to July 1, 2004, Class R3 shares were designated Class S shares, which had lower fees and expenses. The performance information in the table prior to July 1, 2004 is based on the performance of the Class S shares. If current fees and expenses had been in effect, performance would have been lower.
| | | | | | | | | | | | |
| | | Average Annual Total Returns
for the Periods Ended December 31, 2012 | |
| | | 1 Year | | | 5 Years | | | 10 Years | |
| Class A (return before taxes) | | | 15.29 | % | | | 1.18 | % | | | 6.55 | % |
| Class A (return after taxes on distributions) | | | 14.58 | % | | | 0.43 | % | | | 6.00 | % |
| Class A (return after taxes on distributions and sale of Fund shares) | | | 10.87 | % | | | 0.90 | % | | | 5.69 | % |
| Class B (return before taxes) | | | 9.47 | % | | | 0.25 | % | | | 5.75 | % |
| Class C (return before taxes) | | | 14.42 | % | | | 0.42 | % | | | 5.75 | % |
| Class R3 (return before taxes) | | | 14.98 | % | | | 0.92 | % | | | 6.32 | % |
| Class I (return before taxes) | | | 15.59 | % | | | 1.42 | % | | | 6.81 | % |
| S&P 500® Index (reflects no deduction for fees, expenses or taxes) | | | 16.00 | % | | | 1.66 | % | | | 7.10 | % |
Lipper S&P 500® Index Objective Classification Average
(reflects no deduction for taxes or certain expenses) | | | 15.33 | % | | | 1.12 | % | | | 6.57 | % |
Management
Investment Adviser
Nuveen Fund Advisors, LLC
Sub-Adviser
Nuveen Asset Management, LLC
Portfolio Managers
| | | | |
Name | | Title | | Portfolio Manager of Fund Since |
| Walter A. French | | Senior Vice President | | October 1999 |
| David A. Friar | | Assistant Vice President | | September 2000 |
10
Section 1 Fund Summaries
Purchase and Sale of Fund Shares
You may purchase, redeem or exchange shares of the Fund on any business day, which is any day the New York Stock Exchange is open for business. You may purchase, redeem or exchange shares of the Fund either through a financial advisor or other financial intermediary or directly from the Fund. Class B shares are available only through exchanges and dividend reinvestments by current Class B shareholders. The Fund’s initial and subsequent investment minimums generally are as follows, although the Fund may reduce or waive the minimums in some cases:
| | | | | | | | |
| | | Class A | | Class C | | Class R3 | | Class I |
Eligibility and Minimum Initial Investment | | Available only through fee-based programs and certain retirement plans. •$250 minimum for accounts opened through fee-based programs. •No minimum for retirement plans. | | $3,000 for all accounts except: •$2,500 for Traditional/Roth IRA accounts. •$2,000 for Coverdell Education Savings Accounts. •$250 for accounts opened through fee-based programs. •No minimum for retirement plans. | | Available only through certain retirement plans. No minimum. | | Available only through fee-based programs and certain retirement plans, and to other limited categories of investors as described in the prospectus. $100,000 for all accounts except: •$250 for clients of financial intermediaries and family offices that have accounts holding Class I shares with an aggregate value of at least $100,000 (or that are expected to reach this level). •No minimum for eligible retirement plans and certain other categories of eligible investors as described in the prospectus. |
| Minimum Additional Investment | | $100 | | $100 | | No minimum. | | No minimum. |
Tax Information
The Fund’s distributions are taxable and will generally be taxed as ordinary income or capital gains, unless you are investing through a tax-deferred account, such as an IRA or 401(k) plan.
Payments to Broker-Dealers and Other Financial Intermediaries
If you purchase shares of the Fund through a broker-dealer or other financial intermediary (such as a bank or financial advisor), the Fund, its distributor or its investment adviser may pay the intermediary for the sale of Fund shares and related services. These payments may create a conflict of interest by influencing the broker-dealer or other financial intermediary and your salesperson to recommend the Fund over another investment. Ask your financial advisor or visit your financial intermediary’s website for more information.
Section 1 Fund Summaries
11
Nuveen International Fund
Investment Objective
The investment objective of the Fund is long-term growth of capital.
Fees and Expenses of the Fund
This table describes the fees and expenses that you may pay if you buy and hold shares of the Fund. You may qualify for sales charge discounts if you and your family invest, or agree to invest in the future, at least $50,000 in the Fund or in other Nuveen Mutual Funds. More information about these and other discounts, as well as eligibility requirements for each share class, is available from your financial advisor and in “What Share Classes We Offer” on page 99 of the Fund’s prospectus, “How to Reduce Your Sales Charge” on page 102 of the prospectus and “Purchase and Redemption of Fund Shares” on page S-99 of the Fund’s statement of additional information.
Shareholder Fees
(fees paid directly from your investment)
| | | | | | | | | | | | | | | | |
| | | Class A | | | Class C | | | Class R3 | | | Class I | |
Maximum Sales Charge (Load) Imposed on Purchases
(as a percentage of offering price) | | | 5.75% | | | | None | | | | None | | | | None | |
Maximum Deferred Sales Charge (Load)
(as a percentage of the lesser of purchase price or redemption proceeds)1 | | | None | | | | 1.00% | | | | None | | | | None | |
| Maximum Sales Charge (Load) Imposed on Reinvested Dividends | | | None | | | | None | | | | None | | | | None | |
| Exchange Fee | | | None | | | | None | | | | None | | | | None | |
| Annual Low Balance Account Fee (for accounts under $1,000)2 | | | $15 | | | | $15 | | | | None | | | | $15 | |
Annual Fund Operating Expenses
(expenses that you pay each year as a percentage of the value of your investment)
| | | | | | | | | | | | | | | | |
| | | Class A | | | Class C | | | Class R3 | | | Class I | |
| Management Fees | | | 1.04% | | | | 1.04% | | | | 1.04% | | | | 1.04% | |
| Distribution and/or Service (12b-1) Fees | | | 0.25% | | | | 1.00% | | | | 0.50% | | | | 0.00% | |
| Other Expenses3 | | | 0.66% | | | | 0.66% | | | | 0.68% | | | | 0.66% | |
| Acquired Fund Fees and Expenses | | | 0.04% | | | | 0.04% | | | | 0.04% | | | | 0.04% | |
| Total Annual Fund Operating Expenses | | | 1.99% | | | | 2.74% | | | | 2.26% | | | | 1.74% | |
| Fee Waivers and/or Expense Reimbursements3,4 | | | (0.46)% | | | | (0.46)% | | | | (0.48)% | | | | (0.46)% | |
| Total Annual Fund Operating Expenses After Fee Waivers and/or Expense Reimbursements | | | 1.53% | | | | 2.28% | | | | 1.78% | | | | 1.28% | |
| 1 | The contingent deferred sales charge on Class C shares applies only to redemptions within 12 months of purchase. |
| 2 | Fee applies to the following types of accounts under $1,000 held directly with the Fund: individual retirement accounts (IRAs), Coverdell Education Savings Accounts and accounts established pursuant to the Uniform Transfers to Minors Act (UTMA) or Uniform Gifts to Minors Act (UGMA). |
| 3 | Other Expenses and Fee Waivers and/or Expense Reimbursements have been restated to reflect current contractual fees. |
| 4 | The Fund’s investment adviser has contractually agreed to waive fees and/or reimburse other Fund expenses through February 28, 2014 so that total annual fund operating expenses, after fee waivers and/or expense reimbursements and excluding Acquired Fund Fees and Expenses, do not exceed 1.49%, 2.24%, 1.74%, and 1.24% for Class A, Class C, Class R3 and Class I shares, respectively. Fee waivers and/or expense reimbursements will not be terminated prior to that time without the approval of the Fund’s board of directors. |
Example
The following example is intended to help you compare the cost of investing in the Fund with the cost of investing in other mutual funds. The example assumes that you invest $10,000 in the Fund for the time periods indicated and then either redeem or do not redeem your shares at the end of a period. The example also assumes that your investment has a 5% return each year, that the Fund’s operating expenses remain the same, and the contractual fee waivers currently in place are not renewed beyond February 28, 2014. Although your actual costs may be higher or lower, based on these assumptions your costs would be:
| | | | | | | | | | | | | | | | | | | | | | | | | | | | | | | | | | | | |
| | | Redemption | | | | | No Redemption | | | |
| | | A | | | C | | | R3 | | | I | | | | | A | | | C | | | R3 | | | I | | | |
| 1 Year | | $ | 722 | | | $ | 231 | | | $ | 181 | | | $ | 130 | | | | | $ | 722 | | | $ | 231 | | | $ | 181 | | | $ | 130 | | | |
| 3 Years | | $ | 1,122 | | | $ | 807 | | | $ | 660 | | | $ | 503 | | | | | $ | 1,122 | | | $ | 807 | | | $ | 660 | | | $ | 503 | | | |
| 5 Years | | $ | 1,546 | | | $ | 1,409 | | | $ | 1,166 | | | $ | 901 | | | | | $ | 1,546 | | | $ | 1,409 | | | $ | 1,166 | | | $ | 901 | | | |
| 10 Years | | $ | 2,724 | | | $ | 3,037 | | | $ | 2,558 | | | $ | 2,014 | | | | | $ | 2,724 | | | $ | 3,037 | | | $ | 2,558 | | | $ | 2,014 | | | |
12
Section 1 Fund Summaries
Portfolio Turnover
The Fund pays transaction costs, such as commissions, when it buys and sells securities (or “turns over” its portfolio). A higher portfolio turnover rate may indicate higher transaction costs and may result in higher taxes when Fund shares are held in a taxable account. These costs, which are not reflected in annual fund operating expenses or in the example, affect the Fund’s performance. During the most recent fiscal year, the Fund’s portfolio turnover rate was 57% of the average value of its portfolio.
Principal Investment Strategies
Under normal market conditions, the Fund invests primarily in equity securities of non-U.S. issuers that trade in U.S. or non-U.S. markets, depositary receipts representing shares of non-U.S. issuers, and exchange-traded funds and other investment companies (“investment companies”) that provide exposure to non-U.S. issuers. The Fund considers an issuer to be non-U.S. if it is organized, domiciled, or has a principal place of business outside the United States. The Fund diversifies its investments among a number of different countries throughout the world and may invest in companies of any size.
Up to 15% of the Fund’s total assets may be invested in equity securities of emerging markets issuers. A country is considered to be an “emerging market” if it is defined as such by Morgan Stanley Capital International Inc.
The Fund may utilize options, futures contracts, options on futures contracts, and forward foreign currency exchange contracts (“derivatives”). The Fund may use these derivatives to manage market or business risk, enhance the Fund’s return, or hedge against adverse movements in currency exchange rates.
Nuveen Asset Management, LLC (“Nuveen Asset Management”) and Altrinsic Global Advisors, LLC (“Altrinsic”) act as the Fund’s sub-advisers. The sub-advisers employ different investment strategies, which are intended to complement one another:
| • | | Altrinsic employs a value strategy, emphasizing investment in equity securities of companies trading below intrinsic valuations with stable returns and companies trading at steep discounts to intrinsic valuations with catalysts for an improvement in returns. |
| • | | Nuveen Asset Management invests the Fund’s assets using three distinct strategies: |
| | • | | Nuveen Asset Management’s international growth team employs a growth strategy, emphasizing investments in equity securities of companies with superior growth characteristics, including superior profitability, secular growth, sustainable competitive advantage, and strong capital structure. |
| | • | | Nuveen Asset Management’s infrastructure team will be allocated up to 10% of the Fund’s total assets, and will focus on equity securities of infrastructure-related companies. |
| | • | | Nuveen Asset Management’s asset allocation team may invest in derivatives, other investment companies, and money market instruments and other short-term securities. These investments may be used as an investment “overlay” for the purpose of increasing or reducing the Fund’s exposure to certain companies, industry sectors, countries, regions, or investment styles, or for such other reasons as Nuveen Asset Management deems advisable. They also may be used to facilitate cash flows to and from the sub-advisers, to meet redemptions requests, and to pay Fund expenses. |
Decisions on how to allocate the Fund’s assets between the sub-advisers and among the different investment strategies are made by Nuveen Asset Management’s asset allocation team. Allocation determinations are based on a variety of factors, including performance records and the characteristics of typical portfolio investments for the different strategies. These characteristics may include capitalization size, growth and profitability measures, valuation measures, economic sector weightings, and earnings and price volatility statistics. Allocations will vary over time according to the prospective returns and risks associated with the various investment strategies.
Principal Risks
The value of your investment in this Fund will change daily, which means you could lose money. An investment in the Fund is not a deposit of a bank and is not insured or guaranteed by the Federal Deposit Insurance Corporation or any other government agency. The principal risks of investing in the Fund include:
Derivatives Risk—The use of derivatives involves additional risks, such as liquidity, interest rate, counterparty, market, credit and management risks, and transaction costs which could leave the Fund in a worse position than if it had not used
Section 1 Fund Summaries
13
these instruments. Derivatives may entail investment exposures that are greater than their cost would suggest. As a result, a small investment in derivatives could have a large impact on performance. Recent legislation requires the development of a new regulatory framework for the derivatives market. The impact of the new regulations is still unknown, but has the potential to increase the costs of using derivatives, may limit the availability of some forms of derivatives or the Fund’s ability to use derivatives, and may adversely affect the performance of some derivative instruments used by the Fund as well as the Fund’s ability to pursue its investment objective through the use of such instruments.
Equity Security Risk—Equity securities may decline significantly in price over short or extended periods of time, and such declines may occur in the equity market as a whole, or they may occur in only a particular country, company, industry, or sector of the market.
Infrastructure Sector Risk—Because the Fund may invest in infrastructure-related securities, the Fund could have greater exposure to adverse economic, regulatory, political, legal and other changes affecting the issuers of such securities.
Multi-Manager Risk—Each sub-adviser makes investment decisions independently and it is possible that the security selection process of the sub-advisers may not complement one another. The sub-advisers selected may underperform the market generally or other sub-advisers that could have been selected.
Non-U.S./Emerging Markets Risk—Non-U.S. issuers or U.S. issuers with significant non-U.S. operations may be subject to risks in addition to those of issuers located in or that principally operate in the United States as a result of, among other things, political, social and economic developments abroad and different legal, regulatory and tax environments. These additional risks may be heightened for securities of issuers located in, or with significant operations in, emerging market countries. Also, changes in currency exchange rates may affect the Fund’s net asset value, the value of dividends and interest earned, and gains and losses realized on the sale of securities.
Other Investment Companies Risk—When the Fund invests in other investment companies, you bear both your proportionate share of Fund expenses and, indirectly, the expenses of the other investment companies.
Smaller Company Risk—Small-cap stocks involve substantial risk. Prices of small-cap stocks may be subject to more abrupt or erratic movements, and to wider fluctuations, than stock prices of larger, more established companies or the market averages in general. It may be difficult to sell small-cap stocks at the desired time and price. While mid-cap stocks may be slightly less volatile than small-cap stocks, they still involve similar risks.
Fund Performance
The following bar chart and table provide some indication of the potential risks of investing in the Fund. The Fund’s past performance (before and after taxes) is not necessarily an indication of how the Fund will perform in the future. Updated performance information is available at www.nuveen.com/performance or by calling (800) 257-8787.
The bar chart below shows the variability of the Fund’s performance from year to year for Class A shares. The performance of the other share classes will differ due to their different expense structures. The bar chart and highest/lowest quarterly returns that follow do not reflect sales charges, and if these charges were reflected, the returns would be less than those shown.
Class A Annual Total Return
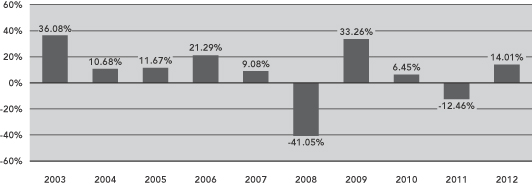
During the ten-year period ended December 31, 2012, the Fund’s highest and lowest quarterly returns were 22.24% and -20.22%, respectively, for the quarters ended June 30, 2009 and December 31, 2008.
14
Section 1 Fund Summaries
The table below shows the variability of the Fund’s average annual returns and how they compare over the time periods indicated with those of a broad measure of market performance and an index of funds with similar investment objectives. All after-tax returns are calculated using the historical highest individual federal marginal income tax rates and do not reflect the impact of state and local taxes. After-tax returns are shown for Class A shares only; after-tax returns for other share classes will vary. Your own actual after-tax returns will depend on your specific tax situation and may differ from what is shown here. After-tax returns are not relevant to investors who hold Fund shares in tax-deferred accounts such as IRAs or employer-sponsored retirement plans.
Both the bar chart and the table assume that all distributions have been reinvested. Performance reflects fee waivers, if any, in effect during the periods presented. If any such waivers were not in place, returns would be reduced.
Prior to July 1, 2004, Class R3 shares were designated Class S shares, which had lower fees and expenses. The performance information in the table prior to July 1, 2004 is based on the performance of the Class S shares. If current fees and expenses had been in effect, performance would have been lower.
| | | | | | | | | | | | |
| | | Average Annual Total Returns
for the Periods Ended
December 31, 2012 | |
| | | 1 Year | | | 5 Years | | | 10 Years | |
| Class A (return before taxes) | | | 7.50 | % | | | (4.69 | )% | | | 5.76 | % |
| Class A (return after taxes on distributions) | | | 7.53 | % | | | (4.90 | )% | | | 5.61 | % |
| Class A (return after taxes on distributions and sale of Fund shares) | | | 5.23 | % | | | (3.63 | )% | | | 5.46 | % |
| Class C (return before taxes) | | | 13.24 | % | | | (4.26 | )% | | | 5.59 | % |
| Class R3 (return before taxes) | | | 13.84 | % | | | (3.72 | )% | | | 6.13 | % |
| Class I (return before taxes) | | | 14.25 | % | | | (3.35 | )% | | | 6.63 | % |
| MSCI EAFE Index (reflects no deduction for fees, expenses or taxes) | | | 17.90 | % | | | (3.21 | )% | | | 8.70 | % |
Lipper International Large-Cap Growth Classification Average
(reflects no deduction for taxes or certain expenses) | | | 18.28 | % | | | (2.90 | )% | | | 8.33 | % |
Management
Investment Adviser
Nuveen Fund Advisors, LLC
Sub-Advisers
Nuveen Asset Management, LLC (“Nuveen Asset Management”)
Altrinsic Global Advisors, LLC (“Altrinsic”)
Section 1 Fund Summaries
15
Portfolio Managers
| | | | |
Name | | Title | | Portfolio Manager of Fund Since |
| Nuveen Asset Management | | | | |
| Asset Allocation | | | | |
| Keith B. Hembre, CFA | | Managing Director | | November 2008 |
| Walter A. French | | Senior Vice President | | November 2008 |
| David A. Friar | | Assistant Vice President | | February 2010 |
| Derek B. Bloom, CFA | | Vice President | | February 2010 |
| International Growth | | | | |
| Tracy P. Stouffer, CFA | | Senior Vice President | | June 2013 |
| Infrastructure | | | | |
| Jay L. Rosenberg | | Managing Director | | June 2013 |
| | |
| Altrinsic | | | | |
| John Hock, CFA | | Chief Investment Officer | | November 2008 |
| John L. DeVita, CFA | | Principal | | November 2008 |
| Rehan Chaudhri | | Principal | | November 2008 |
Purchase and Sale of Fund Shares
You may purchase, redeem or exchange shares of the Fund on any business day, which is any day the New York Stock Exchange is open for business. You may purchase, redeem or exchange shares of the Fund either through a financial advisor or other financial intermediary or directly from the Fund. The Fund’s initial and subsequent investment minimums generally are as follows, although the Fund may reduce or waive the minimums in some cases:
| | | | | | |
| | | Class A and Class C | | Class R3 | | Class I |
| Eligibility and Minimum Initial Investment | | $3,000 for all accounts except: •$2,500 for Traditional/Roth IRA accounts. •$2,000 for Coverdell Education Savings Accounts. •$250 for accounts opened through fee- based programs. •No minimum for retirement plans. | | Available only through certain retirement plans. No minimum. | | Available only through fee-based programs and certain retirement plans, and to other limited categories of investors as described in the prospectus. $100,000 for all accounts except: •$250 for clients of financial intermediaries and family offices that have accounts holding Class I shares with an aggregate value of at least $100,000 (or that are expected to reach this level). •No minimum for eligible retirement plans and certain other categories of eligible investors as described in the prospectus. |
| Minimum Additional Investment | | $100 | | No minimum. | | No minimum. |
Tax Information
The Fund’s distributions are taxable and will generally be taxed as ordinary income or capital gains, unless you are investing through a tax-deferred account, such as an IRA or 401(k) plan.
Payments to Broker-Dealers and Other Financial Intermediaries
If you purchase shares of the Fund through a broker-dealer or other financial intermediary (such as a bank or financial advisor), the Fund, its distributor or its investment adviser may pay the intermediary for the sale of Fund shares and related services. These payments may create a conflict of interest by influencing the broker-dealer or other financial intermediary and your salesperson to recommend the Fund over another investment. Ask your financial advisor or visit your financial intermediary’s website for more information.
16
Section 1 Fund Summaries
Nuveen International Select Fund
Investment Objective
The investment objective of the Fund is long-term growth of capital.
Fees and Expenses of the Fund
This table describes the fees and expenses that you may pay if you buy and hold shares of the Fund. You may qualify for sales charge discounts if you and your family invest, or agree to invest in the future, at least $50,000 in the Fund or in other Nuveen Mutual Funds. More information about these and other discounts, as well as eligibility requirements for each share class, is available from your financial advisor and in “What Share Classes We Offer” on page 99 of the Fund’s prospectus, “How to Reduce Your Sales Charge” on page 102 of the prospectus and “Purchase and Redemption of Fund Shares” on page S-99 of the Fund’s statement of additional information.
Shareholder Fees
(fees paid directly from your investment)
| | | | | | | | | | | | |
| | | Class A | | | Class C | | | Class I | |
| Maximum Sales Charge (Load) Imposed on Purchases (as a percentage of offering price) | | | 5.75% | | | | None | | | | None | |
Maximum Deferred Sales Charge (Load)
(as a percentage of the lesser of purchase price or redemption proceeds)1 | | | None | | | | 1.00% | | | | None | |
| Maximum Sales Charge (Load) Imposed on Reinvested Dividends | | | None | | | | None | | | | None | |
| Exchange Fee | | | None | | | | None | | | | None | |
| Annual Low Balance Account Fee (for accounts under $1,000)2 | | | $15 | | | | $15 | | | | $15 | |
Annual Fund Operating Expenses
(expenses that you pay each year as a percentage of the value of your investment)
| | | | | | | | | | | | |
| | | Class A | | | Class C | | | Class I | |
| Management Fees | | | 1.03% | | | | 1.03% | | | | 1.03% | |
| Distribution and/or Service (12b-1) Fees | | | 0.25% | | | | 1.00% | | | | 0.00% | |
| Other Expenses | | | 0.25% | | | | 0.25% | | | | 0.25% | |
| Acquired Fund Fees and Expenses | | | 0.04% | | | | 0.04% | | | | 0.04% | |
| Total Annual Fund Operating Expenses | | | 1.57% | | | | 2.32% | | | | 1.32% | |
| Fee Waivers and/or Expense Reimbursements3,4 | | | (0.04)% | | | | (0.04)% | | | | (0.04)% | |
| Total Annual Fund Operating Expenses After Fee Waivers and/or Expense Reimbursements | | | 1.53% | | | | 2.28% | | | | 1.28% | |
| 1 | The contingent deferred sales charge on Class C shares applies only to redemptions within 12 months of purchase. |
| 2 | Fee applies to the following types of accounts under $1,000 held directly with the Fund: individual retirement accounts (IRAs), Coverdell Education Savings Accounts and accounts established pursuant to the Uniform Transfers to Minors Act (UTMA) or Uniform Gifts to Minors Act (UGMA). |
| 3 | Fee Waivers and/or Expense Reimbursements have been restated to reflect current contractual fees. |
| 4 | The Fund’s investment adviser has contractually agreed to waive fees and/or reimburse other Fund expenses through February 28, 2014 so that total annual fund operating expenses, after fee waivers and/or expense reimbursements and excluding Acquired Fund Fees and Expenses, do not exceed 1.49%,2.24% and 1.24% for Class A, Class C and Class I shares, respectively. Fee waivers and/or expense reimbursements will not be terminated prior to that time without the approval of the Fund’s board of directors. |
Example
The following example is intended to help you compare the cost of investing in the Fund with the cost of investing in other mutual funds. The example assumes that you invest $10,000 in the Fund for the time periods indicated and then either redeem or do not redeem your shares at the end of a period. The example also assumes that your investment has a 5% return each year, that the Fund’s operating expenses remain the same, and the contractual fee waivers currently in place are not renewed beyond February 28, 2014. Although your actual costs may be higher or lower, based on these assumptions your costs would be:
| | | | | | | | | | | | | | | | | | | | | | | | | | | | |
| | | Redemption | | | | | No Redemption | | | |
| | | A | | | C | | | I | | | | | A | | | C | | | I | | | |
| 1 Year | | $ | 722 | | | $ | 231 | | | $ | 130 | | | | | $ | 722 | | | $ | 231 | | | $ | 130 | | | |
| 3 Years | | $ | 1,039 | | | $ | 721 | | | $ | 414 | | | | | $ | 1,039 | | | $ | 721 | | | $ | 414 | | | |
| 5 Years | | $ | 1,377 | | | $ | 1,237 | | | $ | 720 | | | | | $ | 1,377 | | | $ | 1,237 | | | $ | 720 | | | |
| 10 Years | | $ | 2,332 | | | $ | 2,653 | | | $ | 1,587 | | | | | $ | 2,332 | | | $ | 2,653 | | | $ | 1,587 | | | |
Section 1 Fund Summaries
17
Portfolio Turnover
The Fund pays transaction costs, such as commissions, when it buys and sells securities (or “turns over” its portfolio). A higher portfolio turnover rate may indicate higher transaction costs and may result in higher taxes when Fund shares are held in a taxable account. These costs, which are not reflected in annual fund operating expenses or in the example, affect the Fund’s performance. During the most recent fiscal year, the Fund’s portfolio turnover rate was 49% of the average value of its portfolio.
Principal Investment Strategies
Under normal market conditions, the Fund invests primarily in equity securities of non-U.S. issuers that trade in U.S. or non-U.S. markets, depositary receipts representing shares of non-U.S. issuers, and exchange-traded funds and other investment companies (“investment companies”) that provide exposure to non-U.S. issuers. The Fund considers an issuer to be non-U.S. if it is organized, domiciled, or has a principal place of business outside the United States. The Fund diversifies its investments among a number of different countries throughout the world and may invest in companies of any size.
The Fund may utilize options, futures contracts, options on futures contracts, and forward foreign currency exchange contracts (“derivatives”). The Fund may use these derivatives to manage market or business risk, enhance the Fund’s return, or hedge against adverse movements in currency exchange rates.
Nuveen Asset Management, LLC (“Nuveen Asset Management”), Altrinsic Global Advisors, LLC (“Altrinsic”) and Lazard Asset Management LLC (“Lazard”) act as the Fund’s sub-advisers. The sub-advisers employ different investment strategies, which are intended to complement one another:
| • | | Altrinsic employs a value strategy, emphasizing investment in equity securities of companies trading below intrinsic valuations with stable returns and companies trading at steep discounts to intrinsic valuations with catalysts for an improvement in returns. |
| • | | Lazard employs an emerging markets strategy, emphasizing investments in equity securities of companies whose principal activities are located in emerging market countries that are believed to be undervalued based on their earnings, cash flow or asset values. A country is considered to be an “emerging market” if it is defined as such by Morgan Stanley Capital International Inc. |
| • | | Nuveen Asset Management invests the Fund’s assets using three distinct strategies: |
| | • | | Nuveen Asset Management’s international growth team employs a growth strategy, emphasizing investments in equity securities of companies with superior growth characteristics, including superior profitability, secular growth, sustainable competitive advantage, and strong capital structure. |
| | • | | Nuveen Asset Management’s infrastructure team will be allocated up to 10% of the Fund’s total assets, and will focus on equity securities of infrastructure-related companies. |
| | • | | Nuveen Asset Management’s asset allocation team may invest in derivatives, other investment companies, and money market instruments and other short-term securities. These investments may be used as an investment “overlay” for the purpose of increasing or reducing the Fund’s exposure to certain companies, industry sectors, countries, regions, or investment styles, or for such other reasons as Nuveen Asset Management deems advisable. They also may be used to facilitate cash flows to and from the sub-advisers, to meet redemptions requests, and to pay Fund expenses. |
Decisions on how to allocate the Fund’s assets between the sub-advisers and among the different investment strategies are made by Nuveen Asset Management’s asset allocation team. Allocation determinations are based on a variety of factors, including performance records and the characteristics of typical portfolio investments for the different strategies. These characteristics may include capitalization size, growth and profitability measures, valuation measures, economic sector weightings, and earnings and price volatility statistics. Allocations will vary over time according to the prospective returns and risks associated with the various investment strategies.
Principal Risks
The value of your investment in this Fund will change daily, which means you could lose money. An investment in the Fund is not a deposit of a bank and is not insured or guaranteed by the Federal Deposit Insurance Corporation or any other government agency. The principal risks of investing in the Fund include:
Derivatives Risk—The use of derivatives involves additional risks, such as liquidity, interest rate, counterparty, market,
credit and management risks, and transaction costs which could leave the Fund in a worse position than if it had not used
18
Section 1 Fund Summaries
these instruments. Derivatives may entail investment exposures that are greater than their cost would suggest. As a result, a small investment in derivatives could have a large impact on performance. Recent legislation requires the development of a new regulatory framework for the derivatives market. The impact of the new regulations is still unknown, but has the potential to increase the costs of using derivatives, may limit the availability of some forms of derivatives or the Fund’s ability to use derivatives, and may adversely affect the performance of some derivative instruments used by the Fund as well as the Fund’s ability to pursue its investment objective through the use of such instruments.
Equity Security Risk—Equity securities may decline significantly in price over short or extended periods of time, and such declines may occur in the equity market as a whole, or they may occur in only a particular country, company, industry, or sector of the market.
Infrastructure Sector Risk—Because the Fund may invest in infrastructure-related securities, the Fund could have greater exposure to adverse economic, regulatory, political, legal and other changes affecting the issuers of such securities.
Multi-Manager Risk—Each sub-adviser makes investment decisions independently and it is possible that the security selection process of the sub-advisers may not complement one another. The sub-advisers selected may underperform the market generally or other sub-advisers that could have been selected.
Non-U.S./Emerging Markets Risk—Non-U.S. issuers or U.S. issuers with significant non-U.S. operations may be subject to risks in addition to those of issuers located in or that principally operate in the United States as a result of, among other things, political, social and economic developments abroad and different legal, regulatory and tax environments. These additional risks may be heightened for securities of issuers located in, or with significant operations in, emerging market countries. Also, changes in currency exchange rates may affect the Fund’s net asset value, the value of dividends and interest earned, and gains and losses realized on the sale of securities.
Other Investment Companies Risk—When the Fund invests in other investment companies, you bear both your proportionate share of Fund expenses and, indirectly, the expenses of the other investment companies.
Smaller Company Risk—Small-cap stocks involve substantial risk. Prices of small-cap stocks may be subject to more abrupt or erratic movements, and to wider fluctuations, than stock prices of larger, more established companies or the market averages in general. It may be difficult to sell small-cap stocks at the desired time and price. While mid-cap stocks may be slightly less volatile than small-cap stocks, they still involve similar risks.
Fund Performance
The following bar chart and table provide some indication of the potential risks of investing in the Fund. The Fund’s past performance (before and after taxes) is not necessarily an indication of how the Fund will perform in the future. Updated performance information is available at www.nuveen.com/performance or by calling (800) 257-8787.
The bar chart below shows the variability of the Fund’s performance from year to year for Class A shares. The performance of the other share classes will differ due to their different expense structures. The bar chart and highest/lowest quarterly returns that follow do not reflect sales charges, and if these charges were reflected, the returns would be less than those shown.
Class A Annual Total Return
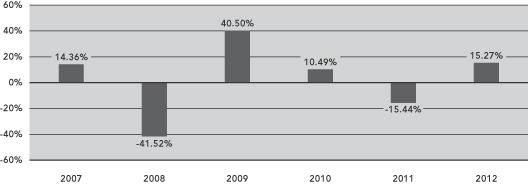
During the six-year period ended December 31, 2012, the Fund’s highest and lowest quarterly returns were 24.92% and -21.70%, respectively, for the quarters ended June 30, 2009 and December 31, 2008.
Section 1 Fund Summaries
19
The table below shows the variability of the Fund’s average annual returns and how they compare over the time periods indicated with those of a broad measure of market performance and an index of funds with similar investment objectives. All after-tax returns are calculated using the historical highest individual federal marginal income tax rates and do not reflect the impact of state and local taxes. After-tax returns are shown for Class A shares only; after-tax returns for other share classes will vary. Your own actual after-tax returns will depend on your specific tax situation and may differ from what is shown here. After-tax returns are not relevant to investors who hold Fund shares in tax-deferred accounts such as IRAs or employer-sponsored retirement plans.
Both the bar chart and the table assume that all distributions have been reinvested. Performance reflects fee waivers, if any, in effect during the periods presented. If any such waivers were not in place, returns would be reduced.
| | | | | | | | | | | | | | | | |
| | | | | | Average Annual Total Returns
for the Periods Ended
December 31, 2012 | |
| | | Inception
Date | | | 1 Year | | | 5 Years | | | Since
Inception | |
| Class A (return before taxes) | | | 12/21/06 | | | | 8.63 | % | | | (3.56 | )% | | | (0.70 | )% |
| Class A (return after taxes on distributions) | | | | | | | 8.64 | % | | | (3.54 | )% | | | (0.75 | )% |
| Class A (return after taxes on distributions and sale of Fund shares) | | | | | | | 6.05 | % | | | (2.82 | )% | | | (0.45 | )% |
| Class C (return before taxes) | | | 12/21/06 | | | | 14.43 | % | | | (3.13 | )% | | | (0.47 | )% |
| Class I (return before taxes) | | | 12/21/06 | | | | 15.54 | % | | | (2.17 | )% | | | 0.52 | % |
MSCI All Country World Investable Market Index (ex U.S.)
(reflects no deduction for fees, expenses or taxes) | | | | | | | 17.58 | % | | | (2.15 | )% | | | 0.89 | % |
Lipper International Multi-Cap Growth Classification Average
(reflects no deduction for taxes or certain expenses) | | | | | | | 18.03 | % | | | (3.03 | )% | | | (0.24 | )% |
Management
Investment Adviser
Nuveen Fund Advisors, LLC
Sub-Advisers
Nuveen Asset Management, LLC (“Nuveen Asset Management”)
Altrinsic Global Advisors, LLC (“Altrinsic”)
Lazard Asset Management LLC (“Lazard”)
Portfolio Managers
| | | | |
Name | | Title | | Portfolio Manager of Fund Since |
| | |
| Nuveen Asset Management | | | | |
| Asset Allocation | | | | |
| Keith B. Hembre, CFA | | Managing Director | | December 2006 |
| Walter A. French | | Senior Vice President | | December 2006 |
| David A. Friar | | Assistant Vice President | | February 2010 |
| Derek B. Bloom, CFA | | Vice President | | February 2010 |
| International Growth | | | | |
| Tracy P. Stouffer, CFA | | Senior Vice President | | June 2013 |
| Infrastructure | | | | |
| Jay L. Rosenberg | | Managing Director | | June 2013 |
20
Section 1 Fund Summaries
| | | | |
Name | | Title | | Portfolio Manager of Fund Since |
| | |
| Altrinsic | | | | |
| John Hock, CFA | | Chief Investment Officer | | December 2006 |
| John L. DeVita, CFA | | Principal | | December 2006 |
| Rehan Chaudhri | | Principal | | December 2006 |
| | |
| Lazard | | | | |
| James M. Donald, CFA | | Managing Director & Head of Emerging Markets Group | | December 2006 |
| John R. Reinsberg | | Deputy Chairman & Head of International and Global Products | | December 2006 |
Purchase and Sale of Fund Shares
You may purchase, redeem or exchange shares of the Fund on any business day, which is any day the New York Stock Exchange is open for business. You may purchase, redeem or exchange shares of the Fund either through a financial advisor or other financial intermediary or directly from the Fund. The Fund’s initial and subsequent investment minimums generally are as follows, although the Fund may reduce or waive the minimums in some cases:
| | | | |
| | | Class A and Class C | | Class I |
| Eligibility and Minimum Initial Investment | | $3,000 for all accounts except: •$2,500 for Traditional/Roth IRA accounts. •$2,000 for Coverdell Education Savings Accounts. •$250 for accounts opened through fee-based programs. •No minimum for retirement plans. | | Available only through fee-based programs and certain retirement plans, and to other limited categories of investors as described in the prospectus. $100,000 for all accounts except: •$250 for clients of financial intermediaries and family offices that have accounts holding Class I shares with an aggregate value of at least $100,000 (or that are expected to reach this level). •No minimum for eligible retirement plans and certain other categories of eligible investors as described in the prospectus. |
| Minimum Additional Investment | | $100 | | No minimum. |
Tax Information
The Fund’s distributions are taxable and will generally be taxed as ordinary income or capital gains, unless you are investing through a tax-deferred account, such as an IRA or 401(k) plan.
Payments to Broker-Dealers and Other Financial Intermediaries
If you purchase shares of the Fund through a broker-dealer or other financial intermediary (such as a bank or financial advisor), the Fund, its distributor or its investment adviser may pay the intermediary for the sale of Fund shares and related services. These payments may create a conflict of interest by influencing the broker-dealer or other financial intermediary and your salesperson to recommend the Fund over another investment. Ask your financial advisor or visit your financial intermediary’s website for more information.
Section 1 Fund Summaries
21
Nuveen Large Cap Growth Opportunities Fund
Investment Objective
The investment objective of the Fund is long-term growth of capital.
Fees and Expenses of the Fund
This table describes the fees and expenses that you may pay if you buy and hold shares of the Fund. You may qualify for sales charge discounts if you and your family invest, or agree to invest in the future, at least $50,000 in the Fund or in other Nuveen Mutual Funds. More information about these and other discounts, as well as eligibility requirements for each share class, is available from your financial advisor and in “What Share Classes We Offer” on page 99 of the Fund’s prospectus, “How to Reduce Your Sales Charge” on page 102 of the prospectus and “Purchase and Redemption of Fund Shares” on page S-99 of the Fund’s statement of additional information.
Shareholder Fees
(fees paid directly from your investment)
| | | | | | | | | | | | | | | | | | | | | | | | |
| | | Class A | | | Class B | | | Class C | | | Class R3 | | | Class R6 | | | Class I | |
Maximum Sales Charge (Load) Imposed on Purchases
(as a percentage of offering price) | | | 5.75% | | | | None | | | | None | | | | None | | | | None | | | | None | |
Maximum Deferred Sales Charge (Load)
(as a percentage of the lesser of purchase price or redemption proceeds)1 | | | None | | | | 5.00% | | | | 1.00% | | | | None | | | | None | | | | None | |
| Maximum Sales Charge (Load) Imposed on Reinvested Dividends | | | None | | | | None | | | | None | | | | None | | | | None | | | | None | |
| Exchange Fee | | | None | | | | None | | | | None | | | | None | | | | None | | | | None | |
| Annual Low Balance Account Fee (for accounts under $1,000)2 | | | $15 | | | | $15 | | | | $15 | | | | None | | | | None | | | | $15 | |
Annual Fund Operating Expenses
(expenses that you pay each year as a percentage of the value of your investment)
| | | | | | | | | | | | | | | | | | | | | | | | |
| | | Class A | | | Class B | | | Class C | | | Class R3 | | | Class R63 | | | Class I | |
| Management Fees | | | 0.83% | | | | 0.83% | | | | 0.83% | | | | 0.83% | | | | 0.83% | | | | 0.83% | |
| Distribution and/or Service (12b-1) Fees | | | 0.25% | | | | 1.00% | | | | 1.00% | | | | 0.50% | | | | 0.00% | | | | 0.00% | |
| Other Expenses4 | | | 0.17% | | | | 0.16% | | | | 0.17% | | | | 0.17% | | | | 0.11% | | | | 0.17% | |
| Total Annual Fund Operating Expenses | | | 1.25% | | | | 1.99% | | | | 2.00% | | | | 1.50% | | | | 0.94% | | | | 1.00% | |
| 1 | The contingent deferred sales charge (“CDSC”) on Class B shares declines over a six-year period from purchase. The CDSC on Class C shares applies only to redemptions within 12 months of purchase. |
| 2 | Fee applies to the following types of accounts under $1,000 held directly with the Fund: individual retirement accounts (IRAs), Coverdell Education Savings Accounts and accounts established pursuant to the Uniform Transfers to Minors Act (UTMA) or Uniform Gifts to Minors Act (UGMA). |
| 3 | Class R6 shares were established on February 28, 2013. Accordingly, expenses are based upon the actual expenses incurred by the other share classes; adjusted to reflect anticipated savings resulting from the fact that sub-transfer agent and similar fees are not charged to Class R6 shares. |
| 4 | Other Expenses have been restated to reflect current contractual fees. |
Example
The following example is intended to help you compare the cost of investing in the Fund with the cost of investing in other mutual funds. The example assumes that you invest $10,000 in the Fund for the time periods indicated and then either redeem or do not redeem your shares at the end of a period. The example also assumes that your investment has a 5% return each year and that the Fund’s operating expenses remain the same. Although your actual costs may be higher or lower, based on these assumptions your costs would be:
| | | | | | | | | | | | | | | | | | | | | | | | | | | | | | | | | | | | | | | | | | | | | | | | | | | | |
| | | Redemption | | | | | No Redemption | | | |
| | | A | | | B | | | C | | | R3 | | | R6 | | | I | | | | | A | | | B | | | C | | | R3 | | | R6 | | | I | | | |
| 1 Year | | $ | 695 | | | $ | 702 | | | $ | 203 | | | $ | 153 | | | $ | 96 | | | $ | 102 | | | | | $ | 695 | | | $ | 202 | | | $ | 203 | | | $ | 153 | | | $ | 96 | | | $ | 102 | | | |
| 3 Years | | $ | 949 | | | $ | 924 | | | $ | 627 | | | $ | 474 | | | $ | 300 | | | $ | 318 | | | | | $ | 949 | | | $ | 624 | | | $ | 627 | | | $ | 474 | | | $ | 300 | | | $ | 318 | | | |
| 5 Years | | $ | 1,222 | | | $ | 1,173 | | | $ | 1,078 | | | $ | 818 | | | $ | 520 | | | $ | 552 | | | | | $ | 1,222 | | | $ | 1,073 | | | $ | 1,078 | | | $ | 818 | | | $ | 520 | | | $ | 552 | | | |
| 10 Years | | $ | 1,999 | | | $ | 2,126 | | | $ | 2,327 | | | $ | 1,791 | | | $ | 1,155 | | | $ | 1,225 | | | | | $ | 1,999 | | | $ | 2,126 | | | $ | 2,327 | | | $ | 1,791 | | | $ | 1,155 | | | $ | 1,225 | | | |
22
Section 1 Fund Summaries
Portfolio Turnover
The Fund pays transaction costs, such as commissions, when it buys and sells securities (or “turns over” its portfolio). A higher portfolio turnover rate may indicate higher transaction costs and may result in higher taxes when Fund shares are held in a taxable account. These costs, which are not reflected in annual fund operating expenses or in the example, affect the Fund’s performance. During the most recent fiscal year, the Fund’s portfolio turnover rate was 73% of the average value of its portfolio.
Principal Investment Strategies
Under normal market conditions, the Fund invests at least 80% of net assets, plus the amount of any borrowings for investment purposes, in common stocks of large-capitalization companies, defined as companies that have market capitalizations of $5 billion or greater at the time of purchase.
In selecting stocks, the Fund’s sub-adviser invests in companies that it believes exhibit the potential for superior growth based on factors such as above average growth in revenue and earnings, strong competitive position, strong management, and sound financial condition. The Fund’s sub-adviser will generally sell a stock if the stock hits its price target, the company’s fundamentals or competitive position significantly deteriorate, or if a better alternative exists in the marketplace.
The Fund may invest up to 15% of its total assets in non-dollar denominated equity securities of non-U.S. issuers. In addition, the Fund may invest up to 25% of its assets, collectively, in non-dollar denominated equity securities of non-U.S. issuers and in dollar-denominated equity securities of non-U.S. issuers that are either listed on a U.S. stock exchange or represented by depositary receipts that may or may not be sponsored by a domestic bank. Up to 15% of the Fund’s total assets may be invested in equity securities of emerging market issuers. A country is considered to be an “emerging market” if it is defined as such by Morgan Stanley Capital International Inc.
The Fund may utilize options, futures contracts, options on futures contracts, and forward foreign currency exchange contracts (“derivatives”). The Fund may use these derivatives to manage market or business risk, enhance the Fund’s return, or hedge against adverse movements in currency exchange rates.
Principal Risks
The value of your investment in this Fund will change daily, which means you could lose money. An investment in the Fund is not a deposit of a bank and is not insured or guaranteed by the Federal Deposit Insurance Corporation or any other government agency. The principal risks of investing in the Fund include:
Derivatives Risk—The use of derivatives involves additional risks, such as liquidity, interest rate, counterparty, market, credit and management risks, and transaction costs which could leave the Fund in a worse position than if it had not used these instruments. Derivatives may entail investment exposures that are greater than their cost would suggest. As a result, a small investment in derivatives could have a large impact on performance. Recent legislation requires the development of a new regulatory framework for the derivatives market. The impact of the new regulations is still unknown, but has the potential to increase the costs of using derivatives, may limit the availability of some forms of derivatives or the Fund’s ability to use derivatives, and may adversely affect the performance of some derivative instruments used by the Fund as well as the Fund’s ability to pursue its investment objective through the use of such instruments.
Equity Security Risk—Equity securities may decline significantly in price over short or extended periods of time, and such declines may occur in the equity market as a whole, or they may occur in only a particular country, company, industry, or sector of the market.
Investment Focus Risk—Different types of stocks tend to shift in and out of favor depending on market and economic conditions. The Fund emphasizes a growth style of investing and therefore seeks companies experiencing high rates of current growth; such companies may be more volatile than other types of investments. Furthermore, because the Fund focuses its investments in large-cap stocks, the Fund may not benefit from gains in smaller cap sectors of the market.
Section 1 Fund Summaries
23
Non-U.S./Emerging Markets Risk—Non-U.S. issuers or U.S. issuers with significant non-U.S. operations may be subject to risks in addition to those of issuers located in or that principally operate in the United States as a result of, among other things, political, social and economic developments abroad and different legal, regulatory and tax environments. These additional risks may be heightened for securities of issuers located in, or with significant operations in, emerging market countries. Also, changes in currency exchange rates may affect the Fund’s net asset value, the value of dividends and interest earned, and gains and losses realized on the sale of securities.
Fund Performance
The following bar chart and table provide some indication of the potential risks of investing in the Fund. The Fund’s past performance (before and after taxes) is not necessarily an indication of how the Fund will perform in the future. Updated performance information is available at www.nuveen.com/performance or by calling (800) 257-8787.
The bar chart below shows the variability of the Fund’s performance from year to year for Class A shares. The performance of the other share classes will differ due to their different expense structures. The bar chart and highest/lowest quarterly returns that follow do not reflect sales charges, and if these charges were reflected, the returns would be less than those shown.
Class A Annual Total Return
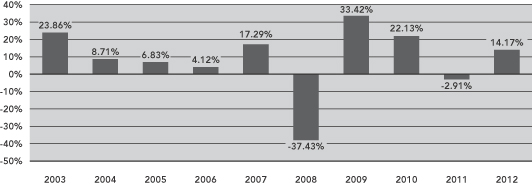
During the ten-year period ended December 31, 2012, the Fund’s highest and lowest quarterly returns were 18.58% and -21.12%, respectively, for the quarters ended March 31, 2012 and December 31, 2008.
The table below shows the variability of the Fund’s average annual returns and how they compare over the time periods indicated with those of a broad measure of market performance and an index of funds with similar investment objectives. All after-tax returns are calculated using the historical highest individual federal marginal income tax rates and do not reflect the impact of state and local taxes. After-tax returns are shown for Class A shares only; after-tax returns for other share classes will vary. Your own actual after-tax returns will depend on your specific tax situation and may differ from what is shown here. After-tax returns are not relevant to investors who hold Fund shares in tax-deferred accounts such as IRAs or employer-sponsored retirement plans.
Both the bar chart and the table assume that all distributions have been reinvested. Performance reflects fee waivers, if any, in effect during the periods presented. If any such waivers were not in place, returns would be reduced.
Prior to July 1, 2004, Class R3 shares were designated Class S shares, which had lower fees and expenses. The performance information in the table prior to July 1, 2004 is based on the performance of the Class S shares. If current fees and expenses had been in effect, performance would have been lower.
Performance is not shown for Class R6 shares, which have not been offered for a full calendar year.
24
Section 1 Fund Summaries
| | | | | | | | | | | | |
| | | Average Annual Total Returns for the Periods Ended December 31, 2012 | |
| | | 1 Year | | | 5 Years | | | 10 Years | |
| Class A (return before taxes) | | | 7.61 | % | | | 1.27 | % | | | 6.47 | % |
| Class A (return after taxes on distributions) | | | 7.42 | % | | | 1.11 | % | | | 6.20 | % |
| Class A (return after taxes on distributions and sale of Fund shares) | | | 5.20 | % | | | 1.07 | % | | | 5.65 | % |
| Class B (return before taxes) | | | 8.42 | % | | | 1.55 | % | | | 6.31 | % |
| Class C (return before taxes) | | | 13.32 | % | | | 1.71 | % | | | 6.30 | % |
| Class R3 (return before taxes) | | | 13.91 | % | | | 2.23 | % | | | 6.87 | % |
| Class I (return before taxes) | | | 14.47 | % | | | 2.73 | % | | | 7.37 | % |
Russell 1000® Growth Index
(reflects no deduction for fees, expenses or taxes) | | | 15.26 | % | | | 3.12 | % | | | 7.52 | % |
Lipper Multi-Cap Growth Classification Average
(reflects no deduction for taxes or certain expenses) | | | 15.25 | % | | | 0.94 | % | | | 8.07 | % |
Management
Investment Adviser
Nuveen Fund Advisors, LLC
Sub-Adviser
Nuveen Asset Management, LLC
Portfolio Managers
| | | | |
Name | | Title | | Portfolio Manager of Fund Since |
| Harold R. Goldstein | | Senior Vice President | | July 2002 |
| Scott M. Mullinix, CFA | | Senior Vice President | | April 2006 |
| James A. Diedrich, CFA | | Senior Vice President | | February 2006 |
Section 1 Fund Summaries
25
Purchase and Sale of Fund Shares
You may purchase, redeem or exchange shares of the Fund on any business day, which is any day the New York Stock Exchange is open for business. You may purchase, redeem or exchange shares of the Fund either through a financial advisor or other financial intermediary or directly from the Fund. Class B shares are available only through exchanges and dividend reinvestments by current Class B shareholders. The Fund’s initial and subsequent investment minimums generally are as follows, although the Fund may reduce or waive the minimums in some cases:
| | | | | | | | |
| | | Class A and Class C | | Class R3 | | Class R6 | | Class I |
Eligibility and
Minimum Initial
Investment | | $3,000 for all accounts except: •$2,500 for Traditional/Roth IRA accounts. •$2,000 for Coverdell Education Savings Accounts. •$250 for accounts opened through fee-based programs. •No minimum for retirement plans. | | Available only through certain retirement plans. No minimum. | | Available only to certain qualified retirement plans and other investors as described in the prospectus. $5 million for all accounts except: •No minimum for certain qualified retirement plans as described in the prospectus. | | Available only through fee-based programs and certain retirement plans, and to other limited categories of investors as described in the prospectus. $100,000 for all accounts except: •$250 for clients of financial intermediaries and family offices that have accounts holding Class I shares with an aggregate value of at least $100,000 (or that are expected to reach this level). •No minimum for eligible retirement plans and certain other categories of eligible investors as described in the prospectus. |
| Minimum Additional Investment | | $100 | | No minimum. | | No minimum. | | No minimum. |
Tax Information
The Fund’s distributions are taxable and will generally be taxed as ordinary income or capital gains, unless you are investing through a tax-deferred account, such as an IRA or 401(k) plan.
Payments to Broker-Dealers and Other Financial Intermediaries
If you purchase shares of the Fund through a broker-dealer or other financial intermediary (such as a bank or financial advisor), the Fund, its distributor or its investment adviser may pay the intermediary for the sale of Fund shares and related services. These payments may create a conflict of interest by influencing the broker-dealer or other financial intermediary and your salesperson to recommend the Fund over another investment. Ask your financial advisor or visit your financial intermediary’s website for more information.
26
Section 1 Fund Summaries
Nuveen Large Cap Select Fund
Investment Objective
The investment objective of the Fund is capital appreciation.
Fees and Expenses of the Fund
This table describes the fees and expenses that you may pay if you buy and hold shares of the Fund. You may qualify for sales charge discounts if you and your family invest, or agree to invest in the future, at least $50,000 in the Fund or in other Nuveen Mutual Funds. More information about these and other discounts, as well as eligibility requirements for each share class, is available from your financial advisor and in “What Share Classes We Offer” on page 99 of the Fund’s prospectus, “How to Reduce Your Sales Charge” on page 102 of the prospectus and “Purchase and Redemption of Fund Shares” on page S-99 of the Fund’s statement of additional information.
Shareholder Fees
(fees paid directly from your investment)
| | | | | | | | | | | | |
| | | Class A | | | Class C | | | Class I | |
Maximum Sales Charge (Load) Imposed on Purchases
(as a percentage of offering price) | | | 5.75% | | | | None | | | | None | |
Maximum Deferred Sales Charge (Load)
(as a percentage of the lesser of purchase price or redemption proceeds)1 | | | None | | | | 1.00% | | | | None | |
| Maximum Sales Charge (Load) Imposed on Reinvested Dividends | | | None | | | | None | | | | None | |
| Exchange Fee | | | None | | | | None | | | | None | |
| Annual Low Balance Account Fee (for accounts under $1,000)2 | | | $15 | | | | $15 | | | | $15 | |
Annual Fund Operating Expenses
(expenses that you pay each year as a percentage of the value of your investment)
| | | | | | | | | | | | |
| | | Class A | | | Class C | | | Class I | |
| Management Fees | | | 0.75% | | | | 0.75% | | | | 0.75% | |
| Distribution and/or Service (12b-1) Fees | | | 0.25% | | | | 1.00% | | | | 0.00% | |
| Other Expenses3 | | | 0.41% | | | | 0.41% | | | | 0.41% | |
| Total Annual Fund Operating Expenses | | | 1.41% | | | | 2.16% | | | | 1.16% | |
| 1 | The contingent deferred sales charge on Class C shares applies only to redemptions within 12 months of purchase. |
| 2 | Fee applies to the following types of accounts under $1,000 held directly with the Fund: individual retirement accounts (IRAs), Coverdell Education Savings Accounts and accounts established pursuant to the Uniform Transfers to Minors Act (UTMA) or Uniform Gifts to Minors Act (UGMA). |
| 3 | Other Expenses have been restated to reflect current contractual fees. |
Example
The following example is intended to help you compare the cost of investing in the Fund with the cost of investing in other mutual funds. The example assumes that you invest $10,000 in the Fund for the time periods indicated and then either redeem or do not redeem your shares at the end of a period. The example also assumes that your investment has a 5% return each year and that the Fund’s operating expenses remain the same. Although your actual costs may be higher or lower, based on these assumptions your costs would be:
| | | | | | | | | | | | | | | | | | | | | | | | | | | | |
| | | Redemption | | No Redemption |
| | | A | | | C | | | I | | | | | A | | | C | | | I | | | |
| 1 Year | | $ | 710 | | | $ | 219 | | | $ | 118 | | | | | $ | 710 | | | $ | 219 | | | $ | 118 | | | |
| 3 Years | | $ | 996 | | | $ | 676 | | | $ | 368 | | | | | $ | 996 | | | $ | 676 | | | $ | 368 | | | |
| 5 Years | | $ | 1,302 | | | $ | 1,159 | | | $ | 638 | | | | | $ | 1,302 | | | $ | 1,159 | | | $ | 638 | | | |
| 10 Years | | $ | 2,169 | | | $ | 2,493 | | | $ | 1,409 | | | | | $ | 2,169 | | | $ | 2,493 | | | $ | 1,409 | | | |
Section 1 Fund Summaries
27
Portfolio Turnover
The Fund pays transaction costs, such as commissions, when it buys and sells securities (or “turns over” its portfolio). A higher portfolio turnover rate may indicate higher transaction costs and may result in higher taxes when Fund shares are held in a taxable account. These costs, which are not reflected in annual fund operating expenses or in the example, affect the Fund’s performance. During the most recent fiscal year, the Fund’s portfolio turnover rate was 127% of the average value of its portfolio.
Principal Investment Strategies
Under normal market conditions, the Fund invests at least 80% of net assets, plus the amount of any borrowings for investment purposes, in common stocks of large-capitalization companies, defined as companies that have market capitalizations of $5 billion or greater at the time of purchase.
The sub-adviser will select companies based on a combination of value and growth objectives, seeking companies that meet at least two of the following criteria:
| • | | Attractively valued relative to other companies in the same industry or market. |
| • | | Strong or improving cash flows, revenue and earnings growth, or other fundamentals. |
| • | | Strong competitive position. |
| • | | An identifiable catalyst that could increase the value of the company’s stock over the next one or two years. |
The Fund’s sub-adviser will generally sell a stock if the stock hits its price target, the company’s fundamentals or competitive position significantly deteriorate, or if a better alternative exists in the marketplace.
The Fund may invest up to 15% of its total assets in non-dollar denominated equity securities of non-U.S. issuers. In addition, the Fund may invest up to 25% of its assets, collectively, in non-dollar denominated equity securities of non-U.S. issuers and in dollar-denominated equity securities of non-U.S. issuers that are either listed on a U.S. stock exchange or represented by depositary receipts that may or may not be sponsored by a domestic bank. Up to 15% of the Fund’s total assets may be invested in equity securities of emerging market issuers. A country is considered to be an “emerging market” if it is defined as such by Morgan Stanley Capital International Inc.
The Fund may utilize options, futures contracts, options on futures contracts, and forward foreign currency exchange contracts (“derivatives”). The Fund may use these derivatives to manage market or business risk, enhance the Fund’s return, or hedge against adverse movements in currency exchange rates.
Principal Risks
The value of your investment in this Fund will change daily, which means you could lose money. An investment in the Fund is not a deposit of a bank and is not insured or guaranteed by the Federal Deposit Insurance Corporation or any other government agency. The principal risks of investing in the Fund include:
Derivatives Risk—The use of derivatives involves additional risks, such as liquidity, interest rate, counterparty, market, credit and management risks, and transaction costs which could leave the Fund in a worse position than if it had not used these instruments. Derivatives may entail investment exposures that are greater than their cost would suggest. As a result, a small investment in derivatives could have a large impact on performance. Recent legislation requires the development of a new regulatory framework for the derivatives market. The impact of the new regulations is still unknown, but has the potential to increase the costs of using derivatives, may limit the availability of some forms of derivatives or the Fund’s ability to use derivatives, and may adversely affect the performance of some derivative instruments used by the Fund as well as the Fund’s ability to pursue its investment objective through the use of such instruments.
Equity Security Risk—Equity securities may decline significantly in price over short or extended periods of time, and such declines may occur in the equity market as a whole, or they may occur in only a particular country, company, industry, or sector of the market.
Non-U.S./Emerging Markets Risk—Non-U.S. issuers or U.S. issuers with significant non-U.S. operations may be subject to risks in addition to those of issuers located in or that principally operate in the United States as a result of, among other things, political, social and economic developments abroad and different legal, regulatory and tax environments. These additional risks may be heightened for securities of issuers located in, or with significant operations in, emerging market countries. Also, changes in currency exchange rates may affect the Fund’s net asset value, the value of dividends and interest earned, and gains and losses realized on the sale of securities.
28
Section 1 Fund Summaries
Fund Performance
The following bar chart and table provide some indication of the potential risks of investing in the Fund. The Fund’s past performance (before and after taxes) is not necessarily an indication of how the Fund will perform in the future. Updated performance information is available at www.nuveen.com/performance or by calling (800) 257-8787.
The bar chart below shows the variability of the Fund’s performance from year to year for Class A shares. The performance of the other share classes will differ due to their different expense structures. The bar chart and highest/lowest quarterly returns that follow do not reflect sales charges, and if these charges were reflected, the returns would be less than those shown.
Class A Annual Total Return
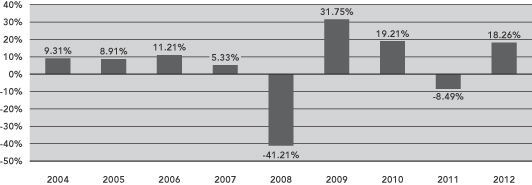
During the nine-year period ended December 31, 2012, the Fund’s highest and lowest quarterly returns were 17.42% and -23.26%, respectively, for the quarters ended September 30, 2009 and December 31, 2008.
The table below shows the variability of the Fund’s average annual returns and how they compare over the time periods indicated with those of a broad measure of market performance and an index of funds with similar investment objectives. All after-tax returns are calculated using the historical highest individual federal marginal income tax rates and do not reflect the impact of state and local taxes. After-tax returns are shown for Class A shares only; after-tax returns for other share classes will vary. Your own actual after-tax returns will depend on your specific tax situation and may differ from what is shown here. After-tax returns are not relevant to investors who hold Fund shares in tax-deferred accounts such as IRAs or employer-sponsored retirement plans.
Both the bar chart and the table assume that all distributions have been reinvested. Performance reflects fee waivers, if any, in effect during the periods presented. If any such waivers were not in place, returns would be reduced.
| | | | | | | | | | | | | | | | |
| | | | | | Average Annual Total Returns
for the Periods Ended December 31, 2012 | |
| | | Inception
Date | | | 1 Year | | | 5 Years | | | Since
Inception | |
| Class A (return before taxes) | | | 1/31/03 | | | | 11.46 | % | | | (1.19 | )% | | | 5.39 | % |
| Class A (return after taxes on distributions) | | | | | | | 11.38 | % | | | (1.24 | )% | | | 4.74 | % |
| Class A (return after taxes on distributions and sale of Fund shares) | | | | | | | 7.55 | % | | | (1.02 | )% | | | 4.44 | % |
| Class C (return before taxes) | | | 1/31/03 | | | | 17.36 | % | | | (0.76 | )% | | | 5.20 | % |
| Class I (return before taxes) | | | 1/31/03 | | | | 18.52 | % | | | 0.25 | % | | | 6.29 | % |
| S&P 500® Index (reflects no deduction for fees, expenses or taxes) | | | | | | | 16.00 | % | | | 1.66 | % | | | 7.45 | % |
Lipper Large-Cap Core Classification Average
(reflects no deduction for taxes or certain expenses) | | | | | | | 14.95 | % | | | 0.68 | % | | | 6.84 | % |
Section 1 Fund Summaries
29
Management
Investment Adviser
Nuveen Fund Advisors, LLC
Sub-Adviser
Nuveen Asset Management, LLC
Portfolio Managers
| | | | |
Name | | Title | | Portfolio Manager of Fund Since |
| David A. Chalupnik, CFA | | Managing Director | | January 2003 |
| Anthony R. Burger, CFA | | Senior Vice President | | October 2004 |
Purchase and Sale of Fund Shares
You may purchase, redeem or exchange shares of the Fund on any business day, which is any day the New York Stock Exchange is open for business. You may purchase, redeem or exchange shares of the Fund either through a financial advisor or other financial intermediary or directly from the Fund. The Fund’s initial and subsequent investment minimums generally are as follows, although the Fund may reduce or waive the minimums in some cases:
| | | | |
| | | Class A and Class C | | Class I |
| Eligibility and Minimum Initial Investment | | $3,000 for all accounts except: •$2,500 for Traditional/Roth IRA accounts. •$2,000 for Coverdell Education Savings Accounts. •$250 for accounts opened through fee-based programs. •No minimum for retirement plans. | | Available only through fee-based programs and certain retirement plans, and to other limited categories of investors as described in the prospectus. $100,000 for all accounts except: •$250 for clients of financial intermediaries and family offices that have accounts holding Class I shares with an aggregate value of at least $100,000 (or that are expected to reach this level). •No minimum for eligible retirement plans and certain other categories of eligible investors as described in the prospectus. |
Minimum
Additional Investment | | $100 | | No minimum. |
Tax Information
The Fund’s distributions are taxable and will generally be taxed as ordinary income or capital gains, unless you are investing through a tax-deferred account, such as an IRA or 401(k) plan.
Payments to Broker-Dealers and Other Financial Intermediaries
If you purchase shares of the Fund through a broker-dealer or other financial intermediary (such as a bank or financial advisor), the Fund, its distributor or its investment adviser may pay the intermediary for the sale of Fund shares and related services. These payments may create a conflict of interest by influencing the broker-dealer or other financial intermediary and your salesperson to recommend the Fund over another investment. Ask your financial advisor or visit your financial intermediary’s website for more information.
30
Section 1 Fund Summaries
Nuveen Mid Cap Growth Opportunities Fund
Investment Objective
The investment objective of the Fund is capital appreciation.
Fees and Expenses of the Fund
This table describes the fees and expenses that you may pay if you buy and hold shares of the Fund. You may qualify for sales charge discounts if you and your family invest, or agree to invest in the future, at least $50,000 in the Fund or in other Nuveen Mutual Funds. More information about these and other discounts, as well as eligibility requirements for each share class, is available from your financial advisor and in “What Share Classes We Offer” on page 99 of the Fund’s prospectus, “How to Reduce Your Sales Charge” on page 102 of the prospectus and “Purchase and Redemption of Fund Shares” on page S-99 of the Fund’s statement of additional information.
Shareholder Fees
(fees paid directly from your investment)
| | | | | | | | | | | | | | | | | | | | | | | | |
| | | Class A | | | Class B | | | Class C | | | Class R3 | | | Class R6 | | | Class I | |
Maximum Sales Charge (Load) Imposed on Purchases
(as a percentage of offering price) | | | 5.75% | | | | None | | | | None | | | | None | | | | None | | | | None | |
Maximum Deferred Sales Charge (Load)
(as a percentage of the lesser of purchase price or redemption proceeds)1 | | | None | | | | 5.00% | | | | 1.00% | | | | None | | | | None | | | | None | |
| Maximum Sales Charge (Load) Imposed on Reinvested Dividends | | | None | | | | None | | | | None | | | | None | | | | None | | | | None | |
| Exchange Fee | | | None | | | | None | | | | None | | | | None | | | | None | | | | None | |
| Annual Low Balance Account Fee (for accounts under $1,000)2 | | | $15 | | | | $15 | | | | $15 | | | | None | | | | None | | | | $15 | |
Annual Fund Operating Expenses
(expenses that you pay each year as a percentage of the value of your investment)
| | | | | | | | | | | | | | | | | | | | | | | | |
| | | Class A | | | Class B | | | Class C | | | Class R3 | | | Class R63 | | | Class I | |
| Management Fees | | | 0.87% | | | | 0.87% | | | | 0.87% | | | | 0.87% | | | | 0.87% | | | | 0.87% | |
| Distribution and/or Service (12b-1) Fees | | | 0.25% | | | | 1.00% | | | | 1.00% | | | | 0.50% | | | | 0.00% | | | | 0.00% | |
| Other Expenses | | | 0.18% | | | | 0.18% | | | | 0.18% | | | | 0.18% | | | | 0.09% | | | | 0.18% | |
| Total Annual Fund Operating Expenses | | | 1.30% | | | | 2.05% | | | | 2.05% | | | | 1.55% | | | | 0.96% | | | | 1.05% | |
| 1 | The contingent deferred sales charge (“CDSC”) on Class B shares declines over a six-year period from purchase. The CDSC on Class C shares applies only to redemptions within 12 months of purchase. |
| 2 | Fee applies to the following types of accounts under $1,000 held directly with the Fund: individual retirement accounts (IRAs), Coverdell Education Savings Accounts and accounts established pursuant to the Uniform Transfers to Minors Act (UTMA) or Uniform Gifts to Minors Act (UGMA). |
| 3 | Class R6 shares were established on February 28, 2013. Accordingly, expenses are based upon the actual expenses incurred by the other share classes; adjusted to reflect anticipated savings resulting from the fact that sub-transfer agent and similar fees are not charged to Class R6 shares. |
Example
The following example is intended to help you compare the cost of investing in the Fund with the cost of investing in other mutual funds. The example assumes that you invest $10,000 in the Fund for the time periods indicated and then either redeem or do not redeem your shares at the end of a period. The example also assumes that your investment has a 5% return each year and that the Fund’s operating expenses remain the same. Although your actual costs may be higher or lower, based on these assumptions your costs would be:
| | | | | | | | | | | | | | | | | | | | | | | | | | | | | | | | | | | | | | | | | | | | | | | | | | | | |
| | | Redemption | | | | | No Redemption | | | |
| | | A | | | B | | | C | | | R3 | | | R6 | | | I | | | | | A | | | B | | | C | | | R3 | | | R6 | | | I | | | |
| 1 Year | | $ | 700 | | | $ | 708 | | | $ | 208 | | | $ | 158 | | | $ | 98 | | | $ | 107 | | | | | $ | 700 | | | $ | 208 | | | $ | 208 | | | $ | 158 | | | $ | 98 | | | $ | 107 | | | |
| 3 Years | | $ | 963 | | | $ | 943 | | | $ | 643 | | | $ | 490 | | | $ | 306 | | | $ | 334 | | | | | $ | 963 | | | $ | 643 | | | $ | 643 | | | $ | 490 | | | $ | 306 | | | $ | 334 | | | |
| 5 Years | | $ | 1,247 | | | $ | 1,203 | | | $ | 1,103 | | | $ | 845 | | | $ | 531 | | | $ | 579 | | | | | $ | 1,247 | | | $ | 1,103 | | | $ | 1,103 | | | $ | 845 | | | $ | 531 | | | $ | 579 | | | |
| 10 Years | | $ | 2,053 | | | $ | 2,187 | | | $ | 2,379 | | | $ | 1,845 | | | $ | 1,178 | | | $ | 1,283 | | | | | $ | 2,053 | | | $ | 2,187 | | | $ | 2,379 | | | $ | 1,845 | | | $ | 1,178 | | | $ | 1,283 | | | |
Section 1 Fund Summaries
31
Portfolio Turnover
The Fund pays transaction costs, such as commissions, when it buys and sells securities (or “turns over” its portfolio). A higher portfolio turnover rate may indicate higher transaction costs and may result in higher taxes when Fund shares are held in a taxable account. These costs, which are not reflected in annual fund operating expenses or in the example, affect the Fund’s performance. During the most recent fiscal year, the Fund’s portfolio turnover rate was 113% of the average value of its portfolio.
Principal Investment Strategies
Under normal market conditions, the Fund invests at least 80% of net assets, plus the amount of any borrowings for investment purposes, in common stocks of mid-capitalization companies, defined as companies that have market capitalizations at the time of purchase within the market capitalization range of the companies in the Russell Midcap® Index immediately after its most recent reconstitution prior to such purchase. It is expected that reconstitution of the index will occur each year at the end of June. Immediately after the most recent reconstitution, the range was $699 million to $19.2 billion.
In selecting stocks, the Fund’s sub-adviser invests in companies that it believes exhibit the potential for superior growth based on factors such as above-average growth in revenue and earnings, strong competitive position, strong management, and sound financial condition. The Fund’s sub-adviser will generally sell a stock if the stock hits its price target, the company’s fundamentals or competitive position significantly deteriorate, or if a better alternative exists in the marketplace.
The Fund may invest up to 15% of its total assets in non-dollar denominated equity securities of non-U.S. issuers. In addition, the Fund may invest up to 25% of its assets, collectively, in non-dollar denominated equity securities of non-U.S. issuers and in dollar-denominated equity securities of non-U.S. issuers that are either listed on a U.S. stock exchange or represented by depositary receipts that may or may not be sponsored by a domestic bank. Up to 15% of the Fund’s total assets may be invested in equity securities of emerging market issuers. A country is considered to be an “emerging market” if it is defined as such by Morgan Stanley Capital International Inc.
The Fund may utilize options, futures contracts, options on futures contracts, and forward foreign currency exchange contracts (“derivatives”). The Fund may use these derivatives to manage market or business risk, enhance the Fund’s return, or hedge against adverse movements in currency exchange rates.
Principal Risks
The value of your investment in this Fund will change daily, which means you could lose money. An investment in the Fund is not a deposit of a bank and is not insured or guaranteed by the Federal Deposit Insurance Corporation or any other government agency. The principal risks of investing in the Fund include:
Derivatives Risk—The use of derivatives involves additional risks, such as liquidity, interest rate, counterparty, market, credit and management risks, and transaction costs which could leave the Fund in a worse position than if it had not used these instruments. Derivatives may entail investment exposures that are greater than their cost would suggest. As a result, a small investment in derivatives could have a large impact on performance. Recent legislation requires the development of a new regulatory framework for the derivatives market. The impact of the new regulations is still unknown, but has the potential to increase the costs of using derivatives, may limit the availability of some forms of derivatives or the Fund’s ability to use derivatives, and may adversely affect the performance of some derivative instruments used by the Fund as well as the Fund’s ability to pursue its investment objective through the use of such instruments.
Equity Security Risk—Equity securities may decline significantly in price over short or extended periods of time, and such declines may occur in the equity market as a whole, or they may occur in only a particular country, company, industry, or sector of the market.
Investment Focus Risk—Different types of stocks tend to shift in and out of favor depending on market and economic conditions. The Fund emphasizes a growth style of investing and therefore seeks companies experiencing high rates of current growth; such companies may be more volatile than other types of investments.
32
Section 1 Fund Summaries
Mid-Cap Stock Risk—Stocks of mid-cap companies may be subject to more abrupt or erratic market movements than those of larger, more established companies or the market averages in general.
Non-U.S./Emerging Markets Risk—Non-U.S. issuers or U.S. issuers with significant non-U.S. operations may be subject to risks in addition to those of issuers located in or that principally operate in the United States as a result of, among other things, political, social and economic developments abroad and different legal, regulatory and tax environments. These additional risks may be heightened for securities of issuers located in, or with significant operations in, emerging market countries. Also, changes in currency exchange rates may affect the Fund’s net asset value, the value of dividends and interest earned, and gains and losses realized on the sale of securities.
Fund Performance
The following bar chart and table provide some indication of the potential risks of investing in the Fund. The Fund’s past performance (before and after taxes) is not necessarily an indication of how the Fund will perform in the future. Updated performance information is available at www.nuveen.com/performance or by calling (800) 257-8787.
The bar chart below shows the variability of the Fund’s performance from year to year for Class A shares. The performance of the other share classes will differ due to their different expense structures. The bar chart and highest/lowest quarterly returns that follow do not reflect sales charges, and if these charges were reflected, the returns would be less than those shown.
Class A Annual Total Return
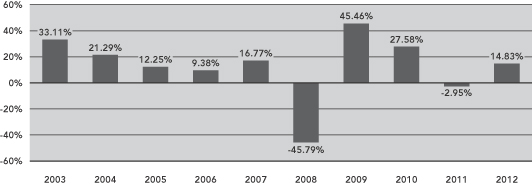
During the ten-year period ended December 31, 2012, the Fund’s highest and lowest quarterly returns were 18.22% and -25.45%, respectively, for the quarters ended September 30, 2010 and December 31, 2008.
The table below shows the variability of the Fund’s average annual returns and how they compare over the time periods indicated with those of a broad measure of market performance and an index of funds with similar investment objectives. All after-tax returns are calculated using the historical highest individual federal marginal income tax rates and do not reflect the impact of state and local taxes. After-tax returns are shown for Class A shares only; after-tax returns for other share classes will vary. Your own actual after-tax returns will depend on your specific tax situation and may differ from what is shown here. After-tax returns are not relevant to investors who hold Fund shares in tax-deferred accounts such as IRAs or employer-sponsored retirement plans.
Both the bar chart and the table assume that all distributions have been reinvested. Performance reflects fee waivers, if any, in effect during the periods presented. If any such waivers were not in place, returns would be reduced.
Prior to July 1, 2004, Class R3 shares were designated Class S shares, which had lower fees and expenses. The performance information in the table prior to July 1, 2004 is based on the performance of the Class S shares. If current fees and expenses had been in effect, performance would have been lower.
Performance is not shown for Class R6 shares, which have not been offered for a full calendar year.
Section 1 Fund Summaries
33
| | | | | | | | | | | | |
| | | Average Annual Total Returns
for the Periods Ended December 31, 2012 | |
| | | 1 Year | | | 5 Years | | | 10 Years | |
| Class A (return before taxes) | | | 8.22% | | | | 1.10 | % | | | 9.36 | % |
| Class A (return after taxes on distributions) | | | 7.02% | | | | 0.75 | % | | | 8.18 | % |
| Class A (return after taxes on distributions and sale of Fund shares) | | | 6.90% | | | | 0.92 | % | | | 7.90 | % |
| Class B (return before taxes) | | | 8.95% | | | | 1.36 | % | | | 9.18 | % |
| Class C (return before taxes) | | | 13.97% | | | | 1.55 | % | | | 9.18 | % |
| Class R3 (return before taxes) | | | 14.54% | | | | 2.05 | % | | | 9.78 | % |
| Class I (return before taxes) | | | 15.12% | | | | 2.56 | % | | | 10.28 | % |
| Russell Midcap® Growth Index (reflects no deduction for fees, expenses or taxes) | | | 15.81% | | | | 3.23 | % | | | 10.32 | % |
Lipper Multi-Cap Growth Classification Average
(reflects no deduction for taxes or certain expenses) | | | 13.56% | | | | 1.67 | % | | | 8.83 | % |
Management
Investment Adviser
Nuveen Fund Advisors, LLC
Sub-Adviser
Nuveen Asset Management, LLC
Portfolio Managers
| | | | |
Name | | Title | | Portfolio Manager of Fund Since |
| James A. Diedrich, CFA | | Senior Vice President | | February 2006 |
| Harold R. Goldstein | | Senior Vice President | | September 2005 |
| Scott M. Mullinix, CFA | | Senior Vice President | | April 2006 |
34
Section 1 Fund Summaries
Purchase and Sale of Fund Shares
You may purchase, redeem or exchange shares of the Fund on any business day, which is any day the New York Stock Exchange is open for business. You may purchase, redeem or exchange shares of the Fund either through a financial advisor or other financial intermediary or directly from the Fund. Class B shares are available only through exchanges and dividend reinvestments by current Class B shareholders. The Fund’s initial and subsequent investment minimums generally are as follows, although the Fund may reduce or waive the minimums in some cases:
| | | | | | | | |
| | | Class A and Class C | | Class R3 | | Class R6 | | Class I |
| Eligibility and Minimum Initial Investment | | $3,000 for all accounts except: •$2,500 for Traditional/Roth IRA accounts. •$2,000 for Coverdell Education Savings Accounts. •$250 for accounts opened through fee-based programs. •No minimum for retirement plans. | | Available only through certain retirement plans. No minimum. | | Available only to certain qualified retirement plans and other investors as described in the prospectus. $5 million for all accounts except: •No minimum for certain qualified retirement plans as described in the prospectus. | | Available only through fee-based programs and certain retirement plans, and to other limited categories of investors as described in the prospectus. $100,000 for all accounts except: •$250 for clients of financial intermediaries and family offices that have accounts holding Class I shares with an aggregate value of at least $100,000 (or that are expected to reach this level). •No minimum for eligible retirement plans and certain other categories of eligible investors as described in the prospectus. |
| Minimum Additional Investment | | $100 | | No minimum. | | No minimum. | | No minimum. |
Tax Information
The Fund’s distributions are taxable and will generally be taxed as ordinary income or capital gains, unless you are investing through a tax-deferred account, such as an IRA or 401(k) plan.
Payments to Broker-Dealers and Other Financial Intermediaries
If you purchase shares of the Fund through a broker-dealer or other financial intermediary (such as a bank or financial advisor), the Fund, its distributor or its investment adviser may pay the intermediary for the sale of Fund shares and related services. These payments may create a conflict of interest by influencing the broker-dealer or other financial intermediary and your salesperson to recommend the Fund over another investment. Ask your financial advisor or visit your financial intermediary’s website for more information.
Section 1 Fund Summaries
35
Nuveen Mid Cap Index Fund
Investment Objective
The investment objective of the Fund is to provide investment results that correspond to the performance of the Standard & Poor’s MidCap 400® Index (S&P MidCap 400 Index).
Fees and Expenses of the Fund
This table describes the fees and expenses that you may pay if you buy and hold shares of the Fund. You may qualify for sales charge discounts if you and your family invest, or agree to invest in the future, at least $50,000 in the Fund or in other Nuveen Mutual Funds. More information about these and other discounts, as well as eligibility requirements for each share class, is available from your financial advisor and in “What Share Classes We Offer” on page 99 of the Fund’s prospectus and “Purchase and Redemption of Fund Shares” on page S-99 of the Fund’s statement of additional information.
Shareholder Fees
(fees paid directly from your investment)
| | | | | | | | | | | | | | | | |
| | | Class A | | | Class C | | | Class R3 | | | Class I | |
Maximum Sales Charge (Load) Imposed on Purchases
(as a percentage of offering price) | | | None | | | | None | | | | None | | | | None | |
Maximum Deferred Sales Charge (Load)
(as a percentage of the lesser of purchase price or redemption proceeds)1 | | | None | | | | 1.00% | | | | None | | | | None | |
| Maximum Sales Charge (Load) Imposed on Reinvested Dividends | | | None | | | | None | | | | None | | | | None | |
| Exchange Fee | | | None | | | | None | | | | None | | | | None | |
| Annual Low Balance Account Fee (for accounts under $1,000)2 | | | $15 | | | | $15 | | | | None | | | | $15 | |
Annual Fund Operating Expenses
(expenses that you pay each year as a percentage of the value of your investment)
| | | | | | | | | | | | | | | | |
| | | Class A | | | Class C | | | Class R3 | | | Class I | |
| Management Fees | | | 0.33% | | | | 0.33% | | | | 0.33% | | | | 0.33% | |
| Distribution and/or Service (12b-1) Fees | | | 0.25% | | | | 1.00% | | | | 0.50% | | | | 0.00% | |
| Other Expenses | | | 0.22% | | | | 0.22% | | | | 0.22% | | | | 0.22% | |
| Acquired Fund Fees and Expenses | | | 0.02% | | | | 0.02% | | | | 0.02% | | | | 0.02% | |
| Total Annual Fund Operating Expenses | | | 0.82% | | | | 1.57% | | | | 1.07% | | | | 0.57% | |
| Fee Waivers and/or Expense Reimbursements3 | | | (0.06)% | | | | (0.06)% | | | | (0.06)% | | | | (0.06)% | |
| Total Annual Fund Operating Expenses After Fee Waivers and/or Expense Reimbursements | | | 0.76% | | | | 1.51% | | | | 1.01% | | | | 0.51% | |
| 1 | The contingent deferred sales charge on Class C shares applies only to redemptions within 12 months of purchase. |
| 2 | Fee applies to the following types of accounts under $1,000 held directly with the Fund: individual retirement accounts (IRAs), Coverdell Education Savings Accounts and accounts established pursuant to the Uniform Transfers to Minors Act (UTMA) or Uniform Gifts to Minors Act (UGMA). |
| 3 | The Fund’s investment adviser has contractually agreed to waive fees and/or reimburse other Fund expenses through February 28, 2014 so that total annual fund operating expenses, after fee waivers and/or expense reimbursements and excluding Acquired Fund Fees and Expenses, do not exceed 0.75%, 1.50%, 1.00% and 0.50% for Class A, Class C, Class R3 and Class I shares, respectively. Fee waivers and/or expense reimbursements will not be terminated prior to that time without the approval of the Fund’s board of directors. |
36
Section 1 Fund Summaries
Example
The following example is intended to help you compare the cost of investing in the Fund with the cost of investing in other mutual funds. The example assumes that you invest $10,000 in the Fund for the time periods indicated and then either redeem or do not redeem your shares at the end of a period. The example also assumes that your investment has a 5% return each year, that the Fund’s operating expenses remain the same, and the contractual fee waivers currently in place are not renewed beyond February 28, 2014. Although your actual costs may be higher or lower, based on these assumptions your costs would be:
| | | | | | | | | | | | | | | | | | | | | | | | | | | | | | | | | | | | |
| | | Redemption | | | | | No Redemption | | | |
| | | A | | | C | | | R3 | | | I | | | | | A | | | C | | | R3 | | | I | | | |
| 1 Year | | $ | 78 | | | $ | 154 | | | $ | 103 | | | $ | 52 | | | | | $ | 78 | | | $ | 154 | | | $ | 103 | | | $ | 52 | | | |
| 3 Years | | $ | 256 | | | $ | 490 | | | $ | 334 | | | $ | 177 | | | | | $ | 256 | | | $ | 490 | | | $ | 334 | | | $ | 177 | | | |
| 5 Years | | $ | 449 | | | $ | 849 | | | $ | 584 | | | $ | 312 | | | | | $ | 449 | | | $ | 849 | | | $ | 584 | | | $ | 312 | | | |
| 10 Years | | $ | 1,008 | | | $ | 1,862 | | | $ | 1,300 | | | $ | 708 | | | | | $ | 1,008 | | | $ | 1,862 | | | $ | 1,300 | | | $ | 708 | | | |
Portfolio Turnover
The Fund pays transaction costs, such as commissions, when it buys and sells securities (or “turns over” its portfolio). A higher portfolio turnover rate may indicate higher transaction costs and may result in higher taxes when Fund shares are held in a taxable account. These costs, which are not reflected in annual fund operating expenses or in the example, affect the Fund’s performance. During the most recent fiscal year, the Fund’s portfolio turnover rate was 7% of the average value of its portfolio.
Principal Investment Strategies
Under normal market conditions, the Fund generally invests at least 90% of its net assets, plus the amount of any borrowings for investment purposes, in common stocks included in the S&P MidCap 400 Index. This index is an unmanaged market-value weighted index consisting of 400 stocks chosen for market size, liquidity, sector representation and other factors that represents the mid range sector of the U.S. stock market. Reconstitution of the index occurs both on a quarterly and ongoing basis. As of January 31, 2013, market capitalizations of companies in the S&P MidCap 400 Index ranged from approximately $473.9 million to $16.9 billion.
The Fund’s sub-adviser believes that the Fund’s objective can best be achieved by investing in common stocks of approximately 90% to 100% of the issues included in the S&P MidCap 400 Index, depending on the size of the Fund. A computer program is used to identify which stocks should be purchased or sold in order to replicate, as closely as practicable, the composition of the S&P MidCap 400 Index.
Because the Fund may not always hold all of the stocks included in the S&P MidCap 400 Index, and because the Fund has expenses and the index does not, the Fund will not duplicate the index’s performance precisely. However, the Fund’s sub-adviser believes there should be a close correlation between the Fund’s performance and that of the S&P MidCap 400 Index in both rising and falling markets. The Fund will attempt to achieve a correlation between the performance of its portfolio and that of the S&P MidCap 400 Index of at least 95%, without taking into account expenses of the Fund. A perfect correlation would be indicated by a figure of 100%, which would be achieved if the Fund’s net asset value, including the value of its dividends and capital gains distributions, increased or decreased in exact proportion to changes in the S&P MidCap 400 Index. If the Fund is unable to achieve a correlation of 95% over time, the Fund’s board of directors will consider alternative strategies for the Fund.
The Fund may invest in stock index futures contracts, options on stock indices, and options on stock index futures (“derivatives”) on the S&P MidCap 400 Index. The Fund makes these investments to maintain the liquidity needed to meet redemption requests, to increase the level of Fund assets devoted to replicating the composition of the S&P MidCap 400 Index, and to reduce transaction costs.
Section 1 Fund Summaries
37
Principal Risks
The value of your investment in this Fund will change daily, which means you could lose money. An investment in the Fund is not a deposit of a bank and is not insured or guaranteed by the Federal Deposit Insurance Corporation or any other government agency. The principal risks of investing in the Fund include:
Derivatives Risk—The use of derivatives involves additional risks, such as liquidity, interest rate, counterparty, market, credit and management risks, and transaction costs which could leave the Fund in a worse position than if it had not used these instruments. Derivatives may entail investment exposures that are greater than their cost would suggest. As a result, a small investment in derivatives could have a large impact on performance. Recent legislation requires the development of a new regulatory framework for the derivatives market. The impact of the new regulations is still unknown, but has the potential to increase the costs of using derivatives, may limit the availability of some forms of derivatives or the Fund’s ability to use derivatives, and may adversely affect the performance of some derivative instruments used by the Fund as well as the Fund’s ability to pursue its investment objective through the use of such instruments.
Equity Security Risk—Equity securities may decline significantly in price over short or extended periods of time, and such declines may occur in the equity market as a whole, or they may occur in only a particular country, company, industry, or sector of the market.
Failure to Match Index Performance—The Fund may not replicate the performance of the S&P MidCap 400 Index.
Mid-Cap Stock Risk—Stocks of mid-cap companies may be subject to more abrupt or erratic market movements than those of larger, more established companies or the market averages in general.
Fund Performance
The following bar chart and table provide some indication of the potential risks of investing in the Fund. The Fund’s past performance (before and after taxes) is not necessarily an indication of how the Fund will perform in the future. Updated performance information is available at www.nuveen.com/performance or by calling (800) 257-8787.
The bar chart below shows the variability of the Fund’s performance from year to year for Class A shares. The performance of the other share classes will differ due to their different expense structures.
Class A Annual Total Return
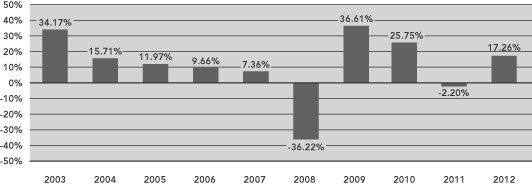
During the ten-year period ended December 31, 2012, the Fund’s highest and lowest quarterly returns were 19.81% and -25.52%, respectively, for the quarters ended September 30, 2009 and December 31, 2008.
The table below shows the variability of the Fund’s average annual returns and how they compare over the time periods indicated with those of a broad measure of market performance and an index of funds with similar investment objectives. All after-tax returns are calculated using the historical highest individual federal marginal income tax rates and do not reflect the impact of state and local taxes. After-tax returns are shown for Class A shares only; after-tax returns for other share classes will vary. Your own actual after-tax returns will depend on your specific tax situation and may differ from what is shown here. After-tax returns are not relevant to investors who hold Fund shares in tax-deferred accounts such as IRAs or employer-sponsored retirement plans.
38
Section 1 Fund Summaries
Both the bar chart and the table assume that all distributions have been reinvested. Performance reflects fee waivers, if any, in effect during the periods presented. If any such waivers were not in place, returns would be reduced.
Prior to July 1, 2004, Class R3 shares were designated Class S shares, which had lower fees and expenses. The performance information in the table prior to July 1, 2004 is based on the performance of the Class S shares. If current fees and expenses had been in effect, performance would have been lower.
| | | | | | | | | | | | |
| | | Average Annual Total Returns
for the Periods Ended December 31, 2012 | |
| | | 1 Year | | | 5 Years | | | 10 Years | |
| Class A (return before taxes) | | | 17.26 | % | | | 4.67 | % | | | 9.90 | % |
| Class A (return after taxes on distributions) | | | 16.42 | % | | | 4.05 | % | | | 9.05 | % |
| Class A (return after taxes on distributions and sale of Fund shares) | | | 12.00 | % | | | 3.83 | % | | | 8.57 | % |
| Class C (return before taxes) | | | 16.41 | % | | | 3.88 | % | | | 9.09 | % |
| Class R3 (return before taxes) | | | 16.98 | % | | | 4.41 | % | | | 9.67 | % |
| Class I (return before taxes) | | | 17.49 | % | | | 4.91 | % | | | 10.18 | % |
S&P MidCap 400® Index
(reflects no deduction for fees, expenses or taxes) | | | 17.88 | % | | | 5.15 | % | | | 10.53 | % |
Lipper Mid-Cap Core Classification Average
(reflects no deduction for taxes or certain expenses) | | | 15.59 | % | | | 2.23 | % | | | 8.89 | % |
Management
Investment Adviser
Nuveen Fund Advisors, LLC
Sub-Adviser
Nuveen Asset Management, LLC
Portfolio Managers
| | | | |
Name | | Title | | Portfolio Manager of Fund Since |
| Walter A. French | | Senior Vice President | | March 2001 |
| David A. Friar | | Assistant Vice President | | March 2001 |
Section 1 Fund Summaries
39
Purchase and Sale of Fund Shares
You may purchase, redeem or exchange shares of the Fund on any business day, which is any day the New York Stock Exchange is open for business. You may purchase, redeem or exchange shares of the Fund either through a financial advisor or other financial intermediary or directly from the Fund. The Fund’s initial and subsequent investment minimums generally are as follows, although the Fund may reduce or waive the minimums in some cases:
| | | | | | | | |
| | | Class A | | Class C | | Class R3 | | Class I |
| Eligibility and Minimum Initial Investment | | Available only through fee-based programs and certain retirement plans. •$250 minimum for accounts opened through fee-based programs. •No minimum for retirement plans. | | $3,000 for all accounts except: •$2,500 for Traditional/Roth IRA accounts. •$2,000 for Coverdell Education Savings Accounts. •$250 for accounts opened through fee-based programs. •No minimum for retirement plans. | | Available only through certain retirement plans. No minimum. | | Available only through fee-based programs and certain retirement plans, and to other limited categories of investors as described in the prospectus. $100,000 for all accounts except: •$250 for clients of financial intermediaries and family offices that have accounts holding Class I shares with an aggregate value of at least $100,000 (or that are expected to reach this level). •No minimum for eligible retirement plans and certain other categories of eligible investors as described in the prospectus. |
| Minimum Additional Investment | | $100 | | $100 | | No minimum. | | No minimum. |
Tax Information
The Fund’s distributions are taxable and will generally be taxed as ordinary income or capital gains, unless you are investing through a tax-deferred account, such as an IRA or 401(k) plan.
Payments to Broker-Dealers and Other Financial Intermediaries
If you purchase shares of the Fund through a broker-dealer or other financial intermediary (such as a bank or financial advisor), the Fund, its distributor or its investment adviser may pay the intermediary for the sale of Fund shares and related services. These payments may create a conflict of interest by influencing the broker-dealer or other financial intermediary and your salesperson to recommend the Fund over another investment. Ask your financial advisor or visit your financial intermediary’s website for more information.
40
Section 1 Fund Summaries
Nuveen Mid Cap Select Fund
Investment Objective
The investment objective of the Fund is long-term growth of capital.
Fees and Expenses of the Fund
This table describes the fees and expenses that you may pay if you buy and hold shares of the Fund. You may qualify for sales charge discounts if you and your family invest, or agree to invest in the future, at least $50,000 in the Fund or in other Nuveen Mutual Funds. More information about these and other discounts, as well as eligibility requirements for each share class, is available from your financial advisor and in “What Share Classes We Offer” on page 99 of the Fund’s prospectus, “How to Reduce Your Sales Charge” on page 102 of the prospectus and “Purchase and Redemption of Fund Shares” on page S-99 of the Fund’s statement of additional information.
Shareholder Fees
(fees paid directly from your investment)
| | | | | | | | | | | | |
| | | Class A | | | Class C | | | Class I | |
Maximum Sales Charge (Load) Imposed on Purchases
(as a percentage of offering price) | | | 5.75% | | | | None | | | | None | |
Maximum Deferred Sales Charge (Load) (as a percentage of the lesser of purchase price or redemption proceeds)1 | | | None | | | | 1.00% | | | | None | |
| Maximum Sales Charge (Load) Imposed on Reinvested Dividends | | | None | | | | None | | | | None | |
| Exchange Fee | | | None | | | | None | | | | None | |
| Annual Low Balance Account Fee (for accounts under $1,000)2 | | | $15 | | | | $15 | | | | $15 | |
| | | |
Annual Fund Operating Expenses (expenses that you pay each year as a percentage of the value of your investment) | | | | | | | | | | | | |
| | | Class A | | | Class C | | | Class I | |
| Management Fees | | | 0.90% | | | | 0.90% | | | | 0.90% | |
| Distribution and/or Service (12b-1) Fees | | | 0.25% | | | | 1.00% | | | | 0.00% | |
| Other Expenses3 | | | 0.69% | | | | 0.69% | | | | 0.69% | |
| Total Annual Fund Operating Expenses | | | 1.84% | | | | 2.59% | | | | 1.59% | |
| Fee Waivers and/or Expense Reimbursements4 | | | (0.43)% | | | | (0.43)% | | | | (0.43)% | |
| Total Annual Fund Operating Expenses After Fee Waivers and/or Expense Reimbursements | | | 1.41% | | | | 2.16% | | | | 1.16% | |
| 1 | The contingent deferred sales charge on Class C shares applies only to redemptions within 12 months of purchase. |
| 2 | Fee applies to the following types of accounts under $1,000 held directly with the Fund: individual retirement accounts (IRAs), Coverdell Education Savings Accounts and accounts established pursuant to the Uniform Transfers to Minors Act (UTMA) or Uniform Gifts to Minors Act (UGMA). |
| 3 | Other Expenses have been restated to reflect current contractual fees. |
| 4 | The Fund’s investment adviser has contractually agreed to waive fees and/or reimburse other Fund expenses through February 28, 2014 so that total annual fund operating expenses, after fee waivers and/or expense reimbursements and excluding Acquired Fund Fees and Expenses, do not exceed 1.41%, 2.16% and 1.16% for Class A, Class C and Class I shares, respectively. Fee waivers and/or expense reimbursements will not be terminated prior to that time without the approval of the Fund’s board of directors. |
Section 1 Fund Summaries
41
Example
The following example is intended to help you compare the cost of investing in the Fund with the cost of investing in other mutual funds. The example assumes that you invest $10,000 in the Fund for the time periods indicated and then either redeem or do not redeem your shares at the end of a period. The example also assumes that your investment has a 5% return each year, that the Fund’s operating expenses remain the same, and the contractual fee waivers currently in place are not renewed beyond February 28, 2014. Although your actual costs may be higher or lower, based on these assumptions your costs would be:
| | | | | | | | | | | | | | | | | | | | | | | | | | | | |
| | | Redemption | | | | | No Redemption | | | |
| | | A | | | C | | | I | | | | | A | | | C | | | I | | | |
| 1 Year | | $ | 710 | | | $ | 219 | | | $ | 118 | | | | | $ | 710 | | | $ | 219 | | | $ | 118 | | | |
| 3 Years | | $ | 1,081 | | | $ | 765 | | | $ | 460 | | | | | $ | 1,081 | | | $ | 765 | | | $ | 460 | | | |
| 5 Years | | $ | 1,476 | | | $ | 1,337 | | | $ | 825 | | | | | $ | 1,476 | | | $ | 1,337 | | | $ | 825 | | | |
| 10 Years | | $ | 2,576 | | | $ | 2,893 | | | $ | 1,853 | | | | | $ | 2,576 | | | $ | 2,893 | | | $ | 1,853 | | | |
Portfolio Turnover
The Fund pays transaction costs, such as commissions, when it buys and sells securities (or “turns over” its portfolio). A higher portfolio turnover rate may indicate higher transaction costs and may result in higher taxes when Fund shares are held in a taxable account. These costs, which are not reflected in annual fund operating expenses or in the example, affect the Fund’s performance. During the most recent fiscal year, the Fund’s portfolio turnover rate was 198% of the average value of its portfolio.
Principal Investment Strategies
Under normal market conditions, the Fund invests at least 80% of net assets, plus the amount of any borrowings for investment purposes, in common stocks of mid-capitalization companies, defined as companies that have market capitalizations at the time of purchase within the market capitalization range of the companies in the Russell Midcap® Index immediately after its most recent reconstitution prior to such purchase. It is expected that reconstitution of the index will occur each year at the end of June. Immediately after the most recent reconstitution, the range was $699 million to $19.2 billion.
In selecting stocks, the Fund’s sub-adviser invests in companies that it believes meet one or more of the following criteria:
| • | | Attractively valued relative to other companies in the same industry or market. |
| • | | Strong or improving cash flows, revenue and earnings growth, or other fundamentals. |
| • | | Strong competitive position. |
| • | | An identifiable catalyst that could increase the value of the company’s stock over the next one or two years. |
The Fund’s sub-adviser will generally sell a stock if the stock hits its price target, the company’s fundamentals or competitive position significantly deteriorate, or if a better alternative exists in the marketplace.
The Fund may invest up to 15% of its total assets in non-dollar denominated equity securities of non-U.S. issuers. In addition, the Fund may invest up to 25% of its assets, collectively, in non-dollar denominated equity securities of non-U.S. issuers and in dollar-denominated equity securities of non-U.S. issuers that are either listed on a U.S. stock exchange or represented by depositary receipts that may or may not be sponsored by a domestic bank. Up to 15% of the Fund’s total assets may be invested in equity securities of emerging market issuers. A country is considered to be an “emerging market” if it is defined as such by Morgan Stanley Capital International Inc.
The Fund may utilize options, futures contracts, options on futures contracts, and forward foreign currency exchange contracts (“derivatives”). The Fund may use these derivatives to manage market or business risk, enhance the Fund’s return, or hedge against adverse movements in currency exchange rates.
42
Section 1 Fund Summaries
Principal Risks
The value of your investment in this Fund will change daily, which means you could lose money. An investment in the Fund is not a deposit of a bank and is not insured or guaranteed by the Federal Deposit Insurance Corporation or any other government agency. The principal risks of investing in the Fund include:
Derivatives Risk—The use of derivatives involves additional risks, such as liquidity, interest rate, counterparty, market, credit and management risks, and transaction costs which could leave the Fund in a worse position than if it had not used these instruments. Derivatives may entail investment exposures that are greater than their cost would suggest. As a result, a small investment in derivatives could have a large impact on performance. Recent legislation requires the development of a new regulatory framework for the derivatives market. The impact of the new regulations is still unknown, but has the potential to increase the costs of using derivatives, may limit the availability of some forms of derivatives or the Fund’s ability to use derivatives, and may adversely affect the performance of some derivative instruments used by the Fund as well as the Fund’s ability to pursue its investment objective through the use of such instruments.
Equity Security Risk—Equity securities may decline significantly in price over short or extended periods of time, and such declines may occur in the equity market as a whole, or they may occur in only a particular country, company, industry, or sector of the market.
Mid-Cap Stock Risk—Stocks of mid-cap companies may be subject to more abrupt or erratic market movements than those of larger, more established companies or the market averages in general.
Non-U.S./Emerging Markets Risk—Non-U.S. issuers or U.S. issuers with significant non-U.S. operations may be subject to risks in addition to those of issuers located in or that principally operate in the United States as a result of, among other things, political, social and economic developments abroad and different legal, regulatory and tax environments. These additional risks may be heightened for securities of issuers located in, or with significant operations in, emerging market countries. Also, changes in currency exchange rates may affect the Fund’s net asset value, the value of dividends and interest earned, and gains and losses realized on the sale of securities.
Fund Performance
The following bar chart and table provide some indication of the potential risks of investing in the Fund. The Fund’s past performance (before and after taxes) is not necessarily an indication of how the Fund will perform in the future. Updated performance information is available at www.nuveen.com/performance or by calling (800) 257-8787.
The bar chart below shows the variability of the Fund’s performance from year to year for Class A shares. The performance of the other share classes will differ due to their different expense structures. The bar chart and highest/lowest quarterly returns that follow do not reflect sales charges, and if these charges were reflected, the returns would be less than those shown.
Class A Annual Total Return
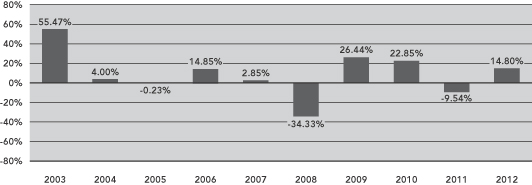
During the ten-year period ended December 31, 2012, the Fund’s highest and lowest quarterly returns were 28.88% and -22.43%, respectively, for the quarters ended June 30, 2003 and December 31, 2008.
Section 1 Fund Summaries
43
The table below shows the variability of the Fund’s average annual returns and how they compare over the time periods indicated with those of a broad measure of market performance and an index of funds with similar investment objectives. All after-tax returns are calculated using the historical highest individual federal marginal income tax rates and do not reflect the impact of state and local taxes. After-tax returns are shown for Class A shares only; after-tax returns for other share classes will vary. Your own actual after-tax returns will depend on your specific tax situation and may differ from what is shown here. After-tax returns are not relevant to investors who hold Fund shares in tax-deferred accounts such as IRAs or employer-sponsored retirement plans.
Both the bar chart and the table assume that all distributions have been reinvested. Performance reflects fee waivers, if any, in effect during the periods presented. If any such waivers were not in place, returns would be reduced.
Performance for periods prior to May 4, 2009 reflects the Fund’s operation using different investment strategies than are currently in place. Effective October 3, 2005, the Fund’s principal investment strategy was changed from investing primarily in technology stocks to investing primarily in common stocks of small- and mid-capitalization companies, and the Fund’s name changed from First American Technology Fund to First American Small-Mid Cap Core Fund. Thereafter, effective May 4, 2009, the Fund’s principal investment strategy was changed from investing primarily in common stocks of small- and mid-capitalization companies to investing primarily in common stocks of mid-capitalization companies, and the Fund’s name changed from First American Small-Mid Cap Core Fund to First American Mid Cap Select Fund.
| | | | | | | | | | | | |
| | | Average Annual Total Returns
for the Periods Ended
December 31, 2012 | |
| | | 1 Year | | | 5 Years | | | 10 Years | |
| Class A (return before taxes) | | | 8.16 | % | | | (0.04 | )% | | | 6.65 | % |
| Class A (return after taxes on distributions) | | | 8.08 | % | | | (0.07 | )% | | | 6.64 | % |
| Class A (return after taxes on distributions and sale of Fund shares) | | | 5.41 | % | | | (0.04 | )% | | | 5.86 | % |
| Class C (return before taxes) | | | 13.97 | % | | | 0.40 | % | | | 6.49 | % |
| Class I (return before taxes) | | | 15.07 | % | | | 1.39 | % | | | 7.55 | % |
| Russell Midcap® Index (reflects no deduction for fees, expenses or taxes) | | | 17.28 | % | | | 3.57 | % | | | 10.65 | % |
Lipper Mid-Cap Core Classification Average
(reflects no deduction for taxes or certain expenses) | | | 15.59 | % | | | 2.23 | % | | | 8.89 | % |
Management
Investment Adviser
Nuveen Fund Advisors, LLC
Sub-Adviser
Nuveen Asset Management, LLC
Portfolio Managers
| | | | |
Name | | Title | | Portfolio Manager of Fund Since |
| Anthony R. Burger, CFA | | Senior Vice President | | May 2005 |
| Scott M. Tonneson, CFA | | Vice President | | February 2012 |
44
Section 1 Fund Summaries
Purchase and Sale of Fund Shares
You may purchase, redeem or exchange shares of the Fund on any business day, which is any day the New York Stock Exchange is open for business. You may purchase, redeem or exchange shares of the Fund either through a financial advisor or other financial intermediary or directly from the Fund. The Fund’s initial and subsequent investment minimums generally are as follows, although the Fund may reduce or waive the minimums in some cases:
| | | | |
| | | Class A and Class C | | Class I |
| Eligibility and Minimum Initial Investment | | $3,000 for all accounts except: •$2,500 for Traditional/Roth IRA accounts. •$2,000 for Coverdell Education Savings Accounts. •$250 for accounts opened through fee-based programs. •No minimum for retirement plans. | | Available only through fee-based programs and certain retirement plans, and to other limited categories of investors as described in the prospectus. $100,000 for all accounts except: •$250 for clients of financial intermediaries and family offices that have accounts holding Class I shares with an aggregate value of at least $100,000 (or that are expected to reach this level). •No minimum for eligible retirement plans and certain other categories of eligible investors as described in the prospectus. |
| Minimum Additional Investment | | $100 | | No minimum. |
Tax Information
The Fund’s distributions are taxable and will generally be taxed as ordinary income or capital gains, unless you are investing through a tax-deferred account, such as an IRA or 401(k) plan.
Payments to Broker-Dealers and Other Financial Intermediaries
If you purchase shares of the Fund through a broker-dealer or other financial intermediary (such as a bank or financial advisor), the Fund, its distributor or its investment adviser may pay the intermediary for the sale of Fund shares and related services. These payments may create a conflict of interest by influencing the broker-dealer or other financial intermediary and your salesperson to recommend the Fund over another investment. Ask your financial advisor or visit your financial intermediary’s website for more information.
Proposed Reorganization of Nuveen Mid Cap Select Fund into Nuveen Symphony Mid-Cap Core Fund
The Board of Directors/Trustees of Nuveen Investment Funds, Inc. (“NIF”) and Nuveen Investment Trust II (“NIT II”) has approved the reorganization of Nuveen Mid Cap Select Fund (the “Acquired Fund”), a series of NIF, into Nuveen Symphony Mid-Cap Core Fund (the “Acquiring Fund”), a series of NIT II. In order for the reorganization to occur, it must be approved by the shareholders of the Acquired Fund.
If the Acquired Fund’s shareholders approve the reorganization, the Acquired Fund will transfer all of its assets and liabilities to the Acquiring Fund in exchange for Acquiring Fund shares of equal value. These Acquiring Fund shares will then be distributed to Acquired Fund shareholders and the Acquired Fund will be terminated. As a result of these transactions, Acquired Fund shareholders will become shareholders of the Acquiring Fund and will cease to be shareholders of the Acquired Fund. Each Acquired Fund shareholder will receive Acquiring Fund shares with a total value equal to the total value of that shareholder’s Acquired Fund shares immediately prior to the closing of the reorganization.
A special meeting of the Acquired Fund’s shareholders for the purpose of voting on the reorganization is expected to be held in late August 2013. If the required approval is obtained, it is anticipated that the reorganization will be consummated shortly after the special shareholder meeting. Further information regarding the proposed reorganization will be contained in proxy materials that are expected to be sent to shareholders of the Acquired Fund in late July 2013.
The Acquired Fund will continue sales and redemptions of its shares as described in the prospectus until shortly before its reorganization. However, holders of shares purchased after the record date set for the Acquired Fund’s special meeting of shareholders will not be entitled to vote those shares at the special meeting.
Section 1 Fund Summaries
45
Nuveen Mid Cap Value Fund
Investment Objective
The investment objective of the Fund is capital appreciation.
Fees and Expenses of the Fund
This table describes the fees and expenses that you may pay if you buy and hold shares of the Fund. You may qualify for sales charge discounts if you and your family invest, or agree to invest in the future, at least $50,000 in the Fund or in other Nuveen Mutual Funds. More information about these and other discounts, as well as eligibility requirements for each share class, is available from your financial advisor and in “What Share Classes We Offer” on page 99 of the Fund’s prospectus, “How to Reduce Your Sales Charge” on page 102 of the prospectus and “Purchase and Redemption of Fund Shares” on page S-99 of the Fund’s statement of additional information.
Shareholder Fees
(fees paid directly from your investment)
| | | | | | | | | | | | | | | | | | | | |
| | | Class A | | | Class B | | | Class C | | | Class R3 | | | Class I | |
Maximum Sales Charge (Load) Imposed on Purchases
(as a percentage of offering price) | | | 5.75% | | | | None | | | | None | | | | None | | | | None | |
Maximum Deferred Sales Charge (Load)
(as a percentage of the lesser of purchase price or redemption proceeds)1 | | | None | | | | 5.00% | | | | 1.00% | | | | None | | | | None | |
| Maximum Sales Charge (Load) Imposed on Reinvested Dividends | | | None | | | | None | | | | None | | | | None | | | | None | |
| Exchange Fee | | | None | | | | None | | | | None | | | | None | | | | None | |
| Annual Low Balance Account Fee (for accounts under $1,000)2 | | | $15 | | | | $15 | | | | $15 | | | | None | | | | $15 | |
Annual Fund Operating Expenses
(expenses that you pay each year as a percentage of the value of your investment)
| | | | | | | | | | | | | | | | | | | | |
| | | Class A | | | Class B | | | Class C | | | Class R3 | | | Class I | |
| Management Fees | | | 0.90% | | | | 0.90% | | | | 0.90% | | | | 0.90% | | | | 0.90% | |
| Distribution and/or Service (12b-1) Fees | | | 0.25% | | | | 1.00% | | | | 1.00% | | | | 0.50% | | | | 0.00% | |
| Other Expenses3 | | | 0.32% | | | | 0.32% | | | | 0.32% | | | | 0.32% | | | | 0.32% | |
| Total Annual Fund Operating Expenses | | | 1.47% | | | | 2.22% | | | | 2.22% | | | | 1.72% | | | | 1.22% | |
| Fee Waivers and/or Expense Reimbursements3,4 | | | (0.13)% | | | | (0.13)% | | | | (0.13)% | | | | (0.13)% | | | | (0.13)% | |
| Total Annual Fund Operating Expenses After Fee Waivers and/or Expense Reimbursements | | | 1.34% | | | | 2.09% | | | | 2.09% | | | | 1.59% | | | | 1.09% | |
| 1 | The contingent deferred sales charge (“CDSC”) on Class B shares declines over a six-year period from purchase. The CDSC on Class C shares applies only to redemptions within 12 months of purchase. |
| 2 | Fee applies to the following types of accounts under $1,000 held directly with the Fund: individual retirement accounts (IRAs), Coverdell Education Savings Accounts and accounts established pursuant to the Uniform Transfers to Minors Act (UTMA) or Uniform Gifts to Minors Act (UGMA). |
| 3 | Other Expenses and Fee Waivers and/or Expense Reimbursements have been restated to reflect current contractual fees. |
| 4 | The Fund’s investment adviser has contractually agreed to waive fees and/or reimburse other Fund expenses through February 28, 2014 so that total annual fund operating expenses, after fee waivers and/or expense reimbursements and excluding Acquired Fund Fees and Expenses, do not exceed 1.34%, 2.09%, 2.09%, 1.59% and 1.09% for Class A, Class B, Class C, Class R3 and Class I shares, respectively. Fee waivers and/or expense reimbursements will not be terminated prior to that time without the approval of the Fund’s board of directors. |
Example
The following example is intended to help you compare the cost of investing in the Fund with the cost of investing in other mutual funds. The example assumes that you invest $10,000 in the Fund for the time periods indicated and then either redeem or do not redeem your shares at the end of a period. The example also assumes that your investment has a 5% return each year, that the Fund’s operating expenses remain the same, and the contractual fee waivers currently in place are not renewed beyond February 28, 2014. Although your actual costs may be higher or lower, based on these assumptions your costs would be:
| | | | | | | | | | | | | | | | | | | | | | | | | | | | | | | | | | | | | | | | | | | | |
| | | Redemption | | | | | No Redemption | | | |
| | | A | | | B | | | C | | | R3 | | | I | | | | | A | | | B | | | C | | | R3 | | | I | | | |
| 1 Year | | $ | 704 | | | $ | 712 | | | $ | 212 | | | $ | 162 | | | $ | 111 | | | | | $ | 704 | | | $ | 212 | | | $ | 212 | | | $ | 162 | | | $ | 111 | | | |
| 3 Years | | $ | 1,001 | | | $ | 982 | | | $ | 682 | | | $ | 529 | | | $ | 374 | | | | | $ | 1,001 | | | $ | 682 | | | $ | 682 | | | $ | 529 | | | $ | 374 | | | |
| 5 Years | | $ | 1,320 | | | $ | 1,278 | | | $ | 1,178 | | | $ | 921 | | | $ | 658 | | | | | $ | 1,320 | | | $ | 1,178 | | | $ | 1,178 | | | $ | 921 | | | $ | 658 | | | |
| 10 Years | | $ | 2,221 | | | $ | 2,355 | | | $ | 2,544 | | | $ | 2,019 | | | $ | 1,466 | | | | | $ | 2,221 | | | $ | 2,355 | | | $ | 2,544 | | | $ | 2,019 | | | $ | 1,466 | | | |
46
Section 1 Fund Summaries
Portfolio Turnover
The Fund pays transaction costs, such as commissions, when it buys and sells securities (or “turns over” its portfolio). A higher portfolio turnover rate may indicate higher transaction costs and may result in higher taxes when Fund shares are held in a taxable account. These costs, which are not reflected in annual fund operating expenses or in the example, affect the Fund’s performance. During the most recent fiscal year, the Fund’s portfolio turnover rate was 140% of the average value of its portfolio.
Principal Investment Strategies
Under normal market conditions, the Fund invests at least 80% of net assets, plus the amount of any borrowings for investment purposes, in common stocks of mid-capitalization companies, defined as companies that have market capitalizations at the time of purchase within the market capitalization range of the companies in the Russell Midcap® Index immediately after its most recent reconstitution prior to such purchase. It is expected that reconstitution of the index will occur each year at the end of June. Immediately after the most recent reconstitution, the range was $699 million to $19.2 billion.
In selecting stocks, the Fund’s sub-adviser invests in companies that it believes are undervalued relative to other companies in the same industry or market, exhibit good or improving fundamentals, and exhibit an identifiable catalyst that could close the gap between market value and fair value over the next one to two years. The Fund’s sub-adviser will generally sell a stock if the stock hits its price target, the company’s fundamentals or competitive position significantly deteriorate, or if a better alternative exists in the marketplace.
The Fund may invest up to 15% of its total assets in non-dollar denominated equity securities of non-U.S. issuers. In addition, the Fund may invest up to 25% of its assets, collectively, in non-dollar denominated equity securities of non-U.S. issuers and in dollar-denominated equity securities of non-U.S. issuers that are either listed on a U.S. stock exchange or represented by depositary receipts that may or may not be sponsored by a domestic bank. Up to 15% of the Fund’s total assets may be invested in equity securities of emerging market issuers. A country is considered to be an “emerging market” if it is defined as such by Morgan Stanley Capital International Inc.
The Fund may utilize options, futures contracts, options on futures contracts, and forward foreign currency exchange contracts (“derivatives”). The Fund may use these derivatives to manage market or business risk, enhance the Fund’s return, or hedge against adverse movements in currency exchange rates.
Principal Risks
The value of your investment in this Fund will change daily, which means you could lose money. An investment in the Fund is not a deposit of a bank and is not insured or guaranteed by the Federal Deposit Insurance Corporation or any other government agency. The principal risks of investing in the Fund include:
Derivatives Risk—The use of derivatives involves additional risks, such as liquidity, interest rate, counterparty, market, credit and management risks, and transaction costs which could leave the Fund in a worse position than if it had not used these instruments. Derivatives may entail investment exposures that are greater than their cost would suggest. As a result, a small investment in derivatives could have a large impact on performance. Recent legislation requires the development of a new regulatory framework for the derivatives market. The impact of the new regulations is still unknown, but has the potential to increase the costs of using derivatives, may limit the availability of some forms of derivatives or the Fund’s ability to use derivatives, and may adversely affect the performance of some derivative instruments used by the Fund as well as the Fund’s ability to pursue its investment objective through the use of such instruments.
Equity Security Risk—Equity securities may decline significantly in price over short or extended periods of time, and such declines may occur in the equity market as a whole, or they may occur in only a particular country, company, industry, or sector of the market.
Investment Focus Risk—Different types of stocks tend to shift in and out of favor depending on market and economic conditions. The Fund emphasizes a value style of investing and therefore seeks undervalued companies with characteristics for improved valuations; such companies are subject to the risk that the valuations never improve.
Section 1 Fund Summaries
47
Mid-Cap Stock Risk—Stocks of mid-cap companies may be subject to more abrupt or erratic market movements than those of larger, more established companies or the market averages in general.
Non-U.S./Emerging Markets Risk—Non-U.S. issuers or U.S. issuers with significant non-U.S. operations may be subject to risks in addition to those of issuers located in or that principally operate in the United States as a result of, among other things, political, social and economic developments abroad and different legal, regulatory and tax environments. These additional risks may be heightened for securities of issuers located in, or with significant operations in, emerging market countries. Also, changes in currency exchange rates may affect the Fund’s net asset value, the value of dividends and interest earned, and gains and losses realized on the sale of securities.
Fund Performance
The following bar chart and table provide some indication of the potential risks of investing in the Fund. The Fund’s past performance (before and after taxes) is not necessarily an indication of how the Fund will perform in the future. Updated performance information is available at www.nuveen.com/performance or by calling (800) 257-8787.
The bar chart below shows the variability of the Fund’s performance from year to year for Class A shares. The performance of the other share classes will differ due to their different expense structures. The bar chart and highest/lowest quarterly returns that follow do not reflect sales charges, and if these charges were reflected, the returns would be less than those shown.
Class A Annual Total Return
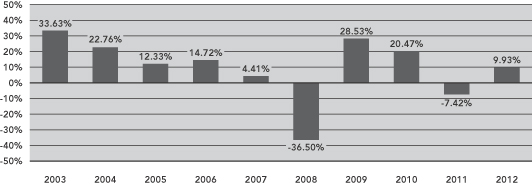
During the ten-year period ended December 31, 2012, the Fund’s highest and lowest quarterly returns were 18.57% and -21.15%, respectively, for the quarters ended September 30, 2009 and September 30, 2011.
The table below shows the variability of the Fund’s average annual returns and how they compare over the time periods indicated with those of a broad measure of market performance and an index of funds with similar investment objectives. All after-tax returns are calculated using the historical highest individual federal marginal income tax rates and do not reflect the impact of state and local taxes. After-tax returns are shown for Class A shares only; after-tax returns for other share classes will vary. Your own actual after-tax returns will depend on your specific tax situation and may differ from what is shown here. After-tax returns are not relevant to investors who hold Fund shares in tax-deferred accounts such as IRAs or employer-sponsored retirement plans.
Both the bar chart and the table assume that all distributions have been reinvested. Performance reflects fee waivers, if any, in effect during the periods presented. If any such waivers were not in place, returns would be reduced.
48
Section 1 Fund Summaries
Prior to July 1, 2004, Class R3 shares were designated Class S shares, which had lower fees and expenses. The performance information in the table prior to July 1, 2004 is based on the performance of the Class S shares. If current fees and expenses had been in effect, performance would have been lower.
| | | | | | | | | | | | |
| | | Average Annual Total Returns
for the Periods Ended December 31, 2012 | |
| | | 1 Year | | | 5 Years | | | 10 Years | |
| Class A (return before taxes) | | | 3.63 | % | | | (1.16 | )% | | | 7.61 | % |
| Class A (return after taxes on distributions) | | | 3.42 | % | | | (1.31 | )% | | | 7.11 | % |
| Class A (return after taxes on distributions and sale of Fund shares) | | | 2.54 | % | | | (1.00 | )% | | | 6.61 | % |
| Class B (return before taxes) | | | 4.17 | % | | | (0.92 | )% | | | 7.45 | % |
| Class C (return before taxes) | | | 9.16 | % | | | (0.73 | )% | | | 7.44 | % |
| Class R3 (return before taxes) | | | 9.66 | % | | | (0.24 | )% | | | 8.02 | % |
| Class I (return before taxes) | | | 10.24 | % | | | 0.26 | % | | | 8.52 | % |
| Russell Midcap® Value Index (reflects no deduction for fees, expenses or taxes) | | | 18.51 | % | | | 3.79 | % | | | 10.63 | % |
Lipper Mid-Cap Value Classification Average
(reflects no deduction for taxes or certain expenses) | | | 17.08 | % | | | 2.88 | % | | | 9.15 | % |
Management
Investment Adviser
Nuveen Fund Advisors, LLC
Sub-Adviser
Nuveen Asset Management, LLC
Portfolio Managers
| | | | |
Name | | Title | | Portfolio Manager of Fund Since |
| David A. Chalupnik, CFA | | Managing Director | | April 2012 |
| Karen L. Bowie, CFA | | Senior Vice President | | April 2012 |
Purchase and Sale of Fund Shares
You may purchase, redeem or exchange shares of the Fund on any business day, which is any day the New York Stock Exchange is open for business. You may purchase, redeem or exchange shares of the Fund either through a financial advisor or other financial intermediary or directly from the Fund. Class B shares are available only through exchanges and dividend reinvestments by current Class B shareholders. The Fund’s initial and subsequent investment minimums generally are as follows, although the Fund may reduce or waive the minimums in some cases:
| | | | | | |
| | | Class A and Class C | | Class R3 | | Class I |
Eligibility and
Minimum Initial
Investment | | $3,000 for all accounts except: •$2,500 for Traditional/Roth IRA accounts. •$2,000 for Coverdell Education Savings Accounts. •$250 for accounts opened through fee-based programs. •No minimum for retirement plans. | | Available only through certain retirement plans. No minimum. | | Available only through fee-based programs and certain retirement plans, and to other limited categories of investors as described in the prospectus. $100,000 for all accounts except: •$250 for clients of financial intermediaries and family offices that have accounts holding Class I shares with an aggregate value of at least $100,000 (or that are expected to reach this level). •No minimum for eligible retirement plans and certain other categories of eligible investors as described in the prospectus. |
| Minimum Additional Investment | | $100 | | No minimum. | | No minimum. |
Section 1 Fund Summaries
49
Tax Information
The Fund’s distributions are taxable and will generally be taxed as ordinary income or capital gains, unless you are investing through a tax-deferred account, such as an IRA or 401(k) plan.
Payments to Broker-Dealers and Other Financial Intermediaries
If you purchase shares of the Fund through a broker-dealer or other financial intermediary (such as a bank or financial advisor), the Fund, its distributor or its investment adviser may pay the intermediary for the sale of Fund shares and related services. These payments may create a conflict of interest by influencing the broker-dealer or other financial intermediary and your salesperson to recommend the Fund over another investment. Ask your financial advisor or visit your financial intermediary’s website for more information.
50
Section 1 Fund Summaries
Nuveen Quantitative Enhanced Core Equity Fund
Investment Objective
The investment objective of the Fund is to provide, over the long term, a total return that exceeds the total return of the Standard & Poor’s 500® Index (S&P 500 Index).
Fees and Expenses of the Fund
This table describes the fees and expenses that you may pay if you buy and hold shares of the Fund. You may qualify for sales charge discounts if you and your family invest, or agree to invest in the future, at least $50,000 in the Fund or in other Nuveen Mutual Funds. More information about these and other discounts, as well as eligibility requirements for each share class, is available from your financial advisor and in “What Share Classes We Offer” on page 99 of the Fund’s prospectus and “Purchase and Redemption of Fund Shares” on page S-99 of the Fund’s statement of additional information.
Shareholder Fees
(fees paid directly from your investment)
| | | | | | | | | | | | |
| | | Class A | | | Class C | | | Class I | |
Maximum Sales Charge (Load) Imposed on Purchases
(as a percentage of offering price) | | | None | | | | None | | | | None | |
Maximum Deferred Sales Charge (Load)
(as a percentage of the lesser of purchase price or redemption proceeds)1 | | | None | | | | 1.00% | | | | None | |
| Maximum Sales Charge (Load) Imposed on Reinvested Dividends | | | None | | | | None | | | | None | |
| Exchange Fee | | | None | | | | None | | | | None | |
| Annual Low Balance Account Fee (for accounts under $1,000)2 | | | $15 | | | | $15 | | | | $15 | |
Annual Fund Operating Expenses (expenses that you pay each year as a percentage of the value of your investment) | | | | | | | | | | | | |
| | | Class A | | | Class C | | | Class I | |
| Management Fees | | | 0.50% | | | | 0.50% | | | | 0.50% | |
| Distribution and/or Service (12b-1) Fees | | | 0.25% | | | | 1.00% | | | | 0.00% | |
| Other Expenses3 | | | 0.27% | | | | 0.28% | | | | 0.28% | |
| Acquired Fund Fees and Expenses | | | 0.02% | | | | 0.02% | | | | 0.02% | |
| Total Annual Fund Operating Expenses | | | 1.04% | | | | 1.80% | | | | 0.80% | |
| Fee Waivers and/or Expense Reimbursements4 | | | (0.32)% | | | | (0.33)% | | | | (0.33)% | |
| Total Annual Fund Operating Expenses After Fee Waivers and/or Expense Reimbursements | | | 0.72% | | | | 1.47% | | | | 0.47% | |
| 1 | The contingent deferred sales charge on Class C shares applies only to redemptions within 12 months of purchase. |
| 2 | Fee applies to the following types of accounts under $1,000 held directly with the Fund: individual retirement accounts (IRAs), Coverdell Education Savings Accounts and accounts established pursuant to the Uniform Transfers to Minors Act (UTMA) or Uniform Gifts to Minors Act (UGMA). |
| 3 | Other Expenses have been restated to reflect current contractual fees. |
| 4 | The Fund’s investment adviser has contractually agreed to waive fees and/or reimburse other Fund expenses through February 28, 2014 so that total annual fund operating expenses, after fee waivers and/or expense reimbursements and excluding Acquired Fund Fees and Expenses, do not exceed 0.70%, 1.45% and 0.45% for Class A, Class C and Class I shares, respectively. Fee waivers and/or expense reimbursements will not be terminated prior to that time without the approval of the Fund’s board of directors. |
Section 1 Fund Summaries
51
Example
The following example is intended to help you compare the cost of investing in the Fund with the cost of investing in other mutual funds. The example assumes that you invest $10,000 in the Fund for the time periods indicated and then either redeem or do not redeem your shares at the end of a period. The example also assumes that your investment has a 5% return each year, that the Fund’s operating expenses remain the same, and the contractual fee waivers currently in place are not renewed beyond February 28, 2014. Although your actual costs may be higher or lower, based on these assumptions your costs would be:
| | | | | | | | | | | | | | | | | | | | | | | | | | | | |
| | | Redemption | | No Redemption |
| | | A | | | C | | | I | | | | | A | | | C | | | I | | | |
| 1 Year | | $ | 74 | | | $ | 150 | | | $ | 48 | | | | | $ | 74 | | | $ | 150 | | | $ | 48 | | | |
| 3 Years | | $ | 299 | | | $ | 534 | | | $ | 222 | | | | | $ | 299 | | | $ | 534 | | | $ | 222 | | | |
| 5 Years | | $ | 543 | | | $ | 944 | | | $ | 412 | | | | | $ | 543 | | | $ | 944 | | | $ | 412 | | | |
| 10 Years | | $ | 1,242 | | | $ | 2,089 | | | $ | 959 | | | | | $ | 1,242 | | | $ | 2,089 | | | $ | 959 | | | |
Portfolio Turnover
The Fund pays transaction costs, such as commissions, when it buys and sells securities (or “turns over” its portfolio). A higher portfolio turnover rate may indicate higher transaction costs and may result in higher taxes when Fund shares are held in a taxable account. These costs, which are not reflected in annual fund operating expenses or in the example, affect the Fund’s performance. During the most recent fiscal year, the Fund’s portfolio turnover rate was 137% of the average value of its portfolio.
Principal Investment Strategies
Under normal market conditions, the Fund invests at least 80% of its net assets, plus the amount of any borrowings for investment purposes, in equity securities. The Fund will seek to achieve its investment objective by primarily investing in companies that have market capitalizations at the time of purchase within the range of market capitalizations of companies in the S&P 500 Index. The S&P 500 Index is an unmanaged index of 500 stocks chosen for market size, liquidity and industry group representation, with a focus on the large cap segment of the market. The market capitalizations of companies in the S&P 500 Index ranged from approximately $1.8 billion to $427.7 billion as of January 31, 2013, with an average market capitalization of approximately $28.2 billion. Although the Fund may from time to time emphasize smaller or larger capitalization companies within this range as a result of the quantitative process discussed below, the sub-adviser anticipates that generally the Fund’s capitalization weightings will be similar to those of the S&P 500 Index. The Fund’s investments may include common stocks of non-U.S. issuers which are listed on a U.S. stock exchange.
The Fund is actively managed using a proprietary quantitative process which projects a stock’s performance based upon a variety of factors, such as the stock’s growth or value style, market capitalization, earnings volatility, earnings yield, financial leverage and currency sensitivity. This process tracks the historical performance of each of these factors against relevant economic and market variables, and then determines how each of the factors is expected to perform given today’s economic conditions. The process then measures the relative sensitivity of each of the stocks in the Fund’s investable universe to the various factors and projects each stock’s performance based on this sensitivity. Stocks are selected for purchase or sale using an optimization formula which is designed to maximize the Fund’s overall projected return within the constraints that have been established to limit the Fund’s tracking error as compared to the S&P 500 Index.
The Fund may buy and sell stock index futures contracts. The Fund may use futures contracts to manage market or business risk or enhance the Fund’s return. The Fund may also invest in exchange-traded funds in order to reduce cash balances in the Fund and increase the level of Fund assets exposed to common stocks.
52
Section 1 Fund Summaries
Principal Risks
The value of your investment in this Fund will change daily, which means you could lose money. An investment in the Fund is not a deposit of a bank and is not insured or guaranteed by the Federal Deposit Insurance Corporation or any other government agency. The principal risks of investing in the Fund include:
Equity Security Risk—Equity securities may decline significantly in price over short or extended periods of time, and such declines may occur in the equity market as a whole, or they may occur in only a particular country, company, industry, or sector of the market.
Futures Contract Risk—The use of futures contracts involves additional risks and transaction costs which could leave the Fund in a worse position than if it had not used these instruments. Futures contracts may entail investment exposures that are greater than their cost would suggest. As a result, a small investment in futures contracts could have a large impact on performance.
Investment Strategy Risk—The Fund is managed using a proprietary quantitative process. There can be no assurance that this quantitative process will perform as anticipated or enable the Fund to achieve its objective.
Non-U.S./Emerging Markets Risk—Non-U.S. issuers or U.S. issuers with significant non-U.S. operations may be subject to risks in addition to those of issuers located in or that principally operate in the United States as a result of, among other things, political, social and economic developments abroad and different legal, regulatory and tax environments. These additional risks may be heightened for securities of issuers located in, or with significant operations in, emerging market countries. Also, changes in currency exchange rates may affect the Fund’s net asset value, the value of dividends and interest earned, and gains and losses realized on the sale of securities.
Other Investment Companies Risk—When the Fund invests in other investment companies, you bear both your proportionate share of Fund expenses and, indirectly, the expenses of the other investment companies.
Fund Performance
The following bar chart and table provide some indication of the potential risks of investing in the Fund. The Fund’s past performance (before and after taxes) is not necessarily an indication of how the Fund will perform in the future. Updated performance information is available at www.nuveen.com/performance or by calling (800) 257-8787.
The bar chart below shows the variability of the Fund’s performance from year to year for Class A shares. The performance of the other share classes will differ due to their different expense structures.
Class A Annual Total Return
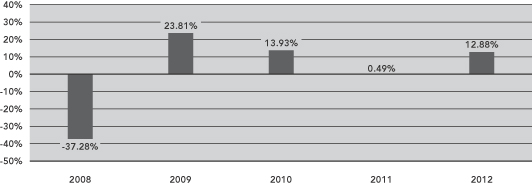
During the five-year period ended December 31, 2012, the Fund’s highest and lowest quarterly returns were 14.99% and -20.58%, respectively, for the quarters ended June 30, 2009 and December 31, 2008.
Section 1 Fund Summaries
53
The table below shows the variability of the Fund’s average annual returns and how they compare over the time periods indicated with those of a broad measure of market performance and an index of funds with similar investment objectives. All after-tax returns are calculated using the historical highest individual federal marginal income tax rates and do not reflect the impact of state and local taxes. After-tax returns are shown for Class A shares only; after-tax returns for other share classes will vary. Your own actual after-tax returns will depend on your specific tax situation and may differ from what is shown here. After-tax returns are not relevant to investors who hold Fund shares in tax-deferred accounts such as IRAs or employer-sponsored retirement plans.
Both the bar chart and the table assume that all distributions have been reinvested. Performance reflects fee waivers, if any, in effect during the periods presented. If any such waivers were not in place, returns would be reduced.
| | | | | | | | | | | | | | | | |
| | | | | | Average Annual Total Returns
for the Periods Ended
December 31, 2012 | |
| | | Inception
Date | | | 1 Year | | | 5 Years | | | Since
Inception | |
| Class A (return before taxes) | | | 7/31/07 | | | | 12.88 | % | | | 0.07 | % | | | 0.73 | % |
| Class A (return after taxes on distributions) | | | | | | | 9.75 | % | | | (0.73 | )% | | | (0.08 | )% |
| Class A (return after taxes on distributions and sale of Fund shares) | | | | | | | 8.72 | % | | | (0.27 | )% | | | 0.29 | % |
| Class C (return before taxes) | | | 7/31/07 | | | | 12.01 | % | | | (0.67 | )% | | | (0.01 | )% |
| Class I (return before taxes) | | | 7/31/07 | | | | 13.15 | % | | | 0.32 | % | | | 0.98 | % |
| S&P 500® Index (reflects no deduction for fees, expenses or taxes) | | | | | | | 16.00 | % | | | 1.66 | % | | | 1.86 | % |
Lipper Large-Cap Core Classification Average
(reflects no deduction for taxes or certain expenses) | | | | | | | 14.95 | % | | | 0.68 | % | | | 1.06 | % |
Management
Investment Adviser
Nuveen Fund Advisors, LLC
Sub-Adviser
Nuveen Asset Management, LLC
Portfolio Managers
| | | | |
Name | | Title | | Portfolio Manager of Fund Since |
| Walter A. French | | Senior Vice President | | July 2007 |
| David R. Cline | | Vice President | | July 2007 |
| David A. Friar | | Assistant Vice President | | July 2007 |
| Keith B. Hembre | | Managing Director | | July 2007 |
54
Section 1 Fund Summaries
Purchase and Sale of Fund Shares
You may purchase, redeem or exchange shares of the Fund on any business day, which is any day the New York Stock Exchange is open for business. You may purchase, redeem or exchange shares of the Fund either through a financial advisor or other financial intermediary or directly from the Fund. The Fund’s initial and subsequent investment minimums generally are as follows, although the Fund may reduce or waive the minimums in some cases:
| | | | | | |
| | | Class A | | Class C | | Class I |
| Eligibility and Minimum Initial Investment | | Available only through fee-based programs and certain retirement plans. •$250 minimum for accounts opened through fee-based programs. •No minimum for retirement plans. | | $3,000 for all accounts except: •$2,500 for Traditional/Roth IRA accounts. •$2,000 for Coverdell Education Savings Accounts. •$250 for accounts opened through fee-based programs. •No minimum for retirement plans. | | Available only through fee-based programs and certain retirement plans, and to other limited categories of investors as described in the prospectus. $100,000 for all accounts except: •$250 for clients of financial intermediaries and family offices that have accounts holding Class I shares with an aggregate value of at least $100,000 (or that are expected to reach this level). •No minimum for eligible retirement plans and certain other categories of eligible investors as described in the prospectus. |
| Minimum Additional Investment | | $100 | | $100 | | No minimum. |
Tax Information
The Fund’s distributions are taxable and will generally be taxed as ordinary income or capital gains, unless you are investing through a tax-deferred account, such as an IRA or 401(k) plan.
Payments to Broker-Dealers and Other Financial Intermediaries
If you purchase shares of the Fund through a broker-dealer or other financial intermediary (such as a bank or financial advisor), the Fund, its distributor or its investment adviser may pay the intermediary for the sale of Fund shares and related services. These payments may create a conflict of interest by influencing the broker-dealer or other financial intermediary and your salesperson to recommend the Fund over another investment. Ask your financial advisor or visit your financial intermediary’s website for more information.
Proposed Reorganization of Nuveen Quantitative Enhanced Core Equity Fund into Nuveen Symphony Low Volatility Equity Fund (formerly Nuveen Symphony Optimized Alpha Fund)
The Board of Directors/Trustees of Nuveen Investment Funds, Inc. (“NIF”) and Nuveen Investment Trust II (“NIT II”) has approved the reorganization of Nuveen Quantitative Enhanced Core Equity Fund (the “Acquired Fund”), a series of NIF, into Nuveen Symphony Low Volatility Equity Fund (the “Acquiring Fund”), a series of NIT II. In order for the reorganization to occur, it must be approved by the shareholders of the Acquired Fund.
If the Acquired Fund’s shareholders approve the reorganization, the Acquired Fund will transfer all of its assets and liabilities to the Acquiring Fund in exchange for Acquiring Fund shares of equal value. These Acquiring Fund shares will then be distributed to Acquired Fund shareholders and the Acquired Fund will be terminated. As a result of these transactions, Acquired Fund shareholders will become shareholders of the Acquiring Fund and will cease to be shareholders of the Acquired Fund. Each Acquired Fund shareholder will receive Acquiring Fund shares with a total value equal to the total value of that shareholder’s Acquired Fund shares immediately prior to the closing of the reorganization.
A special meeting of the Acquired Fund’s shareholders for the purpose of voting on the reorganization is expected to be held in late August 2013. If the required approval is obtained, it is anticipated that the reorganization will be consummated shortly after the special shareholder meeting. Further information regarding the proposed reorganization will be contained in proxy materials that are expected to be sent to shareholders of the Acquired Fund in late July 2013.
The Acquired Fund will continue sales and redemptions of its shares as described in the prospectus until shortly before its reorganization. However, holders of shares purchased after the record date set for the Acquired Fund’s special meeting of shareholders will not be entitled to vote those shares at the special meeting.
Section 1 Fund Summaries
55
Nuveen Small Cap Growth Opportunities Fund
Investment Objective
The investment objective of the Fund is growth of capital.
Fees and Expenses of the Fund
This table describes the fees and expenses that you may pay if you buy and hold shares of the Fund. You may qualify for sales charge discounts if you and your family invest, or agree to invest in the future, at least $50,000 in the Fund or in other Nuveen Mutual Funds. More information about these and other discounts, as well as eligibility requirements for each share class, is available from your financial advisor and in “What Share Classes We Offer” on page 99 of the Fund’s prospectus, “How to Reduce Your Sales Charge” on page 102 of the prospectus and “Purchase and Redemption of Fund Shares” on page S-99 of the Fund’s statement of additional information.
Shareholder Fees
(fees paid directly from your investment)
| | | | | | | | | | | | | | | | | | | | |
| | | Class A | | | Class B | | | Class C | | | Class R3 | | | Class I | |
Maximum Sales Charge (Load) Imposed on Purchases
(as a percentage of offering price) | | | 5.75% | | | | None | | | | None | | | | None | | | | None | |
Maximum Deferred Sales Charge (Load)
(as a percentage of the lesser of purchase price or redemption proceeds)1 | | | None | | | | 5.00% | | | | 1.00% | | | | None | | | | None | |
| Maximum Sales Charge (Load) Imposed on Reinvested Dividends | | | None | | | | None | | | | None | | | | None | | | | None | |
| Exchange Fee | | | None | | | | None | | | | None | | | | None | | | | None | |
| Annual Low Balance Account Fee (for accounts under $1,000)2 | | | $15 | | | | $15 | | | | $15 | | | | None | | | | $15 | |
Annual Fund Operating Expenses
(expenses that you pay each year as a percentage of the value of your investment)
| | | | | | | | | | | | | | | | | | | | |
| | | Class A | | | Class B | | | Class C | | | Class R3 | | | Class I | |
| Management Fees | | | 1.00% | | | | 1.00% | | | | 1.00% | | | | 1.00% | | | | 1.00% | |
| Distribution and/or Service (12b-1) Fees | | | 0.25% | | | | 1.00% | | | | 1.00% | | | | 0.50% | | | | 0.00% | |
| Other Expenses3 | | | 0.45% | | | | 0.45% | | | | 0.44% | | | | 0.44% | | | | 0.45% | |
| Total Annual Fund Operating Expenses | | | 1.70% | | | | 2.45% | | | | 2.44% | | | | 1.94% | | | | 1.45% | |
| Fee Waivers and/or Expense Reimbursements4 | | | (0.23)% | | | | (0.23)% | | | | (0.22)% | | | | (0.22)% | | | | (0.23)% | |
| Total Annual Fund Operating Expenses After Fee Waivers and/or Expense Reimbursements | | | 1.47% | | | | 2.22% | | | | 2.22% | | | | 1.72% | | | | 1.22% | |
| 1 | The contingent deferred sales charge (“CDSC”) on Class B shares declines over a six-year period from purchase. The CDSC on Class C shares applies only to redemptions within 12 months of purchase. |
| 2 | Fee applies to the following types of accounts under $1,000 held directly with the Fund: individual retirement accounts (IRAs), Coverdell Education Savings Accounts and accounts established pursuant to the Uniform Transfers to Minors Act (UTMA) or Uniform Gifts to Minors Act (UGMA). |
| 3 | Other Expenses have been restated to reflect current contractual fees. |
| 4 | The Fund’s investment adviser has contractually agreed to waive fees and/or reimburse other Fund expenses through February 28, 2014 so that total annual fund operating expenses, after fee waivers and/or expense reimbursements and excluding Acquired Fund Fees and Expenses, do not exceed 1.47%, 2.22%, 2.22%, 1.72% and 1.22% for Class A, Class B, Class C, Class R3 and Class I shares, respectively. Fee waivers and/or expense reimbursements will not be terminated prior to that time without the approval of the Fund’s board of directors. |
56
Section 1 Fund Summaries
Example
The following example is intended to help you compare the cost of investing in the Fund with the cost of investing in other mutual funds. The example assumes that you invest $10,000 in the Fund for the time periods indicated and then either redeem or do not redeem your shares at the end of a period. The example also assumes that your investment has a 5% return each year, that the Fund’s operating expenses remain the same, and the contractual fee waivers currently in place are not renewed beyond February 28, 2014. Although your actual costs may be higher or lower, based on these assumptions your costs would be:
| | | | | | | | | | | | | | | | | | | | | | | | | | | | | | | | | | | | | | | | | | | | |
| | | Redemption | | No Redemption |
| | | A | | | B | | | C | | | R3 | | | I | | | | | A | | | B | | | C | | | R3 | | | I | | | |
| 1 Year | | $ | 716 | | | $ | 725 | | | $ | 225 | | | $ | 175 | | | $ | 124 | | | | | $ | 716 | | | $ | 225 | | | $ | 225 | | | $ | 175 | | | $ | 124 | | | |
| 3 Years | | $ | 1,059 | | | $ | 1,042 | | | $ | 740 | | | $ | 588 | | | $ | 436 | | | | | $ | 1,059 | | | $ | 742 | | | $ | 740 | | | $ | 588 | | | $ | 436 | | | |
| 5 Years | | $ | 1,425 | | | $ | 1,385 | | | $ | 1,281 | | | $ | 1,027 | | | $ | 770 | | | | | $ | 1,425 | | | $ | 1,285 | | | $ | 1,281 | | | $ | 1,027 | | | $ | 770 | | | |
| 10 Years | | $ | 2,450 | | | $ | 2,583 | | | $ | 2,760 | | | $ | 2,247 | | | $ | 1,716 | | | | | $ | 2,450 | | | $ | 2,583 | | | $ | 2,760 | | | $ | 2,247 | | | $ | 1,716 | | | |
Portfolio Turnover
The Fund pays transaction costs, such as commissions, when it buys and sells securities (or “turns over” its portfolio). A higher portfolio turnover rate may indicate higher transaction costs and may result in higher taxes when Fund shares are held in a taxable account. These costs, which are not reflected in annual fund operating expenses or in the example, affect the Fund’s performance. During the most recent fiscal year, the Fund’s portfolio turnover rate was 118% of the average value of its portfolio.
Principal Investment Strategies
Under normal market conditions, the Fund invests at least 80% of net assets, plus the amount of any borrowings for investment purposes, in common stocks of small-capitalization companies, defined as companies that have market capitalizations of less than $3 billion at the time of purchase.
In selecting stocks, the Fund’s sub-adviser invests in companies that it believes exhibit the potential for superior growth based on factors such as above-average growth in revenue and earnings, strong competitive position, strong management, and sound financial condition. The Fund’s sub-adviser will generally sell a stock if the stock hits its price target, the company’s fundamentals or competitive position significantly deteriorate, or if a better alternative exists in the marketplace.
The Fund may invest up to 15% of its total assets in non-dollar denominated equity securities of non-U.S. issuers. In addition, the Fund may invest up to 25% of its assets, collectively, in non-dollar denominated equity securities of non-U.S. issuers and in dollar-denominated equity securities of non-U.S. issuers that are either listed on a U.S. stock exchange or represented by depositary receipts that may or may not be sponsored by a domestic bank. Up to 15% of the Fund’s total assets may be invested in equity securities of emerging market issuers. A country is considered to be an “emerging market” if it is defined as such by Morgan Stanley Capital International Inc.
The Fund may utilize options, futures contracts, options on futures contracts, and forward foreign currency exchange contracts (“derivatives”). The Fund may use these derivatives to manage market or business risk, enhance the Fund’s return, or hedge against adverse movements in currency exchange rates.
Principal Risks
The value of your investment in this Fund will change daily, which means you could lose money. An investment in the Fund is not a deposit of a bank and is not insured or guaranteed by the Federal Deposit Insurance Corporation or any other government agency. The principal risks of investing in the Fund include:
Derivatives Risk—The use of derivatives involves additional risks, such as liquidity, interest rate, counterparty, market, credit and management risks, and transaction costs which could leave the Fund in a worse position than if it had not
Section 1 Fund Summaries
57
used these instruments. Derivatives may entail investment exposures that are greater than their cost would suggest. As a result, a small investment in derivatives could have a large impact on performance. Recent legislation requires the development of a new regulatory framework for the derivatives market. The impact of the new regulations is still unknown, but has the potential to increase the costs of using derivatives, may limit the availability of some forms of derivatives or the Fund’s ability to use derivatives, and may adversely affect the performance of some derivative instruments used by the Fund as well as the Fund’s ability to pursue its investment objective through the use of such instruments.
Equity Security Risk—Equity securities may decline significantly in price over short or extended periods of time, and such declines may occur in the equity market as a whole, or they may occur in only a particular country, company, industry, or sector of the market.
Investment Focus Risk—Different types of stocks tend to shift in and out of favor depending on market and economic conditions. The Fund emphasizes a growth style of investing and therefore seeks companies experiencing high rates of current growth; such companies may be more volatile than other types of investments.
Non-U.S./Emerging Markets Risk—Non-U.S. issuers or U.S. issuers with significant non-U.S. operations may be subject to risks in addition to those of issuers located in or that principally operate in the United States as a result of, among other things, political, social and economic developments abroad and different legal, regulatory and tax environments. These additional risks may be heightened for securities of issuers located in, or with significant operations in, emerging market countries. Also, changes in currency exchange rates may affect the Fund’s net asset value, the value of dividends and interest earned, and gains and losses realized on the sale of securities.
Small-Cap Stock Risk—Small-cap stocks may involve greater risks than large-cap stocks. Prices of small-cap stocks may be subject to more abrupt or erratic movements, and to wider fluctuations, than stock prices of larger, more established companies or the market averages in general. It may be difficult to sell small-cap stocks at the desired time and price.
Fund Performance
The following bar chart and table provide some indication of the potential risks of investing in the Fund. The Fund’s past performance (before and after taxes) is not necessarily an indication of how the Fund will perform in the future. Updated performance information is available at www.nuveen.com/performance or by calling (800) 257-8787.
The bar chart below shows the variability of the Fund’s performance from year to year for Class A shares. The performance of the other share classes will differ due to their different expense structures. The bar chart and highest/lowest quarterly returns that follow do not reflect sales charges, and if these charges were reflected, the returns would be less than those shown.
Class A Annual Total Return
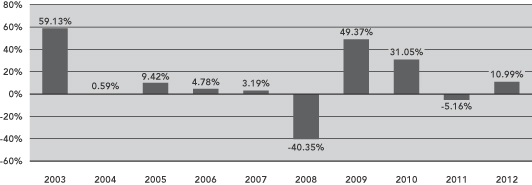
During the ten-year period ended December 31, 2012, the Fund’s highest and lowest quarterly returns were 34.11% and -28.23%, respectively, for the quarters ended June 30, 2003 and December 31, 2008.
58
Section 1 Fund Summaries
The table below shows the variability of the Fund’s average annual returns and how they compare over the time periods indicated with those of a broad measure of market performance and an index of funds with similar investment objectives. All after-tax returns are calculated using the historical highest individual federal marginal income tax rates and do not reflect the impact of state and local taxes. After-tax returns are shown for Class A shares only; after-tax returns for other share classes will vary. Your own actual after-tax returns will depend on your specific tax situation and may differ from what is shown here. After-tax returns are not relevant to investors who hold Fund shares in tax-deferred accounts such as IRAs or employer-sponsored retirement plans.
Both the bar chart and the table assume that all distributions have been reinvested. Performance reflects fee waivers, if any, in effect during the periods presented. If any such waivers were not in place, returns would be reduced.
Prior to July 1, 2004, Class R3 shares were designated Class S shares, which had lower fees and expenses. The performance information in the table prior to July 1, 2004 is based on the performance of the Class S shares. If current fees and expenses had been in effect, performance would have been lower.
| | | | | | | | | | | | |
| | | Average Annual Total Returns
for the Periods Ended December 31, 2012 | |
| | | 1 Year | | | 5 Years | | | 10 Years | |
| Class A (return before taxes) | | | 4.62 | % | | | 2.99 | % | | | 8.17 | % |
| Class A (return after taxes on distributions) | | | 2.88 | % | | | 2.60 | % | | | 6.56 | % |
| Class A (return after taxes on distributions and sale of Fund shares) | | | 4.21 | % | | | 2.45 | % | | | 6.35 | % |
| Class B (return before taxes) | | | 5.21 | % | | | 3.26 | % | | | 8.00 | % |
| Class C (return before taxes) | | | 10.19 | % | | | 3.45 | % | | | 8.01 | % |
| Class R3 (return before taxes) | | | 10.74 | % | | | 3.96 | % | | | 8.60 | % |
| Class I (return before taxes) | | | 11.26 | % | | | 4.47 | % | | | 9.08 | % |
Russell 2000® Growth Index
(reflects no deduction for fees, expenses or taxes) | | | 14.59 | % | | | 3.49 | % | | | 9.80 | % |
Lipper Small-Cap Growth Classification Average
(reflects no deduction for taxes or certain expenses) | | | 13.09 | % | | | 2.49 | % | | | 8.97 | % |
Management
Investment Adviser
Nuveen Fund Advisors, LLC
Sub-Adviser
Nuveen Asset Management, LLC
Portfolio Managers
| | | | |
Name | | Title | | Portfolio Manager of Fund Since |
| Robert S. McDougall, CFA | | Senior Vice President | | May 2004 |
| Jon A. Loth, CFA | | Vice President | | October 2007 |
Section 1 Fund Summaries
59
Purchase and Sale of Fund Shares
You may purchase, redeem or exchange shares of the Fund on any business day, which is any day the New York Stock Exchange is open for business. You may purchase, redeem or exchange shares of the Fund either through a financial advisor or other financial intermediary or directly from the Fund. Class B shares are available only through exchanges and dividend reinvestments by current Class B shareholders. The Fund’s initial and subsequent investment minimums generally are as follows, although the Fund may reduce or waive the minimums in some cases:
| | | | | | |
| | | Class A and Class C | | Class R3 | | Class I |
| Eligibility and Minimum Initial Investment | | $3,000 for all accounts except: •$2,500 for Traditional/Roth IRA accounts. •$2,000 for Coverdell Education Savings Accounts. •$250 for accounts opened through fee-based programs. •No minimum for retirement plans. | | Available only through certain retirement plans. No minimum. | | Available only through fee-based programs and certain retirement plans, and to other limited categories of investors as described in the prospectus. $100,000 for all accounts except: •$250 for clients of financial intermediaries and family offices that have accounts holding Class I shares with an aggregate value of at least $100,000 (or that are expected to reach this level). •No minimum for eligible retirement plans and certain other categories of eligible investors as described in the prospectus. |
| Minimum Additional Investment | | $100 | | No minimum. | | No minimum. |
Tax Information
The Fund’s distributions are taxable and will generally be taxed as ordinary income or capital gains, unless you are investing through a tax-deferred account, such as an IRA or 401(k) plan.
Payments to Broker-Dealers and Other Financial Intermediaries
If you purchase shares of the Fund through a broker-dealer or other financial intermediary (such as a bank or financial advisor), the Fund, its distributor or its investment adviser may pay the intermediary for the sale of Fund shares and related services. These payments may create a conflict of interest by influencing the broker-dealer or other financial intermediary and your salesperson to recommend the Fund over another investment. Ask your financial advisor or visit your financial intermediary’s website for more information.
60
Section 1 Fund Summaries
Nuveen Small Cap Index Fund
Investment Objective
The investment objective of the Fund is to provide investment results that correspond to the performance of the Russell 2000® Index (Russell 2000 Index).
Fees and Expenses of the Fund
This table describes the fees and expenses that you may pay if you buy and hold shares of the Fund. You may qualify for sales charge discounts if you and your family invest, or agree to invest in the future, at least $50,000 in the Fund or in other Nuveen Mutual Funds. More information about these and other discounts, as well as eligibility requirements for each share class, is available from your financial advisor and in “What Share Classes We Offer” on page 99 of the Fund’s prospectus and “Purchase and Redemption of Fund Shares” on page S-99 of the Fund’s statement of additional information.
Shareholder Fees
(fees paid directly from your investment)
| | | | | | | | | | | | | | | | |
| | | Class A | | | Class C | | | Class R3 | | | Class I | |
| Maximum Sales Charge (Load) Imposed on Purchases (as a percentage of offering price) | | | None | | | | None | | | | None | | | | None | |
Maximum Deferred Sales Charge (Load)
(as a percentage of the lesser of purchase price or redemption proceeds)1 | | | None | | | | 1.00% | | | | None | | | | None | |
| Maximum Sales Charge (Load) Imposed on Reinvested Dividends | | | None | | | | None | | | | None | | | | None | |
| Exchange Fee | | | None | | | | None | | | | None | | | | None | |
| Annual Low Balance Account Fee (for accounts under $1,000)2 | | | $15 | | | | $15 | | | | None | | | | $15 | |
| | | | |
Annual Fund Operating Expenses (expenses that you pay each year as a percentage of the value of your investment) | | | | | | | | | | | | | | | | |
| | | Class A | | | Class C | | | Class R3 | | | Class I | |
| Management Fees | | | 0.35% | | | | 0.35% | | | | 0.35% | | | | 0.35% | |
| Distribution and/or Service (12b-1) Fees | | | 0.25% | | | | 1.00% | | | | 0.50% | | | | 0.00% | |
| Other Expenses3 | | | 0.66% | | | | 0.64% | | | | 0.66% | | | | 0.64% | |
| Acquired Fund Fees and Expenses | | | 0.06% | | | | 0.06% | | | | 0.06% | | | | 0.06% | |
| Total Annual Fund Operating Expenses | | | 1.32% | | | | 2.05% | | | | 1.57% | | | | 1.05% | |
| Fee Waivers and/or Expense Reimbursements4 | | | (0.43)% | | | | (0.41)% | | | | (0.43)% | | | | (0.41)% | |
| Total Annual Fund Operating Expenses After Fee Waivers and/or Expense Reimbursements | | | 0.89% | | | | 1.64% | | | | 1.14% | | | | 0.64% | |
| 1 | The contingent deferred sales charge on Class C shares applies only to redemptions within 12 months of purchase. |
| 2 | Fee applies to the following types of accounts under $1,000 held directly with the Fund: individual retirement accounts (IRAs), Coverdell Education Savings Accounts and accounts established pursuant to the Uniform Transfers to Minors Act (UTMA) or Uniform Gifts to Minors Act (UGMA). |
| 3 | Other Expenses have been restated to reflect current contractual fees. |
| 4 | The Fund’s investment adviser has contractually agreed to waive fees and/or reimburse other Fund expenses through February 28, 2014 so that total annual fund operating expenses, after fee waivers and/or expense reimbursements and excluding Acquired Fund Fees and Expenses, do not exceed 0.83%, 1.58%, 1.08% and 0.58% for Class A, Class C, Class R3 and Class I shares, respectively. Fee waivers and/or expense reimbursements will not be terminated prior to that time without the approval of the Fund’s board of directors. |
Section 1 Fund Summaries
61
Example
The following example is intended to help you compare the cost of investing in the Fund with the cost of investing in other mutual funds. The example assumes that you invest $10,000 in the Fund for the time periods indicated and then either redeem or do not redeem your shares at the end of a period. The example also assumes that your investment has a 5% return each year, that the Fund’s operating expenses remain the same, and the contractual fee waivers currently in place are not renewed beyond February 28, 2014. Although your actual costs may be higher or lower, based on these assumptions your costs would be:
| | | | | | | | | | | | | | | | | | | | | | | | | | | | | | | | | | | | |
| | | Redemption | | | | | No Redemption |
| | | A | | | C | | | R3 | | | I | | | | | A | | | C | | | R3 | | | I | | | |
| 1 Year | | $ | 91 | | | $ | 167 | | | $ | 116 | | | $ | 65 | | | | | $ | 91 | | | $ | 167 | | | $ | 116 | | | $ | 65 | | | |
| 3 Years | | $ | 376 | | | $ | 603 | | | $ | 454 | | | $ | 293 | | | | | $ | 376 | | | $ | 603 | | | $ | 454 | | | $ | 293 | | | |
| 5 Years | | $ | 682 | | | $ | 1,066 | | | $ | 815 | | | $ | 540 | | | | | $ | 682 | | | $ | 1,066 | | | $ | 815 | | | $ | 540 | | | |
| 10 Years | | $ | 1,553 | | | $ | 2,347 | | | $ | 1,831 | | | $ | 1,246 | | | | | $ | 1,553 | | | $ | 2,347 | | | $ | 1,831 | | | $ | 1,246 | | | |
Portfolio Turnover
The Fund pays transaction costs, such as commissions, when it buys and sells securities (or “turns over” its portfolio). A higher portfolio turnover rate may indicate higher transaction costs and may result in higher taxes when Fund shares are held in a taxable account. These costs, which are not reflected in annual fund operating expenses or in the example, affect the Fund’s performance. During the most recent fiscal year, the Fund’s portfolio turnover rate was 20% of the average value of its portfolio.
Principal Investment Strategies
Under normal market conditions, the Fund generally invests at least 90% of its net assets, plus the amount of any borrowings for investment purposes, in common stocks included in the Russell 2000 Index. This index measures the performance of the 2,000 smallest companies in the Russell 3000 Index (which is made up of the 3,000 largest U.S. companies based on total market capitalization). Reconstitution of the index occurs annually. As of January 31, 2013, market capitalizations of companies in the Russell 2000 Index ranged from approximately $33.1 million to $5.3 billion.
The Fund’s sub-adviser believes that the Fund’s objective can best be achieved by investing in common stocks of at least 90% of the issues included in the Russell 2000 Index, depending on the size of the Fund. A computer program is used to identify which stocks should be purchased or sold in order to replicate, as closely as practicable, the composition of the Russell 2000 Index.
Because the Fund may not always hold all of the stocks included in the Russell 2000 Index, and because the Fund has expenses and the index does not, the Fund will not duplicate the index’s performance precisely. However, the Fund’s sub-adviser believes there should be a close correlation between the Fund’s performance and that of the Russell 2000 Index in both rising and falling markets. The Fund will attempt to achieve a correlation between the performance of its portfolio and that of the Russell 2000 Index of at least 95%, without taking into account expenses of the Fund. A perfect correlation would be indicated by a figure of 100%, which would be achieved if the Fund’s net asset value, including the value of its dividends and capital gains distributions, increased or decreased in exact proportion to changes in the Russell 2000 Index. If the Fund is unable to achieve a correlation of 95% over time, the Fund’s board of directors will consider alternative strategies for the Fund.
The Fund may invest in stock index futures contracts, options on stock indices, and options on stock index futures (“derivatives”) on the Russell 2000 Index. The Fund makes these investments to maintain the liquidity needed to meet redemption requests, to increase the level of Fund assets devoted to replicating the composition of the Russell 2000 Index, and to reduce transaction costs.
62
Section 1 Fund Summaries
Principal Risks
The value of your investment in this Fund will change daily, which means you could lose money. An investment in the Fund is not a deposit of a bank and is not insured or guaranteed by the Federal Deposit Insurance Corporation or any other government agency. The principal risks of investing in the Fund include:
Derivatives Risk—The use of derivatives involves additional risks, such as liquidity, interest rate, counterparty, market, credit and management risks, and transaction costs which could leave the Fund in a worse position than if it had not used these instruments. Derivatives may entail investment exposures that are greater than their cost would suggest. As a result, a small investment in derivatives could have a large impact on performance. Recent legislation requires the development of a new regulatory framework for the derivatives market. The impact of the new regulations is still unknown, but has the potential to increase the costs of using derivatives, may limit the availability of some forms of derivatives or the Fund’s ability to use derivatives, and may adversely affect the performance of some derivative instruments used by the Fund as well as the Fund’s ability to pursue its investment objective through the use of such instruments.
Equity Security Risk—Equity securities may decline significantly in price over short or extended periods of time, and such declines may occur in the equity market as a whole, or they may occur in only a particular country, company, industry, or sector of the market.
Failure to Match Index Performance—The Fund may not replicate the performance of the Russell 2000 Index.
Small-Cap Stock Risk—Small-cap stocks may involve greater risks than large-cap stocks. Prices of small-cap stocks may be subject to more abrupt or erratic movements, and to wider fluctuations, than stock prices of larger, more established companies or the market averages in general. It may be difficult to sell small-cap stocks at the desired time and price.
Fund Performance
The following bar chart and table provide some indication of the potential risks of investing in the Fund. The Fund’s past performance (before and after taxes) is not necessarily an indication of how the Fund will perform in the future. Updated performance information is available at www.nuveen.com/performance or by calling (800) 257-8787.
The bar chart below shows the variability of the Fund’s performance from year to year for Class A shares. The performance of the other share classes will differ due to their different expense structures.
Class A Annual Total Return
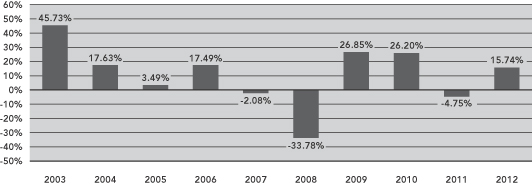
During the ten-year period ended December 31, 2012, the Fund’s highest and lowest quarterly returns were 22.96% and -25.79%, respectively, for the quarters ended June 30, 2003 and December 31, 2008.
The table below shows the variability of the Fund’s average annual returns and how they compare over the time periods indicated with those of a broad measure of market performance and an index of funds with similar investment objectives. All after-tax returns are calculated using the historical highest individual federal marginal income tax rates and do not reflect the impact of state and local taxes. After-tax returns are shown for Class A shares only; after-tax
Section 1 Fund Summaries
63
returns for other share classes will vary. Your own actual after-tax returns will depend on your specific tax situation and may differ from what is shown here. After-tax returns are not relevant to investors who hold Fund shares in tax-deferred accounts such as IRAs or employer-sponsored retirement plans.
Both the bar chart and the table assume that all distributions have been reinvested. Performance reflects fee waivers, if any, in effect during the periods presented. If any such waivers were not in place, returns would be reduced.
Prior to July 1, 2004, Class R3 shares were designated Class S shares, which had lower fees and expenses. The performance information in the table prior to July 1, 2004 is based on the performance of the Class S shares. If current fees and expenses had been in effect, performance would have been lower.
| | | | | | | | | | | | |
| | | Average Annual Total Returns for the Periods Ended December 31, 2012 | |
| | | 1 Year | | | 5 Years | | | 10 Years | |
| Class A (return before taxes) | | | 15.74 | % | | | 3.17 | % | | | 9.08 | % |
| Class A (return after taxes on distributions) | | | 14.93 | % | | | 2.41 | % | | | 7.99 | % |
| Class A (return after taxes on distributions and sale of Fund shares) | | | 11.23 | % | | | 2.47 | % | | | 7.75 | % |
| Class C (return before taxes) | | | 14.90 | % | | | 2.39 | % | | | 8.23 | % |
| Class R3 (return before taxes) | | | 15.40 | % | | | 2.88 | % | | | 8.78 | % |
| Class I (return before taxes) | | | 16.00 | % | | | 3.42 | % | | | 9.31 | % |
| Russell 2000® Index (reflects no deduction for fees, expenses or taxes) | | | 16.35 | % | | | 3.56 | % | | | 9.72 | % |
Lipper Small-Cap Core Classification Average
(reflects no deduction for taxes or certain expenses) | | | 14.74 | % | | | 3.28 | % | | | 9.42 | % |
Management
Investment Adviser
Nuveen Fund Advisors, LLC
Sub-Adviser
Nuveen Asset Management, LLC
Portfolio Managers
| | | | |
Name | | Title | | Portfolio Manager of Fund Since |
| Walter A. French | | Senior Vice President | | March 2001 |
| David A. Friar | | Assistant Vice President | | March 2001 |
64
Section 1 Fund Summaries
Purchase and Sale of Fund Shares
You may purchase, redeem or exchange shares of the Fund on any business day, which is any day the New York Stock Exchange is open for business. You may purchase, redeem or exchange shares of the Fund either through a financial advisor or other financial intermediary or directly from the Fund. The Fund’s initial and subsequent investment minimums generally are as follows, although the Fund may reduce or waive the minimums in some cases:
| | | | | | | | |
| | | Class A | | Class C | | Class R3 | | Class I |
| Eligibility and Minimum Initial Investment | | Available only through fee-based programs and certain retirement plans. •$250 minimum for accounts opened through fee-based programs. •No minimum for retirement plans. | | $3,000 for all accounts except: •$2,500 for Traditional/Roth IRA accounts. •$2,000 for Coverdell Education Savings Accounts. •$250 for accounts opened through fee-based programs. •No minimum for retirement plans. | | Available only through certain retirement plans. No minimum. | | Available only through fee-based programs and certain retirement plans, and to other limited categories of investors as described in the prospectus. $100,000 for all accounts except: •$250 for clients of financial intermediaries and family offices that have accounts holding Class I shares with an aggregate value of at least $100,000 (or that are expected to reach this level). •No minimum for eligible retirement plans and certain other categories of eligible investors as described in the prospectus. |
| Minimum Additional Investment | | $100 | | $100 | | No minimum. | | No minimum. |
Tax Information
The Fund’s distributions are taxable and will generally be taxed as ordinary income or capital gains, unless you are investing through a tax-deferred account, such as an IRA or 401(k) plan.
Payments to Broker-Dealers and Other Financial Intermediaries
If you purchase shares of the Fund through a broker-dealer or other financial intermediary (such as a bank or financial advisor), the Fund, its distributor or its investment adviser may pay the intermediary for the sale of Fund shares and related services. These payments may create a conflict of interest by influencing the broker-dealer or other financial intermediary and your salesperson to recommend the Fund over another investment. Ask your financial advisor or visit your financial intermediary’s website for more information.
Section 1 Fund Summaries
65
Nuveen Small Cap Select Fund
Investment Objective
The investment objective of the Fund is capital appreciation.
Fees and Expenses of the Fund
This table describes the fees and expenses that you may pay if you buy and hold shares of the Fund. You may qualify for sales charge discounts if you and your family invest, or agree to invest in the future, at least $50,000 in the Fund or in other Nuveen Mutual Funds. More information about these and other discounts, as well as eligibility requirements for each share class, is available from your financial advisor and in “What Share Classes We Offer” on page 99 of the Fund’s prospectus, “How to Reduce Your Sales Charge” on page 102 of the prospectus and “Purchase and Redemption of Fund Shares” on page S-99 of the Fund’s statement of additional information.
Shareholder Fees
(fees paid directly from your investment)
| | | | | | | | | | | | | | | | | | | | |
| | | Class A | | | Class B | | | Class C | | | Class R3 | | | Class I | |
Maximum Sales Charge (Load) Imposed on Purchases
(as a percentage of offering price) | | | 5.75% | | | | None | | | | None | | | | None | | | | None | |
Maximum Deferred Sales Charge (Load)
(as a percentage of the lesser of purchase price or redemption proceeds)1 | | | None | | | | 5.00% | | | | 1.00% | | | | None | | | | None | |
| Maximum Sales Charge (Load) Imposed on Reinvested Dividends | | | None | | | | None | | | | None | | | | None | | | | None | |
| Exchange Fee | | | None | | | | None | | | | None | | | | None | | | | None | |
| Annual Low Balance Account Fee (for accounts under $1,000)2 | | | $15 | | | | $15 | | | | $15 | | | | None | | | | $15 | |
Annual Fund Operating Expenses
(expenses that you pay each year as a percentage of the value of your investment)
| | | | | | | | | | | | | | | | | | | | |
| | | Class A | | | Class B | | | Class C | | | Class R3 | | | Class I | |
| Management Fees | | | 0.88% | | | | 0.88% | | | | 0.88% | | | | 0.88% | | | | 0.88% | |
| Distribution and/or Service (12b-1) Fees | | | 0.25% | | | | 1.00% | | | | 1.00% | | | | 0.50% | | | | 0.00% | |
| Other Expenses3 | | | 0.22% | | | | 0.22% | | | | 0.22% | | | | 0.22% | | | | 0.22% | |
| Acquired Fund Fees and Expenses | | | 0.01% | | | | 0.01% | | | | 0.01% | | | | 0.01% | | | | 0.01% | |
| Total Annual Fund Operating Expenses | | | 1.36% | | | | 2.11% | | | | 2.11% | | | | 1.61% | | | | 1.11% | |
| 1 | The contingent deferred sales charge (“CDSC”) on Class B shares declines over a six-year period from purchase. The CDSC on Class C shares applies only to redemptions within 12 months of purchase. |
| 2 | Fee applies to the following types of accounts under $1,000 held directly with the Fund: individual retirement accounts (IRAs), Coverdell Education Savings Accounts and accounts established pursuant to the Uniform Transfers to Minors Act (UTMA) or Uniform Gifts to Minors Act (UGMA). |
| 3 | Other Expenses have been restated to reflect current contractual fees. |
Example
The following example is intended to help you compare the cost of investing in the Fund with the cost of investing in other mutual funds. The example assumes that you invest $10,000 in the Fund for the time periods indicated and then either redeem or do not redeem your shares at the end of a period. The example also assumes that your investment has a 5% return each year and that the Fund’s operating expenses remain the same. Although your actual costs may be higher or lower, based on these assumptions your costs would be:
| | | | | | | | | | | | | | | | | | | | | | | | | | | | | | | | | | | | | | | | | | | | |
| | | Redemption | | | | | No Redemption | | | |
| | | A | | | B | | | C | | | R3 | | | I | | | | | A | | | B | | | C | | | R3 | | | I | | | |
| 1 Year | | $ | 706 | | | $ | 714 | | | $ | 214 | | | $ | 164 | | | $ | 113 | | | | | $ | 706 | | | $ | 214 | | | $ | 214 | | | $ | 164 | | | $ | 113 | | | |
| 3 Years | | $ | 981 | | | $ | 961 | | | $ | 661 | | | $ | 508 | | | $ | 353 | | | | | $ | 981 | | | $ | 661 | | | $ | 661 | | | $ | 508 | | | $ | 353 | | | |
| 5 Years | | $ | 1,277 | | | $ | 1,234 | | | $ | 1,134 | | | $ | 876 | | | $ | 612 | | | | | $ | 1,277 | | | $ | 1,134 | | | $ | 1,134 | | | $ | 876 | | | $ | 612 | | | |
| 10 Years | | $ | 2,116 | | | $ | 2,250 | | | $ | 2,441 | | | $ | 1,911 | | | $ | 1,352 | | | | | $ | 2,116 | | | $ | 2,250 | | | $ | 2,441 | | | $ | 1,911 | | | $ | 1,352 | | | |
66
Section 1 Fund Summaries
Portfolio Turnover
The Fund pays transaction costs, such as commissions, when it buys and sells securities (or “turns over” its portfolio). A higher portfolio turnover rate may indicate higher transaction costs and may result in higher taxes when Fund shares are held in a taxable account. These costs, which are not reflected in annual fund operating expenses or in the example, affect the Fund’s performance. During the most recent fiscal year, the Fund’s portfolio turnover rate was 71% of the average value of its portfolio.
Principal Investment Strategies
Under normal market conditions, the Fund invests at least 80% of its net assets, plus the amount of any borrowings for investment purposes, in common stocks of small-capitalization companies, defined as companies that have market capitalizations of less than $3 billion at the time of purchase.
In selecting stocks, the Fund’s sub-adviser invests in companies that it believes meet one or more of the following criteria:
| • | | Attractively valued relative to other companies in the same industry or market. |
| • | | Strong or improving cash flows, revenue and earnings growth, or other fundamentals. |
| • | | Strong competitive position. |
| • | | Strong management teams. |
| • | | An identifiable catalyst that could increase the value of the company’s stock over the next one or two years. |
The Fund’s sub-adviser will generally sell a stock if the stock hits its price target, the company’s fundamentals or competitive position significantly deteriorate, or if a better alternative exists in the marketplace.
The Fund may invest up to 15% of its total assets in non-dollar denominated equity securities of non-U.S. issuers. In addition, the Fund may invest up to 25% of its assets, collectively, in non-dollar denominated equity securities of non-U.S. issuers and in dollar-denominated equity securities of non-U.S. issuers that are either listed on a U.S. stock exchange or represented by depositary receipts that may or may not be sponsored by a domestic bank. Up to 15% of the Fund’s total assets may be invested in equity securities of emerging market issuers. A country is considered to be an “emerging market” if it is defined as such by Morgan Stanley Capital International Inc.
The Fund may utilize options, futures contracts, options on futures contracts, and forward foreign currency exchange contracts (“derivatives”). The Fund may use these derivatives to manage market or business risk, enhance the Fund’s return, or hedge against adverse movements in currency exchange rates.
Principal Risks
The value of your investment in this Fund will change daily, which means you could lose money. An investment in the Fund is not a deposit of a bank and is not insured or guaranteed by the Federal Deposit Insurance Corporation or any other government agency. The principal risks of investing in the Fund include:
Derivatives Risk—The use of derivatives involves additional risks, such as liquidity, interest rate, counterparty, market, credit and management risks, and transaction costs which could leave the Fund in a worse position than if it had not used these instruments. Derivatives may entail investment exposures that are greater than their cost would suggest. As a result, a small investment in derivatives could have a large impact on performance. Recent legislation requires the development of a new regulatory framework for the derivatives market. The impact of the new regulations is still unknown, but has the potential to increase the costs of using derivatives, may limit the availability of some forms of derivatives or the Fund’s ability to use derivatives, and may adversely affect the performance of some derivative instruments used by the Fund as well as the Fund’s ability to pursue its investment objective through the use of such instruments.
Equity Security Risk—Equity securities may decline significantly in price over short or extended periods of time, and such declines may occur in the equity market as a whole, or they may occur in only a particular country, company, industry, or sector of the market.
Section 1 Fund Summaries
67
Non-U.S./Emerging Markets Risk—Non-U.S. issuers or U.S. issuers with significant non-U.S. operations may be subject to risks in addition to those of issuers located in or that principally operate in the United States as a result of, among other things, political, social and economic developments abroad and different legal, regulatory and tax environments. These additional risks may be heightened for securities of issuers located in, or with significant operations in, emerging market countries. Also, changes in currency exchange rates may affect the Fund’s net asset value, the value of dividends and interest earned, and gains and losses realized on the sale of securities.
Small-Cap Stock Risk—Small-cap stocks may involve greater risks than large-cap stocks. Prices of small-cap stocks may be subject to more abrupt or erratic movements, and to wider fluctuations, than stock prices of larger, more established companies or the market averages in general. It may be difficult to sell small-cap stocks at the desired time and price.
Fund Performance
The following bar chart and table provide some indication of the potential risks of investing in the Fund. The Fund’s past performance (before and after taxes) is not necessarily an indication of how the Fund will perform in the future. Updated performance information is available at www.nuveen.com/performance or by calling (800) 257-8787.
The bar chart below shows the variability of the Fund’s performance from year to year for Class A shares. The performance of the other share classes will differ due to their different expense structures. The bar chart and highest/lowest quarterly returns that follow do not reflect sales charges, and if these charges were reflected, the returns would be less than those shown.
Class A Annual Total Return
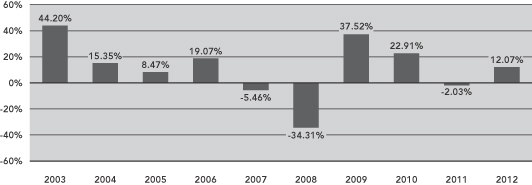
During the ten-year period ended December 31, 2012, the Fund’s highest and lowest quarterly returns were 21.20% and -23.68%, respectively, for the quarters ended December 31, 2011 and September 30, 2011.
The table below shows the variability of the Fund’s average annual returns and how they compare over the time periods indicated with those of a broad measure of market performance and an index of funds with similar investment objectives. All after-tax returns are calculated using the historical highest individual federal marginal income tax rates and do not reflect the impact of state and local taxes. After-tax returns are shown for Class A shares only; after-tax returns for other share classes will vary. Your own actual after-tax returns will depend on your specific tax situation and may differ from what is shown here. After-tax returns are not relevant to investors who hold Fund shares in tax-deferred accounts such as IRAs or employer-sponsored retirement plans.
Both the bar chart and the table assume that all distributions have been reinvested. Performance reflects fee waivers, if any, in effect during the periods presented. If any such waivers were not in place, returns would be reduced.
68
Section 1 Fund Summaries
Prior to July 1, 2004, Class R3 shares were designated Class S shares, which had lower fees and expenses. The performance information in the table prior to July 1, 2004 is based on the performance of the Class S shares. If current fees and expenses had been in effect, performance would have been lower.
| | | | | | | | | | | | |
| | | Average Annual Total Returns
for the Periods Ended December 31, 2012 | |
| | | 1 Year | | | 5 Years | | | 10 Years | |
| Class A (return before taxes) | | | 5.63 | % | | | 2.81 | % | | | 8.84 | % |
| Class A (return after taxes on distributions) | | | 2.62 | % | | | 2.14 | % | | | 6.92 | % |
| Class A (return after taxes on distributions and sale of Fund shares) | | | 6.31 | % | | | 2.28 | % | | | 7.03 | % |
| Class B (return before taxes) | | | 6.77 | % | | | 3.09 | % | | | 8.66 | % |
| Class C (return before taxes) | | | 11.22 | % | | | 3.24 | % | | | 8.67 | % |
| Class R3 (return before taxes) | | | 11.82 | % | | | 3.77 | % | | | 9.26 | % |
| Class I (return before taxes) | | | 12.37 | % | | | 4.29 | % | | | 9.76 | % |
| Russell 2000® Index (reflects no deduction for fees, expenses or taxes) | | | 16.35 | % | | | 3.56 | % | | | 9.72 | % |
Lipper Small-Cap Core Classification Average
(reflects no deduction for taxes or certain expenses) | | | 14.74 | % | | | 3.28 | % | | | 9.42 | % |
Management
Investment Adviser
Nuveen Fund Advisors, LLC
Sub-Adviser
Nuveen Asset Management, LLC
Portfolio Managers
| | | | |
Name | | Title | | Portfolio Manager of Fund Since |
| Allen D. Steinkopf, CFA | | Senior Vice President | | July 2004 |
| Mark A. Traster, CFA | | Vice President | | December 2008 |
Section 1 Fund Summaries
69
Purchase and Sale of Fund Shares
You may purchase, redeem or exchange shares of the Fund on any business day, which is any day the New York Stock Exchange is open for business. You may purchase, redeem or exchange shares of the Fund either through a financial advisor or other financial intermediary or directly from the Fund. Class B shares are available only through exchanges and dividend reinvestments by current Class B shareholders. The Fund’s initial and subsequent investment minimums generally are as follows, although the Fund may reduce or waive the minimums in some cases:
| | | | | | |
| | | Class A and Class C | | Class R3 | | Class I |
| Eligibility and Minimum Initial Investment | | $3,000 for all accounts except: •$2,500 for Traditional/Roth IRA accounts. •$2,000 for Coverdell Education Savings Accounts. •$250 for accounts opened through fee-based programs. •No minimum for retirement plans. | | Available only through certain retirement plans. No minimum. | | Available only through fee-based programs and certain retirement plans, and to other limited categories of investors as described in the prospectus. $100,000 for all accounts except: •$250 for clients of financial intermediaries and family offices that have accounts holding Class I shares with an aggregate value of at least $100,000 (or that are expected to reach this level). •No minimum for eligible retirement plans and certain other categories of eligible investors as described in the prospectus. |
| Minimum Additional Investment | | $100 | | No minimum. | | No minimum. |
Tax Information
The Fund’s distributions are taxable and will generally be taxed as ordinary income or capital gains, unless you are investing through a tax-deferred account, such as an IRA or 401(k) plan.
Payments to Broker-Dealers and Other Financial Intermediaries
If you purchase shares of the Fund through a broker-dealer or other financial intermediary (such as a bank or financial advisor), the Fund, its distributor or its investment adviser may pay the intermediary for the sale of Fund shares and related services. These payments may create a conflict of interest by influencing the broker-dealer or other financial intermediary and your salesperson to recommend the Fund over another investment. Ask your financial advisor or visit your financial intermediary’s website for more information.
70
Section 1 Fund Summaries
Nuveen Small Cap Value Fund
Investment Objective
The investment objective of the Fund is capital appreciation.
Fees and Expenses of the Fund
This table describes the fees and expenses that you may pay if you buy and hold shares of the Fund. You may qualify for sales charge discounts if you and your family invest, or agree to invest in the future, at least $50,000 in the Fund or in other Nuveen Mutual Funds. More information about these and other discounts, as well as eligibility requirements for each share class, is available from your financial advisor and in “What Share Classes We Offer” on page 99 of the Fund’s prospectus, “How to Reduce Your Sales Charge” on page 102 of the prospectus and “Purchase and Redemption of Fund Shares” on page S-99 of the Fund’s statement of additional information.
Shareholder Fees
(fees paid directly from your investment)
| | | | | | | | | | | | | | | | |
| | | Class A | | | Class C | | | Class R3 | | | Class I | |
Maximum Sales Charge (Load) Imposed on Purchases
(as a percentage of offering price) | | | 5.75% | | | | None | | | | None | | | | None | |
Maximum Deferred Sales Charge (Load)
(as a percentage of the lesser of purchase price or redemption proceeds)1 | | | None | | | | 1.00% | | | | None | | | | None | |
| Maximum Sales Charge (Load) Imposed on Reinvested Dividends | | | None | | | | None | | | | None | | | | None | |
| Exchange Fee | | | None | | | | None | | | | None | | | | None | |
| Annual Low Balance Account Fee (for accounts under $1,000)2 | | | $15 | | | | $15 | | | | None | | | | $15 | |
Annual Fund Operating Expenses (expenses that you pay each year as a percentage of the value of your investment) | | | | | | | | | | | | | | | | |
| | | Class A | | | Class C | | | Class R3 | | | Class I | |
| Management Fees | | | 0.90% | | | | 0.90% | | | | 0.90% | | | | 0.90% | |
| Distribution and/or Service (12b-1) Fees | | | 0.25% | | | | 1.00% | | | | 0.50% | | | | 0.00% | |
| Other Expenses3 | | | 0.41% | | | | 0.42% | | | | 0.41% | | | | 0.42% | |
| Acquired Fund Fees and Expenses | | | 0.01% | | | | 0.01% | | | | 0.01% | | | | 0.01% | |
| Total Annual Fund Operating Expenses | | | 1.57% | | | | 2.33% | | | | 1.82% | | | | 1.33% | |
| Fee Waivers and/or Expense Reimbursements3,4 | | | (0.06)% | | | | (0.07)% | | | | (0.06)% | | | | (0.07)% | |
| Total Annual Fund Operating Expenses After Fee Waivers and/or Expense Reimbursements | | | 1.51% | | | | 2.26% | | | | 1.76% | | | | 1.26% | |
| 1 | The contingent deferred sales charge on Class C shares applies only to redemptions within 12 months of purchase. |
| 2 | Fee applies to the following types of accounts under $1,000 held directly with the Fund: individual retirement accounts (IRAs), Coverdell Education Savings Accounts and accounts established pursuant to the Uniform Transfers to Minors Act (UTMA) or Uniform Gifts to Minors Act (UGMA). |
| 3 | Other Expenses and Fee Waivers and/or Expense Reimbursements have been restated to reflect current contractual fees. |
| 4 | The Fund’s investment adviser has contractually agreed to waive fees and/or reimburse other Fund expenses through February 28, 2014 so that total annual fund operating expenses, after fee waivers and/or expense reimbursements and excluding Acquired Fund Fees and Expenses, do not exceed 1.50%, 2.25%, 1.75% and 1.25% for Class A, Class C, Class R3 and Class I shares, respectively. Fee waivers and/or expense reimbursements will not be terminated prior to that time without the approval of the Fund’s board of directors. |
Example
The following example is intended to help you compare the cost of investing in the Fund with the cost of investing in other mutual funds. The example assumes that you invest $10,000 in the Fund for the time periods indicated and then either redeem or do not redeem your shares at the end of a period. The example also assumes that your investment has a 5% return each year, that the Fund’s operating expenses remain the same, and the contractual fee waivers currently in place are not renewed beyond February 28, 2014. Although your actual costs may be higher or lower, based on these assumptions your costs would be:
| | | | | | | | | | | | | | | | | | | | | | | | | | | | | | | | | | | | |
| | | Redemption | | | No Redemption | | | |
| | | A | | | C | | | R3 | | | I | | | | | A | | | C | | | R3 | | | I | | | |
| 1 Year | | $ | 720 | | | $ | 229 | | | $ | 179 | | | $ | 128 | | | | | $ | 720 | | | $ | 229 | | | $ | 179 | | | $ | 128 | | | |
| 3 Years | | $ | 1,037 | | | $ | 721 | | | $ | 567 | | | $ | 415 | | | | | $ | 1,037 | | | $ | 721 | | | $ | 567 | | | $ | 415 | | | |
| 5 Years | | $ | 1,376 | | | $ | 1,239 | | | $ | 980 | | | $ | 722 | | | | | $ | 1,376 | | | $ | 1,239 | | | $ | 980 | | | $ | 722 | | | |
| 10 Years | | $ | 2,330 | | | $ | 2,661 | | | $ | 2,132 | | | $ | 1,595 | | | | | $ | 2,330 | | | $ | 2,661 | | | $ | 2,132 | | | $ | 1,595 | | | |
Section 1 Fund Summaries
71
Portfolio Turnover
The Fund pays transaction costs, such as commissions, when it buys and sells securities (or “turns over” its portfolio). A higher portfolio turnover rate may indicate higher transaction costs and may result in higher taxes when Fund shares are held in a taxable account. These costs, which are not reflected in annual fund operating expenses or in the example, affect the Fund’s performance. During the most recent fiscal year, the Fund’s portfolio turnover rate was 46% of the average value of its portfolio.
Principal Investment Strategies
Under normal market conditions, the Fund invests at least 80% of net assets, plus the amount of any borrowings for investment purposes, in common stocks of small-capitalization companies, defined as companies that have market capitalizations of less than $3 billion at the time of purchase.
In selecting stocks, the Fund’s sub-adviser invests in companies that it believes meet at least two of the following criteria:
| • | | Undervalued relative to other companies in the same industry or market; |
| • | | Good or improving fundamentals; and |
| • | | An identifiable catalyst that could close the gap between market value and fair value over the next one to two years. |
The Fund’s sub-adviser will generally sell a stock if the stock hits its price target, the company’s fundamentals or competitive position significantly deteriorate, or if a better alternative exists in the marketplace.
The Fund may invest up to 15% of its total assets in non-dollar denominated equity securities of non-U.S. issuers. In addition, the Fund may invest up to 25% of its assets, collectively, in non-dollar denominated equity securities of non-U.S. issuers and in dollar-denominated equity securities of non-U.S. issuers that are either listed on a U.S. stock exchange or represented by depositary receipts that may or may not be sponsored by a domestic bank. Up to 15% of the Fund’s total assets may be invested in equity securities of emerging market issuers. A country is considered to be an “emerging market” if it is defined as such by Morgan Stanley Capital International Inc.
The Fund may utilize options, futures contracts, options on futures contracts, and forward foreign currency exchange contracts (“derivatives”). The Fund may use these derivatives to manage market or business risk, enhance the Fund’s return, or hedge against adverse movements in currency exchange rates.
Principal Risks
The value of your investment in this Fund will change daily, which means you could lose money. An investment in the Fund is not a deposit of a bank and is not insured or guaranteed by the Federal Deposit Insurance Corporation or any other government agency. The principal risks of investing in the Fund include:
Derivatives Risk—The use of derivatives involves additional risks, such as liquidity, interest rate, counterparty, market, credit and management risks, and transaction costs which could leave the Fund in a worse position than if it had not used these instruments. Derivatives may entail investment exposures that are greater than their cost would suggest. As a result, a small investment in derivatives could have a large impact on performance. Recent legislation requires the development of a new regulatory framework for the derivatives market. The impact of the new regulations is still unknown, but has the potential to increase the costs of using derivatives, may limit the availability of some forms of derivatives or the Fund’s ability to use derivatives, and may adversely affect the performance of some derivative instruments used by the Fund as well as the Fund’s ability to pursue its investment objective through the use of such instruments.
Equity Security Risk—Equity securities may decline significantly in price over short or extended periods of time, and such declines may occur in the equity market as a whole, or they may occur in only a particular country, company, industry, or sector of the market.
Investment Focus Risk—Different types of stocks tend to shift in and out of favor depending on market and economic conditions. The Fund emphasizes a value style of investing and therefore seeks undervalued companies with characteristics for improved valuations; such companies are subject to the risk that the valuations never improve.
72
Section 1 Fund Summaries
Non-U.S./Emerging Markets Risk—Non-U.S. issuers or U.S. issuers with significant non-U.S. operations may be subject to risks in addition to those of issuers located in or that principally operate in the United States as a result of, among other things, political, social and economic developments abroad and different legal, regulatory and tax environments. These additional risks may be heightened for securities of issuers located in, or with significant operations in, emerging market countries. Also, changes in currency exchange rates may affect the Fund’s net asset value, the value of dividends and interest earned, and gains and losses realized on the sale of securities.
Small-Cap Stock Risk—Small-cap stocks may involve greater risks than large-cap stocks. Prices of small-cap stocks may be subject to more abrupt or erratic movements, and to wider fluctuations, than stock prices of larger, more established companies or the market averages in general. It may be difficult to sell small-cap stocks at the desired time and price.
Fund Performance
The following bar chart and table provide some indication of the potential risks of investing in the Fund. The Fund’s past performance (before and after taxes) is not necessarily an indication of how the Fund will perform in the future. Updated performance information is available at www.nuveen.com/performance or by calling (800) 257-8787.
The bar chart below shows the variability of the Fund’s performance from year to year for Class A shares. The performance of the other share classes will differ due to their different expense structures. The bar chart and highest/lowest quarterly returns that follow do not reflect sales charges, and if these charges were reflected, the returns would be less than those shown.
Class A Annual Total Return
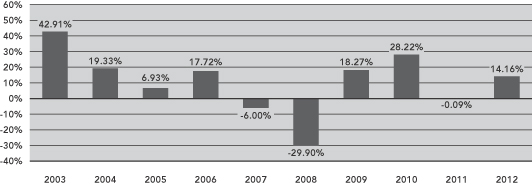
During the ten-year period ended December 31, 2012, the Fund’s highest and lowest quarterly returns were 19.73% and -22.12%, respectively, for the quarters ended December 31, 2011 and December 31, 2008.
The table below shows the variability of the Fund’s average annual returns and how they compare over the time periods indicated with those of a broad measure of market performance and an index of funds with similar investment objectives. All after-tax returns are calculated using the historical highest individual federal marginal income tax rates and do not reflect the impact of state and local taxes. After-tax returns are shown for Class A shares only; after-tax returns for other share classes will vary. Your own actual after-tax returns will depend on your specific tax situation and may differ from what is shown here. After-tax returns are not relevant to investors who hold Fund shares in tax-deferred accounts such as IRAs or employer-sponsored retirement plans.
Both the bar chart and the table assume that all distributions have been reinvested. Performance reflects fee waivers, if any, in effect during the periods presented. If any such waivers were not in place, returns would be reduced.
Section 1 Fund Summaries
73
Prior to July 1, 2004, Class R3 shares were designated Class S shares, which had lower fees and expenses. The performance information in the table prior to July 1, 2004 is based on the performance of the Class S shares. If current fees and expenses had been in effect, performance would have been lower.
| | | | | | | | | | | | |
| | | Average Annual Total Returns
for the Periods Ended
December 31, 2012 | |
| | | 1 Year | | | 5 Years | | | 10 Years | |
| Class A (return before taxes) | | | 7.62 | % | | | 2.71 | % | | | 8.72 | % |
| Class A (return after taxes on distributions) | | | 7.56 | % | | | 2.65 | % | | | 7.29 | % |
| Class A (return after taxes on distributions and sale of Fund shares) | | | 5.04 | % | | | 2.30 | % | | | 7.24 | % |
| Class C (return before taxes) | | | 13.34 | % | | | 3.16 | % | | | 8.55 | % |
| Class R3 (return before taxes) | | | 13.95 | % | | | 3.69 | % | | | 9.15 | % |
| Class I (return before taxes) | | | 14.43 | % | | | 4.19 | % | | | 9.63 | % |
Russell 2000® Value Index
(reflects no deduction for fees, expenses or taxes) | | | 18.05 | % | | | 3.55 | % | | | 9.50 | % |
Lipper Small-Cap Value Classification Average
(reflects no deduction for taxes or certain expenses) | | | 16.27 | % | | | 4.26 | % | | | 9.88 | % |
Management
Investment Adviser
Nuveen Fund Advisors, LLC
Sub-Adviser
Nuveen Asset Management, LLC
Portfolio Manager
| | | | |
Name | | Title | | Portfolio Manager of Fund Since |
| Karen L. Bowie, CFA | | Senior Vice President | | July 2005 |
74
Section 1 Fund Summaries
Purchase and Sale of Fund Shares
You may purchase, redeem or exchange shares of the Fund on any business day, which is any day the New York Stock Exchange is open for business. You may purchase, redeem or exchange shares of the Fund either through a financial advisor or other financial intermediary or directly from the Fund. The Fund’s initial and subsequent investment minimums generally are as follows, although the Fund may reduce or waive the minimums in some cases:
| | | | | | |
| | | Class A and Class C | | Class R3 | | Class I |
| Eligibility and Minimum Initial Investment | | $3,000 for all accounts except: •$2,500 for Traditional/Roth IRA accounts. •$2,000 for Coverdell Education Savings Accounts. •$250 for accounts opened through fee-based programs. •No minimum for retirement plans. | | Available only through certain retirement plans. No minimum. | | Available only through fee-based programs and certain retirement plans, and to other limited categories of investors as described in the prospectus. $100,000 for all accounts except: •$250 for clients of financial intermediaries and family offices that have accounts holding Class I shares with an aggregate value of at least $100,000 (or that are expected to reach this level). •No minimum for eligible retirement plans and certain other categories of eligible investors as described in the prospectus. |
| Minimum Additional Investment | | $100 | | No minimum. | | No minimum. |
Tax Information
The Fund’s distributions are taxable and will generally be taxed as ordinary income or capital gains, unless you are investing through a tax-deferred account, such as an IRA or 401(k) plan.
Payments to Broker-Dealers and Other Financial Intermediaries
If you purchase shares of the Fund through a broker-dealer or other financial intermediary (such as a bank or financial advisor), the Fund, its distributor or its investment adviser may pay the intermediary for the sale of Fund shares and related services. These payments may create a conflict of interest by influencing the broker-dealer or other financial intermediary and your salesperson to recommend the Fund over another investment. Ask your financial advisor or visit your financial intermediary’s website for more information.
Section 1 Fund Summaries
75
Nuveen Tactical Market Opportunities Fund
Investment Objective
The investment objective of the Fund is to earn a positive total return over a reasonable period of time, regardless of market conditions.
Fees and Expenses of the Fund
This table describes the fees and expenses that you may pay if you buy and hold shares of the Fund. You may qualify for sales charge discounts if you and your family invest, or agree to invest in the future, at least $50,000 in the Fund or in other Nuveen Mutual Funds. More information about these and other discounts, as well as eligibility requirements for each share class, is available from your financial advisor and in “What Share Classes We Offer” on page 99 of the Fund’s prospectus, “How to Reduce Your Sales Charge” on page 102 of the prospectus and “Purchase and Redemption of Fund Shares” on page S-99 of the Fund’s statement of additional information.
Shareholder Fees
(fees paid directly from your investment)
| | | | | | | | | | | | |
| | | Class A | | | Class C | | | Class I | |
Maximum Sales Charge (Load) Imposed on Purchases
(as a percentage of offering price) | | | 5.75% | | | | None | | | | None | |
Maximum Deferred Sales Charge (Load)
(as a percentage of the lesser of purchase price or redemption proceeds)1 | | | None | | | | 1.00% | | | | None | |
| Maximum Sales Charge (Load) Imposed on Reinvested Dividends | | | None | | | | None | | | | None | |
| Exchange Fee | | | None | | | | None | | | | None | |
| Annual Low Balance Account Fee (for accounts under $1,000)2 | | | $15 | | | | $15 | | | | $15 | |
Annual Fund Operating Expenses (expenses that you pay each year as a percentage of the value of your investment) | | | | | | | | | | | | |
| | | Class A | | | Class C | | | Class I | |
| Management Fees | | | 0.77% | | | | 0.77% | | | | 0.77% | |
| Distribution and/or Service (12b-1) Fees | | | 0.25% | | | | 1.00% | | | | 0.00% | |
| Other Expenses3 | | | 0.15% | | | | 0.14% | | | | 0.15% | |
| Acquired Fund Fees and Expenses | | | 0.17% | | | | 0.17% | | | | 0.17% | |
| Total Annual Fund Operating Expenses | | | 1.34% | | | | 2.08% | | | | 1.09% | |
| 1 | The contingent deferred sales charge on Class C shares applies only to redemptions within 12 months of purchase. |
| 2 | Fee applies to the following types of accounts under $1,000 held directly with the Fund: individual retirement accounts (IRAs), Coverdell Education Savings Accounts and accounts established pursuant to the Uniform Transfers to Minors Act (UTMA) or Uniform Gifts to Minors Act (UGMA). |
| 3 | Other Expenses have been restated to reflect current contractual fees. |
Example
The following example is intended to help you compare the cost of investing in the Fund with the cost of investing in other mutual funds. The example assumes that you invest $10,000 in the Fund for the time periods indicated and then either redeem or do not redeem your shares at the end of a period. The example also assumes that your investment has a 5% return each year and that the Fund’s operating expenses remain the same. Although your actual costs may be higher or lower, based on these assumptions your costs would be:
| | | | | | | | | | | | | | | | | | | | | | | | | | | | |
| | | Redemption | | | | | No Redemption | | | |
| | | A | | | C | | | I | | | | | A | | | C | | | I | | | |
| 1 Year | | $ | 704 | | | $ | 211 | | | $ | 111 | | | | | $ | 704 | | | $ | 211 | | | $ | 111 | | | |
| 3 Years | | $ | 975 | | | $ | 652 | | | $ | 347 | | | | | $ | 975 | | | $ | 652 | | | $ | 347 | | | |
| 5 Years | | $ | 1,267 | | | $ | 1,119 | | | $ | 601 | | | | | $ | 1,267 | | | $ | 1,119 | | | $ | 601 | | | |
| 10 Years | | $ | 2,095 | | | $ | 2,410 | | | $ | 1,329 | | | | | $ | 2,095 | | | $ | 2,410 | | | $ | 1,329 | | | |
76
Section 1 Fund Summaries
Portfolio Turnover
The Fund pays transaction costs, such as commissions, when it buys and sells securities (or “turns over” its portfolio). A higher portfolio turnover rate may indicate higher transaction costs and may result in higher taxes when Fund shares are held in a taxable account. These costs, which are not reflected in annual fund operating expenses or in the example, affect the Fund’s performance. During the most recent fiscal year, the Fund’s portfolio turnover rate was 189% of the average value of its portfolio.
Principal Investment Strategies
Under normal market conditions, the Fund will seek to outperform the Merrill Lynch 3 Month Treasury Bill Index (the “Treasury Bill Index”) by 400 basis points, or 4%, on an annualized basis. The Treasury Bill Index is comprised of a single U.S. Treasury issue with approximately three months to final maturity, purchased at the beginning of each month and held for one full month. At the end of the month, that issue is sold and rolled into a newly selected issue. U.S. Treasury bills are backed by the full faith and credit of the U.S. government, and are generally considered a risk free investment. Investing in the Fund, on the other hand, involves certain risks, including the risk of loss. In addition, an investment in the Fund will be more volatile than an investment in U.S. Treasury bills. The Fund’s portfolio managers will manage volatility by attempting to limit the Fund’s tracking error relative to the Treasury Bill Index to a level consistent with achieving the return that the Fund is seeking.
The Fund seeks to outperform the Treasury Bill Index over a reasonable period of time, although there is no guarantee that it will be able to do so. Over shorter periods of time, investment returns will fluctuates as market conditions vary and may be lower than those of the Treasury Bill Index. Thus, the Fund is designed for investors with longer term investment horizons—generally at least three years or more.
The Fund seeks to achieve its objective by investing its assets across the following asset classes:
| | • | | U.S., international and emerging market equity securities, |
| | • | | U.S., international and emerging market debt securities, including high-yield debt securities, |
| | • | | High quality, short-term debt securities and money market funds. |
The Fund gains exposure to the above asset classes (i) by investing in derivative instruments and exchange-traded funds (“ETFs”), (ii) by creating custom baskets of equity and debt securities, where each basket is designed to track the performance of a particular securities index (such as an industry, sector, country or region index) within certain parameters, and (iii) by investing directly in U.S. Treasury obligations, non-U.S. government obligations that have an investment grade rating from at least one rating agency and money market funds.
The Fund will use derivative instruments such as options; futures contracts, including futures on equity and commodities indices, interest rate futures and currency futures; options on futures contracts; interest rate caps and floors; foreign currency contracts; options on foreign currencies; interest rate, total return, currency and credit default swaps; and options on the foregoing types of swap agreements. Derivatives may be entered into on established exchanges, either in the U.S. or in non-U.S. countries, or through privately negotiated transactions referred to as over-the-counter derivatives. In using derivatives, the Fund may take both long positions (the values of which move in the same direction as the prices of the underlying investment, pool of investments, index or currency) and short positions (the values of which move in the opposite direction from the price of the underlying investment, pool of investments, index or currency).
The Fund’s sub-adviser may allocate the Fund’s assets among the different asset classes in different proportions at different times. The Fund is not required to allocate its investments among the asset classes in any fixed proportion, nor is it limited by investment style or by the issuer’s location, size, market capitalization or industry sector. The Fund may have none or some of its assets invested in each asset class in relative proportions that change over time based on market and economic conditions.
The sub-adviser allocates assets among the various asset classes based on its forecasted returns and its risk assessment for each asset class. The sub-adviser will seek to take advantage of both investment opportunities that are
Section 1 Fund Summaries
77
believed to have a high probability of success (long investment) and a high probability of failure (short investment). The sub-adviser regularly assesses and manages the overall risk profile of the Fund’s portfolio, based on the Fund’s exposure to each asset class, the volatility of the asset classes, and the correlation of returns among the different asset classes.
Principal Risks
The value of your investment in this Fund will change daily, which means you could lose money. An investment in the Fund is not a deposit of a bank and is not insured or guaranteed by the Federal Deposit Insurance Corporation or any other government agency. The principal risks of investing in the Fund include:
Commodities Risk—Commodities markets historically have been extremely volatile, and the performance of securities that provide exposure to those markets therefore also may be highly volatile.
Credit Risk—Credit risk is the risk that an issuer of a debt security may be unable or unwilling to make interest and principal payments when due and the related risk that the value of a debt security may decline because of concerns about the issuer’s ability or willingness to make such payments. In addition, parties to other financial contracts with the Fund could default on their obligations.
Derivatives Risk—The use of derivatives involves additional risks, such as liquidity, interest rate, counterparty, market, credit and management risks, and transaction costs which could leave the Fund in a worse position than if it had not used these instruments. Derivatives may entail investment exposures that are greater than their cost would suggest. As a result, a small investment in derivatives could have a large impact on performance. Recent legislation requires the development of a new regulatory framework for the derivatives market. The impact of the new regulations is still unknown, but has the potential to increase the costs of using derivatives, may limit the availability of some forms of derivatives or the Fund’s ability to use derivatives, and may adversely affect the performance of some derivative instruments used by the Fund as well as the Fund’s ability to pursue its investment objective through the use of such instruments.
Equity Security Risk—Equity securities may decline significantly in price over short or extended periods of time, and such declines may occur in the equity market as a whole, or they may occur in only a particular country, company, industry, or sector of the market.
ETF Risk—An ETF is subject to the risks of the underlying securities that it holds. In addition, for index-based ETFs the performance of an ETF may diverge from the performance of such index (commonly known as tracking error). ETFs are subject to fees and expenses (like management fees and operating expenses) that do not apply to an index, and the Fund will indirectly bear its proportionate share of any such fees and expenses paid by the ETFs in which it invests.
Frequent Trading Risk—Frequent trading of portfolio securities may produce capital gains, which are taxable to shareholders when distributed. Frequent trading may also increase the amount of commissions or mark-ups to broker-dealers that the Fund pays when it buys and sells securities, which may detract from the Fund’s performance.
High Yield Securities Risk—High yield securities are high risk investments that may cause income and principal losses for the Fund. They generally have greater credit risk, are less liquid and have more volatile prices than investment grade securities.
Interest Rate Risk—Interest rate risk is the risk that the value of the Fund’s portfolio will decline because of rising interest rates. When interest rates change, the values of longer-duration debt securities usually change more than the values of shorter-duration debt securities.
Non-U.S./Emerging Markets Risk—Non-U.S. issuers or U.S. issuers with significant non-U.S. operations may be subject to risks in addition to those of issuers located in or that principally operate in the United States as a result of, among other things, political, social and economic developments abroad and different legal, regulatory and tax environments. These additional risks may be heightened for securities of issuers located in, or with significant operations in, emerging market countries. Also, changes in currency exchange rates may affect the Fund’s net asset value, the value of dividends and interest earned, and gains and losses realized on the sale of securities.
Other Investment Companies Risk—When the Fund invests in other investment companies, you bear both your proportionate share of Fund expenses and, indirectly, the expenses of the other investment companies.
78
Section 1 Fund Summaries
Fund Performance
The following bar chart and table provide some indication of the potential risks of investing in the Fund. The Fund’s past performance (before and after taxes) is not necessarily an indication of how the Fund will perform in the future. Updated performance information is available at www.nuveen.com/performance or by calling (800) 257-8787.
The bar chart below shows the variability of the Fund’s performance from year to year for Class I shares. The performance of the other share classes will differ due to their different expense structures.
Class I Annual Total Return
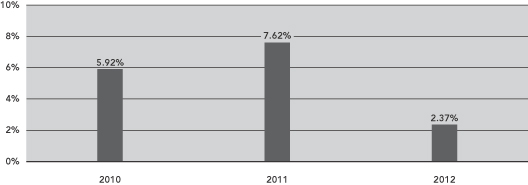
During the three-year period ended December 31, 2012, the Fund’s highest and lowest quarterly returns were 4.45% and -0.20%, respectively, for the quarters ended September 30, 2010 and June 30, 2010.
The table below shows the variability of the Fund’s average annual returns and how they compare over the time periods indicated with those of a broad measure of market performance and an index of funds with similar investment objectives. All after-tax returns are calculated using the historical highest individual federal marginal income tax rates and do not reflect the impact of state and local taxes. After-tax returns are shown for Class I shares only; after-tax returns for other share classes will vary. Your own actual after-tax returns will depend on your specific tax situation and may differ from what is shown here. After-tax returns are not relevant to investors who hold Fund shares in tax-deferred accounts such as IRAs or employer-sponsored retirement plans.
Both the bar chart and the table assume that all distributions have been reinvested. Performance reflects fee waivers, if any, in effect during the periods presented. If any such waivers were not in place, returns would be reduced.
| | | | | | | | | | | | | | | | |
| | | | | | Average Annual Total Returns
for the Periods Ended
December 31, 2012 | |
| | | Inception
Date | | | 1 Year | | | Since
Inception
(Class A
& Class C) | | | Since
Inception
(Class I) | |
| Class A (return before taxes) | | | 2/24/11 | | | | (3.73 | )% | | | 2.87 | % | | | N/A | |
| Class C (return before taxes) | | | 2/24/11 | | | | 1.27 | % | | | 4.08 | % | | | N/A | |
| Class I (return before taxes) | | | 12/30/09 | | | | 2.37 | % | | | N/A | | | | 5.20 | % |
| Class I (return after taxes on distributions) | | | | | | | 2.01 | % | | | N/A | | | | 4.77 | % |
| Class I (return after taxes on distributions and sale of Fund shares) | | | | | | | 1.60 | % | | | N/A | | | | 4.23 | % |
BofA Merrill Lynch 3-Month U.S. Treasury Bill Index
(reflects no deduction for fees, expenses or taxes) | | | | 0.11 | % | | | 0.10 | % | | | 0.11 | % |
Lipper Flexible Portfolio Classification Average
(reflects no deduction for taxes or certain expenses) | | | | 8.76 | % | | | 2.92 | % | | | 6.71 | % |
Section 1 Fund Summaries
79
Management
Investment Adviser
Nuveen Fund Advisors, LLC
Sub-Adviser
Nuveen Asset Management, LLC
Portfolio Managers
| | | | |
Name | | Title | | Portfolio Manager of Fund Since |
| David R. Cline | | Vice President | | December 2009 |
| Walter A. French | | Senior Vice President | | December 2009 |
| David A. Friar | | Assistant Vice President | | December 2009 |
| Keith B. Hembre, CFA | | Managing Director | | December 2009 |
| Derek B. Bloom, CFA | | Vice President | | February 2011 |
Purchase and Sale of Fund Shares
You may purchase, redeem or exchange shares of the Fund on any business day, which is any day the New York Stock Exchange is open for business. You may purchase, redeem or exchange shares of the Fund either through a financial advisor or other financial intermediary or directly from the Fund. The Fund’s initial and subsequent investment minimums generally are as follows, although the Fund may reduce or waive the minimums in some cases:
| | | | |
| | | Class A and Class C | | Class I |
| Eligibility and Minimum Initial Investment | | $3,000 for all accounts except: •$2,500 for Traditional/Roth IRA accounts. •$2,000 for Coverdell Education Savings Accounts. •$250 for accounts opened through fee-based programs. •No minimum for retirement plans. | | Available only through fee-based programs and certain retirement plans, and to other limited categories of investors as described in the prospectus. $100,000 for all accounts except: •$250 for clients of financial intermediaries and family offices that have accounts holding Class I shares with an aggregate value of at least $100,000 (or that are expected to reach this level). •No minimum for eligible retirement plans and certain other categories of eligible investors as described in the prospectus. |
| Minimum Additional Investment | | $100 | | No minimum. |
Tax Information
The Fund’s distributions are taxable and will generally be taxed as ordinary income or capital gains, unless you are investing through a tax-deferred account, such as an IRA or 401(k) plan.
Payments to Broker-Dealers and Other Financial Intermediaries
If you purchase shares of the Fund through a broker-dealer or other financial intermediary (such as a bank or financial advisor), the Fund, its distributor or its investment adviser may pay the intermediary for the sale of Fund shares and related services. These payments may create a conflict of interest by influencing the broker-dealer or other financial intermediary and your salesperson to recommend the Fund over another investment. Ask your financial advisor or visit your financial intermediary’s website for more information.
80
Section 1 Fund Summaries
Section 2 How We Manage Your Money
To help you better understand the Funds, this section includes a detailed discussion of the Funds’ investment and risk management strategies. For a more complete discussion of these matters, please see the statement of additional information, which is available by calling (800) 257-8787 or by visiting Nuveen’s website at www.nuveen.com.

Nuveen Fund Advisors, LLC (“Nuveen Fund Advisors”), the Funds’ investment adviser, offers advisory and investment management services to a broad range of mutual fund clients. Nuveen Fund Advisors has overall responsibility for management of the Funds, oversees the management of the Funds’ portfolios, manages the Funds’ business affairs and provides certain clerical, bookkeeping and other administrative services. Nuveen Fund Advisors is located at 333 West Wacker Drive, Chicago, Illinois 60606. Nuveen Fund Advisors is a subsidiary of Nuveen Investments, Inc. (“Nuveen Investments”). On November 13, 2007, Nuveen Investments was acquired by investors led by Madison Dearborn Partners, LLC, which is a private equity investment firm based in Chicago, Illinois. The Nuveen family of advisers has been providing advice to investment companies since 1976, and had $220 billion of assets under management as of September 30, 2012.
Nuveen Fund Advisors has selected its affiliate, Nuveen Asset Management, LLC (“Nuveen Asset Management”), located at 333 West Wacker Drive, Chicago, Illinois 60606, to serve as sub-adviser to each Fund. Nuveen Asset Management manages the investment of the Funds’ assets on a discretionary basis, subject to the supervision of Nuveen Fund Advisors.
In addition to Nuveen Asset Management, Altrinsic Global Advisors, LLC (“Altrinsic”) serves as a sub-adviser for Nuveen International Fund and Altrinsic and Lazard Asset Management LLC (“Lazard”) serve as sub-advisers for Nuveen International Select Fund.
Altrinsic, located at 8 Sound Shore Drive, Greenwich, Connecticut 06830, was established in 2000 and is an employee-controlled and majority-owned firm specializing in global and international investment management. As of December 31, 2012, Altrinsic had assets under management of approximately $12.6 billion. Altrinsic’s investment philosophy is based on value creation and the belief that a company’s valuation is a function of its future financial productivity (i.e., sustainable returns-on-capital relative to cost of capital) adjusted for associated risk. In implementing its philosophy, Altrinsic’s team capitalizes on inefficiencies (i.e. mispriced securities) in the world’s equity markets by taking a long-term view and leveraging proprietary individual-company analysis, global industry knowledge, and a distinctive cross-border frame of reference. Predicated on the time-tested principles of fundamental value investing, Altrinsic’s investment approach is bottom-up, fundamentally driven, internationally focused, and all-cap. Altrinsic has been providing advice to investment companies since 2006.
Lazard, 30 Rockefeller Plaza, New York, New York 10112, is a wholly owned subsidiary of Lazard Frères & Co., LLC. As of December 31, 2012, Lazard had assets under management of approximately $151.7 billion. Lazard employs a
Section 2 How We Manage Your Money
81
bottom-up, relative value approach in selecting stocks that includes proprietary database screening, accounting validation, fundamental analysis, and portfolio construction/risk evaluation. Lazard seeks to identify individual stocks of companies whose principal activities are located in emerging market countries that are believed to be undervalued based on their earnings, cash flow or asset values. Lazard has been providing advice to investment companies since 1991.
The portfolio managers primarily responsible for the Funds’ management are:
Nuveen Dividend Value Fund. Cori B. Johnson, CFA, has been a portfolio manager of the Fund since August 1994. Ms. Johnson entered the financial services industry in 1981 and joined FAF Advisors, Inc. (“FAF”) in 1985. She joined Nuveen Asset Management as a Senior Vice President on January 1, 2011 in connection with the firm’s acquisition of a portion of FAF’s asset management business. Prior thereto, she was a Senior Equity Portfolio Manager at FAF.
Derek M. Sadowsky has been a portfolio manager of the Fund since February 2012. Mr. Sadowsky joined FAF in 2010. Prior to his current portfolio management role, he was a senior equity research analyst for the mid- and large-cap research team, specializing in the basic materials sector. Previously, he was an analyst at State Street Global Advisors in charge of the global basic materials sector from 2007 to 2009. He was also an associate at Putnam Investments from 2006 to 2007 where he worked on the global basic materials team. Mr. Sadowsky entered the financial services industry in 1998 and joined Nuveen Asset Management on January 1, 2011 as a Vice President in connection with the firm’s acquisition of a portion of FAF’s asset management business.
Nuveen Equity Index Fund. Walter A. French has been a portfolio manager of the Fund since October 1999. Mr. French entered the financial services industry in 1974 and joined FAF in 1999. He joined Nuveen Asset Management as a Senior Vice President on January 1, 2011 in connection with the firm’s acquisition of a portion of FAF’s asset management business. Prior thereto, he was a Senior Equity Portfolio Manager at FAF.
David A. Friar has been a portfolio manager of the Fund since September 2000. Mr. Friar entered the financial services industry in 1998 and joined FAF in 1999. He joined Nuveen Asset Management as a Vice President on January 1, 2011 in connection with the firm’s acquisition of a portion of FAF’s asset management business. Prior thereto, he was an Equity Portfolio Manager at FAF.
Nuveen International Fund. Nuveen Asset Management allocates the management of the Fund’s assets among the Fund’s sub-advisers.
The following individuals are primarily responsible for the day-to-day management of the portion of the Fund managed by Altrinsic: John Hock, CFA, John L. DeVita, CFA and Rehan Chaudhri.
| | • | | Mr. Hock founded Altrinsic in 2000 and has been its Chief Investment Officer since inception. Prior to Altrinsic, Mr. Hock was a portfolio manager with Hansberger Global Investors. He began his global equity career in 1990. |
| | • | | Mr. DeVita, Principal, has been a portfolio manager of Altrinsic since its founding in 2000. Prior to Altrinsic, Mr. DeVita was an equity analyst with Arnhold & S. Bleichroeder Advisors and Société Générale Asset Management. He began his global equity career in 1991. |
82
Section 2 How We Manage Your Money
| | • | | Mr. Chaudhri, Principal, has been a portfolio manager of Altrinsic since 2003. Prior to Altrinsic, Mr. Chaudhri was a portfolio manager with Lazard Asset Management. He began his global equity career in 1993. |
The following individuals are primarily responsible for the day-to-day management of the portion of the Fund managed by Nuveen Asset Management: Keith B. Hembre, CFA, Walter A. French, David A. Friar, Derek B. Bloom, CFA, Tracy P. Stouffer, CFA, and Jay L. Rosenberg.
| | • | | Mr. Hembre has been a portfolio manager of the Fund since November 2008. Mr. Hembre entered the financial services industry in 1992 and joined FAF in 1997. He joined Nuveen Asset Management as a Managing Director, Chief Economist and Investment Strategist, and Head of Quantitative Strategies on January 1, 2011 in connection with the firm’s acquisition of a portion of FAF’s asset management business. Prior thereto, he was Chief Economist and Chief Investment Strategist at FAF. |
| | • | | Mr. French has been a portfolio manager of the Fund since November 2008. Information on Mr. French appears above under “Nuveen Equity Index Fund.” |
| | • | | Mr. Friar has been a portfolio manager of the Fund since February 2010. Information on Mr. Friar appears above under “Nuveen Equity Index Fund.” |
| | • | | Mr. Bloom has been a portfolio manager of the Fund since February 2010. He entered the financial services industry in 2002 and joined FAF in 2003. In 2006 he joined the team managing the international products. He joined Nuveen Asset Management as a Vice President on January 1, 2011 in connection with the firm’s acquisition of a portion of FAF’s asset management business. Prior thereto, he was a Senior Quantitative Analyst at FAF. |
| | • | | Ms. Stouffer has been a portfolio manager of the Fund since June 24, 2013. She joined Nuveen Asset Management on March 1, 2013, in connection with an internal reorganization of certain investment personnel and fund management responsibilities between Nuveen Asset Management and its affiliate, Santa Barbara Asset Management, LLC (“SBAM”). Prior thereto, she was an international portfolio manager for SBAM. She joined SBAM in 2008 from WayMark Capital, LLC, an investment management firm where she was a managing partner. Prior to that, she was an international portfolio manager at Dreyfus Founders Funds, Federated Global Investment Management, Clariden Asset Management and TIAA-CREF. |
| | • | | Jay L. Rosenberg entered the financial services industry in 1995 and joined FAF in 2005 as Equity Portfolio Manager. He joined Nuveen Asset Management as Managing Director and Portfolio Manager on January 1, 2011 in connection with the firm’s acquisition of a portion of FAF’s asset management business. |
Nuveen International Select Fund. Nuveen Asset Management allocates the Fund’s assets among the Fund’s sub-advisers.
The following individuals are primarily responsible for the day-to-day management of the portion of the Fund managed by Altrinsic: John Hock, CFA, John L. DeVita, CFA, and Rehan Chaudhri. Information on Mr. Hock, Mr. DeVita and Mr. Chaudhri appears above under “Nuveen International Fund.”
The following individuals are primarily responsible for the day-to-day management of the portion of the Fund managed by Lazard: James M. Donald and John R. Reinsberg.
Section 2 How We Manage Your Money
83
| | • | | Mr. Donald is a Managing Director and Head of the Emerging Markets Group at Lazard. He joined Lazard in 1996 and is a CFA Charterholder. Mr. Donald has been working in the investment industry for 21 years. |
| | • | | Mr. Reinsberg is a Deputy Chairman and Head of International and Global Products at Lazard. He also oversees the day-to-day operations of Lazard’s international equity investment team. He joined Lazard in 1992 and has 25 years investment experience. |
The following individuals are primarily responsible for the day-to-day management of the portion of the Fund managed by Nuveen Asset Management: Keith B. Hembre, CFA, Walter A. French, David A. Friar and Derek B. Bloom, CFA, Tracy P. Stouffer, CFA, and Jay L. Rosenberg.
| | • | | Mr. Hembre has been a portfolio manager of the Fund since December 2006. Information on Mr. Hembre appears above under “Nuveen International Fund.” |
| | • | | Mr. French has been a portfolio manager of the Fund since December 2006. Information on Mr. French appears above under “Nuveen Equity Index Fund.” |
| | • | | Mr. Friar has been a portfolio manager of the Fund since February 2010. Information on Mr. Friar appears above under “Nuveen Equity Index Fund.” |
| | • | | Mr. Bloom has been a portfolio manager of the Fund since February 2010. Information on Mr. Bloom appears above under “Nuveen International Fund.” |
| | • | | Ms. Stouffer has been a portfolio manager of the Fund since June 24, 2013. Information on Ms. Stouffer appears above under “Nuveen International Fund.” |
| | • | | Mr. Rosenberg has been a portfolio manager of the Fund since June 24, 2013. Information on Mr. Rosenberg appears above under “Nuveen International Fund.” |
Nuveen Large Cap Growth Opportunities Fund. Harold R. Goldstein has been a portfolio manager of the Fund since July 2002. Mr. Goldstein entered the financial services industry in 1982 and joined FAF in 2002. He joined Nuveen Asset Management as a Senior Vice President on January 1, 2011 in connection with the firm’s acquisition of a portion of FAF’s asset management business. Prior thereto, he was a Senior Equity Portfolio Manager at FAF.
Scott M. Mullinix, CFA, has been a portfolio manager of the Fund since April 2006. Mr. Mullinix entered the financial services industry in 1989 and joined FAF in 2006. He joined Nuveen Asset Management as a Senior Vice President on January 1, 2011 in connection with the firm’s acquisition of a portion of FAF’s asset management business. Prior thereto, he was a Senior Equity Portfolio Manager at FAF.
James A. Diedrich, CFA, has been a portfolio manager of the Fund since February 2006. Mr. Diedrich entered the financial services industry in 1984 and joined FAF in 2006. He joined Nuveen Asset Management as a Senior Vice President on January 1, 2011 in connection with the firm’s acquisition of a portion of FAF’s asset management business. Prior thereto, he was a Senior Equity Portfolio Manager at FAF.
Nuveen Large Cap Select Fund. David A. Chalupnik, CFA, has been a portfolio manager of the Fund since January 2003. Mr. Chalupnik entered the financial services industry in 1984 and joined FAF in 2002. He joined Nuveen Asset Management as a Managing Director and Head of Equities on
84
Section 2 How We Manage Your Money
January 1, 2011 in connection with the firm’s acquisition of a portion of FAF’s asset management business. Prior thereto, he was a Senior Managing Director and Head of Equities at FAF.
Anthony R. Burger, CFA, has been a portfolio manager of the Fund since October 2004. Mr. Burger entered the financial services industry in 1994 and joined FAF in 2003. He joined Nuveen Asset Management as a Senior Vice President on January 1, 2011 in connection with the firm’s acquisition of a portion of FAF’s asset management business. Prior thereto, he was Director of Quantitative Equity Research at FAF.
Nuveen Mid Cap Growth Opportunities Fund. James A. Diedrich has been a portfolio manager of the Fund since February 2006. Information on Mr. Diedrich appears above under “Nuveen Large Cap Growth Opportunities Fund.”
Harold R. Goldstein has been a portfolio manager of the Fund since September 2005. Information on Mr. Goldstein appears above under “Nuveen Large Cap Growth Opportunities Fund.”
Scott M. Mullinix has been a portfolio manager of the Fund since April 2006. Information on Mr. Mullinix appears above under “Nuveen Large Cap Growth Opportunities Fund.”
Nuveen Mid Cap Index Fund. Walter A. French has been a portfolio manager of the Fund since March 2001. Information on Mr. French appears above under “Nuveen Equity Index Fund.”
David A. Friar has been a portfolio of the Fund since March 2001. Information on Mr. Friar appears above under “Nuveen Equity Index Fund.”
Nuveen Mid Cap Select Fund. Anthony R. Burger has been a portfolio manager of the Fund since May 2005. Information on Mr. Burger appears above under “Nuveen Large Cap Select Fund.”
Scott M. Tonneson, CFA, has been a portfolio manager of the Fund since February 2012. Mr. Tonneson entered the financial services industry in 1994 and joined FAF in 2007. Prior to his current portfolio management role, he was a senior equity research analyst responsible for building quantitative models to deliver relevant data to the equity portfolio teams. He joined Nuveen Asset Management as a Vice President and Senior Research Analyst on January 1, 2011 in connection with the firm’s acquisition of a portion of FAF’s asset management business.
Nuveen Mid Cap Value Fund. David A. Chalupnik has been a portfolio manager of the Fund since April 2012. Information on Mr. Chalupnik appears above under “Nuveen Large Cap Select Fund.”
Karen L. Bowie, CFA, has been a portfolio manager of the Fund since April 2012. Ms. Bowie has been a portfolio manager on the team managing Small Cap Value since 2005. She entered the financial services industry when she joined FAF in 1984, and she rejoined FAF in 1999. She joined Nuveen Asset Management as a Senior Vice President on January 1, 2011 in connection with the firm’s acquisition of a portion of FAF’s asset management business. Prior thereto, she was an Equity Portfolio Manager at FAF.
Nuveen Quantitative Enhanced Core Equity Fund. Walter A. French has been a portfolio manager of the Fund since July 2007. Information on Mr. French appears above under “Nuveen Equity Index Fund.”
David R. Cline has been a portfolio manager of the Fund since July 2007. Mr. Cline entered the financial services industry when he joined FAF in 1989. He
Section 2 How We Manage Your Money
85
joined Nuveen Asset Management as a Vice President on January 1, 2011 in connection with the firm’s acquisition of a portion of FAF’s asset management business. Prior thereto, he was a Senior Equity Portfolio Manager at FAF.
David A. Friar has been a portfolio manager of the Fund since July 2007. Information on Mr. Friar appears above under “Nuveen Equity Index Fund.”
Keith B. Hembre has been a portfolio manager of the Fund since July 2007. Information on Mr. Hembre appears above under “Nuveen International Fund.”
Nuveen Small Cap Growth Opportunities Fund. Robert S. McDougall, CFA, has been a portfolio manager of the Fund since May 2004. He entered the financial services industry in 1988 and joined FAF in 2004. He joined Nuveen Asset Management as a Senior Vice President on January 1, 2011 in connection with the firm’s acquisition of a portion of FAF’s asset management business. Prior thereto, he was an Equity Portfolio Manager at FAF.
Jon A. Loth, CFA, has been a portfolio manager of the Fund since October 2007. He entered the financial services industry in 1994 and joined FAF in 2004. He joined Nuveen Asset Management as a Vice President on January 1, 2011 in connection with the firm’s acquisition of a portion of FAF’s asset management business. Prior thereto, he was an Equity Portfolio Manager at FAF.
Nuveen Small Cap Index Fund. Walter A. French has been a portfolio manager of the Fund since March 2001. Information on Mr. French appears above under “Nuveen Equity Index Fund.”
David A. Friar has been a portfolio manager of the Fund since March 2001. Information on Mr. Friar appears above under “Nuveen Equity Index Fund.”
Nuveen Small Cap Select Fund. Allen D. Steinkopf, CFA, has been a portfolio manager of the Fund since July 2004. He entered the financial services industry in 1993 and joined FAF in 2003. He joined Nuveen Asset Management as a Senior Vice President on January 1, 2011 in connection with the firm’s acquisition of a portion of FAF’s asset management business. Prior thereto, he was an Equity Portfolio Manager at FAF.
Mark A. Traster, CFA, has been a portfolio manager of the Fund since December 2008. He entered the financial services industry in 1992 and joined FAF in 2004. He joined Nuveen Asset Management as a Vice President on January 1, 2011 in connection with the firm’s acquisition of a portion of FAF’s asset management business. Prior thereto, he was an Equity Portfolio Manager at FAF.
Nuveen Small Cap Value Fund. Karen L. Bowie has been a portfolio manager of the Fund since July 2005. Information on Ms. Bowie appears above under “Nuveen Mid Cap Value Fund.”
Nuveen Tactical Market Opportunities Fund. David R. Cline has been a portfolio manager of the Fund since December 2009. Information on Mr. Cline appears above under “Nuveen Quantitative Enhanced Core Equity Fund.”
Walter A. French has been a portfolio manager of the Fund since December 2009. Information on Mr. French appears above under “Nuveen Equity Index Fund.”
86
Section 2 How We Manage Your Money
David A. Friar has been a portfolio manager of the Fund since December 2009. Information on Mr. Friar appears above under “Nuveen Equity Index Fund.”
Keith B. Hembre has been a portfolio manager of the Fund since December 2009. Information on Mr. Hembre appears above under “Nuveen International Fund.”
Derek B. Bloom has been a portfolio manager of the Fund since December 2009. Information on Mr. Bloom appears above under “Nuveen International Fund.”
Additional information about the portfolio managers’ compensation, other accounts managed by the portfolio managers and the portfolio managers’ ownership of securities in the Funds is provided in the statement of additional information.
Management Fees
The management fee schedule for each Fund consists of two components: a Fund-level fee, based only on the amount of assets within a Fund, and a complex-level fee, based on the aggregate amount of all eligible fund assets managed by Nuveen Fund Advisors.
The annual Fund-level fee, payable monthly, is based upon the average daily net assets of each Fund as follows:
| | | | | | | | | | | | | | | | | | | | | | | | | | | | | | | | |
| Average Daily Net Assets | | Nuveen
Dividend
Value
Fund | | | Nuveen Equity Index Fund | | | Nuveen Inter-
national Fund | | | Nuveen Inter- national Select Fund | | | Nuveen
Large
Cap
Growth
Oppor-
tunities
Fund | | | Nuveen
Large
Cap
Select
Fund | | | Nuveen
Mid
Cap
Growth
Oppor-
tunities
Fund | | | Nuveen Mid
Cap Index Fund | |
| For the first $125 million | | | 0.6000 | % | | | 0.1000 | % | | | 0.8500 | % | | | 0.8500 | % | | | 0.6500 | % | | | 0.5500 | % | | | 0.7000 | % | | | 0.1500 | % |
| For the next $125 million | | | 0.5875 | % | | | 0.0875 | % | | | 0.8375 | % | | | 0.8375 | % | | | 0.6375 | % | | | 0.5375 | % | | | 0.6875 | % | | | 0.1375 | % |
| For the next $250 million | | | 0.5750 | % | | | 0.0750 | % | | | 0.8250 | % | | | 0.8250 | % | | | 0.6250 | % | | | 0.5250 | % | | | 0.6750 | % | | | 0.1250 | % |
| For the next $500 million | | | 0.5625 | % | | | 0.0625 | % | | | 0.8125 | % | | | 0.8125 | % | | | 0.6125 | % | | | 0.5125 | % | | | 0.6625 | % | | | 0.1125 | % |
| For the next $1 billion | | | 0.5500 | % | | | 0.0500 | % | | | 0.8000 | % | | | 0.8000 | % | | | 0.6000 | % | | | 0.5000 | % | | | 0.6500 | % | | | 0.1000 | % |
| For net assets over $2 billion | | | 0.5250 | % | | | 0.0250 | % | | | 0.7750 | % | | | 0.7750 | % | | | 0.5750 | % | | | 0.4750 | % | | | 0.6250 | % | | | 0.0750 | % |
| | | | | | | | | | | | | | | | | | | | | | | | | | | | | | | | |
| Average Daily Net Assets | | Nuveen
Mid
Cap
Select
Fund | | | Nuveen
Mid
Cap
Value
Fund | | | Nuveen Quanti- tative Enhanced Core
Equity Fund | | | Nuveen
Small
Cap
Growth
Oppor-
tunities
Fund | | | Nuveen Small
Cap Index Fund | | | Nuveen
Small Cap
Select
Fund | | | Nuveen Small
Cap Value Fund | | | Nuveen
Tactical
Market
Oppor- tunities
Fund | |
| For the first $125 million | | | 0.7000 | % | | | 0.7000 | % | | | 0.3000 | % | | | 0.8000 | % | | | 0.1500 | % | | | 0.7000 | % | | | 0.7000 | % | | | 0.6000 | % |
| For the next $125 million | | | 0.6875 | % | | | 0.6875 | % | | | 0.2875 | % | | | 0.7875 | % | | | 0.1375 | % | | | 0.6875 | % | | | 0.6875 | % | | | 0.5875 | % |
| For the next $250 million | | | 0.6750 | % | | | 0.6750 | % | | | 0.2750 | % | | | 0.7750 | % | | | 0.1250 | % | | | 0.6750 | % | | | 0.6750 | % | | | 0.5750 | % |
| For the next $500 million | | | 0.6625 | % | | | 0.6625 | % | | | 0.2625 | % | | | 0.7625 | % | | | 0.1125 | % | | | 0.6625 | % | | | 0.6625 | % | | | 0.5625 | % |
| For the next1 $1 billion | | | 0.6500 | % | | | 0.6500 | % | | | 0.2500 | % | | | 0.7500 | % | | | 0.1000 | % | | | 0.6500 | % | | | 0.6500 | % | | | 0.5500 | % |
| For net assets over $2 billion | | | 0.6250 | % | | | 0.6250 | % | | | 0.2250 | % | | | 0.7250 | % | | | 0.0750 | % | | | 0.6250 | % | | | 0.6250 | % | | | 0.5250 | % |
Each Fund’s complex-level fee rate is determined by taking the current overall complex-level fee rate, which is based on the aggregate amount of the “eligible assets” of all Nuveen funds, and making, as appropriate, an upward adjustment to that rate based upon the percentage of the particular Fund’s assets that are not “eligible assets.” The maximum overall complex-level fee rate is 0.2000% of a Fund’s average daily net assets, which is based upon complex-level eligible assets of $55 billion, with the complex-level fee rate decreasing incrementally for eligible assets above that level.
Section 2 How We Manage Your Money
87
Fund-specific complex-level fee rates will not exceed the maximum overall complex-level fee rate of 0.2000%. As of December 31, 2012, the Funds’ complex-level fee rates were as follows:
| | | | |
| | | Complex-Level Fee Rate | |
| Nuveen Dividend Value Fund | | | 0.1885 | % |
| Nuveen Equity Index Fund | | | 0.1998 | % |
| Nuveen International Fund | | | 0.1998 | % |
| Nuveen International Select Fund | | | 0.1998 | % |
| Nuveen Large Cap Growth Opportunities Fund | | | 0.1965 | % |
| Nuveen Large Cap Select Fund | | | 0.1998 | % |
| Nuveen Mid Cap Growth Opportunities Fund | | | 0.1969 | % |
| Nuveen Mid Cap Index Fund | | | 0.1867 | % |
| Nuveen Mid Cap Select Fund | | | 0.1998 | % |
| Nuveen Mid Cap Value Fund | | | 0.1998 | % |
| Nuveen Quantitative Enhanced Core Equity Fund | | | 0.1998 | % |
| Nuveen Small Cap Growth Opportunities Fund | | | 0.1998 | % |
| Nuveen Small Cap Index Fund | | | 0.1929 | % |
| Nuveen Small Cap Select Fund | | | 0.1998 | % |
| Nuveen Small Cap Value Fund | | | 0.1998 | % |
| Nuveen Tactical Market Opportunities Fund | | | 0.1706 | % |
For the most recent fiscal year, each Fund paid Nuveen Fund Advisors the following management fees (net of fee waivers and expense reimbursements, where applicable) as a percentage of average daily net assets:
| | | | |
| | | Management Fee
as a % of Average
Daily Net Assets | |
| Nuveen Dividend Value Fund | | | 0.76 | % |
| Nuveen Equity Index Fund | | | 0.21 | % |
| Nuveen International Fund | | | 0.57 | % |
| Nuveen International Select Fund | | | 0.98 | % |
| Nuveen Large Cap Growth Opportunities Fund | | | 0.80 | % |
| Nuveen Large Cap Select Fund | | | 0.75 | % |
| Nuveen Mid Cap Growth Opportunities Fund | | | 0.84 | % |
| Nuveen Mid Cap Index Fund | | | 0.27 | % |
| Nuveen Mid Cap Select Fund | | | 0.41 | % |
| Nuveen Mid Cap Value Fund | | | 0.68 | % |
| Nuveen Quantitative Enhanced Core Equity Fund | | | 0.16 | % |
| Nuveen Small Cap Growth Opportunities Fund | | | 0.75 | % |
| Nuveen Small Cap Index Fund* | | | — | |
| Nuveen Small Cap Select Fund | | | 0.80 | % |
| Nuveen Small Cap Value Fund | | | 0.77 | % |
| Nuveen Tactical Market Opportunities Fund | | | 0.75 | % |
| | * | For the most recent fiscal year, Nuveen Fund Advisors reimbursed expenses in excess of management fees. |
Nuveen Fund Advisors has contractually agreed to waive fees and/or reimburse expenses through February 28, 2014 so that total annual fund operating expenses, after fee waivers and/or expense reimbursements and excluding acquired fund fees and expenses, for the following Funds do not exceed the percentages of the average daily net assets listed below of any class of Fund shares.
88
Section 2 How We Manage Your Money
| | | | | | | | | | | | | | | | | | | | |
| Fund | | Class A | | | Class B | | | Class C | | | Class R3 | | | Class I | |
| Nuveen Equity Index Fund | | | 0.62 | % | | | 1.37 | % | | | 1.37 | % | | | 0.87 | % | | | 0.37 | % |
| Nuveen International Fund | | | 1.49 | % | | | — | | | | 2.24 | % | | | 1.74 | % | | | 1.24 | % |
| Nuveen International Select Fund | | | 1.49 | % | | | — | | | | 2.24 | % | | | — | | | | 1.24 | % |
| Nuveen Mid Cap Index Fund | | | 0.75 | % | | | — | | | | 1.50 | % | | | 1.00 | % | | | 0.50 | % |
| Nuveen Mid Cap Select Fund | | | 1.41 | % | | | — | | | | 2.16 | % | | | — | | | | 1.16 | % |
| Nuveen Mid Cap Value Fund | | | 1.34 | % | | | 2.09 | % | | | 2.09 | % | | | 1.59 | % | | | 1.09 | % |
| Nuveen Quantitative Enhanced Core Equity Fund | | | 0.70 | % | | | — | | | | 1.45 | % | | | — | | | | 0.45 | % |
| Nuveen Small Cap Growth Opportunities Fund | | | 1.47 | % | | | 2.22 | % | | | 2.22 | % | | | 1.72 | % | | | 1.22 | % |
| Nuveen Small Cap Index Fund | | | 0.83 | % | | | — | | | | 1.58 | % | | | 1.08 | % | | | 0.58 | % |
| Nuveen Small Cap Value Fund | | | 1.50 | % | | | — | | | | 2.25 | % | | | 1.75 | % | | | 1.25 | % |
| Nuveen Tactical Market Opportunities Fund | | | 1.20 | % | | | — | | | | 1.95 | % | | | — | | | | 0.95 | % |
The expense limitations described above may be terminated or modified prior to that date only with the approval of the Board of Directors of the Funds.
Information regarding the Board of Directors’ approval of the investment management agreements is available in the Funds’ annual report for the fiscal year ended October 31, 2012.

The Funds’ investment objectives, which are described in the “Fund Summaries” section, may be changed without shareholder approval. If a Fund’s investment objective changes, you will be notified at least 60 days in advance. Nuveen Equity Index Fund has adopted a non-fundamental investment policy pursuant to Rule 35d-1 under the 1940 Act (a “Name Policy”) whereby the Fund, under normal market conditions, will invest at least 80% of its net assets (plus the amount of any borrowings for investment purposes) in equity securities. Nuveen Large Cap Growth Opportunities Fund and Nuveen Large Cap Select Fund have each adopted a Name Policy whereby a Fund, under normal market conditions, will invest at least 80% of its net assets (plus the amount of any borrowings for investment purposes) in common stocks of large-capitalization companies. Nuveen Mid Cap Growth Opportunities Fund, Nuveen Mid Cap Index Fund, Nuveen Mid Cap Select Fund and Nuveen Mid Cap Value Fund have each adopted a Name Policy whereby a Fund, under normal market conditions, will invest at least 80% of its net assets (plus the amount of any borrowings for investment purposes) in common stocks of mid-capitalization companies. Nuveen Quantitative Enhanced Core Equity Fund has adopted a Name Policy whereby the Fund, under normal market conditions, will invest at least 80% of its net assets (plus the amount of any borrowings for investment purposes) in equity securities. Nuveen Small Cap Growth Opportunities Fund, Nuveen Small Cap Index Fund, Nuveen Small Cap Select Fund and Nuveen Small Cap Value Fund have each adopted a Name Policy whereby a Fund, under normal market conditions, will invest at least 80% of its net assets (plus the amount of any borrowings for investment purposes) in common stocks of small-capitalization companies. As a result, each Fund must provide shareholders with a notice meeting the requirement of Rule 35d-1(c) at least 60 days prior to any change of their Fund’s Name Policy. The Funds’ investment policies may be changed by the Board of Directors without shareholder approval unless otherwise noted in this prospectus or the statement of additional information.
Section 2 How We Manage Your Money
89
The Funds’ principal investment strategies are discussed in the “Fund Summaries” section. These are the strategies that the Funds’ investment adviser and sub-adviser(s) believe are most likely to be important in trying to achieve the Funds’ investment objectives. This section provides more information about these strategies, as well as information about some additional strategies that the Funds’ sub-adviser(s) uses, or may use, to achieve the Funds’ objectives. You should be aware that each Fund may also use strategies and invest in securities that are not described in this prospectus, but that are described in the statement of additional information. For a copy of the statement of additional information, call Nuveen Investor Services at (800) 257-8787 or visit Nuveen’s website at www.nuveen.com.
Convertible Securities
Nuveen Dividend Value Fund may invest in convertible securities, which are hybrid securities that combine the investment characteristics of bonds and common stocks. Convertible securities typically consist of debt securities or preferred securities that may be converted within a specified period of time (typically for the entire life of the security) into a certain amount of common stock or other equity security of the same or a different issuer at a predetermined price. They also include debt securities with warrants or common stock attached and derivatives combining the features of debt securities and equity securities. Convertible securities entitle the holder to receive interest paid or accrued on debt securities, or dividends paid or accrued on preferred securities, until the securities mature or are redeemed, converted or exchanged.
Infrastructure Related Securities
For Nuveen International Fund and Nuveen International Select Fund, one of the Funds’ sub-advisers, Nuveen Asset Management, may invest up to 10% in each Fund’s total assets in equity securities issued by U.S. and non-U.S. infrastructure-related companies. Infrastructure related companies are defined as companies that own, develop, construct, finance, operate or invest in infrastructure assets. Infrastructure assets are the physical structures and networks upon which the operation, growth and development of a community depends, which includes water, sewer, and energy utilities; transportation and communication networks; health care facilities, government accommodations, and other public service facilities; and shipping, timber, steel, alternative energy, and other resources and services necessary for the construction and maintenance of these physical structures and networks.
Securities Lending
Each Fund, other than Nuveen Tactical Market Opportunities Fund, may lend securities representing up to one-third of the value of its total assets to broker-dealers, banks, and other institutions to generate additional income. When a Fund loans its portfolio securities, it will receive, at the inception of each loan, cash collateral equal to at least 102% of the value of the loaned securities. Under these Funds’ securities lending agreement, the securities lending agent will generally bear the risk that a borrower may default on its obligation to return loaned securities. The Funds, however, will be responsible for the risks associated with the investment of cash collateral. A Fund may lose money on its investment of cash collateral or may fail to earn sufficient income on its investment to meet its obligations to the borrower.
90
Section 2 How We Manage Your Money
When a dividend is paid on a security that is out on loan, the borrower receives the dividend and in turn makes a payment of the same amount to the Fund. Dividends, if they constitute “qualified dividends,” are taxable at the same rate as long-term capital gains. These payments made by borrowers, however, are not qualified dividends, and are taxable at higher ordinary income rates. As a result, some of the distributions received by shareholders who hold Fund shares in taxable accounts may be subject to taxation at a higher rate than if the Fund had not loaned its portfolio securities.
Temporary Investments
In an attempt to respond to adverse market, economic, political, or other conditions, each Fund may temporarily invest without limit in cash and in U.S. dollar-denominated high-quality money market instruments and other short-term securities, including money market funds. Being invested in these securities may keep a Fund from participating in a market upswing and prevent the Fund from achieving its investment objective.
Foreign Government Obligations
As a principal investment strategy, Nuveen Tactical Market Opportunities Fund may purchase foreign government obligations that are non-dollar denominated or dollar denominated. While the foreign government obligations that the Fund may purchase must have an investment grade rating from at least one rating agency, it is possible that such obligations will be issued by governments of emerging market countries. If the rating of a security is reduced below investment grade after purchase, the Fund is not required to sell the security, but may consider doing so.
ETFs and Money Market Funds
As a principal investment strategy, Nuveen International Fund, Nuveen International Select Fund, Nuveen Quantitative Enhanced Core Equity Fund and Nuveen Tactical Market Opportunities Fund may invest in securities of other open-end or closed-end investment companies, including exchange-traded funds (“ETFs”), that invest primarily in securities of the types in which the Funds may invest directly. An ETF is an investment company that holds a portfolio of securities generally designed to track the performance of a securities index, including industry, sector, country and region indexes. ETFs trade on a securities exchange and their shares may, at times, trade at a premium or discount to their net asset value. In addition, the Funds will incur brokerage costs when purchasing and selling shares of ETFs. The Funds will not invest in leveraged ETFs.
Generally, investments in ETFs are subject to statutory limitations prescribed by the 1940 Act. These limitations include a prohibition on a Fund acquiring more than 3% of the voting shares of any other investment company, and a prohibition on investing more than 5% of a Fund’s total assets in the securities of any one investment company or more than 10% of its total assets, in the aggregate, in investment company securities. Many ETFs, however, have obtained exemptive relief from the Securities and Exchange Commission (“SEC”) to permit unaffiliated funds to invest in the ETFs’ shares beyond these statutory limitations, subject to certain conditions and pursuant to a contractual arrangement between the ETFs and the investing Funds. Nuveen Tactical Market Opportunities Fund intends to rely on these exemptive orders in order to invest in unaffiliated ETFs beyond the foregoing statutory limitations. Subject to certain conditions, Nuveen
Section 2 How We Manage Your Money
91
Tactical Market Opportunities Fund also may invest in money market funds beyond the statutory limits described above.
Portfolio Holdings
A description of the Funds’ policies and procedures with respect to the disclosure of the Funds’ portfolio holdings is available in the Funds’ statement of additional information. Certain portfolio holdings information for each Fund is available on the Funds’ website—www.nuveen.com/mf—by navigating to your Fund using the “Mutual Fund Finder” and clicking on the “Holdings & Detail” tab. By following these links, you can obtain a list of your Fund’s top ten holdings as of the end of the most recent month. A complete list of portfolio holdings information is generally made available on the Funds’ website ten business days after the end of the month. This information will remain available on the website until the Funds file with the Securities and Exchange Commission their annual, semi-annual or quarterly holdings report for the fiscal period that includes the date(s) as of which the website information is current.

Risk is inherent in all investing. Investing in a mutual fund involves risk, including the risk that you may receive little or no return on your investment or even that you may lose part or all of your investment. Therefore, before investing you should consider carefully the principal risks and certain other risks that you assume when you invest in the Funds. These risks are listed alphabetically below. Because of these risks, you should consider an investment in the Funds to be a long-term investment.
Principal Risks
Commodities risk: Nuveen Tactical Market Opportunities Fund may invest in instruments providing exposure to commodities as a principal investment strategy. Commodities markets historically have been extremely volatile, and the performance of securities that provide an exposure to those markets therefore also may be highly volatile. Commodity prices are affected by factors such as the cost of producing commodities, changes in consumer demand for commodities, the hedging and trading strategies of producers and consumers of commodities, speculative trading in commodities by commodity pools and other market participants, disruptions in commodity supply, drought, floods, weather, livestock disease, embargoes, tariffs, and international economic, political, and regulatory developments. Suspensions or disruptions of market trading in the commodities markets and related futures markets may adversely affect the value of securities providing an exposure to the commodities markets.
Credit risk: Nuveen Dividend Value Fund and Nuveen Tactical Market Opportunities Fund are subject to the risk that the issuers of debt securities held by the Fund, or to which the Fund has exposure, may be unable or unwilling to make interest and principal payments on the securities and the related risk that the value of a debt security may decline because of concerns about the issuer’s ability or willingness to make such payments. There is also the risk that an issuer could suffer adverse changes in financial condition that could lower the credit quality of a security. This could lead to greater volatility in the price of the security and in shares of the Fund. Also, a change in the credit quality rating of a bond could affect the bond’s liquidity and make it more difficult for the Fund to sell. When the Fund purchases unrated
92
Section 2 How We Manage Your Money
securities, it will depend on the sub-adviser’s analysis of credit risk without the assessment of an independent rating organization, such as Moody’s or Standard & Poor’s.
Derivatives risk: The use of derivatives presents risks different from, and possibly greater than, the risks associated with investing directly in traditional securities or other instruments. Among the risks presented are market risk, credit risk, management risk and liquidity risk. Derivatives can be highly volatile, illiquid and difficult to value, and there is the risk that changes in the value of a derivative held by a Fund will not correlate with the underlying instruments or the Fund’s other investments.
The use of derivatives can lead to losses because of adverse movements in the price or value of the underlying asset, index or rate, which may be magnified by certain features of the derivatives. Derivative instruments also involve the risk that a loss may be sustained as a result of the failure of the counterparty to the derivative instruments to make required payments or otherwise comply with the derivative instruments’ terms. These risks are heightened when the management team uses derivatives to enhance a Fund’s return or as a substitute for a position or security, rather than solely to hedge (or offset) the risk of a position or security held by the Fund.
In addition, when a Fund invests in certain derivative securities, including, but not limited to, when-issued securities, forward commitments, futures contracts and interest rate swaps, it is effectively leveraging its investments, which could result in exaggerated changes in the net asset value of the Funds’ shares and can result in losses that exceed the amount originally invested. The success of a Fund’s derivatives strategies will depend on the sub-adviser’s ability to assess and predict the impact of market or economic developments on the underlying asset, index or rate and the derivative itself, without the benefit of observing the performance of the derivative under all possible market conditions. A Fund may also enter into over-the-counter (OTC) transactions in derivatives. Transactions in the OTC markets generally are conducted on a principal-to-principal basis. The terms and conditions of these instruments generally are not standardized and tend to be more specialized or complex, and the instruments may be harder to value. In general, there is less governmental regulation and supervision of transactions in the OTC markets than of transactions entered into on organized exchanges. In addition, certain derivative instruments and markets may not be liquid, which means the Fund may not be able to close out a derivatives transaction in a cost-efficient manner.
The Funds may take short positions in derivatives which may involve greater risks than long positions, as the risk of loss on short positions is theoretically unlimited (unlike a long position, in which the risk of loss may be limited to the amount invested).
In particular, swap agreements are subject to the risk that the counterparty to the swap will default on its obligation to pay the Fund and the risk that the Fund will not be able to meet its obligations to pay the counterparty to the swap. Swap agreements may also involve fees, commissions or other costs that may reduce the Fund’s gains from a swap agreement or may cause the Fund to lose money. Some of the risks associated with the use of futures contracts are the imperfect correlation between the change in market value of the instruments held by a Fund and the price of the futures contract, liquidity risks, and losses caused by unanticipated market movements.
Section 2 How We Manage Your Money
93
Recent legislation requires the development of a new regulatory framework for the derivatives market. The impact of the new regulations is still unknown, but has the potential to increase the costs of using derivatives, may limit the availability of some forms of derivatives or a Fund’s ability to use derivatives, and may adversely affect the performance of some derivative instruments used by a Fund as well as the Fund’s ability to pursue its investment objectives through the use of such instruments.
Equity security risk: Equity securities may decline significantly in price over short or extended periods of time. Price changes may occur in the market as a whole, or they may occur in only a particular country, company, industry, or sector of the market. In addition, the types of securities in which a particular Fund invests, such as value stocks, growth stocks, large-capitalization stocks, mid-capitalization stocks, small-capitalization stocks and/or micro-capitalization stocks, may underperform the market as a whole.
ETF risk: As a principal investment strategy, Nuveen Tactical Market Opportunities Fund may invest in ETFs. Like any fund, an ETF is subject to the risks of the underlying securities that it holds. In addition, investments in ETFs present certain risks that do not apply to investments in traditional mutual funds. For index-based ETFs, while such ETFs seek to achieve the same returns as a particular market index, the performance of an ETF may diverge from the performance of such index (commonly known as tracking error). ETFs are subject to fees and expenses (like management fees and operating expenses) and the Fund will indirectly bear its proportionate share of any such fees and expenses paid by the ETFs in which it invests. Moreover, ETF shares may trade at a premium or discount to their net asset value. As ETFs trade on an exchange, they are subject to the risks of any exchange-traded instrument, including: (i) an active trading market for its shares may not develop or be maintained, (ii) trading of its shares may be halted by the exchange, and (iii) its shares may be delisted from the exchange.
Failure to match index performance: The ability of Nuveen Equity Index Fund, Nuveen Mid Cap Index Fund and Nuveen Small Cap Index Fund to replicate the performance of their respective indices may be affected by, among other things, changes in securities markets, the manner in which performance of the index is calculated, changes in the composition of the index, the amount and timing of cash flows into and out of the Fund, commissions, sales charges (if any), and other expenses.
Frequent trading risk: Frequent trading of a Fund’s portfolio securities may produce capital gains, which are taxable to shareholders when distributed. Frequent trading may also increase the amount of commissions or mark-ups to broker-dealers that a Fund pays when it buys and sells securities, which may detract from the Fund’s performance.
Futures contract risk: The use of futures contracts involves additional risks and transaction costs which could leave a Fund in a worse position than if it had not used these instruments. Futures contracts may entail investment exposures that are greater than their cost would suggest. As a result, a small investment in futures contracts could have a large impact on performance.
High yield securities risk: Nuveen Dividend Value Fund and Nuveen Tactical Market Opportunities Fund may invest in high yield securities, which involve more risk than investment grade securities. High yield securities usually offer higher yields than investment grade securities, but also involve more risk. High yield securities may be more susceptible to real or perceived adverse
94
Section 2 How We Manage Your Money
economic conditions than investment grade securities, and they generally have more volatile prices and carry more risk to principal. In addition, liquidity risk is greater for high yield securities than for investment grade securities.
Infrastructure sector risk: Because Nuveen International Fund and Nuveen International Select Fund may invest in infrastructure-related securities, the Funds could have greater exposure to adverse economic, regulatory, political, legal, and other changes affecting the issuers of such securities. Infrastructure-related businesses are subject to a variety of factors that may adversely affect their business or operations, including high interest costs in connection with capital construction programs, costs associated with environmental and other regulations, the effects of economic slowdown and surplus capacity, increased competition from other providers of services, uncertainties concerning the availability of fuel at reasonable prices, the effects of energy conservation policies and other factors. Additionally, infrastructure-related entities may be subject to regulation by various governmental authorities and may also be affected by governmental regulation of rates charged to customers, service interruption and/or legal challenges due to environmental, operational or other mishaps and the imposition of special tariffs and changes in tax laws, regulatory policies and accounting standards. There is also the risk that corruption may negatively affect publicly-funded infrastructure projects, especially in emerging markets, resulting in delays and cost overruns.
Interest rate risk: Nuveen Dividend Value Fund and Nuveen Tactical Market Opportunities Fund may invest in or have exposure to debt securities as a principal investment strategy. Debt securities in the Funds will fluctuate in value with changes in interest rates. In general, debt securities will increase in value when interest rates fall and decrease in value when interest rates rise. Longer-term debt securities are generally more sensitive to interest rate changes.
Investment focus risk: Different types of stocks tend to shift in and out of favor depending on market and economic conditions. Funds that emphasize a growth style of investing often seek companies experiencing high rates of current growth; such companies may be more volatile than other types of investments. Funds that emphasize a value style of investing often seek undervalued companies with characteristics for improved valuations; such companies are subject to the risk that the valuations never improve. Certain Funds invest in companies with new, limited or cyclical product lines, services, markets, distribution channels or financial resources, or companies where the management of such companies may be dependent upon one or a few key people, or companies conducting initial public offerings or other major corporate events such as acquisitions, mergers, or liquidations; such companies can be subject to more abrupt or erratic market movements than stocks of larger, more established companies or the stock markets in general.
Investment strategy risk: Nuveen Quantitative Enhanced Core Equity Fund is managed using a proprietary quantitative process. There can be no assurance that this quantitative process will perform as anticipated or enable the Fund to achieve its objective.
Mid-cap stock risk: While stocks of mid-cap companies may be slightly less volatile than those of small-cap companies, they still involve substantial risk. Mid-cap companies may have limited product lines, markets or financial resources, and they may be dependent on a limited management group.
Section 2 How We Manage Your Money
95
Stocks of mid-cap companies may be subject to more abrupt or erratic market movements than those of larger, more established companies or the market averages in general.
Multi-manager risk: Because each sub-adviser of Nuveen International Fund and Nuveen International Select Fund makes investment decisions independently, it is possible that the security selection process of the sub-advisers may not complement one another. As a result, each Fund’s exposure to a given security, industry, sector or market capitalization could be smaller or larger than would be the case if the Fund was managed by a single sub-adviser. It is possible that one or more of the sub-advisers may, at any time, take positions that may be opposite of positions taken by other sub-advisers. In such cases, the Funds will incur brokerage and other transaction costs, without accomplishing any net investment results. Sub-advisers also may be competing with one another for similar positions at the same time, which could have the result of increasing a security’s cost. The multi-manager approach could increase each Fund’s portfolio turnover rates which may result in higher levels of realized capital gains or losses with respect to each Fund’s portfolio securities, and higher brokerage commissions and other transaction costs. The sub-advisers selected may underperform the market generally or other sub-advisers that could have been selected for the Funds.
Non-U.S./emerging markets risk: Nuveen International Fund and Nuveen International Select Fund invest primarily in equity securities that trade in markets other than the United States. As a principal investment strategy, Nuveen Tactical Market Opportunities Fund may invest in or have exposure to equity and debt securities that were issued or trade outside the United States. Each other Fund, other than Nuveen Equity Index Fund, Nuveen Mid Cap Index Fund, Nuveen Small Cap Index Fund and Nuveen Quantitative Enhanced Core Equity Fund, may also invest in equity securities that trade in markets other than the United States as a principal investment strategy. Non-U.S. issuers or U.S. issuers with significant non-U.S. operations may be subject to risks in addition to those of issuers located in or that principally operate in the United States due to political, social and economic developments abroad, different regulatory environments and laws, potential seizure by the government of company assets, higher taxation, withholding taxes on dividends and interest and limitations on the use or transfer of portfolio assets. To the extent a Fund is allowed to invest in depositary receipts, the Fund will be subject to many of the same risks as when investing directly in non-U.S. securities. The holder of an unsponsored depositary receipt may have limited voting rights and may not receive as much information about the issuer of the underlying securities as would the holder of a sponsored depositary receipt.
Other non-U.S. investment risks include the following:
| | • | | Enforcing legal rights may be difficult, costly and slow in non-U.S. countries, and there may be special problems enforcing claims against non-U.S. governments. |
| | • | | Non-U.S. companies may not be subject to accounting standards or governmental supervision comparable to U.S. companies, and there may be less public information about their operations. |
| | • | | Non-U.S. markets may be less liquid and more volatile than U.S. markets. |
| | • | | The U.S. and non-U.S. markets often rise and fall at different times or by different amounts due to economic or other developments particular to |
96
Section 2 How We Manage Your Money
| | a given country or region. This phenomenon would tend to lower the overall price volatility of a portfolio that included both U.S. and non-U.S. securities. Sometimes, however, global trends will cause the U.S. and non-U.S. markets to move in the same direction, reducing or eliminating the risk reduction benefit of international investing. |
| | • | | Because the non-U.S. securities in which a Fund invests, with the exception of American Depositary Receipts, generally trade in currencies other than the U.S. dollar, changes in currency exchange rates will affect the Fund’s net asset value, the value of dividends and interest earned, and gains and losses realized on the sale of securities. A strong U.S. dollar relative to these other currencies will adversely affect the value of the Fund. |
| | • | | Securities of companies traded in many countries outside the United States, particularly emerging markets countries, may be subject to further risks due to the inexperience of local investment professionals and financial institutions, the possibility of permanent or temporary termination of trading, and greater spreads between bid and asked prices for securities. In addition, non-U.S. exchanges and investment professionals are subject to less governmental regulation, and commissions may be higher than in the United States. Also, there may be delays in the settlement of non-U.S. exchange transactions. |
| | • | | A Fund’s income from non-U.S. issuers may be subject to non-U.S. withholding taxes. In some countries, the Fund also may be subject to taxes on trading profits and, on certain securities transactions, transfer or stamp duties tax. To the extent non-U.S. income taxes are paid by the Fund, U.S. shareholders may be entitled to a credit or deduction for U.S. tax purposes. |
| | • | | Some countries, particularly emerging markets, restrict to varying degrees foreign investment in their securities markets. In some circumstances, these restrictions may limit or preclude investment in certain countries or may increase the cost of investing in securities of particular companies. |
| | • | | Emerging markets generally do not have the level of market efficiency and strict standards in accounting and securities regulation to be on par with advanced economies. Investments in emerging markets come with much greater risk due to political instability, domestic infrastructure problems, currency volatility and limited equity opportunities (many large companies may still be “state-run” or private). Also, local exchanges may not offer liquid markets for outside investors. |
Other investment companies: Nuveen International Fund, Nuveen International Select Fund, Nuveen Quantitative Enhanced Core Equity Fund and Nuveen Tactical Market Opportunities Fund may invest in other investment companies as a principal investment strategy. When a Fund invests in other investment companies, you bear both your proportionate share of Fund expenses and, indirectly, the expenses of the other investment companies.
Small-cap stock risk: As a principal investment strategy, Nuveen Small Cap Growth Opportunities Fund, Nuveen Small Cap Index Fund, Nuveen Small Cap Select Fund and Nuveen Small Cap Value Fund invest in small-cap stocks, which involve substantial risk. Stocks of small-cap companies involve substantial risk. These companies may lack the management expertise, financial resources, product diversification, and competitive strengths of
Section 2 How We Manage Your Money
97
larger companies. Prices of small-cap stocks may be subject to more abrupt or erratic movements than stock prices of larger, more established companies or the market averages in general. In addition, the frequency and volume of their trading may be less than is typical of larger companies, making them subject to wider price fluctuations. In some cases, there could be difficulties in selling the stocks of small-cap companies at the desired time and price. Stocks at the bottom end of the capitalization range of small-cap companies sometimes are referred to as “micro-cap” stocks. These stocks may be subject to extreme price volatility, as well as limited liquidity and limited research.
Smaller company risk: Prices of small-cap stocks may be subject to more abrupt or erratic movements, and to wider fluctuations, than stock prices of larger, more established companies or the market averages in general. It may be difficult to sell small-cap stocks at the desired time and price. While mid-cap stocks may be slightly less volatile than small-cap stocks, they still involve similar risks. As a principal investment strategy, Nuveen Mid Cap Growth Opportunities Fund, Nuveen Mid Cap Index Fund, Nuveen Mid Cap Select Fund, and Nuveen Mid Cap Value Fund invest in mid-cap stocks.
Other Risks
Inflation risk: The value of assets or income from investments may be less in the future as inflation decreases the value of money. As inflation increases, the value of a Fund’s assets can decline, as can the value of a Fund’s distributions.
Small fund risk: Nuveen Large Cap Select Fund and Nuveen Mid Cap Select Fund have less assets than similar funds, and like other relatively small funds, large inflows and outflows may impact a Fund’s market exposure for limited periods of time, causing the Fund’s performance to vary from that of the Fund’s model portfolio. This impact may be positive or negative, depending on the direction of market movement during the period affected. The Funds have policies in place which seek to reduce the impact of these flows where Nuveen Fund Advisors has prior knowledge of them.
98
Section 2 How We Manage Your Money
Section 3 How You Can Buy and Sell Shares
The Funds offer multiple classes of shares, each with a different combination of sales charges, fees, eligibility requirements and other features. Your financial advisor can help you determine which class is best for you. For further details, please see the statement of additional information.

Class A Shares
Nuveen Equity Index Fund, Nuveen Mid Cap Index Fund, Nuveen Small Cap Index Fund and Nuveen Quantitative Enhanced Core Equity Fund only issue Class A shares for purchase by certain retirement plans and by qualifying clients of investment advisers, financial planners or other financial intermediaries that charge periodic or asset-based fees for their service. Class A shares are offered to these investors at their net asset value per share with no up-front sales charge.
For all other Funds, you can purchase Class A shares at the offering price, which is the net asset value per share plus an up-front sales charge. You may qualify for a reduced sales charge, or the sales charge may be waived, as described in “How to Reduce Your Sales Charge.” Class A shares are also subject to an annual service fee of 0.25% of your Fund’s average daily net assets, which compensates your financial advisor or other financial intermediary for providing ongoing service to you. Nuveen Securities, LLC (the “Distributor”), a subsidiary of Nuveen Investments and the distributor of the Funds, retains the up-front sales charge and the service fee on accounts with no financial intermediary of record. The up-front Class A sales charges for the Funds are as follows:
| | | | | | | | | | | | |
| Amount of Purchase | | Sales Charge as %
of Public Offering Price | | | Sales Charge as %
of Net Amount Invested | | | Maximum Financial Intermediary Commission as % of Public Offering Price | |
| Less than $50,000 | | | 5.75 | % | | | 6.10 | % | | | 5.00 | % |
| $50,000 but less than $100,000 | | | 4.50 | | | | 4.71 | | | | 4.00 | |
| $100,000 but less than $250,000 | | | 3.75 | | | | 3.90 | | | | 3.25 | |
| $250,000 but less than $500,000 | | | 2.75 | | | | 2.83 | | | | 2.50 | |
| $500,000 but less than $1,000,000 | | | 2.00 | | | | 2.04 | | | | 1.75 | |
| $1,000,000 and over* | | | — | | | | — | | | | 1.00 | |
| | * | You can purchase $1 million or more of Class A shares at net asset value without an up-front sales charge. The Distributor pays financial intermediaries of record a commission equal to 1% of the first $2.5 million, plus 0.75% of the next $2.5 million, plus 0.50% of the amount over $5 million. Unless you are eligible for a waiver, you may be assessed a contingent deferred sales charge (“CDSC”) of 1% if you redeem any of your shares within 12 months of purchase. See “How to Sell Shares—Contingent Deferred Sales Charge” below for more information. |
Class B Shares
Nuveen International Fund, Nuveen International Select Fund, Nuveen Large Cap Select Fund, Nuveen Mid Cap Index Fund, Nuveen Mid Cap Select Fund, Nuveen Quantitative Enhanced Core Equity Fund, Nuveen Small Cap Index Fund, Nuveen Small Cap Value Fund and Nuveen Tactical Market Opportunities Fund do not issue Class B shares. The remaining Funds will issue Class B shares upon the exchange of Class B shares from another Nuveen Mutual Fund or for purposes of dividend reinvestment, but Class B shares are not available for new accounts or for additional investment into existing accounts.
Section 3 How You Can Buy and Sell Shares
99
Class B shares are subject to annual distribution and service fees of 1% of your Fund’s average daily net assets. The annual 0.25% service fee compensates your financial advisor or other financial intermediary for providing ongoing service to you. The annual 0.75% distribution fee compensates the Distributor for paying your financial advisor or other financial intermediary a 4.25% up-front sales commission, which includes an advance of the first year’s service fee. The Distributor retains the service and distribution fees on accounts with no financial intermediary of record. If you redeem your shares within six years of purchase, you will normally pay a CDSC as shown in the schedule below. The CDSC is based on your purchase price or redemption proceeds, whichever is lower. You do not pay a CDSC on any Class B shares you purchase by reinvesting dividends.
| | | | | | | | | | | | | | | | | | | | | | | | | | | | |
| Years Since Purchase | | 0-1 | | | 1-2 | | | 2-3 | | | 3-4 | | | 4-5 | | | 5-6 | | | Over 6 | |
| CDSC | | | 5 | % | | | 5 | % | | | 4 | % | | | 3 | % | | | 2 | % | | | 1 | % | | | None | |
Class B shares automatically convert to Class A shares eight years after you buy them so that the distribution fees you pay over the life of your investment are limited. You will continue to pay an annual service fee on any converted Class B shares.
Class C Shares
You can purchase Class C shares at the offering price, which is the net asset value per share without any up-front sales charge. Class C shares are subject to annual distribution and service fees of 1% of your Fund’s average daily net assets. The annual 0.25% service fee compensates your financial advisor or other financial intermediary for providing ongoing service to you. The annual 0.75% distribution fee compensates the Distributor for paying your financial advisor or other financial intermediary an ongoing sales commission as well as an advance of the first year’s service and distribution fees. The Distributor retains the service and distribution fees on accounts with no financial intermediary of record. If you redeem your shares within 12 months of purchase, you will normally pay a 1% CDSC, which is calculated on the lower of your purchase price or redemption proceeds. You do not pay a CDSC on any Class C shares you purchase by reinvesting dividends.
The Funds have established a limit to the amount of Class C shares that may be purchased by an individual investor. See the statement of additional information for more information.
Class R3 Shares
Nuveen International Select Fund, Nuveen Large Cap Select Fund, Nuveen Mid Cap Select Fund, Nuveen Quantitative Enhanced Core Equity Fund and Nuveen Tactical Market Opportunities Fund do not issue Class R3 shares. You can purchase Class R3 shares of the remaining Funds at the offering price, which is the net asset value per share without any up-front sales charge. Class R3 shares are subject to annual distribution and service fees of 0.50% of your Fund’s average daily net assets. Class R3 shares are only available for purchase by eligible retirement plans. Class R3 shares are not available to traditional and Roth IRAs, Coverdell Education Savings Accounts, SEPs, SAR-SEPs, SIMPLE IRAs or individual 403(b) plans. See the statement of additional information for more information.
Class R6 Shares
Nuveen Dividend Value Fund, Nuveen Large Cap Growth Opportunities Fund and Nuveen Mid Cap Growth Opportunities Fund issue Class R6
100
Section 3 How You Can Buy and Sell Shares
shares. Class R6 shares are available to certain qualified retirement plans and other investors as set forth in the statement of additional information. There is no minimum initial investment for qualified retirement plans; however, the shares must be held through plan-level or omnibus accounts held on the books of the Funds. All other eligible investors must meet a minimum initial investment of at least $5 million in each Fund in which they invest. Class R6 shares are only available through financial intermediaries that have entered into an agreement with the Distributor to offer Class R6 shares. Class R6 shares are only available in cases where neither the investor nor the intermediary will receive any commission payments, account servicing fees, record keeping fees, 12b-1 fees, sub-transfer agent fees, so called “finder’s fees,” administration fees or similar fees with respect to Class R6 shares. Class R6 shares are not available directly to traditional or Roth IRAs, Coverdell Savings Accounts, Keoghs, SEPs, SARSEPs, or SIMPLE IRAs. Class R6 shares also are not available through retail, advisory fee-based wrap platforms.
Class I Shares
You can purchase Class I shares at the offering price, which is the net asset value per share without any up-front sales charge. As Class I shares are not subject to sales charges or ongoing service or distribution fees, they have lower ongoing expenses than the other classes.
Class I shares are available for purchase by clients of financial intermediaries who charge such clients an ongoing fee for advisory, investment, consulting or related services. Such clients may include individuals, corporations, endowments and foundations. The minimum initial investment for such clients is $100,000, but this minimum will be lowered to $250 for clients of financial intermediaries that have accounts holding Class I shares with an aggregate value of at least $100,000. The Distributor may also lower the minimum to $250 for clients of financial intermediaries anticipated to reach this Class I share holdings level.
Class I shares are also available for purchase by family offices and their clients. A family office is a company that provides certain financial and other services to a high net worth family or families. The minimum initial investment for family offices and their clients is $100,000, but this minimum will be lowered to $250 for clients of family offices that have accounts holding Class I shares with an aggregate value of at least $100,000. The Distributor may also lower the minimum to $250 for clients of family offices anticipated to reach this Class I share holdings level.
Class I shares are also available for purchase, with no minimum initial investment, by the following categories of investors:
| | • | | Certain employer-sponsored retirement plans. |
| | • | | Certain bank or broker-affiliated trust departments. |
| | • | | Advisory accounts of Nuveen Fund Advisors and its affiliates. |
| | • | | Current and former trustees/directors of any Nuveen Fund, and their immediate family members (as defined in the statement of additional information). |
| | • | | Officers, directors and former directors of Nuveen Investments and its affiliates, and their immediate family members. |
| | • | | Full-time and retired employees of Nuveen Investments and its affiliates, and their immediate family members. |
| | • | | Certain financial intermediary personnel, and their immediate family members. |
Section 3 How You Can Buy and Sell Shares
101
| | • | | Certain other institutional investors described in the statement of additional information. |
Please refer to the statement of additional information for more information about Class A, Class B, Class C, Class R3, Class R6 and Class I shares, including more detailed program descriptions and eligibility requirements. Additional information is also available from your financial advisor, who can also help you prepare any necessary application forms.

The Funds offer a number of ways to reduce or eliminate the up-front sales charge on Class A shares. See “What Share Classes We Offer” (above) for a discussion of eligibility requirements for purchasing Class I shares.
Class A Sales Charge Reductions
| | • | | Rights of Accumulation. In calculating the appropriate sales charge on a purchase of Class A shares of a Fund, you may be able to add the amount of your purchase to the value, based on the current net asset value per share, of all of your prior purchases of any Nuveen Mutual Fund. |
| | • | | Letter of Intent. Subject to certain requirements, you may purchase Class A shares of a Fund at the sales charge rate applicable to the total amount of the purchases you intend to make over a 13-month period. |
For purposes of calculating the appropriate sales charge as described under Rights of Accumulation and Letter of Intent above, you may include purchases by (i) you, (ii) your spouse or domestic partner and children under the age of 21 years, and (iii) a corporation, partnership or sole proprietorship that is 100% owned by any of the persons in (i) or (ii). In addition, a trustee or other fiduciary can count all shares purchased for a single trust, estate or other single fiduciary account that has multiple accounts (including one or more employee benefit plans of the same employer).
Class A Sales Charge Waivers
Class A shares of a Fund may be purchased at net asset value without a sales charge as follows:
| | • | | Purchases of $1,000,000 or more. |
| | • | | Monies representing reinvestment of Nuveen Mutual Fund distributions. |
| | • | | Certain employer-sponsored retirement plans. |
| | • | | Employees of Nuveen Investments and its affiliates. Purchases by full-time and retired employees of Nuveen Investments and its affiliates and such employees’ immediate family members (as defined in the statement of additional information). |
| | • | | Current and former trustees/directors of the Nuveen Funds. |
| | • | | Financial intermediary personnel. Purchases by any person who, for at least the last 90 days, has been an officer, director, or employee of any financial intermediary or any such person’s immediate family member. |
| | • | | Certain trust departments. Purchases by bank or broker-affiliated trust departments investing funds over which they exercise exclusive discretionary investment authority and that are held in a fiduciary, agency, advisory, custodial or similar capacity. |
| | • | | Additional categories of investors. Purchases made (i) by investors purchasing on a periodic fee, asset-based fee or no transaction fee basis through a broker-dealer sponsored mutual fund purchase program; |
102
Section 3 How You Can Buy and Sell Shares
| | (ii) by clients of investment advisers, financial planners or other financial intermediaries that charge periodic or asset-based fees for their services; and (iii) through a financial intermediary that has entered into an agreement with the Distributor to offer the Funds’ shares to self-directed investment brokerage accounts and that may or may not charge a transaction fee to its customers. |
In order to obtain a sales charge reduction or waiver, it may be necessary at the time of purchase for you to inform the Funds or your financial advisor of the existence of other accounts in which there are holdings eligible to be aggregated for such purposes. You may need to provide the Funds or your financial advisor information or records, such as account statements, in order to verify your eligibility for a sales charge reduction or waiver. This may include account statements of family members and information regarding Nuveen Mutual Fund shares held in accounts with other financial advisors. You or your financial advisor must notify the Distributor at the time of each purchase if you are eligible for any of these programs. The Funds may modify or discontinue these programs at any time.

Fund shares may be purchased on any business day, which is any day the New York Stock Exchange (the “NYSE”) is open for business. Generally, the NYSE is closed on weekends and national holidays. The share price you pay depends on when the Distributor receives your order and on the share class you are purchasing. Orders received before the close of trading on a business day (normally, 4:00 p.m. New York time) will receive that day’s closing share price; otherwise, you will receive the next business day’s price.
You may purchase Fund shares (1) through a financial advisor or (2) directly from the Funds.
Through a Financial Advisor
You may buy shares through your financial advisor, who can handle all the details for you, including opening a new account. Financial advisors can also help you review your financial needs and formulate long-term investment goals and objectives. In addition, financial advisors generally can help you develop a customized financial plan, select investments and monitor and review your portfolio on an ongoing basis to help assure your investments continue to meet your needs as circumstances change. Financial advisors (including brokers or agents) are paid for providing ongoing investment advice and services, either from Fund sales charges and fees or by charging you a separate fee in lieu of a sales charge.
Financial advisors or other dealer firms may charge their customers a processing or service fee in connection with the purchase or redemption of Fund shares. The amount and applicability of such a fee is determined and disclosed to customers by each individual dealer. Processing or service fees typically are fixed, nominal dollar amounts and are in addition to the sales and other charges described in this prospectus and the statement of additional information. Your dealer will provide you with specific information about any processing or service fees you will be charged. Shares you purchase through your financial advisor or other intermediary will normally be held with that firm. For more information, please contact your financial advisor.
Section 3 How You Can Buy and Sell Shares
103
Directly from the Funds
Eligible investors may purchase shares directly from the Funds.
| | • | | By wire. You can purchase shares by making a wire transfer from your bank. Before making an initial investment by wire, you must submit a new account form to a Fund. After receiving your form, a service representative will contact you with your account number and wiring instructions. Your order will be priced at the next closing share price based on the share class of your Fund, calculated after your Fund’s custodian receives your payment by wire. Wired funds must be received prior to 4:00 p.m. New York time to be eligible for same day pricing. Neither your Fund nor the transfer agent is responsible for the consequences of delays resulting from the banking or Federal Reserve wire system, or from incomplete wiring instructions. Before making any additional purchases by wire, you should call Nuveen Investor Services at (800) 257-8787. You cannot purchase shares by wire on days when federally chartered banks are closed. |
| | • | | By mail. You may open an account directly with the Funds and buy shares by completing an application and mailing it along with your check to: Nuveen Investor Services, P.O. Box 8530, Boston, Massachusetts 02266-8530. Applications may be obtained at www.nuveen.com or by calling (800) 257-8787. No third party checks will be accepted. |
The Funds do not consider the U.S. Postal Service or other independent delivery services to be their agents. Therefore, deposit in the mail or with such services, or receipt at the post office box above, of purchase orders or redemption requests does not constitute receipt by the transfer agent of the Funds.
| | • | | On-line. Existing shareholders with direct accounts may process certain account transactions on-line. You may purchase additional shares or exchange shares between existing, identically registered direct accounts. You can also look up your account balance, history and dividend information, as well as order duplicate account statements and tax forms from the Funds’ website. To access your account, click the “Individual Investors” link on www.nuveen.com and then choose “Account Access” under the “Resources” tab. The system will walk you through the log-in process. To purchase shares on-line, you must have established Fund Direct privileges on your account prior to the requested transaction. See “Special Services—Fund Direct” below. |
| | • | | By telephone. Existing shareholders with direct accounts may also process account transactions via the Funds’ automated information line. Simply call (800) 257-8787, press 1 for mutual funds and the voice menu will walk you through the process. To purchase shares by telephone, you must have established Fund Direct privileges on your account prior to the requested transaction. See “Special Services—Fund Direct” below. |

To help make your investing with us easy and efficient, we offer you the following services at no extra cost. Your financial advisor can help you complete the forms for these services, or you can call Nuveen Investor Services at (800) 257-8787 for copies of the necessary forms.
104
Section 3 How You Can Buy and Sell Shares
Systematic Investing
Once you have opened an account satisfying the applicable investment minimum, systematic investing allows you to make regular additional investments through automatic deductions from your bank account, directly from your paycheck or from exchanging shares from another mutual fund account. The minimum automatic deduction is $100 per month. There is no charge to participate in your Fund’s systematic investment plan. You can stop the deductions at any time by notifying your Fund in writing.
| | • | | From your bank account. You can make systematic investments of $100 or more per month by authorizing your Fund to draw pre-authorized checks on your bank account. |
| | • | | From your paycheck. With your employer’s consent, you can make systematic investments each pay period (collectively meeting the monthly minimum of $100) by authorizing your employer to deduct monies from your paycheck. |
| | • | | Systematic exchanging. You can make systematic investments by authorizing the Distributor to exchange shares from one Nuveen Mutual Fund account into another identically registered Nuveen Mutual Fund account of the same share class. |
Systematic Withdrawal
If the value of your Fund account is at least $10,000, you may request to have $50 or more withdrawn automatically from your account. You may elect to receive payments monthly, quarterly, semi-annually or annually, and may choose to receive a check, have the monies transferred directly into your bank account (see “Fund Direct” below), paid to a third party or sent payable to you at an address other than your address of record. You must complete the appropriate section of the account application or Account Update Form to participate in each Fund’s systematic withdrawal plan.
You should not establish systematic withdrawals if you intend to make concurrent purchases of Class A or Class C shares because you may unnecessarily pay a sales charge or CDSC on these purchases.
Exchanging Shares
You may exchange Fund shares into an identically registered account for the same class of another Nuveen Mutual Fund available in your state. Your exchange must meet the minimum purchase requirements of the fund into which you are exchanging. You may also, under certain limited circumstances, exchange between certain classes of shares of the same fund, subject to the payment of any applicable CDSC. Please consult the statement of additional information for details.
Each Fund reserves the right to revise or suspend the exchange privilege, limit the amount or number of exchanges, or reject any exchange. Shareholders will be provided with at least 60 days’ notice of any material revision to or termination of the exchange privilege.
Because an exchange between funds is treated for tax purposes as a purchase and sale, any gain may be subject to tax. An exchange between classes of shares of the same fund may not be considered a taxable event. You should consult your tax advisor about the tax consequences of exchanging your shares.
Section 3 How You Can Buy and Sell Shares
105
Fund DirectSM
The Fund Direct Program allows you to link your Fund account to your bank account, transfer money electronically between these accounts and perform a variety of account transactions, including purchasing shares by telephone and investing through a systematic investment plan. You may also have dividends, distributions, redemption payments or systematic withdrawal plan payments sent directly to your bank account.
Reinstatement Privilege
If you redeem Fund shares, you may reinvest all or part of your redemption proceeds up to one year later without incurring any additional charges. You may only reinvest into the same share class you redeemed. If you paid a CDSC, your Fund will refund your CDSC and reinstate your holding period for purposes of calculating the CDSC. You may use this reinstatement privilege only once for any redemption. The reinstatement privilege is not available for Class B shares.

You may sell (redeem) your shares on any business day, which is any day the NYSE is open for business. You will receive the share price next determined after your Fund has received your properly completed redemption request. Your redemption request must be received before the close of trading on the NYSE (normally, 4:00 p.m. New York time) for you to receive that day’s price. The Fund will normally mail your check the next business day after a redemption request is received, but in no event more than seven days after your request is received. If you are selling shares purchased recently with a check, your redemption proceeds will not be mailed until your check has cleared, which may take up to ten business days from your purchase date.
You may sell your shares (1) through a financial advisor or (2) directly to the Funds.
Through a Financial Advisor
You may sell your shares through your financial advisor, who can prepare the necessary documentation. Your financial advisor may charge for this service.
Directly to the Funds
| | • | | By mail. You can sell your shares at any time by sending a written request to the appropriate Fund, c/o Nuveen Investor Services, P.O. Box 8530, Boston, Massachusetts 02266-8530. Your request must include the following information: |
| | • | | Your name and account number; |
| | • | | The dollar or share amount you wish to redeem; |
| | • | | The signature of each owner exactly as it appears on the account; |
| | • | | The name of the person to whom you want your redemption proceeds paid (if other than to the shareholder of record); |
| | • | | The address where you want your redemption proceeds sent (if other than the address of record); |
| | • | | Any certificates you have for the shares; and |
| | • | | Any required signature guarantees. |
106
Section 3 How You Can Buy and Sell Shares
After you have established your account, signatures on a written request must be guaranteed if:
| | • | | You would like redemption proceeds payable or sent to any person, address or bank account other than that on record; |
| | • | | You have changed the address on your Fund’s records within the last 30 days; |
| | • | | Your redemption request is in excess of $50,000; or |
| | • | | You are requesting a change in ownership on your account. |
Non-financial transactions, including establishing or modifying certain services such as changing bank information on an account, will require a signature guarantee or signature verification from a Medallion Signature Guarantee Program member or other acceptable form of authentication from a financial institution source. In addition to the situations described above, the Funds reserve the right to require a signature guarantee, or another acceptable form of signature verification, in other instances based on the circumstances of a particular situation.
A signature guarantee assures that a signature is genuine and protects shareholders from unauthorized account transfers. Banks, savings and loan associations, trust companies, credit unions, broker-dealers and member firms of a national securities exchange may guarantee signatures. Call your financial intermediary to determine if it has this capability. A notary public is not an acceptable signature guarantor. Proceeds from a written redemption request will be sent to you by check unless another form of payment is requested.
| | • | | On-line. You may redeem shares or exchange shares between existing, identically registered accounts on-line. To access your account, click the “Individual Investors” link on www.nuveen.com and then choose “Account Access” under the “Resources” tab. The system will walk you through the log-in process. On-line redemptions are not available for shares owned in certificate form and, with respect to redemptions where the proceeds are payable by check, may not exceed $50,000. Checks will only be issued to you as the shareholder of record and mailed to your address of record. If you have established Fund Direct privileges, you may have redemption proceeds transferred electronically to your bank account. |
| | • | | By telephone. If your account is held with your Fund and not in your brokerage account, and you have authorized telephone redemption privileges, call (800) 257-8787 to redeem your shares, press 1 for mutual funds and the voice menu will walk you through the process. Telephone redemptions are not available for shares owned in certificate form and, with respect to redemptions where the proceeds are payable by check, may not exceed $50,000. Checks will only be issued to you as the shareholder of record and mailed to your address of record, normally the next business day after the redemption request is received. If you have established Fund Direct privileges, you may have redemption proceeds transferred electronically to your bank account. In this case, the redemption proceeds will be transferred to your bank on the next business day after the redemption request is received. You should contact your bank for further information concerning the timing of the credit of the redemption proceeds in your bank account. |
Section 3 How You Can Buy and Sell Shares
107
An Important Note About Telephone Transactions
Although Nuveen Investor Services has certain safeguards and procedures to confirm the identity of callers, it will not be liable for losses resulting from following telephone instructions it reasonably believes to be genuine. Also, you should verify your trade confirmations immediately upon receipt.
Contingent Deferred Sales Charge
If you redeem Class A, Class B or Class C shares that are subject to a CDSC, you may be assessed a CDSC upon redemption. When you redeem Class A, Class B or Class C shares subject to a CDSC, your Fund will first redeem any shares that are not subject to a CDSC, and then redeem the shares you have owned for the longest period of time, unless you ask the Fund to redeem your shares in a different order. No CDSC is imposed on shares you buy through the reinvestment of dividends and capital gains. The CDSC holding period is calculated on a monthly basis and begins on the first day of the month in which the purchase was made. When you redeem shares subject to a CDSC, the CDSC is calculated on the lower of your purchase price or redemption proceeds, deducted from your redemption proceeds, and paid to the Distributor. The CDSC may be waived under certain special circumstances as described in the statement of additional information.
Accounts with Low Balances
The Funds reserve the right to liquidate or assess a low balance fee on any account (other than accounts holding Class R3 or Class R6 shares) held directly with the Funds that has a balance that has fallen below the account balance minimum of $1,000 for any reason, including market fluctuations.
If a Fund elects to exercise the right to assess a low balance fee, then annually the Fund will assess a $15 low balance account fee on certain accounts with balances under the account balance minimum that are IRAs, Coverdell Education Savings Accounts or accounts established pursuant to the UTMA or UGMA. At the same time, other accounts with balances under the account balance minimum will be liquidated, with proceeds being mailed to the address of record. Prior to the assessment of any low balance fee or liquidation of low balance accounts, affected shareholders will receive a communication notifying them of the pending action, thereby providing time to ensure that balances are at or above the account balance minimum prior to any fee assessment or account liquidation. You will not be assessed a CDSC if your account is liquidated.
Redemptions In-Kind
The Funds generally pay redemption proceeds in cash. However, if a Fund determines that it would be detrimental to its remaining shareholders to make payment of a redemption order wholly in cash, that Fund may pay a portion of your redemption proceeds in securities or other Fund assets. Although it is unlikely that your shares would be redeemed in-kind, you would probably have to pay brokerage costs to sell the securities or other assets distributed to you, as well as taxes on any capital gains from that sale.
108
Section 3 How You Can Buy and Sell Shares
Section 4 General Information
To help you understand the tax implications of investing in the Funds, this section includes important details about how the Funds make distributions to shareholders. We discuss some other Fund policies as well. Please consult the statement of additional information and your tax advisor for more information about taxes.

Dividends from net investment income are normally declared and paid quarterly for Nuveen Dividend Value Fund and Nuveen Equity Index Fund. For each other Fund, dividends from net investment income, if any, are normally declared and paid annually. For each of the Funds, any capital gains are normally distributed at least once each year.
Payment and Reinvestment Options
The Funds automatically reinvest your dividends in additional Fund shares unless you request otherwise. You may request to have your dividends paid to you by check, sent via electronic funds transfer through Automated Clearing House network or reinvested in shares of another Nuveen Mutual Fund. For further information, contact your financial advisor or call Nuveen Investor Services at (800) 257-8787. If you request that your distributions be paid by check but those distributions cannot be delivered because of an incorrect mailing address, or if a distribution check remains uncashed for six months, the undelivered or uncashed distributions and all future distributions will be reinvested in Fund shares at the current net asset value.
Non-U.S. Income Tax Considerations
Investment income that the Funds receive from their non-U.S. investments may be subject to non-U.S. income taxes, which generally will reduce Fund distributions. However, the United States has entered into tax treaties with many non-U.S. countries that may entitle you to certain tax benefits.
Taxes and Tax Reporting
The Funds will make distributions that may be taxed as ordinary income (which may be taxable at different rates, depending on the sources of the distributions) or capital gains (which may be taxable at different rates, depending on the length of time a Fund holds its assets). Dividends from a Fund’s long-term capital gains are generally taxable as capital gains, while dividends from short-term capital gains and net investment income are generally taxable as ordinary income. However, certain ordinary income distributions received from a Fund that are determined to be qualified dividend income may be taxed at tax rates equal to those applicable to long-term capital gains. The tax you pay on a given capital gains distribution depends generally on how long the Fund has held the portfolio securities it sold. It does not depend on how long you have owned your Fund shares. Dividends generally do not qualify for a dividends received deduction if you are a corporate shareholder.
Early in each year, you will receive a statement detailing the amount and nature of all dividends and capital gains that you were paid during the prior
Section 4 General Information
109
year. If you hold your investment at the firm where you purchased your Fund shares, you will receive the statement from that firm. If you hold your shares directly with the Fund, the Distributor will send you the statement. The tax status of your dividends is the same whether you reinvest your dividends or elect to receive them in cash. The sale of shares in your account may produce a gain or loss, and is a taxable event. For tax purposes, an exchange of shares between funds is generally the same as a sale.
Please note that if you do not furnish your Fund with your correct Social Security number or employer identification number, you fail to provide certain certifications to your Fund, you fail to certify whether you are a U.S. citizen or a U.S. resident alien, or the Internal Revenue Service notifies the Fund to withhold, federal law requires your Fund to withhold federal income tax from your distributions and redemption proceeds at the applicable withholding rate.
Buying or Selling Shares Close to a Record Date
Buying Fund shares shortly before the record date for a taxable dividend or capital gain distribution is commonly known as “buying the dividend.” The entire dividend may be taxable to you even though a portion of the dividend effectively represents a return of your purchase price.
Non U.S. Tax Credit
A regulated investment company with more than 50% of the value of its assets in stock or other securities of non-U.S. corporations at the close of a taxable year or that is a qualified fund of funds may, for such taxable year, elect to pass the regulated investment company’s non-U.S. tax credits through to its investors.
Cost Basis Method
For shares acquired on or after January 1, 2012, you may elect a cost basis method to apply to all existing and future accounts you may establish. The cost basis method you select will determine the order in which shares are redeemed and how your cost basis information is calculated and subsequently reported to you and to the Internal Revenue Service. Please consult your tax advisor to determine which cost basis method best suits your specific situation. If you hold your account directly with a Fund, please contact Nuveen Investor Services at (800) 257-8787 for instructions on how to make your election. If you hold your account with a financial intermediary, please contact that financial intermediary for instructions on how to make your election. If you hold your account directly with a Fund and do not elect a cost basis method, your account will default to the average cost basis method. For a definition of “average cost basis method,” please see the glossary. Financial intermediaries choose their own default method.

The Distributor serves as the selling agent and distributor of the Funds’ shares. In this capacity, the Distributor manages the offering of the Funds’ shares and is responsible for all sales and promotional activities. In order to reimburse the Distributor for its costs in connection with these activities, including compensation paid to financial intermediaries, each Fund has adopted a distribution and service plan under Rule 12b-1 under the 1940 Act. See “How You Can Buy and Sell Shares—What Share Classes We Offer”
110
Section 4 General Information
for a description of the distribution and service fees paid under this plan.
Under the plan, the Distributor receives a distribution fee for Class B, Class C and Class R3 shares primarily for providing compensation to financial intermediaries, including the Distributor, in connection with the distribution of shares. The Distributor receives a service fee for Class A, Class B, Class C and Class R3 shares to compensate financial intermediaries, including the Distributor, for providing ongoing account services to shareholders. These services may include establishing and maintaining shareholder accounts, answering shareholder inquiries and providing other personal services to shareholders. These fees also compensate the Distributor for other expenses, including printing and distributing prospectuses to persons other than shareholders, and preparing, printing, and distributing advertising materials, sales literature and reports to shareholders used in connection with the sale of shares. Because these fees are paid out of a Fund’s assets on an ongoing basis, over time these fees will increase the cost of your investment and may cost you more than paying other types of sales charges. Long- term holders of Class B, Class C and Class R3 shares may pay more in distribution and service fees and CDSCs (Class B and Class C shares only) than the economic equivalent of the maximum front-end sales charge permitted under the Financial Industry Regulatory Authority Conduct Rules.
Other Payments to Financial Intermediaries
In addition to the sales commissions and certain payments from distribution and service fees to financial intermediaries as previously described, the Distributor may from time to time make additional payments, out of its own resources, to certain financial intermediaries that sell shares of Nuveen Mutual Funds in order to promote the sales and retention of Fund shares by those firms and their customers. The amounts of these payments vary by financial intermediary and, with respect to a given firm, are typically calculated by reference to the amount of the firm’s recent gross sales of Nuveen Mutual Fund shares and/or total assets of Nuveen Mutual Funds held by the firm’s customers. The level of payments that the Distributor is willing to provide to a particular financial intermediary may be affected by, among other factors, the firm’s total assets held in and recent net investments into Nuveen Mutual Funds, the firm’s level of participation in Nuveen Mutual Fund sales and marketing programs, the firm’s compensation program for its registered representatives who sell Fund shares and provide services to Fund shareholders, and the asset class of the Nuveen Mutual Funds for which these payments are provided. For 2012, these payments in the aggregate were approximately 0.060% to 0.063% of the assets in the Nuveen Mutual Funds, although payments to particular financial intermediaries can be significantly higher. The statement of additional information contains additional information about these payments, including the names of the firms to which payments are made. The Distributor may also make payments to financial intermediaries in connection with sales meetings, due diligence meetings, prospecting seminars and other meetings at which the Distributor promotes its products and services.
In connection with the availability of Nuveen Mutual Funds within selected mutual fund no-transaction fee institutional platforms and fee-based wrap programs (together, “Platform Programs”) at certain financial intermediaries, the Distributor also makes payments out of its own assets to those firms as compensation for certain recordkeeping, shareholder communications and other account administration services provided to Nuveen Mutual Fund shareholders who own their Fund shares in these Platform Programs. These
Section 4 General Information
111
payments are in addition to the service fee and any applicable omnibus sub-accounting fees paid to these firms with respect to these services by the Nuveen Mutual Funds out of Fund assets.
The amounts of payments to a financial intermediary could be significant, and may create an incentive for the intermediary or its representatives to recommend or offer shares of the Funds to you. The intermediary may elevate the prominence or profile of the Funds within the intermediary’s organization by, for example, placing the Funds on a list of preferred or recommended funds and/or granting the Distributor and/or its affiliates preferential or enhanced opportunities to promote the Funds in various ways within the intermediary’s organization.

The price you pay for your shares or the amount you receive upon redemption of your shares is based on your Fund’s net asset value per share, which is determined as of the close of trading (normally 4:00 p.m. New York time) on each day the NYSE is open for business. Net asset value is calculated for each class of each Fund by taking the value of the class’s total assets, including interest or dividends accrued but not yet collected, less all liabilities, and dividing by the total number of shares outstanding. The result, rounded to the nearest cent, is the net asset value per share. All valuations are subject to review by the Funds’ Board of Directors or its designee; however, the Board of Directors retains oversight responsibility for valuing the Funds’ portfolio securities.
In determining net asset value, portfolio instruments generally are valued using prices provided by independent pricing services or obtained from other sources, such as broker-dealer quotations, all as approved by the Board of Directors. Exchange-traded instruments generally are valued at the last reported sales price or official closing price on an exchange, if available. Independent pricing services typically value non-exchange-traded instruments utilizing a range of market-based inputs and assumptions, including readily available market quotations obtained from broker-dealers making markets in such instruments, cash flows, and transactions for comparable instruments. In pricing certain instruments, the pricing services may consider information about an instrument’s issuer or market activity provided by the Funds’ investment adviser or sub-adviser. Non-U.S. securities and currency are valued in U.S. dollars based on non-U.S. currency exchange rate quotations supplied by an independent quotation service.
For non-U.S. traded securities whose principal local markets close before the close of the NYSE, a Fund may adjust the local closing price based upon such factors as developments in non-U.S. markets, the performance of U.S. securities markets and the performance of instruments trading in U.S. markets that represent non-U.S. securities. A Fund may rely on an independent fair valuation service in making any such fair value determinations. If a Fund holds portfolio instruments that are principally listed on non-U.S. exchanges, the value of such instruments may change on days when shareholders will not be able to purchase or redeem the Fund’s shares.
If a price cannot be obtained from a pricing service or other pre-approved source, or if Nuveen Fund Advisors deems such price to be unreliable, a portfolio instrument may be valued by a Fund at its fair value as determined
112
Section 4 General Information
in good faith by the Board of Directors or its designee. Nuveen Fund Advisors might find a price obtained from a pricing service or other pre-approved source to be unreliable if, for example, the price has not changed for an identified period of time, or because it differs from the previous day’s price by a threshold amount, and Nuveen Fund Advisors determines that recent transactions and/or broker-dealer price quotations differ materially from such price. As a general principle, the fair value of a portfolio instrument is the amount that an owner might reasonably expect to receive upon the instrument’s current sale. A range of factors and analysis may be considered when determining fair value, including relevant market data, interest rates, credit considerations and/or issuer-specific news.
A security that is fair valued may be valued at a price higher or lower than actual market quotations, the last price determined by the pricing service, the last bid or ask price in the market or the value determined by other funds using their own fair valuation procedures.

The Funds are intended for long-term investment and should not be used for excessive trading. Excessive trading in the Funds’ shares can disrupt portfolio management, lead to higher operating costs, and cause other operating inefficiencies for the Funds. However, the Funds are also mindful that shareholders may have valid reasons for periodically purchasing and redeeming Fund shares.
Accordingly, the Funds have adopted a Frequent Trading Policy that seeks to balance the Funds’ need to prevent excessive trading in Fund shares while offering investors the flexibility in managing their financial affairs to make periodic purchases and redemptions of Fund shares.
The Funds’ Frequent Trading Policy generally limits an investor to two “round trip” trades in a 60-day period. A “round trip” is the purchase and subsequent redemption of Fund shares, including by exchange. Each side of a round trip may be comprised of either a single transaction or a series of closely-spaced transactions.
The Funds primarily receive share purchase and redemption orders through third-party financial intermediaries, some of whom rely on the use of omnibus accounts. An omnibus account typically includes multiple investors and provides the Funds only with a net purchase or redemption amount on any given day where multiple purchases, redemptions and exchanges of shares occur in the account. The identity of individual purchasers, redeemers and exchangers whose orders are aggregated in omnibus accounts, and the size of their orders, will generally not be known by the Funds. Despite the Funds’ efforts to detect and prevent frequent trading, the Funds may be unable to identify frequent trading because the netting effect in omnibus accounts often makes it more difficult to identify frequent traders. The Distributor has entered into agreements with financial intermediaries that maintain omnibus accounts with the Funds’ transfer agent. Under the terms of these agreements, the financial intermediaries undertake to cooperate with the Distributor in monitoring purchase, exchange and redemption orders by their customers in order to detect and prevent frequent trading in the Funds through such accounts. Technical limitations in operational systems at such intermediaries or at the Distributor may also limit the Funds’ ability to detect and prevent frequent trading. In addition, the Funds may
Section 4 General Information
113
permit certain financial intermediaries, including broker-dealer and retirement plan administrators, among others, to enforce their own internal policies and procedures concerning frequent trading. Such policies may differ from the Funds’ Frequent Trading Policy and may be approved for use in instances where the Funds reasonably believe that the intermediary’s policies and procedures effectively discourage inappropriate trading activity. Shareholders holding their accounts with such intermediaries may wish to contact the intermediary for information regarding its frequent trading policy. Although the Funds do not knowingly permit frequent trading, they cannot guarantee that they will be able to identify and restrict all frequent trading activity.
The Funds reserve the right in their sole discretion to waive unintentional or minor violations (including transactions below certain dollar thresholds) if they determine that doing so would not harm the interests of Fund shareholders. In addition, certain categories of redemptions may be excluded from the application of the Frequent Trading Policy, as described in more detail in the statement of additional information. These include, among others, redemptions pursuant to systematic withdrawal plans, redemptions in connection with the total disability or death of the investor, involuntary redemptions by operation of law, redemptions in payment of account or plan fees, and certain redemptions by retirement plans, including redemptions in connection with qualifying loans or hardship withdrawals, termination of plan participation, return of excess contributions, and required minimum distributions. The Funds may also modify or suspend the Frequent Trading Policy without notice during periods of market stress or other unusual circumstances.
The Funds reserve the right to impose restrictions on purchases or exchanges that are more restrictive than those stated above if they determine, in their sole discretion, that a transaction or a series of transactions involves market timing or excessive trading that may be detrimental to Fund shareholders. The Funds also reserve the right to reject any purchase order, including exchange purchases, for any reason. For example, a Fund may refuse purchase orders if the Fund would be unable to invest the proceeds from the purchase order in accordance with the Fund’s investment policies and/or objective, or if the Fund would be adversely affected by the size of the transaction, the frequency of trading in the account or various other factors. For more information about the Funds’ Frequent Trading Policy and its enforcement, see “Purchase and Redemption of Fund Shares—Frequent Trading Policy” in the statement of additional information.

The custodian of the assets of the Funds other than Nuveen International Fund and Nuveen International Select Fund is U.S. Bank National Association, 60 Livingston Avenue, St. Paul, MN 55101. The custodian of the assets of Nuveen International Fund and Nuveen International Select Fund is State Street Bank and Trust Company, 2 Avenue de Lafayette, LCC/5 Boston, MA 02111. The Funds’ transfer, shareholder services and dividend paying agent, Boston Financial Data Services, Inc., P.O. Box 8530, Boston, Massachusetts 02266-8530, performs bookkeeping, data processing and administrative services for the maintenance of shareholder accounts.
114
Section 4 General Information

For disclaimers relating to the indices for Nuveen Equity Index Fund and Nuveen Mid Cap Index Fund, please see the statement of additional information.
Nuveen Small Cap Index Fund is not promoted, sponsored or endorsed by, nor in any way affiliated with Frank Russell Company. Frank Russell Company is not responsible for and has not reviewed Nuveen Small Cap Index Fund nor any associated literature or publications and Frank Russell Company makes no representation or warranty, express or implied, as to their accuracy, or completeness, or otherwise. Please see the statement of additional information for further restrictions and information regarding the Russell Index(es).
Section 4 General Information
115
Section 5 Financial Highlights
The financial highlights table is intended to help you understand a Fund’s financial performance for the past five fiscal years or, if shorter, the period of operations for the Fund or class of shares. Certain information reflects financial results for a single Fund share. The total returns in the table represent the rate that an investor would have earned (or lost) on an investment in a Fund (assuming reinvestment of all dividends and distributions).
The information for the most recent fiscal year has been audited by PricewaterhouseCoopers LLP, whose report, along with the Funds’ financial statements, are included in the annual report, which is available upon request. The financial statements for the years ended October 31, 2011 and prior were audited by other independent auditors.
Nuveen Dividend Value Fund
| | | | | | | | | | | | | | | | | | | | | | | | | | | | | | | | | | | | | | | | | | | | | | | | | | | | |
Class
(Commencement
Date) | | | | | Investment Operations | | | Less Distributions | | | | | | | | | Ratios/Supplemental Data | |
Year Ended
October 31, | | Beginning
Net Asset
Value | | | Net
Investment
Income
(Loss)(a) | | | Net
Realized/
Unrealized
Gain (Loss) | | | Total | | | Net
Investment
Income | | | Capital
Gains(b) | | | Total | | | Ending Net Asset Value | | | Total
Return(c) | | | Ending
Net
Assets
(000) | | | Ratios of
Expenses
to Average
Net
Assets(d) | | | Ratios of
Net
Investment
Income
(Loss) to
Average
Net
Assets(d) | | | Portfolio
Turnover
Rate | |
| | | | | | | | | | | | |
| Class A (12/92) | | | | | | | | | | | | | | | | | | | | | | | | | | | | | | | | | | | | | | | | | | | | | | | | | |
| 2012 | | $ | 13.05 | | | $ | .27 | | | $ | 1.59 | | | $ | 1.86 | | | $ | (.31 | ) | | $ | — | | | $ | (.31 | ) | | $ | 14.60 | | | | 14.31 | % | | $ | 273,317 | | | | 1.16 | % | | | 1.95 | % | | | 24 | % |
| 2011 | | | 12.42 | | | | .27 | | | | .63 | | | | .90 | | | | (.27 | ) | | | — | | | | (.27 | ) | | | 13.05 | | | | 7.28 | | | | 176,954 | | | | 1.14 | | | | 2.05 | | | | 33 | |
| 2010 | | | 10.76 | | | | .34 | | | | 1.63 | | | | 1.97 | | | | (.31 | ) | | | — | | | | (.31 | ) | | | 12.42 | | | | 18.46 | | | | 125,226 | | | | 1.17 | | | | 2.89 | | | | 29 | |
| 2009 | | | 10.09 | | | | .29 | | | | .71 | | | | 1.00 | | | | (.33 | ) | | | — | | | | (.33 | ) | | | 10.76 | | | | 10.32 | | | | 100,059 | | | | 1.19 | | | | 3.00 | | | | 48 | |
| 2008 | | | 16.43 | | | | .33 | | | | (5.28 | ) | | | (4.95 | ) | | | (.29 | ) | | | (1.10 | ) | | | (1.39 | ) | | | 10.09 | | | | (32.51 | ) | | | 100,824 | | | | 1.17 | | | | 2.45 | | | | 32 | |
| | | | | | | | | | | | |
| Class B (8/94) | | | | | | | | | | | | | | | | | | | | | | | | | | | | | | | | | | | | | | | | | | | | | | | | | |
| 2012 | | | 12.93 | | | | .18 | | | | 1.57 | | | | 1.75 | | | | (.21 | ) | | | — | | | | (.21 | ) | | | 14.47 | | | | 13.51 | | | | 1,525 | | | | 1.91 | | | | 1.33 | | | | 24 | |
| 2011 | | | 12.25 | | | | .17 | | | | .61 | | | | .78 | | | | (.10 | ) | | | — | | | | (.10 | ) | | | 12.93 | | | | 6.45 | | | | 3,016 | | | | 1.89 | | | | 1.32 | | | | 33 | |
| 2010 | | | 10.61 | | | | .24 | | | | 1.61 | | | | 1.85 | | | | (.21 | ) | | | — | | | | (.21 | ) | | | 12.25 | | | | 17.59 | | | | 5,039 | | | | 1.92 | | | | 2.07 | | | | 29 | |
| 2009 | | | 9.96 | | | | .22 | | | | .68 | | | | .90 | | | | (.25 | ) | | | — | | | | (.25 | ) | | | 10.61 | | | | 9.41 | | | | 7,237 | | | | 1.94 | | | | 2.28 | | | | 48 | |
| 2008 | | | 16.23 | | | | .22 | | | | (5.19 | ) | | | (4.97 | ) | | | (.20 | ) | | | (1.10 | ) | | | (1.30 | ) | | | 9.96 | | | | (32.95 | ) | | | 9,113 | | | | 1.92 | | | | 1.69 | | | | 32 | |
| | | | | | | | | | | | |
| Class C (2/99) | | | | | | | | | | | | | | | | | | | | | | | | | | | | | | | | | | | | | | | | | | | | | | | | | |
| 2012 | | | 12.92 | | | | .17 | | | | 1.54 | | | | 1.71 | | | | (.21 | ) | | | — | | | | (.21 | ) | | | 14.42 | | | | 13.29 | | | | 29,234 | | | | 1.91 | | | | 1.21 | | | | 24 | |
| 2011 | | | 12.26 | | | | .17 | | | | .62 | | | | .79 | | | | (.13 | ) | | | — | | | | (.13 | ) | | | 12.92 | | | | 6.42 | | | | 18,714 | | | | 1.89 | | | | 1.31 | | | | 33 | |
| 2010 | | | 10.63 | | | | .26 | | | | 1.60 | | | | 1.86 | | | | (.23 | ) | | | — | | | | (.23 | ) | | | 12.26 | | | | 17.60 | | | | 11,107 | | | | 1.92 | | | | 2.22 | | | | 29 | |
| 2009 | | | 9.98 | | | | .21 | | | | .69 | | | | .90 | | | | (.25 | ) | | | — | | | | (.25 | ) | | | 10.63 | | | | 9.41 | | | | 4,921 | | | | 1.94 | | | | 2.23 | | | | 48 | |
| 2008 | | | 16.26 | | | | .22 | | | | (5.20 | ) | | | (4.98 | ) | | | (.20 | ) | | | (1.10 | ) | | | (1.30 | ) | | | 9.98 | | | | (32.95 | ) | | | 4,625 | | | | 1.92 | | | | 1.69 | | | | 32 | |
| | | | | | | | | | | | |
| Class R3 (9/01) | | | | | | | | | | | | | | | | | | | | | | | | | | | | | | | | | | | | | | | | | | | | | | | | | |
| 2012 | | | 13.03 | | | | .24 | | | | 1.59 | | | | 1.83 | | | | (.28 | ) | | | — | | | | (.28 | ) | | | 14.58 | | | | 14.13 | | | | 21,649 | | | | 1.41 | | | | 1.70 | | | | 24 | |
| 2011 | | | 12.41 | | | | .23 | | | | .63 | | | | .86 | | | | (.24 | ) | | | — | | | | (.24 | ) | | | 13.03 | | | | 6.93 | | | | 12,092 | | | | 1.41 | | | | 1.75 | | | | 33 | |
| 2010 | | | 10.76 | | | | .30 | | | | 1.64 | | | | 1.94 | | | | (.29 | ) | | | — | | | | (.29 | ) | | | 12.41 | | | | 18.16 | | | | 1,204 | | | | 1.39 | | | | 2.50 | | | | 29 | |
| 2009 | | | 10.08 | | | | .28 | | | | .68 | | | | .96 | | | | (.28 | ) | | | — | | | | (.28 | ) | | | 10.76 | | | | 9.92 | | | | 122 | | | | 1.45 | | | | 2.94 | | | | 48 | |
| 2008 | | | 16.41 | | | | .29 | | | | (5.26 | ) | | | (4.97 | ) | | | (.26 | ) | | | (1.10 | ) | | | (1.36 | ) | | | 10.08 | | | | (32.64 | ) | | | 535 | | | | 1.42 | | | | 2.20 | | | | 32 | |
| | | | | | | | | | | | |
| Class I (8/94) | | | | | | | | | | | | | | | | | | | | | | | | | | | | | | | | | | | | | | | | | | | | | | | | | |
| 2012 | | | 13.16 | | | | .31 | | | | 1.60 | | | | 1.91 | | | | (.35 | ) | | | — | | | | (.35 | ) | | | 14.72 | | | | 14.65 | | | | 1,072,335 | | | | .91 | | | | 2.23 | | | | 24 | |
| 2011 | | | 12.53 | | | | .31 | | | | .64 | | | | .95 | | | | (.32 | ) | | | — | | | | (.32 | ) | | | 13.16 | | | | 7.56 | | | | 861,754 | | | | .89 | | | | 2.31 | | | | 33 | |
| 2010 | | | 10.85 | | | | .37 | | | | 1.65 | | | | 2.02 | | | | (.34 | ) | | | — | | | | (.34 | ) | | | 12.53 | | | | 18.78 | | | | 684,540 | | | | .92 | | | | 3.10 | | | | 29 | |
| 2009 | | | 10.18 | | | | .32 | | | | .70 | | | | 1.02 | | | | (.35 | ) | | | — | | | | (.35 | ) | | | 10.85 | | | | 10.51 | | | | 570,690 | | | | .94 | | | | 3.25 | | | | 48 | |
| 2008 | | | 16.55 | | | | .36 | | | | (5.30 | ) | | | (4.94 | ) | | | (.33 | ) | | | (1.10 | ) | | | (1.43 | ) | | | 10.18 | | | | (32.29 | ) | | | 574,162 | | | | .92 | | | | 2.70 | | | | 32 | |
| (a) | Per share Net Investment Income (Loss) is calculated using the average daily shares method. |
| (b) | Distributions from Capital Gains include short-term capital gains, if any. |
| (c) | Total Return is the combination of changes in net asset value without any sales charge, reinvested dividend income at net asset value and reinvested capital gains distributions at net asset value, if any. Total Return is not annualized. |
| (d) | After expense reimbursement from the Adviser, where applicable. |
116
Section 5 Financial Highlights
Nuveen Equity Index Fund
| | | | | | | | | | | | | | | | | | | | | | | | | | | | | | | | | | | | | | | | | | | | | | | | | | | | |
Class
(Commencement
Date) | | | Investment Operations | | | Less Distributions | | | | | | | | | Ratios/Supplemental Data | |
Year Ended
October 31, | | Beginning
Net Asset
Value | | | Net
Investment
Income
(Loss)(a) | | | Net
Realized/
Unrealized
Gain (Loss) | | | Total | | | Net
Investment
Income | | | Capital
Gains(b) | | | Total | | | Ending
Net
Asset
Value | | | Total
Return(c) | | | Ending
Net
Assets
(000) | | | Ratios of
Expenses
to Average
Net
Assets(d) | | | Ratios of
Net
Investment
Income
(Loss) to
Average
Net
Assets(d) | | | Portfolio
Turnover
Rate | |
| | | | | | | | | | | |
| CLASS A (12/92) | | | | | | | | | | | | | | | | | | | | | | | | | | | | | | | | | | | | | | | | | | | | | |
| 2012 | | $ | 21.44 | | | $ | .34 | | | $ | 2.48 | | | $ | 2.82 | | | $ | (.35 | ) | | $ | (1.56 | ) | | $ | (1.91 | ) | | $ | 22.35 | | | | 14.51 | % | | $ | 143,664 | | | | .62 | % | | | 1.56 | % | | | 1 | % |
| 2011 | | | 21.51 | | | | .30 | | | | 1.26 | | | | 1.56 | | | | (.26 | ) | | | (1.37 | ) | | | (1.63 | ) | | | 21.44 | | | | 7.41 | | | | 119,172 | | | | .62 | | | | 1.37 | | | | 2 | |
| 2010 | | | 18.86 | | | | .29 | | | | 2.70 | | | | 2.99 | | | | (.30 | ) | | | (.04 | ) | | | (.34 | ) | | | 21.51 | | | | 15.94 | | | | 119,761 | | | | .61 | | | | 1.41 | | | | 4 | |
| 2009 | | | 17.61 | | | | .34 | | | | 1.27 | | | | 1.61 | | | | (.36 | ) | | | — | | | | (.36 | ) | | | 18.86 | | | | 9.51 | | | | 115,213 | | | | .62 | | | | 2.03 | | | | 10 | |
| 2008 | | | 28.67 | | | | .42 | | | | (10.57 | ) | | | (10.15 | ) | | | (.38 | ) | | | (.53 | ) | | | (.91 | ) | | | 17.61 | | | | (36.35 | ) | | | 114,654 | | | | .62 | | | | 1.74 | | | | 4 | |
| | | | | | | | | | | |
| CLASS B (8/94) | | | | | | | | | | | | | | | | | | | | | | | | | | | | | | | | | | | | | | | | | | | | | |
| 2012 | | | 21.10 | | | | .18 | | | | 2.43 | | | | 2.61 | | | | (.18 | ) | | | (1.56 | ) | | | (1.74 | ) | | | 21.97 | | | | 13.69 | | | | 2,611 | | | | 1.37 | | | | .84 | | | | 1 | |
| 2011 | | | 21.19 | | | | .14 | | | | 1.24 | | | | 1.38 | | | | (.10 | ) | | | (1.37 | ) | | | (1.47 | ) | | | 21.10 | | | | 6.60 | | | | 4,227 | | | | 1.37 | | | | .63 | | | | 2 | |
| 2010 | | | 18.58 | | | | .13 | | | | 2.66 | | | | 2.79 | | | | (.14 | ) | | | (.04 | ) | | | (.18 | ) | | | 21.19 | | | | 15.07 | | | | 7,351 | | | | 1.36 | | | | .67 | | | | 4 | |
| 2009 | | | 17.35 | | | | .22 | | | | 1.25 | | | | 1.47 | | | | (.24 | ) | | | — | | | | (.24 | ) | | | 18.58 | | | | 8.69 | | | | 9,822 | | | | 1.37 | | | | 1.33 | | | | 10 | |
| 2008 | | | 28.27 | | | | .24 | | | | (10.42 | ) | | | (10.18 | ) | | | (.21 | ) | | | (.53 | ) | | | (.74 | ) | | | 17.35 | | | | (36.82 | ) | | | 12,856 | | | | 1.37 | | | | .99 | | | | 4 | |
| | | | | | | | | | | |
| CLASS C (2/99) | | | | | | | | | | | | | | | | | | | | | | | | | | | | | | | | | | | | | | | | | | | | | |
| 2012 | | | 21.24 | | | | .17 | | | | 2.46 | | | | 2.63 | | | | (.18 | ) | | | (1.56 | ) | | | (1.74 | ) | | | 22.13 | | | | 13.70 | | | | 8,095 | | | | 1.37 | | | | .82 | | | | 1 | |
| 2011 | | | 21.32 | | | | .13 | | | | 1.26 | | | | 1.39 | | | | (.10 | ) | | | (1.37 | ) | | | (1.47 | ) | | | 21.24 | | | | 6.61 | | | | 8,261 | | | | 1.37 | | | | .62 | | | | 2 | |
| 2010 | | | 18.70 | | | | .13 | | | | 2.67 | | | | 2.80 | | | | (.14 | ) | | | (.04 | ) | | | (.18 | ) | | | 21.32 | | | | 15.05 | | | | 8,651 | | | | 1.36 | | | | .66 | | | | 4 | |
| 2009 | | | 17.46 | | | | .21 | | | | 1.26 | | | | 1.47 | | | | (.23 | ) | | | — | | | | (.23 | ) | | | 18.70 | | | | 8.69 | | | | 8,661 | | | | 1.37 | | | | 1.31 | | | | 10 | |
| 2008 | | | 28.45 | | | | .24 | | | | (10.48 | ) | | | (10.24 | ) | | | (.22 | ) | | | (.53 | ) | | | (.75 | ) | | | 17.46 | | | | (36.83 | ) | | | 9,784 | | | | 1.37 | | | | .99 | | | | 4 | |
| | | | | | | | | | | |
| CLASS R3 (9/01) | | | | | | | | | | | | | | | | | | | | | | | | | | | | | | | | | | | | | | | | | | | | | |
| 2012 | | | 21.40 | | | | .28 | | | | 2.48 | | | | 2.76 | | | | (.29 | ) | | | (1.56 | ) | | | (1.85 | ) | | | 22.31 | | | | 14.26 | | | | 33,685 | | | | .87 | | | | 1.28 | | | | 1 | |
| 2011 | | | 21.47 | | | | .25 | | | | 1.26 | | | | 1.51 | | | | (.21 | ) | | | (1.37 | ) | | | (1.58 | ) | | | 21.40 | | | | 7.15 | | | | 14,218 | | | | .87 | | | | 1.13 | | | | 2 | |
| 2010 | | | 18.83 | | | | .23 | | | | 2.70 | | | | 2.93 | | | | (.25 | ) | | | (.04 | ) | | | (.29 | ) | | | 21.47 | | | | 15.63 | | | | 12,979 | | | | .86 | | | | 1.15 | | | | 4 | |
| 2009 | | | 17.58 | | | | .29 | | | | 1.28 | | | | 1.57 | | | | (.32 | ) | | | — | | | | (.32 | ) | | | 18.83 | | | | 9.27 | | | | 10,915 | | | | .87 | | | | 1.73 | | | | 10 | |
| 2008 | | | 28.63 | | | | .35 | | | | (10.54 | ) | | | (10.19 | ) | | | (.33 | ) | | | (.53 | ) | | | (.86 | ) | | | 17.58 | | | | (36.51 | ) | | | 9,463 | | | | .87 | | | | 1.49 | | | | 4 | |
| | | | | | | | | | | |
| CLASS I (2/94) | | | | | | | | | | | | | | | | | | | | | | | | | | | | | | | | | | | | | | | | | | | | | |
| 2012 | | | 21.43 | | | | .39 | | | | 2.49 | | | | 2.88 | | | | (.40 | ) | | | (1.56 | ) | | | (1.96 | ) | | | 22.35 | | | | 14.85 | | | | 556,215 | | | | .37 | | | | 1.82 | | | | 1 | |
| 2011 | | | 21.50 | | | | .36 | | | | 1.26 | | | | 1.62 | | | | (.32 | ) | | | (1.37 | ) | | | (1.69 | ) | | | 21.43 | | | | 7.68 | | | | 597,030 | | | | .37 | | | | 1.63 | | | | 2 | |
| 2010 | | | 18.86 | | | | .34 | | | | 2.69 | | | | 3.03 | | | | (.35 | ) | | | (.04 | ) | | | (.39 | ) | | | 21.50 | | | | 16.18 | | | | 749,210 | | | | .36 | | | | 1.66 | | | | 4 | |
| 2009 | | | 17.61 | | | | .38 | | | | 1.27 | | | | 1.65 | | | | (.40 | ) | | | — | | | | (.40 | ) | | | 18.86 | | | | 9.78 | | | | 827,145 | | | | .37 | | | | 2.31 | | | | 10 | |
| 2008 | | | 28.66 | | | | .48 | | | | (10.56 | ) | | | (10.08 | ) | | | (.44 | ) | | | (.53 | ) | | | (.97 | ) | | | 17.61 | | | | (36.18 | ) | | | 954,582 | | | | .37 | | | | 1.99 | | | | 4 | |
| (a) | Per share Net Investment Income (Loss) is calculated using the average daily shares method. |
| (b) | Distributions from Capital Gains include short-term capital gains, if any. |
| (c) | Total Return is the combination of changes in net asset value, reinvested dividend income at net asset value and reinvested capital gains distributions at net asset value, if any. Total Return is not annualized. |
| (d) | After expense reimbursement from the Adviser, where applicable. |
Section 5 Financial Highlights
117
Nuveen International Fund
| | | | | | | | | | | | | | | | | | | | | | | | | | | | | | | | | | | | | | | | | | | | | | | | | | | | |
Class
(Commencement
Date) | | | | | Investment Operations | | | Less Distributions | | | | | | | | | Ratios/Supplemental Data | |
Year Ended
October 31, | | Beginning
Net Asset
Value | | | Net
Investment
Income
(Loss)(a) | | | Net
Realized/
Unrealized
Gain (Loss) | | | Total | | | Net
Investment
Income | | | Capital
Gains(b) | | | Total | | | Ending
Net
Asset
Value | | | Total
Return(c) | | | Ending
Net
Assets
(000) | | | Ratios of
Net
Expenses
to Average
Net
Assets(d) | | | Ratios of
Net
Investment
Income
(Loss) to
Average
Net
Assets(d) | | | Portfolio
Turnover
Rate | |
| | | | | | | | | | | | | |
| Class A (5/94) | | | | | | | | | | | | | | | | | | | | | | | | | | | | | | | | | | | | | | | | | | | | | | | | | | | | |
| 2012 | | $ | 11.12 | | | $ | .07 | | | $ | .16 | | | $ | .23 | | | $ | (.41 | ) | | $ | (1.40 | ) | | $ | (1.81 | ) | | $ | 9.54 | | | | 3.91 | % | | $ | 21,009 | | | | 1.48 | % | | | .69 | % | | | 57 | % |
| 2011 | | | 11.62 | | | | .10 | | | | (.55 | ) | | | (.45 | ) | | | (.05 | ) | | | — | | | | (.05 | ) | | | 11.12 | | | | (3.93 | ) | | | 22,328 | | | | 1.46 | | | | .84 | | | | 72 | |
| 2010 | | | 10.78 | | | | .07 | | | | .81 | | | | .88 | | | | (.04 | ) | | | — | | | | (.04 | ) | | | 11.62 | | | | 8.21 | | | | 26,698 | | | | 1.48 | | | | .62 | | | | 56 | |
| 2009 | | | 8.68 | | | | .09 | | | | 2.09 | | | | 2.18 | | | | (.08 | ) | | | — | | | | (.08 | ) | | | 10.78 | | | | 25.29 | | | | 27,995 | | | | 1.49 | | | | 1.00 | | | | 231 | |
| 2008 | | | 17.15 | | | | .26 | | | | (7.14 | ) | | | (6.88 | ) | | | (.14 | ) | | | (1.45 | ) | | | (1.59 | ) | | | 8.68 | | | | (43.82 | ) | | | 25,342 | | | | 1.49 | | | | 1.92 | | | | 18 | |
| | | | | | | | | | | | | |
| Class C (9/01) | | | | | | | | | | | | | | | | | | | | | | | | | | | | | | | | | | | | | | | | | | | | | | | | | | | | |
| 2012 | | | 10.51 | | | | (.01 | ) | | | .16 | | | | .15 | | | | (.31 | ) | | | (1.40 | ) | | | (1.71 | ) | | | 8.95 | | | | 3.11 | | | | 1,675 | | | | 2.23 | | | | (.06 | ) | | | 57 | |
| 2011 | | | 11.03 | | | | .01 | | | | (.53 | ) | | | (.52 | ) | | | — | | | | — | | | | — | | | | 10.51 | | | | (4.71 | ) | | | 1,987 | | | | 2.21 | | | | .10 | | | | 72 | |
| 2010 | | | 10.26 | | | | (.02 | ) | | | .79 | | | | .77 | | | | — | | | | — | | | | — | | | | 11.03 | | | | 7.50 | | | | 2,607 | | | | 2.23 | | | | (.14 | ) | | | 56 | |
| 2009 | | | 8.25 | | | | .02 | | | | 1.99 | | | | 2.01 | | | | — | | | | — | | | | — | | | | 10.26 | | | | 24.36 | | | | 3,269 | | | | 2.24 | | | | .24 | | | | 231 | |
| 2008 | | | 16.36 | | | | .15 | | | | (6.79 | ) | | | (6.64 | ) | | | (.02 | ) | | | (1.45 | ) | | | (1.47 | ) | | | 8.25 | | | | (44.21 | ) | | | 3,232 | | | | 2.24 | | | | 1.20 | | | | 18 | |
| | | | | | | | | | | | | |
| Class R3 (4/94) | | | | | | | | | | | | | | | | | | | | | | | | | | | | | | | | | | | | | | | | | | | | | | | | | | | | |
| 2012 | | | 11.11 | | | | .05 | | | | .16 | | | | .21 | | | | (.38 | ) | | | (1.40 | ) | | | (1.78 | ) | | | 9.54 | | | | 3.69 | | | | 42 | | | | 1.73 | | | | .53 | | | | 57 | |
| 2011 | | | 11.61 | | | | .07 | | | | (.54 | ) | | | (.47 | ) | | | (.03 | ) | | | — | | | | (.03 | ) | | | 11.11 | | | | (4.10 | ) | | | 11 | | | | 1.68 | | | | .59 | | | | 72 | |
| 2010 | | | 10.78 | | | | .04 | | | | .82 | | | | .86 | | | | (.03 | ) | | | — | | | | (.03 | ) | | | 11.61 | | | | 7.94 | | | | 6 | | | | 1.73 | | | | .38 | | | | 56 | |
| 2009 | | | 8.67 | | | | .07 | | | | 2.11 | | | | 2.18 | | | | (.07 | ) | | | — | | | | (.07 | ) | | | 10.78 | | | | 25.39 | | | | 5 | | | | 1.74 | | | | .73 | | | | 231 | |
| 2008 | | | 17.17 | | | | .19 | | | | (7.10 | ) | | | (6.91 | ) | | | (.14 | ) | | | (1.45 | ) | | | (1.59 | ) | | | 8.67 | | | | (43.94 | ) | | | 2 | | | | 1.74 | | | | 1.40 | | | | 18 | |
| | | | | | | | | | | | | |
| Class I (4/94) | | | | | | | | | | | | | | | | | | | | | | | | | | | | | | | | | | | | | | | | | | | | | | | | | | | | |
| 2012 | | | 11.25 | | | | .09 | | | | .17 | | | | .26 | | | | (.45 | ) | | | (1.40 | ) | | | (1.85 | ) | | | 9.66 | | | | 4.15 | | | | 75,592 | | | | 1.23 | | | | .93 | | | | 57 | |
| 2011 | | | 11.78 | | | | .14 | | | | (.59 | ) | | | (.45 | ) | | | (.08 | ) | | | — | | | | (.08 | ) | | | 11.25 | | | | (3.90 | ) | | | 141,264 | | | | 1.21 | | | | 1.17 | | | | 72 | |
| 2010 | | | 10.92 | | | | .10 | | | | .83 | | | | .93 | | | | (.07 | ) | | | — | | | | (.07 | ) | | | 11.78 | | | | 8.52 | | | | 652,664 | | | | 1.23 | | | | .87 | | | | 56 | |
| 2009 | | | 8.81 | | | | .11 | | | | 2.12 | | | | 2.23 | | | | (.12 | ) | | | — | | | | (.12 | ) | | | 10.92 | | | | 25.68 | | | | 680,309 | | | | 1.24 | | | | 1.25 | | | | 231 | |
| 2008 | | | 17.38 | | | | .30 | | | | (7.24 | ) | | | (6.94 | ) | | | (.18 | ) | | | (1.45 | ) | | | (1.63 | ) | | | 8.81 | | | | (43.68 | ) | | | 658,276 | | | | 1.24 | | | | 2.19 | | | | 18 | |
| (a) | Per share Net Investment Income (Loss) is calculated using the average daily shares method. |
| (b) | Distributions from Capital Gains include short-term capital gains, if any. |
| (c) | Total Return is the combination of changes in net asset value without any sales charge, reinvested dividend income at net asset value and reinvested capital gains distributions at net asset value, if any. Total Return is not annualized. |
| (d) | After expense reimbursement from the Adviser, where applicable. |
118
Section 5 Financial Highlights
Nuveen International Select Fund
| | | | | | | | | | | | | | | | | | | | | | | | | | | | | | | | | | | | | | | | | | | | | | | | | | | | |
Class
(Commencement
Date) | | | | | Investment Operations | | | Less Distributions | | | | | | | | | Ratios/Supplemental Data | |
Year Ended
October 31, | | Beginning
Net Asset
Value | | | Net
Investment
Income
(Loss)(a) | | | Net
Realized/
Unrealized
Gain (Loss) | | | Total | | | Net
Investment
Income | | | Capital
Gains(b) | | | Total | | | Ending
Net
Asset
Value | | | Total
Return(c) | | | Ending
Net
Assets
(000) | | | Ratios of
Expenses
to Average
Net
Assets(d) | | | Ratios of
Net
Investment
Income
(Loss) to
Average
Net
Assets(d) | | | Portfolio
Turnover
Rate | |
| | | | | | | | | | | | | |
| Class A (12/06) | | | | | | | | | | | | | | | | | | | | | | | | | | | | | | | | | | | | | | | | | | | | | | | | | | | | |
| 2012 | | $ | 8.85 | | | $ | .08 | | | $ | .24 | | | $ | .32 | | | $ | (.11 | ) | | $ | (.10 | ) | | $ | (.21 | ) | | $ | 8.96 | | | | 3.83 | % | | $ | 4,060 | | | | 1.48 | % | | | .93 | % | | | 49 | % |
| 2011 | | | 9.54 | | | | .09 | | | | (.72 | ) | | | (.63 | ) | | | (.06 | ) | | | — | | | | (.06 | ) | | | 8.85 | | | | (6.70 | ) | | | 4,388 | | | | 1.46 | | | | .96 | | | | 59 | |
| 2010 | | | 8.48 | | | | .06 | | | | 1.02 | | | | 1.08 | | | | (.02 | ) | | | — | | | | (.02 | ) | | | 9.54 | | | | 12.72 | | | | 5,530 | | | | 1.49 | | | | .69 | | | | 47 | |
| 2009 | | | 6.53 | | | | .07 | | | | 2.00 | | | | 2.07 | | | | (.12 | ) | | | — | | | | (.12 | ) | | | 8.48 | | | | 32.32 | | | | 3,029 | | | | 1.49 | | | | 1.04 | | | | 64 | |
| 2008 | | | 12.15 | | | | .15 | | | | (5.52 | ) | | | (5.37 | ) | | | (.06 | ) | | | (.19 | ) | | | (.25 | ) | | | 6.53 | | | | (45.00 | ) | | | 1,904 | | | | 1.49 | | | | 1.52 | | | | 63 | |
| | | | | | | | | | | | | |
| Class C (12/06) | | | | | | | | | | | | | | | | | | | | | | | | | | | | | | | | | | | | | | | | | | | | | | | | | | | | |
| 2012 | | | 8.72 | | | | .02 | | | | .24 | | | | .26 | | | | (.04 | ) | | | (.10 | ) | | | (.14 | ) | | | 8.84 | | | | 3.09 | | | | 644 | | | | 2.23 | | | | .20 | | | | 49 | |
| 2011 | | | 9.43 | | | | .02 | | | | (.72 | ) | | | (.70 | ) | | | (.01 | ) | | | — | | | | (.01 | ) | | | 8.72 | | | | (7.45 | ) | | | 717 | | | | 2.21 | | | | .21 | | | | 59 | |
| 2010 | | | 8.42 | | | | .01 | | | | 1.00 | | | | 1.01 | | | | — | | | | — | | | | — | | | | 9.43 | | | | 12.00 | | | | 816 | | | | 2.24 | | | | .08 | | | | 47 | |
| 2009 | | | 6.46 | | | | .03 | | | | 1.97 | | | | 2.00 | | | | (.04 | ) | | | — | | | | (.04 | ) | | | 8.42 | | | | 31.43 | | | | 244 | | | | 2.24 | | | | .40 | | | | 64 | |
| 2008 | | | 12.07 | | | | .09 | | | | (5.48 | ) | | | (5.39 | ) | | | (.03 | ) | | | (.19 | ) | | | (.22 | ) | | | 6.46 | | | | (45.39 | ) | | | 226 | | | | 2.24 | | | | .92 | | | | 63 | |
| | | | | | | | | | | | | |
| Class I (12/06) | | | | | | | | | | | | | | | | | | | | | | | | | | | | | | | | | | | | | | | | | | | | | | | | | | | | |
| 2012 | | | 8.87 | | | | .10 | | | | .24 | | | | .34 | | | | (.13 | ) | | | (.10 | ) | | | (.23 | ) | | | 8.98 | | | | 4.12 | | | | 428,624 | | | | 1.23 | | | | 1.18 | | | | 49 | |
| 2011 | | | 9.57 | | | | .12 | | | | (.74 | ) | | | (.62 | ) | | | (.08 | ) | | | — | | | | (.08 | ) | | | 8.87 | | | | (6.60 | ) | | | 578,597 | | | | 1.21 | | | | 1.23 | | | | 59 | |
| 2010 | | | 8.49 | | | | .09 | | | | 1.02 | | | | 1.11 | | | | (.03 | ) | | | — | | | | (.03 | ) | | | 9.57 | | | | 13.14 | | | | 848,165 | | | | 1.24 | | | | .98 | | | | 47 | |
| 2009 | | | 6.55 | | | | .08 | | | | 2.01 | | | | 2.09 | | | | (.15 | ) | | | — | | | | (.15 | ) | | | 8.49 | | | | 32.68 | | | | 584,667 | | | | 1.24 | | | | 1.17 | | | | 64 | |
| 2008 | | | 12.17 | | | | .17 | | | | (5.52 | ) | | | (5.35 | ) | | | (.08 | ) | | | (.19 | ) | | | (.27 | ) | | | 6.55 | | | | (44.86 | ) | | | 249,805 | | | | 1.24 | | | | 1.72 | | | | 63 | |
| (a) | Per share Net Investment Income (Loss) is calculated using the average daily shares method. |
| (b) | Distributions from Capital Gains include short-term capital gains, if any. |
| (c) | Total Return is the combination of changes in net asset value without any sales charge, reinvested dividend income at net asset value and reinvested capital gains distributions at net asset value, if any. Total Return is not annualized. |
| (d) | After expense reimbursement from the Adviser, where applicable. |
Section 5 Financial Highlights
119
Nuveen Large Cap Growth Opportunities Fund
| | | | | | | | | | | | | | | | | | | | | | | | | | | | | | | | | | | | | | | | | | | | | | | | | | | | |
Class
(Commencement
Date) | | | | | Investment Operations | | | Less Distributions | | | | | | | | | Ratios/Supplemental Data | |
Year Ended
October 31, | | Beginning
Net Asset
Value | | | Net
Investment
Income
(Loss)(a) | | | Net
Realized/
Unrealized
Gain (Loss) | | | Total | | | Net
Investment
Income | | | Capital
Gains(b) | | | Total | | | Ending
Net
Asset
Value | | | Total
Return(c) | | | Ending
Net
Assets
(000) | | | Ratios of
Expenses
to Average
Net
Assets(d) | | | Ratios of
Net
Investment
Income
(Loss) to
Average
Net
Assets(d) | | | Portfolio
Turnover
Rate | |
| | | | | | | | | | | | |
| Class A (1/95) | | | | | | | | | | | | | | | | | | | | | | | | | | | | | | | | | | | | | | | | | | | | | | | | | |
| 2012 | | $ | 32.92 | | | $ | (.13 | ) | | $ | 2.46 | | | $ | 2.33 | | | $ | — | | | $ | (1.16 | ) | | $ | (1.16 | ) | | $ | 34.09 | | | | 7.66 | % | | $ | 134,788 | | | | 1.23 | % | | | (0.39 | )% | | | 73 | % |
| 2011 | | | 30.24 | | | | (.15 | ) | | | 2.83 | | | | 2.68 | | | | — | | | | — | | | | — | | | | 32.92 | | | | 8.86 | | | | 84,875 | | | | 1.20 | | | | (.46 | ) | | | 88 | |
| 2010 | | | 24.23 | | | | (.09 | ) | | | 6.15 | | | | 6.06 | | | | (.05 | ) | | | — | | | | (.05 | ) | | | 30.24 | | | | 25.03 | | | | 66,409 | | | | 1.20 | | | | (.35 | ) | | | 106 | |
| 2009 | | | 21.52 | | | | .05 | | | | 2.68 | | | | 2.73 | | | | (.02 | ) | | | — | | | | (.02 | ) | | | 24.23 | | | | 12.73 | | | | 56,963 | | | | 1.22 | | | | .24 | | | | 112 | |
| 2008 | | | 36.27 | | | | .02 | | | | (11.65 | ) | | | (11.63 | ) | | | — | | | | (3.12 | ) | | | (3.12 | ) | | | 21.52 | | | | (34.81 | ) | | | 53,430 | | | | 1.20 | | | | .07 | | | | 92 | |
| | | | | | | | | | | | |
| Class B (3/99) | | | | | | | | | | | | | | | | | | | | | | | | | | | | | | | | | | | | | | | | | | | | | | | | | |
| 2012 | | | 29.90 | | | | (.33 | ) | | | 2.24 | | | | 1.91 | | | | — | | | | (1.16 | ) | | | (1.16 | ) | | | 30.65 | | | | 7.00 | | | | 1,481 | | | | 1.98 | | | | (1.07 | ) | | | 73 | |
| 2011 | | | 27.68 | | | | (.36 | ) | | | 2.58 | | | | 2.22 | | | | — | | | | — | | | | — | | | | 29.90 | | | | 8.02 | | | | 2,411 | | | | 1.95 | | | | (1.19 | ) | | | 88 | |
| 2010 | | | 22.31 | | | | (.26 | ) | | | 5.63 | | | | 5.37 | | | | — | | | | — | | | | — | | | | 27.68 | | | | 24.07 | | | | 3,473 | | | | 1.95 | | | | (1.06 | ) | | | 106 | |
| 2009 | | | 19.93 | | | | (.09 | ) | | | 2.47 | | | | 2.38 | | | | — | | | | — | | | | — | | | | 22.31 | | | | 11.94 | | | | 4,749 | | | | 1.97 | | | | (.48 | ) | | | 112 | |
| 2008 | | | 34.08 | | | | (.19 | ) | | | (10.84 | ) | | | (11.03 | ) | | | — | | | | (3.12 | ) | | | (3.12 | ) | | | 19.93 | | | | (35.33 | ) | | | 5,907 | | | | 1.95 | | | | (.68 | ) | | | 92 | |
| | | | | | | | | | | | |
| Class C (9/01) | | | | | | | | | | | | | | | | | | | | | | | | | | | | | | | | | | | | | | | | | | | | | | | | | |
| 2012 | | | 30.57 | | | | (.35 | ) | | | 2.28 | | | | 1.93 | | | | — | | | | (1.16 | ) | | | (1.16 | ) | | | 31.34 | | | | 6.88 | | | | 11,193 | | | | 1.98 | | | | (1.14 | ) | | | 73 | |
| 2011 | | | 28.30 | | | | (.37 | ) | | | 2.64 | | | | 2.27 | | | | — | | | | — | | | | — | | | | 30.57 | | | | 8.02 | | | | 7,832 | | | | 1.95 | | | | (1.21 | ) | | | 88 | |
| 2010 | | | 22.81 | | | | (.27 | ) | | | 5.76 | | | | 5.49 | | | | — | | | | — | | | | — | | | | 28.30 | | | | 24.07 | | | | 4,220 | | | | 1.95 | | | | (1.08 | ) | | | 106 | |
| 2009 | | | 20.38 | | | | (.10 | ) | | | 2.53 | | | | 2.43 | | | | — | | | | — | | | | — | | | | 22.81 | | | | 11.92 | | | | 4,509 | | | | 1.97 | | | | (.51 | ) | | | 112 | |
| 2008 | | | 34.77 | | | | (.19 | ) | | | (11.08 | ) | | | (11.27 | ) | | | — | | | | (3.12 | ) | | | (3.12 | ) | | | 20.38 | | | | (35.31 | ) | | | 4,368 | | | | 1.95 | | | | (.68 | ) | | | 92 | |
| | | | | | | | | | | | |
| Class R3 (11/00) | | | | | | | | | | | | | | | | | | | | | | | | | | | | | | | | | | | | | | | | | | | | | | | | | |
| 2012 | | | 32.39 | | | | (.22 | ) | | | 2.43 | | | | 2.21 | | | | — | | | | (1.16 | ) | | | (1.16 | ) | | | 33.44 | | | | 7.40 | | | | 9,658 | | | | 1.48 | | | | (.67 | ) | | | 73 | |
| 2011 | | | 29.83 | | | | (.23 | ) | | | 2.79 | | | | 2.56 | | | | — | | | | — | | | | — | | | | 32.39 | | | | 8.58 | | | | 3,431 | | | | 1.45 | | | | (.72 | ) | | | 88 | |
| 2010 | | | 23.92 | | | | (.16 | ) | | | 6.07 | | | | 5.91 | | | | — | | | | — | | | | — | | | | 29.83 | | | | 24.71 | | | | 742 | | | | 1.45 | | | | (.59 | ) | | | 106 | |
| 2009 | | | 21.26 | | | | (.01 | ) | | | 2.67 | | | | 2.66 | | | | — | | | | — | | | | — | | | | 23.92 | | | | 12.51 | | | | 667 | | | | 1.47 | | | | (.05 | ) | | | 112 | |
| 2008 | | | 35.97 | | | | (.05 | ) | | | (11.54 | ) | | | (11.59 | ) | | | — | | | | (3.12 | ) | | | (3.12 | ) | | | 21.26 | | | | (35.00 | ) | | | 454 | | | | 1.45 | | | | (.18 | ) | | | 92 | |
| | | | | | | | | | | | |
| Class I (12/92) | | | | | | | | | | | | | | | | | | | | | | | | | | | | | | | | | | | | | | | | | | | | | | | | | |
| 2012 | | | 34.19 | | | | (.04 | ) | | | 2.56 | | | | 2.52 | | | | — | | | | (1.16 | ) | | | (1.16 | ) | | | 35.55 | | | | 7.94 | | | | 418,144 | | | | .98 | | | | (.11 | ) | | | 73 | |
| 2011 | | | 31.33 | | | | (.06 | ) | | | 2.92 | | | | 2.86 | | | | — | | | | — | | | | — | | | | 34.19 | | | | 9.13 | | | | 435,619 | | | | .95 | | | | (.17 | ) | | | 88 | |
| 2010 | | | 25.09 | | | | (.03 | ) | | | 6.38 | | | | 6.35 | | | | (.11 | ) | | | — | | | | (.11 | ) | | | 31.33 | | | | 25.34 | | | | 546,605 | | | | .95 | | | | (.10 | ) | | | 106 | |
| 2009 | | | 22.31 | | | | .11 | | | | 2.77 | | | | 2.88 | | | | (.10 | ) | | | — | | | | (.10 | ) | | | 25.09 | | | | 13.02 | | | | 482,222 | | | | .97 | | | | .48 | | | | 112 | |
| 2008 | | | 37.42 | | | | .10 | | | | (12.07 | ) | | | (11.97 | ) | | | (.02 | ) | | | (3.12 | ) | | | (3.14 | ) | | | 22.31 | | | | (34.65 | ) | | | 417,337 | | | | .95 | | | | .32 | | | | 92 | |
| (a) | Per share Net Investment Income (Loss) is calculated using the average daily shares method. |
| (b) | Distributions from Capital Gains include short-term capital gains, if any. |
| (c) | Total Return is the combination of changes in net asset value without any sales charge, reinvested dividend income at net asset value and reinvested capital gains distributions at net asset value, if any. Total Return is not annualized. |
| (d) | After expense reimbursement from the Adviser, where applicable. |
120
Section 5 Financial Highlights
Nuveen Large Cap Select Fund
| | | | | | | | | | | | | | | | | | | | | | | | | | | | | | | | | | | | | | | | | | | | | | | | | | | | |
Class
(Commencement
Date) | | | | | Investment Operations | | | Less Distributions | | | | | | | | | Ratios/Supplemental Data | |
Year Ended
October 31, | | Beginning
Net Asset
Value | | | Net
Investment
Income
(Loss)(a) | | | Net
Realized/
Unrealized
Gain (Loss) | | | Total | | | Net
Investment
Income | | | Capital
Gains(b) | | | Total | | | Ending
Net
Asset
Value | | | Total
Return(c) | | | Ending
Net
Assets
(000) | | | Ratios of
Expenses
to Average
Net
Assets(d) | | | Ratios of
Net
Investment
Income
(Loss) to
Average
Net
Assets(d) | | | Portfolio
Turnover
Rate | |
| | | | | | | | | | | | |
| Class A (1/03) | | | | | | | | | | | | | | | | | | | | | | | | | | | | | | | | | | | | | | | | | | | | | | | | | |
| 2012 | | $ | 11.73 | | | $ | .03 | | | $ | 1.66 | | | $ | 1.69 | | | $ | — | | | $ | — | | | $ | — | | | $ | 13.42 | | | | 14.41 | % | | $ | 2,924 | | | | 1.43 | % | | | .26 | % | | | 127 | % |
| 2011 | | | 11.65 | | | | (.02 | ) | | | .10 | | | | .08 | | | | — | | | | — | | | | — | | | | 11.73 | | | | .69 | | | | 2,938 | | | | 1.20 | | | | (.18 | ) | | | 139 | |
| 2010 | | | 9.80 | | | | (.01 | ) | | | 1.92 | | | | 1.91 | | | | (.06 | ) | | | — | | | | (.06 | ) | | | 11.65 | | | | 19.49 | | | | 3,487 | | | | 1.32 | | | | (.06 | ) | | | 140 | |
| 2009 | | | 8.83 | | | | .04 | | | | .97 | | | | 1.01 | | | | (.04 | ) | | | — | | | | (.04 | ) | | | 9.80 | | | | 11.54 | | | | 3,292 | | | | 1.29 | | | | .52 | | | | 185 | |
| 2008 | | | 17.05 | | | | .06 | | | | (6.04 | ) | | | (5.98 | ) | | | (.04 | ) | | | (2.20 | ) | | | (2.24 | ) | | | 8.83 | | | | (39.81 | ) | | | 3,608 | | | | 1.21 | | | | .49 | | | | 210 | |
| | | | | | | | | | | | |
| Class C (1/03) | | | | | | | | | | | | | | | | | | | | | | | | | | | | | | | | | | | | | | | | | | | | | | | | | |
| 2012 | | | 11.21 | | | | (.06 | ) | | | 1.58 | | | | 1.52 | | | | — | | | | — | | | | — | | | | 12.73 | | | | 13.65 | | | | 195 | | | | 2.18 | | | | (.49 | ) | | | 127 | |
| 2011 | | | 11.22 | | | | (.11 | ) | | | .10 | | | | (.01 | ) | | | — | | | | — | | | | — | | | | 11.21 | | | | (.09 | ) | | | 183 | | | | 1.95 | | | | (.90 | ) | | | 139 | |
| 2010 | | | 9.46 | | | | (.08 | ) | | | 1.84 | | | | 1.76 | | | | — | | | | — | | | | — | | | | 11.22 | | | | 18.60 | | | | 175 | | | | 2.07 | | | | (.79 | ) | | | 140 | |
| 2009 | | | 8.56 | | | | (.02 | ) | | | .93 | | | | .91 | | | | (.01 | ) | | | — | | | | (.01 | ) | | | 9.46 | | | | 10.64 | | | | 186 | | | | 2.05 | | | | (.23 | ) | | | 185 | |
| 2008 | | | 16.69 | | | | (.03 | ) | | | (5.90 | ) | | | (5.93 | ) | | | — | | | | (2.20 | ) | | | (2.20 | ) | | | 8.56 | | | | (40.38 | ) | | | 180 | | | | 1.96 | | | | (.26 | ) | | | 210 | |
| | | | | | | | | | | | |
| Class I (1/03) | | | | | | | | | | | | | | | | | | | | | | | | | | | | | | | | | | | | | | | | | | | | | | | | | |
| 2012 | | | 11.80 | | | | .07 | | | | 1.66 | | | | 1.73 | | | | (.01 | ) | | | — | | | | (.01 | ) | | | 13.52 | | | | 14.79 | | | | 34,554 | | | | 1.18 | | | | .54 | | | | 127 | |
| 2011 | | | 11.71 | | | | .01 | | | | .10 | | | | .11 | | | | (.02 | ) | | | — | | | | (.02 | ) | | | 11.80 | | | | .89 | | | | 58,314 | | | | .95 | | | | .07 | | | | 139 | |
| 2010 | | | 9.85 | | | | .02 | | | | 1.92 | | | | 1.94 | | | | (.08 | ) | | | — | | | | (.08 | ) | | | 11.71 | | | | 19.75 | | | | 130,803 | | | | 1.07 | | | | .21 | | | | 140 | |
| 2009 | | | 8.87 | | | | .07 | | | | .96 | | | | 1.03 | | | | (.05 | ) | | | — | | | | (.05 | ) | | | 9.85 | | | | 11.81 | | | | 147,231 | | | | 1.04 | | | | .82 | | | | 185 | |
| 2008 | | | 17.10 | | | | .09 | | | | (6.05 | ) | | | (5.96 | ) | | | (.07 | ) | | | (2.20 | ) | | | (2.27 | ) | | | 8.87 | | | | (39.63 | ) | | | 207,904 | | | | .96 | | | | .74 | | | | 210 | |
| (a) | Per share Net Investment Income (Loss) is calculated using the average daily shares method. |
| (b) | Distributions from Capital Gains include short-term capital gains, if any. |
| (c) | Total Return is the combination of changes in net asset value without any sales charge, reinvested dividend income at net asset value and reinvested capital gains distributions at net asset value, if any. Total Return is not annualized. |
| (d) | After expense reimbursement from the Adviser, where applicable. |
| * | Rounds to less than $.01 per share. |
Section 5 Financial Highlights
121
Nuveen Mid Cap Growth Opportunities Fund
| | | | | | | | | | | | | | | | | | | | | | | | | | | | | | | | | | | | | | | | | | | | | | | | | | | | |
Class
(Commencement
Date) | | | | | Investment Operations | | | Less Distributions | | | | | | | | | Ratios/Supplemental Data | |
Year Ended
October 31, | | Beginning
Net Asset
Value | | | Net
Investment
Income
(Loss)(a) | | | Net
Realized/
Unrealized
Gain (Loss) | | | Total | | | Net
Investment
Income | | | Capital
Gains(b) | | | Total | | | Ending
Net
Asset
Value | | | Total
Return(c) | | | Ending
Net
Assets
(000) | | | Ratios of
Expenses
to Average
Net
Assets(d) | | | Ratios of
Net
Investment
Income
(Loss) to
Average
Net
Assets(d) | | | Portfolio
Turnover
Rate | |
| | | | | | | | | | | | |
| Class A (1/95) | | | | | | | | | | | | | | | | | | | | | | | | | | | | | | | | | | | | | | | | | | | | | | | | | |
| 2012 | | $ | 41.36 | | | $ | (.16 | ) | | $ | 2.77 | | | $ | 2.61 | | | $ | — | | | $ | (1.59 | ) | | $ | (1.59 | ) | | $ | 42.38 | | | | 6.88 | % | | $ | 306,507 | | | | 1.27 | % | | | (.39 | )% | | | 113 | % |
| 2011 | | | 37.26 | | | | (.22 | ) | | | 4.32 | | | | 4.10 | | | | — | | | | — | | | | — | | | | 41.36 | | | | 11.00 | | | | 289,038 | | | | 1.26 | | | | (.53 | ) | | | 114 | |
| 2010 | | | 28.83 | | | | (.18 | ) | | | 8.61 | | | | 8.43 | | | | — | | | | — | | | | — | | | | 37.26 | | | | 29.24 | | | | 275,040 | | | | 1.23 | | | | (.57 | ) | | | 114 | |
| 2009 | | | 23.88 | | | | (.08 | ) | | | 5.03 | | | | 4.95 | | | | — | | | | — | | | | — | | | | 28.83 | | | | 20.73 | | | | 231,743 | | | | 1.23 | | | | (.33 | ) | | | 123 | |
| 2008 | | | 46.57 | | | | (.16 | ) | | | (17.86 | ) | | | (18.02 | ) | | | — | | | | (4.67 | ) | | | (4.67 | ) | | | 23.88 | | | | (42.75 | ) | | | 209,052 | | | | 1.22 | | | | (.43 | ) | | | 113 | |
| | | | | | | | | | | | |
| Class B (3/99) | | | | | | | | | | | | | | | | | | | | | | | | | | | | | | | | | | | | | | | | | | | | | | | | | |
| 2012 | | | 35.93 | | | | (.42 | ) | | | 2.38 | | | | 1.96 | | | | — | | | | (1.59 | ) | | | (1.59 | ) | | | 36.30 | | | | 6.08 | | | | 2,576 | | | | 2.02 | | | | (1.15 | ) | | | 113 | |
| 2011 | | | 32.62 | | | | (.46 | ) | | | 3.77 | | | | 3.31 | | | | — | | | | — | | �� | | — | | | | 35.93 | | | | 10.15 | | | | 4,127 | | | | 2.01 | | | | (1.26 | ) | | | 114 | |
| 2010 | | | 25.43 | | | | (.37 | ) | | | 7.56 | | | | 7.19 | | | | — | | | | — | | | | — | | | | 32.62 | | | | 28.27 | | | | 5,490 | | | | 1.98 | | | | (1.31 | ) | | | 114 | |
| 2009 | | | 21.22 | | | | (.23 | ) | | | 4.44 | | | | 4.21 | | | | — | | | | — | | | | — | | | | 25.43 | | | | 19.84 | | | | 6,762 | | | | 1.98 | | | | (1.06 | ) | | | 123 | |
| 2008 | | | 42.21 | | | | (.38 | ) | | | (15.94 | ) | | | (16.32 | ) | | | — | | | | (4.67 | ) | | | (4.67 | ) | | | 21.22 | | | | (43.18 | ) | | | 7,241 | | | | 1.97 | | | | (1.18 | ) | | | 113 | |
| | | | | | | | | | | | |
| Class C (9/01) | | | | | | | | | | | | | | | | | | | | | | | | | | | | | | | | | | | | | | | | | | | | | | | | | |
| 2012 | | | 37.70 | | | | (.43 | ) | | | 2.49 | | | | 2.06 | | | | — | | | | (1.59 | ) | | | (1.59 | ) | | | 38.17 | | | | 6.06 | | | | 17,874 | | | | 2.02 | | | | (1.13 | ) | | | 113 | |
| 2011 | | | 34.21 | | | | (.49 | ) | | | 3.98 | | | | 3.49 | | | | — | | | | — | | | | — | | | | 37.70 | | | | 10.20 | | | | 14,314 | | | | 2.01 | | | | (1.28 | ) | | | 114 | |
| 2010 | | | 26.67 | | | | (.39 | ) | | | 7.93 | | | | 7.54 | | | | — | | | | — | | | | — | | | | 34.21 | | | | 28.27 | | | | 13,564 | | | | 1.98 | | | | (1.32 | ) | | | 114 | |
| 2009 | | | 22.26 | | | | (.24 | ) | | | 4.65 | | | | 4.41 | | | | — | | | | — | | | | — | | | | 26.67 | | | | 19.81 | | | | 12,894 | | | | 1.98 | | | | (1.07 | ) | | | 123 | |
| 2008 | | | 44.03 | | | | (.40 | ) | | | (16.70 | ) | | | (17.10 | ) | | | — | | | | (4.67 | ) | | | (4.67 | ) | | | 22.26 | | | | (43.16 | ) | | | 13,011 | | | | 1.97 | | | | (1.18 | ) | | | 113 | |
| | | | | | | | | | | | |
| Class R3 (12/00) | | | | | | | | | | | | | | | | | | | | | | | | | | | | | | | | | | | | | | | | | | | | | | | | | |
| 2012 | | | 40.50 | | | | (.27 | ) | | | 2.71 | | | | 2.44 | | | | — | | | | (1.59 | ) | | | (1.59 | ) | | | 41.35 | | | | 6.59 | | | | 38,869 | | | | 1.52 | | | | (.64 | ) | | | 113 | |
| 2011 | | | 36.58 | | | | (.31 | ) | | | 4.23 | | | | 3.92 | | | | — | | | | — | | | | — | | | | 40.50 | | | | 10.72 | | | | 34,929 | | | | 1.51 | | | | (.77 | ) | | | 114 | |
| 2010 | | | 28.37 | | | | (.26 | ) | | | 8.47 | | | | 8.21 | | | | — | | | | — | | | | — | | | | 36.58 | | | | 28.94 | | | | 33,772 | | | | 1.48 | | | | (.82 | ) | | | 114 | |
| 2009 | | | 23.56 | | | | (.14 | ) | | | 4.95 | | | | 4.81 | | | | — | | | | — | | | | — | | | | 28.37 | | | | 20.42 | | | | 26,822 | | | | 1.48 | | | | (.59 | ) | | | 123 | |
| 2008 | | | 46.11 | | | | (.24 | ) | | | (17.64 | ) | | | (17.88 | ) | | | — | | | | (4.67 | ) | | | (4.67 | ) | | | 23.56 | | | | (42.88 | ) | | | 21,246 | | | | 1.47 | | | | (.69 | ) | | | 113 | |
| | | | | | | | | | | | |
| Class I (12/89) | | | | | | | | | | | | | | | | | | | | | | | | | | | | | | | | | | | | | | | | | | | | | | | | | |
| 2012 | | | 44.62 | | | | (.06 | ) | | | 3.00 | | | | 2.94 | | | | — | | | | (1.59 | ) | | | (1.59 | ) | | | 45.97 | | | | 7.13 | | | | 744,480 | | | | 1.02 | | | | (.14 | ) | | | 113 | |
| 2011 | | | 40.09 | | | | (.10 | ) | | | 4.63 | | | | 4.53 | | | | — | | | | — | | | | — | | | | 44.62 | | | | 11.30 | | | | 728,843 | | | | 1.01 | | | | (.21 | ) | | | 114 | |
| 2010 | | | 30.94 | | | | (.11 | ) | | | 9.26 | | | | 9.15 | | | | — | | | | — | | | | — | | | | 40.09 | | | | 29.57 | | | | 993,053 | | | | .98 | | | | (.31 | ) | | | 114 | |
| 2009 | | | 25.57 | | | | (.02 | ) | | | 5.39 | | | | 5.37 | | | | — | | | | — | | | | — | | | | 30.94 | | | | 21.00 | | | | 907,825 | | | | .98 | | | | (.09 | ) | | | 123 | |
| 2008 | | | 49.40 | | | | (.07 | ) | | | (19.09 | ) | | | (19.16 | ) | | | — | | | | (4.67 | ) | | | (4.67 | ) | | | 25.57 | | | | (42.59 | ) | | | 732,559 | | | | .97 | | | | (.18 | ) | | | 113 | |
| (a) | Per share Net Investment Income (Loss) is calculated using the average daily shares method. |
| (b) | Distributions from Capital Gains include short-term capital gains, if any. |
| (c) | Total Return is the combination of changes in net asset value without any sales charge, reinvested dividend income at net asset value and reinvested capital gains distributions at net asset value, if any. Total Return is not annualized. |
| (d) | After expense reimbursement from the Adviser, where applicable. |
122
Section 5 Financial Highlights
Nuveen Mid Cap Index Fund
| | | | | | | | | | | | | | | | | | | | | | | | | | | | | | | | | | | | | | | | | | | | | | | | | | | | |
Class
(Commencement
Date) | | | | | Investment Operations | | | Less Distributions | | | | | | | | | Ratios/Supplemental Data | |
Year Ended
October 31, | | Beginning
Net Asset
Value | | | Net
Investment
Income
(Loss)(a) | | | Net
Realized/
Unrealized
Gain (Loss) | | | Total | | | Net
Investment
Income | | | Capital
Gains(b) | | | Total | | | Ending Net Asset Value | | | Total
Return(c) | | | Ending
Net
Assets
(000) | | | Ratios of
Expenses
to Average
Net
Assets(d) | | | Ratio of
Net
Investment
Income
(Loss) to
Average
Net
Assets(d) | | | Portfolio
Turnover
Rate | |
| | | | | | | | | | | | | |
| Class A (11/99) | | | | | | | | | | | | | | | | | | | | | | | | | | | | | | | | | | | | | | | | | | | | | | | | | | | | |
| 2012 | | $ | 12.87 | | | $ | .09 | | | $ | 1.31 | | | $ | 1.40 | | | $ | (.03 | ) | | $ | (.48 | ) | | $ | (.51 | ) | | $ | 13.76 | | | | 11.48 | % | | $ | 104,467 | | | | .74 | % | | | .67 | % | | | 7 | % |
| 2011 | | | 11.98 | | | | .05 | | | | .92 | | | | .97 | | | | (.08 | ) | | | — | | | | (.08 | ) | | | 12.87 | | | | 8.07 | | | | 68,856 | | | | .75 | | | | .36 | | | | 23 | |
| 2010 | | | 9.52 | | | | .09 | | | | 2.45 | | | | 2.54 | | | | (.08 | ) | | | — | | | | (.08 | ) | | | 11.98 | | | | 26.79 | | | | 36,499 | | | | .74 | | | | .82 | | | | 8 | |
| 2009 | | | 8.83 | | | | .09 | | | | 1.27 | | | | 1.36 | | | | (.07 | ) | | | (.60 | ) | | | (.67 | ) | | | 9.52 | | | | 17.53 | | | | 22,766 | | | | .75 | | | | 1.15 | | | | 18 | |
| 2008 | | | 15.69 | | | | .13 | | | | (5.30 | ) | | | (5.17 | ) | | | (.10 | ) | | | (1.59 | ) | | | (1.69 | ) | | | 8.83 | | | | (36.46 | ) | | | 11,374 | | | | .74 | | | | 1.04 | | | | 15 | |
| | | | | | | | | | | | | |
| Class C (9/01) | | | | | | | | | | | | | | | | | | | | | | | | | | | | | | | | | | | | | | | | | | | | | | | | | | | | |
| 2012 | | | 12.51 | | | | (.01 | ) | | | 1.26 | | | | 1.25 | | | | — | | | | (.48 | ) | | | (.48 | ) | | | 13.28 | | | | 10.60 | | | | 5,290 | | | | 1.49 | | | | (.07 | ) | | | 7 | |
| 2011 | | | 11.67 | | | | (.05 | ) | | | .89 | | | | .84 | | | | — | | | | — | | | | — | | | | 12.51 | | | | 7.20 | | | | 3,302 | | | | 1.50 | | | | (.39 | ) | | | 23 | |
| 2010 | | | 9.28 | | | | .01 | | | | 2.39 | | | | 2.40 | | | | (.01 | ) | | | — | | | | (.01 | ) | | | 11.67 | | | | 25.86 | | | | 3,100 | | | | 1.49 | | | | .07 | | | | 8 | |
| 2009 | | | 8.64 | | | | .04 | | | | 1.23 | | | | 1.27 | | | | (.03 | ) | | | (.60 | ) | | | (.63 | ) | | | 9.28 | | | | 16.68 | | | | 2,766 | | | | 1.50 | | | | .48 | | | | 18 | |
| 2008 | | | 15.41 | | | | .04 | | | | (5.19 | ) | | | (5.15 | ) | | | (.03 | ) | | | (1.59 | ) | | | (1.62 | ) | | | 8.64 | | | | (36.91 | ) | | | 3,101 | | | | 1.48 | | | | .30 | | | | 15 | |
| | | | | | | | | | | | | |
| Class R3 (11/00) | | | | | | | | | | | | | | | | | | | | | | | | | | | | | | | | | | | | | | | | | | | | | | | | | | | | |
| 2012 | | | 12.73 | | | | .06 | | | | 1.28 | | | | 1.34 | | | | — | | | | (.48 | ) | | | (.48 | ) | | | 13.59 | | | | 11.14 | | | | 113,834 | | | | .99 | | | | .42 | | | | 7 | |
| 2011 | | | 11.86 | | | | .01 | | | | .92 | | | | .93 | | | | (.06 | ) | | | — | | | | (.06 | ) | | | 12.73 | | | | 7.83 | | | | 65,060 | | | | 1.00 | | | | .11 | | | | 23 | |
| 2010 | | | 9.43 | | | | .06 | | | | 2.43 | | | | 2.49 | | | | (.06 | ) | | | — | | | | (.06 | ) | | | 11.86 | | | | 26.48 | | | | 26,458 | | | | .99 | | | | .56 | | | | 8 | |
| 2009 | | | 8.76 | | | | .07 | | | | 1.26 | | | | 1.33 | | | | (.06 | ) | | | (.60 | ) | | | (.66 | ) | | | 9.43 | | | | 17.29 | | | | 12,212 | | | | 1.00 | | | | .89 | | | | 18 | |
| 2008 | | | 15.60 | | | | .10 | | | | (5.27 | ) | | | (5.17 | ) | | | (.08 | ) | | | (1.59 | ) | | | (1.67 | ) | | | 8.76 | | | | (36.66 | ) | | | 8,157 | | | | 1.00 | | | | .80 | | | | 15 | |
| | | | | | | | | | | | | |
| Class I (11/99) | | | | | | | | | | | | | | | | | | | | | | | | | | | | | | | | | | | | | | | | | | | | | | | | | | | | |
| 2012 | | | 12.92 | | | | .12 | | | | 1.32 | | | | 1.44 | | | | (.07 | ) | | | (.48 | ) | | | (.55 | ) | | | 13.81 | | | | 11.80 | | | | 168,328 | | | | .49 | | | | .93 | | | | 7 | |
| 2011 | | | 12.03 | | | | .08 | | | | .91 | | | | .99 | | | | (.10 | ) | | | — | | | | (.10 | ) | | | 12.92 | | | | 8.23 | | | | 170,174 | | | | .50 | | | | .63 | | | | 23 | |
| 2010 | | | 9.55 | | | | .12 | | | | 2.46 | | | | 2.58 | | | | (.10 | ) | | | — | | | | (.10 | ) | | | 12.03 | | | | 27.13 | | | | 202,542 | | | | .49 | | | | 1.07 | | | | 8 | |
| 2009 | | | 8.84 | | | | .12 | | | | 1.27 | | | | 1.39 | | | | (.08 | ) | | | (.60 | ) | | | (.68 | ) | | | 9.55 | | | | 17.92 | | | | 163,432 | | | | .50 | | | | 1.47 | | | | 18 | |
| 2008 | | | 15.70 | | | | .17 | | | | (5.31 | ) | | | (5.14 | ) | | | (.13 | ) | | | (1.59 | ) | | | (1.72 | ) | | | 8.84 | | | | (36.31 | ) | | | 177,038 | | | | .49 | | | | 1.29 | | | | 15 | |
| (a) | Per share Net Investment Income (Loss) is calculated using the average daily shares method. |
| (b) | Distributions from Capital Gains include short-term capital gains, if any. |
| (c) | Total Return is the combination of changes in net asset value, reinvested dividend income at net asset value and reinvested capital gains distributions at net asset value, if any. Total Return is not annualized. |
| (d) | After expense reimbursement from the Adviser, where applicable. |
Section 5 Financial Highlights
123
Nuveen Mid Cap Select Fund(e)
| | | | | | | | | | | | | | | | | | | | | | | | | | | | | | | | | | | | | | | | | | | | | | | | | | | | |
Class
(Commencement
Date) | | | | | Investment Operations | | | Less Distributions | | | | | | | | | Ratios/Supplemental Data | |
Year Ended
October 31, | | Beginning
Net Asset
Value | | | Net
Investment
Income
(Loss)(a) | | | Net
Realized/
Unrealized
Gain (Loss) | | | Total | | | Net
Investment
Income | | | Capital
Gains(b) | | | Total | | | Ending
Net
Asset
Value | | | Total
Return(c) | | | Ending
Net
Assets
(000) | | | Ratios of
Expenses
to Average
Net
Assets(d) | | | Ratio of
Net
Investment
Income
(Loss) to
Average
Net
Assets(d) | | | Portfolio
Turnover
Rate | |
| | | | | | | | | | | |
| Class A (4/94) | | | | | | | | | | | | | | | | | | | | | | | | | | | | | | | | | | | | | | | | | | | | | |
| 2012 | | $ | 9.48 | | | $ | .04 | | | $ | .78 | | | $ | .82 | | | $ | — | | | $ | — | | | $ | — | | | $ | 10.30 | | | | 8.65 | % | | $ | 10,862 | | | | 1.41 | % | | | .39 | % | | | 198 | % |
| 2011 | | | 9.31 | | | | (.05 | ) | | | .22 | | | | .17 | | | | — | | | | — | | | | — | | | | 9.48 | | | | 1.83 | | | | 10,829 | | | | 1.41 | | | | (.48 | ) | | | 148 | |
| 2010 | | | 7.65 | | | | (.02 | ) | | | 1.70 | | | | 1.68 | | | | (.02 | ) | | | — | | | | (.02 | ) | | | 9.31 | | | | 22.03 | | | | 12,402 | | | | 1.41 | | | | (.27 | ) | | | 154 | |
| 2009 | | | 7.00 | | | | .03 | | | | .62 | | | | .65 | | | | — | | | | — | | | | — | | | | 7.65 | | | | 9.32 | | | | 12,487 | | | | 1.41 | | | | .49 | | | | 186 | |
| 2008 | | | 10.64 | | | | (.01 | ) | | | (3.63 | ) | | | (3.64 | ) | | | — | | | | — | | | | — | | | | 7.00 | | | | (34.21 | ) | | | 12,848 | | | | 1.41 | | | | (.13 | ) | | | 170 | |
| | | | | | | | | | | |
| Class C (2/00) | | | | | | | | | | | | | | | | | | | | | | | | | | | | | | | | | | | | | | | | | | | | | |
| 2012 | | | 8.70 | | | | (.03 | ) | | | .72 | | | | .69 | | | | — | | | | — | | | | — | | | | 9.39 | | | | 7.93 | | | | 1,710 | | | | 2.16 | | | | (.35 | ) | | | 198 | |
| 2011 | | | 8.61 | | | | (.11 | ) | | | .20 | | | | .09 | | | | — | | | | — | | | | — | | | | 8.70 | | | | 1.05 | | | | 1,771 | | | | 2.16 | | | | (1.22 | ) | | | 148 | |
| 2010 | | | 7.12 | | | | (.08 | ) | | | 1.57 | | | | 1.49 | | | | — | | | | — | | | | — | | | | 8.61 | | | | 20.93 | | | | 2,332 | | | | 2.16 | | | | (1.03 | ) | | | 154 | |
| 2009 | | | 6.56 | | | | (.01 | ) | | | .57 | | | | .56 | | | | — | | | | — | | | | — | | | | 7.12 | | | | 8.54 | | | | 2,526 | | | | 2.16 | | | | (.24 | ) | | | 186 | |
| 2008 | | | 10.04 | | | | (.08 | ) | | | (3.40 | ) | | | (3.48 | ) | | | — | | | | — | | | | — | | | | 6.56 | | | | (34.66 | ) | | | 3,068 | | | | 2.16 | | | | (.88 | ) | | | 170 | |
| | | | | | | | | | | |
| Class I (4/94) | | | | | | | | | | | | | | | | | | | | | | | | | | | | | | | | | | | | | | | | | | | | | |
| 2012 | | | 9.91 | | | | .07 | | | | .82 | | | | .89 | | | | — | | | | — | | | | — | | | | 10.80 | | | | 8.98 | | | | 12,805 | | | | 1.16 | | | | .64 | | | | 198 | |
| 2011 | | | 9.71 | | | | (.02 | ) | | | .22 | | | | .20 | | | | — | | | | — | | | | — | | | | 9.91 | | | | 2.06 | | | | 16,646 | | | | 1.16 | | | | (.23 | ) | | | 148 | |
| 2010 | | | 7.98 | | | | — | * | | | 1.77 | | | | 1.77 | | | | (.04 | ) | | | — | | | | (.04 | ) | | | 9.71 | | | | 22.26 | | | | 23,076 | | | | 1.16 | | | | (.03 | ) | | | 154 | |
| 2009 | | | 7.31 | | | | .06 | | | | .64 | | | | .70 | | | | (.03 | ) | | | — | | | | (.03 | ) | | | 7.98 | | | | 9.62 | | | | 27,030 | | | | 1.16 | | | | .81 | | | | 186 | |
| 2008 | | | 11.09 | | | | .01 | | | | (3.79 | ) | | | (3.78 | ) | | | — | | | | — | | | | — | | | | 7.31 | | | | (34.08 | ) | | | 40,409 | | | | 1.16 | | | | .12 | | | | 170 | |
| (a) | Per share Net Investment Income (Loss) is calculated using the average daily shares method. |
| (b) | Distributions from Capital Gains include short-term capital gains, if any. |
| (c) | Total Return is the combination of changes in net asset value without any sales charge, reinvested dividend income at net asset value and reinvested capital gains distributions at net asset value, if any. Total Return is not annualized. |
| (d) | After expense reimbursement from the Adviser, where applicable. |
| (e) | The financial highlights for the period from November 1, 2006 through May 3, 2009 are those of Small-Mid Cap Core Fund, which changed its principal investment strategies and changed its name to Mid Cap Select Fund on May 4, 2009. |
| * | Rounds to less than $.01 per share. |
124
Section 5 Financial Highlights
Nuveen Mid Cap Value Fund
| | | | | | | | | | | | | | | | | | | | | | | | | | | | | | | | | | | | | | | | | | | | | | | | | | | | |
Class
(Commencement
Date) | | | | | Investment Operations | | | Less Distributions | | | | | | | | | Ratios/Supplemental Data | |
Year Ended
October 31, | | Beginning
Net Asset
Value | | | Net
Investment
Income
(Loss)(a) | | | Net
Realized/
Unrealized
Gain (Loss) | | | Total | | | Net
Investment
Income | | | Capital
Gains(b) | | | Total | | | Ending
Net
Asset
Value | | | Total
Return(c) | | | Ending
Net
Assets
(000) | | | Ratios of
Expenses
to Average
Net
Assets(d) | | | Ratios of
Net
Investment
Income
(Loss) to
Average
Net
Assets(d) | | | Portfolio
Turnover
Rate | |
| | | | | | | | | | | | |
| Class A (12/87) | | | | | | | | | | | | | | | | | | | | | | | | | | | | | | | | | | | | | | | | | | | | | | | | | |
| 2012 | | $ | 21.83 | | | $ | .18 | | | $ | 1.35 | | | $ | 1.53 | | | $ | (.14 | ) | | $ | — | | | $ | (.14 | ) | | $ | 23.22 | | | | 7.03 | % | | $ | 35,633 | | | | 1.28 | % | | | .79 | % | | | 140 | % |
| 2011 | | | 22.20 | | | | .07 | | | | (.19 | ) | | | (.12 | ) | | | (.25 | ) | | | — | | | | (.25 | ) | | | 21.83 | | | | (.64 | ) | | | 52,334 | | | | 1.31 | | | | .30 | | | | 123 | |
| 2010 | | | 18.28 | | | | .12 | | | | 4.00 | | | | 4.12 | | | | (.20 | ) | | | — | | | | (.20 | ) | | | 22.20 | | | | 22.65 | | | | 76,667 | | | | 1.25 | | | | .58 | | | | 123 | |
| 2009 | | | 16.13 | | | | .24 | | | | 1.99 | | | | 2.23 | | | | (.08 | ) | | | — | | | | (.08 | ) | | | 18.28 | | | | 13.95 | | | | 130,222 | | | | 1.25 | | | | 1.52 | | | | 106 | |
| 2008 | | | 27.83 | | | | .21 | | | | (9.92 | ) | | | (9.71 | ) | | | (.16 | ) | | | (1.83 | ) | | | (1.99 | ) | | | 16.13 | | | | (37.32 | ) | | | 124,275 | | | | 1.23 | | | | .90 | | | | 93 | |
| | | | | | | | | | | | |
| Class B (8/94) | | | | | | | | | | | | | | | | | | | | | | | | | | | | | | | | | | | | | | | | | | | | | | | | | |
| 2012 | | | 20.52 | | | | .01 | | | | 1.26 | | | | 1.27 | | | | — | | | | — | | | | — | | | | 21.79 | | | | 6.19 | | | | 1,568 | | | | 2.02 | | | | .04 | | | | 140 | |
| 2011 | | | 20.87 | | | | (.10 | ) | | | (.18 | ) | | | (.28 | ) | | | (.07 | ) | | | — | | | | (.07 | ) | | | 20.52 | | | | (1.35 | ) | | | 2,073 | | | | 2.06 | | | | (.45 | ) | | | 123 | |
| 2010 | | | 17.21 | | | | (.04 | ) | | | 3.78 | | | | 3.74 | | | | (.08 | ) | | | — | | | | (.08 | ) | | | 20.87 | | | | 21.77 | | | | 2,815 | | | | 2.00 | | | | (.20 | ) | | | 123 | |
| 2009 | | | 15.22 | | | | .13 | | | | 1.87 | | | | 2.00 | | | | (.01 | ) | | | — | | | | (.01 | ) | | | 17.21 | | | | 13.13 | | | | 3,481 | | | | 1.98 | | | | .85 | | | | 106 | |
| 2008 | | | 26.48 | | | | .03 | | | | (9.39 | ) | | | (9.36 | ) | | | (.07 | ) | | | (1.83 | ) | | | (1.90 | ) | | | 15.22 | | | | (37.82 | ) | | | 4,133 | | | | 1.98 | | | | .14 | | | | 93 | |
| | | | | | | | | | | | |
| Class C (2/99) | | | | | | | | | | | | | | | | | | | | | | | | | | | | | | | | | | | | | | | | | | | | | | | | | |
| 2012 | | | 20.99 | | | | .01 | | | | 1.29 | | | | 1.30 | | | | — | | | | — | | | | — | | | | 22.29 | | | | 6.19 | | | | 7,855 | | | | 2.02 | | | | .05 | | | | 140 | |
| 2011 | | | 21.36 | | | | (.10 | ) | | | (.18 | ) | | | (.28 | ) | | | (.09 | ) | | | — | | | | (.09 | ) | | | 20.99 | | | | (1.35 | ) | | | 8,957 | | | | 2.06 | | | | (.45 | ) | | | 123 | |
| 2010 | | | 17.61 | | | | (.04 | ) | | | 3.86 | | | | 3.82 | | | | (.07 | ) | | | — | | | | (.07 | ) | | | 21.36 | | | | 21.74 | | | | 11,564 | | | | 2.00 | | | | (.21 | ) | | | 123 | |
| 2009 | | | 15.58 | | | | .12 | | | | 1.92 | | | | 2.04 | | | | (.01 | ) | | | — | | | | (.01 | ) | | | 17.61 | | | | 13.10 | | | | 12,040 | | | | 2.00 | | | | .80 | | | | 106 | |
| 2008 | | | 27.05 | | | | .03 | | | | (9.60 | ) | | | (9.57 | ) | | | (.07 | ) | | | (1.83 | ) | | | (1.90 | ) | | | 15.58 | | | | (37.80 | ) | | | 13,154 | | | | 1.98 | | | | .14 | | | | 93 | |
| | | | | | | | | | | | |
| Class R3 (9/01) | | | | | | | | | | | | | | | | | | | | | | | | | | | | | | | | | | | | | | | | | | | | | | | | | |
| 2012 | | | 21.70 | | | | .12 | | | | 1.33 | | | | 1.45 | | | | (.07 | ) | | | — | | | | (.07 | ) | | | 23.08 | | | | 6.70 | | | | 9,576 | | | | 1.53 | | | | .52 | | | | 140 | |
| 2011 | | | 22.05 | | | | .01 | | | | (.19 | ) | | | (.18 | ) | | | (.17 | ) | | | — | | | | (.17 | ) | | | 21.70 | | | | (.87 | ) | | | 15,310 | | | | 1.56 | | | | .06 | | | | 123 | |
| 2010 | | | 18.15 | | | | .06 | | | | 3.99 | | | | 4.05 | | | | (.15 | ) | | | — | | | | (.15 | ) | | | 22.05 | | | | 22.40 | | | | 20,195 | | | | 1.50 | | | | .30 | | | | 123 | |
| 2009 | | | 16.04 | | | | .19 | | | | 1.98 | | | | 2.17 | | | | (.06 | ) | | | — | | | | (.06 | ) | | | 18.15 | | | | 13.63 | | | | 25,664 | | | | 1.50 | | | | 1.21 | | | | 106 | |
| 2008 | | | 27.72 | | | | .15 | | | | (9.87 | ) | | | (9.72 | ) | | | (.13 | ) | | | (1.83 | ) | | | (1.96 | ) | | | 16.04 | | | | (37.47 | ) | | | 23,423 | | | | 1.49 | | | | .64 | | | | 93 | |
| | | | | | | | | | | | |
| Class I (2/94) | | | | | | | | | | | | | | | | | | | | | | | | | | | | | | | | | | | | | | | | | | | | | | | | | |
| 2012 | | | 21.99 | | | | .24 | | | | 1.33 | | | | 1.57 | | | | (.27 | ) | | | — | | | | (.27 | ) | | | 23.29 | | | | 7.23 | | | | 106,276 | | | | 1.03 | | | | 1.03 | | | | 140 | |
| 2011 | | | 22.37 | | | | .15 | | | | (.22 | ) | | | (.07 | ) | | | (.31 | ) | | | — | | | | (.31 | ) | | | 21.99 | | | | (.42 | ) | | | 151,409 | | | | 1.06 | | | | .65 | | | | 123 | |
| 2010 | | | 18.42 | | | | .16 | | | | 4.05 | | | | 4.21 | | | | (.26 | ) | | | — | | | | (.26 | ) | | | 22.37 | | | | 22.98 | | | | 470,266 | | | | 1.00 | | | | .78 | | | | 123 | |
| 2009 | | | 16.24 | | | | .28 | | | | 2.01 | | | | 2.29 | | | | (.11 | ) | | | — | | | | (.11 | ) | | | 18.42 | | | | 14.24 | | | | 440,968 | | | | 1.00 | | | | 1.76 | | | | 106 | |
| 2008 | | | 27.98 | | | | .27 | | | | (9.99 | ) | | | (9.72 | ) | | | (.19 | ) | | | (1.83 | ) | | | (2.02 | ) | | | 16.24 | | | | (37.17 | ) | | | 415,486 | | | | .99 | | | | 1.14 | | | | 93 | |
| (a) | Per share Net Investment Income (Loss) is calculated using the average daily shares method. |
| (b) | Distributions from Capital Gains include short-term capital gains, if any. |
| (c) | Total Return is the combination of changes in net asset value without any sales charge, reinvested dividend income at net asset value and reinvested capital gains distributions at net asset value, if any. Total Return is not annualized. |
| (d) | After expense reimbursement from the Adviser, where applicable. |
Section 5 Financial Highlights
125
Nuveen Quantitative Enhanced Core Equity Fund
| | | | | | | | | | | | | | | | | | | | | | | | | | | | | | | | | | | | | | | | | | | | | | | | | | | | |
Class
(Commencement
Date) | | | | | Investment Operations | | | Less Distributions | | | | | | | | | Ratios/Supplemental Data | |
Year Ended
October 31, | | Beginning
Net Asset
Value | | | Net
Investment
Income
(Loss)(a) | | | Net
Realized/
Unrealized
Gain (Loss) | | | Total | | | Net
Investment
Income | | | Capital
Gains(b) | | | Total | | | Ending
Net
Asset
Value | | | Total
Return(c) | | | Ending
Net
Assets
(000) | | | Ratios of
Expenses
to Average
Net
Assets(d) | | | Ratios of
Net
Investment
Income
(Loss) to
Average
Net
Assets(d) | | | Portfolio
Turnover
Rate | |
| | | | | | | | | | | | | |
| Class A (7/07) | | | | | | | | | | | | | | | | | | | | | | | | | | | | | | | | | | | | | | | | | | | | | | | | | | | | |
| 2012 | | $ | 21.57 | | | $ | .38 | | | $ | 2.16 | | | $ | 2.54 | | | $ | (.37 | ) | | $ | (.35 | ) | | $ | (.72 | ) | | $ | 23.39 | | | | 12.18 | % | | $ | 151 | | | | .70 | % | | | 1.66 | % | | | 137 | % |
| 2011 | | | 20.50 | | | | .31 | | | | 1.02 | | | | 1.33 | | | | (.26 | ) | | | — | | | | (.26 | ) | | | 21.57 | | | | 6.50 | | | | 164 | | | | .70 | | | | 1.41 | | | | 159 | |
| 2010 | | | 18.01 | | | | .25 | | | | 2.48 | | | | 2.73 | | | | (.24 | ) | | | — | | | | (.24 | ) | | | 20.50 | | | | 15.24 | | | | 253 | | | | .70 | | | | 1.28 | | | | 142 | |
| 2009 | | | 16.56 | | | | .31 | | | | 1.29 | | | | 1.60 | | | | (.15 | ) | | | — | | | | (.15 | ) | | | 18.01 | | | | 9.87 | | | | 243 | | | | .69 | | | | 1.94 | | | | 75 | |
| 2008 | | | 26.90 | | | | .40 | | | | (10.21 | ) | | | (9.81 | ) | | | (.29 | ) | | | (.24 | ) | | | (.53 | ) | | | 16.56 | | | | (37.08 | ) | | | 118 | | | | .70 | | | | 1.77 | | | | 153 | |
| | | | | | | | | | | | | |
| Class C (7/07) | | | | | | | | | | | | | | | | | | | | | | | | | | | | | | | | | | | | | | | | | | | | | | | | | | | | |
| 2012 | | | 21.40 | | | | .20 | | | | 2.15 | | | | 2.35 | | | | (.20 | ) | | | (.35 | ) | | | (.55 | ) | | | 23.20 | | | | 11.31 | | | | 120 | | | | 1.45 | | | | .90 | | | | 137 | |
| 2011 | | | 20.50 | | | | .12 | | | | 1.06 | | | | 1.18 | | | | (.28 | ) | | | — | | | | (.28 | ) | | | 21.40 | | | | 5.76 | | | | 108 | | | | 1.45 | | | | .56 | | | | 159 | |
| 2010 | | | 17.91 | | | | .08 | | | | 2.51 | | | | 2.59 | | | | — | | | | — | | | | — | | | | 20.50 | | | | 14.46 | | | | 14 | | | | 1.45 | | | | .43 | | | | 142 | |
| 2009 | | | 16.51 | | | | .24 | | | | 1.24 | | | | 1.48 | | | | (.08 | ) | | | — | | | | (.08 | ) | | | 17.91 | | | | 9.05 | | | | 4 | | | | 1.44 | | | | 1.57 | | | | 75 | |
| 2008 | | | 26.88 | | | | .23 | | | | (10.20 | ) | | | (9.97 | ) | | | (.16 | ) | | | (.24 | ) | | | (.40 | ) | | | 16.51 | | | | (37.58 | ) | | | 10 | | | | 1.45 | | | | .99 | | | | 153 | |
| | | | | | | | | | | | | |
| Class I (7/07) | | | | | | | | | | | | | | | | | | | | | | | | | | | | | | | | | | | | | | | | | | | | | | | | | | | | |
| 2012 | | | 21.64 | | | | .44 | | | | 2.15 | | | | 2.59 | | | | (.42 | ) | | | (.35 | ) | | | (.77 | ) | | | 23.46 | | | | 12.44 | | | | 74,098 | | | | .45 | | | | 1.93 | | | | 137 | |
| 2011 | | | 20.57 | | | | .37 | | | | 1.03 | | | | 1.40 | | | | (.33 | ) | | | — | | | | (.33 | ) | | | 21.64 | | | | 6.79 | | | | 107,734 | | | | .45 | | | | 1.68 | | | | 159 | |
| 2010 | | | 18.04 | | | | .29 | | | | 2.51 | | | | 2.80 | | | | (.27 | ) | | | — | | | | (.27 | ) | | | 20.57 | | | | 15.61 | | | | 203,316 | | | | .45 | | | | 1.50 | | | | 142 | |
| 2009 | | | 16.57 | | | | .35 | | | | 1.29 | | | | 1.64 | | | | (.17 | ) | | | — | | | | (.17 | ) | | | 18.04 | | | | 10.13 | | | | 146,180 | | | | .44 | | | | 2.19 | | | | 75 | |
| 2008 | | | 26.90 | | | | .44 | | | | (10.20 | ) | | | (9.76 | ) | | | (.33 | ) | | | (.24 | ) | | | (.57 | ) | | | 16.57 | | | | (36.93 | ) | | | 89,270 | | | | .45 | | | | 1.99 | | | | 153 | |
| (a) | Per share Net Investment Income (Loss) is calculated using the average daily shares method. |
| (b) | Distributions from Capital Gains include short-term capital gains, if any. |
| (c) | Total Return is the combination of changes in net asset value, reinvested dividend income at net asset value and reinvested capital gains distributions at net asset value, if any. Total Return is not annualized. |
| (d) | After expense reimbursement from the Adviser, where applicable. |
126
Section 5 Financial Highlights
Nuveen Small Cap Growth Opportunities Fund
| | | | | | | | | | | | | | | | | | | | | | | | | | | | | | | | | | | | | | | | | | | | | | | | | | | | |
Class
(Commencement
Date) | | | | | Investment Operations | | | Less Distributions | | | | | | | | | Ratios/Supplemental Data | |
Year Ended
October 31, | | Beginning
Net Asset
Value | | | Net
Investment
Income
(Loss)(a) | | | Net
Realized/
Unrealized
Gain (Loss) | | | Total | | | Net
Investment
Income | | | Capital
Gains(b) | | | Total | | | Ending
Net
Asset
Value | | | Total
Return(c) | | | Ending
Net
Assets
(000) | | | Ratios of
Expenses
to Average
Net
Assets(d) | | | Ratios of
Net
Investment
Income
(Loss) to
Average
Net
Assets(d) | | | Portfolio
Turnover
Rate | |
| | | | | | | | | | |
| Class A (8/95) | | | | | | | | | | | | | | | | | | | | | | | | | | | | | | | | | | | | | | | | | |
| 2012 | | $ | 20.41 | | | $ | (.21 | ) | | $ | 1.35 | | | $ | 1.14 | | | $ | — | | | $ | (.30 | ) | | $ | (.30 | ) | | $ | 21.25 | | | | 5.73 | % | | $ | 35,306 | | | | 1.47 | % | | | (.97 | )% | | | 118 | % |
| 2011 | | | 19.04 | | | | (.24 | ) | | | 1.61 | | | | 1.37 | | | | — | | | | — | | | | — | | | | 20.41 | | | | 7.20 | | | | 36,188 | | | | 1.47 | | | | (1.12 | ) | | | 118 | |
| 2010 | | | 14.55 | | | | (.18 | ) | | | 4.67 | | | | 4.49 | | | | — | | | | — | | | | — | | | | 19.04 | | | | 30.86 | | | | 39,501 | | | | 1.47 | | | | (1.05 | ) | | | 142 | |
| 2009 | | | 11.96 | | | | (.11 | ) | | | 2.70 | | | | 2.59 | | | | — | | | | — | | | | — | | | | 14.55 | | | | 21.66 | | | | 30,202 | | | | 1.47 | | | | (.89 | ) | | | 169 | |
| 2008 | | | 21.65 | | | | (.14 | ) | | | (7.97 | ) | | | (8.11 | ) | | | — | | | | (1.58 | ) | | | (1.58 | ) | | | 11.96 | | | | (40.07 | ) | | | 29,022 | | | | 1.46 | | | | (.82 | ) | | | 138 | |
| | | | | | | | | | |
| Class B (3/99) | | | | | | | | | | | | | | | | | | | | | | | | | | | | | | | | | | | | | | | | | |
| 2012 | | | 17.72 | | | | (.32 | ) | | | 1.17 | | | | .85 | | | | — | | | | (.30 | ) | | | (.30 | ) | | | 18.27 | | | | 4.95 | | | | 687 | | | | 2.22 | | | | (1.72 | ) | | | 118 | |
| 2011 | | | 16.66 | | | | (.35 | ) | | | 1.41 | | | | 1.06 | | | | — | | | | — | | | | — | | | | 17.72 | | | | 6.36 | | | | 1,482 | | | | 2.22 | | | | (1.86 | ) | | | 118 | |
| 2010 | | | 12.82 | | | | (.27 | ) | | | 4.11 | | | | 3.84 | | | | — | | | | — | | | | — | | | | 16.66 | | | | 29.95 | | | | 2,088 | | | | 2.22 | | | | (1.79 | ) | | | 142 | |
| 2009 | | | 10.62 | | | | (.18 | ) | | | 2.38 | | | | 2.20 | | | | — | | | | — | | | | — | | | | 12.82 | | | | 20.72 | | | | 2,025 | | | | 2.22 | | | | (1.64 | ) | | | 169 | |
| 2008 | | | 19.56 | | | | (.23 | ) | | | (7.13 | ) | | | (7.36 | ) | | | — | | | | (1.58 | ) | | | (1.58 | ) | | | 10.62 | | | | (40.55 | ) | | | 1,978 | | | | 2.21 | | | | (1.57 | ) | | | 138 | |
| | | | | | | | | | |
| Class C (9/01) | | | | | | | | | | | | | | | | | | | | | | | | | | | | | | | | | | | | | | | | | |
| 2012 | | | 18.58 | | | | (.34 | ) | | | 1.23 | | | | .89 | | | | — | | | | (.30 | ) | | | (.30 | ) | | | 19.17 | | | | 4.93 | | | | 1,568 | | | | 2.22 | | | | (1.72 | ) | | | 118 | |
| 2011 | | | 17.46 | | | | (.36 | ) | | | 1.48 | | | | 1.12 | | | | — | | | | — | | | | — | | | | 18.58 | | | | 6.41 | | | | 1,546 | | | | 2.22 | | | | (1.87 | ) | | | 118 | |
| 2010 | | | 13.44 | | | | (.28 | ) | | | 4.30 | | | | 4.02 | | | | — | | | | — | | | | — | | | | 17.46 | | | | 29.91 | | | | 1,596 | | | | 2.22 | | | | (1.80 | ) | | | 142 | |
| 2009 | | | 11.13 | | | | (.19 | ) | | | 2.50 | | | | 2.31 | | | | — | | | | — | | | | — | | | | 13.44 | | | | 20.75 | | | | 1,341 | | | | 2.22 | | | | (1.66 | ) | | | 169 | |
| 2008 | | | 20.41 | | | | (.24 | ) | | | (7.46 | ) | | | (7.70 | ) | | | — | | | | (1.58 | ) | | | (1.58 | ) | | | 11.13 | | | | (40.53 | ) | | | 1,104 | | | | 2.21 | | | | (1.56 | ) | | | 138 | |
| | | | | | | | | | |
| Class R3 (12/00) | | | | | | | | | | | | | | | | | | | | | | | | | | | | | | | | | | | | | | | | | |
| 2012 | | | 20.04 | | | | (.26 | ) | | | 1.33 | | | | 1.07 | | | | — | | | | (.30 | ) | | | (.30 | ) | | | 20.81 | | | | 5.48 | | | | 2,395 | | | | 1.72 | | | | (1.22 | ) | | | 118 | |
| 2011 | | | 18.74 | | | | (.29 | ) | | | 1.59 | | | | 1.30 | | | | — | | | | — | | | | — | | | | 20.04 | | | | 6.94 | | | | 2,334 | | | | 1.72 | | | | (1.37 | ) | | | 118 | |
| 2010 | | | 14.36 | | | | (.22 | ) | | | 4.60 | | | | 4.38 | | | | — | | | | — | | | | — | | | | 18.74 | | | | 30.50 | | | | 2,185 | | | | 1.72 | | | | (1.31 | ) | | | 142 | |
| 2009 | | | 11.83 | | | | (.16 | ) | | | 2.69 | | | | 2.53 | | | | — | | | | — | | | | — | | | | 14.36 | | | | 21.39 | | | | 1,469 | | | | 1.72 | | | | (1.24 | ) | | | 169 | |
| 2008 | | | 21.49 | | | | (.17 | ) | | | (7.91 | ) | | | (8.08 | ) | | | — | | | | (1.58 | ) | | | (1.58 | ) | | | 11.83 | | | | (40.24 | ) | | | 433 | | | | 1.72 | | | | (1.04 | ) | | | 138 | |
| | | | | | | | | | |
| Class I (8/95) | | | | | | | | | | | | | | | | | | | | | | | | | | | | | | | | | | | | | | | | | |
| 2012 | | | 22.04 | | | | (.17 | ) | | | 1.46 | | | | 1.29 | | | | — | | | | (.30 | ) | | | (.30 | ) | | | 23.03 | | | | 5.99 | | | | 48,111 | | | | 1.22 | | | | (.72 | ) | | | 118 | |
| 2011 | | | 20.51 | | | | (.19 | ) | | | 1.72 | | | | 1.53 | | | | — | | | | — | | | | — | | | | 22.04 | | | | 7.46 | | | | 63,866 | | | | 1.22 | | | | (.84 | ) | | | 118 | |
| 2010 | | | 15.63 | | | | (.15 | ) | | | 5.03 | | | | 4.88 | | | | — | | | | — | | | | — | | | | 20.51 | | | | 31.22 | | | | 141,215 | | | | 1.22 | | | | (.80 | ) | | | 142 | |
| 2009 | | | 12.81 | | | | (.09 | ) | | | 2.91 | | | | 2.82 | | | | — | | | | — | | | | — | | | | 15.63 | | | | 22.01 | | | | 103,423 | | | | 1.22 | | | | (.67 | ) | | | 169 | |
| 2008 | | | 23.03 | | | | (.10 | ) | | | (8.54 | ) | | | (8.64 | ) | | | — | | | | (1.58 | ) | | | (1.58 | ) | | | 12.81 | | | | (39.97 | ) | | | 75,355 | | | | 1.22 | | | | (.56 | ) | | | 138 | |
| (a) | Per share Net Investment Income (Loss) is calculated using the average daily shares method. |
| (b) | Distributions from Capital Gains include short-term capital gains, if any. |
| (c) | Total Return is the combination of changes in net asset value without any sales charge, reinvested dividend income at net asset value and reinvested capital gains distributions at net asset value, if any. Total Return is not annualized. |
| (d) | After expense reimbursement from the Adviser, where applicable. |
Section 5 Financial Highlights
127
Nuveen Small Cap Index Fund
| | | | | | | | | | | | | | | | | | | | | | | | | | | | | | | | | | | | | | | | | | | | | | | | | | | | |
Class
(Commencement
Date) | | | | | Investment Operations | | | Less Distributions | | | | | | | | | Ratios/Supplemental Data | |
Year Ended
October 31, | | Beginning
Net Asset
Value | | | Net
Investment
Income
(Loss)(a) | | | Net
Realized/
Unrealized
Gain (Loss) | | | Total | | | Net
Investment
Income | | | Capital
Gains(b) | | | Total | | | Ending
Net
Asset
Value | | | Total
Return(c) | | | Ending
Net
Assets
(000) | | | Ratios of
Expenses
to Average
Net
Assets(d) | | | Ratios of
Net
Investment
Income
(Loss) to
Average
Net
Assets(d) | | | Portfolio
Turnover
Rate | |
| | | | | | | | | | | | | |
| Class A (12/98) | | | | | | | | | | | | | | | | | | | | | | | | | | | | | | | | | | | | | | | | | | | | | | | | | | | | |
| 2012 | | $ | 10.43 | | | $ | .08 | | | $ | 1.11 | | | $ | 1.19 | | | $ | (.03 | ) | | $ | — | | | $ | (.03 | ) | | $ | 11.59 | | | | 11.44 | % | | $ | 28,640 | | | | .83 | % | | | .72 | % | | | 20 | % |
| 2011 | | | 9.89 | | | | .05 | | | | .55 | | | | .60 | | | | (.06 | ) | | | — | | | | (.06 | ) | | | 10.43 | | | | 6.03 | | | | 19,406 | | | | .83 | | | | .50 | | | | 14 | |
| 2010 | | | 7.90 | | | | .05 | | | | 1.99 | | | | 2.04 | | | | (.05 | ) | | | — | | | | (.05 | ) | | | 9.89 | | | | 25.91 | | | | 12,667 | | | | .79 | | | | .55 | | | | 12 | |
| 2009 | | | 8.91 | | | | .06 | | | | .27 | | | | .33 | | | | (.07 | ) | | | (1.27 | ) | | | (1.34 | ) | | | 7.90 | | | | 6.34 | | | | 8,591 | | | | .82 | | | | .87 | | | | 22 | |
| 2008 | | | 15.37 | | | | .13 | | | | (4.88 | ) | | | (4.75 | ) | | | (.10 | ) | | | (1.61 | ) | | | (1.71 | ) | | | 8.91 | | | | (34.15 | ) | | | 6,043 | | | | .82 | | | | 1.09 | | | | 19 | |
| | | | | | | | | | | | | |
| Class C (9/01) | | | | | | | | | | | | | | | | | | | | | | | | | | | | | | | | | | | | | | | | | | | | | | | | | | | | |
| 2012 | | | 10.02 | | | | — | | | | 1.06 | | | | 1.06 | | | | — | | | | — | | | | — | | | | 11.08 | | | | 10.58 | | | | 1,246 | | | | 1.58 | | | | (.03 | ) | | | 20 | |
| 2011 | | | 9.52 | | | | (.03 | ) | | | .53 | | | | .50 | | | | — | | | | — | | | | — | | | | 10.02 | | | | 5.25 | | | | 1,330 | | | | 1.58 | | | | (.26 | ) | | | 14 | |
| 2010 | | | 7.62 | | | | (.02 | ) | | | 1.92 | | | | 1.90 | | | | — | | | | — | | | | — | | | | 9.52 | | | | 24.93 | | | | 1,645 | | | | 1.54 | | | | (.20 | ) | | | 12 | |
| 2009 | | | 8.66 | | | | .01 | | | | .26 | | | | .27 | | | | (.04 | ) | | | (1.27 | ) | | | (1.31 | ) | | | 7.62 | | | | 5.60 | | | | 1,380 | | | | 1.57 | | | | .17 | | | | 22 | |
| 2008 | | | 15.02 | | | | .04 | | | | (4.76 | ) | | | (4.72 | ) | | | (.03 | ) | | | (1.61 | ) | | | (1.64 | ) | | | 8.66 | | | | (34.67 | ) | | | 1,531 | | | | 1.57 | | | | .34 | | | | 19 | |
| | | | | | | | | | | | | |
| Class R3 (12/98) | | | | | | | | | | | | | | | | | | | | | | | | | | | | | | | | | | | | | | | | | | | | | | | | | | | | |
| 2012 | | | 10.18 | | | | .05 | | | | 1.08 | | | | 1.13 | | | | — | | | | — | | | | — | | | | 11.31 | | | | 11.13 | | | | 20,198 | | | | 1.08 | | | | .47 | | | | 20 | |
| 2011 | | | 9.66 | | | | .03 | | | | .53 | | | | .56 | | | | (.04 | ) | | | — | | | | (.04 | ) | | | 10.18 | | | | 5.79 | | | | 11,824 | | | | 1.08 | | | | .24 | | | | 14 | |
| 2010 | | | 7.73 | | | | .03 | | | | 1.94 | | | | 1.97 | | | | (.04 | ) | | | — | | | | (.04 | ) | | | 9.66 | | | | 25.55 | | | | 4,795 | | | | 1.04 | | | | .30 | | | | 12 | |
| 2009 | | | 8.76 | | | | .04 | | | | .26 | | | | .30 | | | | (.06 | ) | | | (1.27 | ) | | | (1.33 | ) | | | 7.73 | | | | 6.08 | | | | 2,512 | | | | 1.07 | | | | .55 | | | | 22 | |
| 2008 | | | 15.16 | | | | .10 | | | | (4.81 | ) | | | (4.71 | ) | | | (.08 | ) | | | (1.61 | ) | | | (1.69 | ) | | | 8.76 | | | | (34.33 | ) | | | 1,121 | | | | 1.08 | | | | .87 | | | | 19 | |
| | | | | | | | | | | | | |
| Class I (12/98) | | | | | | | | | | | | | | | | | | | | | | | | | | | | | | | | | | | | | | | | | | | | | | | | | | | | |
| 2012 | | | 10.46 | | | | .11 | | | | 1.12 | | | | 1.23 | | | | (.06 | ) | | | — | | | | (.06 | ) | | | 11.63 | | | | 11.79 | | | | 33,733 | | | | .58 | | | | .97 | | | | 20 | |
| 2011 | | | 9.91 | | | | .08 | | | | .55 | | | | .63 | | | | (.08 | ) | | | — | | | | (.08 | ) | | | 10.46 | | | | 6.33 | | | | 40,135 | | | | .58 | | | | .75 | | | | 14 | |
| 2010 | | | 7.91 | | | | .07 | | | | 2.00 | | | | 2.07 | | | | (.07 | ) | | | — | | | | (.07 | ) | | | 9.91 | | | | 26.22 | | | | 47,179 | | | | .54 | | | | .80 | | | | 12 | |
| 2009 | | | 8.92 | | | | .09 | | | | .25 | | | | .34 | | | | (.08 | ) | | | (1.27 | ) | | | (1.35 | ) | | | 7.91 | | | | 6.50 | | | | 43,179 | | | | .57 | | | | 1.19 | | | | 22 | |
| 2008 | | | 15.37 | | | | .16 | | | | (4.88 | ) | | | (4.72 | ) | | | (.12 | ) | | | (1.61 | ) | | | (1.73 | ) | | | 8.92 | | | | (33.95 | ) | | | 54,932 | | | | .57 | | | | 1.33 | | | | 19 | |
| (a) | Per share Net Investment Income (Loss) is calculated using the average daily shares method. |
| (b) | Distributions from Capital Gains include short-term capital gains, if any. |
| (c) | Total Return is the combination of changes in net asset value, reinvested dividend income at net asset value and reinvested capital gains distributions at net asset value, if any. Total Return is not annualized. |
| (d) | After expense reimbursement from the Adviser, where applicable. |
128
Section 5 Financial Highlights
Nuveen Small Cap Select Fund
| | | | | | | | | | | | | | | | | | | | | | | | | | | | | | | | | | | | | | | | | | | | | | | | | | | | |
Class
(Commencement
Date) | | | | | Investment Operations | | | Less Distributions | | | | | | | | | Ratios/Supplemental Data | |
Year Ended
October 31, | | Beginning
Net Asset
Value | | | Net
Investment
Income
(Loss)(a) | | | Net
Realized/
Unrealized
Gain (Loss) | | | Total | | | Net
Investment
Income | | | Capital
Gains(b) | | | Total | | | Ending
Net
Asset
Value | | | Total
Return(c) | | | Ending
Net
Assets
(000) | | | Ratios of
Expenses
to Average
Net
Assets(d) | | | Ratios of
Net
Investment
Income
(Loss) to
Average
Net
Assets(d) | | | Portfolio
Turnover
Rate | |
| | | | | | | | | | | | |
| Class A (5/92) | | | | | | | | | | | | | | | | | | | | | | | | | | | | | | | | | | | | | | | | | | | | | | | | | |
| 2012 | | $ | 12.44 | | | $ | (.05 | ) | | $ | 1.45 | | | $ | 1.40 | | | $ | — | | | $ | (.30 | ) | | $ | (.30 | ) | | $ | 13.54 | | | | 11.62 | % | | $ | 155,624 | | | | 1.28 | % | | | (.41 | )% | | | 71 | % |
| 2011 | | | 11.72 | | | | (.09 | ) | | | .81 | | | | .72 | | | | — | | | | — | | | | — | | | | 12.44 | | | | 6.14 | | | | 275,994 | | | | 1.30 | | | | (.70 | ) | | | 69 | |
| 2010 | | | 9.53 | | | | (.05 | ) | | | 2.24 | | | | 2.19 | | | | — | | | | — | | | | — | | | | 11.72 | | | | 22.98 | | | | 339,826 | | | | 1.24 | | | | (.48 | ) | | | 88 | |
| 2009 | | | 8.27 | | | | (.01 | ) | | | 1.27 | | | | 1.26 | | | | — | | | | — | | | | — | | | | 9.53 | | | | 15.24 | | | | 295,348 | | | | 1.26 | | | | (.09 | ) | | | 99 | |
| 2008 | | | 14.06 | | | | (.02 | ) | | | (4.92 | ) | | | (4.94 | ) | | | — | | | | (.85 | ) | | | (.85 | ) | | | 8.27 | | | | (37.00 | ) | | | 166,698 | | | | 1.26 | | | | (.15 | ) | | | 92 | |
| | | | | | | | | | | | |
| Class B (3/95) | | | | | | | | | | | | | | | | | | | | | | | | | | | | | | | | | | | | | | | | | | | | | | | | | |
| 2012 | | | 9.77 | | | | (.12 | ) | | | 1.14 | | | | 1.02 | | | | — | | | | (.30 | ) | | | (.30 | ) | | | 10.49 | | | | 10.88 | | | | 2,032 | | | | 2.03 | | | | (1.13 | ) | | | 71 | |
| 2011 | | | 9.27 | | | | (.15 | ) | | | .65 | | | | .50 | | | | — | | | | — | | | | — | | | | 9.77 | | | | 5.39 | | | | 2,866 | | | | 2.05 | | | | (1.45 | ) | | | 69 | |
| 2010 | | | 7.60 | | | | (.10 | ) | | | 1.77 | | | | 1.67 | | | | — | | | | — | | | | — | | | | 9.27 | | | | 21.97 | | | | 3,925 | | | | 1.99 | | | | (1.22 | ) | | | 88 | |
| 2009 | | | 6.64 | | | | (.05 | ) | | | 1.01 | | | | .96 | | | | — | | | | — | | | | — | | | | 7.60 | | | | 14.46 | | | | 5,511 | | | | 2.01 | | | | (.80 | ) | | | 99 | |
| 2008 | | | 11.56 | | | | (.08 | ) | | | (3.99 | ) | | | (4.07 | ) | | | — | | | | (.85 | ) | | | (.85 | ) | | | 6.64 | | | | (37.52 | ) | | | 6,249 | | | | 2.01 | | | | (.90 | ) | | | 92 | |
| | | | | | | | | | | | |
| Class C (9/01) | | | | | | | | | | | | | | | | | | | | | | | | | | | | | | | | | | | | | | | | | | | | | | | | | |
| 2012 | | | 11.22 | | | | (.13 | ) | | | 1.30 | | | | 1.17 | | | | — | | | | (.30 | ) | | | (.30 | ) | | | 12.09 | | | | 10.81 | | | | 10,058 | | | | 2.03 | | | | (1.13 | ) | | | 71 | |
| 2011 | | | 10.65 | | | | (.17 | ) | | | .74 | | | | .57 | | | | — | | | | — | | | | — | | | | 11.22 | | | | 5.35 | | | | 14,009 | | | | 2.05 | | | | (1.45 | ) | | | 69 | |
| 2010 | | | 8.73 | | | | (.12 | ) | | | 2.04 | | | | 1.92 | | | | — | | | | — | | | | — | | | | 10.65 | | | | 21.99 | | | | 17,393 | | | | 1.99 | | | | (1.23 | ) | | | 88 | |
| 2009 | | | 7.63 | | | | (.06 | ) | | | 1.16 | | | | 1.10 | | | | — | | | | — | | | | — | | | | 8.73 | | | | 14.42 | | | | 16,938 | | | | 2.01 | | | | (.80 | ) | | | 99 | |
| 2008 | | | 13.13 | | | | (.09 | ) | | | (4.56 | ) | | | (4.65 | ) | | | — | | | | (.85 | ) | | | (.85 | ) | | | 7.63 | | | | (37.44 | ) | | | 17,062 | | | | 2.01 | | | | (.90 | ) | | | 92 | |
| | | | | | | | | | | | |
| Class R3 (1/94) | | | | | | | | | | | | | | | | | | | | | | | | | | | | | | | | | | | | | | | | | | | | | | | | | |
| 2012 | | | 12.13 | | | | (.08 | ) | | | 1.42 | | | | 1.34 | | | | — | | | | (.30 | ) | | | (.30 | ) | | | 13.17 | | | | 11.42 | | | | 18,386 | | | | 1.53 | | | | (.61 | ) | | | 71 | |
| 2011 | | | 11.46 | | | | (.12 | ) | | | .79 | | | | .67 | | | | — | | | | — | | | | — | | | | 12.13 | | | | 5.85 | | | | 20,044 | | | | 1.55 | | | | (.95 | ) | | | 69 | |
| 2010 | | | 9.34 | | | | (.08 | ) | | | 2.20 | | | | 2.12 | | | | — | | | | — | | | | — | | | | 11.46 | | | | 22.70 | | | | 18,047 | | | | 1.49 | | | | (.71 | ) | | | 88 | |
| 2009 | | | 8.12 | | | | (.03 | ) | | | 1.25 | | | | 1.22 | | | | — | | | | — | | | | — | | | | 9.34 | | | | 15.02 | | | | 24,701 | | | | 1.51 | | | | (.31 | ) | | | 99 | |
| 2008 | | | 13.86 | | | | (.04 | ) | | | (4.85 | ) | | | (4.89 | ) | | | — | | | | (.85 | ) | | | (.85 | ) | | | 8.12 | | | | (37.19 | ) | | | 23,069 | | | | 1.51 | | | | (.40 | ) | | | 92 | |
| | | | | | | | | | | | |
| Class I (5/92) | | | | | | | | | | | | | | | | | | | | | | | | | | | | | | | | | | | | | | | | | | | | | | | | | |
| 2012 | | | 13.54 | | | | (.02 | ) | | | 1.60 | | | | 1.58 | | | | — | | | | (.30 | ) | | | (.30 | ) | | | 14.82 | | | | 12.01 | | | | 261,760 | | | | 1.03 | | | | (.11 | ) | | | 71 | |
| 2011 | | | 12.73 | | | | (.06 | ) | | | .87 | | | | .81 | | | | — | | | | — | | | | — | | | | 13.54 | | | | 6.36 | | | | 273,983 | | | | 1.05 | | | | (.45 | ) | | | 69 | |
| 2010 | | | 10.33 | | | | (.03 | ) | | | 2.44 | | | | 2.41 | | | | (.01 | ) | | | — | | | | (.01 | ) | | | 12.73 | | | | 23.30 | | | | 400,042 | | | | .99 | | | | (.23 | ) | | | 88 | |
| 2009 | | | 8.94 | | | | .02 | | | | 1.37 | | | | 1.39 | | | | — | | | | — | | | | — | | | | 10.33 | | | | 15.55 | | | | 322,658 | | | | 1.01 | | | | .19 | | | | 99 | |
| 2008 | | | 15.10 | | | | .01 | | | | (5.31 | ) | | | (5.30 | ) | | | (.01 | ) | | | (.85 | ) | | | (.86 | ) | | | 8.94 | | | | (36.86 | ) | | | 289,685 | | | | 1.01 | | | | .10 | | | | 92 | |
| (a) | Per share Net Investment Income (Loss) is calculated using the average daily shares method. |
| (b) | Distributions from Capital Gains include short-term capital gains, if any. |
| (c) | Total Return is the combination of changes in net asset value without any sales charge, reinvested dividend income at net asset value and reinvested capital gains distributions at net asset value, if any. Total Return is not annualized. |
| (d) | After expense reimbursement from the Adviser, where applicable. |
Section 5 Financial Highlights
129
Nuveen Small Cap Value Fund
| | | | | | | | | | | | | | | | | | | | | | | | | | | | | | | | | | | | | | | | | | | | | | | | | | | | |
Class
(Commencement
Date) | | | | | Investment Operations | | | Less Distributions | | | | | | | | | Ratios/Supplemental Data | |
Year Ended
October 31, | | Beginning
Net Asset
Value | | | Net
Investment
Income
(Loss)(a) | | | Net
Realized/
Unrealized
Gain (Loss) | | | Total | | | Net
Investment
Income | | | Capital
Gains(b) | | | Total | | | Ending
Net
Asset
Value | | | Total
Return(c) | | | Ending
Net
Assets
(000) | | | Ratios of
Expenses
to Average
Net
Assets(d) | | | Ratios of
Net
Investment
Income
(Loss) to
Average
Net
Assets(d) | | | Portfolio
Turnover
Rate | |
| | | | | | | | | | | | |
| Class A (8/94) | | | | | | | | | | | | | | | | | | | | | | | | | | | | | | | | | | | | | | | | | | | | | | | | | |
| 2012 | | $ | 11.30 | | | $ | .05 | | | $ | 1.28 | | | $ | 1.33 | | | $ | — | | | $ | — | | | $ | — | | | $ | 12.63 | | | | 11.77 | % | | $ | 32,208 | | | | 1.46 | % | | | .39 | % | | | 46 | % |
| 2011 | | | 10.26 | | | | (.05 | ) | | | 1.09 | | | | 1.04 | | | | — | | | | — | | | | — | | | | 11.30 | | | | 10.14 | | | | 31,814 | | | | 1.46 | | | | (.40 | ) | | | 41 | |
| 2010 | | | 8.22 | | | | (.01 | ) | | | 2.07 | | | | 2.06 | | | | (.02 | ) | | | — | | | | (.02 | ) | | | 10.26 | | | | 25.15 | | | | 32,332 | | | | 1.34 | | | | (.11 | ) | | | 58 | |
| 2009 | | | 8.12 | | | | .03 | | | | .15 | | | | .18 | | | | (.08 | ) | | | — | | | | (.08 | ) | | | 8.22 | | | | 2.40 | | | | 29,026 | | | | 1.37 | | | | .46 | | | | 73 | |
| 2008 | | | 13.52 | | | | .08 | | | | (3.97 | ) | | | (3.89 | ) | | | (.14 | ) | | | (1.37 | ) | | | (1.51 | ) | | | 8.12 | | | | (31.75 | ) | | | 28,344 | | | | 1.31 | | | | .75 | | | | 49 | |
| | | | | | | | | | | | |
| Class C (2/99) | | | | | | | | | | | | | | | | | | | | | | | | | | | | | | | | | | | | | | | | | | | | | | | | | |
| 2012 | | | 9.93 | | | | (.04 | ) | | | 1.13 | | | | 1.09 | | | | — | | | | — | | | | — | | | | 11.02 | | | | 10.98 | | | | 1,367 | | | | 2.21 | | | | (.34 | ) | | | 46 | |
| 2011 | | | 9.08 | | | | (.12 | ) | | | .97 | | | | .85 | | | | — | | | | — | | | | — | | | | 9.93 | | | | 9.36 | | | | 1,498 | | | | 2.21 | | | | (1.18 | ) | | | 41 | |
| 2010 | | | 7.31 | | | | (.07 | ) | | | 1.84 | | | | 1.77 | | | | — | | | | — | | | | — | | | | 9.08 | | | | 24.21 | | | | 1,843 | | | | 2.09 | | | | (.86 | ) | | | 58 | |
| 2009 | | | 7.22 | | | | (.02 | ) | | | .13 | | | | .11 | | | | (.02 | ) | | | — | | | | (.02 | ) | | | 7.31 | | | | 1.56 | | | | 2,080 | | | | 2.12 | | | | (.27 | ) | | | 73 | |
| 2008 | | | 12.19 | | | | — | * | | | (3.54 | ) | | | (3.54 | ) | | | (.06 | ) | | | (1.37 | ) | | | (1.43 | ) | | | 7.22 | | | | (32.23 | ) | | | 2,373 | | | | 2.06 | | | | — | ** | | | 49 | |
| | | | | | | | | | | | |
| Class R3 (9/01) | | | | | | | | | | | | | | | | | | | | | | | | | | | | | | | | | | | | | | | | | | | | | | | | | |
| 2012 | | | 11.11 | | | | .02 | | | | 1.26 | | | | 1.28 | | | | — | | | | — | | | | — | | | | 12.39 | | | | 11.52 | | | | 2,653 | | | | 1.71 | | | | .14 | | | | 46 | |
| 2011 | | | 10.11 | | | | (.07 | ) | | | 1.07 | | | | 1.00 | | | | — | | | | — | | | | — | | | | 11.11 | | | | 9.89 | | | | 2,246 | | | | 1.71 | | | | (.65 | ) | | | 41 | |
| 2010 | | | 8.10 | | | | (.03 | ) | | | 2.04 | | | | 2.01 | | | | — | | | | — | | | | — | | | | 10.11 | | | | 24.85 | | | | 2,111 | | | | 1.59 | | | | (.35 | ) | | | 58 | |
| 2009 | | | 8.00 | | | | .01 | | | | .15 | | | | .16 | | | | (.06 | ) | | | — | | | | (.06 | ) | | | 8.10 | | | | 2.14 | | | | 2,327 | | | | 1.62 | | | | .19 | | | | 73 | |
| 2008 | | | 13.35 | | | | .05 | | | | (3.91 | ) | | | (3.86 | ) | | | (.12 | ) | | | (1.37 | ) | | | (1.49 | ) | | | 8.00 | | | | (31.90 | ) | | | 2,159 | | | | 1.56 | | | | .50 | | | | 49 | |
| | | | | | | | | | | | |
| Class I (8/94) | | | | | | | | | | | | | | | | | | | | | | | | | | | | | | | | | | | | | | | | | | | | | | | | | |
| 2012 | | | 11.65 | | | | .08 | | | | 1.33 | | | | 1.41 | | | | — | | | | — | | | | — | | | | 13.06 | | | | 12.02 | | | | 41,444 | | | | 1.21 | | | | .66 | | | | 46 | |
| 2011 | | | 10.55 | | | | (.02 | ) | | | 1.12 | | | | 1.10 | | | | — | | | | — | | | | — | | | | 11.65 | | | | 10.43 | | | | 48,596 | | | | 1.21 | | | | (.16 | ) | | | 41 | |
| 2010 | | | 8.45 | | | | .01 | | | | 2.13 | | | | 2.14 | | | | (.04 | ) | | | — | | | | (.04 | ) | | | 10.55 | | | | 25.43 | | | | 180,875 | | | | 1.09 | | | | .14 | | | | 58 | |
| 2009 | | | 8.36 | | | | .05 | | | | .15 | | | | .20 | | | | (.11 | ) | | | — | | | | (.11 | ) | | | 8.45 | | | | 2.59 | | | | 149,515 | | | | 1.12 | | | | .72 | | | | 73 | |
| 2008 | | | 13.87 | | | | .11 | | | | (4.08 | ) | | | (3.97 | ) | | | (.17 | ) | | | (1.37 | ) | | | (1.54 | ) | | | 8.36 | | | | (31.56 | ) | | | 158,112 | | | | 1.06 | | | | 1.00 | | | | 49 | |
| (a) | Per share Net Investment Income (Loss) is calculated using the average daily shares method. |
| (b) | Distributions from Capital Gains include short-term capital gains, if any. |
| (c) | Total Return is the combination of changes in net asset value without any sales charge, reinvested dividend income at net asset value and reinvested capital gains distributions at net asset value, if any. Total Return is not annualized. |
| (d) | After expense reimbursement from the Adviser, where applicable. |
| * | Rounds to less than $.01 per share. |
| ** | Rounds to less than .01%. |
130
Section 5 Financial Highlights
Nuveen Tactical Market Opportunities Fund
| | | | | | | | | | | | | | | | | | | | | | | | | | | | | | | | | | | | | | | | | | | | | | | | | | | | |
Class
(Commencement
Date) | | | | | Investment Operations | | | Less Distributions | | | | | | | | | Ratios/Supplemental Data | |
Year Ended
October 31, | | Beginning
Net Asset
Value | | | Net
Investment
Income
(Loss)(a) | | | Net
Realized/
Unrealized
Gain (Loss) | | | Total | | | Net
Investment
Income | | | Capital
Gains(b) | | | Total | | | Ending
Net
Asset
Value | | | Total
Return(c) | | | Ending
Net
Assets
(000) | | | Ratios of
Expenses
to Average
Net
Assets(d) | | | Ratios of Net Investment Income (Loss) to Average Net Assets(d) | | | Portfolio
Turnover
Rate | |
| | | | | | | | | | | | | |
| Class A (2/11) | | | | | | | | | | | | | | | | | | | | | | | | | | | | | | | | | | | | | | | | | | | | | | | | | | | | |
| 2012 | | $ | 11.22 | | | $ | .02 | | | $ | .25 | | | $ | .27 | | | $ | (.03 | ) | | $ | (.17 | ) | | $ | (.20 | ) | | $ | 11.29 | | | | 2.45 | % | | $ | 59,751 | | | | 1.18 | % | | | .14 | % | | | 189 | % |
| 2011(e) | | | 10.59 | | | | .04 | | | | .59 | | | | .63 | | | | — | | | | — | | | | — | | | | 11.22 | | | | 5.95 | | | | 3,558 | | | | 1.19 | ** | | | .54 | | | | 177 | |
| | | | | | | | | | | | | |
| Class C (2/11) | | | | | | | | | | | | | | | | | | | | | | | | | | | | | | | | | | | | | | | | | | | | | | | | | | | | |
| 2012 | | | 11.17 | | | | (.07 | ) | | | .24 | | | | .17 | | | | — | | | | (.17 | ) | | | (.17 | ) | | | 11.17 | | | | 1.55 | | | | 15,045 | | | | 1.93 | | | | (.65 | ) | | | 189 | |
| 2011(e) | | | 10.59 | | | | — | * | | | .58 | | | | .58 | | | | — | | | | — | | | | — | | | | 11.17 | | | | 5.48 | | | | 475 | | | | 1.94 | ** | | | — | *** | | | 177 | |
| | | | | | | | | | | | | |
| Class I (12/09) | | | | | | | | | | | | | | | | | | | | | | | | | | | | | | | | | | | | | | | | | | | | | | | | | | | | |
| 2012 | | | 11.25 | | | | .05 | | | | .25 | | | | .30 | | | | (.06 | ) | | | (.17 | ) | | | (.23 | ) | | | 11.32 | | | | 2.69 | | | | 195,709 | | | | .93 | | | | .43 | | | | 189 | |
| 2011 | | | 10.62 | | | | .14 | | | | .59 | | | | .73 | | | | (.08 | ) | | | (.02 | ) | | | (.10 | ) | | | 11.25 | | | | 6.95 | | | | 48,860 | | | | .94 | | | | 1.25 | | | | 177 | |
| 2010(f) | | | 10.00 | | | | .02 | | | | .60 | | | | .62 | | | | — | | | | — | | | | — | | | | 10.62 | | | | 6.20 | | | | 27,300 | | | | .92 | ** | | | 1.39 | ** | | | 156 | |
| (a) | Per share Net Investment Income (Loss) is calculated using the average daily shares method. |
| (b) | Distributions from Capital Gains include short-term capital gains, if any. |
| (c) | Total Return is the combination of changes in net asset value without any sales charge, reinvested dividend income at net asset value and reinvested capital gains distributions at net asset value, if any. Total Return is not annualized. |
| (d) | After expense reimbursement from the Adviser, where applicable. |
| (e) | For the period February 24, 2011 (commencement of operations) through October 31, 2011. |
| (f) | For the period December 30, 2009 (commencement of operations) through October 31, 2010. |
| (g) | In addition to the fees and expenses which the Fund bears directly; the Fund indirectly bears a pro rata share of the fees and expenses of the exchange-traded funds in which the Fund invests. These exchange-traded fund fees and expenses are not reflected in the expense ratios. Because the exchange-traded funds have varied expenses and fee levels and the Fund may own different proportions at different times, the amount of fees and expenses incurred indirectly by the Fund will vary. |
| * | Rounds to less than $.01 per share. |
| *** | Annualized ratio rounds to less than .01%. |
Section 5 Financial Highlights
131
Section 6 Glossary of Investment Terms
| | • | | American Depositary Receipts (“ADRs”): Certificates issued by a U.S. depositary bank that represent a bank’s holdings of a stated number of shares of a non-U.S. company. ADRs are typically bought and sold in the same manner as U.S. securities (although investors can also purchase the non-U.S. securities overseas and convert them to ADRs, and likewise can convert an ADR to its underlying non-U.S. security and sell it overseas) and are priced in U.S. dollars. ADRs carry most of the risks of investing directly in non-U.S. equity securities. |
| | • | | Average cost basis method: Calculating cost basis by determining the average price paid for Fund shares that may have been purchased at different times for different prices. |
| | • | | BofA Merrill Lynch 3-Month U.S. Treasury Bill Index: An unmanaged index that is comprised of a single U.S. Treasury issue with approximately three months to final maturity, purchased at the beginning of each month and held for one full month. |
| | • | | Derivatives: Financial instruments whose performance is derived from the performance of an underlying asset, security or index. Derivatives may be used to hedge risk, to exchange a floating rate of return for a fixed rate of return or to gain investment exposure. Derivatives include futures, options and swaps, among other instruments. |
| | • | | Emerging markets: The financial markets of developing economies in countries with low per capita income in the initial stages of their industrialization cycles. They generally do not have the level of market efficiency and strict standards in accounting and securities regulation to be on par with advanced economies. Investments in emerging markets come with much greater risk due to political instability, domestic infrastructure problems, currency volatility and limited equity opportunities (many large companies may still be “state-run” or private). Also, local exchanges may not offer liquid markets for outside investors. |
| | • | | Futures: Derivative contracts obligating buyers to purchase an asset or sellers to sell an asset at a predetermined future date and price. Futures contracts detail the quality and quantity of the underlying asset; they are standardized to facilitate trading on a futures exchange. |
| | • | | Lipper Equity Income Classification Average: Represents the average annualized total return for all reporting funds in the Lipper Equity Income Funds Classification. |
| | • | | Lipper Flexible Portfolio Classification Average: Represents the average annualized total return for all reporting funds in the Lipper Flexible Portfolio Funds Classification. |
| | • | | Lipper International Large-Cap Growth Classification Average: Represents the average annualized total return for all reporting funds in the Lipper International Large-Cap Growth Funds Classification. |
| | • | | Lipper International Multi-Cap Growth Classification Average: Represents the average annualized returns for all reporting funds in the Lipper International Multi-Cap Growth Funds Classification. |
| | • | | Lipper Large-Cap Core Classification Average: Represents the average annualized total return for all reporting funds in the Lipper Large-Cap Core Funds Classification. |
132
Section 6 Glossary of Investment Terms
| | • | | Lipper Mid-Cap Core Classification Average: Represents the average annualized total return for all reporting funds in the Lipper Mid-Cap Core Funds Classification. |
| | • | | Lipper Mid-Cap Value Classification Average: Represents the average annualized total return for all reporting funds in the Lipper Mid-Cap Value Funds Classification. |
| | • | | Lipper Multi-Cap Growth Classification Average: Represents the average annualized total return for all reporting funds in the Lipper Multi-Cap Growth Funds Classification. |
| | • | | Lipper S&P 500® Index Objective Classification Average: Represents the average annualized total return for all reporting funds in the Lipper S&P 500® Index Objective Funds Classification. |
| | • | | Lipper Small-Cap Core Classification Average: Represents the average annualized total return for all reporting funds in the Lipper Small-Cap Core Funds Classification. |
| | • | | Lipper Small-Cap Growth Classification Average: Represents the average annualized total return for all reporting funds in the Lipper Small-Cap Growth Funds Classification. |
| | • | | Lipper Small-Cap Value Classification Average: Represents the average annualized total return for all reporting funds in the Lipper Small-Cap Value Funds Classification. |
| | • | | MSCI All Country World Investable Market Index (ex U.S.): The MSCI (Morgan Stanley Capital International) All Country World Investable Market Index (ex U.S.) is a free float-adjusted market capitalization weighted index that is designed to measure the equity market performance of developed and emerging markets. The index consists of 45 country indexes comprising 24 developed and 21 emerging market countries. |
| | • | | MSCI EAFE Index: The MSCI (Morgan Stanley Capital International) EAFE (Europe, Australasia, Far East) Index is a free float-adjusted market capitalization weighted index designed to measure developed market equity performance, excluding the U.S. and Canada. |
| | • | | Options: Derivative contracts giving buyers the right to buy or to sell shares of a specified stock at a specified price on or before a given date. There are also options on currencies and other financial assets. |
| | • | | Russell 1000® Growth Index: An index that measures the performance of those Russell 1000 companies with higher price-to-book ratios and higher forecasted growth values. |
| | • | | Russell 1000® Value Index: An index that measures the performance of those Russell 1000 companies with lower price-to-book ratios and lower forecasted growth values. |
| | • | | Russell 2000® Growth Index: An index that measures the performance of those Russell 2000 companies with higher price-to-book ratios and higher forecasted growth values. |
| | • | | Russell 2000® Index: An index that measures the performance of the small-cap segment of the U.S. equity universe. The Russell 2000 is a subset of the Russell 3000® Index representing approximately 10% of the total market capitalization of that index. It includes approximately 2000 of the smallest securities based on a combination of their market cap and current index membership. |
Section 6 Glossary of Investment Terms
133
| | • | | Russell 2000® Value Index: An index that measures the performance of those Russell 2000 companies with lower price-to-book ratios and lower forecasted growth values. |
| | • | | Russell Midcap® Growth Index: An index that measures the performance of the mid-cap growth segment of the U.S. equity universe. It includes those Russell Midcap Index companies with higher price-to-book ratios and higher forecasted growth values. |
| | • | | Russell Midcap® Index: An index that measures the performance of the mid-cap segment of the U.S. equity universe. The Russell Midcap is a subset of the Russell 1000® Index. It includes approximately 800 of the smallest securities based on a combination of their market cap and current index membership. The Russell Midcap represents approximately 31% of the total market capitalization of the Russell 1000 companies. |
| | • | | Russell Midcap® Value Index: An index that measures the performance of the mid-cap value segment of the U.S. equity universe. It includes those Russell Midcap Index companies with lower price-to-book ratios and lower forecasted growth values. |
| | • | | S&P 500® Index: An unmanaged index generally considered representative of the U.S. stock market. |
| | • | | S&P MidCap 400® Index: An unmanaged, market value-weighted index of 400 mid-cap companies. |
| | • | | Swaps: Derivative contracts in which two parties agree to exchange one stream of cash flows for another stream. Swap agreements define the dates when the cash flows will be paid and how the cash flows are calculated. |
134
Section 6 Glossary of Investment Terms
Nuveen Mutual Funds
Nuveen offers a variety of mutual funds designed to help you reach your financial goals. The funds below are grouped by category.
Municipal-National
All-American Municipal Bond
High Yield Municipal Bond
Inflation Protected Municipal Bond
Intermediate Duration Municipal Bond
Limited Term Municipal Bond
Short Duration High Yield Municipal Bond
Short Term Municipal Bond
Municipal-State
Arizona Municipal Bond
California High Yield Municipal Bond
California Municipal Bond
Colorado Municipal Bond
Connecticut Municipal Bond
Georgia Municipal Bond
Kansas Municipal Bond
Kentucky Municipal Bond
Louisiana Municipal Bond
Maryland Municipal Bond
Massachusetts Municipal Bond
Michigan Municipal Bond
Minnesota Intermediate Municipal Bond
Minnesota Municipal Bond
Missouri Municipal Bond
Nebraska Municipal Bond
New Jersey Municipal Bond
New Mexico Municipal Bond
New York Municipal Bond
North Carolina Municipal Bond
Municipal-State (continued)
Ohio Municipal Bond
Oregon Intermediate Municipal Bond
Pennsylvania Municipal Bond
Tennessee Municipal Bond
Virginia Municipal Bond
Wisconsin Municipal Bond
Taxable Fixed Income
Core Bond
Core Plus Bond
Global Total Return Bond
High Income Bond
Inflation Protected Securities
Intermediate Government Bond
NWQ Flexible Income
Preferred Securities
Short Term Bond
Strategic Income
Symphony Credit Opportunities
Symphony Floating Rate Income
Symphony High Yield Bond
Global/International
Global Growth
International
International Growth
International Select
Santa Barbara Global Dividend Growth
Santa Barbara International Dividend Growth
Symphony International Equity
Tradewinds Emerging Markets
Tradewinds Global All-Cap
Global/International (continued)
Tradewinds Global Resources
Tradewinds International Value
Tradewinds Japan
Tradewinds Small-Cap Opportunities
Value
Dividend Value
Large-Cap Value
Mid Cap Value
NWQ Large-Cap Value
NWQ Multi-Cap Value
NWQ Small-Cap Value
NWQ Small/Mid-Cap Value
Small Cap Value
Tradewinds Value Opportunities
Growth
Growth
Large Cap Growth
Large Cap Growth Opportunities
Mid Cap Growth Opportunities
Small Cap Growth Opportunities
Symphony Large-Cap Growth
Winslow Large-Cap Growth
Core
Concentrated Core
Core Dividend
Large Cap Core
Large Cap Core Plus
Large Cap Select
Mid Cap Select
Santa Barbara Dividend Growth
Core (continued)
Small Cap Select
Symphony Low Volatility Equity
Symphony Mid-Cap Core
Real Assets
Global Infrastructure
Gresham Diversified Commodity Strategy
Real Asset Income
Real Estate Securities
Asset Allocation
Strategy Aggressive Growth Allocation
Strategy Balanced Allocation
Strategy Conservative Allocation
Strategy Growth Allocation
Quantitative/Enhanced
Quantitative Enhanced Core Equity
Index
Equity Index
Mid Cap Index
Small Cap Index
Non-Traditional Strategies
Equity Long/Short
Equity Market Neutral
Gresham Long/Short Commodity Strategy
Intelligent Risk Conservative Allocation
Intelligent Risk Growth Allocation
Intelligent Risk Moderate Allocation
Tactical Market Opportunities
Several additional sources of information are available to you, including the codes of ethics adopted by the Funds, Nuveen Investments, Nuveen Fund Advisors and Nuveen Asset Management. The statement of additional information, incorporated by reference into this prospectus, contains detailed information on the policies and operation of the Funds included in this prospectus. Additional information about the Funds’ investments is available in the annual and semi-annual reports to shareholders. In the Funds’ annual reports, you will find a discussion of the market conditions and investment strategies that significantly affected the Funds’ performance during their last fiscal year. The Funds’ most recent statement of additional information, annual and semi-annual reports and certain other information are available, free of charge, by calling Nuveen Investor Services at (800) 257-8787, on the Funds’ website at www.nuveen.com, or through your financial advisor. Shareholders may call the toll free number above with any inquiries. The best sources for information regarding sales charges and distribution arrangements are the Funds’ prospectus and statement of additional information. The Funds have chosen to not separately disclose such information on their website because the prospectus and statement of additional information are made available free of charge on the website at www.nuveen.com.
You may also obtain this and other Fund information directly from the Securities and Exchange Commission (“SEC”). Reports and other information about the Funds are available on the EDGAR Database on the SEC’s website at http://www.sec.gov or in person at the SEC’s Public Reference Room in Washington, D.C. Call the SEC at (202) 551-8090 for room hours and operation. You may also request Fund information by sending an e-mail request to publicinfo@sec.gov or by writing to the SEC’s Public Reference Section at 100 F Street, NE, Washington, D.C. 20549-1520. The SEC may charge a copying fee for this information.
The Funds are series of Nuveen Investment Funds, Inc., whose Investment Company Act file number is 811-05309.
Distributed by
Nuveen Securities, LLC
333 West Wacker Drive
Chicago, Illinois 60606
(800) 257-8787
www.nuveen.com
MPR-FSTK-0613D
STATEMENT OF ADDITIONAL INFORMATION
NUVEEN SYMPHONY MID-CAP CORE FUND
Relating to the Acquisition of the Assets and Liabilities of
NUVEEN MID CAP SELECT FUND
333 West Wacker Dr.
Chicago, Illinois 60606
Telephone: (312) 917-7700
This Statement of Additional Information (“SAI”) is not a prospectus but should be read in conjunction with the Proxy Statement/Prospectus dated , 2013 for use in connection with the special meeting of shareholders (the “Special Meeting”) of Nuveen Mid Cap Select Fund (the “Target Fund”), a series of Nuveen Investment Funds, Inc. (the “Corporation”), to be held on , 2013. At the Special Meeting, shareholders of the Target Fund will be asked to approve the reorganization (the “Reorganization”) of the Target Fund into Nuveen Symphony Mid-Cap Core Fund (the “Acquiring Fund”; the Target Fund and the Acquiring Fund are collectively referred to as the “Funds”) as described in the Proxy Statement/Prospectus. Copies of the Proxy Statement/Prospectus may be obtained at no charge by writing to the Corporation at the address shown above or by calling (800) 257-8787. Capitalized terms used herein that are not defined have the same meaning as in the Proxy Statement/Prospectus.
Further information about the Funds is contained in the Acquiring Fund’s Statement of Additional Information dated January 31, 2013, as supplemented through the date of this SAI, and the Target Fund’s Statement of Additional Information dated February 28, 2013, as supplemented through the date of this SAI, each of which is incorporated herein by reference only insofar as it relates to the Acquiring Fund or Target Fund, respectively. No other parts are incorporated by reference herein.
The unaudited pro forma financial information, attached hereto as Appendix A, is intended to present the financial condition and related results of operations of the Acquiring Fund as if the Reorganization had been consummated on March 31, 2013.
The audited financial statements and related independent registered public accounting firm’s report for the Acquiring Fund are contained in the Fund’s Annual Report for the fiscal year ended September 30, 2012, and the unaudited financial statements for the Acquiring Fund are contained in the Fund’s Semi-Annual Report for the six-month period ended March 31, 2013, each of which is incorporated herein by reference only insofar as it relates to the Acquiring Fund. No other parts of the Annual Report or Semi-Annual Report are incorporated by reference herein.
The audited financial statements and related independent registered public accounting firm’s report for the Target Fund are contained in the Fund’s Annual Report for the fiscal year ended October 31, 2012, and the unaudited financial statements for the Target Fund are contained in the Fund’s Semi-Annual Report for the six-month period ended April 30, 2013, each of which is incorporated herein by reference only insofar as it relates to the Target Fund. No other parts of the Annual Report or Semi-Annual Report are incorporated by reference herein.
The date of this Statement of Additional Information is , 2013.
S-1
Appendix A
Pro Forma Financial Information
(Unaudited)
The unaudited pro forma financial information set forth below is for informational purposes only and does not purport to be indicative of the financial condition that actually would have resulted if the Reorganization had been consummated. These pro forma numbers have been estimated in good faith based on information regarding the Target Fund and Acquiring Fund as of March 31, 2013, using the fees and expenses information shown in the Proxy Statement/Prospectus. The unaudited pro forma financial information should be read in conjunction with the historical financial statements of the Target Fund and Acquiring Fund, which are available in their annual and semi-annual shareholder reports.
Narrative Description of the Pro Forma Effects of the Reorganization
Note 1 — Reorganization
The unaudited pro forma information has been prepared to give effect to the proposed reorganization of the Target Fund into the Acquiring Fund pursuant to an Agreement and Plan of Reorganization (the “Plan”) as if the Reorganization occurred on March 31, 2013.
| | |
| Target Fund | | Acquiring Fund |
| Nuveen Mid Cap Select Fund | | Nuveen Symphony Mid-Cap
Core Fund |
Note 2 — Basis of Pro Forma
The Reorganization will be accounted for as a tax-free reorganization for federal income tax purposes; therefore, no gain or loss will be recognized by the Acquiring Fund or its shareholders as a direct result of the Reorganization. The Target Fund and the Acquiring Fund are both registered open-end management investment companies. The Reorganization would be accomplished by the acquisition of all of the assets and the assumption of all of the liabilities of the Target Fund by the Acquiring Fund in exchange for shares of the Acquiring Fund, followed by the distribution of such shares to Target Fund shareholders in complete liquidation and termination of the Target Fund. The pro forma financial information has been adjusted to reflect the assumption that the Target Fund distributes its undistributed net investment income of $78,717 to its shareholders prior to the Reorganization. The table below shows the class and shares that Target Fund shareholders would have received had the Reorganization occurred on the period ended date in Note 1.
| | | | |
Target Fund Share Class | | Acquiring Fund Shares Issued | | Acquiring Fund Share Class |
Class A | | 400,577 | | Class A |
Class C | | 67,772 | | Class C |
Class I | | 490,298 | | Class I |
The Reorganization will be accounted for as a tax-free reorganization for federal income tax purposes. In accordance with accounting principles generally accepted in the United States of America, for financial reporting purposes, the historical cost basis of the investments received from the Target Fund will be carried forward to align ongoing reporting of the realized and unrealized gains and losses of the surviving fund (which will be the Acquiring Fund) with amounts distributable to shareholders for tax purposes.
A-1
| | | | | | | | |
Fund | | Net Assets | | | As-of Date | |
Nuveen Mid Cap Select Fund
(Target Fund) | | $ | 26,969,751 | | | | March 31, 2013 | |
Nuveen Symphony Mid-Cap Core Fund (Acquiring Fund) | | $ | 5,213,052 | | | | March 31, 2013 | |
Nuveen Symphony Mid-Cap Core Fund (Pro Forma Combined Fund) | | $ | 32,104,086 | | | | March 31, 2013 | |
Note 3 — Pro Forma Expense Adjustments
The table below reflects adjustments to annual expenses made to the Pro Forma Combined Fund financial information as if the Reorganization had taken place on the first day of the period as disclosed in Note 1 using the fees and expenses information shown in the Proxy Statement/Prospectus. The pro forma information has been derived from the books and records used in calculating daily net asset values of the Target Fund and Acquiring Fund and has been prepared in accordance with accounting principles generally accepted in the United States of America which require management to make estimates and assumptions that affect this information. Percentages presented below are the increase (decrease) in expenses divided by the Pro Forma Combined Fund net assets presented in Note 2. Actual results could differ from those estimates. No other significant pro forma effects are expected to result from the Reorganization.
| | | | | | | | |
| | | Fee and Expense
Increase (Decrease) | |
Net Expense Category | | Dollar Amount | | | Percentage | |
Management fees1 | | $ | (39,239 | ) | | | (0.12% | ) |
Custodian fees and expenses2 | | $ | (13,534 | ) | | | (0.04% | ) |
Professional fees2 | | $ | (12,034 | ) | | | (0.04% | ) |
Federal and state registration fees2 | | $ | (254 | ) | | | (0.00% | )4 |
Reimbursement3 | | $ | 65,061 | | | | 0.20% | |
| | | | | | | | |
Total Pro Forma Net Expense Adjustment | | $ | — | | | | 0.00% | |
| | | | | | | | |
| (1) | Reflects the impact of applying the Acquiring Fund’s fund-level management fee rates following the Reorganization to the combined fund’s average net assets. |
| (2) | Reflects the anticipated reduction of certain duplicative expenses eliminated as a result of the Reorganization. |
| (3) | Reflects the decrease in expense reimbursement payments the adviser would have made to the combined fund if the Reorganization had occurred on the first day of the period disclosed in Note 1. |
| (4) | Rounds to less than (0.01%). |
No significant accounting policies will change as a result of the Reorganization, specifically policies regarding security valuation or compliance with Subchapter M of the Internal Revenue Code of 1986, as amended. No significant changes to any existing contracts of the Acquiring Fund are expected as a result of the Reorganization.
Note 4 — Portfolio Repositioning
If the Reorganization had occurred as of March 31, 2013, the Target Fund would not have been required to dispose of any of its securities in order to comply with the Acquiring Fund’s investment policies and restrictions. However, based on the Funds’ portfolios as of March 31, 2013, it is estimated that the Target Fund will sell approximately 85% of its portfolio prior to the Reorganization because of
A-2
the different investment processes utilized by the sub-advisers. It is estimated that such portfolio repositioning would have resulted in realized gains of approximately $3.1 million if such sales occurred as of March 31. 2013. However, due to the Target Fund’s capital loss carryforwards set forth in Note 7 below, it is not expected that any such portfolio repositioning would have resulted in capital gain distributions to Target Fund shareholders. Reorganization costs do not include any commissions or other transaction costs that would be incurred due to portfolio repositioning.
Note 5 — Reorganization Costs
Nuveen Fund Advisors estimates that expenses for the Reorganization will be approximately $159,000. These costs represent management’s estimate of professional services fees, printing costs and mailing charges related to the proposed Reorganization to be borne by the Target Fund up to the projected cost savings for the Target Fund for the first year following the Reorganization. Nuveen will absorb any Reorganization costs in excess of the Target Fund’s expected cost savings of approximately $2,600. The Acquiring Fund is not expected to realize cost savings, and therefore it will not be charged any of the Reorganization costs. To the extent that payment of these costs would cause the Target Fund to exceed its expense cap for all share classes currently in effect through February 28, 2014, Nuveen will reimburse the portion of the expenses necessary for the Fund to operate within the cap. Based on current expense levels, it is anticipated that Nuveen will absorb all expenses charged to the Target Fund. The pro forma financial information included in Note 2 has been adjusted for any costs related to the Reorganization to be borne by the Target Fund. Nuveen will bear 100% of these costs and expenses if the Reorganization is not consummated.
Note 6 — Accounting Survivor
The Acquiring Fund will be the accounting survivor. The surviving fund will have the portfolio management team, portfolio composition, strategies, investment objective, expense structure and policies/restrictions of the Acquiring Fund.
Note 7 — Capital Loss Carryforward
At March 31, 2013, the Acquiring Fund had no unused capital loss carryforwards, while the Target Fund had unused capital loss carryforwards available for federal income tax purposes to be applied against future capital gains, if any. If not applied, the capital loss carryforwards will expire as follows:
| | | | |
| | | Target Fund | |
Expiration Date: | | | | |
October 31, 2016 | | $ | 3,329,146 | |
October 31, 2017 | | | 15,708,192 | |
| | | | |
Total | | $ | 19,037,338 | |
| | | | |
A-3
January 31, 2013
Nuveen Symphony International Equity Fund
Ticker Symbols: Class A—NSIAX, Class C—NSECX, Class R3—NSREX, Class I—NSIEX
Nuveen Symphony Large-Cap Growth Fund
Ticker Symbols: Class A—NCGAX, Class C—NCGCX, Class R3—NSGQX, Class I—NSGIX
Nuveen Symphony Mid-Cap Core Fund
Ticker Symbols: Class A—NCCAX, Class C—NCCCX, Class R3—NMCRX, Class I—NCCIX
Nuveen Symphony Optimized Alpha Fund
Ticker Symbols: Class A—NOPAX, Class C—NOPCX, Class I—NOPRX
STATEMENT OF ADDITIONAL INFORMATION
This Statement of Additional Information (“SAI”) is not a prospectus. This SAI relates to, and should be read in conjunction with, the Prospectus dated January 31, 2013 for Nuveen Symphony International Equity Fund, Nuveen Symphony Large-Cap Growth Fund, Nuveen Symphony Mid-Cap Core Fund and Nuveen Symphony Optimized Alpha Fund (each, a “Fund,” and collectively, the “Funds”), each a series of Nuveen Investment Trust II. A Prospectus may be obtained without charge from certain securities representatives, banks and other financial institutions that have entered into sales agreements with Nuveen Securities, LLC (the “Distributor”), or from a Fund, by written request to the applicable Fund, c/o Nuveen Investor Services, P.O. Box 8530, Boston, Massachusetts 02266-8530, or by calling (800) 257-8787.
The audited financial statements for each Fund’s most recent fiscal year appear in the Fund’s Annual Report dated September 30, 2012, which is incorporated herein by reference and is available without charge by calling (800) 257-8787.
TABLE OF CONTENTS
S-2
GENERAL INFORMATION
The Funds are diversified series of Nuveen Investment Trust II (the “Trust”), an open-end management investment company organized as a Massachusetts business trust on June 27, 1997. Each series of the Trust represents shares of beneficial interest in a separate portfolio of securities and other assets, with its own objective and policies. Currently, 18 series of the Trust are authorized and outstanding. The Funds’ investment adviser is Nuveen Fund Advisors, LLC (“Nuveen Fund Advisors” or the “Adviser”). The Funds’ sub-adviser is Symphony Asset Management LLC (“Symphony” or the “Sub-Adviser”).
Certain matters under the Investment Company Act of 1940, as amended (the “1940 Act”), which must be submitted to a vote of the holders of the outstanding voting securities of a series, shall not be deemed to have been effectively acted upon unless approved by the holders of a majority of the outstanding voting shares of each series affected by such matter.
INVESTMENT RESTRICTIONS
The investment objective and certain fundamental investment policies of each Fund are described in the Prospectus for the Funds. Each Fund, as a fundamental policy, may not, without the approval of the holders of a majority of the Fund’s outstanding voting shares:
(1) With respect to 75% of the total assets of the Fund, purchase the securities of any issuer (except securities issued or guaranteed by the United States government or any agency or instrumentality thereof) if, as a result, (i) more than 5% of the Fund’s total assets would be invested in securities of that issuer, or (ii) the Fund would hold more than 10% of the outstanding voting securities of that issuer.
(2) Borrow money, except as permitted by the 1940 Act and exemptive orders granted under the 1940 Act.
(3) Act as an underwriter of another issuer’s securities, except to the extent that the Fund may be deemed to be an underwriter within the meaning of the Securities Act of 1933 in connection with the purchase and sale of portfolio securities.
(4) Make loans except as permitted by the 1940 Act and exemptive orders granted under the 1940 Act.
(5) Purchase or sell physical commodities unless acquired as a result of ownership of securities or other instruments (but this shall not prevent the Fund from purchasing or selling options, futures contracts, or other derivative instruments, or from investing in securities or other instruments backed by physical commodities).
(6) Purchase or sell real estate unless acquired as a result of ownership of securities or other instruments (but this shall not prohibit the Fund from purchasing or selling securities or other instruments backed by real estate or of issuers engaged in real estate activities).
(7) Issue senior securities, except as permitted under the 1940 Act.
(8) Purchase the securities of any issuer if, as a result, 25% or more of the Fund’s total assets would be invested in the securities of issuers whose principal business activities are in the same industry; except that this restriction shall not be applicable to securities issued or guaranteed by the U.S. government or any agency or instrumentality thereof.
Except with respect to paragraph (2) above, the foregoing restrictions and limitations will apply only at the time of purchase of securities, and the percentage limitations will not be considered violated unless an excess or deficiency occurs or exists immediately after and as a result of an acquisition of securities, unless otherwise indicated.
For purposes of applying the limitations set forth in numbers 2 and 7 above, under the 1940 Act as currently in effect, a Fund is not permitted to issue senior securities, except that a Fund may borrow from any bank if immediately after such borrowing the value of the Fund’s total assets is at least 300%
S-3
of the principal amount of all of the Fund’s borrowings (i.e., the principal amount of the borrowings may not exceed 33 1/3% of the Fund’s total assets). In the event that such asset coverage shall at any time fall below 300% the Fund shall, within three days thereafter (not including Sundays and holidays) reduce the amount of its borrowings to an extent that the asset coverage of such borrowing shall be at least 300%.
For purposes of applying the limitation set forth in number 4 above, there are no limitations with respect to unsecured loans made by a Fund to an unaffiliated party. However, when a Fund loans its portfolio securities, the obligation on the part of the Fund to return collateral upon termination of the loan could be deemed to involve the issuance of a senior security within the meaning of Section 18(f) of the 1940 Act. In order to avoid violation of Section 18(f), the Fund may not make a loan of portfolio securities if, as a result, more than one-third of its total asset value (at market value computed at the time of making a loan) would be on loan.
The limitation in number 8 above will be interpreted to permit investment without limit in the following: securities of the U.S. government and its agencies or instrumentalities; securities of state, territory, possession or municipal governments and their authorities, agencies, instrumentalities or political subdivisions; securities of foreign governments; and repurchase agreements collateralized by any such obligations. Accordingly, issuers of the foregoing securities will not be considered to be members of any industry. This limitation also does not place a limit on investment in issuers domiciled in a single jurisdiction or country.
For purposes of applying the limitation set forth in number 8 above, each Fund classifies asset-backed securities in its portfolio in separate industries based upon a combination of the industry of the issuer or sponsor and the type of collateral. The industry of the issuer or sponsor and the type of collateral will be determined by the Adviser. For example, an asset-backed security known as “Money Store 94-D A2” would be classified as follows: the issuer or sponsor of the security is The Money Store, a personal finance company, and the collateral underlying the security is automobile receivables. Therefore, the industry classification would be Personal Finance Companies—Automobile. Similarly, an asset-backed security known as “Midlantic Automobile Grantor Trust 1992-1 B” would be classified as follows: the issuer or sponsor of the security is Midlantic National Bank, a banking organization, and the collateral underlying the security is automobile receivables. Therefore, the industry classification would be Banks—Automobile. Thus, an issuer or sponsor may be included in more than one “industry” classification, as may a particular type of collateral.
The foregoing fundamental investment policies, together with the investment objective of each of the Funds and certain other policies specifically identified in the Prospectus, cannot be changed without approval by holders of a “majority of the Fund’s outstanding voting shares.” As defined in the 1940 Act, this means the vote of (i) 67% or more of the Fund’s shares present at a meeting, if the holders of more than 50% of the Fund’s shares are present or represented by proxy, or (ii) more than 50% of the Fund’s shares, whichever is less.
In addition to the foregoing fundamental investment policies, each Fund is also subject to the following non-fundamental restrictions and policies, which may be changed by the Board of Trustees. A Fund may not:
(1) Sell securities short, unless the Fund owns or has the right to obtain securities equivalent in kind and amount to the securities sold short at no added cost, and provided that transactions in options, futures contracts, options on futures contracts, or other derivative instruments are not deemed to constitute selling securities short.
(2) Purchase securities on margin, except that the Fund may obtain such short term credits as are necessary for the clearance of transactions; and provided that margin deposits in connection with futures contracts, options on futures contracts, or other derivative instruments shall not constitute purchasing securities on margin.
(3) Purchase securities of open-end and closed-end investment companies except in compliance with the 1940 Act.
S-4
(4) Invest in direct interests in oil, gas or other mineral exploration programs or leases; however, the Fund may invest in the securities of issuers that engage in these activities.
(5) Purchase securities when borrowings exceed 5% of its total assets. If due to market fluctuations or other reasons, the value of the Fund’s assets falls below 300% of its borrowings, the Fund will reduce its borrowings within 3 business days.
(6) Invest in illiquid securities if, as a result of such investment, more than 15% of the Fund’s net assets would be invested in illiquid securities.
(7) Acquire any securities of registered open-end investment companies or registered unit investment trusts in reliance on subparagraph (F) or subparagraph (G) of Section 12(d)(1) of the 1940 Act.
(8) Invest directly in futures, options on futures and swaps to the extent that the Adviser would be required to register with the Commodity Futures Trading Commission (“CFTC”) as a commodity pool operator. See “Investment Policies and Techniques—Derivatives and Hedging Strategies—Limitations on the Use of Futures, Options on Futures and Swaps.”
For the purposes of paragraph 6 above, “illiquid securities” will have the same meaning as it does under the 1940 Act.
Nuveen Symphony International Equity Fund has adopted a non-fundamental investment policy pursuant to Rule 35d-1 under the 1940 Act (the “Name Policy”) whereby it, under normal market conditions, will invest at least 80% of its net assets (plus the amount of any borrowings for investment purposes) in equity securities; the Fund’s strategy of investing at least 80% of its net assets in non-U.S. equity securities is not subject to the Name Policy. Nuveen Symphony Large-Cap Growth Fund has adopted the Name Policy whereby it, under normal market conditions, will invest at least 80% of its net assets (plus the amount of any borrowings for investment purposes) in equity securities of companies with market capitalizations at the time of investment comparable to companies in the Russell 1000 Growth Index. Nuveen Symphony Mid-Cap Core Fund has adopted the Name Policy whereby it, under normal market conditions, will invest at least 80% of its net assets (plus the amount of any borrowings for investment purposes) in equity securities of companies with market capitalizations at the time of investment comparable to companies in the Russell Midcap Index.
As a result, each of Nuveen Symphony International Equity Fund, Nuveen Symphony Large-Cap Growth Fund and Nuveen Symphony Mid-Cap Core Fund must provide shareholders with a notice meeting the requirement of Rule 35d-1(c) at least 60 days prior to any change of their Fund’s Name Policy. For purpose of the Name Policy, the Funds consider the term “investments” to include both direct investments and indirect investments (e.g., investments in an underlying fund, derivatives and synthetic instruments with economic characteristics similar to the underlying asset), and the Funds may achieve exposure to a particular investment, industry, country or geographic region through direct investments or indirect investments.
INVESTMENT POLICIES AND TECHNIQUES
The following information supplements the discussion of the Funds’ investment objectives, principal investment strategies, policies and techniques that appears in the Prospectus for the Funds. Additional information concerning principal investment strategies of the Funds, and other investment strategies that may be used by the Funds, is set forth below. The Funds have attempted to identify investment strategies that will be employed in pursuing each Fund’s investment objective. Additional information concerning the Funds’ investment restrictions is set forth above under “Investment Restrictions.”
If a percentage limitation on investments by a Fund stated in this SAI or its Prospectus is adhered to at the time of an investment, a later increase or decrease in percentage resulting from changes in asset value will not be deemed to violate the limitation except in the case of the limitations on borrowing.
References in this section to the Adviser also apply, to the extent applicable, to the Sub-adviser of the Funds.
S-5
Cash Equivalents and Short-Term Investments
Under normal market conditions, the Funds may hold up to 10% of their net assets in cash or cash equivalents, money market funds and short-term taxable fixed income securities. For temporary defensive purposes or during periods of high cash inflows or outflows, the Funds may invest up to 100% of their net assets in such holdings. During such periods, a Fund may not be able to achieve its investment objective. The Funds may only invest in short-term taxable fixed income securities with a maturity of one year or less and whose issuers have a long-term rating of at least A or higher by S&P, Moody’s or Fitch. Short-term taxable fixed income securities are defined to include, without limitation, the following:
(1) Each Fund may invest in U.S. government securities, including bills, notes and bonds differing as to maturity and rates of interest, which are either issued or guaranteed by the U.S. Treasury or by U.S. government agencies or instrumentalities. U.S. government agency securities include securities issued by (a) the Federal Housing Administration, Farmers Home Administration, Export-Import Bank of the United States, Small Business Administration, and the Government National Mortgage Association, whose securities are supported by the full faith and credit of the United States; (b) the Federal Home Loan Banks, Federal Intermediate Credit Banks, and the Tennessee Valley Authority, whose securities are supported by the right of the agency to borrow from the U.S. Treasury; (c) the Federal National Mortgage Association, whose securities are supported by the discretionary authority of the U.S. government to purchase certain obligations of the agency or instrumentality; and (d) the Student Loan Marketing Association, whose securities are supported only by its credit. While the U.S. government provides financial support to such U.S. government-sponsored agencies or instrumentalities, no assurance can be given that it always will do so since it is not so obligated by law. The U.S. government, its agencies and instrumentalities do not guarantee the market value of their securities, and consequently, the value of such securities may fluctuate. In addition, a Fund may invest in sovereign debt obligations of non-U.S. countries. A sovereign debtor’s willingness or ability to repay principal and interest in a timely manner may be affected by a number of factors, including its cash flow situation, the extent of its non-U.S. reserves, the availability of sufficient non-U.S. exchange on the date a payment is due, the relative size of the debt service burden to the economy as a whole, the sovereign debtor’s policy toward principal international lenders and the political constraints to which it may be subject.
(2) Each Fund may invest in certificates of deposit issued against funds deposited in a bank or savings and loan association. Such certificates are for a definite period of time, earn a specified rate of return, and are normally negotiable. If such certificates of deposit are non-negotiable, they will be considered illiquid securities and be subject to the Fund’s 15% restriction on investments in illiquid securities. Pursuant to the certificate of deposit, the issuer agrees to pay the amount deposited plus interest to the bearer of the certificate on the date specified thereon. Under current FDIC regulations, the maximum insurance payable as to any one certificate of deposit is $250,000; therefore, certificates of deposit purchased by a Fund may not be fully insured. A Fund may only invest in certificates of deposit issued by U.S. banks with at least $1 billion in assets.
(3) Each Fund may invest in bankers’ acceptances, which are short-term credit instruments used to finance commercial transactions. Generally, an acceptance is a time draft drawn on a bank by an exporter or an importer to obtain a stated amount of funds to pay for specific merchandise. The draft is then “accepted” by a bank that, in effect, unconditionally guarantees to pay the face value of the instrument on its maturity date. The acceptance may then be held by the accepting bank as an asset or it may be sold in the secondary market at the going rate of interest for a specific maturity.
(4) Each Fund may invest in repurchase agreements which involve purchases of debt securities. In such an action, at the time the Fund purchases the security, it simultaneously agrees to resell and redeliver the security to the seller, who also simultaneously agrees to buy back the security at a fixed price and time. This assures a predetermined yield for a Fund during its holding period since the resale price is always greater than the purchase price and reflects an agreed-upon market rate. Such actions afford an opportunity for a Fund to invest temporarily available cash. A Fund may enter into repurchase agreements only with respect to obligations of the
S-6
U.S. government, its agencies or instrumentalities; certificates of deposit; or bankers’ acceptances in which the Fund may invest. Repurchase agreements may be considered loans to the seller, collateralized by the underlying securities. The risk to a Fund is limited to the ability of the seller to pay the agreed-upon sum on the repurchase date; in the event of default, the repurchase agreement provides that the affected Fund is entitled to sell the underlying collateral. If the value of the collateral declines after the agreement is entered into, however, and if the seller defaults under a repurchase agreement when the value of the underlying collateral is less than the repurchase price, the Fund could incur a loss of both principal and interest. The portfolio managers monitor the value of the collateral at the time the action is entered into and at all times during the term of the repurchase agreement. The portfolio managers do so in an effort to determine that the value of the collateral always equals or exceeds the agreed-upon repurchase price to be paid to a Fund. If the seller were to be subject to a federal bankruptcy proceeding, the ability of a Fund to liquidate the collateral could be delayed or impaired because of certain provisions of the bankruptcy laws.
(5) Each Fund may invest in bank time deposits, which are monies kept on deposit with banks or savings and loan associations for a stated period of time at a fixed rate of interest. There may be penalties for the early withdrawal of such time deposits, in which case the yields of these investments will be reduced.
(6) Each Fund may invest in commercial paper, which are short-term unsecured promissory notes, including variable rate master demand notes issued by corporations to finance their current operations. Master demand notes are direct lending arrangements between a Fund and a corporation. There is no secondary market for the notes. However, they are redeemable by a Fund at any time. The portfolio managers will consider the financial condition of the corporation (e.g., earning power, cash flow and other liquidity ratios) and will continuously monitor the corporation’s ability to meet all of its financial obligations, because a Fund’s liquidity might be impaired if the corporation were unable to pay principal and interest on demand. The Funds may only invest in commercial paper rated A-2 or better by S&P, Prime-2 or higher by Moody’s or F2 or higher by Fitch, or unrated commercial paper which is, in the opinion of the portfolio managers, of comparable quality.
Derivatives and Hedging Strategies
Subject to the limitations set forth below under “Limitations on the Use of Futures, Options on Futures and Swaps,“ each Fund may utilize a variety of financial instruments, including options, futures contracts (sometimes referred to as “futures”), forward contracts and swaps to attempt to seek to enhance return, to hedge some of the risks of its investments in securities, as a substitute for a position in the underlying asset, to reduce transaction costs, to maintain full market exposure (which means to adjust the characteristics of its investments to more closely approximate those of the markets in which it invests), to manage cash flows, to limit exposure to losses due to changes to non-U.S. currency exchange rate or to preserve capital.
Derivative hedges are generally used to hedge against price movements in one or more particular securities positions that a Fund owns or intends to acquire. Such instruments may also be used to “lock-in” realized but unrecognized gains in the value of portfolio securities. Hedging instruments on stock indices, in contrast, generally are used to hedge against price movements in broad equity market sectors in which a Fund has invested or expects to invest. Hedging strategies, if successful, can reduce the risk of loss by wholly or partially offsetting the negative effect of unfavorable price movements in the investments being hedged. However, hedging strategies can also reduce the opportunity for gain by offsetting the positive effect of favorable price movements in the hedged investments. A Fund may also use derivative instruments to manage the risks of its assets. Risk management strategies include, but are not limited to, facilitating the sale of securities, establishing a position in the derivatives markets as a substitute for buying or selling certain securities or creating or altering exposure to certain asset classes, such as debt and non-U.S. securities. The use of derivative instruments may provide a less expensive, more expedient or more specifically focused way for a Fund to invest than would “traditional” securities (i.e., stocks or bonds). The use of derivative instruments is subject to applicable regulations of the Securities and Exchange Commission (the “SEC”), the several options and futures exchanges upon which they are traded, the Commodity
S-7
Futures Trading Commission (the “CFTC”) and various state regulatory authorities. In addition, a Fund’s ability to use hedging instruments will be limited by tax considerations.
Limitations on the Use of Futures, Options on Futures and Swaps
Each Fund will limit its direct investments in futures, options on futures and swaps to the extent necessary for the Adviser to claim the exclusion from regulation as a commodity pool operator with respect to each Fund under CFTC Rule 4.5, as such rule may be amended from time to time. Under Rule 4.5 as currently in effect, each Fund will limit its trading activity in futures, option on futures and swaps (excluding activity for “bona fide hedging purposes,” as defined by the CFTC) such that it meets one of the following tests:
| | • | | Aggregate initial margin and premiums required to establish its futures, options on futures and swap positions do not exceed 5% of the liquidation value of the Fund’s portfolio, after taking into account unrealized profits and losses on such positions; or |
| | • | | Aggregate net notional value of its futures, options on futures and swap positions does not exceed 100% of the liquidation value of the Fund’s portfolio, after taking into account unrealized profits and losses on such positions. |
The Adviser, with respect to each Fund, has filed a notice of eligibility for exclusion from the definition of the term commodity pool operator under the Commodity Exchange Act and therefore is not subject to registration or regulation as a commodity pool operator thereunder.
The requirements for qualification as a regulated investment company may also limit the extent to which each Fund may invest in futures, options on futures and swaps. See “Tax Matters—Qualification as a Regulated Investment Company.”
Asset Coverage for Futures and Options Positions
Each Fund will comply with the regulatory requirements of the SEC and the CFTC with respect to coverage of options and futures positions by registered investment companies and, if the guidelines so require, will set aside or earmark cash, U.S. government securities, high grade liquid debt securities and/or other liquid assets permitted by the SEC and CFTC in the amount prescribed. Securities set aside or earmarked cannot be sold while the futures or options position is outstanding, unless replaced with other permissible assets, and will be marked-to-market daily. A Fund may not enter into futures or options positions if such positions will require the Fund to set aside or earmark more than 100% of its assets.
Federal Income Tax Treatment of Futures Contracts and Options
Each Fund’s transactions in futures contracts and options will be subject to special provisions of the Internal Revenue Code of 1986, as amended (the “Code”) that, among other things, may affect the character of gains and losses realized by a Fund (i.e., may affect whether gains or losses are ordinary or capital, or short-term or long-term), may accelerate recognition of income to a Fund and may defer Fund losses. These rules could, therefore, affect the character, amount and timing of distributions to shareholders. These provisions also (a) will require a Fund to mark-to-market certain types of the positions in its portfolio (i.e., treat them as if they were closed out), and (b) may cause a Fund to recognize income without receiving cash with which to make distributions in amounts necessary to satisfy the 90% distribution requirement for qualifying to be taxed as a regulated investment company and the distribution requirement for avoiding excise taxes.
Certain Considerations Regarding Options
There is no assurance that a liquid secondary market on an options exchange will exist for any particular option, or at any particular time, and for some options no secondary market on an exchange or elsewhere may exist. If a Fund is unable to close out a call option on securities that it has written before the option is exercised, the Fund may be required to purchase the optioned securities in order to satisfy its obligation under the option to deliver such securities. If a Fund is unable to effect a closing sale transaction with respect to options on securities that it has purchased, it would have to exercise the option in order to realize any profit and would incur transaction costs upon the purchase and sale of the underlying securities.
S-8
The writing and purchasing of options is a highly specialized activity which involves investment techniques and risks different from those associated with ordinary portfolio securities transactions. Imperfect correlation between the options and securities markets may detract from the effectiveness of attempted hedging. Options transactions may result in significantly higher transaction costs for a Fund.
Stock Index Options
Each Fund may (i) purchase stock index options, (ii) sell stock index options, and/or (iii) write covered options on stock indexes for any purpose. Stock index options are put options and call options on various stock indexes. In most respects, they are identical to listed options on common stocks. The primary difference between stock options and index options occurs when index options are exercised. In the case of stock options, the underlying security, common stock, is delivered. However, upon the exercise of an index option, settlement does not occur by delivery of the securities comprising the index. The option holder who exercises the index option receives an amount of cash if the closing level of the stock index upon which the option is based is greater than, in the case of a call, or less than, in the case of a put, the exercise price of the option. This amount of cash is equal to the difference between the closing price of the stock index and the exercise price of the option expressed in dollars times a specified multiple.
A stock index fluctuates with changes in the market values of the stock included in the index. For example, some stock index options are based on a broad market index, such as the Standard & Poor’s 500® or the Value Line Composite Index or a narrower market index, such as the Standard & Poor’s 100. Indexes may also be based on an industry or market segment, such as the AMEX Oil and Gas Index or the Computer and Business Equipment Index. Options on stock indexes are currently traded on the following exchanges: the Chicago Board of Options Exchange, the New York Stock Exchange (the “NYSE”), the American Stock Exchange, the Pacific Stock Exchange and the Philadelphia Stock Exchange.
A Fund’s use of stock index options is subject to certain risks. Successful use by a Fund of options on stock indexes will be subject to the ability of the portfolio managers to correctly predict movements in the direction of the stock market. This requires different skills and techniques than predicting changes in the prices of individual securities. In addition, a Fund’s ability to effectively hedge all or a portion of the securities in its portfolio, in anticipation of or during a market decline through transactions in put options on stock indexes, depends on the degree to which price movements in the underlying index correlate with the price movements of the securities held by a Fund. Inasmuch as a Fund’s securities will not duplicate the components of an index, the correlation will not be perfect. Consequently, a Fund will bear the risk that the prices of its securities being hedged will not move in the same amount as the prices of its put options on the stock indexes. It is also possible that there may be a negative correlation between the index and a Fund’s securities which would result in a loss on both such securities and the options on stock indexes acquired by the Fund.
The hours of trading for options may not conform to the hours during which the underlying securities are traded. To the extent that the options markets close before the markets for the underlying securities, significant price and rate movements can take place in the underlying markets that cannot be reflected in the options markets. The purchase of options is a highly specialized activity which involves investment techniques and risks different from those associated with ordinary portfolio securities transactions. The purchase of stock index options involves the risk that the premium and transaction costs paid by a Fund in purchasing an option will be lost as a result of unanticipated movements in prices of the securities comprising the stock index on which the option is based. Options transactions may result in significantly higher transaction costs for the Fund.
Futures Contracts
Each Fund may enter into futures contracts (hereinafter referred to as “Futures Contracts”), including index futures, as a hedge against movements in the equity markets, in order to establish more definitely the effective return on securities held or intended to be acquired by a Fund or for other purposes permissible under the CEA. A Fund’s hedging may include sales of futures as an offset against the effect of expected declines in stock prices and purchases of futures as an offset against the effect of expected increases in stock prices. A Fund will not enter into Futures Contracts which are
S-9
prohibited under the CEA and will, to the extent required by regulatory authorities, enter only into Futures Contracts that are traded on national futures exchanges and are standardized as to maturity date and underlying financial instrument. The principal interest rate futures exchanges in the United States are the Chicago Board of Trade and the Chicago Mercantile Exchange. Futures exchanges and trading are regulated under the CEA by the CFTC.
An interest rate Futures Contract provides for the future sale by one party and purchase by another party of a specified amount of a specific financial instrument (e.g., a debt security) or currency for a specified price at a designated date, time and place. An index Futures Contract is an agreement pursuant to which the parties agree to take or make delivery of an amount of cash equal to the difference between the value of the index at the close of the last trading day of the contract and the price at which the index Futures Contract was originally written. Transaction costs are incurred when a Futures Contract is bought or sold and margin deposits must be maintained. A Futures Contract may be satisfied by delivery or purchase, as the case may be, of the instrument or by payment of the change in the cash value of the index. More commonly, Futures Contracts are closed out prior to delivery by entering into an offsetting transaction in a matching Futures Contract. Although the value of an index might be a function of the value of certain specified securities, no physical delivery of those securities is made. If the offsetting purchase price is less than the original sale price, a gain will be realized; if it is more, a loss will be realized. Conversely, if the offsetting sale price is more than the original purchase price, a gain will be realized; if it is less, a loss will be realized. The transaction costs must also be included in these calculations. There can be no assurance, however, that a Fund will be able to enter into an offsetting transaction with respect to a particular Futures Contract at a particular time. If a Fund is not able to enter into an offsetting transaction, the Fund will continue to be required to maintain the margin deposits on the Futures Contract.
Margin is the amount of funds that must be deposited by a Fund with its custodian in a segregated account in the name of the futures commission merchant in order to initiate futures trading and to maintain the Fund’s open positions in Futures Contracts. A margin deposit is intended to ensure a Fund’s performance of the Futures Contract. The margin required for a particular Futures Contract is set by the exchange on which the Futures Contract is traded and may be significantly modified from time to time by the exchange during the term of the Futures Contract. Futures Contracts are customarily purchased and sold on margins that may range upward from less than 5% of the value of the Futures Contract being traded.
If the price of an open Futures Contract changes (by increase in the case of a sale or by decrease in the case of a purchase) so that the loss on the Futures Contract reaches a point at which the margin on deposit does not satisfy margin requirements, the broker will require an increase in the margin. However, if the value of a position increases because of favorable price changes in the Futures Contract so that the margin deposit exceeds the required margin, the broker will pay the excess to the Fund. In computing daily net asset value, a Fund will mark to market the current value of its open Futures Contracts. The Funds expect to earn interest income on their margin deposits.
Because of the low margin deposits required, futures trading involves an extremely high degree of leverage. As a result, a relatively small price movement in a Futures Contract may result in immediate and substantial loss, as well as gain, to the investor. For example, if at the time of purchase, 10% of the value of the Futures Contract is deposited as margin, a subsequent 10% decrease in the value of the Futures Contract would result in a total loss of the margin deposit, before any deduction for the transaction costs, if the account were then closed out. A 15% decrease would result in a loss equal to 150% of the original margin deposit, if the Futures Contract were closed out. Thus, a purchase or sale of a Futures Contract may result in losses in excess of the amount initially invested in the Futures Contract. However, a Fund would presumably have sustained comparable losses if, instead of the Futures Contract, it had invested in the underlying financial instrument and sold it after the decline.
Most U.S. futures exchanges limit the amount of fluctuation permitted in Futures Contract prices during a single trading day. The day limit establishes the maximum amount that the price of a Futures Contract may vary either up or down from the previous day’s settlement price at the end of a trading session. Once the daily limit has been reached in a particular type of Futures Contract, no trades may be made on that day at a price beyond that limit. The daily limit governs only price movement during
S-10
a particular trading day and therefore does not limit potential losses, because the limit may prevent the liquidation of unfavorable positions. Futures Contract prices have occasionally moved to the daily limit for several consecutive trading days with little or no trading, thereby preventing prompt liquidation of Futures positions and subjecting some Futures traders to substantial losses.
There can be no assurance that a liquid market will exist at a time when a Fund seeks to close out a Futures position. The Fund would continue to be required to meet margin requirements until the position is closed, possibly resulting in a decline in the Fund’s net asset value. In addition, many of the contracts discussed above are relatively new instruments without a significant trading history. As a result, there can be no assurance that an active secondary market will develop or continue to exist.
A public market exists in Futures Contracts covering a number of indexes, including, but not limited to, the S&P 500® Index, the S&P 100 Index, the NASDAQ-100 Index, the Value Line Composite Index and the New York Stock Exchange Composite Index.
Options on Futures
Each Fund may also purchase or write put and call options on Futures Contracts and enter into closing transactions with respect to such options to terminate an existing position. A futures option gives the holder the right, in return for the premium paid, to assume a long position (call) or short position (put) in a Futures Contract at a specified exercise price prior to the expiration of the option. Upon exercise of a call option, the holder acquires a long position in the Futures Contract and the writer is assigned the opposite short position. In the case of a put option, the opposite is true. Prior to exercise or expiration, a futures option may be closed out by an offsetting purchase or sale of a futures option of the same series.
Each Fund may use options on Futures Contracts in connection with hedging strategies. Generally, these strategies would be applied under the same market and market sector conditions in which a Fund uses put and call options on securities or indexes. The purchase of put options on Futures Contracts is analogous to the purchase of puts on securities or indexes so as to hedge a Fund’s securities holdings against the risk of declining market prices. The writing of a call option or the purchasing of a put option on a Futures Contract constitutes a partial hedge against declining prices of the securities which are deliverable upon exercise of the Futures Contract. If the futures price at expiration of a written call option is below the exercise price, a Fund will retain the full amount of the option premium which provides a partial hedge against any decline that may have occurred in the Fund’s holdings of securities. If the futures price when the option is exercised is above the exercise price, however, a Fund will incur a loss, which may be offset, in whole or in part, by the increase in the value of the securities held by the Fund that were being hedged. Writing a put option or purchasing a call option on a Futures Contract serves as a partial hedge against an increase in the value of the securities a Fund intends to acquire.
As with investments in Futures Contracts, a Fund is required to deposit and maintain margin with respect to put and call options on Futures Contracts written by it. Such margin deposits will vary depending on the nature of the underlying Futures Contract (and the related initial margin requirements), the current market value of the option, and other futures positions held by the Fund. A Fund will set aside in a segregated account at the Fund’s custodian liquid assets, such as cash, U.S. government securities or other high grade liquid debt obligations equal in value to the amount due on the underlying obligation. Such segregated assets will be marked-to-market daily, and additional assets will be placed in the segregated account whenever the total value of the segregated account falls below the amount due on the underlying obligation.
The risks associated with the use of options on Futures Contracts include the risk that a Fund may close out its position as a writer of an option only if a liquid secondary market exists for such options, which cannot be assured. A Fund’s successful use of options on Futures Contracts depends on the portfolio managers’ ability to correctly predict the movement in prices of Futures Contracts and the underlying instruments, which may prove to be incorrect. In addition, there may be imperfect correlation between the instruments being hedged and the Futures Contract subject to the option.
For additional information, see “Futures Contracts.” Certain characteristics of the futures market might increase the risk that movements in the prices of Futures Contracts or options on Futures
S-11
Contracts might not correlate perfectly with movements in the prices of the investments being hedged. For example, all participants in the futures and options on Futures Contracts markets are subject to daily variation margin calls and might be compelled to liquidate futures or options on Futures Contracts positions whose prices are moving unfavorably to avoid being subject to further calls. These liquidations could increase the price volatility of the instruments and distort the normal price relationship between the futures or options and the investments being hedged. Also, because of initial margin deposit requirements in futures markets, there might be increased participation by speculators in the futures markets. This participation also might cause temporary price distortions. In addition, activities of large traders in both the futures and securities markets involving arbitrage, “program trading” and other investment strategies might result in temporary price distortions.
Swap Agreements
A swap is a financial instrument that typically involves the exchange of cash flows between two parties on specified dates (settlement dates), where the cash flows are based on agreed-upon prices, rates, indices, etc. The nominal amount on which the cash flows are calculated is called the notional amount. Swaps are individually negotiated and structured to include exposure to a variety of different types of investments or market factors, such as interest rates, non-U.S. currency rates, mortgage securities, corporate borrowing rates, security prices, indexes or inflation rates.
Swap agreements may increase or decrease the overall volatility of the investments of a Fund and its share price. The performance of swap agreements may be affected by a change in the specific interest rate, currency, or other factors that determine the amounts of payments due to and from a Fund. If a swap agreement calls for payments by a Fund, the Fund must be prepared to make such payments when due. In addition, if the counterparty’s creditworthiness declines, the value of a swap agreement would be likely to decline, potentially resulting in losses.
Generally, swap agreements have a fixed maturity date that will be agreed upon by the parties. The agreement can be terminated before the maturity date only under limited circumstances, such as default by one of the parties or insolvency, among others, and can be transferred by a party only with the prior written consent of the other party. A Fund may be able to eliminate its exposure under a swap agreement either by assignment or by other disposition, or by entering into an offsetting swap agreement with the same party or a similarly creditworthy party. If the counterparty is unable to meet its obligations under the contract, declares bankruptcy, defaults or becomes insolvent, a Fund may not be able to recover the money it expected to receive under the contract.
A swap agreement can be a form of leverage, which can magnify a Fund’s gains or losses. In order to reduce the risk associated with leveraging, a Fund may cover its current obligations under swap agreements according to guidelines established by the SEC. If a Fund enters into a swap agreement on a net basis, it will segregate assets with a daily value at least equal to the excess, if any, of a Fund’s accrued obligations under the swap agreement over the accrued amount the Fund is entitled to receive under the agreement. If a Fund enters into a swap agreement on other than a net basis, it will segregate assets with a value equal to the full amount of a Fund’s accrued obligations under the agreement.
Equity Swaps. In a typical equity swap, one party agrees to pay another party the return on a stock, stock index or basket of stocks in return for a specified interest rate. By entering into an equity index swap, for example, the index receiver can gain exposure to stocks making up the index of securities without actually purchasing those stocks. Equity index swaps involve not only the risk associated with investment in the securities represented in the index, but also the risk that the performance of such securities, including dividends, will not exceed the return on the interest rate that a Fund will be committed to pay.
Interest Rate Swaps. Interest rate swaps are financial instruments that involve the exchange of one type of interest rate for another type of interest rate cash flow on specified dates in the future. Some of the different types of interest rate swaps are “fixed-for floating rate swaps,” “termed basis swaps” and “index amortizing swaps.” Fixed-for floating rate swaps involve the exchange of fixed interest rate cash flows for floating rate cash flows. Termed basis swaps entail cash flows to both parties based on floating interest rates, where the interest rate indices are different. Index amortizing swaps are typically fixed-for floating swaps where the notional amount changes if certain conditions are met.
S-12
Like a traditional investment in a debt security, a Fund could lose money by investing in an interest rate swap if interest rates change adversely. For example, if a Fund enters into a swap where it agrees to exchange a floating rate of interest for a fixed rate of interest, the Fund may have to pay more money than it receives. Similarly, if a Fund enters into a swap where it agrees to exchange a fixed rate of interest for a floating rate of interest, the Fund may receive less money than it has agreed to pay.
Currency Swaps. A currency swap is an agreement between two parties in which one party agrees to make interest rate payments in one currency and the other promises to make interest rate payments in another currency. A Fund may enter into a currency swap when it has one currency and desires a different currency. Typically the interest rates that determine the currency swap payments are fixed, although occasionally one or both parties may pay a floating rate of interest. Unlike an interest rate swap, however, the principal amounts are exchanged at the beginning of the contract and returned at the end of the contract. Changes in non-U.S. exchange rates and changes in interest rates, as described above, may negatively affect currency swaps.
Credit Default Swaps. A credit default swap is similar to an insurance contract in that it provides the buyer with protection against specific risks. Most often, corporate bond investors buy credit default swaps for protection against a default by the issuer of the corporate bond, but these flexible instruments can be used in many ways to customize exposure to corporate credit. Credit default swap agreements can mitigate risks in bond investing by transferring a given risk from one party to another without transferring the underlying bond or other credit asset. In a credit default swap agreement, one party “sells” risk and the counterparty “buys” that risk. The “seller” of credit risk, who also tends to own the underlying credit asset, pays a periodic fee to the risk “buyer.” In return, the risk “buyer” agrees to pay the “seller” a set amount if there is a default, or a credit event.
A Fund’s use of credit default swap agreements exposes the Fund to additional risks, including but not limited to, the credit and liquidity risk of a counterparty. If the credit quality of any such counterparty deteriorates, such counterparty may default on its obligations to make payments under the swap agreement. A Fund may also be exposed to liquidity risk because the market for credit default swaps are relatively illiquid and the Fund will generally not be permitted to terminate or assign its credit default swaps without the consent of the related counterparty and accordingly may not be able to terminate or assign such credit default swaps in a timely fashion and for a fair price, potentially restricting its ability to take advantage of market opportunities.
Caps, Collars and Floors
Caps and floors have an effect similar to buying or writing options. In a typical cap or floor agreement, one party agrees to make payments only under specified circumstances, usually in return for payment of a fee by the other party. For example, the buyer of an interest rate cap obtains the right to receive payments to the extent that a specified interest rate exceeds an agreed-upon level. The seller of an interest rate floor is obligated to make payments to the extent that a specified interest rate falls below an agreed-upon level. An interest rate collar combines elements of buying a cap and selling a floor.
Risks and Special Considerations Concerning Derivatives
The use of derivative instruments involves certain general risks and considerations as described below. The specific risks pertaining to certain types of derivative instruments are described below:
(1) Market Risk. Market risk is the risk that the value of the underlying assets may go up or down. Adverse movements in the value of an underlying asset can expose the Fund to losses. Market risk is the primary risk associated with derivative transactions. Derivative instruments may include elements of leverage and, accordingly, fluctuations in the value of the derivative instrument in relation to the underlying asset may be magnified. The successful use of derivative instruments depends upon a variety of factors, particularly the portfolio managers’ ability to predict movements of the securities, currencies and commodities markets, which may require different skills than predicting changes in the prices of individual securities. There can be no assurance that any particular strategy adopted will succeed. A decision to engage in a derivative transaction will reflect the portfolio managers’ judgment that the derivative transaction will provide value to the applicable Fund and its shareholders and is consistent with the Fund’s
S-13
objective, investment limitations, and operating policies. In making such a judgment, the portfolio managers will analyze the benefits and risks of the derivative transactions and weigh them in the context of the Fund’s overall investments and investment objective.
(2) Credit Risk. Credit risk is the risk that a loss may be sustained as a result of the failure of a counterparty to comply with the terms of a derivative instrument. The counterparty risk for exchange-traded derivatives is generally less than for privately-negotiated or OTC derivatives, since generally a clearing agency, which is the issuer or counterparty to each exchange-traded instrument, provides a guarantee of performance. For privately-negotiated instruments, there is no similar clearing agency guarantee. In all transactions, a Fund will bear the risk that the counterparty will default, and this could result in a loss of the expected benefit of the derivative transactions and possibly other losses to the Fund. A Fund will enter into transactions in derivative instruments only with counterparties that their respective portfolio managers reasonably believe are capable of performing under the contract.
(3) Correlation Risk. Correlation risk is the risk that there might be an imperfect correlation, or even no correlation, between price movements of a derivative instrument and price movements of investments being hedged. When a derivative transaction is used to completely hedge another position, changes in the market value of the combined position (the derivative instrument plus the position being hedged) result from an imperfect correlation between the price movements of the two instruments. With a perfect hedge, the value of the combined position remains unchanged with any change in the price of the underlying asset. With an imperfect hedge, the value of the derivative instrument and its hedge are not perfectly correlated. For example, if the value of a derivative instrument used in a short hedge (such as writing a call option, buying a put option or selling a futures contract) increased by less than the decline in value of the hedged investments, the hedge would not be perfectly correlated. This might occur due to factors unrelated to the value of the investments being hedged, such as speculative or other pressures on the markets in which these instruments are traded. The effectiveness of hedges using instruments on indices will depend, in part, on the degree of correlation between price movements in the index and the price movements in the investments being hedged.
(4) Liquidity Risk. Liquidity risk is the risk that a derivative instrument cannot be sold, closed out or replaced quickly at or very close to its fundamental value. Generally, exchange contracts are very liquid because the exchange clearinghouse is the counterparty of every contract. OTC transactions are less liquid than exchange-traded derivatives since they often can only be closed out with the other party to the transaction. A Fund might be required by applicable regulatory requirements to maintain assets as “cover,” maintain segregated accounts, and/or make margin payments when it takes positions in derivative instruments involving obligations to third parties (i.e., instruments other than purchase options). If a Fund is unable to close out its positions in such instruments, it might be required to continue to maintain such assets or accounts or make such payments until the position expires, matures or is closed out. These requirements might impair a Fund’s ability to sell a security or make an investment at a time when it would otherwise be favorable to do so, or require that the Fund sell a portfolio security at a disadvantageous time. A Fund’s ability to sell or close out a position in an instrument prior to expiration or maturity depends upon the existence of a liquid secondary market or, in the absence of such a market, the ability and willingness of the counterparty to enter into a transaction closing out the position. Due to liquidity risk, there is no assurance that any derivatives position can be sold or closed out at a time and price that is favorable to a Fund.
(5) Legal Risk. Legal risk is the risk of loss caused by the unenforceability of a party’s obligations under the derivative. While a party seeking price certainty agrees to surrender the potential upside in exchange for downside protection, the party taking the risk is looking for a positive payoff. Despite this voluntary assumption of risk, a counterparty that has lost money in a derivative transaction may try to avoid payment by exploiting various legal uncertainties about certain derivative products.
(6) Systemic or “Interconnection” Risk. Systemic or interconnection risk is the risk that a disruption in the financial markets will cause difficulties for all market participants. In other words, a disruption in one market will spill over into other markets, perhaps creating a chain reaction.
S-14
Much of the OTC derivatives market takes place among the OTC dealers themselves, thus creating a large interconnected web of financial obligations. This interconnectedness raises the possibility that a default by one large dealer could create losses for other dealers and destabilize the entire market for OTC derivative instruments.
Equity Securities
Under normal market conditions, the Funds primarily invest in equity securities. Equity securities include common stocks, preferred securities, warrants to purchase common stocks or preferred stocks and other securities with equity characteristics, including participatory notes and pooled investment vehicles.
Common Stocks
Common stocks represent units of ownership in a company. Common stocks usually carry voting rights and earn dividends. Unlike preferred securities, dividends on common stocks are not fixed but are declared at the discretion of a company’s board.
Preferred Securities
Preferred securities are also units of ownership in a company. Preferred securities normally have preference over common stock in the payment of dividends and the liquidation of the company. However, in all other respects, preferred securities are subordinated to the liabilities of the issuer. Unlike common stocks, preferred securities are generally not entitled to vote on corporate matters. Types of preferred securities include adjustable-rate preferred securities, fixed dividend preferred securities, perpetual preferred securities and sinking fund preferred securities. Generally, the market value of preferred securities with a fixed dividend rate and no conversion element varies inversely with interest rates and perceived credit risk.
Warrants
The Funds may invest in warrants if, after giving effect thereto, not more than 5% of their net assets will be invested in warrants other than warrants acquired in units or attached to other securities. Investing in warrants is purely speculative in that they have no voting rights, pay no dividends, and have no rights with respect to the assets of the corporation issuing them. Warrants basically are options to purchase equity securities at a specific price for a specific period of time. They do not represent ownership of the securities but only the right to buy them. Warrants are issued by the issuer of the security, which may be purchased on their exercise. The prices of warrants do not necessarily parallel the prices of the underlying securities.
Over-the-Counter Market
The Funds may invest in over-the-counter securities. In contrast to the securities exchanges, the over-the-counter market is not a centralized facility that limits trading activity to securities of companies which initially satisfy certain defined standards. Generally, the volume of trading in an unlisted or over-the-counter security is less than the volume of trading in a listed security. This means that the depth of market liquidity of some securities in which the Funds invest may not be as great as that of other securities and, if the Funds were to dispose of such a security, they might have to offer the securities at a discount from recent prices, or sell the securities in small lots over an extended period of time.
Initial Public Offerings (“IPO”)
The Funds may invest a portion of their assets in securities of companies offering shares in IPOs. IPOs may have a magnified performance impact on the Funds with a small asset base. The impact of IPOs on the Funds’ performance likely will decrease as the Funds’ asset size increases, which could reduce each Fund’s total returns. IPOs may not be consistently available to a Fund for investing, particularly as the Fund’s asset base grows. Because IPO shares frequently are volatile in price, a Fund may hold IPO shares for a very short period of time. This may increase the turnover of a Fund and may lead to increased expenses for a Fund, such as commissions and transaction costs. By selling shares, a Fund may realize taxable gains it will subsequently distribute to shareholders. In addition, the market for IPO shares can be speculative and/or inactive for extended periods of time. The limited number of
S-15
shares available for trading in some IPOs may make it more difficult for a Fund to buy or sell significant amounts of shares without an unfavorable impact on prevailing prices. Shareholders in IPO shares can be affected by substantial dilution in the value of their shares, by sales of additional shares and by concentration of control in existing management and principal shareholders.
A Fund’s investment in IPO shares may include the securities of unseasoned companies (companies with less than three years of continuous operations), which presents risks considerably greater than common stocks of more established companies. These companies may have limited operating histories and their prospects for profitability may be uncertain. These companies may be involved in new and evolving businesses and may be vulnerable to competition and changes in technology, markets and economic conditions. They may be more dependent on key managers and third parties and may have limited product lines.
General Risks of Investing in Stocks
While investing in stocks allows shareholders to participate in the benefits of owning a company, such shareholders must accept the risks of ownership. Unlike bondholders, who have preference to a company’s earnings and cash flow, preferred stockholders, followed by common stockholders in order of priority, are entitled only to the residual amount after a company meets its other obligations. For this reason, the value of a company’s stock will usually react more strongly to actual or perceived changes in the company’s financial condition or prospects than its debt obligations. Stockholders of a company that fares poorly can lose money.
Stock markets tend to move in cycles with short or extended periods of rising and falling stock prices. The value of a company’s stock may fall because of:
| | • | | Factors that directly relate to that company, such as decisions made by its management or lower demand for the company’s products or services; |
| | • | | Factors affecting an entire industry, such as increases in production costs; and |
| | • | | Changes in financial market conditions that are relatively unrelated to the company or its industry, such as changes in interest rates, currency exchange rates or inflation rates. |
Because preferred securities are generally junior to debt securities and other obligations of the issuer, deterioration in the credit quality of the issuer will cause greater changes in the value of a preferred security than in a more senior debt security with similar stated yield characteristics.
The Funds may invest in securities of issuers with small or medium market capitalizations. Any investment in small and medium capitalization companies involves greater risk and price volatility than that customarily associated with investments in larger, more established companies. This increased risk may be due to the greater business risks of their small or medium size, limited markets and financial resources, narrow product lines and frequent lack of management depth. The securities of small and medium capitalization companies are often traded in the over-the-counter market, and might not be traded in volumes typical of securities traded on a national securities exchange. Thus, the securities of small and medium capitalization companies are likely to be less liquid and subject to more abrupt or erratic market movements than securities of larger, more established companies.
Non-U.S. Securities
Under normal market conditions, Nuveen Symphony International Equity Fund primarily invests in a variety of equity securities of companies organized or located outside the United States and doing a substantial amount of business outside the United States. Nuveen Symphony International Equity Fund considers a company that derives at least 50% of its revenue from business outside the United States or has at least 50% of its assets outside the United States as doing a substantial amount of business outside the United States. Nuveen Symphony International Equity Fund invests in non-U.S. equity securities, including direct investment in securities of non-U.S. companies traded overseas as well as American Depositary Receipts (“ADRs”) and other types of depositary receipts. Investments in securities of non-U.S. companies involve risks in addition to the usual risks inherent in domestic investments, including currency risk. The value of a non-U.S. security in U.S. dollars tends to decrease when the value of the U.S. dollar rises against the non-U.S. currency in which the security is denominated and tends to increase when the value of the U.S. dollar falls against such currency.
S-16
Non-U.S. securities are affected by the fact that in many countries there is less publicly available information about issuers than is available in the reports and ratings published about companies in the United States and companies may not be subject to uniform accounting, auditing and financial reporting standards. Other risks inherent in non-U.S. investments include expropriation; confiscatory taxation; withholding taxes on dividends and interest; less extensive regulation of non-U.S. brokers, securities markets and issuers; diplomatic developments; and political or social instability. Non-U.S. economies may differ favorably or unfavorably from the U.S. economy in various respects, and many non-U.S. securities are less liquid and their prices tend to be more volatile than comparable U.S. securities. From time to time, non-U.S. securities may be difficult to liquidate rapidly without adverse price effects.
Nuveen Symphony International Equity Fund may invest directly in non-U.S. securities that are denominated in non-U.S. currencies or in dollar-denominated securities of non-U.S. companies. Nuveen Symphony International Equity Fund may also invest in non-U.S. securities by purchasing depositary receipts, denominated in U.S. dollars, including ADRs, European Depositary Receipts (“EDRs”), Global Depositary Receipts (“GDRs”) or other securities representing indirect ownership interests in the securities of non-U.S. companies, including New York Shares. Generally, ADRs, in registered form, are denominated in U.S. dollars and are designated for use in the U.S. securities markets, while EDRs and GDRs are typically in bearer form and may be denominated in non-U.S. currencies and are designed for use in European and other markets. ADRs are receipts typically issued by a U.S. bank or trust company evidencing ownership of the underlying non-U.S. security. ADRs, EDRs and GDRs are deemed to have the same classification as the underlying securities they represent, except that ADRs, EDRs and GDRs shall be treated as indirect non-U.S. investments. Thus, an ADR, EDR or GDR representing ownership of common stock will be treated as common stock. ADRs, EDRs and GDRs do not eliminate all of the risks associated with directly investing in the securities of non-U.S. companies, such as changes in non-U.S. currency exchange rates. However, by investing in ADRs rather than directly in non-U.S. companies’ stock, Nuveen Symphony International Equity Fund avoids currency risks during the settlement period. Some ADRs may not be sponsored by the issuer.
Other types of depositary receipts include American Depositary Shares (“ADSs”), Global Depositary Certificates (“GDCs”) and International Depositary Receipts (“IDRs”). ADSs are shares issued under a deposit agreement representing the underlying ordinary shares that trade in the issuer’s home market. An ADR, described above, is a certificate that represents a number of ADSs. GDCs and IDRs are typically issued by a non-U.S. bank or trust company, although they may sometimes also be issued by a U.S. bank or trust company. GDCs and IDRs are depositary receipts that evidence ownership of underlying securities issued by either a non-U.S. or a U.S. corporation.
Depositary receipts may be available through “sponsored” or “unsponsored” facilities. A sponsored facility is established jointly by a depositary and the issuer of the security underlying the receipt. An unsponsored facility may be established by a depositary without participation by the issuer of the security underlying the receipt. There are greater risks associated with holding unsponsored depositary receipts. For example, if Nuveen Symphony International Equity Fund holds an unsponsored depositary receipt, it will generally bear all of the costs of establishing the unsponsored facility. In addition, the depositary of an unsponsored facility frequently is under no obligation to distribute shareholder communications received from the issuer of the deposited security. Whether a sponsored or unsponsored facility, there is no assurance that either would pass through to the holders of the receipts voting rights with respect to the deposited securities.
In considering whether to invest in the securities of a non-U.S. company, the portfolio managers consider such factors as the characteristics of the particular company, differences between economic trends, and the performance of securities markets within the United States and those within other countries. The portfolio managers also consider factors relating to the general economic, governmental and social conditions of the country or countries where the company is located.
Securities transactions conducted outside the United States may not be regulated as rigorously as in the United States, may not involve a clearing mechanism and related guarantees, and are subject to the risk of governmental actions affecting trading in, or the prices of, non-U.S. securities, currencies and other instruments. The value of such positions also could be adversely affected by (i) other
S-17
complex non-U.S. political, legal and economic factors, (ii) lesser availability than in the United States of data on which to make trading decisions, (iii) delays in a Fund’s ability to act upon economic events occurring in non-U.S. markets during non-business hours in the United States, (iv) the imposition of different exercise and settlement terms and procedures and the margin requirements than in the United States, (v) currency exchange rate changes, and (vi) lower trading volume and liquidity.
Currency Risk
By investing in non-U.S. securities, Nuveen Symphony International Equity Fund will be subject to currency risk, which is the risk that an increase in the U.S. dollar relative to the non-U.S. currency will reduce returns or portfolio value. Generally, when the U.S. dollar rises in value relative to a non-U.S. currency, Nuveen Symphony International Equity Fund’s investment in securities denominated in that currency will lose value because its currency is worth fewer U.S. dollars. On the other hand, when the value of the U.S. dollar falls relative to a non-U.S. currency, Nuveen Symphony International Equity Fund’s investments denominated in that currency will tend to increase in value because that currency is worth more U.S. dollars. The exchange rates between the U.S. dollar and non-U.S. currencies depend upon such factors as supply and demand in the currency exchange markets, international balance of payments, governmental intervention, speculation and other economic and political conditions. Although Nuveen Symphony International Equity Fund values its assets daily in U.S. dollars, it may not convert its holdings of non-U.S. currencies to U.S. dollars on a daily basis. Nuveen Symphony International Equity Fund may incur conversion costs when it converts its holdings to another currency. Non-U.S. exchange dealers may realize a profit on the difference between the price at which Nuveen Symphony International Equity Fund buys and sells currencies. Nuveen Symphony International Equity Fund may engage in non-U.S. currency exchange transactions in connection with its portfolio investments. Nuveen Symphony International Equity Fund conducts its non-U.S. currency exchange transactions either on a spot (i.e., cash) basis at the spot rate prevailing in the non-U.S. currency exchange market or through forward contracts to purchase or sell non-U.S. contracts. Nuveen Symphony International Equity Fund may also be subject to currency risk through investments in ADRs and other non-U.S. securities denominated in U.S. dollars.
Other Investment Policies and Techniques
When-Issued or Delayed-Delivery Transactions
Each Fund may from time to time purchase securities on a “when-issued” or other delayed-delivery basis. The price of securities purchased on a when-issued basis is fixed at the time the commitment to purchase is made, but delivery and payment for the securities take place at a later date. Normally, the settlement date occurs within 45 days of the purchase. During the period between the purchase and settlement, no payment is made by a Fund to the issuer and no interest is accrued on debt securities or dividend income is earned on equity securities. Forward commitments involve a risk of loss if the value of the security to be purchased declines prior to the settlement date. This risk is in addition to the risk of decline in value of a Fund’s other assets. While when-issued securities may be sold prior to the settlement date, the Funds intend to purchase such securities with the purpose of actually acquiring them. At the time a Fund makes the commitment to purchase a security on a when-issued basis, it will record the transaction and reflect the value of the security in determining its net asset value. The Funds do not believe that net asset value will be adversely affected by purchases of securities on a when-issued basis.
Each Fund will maintain in a segregated account cash, U.S. government securities and high grade liquid debt securities equal in value to commitments for when-issued securities. Such segregated securities will either mature or, if necessary, be sold on or before the settlement date. When the time comes to pay for when-issued securities, each Fund will meet its obligations from then-available cash flow, sale of the securities held in the segregated account (described above), sale of other securities or, although it would not normally expect to do so, from the sale of the when-issued securities themselves (which may have a market value greater or less than the Fund’s payment obligation).
Illiquid Securities
Each Fund may invest in illiquid securities (i.e., securities that are not readily marketable). For purposes of this restriction, illiquid securities include, but are not limited to, restricted securities
S-18
(securities the disposition of which is restricted under the federal securities laws), and repurchase agreements with maturities in excess of seven days. However, no Fund will acquire illiquid securities if, as a result, such securities would comprise more than 15% of the value of the Fund’s net assets. The Board of Trustees or its delegate has the ultimate authority to determine, to the extent permissible under the federal securities laws, which securities are liquid or illiquid for purposes of this 15% limitation. The Board of Trustees has delegated to the Adviser the day-to-day determination of the illiquidity of any portfolio security, although it has retained oversight over and ultimate responsibility for such determinations. The Adviser works with and to a large extent relies on the expertise and advice of the sub-adviser in making these liquidity determinations. Although no definitive liquidity criteria are used, the Board of Trustees has directed the Adviser to look to such factors as (i) the nature of the market for a security (including the institutional private resale market; the frequency of trades and quotes for the security; the number of dealers willing to purchase or sell the security; and the amount of time normally needed to dispose of the security, the method of soliciting offers and the mechanics of transfer), (ii) the terms of certain securities or other instruments allowing for the disposition to a third party or the issuer thereof (e.g., certain repurchase obligations and demand instruments), and (iii) other permissible relevant facts.
Restricted securities may be sold only in privately negotiated transactions or in a public offering with respect to which a registration statement is in effect under the Securities Act of 1933, as amended. Where registration is required, a Fund may be obligated to pay all or part of the registration expenses and a considerable period may elapse between the time of the decision to sell and the time the Fund may be permitted to sell a security under an effective registration statement. If, during such a period, adverse market conditions were to develop, a Fund might obtain a less favorable price than that which prevailed when it decided to sell. Illiquid securities will be priced at fair value as determined in good faith by the Board of Trustees or its delegate. If, through the appreciation of illiquid securities or the depreciation of liquid securities, a Fund should be in a position where more than 15% of the value of its net assets are invested in illiquid securities, including restricted securities which are not readily marketable, the Fund will take such steps as is deemed advisable, if any, to protect liquidity.
Short Sales Against the Box
When a Fund’s portfolio managers believe that the price of a particular security held by a Fund may decline, it may make “short sales against the box” to hedge the unrealized gain on such security. Selling short against the box involves selling a security which a Fund owns for delivery at a specified date in the future. The Funds will limit their transactions in short sales against the box to 5% of their net assets. If, for example, a Fund bought 100 shares of ABC at $40 per share in January and the price appreciates to $50 in March, the Fund might “sell short” the 100 shares at $50 for delivery the following July. Thereafter, if the price of the stock declines to $45, it will realize the full $1,000 gain rather than the $500 gain it would have received had it sold the stock in the market. On the other hand, if the price appreciates to $55 per share, the Fund would be required to sell at $50 and thus receive a $1,000 gain rather than the $1,500 gain it would have received had it sold the stock in the market. A Fund may also be required to pay a premium for short sales which would partially offset any gain.
Investment Companies
Each Fund may invest in other investment companies, including open-end funds, closed-end funds, unit investment trusts, and exchange-traded funds (“ETFs”) regulated under the 1940 Act (“1940 Act ETFs”). Under the 1940 Act, a Fund’s investment in such securities, subject to certain exceptions, currently is limited to 3% of the total voting stock of any one investment company; 5% of such Fund’s total assets with respect to any one investment company; and 10% of such Fund’s total assets in the aggregate. Many 1940 Act ETFs, however, have obtained exemptive relief from the SEC to permit unaffiliated funds to invest in their shares beyond these statutory limits, subject to certain conditions and pursuant to contractual arrangements between the ETFs and the investing funds. The Funds may rely on these exemptive orders in investing in 1940 Act ETFs. A Fund’s investments in other investment companies may include money market mutual funds. Investments in money market funds are not subject to the percentage limitations set forth above.
S-19
ETFs in which the Funds may invest are a type of index fund bought and sold on a securities exchange. An ETF trades like common stock and represents a portfolio of securities designed to track a particular market index. ETFs can give exposure to all or a portion of the U.S. market, a foreign market, a region, a commodity, a currency, or to any other index that an ETF tracks. The risks of owning an ETF generally reflect the risks of owning the underlying securities they are designed to track, although lack of liquidity in an ETF could result in it being more volatile and ETFs have management fees that increase their costs. An ETF may fail to accurately track the returns of the market segment or index that it is designed to track, and the price of an ETF’s shares may fluctuate. In addition, because they, unlike traditional mutual funds, are traded on an exchange, ETFs are subject to the following risks: (i) the performance of the ETF may not replicate the performance of the underlying index that it is designed to track; (ii) the market price of the ETF’s shares may trade at a premium or discount to the ETF’s net asset value; (iii) an active trading market for an ETF may not develop or be maintained; and (iv) there is no assurance that the requirements of the exchange necessary to maintain the listing of the ETF will continue to be met or remain unchanged. In the event substantial market or other disruptions affecting ETFs should occur in the future, the liquidity and value of a Fund’s shares could also be substantially and adversely affected.
S-20
MANAGEMENT
The management of the Trust, including general supervision of the duties performed for the Funds by the Adviser under the Investment Management Agreement, is the responsibility of the Board of Trustees. The number of trustees of the Trust is ten, one of whom is an “interested person” (as the term “interested person” is defined in the 1940 Act) and nine of whom are not interested persons (referred to herein as “independent trustees”). None of the independent trustees has ever been a trustee, director or employee of, or consultant to, the Adviser or its affiliates. The names, business addresses and birthdates of the trustees and officers of the Funds, their principal occupations and other affiliations during the past five years, the number of portfolios each oversees and other directorships they hold are set forth below. The trustees of the Trust are directors or trustees, as the case may be, of 100 Nuveen-sponsored open-end funds (the “Nuveen Mutual Funds”) and 115 Nuveen-sponsored closed-end funds (collectively with the Nuveen Mutual Funds, the “Nuveen Funds”).
| | | | | | | | | | |
Name, Business Address
and Birthdate | | Position(s)
Held with
Trust | | Term of Office
and Length of
Time Served
with Trust | | Principal Occupation(s)
During Past Five Years | | Number of
Portfolios
in Fund
Complex
Overseen by
Trustee | | Other
Directorships
Held by
Trustee
During Past
Five Years |
| | |
Independent Trustees: | | | | |
| | | | | |
Robert P. Bremner 333 West Wacker Drive Chicago, IL 60606 (8/22/40) | | Chairman of the Board and Trustee | | Term—Indefinite* Length of
Service— Since 2003 | | Private Investor and Management Consultant; Treasurer and Director, Humanities Council of Washington, D.C.; Board Member, Independent Directors Council affiliated with the Investment Company Institute. | | 215 | | None |
| | | | | |
Jack B. Evans 333 West Wacker Drive Chicago, IL 60606 (10/22/48) | | Trustee | | Term—Indefinite* Length of Service— Since 2003 | | President, The Hall-Perrine Foundation, a private philanthropic corporation (since 1996); Member, Board of Regents for the State of Iowa University System; Director, Source Media Group; Life Trustee of Coe College and the Iowa College Foundation; formerly, Director, Federal Reserve Bank of Chicago; formerly, President and Chief Operating Officer, SCI Financial Group, Inc., a regional financial services firm. | | 215 | | Director and Chairman, United Fire Group, a publicly held company; formerly, Director, Alliant Energy. |
S-21
| | | | | | | | | | |
Name, Business Address
and Birthdate | | Position(s)
Held with
Trust | | Term of Office
and Length of
Time Served
with Trust | | Principal Occupation(s)
During Past Five Years | | Number of
Portfolios
in Fund
Complex
Overseen by
Trustee | | Other
Directorships
Held by
Trustee
During Past
Five Years |
| | | | | |
William C. Hunter 333 West Wacker Drive Chicago, IL 60606 (3/6/48) | | Trustee | | Term—Indefinite* Length of Service—Since 2004 | | Dean Emeritus (since June 30, 2012), formerly, Dean (2006-2012), Tippie College of Business, University of Iowa; Director (since 2005) and President (since July 2012), Beta Gamma Sigma, Inc., The International Honor Society; Director of Wellmark, Inc. (since 2009); formerly, Director (1997-2007), Credit Research Center at Georgetown University; formerly, Dean and Distinguished Professor of Finance, School of Business at the University of Connecticut (2003-2006); previously, Senior Vice President and Director of Research at the Federal Reserve Bank of Chicago (1995-2003). | | 215 | | Director (since 2004) of Xerox Corporation. |
| | | | | |
David J. Kundert 333 West Wacker Drive Chicago, IL 60606 (10/28/42) | | Trustee | | Term—Indefinite* Length of
Service—Since 2005 | | Director, Northwestern Mutual Wealth Management Company; retired (since 2004) as Chairman, JPMorgan Fleming Asset Management, President and CEO, Banc One Investment Advisors Corporation, and President, One Group Mutual Funds; prior thereto, Executive Vice President, Bank One Corporation and Chairman and CEO, Banc One Investment Management Group; Member, Board of Regents, Luther College; Member of the Wisconsin Bar Association; Member of Board of Directors, Friends of Boerner Botanical Gardens; Member of Board of Directors and Chair of Investment Committee, Greater Milwaukee Foundation. | | 215 | | None |
S-22
| | | | | | | | | | |
Name, Business Address
and Birthdate | | Position(s)
Held with
Trust | | Term of Office
and Length of
Time Served with
Trust | | Principal Occupation(s)
During Past Five Years | | Number of
Portfolios
in Fund
Complex
Overseen by
Trustee | | Other
Directorships
Held by
Trustee
During Past
Five Years |
| | | | | |
William J. Schneider 333 West Wacker Drive Chicago, IL 60606 (9/24/44) | | Trustee | | Term—Indefinite* Length of
Service—Since 2003 | | Chairman of Miller-Valentine Partners Ltd., a real estate investment company; Member, Mid-America Health System Board; Member, University of Dayton Business School Advisory Council; formerly, Senior Partner and Chief Operating Officer (retired, 2004) of Miller-Valentine Group; formerly, Member, Dayton Philharmonic Orchestra Association; formerly, Director, Dayton Development Coalition; formerly, Member, Business Advisory Council, Cleveland Federal Reserve Bank. | | 215 | | None |
| | | | | |
Judith M. Stockdale 333 West Wacker Drive Chicago, IL 60606 (12/29/47) | | Trustee | | Term—Indefinite* Length of
Service—Since 2003 | | Formerly, Executive Director (1994-2012), Gaylord and Dorothy Donnelley Foundation; prior thereto, Executive Director, Great Lakes Protection Fund (1990-1994). | | 215 | | None |
| | | | | |
Carole E. Stone 333 West Wacker Drive Chicago, IL 60606 (6/28/47) | | Trustee | | Term—Indefinite* Length of
Service—Since 2007 | | Director, C2 Options Exchange, Incorporated (since 2009); formerly, Commissioner, New York State Commission on Public Authority Reform (2005-2010); formerly, Chair, New York Racing Association Oversight Board (2005-2007). | | 215 | | Director, Chicago Board Options Exchange (since 2006). |
| | | | | |
Virginia L. Stringer 333 West Wacker Drive Chicago, IL 60606 (8/16/44) | | Trustee | | Term—Indefinite* Length of
Service—Since 2011 | | Board Member, Mutual Fund Directors Forum; former Member, Governing Board, Investment Company Institute’s Independent Directors Council; Governance consultant and non-profit board member; former Owner and President, Strategic Management Resources, Inc., a management consulting firm; previously, held several executive positions in general management, marketing and human resources at IBM and The Pillsbury Company. | | 215 | | Previously, Independent Director (1987-2010) and Chair (1997-2010), First American Fund Complex. |
S-23
| | | | | | | | | | |
Name, Business Address
and Birthdate | | Position(s)
Held with
Trust | | Term of Office
and Length of
Time Served with
Trust | | Principal Occupation(s)
During Past Five Years | | Number of
Portfolios
in Fund
Complex
Overseen by
Trustee | | Other
Directorships
Held by
Trustee
During Past
Five Years |
| | | | | |
Terence J. Toth 333 West Wacker Drive Chicago, IL 60606 (9/29/59) | | Trustee | | Term—Indefinite* Length of Service—
Since 2008 | | Director, Legal & General Investment Management America, Inc. (since 2008); Managing Partner, Promus Capital (since 2008); formerly, CEO and President, Northern Trust Global Investments (2004-2007); Executive Vice President, Quantitative Management & Securities Lending (2000-2004); prior thereto, various positions with Northern Trust Company (since 1994); Member, Chicago Fellowship Board (since 2005), Catalyst Schools of Chicago Board (since 2008) and Mather Foundation Board (since 2012) and a member of its investment committee; formerly, Member, Northern Trust Mutual Funds Board (2005-2007), Northern Trust Global Investments Board (2004-2007), Northern Trust Japan Board (2004-2007), Northern Trust Securities Inc. Board (2003-2007) and Northern Trust Hong Kong Board (1997-2004). | | 215 | | None |
| | | |
Interested Trustee: | | | | | | |
| | | | | |
John P. Amboian** 333 West Wacker Drive Chicago, IL 60606
(6/14/61) | | Trustee | | Term—Indefinite* Length of Service—
Since 2008 | | Chief Executive Officer and Chairman (since 2007) and Director (since 1999) of Nuveen Investments, Inc.; formerly, President (1999-2007); Chief Executive Officer (since 2007) of Nuveen Investments Advisers Inc.; Director (since 1998), formerly, Chief Executive Officer (2007-2010) of Nuveen Fund Advisors, LLC. | | 215 | | None |
| * | | Each trustee serves an indefinite term until his or her successor is elected. |
| ** | | Mr. Amboian is an “interested person” of the Trust, as defined in the 1940 Act, by reason of his positions with Nuveen Investments, Inc. (“Nuveen Investments”) and certain of its subsidiaries. |
S-24
| | | | | | | | |
Name, Business Address
and Birthdate | | Position(s) Held
with Trust | | Term of
Office and
Length of
Time Served
with Trust | | Principal Occupation(s)
During Past Five Years | | Number of
Portfolios
in Fund
Complex
Overseen by
Officer |
| | | | |
Officers of the Trust: | | | | | | | | |
| | | | |
Gifford R. Zimmerman
333 West Wacker Drive
Chicago, IL 60606
(9/9/56) | | Chief Administrative Officer | | Term—Until August 2013 Length of Service—
Since
Inception | | Managing Director (since 2002) and Assistant Secretary of Nuveen Securities, LLC; Managing Director (since 2002), Assistant Secretary (since 1997) and Co-General Counsel (since 2011) of Nuveen Fund Advisors, LLC; Managing Director, Assistant Secretary and Associate General Counsel of Nuveen Asset Management, LLC (since 2011); Managing Director (since 2004) and Assistant Secretary (since 1994) of Nuveen Investments, Inc.; Vice President and Assistant Secretary of NWQ Investment Management Company, LLC (since 2002); Vice President and Assistant Secretary of Nuveen Investments Advisers Inc. (since 2002); Managing Director, Associate General Counsel and Assistant Secretary of Symphony Asset Management LLC (since 2003); Vice President and Assistant Secretary of Santa Barbara Asset Management, LLC (since 2006) and Winslow Capital Management, LLC (since 2010); Chief Administrative Officer and Chief Compliance Officer (since 2006) of Nuveen Commodities Asset Management, LLC; Chartered Financial Analyst. | | 215 |
| | | | |
Margo L. Cook 333 West Wacker Drive Chicago, IL 60606 (4/11/64) | | Vice President | | Term—Until August 2013 Length of Service—Since 2009 | | Executive Vice President (since 2008) of Nuveen Investments, Inc. and Nuveen Fund Advisors, LLC (since 2011); Managing Director—Investment Services of Nuveen Commodities Asset Management, LLC (since August 2011); previously, Head of Institutional Asset Management (2007-2008) of Bear Stearns Asset Management; Head of Institutional Asset Management (1986-2007) of Bank of NY Mellon; Chartered Financial Analyst. | | 215 |
| | | | |
Lorna C. Ferguson 333 West Wacker Drive Chicago, IL 60606
(10/24/45) | | Vice President | | Term—Until August 2013 Length of Service—
Since 1998 | | Managing Director (since 2004) of Nuveen Securities, LLC; Managing Director (since 2005) of Nuveen Fund Advisors, LLC. | | 215 |
| | | | |
Stephen D. Foy 333 West Wacker Drive Chicago, IL 60606 (5/31/54) | | Vice President and Controller | | Term—Until August 2013 Length of Service—
Since 1998 | | Senior Vice President (since 2010), formerly, Vice President (2004-2010) and Funds Controller of Nuveen Securities, LLC; Vice President of Nuveen Fund Advisors, LLC (since 2005); Chief Financial Officer (since 2010) of Nuveen Commodities Asset Management, LLC; Certified Public Accountant. | | 215 |
S-25
| | | | | | | | |
Name, Business Address
and Birthdate | | Position(s) Held
with Trust | | Term of
Office and
Length of
Time Served
with Trust | | Principal Occupation(s)
During Past Five Years | | Number of
Portfolios
in Fund
Complex
Overseen by
Officer |
| | | | |
Scott S. Grace 333 West Wacker Drive Chicago, IL 60606 (8/20/70) | | Vice President and Treasurer | | Term—Until August 2013 Length of Service—Since 2009 | | Managing Director, Corporate Finance & Development, Treasurer (since 2009) of Nuveen Securities, LLC; Managing Director and Treasurer (since 2009) of Nuveen Investments Advisers Inc., Nuveen Investments Holdings, Inc., Nuveen Fund Advisors, LLC and (since 2011) Nuveen Asset Management, LLC; Vice President and Treasurer of NWQ Investment Management Company, LLC, Tradewinds Global Investors, LLC, Symphony Asset Management LLC and Winslow Capital Management, LLC; Vice President of Santa Barbara Asset Management, LLC; formerly, Treasurer (2006-2009), Senior Vice President (2008-2009), previously, Vice President (2006-2008) of Janus Capital Group, Inc.; formerly, Senior Associate in Morgan Stanley’s Global Financial Services Group (2000-2003); Chartered Accountant. | | 215 |
| | | | |
Walter M. Kelly 333 West Wacker Drive Chicago, IL 60606 (2/24/70) | | Vice President and Chief Compliance Officer | | Term—Until August 2013 Length of Service—
Since 2003 | | Senior Vice President (since 2008) and Assistant Secretary (since 2003) of Nuveen Fund Advisors, LLC; Senior Vice President (since 2008) of Nuveen Investments Holdings, Inc.; formerly, Senior Vice President (2008-2011) of Nuveen Securities, LLC. | | 215 |
| | | | |
Tina M. Lazar 333 West Wacker Drive Chicago, IL 60606 (8/27/61) | | Vice President | | Term—Until August 2013 Length of Service—
Since 2002 | | Senior Vice President (since 2010), formerly, Vice President (2005-2010) of Nuveen Fund Advisors, LLC. | | 215 |
| | | | |
Kevin J. McCarthy 333 West Wacker Drive Chicago, IL 60606 (3/26/66) | | Vice President and Secretary | | Term—Until August 2013 Length of Service—Since 2007 | | Managing Director and Assistant Secretary (since 2008), formerly, Vice President (2007-2008) of Nuveen Securities, LLC; Managing Director (since 2008), Vice President and Assistant Secretary (since 2007) and Co-General Counsel (since 2011) of Nuveen Fund Advisors, LLC; Managing Director, Assistant Secretary and Associate General Counsel (since 2011) of Nuveen Asset Management, LLC; Vice President and Assistant Secretary of Nuveen Investments Advisers Inc., NWQ Investment Management Company, LLC, NWQ Holdings, LLC, Symphony Asset Management LLC, Santa Barbara Asset Management, LLC and Winslow Capital Management, LLC (since 2010); Vice President and Secretary (since 2010) of Nuveen Commodities Asset Management, LLC; prior thereto, Partner, Bell, Boyd & Lloyd LLP (1997-2007). | | 215 |
S-26
| | | | | | | | |
Name, Business Address
and Birthdate | | Position(s) Held
with Trust | | Term of
Office and
Length of
Time Served
with Trust | | Principal Occupation(s)
During Past Five Years | | Number of
Portfolios
in Fund
Complex
Overseen by
Officer |
| | | | |
Kathleen L. Prudhomme 901 Marquette Avenue Minneapolis, MN 55402 (3/30/53) | | Vice President and Assistant Secretary | | Term—Until August 2013 Length of Service— Since 2011 | | Managing Director and Assistant Secretary of Nuveen Securities, LLC (since 2011); Managing Director, Assistant Secretary and Co-General Counsel (since 2011) of Nuveen Fund Advisors, LLC; Managing Director, Assistant Secretary and Associate General Counsel (since 2011) of Nuveen Asset Management, LLC; formerly, Deputy General Counsel, FAF Advisors, Inc. (2004-2010). | | 215 |
| | | | |
Jeffery M. Wilson 333 West Wacker Drive Chicago, IL 60606 (3/13/56) | | Vice President | | Term—Until August 2013 Length of Service— Since 2011 | | Senior Vice President of Nuveen Securities, LLC (since 2011); formerly, Senior Vice President of FAF Advisors, Inc. (2000-2010). | | 100 |
S-27
Board Leadership Structure and Risk Oversight
The Board of Directors or the Board of Trustees (as the case may be, each is referred to hereafter as the “Board” or “Board of Trustees” and the directors or trustees of the Nuveen Funds, as applicable, are each referred to herein as “trustees”) oversees the operations and management of the Nuveen Funds, including the duties performed for the Nuveen Funds by the Adviser. The Board has adopted a unitary board structure. A unitary board consists of one group of directors who serve on the board of every fund in the Nuveen Fund complex. In adopting a unitary board structure, the trustees seek to provide effective governance through establishing a board, the overall composition of which will, as a body, possess the appropriate skills, independence and experience to oversee the Nuveen Funds’ business. With this overall framework in mind, when the Board, through its Nominating and Governance Committee discussed below, seeks nominees for the Board, the trustees consider, not only the candidate’s particular background, skills and experience, among other things, but also whether such background, skills and experience enhance the Board’s diversity and at the same time complement the Board given its current composition and the mix of skills and experiences of the incumbent trustees. The Nominating and Governance Committee believes that the Board generally benefits from diversity of background, experience and views among its members, and considers this a factor in evaluating the composition of the Board, but has not adopted any specific policy on diversity or any particular definition of diversity.
The Board believes the unitary board structure enhances good and effective governance, particularly given the nature of the structure of the investment company complex. Funds in the same complex generally are served by the same service providers and personnel and are governed by the same regulatory scheme which raises common issues that must be addressed by the directors across the fund complex (such as compliance, valuation, liquidity, brokerage, trade allocation or risk management). The Board believes it is more efficient to have a single board review and oversee common policies and procedures which increases the Board’s knowledge and expertise with respect to the many aspects of fund operations that are complex-wide in nature. The unitary structure also enhances the Board’s influence and oversight over the investment adviser and other service providers.
In an effort to enhance the independence of the Board, the Board also has a Chairman that is an independent trustee. The Board recognizes that a chairman can perform an important role in setting the agenda for the Board, establishing the boardroom culture, establishing a point person on behalf of the Board for fund management, and reinforcing the Board’s focus on the long-term interests of shareholders. The Board recognizes that a chairman may be able to better perform these functions without any conflicts of interests arising from a position with fund management. Accordingly, the trustees have elected Robert P. Bremner to serve as the independent Chairman of the Board through June 30, 2013 and William J. Schneider to serve as the independent Chairman of the Board effective July 1, 2013. Specific responsibilities of the Chairman include: (i) presiding at all meetings of the Board and of the shareholders; (ii) seeing that all orders and resolutions of the trustees are carried into effect; and (iii) maintaining records of and, whenever necessary, certifying all proceedings of the trustees and the shareholders.
Although the Board has direct responsibility over various matters (such as advisory contracts, underwriting contracts and fund performance), the Board also exercises certain of its oversight responsibilities through several committees that it has established and which report back to the full Board. The Board believes that a committee structure is an effective means to permit trustees to focus on particular operations or issues affecting the Nuveen Funds, including risk oversight. More specifically, with respect to risk oversight, the Board has delegated matters relating to valuation and compliance to certain committees (as summarized below) as well as certain aspects of investment risk. In addition, the Board believes that the periodic rotation of trustees among the different committees allows the trustees to gain additional and different perspectives of a Nuveen Fund’s operations. The Board has established six standing committees: the Executive Committee, the Dividend Committee, the Audit Committee, the Compliance, Risk Management and Regulatory Oversight Committee, the Nominating and Governance Committee and the Open-End Funds Committee. The Board may also from time to time create ad hoc committees to focus on particular issues as the need arises. The membership and functions of the standing committees are summarized below.
S-28
The Executive Committee, which meets between regular meetings of the Board, is authorized to exercise all of the powers of the Board. The members of the Executive Committee are Robert P. Bremner, Chair, Judith M. Stockdale and John P. Amboian. During the fiscal year ended September 30, 2012, the Executive Committee did not meet.
The Audit Committee assists the Board in the oversight and monitoring of the accounting and reporting policies, processes and practices of the Nuveen Funds, and the audits of the financial statements of the Nuveen Funds; the quality and integrity of the financial statements of the Nuveen Funds; the Nuveen Funds’ compliance with legal and regulatory requirements relating to the Nuveen Funds’ financial statements; the independent auditors’ qualifications, performance and independence; and the pricing procedures of the Nuveen Funds and the Adviser’s internal valuation group. It is the responsibility of the Audit Committee to select, evaluate and replace any independent auditors (subject only to Board and, if applicable, shareholder ratification) and to determine their compensation. The Audit Committee is also responsible for, among other things, overseeing the valuation of securities comprising the Nuveen Funds’ portfolios. Subject to the Board’s general supervision of such actions, the Audit Committee addresses any valuation issues, oversees the Nuveen Funds’ pricing procedures and actions taken by the Adviser’s internal valuation group which provides regular reports to the committee, reviews any issues relating to the valuation of the Nuveen Funds’ securities brought to its attention and considers the risks to the Nuveen Funds in assessing the possible resolutions to these matters. The Audit Committee may also consider any financial risk exposures for the Nuveen Funds in conjunction with performing its functions.
To fulfill its oversight duties, the Audit Committee receives annual and semi-annual reports and has regular meetings with the external auditors for the Nuveen Funds and the Adviser’s internal audit group. The Audit Committee also may review in a general manner the processes the Board or other Board committees have in place with respect to risk assessment and risk management as well as compliance with legal and regulatory matters relating to the Nuveen Funds’ financial statements. The committee operates under a written charter adopted and approved by the Board. Members of the Audit Committee shall be independent (as set forth in the charter) and free of any relationship that, in the opinion of the trustees, would interfere with their exercise of independent judgment as an Audit Committee member. The members of the Audit Committee are Robert P. Bremner, David J. Kundert, Chair, William J. Schneider, Carole E. Stone and Terence J. Toth, each of whom is an independent trustee of the Nuveen Funds. During the fiscal year ended September 30, 2012, the Audit Committee met four times.
The Nominating and Governance Committee is responsible for seeking, identifying and recommending to the Board qualified candidates for election or appointment to the Board. In addition, the Nominating and Governance Committee oversees matters of corporate governance, including the evaluation of Board performance and processes, the assignment and rotation of committee members, and the establishment of corporate governance guidelines and procedures, to the extent necessary or desirable, and matters related thereto. Although the unitary and committee structure has been developed over the years and the Nominating and Governance Committee believes the structure has provided efficient and effective governance, the committee recognizes that as demands on the Board evolve over time (such as through an increase in the number of funds overseen or an increase in the complexity of the issues raised), the committee must continue to evaluate the Board and committee structures and their processes and modify the foregoing as may be necessary or appropriate to continue to provide effective governance. Accordingly, the Nominating and Governance Committee has a separate meeting each year to, among other things, review the Board and committee structures, their performance and functions, and recommend any modifications thereto or alternative structures or processes that would enhance the Board’s governance of the Nuveen Funds.
In addition, the Nominating and Governance Committee, among other things, makes recommendations concerning the continuing education of trustees; monitors performance of legal counsel and other service providers; establishes and monitors a process by which security holders are able to communicate in writing with members of the Board; and periodically reviews and makes recommendations about any appropriate changes to trustee compensation. In the event of a vacancy on the Board, the Nominating and Governance Committee receives suggestions from various sources,
S-29
including shareholders, as to suitable candidates. Suggestions should be sent in writing to Lorna Ferguson, Manager of Fund Board Relations, Nuveen Investments, 333 West Wacker Drive, Chicago, IL 60606. The Nominating and Governance Committee sets appropriate standards and requirements for nominations for new trustees and reserves the right to interview any and all candidates and to make the final selection of any new trustees. In considering a candidate’s qualifications, each candidate must meet certain basic requirements, including relevant skills and experience, time availability (including the time requirements for due diligence site visits to sub-advisers and service providers) and, if qualifying as an independent trustee candidate, independence from the Adviser, sub-advisers, the Distributor and other service providers, including any affiliates of these entities. These skill and experience requirements may vary depending on the current composition of the Board, since the goal is to ensure an appropriate range of skills, diversity and experience, in the aggregate. Accordingly, the particular factors considered and weight given to these factors will depend on the composition of the Board and the skills and backgrounds of the incumbent trustees at the time of consideration of the nominees. All candidates, however, must meet high expectations of personal integrity, independence, governance experience and professional competence. All candidates must be willing to be critical within the Board and with management and yet maintain a collegial and collaborative manner toward other Board members. The committee operates under a written charter adopted and approved by the Board. This committee is composed of the independent trustees of the Nuveen Funds. Accordingly, the members of the Nominating and Governance Committee are Robert P. Bremner, Chair, Jack B. Evans, William C. Hunter, David J. Kundert, William J. Schneider, Judith M. Stockdale, Carole E. Stone, Virginia L. Stringer and Terence J. Toth. During the fiscal year ended September 30, 2012, the Nominating and Governance Committee met six times.
The Dividend Committee is authorized to declare distributions on the Nuveen Funds’ shares, including, but not limited to, regular and special dividends, capital gains and ordinary income distributions. The members of the Dividend Committee are Jack B. Evans, Chair, Judith M. Stockdale and Terence J. Toth. During the fiscal year ended September 30, 2012, the Dividend Committee met four times.
The Compliance, Risk Management and Regulatory Oversight Committee (the “Compliance Committee”) is responsible for the oversight of compliance issues, risk management and other regulatory matters affecting the Nuveen Funds that are not otherwise the jurisdiction of the other committees. The Board has adopted and periodically reviews policies and procedures designed to address the Nuveen Funds’ compliance and risk matters. As part of its duties, the Compliance Committee reviews the policies and procedures relating to compliance matters and recommends modifications thereto as necessary or appropriate to the full Board; develops new policies and procedures as new regulatory matters affecting the Nuveen Funds arise from time to time; evaluates or considers any comments or reports from examinations from regulatory authorities and responses thereto; and performs any special reviews, investigations or other oversight responsibilities relating to risk management, compliance and/or regulatory matters as requested by the Board.
In addition, the Compliance Committee is responsible for risk oversight, including, but not limited to, the oversight of risks related to investments and operations. Such risks include, among other things, exposures to particular issuers, market sectors, or types of securities; risks related to product structure elements, such as leverage; and techniques that may be used to address those risks, such as hedging and swaps. In assessing issues brought to the committee’s attention or in reviewing a particular policy, procedure, investment technique or strategy, the Compliance Committee evaluates the risks to the Nuveen Funds in adopting a particular approach compared to the anticipated benefits to the Nuveen Funds and their shareholders. In fulfilling its obligations, the Compliance Committee meets on a quarterly basis, and at least once a year in person. The Compliance Committee receives written and oral reports from the Nuveen Funds’ Chief Compliance Officer (“CCO”) and meets privately with the CCO at each of its quarterly meetings. The CCO also provides an annual report to the full Board regarding the operations of the Nuveen Funds’ and other service providers’ compliance programs as well as any recommendations for modifications thereto. The Compliance Committee also receives reports from the Adviser’s investment services group regarding various investment risks. Notwithstanding the foregoing, the full Board also participates in discussions with management regarding certain matters relating to investment risk, such as the use of leverage and hedging. The investment services group therefore also reports to the full Board at its quarterly meetings regarding,
S-30
among other things, fund performance and the various drivers of such performance. Accordingly, the Board directly and/or in conjunction with the Compliance Committee oversees matters relating to investment risks. Matters not addressed at the committee level are addressed directly by the full Board. The committee operates under a written charter adopted and approved by the Board. The members of the Compliance Committee are Jack B. Evans, William C. Hunter, William J. Schneider, Judith M. Stockdale, Chair, and Virginia L. Stringer. During the fiscal year ended September 30, 2012, the Compliance Committee met six times.
Effective January 1, 2012, the Board approved the creation of the Open-End Funds Committee. The Open-End Funds Committee is responsible for assisting the Board in the oversight and monitoring of the Nuveen Funds that are registered as open-end management investment companies (“Open-End Funds”). The committee may review and evaluate matters related to the formation and the initial presentation to the Board of any new Open-End Fund and may review and evaluate any matters relating to any existing Open-End Fund. The committee operates under a written charter adopted and approved by the Board. The members of the Open-End Funds Committee are Robert P. Bremner, David J. Kundert, Judith M. Stockdale, Virginia L. Stringer and Terence J. Toth, Chair. During the fiscal year ended September 30, 2012, the Open-End Funds Committee met two times.
Board Diversification and Trustee Qualifications
In determining that a particular trustee was qualified to serve on the Board, the Board has considered each trustee’s background, skills, experience and other attributes in light of the composition of the Board with no particular factor controlling. The Board believes that trustees need to have the ability to critically review, evaluate, question and discuss information provided to them, and to interact effectively with Fund management, service providers and counsel, in order to exercise effective business judgment in the performance of their duties, and the Board believes each trustee satisfies this standard. An effective trustee may achieve this ability through his or her educational background; business, professional training or practice; public service or academic positions; experience from service as a board member or executive of investment funds, public companies or significant private or not-for-profit entities or other organizations; and/or other life experiences. Accordingly, set forth below is a summary of the experiences, qualifications, attributes, and skills that led to the conclusion, as of the date of this document, that each trustee should continue to serve in that capacity. References to the experiences, qualifications, attributes and skills of trustees are pursuant to requirements of the SEC, do not constitute holding out of the Board or any trustee as having any special expertise or experience and shall not impose any greater responsibility or liability on any such person or on the Board by reason thereof.
John P. Amboian
Mr. Amboian, an interested trustee of the Nuveen Funds, joined Nuveen Investments in June 1995 and became Chief Executive Officer in July 2007 and Chairman in November 2007. Prior to this, since 1999, he served as President with responsibility for the firm’s product, marketing, sales, operations and administrative activities. Mr. Amboian initially served Nuveen Investments as Executive Vice President and Chief Financial Officer. Prior to joining Nuveen Investments, Mr. Amboian held key management positions with two consumer product firms affiliated with the Phillip Morris Companies. He served as Senior Vice President of Finance, Strategy and Systems at Miller Brewing Company. Mr. Amboian began his career in corporate and international finance at Kraft Foods, Inc., where he eventually served as Treasurer. He received a Bachelor’s degree in economics and a Masters of Business Administration (“MBA”) from the University of Chicago. Mr. Amboian serves on the Board of Directors of Nuveen Investments and is a Board Member or Trustee of the Investment Company Institute Board of Governors, Boys and Girls Clubs of Chicago, Children’s Memorial Hospital and Foundation, the Council on the Graduate School of Business (University of Chicago), and the North Shore Country Day School Foundation. He is also a member of the Civic Committee of the Commercial Club of Chicago and the Economic Club of Chicago.
Robert P. Bremner
Mr. Bremner, the Nuveen Funds’ Independent Chairman, is a private investor and management consultant in Washington, D.C. His biography of William McChesney Martin, Jr., a former chairman of
S-31
the Federal Reserve Board, was published by Yale University Press in November 2004. From 1994 to 1997, he was a Senior Vice President at Samuels International Associates, an international consulting firm specializing in governmental policies, where he served in a part-time capacity. Previously, Mr. Bremner was a partner in the LBK Investors Partnership and was chairman and majority stockholder with ITC Investors Inc., both private investment firms. He currently serves on the Board and as Treasurer of the Humanities Council of Washington D.C. and is a Board Member of the Independent Directors Council affiliated with the Investment Company Institute. From 1984 to 1996, Mr. Bremner was an independent Trustee of the Flagship Funds, a group of municipal open-end funds. He began his career at the World Bank in Washington D.C. He graduated with a Bachelor of Science degree from Yale University and received his MBA from Harvard University.
Jack B. Evans
President of the Hall-Perrine Foundation, a private philanthropic corporation, since 1996, Mr. Evans was formerly President and Chief Operating Officer of the SCI Financial Group, Inc., a regional financial services firm headquartered in Cedar Rapids, Iowa. Formerly, he was a member of the Board of the Federal Reserve Bank of Chicago as well as a Director of Alliant Energy. Mr. Evans is Chairman of the Board of United Fire Group, sits on the Board of Source Media Group, is a member of the Board of Regents for the State of Iowa University System and is a Life Trustee of Coe College. He has a Bachelor of Arts degree from Coe College and an MBA from the University of Iowa.
William C. Hunter
Mr. Hunter became Dean Emeritus of the Henry B. Tippie College of Business at the University of Iowa on June 30, 2012. He was appointed Dean of the Henry B. Tippie College of Business at the University of Iowa on July 1, 2006. He had been Dean and Distinguished Professor of Finance at the University of Connecticut School of Business since June 2003. From 1995 to 2003, he was the Senior Vice President and Director of Research at the Federal Reserve Bank of Chicago. While there he served as the Bank’s Chief Economist and was an Associate Economist on the Federal Reserve System’s Federal Open Market Committee (FOMC). In addition to serving as a Vice President in charge of financial markets and basic research at the Federal Reserve Bank in Atlanta, he held faculty positions at Emory University, Atlanta University, the University of Georgia and Northwestern University. A past Director of the Credit Research Center at Georgetown University, SS&C Technologies, Inc. (2005) and past President of the Financial Management Association International, he has consulted with numerous foreign central banks and official agencies in Western Europe, Central and Eastern Europe, Asia, Central America and South America. From 1990 to 1995, he was a U.S. Treasury Advisor to Central and Eastern Europe. He has been a Director of the Xerox Corporation since 2004 and Wellmark, Inc. since 2009. He is a Director and President of Beta Gamma Sigma, Inc., The International Business Honor Society.
David J. Kundert
Mr. Kundert retired in 2004 as Chairman of JPMorgan Fleming Asset Management, and as President and CEO of Banc One Investment Advisors Corporation, and as President of One Group Mutual Funds. Prior to the merger between Bank One Corporation and JPMorgan Chase and Co., he was Executive Vice President, Bank One Corporation and, since 1995, the Chairman and CEO, Banc One Investment Management Group. From 1988 to 1992, he was President and CEO of Bank One Wisconsin Trust Company. Currently, Mr. Kundert is a Director of the Northwestern Mutual Wealth Management Company. He started his career as an attorney for Northwestern Mutual Life Insurance Company. Mr. Kundert has served on the Board of Governors of the Investment Company Institute and he is currently a member of the Wisconsin Bar Association. He is on the Board of the Greater Milwaukee Foundation and chairs its Investment Committee. He received his Bachelor of Arts degree from Luther College, and his Juris Doctor from Valparaiso University.
William J. Schneider
Mr. Schneider is currently Chairman, formerly Senior Partner and Chief Operating Officer (retired, December 2004) of Miller-Valentine Partners Ltd., a real estate investment company. He was formerly a Director and Past Chair of the Dayton Development Coalition. He was formerly a member of the Community Advisory Board of the National City Bank in Dayton as well as a former member of the
S-32
Business Advisory Council of the Cleveland Federal Reserve Bank. Mr. Schneider is a member of the Business Advisory Council for the University of Dayton College of Business. Mr. Schneider was an independent Trustee of the Flagship Funds, a group of municipal open-end funds. He also served as Chair of the Miami Valley Hospital and as Chair of the Finance Committee of its parent holding company. Mr. Schneider has a Bachelor of Science in Community Planning from the University of Cincinnati and a Masters of Public Administration from the University of Dayton.
Judith M. Stockdale
Ms. Stockdale retired in 2012 as Executive Director of the Gaylord and Dorothy Donnelley Foundation, a private foundation working in land conservation and artistic vitality in the Chicago region and the Low country of South Carolina. Her previous positions include Executive Director of the Great Lakes Protection Fund, Executive Director of Openlands, and Senior Staff Associate at the Chicago Community Trust. She has served on the Boards of the Land Trust Alliance, the National Zoological Park, the Governor’s Science Advisory Council (Illinois), the Nancy Ryerson Ranney Leadership Grants Program, Friends of Ryerson Woods and the Donors Forum. Ms. Stockdale, a native of the United Kingdom, has a Bachelor of Science degree in geography from the University of Durham (UK) and a Master of Forest Science degree from Yale University.
Carole E. Stone
Ms. Stone retired from the New York State Division of the Budget in 2004, having served as its Director for nearly five years and as Deputy Director from 1995 through 1999. Ms. Stone is currently on the Board of Directors of the Chicago Board Options Exchange, CBOE Holdings, Inc. and C2 Options Exchange, Incorporated. She has also served as the Chair of the New York Racing Association Oversight Board, as a Commissioner on the New York State Commission on Public Authority Reform and as a member of the Boards of Directors of several New York State public authorities. Ms. Stone has a Bachelor of Arts from Skidmore College in Business Administration.
Virginia L. Stringer
Ms. Stringer served as the independent chair of the Board of the First American Fund Complex from 1997 to 2010, having joined such Board in 1987. Ms. Stringer serves on the board of the Mutual Fund Directors Forum. She is a recipient of the Outstanding Corporate Director award from Twin Cities Business Monthly and the Minnesota Chapter of the National Association of Corporate Directors. Ms. Stringer is the past board chair of the Oak Leaf Trust, director of the Saint Paul Riverfront Corporation and also served as President of the Minneapolis Club’s Governing Board. She is a director and former board chair of the Minnesota Opera and a Life Trustee and former board of the Voyageur Outward Bound School. She also served as a trustee of Outward Bound USA. She was appointed by the Governor of Minnesota to the Board on Judicial Standards and also served on a Minnesota Supreme Court Judicial Advisory Committee to reform the state’s judicial disciplinary process. She is a member of the International Women’s Forum and attended the London Business School as an International Business Fellow. Ms. Stringer also served as board chair of the Human Resource Planning Society, the Minnesota Women’s Campaign Fund and the Minnesota Women’s Economic Roundtable. Ms. Stringer is the retired founder of Strategic Management Resources, a consulting practice focused on corporate governance, strategy and leadership. She has twenty five years of corporate experience having held executive positions in general management, marketing and human resources with IBM and the Pillsbury Company.
Terence J. Toth
Mr. Toth is a Director, Legal & General Investment Management America, Inc. (since 2008) and a Managing Partner, Promus Capital (since 2008). From 2004 to 2007, he was Chief Executive Officer and President of Northern Trust Global Investments, and Executive Vice President of Quantitative Management & Securities Lending from 2000 to 2004. He also formerly served on the Board of the Northern Trust Mutual Funds. He joined Northern Trust in 1994 after serving as Managing Director and Head of Global Securities Lending at Bankers Trust (1986 to 1994) and Head of Government Trading and Cash Collateral Investment at Northern Trust from 1982 to 1986. He currently serves on the Board of the Chicago Fellowship and is Chairman of the Board of Catalyst Schools of Chicago. He is on the Mather Foundation Board (since 2012) and is a member of its investment committee.
S-33
Mr. Toth graduated with a Bachelor of Science degree from the University of Illinois, and received his MBA from New York University. In 2005, he graduated from the CEO Perspectives Program at Northwestern University.
Board Compensation
The following table shows, for each independent trustee, (1) the aggregate compensation paid by the Funds for the fiscal year ended September 30, 2012, (2) the amount of total compensation paid by the Funds that has been deferred, and (3) the total compensation paid to each trustee by the Nuveen Funds during the fiscal year ended September 30, 2012.
| | | | | | | | | | | | |
Name of Trustee | | Aggregate
Compensation
From Funds1 | | | Amount of Total
Compensation that
Has Been Deferred2 | | | Total Compensation
From Nuveen Funds
Paid to Trustees3 | |
Robert P. Bremner | | $ | 79 | | | $ | — | | | $ | 347,588 | |
Jack B. Evans | | | 58 | | | | — | | | | 268,219 | |
William C. Hunter | | | 54 | | | | — | | | | 254,097 | |
David J. Kundert | | | 60 | | | | — | | | | 276,805 | |
William J. Schneider | | | 64 | | | | — | | | | 287,562 | |
Judith M. Stockdale | | | 58 | | | | — | | | | 270,056 | |
Carole E. Stone | | | 59 | | | | — | | | | 266,000 | |
Virginia L. Stringer | | | 56 | | | | — | | | | 248,500 | |
Terence J. Toth | | | 65 | | | | — | | | | 294,750 | |
| 1 | | The compensation paid, including deferred amounts, to the independent trustees for the fiscal year ended September 30, 2012 for services to the Funds. |
| 2 | | Pursuant to a deferred compensation agreement with the Funds, deferred amounts are treated as though an equivalent dollar amount has been invested in shares of one or more eligible Nuveen Funds. The amounts provided are the total deferred fees (including the return from the assumed investment in the eligible Nuveen Funds) payable from the Funds. |
| 3 | | Based on the compensation paid (including any amounts deferred) to the trustees for the one- year period ended September 30, 2012 for services to the Nuveen Funds. |
Prior to January 1, 2012, independent trustees received a $120,000 annual retainer plus (a) a fee of $4,500 per day for attendance in person or by telephone at regularly scheduled meetings of the Board; (b) a fee of $3,000 per meeting for attendance in person or by telephone at special, non-regularly scheduled Board meetings where in-person attendance was required and $2,000 per meeting for attendance by telephone or in person at such meetings where in-person attendance was not required; (c) a fee of $2,500 per meeting for attendance in person or by telephone at Audit Committee meetings where in-person attendance was required and $2,000 per meeting for attendance by telephone or in person at such meetings where in-person attendance was not required; (d) a fee of $2,500 per meeting for attendance in person or by telephone at Compliance, Risk Management and Regulatory Oversight Committee meetings where in-person attendance was required and $2,000 per meeting for attendance by telephone or in person at such meetings where in-person attendance was not required; (e) a fee of $1,000 per meeting for attendance in person or by telephone at Dividend Committee meetings; and (f) a fee of $500 per meeting for attendance in person or by telephone at all other committee meetings ($1,000 for shareholder meetings) where in-person attendance was required and $250 per meeting for attendance by telephone or in person at such committee meetings (excluding shareholder meetings) where in-person attendance was not required, and $100 per meeting when the Executive Committee acted as pricing committee for IPOs, plus, in each case, expenses incurred in attending such meetings, provided that no fees were received for meetings held on days on which regularly scheduled Board meetings were held. In addition to the payments described above, the Chairman of the Board received $75,000, the chairpersons of the Audit Committee, the Dividend Committee and the Compliance, Risk Management and Regulatory Oversight Committee received $10,000 each and the chairperson of the Nominating and Governance Committee received $5,000 as additional retainers. Independent trustees also received a fee of $3,000 per day for site visits to entities that provided services to the Nuveen Funds on days on which no Board meeting was held. When ad hoc committees were organized, the Nominating and
S-34
Governance Committee at the time of formation determined compensation to be paid to the members of such committee; however, in general, such fees were $1,000 per meeting for attendance in person or by telephone at ad hoc committee meetings where in-person attendance was required and $500 per meeting for attendance by telephone or in person at such meetings where in-person attendance was not required. The annual retainer, fees and expenses were allocated among the Nuveen Funds on the basis of relative net assets, although management might have, in its discretion, established a minimum amount to be allocated to each fund.
Effective January 1, 2012, independent trustees received a $130,000 annual retainer, which was increased to $140,000 as of January 1, 2013, plus they receive (a) a fee of $4,500 per day for attendance in person or by telephone at regularly scheduled meetings of the Board; (b) a fee of $3,000 per meeting for attendance in person or by telephone at special, non-regularly scheduled Board meetings where in-person attendance is required and $2,000 per meeting for attendance by telephone or in person at such meetings where in-person attendance is not required; (c) a fee of $2,500 per meeting for attendance in person or by telephone at Audit Committee meetings where in-person attendance is required and $2,000 per meeting for attendance by telephone or in person at such meetings where in-person attendance is not required; (d) a fee of $2,500 per meeting for attendance in person or by telephone at Compliance, Risk Management and Regulatory Oversight Committee meetings where in-person attendance is required and $2,000 per meeting for attendance by telephone or in person at such meetings where in-person attendance is not required; (e) a fee of $1,000 per meeting for attendance in person or by telephone at Dividend Committee meetings; (f) a fee of $500 per meeting for attendance in person or by telephone at all other committee meetings ($1,000 for shareholder meetings) where in-person attendance is required and $250 per meeting for attendance by telephone or in person at such committee meetings (excluding shareholder meetings) where in-person attendance is not required, and $100 per meeting when the Executive Committee acts as pricing committee for IPOs, plus, in each case, expenses incurred in attending such meetings, provided that no fees are received for meetings held on days on which regularly scheduled Board meetings are held; and (g) a fee of $2,500 per meeting for attendance in person or by telephone at Open-End Funds Committee meetings where in-person attendance is required and $2,000 per meeting for attendance by telephone or in person at such meetings where in-person attendance is not required; provided that no fees are received for meetings held on days on which regularly scheduled Board meetings are held. In addition to the payments described above, the Chairman of the Board receives $75,000, the chairpersons of the Audit Committee, the Dividend Committee, the Compliance, Risk Management and Regulatory Oversight Committee and the Open-End Funds Committee receive $12,500 each and the chairperson of the Nominating and Governance Committee receives $5,000 as additional retainers. Independent trustees also receive a fee of $3,000 per day for site visits to entities that provide services to the Nuveen Funds on days on which no Board meeting is held. When ad hoc committees are organized, the Nominating and Governance Committee will at the time of formation determine compensation to be paid to the members of such committee; however, in general, such fees will be $1,000 per meeting for attendance in person or by telephone at ad hoc committee meetings where in-person attendance is required and $500 per meeting for attendance by telephone or in person at such meetings where in-person attendance is not required. The annual retainer, fees and expenses are allocated among the Nuveen Funds on the basis of relative net assets, although management may, in its discretion, establish a minimum amount to be allocated to each fund.
The Trust does not have a retirement or pension plan. The Trust has a deferred compensation plan (the “Deferred Compensation Plan”) that permits any independent trustee to elect to defer receipt of all or a portion of his or her compensation as an independent trustee. The deferred compensation of a participating trustee is credited to a book reserve account of the Trust when the compensation would otherwise have been paid to the trustee. The value of the trustee’s deferral account at any time is equal to the value that the account would have had if contributions to the account had been invested and reinvested in shares of one or more of the eligible Nuveen Funds. At the time for commencing distributions from a trustee’s deferral account, the independent trustee may elect to receive distributions in a lump sum or over a period of five years. The Trust will not be liable for any other fund’s obligations to make distributions under the Deferred Compensation Plan.
The Funds have no employees. The officers of the Trust and the trustee of the Trust who is not an independent trustee serve without any compensation from the Funds.
S-35
Share Ownership
The information in the table below discloses the dollar ranges of (i) each trustee’s beneficial ownership in each Fund, and (ii) each trustee’s aggregate beneficial ownership in all funds within the Nuveen Funds complex, including in each case the value of fund shares elected by the trustee in the trustees’ deferred compensation plan, based on the value of fund shares as of December 31, 2012.
| | | | | | | | | | |
Name of Trustee | | Dollar Range of Equity Securities in the Funds | | Aggregate Dollar
Range of Equity
Securities in All
Registered
Investment
Companies
Overseen by
Trustee in Family
of Investment
Companies |
| | Nuveen
Symphony
International
Equity
Fund | | Nuveen
Symphony
Large-Cap
Growth
Fund | | Nuveen
Symphony
Mid-Cap
Core
Fund | | Nuveen
Symphony
Optimized Alpha
Fund | |
John P. Amboian | | $0 | | $0 | | $0 | | $0 | | Over $100,000 |
Robert P. Bremner | | $0 | | $0 | | $0 | | $0 | | Over $100,000 |
Jack B. Evans | | $0 | | $0 | | $0 | | $0 | | Over $100,000 |
William C. Hunter | | $0 | | $0 | | $0 | | $0 | | Over $100,000 |
David J. Kundert | | $0 | | $0 | | $0 | | $0 | | Over $100,000 |
William J. Schneider | | $0 | | $0 | | $0 | | $0 | | Over $100,000 |
Judith M. Stockdale | | $0 | | $0 | | $0 | | $0 | | Over $100,000 |
Carole E. Stone | | $0 | | $0 | | $0 | | $0 | | Over $100,000 |
Virginia L. Stringer | | $0 | | $0 | | $0 | | $0 | | Over $100,000 |
Terence J. Toth | | $0 | | $50,001-$100,000 | | $0 | | $0 | | Over $100,000 |
As of January 3, 2013, the officers and trustees of each Fund, in the aggregate, owned less than 1% of the shares of each of the Funds.
As of January 3, 2013, none of the independent trustees or their immediate family members owned, beneficially, or of record, any securities in (i) an investment adviser or principal underwriter of the Funds or (ii) a person (other than a registered investment company) directly or indirectly controlling, controlled by, or under common control with an investment adviser or principal underwriter of the Funds.
Sales Loads
Trustees of the Funds and certain other Fund affiliates may purchase the Funds’ Class I shares. See the Funds’ Prospectus for details.
SERVICE PROVIDERS
Investment Adviser
Nuveen Fund Advisors, located at 333 West Wacker Drive, Chicago, Illinois 60606, serves as the investment adviser of each Fund, with responsibility for the overall management of each Fund. The Adviser is also responsible for managing the Funds’ business affairs and providing day-to-day administrative services to the Funds. The Adviser has selected its affiliate, Symphony, located at 555 California Street, Suite 2975, San Francisco, California 94104, to serve as sub-adviser to manage the investment portfolios of the Funds. For additional information regarding the management services performed by the Adviser and Symphony, see “Who Manages the Funds” in the Prospectus.
The Adviser is an affiliate of the Distributor, which is located at 333 West Wacker Drive, Chicago, Illinois 60606. The Distributor is the principal underwriter for the Nuveen Mutual Funds, and has served as co-managing underwriter for the shares of the Nuveen Closed-End Funds. The Adviser and the Distributor are subsidiaries of Nuveen Investments.
On November 13, 2007, Nuveen Investments was acquired by investors led by Madison Dearborn Partners, LLC, which is a private equity investment firm based in Chicago, Illinois.
For the management services and facilities furnished by the Adviser, each of the Funds has agreed to pay an annual management fee at a rate set forth in the Prospectus under “Who Manages the Funds.” In addition, the Adviser has agreed to waive all or a portion of its management fee or reimburse certain expenses of the Funds. The Prospectus includes current fee waivers and expense reimbursements for the Funds.
S-36
Each Fund’s management fee is divided into two components—a complex-level fee based on the aggregate amount of all eligible Nuveen Fund assets and a specific fund-level fee based only on the amount of assets within each individual Fund. This pricing structure enables Fund shareholders to benefit from growth in the assets within each individual Fund as well as from growth in the amount of complex-wide assets managed by the Adviser. Under no circumstances will this pricing structure result in a Fund paying management fees at a rate higher than would otherwise have been applicable had the complex-wide management fee structure not been implemented.
Each Fund has agreed to pay an annual fund-level management fee, payable monthly, based upon the average daily net assets of each Fund as set forth in the Prospectus.
The annual complex-level management fee for each Fund, payable monthly, which is additive to the fund-level fee, is based on the aggregate amount of total eligible assets managed for all Nuveen Funds as stated in the table below.
| | | | |
Complex-Level Asset
Breakpoint Level* | | Effective Rate at
Breakpoint Level | |
$55 billion | | | 0.2000 | % |
$56 billion | | | 0.1996 | % |
$57 billion | | | 0.1989 | % |
$60 billion | | | 0.1961 | % |
$63 billion | | | 0.1931 | % |
$66 billion | | | 0.1900 | % |
$71 billion | | | 0.1851 | % |
$76 billion | | | 0.1806 | % |
$80 billion | | | 0.1773 | % |
$91 billion | | | 0.1691 | % |
$125 billion | | | 0.1599 | % |
$200 billion | | | 0.1505 | % |
$250 billion | | | 0.1469 | % |
$300 billion | | | 0.1445 | % |
| * | | The complex-level fee is calculated based upon the aggregate daily ”eligible assets” of all Nuveen Funds. Except as described below, eligible assets include the net assets of all Nuveen-branded closed-end and open-end registered investment companies organized in the United States. Eligible assets do not include assets attributable to investments in other Nuveen Funds or assets in excess of a determined amount (originally $2 billion) added to the Nuveen Fund complex in connection with Nuveen Fund Advisors’ assumption of the management of the former First American Funds effective January 1, 2011. Eligible assets include closed-end fund assets managed by the Adviser that are attributable to financial leverage. For these purposes, financial leverage includes the closed-end funds’ use of preferred stock and borrowings and certain investments in the residual interest certificates (also called inverse floating rate securities) in tender option bond (TOB) trusts, including the portion of assets held by a TOB trust that has been effectively financed by the trust’s issuance of floating rate securities, subject to an agreement by the Adviser as to certain funds to limit the amount of such assets for determining eligible assets in certain circumstances. As of September 30, 2012, the complex-level fee rate was 0.1695%. |
The following table sets forth the management fees (net of fee waivers and expense reimbursements) paid by the Funds and the fees waived and expenses reimbursed by the Adviser for the specified periods.
| | | | | | | | | | | | | | | | | | | | | | | | |
Fund | | Amount of Management Fees (Net
of Fee Waivers and Expense
Reimbursements by the Adviser) | | | Amount of Fees Waived and
Expenses Reimbursed by the Adviser | |
| | | 10/01/09-
9/30/10 | | | 10/01/10-
9/30/11 | | | 10/01/11-
9/30/12 | | | 10/01/09-
9/30/10 | | | 10/01/10-
9/30/11 | | | 10/01/11-
9/30/12 | |
Nuveen Symphony International Equity Fund | | $ | — | | | $ | — | | | $ | — | | | $ | 97,750 | | | $ | 87,517 | | | $ | 63,999 | |
S-37
| | | | | | | | | | | | | | | | | | | | | | | | |
Fund | | Amount of Management Fees (Net
of Fee Waivers and Expense
Reimbursements by the Adviser) | | | Amount of Fees Waived and
Expenses Reimbursed by the Adviser | |
| | | 10/01/09-
9/30/10 | | | 10/01/10-
9/30/11 | | | 10/01/11-
9/30/12 | | | 10/01/09-
9/30/10 | | | 10/01/10-
9/30/11 | | | 10/01/11-
9/30/12 | |
Nuveen Symphony Large-Cap Growth Fund | | $ | — | | | $ | — | | | $ | 21,162 | | | $ | 117,303 | | | $ | 110,280 | | | $ | 141,111 | |
Nuveen Symphony Mid-Cap Core Fund | | | — | | | | — | | | | — | | | | 117,992 | | | | 92,600 | | | | 89,178 | |
Nuveen Symphony Optimized Alpha Fund | | | — | | | | — | | | | — | | | | 101,823 | | | | 120,762 | | | | 64,050 | |
In addition to the Adviser’s management fee, each Fund also pays a portion of the Trust’s general administrative expenses allocated in proportion to the net assets of each Fund. All fees and expenses are accrued daily and deducted before payment of dividends to investors.
Sub-Adviser
The Adviser has selected Symphony to serve as sub-adviser to manage the investment portfolio of each Fund. Symphony is organized as a member-managed limited liability company, and its sole managing member is Nuveen Investments. The Adviser pays Symphony a portfolio management fee equal to 50% of the advisory fee paid to the Adviser for its services to the Funds (net of any waivers, reimbursement payments, supermarket fees and alliance fees waived, reimbursed or paid by the Adviser in respect of the Funds).
The following table sets forth the fees paid by the Adviser to Symphony for its services for the specified periods:
| | | | | | | | | | | | |
Fund | | Amount Paid by the Adviser to Symphony | |
| | | 10/01/09-
9/30/10 | | | 10/01/10-
9/30/11 | | | 10/01/11-
9/30/12 | |
Nuveen Symphony International Equity Fund | | $ | — | | | $ | 779 | | | $ | 9,674 | |
Nuveen Symphony Large-Cap Growth Fund | | | 6,445 | | | | 10,772 | | | | 38,775 | |
Nuveen Symphony Mid-Cap Core Fund | | | — | | | | 8,387 | | | | 6,080 | |
Nuveen Symphony Optimized Alpha Fund | | | — | | | | 6,232 | | | | 16,410 | |
Portfolio Managers
Gunther Stein, Ross Sakamoto and Joel Drescher have primary responsibility for the day-to-day implementation of the investment strategies of the Funds.
Compensation
Symphony investment professionals receive compensation based on three elements: fixed-base salary, participation in a bonus pool and certain long-term incentives.
The fixed-base salary is set at a level determined by Symphony and is reviewed periodically to ensure that it is competitive with base salaries paid by similar financial services companies for persons playing similar roles.
The portfolio manager is also eligible to receive an annual bonus from a pool based on Symphony’s aggregate asset-based and performance fees after all operating expenses. The level of this bonus to each individual portfolio manager is determined by senior management’s assessment of the team’s performance, and the individual’s contribution to and performance on that team. Factors considered in that assessment include the total return and risk-adjusted total return performance of the accounts for which the individual serves as portfolio manager relative to any benchmarks established for those accounts; the individual’s effectiveness in communicating investment performance to investors and/or their advisors; and the individual’s contribution to the firm’s overall investment process and to the execution of investment strategies.
Finally, certain key employees of Symphony, including the portfolio managers, have received profits interests in Symphony which entitle their holders to participate in the firm’s growth over time.
S-38
Other Accounts Managed
In addition to the Funds, as of September 30, 2012, the portfolio managers were also primarily responsible for the day-to-day portfolio management of the following accounts:
| | | | | | | | | | | | | | |
Portfolio Manager | | Type of Account Managed | | Number of
Accounts | | Assets | | | Number of
Accounts
with
Performance-
Based Fees | | | Assets of
Accounts
with
Performance-
Based Fees |
Gunther Stein | | Registered Investment Companies Other Pooled Investment Vehicles Other Accounts | | 13
32 14 | |
| $2.4 billion
$1.9 billion $365.2 million |
| |
| 0
17 5 |
| | 0
$1.8 billion $293 million |
Ross Sakamoto | | Registered Investment Companies Other Pooled Investment Vehicles Other Accounts | | 1
10 15 | |
| $34.4 million
$60.2 million $110.5 million |
| |
| 0
3 2 |
| | 0
$41.1 million $90.8 million |
Joel Drescher | | Registered Investment Companies Other Pooled Investment Vehicles Other Accounts | | 1
10 11 | |
| $34.4 million
$60.2 million $110.2 million |
| |
| 0
3 2 |
| | 0
$41.1 million $90.8 million |
Conflicts of Interest
The portfolio managers may manage other accounts with investment strategies similar to the Funds, including other investment companies and separately managed accounts. Fees earned by the sub-adviser may vary among these accounts and the portfolio managers may personally invest in some but not all of these accounts. These factors could create conflicts of interest because a portfolio manager may have incentives to favor certain accounts over others, resulting in other accounts outperforming the Funds. A conflict may also exist if a portfolio manager identified a limited investment opportunity that may be appropriate for more than one account, but the Funds are not able to take full advantage of that opportunity due to the need to allocate that opportunity among multiple accounts. In addition, the portfolio managers may execute transactions for another account that may adversely impact the value of securities held by the Funds. However, the sub-adviser believes that these risks are mitigated by the fact that accounts with like investment strategies managed by a particular portfolio manager are generally managed in a similar fashion, subject to exceptions to account for particular investment restrictions or policies applicable only to certain accounts, differences in cash flows and account sizes, and other factors. In addition, the sub-adviser has adopted trade allocation procedures that require equitable allocation of trade orders for a particular security among participating accounts.
Beneficial Ownership of Securities
The following table indicates as of September 30, 2012 the value, within the indicated range, of shares beneficially owned by the portfolio managers in the Funds they manage. For purposes of this table, the following letters indicate the range listed next to each letter:
| | | | |
A | | - | | $0 |
B | | - | | $1-$10,000 |
C | | - | | $10,001-$50,000 |
D | | - | | $50,001-$100,000 |
E | | - | | $100,001-$500,000 |
F | | - | | $500,001-$1,000,000 |
G | | - | | More than $1 million |
| | | | |
Name of Portfolio Manager | | Fund | | Dollar Range of
Equity Securities
Beneficially Owned
in Fund Managed |
| Gunther Stein | | Nuveen Symphony International Equity Fund | | A |
| | Nuveen Symphony Large-Cap Growth Fund | | A |
| | Nuveen Symphony Mid-Cap Core Fund | | A |
S-39
| | | | |
Name of Portfolio Manager | | Fund | | Dollar Range of
Equity Securities
Beneficially Owned
in Fund Managed |
| | Nuveen Symphony Optimized Alpha Fund | | A |
| Ross Sakamoto | | Nuveen Symphony International Equity Fund | | A |
| | Nuveen Symphony Large-Cap Growth Fund | | C |
| | Nuveen Symphony Mid-Cap Core Fund | | C |
| | Nuveen Symphony Optimized Alpha Fund | | A |
| Joel Drescher | | Nuveen Symphony International Equity Fund | | A |
| | Nuveen Symphony Large-Cap Growth Fund | | A |
| | Nuveen Symphony Mid-Cap Core Fund | | A |
| | Nuveen Symphony Optimized Alpha Fund | | A |
Distributor
Nuveen Securities, LLC, 333 West Wacker Drive, Chicago, Illinois 60606, serves as the distributor for the Funds’ shares pursuant to a “best efforts” arrangement as provided by a Distribution Agreement dated August 1, 1998 (the “Distribution Agreement”). Pursuant to the Distribution Agreement, the Funds appointed the Distributor to be their agent for the distribution of the Funds’ shares on a continuous offering basis.
Independent Registered Public Accounting Firm, Custodian and Transfer Agent
PricewaterhouseCoopers LLP (“PwC”), One North Wacker Drive, Chicago, Illinois 60606, independent registered public accounting firm, has been selected as auditors for the Trust. In addition to audit services, PwC provides assistance on accounting, tax and related matters.
The custodian of the assets of the Funds is State Street Bank & Trust Company, P.O. Box 5043, Boston, Massachusetts 02206-5043. The custodian performs custodial, fund accounting and portfolio accounting services.
The Funds’ transfer, shareholder services, and dividend paying agent is Boston Financial Data Services, Inc. (“BFDS”), P.O. Box 8530, Boston, Massachusetts 02266-8530.
CODES OF ETHICS
The Funds, the Adviser, the Sub-Adviser and the Distributor have adopted codes of ethics pursuant to Rule 17j-1 under the 1940 Act and with respect to the Adviser and Sub-Adviser, Rule 204A-1 under the Investment Advisers Acts of 1940, as amended, addressing personal securities transactions and other conduct by investment personnel and access persons who may have access to information about the Funds’ securities transactions. The codes are intended to address potential conflicts of interest that can arise in connection with personal trading activities of such persons. Persons subject to the codes are generally permitted to engage in personal securities transactions, including investing in securities eligible for investment by the Funds, subject to certain prohibitions, which may include prohibitions on investing in certain types of securities, pre-clearance requirements, blackout periods, annual and quarterly reporting of personal securities holdings and limitations on personal trading of initial public offerings. Violations of the codes are subject to review by the Board of Trustees and could result in severe penalties.
PROXY VOTING POLICIES
Each Fund has adopted a proxy voting policy that seeks to ensure that proxies for securities held by the Fund are voted consistently and solely in the best economic interests of the Fund.
A member of each Fund’s management team is responsible for oversight of the Fund’s proxy voting process. With regard to equity securities, Symphony has engaged the services of Institutional Shareholder Services Inc. (“ISS”) to make recommendations on the voting of proxies relating to securities held by the Funds and managed by Symphony. ISS provides voting recommendations based upon established guidelines and practices. Symphony reviews and frequently follows the ISS recommendations. However, on selected issues, Symphony may not vote in accordance with the ISS
recommendations when it believes that specific ISS recommendations are not in the best economic
S-40
interest of the applicable Fund. If Symphony manages the assets of a company or its pension plan and any of Symphony’s clients hold any securities of that company, Symphony will vote proxies relating to such company’s securities in accordance with the ISS recommendations to avoid any conflict of interest. Where a material conflict of interest has been identified by Symphony and ISS does not offer a recommendation on the matter, Symphony shall disclose the conflict and Symphony’s Proxy Voting Committee shall determine the manner in which to vote and notify the applicable Fund’s Board of Trustees or its designated committee.
Although Symphony has affiliates that provide investment advisory, broker-dealer, insurance or other financial services, Symphony does not receive non-public information about the business arrangements of such affiliates (except with regard to major distribution partners of its investment products) or the directors, officers and employees of such affiliates. Therefore, Symphony is unable to consider such information when determining whether there are material conflicts of interests.
Information regarding how each Fund voted proxies relating to portfolio securities during the most recent 12-month period ended June 30 is available without charge by calling (800) 257-8787 or by accessing the SEC’s website at http://www.sec.gov.
PORTFOLIO TRANSACTIONS
Symphony is responsible for decisions to buy and sell securities for the Funds and for the placement of the Funds’ securities business, the negotiation of the commissions to be paid on brokered transactions, the prices for principal trades in securities, and the allocation of portfolio brokerage and principal business. It is the policy of Symphony to seek the best execution at the best security price available with respect to each transaction, and with respect to brokered transactions, in light of the overall quality of brokerage and research services provided to the adviser and its advisees. The best price to the Funds means the best net price without regard to the mix between purchase or sale price and commission, if any. Purchases may be made from underwriters, dealers, and, on occasion, the issuers. Commissions will be paid on the Funds’ futures and options transactions, if any. The purchase price of portfolio securities purchased from an underwriter or dealer may include underwriting commissions and dealer spreads. The Funds may pay mark-ups on principal transactions. In selecting broker-dealers and in negotiating commissions, the portfolio managers consider, among other things, the firm’s reliability, the quality of its execution services on a continuing basis and its financial condition. Brokerage will not be allocated based on the sale of a Fund’s shares.
Section 28(e) of the Securities Exchange Act of 1934 permits an investment adviser, under certain circumstances, to cause an account to pay a broker or dealer who supplies brokerage and research services a commission for effecting the transaction in excess of the amount of commission another broker or dealer would have charged for effecting the transaction. Brokerage and research services include, but are not limited to, (a) furnishing advice as to the value of securities, the advisability of investing, purchasing or selling securities, and the availability of securities or purchasers or sellers of securities; (b) furnishing analyses and reports concerning issuers, industries, securities, economic factors and trends, portfolio strategy, and the performance of accounts; and (c) effecting securities transactions and performing functions incidental thereto (such as clearance, settlement, and custody).
In light of the above, in selecting brokers, the portfolio managers consider investment and market information and other research, such as economic, securities and performance measurement research, provided by such brokers, and the quality and reliability of brokerage services, including execution capability, performance and financial responsibility. Accordingly, the commissions charged by any such broker may be greater than the amount another firm might charge if the portfolio managers determine in good faith that the amount of such commissions is reasonable in relation to the value of the research information and brokerage services provided by such broker to Symphony or a Fund. Symphony believes that the research information received in this manner provides a Fund with benefits by supplementing the research otherwise available to the Fund. The Investment Management Agreement and the Sub-Advisory Agreement provide that such higher commissions will not be paid by a Fund unless Symphony determines in good faith that the amount is reasonable in relation to the services provided. The investment advisory fees paid by a Fund to the Adviser under the Investment Management Agreement and the sub-advisory fees paid by the Adviser to Symphony under the Sub-Advisory Agreement are not reduced as a result of receipt by either the Adviser or Symphony of research services.
S-41
Symphony places portfolio transactions for other advisory accounts managed by it. Research services furnished by firms through which the Funds effect their securities transactions may be used by Symphony in servicing all of its accounts; not all of such services may be used by Symphony in connection with the Funds. Symphony believes it is not possible to measure separately the benefits from research services to each of the accounts (including the Funds) managed by it. Because the volume and nature of the trading activities of the accounts are not uniform, the amount of commissions in excess of those charged by another broker paid by each account for brokerage and research services will vary. However, Symphony believes such costs to the Funds will not be disproportionate to the benefits received by the Funds on a continuing basis. Symphony seeks to allocate portfolio transactions equitably whenever concurrent decisions are made to purchase or sell securities by the Funds and another advisory account. In some cases, this procedure could have an adverse effect on the price or the amount of securities available to the Funds. In making such allocations between the Funds and other advisory accounts, the main factors considered by Symphony are the respective investment objectives, the relative size of portfolio holdings of the same or comparable securities, the availability of cash for investment and the size of investment commitments generally held.
The following table sets forth the aggregate amount of brokerage commissions paid by the Funds for the specified periods:
| | | | | | | | | | | | |
Fund | | Aggregate Amount of
Brokerage Commissions | |
| | | 10/01/09-
9/30/10 | | | 10/01/10-
9/30/11 | | | 10/01/11-
9/30/12 | |
Nuveen Symphony International Equity Fund | | $ | 832 | | | $ | 443 | | | $ | 173 | |
Nuveen Symphony Large-Cap Growth Fund | | $ | 3,079 | | | $ | 6,987 | | | $ | 27,488 | |
Nuveen Symphony Mid-Cap Core Fund | | $ | 622 | | | $ | 2,462 | | | $ | 4,890 | |
Nuveen Symphony Optimized Alpha Fund | | $ | 1,293 | | | $ | 1,360 | | | $ | 1,400 | |
During the fiscal year ended September 30, 2012, Nuveen Symphony International Equity Fund, Nuveen Symphony Large-Cap Growth Fund, Nuveen Symphony Mid-Cap Core Fund and Nuveen Symphony Optimized Alpha Fund paid to brokers as commissions in return for research services $173, $26,778, $4,864 and $1,351, respectively, and the aggregate amount of those transactions per Fund on which such commissions were paid were $1,271,869, $454,275,758, $29,175,075 and $7,126,962, respectively.
The Funds have acquired during the fiscal year ended September 30, 2012 the securities of their regular brokers or dealers as defined in Rule 10b-1 under the 1940 Act or of the parents of the brokers or dealers. The following table sets forth those brokers or dealers and states the value of the Funds’ aggregate holdings of the securities of each issuer as of close of the fiscal year ended September 30, 2012:
| | | | | | | | |
Fund | | Broker/Dealer | | Issuer | | Aggregate Fund
Holdings of
Broker/Dealer
or Parent (as of
September 30, 2012) | |
Nuveen Symphony International Equity Fund | |
UBS Securities LLC State Street
Bank & Trust | | UBS AG State Street Bank, Repurchase Agreement | | $
| 5,150
— |
|
Nuveen Symphony Large-Cap Growth Fund | |
State Street
Bank & Trust | | State Street Bank, Repurchase Agreement | | | 3,304,115 | |
Nuveen Symphony Mid-Cap Core Fund | |
KeyBanc Capital Markets Inc. | |
KeyCorp. | | | 55,141 | |
Nuveen Symphony Optimized Alpha Fund | |
J.P Morgan Clearing Corp. | | JP Morgan Chase & Company | | | 24,895 | |
| | Citigroup Global Markets Inc. | | Citigroup Global Markets Inc. | | | — | |
S-42
Under the 1940 Act, a Fund may not purchase portfolio securities from any underwriting syndicate of which the Distributor is a member except under certain limited conditions set forth in Rule 10f-3. The Rule sets forth requirements relating to, among other things, the terms of a security purchased by a Fund, the amount of securities that may be purchased in any one issue and the assets of a Fund that may be invested in a particular issue. In addition, purchases of securities made pursuant to the terms of the Rule must be approved at least quarterly by the Board of Trustees, including a majority of the independent trustees.
Portfolio Trading and Turnover
The Funds will make changes in their investment portfolios from time to time in order to seek to take advantage of opportunities in the market and to limit exposure to market risk. The Funds may also engage to a limited extent in short-term trading consistent with their investment objectives. Changes in a Fund’s investments are known as “portfolio turnover.”
DISCLOSURE OF PORTFOLIO HOLDINGS
The Nuveen Mutual Funds have adopted a portfolio holdings disclosure policy which governs the dissemination of the Funds’ portfolio holdings. In accordance with this policy, the Funds may provide portfolio holdings information to third parties no earlier than the time a report is filed with the SEC that is required to contain such information or one day after the information is posted on the Funds’ publicly accessible website, www.nuveen.com. A complete list of portfolio holdings information is generally made available on the Funds’ website ten business days after the end of the month. Additionally, the Funds publish on the website a list of their top ten holdings as of the end of each month, approximately two to five business days after the end of the month for which the information is current. This information will remain available on the website at least until the Funds file with the SEC their Forms N-CSR or Forms N-Q for the period that includes the date as of which the website information is current.
Additionally, the Funds may disclose portfolio holdings information that has not been included in a filing with the SEC or posted on the Funds’ website (i.e., non-public portfolio holdings information) only if there is a legitimate business purpose for doing so and if the recipient is required, either by explicit agreement or by virtue of the recipient’s duties to the Funds as an agent or service provider, to maintain the confidentiality of the information and to not use the information in an improper manner (e.g., personal trading). In this connection, the Funds may disclose on an ongoing basis non-public portfolio holdings information in the normal course of their investment and administrative operations to various service providers, including the Adviser and/or sub-adviser, independent registered public accounting firm, custodian, financial printer (R.R. Donnelley Financial and Financial Graphic Services), proxy voting service(s) (including ISS, ADP Investor Communication Services, and Glass, Lewis & Co.), and to the legal counsel for the Funds’ independent trustees (Chapman and Cutler LLP). Also, the Adviser may transmit to Vestek Systems, Inc. daily non-public portfolio holdings information on a next-day basis to enable the Adviser to perform portfolio attribution analysis using Vestek’s systems and software programs. Vestek is also provided with non-public portfolio holdings information on a monthly basis approximately 2-3 business days after the end of each month so that Vestek may calculate and provide certain statistical information (but not the non-public holdings information itself) to its clients (including retirement plan sponsors or their consultants). The Adviser and/or sub-adviser may also provide certain portfolio holdings information to broker-dealers from time to time in connection with the purchase or sale of securities or requests for price quotations or bids on one or more securities. In providing this information, reasonable precautions are taken in an effort to avoid potential misuse of the disclosed information, including limitations on the scope of the portfolio holdings information disclosed, when appropriate.
S-43
Non-public portfolio holdings information may be provided to other persons if approved by the Funds’ Chief Administrative Officer or Secretary upon a determination that there is a legitimate business purpose for doing so, the disclosure is consistent with the interests of the Funds, and the recipient is obligated to maintain the confidentiality of the information and not misuse it.
Compliance officers of the Funds and the Adviser and sub-adviser periodically monitor overall compliance with the policy to ascertain whether portfolio holdings information is disclosed in a manner that is consistent with the Funds’ policy. Reports are made to the Funds’ Board of Trustees on an annual basis.
There is no assurance that the Funds’ policies on portfolio holdings information will protect the Funds from the potential misuse of portfolio holdings information by individuals or firms in possession of such information.
The following parties currently receive non-public portfolio holdings information regarding one or more of the Nuveen Mutual Funds on an ongoing basis pursuant to the various arrangements described above:
ADP Investor Communications Services
Altrinsic Global Advisors, LLC
Barclays Capital, Inc.
Barra
Bloomberg
BNP Paribas Prime Brokerage, Inc.
BNP Paribas Securities Corp.
Broadridge Systems
Cantor Fitzgerald & Co.
Chapman and Cutler LLP
Commerz Markets LLC
Credit Agricole Securities (USA) Inc.
Credit Suisse Securities (USA), LLC
Deutsche Bank Securities, Inc.
Dresdner Kleinwort Securities, LLC
Ernst & Young LLP
FactSet Research Systems
Financial Graphic Services
First Clearing, LLC
Forbes
Glass, Lewis & Co.
Goldman Sachs & Co.
Hansberger Global Investors, LLC
HSBC Securities (USA), Inc.
ING Financial Markets, LLC
The Investment Company Institute
ISS
Jefferies & Company, Inc.
J.P. Morgan Clearing Corp.
J.P. Morgan Securities, Inc.
Lazard Asset Management, Inc.
Lipper Inc.
Merrill Lynch, Pierce, Fenner & Smith
Moody’s
Morgan Stanley & Co., Inc.
Morningstar, Inc.
MS Securities Services, Inc.
Newedge USA, LLC
Nuveen Asset Management, LLC
Nuveen Fund Advisors, LLC
Pershing, LLC
S-44
PricewaterhouseCoopers LLP
Raymond James & Associates, Inc.
RBC Capital Markets Corporation
RBS Securities, Inc.
R.R. Donnelley & Sons Company
R.R. Donnelley Financial
Scotia Capital (USA), Inc.
SG Ameritas Securities, LLC
Societe Generale, New York Branch
Standard & Poor’s
State Street Bank & Trust Co.
Strategic Insight
TD Ameritrade Clearing, Inc.
ThomsonReuters LLC
UBS Securities, LLC
U.S. Bancorp Fund Services, LLC
U.S. Bank N.A.
Value Line
Vestek Systems, Inc.
Vickers
Wells Fargo Securities, LLC
Wilshire Associates Incorporated
NET ASSET VALUE
Each Fund’s net asset value is determined as set forth in the Prospectus under “General Information—Net Asset Value.”
SHARES OF BENEFICIAL INTEREST
The Board of Trustees of the Trust is authorized to issue an unlimited number of shares in one or more series, which may be divided into classes of shares. Currently, there are 18 series authorized and outstanding, each of which may be generally divided into different classes of shares designated as Class A shares, Class B shares, Class C shares, Class R3 shares and Class I shares. Each class of shares represents an interest in the same portfolio of investments of a Fund. Each class of shares has equal rights as to voting, redemption, dividends and liquidation, except that each bears different class expenses, including different distribution and service fees, and each has exclusive voting rights with respect to any distribution or service plan applicable to its shares. There are no conversion, preemptive or other subscription rights, except that Class B shares (available only in certain series and not available in the Funds) automatically convert into Class A shares. The Board of Trustees of the Trust has the right to establish additional series and classes of shares in the future, to change those series or classes and to determine the preferences, voting powers, rights and privileges thereof.
The Trust is not required and does not intend to hold annual meetings of shareholders. Shareholders owning more than 10% of the outstanding shares of a Fund have the right to call a special meeting to remove trustees or for any other purpose.
Under Massachusetts law applicable to Massachusetts business trusts, shareholders of such a trust may, under certain circumstances, be held personally liable as partners for its obligations. However, the Declaration of Trust of the Trust contains an express disclaimer of shareholder liability for acts or obligations of the Trust and requires that notice of this disclaimer be given in each agreement, obligation or instrument entered into or executed by the Trust or the trustees. The Trust’s Declaration of Trust further provides for indemnification out of the assets and property of the Trust for all losses and expenses of any shareholder held personally liable for the obligations of the Trust. Thus, the risk of a shareholder incurring financial loss on account of shareholder liability is limited to circumstances in which both inadequate insurance existed and the Trust or a Fund itself was unable to meet its obligations. The Trust believes the likelihood of the occurrence of these circumstances is remote.
S-45
As of January 3, 2013, Nuveen Investments owned a considerable portion of Nuveen Symphony International Equity Fund, Nuveen Symphony Mid-Cap Core Fund and Nuveen Symphony Optimized Alpha Fund and, accordingly, has controlled the Funds. A party that controls a Fund may be able to significantly influence the outcome of any item presented to shareholders for approval.
The following table sets forth the percentage ownership of each person, who, as of January 3, 2013, owned of record, or is known by the Trust to have owned of record or beneficially, 5% or more of any class of a Fund’s shares.
| | | | | | |
Name of Fund and Class | | Name and Address of Owner | | Percentage
of
Ownership | |
| | |
Nuveen Symphony International Equity Fund Class A Shares | | Nuveen Investments Inc Attn Darlene Cramer 333 W Wacker Dr Chicago IL 60606-1220 | | | 55.72% | |
| | |
| | American Enterprise Investment Serv 707 2nd Ave S Minneapolis MN 55402-2405 | | | 23.61% | |
| | |
| | Edward D Jones & Co Attn: Mutual Fund Shareholder Accounting 201 Progress Pkwy Maryland Hts MO 63043-3009 | | | 9.84% | |
| | |
| | Pershing LLC 1 Pershing Plz Jersey City NJ 07399-0001 | | | 7.55% | |
| | |
Nuveen Symphony International Equity Fund Class C Shares | | Nuveen Investments Inc Attn Darlene Cramer 333 W Wacker Dr Chicago IL 60606-1220 | | | 46.15% | |
| | |
| | MLPF&S for the Benefit of its Customers Attn Fund Admin / 4800 Deer Lake Dr E Fl 3 Jacksonville FL 32246-6484 | | | 37.08% | |
| | |
| | Joseph Cannizzaro 1465 San Juan Ct Clearwater FL 33756-6051 | | | 9.35% | |
| | |
| | Raymond James Omnibus for Mutual Funds House Acct Attn: Courtney Waller 880 Carillon Parkway St Petersburg FL 33716-1102 | | | 7.42% | |
| | |
Nuveen Symphony International Equity Fund Class R3 Shares | | Nuveen Investments Inc Attn Darlene Cramer 333 W Wacker Dr Chicago IL 60606-1220 | | | 100.00% | |
S-46
| | | | | | |
Name of Fund and Class | | Name and Address of Owner | | Percentage
of
Ownership | |
| | |
Nuveen Symphony International Equity Fund Class I Shares | | Capinco C/O US Bank PO Box 1787 Milwaukee WI 53201-1787 | | | 82.99% | |
| | |
| | Nuveen Investments Inc Attn Darlene Cramer 333 W Wacker Dr Chicago IL 60606-1220 | | | 11.40% | |
| | |
Nuveen Symphony Large-Cap Growth Fund Class A Shares | | American Enterprise Investment Serv 707 2nd Ave S Minneapolis MN 55402-2405 | | | 40.49% | |
| | |
| | Pershing LLC One Pershing Plaza Jersey City NJ 07399-0002 | | | 13.28% | |
| | |
| | LPL Financial FBO: Customer Accounts Attn: Mutual Fund Operations 9785 Towne Centre Drive San Diego CA 92121-1968 | | | 11.59% | |
| | |
| | Raymond James Omnibus for Mutual Funds House Acct Attn: Courtney Waller 880 Carillon Parkway St Petersburg FL 33716-1102 | | | 5.97% | |
| | |
| | First Clearing, LLC Special Custody Acct for the Exclusive Benefit of Customer 2801 Market Street St Louis MO 63103-2523 | | | 5.66% | |
| | |
Nuveen Symphony Large-Cap Growth Fund Class C Shares | | American Enterprise Investment Serv 707 2nd Ave S Minneapolis MN 55402-2405 | | | 22.32% | |
| | |
| | Raymond James Omnibus for Mutual Funds House Acct Attn: Courtney Waller 880 Carillon Parkway St Petersburg FL 33716-1102 | | | 20.51% | |
| | |
| | First Clearing, LLC Special Custody Acct for the Exclusive Benefit of Customer 2801 Market Street St Louis MO 63103-2523 | | | 16.21% | |
S-47
| | | | | | |
Name of Fund and Class | | Name and Address of Owner | | Percentage
of
Ownership | |
| | |
| | Pershing LLC One Pershing Plaza Jersey City NJ 07399-0002 | | | 14.19% | |
| | |
| | National Financial Services LLC For the Exclusive Benefit of our Customers Attn Mutual Fund Dept 4th Floor 499 Washington Blvd Jersey City NJ 07310-2010 | | | 9.21% | |
| | |
| | RBC Capital Markets LLC Mutual Fund Omnibus Processing Omnibus Attn Mutual Funds Ops Manager 510 Marquette Ave S Minneapolis MN 55402-1110 | | | 6.02% | |
| | |
Nuveen Symphony Large-Cap Growth Fund Class R3 Shares | | MG Trust Company Cust. FBO Hand Surgery Associates, P.C. 700 17th Street Suite 300 Denver CO 80202-3531 | | | 50.79% | |
| | |
| | FIIOC FBO Camco Employees Retirement Plan 100 Magellan Way (KWIC) Covington KY 41015-1987 | | | 11.20% | |
| | |
| | MG Trust Company Cust. FBO Tendril Networks, Inc. 401(k) Plan 700 17th Street Suite 300 Denver CO 80202-3531 | | | 11.16% | |
| | |
| | MG Trust Company Cust. FBO Hand Surgery of Colorado, LLC 700 17th Street Suite 300 Denver CO 80202-3531 | | | 7.49% | |
| | |
Nuveen Symphony Large-Cap Growth Fund Class I Shares | | Capinco C/O US Bank PO Box 1787 Milwaukee WI 53201-1787 | | | 27.53% | |
| | |
| | MLPF&S for the Benefit of its Customers Attn Fund Admin / 4800 Deer Lake Dr E Fl 3 Jacksonville FL 32246-6484 | | | 22.52% | |
S-48
| | | | | | |
Name of Fund and Class | | Name and Address of Owner | | Percentage
of
Ownership | |
| | |
| | National Financial Services LLC For the Exclusive Benefit of our Customers Attn Mutual Fund Dept 4th Floor 499 Washington Blvd Jersey City NJ 07310-2010 | | | 12.99% | |
| | |
| | LPL Financial FBO: Customer Accounts Attn: Mutual Fund Operations PO Box 509046 San Diego CA 92150-9046 | | | 9.89% | |
| | |
| | Raymond James Omnibus for Mutual Funds House Acct Attn: Courtney Waller 880 Carillon Parkway St Petersburg FL 33716-1102 | | | 8.32% | |
| | |
Nuveen Symphony Mid-Cap Core Fund Class A Shares | | American Enterprise Investment Serv 707 2nd Ave S Minneapolis MN 55402-2405 | | | 19.59% | |
| | |
| | LPL Financial 9785 Towne Centre Dr San Diego CA 92121-1968 | | | 14.57% | |
| | |
| | Edward D Jones & Co Attn: Mutual Fund Shareholder Accounting 201 Progress Pkwy Maryland Hts MO 63043-3009 | | | 12.69% | |
| | |
| | UBS Wm USA Attn Department Manger 499 Washington Blvd Fl 9 Jersey City NJ 07310-2055 | | | 12.07% | |
| | |
| | LPL Financial FBO: Customer Accounts Attn: Mutual Fund Operations 9785 Towne Centre Drive San Diego CA 92121-1968 | | | 10.13% | |
| | |
| | National Financial Services LLC For the Exclusive Benefit of our Customers Attn Mutual Fund Dept 4th Floor 499 Washington Blvd Jersey City NJ 07310-2010 | | | 5.07% | |
S-49
| | | | | | |
Name of Fund and Class | | Name and Address of Owner | | Percentage
of
Ownership | |
| | |
Nuveen Symphony Mid-Cap Core Fund Class C Shares | | Raymond James Omnibus for Mutual Funds House Acct Attn: Courtney Waller 880 Carillon Parkway St Petersburg FL 33716-1102 | | | 21.38% | |
| | |
| | Pershing LLC One Pershing Plaza Jersey City NJ 07399-0002 | | | 13.81% | |
| | |
| | American Enterprise Investment Serv 707 2nd Ave S Minneapolis MN 55402-2405 | | | 12.56% | |
| | |
| | First Clearing, LLC Special Custody Acct for the Exclusive Benefit of Customer 2801 Market Street St Louis MO 63103-2523 | | | 11.07% | |
| | |
| | Nuveen Investments Inc Attn Darlene Cramer 333 W Wacker Dr Chicago IL 60606-1220 | | | 8.75% | |
| | |
| | RBC Capital Markets LLC Mutual Fund Omnibus Processing Omnibus Attn Mutual Funds Ops Manager 510 Marquette Ave S Minneapolis MN 55402-1110 | | | 7.19% | |
| | |
Nuveen Symphony Mid-Cap Core Fund Class R3 Shares | | Nuveen Investments Inc Attn Darlene Cramer 333 W Wacker Dr Chicago IL 60606-1220 | | | 74.06% | |
| | |
| | Frontier Trust Company FBO Booth Associates 401k Plan P.O. Box 10758 Fargo ND 58106-0758 | | | 19.93% | |
| | |
Nuveen Symphony Mid-Cap Core Fund Class I Shares | | Nuveen Investments Inc Attn Darlene Cramer 333 W Wacker Dr Chicago IL 60606-1220 | | | 61.27% | |
| | |
| | Wells Fargo Bank FBO Various Retirement Plans 1525 West Wt Harris Blvd Charlotte NC 28288-1076 | | | 21.61% | |
S-50
| | | | | | |
Name of Fund and Class | | Name and Address of Owner | | Percentage
of
Ownership | |
| | |
| | LPL Financial FBO: Customer Accounts Attn: Mutual Fund Operations 9785 Towne Centre Drive San Diego CA 92121-1968 | | | 5.19% | |
| | |
Nuveen Symphony Optimized Alpha Fund Class A Shares | | MLPF&S for the Benefit of its Customers Attn Fund Admin / 4800 Deer Lake Dr E Fl 3 Jacksonville FL 32246-6484 | | | 50.80% | |
| | |
| | Pershing LLC One Pershing Plaza Jersey City NJ 07399-0002 | | | 14.49% | |
| | |
| | American Enterprise Investment Serv 707 2nd Ave S Minneapolis MN 55402-2405 | | | 13.17% | |
| | |
| | National Financial Services LLC For the Exclusive Benefit of our Customers Attn Mutual Fund Dept 4th Floor 499 Washington Blvd Jersey City NJ 07310-2010 | | | 10.72% | |
| | |
Nuveen Symphony Optimized Alpha Fund Class C Shares | | Raymond James Omnibus for Mutual Funds House Acct Attn: Courtney Waller 880 Carillon Parkway St Petersburg FL 33716-1102 | | | 23.80% | |
| | |
| | Nuveen Investments Inc Attn Darlene Cramer 333 W Wacker Dr Chicago IL 60606-1220 | | | 19.56% | |
| | |
| | MLPF&S for the Benefit of its Customers Attn Fund Admin / 4800 Deer Lake Dr E Fl 3 Jacksonville FL 32246-6484 | | | 15.21% | |
| | |
| | Pershing LLC One Pershing Plaza Jersey City NJ 07399-0002 | | | 15.08% | |
| | |
| | Edward D Jones & Co Attn: Mutual Fund Shareholder Accounting 201 Progress Pkwy Maryland Hts MO 63043-3009 | | | 8.81% | |
S-51
| | | | | | |
Name of Fund and Class | | Name and Address of Owner | | Percentage
of
Ownership | |
| | |
| | LPL Financial 9785 Towne Centre Dr San Diego CA 92121-1968 | | | 8.26% | |
| | |
Nuveen Symphony Optimized Alpha Fund Class I Shares | | Nuveen Investments Inc Attn Darlene Cramer 333 W Wacker Dr Chicago IL 60606-1220 | | | 39.17% | |
| | |
| | Wells Fargo Bank FBO Various Retirement Plans 1525 West Wt Harris Blvd Charlotte NC 28288-1076 | | | 24.58% | |
| | |
| | First Clearing, LLC Special Custody Acct for the Exclusive Benefit of Customer 2801 Market Street St Louis MO 63103-2523 | | | 13.93% | |
| | |
| | Nuveen Investments Inc Attn Darlene Cramer 333 W Wacker Dr Chicago IL 60606-1220 | | | 11.58% | |
TAX MATTERS
Federal Income Tax Matters
This section summarizes some of the main U.S. federal income tax consequences of owning shares of a Fund. This section is current as of the date of this SAI. Tax laws and interpretations change frequently, and this summary does not describe all of the tax consequences to all taxpayers. For example, this summary generally does not describe your situation if you are a corporation, a non-U.S. person, a broker-dealer or other investor with special circumstances, or if you are investing through a tax-deferred account, such as an IRA or 401(k) plan. In addition, this section does not describe your state, local or non-U.S. tax consequences. This federal income tax summary is based in part on the advice of counsel to the Funds. The Internal Revenue Service could disagree with any conclusions set forth in this section. In addition, Funds’ counsel was not asked to review, and has not reached a conclusion with respect to the federal income tax treatment of the assets to be deposited in the Funds. Consequently, this summary may not be sufficient for you to use for the purpose of avoiding penalties under federal tax law. As with any investment, you should seek advice based on your individual circumstances from your own tax professional.
Fund Status
Each Fund intends to qualify as a “regulated investment company” under the federal tax laws. If a Fund qualifies as a regulated investment company and distributes its income as required by the tax law, the Fund generally will not pay federal income taxes. If a Fund fails for any taxable year to qualify as a regulated investment company for federal income tax purposes, the Fund itself will generally be subject to federal income taxation (which will reduce the amount of Fund income available for distribution) and your tax consequences will be different from those described in this section (for example, all distributions to you will generally be taxed as ordinary income, even if those distributions are derived from capital gains realized by a Fund).
S-52
Qualification as a Regulated Investment Company
As a regulated investment company, a Fund generally will not be subject to federal income tax on the portion of its investment company taxable income (as that term is defined in the Code, but without regard to the deduction for dividends paid) and net capital gain (i.e., the excess of net long-term capital gain over net short-term capital loss), that it distributes to shareholders, provided that it distributes at least 90% of its investment company taxable income and 90% of its net tax-exempt interest income for the year (the “Distribution Requirement”) and satisfies certain other requirements of the Code that are described below. Each Fund also intends to make such distributions as are necessary to avoid the otherwise applicable 4% non-deductible excise tax on certain undistributed earnings.
In addition to satisfying the Distribution Requirement, each Fund must, among other things, derive in each taxable year at least 90% of its gross income from (1) dividends, interest, certain payments with respect to securities loans, gains from the sale or disposition of stock, securities or non-U.S. currencies and other income (including but not limited to gains from options, futures or forward contracts) derived with respect to its business of investing in such stock, securities or currencies, and (2) net income derived from an interest in “qualified publicly traded partnerships” (as such term is defined in the Code). Each Fund must also satisfy an asset diversification test in order to qualify as a regulated investment company. Under this test, at the close of each quarter of a Fund’s taxable year, (1) 50% or more of the value of the Fund’s assets must be represented by cash and cash items (including receivables), United States government securities, securities of other regulated investment companies, and other securities, with such other securities limited, in respect of any one issuer, to an amount not greater than 5% of the value of the Fund’s assets and 10% of the outstanding voting securities of such issuer and (2) not more than 25% of the value of the Fund’s assets may be invested in securities of (a) any one issuer (other than U.S. government securities or securities of other regulated investment companies), or of two or more issuers which the Fund controls and which are engaged in the same, similar or related trades or businesses or (b) in the securities of one or more “qualified publicly traded partnerships” (as such term is defined in the Code). There are certain exceptions for failure to qualify if the failure is for reasonable cause or is de minimis and certain corrective action is taken and certain tax payments are made by a Fund.
Distributions
Fund distributions are generally taxable. After the end of each year, you will receive a tax statement that separates your Fund’s distributions into three categories, ordinary income distributions, capital gains dividends and returns of capital. Ordinary income distributions are generally taxed at your ordinary tax rate, however, as further discussed below, certain ordinary income distributions received from the Fund may be taxed at the capital gains tax rates. Generally, you will treat all capital gains dividends as long-term capital gains regardless of how long you have owned your shares. To determine your actual tax liability for your capital gains dividends, you must calculate your total net capital gain or loss for the tax year after considering all of your other taxable transactions, as described below. In addition, a Fund may make distributions that represent a return of capital for tax purposes and thus will generally not be taxable to you. The tax status of your distributions from your Fund is not affected by whether you reinvest your distributions in additional shares or receive them in cash. The income from your Fund that you must take into account for federal income tax purposes is not reduced by amounts used to pay a deferred sales fee, if any. The tax laws may require you to treat distributions made to you in January as if you had received them on December 31 of the previous year. Under the “Health Care and Education Reconciliation Act of 2010,” income from the Fund may also be subject to a new 3.8 percent “medicare tax” imposed for taxable years beginning after 2012. This tax will generally apply to your net investment income if your adjusted gross income exceeds certain threshold amounts, which are $250,000 in the case of married couples filing joint returns and $200,000 in the case of single individuals.
Dividends Received Deduction
A corporation that owns shares generally will not be entitled to the dividends received deduction with respect to many dividends received from the Funds, because the dividends received deduction is generally not available for distributions from regulated investment companies. However, certain
S-53
ordinary income dividends on shares that are attributable to qualifying dividends received by a Fund from certain corporations may be reported by the Fund as being eligible for the dividends received deduction.
If You Sell or Redeem Shares
If you sell or redeem your shares, you will generally recognize a taxable gain or loss. To determine the amount of this gain or loss, you must subtract your tax basis in your shares from the amount you receive in the transaction. Your tax basis in your shares is generally equal to the cost of your shares, generally including sales charges. In some cases, however, you may have to adjust your tax basis after you purchase your shares.
Taxation of Capital Gains and Losses
If you are an individual, the maximum marginal federal tax rate for net capital gain is generally 20% for taxpayers in the 39.6% tax bracket, 15% for taxpayers in the 25%, 28%, 33% and 35% tax brackets and 0% for taxpayers in the 10% and 15% tax brackets.
Net capital gain equals net long-term capital gain minus net short-term capital loss for the taxable year. Capital gain or loss is long-term if the holding period for the asset is more than one year and is short-term if the holding period for the asset is one year or less. You must exclude the date you purchase your shares to determine your holding period. However, if you receive a capital gain dividend from your Fund and sell your share at a loss after holding it for six months or less, the loss will be recharacterized as long-term capital loss to the extent of the capital gain dividend received. The tax rates for capital gains realized from assets held for one year or less are generally the same as for ordinary income. The Code treats certain capital gains as ordinary income in special situations.
Taxation of Certain Ordinary Income Dividends
Ordinary income dividends received by an individual shareholder from a regulated investment company such as the Fund are generally taxed at the same rates that apply to net capital gain (as discussed above), provided certain holding period requirements are satisfied and provided the dividends are attributable to qualifying dividends received by the Fund itself. The Fund will provide notice to its shareholders of the amount of any distribution which may be taken into account as a dividend which is eligible for the capital gains tax rates.
In-Kind Distributions
Under certain circumstances, as described in the Prospectus, you may receive an in-kind distribution of Fund securities when you redeem shares or when your Fund terminates. This distribution will be treated as a sale for federal income tax purposes and you will generally recognize gain or loss, generally based on the value at that time of the securities and the amount of cash received. The Internal Revenue Service could, however, assert that a loss may not be currently deducted.
Exchanges
If you exchange shares of a Fund for shares of another Nuveen Mutual Fund, the exchange would generally be considered a sale for federal income tax purposes.
Deductibility of Fund Expenses
Expenses incurred and deducted by your Fund will generally not be treated as income taxable to you. In some cases, however, you may be required to treat your portion of these Fund expenses as income. In these cases you may be able to take a deduction for these expenses. However, certain miscellaneous itemized deductions, such as investment expenses, may be deducted by individuals only to the extent that all of these deductions exceed 2% of the individual’s adjusted gross income. Some individuals may also be subject to further limitations on the amount of their itemized deductions, depending on their income.
Non-U.S. Tax Credit
If your Fund invests in any non-U.S. securities, the tax statement that you receive may include an item showing non-U.S. taxes your Fund paid to other countries. In this case, dividends taxed to you will include your share of the taxes your Fund paid to other countries. You may be able to deduct or receive a tax credit for your share of these taxes.
S-54
Investments in Certain Non-U.S. Corporations
If your Fund holds an equity interest in any “passive foreign investment companies” (“PFICs”), which are generally certain foreign corporations that receive at least 75% of their annual gross income from passive sources (such as interest, dividends, certain rents and royalties or capital gains) or that hold at least 50% of their assets in investments producing such passive income, the Fund could be subject to U.S. federal income tax and additional interest charges on gains and certain distributions with respect to those equity interests, even if all the income or gain is timely distributed to its shareholders. The Fund will not be able to pass through to its shareholders any credit or deduction for such taxes. The Fund may be able to make an election that could ameliorate these adverse tax consequences. In this case, the Fund would recognize as ordinary income any increase in the value of such PFIC shares, and as ordinary loss any decrease in such value to the extent it did not exceed prior increases included in income. Under this election, the Fund might be required to recognize in a year income in excess of its distributions from PFICs and its proceeds from dispositions of PFIC stock during that year, and such income would nevertheless be subject to the distribution requirement and would be taken into account for purposes of the 4% excise tax. Dividends paid by PFICs will not be treated as qualified dividend income.
Non-U.S. Investors
If you are a non-U.S. investor (i.e., an investor other than a U.S. citizen or resident or a U.S. corporation, partnership, estate or trust), you should be aware that, generally, subject to applicable tax treaties, distributions from a Fund will be characterized as dividends for federal income tax purposes (other than dividends which a Fund properly reports as capital gain dividends) and will be subject to U.S. income taxes, including withholding taxes, subject to certain exceptions described below. However, distributions received by a non-U.S. investor from a Fund that are properly reported by a Fund as capital gain dividends may not be subject to U.S. federal income taxes, including withholding taxes, provided that a Fund makes certain elections and certain other conditions are met. In the case of dividends with respect to taxable years of the Fund beginning prior to 2014, distributions from the Fund that are properly reported by the Fund as an interest-related dividend attributable to certain interest income received by the Fund or as a short-term capital gain dividend attributable to certain net short-term capital gain income received by the Fund may not be subject to U.S. federal income taxes, including withholding taxes when received by certain foreign investors, provided that the Fund makes certain elections and certain other conditions are met. In addition, distributions in respect of shares after December 31, 2013 may be subject to a U.S. withholding tax of 30% in the case of distributions to (i) certain non-U.S. financial institutions that have not entered into an agreement with the U.S. Treasury to collect and disclose certain information and are not resident in a jurisdiction that has entered into such an agreement with the U.S. Treasury and (ii) certain other non-U.S. entities that do not provide certain certifications and information about the entity’s U.S. owners. Dispositions of interest in the Funds by such persons may be subject to such withholding after December 31, 2016.
PURCHASE AND REDEMPTION OF FUND SHARES
As described in the Prospectus, the Funds provide you with alternative ways of purchasing Fund shares based upon your individual investment needs and preferences.
Each class of shares of a Fund represents an interest in the same portfolio of investments. Each class of shares is identical in all respects except that each class bears its own class expenses, including distribution and administration expenses, and each class has exclusive voting rights with respect to any distribution or service plan applicable to its shares. As a result of the differences in the expenses borne by each class of shares, net income per share, dividends per share and net asset value per share will vary among a Fund’s classes of shares. There are no conversion, preemptive or other subscription rights.
Shareholders of each class will share expenses proportionately for services that are received equally by all shareholders. A particular class of shares will bear only those expenses that are directly attributable to that class, where the type or amount of services received by a class varies from one class to another. For example, class-specific expenses generally will include distribution and service fees for those classes that pay such fees.
S-55
The expenses to be borne by specific classes of shares may include (i) transfer agency fees attributable to a specific class of shares, (ii) printing and postage expenses related to preparing and distributing materials such as shareholder reports, prospectuses and proxy statements to current shareholders of a specific class of shares, (iii) SEC and state securities registration fees incurred by a specific class of shares, (iv) the expense of administrative personnel and services required to support the shareholders of a specific class of shares, (v) litigation or other legal expenses relating to a specific class of shares, (vi) trustees’ fees or expenses incurred as a result of issues relating to a specific class of shares, (vii) accounting expenses relating to a specific class of shares and (viii) any additional incremental expenses subsequently identified and determined to be properly allocated to one or more classes of shares.
Class A Shares
Class A shares may be purchased at a public offering price equal to the applicable net asset value per share plus an up-front sales charge imposed at the time of purchase as set forth in the Prospectus. Shareholders may qualify for a reduced sales charge, or the sales charge may be waived in its entirety, as described below. Class A shares are also subject to an annual service fee of 0.25%. See “Distribution and Service Plan.” Set forth below is an example of the method of computing the offering price of the Class A shares of each of the Funds. The example assumes a purchase on September 30, 2012 of Class A shares of a Fund aggregating less than $50,000 subject to the schedule of sales charges set forth in the Prospectus at a price based upon the net asset value of the Class A shares.
| | | | | | | | | | | | | | | | |
| | | Nuveen
Symphony
International
Equity Fund | | | Nuveen
Symphony
Large-Cap
Growth Fund | | | Nuveen
Symphony
Mid-Cap
Core Fund | | | Nuveen
Symphony
Optimized
Alpha Fund | |
| Net Asset Value per share | | $ | 14.97 | | | $ | 25.19 | | | $ | 25.06 | | | $ | 22.43 | |
| Per Share Sales Charge—5.75% of public offering price (6.08%, 6.11%, 6.11% and 6.11%, respectively, of net asset value per share) | | | 0.91 | | | | 1.54 | | | | 1.53 | | | | 1.37 | |
| | | | | | | | | | | | | | | | |
| Per Share Offering Price to the Public | | $ | 15.88 | | | $ | 26.73 | | | $ | 26.59 | | | $ | 23.80 | |
| | | | | | | | | | | | | | | | |
Each Fund receives the entire net asset value of all Class A shares that are sold. The Distributor retains the full applicable sales charge from which it pays the uniform reallowances shown in the Prospectus to financial intermediaries.
Reduction or Elimination of Up-Front Sales Charge on Class A Shares
Rights of Accumulation. You may qualify for a reduced sales charge on a purchase of Class A shares of a Fund if the amount of your purchase, when added to the value that day of all of your shares of any Nuveen Mutual Fund, falls within the amounts stated in the Class A Sales Charges and Commissions table in “How You Can Buy and Sell Shares” in the Prospectus. You or your financial advisor must notify the Distributor or the Fund’s transfer agent of any cumulative discount whenever you plan to purchase Class A shares of a Fund that you wish to qualify for a reduced sales charge.
Letter of Intent. You may qualify for a reduced sales charge on a purchase of Class A shares of a Fund if you plan to purchase Class A shares of Nuveen Mutual Funds over the next 13 months and the total amount of your purchases would, if purchased at one time, qualify you for one of the reduced sales charges shown in the Class A Sales Charges and Commissions table in “How You Can Buy and Sell Shares” in the Prospectus. In order to take advantage of this option, you must complete the applicable section of the Application Form or sign and deliver to your financial advisor or other financial intermediary or to the Fund’s transfer agent a written Letter of Intent in a form acceptable to the Distributor. A Letter of Intent states that you intend, but are not obligated, to purchase over the next 13 months a stated total amount of Class A shares that would qualify you for a reduced sales charge shown above. You may count shares of all Nuveen Mutual Funds that you already own and any Class C and Class I shares of a Nuveen Mutual Fund that you purchase over the next 13 months towards completion of your investment program, but you will receive a reduced sales charge only on new Class A shares you purchase with a sales charge over the 13 months. You cannot count towards
S-56
completion of your investment program Class A shares that you purchase without a sales charge through investment of distributions from a Nuveen Mutual Fund or a Nuveen Defined Portfolio, or otherwise.
By establishing a Letter of Intent, you agree that your first purchase of Class A shares of a Fund following execution of the Letter of Intent will be at least 5% of the total amount of your intended purchases. You further agree that shares representing 5% of the total amount of your intended purchases will be held in escrow pending completion of these purchases. All dividends and capital gains distributions on Class A shares held in escrow will be credited to your account. If total purchases, less redemptions, prior to the expiration of the 13 month period equal or exceed the amount specified in your Letter of Intent, the Class A shares held in escrow will be transferred to your account. If the total purchases, less redemptions, are less than the amount specified, you must pay the Distributor an amount equal to the difference between the amounts paid for these purchases and the amounts which would have been paid if the higher sales charge had been applied. If you do not pay the additional amount within 20 days after written request by the Distributor or your financial advisor, the Distributor will redeem an appropriate number of your escrowed Class A shares to meet the required payment. By establishing a Letter of Intent, you irrevocably appoint the Distributor as attorney to give instructions to redeem any or all of your escrowed shares, with full power of substitution in the premises.
You or your financial advisor must notify the Distributor or the Funds’ transfer agent whenever you make a purchase of Fund shares that you wish to be covered under the Letter of Intent option.
For purposes of determining whether you qualify for a reduced sales charge as described under Rights of Accumulation and Letter of Intent, you may include together with your own purchases those made by your spouse or domestic partner and your children under the age of 21 years, whether these purchases are made through a taxable or non-taxable account. You may also include purchases made by a corporation, partnership or sole proprietorship which is 100% owned, either alone or in combination, by any of the foregoing. In addition, a trustee or other fiduciary can count all shares purchased for a single trust, estate or other single fiduciary account that has multiple accounts (including one or more employee benefit plans of the same employer).
Elimination of Sales Charge on Class A Shares. Class A shares of a Fund may be purchased at net asset value without a sales charge by the following categories of investors:
| | • | | investors purchasing $1,000,000 or more; |
| | • | | current and former trustees/directors of the Nuveen Funds; |
| | • | | full-time and retired employees and directors of Nuveen Investments, and subsidiaries thereof, or their immediate family members (immediate family members are defined as their spouses or domestic partners, parents, children, grandparents, grandchildren, parents-in-law, sons-in-law and daughters-in-law, siblings, a sibling’s spouse and a spouse’s siblings); |
| | • | | any person who, for at least the last 90 days, has been an officer, director or employee of any financial intermediary, or their immediate family members; |
| | • | | bank or broker-affiliated trust departments investing funds over which they exercise exclusive discretionary investment authority and that are held in a fiduciary, agency, advisory, custodial or similar capacity; |
| | • | | investors purchasing on a periodic fee, asset-based fee or no transaction fee basis through a broker-dealer sponsored mutual fund purchase program; |
| | • | | clients of investment advisers, financial planners or other financial intermediaries that charge periodic or asset-based fees for their services; |
| | • | | employer-sponsored retirement plans except SEPs, SAR-SEPs, SIMPLE IRAs and KEOGH plans; and |
| | • | | investors purchasing through a financial intermediary that has entered into an agreement with the Distributor to offer the Funds’ shares to self-directed investment brokerage accounts and that may or may not charge a transaction fee to its customers. |
S-57
Any Class A shares purchased pursuant to a special sales charge waiver must be acquired for investment purposes and on the condition that they will not be transferred or resold except through redemption by the Funds. You or your financial advisor must notify the Distributor or your Fund’s transfer agent whenever you make a purchase of Class A shares of any Fund that you wish to be covered under these special sales charge waivers.
Class A shares of any Fund may be issued at net asset value without a sales charge in connection with the acquisition by a Fund of another investment company. All purchases under the special sales charge waivers will be subject to minimum purchase requirements as established by the Funds.
The reduced sales charge programs may be modified or discontinued by the Funds at any time. For more information about the purchase of Class A shares or the reduced sales charge program, or to obtain the required application forms, call Nuveen Investor Services toll-free at (800) 257-8787.
Class C Shares
You may purchase Class C shares at a public offering price equal to the applicable net asset value per share without any up-front sales charge. Class C shares are subject to an annual distribution fee of 0.75% to compensate the Distributor for paying your financial advisor or other financial intermediary an ongoing sales commission. Class C shares are also subject to an annual service fee of 0.25% to compensate financial intermediaries for providing you with ongoing financial advice and other account services. The Distributor compensates financial intermediaries for sales of Class C shares at the time of the sale at a rate of 1% of the amount of Class C shares purchased, which represents an advance of the first year’s distribution fee of 0.75% plus an advance on the first year’s annual service fee of 0.25%. See “Distribution and Service Plan.”
Class C share purchase orders equaling or exceeding $1,000,000 will not be accepted. In addition, purchase orders for a single purchaser that, when added to the value that day of all of such purchaser’s shares of any class of any Nuveen Mutual Fund, cause the purchaser’s cumulative total of shares in Nuveen Mutual Funds to equal or exceed the aforementioned limit will not be accepted. Purchase orders for a single purchaser equal to or exceeding the foregoing limit should be placed only for Class A shares, unless such purchase has been reviewed and approved as suitable for the client by the appropriate compliance personnel of the financial intermediary, and the Fund receives written confirmation of such approval.
Redemption of Class C shares within 12 months of purchase may be subject to a contingent deferred sales charge (“CDSC”) of 1% of the lower of the purchase price or redemption proceeds. Because Class C shares do not convert to Class A shares and continue to pay an annual distribution fee indefinitely, Class C shares should normally not be purchased by an investor who expects to hold shares for significantly longer than eight years.
Reduction or Elimination of Contingent Deferred Sales Charge
Class A shares are normally redeemed at net asset value, without any CDSC. However, in the case of Class A shares purchased at net asset value without a sales charge because the purchase amount exceeded $1 million, a CDSC is imposed on any redemption within 12 months of purchase. Class C shares are redeemed at net asset value, without any CDSC, except that a CDSC of 1% is imposed upon any redemption within 12 months of purchase (except in cases where a shareholder is eligible for a waiver).
In determining whether a CDSC is payable, each Fund will first redeem shares not subject to any charge and then will redeem shares held for the longest period, unless the shareholder specifies another order. No CDSC is charged on shares purchased as a result of automatic reinvestment of dividends or capital gains paid. In addition, no CDSC will be charged on exchanges of shares into another Nuveen Mutual Fund. The holding period is calculated on a monthly basis and begins on the first day of the month in which the purchase was made. The CDSC is assessed on an amount equal to the lower of the then current market value or the cost of the shares being redeemed. Accordingly, no sales charge is imposed on increases of net asset value above the initial purchase price. The Distributor receives the amount of any CDSC shareholders pay.
S-58
The CDSC may be waived or reduced under the following circumstances: (i) in the event of total disability (as evidenced by a determination by the federal Social Security Administration) of the shareholder (including a registered joint owner) occurring after the purchase of the shares being redeemed; (ii) in the event of the death of the shareholder (including a registered joint owner); (iii) for redemptions made pursuant to a systematic withdrawal plan, up to 1% monthly, 3% quarterly, 6% semiannually or 12% annually of an account’s net asset value depending on the frequency of the plan as designated by the shareholder; (iv) involuntary redemptions caused by operation of law; (v) redemptions in connection with a payment of account or plan fees; (vi) redemptions in connection with the exercise of a reinstatement privilege whereby the proceeds of a redemption of a Fund’s shares subject to a sales charge are reinvested in shares of certain Funds within a specified number of days; (vii) redemptions in connection with the exercise of a Fund’s right to redeem all shares in an account that does not maintain a certain minimum balance or that the Board of Trustees has determined may have material adverse consequences to the shareholders of a Fund; (viii) in whole or in part for redemptions of shares by shareholders with accounts in excess of specified breakpoints that correspond to the breakpoints under which the up-front sales charge on Class A shares is reduced pursuant to Rule 22d-1 under the Act; (ix) redemptions of shares purchased under circumstances or by a category of investors for which Class A shares could be purchased at net asset value without a sales charge; (x) redemptions of Class A or Class C shares if the proceeds are transferred to an account managed by the Adviser and the Adviser refunds the advanced service and distribution fees to the Distributor; (xi) redemptions of Class C shares in cases where the Distributor did not advance the first year’s service and distribution fees when such shares were purchased; and (xii) redemptions of Class A shares where the Distributor did not pay a sales commission when such shares were purchased. If a Fund waives or reduces the CDSC, such waiver or reduction would be uniformly applied to all Fund shares in the particular category. In waiving or reducing a CDSC, the Funds will comply with the requirements of Rule 22d-1 under the 1940 Act.
In addition, the CDSC will be waived in connection with the following redemptions of shares held by an employer-sponsored qualified defined contribution retirement plan: (i) partial or complete redemptions in connection with a distribution without penalty under Section 72(t) of the Code from a retirement plan: (a) upon attaining age 59 1/2, (b) as part of a series of substantially equal periodic payments, or (c) upon separation from service and attaining age 55; (ii) partial or complete redemptions in connection with a qualifying loan or hardship withdrawal; (iii) complete redemptions in connection with termination of employment, plan termination or transfer to another employer’s plan or IRA; and (iv) redemptions resulting from the return of an excess contribution. The CDSC will also be waived in connection with the following redemptions of shares held in an IRA account: (i) for redemptions made pursuant to an IRA systematic withdrawal based on the shareholder’s life expectancy including, but not limited to, substantially equal periodic payments described in Code Section 72(t)(A)(iv) prior to age 59 1/2; and (ii) for redemptions to satisfy required minimum distributions after age 70 1/2 from an IRA account (with the maximum amount subject to this waiver being based only upon the shareholder’s Nuveen IRA accounts).
Class R3 Shares
Class R3 shares are available for purchase at the offering price, which is the net asset value per share without any up-front sales charge. Class R3 shares are subject to annual distribution and service fees of 0.50% of the Funds’ average daily net assets. The annual 0.25% service fee compensates your financial advisor or other financial intermediary for providing ongoing service to you. The annual 0.25% distribution fee compensates the Distributor for paying your financial advisor or other financial intermediary an ongoing sales commission.
Class R3 shares are only available for purchase by eligible retirement plans. Eligible retirement plans include, but are not limited to, 401(k) plans, 457 plans, employer-sponsored 403(b) plans, profit sharing and money purchase pension plans, defined benefit plans, non-qualified deferred compensation plans and health care benefit funding plans. In addition, Class R3 shares are available only to retirement plans where Class R3 shares are held on the books of the Funds through omnibus accounts (either at the retirement plan level or at the level of the retirement plan’s financial intermediary). Class R3 shares are not available to traditional and Roth IRAs, Coverdell Education Savings Accounts, SEPs, SAR-SEPs, SIMPLE IRAs or individual 403(b) plans.
S-59
The administrator of a retirement plan or employee benefits office can provide plan participants with detailed information on how to participate in the retirement plan and how to elect a Fund as an investment option. Retirement plan participants may be permitted to elect different investment options, alter the amounts contributed to the retirement plan, or change how contributions are allocated among investment options in accordance with the retirement plan’s specific provisions. The retirement plan administrator or employee benefits office should be consulted for details. For questions about their accounts, participants should contact their employee benefits office, the retirement plan administrator, or the organization that provides recordkeeping services for the retirement plan.
Eligible retirement plans may open an account and purchase Class R3 shares directly from the Funds or by contacting any financial intermediary authorized to sell Class R3 shares of the Funds. Financial intermediaries may provide or arrange for the provision of some or all of the shareholder servicing and account maintenance services required by retirement plan accounts and their retirement plan participants, including, without limitation, transfers of registration and dividend payee changes.
Financial intermediaries may also perform other functions, including generating confirmation statements, and may arrange with retirement plan administrators for other investment or administrative services. Financial intermediaries may independently establish and charge retirement plans and retirement plan participants transaction fees and/or other additional amounts for such services, which may change over time. Similarly, retirement plans may charge retirement plan participants for certain expenses. These fees and additional amounts could reduce investment returns in Class R3 shares of the Funds.
Financial intermediaries and retirement plans may have omnibus accounts and similar arrangements with a Fund and may be paid for providing shareholder servicing and other services. A financial intermediary or retirement plan may be paid for its services directly or indirectly by the Funds or the Distributor. The Distributor may pay a financial intermediary an additional amount for sub-transfer agency or other administrative services. Such sub-transfer agency or other administrative services may include, but are not limited to, the following: processing and mailing trade confirmations, monthly statements, prospectuses, annual reports, semiannual reports and shareholder notices and other required communications; capturing and processing tax data; issuing and mailing dividend checks to shareholders who have selected cash distributions; preparing record date shareholder lists for proxy solicitations; collecting and posting distributions to shareholder accounts; and establishing and maintaining systematic withdrawals, automated investment plans and shareholder account registrations. Your retirement plan may establish various minimum investment requirements for Class R3 shares of the Funds and may also establish certain privileges with respect to purchases, redemptions and exchanges of Class R3 shares or the reinvestment of dividends. Retirement plan participants should contact their retirement plan administrator with respect to these issues. This SAI should be read in conjunction with the retirement plan’s and/or the financial intermediary’s materials regarding their fees and services.
Class I Shares
Class I shares are available for purchase by clients of financial intermediaries who charge such clients an ongoing fee for advisory, investment, consulting or related services. Such clients may include individuals, corporations, endowments and foundations. The minimum initial investment for such clients is $100,000, but this minimum will be lowered to $250 for clients of financial intermediaries that have accounts holding Class I shares with an aggregate value of at least $100,000. The Distributor may also lower the minimum to $250 for clients of financial intermediaries anticipated to reach this Class I share holdings level.
Class I shares are also available for purchase by family offices and their clients. A family office is a company that provides certain financial and other services to a high net worth family or families. The minimum initial investment for family offices and their clients is $100,000, but this minimum will be lowered to $250 for clients of family offices that have accounts holding Class I shares with an aggregate value of at least $100,000. The Distributor may also lower the minimum to $250 for clients of family offices anticipated to reach this Class I share holdings level.
S-60
Class I shares also are available for purchase, with no minimum initial investment, by the following categories of investors:
| | • | | employer-sponsored retirement plans, except SEPs, SAR-SEPs, SIMPLE IRAs and KEOGH plans; |
| | • | | bank or broker-affiliated trust departments investing funds over which they exercise exclusive discretionary investment authority and that are held in a fiduciary, agency, advisory, custodial or similar capacity; |
| | • | | advisory accounts of Nuveen Fund Advisors and its affiliates, including other Nuveen Mutual Funds whose investment policies permit investments in other investment companies; |
| | • | | any registered investment company that is not affiliated with the Nuveen Funds and which invests in securities of other investment companies; |
| | • | | any plan organized under section 529 under the Code (i.e., a 529 plan); |
| | • | | current and former trustees/directors of any Nuveen Fund, and their immediate family members (“immediate family members” are defined as spouses or domestic partners, parents, children, grandparents, grandchildren, parents-in-law, sons-in-law and daughters-in-law, siblings, a sibling’s spouse and a spouse’s siblings); |
| | • | | officers, directors and former directors of Nuveen Investments and its affiliates, and their immediate family members; |
| | • | | full-time and retired employees of Nuveen Investments and its affiliates, and their immediate family members; and |
| | • | | any person who, for at least the last 90 days, has been an officer, director or employee of any financial intermediary, and their immediate family members. |
Any shares purchased by investors falling within any of the last four categories listed above must be acquired for investment purposes and on the condition that they will not be transferred or resold except through redemption by a Fund.
Holders of Class I shares may purchase additional Class I shares using dividends and capital gains distributions on their shares.
If you are eligible to purchase either Class I shares or Class A shares without a sales charge at net asset value, you should be aware of the differences between these two classes of shares. Class A shares are subject to an annual service fee to compensate financial intermediaries for providing you with ongoing account services. Class I shares are not subject to a distribution or service fee and, consequently, holders of Class I shares may not receive the same types or levels of services from financial intermediaries. In choosing between Class A shares and Class I shares, you should weigh the benefits of the services to be provided by financial intermediaries against the annual service fee imposed upon the Class A shares.
Shareholder Programs
Exchange Privilege
You may exchange Fund shares into an identically registered account for the same class of another Nuveen Mutual Fund available in your state. Your exchange must meet the minimum purchase requirements of the fund into which you are exchanging. You may also, under certain limited circumstances, exchange between certain classes of shares of the same Fund. An exchange between classes of shares of the same Fund may not be considered a taxable event; please consult your own tax advisor for further information.
If you hold your shares directly with the Fund, you may exchange your shares by either sending a written request to the applicable Fund, c/o Nuveen Investor Services, P.O. Box 8530, Boston, Massachusetts 02266-8530 or by calling Nuveen Investor Services toll free at (800) 257-8787.
If you exchange shares between different Nuveen Mutual Funds and your shares are subject to a CDSC, no CDSC will be charged at the time of the exchange. However, if you subsequently redeem the shares acquired through the exchange, the redemption may be subject to a CDSC, depending on when you purchased your original shares and the CDSC schedule of the fund from which you
S-61
exchanged your shares. If you exchange between classes of shares of the same Fund and your original shares are subject to a CDSC, the CDSC will be assessed at the time of the exchange.
For federal income tax purposes, an exchange between different Nuveen Mutual Funds constitutes a sale and purchase of shares and may result in capital gain or loss. Before making any exchange, you should obtain the Prospectus for the Nuveen Mutual Fund you are purchasing and read it carefully. If the registration of the account for the Fund you are purchasing is not exactly the same as that of the fund account from which the exchange is made, written instructions from all holders of the account from which the exchange is being made must be received, with signatures guaranteed by a member of an approved Medallion Signature Guarantee Program or in such other manner as may be acceptable to the Fund. You may also exchange shares by telephone if you authorize telephone exchanges by checking the applicable box on the Application Form or by calling Nuveen Investor Services toll-free at (800) 257-8787 to obtain an authorization form. Each Fund reserves the right to revise or suspend the exchange privilege, limit the amount or number of exchanges, or reject any exchange. Shareholders will be provided with at least 60 days’ notice of any material revision to or termination of the exchange privilege.
The exchange privilege is not intended to permit a Fund to be used as a vehicle for short-term trading. Excessive exchange activity may interfere with portfolio management, raise expenses and otherwise have an adverse effect on all shareholders. In order to limit excessive exchange activity and in other circumstances where Fund management believes doing so would be in the best interest of the Fund, each Fund reserves the right to revise or terminate the exchange privilege, or limit the amount or number of exchanges or reject any exchange. Shareholders would be notified of any such action to the extent required by law. See “Frequent Trading Policy” below.
Reinstatement Privilege
If you redeemed Class A or Class C shares of a Fund or any other Nuveen Mutual Fund that were subject to a sales charge or a CDSC, you have up to one year to reinvest all or part of the full amount of the redemption in the same class of shares of the Fund at net asset value. This reinstatement privilege can be exercised only once for any redemption, and reinvestment will be made at the net asset value next calculated after reinstatement of the appropriate class of Fund shares. If you reinstate shares that were subject to a CDSC, your holding period as of the redemption date also will be reinstated for purposes of calculating a CDSC and the CDSC paid at redemption will be refunded. The federal income tax consequences of any capital gain realized on a redemption will not be affected by reinstatement, but a capital loss may be disallowed in whole or in part depending on the timing, the amount of the reinvestment and the fund from which the redemption occurred.
Suspension of Right of Redemption
Each Fund may suspend the right of redemption of Fund shares or delay payment more than seven days (a) during any period when the NYSE is closed (other than customary weekend and holiday closings), (b) when trading in the markets the Fund normally utilizes is restricted or an emergency exists as determined by the SEC so that trading of the Fund’s investments or determination of its net asset value is not reasonably practicable, or (c) for any other periods that the SEC by order may permit for protection of Fund shareholders.
Redemption In-Kind
The Funds have reserved the right to redeem in-kind (that is, to pay redemption requests in cash and portfolio securities, or wholly in portfolio securities). The Funds voluntarily have committed to pay in cash all requests for redemption by any shareholder, limited as to each shareholder during any 90-day period to the lesser of $250,000 or 1% of the net asset value of a Fund at the beginning of the 90-day period.
Frequent Trading Policy
The Funds’ Frequent Trading Policy is as follows:
Nuveen Mutual Funds are intended as long-term investments and not as short-term trading vehicles. At the same time, the Funds recognize the need of investors to periodically make purchases
S-62
and redemptions of Fund shares when rebalancing their portfolios and as their financial needs or circumstances change. Nuveen Mutual Funds have adopted the following Frequent Trading Policy that seeks to balance these needs against the potential for higher operating costs, portfolio management disruption and other inefficiencies that can be caused by excessive trading of Fund shares.
1. Definition of Round Trip
A Round Trip trade is the purchase and subsequent redemption of Fund shares, including by exchange. Each side of a Round Trip trade may be comprised of either a single transaction or a series of closely-spaced transactions.
2. Round Trip Trade Limitations
Nuveen Mutual Funds limit the frequency of Round Trip trades that may be placed in a Fund. Subject to certain exceptions noted below, the Funds limit an investor to two Round Trips per trailing 60-day period.
3. Enforcement
Trades placed in violation of the foregoing policies are subject to rejection or cancellation by Nuveen Mutual Funds. Nuveen Mutual Funds may also bar an investor (and/or the investor’s financial advisor) who has violated these policies from opening new accounts with the Funds and may restrict the investor’s existing account(s) to redemptions only. Nuveen Mutual Funds reserve the right, in their sole discretion, to (a) interpret the terms and application of these policies, (b) waive unintentional or minor violations (including transactions below certain dollar thresholds) if Nuveen Mutual Funds determine that doing so does not harm the interests of Fund shareholders, and (c) exclude certain classes of redemptions from the application of the trading restrictions set forth above.
Nuveen Mutual Funds reserve the right to impose restrictions on purchases or exchanges that are more restrictive than those stated above if they determine, in their sole discretion, that a proposed transaction or series of transactions involve market timing or excessive trading that is likely to be detrimental to the Funds. The Funds may also modify or suspend the Frequent Trading Policy without notice during periods of market stress or other unusual circumstances.
The ability of Nuveen Mutual Funds to implement the Frequent Trading Policy for omnibus accounts at certain financial intermediaries may be dependent on receiving from those intermediaries sufficient shareholder information to permit monitoring of trade activity and enforcement of the Funds’ Frequent Trading Policy. In addition, the Funds may rely on a financial intermediary’s policy to restrict market timing and excessive trading if the Funds believe that the policy is reasonably designed to prevent market timing that is detrimental to the Funds. Such policy may be more or less restrictive than the Funds’ Policy. The Funds cannot ensure that these financial intermediaries will in all cases apply the Funds’ policy or their own policies, as the case may be, to accounts under their control.
Exclusions from the Frequent Trading Policy
As stated above, certain redemptions are eligible for exclusion from the Frequent Trading Policy, including: (i) redemptions or exchanges by shareholders investing through the fee-based platforms of certain financial intermediaries (where the intermediary charges an asset-based or comprehensive “wrap” fee for its services) that are effected by the financial intermediaries in connection with systematic portfolio rebalancing; (ii) when there is a verified trade error correction, which occurs when a dealer firm sends a trade to correct an earlier trade made in error and then the firm sends an explanation to the Nuveen Mutual Funds confirming that the trade is actually an error correction; (iii) in the event of total disability (as evidenced by a determination by the federal Social Security Administration) of the shareholder (including a registered joint owner) occurring after the purchase of the shares being redeemed; (iv) in the event of the death of the shareholder (including a registered joint owner); (v) redemptions made pursuant to a systematic withdrawal plan, up to 1% monthly, 3% quarterly, 6% semiannually or 12% annually of an account’s net asset value depending on the frequency of the plan as designated by the shareholder; (vi) redemptions of shares that were purchased through a systematic investment program; (vii) involuntary redemptions caused by operation of law; (viii) redemptions in connection with a payment of account or plan fees;
S-63
(ix) redemptions or exchanges by any “fund of funds” advised by the Adviser; and (x) redemptions in connection with the exercise of a Fund’s right to redeem all shares in an account that does not maintain a certain minimum balance or that the board has determined may have material adverse consequences to the shareholders of a Fund.
In addition, the following redemptions of shares by an employer-sponsored qualified defined contribution retirement plan are excluded from the Frequent Trading Policy: (i) partial or complete redemptions in connection with a distribution without penalty under Section 72(t) of the Code from a retirement plan: (a) upon attaining age 59 1/2; (b) as part of a series of substantially equal periodic payments; or (c) upon separation from service and attaining age 55; (ii) partial or complete redemptions in connection with a qualifying loan or hardship withdrawal; (iii) complete redemptions in connection with termination of employment, plan termination, transfer to another employer’s plan or IRA or changes in a plan’s recordkeeper; and (iv) redemptions resulting from the return of an excess contribution. Also, the following redemptions of shares held in an IRA account are excluded from the application of the Frequent Trading Policy: (i) redemptions made pursuant to an IRA systematic withdrawal based on the shareholder’s life expectancy including, but not limited to, substantially equal periodic payments described in Code Section 72(t)(A)(iv) prior to age 59 1/2; and (ii) redemptions to satisfy required minimum distributions after age 70 1/2 from an IRA account.
Distribution and Service Plan
The Funds have adopted a plan (the “Plan”) pursuant to Rule 12b-1 under the 1940 Act, pursuant to which Class C and Class R3 shares are subject to an annual distribution fee and Class A, Class C and Class R3 shares are subject to an annual service fee. Each Fund may spend up to 0.25% per year of the average daily net assets of Class A shares as a service fee under the Plan as applicable to Class A shares. Each Fund may spend up to 0.75% per year of the average daily net assets of Class C shares and 0.25% per year of the average daily net assets of Class R3 shares as a distribution fee and up to 0.25% per year of the average daily net assets of each of the Class C and Class R3 shares as a service fee under the Plan as applicable to such classes. Class I shares are not subject to either distribution or service fees. Distribution and service fees collectively are referred to herein as “12b-1 fees.”
The distribution fee applicable to Class C and Class R3 shares under each Fund’s Plan compensates the Distributor for expenses incurred in connection with the distribution of Class C and Class R3 shares, respectively. These expenses include payments to financial intermediaries, including the Distributor, who are brokers of record with respect to the Class C and Class R3 shares, as well as, without limitation, expenses of printing and distributing Prospectuses to persons other than shareholders of each Fund, expenses of preparing, printing and distributing advertising and sales literature and reports to shareholders used in connection with the sale of Class C and Class R3 shares, certain other expenses associated with the distribution of Class C and Class R3 shares, and any other distribution-related expenses that may be authorized from time to time by the Board of Trustees.
The service fee applicable to Class A, Class C and Class R3 shares under each Fund’s Plan is used to compensate financial intermediaries in connection with the provision of ongoing account services to shareholders. These services may include establishing and maintaining shareholder accounts, answering shareholder inquiries and providing other personal services to shareholders.
During the fiscal year ended September 30, 2012, the Funds incurred 12b-1 fees pursuant to their Plan in the amounts set forth in the table below. For this period, substantially all of the 12b-1 service fees on Class A shares were paid out as compensation to financial intermediaries for providing services to shareholders relating to their investments. To compensate for commissions advanced to financial intermediaries, all 12b-1 fees on Class C shares during the first year following a purchase are retained by the Distributor. After the first year following a purchase, 12b-1 fees on Class C shares are paid to financial intermediaries.
S-64
| | | | |
| | | 12b-1 Fees
Incurred by
Each Fund for
the Fiscal Year Ended
September 30, 2012 | |
Nuveen Symphony International Equity Fund | | | | |
Class A | | $ | 527 | |
Class C | | | 2,176 | |
Class R3 | | | 249 | |
| | | | |
Total | | $ | 2,952 | |
| | | | |
Nuveen Symphony Large-Cap Growth Fund | | | | |
Class A | | $ | 37,312 | |
Class C | | | 47,064 | |
Class R3 | | | 2,311 | |
| | | | |
Total | | $ | 86,687 | |
| | | | |
Nuveen Symphony Mid-Cap Core Fund | | | | |
Class A | | $ | 4,531 | |
Class C | | | 6,615 | |
Class R3 | | | 1,268 | |
| | | | |
Total | | $ | 12,414 | |
| | | | |
Nuveen Symphony Optimized Alpha Fund | | | | |
Class A | | $ | 1,911 | |
Class C | | | 2,871 | |
| | | | |
Total | | $ | 4,782 | |
| | | | |
Under each Fund’s Plan, the Fund will report quarterly to the Board of Trustees for its review all amounts expended per class of shares under the Plan. The Plan may be terminated at any time with respect to any class of shares, without the payment of any penalty, by a vote of a majority of the independent trustees who have no direct or indirect financial interest in the Plan or by vote of a majority of the outstanding voting securities of such class. The Plan may be renewed from year to year if approved by a vote of the Board of Trustees and a vote of the independent trustees who have no direct or indirect financial interest in the Plan cast in person at a meeting called for the purpose of voting on the Plan. The Plan may be continued only if the trustees who vote to approve such continuance conclude, in the exercise of reasonable business judgment and in light of their fiduciary duties under applicable law, that there is a reasonable likelihood that the Plan will benefit the Fund and its shareholders. The Plan may not be amended to increase materially the cost which a class of shares may bear under the Plan without the approval of the shareholders of the affected class, and any other material amendments of the Plan must be approved by the independent trustees by a vote cast in person at a meeting called for the purpose of considering such amendments. During the continuance of the Plan, the selection and nomination of the independent trustees of the Trust will be committed to the discretion of the independent trustees then in office. With the exception of the Distributor and its affiliates, no “interested person” of the Funds, as that term is defined in the 1940 Act, and no trustee of the Funds has a direct or indirect financial interest in the operation of the Plan or any related agreement.
General Matters
The Funds have authorized one or more brokers to accept on their behalf purchase and redemption orders. Such brokers are authorized to designate other intermediaries to accept purchase and redemption orders on the Funds’ behalf. The Funds will be deemed to have received a purchase or redemption order when an authorized broker or, if applicable, a broker’s authorized designee accepts the order. Customer orders received by such broker (or their designee) will be priced at the applicable Fund’s net asset value next computed after they are accepted by an authorized broker (or their designee). Orders accepted by an authorized broker (or their designee) before the close of regular trading on the NYSE will receive that day’s share price; orders accepted after the close of trading will receive the next business day’s share price.
S-65
If you choose to invest in a Fund, an account will be opened and maintained for you by BFDS, the Funds’ shareholder services agent. Shares will be registered in the name of the investor or the investor’s financial advisor. A change in registration or transfer of shares held in the name of a financial advisor may only be made by an order in good standing form from the financial advisor acting on the investor’s behalf. Each Fund reserves the right to reject any purchase order and to waive or increase minimum investment requirements.
The Funds do not issue share certificates.
Distribution Arrangements
The Distributor sells shares to or through brokers, dealers, banks or other qualified financial intermediaries (collectively referred to as “Dealers”), or others, in a manner consistent with the then effective registration statement of the Trust. Pursuant to the Distribution Agreement, the Distributor, at its own expense, finances certain activities incident to the sale and distribution of the Funds’ shares, including printing and distributing of prospectuses and statements of additional information to other than existing shareholders, the printing and distributing of sales literature, advertising and payment of compensation and giving of concessions to Dealers.
The Distributor receives for its services the excess, if any, of the sales price of a Fund’s shares less the net asset value of those shares, and reallows a majority or all of such amounts to the Dealers who sold the shares. The Distributor also receives distribution fees pursuant to a distribution plan adopted by the Trust pursuant to Rule 12b-1 and described herein under “Distribution and Service Plan.” The Distributor also receives any CDSCs imposed on redemptions of shares, but any amounts as to which a reinstatement privilege is not exercised are set off against and reduce amounts otherwise payable to the Distributor pursuant to the distribution plan. The Distributor may also act as a Dealer.
The following table sets forth the aggregate amounts of underwriting commissions with respect to the sale of Fund shares, the amount thereof retained by the Distributor and the compensation on redemptions and repurchases received by the Distributor for the Funds for the specified periods. All figures are expressed in thousands and are to the nearest thousand.
| | | | | | | | | | | | | | | | | | | | | | | | | | | | | | | | | | | | |
Fund | | Amount of Underwriting
Commissions | | | Amount Retained by
the Distributor | | | Amount of Compensation on
Redemptions and
Repurchases | |
| | | 10/01/09-
9/30/10 | | | 10/01/10-
9/30/11 | | | 10/01/11-
9/30/12 | | | 10/01/09-
9/30/10 | | | 10/01/10-
9/30/11 | | | 10/01/11-
9/30/12 | | | 10/01/09-
9/30/10 | | | 10/01/10-
9/30/11 | | | 10/01/11-
9/30/12 | |
Nuveen Symphony International Equity Fund | | $ | 2 | | | $ | — | | | $ | — | | | $ | — | | | $ | — | | | $ | — | | | $ | — | | | $ | — | | | $ | — | |
Nuveen Symphony Large-Cap Growth Fund | | | 2 | | | | 44 | | | | 134 | | | | — | | | | 5 | | | | 16 | | | | — | | | | — | | | | — | |
Nuveen Symphony Mid-Cap Core Fund | | | 2 | | | | 13 | | | | 11 | | | | — | | | | 2 | | | | 1 | | | | — | | | | 1 | | | | — | |
Nuveen Symphony Optimized Alpha Fund | | | 1 | | | | 12 | | | | 4 | | | | — | | | | 1 | | | | — | | | | — | | | | — | | | | — | |
To help financial advisors and investors better understand and more efficiently use the Funds to reach their investment goals, the Distributor may advertise and create specific investment programs and systems. For example, this may include information on how to use the Funds to accumulate assets for future education needs or periodic payments such as insurance premiums. The Distributor may produce software, electronic information sites or additional sales literature to promote the advantages of using the Funds to meet these and other specific investor needs. In addition, wholesale representatives of the Distributor may visit financial advisors on a regular basis to educate them about the Funds and to encourage the sale of Fund shares to their clients. The costs and expenses associated with these efforts may include travel, lodging, sponsorship at educational seminars and conferences, entertainment and meals to the extent permitted by law. Nuveen wholesalers may receive additional compensation if they meet certain targets for sales of one or more Nuveen Mutual Funds.
S-66
Additional Payments to Financial Intermediaries and Other Payments
In addition to the sales charge payments and the distribution, service and transfer agency fees described in the Prospectus and elsewhere in this SAI, the Adviser and/or the Distributor may make additional payments out of its own assets to selected intermediaries that sell shares of the Nuveen Mutual Funds (such as brokers, dealers, banks, registered investment advisers, retirement plan administrators and other intermediaries; hereinafter, individually, “Intermediary,” and collectively, “Intermediaries”) under the categories described below for the purposes of promoting the sale of Fund shares, maintaining share balances and/or for sub-accounting, administrative or shareholder processing services.
The amounts of these payments could be significant and may create an incentive for an Intermediary or its representatives to recommend or offer shares of the Nuveen Mutual Funds to its customers. The Intermediary may elevate the prominence or profile of the Funds within the Intermediary’s organization by, for example, placing the Funds on a list of preferred or recommended funds and/or granting the Adviser and/or the Distributor preferential or enhanced opportunities to promote the Funds in various ways within the Intermediary’s organization.
These payments are made pursuant to negotiated agreements with Intermediaries. The payments do not change the price paid by investors for the purchase of a share or the amount a Fund will receive as proceeds from such sales. Furthermore, these payments are not reflected in the fees and expenses listed in the fee table section of the Funds’ Prospectus and described above because they are not paid by the Funds.
The categories of payments described below are not mutually exclusive, and a single Intermediary may receive payments under all categories.
The Adviser and/or the Distributor may also make other additional payments out of its own assets as described under “Other Payments” below.
Marketing Support Payments and Program Servicing Payments
The Adviser and/or the Distributor may make payments for marketing support and/or program servicing to selected Intermediaries that are registered as holders or dealers of record for accounts invested in one or more of the Nuveen Mutual Funds or that make Nuveen Mutual Fund shares available through employee benefit plans or fee-based advisory programs to compensate them for the variety of services they provide.
Marketing Support Payments. Services for which an Intermediary receives marketing support payments may include business planning assistance, advertising, educating the Intermediary’s personnel about the Nuveen Mutual Funds in connection with shareholder financial planning needs, placement on the Intermediary’s preferred or recommended fund company list, and access to sales meetings, sales representatives and management representatives of the Intermediary. In addition, Intermediaries may be compensated for enabling representatives of the Adviser and/or the Distributor to participate in and/or present at conferences or seminars, sales or training programs for invited registered representatives and other employees, client and investor events and other events sponsored by the Intermediary.
The Adviser and/or the Distributor compensate Intermediaries differently depending upon, among other factors, the number or value of Nuveen Mutual Funds shares that the Intermediary sells or may sell, the value of the assets invested in the Nuveen Mutual Funds by the Intermediary’s customers, redemption rates, ability to attract and retain assets, reputation in the industry and the level and/or type of marketing assistance and educational activities provided by the Intermediary. Such payments are generally asset-based but also may include the payment of a lump sum.
Program Servicing Payments. Services for which an Intermediary receives program servicing payments typically include recordkeeping, reporting, or transaction processing, but may also include services rendered in connection with fund/investment selection and monitoring, employee enrollment and education, plan balance rollover or separation, or other similar services. An Intermediary may perform program services itself or may arrange with a third party to perform program services.
S-67
Program servicing payments typically apply to employee benefit plans, such as retirement plans, or fee-based advisory programs but may apply to retail sales and assets in certain situations. The payments are based on such factors as the type and nature of services or support furnished by the Intermediary and are generally asset-based.
Marketing Support and Program Servicing Payment Guidelines. In the case of any one Intermediary, marketing support and program servicing payments are not expected, with certain limited exceptions, to exceed, in the aggregate, 0.35% of the average net assets of Fund shares attributable to that Intermediary on an annual basis. In connection with the sale of a business by U.S. Bank N.A. to Great-West Life & Annuity Insurance Company (“Great-West”), the Adviser and/or the Distributor has a services agreement with GWFS Equities, Inc., an affiliate of Great-West, which provides for payments of up to 0.60% of the average net assets of Fund shares attributable to GWFS Equities, Inc. on an annual basis.
Other Payments
From time to time, the Adviser and/or the Distributor, at its expense, may provide other compensation to Intermediaries that sell or arrange for the sale of shares of the Funds, which may be in addition to marketing support and program servicing payments described above. For example, the Adviser and/or the Distributor may: (i) compensate Intermediaries for National Securities Clearing Corporation networking system services (e.g., shareholder communication, account statements, trade confirmations, and tax reporting) on an asset-based or per account basis; (ii) compensate Intermediaries for providing Fund shareholder trading information; (iii) make one-time or periodic payments to reimburse selected Intermediaries for items such as ticket charges (i.e., fees that an Intermediary charges its representatives for effecting transactions in Fund shares) of up to $25 per purchase or exchange order, operational charges (e.g., fees that an Intermediary charges for establishing a Fund on its trading system), and literature printing and/or distribution costs; (iv) at the direction of a retirement plan’s sponsor, reimburse or pay direct expenses of an employee benefit plan that would otherwise be payable by the plan; and (v) provide payments to broker-dealers to help defray their technology or infrastructure costs.
When not provided for in a marketing support or program servicing agreement, the Adviser and/or the Distributor may pay Intermediaries for enabling the Adviser and/or the Distributor to participate in and/or present at conferences or seminars, sales or training programs for invited registered representatives and other Intermediary employees, client and investor events and other Intermediary- sponsored events, and for travel expenses, including lodging incurred by registered representatives and other employees in connection with prospecting, asset retention and due diligence trips. These payments may vary depending upon the nature of the event. The Adviser and/or the Distributor make payments for such events as it deems appropriate, subject to its internal guidelines and applicable law.
The Adviser and/or the Distributor occasionally sponsors due diligence meetings for registered representatives during which they receive updates on various Nuveen Mutual Funds and are afforded the opportunity to speak with portfolio managers. Although invitations to these meetings are not conditioned on selling a specific number of shares, those who have shown an interest in Nuveen Mutual Funds are more likely to be considered. To the extent permitted by their firm’s policies and procedures, all or a portion of registered representatives’ expenses in attending these meetings may be covered by the Adviser and/or the Distributor.
Representatives of the Distributor or its affiliates may receive additional compensation from the Adviser and/or the Distributor if certain targets are met for sales of one or more Nuveen Mutual Funds. Such compensation may vary by Fund and by Intermediary.
Other compensation may be offered to the extent not prohibited by state laws or any self-regulatory agency, such as FINRA. Investors can ask their Intermediary for information about any payments it receives from the Adviser and/or the Distributor and the services it provides for those payments.
Investors may wish to take Intermediary payment arrangements into account when considering and evaluating any recommendations relating to Fund shares.
S-68
Intermediaries Receiving Additional Payments
The following is a list of Intermediaries receiving one or more of the types of payments discussed above as of January 18, 2013:
ADP Broker-Dealer, Inc.
Alliance Fund Distributors
American United Life Insurance Company
Ameriprise Financial Services, Inc.
Ascensus (formerly BISYS Retirement Services, Inc.)
Benefit Plans Administrative Services, Inc.
Benefit Trust Company
Charles Schwab & Co., Inc.
Chase Investment Services
Citigroup Global Markets Inc.
Commonwealth Equity Services, LLP, DBA Commonwealth Financial Network
CPI Qualified Plan Consultants, Inc.
Digital Retirement Solutions, Inc.
Dyatech, LLC
Edward Jones
ExpertPlan, Inc.
Fidelity Brokerage Services LLC/National Financial Services LLC
Fidelity Investments Institutional Operations Company, Inc. (FIIOC)/Fidelity Advisors Retirement
Genesis Employee Benefits, Inc. DBA America’s VEBA Solution
Great West Life and Annuity Insurance Co.
GWFS Equities, Inc.
Hartford Life Insurance Company
Hartford Securities Distribution Company, Inc.
Hewitt Associates LLC
ICMA Retirement Corporation
ING Life Insurance and Annuity Company/ING Institutional Plan Services LLC/ING Financial Advisors, LLC (formerly CitiStreet LLC/CitiStreet Advisors LLC)
J.P. Morgan Retirement Plan Services, LLC
Janney Montgomery Scott LLC
Lincoln Retirement Services Company LLC/AMG Service Corp.
Linsco/Private Ledger Corp.
Marshall & Ilsley Trust Company, N.A.
Massachusetts Mutual Life Insurance Company
Mercer HR Outsourcing LLC
Merrill Lynch, Pierce, Fenner & Smith Inc.
Mid Atlantic Capital Corporation
Morgan Stanley & Co., Incorporated/Morgan Stanley Smith Barney LLC
MSCS Financial Services, LLC
Nationwide Financial Services, Inc.
Newport Retirement Services, Inc.
NYLife Distributors LLC
Pershing LLC
Princeton Retirement Group/GPC Securities, Inc.
Principal Life Insurance Company
Prudential Insurance Company of America (The)
Prudential Investment Management Services, LLC/Prudential Investments LLC
Raymond James & Associates/Raymond James Financial Services, Inc.
RBC Capital Markets, LLC
Reliance Trust Company
Retirement Plan Company, LLC (The)
Robert W. Baird & Co., Inc.
S-69
Savings Institute and Bank
Smith Barney
Stifel, Nicolaus & Co., Inc.
T. Rowe Price Investment Services, Inc./T. Rowe Price Retirement Plan Services, Inc.
TD Ameritrade, Inc.
TD Ameritrade Trust Company (formerly Fiserv Trust Company/International Clearing Trust Company)
TIAA-CREF Individual & Institutional Services, LLC
U.S. Bancorp Investments, Inc.
U.S. Bank N.A.
UBS Financial Services, Inc.
Unified Trust Company, N.A.
VALIC Retirement Services Company (formerly AIG Retirement Services Company)
Vanguard Group, Inc.
Wells Fargo Advisors, LLC
Wells Fargo Bank, N.A.
Wilmington Trust Company
Wilmington Trust Retirement and Institutional Services Company (formerly AST Capital Trust Company)
Any additions, modifications or deletions to the list of Intermediaries identified above that have occurred since January 18, 2013 are not reflected in the list.
FINANCIAL STATEMENTS
The audited financial statements for each Fund’s most recent fiscal year appear in each Fund’s Annual Report dated September 30, 2012. Each Fund’s Annual Report is incorporated by reference into this SAI and is available without charge by calling (800) 257-8787.
S-70
APPENDIX A
RATINGS OF INVESTMENTS
Standard & Poor’s Ratings Group—A brief description of the applicable Standard & Poor’s (“S&P”) rating symbols and their meanings (as published by S&P) follows:
Issue Credit Ratings
A S&P issue credit rating is a forward-looking opinion about the creditworthiness of an obligor with respect to a specific financial obligation, a specific class of financial obligations, or a specific financial program (including ratings on medium-term note programs and commercial paper programs). It takes into consideration the creditworthiness of guarantors, insurers, or other forms of credit enhancement on the obligation and takes into account the currency in which the obligation is denominated. The opinion reflects S&P’s view of the obligor’s capacity and willingness to meet its financial commitments as they come due, and may assess terms, such as collateral security and subordination, which could affect ultimate payment in the event of default.
Issue credit ratings can be either long-term or short-term. Short-term ratings are generally assigned to those obligations considered short-term in the relevant market. In the U.S., for example, that means obligations with an original maturity of no more than 365 days—including commercial paper. Short-term ratings are also used to indicate the creditworthiness of an obligor with respect to put features on long-term obligations. The result is a dual rating, in which the short-term rating addresses the put feature, in addition to the usual long-term rating. Medium-term notes are assigned long-term ratings.
Long-Term Issue Credit Ratings
Issue credit ratings are based, in varying degrees, on S&P’s analysis of the following considerations:
1. Likelihood of payment—capacity and willingness of the obligor to meet its financial commitment on an obligation in accordance with the terms of the obligation;
2. Nature of and provisions of the obligation;
3. Protection afforded by, and relative position of, the obligation in the event of bankruptcy, reorganization, or other arrangement under the laws of bankruptcy and other laws affecting creditors’ rights.
Issue ratings are an assessment of default risk, but may incorporate an assessment of relative seniority or ultimate recovery in the event of default. Junior obligations are typically rated lower than senior obligations, to reflect the lower priority in bankruptcy, as noted above. (Such differentiation may apply when an entity has both senior and subordinated obligations, secured and unsecured obligations, or operating company and holding company obligations.)
| | |
| |
| AAA | | An obligation rated ‘AAA’ has the highest rating assigned by S&P. The obligor’s capacity to meet its financial commitment on the obligation is extremely strong. |
| |
| AA | | An obligation rated ‘AA’ differs from the highest-rated obligations only to a small degree. The obligor’s capacity to meet its financial commitment on the obligation is very strong. |
| |
| A | | An obligation rated ‘A’ is somewhat more susceptible to the adverse effects of changes in circumstances and economic conditions than obligations in higher-rated categories. However, the obligor’s capacity to meet its financial commitment on the obligation is still strong. |
| |
| BBB | | An obligation rated ‘BBB’ exhibits adequate protection parameters. However, adverse economic conditions or changing circumstances are more likely to lead to a weakened capacity of the obligor to meet its financial commitment on the obligation. |
Obligations rated ‘BB’, ‘B’, ‘CCC’, ‘CC’, and ‘C’ are regarded as having significant speculative characteristics. ‘BB’ indicates the least degree of speculation and ‘C’ the highest. While such
A-1
obligations will likely have some quality and protective characteristics, these may be outweighed by large uncertainties or major exposures to adverse conditions.
| | |
| |
| BB | | An obligation rated ‘BB’ is less vulnerable to nonpayment than other speculative issues. However, it faces major ongoing uncertainties or exposure to adverse business, financial, or economic conditions which could lead to the obligor’s inadequate capacity to meet its financial commitment on the obligation. |
| |
| B | | An obligation rated ‘B’ is more vulnerable to nonpayment than obligations rated ‘BB’, but the obligor currently has the capacity to meet its financial commitment on the obligation. Adverse business, financial, or economic conditions will likely impair the obligor’s capacity or willingness to meet its financial commitment on the obligation. |
| |
| CCC | | An obligation rated ‘CCC’ is currently vulnerable to nonpayment, and is dependent upon favorable business, financial, and economic conditions for the obligor to meet its financial commitment on the obligation. In the event of adverse business, financial, or economic conditions, the obligor is not likely to have the capacity to meet its financial commitment on the obligation. |
| |
| CC | | An obligation rated ‘CC’ is currently highly vulnerable to nonpayment. |
| |
| C | | A ‘C’ rating is assigned to obligations that are currently highly vulnerable to nonpayment, obligations that have payment arrearages allowed by the terms of the documents, or obligations of an issuer that is the subject of a bankruptcy petition or similar action which have not experienced a payment default. Among others, the ‘C’ rating may be assigned to subordinated debt, preferred stock or other obligations on which cash payments have been suspended in accordance with the instrument’s terms or when preferred stock is the subject of a distressed exchange offer, whereby some or all of the issue is either repurchased for an amount of cash or replaced by other instruments having a total value that is less than par. |
| |
| D | | An obligation rated ‘D’ is in payment default. The ‘D’ rating category is used when payments on an obligation are not made on the date due unless S&P believes that such payments will be made within five business days, irrespective of any grace period. The ‘D’ rating also will be used upon the filing of a bankruptcy petition or the taking of similar action if payments on an obligation are jeopardized. An obligation’s rating is lowered to ‘D’ upon completion of a distressed exchange offer, whereby some or all of the issue is either repurchased for an amount of cash or replaced by other instruments having a total value that is less than par. |
Plus (+) or Minus (–): The ratings from ‘AA’ to ‘CCC’ may be modified by the addition of a plus or minus sign to show relative standing within the major rating categories.
| | |
| |
| NR | | This indicates that no rating has been requested, that there is insufficient information on which to base a rating, or that S&P does not rate a particular obligation as a matter of policy. |
Short-Term Issue Credit Ratings
| | |
| |
| A-1 | | A short-term obligation rated ‘A-1’ is rated in the highest category by S&P. The obligor’s capacity to meet its financial commitment on the obligation is strong. Within this category, certain obligations are designated with a plus sign (+). This indicates that the obligor’s capacity to meet its financial commitment on these obligations is extremely strong. |
| |
| A-2 | | A short-term obligation rated ‘A-2’ is somewhat more susceptible to the adverse effects of changes in circumstances and economic conditions than obligations in higher rating categories. However, the obligor’s capacity to meet its financial commitment on the obligation is satisfactory. |
| |
| A-3 | | A short-term obligation rated ‘A-3’ exhibits adequate protection parameters. However, adverse economic conditions or changing circumstances are more likely to lead to a weakened capacity of the obligor to meet its financial commitment on the obligation. |
A-2
| | |
| |
| B | | A short-term obligation rated ‘B’ is regarded as vulnerable and has significant speculative characteristics. The obligor currently has the capacity to meet its financial commitments; however, it faces major ongoing uncertainties which could lead to the obligor’s inadequate capacity to meet its financial commitments. |
| |
| C | | A short-term obligation rated ‘C’ is currently vulnerable to nonpayment and is dependent upon favorable business, financial, and economic conditions for the obligor to meet its financial commitment on the obligation. |
| |
| D | | A short-term obligation rated ‘D’ is in payment default. The ‘D’ rating category is used when payments on an obligation are not made on the date due, unless S&P believes that such payments will be made within any stated grace period. However, any stated grace period longer than five business days will be treated as five business days. The ‘D’ rating also will be used upon the filing of a bankruptcy petition or the taking of a similar action if payments on an obligation are jeopardized. |
Moody’s Investors Service, Inc.—A brief description of the applicable Moody’s Investors Service, Inc. (“Moody’s”) rating symbols and their meanings (as published by Moody’s) follows:
Ratings assigned on Moody’s global long-term and short-term rating scales are forward-looking opinions of the relative credit risks of financial obligations issued by non-financial corporates, financial institutions, structured finance vehicles, project finance vehicles, and public sector entities. Long-term ratings are assigned to issuers or obligations with an original maturity of one year or more and reflect both on the likelihood of a default on contractually promised payments and the expected financial loss suffered in the event of default. Short-term ratings are assigned to obligations with an original maturity of thirteen months or less and reflect the likelihood of a default on contractually promised payments.
Long-Term Obligation Ratings
| | |
| |
| Aaa | | Obligations rated Aaa are judged to be of the highest quality, subject to the lowest level of credit risk. |
| |
| Aa | | Obligations rated Aa are judged to be of high quality and are subject to very low credit risk. |
| |
| A | | Obligations rated A are judged to be upper-medium grade and are subject to low credit risk. |
| |
| Baa | | Obligations rated Baa are judged to be medium-grade and subject to moderate credit risk and as such may possess certain speculative characteristics. |
| |
| Ba | | Obligations rated Ba are judged to be speculative and are subject to substantial credit risk. |
| |
| B | | Obligations rated B are considered speculative and are subject to high credit risk. |
| |
| Caa | | Obligations rated Caa are judged to be speculative of poor standing and are subject to very high credit risk. |
| |
| Ca | | Obligations rated Ca are highly speculative and are likely in, or very near, default, with some prospect of recovery of principal and interest. |
| |
| C | | Obligations rated C are the lowest rated and are typically in default, with little prospect for recovery of principal or interest. |
Note: Moody’s appends numerical modifiers 1, 2, and 3 to each generic rating classification from Aa through Caa. The modifier 1 indicates that the obligation ranks in the higher end of its generic rating category; the modifier 2 indicates a mid-range ranking; and the modifier 3 indicates a ranking in the lower end of that generic rating category.
Short-Term Obligation Ratings
| | |
| |
| P-1 | | Issuers (or supporting institutions) rated Prime-1 have a superior ability to repay short-term debt obligations. |
| |
| P-2 | | Issuers (or supporting institutions) rated Prime-2 have a strong ability to repay short-term debt obligations. |
A-3
| | |
| |
| P-3 | | Issuers (or supporting institutions) rated Prime-3 have an acceptable ability to repay short-term obligations. |
| |
| NP | | Issuers (or supporting institutions) rated Not Prime do not fall within any of the Prime rating categories. |
Medium-Term Note Program Ratings
Moody’s assigns provisional ratings to medium-term note (MTN) programs and definitive ratings to the individual debt securities issued from them (referred to as drawdowns or notes).
MTN program ratings are intended to reflect the ratings likely to be assigned to drawdowns issued from the program with the specified priority of claim (e.g. senior or subordinated). To capture the contingent nature of a program rating, Moody’s assigns provisional ratings to MTN programs. A provisional rating is denoted by a (P) in front of the rating. The rating assigned to a drawdown from a rated MTN or bank/deposit note program is definitive in nature, and may differ from the program rating if the drawdown is exposed to additional credit risks besides the issuer’s default, such as links to the defaults of other issuers, or has other structural features that warrant a different rating. In some circumstances, no rating may be assigned to a drawdown.
Moody’s encourages market participants to contact Moody’s Ratings Desks or visit www.moodys.com directly if they have questions regarding ratings for specific notes issued under a medium-term note program. Unrated notes issued under an MTN program may be assigned an NR (not rated) symbol.
U.S. Municipal Short-Term Debt and Demand Obligation Ratings
Short-Term Obligation Ratings
The Municipal Investment Grade (“MIG”) scale is used to rate US municipal bond anticipation notes of up to three years maturity. Municipal notes rated on the MIG scale may be secured by either pledged revenues or proceeds of a take-out financing received prior to note maturity. MIG ratings expire at the maturity of the obligation, and the issuer’s long-term rating is only one consideration in assigning the MIG rating. MIG ratings are divided into three levels—MIG 1 through MIG 3—while speculative grade short-term obligations are designated SG.
| | |
| |
| MIG 1 | | This designation denotes superior credit quality. Excellent protection is afforded by established cash flows, highly reliable liquidity support, or demonstrated broad-based access to the market for refinancing. |
| |
| MIG 2 | | This designation denotes strong credit quality. Margins of protection are ample, although not as large as in the preceding group. |
| |
| MIG 3 | | This designation denotes acceptable credit quality. Liquidity and cash-flow protection may be narrow, and market access for refinancing is likely to be less well-established. |
| |
| SG | | This designation denotes speculative-grade credit quality. Debt instruments in this category may lack sufficient margins of protection. |
Demand Obligation Ratings
In the case of variable rate demand obligations (“VRDOs”), a two-component rating is assigned: a long or short-term debt rating and a demand obligation rating. The first element represents Moody’s evaluation of risk associated with scheduled principal and interest payments. The second element represents Moody’s evaluation of risk associated with the ability to receive purchase price upon demand (“demand feature”). The second element uses a rating from a variation of the MIG scale called the Variable Municipal Investment Grade (“VMIG”) scale.
| | |
| |
| VMIG 1 | | This designation denotes superior credit quality. Excellent protection is afforded by the superior short-term credit strength of the liquidity provider and structural and legal protections that ensure the timely payment of purchase price upon demand. |
A-4
| | |
| |
| VMIG 2 | | This designation denotes strong credit quality. Good protection is afforded by the strong short-term credit strength of the liquidity provider and structural and legal protections that ensure the timely payment of purchase price upon demand. |
| |
| VMIG 3 | | This designation denotes acceptable credit quality. Adequate protection is afforded by the satisfactory short-term credit strength of the liquidity provider and structural and legal protections that ensure the timely payment of purchase price upon demand. |
| |
| SG | | This designation denotes speculative-grade credit quality. Demand features rated in this category may be supported by a liquidity provider that does not have an investment grade short-term rating or may lack the structural and/or legal protections necessary to ensure the timely payment of purchase price upon demand. |
Fitch Ratings—A brief description of the applicable Fitch Ratings (“Fitch”) ratings symbols and meanings (as published by Fitch) follows:
Fitch’s credit ratings provide an opinion on the relative ability of an entity to meet financial commitments, such as interest, preferred dividends, repayment of principal, insurance claims or counterparty obligations. Credit ratings are used by investors as indications of the likelihood of receiving the money owed to them in accordance with the terms on which they invested. The agency’s credit ratings cover the global spectrum of corporate, sovereign (including supranational and sub-national), financial, bank, insurance, municipal and other public finance entities and the securities or other obligations they issue, as well as structured finance securities backed by receivables or other financial assets.
The terms “investment grade” and “speculative grade” have established themselves over time as shorthand to describe the categories ‘AAA’ to ‘BBB’ (investment grade) and ‘BB’ to ‘D’ (speculative grade). The terms “investment grade” and “speculative grade” are market conventions, and do not imply any recommendation or endorsement of a specific security for investment purposes. “Investment grade” categories indicate relatively low to moderate credit risk, while ratings in the “speculative” categories either signal a higher level of credit risk or that a default has already occurred.
A designation of “Not Rated” or “NR” is used to denote securities not rated by Fitch where Fitch has rated some, but not all, securities comprising an issuance capital structure.
Credit ratings express risk in relative rank order, which is to say they are ordinal measures of credit risk and are not predictive of a specific frequency of default or loss.
Fitch’s credit ratings do not directly address any risk other than credit risk. In particular, ratings do not deal with the risk of a market value loss on a rated security due to changes in interest rates, liquidity and other market considerations. However, in terms of payment obligation on the rated liability, market risk may be considered to the extent that it influences the ability of an issuer to pay upon a commitment. Ratings nonetheless do not reflect market risk to the extent that they influence the size or other conditionality of the obligation to pay upon a commitment (for example, in the case of index-linked bonds).
In the default components of ratings assigned to individual obligations or instruments, the agency typically rates to the likelihood of non-payment or default in accordance with the terms of that instrument’s documentation. In limited cases, Fitch may include additional considerations (i.e. rate to a higher or lower standard than that implied in the obligation’s documentation). In such cases, the agency will make clear the assumptions underlying the agency’s opinion in the accompanying rating commentary.
A-5
International Long-Term Ratings
Issuer Credit Rating Scales
| | |
| |
| AAA | | Highest credit quality. ‘AAA’ ratings denote the lowest expectation of default risk. They are assigned only in cases of exceptionally strong capacity for payment of financial commitments. This capacity is highly unlikely to be adversely affected by foreseeable events. |
| |
| AA | | Very high credit quality. ‘AA’ ratings denote expectations of very low default risk. They indicate very strong capacity for payment of financial commitments. This capacity is not significantly vulnerable to foreseeable events. |
| |
| A | | High credit quality. ‘A’ ratings denote expectations of low default risk. The capacity for payment of financial commitments is considered strong. This capacity may, nevertheless, be more vulnerable to adverse business or economic conditions than is the case for higher ratings. |
| |
| BBB | | Good credit quality. ‘BBB’ ratings indicate that expectations of default risk are currently low. The capacity for payment of financial commitments is considered adequate but adverse business or economic conditions are more likely to impair this capacity. |
| |
| BB | | Speculative. ‘BB’ ratings indicate an elevated vulnerability to default risk, particularly in the event of adverse changes in business or economic conditions over time; however, business or financial flexibility exists which supports the servicing of financial commitments. |
| |
| B | | Highly speculative. ‘B’ ratings indicate that material default risk is present, but a limited margin of safety remains. Financial commitments are currently being met; however, capacity for continued payment is vulnerable to deterioration in the business and economic environment. |
| |
| CCC | | Substantial credit risk. Default is a real possibility. |
| |
| CC | | Very high levels of credit risk. Default of some kind appears probable. |
| |
| C | | Exceptionally high levels of credit risk. Default is imminent or inevitable, or the issuer is in standstill. Conditions that are indicative of a ‘C’ category rating for an issuer include: • a. the issuer has entered into a grace or cure period following non-payment of a material financial obligation; • b. the issuer has entered into a temporary negotiated waiver or standstill agreement following a payment default on a material financial obligation; or • c. Fitch otherwise believes a condition of ‘RD’ or ‘D’ to be imminent or inevitable, including through the formal announcement of a distressed debt exchange. |
| |
| RD | | Restricted default. ‘RD’ ratings indicate an issuer that in Fitch’s opinion has experienced an uncured payment default on a bond, loan or other material financial obligation but which has not entered into bankruptcy filings, administration, receivership, liquidation or other formal winding-up procedure, and which has not otherwise ceased operating. This would include: • a. the selective payment default on a specific class or currency of debt; |
| |
| | • b. the uncured expiry of any applicable grace period, cure period or default forbearance period following a payment default on a bank loan, capital markets security or other material financial obligation; • c. the extension of multiple waivers or forbearance periods upon a payment default on one or more material financial obligations, either in series or in parallel; or • d. execution of a distressed debt exchange on one or more material financial obligations. |
A-6
| | |
| |
| D | | Default. ‘D’ ratings indicate an issuer that in Fitch’s opinion has entered into bankruptcy filings, administration, receivership, liquidation or other formal winding-up procedure, or which has otherwise ceased business. Default ratings are not assigned prospectively to entities or their obligations; within this context, non-payment on an instrument that contains a deferral feature or grace period will generally not be considered a default until after the expiration of the deferral or grace period, unless a default is otherwise driven by bankruptcy or other similar circumstance, or by a distressed debt exchange. “Imminent” default typically refers to the occasion where a payment default has been intimated by the issuer, and is all but inevitable. This may, for example, be where an issuer has missed a scheduled payment, but (as is typical) has a grace period during which it may cure the payment default. Another alternative would be where an issuer has formally announced a distressed debt exchange, but the date of the exchange still lies several days or weeks in the immediate future. In all cases, the assignment of a default rating reflects the agency’s opinion as to the most appropriate rating category consistent with the rest of its universe of ratings, and may differ from the definition of default under the terms of an issuer’s financial obligations or local commercial practice. |
International Short-Term Ratings
A short-term issuer or obligation rating is based in all cases on the short-term vulnerability to default of the rated entity or security stream and relates to the capacity to meet financial obligations in accordance with the documentation governing the relevant obligation. Short-Term Ratings are assigned to obligations whose initial maturity is viewed as “short term” based on market convention. Typically, this means up to 13 months for corporate, sovereign, and structured obligations, and up to 36 months for obligations in U.S. public finance markets.
| | |
| |
| F1 | | Highest short-term credit quality. Indicates the strongest intrinsic capacity for timely payment of financial commitments; may have an added “+” to denote any exceptionally strong credit feature. |
| |
| F2 | | Good short-term credit quality. Good intrinsic capacity for timely payment of financial commitments. |
| |
| F3 | | Fair short-term credit quality. The intrinsic capacity for timely payment of financial commitments is adequate. |
| |
| B | | Speculative short-term credit quality. Minimal capacity for timely payment of financial commitments, plus heightened vulnerability to near term adverse changes in financial and economic conditions. |
| |
| C | | High short-term default risk. Default is a real possibility. |
| |
| RD | | Restricted default. Indicates an entity that has defaulted on one or more of its financial commitments, although it continues to meet other financial obligations. Applicable to entity ratings only. |
| |
| D | | Default. Indicates a broad-based default event for an entity, or the default of a short-term obligation. |
Notes to Long-term and Short-term ratings:
The modifiers, “+” or “-” may be appended to a rating to denote relative status within major rating categories. Such suffixes are not added to the ‘AAA’ Long-Term Rating category, or to categories below ‘B’.
‘WD’ indicates that the rating has been withdrawn and the issue or issuer is no longer rated by Fitch.
A-7
Rating Watch: Rating Watches indicate that there is a heightened probability of a rating change and the likely direction of such a change. These are designated as “Positive”, indicating a potential upgrade, “Negative”, for a potential downgrade, or “Evolving”, if ratings may be raised, lowered or affirmed. However, ratings that are not on Rating Watch can be raised or lowered without being placed on Rating Watch first, if circumstances warrant such an action. A Rating Watch is typically event-driven and, as such, it is generally resolved over a relatively short period.
A-8
MAI-SYMPH-0113P
February 28, 2013, as supplemented June 24, 2013
Nuveen Dividend Value Fund
Ticker Symbols: Class A—FFEIX, Class B—FAEBX, Class C—FFECX, Class R3—FEISX, Class R6—FFEFX, Class I—FAQIX
Nuveen Equity Index Fund
Ticker Symbols: Class A—FAEIX, Class B—FAEQX, Class C—FCEIX, Class R3—FADSX, Class I—FEIIX
Nuveen International Fund
Ticker Symbols: Class A—FAIAX, Class C—FIACX, Class R3—ARQIX, Class I—FAICX
Nuveen International Select Fund
Ticker Symbols: Class A—ISACX, Class C—ICCSX, Class I—ISYCX
Nuveen Large Cap Growth Opportunities Fund
Ticker Symbols: Class A—FRGWX, Class B—FETBX, Class C—FAWCX, Class R3—FLCYX, Class R6—FLCFX, Class I—FIGWX
Nuveen Large Cap Select Fund
Ticker Symbols: Class A—FLRAX, Class C—FLYCX, Class I—FLRYX
Nuveen Mid Cap Growth Opportunities Fund
Ticker Symbols: Class A—FRSLX, Class B—FMQBX, Class C—FMECX, Class R3—FMEYX, Class R6—FMEFX, Class I—FISGX
Nuveen Mid Cap Index Fund
Ticker Symbols: Class A—FDXAX, Class C—FDXCX, Class R3—FMCYX, Class I—FIMEX
Nuveen Mid Cap Select Fund
Ticker Symbols: Class A—FATAX, Class C—FTACX, Class I—FATCX
Nuveen Mid Cap Value Fund
Ticker Symbols: Class A—FASEX, Class B—FAESX, Class C—FACSX, Class R3—FMVSX, Class I—FSEIX
Nuveen Quantitative Enhanced Core Equity Fund
Ticker Symbols: Class A—FQCAX, Class C—FQCCX, Class I—FQCYX
Nuveen Small Cap Growth Opportunities Fund
Ticker Symbols: Class A—FRMPX, Class B—FROBX, Class C—FMPCX, Class R3—FMPYX, Class I—FIMPX
Nuveen Small Cap Index Fund
Ticker Symbols: Class A—FMDAX, Class C—FPXCX, Class R3—ARSCX, Class I—ASETX
Nuveen Small Cap Select Fund
Ticker Symbols: Class A—EMGRX, Class B—ARSBX, Class C—FHMCX, Class R3—ASEIX, Class I—ARSTX
Nuveen Small Cap Value Fund
Ticker Symbols: Class A—FSCAX, Class C—FSCVX, Class R3—FSVSX, Class I—FSCCX
Nuveen Tactical Market Opportunities Fund
Ticker Symbols: Class A—NTMAX, Class C—NTMCX, Class I—FGTYX
STATEMENT OF ADDITIONAL INFORMATION
This Statement of Additional Information (“SAI”) is not a prospectus. This SAI relates to, and should be read in conjunction with, the Prospectus dated February 28, 2013 for Nuveen Dividend Value Fund, Nuveen Equity Index Fund, Nuveen International Fund, Nuveen International Select Fund, Nuveen Large Cap Growth Opportunities Fund, Nuveen Large Cap Select Fund, Nuveen Mid Cap Growth Opportunities Fund, Nuveen Mid Cap Index Fund, Nuveen Mid Cap Select Fund, Nuveen Mid Cap Value Fund, Nuveen Quantitative Enhanced Core Equity Fund, Nuveen Small Cap Growth Opportunities Fund, Nuveen Small Cap Index Fund, Nuveen Small Cap Select Fund, Nuveen Small Cap Value Fund and Nuveen Tactical Market Opportunities Fund (each, a “Fund,” and collectively, the “Funds”), each a series of Nuveen Investment Funds, Inc. A Prospectus may be obtained without charge from certain securities representatives, banks and other financial institutions that have entered into sales agreements with Nuveen Securities, LLC (the “Distributor”), or from a Fund, by written request to the applicable Fund, c/o Nuveen Investor Services, P.O. Box 8530, Boston, Massachusetts 02266-8530, or by calling (800) 257-8787.
The audited financial statements for each Fund’s most recent fiscal year appear in the Fund’s Annual Report dated October 31, 2012, which is incorporated herein by reference and is available without charge by calling (800) 257-8787.
TABLE OF CONTENTS
S-2
S-3
GENERAL INFORMATION
Nuveen Investment Funds, Inc. (“NIF”) was incorporated in the State of Maryland on August 20, 1987 under the name “SECURAL Mutual Funds, Inc.” The Board of Directors and shareholders, at meetings held January 10, 1991, and April 2, 1991, respectively, approved amendments to the Articles of Incorporation providing that the name “SECURAL Mutual Funds, Inc.” be changed to “First American Investment Funds, Inc.” At a meeting held February 27, 2011, the Board of Directors approved the name “First American Investment Funds, Inc.” be changed to “Nuveen Investment Funds, Inc.” Nuveen Dividend Value Fund was formerly named Nuveen Equity Income Fund. Nuveen Quantitative Enhanced Core Equity Fund was formerly named Nuveen Quantitative Large Cap Core Fund.
NIF is organized as a series fund and currently issues its shares in 31 series. Each series of shares represents a separate investment portfolio with its own investment objective and policies (in essence, a separate mutual fund). Nuveen Equity Index Fund, Nuveen Mid Cap Index Fund, and Nuveen Small Cap Index Fund are referred to herein collectively as the “Index Funds.”
The Funds are diversified open-end management investment companies. The Funds’ investment adviser is Nuveen Fund Advisors, LLC (“Nuveen Fund Advisors” or the “Adviser”). Each Fund has one or more sub-advisers that are responsible for the day-to-day management of such Fund’s investment portfolio (each a “Sub-Adviser” and, collectively, the “Sub-Advisers”). Nuveen Asset Management, LLC (“Nuveen Asset Management”) is a sub-adviser to each Fund. In addition, Altrinsic Global Advisors, LLC (“Altrinsic”) is also a sub-adviser to Nuveen International Fund. Altrinsic and Lazard Asset Management LLC (“Lazard”) are also sub-advisers to Nuveen International Select Fund.
Shareholders may purchase shares of each Fund through separate classes, Class A, Class B (only Nuveen Dividend Value Fund, Nuveen Equity Index Fund, Nuveen Large Cap Growth Opportunities Fund, Nuveen Mid Cap Growth Opportunities Fund, Nuveen Mid Cap Value Fund, Nuveen Small Cap Growth Opportunities Fund, and Nuveen Small Cap Select Fund and only under limited circumstances as described in the Funds’ Prospectus), Class C, Class R3 (except for Nuveen International Select Fund, Nuveen Large Cap Select Fund, Nuveen Mid Cap Select Fund, Nuveen Quantitative Enhanced Core Equity Fund, and Nuveen Tactical Market Opportunities Fund), Class R6 (only Nuveen Dividend Value Fund, Nuveen Large Cap Growth Opportunities Fund and Nuveen Mid Cap Growth Opportunities Fund) and Class I shares. The different share classes provide for variations in distribution costs, shareholder servicing fees, voting rights and dividends. To the extent permitted by the Investment Company Act of 1940, as amended (“1940 Act”), the Funds may also provide for variations in other costs among the classes. In addition, a sales load is imposed on the sale of Class A, Class B and Class C shares of the Funds. Except for the foregoing differences among the classes pertaining to costs and fees, each share of each Fund represents an equal proportionate interest in that Fund.
The Articles of Incorporation and Bylaws of NIF provide that meetings of shareholders be held as determined by the Board of Directors and as required by the 1940 Act. Maryland corporation law requires a meeting of shareholders to be held upon the written request of shareholders holding 10% or more of the voting shares of NIF, with the cost of preparing and mailing the notice of such meeting payable by the requesting shareholders. The 1940 Act requires a shareholder vote for, among other things, all amendments to fundamental investment policies and restrictions, for approval of investment advisory contracts and amendments thereto, and for amendments to Rule 12b-1 distribution plans.
INVESTMENT RESTRICTIONS
In addition to the investment objectives and policies set forth in the Prospectus and under the caption “Investment Policies and Techniques” below, each Fund is subject to the investment restrictions set forth below. The investment restrictions set forth in paragraphs 1 through 8 below are fundamental and cannot be changed with respect to a Fund without approval by the holders of a majority of the outstanding shares of that Fund as defined in the 1940 Act, i.e., by the lesser of the vote of (a) 67% of the shares of the Fund present at a meeting where more than 50% of the outstanding shares are present in person or by proxy, or (b) more than 50% of the outstanding shares of the Fund.
S-4
None of the Funds will:
1. Concentrate its investments in a particular industry, except that any Fund with one or more industry concentrations implied by its name shall, in normal market conditions, concentrate in securities of issues within that industry or industries. For purposes of this limitation, the U.S. Government is not considered a member of any industry. Whether the Fund is concentrating in an industry shall be determined in accordance with the 1940 Act, as interpreted or modified from time to time by any regulatory authority having jurisdiction.
2. Borrow money or issue senior securities, except as permitted under the 1940 Act, as interpreted or modified from time to time by any regulatory authority having jurisdiction.
3. With respect to 75% of its total assets, purchase securities of an issuer (other than (i) securities issued by other investment companies, (ii) securities issued by the U.S. Government, its agencies, instrumentalities or authorities, or (iii) repurchase agreements fully collateralized by U.S. Government securities) if (a) such purchase would, at the time, cause more than 5% of the Fund’s total assets taken at market value to be invested in the securities of such issuer; or (b) such purchase would, at the time, result in more than 10% of the outstanding voting securities of such issuer being held by the Fund.
4. Invest in companies for the purpose of control or management.
5. Purchase physical commodities or contracts relating to physical commodities. For Nuveen Tactical Market Opportunities Fund, this restriction shall not prohibit the Fund from investing in investment companies that provide exposure to commodities, options on commodity indices, commodity futures contracts and options thereon, commodity-related swap agreements, and other commodity-related derivative instruments.
6. Purchase or sell real estate unless as a result of ownership of securities or other instruments, but this shall not prevent the Funds from investing in securities or other instruments backed by real estate or interests therein or in securities of companies that deal in real estate or mortgages.
7. Act as an underwriter of securities of other issuers, except to the extent that, in connection with the disposition of portfolio securities, it may be deemed an underwriter under applicable laws.
8. Make loans except as permitted under the 1940 Act, as interpreted or modified from time to time by any regulatory authority having jurisdiction.
For purposes of applying the limitation set forth in number 1 above, according to the current interpretation by the Securities and Exchange Commission (“SEC”), a Fund would be concentrated in an industry if 25% or more of its total assets, based on current market value at the time of purchase, were invested in that industry. The Funds will use industry classifications provided by Bloomberg, Barclays, or other similar sources to determine its compliance with this limitation.
The limitation in number 1 above refers to concentration as that term is applied under the 1940 Act, as interpreted or modified from time to time by any regulatory authority having jurisdiction. The limitation will be interpreted to permit investment without limit in the following: securities of the U.S. government and its agencies or instrumentalities; securities of state, territory, possession or municipal governments and their authorities, agencies, instrumentalities or political subdivisions; securities of foreign governments; and repurchase agreements collateralized by any such obligations. Accordingly, issuers of the foregoing securities will not be considered to be members of any industry. This limitation also does not place a limit on investment in issuers domiciled in a single jurisdiction or country.
For purposes of applying the limitation set forth in number 2 above, under the 1940 Act as currently in effect, a Fund is not permitted to issue senior securities, except that a Fund may borrow from any bank if immediately after such borrowing the value of the Fund’s total assets is at least 300% of the principal amount of all of the Fund’s borrowings (i.e., the principal amount of the borrowings may not exceed 33 1/3% of the Fund’s total assets). In the event that such asset coverage shall at any
S-5
time fall below 300% the Fund shall, within three days thereafter (not including Sundays and holidays), reduce the amount of its borrowings to an extent that the asset coverage of such borrowing shall be at least 300%.
For purposes of applying the limitation set forth in number 3 above, to the extent that the income from a municipal bond is derived from a specific project, the securities will be deemed to be from the industry of that project.
For purposes of applying the limitation set forth in number 8 above, there are no limitations with respect to unsecured loans made by a Fund to an unaffiliated party. However, when a Fund loans its portfolio securities, the obligation on the part of the Fund to return collateral upon termination of the loan could be deemed to involve the issuance of a senior security within the meaning of Section 18(f) of the 1940 Act. In order to avoid violation of Section 18(f), the Fund may not make a loan of portfolio securities if, as a result, more than one-third of its total asset value (at market value computed at the time of making a loan) would be on loan.
The following restrictions are non-fundamental and may be changed by NIF’s Board of Directors without a shareholder vote:
None of the Funds will:
1. Invest more than 15% of its net assets in all forms of illiquid investments.
2. Borrow money in an amount exceeding 10% of the borrowing Fund’s total assets. None of the Funds will borrow money for leverage purposes. For the purpose of this investment restriction, the use of options and futures transactions and the purchase of securities on a when-issued or delayed delivery basis shall not be deemed the borrowing of money. No Fund will make additional investments while its borrowings exceed 5% of total assets.
3. Make short sales of securities.
4. Lend portfolio securities representing in excess of one-third of the value of its total assets.
5. Pledge any assets, except in connection with any permitted borrowing and then in amounts not in excess of one-third of the Fund’s total assets, provided that for the purposes of this restriction, margin deposits, security interests, liens and collateral arrangements with respect to options, futures contracts, options on futures contracts, and other permitted investments and techniques are not deemed to be a pledge of assets for purposes of this limitation.
6. Acquire any securities of registered open-end investment companies or registered unit investment trusts in reliance on subparagraph (F) or subparagraph (G) of Section 12(d)(1) of the 1940 Act.
7. Except for Nuveen Tactical Market Opportunities Fund, invest directly in futures, options on futures and swaps to the extent that the Adviser would be required to register with the Commodity Futures Trading Commission (“CFTC”) as a commodity pool operator. See “Investment Policies and Techniques—Derivatives—Limitations on the Use of Futures, Options on Futures and Swaps.”
With respect to the non-fundamental restriction set forth in number 1 above, each Fund will monitor portfolio liquidity on an ongoing basis and, in the event more than 15% of a Fund’s net assets are invested in illiquid investments, the Fund will reduce its holdings of illiquid securities in an orderly fashion in order to maintain adequate liquidity. Illiquid securities will have the same meaning as it does under the 1940 Act.
The Board of Directors has adopted guidelines and procedures under which the Funds’ investment adviser is to determine whether the following types of securities which may be held by certain Funds are “liquid” and to report to the Board concerning its determinations: (i) securities eligible for resale pursuant to Rule 144A under the Securities Act of 1933; (ii) commercial paper issued in reliance on the “private placement” exemption from registration under Section 4(2) of the Securities Act of 1933, whether or not it is eligible for resale pursuant to Rule 144A; (iii) interest-only and principal-only, inverse floating and inverse interest-only securities issued or guaranteed by the U.S. Government or its agencies or instrumentalities; and (iv) municipal leases and securities that represent interests in municipal leases.
S-6
For determining compliance with its investment restriction relating to industry concentration, each Fund classifies asset-backed securities in its portfolio in separate industries based upon a combination of the industry of the issuer or sponsor and the type of collateral. The industry of the issuer or sponsor and the type of collateral will be determined by the Adviser. For example, an asset-backed security known as “Money Store 94-D A2” would be classified as follows: the issuer or sponsor of the security is The Money Store, a personal finance company, and the collateral underlying the security is automobile receivables. Therefore, the industry classification would be Personal Finance Companies—Automobile. Similarly, an asset-backed security known as “Midlantic Automobile Grantor Trust 1992-1 B” would be classified as follows: the issuer or sponsor of the security is Midlantic National Bank, a banking organization, and the collateral underlying the security is automobile receivables. Therefore, the industry classification would be Banks—Automobile. Thus, an issuer or sponsor may be included in more than one “industry” classification, as may a particular type of collateral.
With respect to any Fund that has adopted an investment strategy pursuant to Rule 35d-1 of the 1940 Act, whereby at least 80% of the Fund’s net assets (plus the amount of any borrowings for investment purposes) must be invested in a strategy suggested by the Fund’s name, a policy has been adopted by the Funds to provide shareholders with at least 60 days’ notice in the event of a planned change to the investment strategy. Such notice to shareholders will meet the requirements of Rule 35d-1(c).
INVESTMENT POLICIES AND TECHNIQUES
The following information supplements the discussion of the Funds’ investment objectives, principal investment strategies, policies and techniques that appears in the Prospectus for the Funds. Additional information concerning principal investment strategies of the Funds, and other investment strategies that may be used by the Funds, is set forth below. The Funds have attempted to identify investment strategies that will be employed in pursuing each Fund’s investment objective. Additional information concerning the Funds’ investment restrictions is set forth above under “Investment Restrictions.”
If a percentage limitation on investments by a Fund stated in this SAI or the Prospectus is adhered to at the time of an investment, a later increase or decrease in percentage resulting from changes in asset value will not be deemed to violate the limitation except in the case of the limitations on borrowing. A Fund, which is limited to investing in securities with specified ratings or of a certain credit quality, is not required to sell a security if its rating is reduced or its credit quality declines after purchase, but may consider doing so. Descriptions of the rating categories of Standard & Poor’s Ratings Services, a division of The McGraw-Hill Companies, Inc. (“Standard & Poor’s”), Fitch, Inc. (“Fitch”) and Moody’s Investors Service, Inc. (“Moody’s”) are contained in Appendix A.
References in this section to the Adviser also apply, to the extent applicable, to the Sub-Adviser(s) of the Funds.
Asset Coverage Requirements
To the extent required by SEC guidelines, a Fund will only engage in transactions that expose it to an obligation to another party if it owns either (a) an offsetting position for the same type of financial asset, or (b) cash or liquid securities, designated on the Fund’s books or held in a segregated account, with a value sufficient at all times to cover its potential obligations not covered as provided in (a). Examples of transactions governed by these asset coverage requirements include, for example, options written by the Funds, futures contracts and options on futures contracts, forward currency contracts, swaps, and when-issued and delayed delivery transactions. Assets used as offsetting positions, designated on a Fund’s books, or held in a segregated account cannot be sold while the positions requiring cover are open unless replaced with other appropriate assets. As a result, the commitment of a large portion of assets to be used as offsetting positions or to be designated or segregated in such a manner could impede portfolio management or the ability to meet redemption requests or other current obligations.
Commodity-Linked Securities
As a principal investment strategy, Nuveen Tactical Market Opportunities Fund may invest in commodity-linked exchange-traded funds (“ETFs”) and derivative securities, which are designed to provide investment exposure to commodities without direct investment in physical commodities or
S-7
commodities futures contracts. Commodities to which the Fund may gain exposure include assets such as oil, gas, industrial and precious metals, livestock, and agricultural or meat products, or other items that have tangible properties. The Fund may invest in securities that give it exposure to various commodities and commodity sectors. The value of commodity-linked securities held by the Fund may be affected by a variety of factors, including, but not limited to, overall market movements and other factors affecting the value of particular industries or commodities, such as weather, disease, embargoes, acts of war or terrorism, or political and regulatory developments.
The prices of commodity-linked securities may move in different directions than investments in traditional equity and debt securities. For example, during periods of rising inflation, debt securities have historically tended to decline in value due to the general increase in prevailing interest rates. Conversely, during those same periods of rising inflation, the prices of certain commodities, such as oil and metals, have historically tended to increase. Of course, there cannot be any guarantee that these investments will perform in that manner in the future, and at certain times the price movements of commodity-linked securities have been parallel to those of debt and equity securities. Commodities have historically tended to increase and decrease in value during different parts of the business cycle than financial assets. Nevertheless, at various times, commodities prices may move in tandem with the prices of financial assets and thus may not provide overall portfolio diversification benefits.
Convertible Securities
Nuveen Dividend Value Fund and Nuveen Tactical Market Opportunities Fund may invest in convertible securities as a principal investment strategy. Each other Fund may invest in such securities as a non-principal investment strategy. Convertible securities are bonds, debentures, notes, or other securities that may be converted or exchanged (by the holder or by the issuer) into shares of the underlying common stock (or cash or securities of equivalent value) at a stated exchange ratio. A convertible security may also be called for redemption or conversion by the issuer after a particular date and under certain circumstances (including a specified price) established upon issue. If a convertible security held by a Fund is called for redemption or conversion, the Fund could be required to tender it for redemption, convert it into the underlying common stock, or sell it to a third party.
Convertible securities generally have less potential for gain or loss than common stocks. Convertible securities generally provide yields higher than the underlying common stocks, but generally lower than comparable non-convertible securities. Because of this higher yield, convertible securities generally sell at prices above their “conversion value,” which is the current market value of the stock to be received upon conversion. The difference between this conversion value and the price of convertible securities will vary over time depending on changes in the value of the underlying common stocks and interest rates. When the underlying common stocks decline in value, convertible securities will tend not to decline to the same extent because of the interest or dividend payments and the repayment of principal at maturity for certain types of convertible securities. However, securities that are convertible other than at the option of the holder generally do not limit the potential for loss to the same extent as securities convertible at the option of the holder. When the underlying common stocks rise in value, the value of convertible securities may also be expected to increase. At the same time, however, the difference between the market value of convertible securities and their conversion value will narrow, which means that the value of convertible securities will generally not increase to the same extent as the value of the underlying common stocks. Because convertible securities may also be interest-rate sensitive, their value may increase as interest rates fall and decrease as interest rates rise. Convertible securities are also subject to credit risk, and are often lower-quality securities.
Derivatives
Subject to the limitations set forth below under “Limitations on the Use of Futures, Options on Futures and Swaps,“ each Fund may use derivative instruments, as described below. Generally, a derivative is a financial contract the value of which depends upon, or is derived from, the value of an underlying asset, reference rate or index. Derivatives generally take the form of contracts under which the parties agree to payments between them based upon the performance of a wide variety of underlying references, such as stocks, bonds, loans, commodities, interest rates, currency exchange rates, and various domestic and foreign indices. Derivative instruments that some or all of the Funds
S-8
may use include options contracts, futures contracts, options on futures contracts, forward currency contracts and swap transactions, all of which are described in more detail below.
The Funds may use derivatives for a variety of reasons, including as a substitute for investing directly in securities and currencies, as an alternative to selling a security short, as part of a hedging strategy (that is, for the purpose of reducing risk to a Fund), or for other purposes related to the management of the Funds. Derivatives permit a Fund to increase or decrease the level of risk, or change the character of the risk, to which its portfolio is exposed in much the same way as the Fund can increase or decrease the level of risk, or change the character of the risk, of its portfolio by making investments in specific securities. However, derivatives may entail investment exposures that are greater than their cost would suggest. As a result, a small investment in derivatives could have a large impact on a Fund’s performance.
Derivatives can be volatile and involve various types and degrees of risk, depending upon the characteristics of the particular derivative and the portfolio as a whole. If a Fund invests in derivatives at inopportune times or judges market conditions incorrectly, such investments may lower the Fund’s return or result in a loss. A Fund also could experience losses or limit its gains if the performance of its derivatives is poorly correlated with the underlying instruments or the Fund’s other investments, or if the Fund is unable to liquidate its position because of an illiquid secondary market. The market for derivatives is, or suddenly can become, illiquid. Changes in liquidity may result in significant, rapid and unpredictable changes in the prices for derivatives.
While transactions in some derivatives may be effected on established exchanges, many other derivatives are privately negotiated and entered into in the over-the-counter market with a single counterparty. When exchange-traded derivatives are purchased and sold, a clearing agency associated with the exchange stands between each buyer and seller and effectively guarantees performance of each contract, either on a limited basis through a guaranty fund or to the full extent of the clearing agency’s balance sheet. Transactions in over-the-counter derivatives have no such protection. Each party to an over-the-counter derivative bears the risk that its direct counterparty will default. In addition, over-the-counter derivatives may be less liquid than exchange-traded derivatives since the other party to the transaction may be the only investor with sufficient understanding of the derivative to be interested in bidding for it.
Derivatives generally involve leverage in the sense that the investment exposure created by the derivative is significantly greater than the Fund’s initial investment in the derivative. As discussed above under “—Asset Coverage Requirements,” a Fund may be required to segregate permissible liquid assets, or engage in other permitted measures, to “cover” the Fund’s obligations relating to its transactions in derivatives. For example, in the case of futures contracts or forward contracts that are not contractually required to cash settle, a Fund must set aside liquid assets equal to such contracts’ full notional value (generally, the total numerical value of the asset underlying a future or forward contract at the time of valuation) while the positions are open. With respect to futures contracts or forward contracts that are contractually required to cash settle, however, a Fund is permitted to set aside liquid assets in an amount equal to the Fund’s daily mark-to-market net obligation (i.e., the Fund’s daily net liability) under the contracts, if any, rather than such contracts’ full notional value. By setting aside assets equal to only its net obligations under cash-settled futures and forward contracts, the Fund may employ leverage to a greater extent than if the Fund were required to segregate assets equal to the full notional value of such contracts.
Derivatives also may involve other types of leverage. For example, an instrument linked to the value of a securities index may return income calculated as a multiple of the price movement of the underlying index. This leverage will increase the volatility of these derivatives since they may increase or decrease in value more quickly than the underlying instruments.
The particular derivative instruments the Funds can use are described below. A Fund’s portfolio managers may decide not to employ some or all of these instruments, and there is no assurance that any derivatives strategy used by a Fund will succeed. The Funds may employ new derivative instruments and strategies when they are developed, if those investment methods are consistent with the particular Fund’s investment objective and are permissible under applicable regulations governing the Fund.
S-9
Futures and Options on Futures
The Funds may engage in futures transactions as a principal investment strategy. The Funds may buy and sell futures contracts that relate to: (1) interest rates, (2) debt securities, (3) bond indices, (4) foreign currencies, (5) stock indices, and (6) individual stocks. The Funds also may buy and write options on the futures contracts in which they may invest (“futures options”) and may write straddles, which consist of a call and a put option on the same futures contract. The Funds will only write options and straddles which are “covered.” This means that, when writing a call option, a Fund must either segregate liquid assets with a value equal to the fluctuating market value of the optioned futures contract, or the Fund must own an option to purchase the same futures contract having an exercise price that is (i) equal to or less than the exercise price of the call written, or (ii) greater than the exercise price of the call written, provided the difference is maintained by the Fund in segregated liquid assets. When writing a put option, a Fund must segregate liquid assets in an amount not less than the exercise price, or own a put option on the same futures contract where the exercise price of the put held is (i) equal to or greater than the exercise price of the put written, or (ii) less than the exercise price of the put written, provided the difference is maintained by the Fund in segregated liquid assets. A straddle will be covered when sufficient assets are deposited to meet the Fund’s immediate obligations. A Fund may use the same liquid assets to cover both the call and put options in a straddle where the exercise price of the call and put are the same, or the exercise price of the call is higher than that of the put. In such cases, the Fund will also segregate liquid assets equivalent to the amount, if any, by which the put is “in the money.” The Funds may only enter into futures contracts and futures options which are standardized and traded on a U.S. or foreign exchange, board of trade or similar entity, or quoted on an automated quotation system.
A futures contract is an agreement between two parties to buy and sell a security, index, interest rate, or currency (each a “financial instrument”) for a set price on a future date. Certain futures contracts, such as futures contracts relating to individual securities, call for making or taking delivery of the underlying financial instrument. However, these contracts generally are closed out before delivery by entering into an offsetting purchase or sale of a matching futures contract (same exchange, underlying financial instrument, and delivery month). Other futures contracts, such as futures contracts on interest rates and indices, do not call for making or taking delivery of the underlying financial instrument, but rather are agreements pursuant to which two parties agree to take or make delivery of an amount of cash equal to the difference between the value of the financial instrument at the close of the last trading day of the contract and the price at which the contract was originally written. These contracts also may be settled by entering into an offsetting futures contract.
Unlike when a Fund purchases or sells a security, no price is paid or received by a Fund upon the purchase or sale of a futures contract. Initially, a Fund will be required to deposit with the futures broker, known as a futures commission merchant (“FCM”), an amount of cash or securities equal to a varying specified percentage of the contract amount. This amount is known as initial margin. The margin deposit is intended to ensure completion of the contract. Minimum initial margin requirements are established by the futures exchanges and may be revised. In addition, FCMs may establish margin deposit requirements that are higher than the exchange minimums. Cash held in the margin account generally is not income producing. However, coupon-bearing securities, such as Treasury securities, held in margin accounts generally will earn income. Subsequent payments to and from the FCM, called variation margin, will be made on a daily basis as the price of the underlying financial instrument fluctuates, making the futures contract more or less valuable, a process known as marking the contract to market. Changes in variation margin are recorded by a Fund as unrealized gains or losses. At any time prior to expiration of the futures contract, a Fund may elect to close the position by taking an opposite position that will operate to terminate its position in the futures contract. A final determination of variation margin is then made, additional cash is required to be paid by or released to the Fund, and the Fund realizes a gain or loss. In the event of the bankruptcy or insolvency of an FCM that holds margin on behalf of a Fund, the Fund may be entitled to the return of margin owed to it only in proportion to the amount received by the FCM’s other customers, potentially resulting in losses to the Fund. Futures transactions also involve brokerage costs and the Fund may have to segregate additional liquid assets in accordance with applicable SEC requirements. See “—Asset Coverage Requirements” above.
S-10
A futures option gives the purchaser of such option the right, in return for the premium paid, to assume a long position (call) or short position (put) in a futures contract at a specified exercise price at any time during the period of the option. Upon exercise of a call option, the purchaser acquires a long position in the futures contract and the writer is assigned the opposite short position. Upon the exercise of a put option, the opposite is true. Futures options possess many of the same characteristics as options on securities, currencies and indices (discussed below under “—Options Transactions”).
Regulation of Nuveen Tactical Market Opportunities Fund as a Commodity Pool. Effective January 1, 2013, Nuveen Tactical Market Opportunities Fund is subject to regulation as a commodity pool under the Commodity Exchange Act (“CEA”), and the Adviser has registered with the CFTC and the National Futures Association (“NFA”) as a commodity pool operator with respect to the Fund. The CFTC has proposed amendments to its rules which, upon their compliance dates, will subject the Fund and the Adviser to additional disclosure, reporting and recordkeeping rules, compliance with which is likely to increase the Fund’s expenses.
The Sub-Adviser’s investment decisions may need to be modified, and commodity contract positions held by Nuveen Tactical Market Opportunities Fund may have to be liquidated at disadvantageous times or prices, to avoid exceeding position limits established by the CFTC, potentially subjecting the Fund to substantial losses.
The regulation of commodity transactions in the United States is a rapidly changing area of law and is subject to ongoing modification by government, self-regulatory and judicial action. The effect of any future regulatory change on the Fund is impossible to predict, but could be substantial and adverse to the Fund.
Limitations on the Use of Futures, Options on Futures and Swaps. Each Fund, other than Nuveen Tactical Market Opportunities Fund, will limit its direct investments in futures, options on futures and swaps to the extent necessary for the Adviser to claim the exclusion from regulation as a commodity pool operator with respect to each such Fund under CFTC Rule 4.5, as such rule may be amended from time to time. Under Rule 4.5 as currently in effect, each such Fund will limit its trading activity in futures, option on futures and swaps (excluding activity for “bona fide hedging purposes,” as defined by the CFTC) such that it meets one of the following tests:
| | • | | Aggregate initial margin and premiums required to establish its futures, options on futures and swap positions do not exceed 5% of the liquidation value of the Fund’s portfolio, after taking into account unrealized profits and losses on such positions; or |
| | • | | Aggregate net notional value of its futures, options on futures and swap positions does not exceed 100% of the liquidation value of the Fund’s portfolio, after taking into account unrealized profits and losses on such positions. |
With respect to each such Fund, the Adviser has filed a notice of eligibility for exclusion from the definition of the term commodity pool operator under the Commodity Exchange Act and therefore is not subject to registration or regulation as a commodity pool operator thereunder.
The requirements for qualification as a regulated investment company may also limit the extent to which each Fund may invest in futures, options on futures and swaps. See “Tax Matters—Qualification as a Regulated Investment Company.”
VIX Futures. Nuveen Tactical Market Opportunities Fund may buy and sell futures contracts that track the level of the Chicago Board Options Exchange (“CBOE”) Volatility Index (“VIX”). The CBOE Volatility Index is based upon the prices of options on the S&P 500 Index that are listed on the CBOE, and is designed to reflect investors’ projection of future (30-day) stock market volatility. The value of VIX futures is dependent on the movements in the expected volatility of stock prices; it is not dependent on the direction of stock prices. Thus, VIX futures provide a way for Nuveen Tactical Market Opportunities Fund to seek to either hedge certain of its portfolio positions or to profit by correctly forecasting the future volatility in the stock market. Please see below for a description of the principal risks associated with futures, including VIX futures.
Risks Associated with Futures and Futures Options. There are risks associated with the use of futures contracts and futures options. A purchase or sale of a futures contract may result in a loss in excess of the amount invested in the futures contract.
S-11
If futures are used for hedging purposes, there can be no guarantee that there will be a correlation between price movements in the futures contract and in the underlying financial instruments that are being hedged. This could result from differences between the financial instruments being hedged and the financial instruments underlying the standard contracts available for trading (e.g., differences in interest rate levels, maturities and the creditworthiness of issuers). In addition, price movements of futures contracts may not correlate perfectly with price movements of the financial instruments underlying the futures contracts due to certain market distortions.
Successful use of futures by the Funds also is subject to a Sub-Adviser’s ability to predict correctly movements in the direction of the relevant market. For example, if a Fund uses futures to hedge against the possibility of a decline in the market value of securities held in its portfolio and the prices of such securities increase instead, the Fund will lose part or all of the benefit of the increased value of the securities which it has hedged because it will have offsetting losses in its futures positions. Furthermore, if in such circumstances the Fund has insufficient cash, it may have to sell securities to meet daily variation margin requirements. The Fund may have to sell such securities at a time when it may be disadvantageous to do so.
There can be no assurance that a liquid market will exist at a time when a Fund seeks to close out a futures or a futures option position, and the Fund would remain obligated to meet margin requirements until the position is closed. Futures exchanges may limit the amount of fluctuation permitted in certain futures contract prices during a single trading day. The daily limit establishes the maximum amount that the price of a futures contract may vary either up or down from the previous day’s settlement price at the end of the current trading session. Once the daily limit has been reached in a futures contract subject to the limit, no more trades may be made on that day at a price beyond that limit. The daily limit governs only price movements during a particular trading day and therefore does not limit potential losses because the limit may work to prevent the liquidation of unfavorable positions. For example, futures prices have occasionally moved to the daily limit for several consecutive trading days with little or no trading, thereby preventing prompt liquidation of positions and subjecting some holders of futures contracts to substantial losses.
Additional Risks Associated with Commodity Futures Contracts. There are several additional risks associated with transactions in commodity futures contracts.
Storage. Unlike the financial futures markets, in the commodity futures markets there are costs of physical storage associated with purchasing the underlying commodity. The price of the commodity futures contract will reflect the storage costs of purchasing the physical commodity, including the time value of money invested in the physical commodity. To the extent that the storage costs for an underlying commodity change while the Fund is invested in futures contracts on that commodity, the value of the futures contract may change proportionately.
Reinvestment. In the commodity futures markets, producers of the underlying commodity may decide to hedge the price risk of selling the commodity by selling futures contracts today to lock in the price of the commodity at the time of delivery. In order to induce speculators to purchase the other side of the same futures contract, the commodity producer generally must sell the futures contract at a lower price than the expected future spot price. Conversely, if most hedgers in the futures market are purchasing futures contracts to hedge against a rise in prices, then speculators will only sell the other side of the futures contract at a higher futures price than the expected future spot price of the commodity. The changing nature of the hedgers and speculators in the commodity markets will influence whether futures prices are above or below the expected future spot price, which can have significant implications for the Fund. If the nature of hedgers and speculators in futures markets has shifted when it is time for the Fund to reinvest the proceeds of a maturing contract in a new futures contract, the Fund might reinvest at higher or lower futures prices, or choose to pursue other investments.
Other Economic Factors. The commodities which underlie commodity futures contracts may be subject to additional economic and non-economic variables, such as drought, floods, weather, livestock disease, embargoes, tariffs, and international economic, political and regulatory developments. These factors may have a larger impact on commodity prices and commodity-linked instruments, including futures contracts, than on traditional securities. Certain commodities are also subject to limited pricing flexibility because of supply and demand factors. Others are subject to broad price fluctuations as a
S-12
result of the volatility of the prices for certain raw materials and the instability of supplies of other materials. These additional variables may create additional investment risks which subject the Fund’s investments to greater volatility than investments in traditional securities.
Forward Currency Contracts and other Foreign Currency Transactions
The Funds (other than Nuveen Quantitative Enhanced Core Equity Fund and the Index Funds) may enter into forward currency contracts as a principal investment strategy. A forward currency contract involves an obligation to purchase or sell a specific currency at a future date, which may be any fixed number of days from the date of the contract agreed upon by the parties, at a price set at the time of the contract. These contracts are traded directly between currency traders (usually large commercial banks) and their customers. Unlike futures contracts, which are standardized contracts, forward contracts can be specifically drawn to meet the needs of the parties that enter into them. The parties to a forward currency contract may agree to offset or terminate the contract before its maturity, or may hold the contract to maturity and complete the contemplated exchange. Because forward contracts are not traded on an exchange, the Funds are subject to the credit and performance risk of the counterparties to such contracts.
The following summarizes the principal currency management strategies involving forward contracts that may be used by the Funds. These Funds also may use currency futures contracts and options thereon (see “—Futures and Options on Futures” above), and put and call options on foreign currencies (see “—Options Transactions” below) for the same purposes.
Transaction Hedges. When a Fund enters into a contract for the purchase or sale of a security denominated in a foreign currency, or when it anticipates receiving dividend payments in a foreign currency, the Fund might wish to lock in the U.S. dollar price of the security or the U.S. dollar equivalent of the dividend payments. To do so, the Fund could enter into a forward contract for the purchase or sale of the amount of foreign currency involved in the underlying transaction at a fixed amount of U.S. dollars per unit of the foreign currency. This is known as a “transaction hedge.” A transaction hedge will protect a Fund against a loss from an adverse change in the currency exchange rate during the period between the date on which the security is purchased or sold or on which the payment is declared, and the date on which the payment is made or received. Forward contracts to purchase or sell a foreign currency may also be used by a Fund in anticipation of future purchases or sales of securities denominated in a foreign currency, even if the specific investments have not yet been selected by a Sub-Adviser. This strategy is sometimes referred to as “anticipatory hedging.”
Position Hedges. A Fund could also use forward contracts to lock in the U.S. dollar value of portfolio positions. This is known as a “position hedge.” When a Fund believes that a foreign currency might suffer a substantial decline against the U.S. dollar, it could enter into a forward contract to sell an amount of that foreign currency approximating the value of some or all of the Fund’s portfolio securities denominated in that foreign currency. When a Fund believes that the U.S. dollar might suffer a substantial decline against a foreign currency, it could enter into a forward contract to buy that foreign currency for a fixed dollar amount. Alternatively, a Fund could enter into a forward contract to sell a different foreign currency for a fixed U.S. dollar amount if the Fund believes that the U.S. dollar value of that foreign currency will fall whenever there is a decline in the U.S. dollar value of the currency in which portfolio securities of the Fund are denominated. This is referred to as a “cross hedge.”
Shifting Currency Exposure. A Fund may also enter into forward contracts to shift its investment exposure from one currency into another. This may include shifting exposure from U.S. dollars to foreign currency or from one foreign currency to another foreign currency. This strategy tends to limit exposure to the currency sold, and increase exposure to the currency that is purchased, much as if a Fund had sold a security denominated in one currency and purchased an equivalent security denominated in another currency.
Risks Associated with Forward Currency Transactions. A Sub-Adviser’s decision whether to enter into foreign currency transactions will depend in part on its view regarding the direction and amount in which exchange rates are likely to move. The forecasting of movements in exchange rates is extremely difficult, so that it is highly uncertain whether a currency management strategy, if undertaken, would be successful. To the extent that a Sub-Adviser’s view regarding future exchange rates proves to have been incorrect, a Fund may realize losses on its foreign currency transactions. Even if a foreign currency hedge is effective in protecting a Fund from losses resulting from
S-13
unfavorable changes in exchange rates between the U.S. dollar and foreign currencies, it also would limit the gains which might be realized by the Fund from favorable changes in exchange rates.
Options Transactions
To the extent set forth below, the Funds may purchase put and call options on specific securities (including groups or “baskets” of specific securities), interest rates, stock indices, bond indices, and/or foreign currencies. In addition, the Funds may write put and call options on such financial instruments. Options on futures contracts are discussed above under “— Futures and Options on Futures.”
Options on Securities. As a principal investment strategy, the Funds (other than the Index Funds) may purchase put and call options on securities they own or have the right to acquire. A put option on a security gives the purchaser of the option the right (but not the obligation) to sell, and the writer of the option the obligation to buy, the underlying security at a stated price (the “exercise price”) at any time before the option expires. A call option on a security gives the purchaser the right (but not the obligation) to buy, and the writer the obligation to sell, the underlying security at the exercise price at any time before the option expires. The purchase price for a put or call option is the “premium” paid by the purchaser for the right to sell or buy.
A Fund may purchase put options to hedge against a decline in the value of its portfolio. By using put options in this way, a Fund would reduce any profit it might otherwise have realized in the underlying security by the amount of the premium paid for the put option and by transaction costs. In similar fashion, a Fund may purchase call options to protect against an increase in the price of securities that the Fund anticipates purchasing in the future, a practice sometimes referred to as “anticipatory hedging.” The premium paid for the call option plus any transaction costs will reduce the benefit, if any, realized by the Fund upon exercise of the option, and, unless the price of the underlying security rises sufficiently, the option may expire unexercised.
Options on Interest Rates and Indices. As principal investment strategies, the Funds may purchase put and call options on interest rates and on stock and bond indices. An option on interest rates or on an index gives the holder the right to receive, upon exercise of the option, an amount of cash if the closing value of the underlying interest rate or index is greater than, in the case of a call, or less than, in the case of a put, the exercise price of the option. This amount of cash is equal to the difference between the exercise-settlement value of the interest rate option or the closing price of the index and the exercise price of the option expressed in dollars times a specified multiple (the “multiplier”). The writer of the option is obligated, for the premium received, to make delivery of this amount. Settlements for interest rate and index options are always in cash.
Options on Currencies. The Funds (other than Nuveen Quantitative Enhanced Core Equity Fund and the Index Funds) may purchase put and call options on foreign currencies as a principal investment strategy. A foreign currency option provides the option buyer with the right to buy or sell a stated amount of foreign currency at the exercise price at a specified date or during the option period. A call option gives its owner the right, but not the obligation, to buy the currency, while a put option gives its owner the right, but not the obligation, to sell the currency. The option seller (writer) is obligated to fulfill the terms of the option sold if it is exercised. However, either seller or buyer may close its position during the option period in the secondary market for such options at any time prior to expiration.
A foreign currency call option rises in value if the underlying currency appreciates. Conversely, a foreign currency put option rises in value if the underlying currency depreciates. While purchasing a foreign currency option may protect a Fund against an adverse movement in the value of a foreign currency, it would limit the gain which might result from a favorable movement in the value of the currency. For example, if the Fund were holding securities denominated in an appreciating foreign currency and had purchased a foreign currency put to hedge against a decline in the value of the currency, it would not have to exercise its put. In such an event, however, the amount of the Fund’s gain would be offset in part by the premium paid for the option. Similarly, if the Fund entered into a contract to purchase a security denominated in a foreign currency and purchased a foreign currency call to hedge against a rise in the value of the currency between the date of purchase and the settlement date, the Fund would not need to exercise its call if the currency instead depreciated in value. In such a case, the Fund could acquire the amount of foreign currency needed for settlement in the spot market at a lower price than the exercise price of the option.
S-14
Writing Options. The Funds may write (sell) covered put and call options as a principal investment strategy. These transactions would be undertaken principally to produce additional income. The Funds receive a premium from writing options which it retains whether or not the option is exercised. The Funds may write covered straddles consisting of a combination of a call and a put written on the same underlying instrument.
The Funds will write options only if they are “covered.” In the case of a call option on a security, the option is covered if the Fund owns the security underlying the call or has an absolute and immediate right to acquire that security without additional cash consideration (or, if additional cash consideration is required, cash or other liquid assets in such amount are segregated) upon conversion or exchange of the securities held by the Fund. For a call option on an index or currency, the option is covered if the Fund segregates liquid assets in an amount equal to the contract value of the index or currency. A call option is also covered if the Fund holds a call on the same security, index or currency as the call written where the exercise price of the call held is (i) equal to or less than the exercise price of the call written, or (ii) greater than the exercise price of the call written, provided the difference is maintained by the Fund in segregated liquid assets. A put option on a security, currency or index is “covered” if the Fund segregates liquid assets equal to the exercise price. A put option is also covered if the Fund holds a put on the same security, currency or index as the put written where the exercise price of the put held is (i) equal to or greater than the exercise price of the put written, or (ii) less than the exercise price of the put written, provided the difference is maintained by the Fund in segregated liquid assets. A straddle will be covered when sufficient assets are deposited to meet the Fund’s immediate obligations. The Fund may use the same liquid assets to cover both the call and put options in a straddle where the exercise price of the call and put are the same, or the exercise price of the call is higher than that of the put. In such cases, the Fund will also segregate liquid assets equivalent to the amount, if any, by which the put is “in the money.”
Expiration or Exercise of Options. If an option written by a Fund expires unexercised, the Fund realizes a capital gain equal to the premium received at the time the option was written. If an option purchased by a Fund expires unexercised, the Fund realizes a capital loss equal to the premium paid. Prior to the earlier of exercise or expiration, an exchange traded option may be closed out by an offsetting purchase or sale of an option of the same series (type, exchange, underlying security, currency or index, exercise price, and expiration). There can be no assurance, however, that a closing purchase or sale transaction can be effected when the Fund desires.
A Fund may sell put or call options it has previously purchased, which could result in a net gain or loss depending on whether the amount realized on the sale is more or less than the premium and other transaction costs paid on the put or call option which is sold. Prior to exercise or expiration, an option may be closed out by an offsetting purchase or sale of an option of the same series. A Fund will realize a capital gain from a closing purchase transaction if the cost of the closing option is less than the premium received from writing the option, or, if it is more, the Fund will realize a capital loss. If the premium received from a closing sale transaction is more than the premium paid to purchase the option, the Fund will realize a capital gain or, if it is less, the Fund will realize a capital loss. The principal factors affecting the market value of a put or a call option include supply and demand, interest rates, the current market price of the underlying security, currency or index in relation to the exercise price of the option, the volatility of the underlying security, currency or index, and the time remaining until the expiration date.
Risks Associated with Options Transactions. There are several risks associated with options transactions. For example, there are significant differences between the securities and options markets that could result in an imperfect correlation between these markets, causing a given transaction not to achieve its objectives. A decision as to whether, when and how to use options involves the exercise of skill and judgment, and even a well-conceived transaction may be unsuccessful to some degree because of market behavior or unexpected events.
When a Fund purchases a put or call option, it risks a total loss of the premium paid for the option, plus any transaction costs, if the price of the underlying security does not increase or decrease sufficiently to justify the exercise of such option. Also, where a put or call option on a particular security is purchased to hedge against price movements in a related security, the price of the put or call option may move more or less than the price of the related security.
S-15
There can be no assurance that a liquid market will exist when a Fund seeks to close out an option position. If a Fund were unable to close out an option that it had purchased on a security, it would have to exercise the option in order to realize any profit or the option may expire worthless. If a Fund were unable to close out a covered call option that it had written on a security, it would not be able to sell the underlying security unless the option expired without exercise. There is also a risk that, if restrictions on exercise were imposed, a Fund might be unable to exercise an option it had purchased.
With respect to options written by the Funds during the option period, the covered call writer has, in return for the premium on the option, given up the opportunity to profit from a price increase in the underlying security above the exercise price, but, as long as its obligation as a writer continues, has retained the risk of loss should the price of the underlying security decline. The writer of an option has no control over the time when it may be required to fulfill its obligations as a writer of the option. Once an option writer has received an exercise notice, it cannot effect a closing purchase transaction in order to terminate its obligation under the option and must deliver the underlying security at the exercise price.
Swap Transactions
Nuveen Tactical Market Opportunities Fund may enter into total return, interest rate, currency and credit default swap agreements and interest rate caps, floors and collars as a principal investment strategy. The Fund may also enter into options on the foregoing types of swap agreements (“swap options”).
The Fund may enter into swap transactions for any purpose consistent with its investment objectives and strategies, such as for the purpose of attempting to obtain or preserve a particular return or spread at a lower cost than obtaining a return or spread through purchases and/or sales of instruments in other markets, to protect against currency fluctuations, as a duration management technique, to protect against an increase in the price of securities the Fund anticipates purchasing at a later date, to reduce risk arising from the ownership of a particular instrument, or to gain exposure to certain securities, sectors or markets in the most economical way possible.
Swap agreements are two party contracts entered into primarily by institutional investors for a specified period of time. In a standard swap transaction, two parties agree to exchange the returns (or differentials in rates of return) earned or realized on a particular predetermined asset, reference rate or index. The gross returns to be exchanged or swapped between the parties are generally calculated with respect to a notional amount, e.g., the return on or increase in value of a particular dollar amount invested at a particular interest rate or in a basket of securities representing a particular index. The notional amount of the swap agreement generally is only used as a basis upon which to calculate the obligations that the parties to the swap agreement have agreed to exchange. The Fund’s current obligations under a net swap agreement will be accrued daily (offset against any amounts owed to the Fund) and any accrued but unpaid net amounts owed to a swap counterparty will be covered by assets determined to be liquid by a Sub-Adviser. See “—Asset Coverage Requirements” above.
Interest Rate Swaps, Caps, Collars and Floors. Interest rate swaps are bilateral contracts in which each party agrees to make periodic payments to the other party based on different referenced interest rates (e.g., a fixed rate and a floating rate) applied to a specified notional amount. The purchase of an interest rate floor entitles the purchaser, to the extent that a specified index falls below a predetermined interest rate, to receive payments of interest on a notional principal amount from the party selling such interest rate floor. The purchase of an interest rate cap entitles the purchaser, to the extent that a specified index rises above a predetermined interest rate, to receive payments of interest on a notional principal amount from the party selling such interest rate cap. Interest rate collars involve selling a cap and purchasing a floor or vice versa to protect the Fund against interest rate movements exceeding given minimum or maximum levels.
Currency Swaps. A currency swap is an agreement between two parties to exchange equivalent fixed amounts in two different currencies for a fixed period of time. The exchange of currencies at the inception date of the contract takes place at the current spot rate. Such an agreement may provide that, for the duration of the swap, each party pays interest to the other on the received amount at an agreed upon fixed or floating interest rate. When the contract ends, the parties re-exchange the currencies at the initial exchange rate, a specified rate, or the then current spot rate. Some currency swaps may not provide for exchanging currencies, but only for exchanging interest cash flows.
S-16
Total Return Swaps. In a total return swap, one party agrees to pay the other the “total return” of a defined underlying asset during a specified period, in return for periodic payments based on a fixed or variable interest rate or the total return from other underlying assets. A total return swap may be applied to any underlying asset but is most commonly used with equity indices, single stocks, bonds and defined baskets of loans and mortgages. The Fund might enter into a total return swap involving an underlying index or basket of securities to create exposure to a potentially widely-diversified range of securities in a single trade. An index total return swap can be used by the portfolio managers to assume risk, without the complications of buying the component securities from what may not always be the most liquid of markets.
Credit Default Swaps. A credit default swap is a bilateral contract that enables an investor to buy or sell protection against a defined-issuer credit event. The Fund may enter into credit default swap agreements either as a buyer or a seller. The Fund may buy protection to attempt to mitigate the risk of default or credit quality deterioration in one or more of its individual holdings or in a segment of the fixed income securities market to which it has exposure, or to take a “short” position in individual bonds or market segments which it does not own. The Fund may sell protection in an attempt to gain exposure to the credit quality characteristics of particular bonds or market segments without investing directly in those bonds or market segments.
As the buyer of protection in a credit default swap, the Fund will pay a premium (by means of an upfront payment or a periodic stream of payments over the term of the agreement) in return for the right to deliver a referenced bond or group of bonds to the protection seller and receive the full notional or par value (or other agreed upon value) upon a default (or similar event) by the issuer(s) of the underlying referenced obligation(s). If no default occurs, the protection seller would keep the stream of payments and would have no further obligation to the Fund. Thus, the cost to the Fund would be the premium paid with respect to the agreement. If a credit event occurs, however, the Fund may elect to receive the full notional value of the swap in exchange for an equal face amount of deliverable obligations of the reference entity that may have little or no value. The Fund bears the risk that the protection seller may fail to satisfy its payment obligations.
If the Fund is a seller of protection in a credit default swap and no credit event occurs, the Fund would generally receive an up-front payment or a periodic stream of payments over the term of the swap. If a credit event occurs, however, generally the Fund would have to pay the buyer the full notional value of the swap in exchange for an equal face amount of deliverable obligations of the reference entity that may have little or no value. As the protection seller, the Fund effectively adds economic leverage to its portfolio because, in addition to being subject to investment exposure on its total net assets, the Fund is subject to investment exposure on the notional amount of the swap. Thus, the Fund bears the same risk as it would by buying the reference obligations directly, plus the additional risks related to obtaining investment exposure through a derivative instrument discussed below under “—Risks Associated with Swap Transactions.”
Swap Options. A swap option is a contract that gives a counterparty the right (but not the obligation), in return for payment of a premium, to enter into a new swap agreement or to shorten, extend, cancel, or otherwise modify an existing swap agreement at some designated future time on specified terms. A cash-settled option on a swap gives the purchaser the right, in return for the premium paid, to receive an amount of cash equal to the value of the underlying swap as of the exercise date. The Fund may write (sell) and purchase put and call swap options. Depending on the terms of the particular option agreement, the Fund generally will incur a greater degree of risk when it writes a swap option than when it purchases a swap option. When the Fund purchases a swap option, it risks losing only the amount of the premium it has paid should it decide to let the option expire unexercised. However, when the Fund writes a swap option, upon exercise of the option the Fund will become obligated according to the terms of the underlying agreement.
Risks Associated with Swap Transactions. The use of swap transactions is a highly specialized activity which involves strategies and risks different from those associated with ordinary portfolio security transactions. If a Sub-Adviser is incorrect in its forecasts of default risks, market spreads or other applicable factors the investment performance of the Fund would diminish compared with what it would have been if these techniques were not used. As the protection seller in a credit default swap, the Fund effectively adds economic leverage to its portfolio because, in addition to being subject to investment exposure on its total net assets, the Fund is subject to investment exposure on the notional amount of the swap. The Fund may
S-17
only close out a swap, cap, floor, collar or other two-party contract with its particular counterparty, and may only transfer a position with the consent of that counterparty. In addition, the price at which the Fund may close out such a two party contract may not correlate with the price change in the underlying reference asset. If the counterparty defaults, the Fund will have contractual remedies, but there can be no assurance that the counterparty will be able to meet its contractual obligations or that the Fund will succeed in enforcing its rights. It also is possible that developments in the derivatives market, including potential government regulation, could adversely affect the Fund’s ability to terminate existing swap or other agreements or to realize amounts to be received under such agreements.
Exchange-Traded Funds
Nuveen International Fund, Nuveen International Select Fund, Nuveen Quantitative Enhanced Core Equity Fund, and Nuveen Tactical Market Opportunities Fund may invest in ETFs as a principal investment strategy. The other Funds may invest in ETFs as a non-principal investment strategy. ETFs are a type of index fund bought and sold on a securities exchange. An ETF trades like common stock and represents a portfolio of securities designed to track a particular market index. A Fund could purchase an ETF to gain exposure to all or a portion of the U.S. market, a foreign market, a region, a commodity, a currency, or to any other index that an ETF tracks. The risks of owning an ETF generally reflect the risks of owning the underlying securities they are designed to track, although lack of liquidity in an ETF could result in it being more volatile and ETFs have management fees that increase their costs. An ETF may fail to accurately track the returns of the market segment or index that it is designed to track, and the price of an ETF’s shares may fluctuate. In addition, because they, unlike traditional mutual funds, are traded on an exchange, ETFs are subject to the following risks: (i) the performance of the ETF may not replicate the performance of the underlying index that it is designed to track; (ii) the market price of the ETF’s shares may trade at a premium or discount to the ETF’s net asset value; (iii) an active trading market for an ETF may not develop or be maintained; and (iv) there is no assurance that the requirements of the exchange necessary to maintain the listing of the ETF will continue to be met or remain unchanged. In the event substantial market or other disruptions affecting ETFs should occur in the future, the liquidity and value of the Fund’s shares could also be substantially and adversely affected.
An investment company’s investments in other investment companies are typically subject to statutory limitations prescribed by the 1940 Act. Many ETFs, however, have obtained exemptive relief from the SEC to permit unaffiliated funds (such as a Fund) to invest in their shares beyond these statutory limits, subject to certain conditions and pursuant to contractual arrangements between the ETFs and the investing funds. Nuveen Tactical Market Opportunities Fund may rely on these exemptive orders in investing in ETFs.
Exchange-Traded Notes
The Funds may invest in exchange-traded notes (“ETNs”) as a non-principal investment strategy. ETNs are a type of senior, unsecured, unsubordinated debt security issued by financial institutions that combines both aspects of bonds and ETFs. An ETN’s returns are based on the performance of a market index minus fees and expenses. Similar to ETFs, ETNs are listed on an exchange and traded in the secondary market. However, unlike an ETF, an ETN can be held until the ETN’s maturity, at which time the issuer will pay a return linked to the performance of the market index to which the ETN is linked minus certain fees.
Unlike regular bonds, ETNs do not make periodic interest payments and principal is not protected. ETNs are subject to credit risk and the value of an ETN may drop due to a downgrade in the issuer’s credit rating, despite the underlying market benchmark or strategy remaining unchanged. The value of an ETN may also be influenced by time to maturity, level of supply and demand for the ETN, volatility and lack of liquidity in underlying assets, changes in the applicable interest rates, changes in the issuer’s credit rating, and economic, legal, political, or geographic events that affect the referenced underlying asset. When a Fund invests in ETNs it will bear its proportionate share of any fees and expenses borne by the ETN. A Fund’s decision to sell its ETN holdings may be limited by the availability of a secondary market. In addition, although an ETN may be listed on an exchange, the issuer may not be required to maintain the listing and there can be no assurance that a secondary market will exist for an ETN.
ETNs are also subject to tax risk. No assurance can be given that the Internal Revenue Service (“IRS”) will accept, or a court will uphold, how the Funds characterize and treat ETNs for tax purposes.
S-18
Further, the IRS and Congress have considered proposals that would change the timing and character of income and gains from ETNs.
An ETN that is tied to a specific market benchmark or strategy may not be able to replicate and maintain exactly the composition and relative weighting of securities, commodities or other components in the applicable market benchmark or strategy. Some ETNs that use leverage can, at times, be relatively illiquid and, thus, they may be difficult to purchase or sell at a fair price. Leveraged ETNs are subject to the same risk as other instruments that use leverage in any form.
The market value of ETN shares may differ from their market benchmark or strategy. This difference in price may be due to the fact that the supply and demand in the market for ETN shares at any point in time is not always identical to the supply and demand in the market for the securities, commodities or other components underlying the market benchmark or strategy that the ETN seeks to track. As a result, there may be times when an ETN share trades at a premium or discount to its market benchmark or strategy.
Fixed Income Securities
The Funds may invest in or have exposure to the fixed income securities described below as either a principal or non-principal investment strategy, as indicated. These securities are subject to (i) interest rate risk (the risk that increases in market interest rates will cause declines in the value of debt securities held by a Fund); (ii) credit risk (the risk that the issuers of debt securities held by a Fund default in making required payments); and (iii) call or prepayment risk (the risk that a borrower may exercise the right to prepay a debt obligation before its stated maturity, requiring a Fund to reinvest the prepayment at a lower interest rate).
U.S. Government Securities
Each Fund, other than Nuveen Tactical Market Opportunities Fund, may invest in U.S. government securities as a non-principal investment strategy. Nuveen Tactical Market Opportunities Fund may invest in U.S. Treasury obligations as a principal investment strategy. The U.S. government securities in which the Funds may invest are either issued or guaranteed by the U.S. government, its agencies or instrumentalities. The U.S. government securities in which the Funds invest principally are:
| | • | | direct obligations of the U.S. Treasury, such as U.S. Treasury bills, notes, and bonds; |
| | • | | notes, bonds, and discount notes issued and guaranteed by U.S. government agencies and instrumentalities supported by the full faith and credit of the United States; |
| | • | | notes, bonds, and discount notes of U.S. government agencies or instrumentalities which receive or have access to federal funding; and |
| | • | | notes, bonds, and discount notes of other U.S. government instrumentalities supported only by the credit of the instrumentalities. |
U.S. Treasury obligations include separately traded interest and principal component parts of such obligations, known as Separately Traded Registered Interest and Principal Securities (“STRIPS”), which are transferable through the Federal book-entry system. STRIPS are sold as zero coupon securities, which means that they are sold at a substantial discount and redeemed at face value at their maturity date without interim cash payments of interest or principal. This discount is accreted over the life of the security, and such accretion will constitute the income earned on the security for both accounting and tax purposes. Because of these features, such securities may be subject to greater interest rate volatility than interest paying U.S. Treasury obligations.
The government securities in which the Funds may invest are backed in a variety of ways by the U.S. government or its agencies or instrumentalities. Some of these securities, such as Government National Mortgage Association (“GNMA”) mortgage-backed securities, are backed by the full faith and credit of the U.S. government. Other securities, such as obligations of the Federal National Mortgage Association (“FNMA”) or the Federal Home Loan Mortgage Corporation (“FHLMC”) are backed by the credit of the agency or instrumentality issuing the obligations but not the full faith and credit of the U.S. government. No assurances can be given that the U.S. government will provide financial support to these other agencies or instrumentalities because it is not obligated to do so. See “—Agency Pass-Through Certificates” below for a description of these securities.
S-19
Agency Pass-Through Certificates
The Funds may invest in Agency Pass-Through Certificates to the same extent they can invest in U.S. government securities. Agency Pass-Through Certificates are mortgage pass-through certificates representing undivided interests in pools of residential mortgage loans. Distribution of principal and interest on the mortgage loans underlying an Agency Pass-Through Certificate is an obligation of or guaranteed by GNMA, FNMA or FHLMC. GNMA is a wholly owned corporate instrumentality of the United States within the Department of Housing and Urban Development. The guarantee of GNMA with respect to GNMA certificates is backed by the full faith and credit of the United States, and GNMA is authorized to borrow from the U.S. Treasury in an amount which is at any time sufficient to enable GNMA, with no limitation as to amount, to perform its guarantee.
FNMA is a federally chartered and privately owned corporation organized and existing under federal law. Although the Secretary of the Treasury of the United States has discretionary authority to lend funds to FNMA, neither the United States nor any agency thereof is obligated to finance FNMA’s operations or to assist FNMA in any other manner.
FHLMC is a federally chartered corporation organized and existing under federal law, the common stock of which is owned by the Federal Home Loan Banks. Neither the United States nor any agency thereof is obligated to finance FHLMC’s operations or to assist FHLMC in any other manner.
The mortgage loans underlying GNMA certificates are partially or fully guaranteed by the Federal Housing Administration or the Veterans Administration, while the mortgage loans underlying FNMA certificates and FHLMC certificates are conventional mortgage loans which are, in some cases, insured by private mortgage insurance companies. Agency Pass-Through Certificates may be issued in a single class with respect to a given pool of mortgage loans or in multiple classes.
The residential mortgage loans evidenced by Agency Pass-Through Certificates generally are secured by first mortgages on one- to four-family residential dwellings. Such mortgage loans generally have final maturities ranging from 15 to 40 years and generally provide for monthly payments in amounts sufficient to amortize their original principal amounts by the maturity dates. Each monthly payment on such mortgage loans generally includes both an interest component and a principal component, so that the holder of the mortgage loans receives both interest and a partial return of principal in each monthly payment. In general, such mortgage loans can be prepaid by the borrowers at any time without any prepayment penalty. In addition, many such mortgage loans contain a “due-on-sale” clause requiring the loans to be repaid in full upon the sale of the property securing the loans. Because residential mortgage loans generally provide for monthly amortization and may be prepaid in full at any time, the weighted average maturity of a pool of residential mortgage loans is likely to be substantially shorter than its stated final maturity date. The rate at which a pool of residential mortgage loans is prepaid may be influenced by many factors and is not predictable with precision.
Corporate Debt Securities
Nuveen Tactical Market Opportunities Fund may invest in or have exposure to corporate debt securities as a principal investment strategy. Each Fund, other than Nuveen Tactical Market Opportunities Fund, may invest in corporate debt securities as a non-principal investment strategy. Corporate debt securities are fully taxable debt obligations issued by corporations. These securities fund capital improvements, expansions, debt refinancing or acquisitions that require more capital than would ordinarily be available from a single lender. Investors in corporate debt securities lend money to the issuing corporation in exchange for interest payments and repayment of the principal at a set maturity date. Rates on corporate debt securities are set according to prevailing interest rates at the time of the issue, the credit rating of the issuer, the length of the maturity and other terms of the security, such as a call feature. Corporate debt securities are subject to the risk of an issuer’s inability to meet principal and interest payments on the obligations and may also be subject to price volatility due to such factors as market interest rates, market perception of the creditworthiness of the issuer and general market liquidity. In addition, corporate restructurings, such as mergers, leveraged buyouts, takeovers or similar corporate transactions are often financed by an increase in a corporate issuer’s debt securities. As a result of the added debt burden, the credit quality and market value of an issuer’s existing debt securities may decline significantly. Except as described below under
S-20
“—Debt Obligations Rated Less than Investment Grade,” investments in nonconvertible corporate debt securities will be limited to investment-grade securities, defined as securities which are rated at the time of purchase by two of Moody’s, Standard & Poor’s and Fitch not less than Baa, BBB and BBB (or the equivalent short-term ratings), respectively, unless only one of those rating agencies provides a rating, in which case that rating must be at least Baa or BBB, or which are of comparable quality in the judgment of a Sub-Adviser.
Repurchase Agreements
Each of the Funds, other than Nuveen Tactical Market Opportunities Fund, may invest in repurchase agreements as a non-principal investment strategy. Ordinarily, a Fund does not expect its investment in repurchase agreements to exceed 10% of its total assets. However, because a Fund may invest without limit in cash and short-term securities for temporary defensive purposes, there is no limit on a Fund’s ability to invest in repurchase agreements. A repurchase agreement involves the purchase by a Fund of securities with the agreement that after a stated period of time, the original seller will buy back the same securities (“collateral”) at a predetermined price or yield. Repurchase agreements involve certain risks not associated with direct investments in securities. If the original seller defaults on its obligation to repurchase as a result of its bankruptcy or otherwise, the purchasing Fund will seek to sell the collateral, which could involve costs or delays. Although collateral (which may consist of any fixed income security which is an eligible investment for the Fund entering into the repurchase agreement) will at all times be maintained in an amount equal to the repurchase price under the agreement (including accrued interest), a Fund would suffer a loss if the proceeds from the sale of the collateral were less than the agreed-upon repurchase price. A Sub-Adviser will monitor the creditworthiness of the firms with which the Funds enter into repurchase agreements.
The Funds’ custodian will hold the securities underlying any repurchase agreement, or the securities will be part of the Federal Reserve/Treasury Book Entry System. The market value of the collateral underlying the repurchase agreement will be determined on each business day. If at any time the market value of the collateral falls below the repurchase price under the repurchase agreement (including any accrued interest), the appropriate Fund will promptly receive additional collateral (so the total collateral is an amount at least equal to the repurchase price plus accrued interest).
Debt Obligations Rated Less Than Investment Grade
The Funds may invest in or have exposure to both investment grade and non-investment grade debt obligations. Debt obligations rated less than “investment grade” are sometimes referred to as “high yield securities” or “junk bonds.” To be consistent with the ratings methodology used by Barclays, a debt obligation is considered to be rated “investment grade” if two of Moody’s, Standard & Poor’s and Fitch rate the security investment-grade (i.e. at least Baa, BBB and BBB, respectively). If ratings are provided by only two of those rating agencies, the more conservative rating is used to determine whether the security is investment-grade. If only one of those rating agencies provides a rating, that rating is used. Nuveen Dividend Value Fund may invest up to 5% of its total assets in debt obligations without regard to their ratings. Each other Fund may invest in non-investment grade debt obligations rated at least B by two of Standard & Poor’s, Moody’s and Fitch, unless only one of those rating agencies rates the security, in which case that rating must be at least B, or in unrated securities determined to be of comparable quality.
The “equity securities” in which certain Funds may invest include corporate debt obligations which are convertible into common stock (see “—Convertible Securities” above). Nuveen Dividend Value Fund and Nuveen Tactical Market Opportunities Fund may invest in convertible securities without regard to their ratings, and therefore may hold convertible securities that are rated less than investment grade. Each of the other Funds may invest up to 5% of its net assets in less than investment grade convertible securities.
Yields on non-investment grade debt obligations will fluctuate over time. The prices of such obligations have been found to be less sensitive to interest rate changes than higher rated obligations, but more sensitive to adverse economic changes or individual corporate developments. Also, during an economic downturn or period of rising interest rates, highly leveraged issuers may experience financial stress which could adversely affect their ability to service principal and interest
S-21
payment obligations, to meet projected business goals, and to obtain additional financing. In addition, periods of economic uncertainty and changes can be expected to result in increased volatility of market prices of non-investment grade debt obligations. If the issuer of a security held by a Fund defaulted, the Fund might incur additional expenses to seek recovery.
In addition, the secondary trading market for non-investment grade debt obligations may be less developed than the market for investment grade obligations. This may make it more difficult for a Fund to value and dispose of such obligations. Adverse publicity and investor perceptions, whether or not based on fundamental analysis, may decrease the values and liquidity of non-investment grade obligations, especially in a thin secondary trading market.
Certain risks also are associated with the use of credit ratings as a method for evaluating non-investment grade debt obligations. For example, credit ratings evaluate the safety of principal and interest payments, not the market value risk of such obligations. In addition, credit rating agencies may not timely change credit ratings to reflect current events. Thus, the success of a Fund’s use of non-investment grade debt obligations may be more dependent on a Sub-Adviser’s own credit analysis than is the case with investment grade obligations.
Variable, Floating, and Fixed Rate Debt Obligations
The debt obligations in which the Funds invest or have exposure to as either a principal or non-principal investment strategy may have variable, floating, or fixed interest rates. Variable rate securities provide for periodic adjustments in the interest rate. Floating rate securities are generally offered at an initial interest rate which is at or above prevailing market rates. The interest rate paid on floating rate securities is then reset periodically (commonly every 90 days) to an increment over some predetermined interest rate index. Commonly utilized indices include the three-month Treasury bill rate, the 180-day Treasury bill rate, the one-month or three-month London Interbank Offered Rate (LIBOR), the prime rate of a bank, the commercial paper rates, or the longer-term rates on U.S. Treasury securities. Variable and floating rate securities are relatively long-term instruments that often carry demand features permitting the holder to demand payment of principal at any time or at specified intervals prior to maturity. In order to most effectively use these securities, a Sub-Adviser must correctly assess probable movements in interest rates. If a Sub-Adviser incorrectly forecasts such movements, a Fund could be adversely affected by use of variable and floating rate securities.
Fixed rate securities pay a fixed rate of interest and tend to exhibit more price volatility during times of rising or falling interest rates than securities with variable or floating rates of interest. The value of fixed rate securities will tend to fall when interest rates rise and rise when interest rates fall. The value of variable or floating rate securities, on the other hand, fluctuates much less in response to market interest rate movements than the value of fixed rate securities. This is because variable and floating rate securities behave like short-term instruments in that the rate of interest they pay is subject to periodic adjustments according to a specified formula, usually with reference to some interest rate index or market interest rate. Fixed rate securities with short-term characteristics are not subject to the same price volatility as fixed rate securities without such characteristics. Therefore, they behave more like variable or floating rate securities with respect to price volatility.
Inflation Protected Securities
Nuveen Tactical Market Opportunities Fund may invest in inflation protected securities as a principal investment strategy. Two structures are common. The U.S. Treasury and some other issuers use a structure that accrues inflation into the principal value of the bond. Most other issuers pay out the inflation accruals as part of a semiannual coupon.
Inflation protected securities issued by the U.S. Treasury have maturities of five, ten, twenty or thirty years, although it is possible that securities with other maturities will be issued in the future. The U.S. Treasury securities pay interest on a semi-annual basis, equal to a fixed percentage of the inflation-adjusted principal amount. For example, if the Fund purchased an inflation protected bond with a par value of $1,000 and a 3% real rate of return coupon (payable 1.5% semi-annually), and inflation over the first six months were 1%, the mid-year par value of the bond would be $1,010 and the first semi-annual interest payment would be $15.15 ($1,010 times 1.5%). If inflation during the second half of the year resulted in the whole years’ inflation equaling 3%, the end-of-year par value of the bond would be $1,030 and the second semi-annual interest payment would be $15.45 ($1,030 times 1.5%).
S-22
If the periodic adjustment rate measuring inflation falls, the principal value of U.S. Treasury inflation protected securities will be adjusted downward, and consequently the interest payable on these securities (calculated with respect to a smaller principal amount) will be reduced. Repayment of the original bond principal upon maturity (as adjusted for inflation) is guaranteed in the case of U.S. Treasury inflation protected bonds, even during a period of deflation. However, the current market value of the bonds is not guaranteed, and will fluctuate. Other inflation-protected securities that accrue inflation into their principal value may or may not provide a similar guarantee. If a guarantee of principal is not provided, the adjusted principal value of the bond repaid at maturity may be less than the original principal.
The value of inflation-protected securities is expected to change in response to changes in real interest rates. Real interest rates in turn are tied to the relationship between nominal interest rates and the rate of inflation. Therefore, if inflation were to rise at a faster rate than nominal interest rates, real interest rates might decline, leading to an increase in value of inflation protected securities. In contrast, if nominal interest rates increased at a faster rate than inflation, real interest rates might rise, leading to a decrease in value of inflation-protected securities.
The periodic adjustment of U.S. inflation protected bonds is tied to the Consumer Price Index for Urban Consumers (“CPI-U”), which is calculated monthly by the U.S. Bureau of Labor Statistics. The CPI-U is a measurement of changes in the cost of living, made up of components such as housing, food, transportation and energy. Inflation protected securities issued by a foreign government are generally adjusted to reflect a comparable inflation index, calculated by that government. There can be no assurance that the CPI-U or any foreign inflation index will accurately measure the real rate of inflation in the prices of goods and services. Moreover, there can be no assurance that the rate of inflation in a foreign country will be correlated to the rate of inflation in the United States. If the market perceives that the adjustment mechanism of an inflation-protected security does not accurately adjust for inflation, the value of the security could be adversely affected.
While inflation protected securities are expected to be protected from long-term inflationary trends, short-term increases in inflation may lead to a decline in value. The calculation of the inflation index ratio for inflation protected securities issued by the U.S. Treasury incorporates an approximate three-month lag, which may have an effect on the trading price of the securities, particularly during periods of significant, rapid changes in the inflation index. To the extent that inflation has increased during the three months prior to an interest payment, that interest payment will not be protected from the inflation increase. Further, to the extent that inflation has increased during the final three months of a security’s maturity, the final value of the security will not be protected against that increase, which will negatively impact the value of the security. If interest rates rise due to reasons other than inflation (for example, due to changes in currency exchange rates), investors in inflation-protected securities may not be protected to the extent that the increase is not reflected in the bond’s inflation measure.
Any increase in the principal amount of an inflation-protected security will be considered taxable income to the Fund, even though the Fund does not receive its principal until maturity.
Sovereign Debt Obligations
Nuveen Tactical Market Opportunities Fund may invest in instruments that give it exposure to sovereign debt obligations and may invest in foreign government obligations that have an investment grade rating from at least one rating agency. Investments in sovereign debt obligations involve special risks which are not present in corporate debt securities. The foreign issuer of the sovereign debt or the foreign governmental authorities that control the repayment of the debt may be unable or unwilling to repay principal or interest when due, and there may be limited recourse in the event of a default. During periods of economic uncertainty, the market prices of sovereign debt, and the net asset value of the Fund, to the extent it invests in such securities, may be more volatile than prices of U.S. debt issuers. In the past, certain foreign countries have encountered difficulties in servicing their debt obligations, withheld payments of principal and interest and declared moratoria on the payment of principal and interest on their sovereign debt.
A sovereign debtor’s willingness or ability to repay principal and pay interest in a timely manner may be affected by, among other factors, its cash flow situation, the extent of its foreign currency reserves, the availability of sufficient foreign exchange, the relative size of the debt service burden,
S-23
the sovereign debtor’s policy toward principal international lenders and local political constraints. Sovereign debtors may also be dependent on expected disbursements from foreign governments, multilateral agencies and other entities to reduce principal and interest arrearages on their debt. The failure of a sovereign debtor to implement economic reforms, achieve specified levels of economic performance or repay principal or interest when due may result in the cancellation of third party commitments to lend funds to the sovereign debtor, which may further impair such debtor’s ability or willingness to service its debts.
Foreign Securities
General. Under normal market conditions, Nuveen International Fund and Nuveen International Select Fund invest principally in foreign securities, Nuveen Tactical Market Opportunities Fund may invest in or have exposure to foreign securities as a principal investment strategy, and the other Funds (other than Nuveen Quantitative Enhanced Core Equity Fund and the Index Funds) each may invest up to 25% of its total assets in foreign securities. To the extent described above under “—Derivatives—Forward Currency Contracts and Other Foreign Currency Transactions,” the Funds’ investments in foreign securities may include investments in securities which are purchased and sold in foreign currencies. Foreign securities may include debt securities of governmental and corporate issuers, preferred stock, common stock, and convertible securities of corporate issuers, rights and warrants to buy common stocks, depositary receipts evidencing ownership of shares of a foreign issuer, and exchange traded funds and other investment companies that provide exposure to foreign issuers.
Investment in foreign securities is subject to special investment risks that differ in some respects from those related to investments in securities of U.S. domestic issuers. These risks include political, social or economic instability in the country of the issuer, the difficulty of predicting international trade patterns, the possibility of the imposition of exchange controls, expropriation, limits on removal of currency or other assets, nationalization of assets, foreign withholding and income taxation, and foreign trading practices (including higher trading commissions, custodial charges and delayed settlements). Foreign securities also may be subject to greater fluctuations in price than securities issued by U.S. corporations. The principal markets on which these securities trade may have less volume and liquidity, and may be more volatile, than securities markets in the United States.
In addition, there may be less publicly available information about a foreign company than about a U.S. domiciled company. Foreign companies generally are not subject to uniform accounting, auditing and financial reporting standards comparable to those applicable to U.S. domestic companies. There is also generally less government regulation of securities exchanges, brokers and listed companies abroad than in the United States. Confiscatory taxation or diplomatic developments could also affect investment in those countries. In addition, foreign branches of U.S. banks, foreign banks and foreign issuers may be subject to less stringent reserve requirements and to different accounting, auditing, reporting, and record keeping standards than those applicable to domestic branches of U.S. banks and U.S. domestic issuers.
Emerging Markets. Each Fund, with the exception of Nuveen Quantitative Enhanced Core Equity Fund and the Index Funds, may invest in or have exposure to securities issued by governmental and corporate issuers that are located in emerging market countries as a principal investment strategy. Investments in securities of issuers in emerging market countries may be subject to potentially higher risks than investments in developed countries. These risks include (i) less social, political and economic stability; (ii) the small current size of the markets for such securities and the currently low or nonexistent volume of trading, which may result in a lack of liquidity and in greater price volatility; (iii) certain national policies which may restrict a Fund’s investment opportunities, including restrictions on investment in issuers or industries deemed sensitive to national interests; (iv) foreign taxation; (v) the absence of developed structures governing private or foreign investment or allowing for judicial redress for injury to private property; (vi) the limited development and recent emergence, in certain countries, of a capital market structure or market-oriented economy; and (vii) the possibility that recent favorable economic developments in certain countries may be slowed or reversed by unanticipated political or social events in such countries.
Despite the dissolution of the Soviet Union, the Communist Party may continue to exercise a significant role in certain (particularly Eastern European) countries. To the extent of the Communist
S-24
Party’s influence, investments in such countries will involve risks of nationalization, expropriation and confiscatory taxation. The communist governments of a number of such countries expropriated large amounts of private property in the past, in many cases without adequate compensation, and there can be no assurance that such expropriation will not occur in the future. In the event of such expropriation, a Fund could lose a substantial portion of any investments it has made in the affected countries. Further, no accounting standards exist in many developing countries. Finally, even though certain currencies may be convertible into U.S. dollars, the conversion rates may be artificial to the actual market values and may be adverse to Fund shareholders.
Certain countries, which do not have market economies, are characterized by an absence of developed legal structures governing private and foreign investments and private property. Certain countries require governmental approval prior to investments by foreign persons, or limit the amount of investment by foreign persons in a particular company, or limit the investment of foreign persons to only a specific class of securities of a company that may have less advantageous terms than securities of the company available for purchase by nationals.
Authoritarian governments in certain countries may require that a governmental or quasi-governmental authority act as custodian of a Fund’s assets invested in such country. To the extent such governmental or quasi-governmental authorities do not satisfy the requirements of the 1940 Act to act as foreign custodians of the Fund’s cash and securities, the Fund’s investment in such countries may be limited or may be required to be effected through intermediaries. The risk of loss through governmental confiscation may be increased in such countries.
Depositary Receipts. The Funds’ investments in foreign securities may include investment in depositary receipts, including American Depositary Receipts (ADRs), European Depositary Receipts (EDRs), and Global Depositary Receipts (GDRs). U.S. dollar-denominated ADRs, which are traded in the United States on exchanges or over-the-counter, are issued by domestic banks. ADRs represent the right to receive securities of foreign issuers deposited in a domestic bank or a correspondent bank. ADRs do not eliminate all the risk inherent in investing in the securities of foreign issuers. However, by investing in ADRs rather than directly in foreign issuers’ stock, a Fund can avoid currency risks during the settlement period for either purchases or sales. In general, there is a large, liquid market in the United States for many ADRs. The information available for ADRs is subject to the accounting, auditing and financial reporting standards of the domestic market or exchange on which they are traded, which standards are more uniform and more exacting than those to which many foreign issuers may be subject. The Funds may also invest in EDRs, GDRs, and in other similar instruments representing securities of foreign companies. EDRs and GDRs are securities that are typically issued by foreign banks or foreign trust companies, although U.S. banks or U.S. trust companies may issue them. EDRs and GDRs are structured similarly to the arrangements of ADRs. EDRs, in bearer form, are designed for use in European securities markets and are not necessarily denominated in the currency of the underlying security.
Certain depositary receipts, typically those denominated as unsponsored, require the holders thereof to bear most of the costs of the facilities while issuers of sponsored facilities normally pay more of the costs thereof. The depository of an unsponsored facility frequently is under no obligation to distribute shareholder communications received from the issuer of the deposited securities or to pass through the voting rights to facility holders in respect to the deposited securities, whereas the depository of a sponsored facility typically distributes shareholder communications and passes through voting rights.
Foreign Securities Exchanges. Fixed commissions on foreign securities exchanges are generally higher than negotiated commissions on U.S. exchanges. Foreign markets also have different clearance and settlement procedures, and in some markets there have been times when settlements have been unable to keep pace with the volume of securities transactions, making it difficult to conduct such transactions. Delays in settlement could result in temporary periods when a portion of the assets of a Fund is uninvested. In addition, settlement problems could cause a Fund to miss attractive investment opportunities or to incur losses due to an inability to sell or deliver securities in a timely fashion. In the event of a default by an issuer of foreign securities, it may be more difficult for a Fund to obtain or to enforce a judgment against the issuer.
S-25
Index Participations and Index Participation Contracts
The Index Funds may invest in index participations and index participation contracts as a non-principal investment strategy. Index participations and index participation contracts provide the equivalent of a position in the securities comprising an index, with each security’s representation equaling its index weighting. Moreover, their holders are entitled to payments equal to the dividends paid by the underlying index securities. Generally, the value of an index participation or index participation contract will rise and fall along with the value of the related index.
Lending of Portfolio Securities
In order to generate additional income, as a non-principal investment strategy each of the Funds, other than Nuveen Tactical Market Opportunities Fund, may lend portfolio securities representing up to one-third of the value of its total assets to broker-dealers, banks or other institutional borrowers of securities. As with other extensions of credit, there may be risks of delay in recovery of the securities or even loss of rights in the collateral should the borrower of the securities fail financially. However, the Funds will only enter into domestic loan arrangements with broker-dealers, banks, or other institutions which a Sub-Adviser has determined are creditworthy under guidelines established by the Board of Directors. The Funds will pay a portion of the income earned on the lending transaction to the placing broker and may pay administrative and custodial fees in connection with these loans.
In these loan arrangements, the Funds will receive collateral in the form of cash, U.S. government securities or other high-grade debt obligations equal to at least 102% of the value of the securities loaned as determined at the time of loan origination. This collateral must be valued daily by a Sub-Adviser or the applicable Fund’s lending agent and, if the market value of the loaned securities increases, the borrower must furnish additional collateral to the lending Fund. During the time portfolio securities are on loan, the borrower pays the lending Fund any dividends or interest paid on the securities. Loans are subject to termination at any time by the lending Fund or the borrower. While a Fund does not have the right to vote securities on loan, it would terminate the loan and regain the right to vote if that were considered important with respect to the investment.
When a Fund lends portfolio securities to a borrower, payments in lieu of dividends made by the borrower to the Fund will not constitute “qualified dividends” taxable at the same rate as long-term capital gains, even if the actual dividends would have constituted qualified dividends had the Fund held the securities. See “Taxation.”
Money Market Funds
Nuveen Tactical Market Opportunities Fund may invest, to the extent permitted by the 1940 Act, in securities issued by money market funds as a principal investment strategy. As a shareholder of another investment company, the Fund would bear, along with other shareholders, its pro rata portion of that company’s expenses, including advisory fees. These expenses would be in addition to the advisory and other expenses that the Fund bears directly in connection with its own operations. Investment companies in which the Fund may invest may also impose a sales or distribution charge in connection with the purchase or redemption of their shares and other types of commissions or charges. Such charges will be payable by the Fund and, therefore, will be borne indirectly by their shareholders.
Other Investment Companies
Each Fund may invest in other investment companies, such as mutual funds, closed-end funds, and exchange-traded funds (“ETFs”). Nuveen International Fund, Nuveen International Select Fund, Nuveen Quantitative Enhanced Core Equity Fund and Nuveen Tactical Market Opportunities Fund may do so as a principal investment strategy. Under the 1940 Act, a Fund’s investment in such securities, subject to certain exceptions, currently is limited to 3% of the total voting stock of any one investment company; 5% of the Fund’s total assets with respect to any one investment company; and 10% of a Fund’s total assets in the aggregate. As described in the Funds’ Prospectus, Nuveen Tactical Market Opportunities Fund intends to rely on exemptive orders in order to invest in unaffiliated ETFs beyond the foregoing statutory limitations. A Fund’s investments in other investment companies may include money market mutual funds. Investments in money market funds are not subject to the percentage limitations set forth above.
S-26
If a Fund invests in other investment companies, Fund shareholders will bear not only their proportionate share of the Fund’s expenses, but also, indirectly, the similar expenses of the underlying investment companies. Shareholders would also be exposed to the risks associated not only to the Fund, but also to the portfolio investments of the underlying investment companies. Shares of certain closed-end funds may at times be acquired only at market prices representing premiums to their net asset values. Shares acquired at a premium to their net asset value may be more likely to subsequently decline in price, resulting in a loss to the Fund and its shareholders. The underlying securities in an ETF may not follow the price movements of the industry or sector the ETF is designed to track. Trading in an ETF may be halted if the trading in one or more of the ETF’s underlying securities is halted, which could result in the ETF being more volatile.
Preferred Stock
Nuveen Dividend Value Fund, Nuveen International Fund, Nuveen International Select Fund and Nuveen Tactical Markets Opportunities Fund may invest in preferred stock as a principal investment strategy. Each other Fund may invest in preferred stock as a non-principal investment strategy. Preferred stock, unlike common stock, offers a stated dividend rate payable from the issuer’s earnings. Preferred stock dividends may be cumulative or non-cumulative, participating, or auction rate. If interest rates rise, the fixed dividend on preferred stocks may be less attractive, causing the price of preferred stocks to decline. Preferred stock may have mandatory sinking fund provisions, as well as call/redemption provisions prior to maturity, a negative feature when interest rates decline. Except as described above under “—Fixed Income Securities—Debt Obligations Rated Less than Investment Grade,” investments in nonconvertible preferred stock will be limited to investment-grade securities, defined as securities which are rated at the time of purchase by two of Moody’s, Standard & Poor’s and Fitch not less than Baa, BBB and BBB (or the equivalent short-term ratings), respectively, unless only one of those rating agencies provides a rating, in which case that rating must be at least Baa or BBB, or which are of comparable quality in the judgment of a Sub-Adviser.
Real Estate Investment Trust (“REIT”) Securities
Nuveen Tactical Market Opportunities Fund may invest in securities of real estate investment trusts as a principal investment strategy. Each Fund may invest in securities of real estate investment trusts as a non-principal investment strategy. REITs are publicly traded corporations or trusts that specialize in acquiring, holding, and managing residential, commercial or industrial real estate. A REIT is not taxed at the entity level on income distributed to its shareholders or unitholders if it distributes to shareholders or unitholders at least 90% of its taxable income for each taxable year and complies with regulatory requirements relating to its organization, ownership, assets and income.
REITs generally can be classified as Equity REITs, Mortgage REITs and Hybrid REITs. An Equity REIT invests the majority of its assets directly in real property and derives its income primarily from rents and from capital gains on real estate appreciation which are realized through property sales. A Mortgage REIT invests the majority of its assets in real estate mortgage loans and services its income primarily from interest payments. A Hybrid REIT combines the characteristics of an Equity REIT and a Mortgage REIT.
A Fund’s investment in the real estate industry subjects the Fund to risks associated with that industry. The real estate industry has been subject to substantial fluctuations and declines on a local, regional and national basis in the past and may continue to be in the future. Real property values and income from real property may decline due to general and local economic conditions, overbuilding and increased competition, increases in property taxes and operating expenses, changes in zoning laws, casualty or condemnation losses, regulatory limitations on rents, changes in neighborhoods and in demographics, increases in market interest rates, or other factors. Factors such as these may adversely affect companies which own and operate real estate directly, companies which lend to such companies, and companies which service the real estate industry.
A Fund is also subject to risks associated with direct investments in REITs. Equity REITs will be affected by changes in the values of and income from the properties they own, while Mortgage REITs may be affected by the credit quality of the mortgage loans they hold. In addition, REITs are dependent on specialized management skills and on their ability to generate cash flow for operating
S-27
purposes and to make distributions to shareholders or unitholders. REITs may have limited diversification and are subject to risks associated with obtaining financing for real property, as well as to the risk of self-liquidation. REITs also can be adversely affected by their failure to qualify for tax-free pass-through treatment of their income under the Code or their failure to maintain an exemption from registration under the 1940 Act. By investing in REITs indirectly through the Funds, a shareholder bears not only a proportionate share of the expenses of the Fund, but also may indirectly bear similar expenses of some of the REITs in which it invests.
Royalty Trusts
Each Fund may invest in publicly-traded royalty trusts as a non-principal investment strategy. Royalty trusts are income-oriented equity investments that indirectly, through the ownership of trust units, provide investors (called “unit holders”) with exposure to energy sector assets such as coal, oil and natural gas. Royalty trusts are structured similarly to REITs. A royalty trust generally acquires an interest in natural resource companies or chemical companies and distributes the income it receives to the investors of the royalty trust. A sustained decline in demand for crude oil, natural gas and refined petroleum products could adversely affect income and royalty trust revenues and cash flows. Factors that could lead to a decrease in market demand include a recession or other adverse economic conditions, an increase in the market price of the underlying commodity, higher taxes or other regulatory actions that increase costs, or a shift in consumer demand for such products. A rising interest rate environment could adversely impact the performance of royalty trusts. Rising interest rates could limit the capital appreciation of royalty trusts because of the increased availability of alternative investments at more competitive yields.
Short-Term Temporary Investments
In an attempt to respond to adverse market, economic, political or other conditions, each Fund may temporarily invest without limit in a variety of short-term instruments such as commercial paper and variable amount master demand notes; U.S. dollar-denominated time and savings deposits (including certificates of deposit); bankers’ acceptances; obligations of the U.S. government or its agencies or instrumentalities; repurchase agreements collateralized by eligible investments of a Fund; securities of other mutual funds that invest primarily in debt obligations with remaining maturities of 13 months or less (which investments also are subject to an advisory fee); and other similar high-quality short-term U.S. dollar-denominated obligations. During such periods, a Fund may not be able to achieve its investment objective.
Each Fund may also invest in Eurodollar certificates of deposit issued by foreign branches of U.S. or foreign banks; Eurodollar time deposits, which are U.S. dollar-denominated deposits in foreign branches of U.S. or foreign banks; and Yankee certificates of deposit, which are U.S. dollar-denominated certificates of deposit issued by U.S. branches of foreign banks and held in the United States. In each instance, the Funds may only invest in bank instruments issued by an institution which has capital, surplus and undivided profits of more than $100 million or the deposits of which are insured by the Bank Insurance Fund or the Savings Association Insurance Fund.
When-Issued and Delayed Delivery Transactions
Each Fund, other than the Index Funds and Nuveen Tactical Market Opportunities Fund, may purchase securities on a when-issued or delayed delivery basis as a non-principal investment strategy. When such a transaction is negotiated, the purchase price is fixed at the time the purchase commitment is entered, but delivery of and payment for the securities take place at a later date. A Fund will not accrue income with respect to securities purchased on a when-issued or delayed delivery basis prior to their stated delivery date.
The purchase of securities on a when-issued or delayed delivery basis exposes a Fund to risk because the securities may decrease in value prior to delivery. In addition, a Fund’s purchase of securities on a when-issued or delayed delivery basis while remaining substantially fully invested could increase the amount of the Fund’s total assets that are subject to market risk, resulting in increased sensitivity of net asset value to changes in market prices. A seller’s failure to deliver securities to a Fund could prevent the Fund from realizing a price or yield considered to be advantageous.
S-28
When a Fund agrees to purchase securities on a when-issued or delayed delivery basis, the Fund will segregate cash or liquid securities in an amount sufficient to meet the Fund’s purchase commitments. It may be expected that a Fund’s net assets will fluctuate to a greater degree when it sets aside securities to cover such purchase commitments than when it sets aside cash. In addition, because a Fund will set aside cash or liquid securities to satisfy its purchase commitments, its liquidity and the ability of a Sub-Adviser to manage it might be affected in the event its commitments to purchase when-issued or delayed delivery securities ever became significant. Under normal market conditions, however, a Fund’s commitments to purchase when-issued or delayed delivery securities will not exceed 25% of the value of its total assets.
Index Disclaimers
Nuveen Equity Index Fund
Nuveen Equity Index Fund is not sponsored, endorsed, sold or promoted by Standard & Poor’s, a division of The McGraw-Hill Companies, Inc. (“S&P”). S&P makes no representation or warranty, express or implied, to the owners of Nuveen Equity Index Fund or any member of the public regarding the advisability of investing in securities generally or in Nuveen Equity Index Fund particularly or the ability of the S&P 500 Index to track general stock market performance. S&P’s only relationship to NIF is the licensing of certain trademarks and trade names of S&P and of the S&P 500 Index which is determined, composed and calculated by S&P without regard to NIF or Nuveen Equity Index Fund. S&P has no obligation to take the needs of NIF or the owners of Nuveen Equity Index Fund into consideration in determining, composing or calculating the S&P 500 Index. S&P is not responsible for and has not participated in the determination of the prices and amount of Nuveen Equity Index Fund or the timing of the issuance or sale of Nuveen Equity Index Fund or in the determination or calculation of the equation by which Nuveen Equity Index Fund is to be converted into cash. S&P has no obligation or liability in connection with the administration, marketing or trading of Nuveen Equity Index Fund.
S&P DOES NOT GUARANTEE THE ACCURACY AND/OR THE COMPLETENESS OF THE S&P 500 INDEX OR ANY DATA INCLUDED THEREIN AND S&P SHALL HAVE NO LIABILITY FOR ANY ERRORS, OMISSIONS, OR INTERRUPTIONS THEREIN. S&P MAKES NO WARRANTY, EXPRESS OR IMPLIED, AS TO RESULTS TO BE OBTAINED BY NIF, OWNERS OF NUVEEN EQUITY INDEX FUND OR ANY OTHER PERSON OR ENTITY FROM THE USE OF THE S&P 500 INDEX OR ANY DATA INCLUDED THEREIN. S&P MAKES NO EXPRESS OR IMPLIED WARRANTIES, AND EXPRESSLY DISCLAIMS ALL WARRANTIES OF MERCHANTABILITY OR FITNESS FOR A PARTICULAR PURPOSE OR USE WITH RESPECT TO THE S&P 500 INDEX OR ANY DATA INCLUDED THEREIN. WITHOUT LIMITING ANY OF THE FOREGOING, IN NO EVENT SHALL S&P HAVE ANY LIABILITY FOR ANY SPECIAL, PUNITIVE, INDIRECT, OR CONSEQUENTIAL DAMAGES (INCLUDING LOST PROFITS), EVEN IF NOTIFIED OF THE POSSIBILITY OF SUCH DAMAGES.
Nuveen Mid Cap Index Fund
Nuveen Mid Cap Index Fund is not sponsored, endorsed, sold or promoted by S&P. S&P makes no representation or warranty, express or implied, to the owners of Nuveen Mid Cap Index Fund or any member of the public regarding the advisability of investing in securities generally or in Nuveen Mid Cap Index Fund particularly or the ability of the S&P MidCap 400 Index to track general stock market performance. S&P’s only relationship to NIF is the licensing of certain trademarks and trade names of S&P and of the S&P MidCap 400 Index which is determined, composed and calculated by S&P without regard to NIF or Nuveen Mid Cap Index Fund. S&P has no obligation to take the needs of NIF or the owners of Nuveen Mid Cap Index Fund into consideration in determining, composing or calculating the S&P MidCap 400 Index. S&P is not responsible for and has not participated in the determination of the prices and amount of Nuveen Mid Cap Index Fund or the timing of the issuance or sale of Nuveen Mid Cap Index Fund or in the determination or calculation of the equation by which Nuveen Mid Cap Index Fund is to be converted into cash. S&P has no obligation or liability in connection with the administration, marketing or trading of Nuveen Mid Cap Index Fund.
S&P DOES NOT GUARANTEE THE ACCURACY AND/OR THE COMPLETENESS OF THE S&P MidCap 400 INDEX OR ANY DATA INCLUDED THEREIN AND S&P SHALL HAVE NO LIABILITY FOR ANY ERRORS, OMISSIONS, OR INTERRUPTIONS THEREIN. S&P MAKES NO WARRANTY, EXPRESS
S-29
OR IMPLIED, AS TO RESULTS TO BE OBTAINED BY NIF, OWNERS OF NUVEEN MID CAP INDEX FUND, OR ANY OTHER PERSON OR ENTITY FROM THE USE OF THE S&P MidCap 400 INDEX OR ANY DATA INCLUDED THEREIN. S&P MAKES NO EXPRESS OR IMPLIED WARRANTIES, AND EXPRESSLY DISCLAIMS ALL WARRANTIES OF MERCHANTABILITY OR FITNESS FOR A PARTICULAR PURPOSE OR USE WITH RESPECT TO THE S&P MidCap 400 INDEX OR ANY DATA INCLUDED THEREIN. WITHOUT LIMITING ANY OF THE FORGOING, IN NO EVENT SHALL S&P HAVE ANY LIABILITY FOR ANY SPECIAL, PUNITIVE, INDIRECT, OR CONSEQUENTIAL DAMAGES (INCLUDING LOST PROFITS), EVEN IF NOTIFIED OF THE POSSIBILITY OF SUCH DAMAGES.
Nuveen Small Cap Index Fund
Frank Russell Company reserves the right, at any time and without notice, to alter, amend, terminate or in any way change the Russell Indexes. Frank Russell Company has no obligation to take the needs of any particular fund or its participants or any other product or person into consideration in determining, composing or calculating any of the Russell Indexes.
Frank Russell Company’s publication of the Russell Indexes in no way suggests or implies an opinion by Frank Russell Company as to the attractiveness or appropriateness of investment in any or all securities upon which the Russell Indexes are based. FRANK RUSSELL COMPANY MAKES NO REPRESENTATION, WARRANTY, OR GUARANTEE AS TO THE ACCURACY, COMPLETENESS, RELIABILITY, OR OTHERWISE OF THE RUSSELL INDEXES OR ANY DATA INCLUDED IN THE RUSSELL INDEXES. FRANK RUSSELL COMPANY MAKES NO REPRESENTATION, WARRANTY OR GUARANTEE REGARDING THE USE, OR THE RESULTS OF USE, OF THE RUSSELL INDEXES OR ANY DATA INCLUDED THEREIN, OR ANY SECURITY (OR COMBINATION THEREOF) COMPRISING THE RUSSELL INDEXES. FRANK RUSSELL COMPANY MAKES NO OTHER EXPRESS OR IMPLIED WARRANTY, AND EXPRESSLY DISCLAIMS ANY WARRANTY, OF ANY KIND, INCLUDING WITHOUT LIMITATION, ANY WARRANTY OF MERCHANTABILITY OR FITNESS FOR A PARTICULAR PURPOSE WITH RESPECT TO THE RUSSELL INDEX(ES) OR ANY DATA OR ANY SECURITY (OR COMBINATION THEREOF) INCLUDED THEREIN.
S-30
MANAGEMENT
The management of NIF, including general supervision of the duties performed for the Funds by the Adviser under the Management Agreement, is the responsibility of the Board of Directors. The number of directors of NIF is ten, one of whom is an “interested person” (as the term “interested person” is defined in the 1940 Act) and nine of whom are not interested persons (referred to herein as “independent directors”). None of the independent directors has ever been a trustee, director or employee of, or consultant to, the Adviser or its affiliates. The names, business addresses and birthdates of the directors and officers of the Funds, their principal occupations and other affiliations during the past five years, the number of portfolios each oversees and other directorships they hold are set forth below. The directors of NIF are directors or trustees, as the case may be, of 101 Nuveen-sponsored open-end funds (the “Nuveen Mutual Funds”) and 116 Nuveen-sponsored closed-end funds (collectively with the Nuveen Mutual Funds, the “Nuveen Funds”).
| | | | | | | | | | |
Name, Business
Address and Birthdate | | Position(s)
Held with
NIF | | Term of Officeand Length of Time Served with
NIF | | Principal Occupation(s)
During Past Five Years | | Number of
Portfolios
in Fund
Complex
Overseen by
Director | | Other
Directorships
Held by
Director
During Past
Five Years |
| | |
Independent Directors: | | | | |
| | | | | |
Robert P. Bremner 333 West Wacker Drive Chicago, IL 60606 (8/22/40) | | Chairman of the Board and Director | | Term—Indefinite* Length of Service—
Since 2011 | | Private Investor and Management Consultant; Treasurer and Director, Humanities Council of Washington, D.C.; Board Member, Independent Directors Council affiliated with the Investment Company Institute. | | 217 | | None |
| | | | | |
Jack B. Evans 333 West Wacker Drive Chicago, IL 60606 (10/22/48) | | Director | | Term—Indefinite* Length of Service—
Since 2011 | | President, The Hall-Perrine Foundation, a private philanthropic corporation (since 1996); Member, Board of Regents for the State of Iowa University System; Director, Source Media Group; Life Trustee of Coe College and the Iowa College Foundation; formerly, Director, Federal Reserve Bank of Chicago; formerly, President and Chief Operating Officer, SCI Financial Group, Inc., a regional financial services firm. | | 217 | | Director and Chairman, United Fire Group, a publicly held company; formerly, Director, Alliant Energy. |
S-31
| | | | | | | | | | |
Name, Business
Address and Birthdate | | Position(s)
Held with
NIF | | Term of Officeand Length of Time Served with
NIF | | Principal Occupation(s)
During Past Five Years | | Number of
Portfolios
in Fund
Complex
Overseen by
Director | | Other
Directorships
Held by
Director
During Past
Five Years |
| | | | | |
William C. Hunter 333 West Wacker Drive Chicago, IL 60606 (3/6/48) | | Director | | Term—Indefinite* Length of Service—
Since 2011 | | Dean Emeritus (since June 30, 2012), formerly, Dean (2006-2012), Tippie College of Business, University of Iowa; Director (since 2005) and President (since July 2012), Beta Gamma Sigma, Inc., The International Honor Society; Director of Wellmark, Inc. (since 2009); formerly, Director (1997-2007), Credit Research Center at Georgetown University; formerly, Dean and Distinguished Professor of Finance, School of Business at the University of Connecticut (2003-2006); previously, Senior Vice President and Director of Research at the Federal Reserve Bank of Chicago (1995-2003). | | 217 | | Director (since 2004) of Xerox Corporation. |
| | | | | |
David J. Kundert 333 West Wacker Drive Chicago, IL 60606 (10/28/42) | | Director | | Term—Indefinite* Length of Service—
Since 2011 | | Director, Northwestern Mutual Wealth Management Company; retired (since 2004) as Chairman, JPMorgan Fleming Asset Management, President and CEO, Banc One Investment Advisors Corporation, and President, One Group Mutual Funds; prior thereto, Executive Vice President, Bank One Corporation and Chairman and CEO, Banc One Investment Management Group; Regent Emeritus, Member of Investment Committee, Luther College; Member of the Wisconsin Bar Association; Member of Board of Directors, Friends of Boerner Botanical Gardens; Member of Board of Directors and Chair of Investment Committee, Greater Milwaukee Foundation; Member of the Board of Directors (Milwaukee), College Possible. | | 217 | | None |
S-32
| | | | | | | | | | |
Name, Business
Address and Birthdate | | Position(s)
Held with
NIF | | Term of Office
and Length of Time Served with
NIF | | Principal Occupation(s)
During Past Five Years | | Number of
Portfolios
in Fund
Complex
Overseen by
Director | | Other
Directorships
Held by
Director
During Past
Five Years |
| | | | | |
William J. Schneider 333 West Wacker Drive Chicago, IL 60606 (9/24/44) | | Director | | Term—Indefinite* Length of Service—
Since 2011 | | Chairman of Miller-Valentine Partners Ltd., a real estate investment company; Member of two Miller Valentine real estate LLC companies; Member, Mid-America Health System Board; Member, University of Dayton Business School Advisory Council; Board Member of Tech Town, Inc, a not-for-profit community development company; Board Member of WDPR Public Radio. Formerly, Senior Partner and Chief Operating Officer (retired, 2004) of Miller-Valentine Group; formerly, Member, Dayton Philharmonic Orchestra Association; formerly, Director, Dayton Development Coalition; formerly, Member, Business Advisory Council, Cleveland Federal Reserve Bank. | | 217 | | None |
| | | | | |
Judith M. Stockdale 333 West Wacker Drive Chicago, IL 60606 (12/29/47) | | Director | | Term—Indefinite* Length of Service—
Since 2011 | | Formerly, Executive Director (1994-2012), Gaylord and Dorothy Donnelley Foundation; prior thereto, Executive Director, Great Lakes Protection Fund (1990-1994). | | 217 | | None |
| | | | | |
Carole E. Stone 333 West Wacker Drive Chicago, IL 60606 (6/28/47) | | Director | | Term—Indefinite* Length of Service—
Since 2011 | | Director, C2 Options Exchange, Incorporated (since 2009); formerly, Commissioner, New York State Commission on Public Authority Reform (2005-2010); formerly, Chair, New York Racing Association Oversight Board (2005-2007). | | 217 | | Director, Chicago Board Options Exchange (since 2006). |
S-33
| | | | | | | | | | |
Name, Business
Address and Birthdate | | Position(s)
Held with
NIF | | Term of Office
and Length of Time Servedwith
NIF | | Principal Occupation(s)
During Past Five Years | | Number of
Portfolios
in Fund
Complex
Overseen by
Director | | Other
Directorships
Held by
Director
During Past
Five Years |
| | | | | |
Virginia L. Stringer 333 West Wacker Drive Chicago, IL 60606 (8/16/44) | | Director | | Term—Indefinite* Length of Service—
Since 1987 | | Board Member, Mutual Fund Directors Forum; former Member, Governing Board, Investment Company Institute’s Independent Directors Council; Governance consultant and non-profit board member; former Owner and President, Strategic Management Resources, Inc., a management consulting firm; previously, held several executive positions in general management, marketing and human resources at IBM and The Pillsbury Company. | | 217 | | Previously, Independent Director (1987-2010) and Chair (1997-2010), First American Fund Complex. |
| | | | | |
Terence J. Toth 333 West Wacker Drive Chicago, IL 60606 (9/29/59) | | Director | | Term—Indefinite* Length of Service—
Since 2011 | | Director, Legal & General Investment Management America, Inc. (since 2008); Managing Partner, Promus Capital (since 2008); formerly, CEO and President, Northern Trust Global Investments (2004-2007); Executive Vice President, Quantitative Management & Securities Lending (2000-2004); prior thereto, various positions with Northern Trust Company (since 1994); Member, Chicago Fellowship Board (since 2005), Catalyst Schools of Chicago Board (since 2008) and Mather Foundation Board (since 2012) and a member of its investment committee; formerly, Member, Northern Trust Mutual Funds Board (2005-2007), Northern Trust Global Investments Board (2004-2007), Northern Trust Japan Board (2004-2007), Northern Trust Securities Inc. Board (2003-2007) and Northern Trust Hong Kong Board (1997-2004). | | 217 | | None |
S-34
| | | | | | | | | | |
Name, Business
Address and Birthdate | | Position(s)
Held with
NIF | | Term of Office
and Length of Time Servedwith
NIF | | Principal Occupation(s)
During Past Five Years | | Number of
Portfolios
in Fund
Complex
Overseen by
Director | | Other
Directorships
Held by
Director
During Past
Five Years |
| | | | | |
Interested Director: | | | | | | | | | | |
| | | | | |
John P. Amboian** 333 West Wacker Drive Chicago, IL 60606 (6/14/61) | | Director | | Term—Indefinite* Length of Service—
Since 2011 | | Chief Executive Officer and Chairman (since 2007) and Director (since 1999) of Nuveen Investments, Inc.; formerly, President (1999-2007); Chief Executive Officer (since 2007) of Nuveen Investments Advisers Inc.; Director (since 1998), formerly, Chief Executive Officer (2007-2010) of Nuveen Fund Advisors, LLC. | | 217 | | None |
| * | | Each director serves an indefinite term until his or her successor is elected. |
| ** | | Mr. Amboian is an “interested person” of NIF, as defined in the 1940 Act, by reason of his positions with Nuveen Investments, Inc. (“Nuveen Investments”) and certain of its subsidiaries. |
S-35
| | | | | | | | |
Name, Business
Address and Birthdate | | Position(s) Held
with NIF | | Term of
Office and
Length of
Time Served
with NIF | | Principal Occupation(s)
During Past Five Years | | Number of
Portfolios
in Fund
Complex
Overseen by
Officer |
| | | |
Officers of NIF: | | | | | | |
| | | | |
Gifford R. Zimmerman 333 West Wacker Drive Chicago, IL 60606
(9/9/56) | | Chief Administrative Officer | | Term—Until August 2013 Length of Service—Since 2011 | | Managing Director (since 2002) and Assistant Secretary of Nuveen Securities, LLC; Managing Director (since 2002), Assistant Secretary (since 1997) and Co-General Counsel (since 2011) of Nuveen Fund Advisors, LLC; Managing Director, Assistant Secretary and Associate General Counsel of Nuveen Asset Management, LLC (since 2011); Managing Director (since 2004) and Assistant Secretary (since 1994) of Nuveen Investments, Inc.; Vice President and Assistant Secretary of NWQ Investment Management Company, LLC (since 2002); Vice President and Assistant Secretary of Nuveen Investments Advisers Inc. (since 2002); Managing Director, Associate General Counsel and Assistant Secretary of Symphony Asset Management LLC (since 2003); Vice President and Assistant Secretary of Santa Barbara Asset Management, LLC (since 2006) and Winslow Capital Management, LLC (since 2010); Chief Administrative Officer and Chief Compliance Officer (since 2006) of Nuveen Commodities Asset Management, LLC; Chartered Financial Analyst. | | 217 |
| | | | |
Margo L. Cook 333 West Wacker Drive Chicago, IL 60606 (4/11/64) | | Vice President | | Term—Until August 2013 Length of Service—Since 2011 | | Executive Vice President (since 2008) of Nuveen Investments, Inc. and Nuveen Fund Advisors, LLC (since 2011); Managing Director—Investment Services of Nuveen Commodities Asset Management, LLC (since August 2011); previously, Head of Institutional Asset Management (2007-2008) of Bear Stearns Asset Management; Head of Institutional Asset Management (1986-2007) of Bank of NY Mellon; Chartered Financial Analyst. | | 217 |
| | | | |
Lorna C. Ferguson 333 West Wacker Drive Chicago, IL 60606 (10/24/45) | | Vice President | | Term—Until August 2013 Length of Service—Since 2011 | | Managing Director (since 2004) of Nuveen Securities, LLC; Managing Director (since 2005) of Nuveen Fund Advisors, LLC. | | 217 |
| | | | |
Stephen D. Foy 333 West Wacker Drive Chicago, IL 60606 (5/31/54) | | Vice President and Controller | | Term—Until August 2013 Length of Service—Since 2011 | | Senior Vice President (since 2010), formerly, Vice President (2004-2010) and Funds Controller of Nuveen Securities, LLC; Vice President of Nuveen Fund Advisors, LLC (since 2005); Chief Financial Officer (since 2010) of Nuveen Commodities Asset Management, LLC; Certified Public Accountant. | | 217 |
S-36
| | | | | | | | |
Name, Business
Address and Birthdate | | Position(s) Held
with NIF | | Term of
Office and
Length of
Time Served
with NIF | | Principal Occupation(s)
During Past Five Years | | Number of
Portfolios
in Fund
Complex
Overseen by
Officer |
| | | | |
Scott S. Grace 333 West Wacker Drive Chicago, IL 60606 (8/20/70) | | Vice President and Treasurer | | Term—Until August 2013 Length of Service—Since 2011 | | Managing Director, Corporate Finance & Development, Treasurer (since 2009) of Nuveen Securities, LLC; Managing Director and Treasurer (since 2009) of Nuveen Investments Advisers Inc., Nuveen Investments Holdings, Inc., Nuveen Fund Advisors, LLC and (since 2011) Nuveen Asset Management, LLC; Vice President and Treasurer of NWQ Investment Management Company, LLC, Tradewinds Global Investors, LLC, Symphony Asset Management LLC and Winslow Capital Management, LLC; Vice President of Santa Barbara Asset Management, LLC; formerly, Treasurer (2006-2009), Senior Vice President (2008-2009), previously, Vice President (2006-2008) of Janus Capital Group, Inc.; formerly, Senior Associate in Morgan Stanley’s Global Financial Services Group (2000-2003); Chartered Accountant. | | 217 |
| | | | |
Walter M. Kelly 333 West Wacker Drive Chicago, IL 60606 (2/24/70) | | Vice President and Chief Compliance Officer | | Term—Until August 2013 Length of Service—Since 2011 | | Senior Vice President (since 2008) and Assistant Secretary (since 2003) of Nuveen Fund Advisors, LLC; Senior Vice President (since 2008) of Nuveen Investments Holdings, Inc.; formerly, Senior Vice President (2008-2011) of Nuveen Securities, LLC. | | 217 |
| | | | |
Tina M. Lazar 333 West Wacker Drive Chicago, IL 60606 (8/27/61) | | Vice President | | Term—Until August 2013 Length of Service—Since 2011 | | Senior Vice President (since 2010), formerly, Vice President (2005-2010) of Nuveen Fund Advisors, LLC. | | 217 |
| | | | |
Kevin J. McCarthy 333 West Wacker Drive Chicago, IL 60606 (3/26/66) | | Vice President and Secretary | | Term—Until August 2013 Length of Service—Since 2011 | | Managing Director and Assistant Secretary (since 2008), formerly, Vice President (2007-2008) of Nuveen Securities, LLC; Managing Director (since 2008), Vice President and Assistant Secretary (since 2007) and Co-General Counsel (since 2011) of Nuveen Fund Advisors, LLC; Managing Director, Assistant Secretary and Associate General Counsel (since 2011) of Nuveen Asset Management, LLC; Vice President and Assistant Secretary of Nuveen Investments Advisers Inc., NWQ Investment Management Company, LLC, NWQ Holdings, LLC, Symphony Asset Management LLC, Santa Barbara Asset Management, LLC and Winslow Capital Management, LLC (since 2010); Vice President and Secretary (since 2010) of Nuveen Commodities Asset Management, LLC; prior thereto, Partner, Bell, Boyd & Lloyd LLP (1997-2007). | | 217 |
S-37
| | | | | | | | |
Name, Business
Address and Birthdate | | Position(s) Held
with NIF | | Term of
Office and
Length of
Time Served
with NIF | | Principal Occupation(s)
During Past Five Years | | Number of
Portfolios
in Fund
Complex
Overseen by
Officer |
| | | | |
Kathleen L. Prudhomme 901 Marquette Avenue Minneapolis, MN 55402 (3/30/53) | | Vice President and Assistant Secretary | | Term—Until August 2013 Length of Service—Since 2011 | | Managing Director and Assistant Secretary of Nuveen Securities, LLC (since 2011); Managing Director, Assistant Secretary and Co-General Counsel (since 2011) of Nuveen Fund Advisors, LLC; Managing Director, Assistant Secretary and Associate General Counsel (since 2011) of Nuveen Asset Management, LLC; formerly, Deputy General Counsel, FAF Advisors, Inc. (2004-2010). | | 217 |
| | | | |
Jeffery M. Wilson 333 West Wacker Drive Chicago, IL 60606 (3/13/56) | | Vice President | | Term—Until August 2013 Length of Service—Since 2011 | | Senior Vice President of Nuveen Securities, LLC (since 2011); formerly, Senior Vice President of FAF Advisors, Inc. (2000-2010). | | 101 |
S-38
Board Leadership Structure and Risk Oversight
The Board of Directors or the Board of Trustees (as the case may be, each is referred to hereafter as the “Board” or “Board of Directors” and the directors or trustees of the Nuveen Funds, as applicable, are each referred to herein as “directors”) oversees the operations and management of the Nuveen Funds, including the duties performed for the Nuveen Funds by the Adviser. The Board has adopted a unitary board structure. A unitary board consists of one group of directors who serve on the board of every fund in the Nuveen Fund complex. In adopting a unitary board structure, the directors seek to provide effective governance through establishing a board, the overall composition of which will, as a body, possess the appropriate skills, independence and experience to oversee the Nuveen Funds’ business. With this overall framework in mind, when the Board, through its Nominating and Governance Committee discussed below, seeks nominees for the Board, the directors consider, not only the candidate’s particular background, skills and experience, among other things, but also whether such background, skills and experience enhance the Board’s diversity and at the same time complement the Board given its current composition and the mix of skills and experiences of the incumbent directors. The Nominating and Governance Committee believes that the Board generally benefits from diversity of background, experience and views among its members, and considers this a factor in evaluating the composition of the Board, but has not adopted any specific policy on diversity or any particular definition of diversity.
The Board believes the unitary board structure enhances good and effective governance, particularly given the nature of the structure of the investment company complex. Funds in the same complex generally are served by the same service providers and personnel and are governed by the same regulatory scheme which raises common issues that must be addressed by the directors across the fund complex (such as compliance, valuation, liquidity, brokerage, trade allocation or risk management). The Board believes it is more efficient to have a single board review and oversee common policies and procedures which increases the Board’s knowledge and expertise with respect to the many aspects of fund operations that are complex-wide in nature. The unitary structure also enhances the Board’s influence and oversight over the investment adviser and other service providers.
In an effort to enhance the independence of the Board, the Board also has a Chairman that is an independent director. The Board recognizes that a chairman can perform an important role in setting the agenda for the Board, establishing the boardroom culture, establishing a point person on behalf of the Board for fund management, and reinforcing the Board’s focus on the long-term interests of shareholders. The Board recognizes that a chairman may be able to better perform these functions without any conflicts of interests arising from a position with fund management. Accordingly, the directors have elected Robert P. Bremner to serve as the independent Chairman of the Board through June 30, 2013 and William J. Schneider to serve as the independent Chairman of the Board effective July 1, 2013. Specific responsibilities of the Chairman include: (i) presiding at all meetings of the Board and of the shareholders; (ii) seeing that all orders and resolutions of the directors are carried into effect; and (iii) maintaining records of and, whenever necessary, certifying all proceedings of the directors and the shareholders.
Although the Board has direct responsibility over various matters (such as advisory contracts, underwriting contracts and fund performance), the Board also exercises certain of its oversight responsibilities through several committees that it has established and which report back to the full Board. The Board believes that a committee structure is an effective means to permit directors to focus on particular operations or issues affecting the Nuveen Funds, including risk oversight. More specifically, with respect to risk oversight, the Board has delegated matters relating to valuation and compliance to certain committees (as summarized below) as well as certain aspects of investment risk. In addition, the Board believes that the periodic rotation of directors among the different committees allows the directors to gain additional and different perspectives of a Nuveen Fund’s operations. The Board has established six standing committees: the Executive Committee, the Dividend Committee, the Audit Committee, the Compliance, Risk Management and Regulatory Oversight Committee, the Nominating and Governance Committee and the Open-End Funds Committee. The Board may also from time to time create ad hoc committees to focus on particular issues as the need arises. The membership and functions of the standing committees are summarized below.
The Executive Committee, which meets between regular meetings of the Board, is authorized to exercise all of the powers of the Board. The members of the Executive Committee are Robert P. Bremner, Chair, Judith M. Stockdale and John P. Amboian. During the fiscal year ended October 31, 2012, the Executive Committee did not meet.
S-39
The Audit Committee assists the Board in the oversight and monitoring of the accounting and reporting policies, processes and practices of the Nuveen Funds, and the audits of the financial statements of the Nuveen Funds; the quality and integrity of the financial statements of the Nuveen Funds; the Nuveen Funds’ compliance with legal and regulatory requirements relating to the Nuveen Funds’ financial statements; the independent auditors’ qualifications, performance and independence; and the pricing procedures of the Nuveen Funds and the Adviser’s internal valuation group. It is the responsibility of the Audit Committee to select, evaluate and replace any independent auditors (subject only to Board and, if applicable, shareholder ratification) and to determine their compensation. The Audit Committee is also responsible for, among other things, overseeing the valuation of securities comprising the Nuveen Funds’ portfolios. Subject to the Board’s general supervision of such actions, the Audit Committee addresses any valuation issues, oversees the Nuveen Funds’ pricing procedures and actions taken by the Adviser’s internal valuation group which provides regular reports to the committee, reviews any issues relating to the valuation of the Nuveen Funds’ securities brought to its attention and considers the risks to the Nuveen Funds in assessing the possible resolutions to these matters. The Audit Committee may also consider any financial risk exposures for the Nuveen Funds in conjunction with performing its functions.
To fulfill its oversight duties, the Audit Committee receives annual and semi-annual reports and has regular meetings with the external auditors for the Nuveen Funds and the Adviser’s internal audit group. The Audit Committee also may review in a general manner the processes the Board or other Board committees have in place with respect to risk assessment and risk management as well as compliance with legal and regulatory matters relating to the Nuveen Funds’ financial statements. The committee operates under a written charter adopted and approved by the Board. Members of the Audit Committee shall be independent (as set forth in the charter) and free of any relationship that, in the opinion of the directors, would interfere with their exercise of independent judgment as an Audit Committee member. The members of the Audit Committee are Robert P. Bremner, David J. Kundert, Chair, William J. Schneider, Carole E. Stone and Terence J. Toth, each of whom is an independent director of the Nuveen Funds. During the fiscal year ended October 31, 2012, the Audit Committee met four times.
The Nominating and Governance Committee is responsible for seeking, identifying and recommending to the Board qualified candidates for election or appointment to the Board. In addition, the Nominating and Governance Committee oversees matters of corporate governance, including the evaluation of Board performance and processes, the assignment and rotation of committee members, and the establishment of corporate governance guidelines and procedures, to the extent necessary or desirable, and matters related thereto. Although the unitary and committee structure has been developed over the years and the Nominating and Governance Committee believes the structure has provided efficient and effective governance, the committee recognizes that as demands on the Board evolve over time (such as through an increase in the number of funds overseen or an increase in the complexity of the issues raised), the committee must continue to evaluate the Board and committee structures and their processes and modify the foregoing as may be necessary or appropriate to continue to provide effective governance. Accordingly, the Nominating and Governance Committee has a separate meeting each year to, among other things, review the Board and committee structures, their performance and functions, and recommend any modifications thereto or alternative structures or processes that would enhance the Board’s governance of the Nuveen Funds.
In addition, the Nominating and Governance Committee, among other things, makes recommendations concerning the continuing education of directors; monitors performance of legal counsel and other service providers; establishes and monitors a process by which security holders are able to communicate in writing with members of the Board; and periodically reviews and makes recommendations about any appropriate changes to director compensation. In the event of a vacancy on the Board, the Nominating and Governance Committee receives suggestions from various sources, including shareholders, as to suitable candidates. Suggestions should be sent in writing to Lorna Ferguson, Manager of Fund Board Relations, Nuveen Investments, 333 West Wacker Drive, Chicago, IL 60606. The Nominating and Governance Committee sets appropriate standards and requirements for nominations for new directors and reserves the right to interview any and all candidates and to make the final selection of any new directors. In considering a candidate’s qualifications, each
S-40
candidate must meet certain basic requirements, including relevant skills and experience, time availability (including the time requirements for due diligence site visits to sub-advisers and service providers) and, if qualifying as an independent director candidate, independence from the Adviser, sub-advisers, the Distributor and other service providers, including any affiliates of these entities. These skill and experience requirements may vary depending on the current composition of the Board, since the goal is to ensure an appropriate range of skills, diversity and experience, in the aggregate. Accordingly, the particular factors considered and weight given to these factors will depend on the composition of the Board and the skills and backgrounds of the incumbent directors at the time of consideration of the nominees. All candidates, however, must meet high expectations of personal integrity, independence, governance experience and professional competence. All candidates must be willing to be critical within the Board and with management and yet maintain a collegial and collaborative manner toward other Board members. The committee operates under a written charter adopted and approved by the Board. This committee is composed of the independent directors of the Nuveen Funds. Accordingly, the members of the Nominating and Governance Committee are Robert P. Bremner, Chair, Jack B. Evans, William C. Hunter, David J. Kundert, William J. Schneider, Judith M. Stockdale, Carole E. Stone, Virginia L. Stringer and Terence J. Toth. During the fiscal year ended October 31, 2012, the Nominating and Governance Committee met six times.
The Dividend Committee is authorized to declare distributions on the Nuveen Funds’ shares, including, but not limited to, regular and special dividends, capital gains and ordinary income distributions. The members of the Dividend Committee are Jack B. Evans, Chair, Judith M. Stockdale and Terence J. Toth. During the fiscal year ended October 31, 2012, the Dividend Committee met four times.
The Compliance, Risk Management and Regulatory Oversight Committee (the “Compliance Committee”) is responsible for the oversight of compliance issues, risk management and other regulatory matters affecting the Nuveen Funds that are not otherwise the jurisdiction of the other committees. The Board has adopted and periodically reviews policies and procedures designed to address the Nuveen Funds’ compliance and risk matters. As part of its duties, the Compliance Committee reviews the policies and procedures relating to compliance matters and recommends modifications thereto as necessary or appropriate to the full Board; develops new policies and procedures as new regulatory matters affecting the Nuveen Funds arise from time to time; evaluates or considers any comments or reports from examinations from regulatory authorities and responses thereto; and performs any special reviews, investigations or other oversight responsibilities relating to risk management, compliance and/or regulatory matters as requested by the Board.
In addition, the Compliance Committee is responsible for risk oversight, including, but not limited to, the oversight of risks related to investments and operations. Such risks include, among other things, exposures to particular issuers, market sectors, or types of securities; risks related to product structure elements, such as leverage; and techniques that may be used to address those risks, such as hedging and swaps. In assessing issues brought to the committee’s attention or in reviewing a particular policy, procedure, investment technique or strategy, the Compliance Committee evaluates the risks to the Nuveen Funds in adopting a particular approach compared to the anticipated benefits to the Nuveen Funds and their shareholders. In fulfilling its obligations, the Compliance Committee meets on a quarterly basis, and at least once a year in person. The Compliance Committee receives written and oral reports from the Nuveen Funds’ Chief Compliance Officer (“CCO”) and meets privately with the CCO at each of its quarterly meetings. The CCO also provides an annual report to the full Board regarding the operations of the Nuveen Funds’ and other service providers’ compliance programs as well as any recommendations for modifications thereto. The Compliance Committee also receives reports from the Adviser’s investment services group regarding various investment risks. Notwithstanding the foregoing, the full Board also participates in discussions with management regarding certain matters relating to investment risk, such as the use of leverage and hedging. The investment services group therefore also reports to the full Board at its quarterly meetings regarding, among other things, fund performance and the various drivers of such performance. Accordingly, the Board directly and/or in conjunction with the Compliance Committee oversees matters relating to investment risks. Matters not addressed at the committee level are addressed directly by the full Board. The committee operates under a written charter adopted and approved by the Board. The
S-41
members of the Compliance Committee are Jack B. Evans, William C. Hunter, William J. Schneider, Judith M. Stockdale, Chair, and Virginia L. Stringer. During the fiscal year ended October 31, 2012, the Compliance Committee met six times.
Effective January 1, 2012, the Board approved the creation of the Open-End Funds Committee. The Open-End Funds Committee is responsible for assisting the Board in the oversight and monitoring of the Nuveen Funds that are registered as open-end management investment companies (“Open-End Funds”). The committee may review and evaluate matters related to the formation and the initial presentation to the Board of any new Open-End Fund and may review and evaluate any matters relating to any existing Open-End Fund. The committee operates under a written charter adopted and approved by the Board. The members of the Open-End Funds Committee are Robert P. Bremner, David J. Kundert, Judith M. Stockdale, Virginia L. Stringer and Terence J. Toth, Chair. During the fiscal year ended October 31, 2012, the Open-End Funds Committee met three times.
Board Diversification and Director Qualifications
In determining that a particular director was qualified to serve on the Board, the Board has considered each director’s background, skills, experience and other attributes in light of the composition of the Board with no particular factor controlling. The Board believes that directors need to have the ability to critically review, evaluate, question and discuss information provided to them, and to interact effectively with Fund management, service providers and counsel, in order to exercise effective business judgment in the performance of their duties, and the Board believes each director satisfies this standard. An effective director may achieve this ability through his or her educational background; business, professional training or practice; public service or academic positions; experience from service as a board member or executive of investment funds, public companies or significant private or not-for-profit entities or other organizations; and/or other life experiences. Accordingly, set forth below is a summary of the experiences, qualifications, attributes, and skills that led to the conclusion, as of the date of this document, that each director should continue to serve in that capacity. References to the experiences, qualifications, attributes and skills of directors are pursuant to requirements of the SEC, do not constitute holding out of the Board or any director as having any special expertise or experience and shall not impose any greater responsibility or liability on any such person or on the Board by reason thereof.
John P. Amboian
Mr. Amboian, an interested director of the Nuveen Funds, joined Nuveen Investments in June 1995 and became Chief Executive Officer in July 2007 and Chairman in November 2007. Prior to this, since 1999, he served as President with responsibility for the firm’s product, marketing, sales, operations and administrative activities. Mr. Amboian initially served Nuveen Investments as Executive Vice President and Chief Financial Officer. Prior to joining Nuveen Investments, Mr. Amboian held key management positions with two consumer product firms affiliated with the Phillip Morris Companies. He served as Senior Vice President of Finance, Strategy and Systems at Miller Brewing Company. Mr. Amboian began his career in corporate and international finance at Kraft Foods, Inc., where he eventually served as Treasurer. He received a Bachelor’s degree in economics and a Masters of Business Administration (“MBA”) from the University of Chicago. Mr. Amboian serves on the Board of Directors of Nuveen Investments and is a Board Member or Trustee of the Investment Company Institute Board of Governors, Boys and Girls Clubs of Chicago, Children’s Memorial Hospital and Foundation, the Council on the Graduate School of Business (University of Chicago), and the North Shore Country Day School Foundation. He is also a member of the Civic Committee of the Commercial Club of Chicago and the Economic Club of Chicago.
Robert P. Bremner
Mr. Bremner, the Nuveen Funds’ Independent Chairman, is a private investor and management consultant in Washington, D.C. His biography of William McChesney Martin, Jr., a former chairman of the Federal Reserve Board, was published by Yale University Press in November 2004. From 1994 to 1997, he was a Senior Vice President at Samuels International Associates, an international consulting firm specializing in governmental policies, where he served in a part-time capacity. Previously, Mr. Bremner was a partner in the LBK Investors Partnership and was chairman and majority stockholder with ITC Investors Inc., both private investment firms. He currently serves on the Board
S-42
and as Treasurer of the Humanities Council of Washington D.C. and is a Board Member of the Independent Directors Council affiliated with the Investment Company Institute. From 1984 to 1996, Mr. Bremner was an independent Trustee of the Flagship Funds, a group of municipal open-end funds. He began his career at the World Bank in Washington D.C. He graduated with a Bachelor of Science degree from Yale University and received his MBA from Harvard University.
Jack B. Evans
President of the Hall-Perrine Foundation, a private philanthropic corporation, since 1996, Mr. Evans was formerly President and Chief Operating Officer of the SCI Financial Group, Inc., a regional financial services firm headquartered in Cedar Rapids, Iowa. Formerly, he was a member of the Board of the Federal Reserve Bank of Chicago as well as a Director of Alliant Energy. Mr. Evans is Chairman of the Board of United Fire Group, sits on the Board of Source Media Group, is a member of the Board of Regents for the State of Iowa University System and is a Life Trustee of Coe College. He has a Bachelor of Arts degree from Coe College and an MBA from the University of Iowa.
William C. Hunter
Mr. Hunter became Dean Emeritus of the Henry B. Tippie College of Business at the University of Iowa on June 30, 2012. He was appointed Dean of the Henry B. Tippie College of Business at the University of Iowa on July 1, 2006. He had been Dean and Distinguished Professor of Finance at the University of Connecticut School of Business since June 2003. From 1995 to 2003, he was the Senior Vice President and Director of Research at the Federal Reserve Bank of Chicago. While there he served as the Bank’s Chief Economist and was an Associate Economist on the Federal Reserve System’s Federal Open Market Committee (FOMC). In addition to serving as a Vice President in charge of financial markets and basic research at the Federal Reserve Bank in Atlanta, he held faculty positions at Emory University, Atlanta University, the University of Georgia and Northwestern University. A past Director of the Credit Research Center at Georgetown University, SS&C Technologies, Inc. (2005) and past President of the Financial Management Association International, he has consulted with numerous foreign central banks and official agencies in Western Europe, Central and Eastern Europe, Asia, Central America and South America. From 1990 to 1995, he was a U.S. Treasury Advisor to Central and Eastern Europe. He has been a Director of the Xerox Corporation since 2004 and Wellmark, Inc. since 2009. He is a Director and President of Beta Gamma Sigma, Inc., The International Business Honor Society.
David J. Kundert
Mr. Kundert retired in 2004 as Chairman of JPMorgan Fleming Asset Management, and as President and CEO of Banc One Investment Advisors Corporation, and as President of One Group Mutual Funds. Prior to the merger between Bank One Corporation and JPMorgan Chase and Co., he was Executive Vice President, Bank One Corporation and, since 1995, the Chairman and CEO, Banc One Investment Management Group. From 1988 to 1992, he was President and CEO of Bank One Wisconsin Trust Company. Currently, Mr. Kundert is a Director of the Northwestern Mutual Wealth Management Company. He started his career as an attorney for Northwestern Mutual Life Insurance Company. Mr. Kundert has served on the Board of Governors of the Investment Company Institute and he is currently a member of the Wisconsin Bar Association. He is on the Board of the Greater Milwaukee Foundation and chairs its Investment Committee. He is a Regent Emeritus and a Member of the Investment Committee of Luther College. He is also a Member of the Board of Directors (Milwaukee), College Possible. He received his Bachelor of Arts degree from Luther College, and his Juris Doctor from Valparaiso University.
William J. Schneider
Mr. Schneider is currently Chairman, formerly Senior Partner and Chief Operating Officer (retired, December 2004) of Miller-Valentine Partners Ltd., a real estate investment company. He is also a Member of two Miller Valentine real estate LLC companies. He was formerly a Director and Past Chair of the Dayton Development Coalition. He was formerly a member of the Community Advisory Board of the National City Bank in Dayton as well as a former member of the Business Advisory Council of the Cleveland Federal Reserve Bank. Mr. Schneider is a member of the Business Advisory Council for the University of Dayton College of Business. Mr. Schneider was an independent Trustee of the
S-43
Flagship Funds, a group of municipal open-end funds. He also served as Chair of the Miami Valley Hospital and as Chair of the Finance Committee of its parent holding company. He is a Board Member of Tech Town, Inc, a not-for-profit community development company and a Board Member of WDPR Public Radio. Mr. Schneider has a Bachelor of Science in Community Planning from the University of Cincinnati and a Masters of Public Administration from the University of Dayton.
Judith M. Stockdale
Ms. Stockdale retired in 2012 as Executive Director of the Gaylord and Dorothy Donnelley Foundation, a private foundation working in land conservation and artistic vitality in the Chicago region and the Low country of South Carolina. Her previous positions include Executive Director of the Great Lakes Protection Fund, Executive Director of Openlands, and Senior Staff Associate at the Chicago Community Trust. She has served on the Boards of the Land Trust Alliance, the National Zoological Park, the Governor’s Science Advisory Council (Illinois), the Nancy Ryerson Ranney Leadership Grants Program, Friends of Ryerson Woods and the Donors Forum. Ms. Stockdale, a native of the United Kingdom, has a Bachelor of Science degree in geography from the University of Durham (UK) and a Master of Forest Science degree from Yale University.
Carole E. Stone
Ms. Stone retired from the New York State Division of the Budget in 2004, having served as its Director for nearly five years and as Deputy Director from 1995 through 1999. Ms. Stone is currently on the Board of Directors of the Chicago Board Options Exchange, CBOE Holdings, Inc. and C2 Options Exchange, Incorporated. She has also served as the Chair of the New York Racing Association Oversight Board, as a Commissioner on the New York State Commission on Public Authority Reform and as a member of the Boards of Directors of several New York State public authorities. Ms. Stone has a Bachelor of Arts from Skidmore College in Business Administration.
Virginia L. Stringer
Ms. Stringer served as the independent chair of the Board of the First American Fund Complex from 1997 to 2010, having joined such Board in 1987. Ms. Stringer serves on the board of the Mutual Fund Directors Forum. She is a recipient of the Outstanding Corporate Director award from Twin Cities Business Monthly and the Minnesota Chapter of the National Association of Corporate Directors. Ms. Stringer is the past board chair of the Oak Leaf Trust, director emeritus and former Chair of the Saint Paul Riverfront Corporation and also served as President of the Minneapolis Club’s Governing Board. She is a director and former board chair of the Minnesota Opera and a Life Trustee and former board of the Voyageur Outward Bound School. She also served as a trustee of Outward Bound USA. She was appointed by the Governor of Minnesota to the Board on Judicial Standards and also served on a Minnesota Supreme Court Judicial Advisory Committee to reform the state’s judicial disciplinary process. She is a member of the International Women’s Forum and attended the London Business School as an International Business Fellow. Ms. Stringer also served as board chair of the Human Resource Planning Society, the Minnesota Women’s Campaign Fund and the Minnesota Women’s Economic Roundtable. Ms. Stringer is the retired founder of Strategic Management Resources, a consulting practice focused on corporate governance, strategy and leadership. She has twenty five years of corporate experience having held executive positions in general management, marketing and human resources with IBM and the Pillsbury Company.
Terence J. Toth
Mr. Toth is a Director, Legal & General Investment Management America, Inc. (since 2008) and a Managing Partner, Promus Capital (since 2008). From 2004 to 2007, he was Chief Executive Officer and President of Northern Trust Global Investments, and Executive Vice President of Quantitative Management & Securities Lending from 2000 to 2004. He also formerly served on the Board of the Northern Trust Mutual Funds. He joined Northern Trust in 1994 after serving as Managing Director and Head of Global Securities Lending at Bankers Trust (1986 to 1994) and Head of Government Trading and Cash Collateral Investment at Northern Trust from 1982 to 1986. He currently serves on the Board of Chicago Fellowship and is Chairman of the Board of Catalyst Schools of Chicago. He is on the Mather Foundation Board (since 2012) and is a member of its investment committee. Mr. Toth graduated with a Bachelor of Science degree from the University of Illinois, and received his MBA from New York University. In 2005, he graduated from the CEO Perspectives Program at Northwestern University.
S-44
Board Compensation
The following table shows, for each independent director, (1) the aggregate compensation paid by the Funds for the fiscal year ended October 31, 2012, (2) the amount of total compensation paid by the Funds that has been deferred, and (3) the total compensation paid to each director by the Nuveen Funds during the fiscal year ended October 31, 2012.
| | | | | | | | | | | | |
Name of Director | | Aggregate
Compensation
From Funds1 | | | Amount of Total
Compensation that Has
Been Deferred2 | | | Total Compensation
From Nuveen Funds
Paid to Director3 | |
| Robert P. Bremner | | $ | 20,858 | | | $ | 2,760 | | | $ | 343,713 | |
| Jack B. Evans | | | 15,572 | | | | 3,467 | | | | 262,755 | |
| William C. Hunter | | | 14,384 | | | | 3,385 | | | | 240,276 | |
| David J. Kundert | | | 16,654 | | | | 14,608 | | | | 269,060 | |
| William J. Schneider | | | 17,296 | | | | 11,597 | | | | 286,919 | |
| Judith M. Stockdale | | | 15,657 | | | | 8,635 | | | | 261,414 | |
| Carole E. Stone | | | 15,826 | | | | — | | | | 263,100 | |
| Virginia L. Stringer | | | 17,726 | | | | — | | | | 248,600 | |
| Terence J. Toth | | | 20,435 | | | | — | | | | 298,475 | |
| 1 | | The compensation paid, including deferred amounts, to the independent directors for the fiscal year ended October 31, 2012 for services to the Funds. |
| 2 | | Pursuant to a deferred compensation agreement with the Funds, deferred amounts are treated as though an equivalent dollar amount has been invested in shares of one or more eligible Nuveen Funds. The amounts provided are the total deferred fees (including the return from the assumed investment in the eligible Nuveen Funds) payable from the Funds. |
| 3 | | Based on the compensation paid (including any amounts deferred) to the directors for the one-year period ended October 31, 2012 for services to the Nuveen Funds. |
Prior to January 1, 2012, independent directors received a $120,000 annual retainer plus (a) a fee of $4,500 per day for attendance in person or by telephone at regularly scheduled meetings of the Board; (b) a fee of $3,000 per meeting for attendance in person or by telephone at special, non-regularly scheduled Board meetings where in-person attendance was required and $2,000 per meeting for attendance by telephone or in person at such meetings where in-person attendance was not required; (c) a fee of $2,500 per meeting for attendance in person or by telephone at Audit Committee meetings where in-person attendance was required and $2,000 per meeting for attendance by telephone or in person at such meetings where in-person attendance was not required; (d) a fee of $2,500 per meeting for attendance in person or by telephone at Compliance, Risk Management and Regulatory Oversight Committee meetings where in-person attendance was required and $2,000 per meeting for attendance by telephone or in person at such meetings where in-person attendance was not required; (e) a fee of $1,000 per meeting for attendance in person or by telephone at Dividend Committee meetings; and (f) a fee of $500 per meeting for attendance in person or by telephone at all other committee meetings ($1,000 for shareholder meetings) where in-person attendance was required and $250 per meeting for attendance by telephone or in person at such committee meetings (excluding shareholder meetings) where in-person attendance was not required, and $100 per meeting when the Executive Committee acted as pricing committee for IPOs, plus, in each case, expenses incurred in attending such meetings, provided that no fees were received for meetings held on days on which regularly scheduled Board meetings were held. In addition to the payments described above, the Chairman of the Board received $75,000, the chairpersons of the Audit Committee, the Dividend Committee and the Compliance, Risk Management and Regulatory Oversight Committee received $10,000 each and the chairperson of the Nominating and Governance Committee received $5,000 as additional retainers. Independent directors also received a fee of $3,000 per day for site visits to entities that provided services to the Nuveen Funds on days on which no Board meeting was held. When ad hoc committees were organized, the Nominating and Governance Committee at the time of formation determined compensation to be paid to the members of such committee; however, in general, such fees were $1,000 per meeting for attendance in person or by telephone at ad hoc committee meetings where in-person attendance was required and $500 per meeting for attendance by telephone or in person at such meetings where in-person
S-45
attendance was not required. The annual retainer, fees and expenses were allocated among the Nuveen Funds on the basis of relative net assets, although management might have, in its discretion, established a minimum amount to be allocated to each fund.
Effective January 1, 2012, independent directors received a $130,000 annual retainer, which was increased to $140,000 as of January 1, 2013, plus they receive (a) a fee of $4,500 per day for attendance in person or by telephone at regularly scheduled meetings of the Board; (b) a fee of $3,000 per meeting for attendance in person or by telephone at special, non-regularly scheduled Board meetings where in-person attendance is required and $2,000 per meeting for attendance by telephone or in person at such meetings where in-person attendance is not required; (c) a fee of $2,500 per meeting for attendance in person or by telephone at Audit Committee meetings where in-person attendance is required and $2,000 per meeting for attendance by telephone or in person at such meetings where in-person attendance is not required; (d) a fee of $2,500 per meeting for attendance in person or by telephone at Compliance, Risk Management and Regulatory Oversight Committee meetings where in-person attendance is required and $2,000 per meeting for attendance by telephone or in person at such meetings where in-person attendance is not required; (e) a fee of $1,000 per meeting for attendance in person or by telephone at Dividend Committee meetings; (f) a fee of $500 per meeting for attendance in person or by telephone at all other committee meetings ($1,000 for shareholder meetings) where in-person attendance is required and $250 per meeting for attendance by telephone or in person at such committee meetings (excluding shareholder meetings) where in-person attendance is not required, and $100 per meeting when the Executive Committee acts as pricing committee for IPOs, plus, in each case, expenses incurred in attending such meetings, provided that no fees are received for meetings held on days on which regularly scheduled Board meetings are held; and (g) a fee of $2,500 per meeting for attendance in person or by telephone at Open-End Funds Committee meetings where in-person attendance is required and $2,000 per meeting for attendance by telephone or in person at such meetings where in-person attendance is not required; provided that no fees are received for meetings held on days on which regularly scheduled Board meetings are held. In addition to the payments described above, the Chairman of the Board receives $75,000, the chairpersons of the Audit Committee, the Dividend Committee, the Compliance, Risk Management and Regulatory Oversight Committee and the Open-End Funds Committee receive $12,500 each and the chairperson of the Nominating and Governance Committee receives $5,000 as additional retainers. Independent trustees also receive a fee of $3,000 per day for site visits to entities that provide services to the Nuveen Funds on days on which no Board meeting is held. When ad hoc committees are organized, the Nominating and Governance Committee will at the time of formation determine compensation to be paid to the members of such committee; however, in general, such fees will be $1,000 per meeting for attendance in person or by telephone at ad hoc committee meetings where in-person attendance is required and $500 per meeting for attendance by telephone or in person at such meetings where in-person attendance is not required. The annual retainer, fees and expenses are allocated among the Nuveen Funds on the basis of relative net assets, although management may, in its discretion, establish a minimum amount to be allocated to each fund.
NIF does not have a retirement or pension plan. NIF has a deferred compensation plan (the “Deferred Compensation Plan”) that permits any independent director to elect to defer receipt of all or a portion of his or her compensation as an independent director. The deferred compensation of a participating director is credited to a book reserve account of NIF when the compensation would otherwise have been paid to the director. The value of the director’s deferral account at any time is equal to the value that the account would have had if contributions to the account had been invested and reinvested in shares of one or more of the eligible Nuveen Funds. At the time for commencing distributions from a director’s deferral account, the independent director may elect to receive distributions in a lump sum or over a period of five years. NIF will not be liable for any other fund’s obligations to make distributions under the Deferred Compensation Plan.
The Funds have no employees. The officers of NIF and the director of NIF who is not an independent director serve without any compensation from the Funds.
S-46
Share Ownership
The information in the table below discloses the dollar ranges of (i) each director’s beneficial ownership in each Fund, and (ii) each director’s aggregate beneficial ownership in all funds within the Nuveen Funds complex, including in each case the value of fund shares elected by the director in the directors’ deferred compensation plan, based on the value of fund shares as of December 31, 2012.
| | | | | | | | | | | | | | | | | | | | | | | | | | | | | | | | | | | | | | | | |
| | | Directors | |
| | | Bremner | | | Evans | | | Hunter | | | Kundert | | | Schneider | | | Stockdale | | | Stone | | | Stringer | | | Toth | | | Amboian | |
Aggregate Holdings – Fund Complex | |
| Over
$100,000 |
| |
| Over
$100,000 |
| |
| Over
$100,000 |
| |
| Over
$100,000 |
| |
| Over
$100,000 |
| |
| Over
$100,000 |
| |
| Over
$100,000 |
| |
| Over
$100,000 |
| |
| Over
$100,000 |
| |
| Over
$100,000 |
|
Nuveen Dividend Value Fund | | | — | | | | — | | | | — | | | | — | | | | — | | | | — | | | | — | | |
| $10,001-
$50,000 |
| |
| $50,001-
$100,000 |
| | | — | |
Nuveen Equity Index Fund | | | — | | | | — | | | | — | | | | — | | | | — | | | | — | | | | — | | | | — | | | | — | | | | — | |
Nuveen International Fund | | | — | | | | — | | | | — | | | | — | | | | — | | | | — | | | | — | | |
| $10,001-
$50,000 |
| | | — | | | | — | |
Nuveen International Select Fund | | | — | | | | — | | | | — | | | | — | | | | — | | | | — | | | | — | | |
| $50,001-
$100,000 |
| | | — | | | | — | |
Nuveen Large Cap Growth Opportunities Fund | | | — | | | | — | | | | — | | | | — | | | | — | | | | — | | | | — | | |
| $10,001-
$50,000 |
| | | — | | | | — | |
Nuveen Large Cap Select Fund | | | — | | | | — | | | | — | | | | — | | | | — | | | | — | | | | — | | | | — | | | | — | | | | — | |
Nuveen Mid Cap Growth Opportunities Fund | | | — | | | | — | | | | — | | | | — | | | | — | | | | — | | | | — | | |
| $50,001-
$100,000 |
| | | — | | | | — | |
Nuveen Mid Cap Index Fund | | | — | | | | — | | | | — | | | | — | | | | — | | | | — | | | | — | | |
| $10,001-
$50,000 |
| | | — | | | | — | |
Nuveen Mid Cap Select Fund | | | — | | | | — | | | | — | | | | — | | | | — | | | | — | | | | — | | | | — | | | | — | | | | — | |
Nuveen Mid Cap Value Fund | | | — | | | | — | | | | — | | | | — | | | | — | | | | — | | | | — | | |
| $50,001-
$100,000 |
| | | — | | | | — | |
Nuveen Quantitative Enhanced Core Equity Fund | | | — | | | | — | | | | — | | | | — | | | | — | | | | — | | | | — | | | | — | | | | — | | | | — | |
Nuveen Small Cap Growth Opportunities Fund | | | — | | | | — | | | | — | | | | — | | | | — | | | | — | | | | — | | | | — | | | | — | | | | — | |
Nuveen Small Cap Index Fund | | | — | | | | — | | | | — | | | | — | | | | — | | | | — | | | | — | | |
| $10,001-
$50,000 |
| | | — | | | | — | |
Nuveen Small Cap Select Fund | | | — | | | | — | | | | — | | | | — | | | | — | | | | — | | | | — | | |
| $50,001-
$100,000 |
| | | — | | | | — | |
Nuveen Small Cap Value Fund | | | — | | | | — | | | | — | | | | — | | | | — | | | | — | | | | — | | |
| $10,001-
$50,000 |
| | | — | | | | — | |
Nuveen Tactical Market Opportunities Fund | | | — | | | | — | | | | — | | | | — | | | | — | | | | — | | |
| $50,001-
$100,000 |
| | | — | | |
| $10,001-
$50,000 |
| |
| $50,001-
$100,000 |
|
As of February 4, 2013, the officers and directors of each Fund, in the aggregate, owned less than 1% of the shares of each of the Funds.
As of February 4, 2013, none of the independent directors or their immediate family members owned, beneficially, or of record, any securities in (i) an investment adviser or principal underwriter of the Funds or (ii) a person (other than a registered investment company) directly or indirectly controlling, controlled by, or under common control with an investment adviser or principal underwriter of the Funds.
Sales Loads
Directors of the Funds and certain other Fund affiliates may purchase the Funds’ Class I shares. See the Funds’ Prospectus for details.
S-47
SERVICE PROVIDERS
Investment Adviser
Nuveen Fund Advisors, located at 333 West Wacker Drive, Chicago, Illinois 60606, serves as the investment adviser of each Fund, with responsibility for the overall management of each Fund. The Adviser is also responsible for managing the Funds’ business affairs and providing day-to-day administrative services to the Funds. The Adviser has selected its affiliate, Nuveen Asset Management, located at 333 West Wacker Drive, Chicago, Illinois 60606, to serve as sub-adviser to manage the investment portfolios of the Funds. In addition, the Adviser has selected one or more Sub-Advisers provide investment advisory services to Nuveen International Fund and Nuveen International Select Fund. For additional information regarding the management services performed by the Adviser and Sub-Advisers, see “Who Manages the Funds” in the Prospectus.
The Adviser is an affiliate of the Distributor, which is located at 333 West Wacker Drive, Chicago, Illinois 60606. The Distributor is the principal underwriter for the Nuveen Mutual Funds, and has served as co-managing underwriter for the shares of the Nuveen Closed-End Funds. The Adviser and the Distributor are subsidiaries of Nuveen Investments.
On November 13, 2007, Nuveen Investments was acquired by investors led by Madison Dearborn Partners, LLC, which is a private equity investment firm based in Chicago, Illinois.
For the management services and facilities furnished by the Adviser, each of the Funds has agreed to pay an annual management fee at rates set forth in the Prospectus under “Who Manages the Funds.” In addition, for certain funds the Adviser has agreed to waive all or a portion of its management fee or reimburse certain expenses of the Funds. The Prospectus includes current fee waivers and expense reimbursements for the Funds.
Each Fund’s management fee is divided into two components—a complex-level fee based on the aggregate amount of all eligible Nuveen Fund assets and a specific fund-level fee based only on the amount of assets within each individual Fund. This pricing structure enables Fund shareholders to benefit from growth in the assets within each individual Fund as well as from growth in the amount of complex-wide assets managed by the Adviser. Under no circumstances will this pricing structure result in a Fund paying management fees at a rate higher than would otherwise have been applicable had the complex-wide management fee structure not been implemented.
Each Fund has agreed to pay an annual fund-level management fee, payable monthly, based upon the average daily net assets of each Fund as set forth in the Prospectus.
Each Fund’s complex-level fee is payable monthly and is additive to the fund-level fee. It is determined by taking the current overall complex-level fee rate, which is based on the aggregate amount of the “eligible assets” of all Nuveen Funds, and making, as appropriate, upward adjustments to that rate based upon the percentage of each Fund’s assets that are not “eligible assets.” The current overall complex-level fee schedule is as follows:
| | | | |
Complex-Level Asset Breakpoint Level* | | Effective Rate at
Breakpoint Level | |
| $55 billion | | | 0.2000 | % |
| $56 billion | | | 0.1996 | % |
| $57 billion | | | 0.1989 | % |
| $60 billion | | | 0.1961 | % |
| $63 billion | | | 0.1931 | % |
| $66 billion | | | 0.1900 | % |
| $71 billion | | | 0.1851 | % |
| $76 billion | | | 0.1806 | % |
| $80 billion | | | 0.1773 | % |
| $91 billion | | | 0.1691 | % |
| $125 billion | | | 0.1599 | % |
| $200 billion | | | 0.1505 | % |
| $250 billion | | | 0.1469 | % |
| $300 billion | | | 0.1445 | % |
S-48
| * | | The complex-level fee is calculated based upon the aggregate daily “eligible assets” of all Nuveen Funds. Except as described below, eligible assets include the net assets of all Nuveen-branded closed-end and open-end registered investment companies organized in the United States. Eligible assets do not include assets attributable to investments in other Nuveen Funds or assets in excess of a determined amount (originally $2 billion) added to the Nuveen Fund complex in connection with Nuveen Fund Advisors’ assumption of the management of the former First American Funds effective January 1, 2011. Eligible assets include closed-end fund assets managed by the Adviser that are attributable to financial leverage. For these purposes, financial leverage includes the closed-end funds’ use of preferred stock and borrowings and certain investments in the residual interest certificates (also called inverse floating rate securities) in tender option bond (TOB) trusts, including the portion of assets held by a TOB trust that has been effectively financed by the trust’s issuance of floating rate securities, subject to an agreement by the Adviser as to certain funds to limit the amount of such assets for determining eligible assets in certain circumstances. |
A Fund’s complex-level fee rate will not exceed the maximum overall complex-level fee rate of 0.2000%. As of December 31, 2012, the Funds’ complex-level fees were:
| | | | |
Fund | | Complex-Level Fee Rate | |
| Nuveen Dividend Value Fund | | | 0.1885 | % |
| Nuveen Equity Index Fund | | | 0.1998 | % |
| Nuveen International Fund | | | 0.1998 | % |
| Nuveen International Select Fund | | | 0.1998 | % |
| Nuveen Large Cap Growth Opportunities Fund | | | 0.1965 | % |
| Nuveen Large Cap Select Fund | | | 0.1998 | % |
| Nuveen Mid Cap Growth Opportunities Fund | | | 0.1969 | % |
| Nuveen Mid Cap Index Fund | | | 0.1867 | % |
| Nuveen Mid Cap Select Fund | | | 0.1998 | % |
| Nuveen Mid Cap Value Fund | | | 0.1998 | % |
| Nuveen Quantitative Enhanced Core Equity Fund | | | 0.1998 | % |
| Nuveen Small Cap Growth Opportunities Fund | | | 0.1998 | % |
| Nuveen Small Cap Index Fund | | | 0.1929 | % |
| Nuveen Small Cap Select Fund | | | 0.1998 | % |
| Nuveen Small Cap Value Fund | | | 0.1998 | % |
| Nuveen Tactical Market Opportunities Fund | | | 0.1706 | % |
The following table sets forth the management fees (net of fee waivers and expense reimbursements) paid by the Funds and the fees waived and expenses reimbursed by the Adviser for the specified periods.
| | | | | | | | | | | | | | | | |
| | | Management Fees Net of Expense
Reimbursement Paid to
the Adviser | | | Fee Waivers and Expense
Reimbursements from
the Adviser | |
Fund | | January 1, 2011 through
October 31, 2011 | | | Fiscal Year Ended
October 31, 2012 | | | January 1, 2011 through
October 31, 2011 | | | Fiscal Year Ended
October 31, 2012 | |
Nuveen Dividend Value Fund | | $ | 6,548,266 | | | $ | 9,085,008 | | | $ | — | | | $ | — | |
Nuveen Equity Index Fund | | | 1,502,803 | | | | 1,535,193 | | | | 380,405 | | | | 527,292 | |
Nuveen International Fund | | | 5,458,891 | | | | 675,228 | | | | — | | | | 568,337 | |
Nuveen International Select Fund | | | 6,348,008 | | | | 4,836,386 | | | | — | | | | 239,458 | |
Nuveen Large Cap Growth Opportunities Fund | | | 3,820,396 | | | | 4,544,672 | | | | 31 | | | | 157,519 | |
Nuveen Large Cap Select Fund | | | 612,328 | | | | 332,857 | | | | — | | | | 34 | |
S-49
| | | | | | | | | | | | | | | | |
| | | Management Fees Net of Expense
Reimbursement Paid to
the Adviser | | | Fee Waivers and Expense
Reimbursements from
the Adviser | |
Fund | | January 1, 2011 through
October 31, 2011 | | | Fiscal Year Ended
October 31, 2012 | | | January 1, 2011 through
October 31, 2011 | | | Fiscal Year Ended
October 31, 2012 | |
Nuveen Mid Cap Growth Opportunities Fund | | $ | 8,042,935 | | | $ | 9,311,106 | | | $ | 2,827 | | | $ | 303,377 | |
Nuveen Mid Cap Index Fund | | | 777,222 | | | | 952,549 | | | | 63,532 | | | | 208,407 | |
Nuveen Mid Cap Select Fund | | | 102,575 | | | | 113,646 | | | | 171,106 | | | | 135,661 | |
Nuveen Mid Cap Value Fund | | | 2,137,956 | | | | 1,328,929 | | | | 37,294 | | | | 426,012 | |
Nuveen Quantitative Enhanced Core Equity Fund | | | 454,695 | | | | 144,067 | | | | 240,629 | | | | 309,007 | |
Nuveen Small Cap Growth Opportunities Fund | | | 1,018,628 | | | | 750,940 | | | | 62,119 | | | | 246,288 | |
Nuveen Small Cap Index Fund | | | 47,392 | | | | — | | | | 165,373 | | | | 339,342 | |
Nuveen Small Cap Select Fund | | | 4,614,336 | | | | 4,155,906 | | | | 301,403 | | | | 428,176 | |
Nuveen Small Cap Value Fund | | | 736,439 | | | | 648,309 | | | | 3,362 | | | | 108,555 | |
Nuveen Tactical Market Opportunities Fund | | | 165,463 | | | | 1,328,746 | | | | 50,143 | | | | 28,783 | |
The Funds were formerly advised by FAF Advisors, Inc. (“FAF”), a wholly-owned subsidiary of U.S. Bank National Association (“U.S. Bank”). On December 31, 2010, pursuant to an agreement among U.S. Bank, FAF, Nuveen Investments and certain Nuveen affiliates, Nuveen Fund Advisors acquired a portion of the asset management business of FAF and was selected as the investment adviser of the Funds (the “Transaction”).
As noted, FAF served as the Funds’ investment adviser prior to the consummation of the Transaction. The following table sets forth the management fees (net of fee waivers and expense reimbursements) paid by the Funds and the fees waived and expenses reimbursed by FAF for the specified periods.
| | | | | | | | | | | | | | | | |
| | | Management Fees Net of Expense
Reimbursement Paid to FAF | | | Fee Waivers and Expense
Reimbursements from FAF | |
Fund | | Fiscal Year Ended
October 31, 2010 | | | November 1, 2010 through
December 31, 2010 | | | Fiscal Year Ended
October 31, 2010 | | | November 1, 2010 through
December 31, 2010 | |
Nuveen Dividend Value Fund | | $ | 4,846,342 | | | $ | 962,850 | | | $ | 5,472 | | | $ | 3,323 | |
Nuveen Equity Index Fund | | | 677,957 | | | | 107,263 | | | | 1,652,113 | | | | 272,985 | |
Nuveen International Fund | | | 6,279,110 | | | | 1,027,230 | | | | 717,593 | | | | 120,891 | |
Nuveen International Select
Fund | | | 6,587,447 | | | | 1,267,564 | | | | 998,865 | | | | 160,054 | |
S-50
| | | | | | | | | | | | | | | | |
| | | Management Fees Net of Expense
Reimbursement Paid to FAF | | | Fee Waivers and Expense
Reimbursements from FAF | |
Fund | | Fiscal Year Ended
October 31, 2010 | | | November 1, 2010 through
December 31, 2010 | | | Fiscal Year Ended
October 31, 2010 | | | November 1, 2010 through
December 31, 2010 | |
Nuveen Large Cap Growth Opportunities Fund | | $ | 3,743,499 | | | $ | 656,155 | | | $ | 4,441 | | | $ | 579 | |
Nuveen Large Cap Select Fund | | | 901,701 | | | | 142,097 | | | | 1,376 | | | | 20 | |
Nuveen Mid Cap Growth Opportunities Fund | | | 8,851,902 | | | | 1,523,652 | | | | 10,274 | | | | 1,218 | |
Nuveen Mid Cap Index Fund | | | 310,520 | | | | 70,117 | | | | 285,008 | | | | 47,554 | |
Nuveen Mid Cap Select Fund | | | 52,686 | | | | 13,175 | | | | 232,447 | | | | 34,325 | |
Nuveen Mid Cap Value Fund | | | 4,156,389 | | | | 613,635 | | | | 6,475 | | | | 382 | |
Nuveen Quantitative Enhanced Core Equity Fund | | | 113,702 | | | | 30,033 | | | | 405,333 | | | | 70,098 | |
Nuveen Small Cap Growth Opportunities Fund | | | 1,343,107 | | | | 244,906 | | | | 361,674 | | | | 59,567 | |
Nuveen Small Cap Index Fund | | | — | 1 | | | — | 1 | | | 418,808 | | | | 77,362 | |
Nuveen Small Cap Select Fund | | | 5,130,135 | | | | 931,688 | | | | 14,954 | | | | 2,075 | |
Nuveen Small Cap Value Fund | | | 1,424,720 | | | | 212,646 | | | | 2,114 | | | | 643 | |
Nuveen Tactical Market Opportunities Fund 2 | | | — | 1 | | | 5,834 | | | | 114,958 | | | | 24,728 | |
| 1 | | Advisory and certain other fees for the period were waived by FAF to comply with total operating expense limitations that were agreed upon by the Funds and FAF. |
| 2 | | Commenced operations on December 30, 2009. |
In addition to the Adviser’s management fee, each Fund also pays a portion of NIF’s general administrative expenses allocated in proportion to the net assets of each Fund. All fees and expenses are accrued daily and deducted before payment of dividends to investors.
Sub-Advisers
The Adviser has selected Nuveen Asset Management to serve as sub-adviser to manage the investment portfolio of each Fund. In addition, one or more Sub-Advisers provide investment advisory services to Nuveen International Fund and Nuveen International Select Fund. Nuveen Asset Management is responsible for selecting the Funds’ investment strategies and, as it relates to Nuveen International Fund and Nuveen International Select Fund, for allocating and reallocating assets among the other Sub-Advisers consistent with each Fund’s investment objectives and strategies. Any Assets not allocated to another Sub-Adviser of Nuveen International Fund and Nuveen International Select Fund are managed by Nuveen Asset Management. The Adviser and Nuveen Asset Management are also responsible for implementing procedures to ensure that each Sub-Adviser complies with the respective Fund’s investment objective, policies and restrictions. The Adviser pays Nuveen Asset Management a portfolio management fee for each Fund equal to the percentage shown below of the
S-51
advisory fee paid to the Adviser for its services to the Funds (net of any waivers, reimbursement payments, supermarket fees and alliance fees waived, reimbursed or paid by the Adviser in respect of each Fund).
| | | | |
Fund | | Percentage of Fee to be paid by the
Adviser to Nuveen Asset Management | |
| Nuveen Dividend Value Fund | | | 50.0000 | % |
| Nuveen Equity Index Fund | | | 33.3333 | % |
| Nuveen International Fund | | | 30.0000 | % |
| Nuveen International Select Fund | | | 30.0000 | % |
| Nuveen Large Cap Growth Opportunities Fund | | | 47.0588 | % |
| Nuveen Large Cap Select Fund | | | 53.3333 | % |
| Nuveen Mid Cap Growth Opportunities Fund | | | 55.5556 | % |
| Nuveen Mid Cap Index Fund | | | 28.5714 | % |
| Nuveen Mid Cap Select Fund | | | 55.5556 | % |
| Nuveen Mid Cap Value Fund | | | 55.5556 | % |
| Nuveen Quantitative Enhanced Core Equity Fund | | | 50.0000 | % |
| Nuveen Small Cap Growth Opportunities Fund | | | 50.0000 | % |
| Nuveen Small Cap Index Fund | | | 42.8571 | % |
| Nuveen Small Cap Select Fund | | | 55.5556 | % |
| Nuveen Small Cap Value Fund | | | 55.5556 | % |
| Nuveen Tactical Market Opportunities Fund | | | 50.0000 | % |
The following table sets forth the fees paid by the Adviser to Nuveen Asset Management for its services for the specified periods:
| | | | | | | | |
| | | Amount Paid by the Adviser to
Nuveen Asset Management | |
Fund | | 1/01/11-10/31/11 | | | 11/01/11-10/31/12 | |
| Nuveen Dividend Value Fund | | $ | 3,274,133 | | | $ | 4,556,272 | |
| Nuveen Equity Index Fund | | | 500,934 | | | | 511,730 | |
| Nuveen International Fund | | | 1,673,693 | | | | 210,954 | |
| Nuveen International Select Fund | | | 1,952,418 | | | | 1,450,916 | |
| Nuveen Large Cap Growth Opportunities Fund | | | 1,797,833 | | | | 2,138,668 | |
| Nuveen Large Cap Select Fund | | | 326,575 | | | | 177,524 | |
| Nuveen Mid Cap Growth Opportunities Fund | | | 4,468,301 | | | | 4,717,268 | |
| Nuveen Mid Cap Index Fund | | | 222,063 | | | | 272,157 | |
| Nuveen Mid Cap Select Fund | | | 72,227 | | | | 63,137 | |
| Nuveen Mid Cap Value Fund | | | 1,187,754 | | | | 749,432 | |
| Nuveen Quantitative Enhanced Core Equity Fund | | | 227,347 | | | | 120,503 | |
| Nuveen Small Cap Growth Opportunities Fund | | | 510,313 | | | | 408,902 | |
| Nuveen Small Cap Index Fund | | | 43,415 | | | | 13,873 | |
| Nuveen Small Cap Select Fund | | | 2,563,522 | | | | 2,308,838 | |
| Nuveen Small Cap Value Fund | | | 409,133 | | | | 362,669 | |
| Nuveen Tactical Market Opportunities Fund | | | 84,013 | | | | 664,373 | |
The following tables set forth the percentages that are to be paid by the Adviser to the Sub-Advisers for Nuveen International Fund and Nuveen International Select Fund for their sub-advisory services. The fees are based on the aggregate average daily assets of Nuveen International Fund’s and Nuveen International Select Fund’s assets allocated to such Sub-Adviser. The fee is calculated daily and paid monthly.
| | | | | | | | |
Sub-Adviser | | Aggregate Assets of
Sub-Advisory Portfolio | | | Fee per annum to be paid from
the Adviser to Sub-Adviser | |
| Altrinsic | | | First $150 Million | | | | 0.45 | % |
| | | Next $350 Million | | | | 0.37 | % |
| | | Over $500 Million | | | | 0.35 | % |
S-52
| | | | | | | | |
Sub-Adviser | | Aggregate Assets of
Sub-Advisory Portfolio | | | Fee per annum to be paid from
the Adviser to Sub-Adviser | |
| Lazard | | | First $112.5 Million | | | | 0.75 | % |
| | | Next $37.5 Million | | | | 0.70 | % |
| | | Next $37.5 Million | | | | 0.65 | % |
| | | Next $187.5 Million | | | | 0.60 | % |
Nuveen International Fund
The Fund employs one additional Sub-Adviser, which provides investment advisory services for a portion of the Fund’s assets. Altrinsic has been a Sub-Adviser to the Fund since November 3, 2008, currently pursuant to an agreement with the Adviser dated January 1, 2011. Altrinsic is an employee-controlled and majority-owned company founded in 2000. As of December 31, 2012, Altrinsic had assets under management of approximately $12.6 billion.
Prior to June 24, 2013, Hansberger Global Investors, Inc. (“HGI”) served as one of the Fund’s Sub-Advisers. The following table sets forth the aggregate sub-advisory fees paid to Altrinsic and HGI for the fiscal years ended October 31, 2010, October 31, 2011 and October 31, 2012:
| | | | | | | | | | | | |
| | | Fiscal Year Ended
October 31, 2010 | | | Fiscal Year Ended
October 31, 2011 | | | Fiscal Year Ended
October 31, 2012 | |
Fund | | Amount Paid
by the Adviser
to the
Sub-Advisers | | | Amount Paid
by the Adviser
to the
Sub-Advisers | | | Amount Paid
by the Adviser
to the
Sub-Advisers | |
| Nuveen International Fund | | $ | 2,317,794 | | | $ | 2,135,657 | | | $ | 384,541 | |
Nuveen International Select Fund
Altrinsic and Lazard have also served as Sub-Advisers to Nuveen International Select Fund since the Fund’s inception, currently pursuant to individual agreements with the Adviser dated January 1, 2011. Lazard is a wholly-owned subsidiary of Lazard Freres & Co., LLC. As of December 31, 2012, Lazard had assets under management of approximately $151.7 billion.
Each Sub-Adviser has discretion to select portfolio securities for its portion of the Fund (the “Sub-Advisory Portfolio”), but must select those securities according to the Fund’s investment objective and restrictions. Each Sub-Adviser is paid a fee by the Adviser each month for the services provided under their respective sub-advisory agreements.
Prior to June 24, 2013, HGI served as one of the Fund’s Sub-Advisers. The following table sets forth the aggregate sub-advisory fees paid to Altrinsic, HGI and Lazard for the fiscal years ended October 31, 2010, October 31, 2011 and October 31, 2012:
| | | | | | | | | | | | |
| | | Fiscal Year Ended
October 31, 2010 | | | Fiscal Year Ended
October 31, 2011 | | | Fiscal Year Ended
October 31, 2012 | |
Fund | | Amount Paid by
the Adviser to the
Sub-Advisers | | | Amount Paid by
the Adviser to the
Sub-Advisers | | | Amount Paid by
the Adviser to the
Sub-Advisers | |
| Nuveen International Select Fund | | $ | 2,914,141 | | | $ | 3,392,296 | | | $ | 2,098,526 | |
Portfolio Managers
The individuals that have primary responsibility for the day-to-day implementation of the investment strategies of the Funds are named in the Prospectus under the “Fund Summaries” section for each Fund.
Nuveen Asset Management Compensation
Portfolio manager compensation consists primarily of base pay, an annual cash bonus and long-term incentive payments.
Base pay. Base pay is determined based upon an analysis of the portfolio manager’s general performance, experience, and market levels of base pay for such position.
S-53
Annual cash bonus. The Funds’ portfolio managers are eligible for an annual cash bonus based on investment performance, qualitative evaluation and financial performance of Nuveen Asset Management.
A portion of each portfolio manager’s annual cash bonus is based on the Fund’s investment performance, generally measured over the past one- and three- or five-year periods unless the portfolio manager’s tenure is shorter. Investment performance for the Fund generally is determined by evaluating the Fund’s performance relative to its benchmark(s) and/or Lipper industry peer group.
A portion of the cash bonus is based on a qualitative evaluation made by each portfolio manager’s supervisor taking into consideration a number of factors, including the portfolio manager’s team collaboration, expense management, support of personnel responsible for asset growth, and his or her compliance with Nuveen Asset Management’s policies and procedures.
The final factor influencing a portfolio manager’s cash bonus is the financial performance of Nuveen Asset Management based on its operating earnings.
Long-term incentive compensation. Certain key employees of Nuveen Investments and its affiliates, including certain portfolio managers, have received equity interests in the parent company of Nuveen Investments. In addition, certain key employees of Nuveen Asset Management, including certain portfolio managers, have received profits interests in Nuveen Asset Management which entitle their holders to participate in the firm’s growth over time.
There are generally no differences between the methods used to determine compensation with respect to the Funds and the Other Accounts shown in the table below.
Altrinsic Compensation
Altrinsic manages all accounts on a team basis and all the portfolio managers are equity partners. The value of the equity and the associated cash flows are solely determined by the team’s long-term investment performance and client satisfaction. Portfolio managers receive a competitive salary, profit sharing and incentive compensation.
Lazard Compensation
Lazard compensates portfolio managers by a competitive salary and bonus structure, which is determined both quantitatively and qualitatively. Salary and bonus are paid in cash, stock and restricted interests in funds managed by Lazard or its affiliates. Portfolio managers are compensated on the performance of the aggregate group of portfolios managed by them rather than for a specific fund or account. Various factors are considered in the determination of a portfolio manager’s compensation. All of the portfolios managed by a portfolio manager are comprehensively evaluated to determine his or her positive and consistent performance contribution over time. Further factors include the amount of assets in the portfolios as well as qualitative aspects that reinforce Lazard’s investment philosophy such as leadership, teamwork, and commitment.
Total compensation is not fixed, but rather is based on the following factors: (1) maintenance of current knowledge and opinions on companies owned in the portfolio; (2) generation and development of new investment ideas, including the quality of security analysis and identification of appreciation catalysts; (3) ability and willingness to develop and share ideas on a team basis; and (4) the performance results of the portfolios managed by the investment team.
Variable bonus is based on the portfolio manager’s quantitative performance as measured by the manager’s ability to make investment decisions that contribute to the pre-tax absolute and relative returns of the accounts managed by him or her, by comparison of each account to a predetermined benchmark, including, as appropriate for the relevant account’s investment strategy, the MSCI World Index, the FTSE All World Europe ex-UK Index, the MSCI European Index, and the MSCI EAFE Index, over the current year and the longer-term performance (3-, 5-, or 10-year, if applicable) of such account, as well as performance of the account relative to peers. In addition, the portfolio manager’s bonus can be influenced by subjective measurement of the manager’s ability to help others make investment decisions.
S-54
Other Accounts Managed
In addition to the Funds, as of October 31, 2012, the portfolio managers were also primarily responsible for the day-to-day portfolio management of the following accounts:
| | | | | | | | | | | | | | | | | | |
Portfolio Manager | | Type of Account Managed | | Number of
Accounts | | | Assets | | | Number of
Accounts
with
Performance-
Based Fees | | | Assets of
Accounts
with
Performance-
Based Fees | |
Derek B. Bloom | | Registered Investment Companies Other Pooled Investment Vehicles Other Accounts | |
| 3
0 3 |
| |
| $3.2 million
0 $1.1 million |
| |
| 0
0 0 |
| |
| 0
0 0 |
|
Karen L. Bowie | | Registered Investment Companies Other Pooled Investment Vehicles Other Accounts | |
| 0
0 0 |
| |
| 0
0 0 |
| |
| 0
0 0 |
| |
| 0
0 0 |
|
Anthony R. Burger | | Registered Investment Companies Other Pooled Investment Vehicles Other Accounts | |
| 0
0 8 |
| |
| 0
0 $222.8 million |
| |
| 0
0 0 |
| |
| 0
0 0 |
|
David A. Chalupnik | | Registered Investment Companies Other Pooled Investment Vehicles Other Accounts | |
| 0
1 6 |
| |
| 0
$476.0 million $160.0 million |
| |
| 0
0 0 |
| |
| 0
0 0 |
|
Rehan Chaudhri | | Registered Investment Companies Other Pooled Investment Vehicles Other Accounts | |
| 1
26 44 |
| |
| $354.0 million
$3.1 billion
$8.6 billion |
| |
| 0
1 4 |
| |
| 0
$68.9 million $1.2 billion |
|
David R. Cline | | Registered Investment Companies Other Pooled Investment Vehicles Other Accounts | |
| 4
0 0 |
| |
| $750.4 million
0
0 |
| |
| 0
0 0 |
| |
| 0
0 0 |
|
John L. DeVita | | Registered Investment Companies Other Pooled Investment Vehicles Other Accounts | |
| 1
26 44 |
| |
| $354.0 million
$3.1 billion
$8.6 billion |
| |
| 0
1 4 |
| |
| 0
$68.9 million $1.2 billion |
|
James A. Diedrich | | Registered Investment Companies Other Pooled Investment Vehicles Other Accounts | |
| 0
0 11 |
| |
| 0
0
$226.5 million |
| |
| 0
0 0 |
| |
| 0
0 0 |
|
James M. Donald | | Registered Investment Companies Other Pooled Investment Vehicles Other Accounts | |
| 12
18
191 |
| |
| $20.1 billion
$7.3 billion
$13.3 billion |
| |
| 1
1 3 |
| |
| $2.0 billion
$4.5 million $1.6 billion |
|
Walter A. French | | Registered Investment Companies Other Pooled Investment Vehicles Other Accounts | |
| 1
0 19 |
| |
| $304.3 million
0 $488.9 million |
| |
| 0
0 0 |
| |
| 0
0 0 |
|
David A. Friar | | Registered Investment Companies Other Pooled Investment Vehicles Other Accounts | |
| 5
0 4 |
| |
| $1.2 billion
0 $22.0 million |
| |
| 0
0 0 |
| |
| 0
0 0 |
|
Harold R. Goldstein | | Registered Investment Companies Other Pooled Investment Vehicles Other Accounts | |
| 0
0
13 |
| |
| 0
0 $630.0 million |
| |
| 0
0 0 |
| |
| 0
0 0 |
|
Keith B. Hembre | | Registered Investment Companies Other Pooled Investment Vehicles Other Accounts | |
| 6
0 6 |
| |
| $1.5 billion
0 $81.4 million |
| |
| 0
0 0 |
| |
| 0
0 0 |
|
John Hock | | Registered Investment Companies Other Pooled Investment Vehicles Other Accounts | |
| 1
26
44 |
| |
| $354.0 million
$3.1 billion $8.6 billion |
| |
| 0
2 3 |
| |
| 0
$68.9 million $1.2 billion |
|
Cori B. Johnson | | Registered Investment Companies Other Pooled Investment Vehicles Other Accounts | |
| 0
0 19 |
| |
| 0
0 $750.0 million |
| |
| 0
0 0 |
| |
| 0
0 0 |
|
Jon A. Loth | | Registered Investment Companies | | | 0 | | | | 0 | | | | 0 | | | | 0 | |
| | Other Pooled Investment Vehicles | | | 0 | | | | 0 | | | | 0 | | | | 0 | |
| | Other Accounts | | | 2 | | | | $49.9 million | | | | 0 | | | | 0 | |
Robert S. McDougall | | Registered Investment Companies | | | 0 | | | | 0 | | | | 0 | | | | 0 | |
| | Other Pooled Investment Vehicles | | | 0 | | | | 0 | | | | 0 | | | | 0 | |
| | Other Accounts | | | 2 | | | | $49.9 million | | | | 0 | | | | 0 | |
S-55
| | | | | | | | | | | | | | | | | | |
Portfolio Manager | | Type of Account Managed | | Number of
Accounts | | | Assets | | | Number of
Accounts
with
Performance-
Based Fees | | | Assets of
Accounts
with
Performance-
Based Fees | |
Scott M. Mullinix | | Registered Investment Companies | | | 0 | | | | 0 | | | | 0 | | | | 0 | |
| | Other Pooled Investment Vehicles | | | 0 | | | | 0 | | | | 0 | | | | 0 | |
| | Other Accounts | | | 11 | | | | $226.5 million | | | | 0 | | | | 0 | |
John R. Reinsberg | | Registered Investment Companies | | | 7 | | | | $2.3 billion | | | | 0 | | | | 0 | |
| | Other Pooled Investment Vehicles | | | 6 | | | | $128.0 million | | | | 4 | | | | $92.2 million | |
| | Other Accounts | | | 72 | | | | $7.7 billion | | | | 1 | | | | $76.0 million | |
Jay L. Rosenberg* | | Registered Investment Companies | | | 2 | | | | $554.5 million | | | | 0 | | | | 0 | |
| | Other Pooled Investment Vehicles | | | 2 | | | | $185.8 million | | | | 0 | | | | 0 | |
| | Other Accounts | | | 11 | | | | $870.4 million | | | | 0 | | | | 0 | |
Derek M. Sadowsky | | Registered Investment Companies | | | 0 | | | | 0 | | | | 0 | | | | 0 | |
| | Other Pooled Investment Vehicles | | | 0 | | | | 0 | | | | 0 | | | | 0 | |
| | Other Accounts | | | 19 | | | | $750.0 million | | | | 0 | | | | 0 | |
Allen D. Steinkopf | | Registered Investment Companies | | | 0 | | | | 0 | | | | 0 | | | | 0 | |
| | Other Pooled Investment Vehicles | | | 0 | | | | 0 | | | | 0 | | | | 0 | |
| | Other Accounts | | | 3 | | | | $20.0 million | | | | 0 | | | | 0 | |
Tracy P. Stouffer* | | Registered Investment Companies | | | 2 | | | | $35.4 million | | | | 0 | | | | 0 | |
| | Other Pooled Investment Vehicles | | | 0 | | | | 0 | | | | 0 | | | | 0 | |
| | Other Accounts | | | 5 | | | | $42.5 million | | | | 0 | | | | 0 | |
Scott M. Tonneson | | Registered Investment Companies | | | 0 | | | | 0 | | | | 0 | | | | 0 | |
| | Other Pooled Investment Vehicles | | | 0 | | | | 0 | | | | 0 | | | | 0 | |
| | Other Accounts | | | 0 | | | | 0 | | | | 0 | | | | 0 | |
Mark A. Traster | | Registered Investment Companies | | | 0 | | | | 0 | | | | 0 | | | | 0 | |
| | Other Pooled Investment Vehicles | | | 0 | | | | 0 | | | | 0 | | | | 0 | |
| | Other Accounts | | | 3 | | | | $33.2 million | | | | 0 | | | | 0 | |
Nuveen Asset Management Conflicts of Interest
Actual or apparent conflicts of interest may arise when a portfolio manager has day-to-day management responsibilities with respect to more than one account. More specifically, portfolio managers who manage multiple accounts are presented a number of potential conflicts, including, among others, those discussed below.
The management of multiple accounts may result in a portfolio manager devoting unequal time and attention to the management of each account. Nuveen Asset Management seeks to manage such competing interests for the time and attention of portfolio managers by having portfolio managers focus on a particular investment discipline. Most accounts managed by a portfolio manager in a particular investment strategy are managed using the same investment models.
If a portfolio manager identifies a limited investment opportunity which may be suitable for more than one account, an account may not be able to take full advantage of that opportunity due to an allocation of filled purchase or sale orders across all eligible accounts. To deal with these situations, Nuveen Asset Management has adopted procedures for allocating limited opportunities across multiple accounts.
With respect to many of its clients’ accounts, Nuveen Asset Management determines which broker to use to execute transaction orders, consistent with its duty to seek best execution of the transaction. However, with respect to certain other accounts, Nuveen Asset Management may be limited by the client with respect to the selection of brokers or may be instructed to direct trades through a particular broker. In these cases, Nuveen Asset Management may place separate, non-simultaneous, transactions for a Fund and other accounts which may temporarily affect the market price of the security or the execution of the transaction, or both, to the detriment of the Fund or the other accounts.
Some clients are subject to different regulations. As a consequence of this difference in regulatory requirements, some clients may not be permitted to engage in all the investment techniques or transactions or to engage in these transactions to the same extent as the other accounts managed by the portfolio manager. Finally, the appearance of a conflict of interest may arise where
S-56
Nuveen Asset Management has an incentive, such as a performance-based management fee, which relates to the management of some accounts, with respect to which a portfolio manager has day-to-day management responsibilities.
Nuveen Asset Management has adopted certain compliance procedures which are designed to address these types of conflicts common among investment managers. However, there is no guarantee that such procedures will detect each and every situation in which a conflict arises.
Altrinsic Conflicts of Interest
As a portfolio manager with multiple clients, Altrinsic faces potential conflicts of interest in connection with managing the Nuveen International Fund and Nuveen International Select Fund’s portfolios as well as other accounts simultaneously. Altrinsic has accounts which charge fees as a percentage of assets under management, have a fixed fee, or have performance-based fees. A potential conflict of interest could arise when executing trades for accounts which pay fees on different schedules. It is Altrinsic’s policy that no client for whom Altrinsic has investment decision responsibility shall receive preferential treatment over any other client. When allocating securities among clients, it is Altrinsic’s policy that all clients should be treated fairly and that, to the extent possible, all clients should receive equitable treatment over time and no client(s) will receive more favorable treatment or be disadvantaged over other client(s). Whenever possible, Altrinsic will aggregate orders for accounts purchasing/selling the same security at the same time. Generally, ach eligible client that participates in an aggregated order will participate at the average price for all Altrinsic client transactions in that security on a given business day and transaction costs will be generally shared pro-rata based on each client’s participation in the transaction.
Altrinsic and its personnel may affect limited transactions for their own accounts in the same or different securities than those purchased and sold for the accounts of Altrinsic’s clients. All employees are prohibited from engaging in personal securities transactions in Reportable Securities, as defined in the Investment Advisers Act of 1940, as amended, except for sale transactions of securities that were held by the employee prior to their date of hire or purchases and sales of ETFs and closed-end funds. All personal securities transactions require that written pre-clearance approval was obtained from Compliance. Compliance only approves transactions if it concludes that the transaction would comply with the provisions of the Code of Ethics and is not likely to conflict with or have an adverse economic impact on clients. No personal trades are aggregated with clients’ trades.
Altrinsic uses “soft dollars” for research and brokerage services that provide lawful and appropriate assistance to Altrinsic in carrying out its investment decision making responsibilities, as permitted under the safe harbor of Section 28(e) of the Securities and Exchange Act of 1934. A potential conflict of interest could arise when Altrinsic uses client brokerage commissions to obtain research or brokerage services as the firm benefits from the research, products, and/or services it would otherwise have to produce internally or purchase. Altrinsic maintains policies and procedures to address such conflicts. As a fiduciary, Altrinsic has an obligation to seek “best execution” of clients’ transactions under the circumstances of the particular transaction. If Altrinsic selects a broker-dealer that provides soft dollar benefits that may cause clients to pay commission higher in return for those benefits than those commission charged by other broker-dealers.
Lazard Conflicts of Interest
Although the potential for conflicts of interest exists when an investment adviser and portfolio managers manage other accounts with similar investment objectives and strategies as Nuveen International Select Fund, Lazard has procedures in place that are designed to ensure that all accounts are treated fairly and that the Fund is not disadvantaged, including procedures regarding trade allocations and “conflicting trades” (e.g., long and short positions in the same security, as described below). In addition, the Fund, as a registered investment company, is subject to different regulations than certain of the Similar Accounts, and, consequently, may not be permitted to engage in all the investment techniques or transactions, or to engage in such techniques or transactions to the same degree, as the other accounts.
Potential conflicts of interest may arise because of Lazard’s management of the Fund and other accounts. For example, conflicts of interest may arise with both the aggregation and allocation of
S-57
securities transactions and allocation of limited investment opportunities, as Lazard may be perceived as causing accounts it manages to participate in an offering to increase Lazard’s overall allocation of securities in that offering, or to increase Lazard’s ability to participate in future offerings by the same underwriter or issuer.
A potential conflict of interest may be perceived to arise if transactions in one account closely follow related transactions in a different account, such as when a purchase increases the value of securities previously purchased by the other account, or when a sale in one account lowers the sale price received in a sale by a second account. Lazard manages hedge funds that are subject to performance/incentive fees. Certain hedge funds managed by Lazard may also be permitted to sell securities short. When Lazard engages in short sales of securities of the type in which the Fund invests, Lazard could be seen as harming the performance of the Fund for the benefit of the account engaging in short sales if the short sales cause the market value of the securities to fall. As described above, Lazard has procedures in place to address these conflicts. Portfolio managers are generally not permitted to manage both hedge funds that engage in short sales and long-only accounts, including open-end and closed-end registered investment companies.
Beneficial Ownership of Securities
The following table indicates as of October 31, 2012 the value, within the indicated range, of shares beneficially owned by the portfolio managers in the Funds they manage. For purposes of this table, the following letters indicate the range listed next to each letter:
| | | | | | |
| A | | | - | | | $0 |
| B | | | - | | | $1 - $10,000 |
| C | | | - | | | $10,001 - $50,000 |
| D | | | - | | | $50,001 - $100,000 |
| E | | | - | | | $100,001 - $500,000 |
| F | | | - | | | $500,001 - $1,000,000 |
| G | | | - | | | More than $1 million |
| | | | | | |
Name of Portfolio Manager | | Fund | | Dollar Range of
Equity Securities
Beneficially Owned
in Fund Managed | |
Derek B. Bloom | | Nuveen International Fund | | | A | |
| | Nuveen International Select Fund | | | A | |
| | Nuveen Tactical Market Opportunities Fund | | | C | |
Karen L. Bowie | | Nuveen Mid Cap Value Fund | | | C | |
| | Nuveen Small Cap Value Fund | | | D | |
Anthony R. Burger | | Nuveen Large Cap Select Fund | | | A | |
| | Nuveen Mid Cap Select Fund | | | A | |
David A. Chalupnik | | Nuveen Large Cap Select Fund | | | A | |
| | Nuveen Mid Cap Value Fund | | | A | |
Rehan Chaudhri | | Nuveen International Fund | | | A | |
| | Nuveen International Select Fund | | | A | |
David R. Cline | | Nuveen Quantitative Enhanced Core Equity Fund | | | A | |
| | Nuveen Tactical Market Opportunities Fund | | | B | |
John L. DeVita | | Nuveen International Fund | | | A | |
| | Nuveen International Select Fund | | | A | |
James A. Diedrich | | Nuveen Large Cap Growth Opportunities Fund | | | C | |
| | Nuveen Mid Cap Growth Opportunities Fund | | | D | |
James M. Donald | | Nuveen International Select Fund | | | A | |
Walter A. French | | Nuveen Equity Index Fund | | | A | |
| | Nuveen International Fund | | | A | |
| | Nuveen International Select Fund | | | A | |
| | Nuveen Mid Cap Index Fund | | | A | |
| | Nuveen Quantitative Enhanced Core Equity Fund | | | A | |
| | Nuveen Small Cap Index Fund | | | A | |
S-58
| | | | | | |
Name of Portfolio Manager | | Fund | | Dollar Range of
Equity Securities
Beneficially Owned
in Fund Managed | |
| | Nuveen Tactical Market Opportunities Fund | | | A | |
David A. Friar | | Nuveen Equity Index Fund | | | A | |
| | Nuveen International Fund | | | A | |
| | Nuveen International Select Fund | | | B | |
| | Nuveen Mid Cap Index Fund | | | A | |
| | Nuveen Quantitative Enhanced Core Equity Fund | | | A | |
| | Nuveen Small Cap Index Fund | | | A | |
| | Nuveen Tactical Market Opportunities Fund | | | C | |
Harold R. Goldstein | | Nuveen Large Cap Growth Opportunities Fund | | | B | |
| | Nuveen Mid Cap Growth Opportunities Fund | | | B | |
Keith B. Hembre | | Nuveen International Fund | | | A | |
| | Nuveen International Select Fund | | | A | |
| | Nuveen Quantitative Enhanced Core Equity Fund | | | A | |
| | Nuveen Tactical Market Opportunities Fund | | | E | |
John Hock | | Nuveen International Fund | | | A | |
| | Nuveen International Select Fund | | | A | |
Cori B. Johnson | | Nuveen Dividend Value Fund | | | E | |
Jon A. Loth | | Nuveen Small Cap Growth Opportunities Fund | | | C | |
Robert S. McDougall | | Nuveen Small Cap Growth Opportunities Fund | | | B | |
Scott M. Mullinix | | Nuveen Large Cap Growth Opportunities Fund | | | E | |
| | Nuveen Mid Cap Growth Opportunities Fund | | | D | |
John R. Reinsberg | | Nuveen International Select Fund | | | A | |
Jay L. Rosenberg* | | Nuveen International Fund | | | A | |
| | Nuveen International Select Fund | | | A | |
Derek M. Sadowsky | | Nuveen Dividend Value Fund | | | E | |
Allen D. Steinkopf | | Nuveen Small Cap Select Fund | | | B | |
Tracy Stouffer* | | Nuveen International Fund | | | A | |
| | Nuveen International Select Fund | | | A | |
Scott M. Tonneson | | Nuveen Mid Cap Select Fund | | | A | |
Mark A. Traster | | Nuveen Small Cap Select Fund | | | D | |
Administrator
Prior to the Transaction, FAF served as Administrator pursuant to an Administration Agreement between FAF and NIF, dated July 1, 2006 and U.S. Bancorp Fund Services, LLC (“USBFS”), 615 East Michigan Street, Milwaukee, WI 53202, served as sub-administrator pursuant to a Sub-Administration Agreement between FAF and USBFS dated July 1, 2005. USBFS is a subsidiary of U.S. Bancorp. As of December 31, 2010, the Funds no longer have an administrator or sub-administrator. The following table sets forth total administrative fees, after waivers, paid by the Funds to FAF and USBFS for the fiscal year ended October 31, 2010 and for the period from November 1, 2010 through December 31, 2010:
| | | | | | | | |
Fund | | Fiscal Year Ended
October 31, 2010 | | | November 1, 2010
through
December 31, 2010 | |
| Nuveen Dividend Value Fund | | $ | 1,664,988 | | | $ | 334,525 | |
| Nuveen Equity Index Fund | | | 2,077,605 | | | | 342,292 | |
| Nuveen International Fund | | | 1,559,670 | | | | 258,378 | |
| Nuveen International Select Fund | | | 1,694,350 | | | | 321,273 | |
| Nuveen Large Cap Growth Opportunities Fund | | | 1,285,900 | | | | 227,365 | |
| Nuveen Large Cap Select Fund | | | 310,414 | | | | 49,202 | |
| Nuveen Mid Cap Growth Opportunities Fund | | | 2,823,193 | | | | 490,214 | |
| Nuveen Mid Cap Index Fund | | | 531,433 | | | | 105,926 | |
| Nuveen Mid Cap Select Fund | | | 90,796 | | | | 15,271 | |
| Nuveen Mid Cap Value Fund | | | 1,325,904 | | | | 197,380 | |
| Nuveen Quantitative Enhanced Core Equity Fund | | | 386,115 | | | | 75,111 | |
S-59
| | | | | | | | |
Fund | | Fiscal Year Ended
October 31, 2010 | | | November 1, 2010
through
December 31, 2010 | |
| Nuveen Small Cap Growth Opportunities Fund | | $ | 380,362 | | | $ | 68,516 | |
| Nuveen Small Cap Index Fund | | | 140,471 | | | | 26,618 | |
| Nuveen Small Cap Select Fund | | | 1,639,213 | | | | 300,195 | |
| Nuveen Small Cap Value Fund | | | 454,674 | | | | 68,557 | |
| Nuveen Tactical Market Opportunities Fund 1 | | | 7,990 | | | | 9,169 | |
| 1 | | Commenced operations on December 30, 2009. |
Transfer Agent
The Funds’ transfer, shareholder services, and dividend paying agent is Boston Financial Data Services, Inc. (“BFDS”), P.O. Box 8530, Boston, Massachusetts 02266-8530.
Prior to May 14, 2012, USBFS served as the Funds’ transfer agent. The following table sets forth transfer agent fees, excluding out-of-pocket expenses, paid by the Funds to USBFS for the fiscal years ended October 31, 2010 and October 31, 2011 and the period November 1, 2011 through May 14, 2012:
| | | | | | | | | | | | |
Fund | | Fiscal Year Ended
October 31,
2010 | | | Fiscal Year Ended
October 31,
2011 | | | November 1, 2011
through
May 14, 20122 | |
Nuveen Dividend Value Fund | | $ | 232,600 | | | $ | 288,711 | | | $ | 241,148 | |
Nuveen Equity Index Fund | | | 266,034 | | | | 252,592 | | | | 161,217 | |
Nuveen International Fund | | | 165,677 | | | | 127,109 | | | | 82,593 | |
Nuveen International Select Fund | | | 89,706 | | | | 26,955 | | | | 83,003 | |
Nuveen Large Cap Growth Opportunities Fund | | | 219,922 | | | | 213,331 | | | | 187,944 | |
Nuveen Large Cap Select Fund | | | 89,821 | | | | 23,449 | | | | 21,118 | |
Nuveen Mid Cap Growth Opportunities Fund | | | 315,206 | | | | 316,092 | | | | 254,752 | |
Nuveen Mid Cap Index Fund | | | 90,572 | | | | 58,159 | | | | 47,201 | |
Nuveen Mid Cap Select Fund | | | 134,960 | | | | 108,695 | | | | 51,402 | |
Nuveen Mid Cap Value Fund | | | 172,902 | | | | 146,362 | | | | 119,129 | |
Nuveen Quantitative Enhanced Core Equity Fund | | | 72,003 | | | | 13,094 | | | | 26,930 | |
Nuveen Small Cap Growth Opportunities Fund | | | 142,251 | | | | 104,626 | | | | 87,207 | |
Nuveen Small Cap Index Fund | | | 90,187 | | | | 34,289 | | | | 19,153 | |
Nuveen Small Cap Select Fund | | | 227,083 | | | | 217,887 | | | | 143,168 | |
Nuveen Small Cap Value Fund | | | 137,594 | | | | 102,800 | | | | 71,337 | |
Nuveen Tactical Market Opportunities Fund 1 | | | 12,375 | | | | 3,279 | | | | 23,807 | |
| 1 | | Commenced operations on December 30, 2009. |
| 2 | | Transfer agent fees are reflective of one-time fees, due to transfer agent conversion, in the amount of $8,996, $8,086, $2,432, $434, $7,290, $358, $7,915, $1,742, $2,655, $3,854, $93, $2,204, $803, $5,527, $2,428 and $1,632 for Nuveen Dividend Value Fund, Nuveen Equity Index Fund, Nuveen International Fund, Nuveen International Select Fund, Nuveen Large Cap Growth Opportunities Fund, Nuveen Large Cap Select Fund, Nuveen Mid Cap Growth Opportunities Fund, Nuveen Mid Cap Index Fund, Nuveen Mid Cap Select Fund, Nuveen Mid Cap Value Fund, Nuveen Quantitative Enhanced Core Equity Fund, Nuveen Small Cap Growth Opportunities Fund, Nuveen Small Cap Index Fund, Nuveen Small Cap Select Fund, Nuveen Small Cap Value Fund and Nuveen Tactical Market Opportunities Fund, respectively. |
Custodians
U.S. Bank National Association (“U.S. Bank”) and State Street Bank and Trust Company act as custodians for the Funds (the “Custodians”). U.S. Bank, 60 Livingston Avenue, St. Paul, MN 55101, acts as the custodian for each Fund (the “Custodian”) other than Nuveen International Fund and
S-60
Nuveen International Select Fund. U.S. Bank is a subsidiary of U.S. Bancorp. State Street Bank and Trust Company, 2 Avenue de Lafayette, LCC/5 Boston, MA 02111, acts as the custodian for Nuveen International Fund and Nuveen International Select Fund.
The Custodians take no part in determining the investment policies of the Funds or in deciding which securities are purchased or sold by the Funds. All of the instruments representing the investments of the Funds and all cash are held by the Custodians. The Custodians deliver securities against payment upon sale and pays for securities against delivery upon purchase. The Custodians also remit Fund assets in payment of Fund expenses, pursuant to instructions of NIF’s officers or resolutions of the Board of Directors.
As compensation for its services as custodian, U.S. Bank is paid a monthly fee calculated on an annual basis equal to 0.005% of each Fund’s average daily net assets. State Street Bank and Trust Company is paid reasonable compensation as agreed upon from time to time. Sub-custodian fees with respect to the Funds are paid by State Street Bank and Trust Company out of its fees from the Funds. In addition, the Custodians are reimbursed for their out-of-pocket expenses incurred while providing services to the Funds. Each Custodian continues to serve so long as its appointment is approved at least annually by the Board of Directors including a majority of the directors who are not “interested persons” of NIF, as that term is defined in the 1940 Act.
Distributor
Nuveen Securities, LLC, 333 West Wacker Drive, Chicago, Illinois 60606, serves as the distributor for the Funds’ shares pursuant to a “best efforts” arrangement as provided by a Distribution Agreement dated January 1, 2011 (the “Distribution Agreement”). Pursuant to the Distribution Agreement, the Funds appointed the Distributor to be their agent for the distribution of the Funds’ shares on a continuous offering basis.
Independent Registered Public Accounting Firm
PricewaterhouseCoopers LLP (“PwC”), One North Wacker Drive, Chicago, Illinois 60606, independent registered public accounting firm, has been selected as auditors for NIF. In addition to audit services, PwC provides assistance on accounting, tax and related matters.
CODES OF ETHICS
The Funds, the Adviser, Nuveen Asset Management and the Distributor have adopted codes of ethics pursuant to Rule 17j-1 under the 1940 Act and with respect to the Adviser and Sub-Adviser, Rule 204A-1 under the Investment Advisers Acts of 1940, as amended, addressing personal securities transactions and other conduct by investment personnel and access persons who may have access to information about the Funds’ securities transactions. The codes are intended to address potential conflicts of interest that can arise in connection with personal trading activities of such persons. Persons subject to the codes are generally permitted to engage in personal securities transactions, including investing in securities eligible for investment by the Funds, subject to certain prohibitions, which may include prohibitions on investing in certain types of securities, pre-clearance requirements, blackout periods, annual and quarterly reporting of personal securities holdings and limitations on personal trading of initial public offerings. Violations of the codes are subject to review by the Board of Directors and could result in severe penalties. Altrinsic and Lazard have also each adopted a code of ethics pursuant to Rule 17j-1 under the 1940 Act. Each of these codes of ethics permits personnel to invest in securities for their own accounts, including securities that may be purchased or held by the Funds. These codes of ethics are on public file with, and are available from, the SEC.
PROXY VOTING POLICIES
Each Fund has adopted a proxy voting policy that seeks to ensure that proxies for securities held by the Fund are voted consistently and solely in the best economic interests of the Fund.
A member of each Fund’s management team is responsible for oversight of the Fund’s proxy voting process. With regard to equity securities, Nuveen Asset Management has engaged the services
S-61
of Institutional Shareholder Services Inc. (“ISS”) to make recommendations on the voting of proxies relating to securities held by the Funds and managed by Nuveen Asset Management. ISS provides voting recommendations based upon established guidelines and practices. Nuveen Asset Management reviews and frequently follows ISS recommendations. However, on selected issues, Nuveen Asset Management may not vote in accordance with the ISS recommendations when it believes that specific ISS recommendations are not in the best economic interest of the applicable Fund. If Nuveen Asset Management manages the assets of a company or its pension plan and any of Nuveen Asset Management’s clients hold any securities of that company, Nuveen Asset Management will vote proxies relating to such company’s securities in accordance with the ISS recommendations to avoid any conflict of interest. Where a material conflict of interest has been identified by Nuveen Asset Management and ISS does not offer a recommendation on the matter, Nuveen Asset Management shall disclose the conflict and Nuveen Asset Management’s Proxy Voting Committee shall determine the manner in which to vote and notify the Fund’s Board of Trustees or its designated committee.
Although Nuveen Asset Management has affiliates that provide investment advisory, broker-dealer, insurance or other financial services, Nuveen Asset Management does not receive non-public information about the business arrangements of such affiliates (except with regard to major distribution partners of its investment products) or the directors, officers and employees of such affiliates. Therefore, Nuveen Asset Management is unable to consider such information when determining whether there are material conflicts of interests.
Nuveen Asset Management has adopted the ISS Proxy Voting Guidelines. While these guidelines are not intended to be all-inclusive, they do provide guidance on the sub-adviser’s general voting policies.
The proxy voting policies and procedures for Altrinsic and Lazard are set forth in Appendix B.
Information regarding how each Fund voted proxies relating to portfolio securities during the most recent 12-month period ended June 30 is available without charge by calling (800) 257-8787 or by accessing the SEC’s website at http://www.sec.gov.
PORTFOLIO TRANSACTIONS
Decisions with respect to which securities are to be bought or sold, the total amount of securities to be bought or sold, the broker-dealer with or through which the securities transactions are to be effected and the commission rates applicable to the trades are made by Nuveen Asset Management or, in the case of Nuveen International Fund or Nuveen International Select Fund, their Sub-Advisers.
In selecting a broker-dealer to execute securities transactions, the Sub-Advisers consider the full range and quality of a broker-dealer’s services including, among other things: the value, nature and quality of any brokerage and research products and services; execution capability; commission rate; financial responsibility (including willingness to commit capital); the likelihood of price improvement; the speed of execution and likelihood of execution for limit orders; the ability to minimize market impact; the maintenance of the confidentiality of orders; and responsiveness of the broker-dealer. The determinative factor is not the lowest possible commission cost but whether the transaction represents the best qualitative execution for the Funds. Subject to the satisfaction of its obligation to seek best execution, another factor considered by the Sub-Advisers in selecting a broker-dealer may include the broker-dealer’s access to initial public offerings.
For certain transactions, the Sub-Advisers may cause the Funds to pay a broker-dealer a commission higher than that which another broker-dealer might have charged for effecting the same transaction (a practice commonly referred to as “paying up”). The Sub-Advisers cause a Fund to pay up in recognition of the value of the brokerage and research products and services provided by the broker-dealer. The broker-dealer may directly provide such products or services to the Funds or purchase them from a third party for the Funds. In such cases, the Sub-Advisers are in effect paying for the brokerage and research products and services with client commissions—so-called “soft dollars.” The Sub-Advisers will only cause a Fund to pay up if the Sub-Advisers, subject to their overall duty to seek best execution, determine in good faith that the amount of such commission is reasonable in
S-62
relation to the value of the brokerage and research products and services provided by such broker-dealer, viewed in terms of either that particular transaction or the overall responsibilities of the Sub-Advisers with respect to the managing of its accounts.
The types of research products and services the Sub-Advisers receive include economic analysis and forecasts, financial market analysis and forecasts, industry and company specific analysis, performance monitoring, interest rate forecasts, arbitrage relative valuation analysis of various debt securities, analysis of U.S. Treasury securities, research-dedicated computer software and related consulting services and other services that assist in the investment decision making process. Research products and services are received primarily in the form of written reports, computer-generated services, telephone contacts and personal meetings with security analysts. Research services may also be provided in the form of meetings arranged by broker-dealers with corporate management teams and spokespersons, as well as industry spokespersons.
The brokerage and research products and services the Sub-Advisers receive from broker-dealers supplement the Sub-Advisers’ own normal research activities. As a practical matter, the Sub-Advisers could not, on their own, generate all of the research that broker-dealers provide without materially increasing expenses. The brokerage and research products and services the Sub-Advisers receive from broker-dealers may be put to a variety of uses and may be provided as part of a product that bundles research and brokerage products with other products into one package as further described below. The Sub-Advisers reduce their expenses through their use of soft dollars.
As a general matter, the brokerage and research products and services the Sub-Advisers receive from broker-dealers are used to service all of the Sub-Advisers’ accounts, including the Funds. However, any particular brokerage and research product or service may not be used to service each and every account, and may not benefit the particular accounts that generated the brokerage commissions. For example, equity commissions are used for brokerage and research products and services utilized in managing fixed income accounts.
The Sub-Advisers receive brokerage or research products or services that they also use for business purposes unrelated to brokerage or research. For example, certain brokerage services are provided as a part of a product that bundles many separate and distinct brokerage, execution, investment management, custodial and recordkeeping services into one package. Market data services are a specific example of mixed use services that the Sub-Advisers might acquire because certain employees of the Sub-Advisers may use such services for marketing or administrative purposes while others use them for research purposes. The acquisition of mixed use products and services causes a conflict of interest for the Sub-Advisers, in that, clients pay up for this type of brokerage or research product or service while the product or service also directly benefits the Sub-Advisers. For this reason, and in accordance with general SEC guidance, the Sub-Advisers make a good faith effort to determine what percentage of the product or service is used for non-brokerage or research purposes and pay cash (“hard dollars”) for such percentage of the total cost. To ensure that their practices are consistent with their fiduciary responsibilities to their clients and to address this conflict, the Sub-Advisers make all determinations with regard to whether mixed use items may be acquired and, if so, what the appropriate allocations are between soft dollar and hard dollar payments for such products and services. These determinations themselves represent a conflict of interest as the Sub-Advisers have a financial incentive to allocate a greater proportion of the cost of mixed use products to soft dollars.
Many of the Funds’ portfolio transactions involve payment of a brokerage commission by the applicable Fund. In some cases, transactions are with dealers or issuers who act as principal for their own accounts and not as brokers. Transactions effected on a principal basis, other than certain transactions effected on a so-called riskless principal basis, are made without the payment of brokerage commissions but at net prices which usually include a spread or markup. In effecting transactions in over-the-counter securities, the Funds typically deal with market makers unless it appears that better price and execution are available elsewhere.
It is expected that the Funds will purchase most foreign equity securities in the over-the-counter markets or stock exchanges located in the countries in which the respective principal offices of the issuers of the various securities are located if that is the best available market. The commission paid in
S-63
connection with foreign stock transactions may be higher than negotiated commissions on U.S. transactions. There generally is less governmental supervision and regulation of foreign stock exchanges than in the United States. Foreign securities settlements may in some instances be subject to delays and related administrative uncertainties.
Foreign equity securities may be held in the form of depositary receipts or securities convertible into foreign equity securities. Depositary receipts may be listed on stock exchanges or traded in the over-the-counter markets in the United States or overseas. The foreign and domestic debt securities and money market instruments in which the Funds may invest are generally traded in the over-the-counter markets.
The Funds do not effect any brokerage transactions in their portfolio securities with any broker or dealer affiliated directly or indirectly with the Adviser, Sub-Advisers or Distributor unless such transactions, including the frequency thereof, the receipt of commission payable in connection therewith, and the selection of the affiliated broker or dealer effecting such transactions are not unfair or unreasonable to the shareholders of the Funds, as determined by the Board of Directors. Any transactions with an affiliated broker or dealer must be on terms that are both at least as favorable to the Funds as the Funds can obtain elsewhere and at least as favorable as such affiliated broker or dealer normally gives to others. The Funds did not pay any commissions to affiliated brokers or dealers during the fiscal years ended October 31, 2009, 2010 and 2011.
When two or more clients of the Sub-Advisers are simultaneously engaged in the purchase or sale of the same security, the prices and amounts are allocated in a manner considered by the Sub-Advisers to be equitable to each client. In some cases, this system could have a detrimental effect on the price or volume of the security as far as each client is concerned. In other cases, however, the ability of the clients to participate in volume transactions may produce better executions for each client.
The following table sets forth the aggregate brokerage commissions paid by the Funds during the fiscal years ended October 31, 2010, October 31, 2011 and October 31, 2012:
| | | | | | | | | | | | |
| | | Aggregate Brokerage Commissions Paid by the Funds | |
Fund | | Fiscal Year
Ended
October 31, 2010 | | | Fiscal Year
Ended
October 31, 2011 | | | Fiscal Year
Ended
October 31, 2012 | |
Nuveen Dividend Value Fund | | $ | 945,555 | | | $ | 1,062,374 | | | $ | 630,231 | |
Nuveen Equity Index Fund | | | 56,413 | | | | 22,781 | | | | 7,096 | |
Nuveen International Fund | | | 1,268,428 | | | | 1,663,040 | | | | 203,515 | |
Nuveen International Select Fund | | | 1,293,947 | | | | 1,765,524 | | | | 734,891 | |
Nuveen Large Cap Growth Opportunities Fund | | | 1,273,966 | | | | 719,095 | | | | 487,381 | |
Nuveen Large Cap Select Fund | | | 588,540 | | | | 350,507 | | | | 132,105 | |
Nuveen Mid Cap Growth Opportunities Fund | | | 3,863,391 | | | | 2,342,848 | | | | 2,025,483 | |
Nuveen Mid Cap Index Fund | | | 35,705 | | | | 29,030 | | | | 24,096 | |
Nuveen Mid Cap Select Fund | | | 276,353 | | | | 150,047 | | | | 140,523 | |
Nuveen Mid Cap Value Fund | | | 2,609,339 | | | | 1,214,648 | | | | 828,350 | |
Nuveen Quantitative Enhanced Core Equity Fund | | | 542,961 | | | | 460,111 | | | | 183,624 | |
Nuveen Small Cap Growth Opportunities Fund | | | 1,063,297 | | | | 600,748 | | | | 402,918 | |
Nuveen Small Cap Index Fund | | | 10,519 | | | | 10,921 | | | | 11,353 | |
Nuveen Small Cap Select Fund | | | 3,093,093 | | | | 2,166,839 | | | | 1,637,916 | |
Nuveen Small Cap Value Fund | | | 617,325 | | | | 211,305 | | | | 191,121 | |
Nuveen Tactical Market Opportunities Fund 1 | | | 10,962 | | | | 41,633 | | | | 66,822 | |
| 1 | | Commenced operations on December 30, 2009. |
Brokerage commissions paid by a Fund may vary significantly from year to year as a result of changing asset levels throughout the year, portfolio turnover, varying market conditions, and other factors.
S-64
During the fiscal year ended October 31, 2012, Nuveen Dividend Value Fund, Nuveen International Fund, Nuveen International Select Fund, Nuveen Large Cap Growth Opportunities Fund, Nuveen Large Cap Select Fund, Nuveen Mid Cap Growth Opportunities Fund, Nuveen Mid Cap Select Fund, Nuveen Mid Cap Value Fund, Nuveen Small Cap Growth Opportunities Fund, Nuveen Small Cap Select Fund and Nuveen Small Cap Value Fund paid to brokers as commissions in return for research services $486,377, $157,563, $565,084, $322,576, $71,208, $1,515,135, $70,000, $645,435, $273,817, $1,191,901, and $119,610, respectively, and the aggregate amount of those transactions per Fund on which such commissions were paid were $453,557,361, $174,497,285, $524,094,450, $579,031,302, $71,875,773, $1,838,374,627, $41,600,069, $471,236,897, $182,952,811, $666,747,888 and $55,845,612, respectively.
The Funds, excluding the Nuveen Large Cap Growth Opportunities Fund, Nuveen Mid Cap Growth Opportunities Fund, Nuveen Mid Cap Select Fund, Nuveen Mid Cap Value Fund, Nuveen Small Cap Growth Opportunities Fund, Nuveen Small Cap Select Fund, Nuveen Small Cap Value Fund and Nuveen Tactical Market Opportunities Fund, have acquired during the fiscal year ended October 31, 2012 the securities of their regular brokers or dealers as defined in Rule 10b-1 under the 1940 Act or of the parents of the brokers or dealers. The following table sets forth those brokers or dealers and states the value of the Funds’ aggregate holdings of the securities of each issuer as of close of the fiscal year ended October 31, 2012:
| | | | | | | | |
Fund | | Broker/Dealer | | Issuer | | Aggregate Fund
Holdings of
Broker/Dealer
or Parent (as of
October 31, 2012) | |
Nuveen Dividend Value Fund | | Goldman Sachs & Co. | | Goldman Sachs & Co. | | $ | — | |
| | Citigroup Global Markets Inc. | | Citigroup Inc. | | | 34,983,505 | |
| | Bank of America Securities LLC | | Bank of America Corporation | | | 34,251,783 | |
| | J.P. Morgan Chase | | JPMorgan Chase & Co. | | | 20,058,708 | |
| | | |
Nuveen Equity Index Fund | | Bank of New York | | Bank of New York Company, Inc. | | | 1,687,174 | |
| | Morgan Stanley & Company Inc. | | Morgan Stanley | | | 1,394,571 | |
| | Goldman Sachs & Co. | | Goldman Sachs Group, Inc. | | | 3,446,380 | |
| | Citigroup Global Markets Inc. | | Citigroup Inc. | | | 6,276,098 | |
Nuveen International
Fund | | UBS Financial Services Inc. | | UBS | | | 497,047 | |
| | Credit Suisse | | Credit Suisse Group | | | 625,422 | |
Nuveen International Select Fund | |
UBS Financial Services Inc. | | UBS | | | 1,542,390 | |
| | Credit Suisse | | Credit Suisse Group | | | 1,428,700 | |
Nuveen Large Cap Select Fund | | Goldman Sachs & Co. | | Goldman Sachs & Co. | | | — | |
| | Bank of America Securities LLC | | Bank of America Corporation | | | 1,084,783 | |
| | Citigroup Global Markets Inc. | | Citigroup Inc. | | | 1,195,433 | |
Nuveen Mid Cap Index
Fund | |
Morgan Stanley & Company Inc. | | Morgan Stanley & Company Inc. | | | — | |
Nuveen Quantitative Enhanced Core Equity Fund | | Goldman Sachs & Co. | | Goldman Sachs Group, Inc. | | | 252,735 | |
| | Morgan Stanley & Company Inc. | | Morgan Stanley | | | 33,891 | |
| | Bank of New York | | Bank of New York | | | — | |
| | J.P. Morgan Chase | | JPMorgan Chase & Co. | | | 1,113,314 | |
Nuveen Small Cap Index Fund | |
Citigroup Global Markets Inc. | | Citigroup Global Markets Inc. | | | — | |
S-65
Under the 1940 Act, a Fund may not purchase portfolio securities from any underwriting syndicate of which the Distributor is a member except under certain limited conditions set forth in Rule 10f-3. The Rule sets forth requirements relating to, among other things, the terms of a security purchased by a Fund, the amount of securities that may be purchased in any one issue and the assets of a Fund that may be invested in a particular issue. In addition, purchases of securities made pursuant to the terms of the Rule must be approved at least quarterly by the Board of Directors, including a majority of the independent trustees.
Portfolio Trading and Turnover
The Funds will make changes in their investment portfolios from time to time in order to seek to take advantage of opportunities in the market and to limit exposure to market risk. The Funds may also engage to a limited extent in short-term trading consistent with their investment objectives. Changes in a Fund’s investments are known as “portfolio turnover.”
DISCLOSURE OF PORTFOLIO HOLDINGS
The Nuveen Mutual Funds have adopted a portfolio holdings disclosure policy which governs the dissemination of the Funds’ portfolio holdings. In accordance with this policy, the Funds may provide portfolio holdings information to third parties no earlier than the time a report is filed with the SEC that is required to contain such information or one day after the information is posted on the Funds’ publicly accessible website, www.nuveen.com. A complete list of portfolio holdings information is generally made available on the Funds’ website ten business days after the end of the month. Additionally, the Funds publish on the website a list of their top ten holdings as of the end of each month, approximately two to five business days after the end of the month for which the information is current. This information will remain available on the website at least until the Funds file with the SEC their Forms N-CSR or Forms N-Q for the period that includes the date as of which the website information is current.
Additionally, the Funds may disclose portfolio holdings information that has not been included in a filing with the SEC or posted on the Funds’ website (i.e., non-public portfolio holdings information) only if there is a legitimate business purpose for doing so and if the recipient is required, either by explicit agreement or by virtue of the recipient’s duties to the Funds as an agent or service provider, to maintain the confidentiality of the information and to not use the information in an improper manner (e.g., personal trading). In this connection, the Funds may disclose on an ongoing basis non-public portfolio holdings information in the normal course of their investment and administrative operations to various service providers, including the Adviser and/or Sub-Advisers, independent registered public accounting firm, custodian, financial printer (R.R. Donnelley Financial and Financial Graphic Services), proxy voting service(s) (including ISS, ADP Investor Communication Services, and Glass, Lewis & Co.), borrowers of their securities pursuant to securities lending transactions, and to the legal counsel for the Funds’ independent directors (Chapman and Cutler LLP). Also, the Adviser may transmit to Vestek Systems, Inc. daily non-public portfolio holdings information on a next-day basis to enable the Adviser to perform portfolio attribution analysis using Vestek’s systems and software programs. Vestek is also provided with non-public portfolio holdings information on a monthly basis approximately 2-3 business days after the end of each month so that Vestek may calculate and provide certain statistical information (but not the non-public holdings information itself) to its clients (including retirement plan sponsors or their consultants). The Adviser and/or Sub-Advisers may also provide certain portfolio holdings information to broker-dealers from time to time in connection with the purchase or sale of securities or requests for price quotations or bids on one or more securities. In providing this information, reasonable precautions are taken in an effort to avoid potential misuse of the disclosed information, including limitations on the scope of the portfolio holdings information disclosed, when appropriate.
Non-public portfolio holdings information may be provided to other persons if approved by the Funds’ Chief Administrative Officer or Secretary upon a determination that there is a legitimate business purpose for doing so, the disclosure is consistent with the interests of the Funds, and the recipient is obligated to maintain the confidentiality of the information and not misuse it.
S-66
Compliance officers of the Funds and the Adviser and Sub-Advisers periodically monitor overall compliance with the policy to ascertain whether portfolio holdings information is disclosed in a manner that is consistent with the Funds’ policy. Reports are made to the Funds’ Board of Directors on an annual basis.
There is no assurance that the Funds’ policies on portfolio holdings information will protect the Funds from the potential misuse of portfolio holdings information by individuals or firms in possession of such information.
The following parties currently receive non-public portfolio holdings information regarding one or more of the Nuveen Mutual Funds on an ongoing basis pursuant to the various arrangements described above:
ADP Investor Communications Services
Altrinsic Global Advisors, LLC
Barclays Capital, Inc.
Barra
Bloomberg
BNP Paribas Prime Brokerage, Inc.
BNP Paribas Securities Corp.
Broadridge Systems
Cantor Fitzgerald & Co.
Chapman and Cutler LLP
Commerz Markets LLC
Credit Agricole Securities (USA) Inc.
Credit Suisse Securities (USA), LLC
Deutsche Bank Securities, Inc.
Dresdner Kleinwort Securities, LLC
Ernst & Young LLP
FactSet Research Systems
Financial Graphic Services
First Clearing, LLC
Forbes
Glass, Lewis & Co.
Goldman Sachs & Co.
Hansberger Global Investors, LLC
HSBC Securities (USA), Inc.
ING Financial Markets, LLC
The Investment Company Institute
ISS
Jefferies & Company, Inc.
J.P. Morgan Clearing Corp.
J.P. Morgan Securities, Inc.
Lazard Asset Management, Inc.
Lipper Inc.
Merrill Lynch, Pierce, Fenner & Smith
Moody’s
Morgan Stanley & Co., Inc.
Morningstar, Inc.
MS Securities Services, Inc.
Newedge USA, LLC
Nuveen Asset Management, LLC
Nuveen Fund Advisors, LLC
Pershing, LLC
PricewaterhouseCoopers LLP
Raymond James & Associates, Inc.
RBC Capital Markets Corporation
RBS Securities, Inc.
S-67
R.R. Donnelley & Sons Company
R.R. Donnelley Financial
Scotia Capital (USA), Inc.
SG Ameritas Securities, LLC
Societe Generale, New York Branch
Standard & Poor’s
State Street Bank & Trust Co.
Strategic Insight
TD Ameritrade Clearing, Inc.
ThomsonReuters LLC
UBS Securities, LLC
U.S. Bancorp Fund Services, LLC
U.S. Bank N.A.
Value Line
Vestek Systems, Inc.
Vickers
Wells Fargo Securities, LLC
Wilshire Associates Incorporated
NET ASSET VALUE
Each Fund’s net asset value is determined as set forth in the Prospectus under “General Information—Net Asset Value.”
CAPITAL STOCK
Each share of each Fund’s $0.0001 par value common stock is fully paid, nonassessable, and transferable. Shares may be issued as either full or fractional shares. Fractional shares have pro rata the same rights and privileges as full shares. Shares of the Funds have no preemptive or conversion rights.
Each share of a Fund has one vote. On some issues, such as the election of directors, all shares of all NIF funds vote together as one series. The shares do not have cumulative voting rights. On issues affecting only a particular Fund, the shares of that Fund will vote as a separate series. Examples of such issues would be proposals to alter a fundamental investment restriction pertaining to a Fund or to approve, disapprove or alter a distribution plan. The Bylaws of NIF provide that annual shareholders meetings are not required and that meetings of shareholders need only be held with such frequency as required under Maryland law and the 1940 Act.
The following table sets forth the percentage ownership of each person, who, as of February 4, 2013, owned of record, or is known by NIF to have owned of record or beneficially, 5% or more of any class of a Fund’s shares.
| | | | | | |
Name of Fund and Class | | Name and Address of Owner | | Percentage
of
Ownership | |
| | |
Nuveen Dividend Value Fund
Class A Shares | | Charles Schwab & Co Inc Special Custody Acct FBO Customers Attn Mutual Funds 101 Montgomery St San Francisco CA 94104-4151 | | | 21.40% | |
| | |
| | UBS WM USA Omni Account M/F Attn Department Manager 1000 Harbor Blvd Fl 5 Weehawken NJ 07086-6761 | | | 8.51% | |
S-68
| | | | | | |
Name of Fund and Class | | Name and Address of Owner | | Percentage
of
Ownership | |
| | |
Nuveen Dividend Value Fund
Class B Shares | | Charles Schwab & Co Inc Special Custody Acct FBO Customers Attn Mutual Funds 101 Montgomery St San Francisco CA 94104-4151 | | | 39.76% | |
| | |
| | Pershing LLC 1 Pershing Plz Jersey City NJ 07399-0001 | | | 6.93% | |
| | |
Nuveen Dividend Value Fund
Class C Shares | | National Financial Services LLC For the Exclusive Benefit of our Customers Attn Mutual Fund Dept 4th Floor 499 Washington Blvd Jersey City NJ 07310-2010 | | | 16.41% | |
| | |
| | First Clearing, LLC Special Custody Acct for the Exclusive Benefit of Customer 2801 Market St Saint Louis MO 63103-2523 | | | 14.15% | |
| | |
| | Merrill Lynch Pierce Fenner & Smith Attn Physical Team 4800 Deer Lake Dr E Jacksonville FL 32246-6484 | | | 10.42% | |
| | |
| | Raymond James Omnibus for Mutual Funds House Acct Attn: Courtney Waller 880 Carillon Parkway St Petersburg FL 33716-1102 | | | 9.76% | |
| | |
| | Morgan Stanley Smith Barney Harborside Financial Center Plaza 2 3rd Floor Jersey City NJ 07311 | | | 8.88% | |
| | |
| | Pershing LLC 1 Pershing Plz Jersey City NJ 07399-0001 | | | 6.42% | |
| | |
| | American Enterprise Investment Serv 707 2nd Ave S Minneapolis MN 55402-2405 | | | 5.21% | |
| | |
Nuveen Dividend Value Fund
Class R3 Shares | | Wells Fargo Bank FBO Various Retirement Plans 1525 West Wt Harris Blvd Charlotte NC 28288-1076 | | | 35.44% | |
S-69
| | | | | | |
Name of Fund and Class | | Name and Address of Owner | | Percentage
of
Ownership | |
| | |
| | ING Life Insurance & Annuity Co 1 Orange Way Windsor CT 06095-4773 | | | 9.13% | |
| | |
| | Merrill Lynch Pierce Fenner & Smith Safekeeping Attn Physical Team 4800 Deer Lake Dr E Jacksonville FL 32246-6484 | | | 5.76% | |
| | |
| | PIMS/Prudential Retirement As Nominee for the TTEE/Cust Prudential SmartSolution IRA 280 Trumbull St. Hartford CT 06103-3509 | | | 5.01% | |
| | |
Nuveen Dividend Value Fund
Class I Shares | | Band & Co C/O US Bank PO Box 1787 Milwaukee WI 53201-1787 | | | 40.60% | |
| | |
| | Capinco C/O US Bank PO Box 1787 Milwaukee WI 53201-1787 | | | 11.98% | |
| | |
| | Washington & Co PO Box 1787 Milwaukee WI 53201-1787 | | | 11.65% | |
| | |
| | Charles Schwab & Co Inc Special Custody Account For Benefit of Customers Attn Mutual Funds 101 Montgomery St San Francisco CA 94104-4151 | | | 11.14% | |
| | |
| | National Financial Services LLC For the Exclusive Benefit of our Customers Attn Mutual Fund Dept 4th Floor 499 Washington Blvd Jersey City NJ 07310-2010 | | | 5.27% | |
| | |
Nuveen Equity Index Fund
Class A Shares | | Charles Schwab & Co Inc Its Customers Attn Mutual Funds 101 Montgomery St San Francisco CA 94104-4151 | | | 25.59% | |
| | |
| | Hartford Life Insurance Company Separate Account Attn UIT Operations PO Box 2999 Hartford CT 06104-2999 | | | 12.93% | |
S-70
| | | | | | |
Name of Fund and Class | | Name and Address of Owner | | Percentage
of
Ownership | |
| | |
| | Great-West Trust Co LLC Trustee/C FBO Retirement Plans 8515 E Orchard Rd 2T2 Greenwood Vlg CO 80111-5002 | | | 7.56% | |
| | |
Nuveen Equity Index Fund
Class B Shares | | Charles Schwab & Co Inc Special Custody Acct FBO Customers Attn Mutual Funds 101 Montgomery St San Francisco CA 94104-4151 | | | 34.35% | |
| | |
| | First Clearing, LLC Special Custody Acct for the Exclusive Benefit of Customer 2801 Market St Saint Louis MO 63103-2523 | | | 7.59% | |
| | |
Nuveen Equity Index Fund
Class C Shares | | UBS WM USA Omni Account M/F Attn Department Manager 1000 Harbor Blvd Fl 5 Weehawken NJ 07086-6761 | | | 13.79% | |
| | |
| | Merrill Lynch Pierce Fenner & Smith Attn Physical Team 4800 Deer Lake Dr E Jacksonville FL 32246-6484 | | | 11.52% | |
| | |
| | Great-West Trust Co LLC Trustee/C FBO Retirement Plans 8515 E Orchard Rd 2T2 Greenwood Vlg CO 80111-5002 | | | 8.46% | |
| | |
| | First Clearing, LLC Special Custody Acct for the Exclusive Benefit of Customer 2801 Market St Saint Louis MO 63103-2523 | | | 8.29% | |
| | |
| | Charles Schwab & Co Inc Special Custody Acct FBO Customers Attn Mutual Funds 101 Montgomery St San Francisco CA 94104-4151 | | | 6.99% | |
| | |
| | Raymond James Omnibus for Mutual Funds House Acct Attn: Courtney Waller 880 Carillon Parkway St Petersburg FL 33716-1102 | | | 5.33% | |
S-71
| | | | | | |
Name of Fund and Class | | Name and Address of Owner | | Percentage
of
Ownership | |
| | |
| | National Financial Services LLC For the Exclusive Benefit of our Customers Attn Mutual Fund Dept 4th Floor 499 Washington Blvd Jersey City NJ 07310-2010 | | | 5.21% | |
| | |
Nuveen Equity Index Fund
Class R3 Shares | | Hartford Life Insurance Company Separate Account Attn UIT Operations PO Box 2999 Hartford CT 06104-2999 | | | 47.60% | |
| | |
Nuveen Equity Index Fund
Class I Shares | | Great-West Trust Co LLC Trustee/C FBO Retirement Plans 8515 E Orchard Rd 2T2 Greenwood Vlg CO 80111-5002 | | | 37.02% | |
| | |
| | Band & Co C/O US Bank PO Box 1787 Milwaukee WI 53201-1787 | | | 23.56% | |
| | |
| | Capinco C/O US Bank PO Box 1787 Milwaukee WI 53201-1787 | | | 10.43% | |
| | |
| | Washington & Co C/O US Bank PO Box 1787 Milwaukee WI 53201-1787 | | | 7.98% | |
| | |
| | Great-West Trust Co TTEE Employee Benefits Clients 8515 East Orchard Rd 2T2 Greenwood Vlg CO 80111-5002 | | | 5.30% | |
| | |
Nuveen International Fund
Class A Shares | | Charles Schwab & Co Inc Special Custody Acct FBO Customers Attn Mutual Funds 101 Montgomery St San Francisco CA 94104-4151 | | | 25.83% | |
| | |
| | National Financial Services LLC For the Exclusive Benefit of our Customers Attn Mutual Fund Dept 4th Floor 499 Washington Blvd Jersey City NJ 07310-2010 | | | 9.33% | |
| | |
| | UBS WM USA Omni Account M/F Attn Department Manager 1000 Harbor Blvd Fl 5 Weehawken NJ 07086-6761 | | | 7.62% | |
S-72
| | | | | | |
Name of Fund and Class | | Name and Address of Owner | | Percentage
of
Ownership | |
| | |
| | First Clearing, LLC Special Custody Acct for the Exclusive Benefit of Customer 2801 Market St Saint Louis MO 63103-2523 | | | 6.97% | |
| | |
Nuveen International Fund
Class C Shares | | UBS WM USA Omni Account M/F Attn Department Manager 1000 Harbor Blvd Fl 5 Weehawken NJ 07086-6761 | | | 24.38% | |
| | |
| | Pershing LLC 1 Pershing Plz Jersey City NJ 07399-0001 | | | 11.76% | |
| | |
Nuveen International Fund
Class R3 Shares | | Counsel Trust DBA MATC FBO Mercury Tool & Machine PS 401k Plan 1251 Waterfront Place Suite 525 Pittsburgh PA 15222-4228 | | | 67.99% | |
| | |
| | Ronnie D Bubar FBO Subaru of Grand Junction 401k 2496 Highway 6 and 50 Grand Jct CO 81505-1108 | | | 19.91% | |
| | |
| | MG Trust Company Cust. FBO Ultraviolet Resources International 717 17th Street Suite 1300 Denver CO 80202-3304 | | | 10.25% | |
| | |
Nuveen International Fund
Class I Shares | | Band & Co C/O US Bank PO Box 1787 Milwaukee WI 53201-1787 | | | 60.12% | |
| | |
| | Washington & Co C/O US Bank PO Box 1787 Milwaukee WI 53201-1787 | | | 20.01% | |
| | |
| | Capinco C/O US Bank PO Box 1787 Milwaukee WI 53201-1787 | | | 10.70% | |
| | |
Nuveen International Select Fund
Class A Shares | | Charles Schwab & Co Inc Special Custody Acct FBO Customers Attn Mutual Funds 101 Montgomery St San Francisco CA 94104-4151 | | | 46.89% | |
S-73
| | | | | | |
Name of Fund and Class | | Name and Address of Owner | | Percentage
of
Ownership | |
| | |
| | American Enterprise Investment Serv 707 2nd Ave S Minneapolis MN 55402-2405 | | | 5.21% | |
| | |
Nuveen International Select Fund
Class C Shares | | UBS WM USA Omni Account M/F Attn Department Manager 1000 Harbor Blvd Fl 5 Weehawken NJ 07086-6761 | | | 39.80% | |
| | |
| | Morgan Stanley Smith Barney Harborside Financial Center Plaza 2 3rd Floor Jersey City NJ 07311 | | | 12.06% | |
| | |
| | Pershing LLC 1 Pershing Plz Jersey City NJ 07399-0001 | | | 8.21% | |
| | |
| | National Financial Services LLC For the Exclusive Benefit of our Customers Attn Mutual Fund Dept 4th Floor 499 Washington Blvd Jersey City NJ 07310-2010 | | | 7.47% | |
| | |
| | Charles Schwab & Co Inc Special Custody Acct FBO Customers Attn Mutual Funds 101 Montgomery St San Francisco CA 94104-4151 | | | 6.92% | |
| | |
| | American Enterprise Investment Serv 707 2nd Ave S Minneapolis MN 55402-2405 | | | 5.02% | |
| | |
Nuveen International Select Fund
Class I Shares | | Band & Co C/O US Bank PO Box 1787 Milwaukee WI 53201-1787 | | | 46.26% | |
| | |
| | Capinco C/O US Bank PO Box 1787 Milwaukee WI 53201-1787 | | | 26.96% | |
| | |
| | Washington & Co C/O US Bank PO Box 1787 Milwaukee WI 53201-1787 | | | 23.41% | |
S-74
| | | | | | |
Name of Fund and Class | | Name and Address of Owner | | Percentage
of
Ownership | |
| | |
Nuveen Large Cap Growth Opportunities Fund
Class A Shares | | Charles Schwab & Co Inc For the Exclusive Benefit of Its Customers Attn Mutual Funds 101 Montgomery St San Francisco CA 94104-4151 | | | 26.21% | |
| | |
| | Charles Schwab & Co Inc Special Custody Acct FBO Customers Attn Mutual Funds 101 Montgomery St San Francisco CA 94104-4151 | | | 12.50% | |
| | |
| | UBS WM USA Omni Account M/F Attn Department Manager 1000 Harbor Blvd Fl 5 Weehawken NJ 07086-6761 | | | 8.59% | |
| | |
| | National Financial Services LLC For the Exclusive Benefit of our Customers Attn Mutual Fund Dept 4th Floor 499 Washington Blvd Jersey City NJ 07310-2010 | | | 7.21% | |
| | |
| | Great-West Trust Co LLC FBO Putnam FBO Recordkeeping for Various Benef 8515 E Orchard Rd 2T2 Greenwood Village CO 80111-5002 | | | 6.21% | |
| | |
Nuveen Large Cap Growth Opportunities Fund
Class B Shares | | Charles Schwab & Co Inc Special Custody Acct FBO Customers Attn Mutual Funds 101 Montgomery St San Francisco CA 94104-4151 | | | 19.49% | |
| | |
| | First Clearing, LLC Special Custody Acct for the Exclusive Benefit of Customer 2801 Market St Saint Louis MO 63103-2523 | | | 14.24% | |
| | |
Nuveen Large Cap Growth Opportunities Fund
Class C Shares | | Merrill Lynch Pierce Fenner & Smith Attn Physical Team 4800 Deer Lake Dr E Jacksonville FL 32246-6484 | | | 34.26% | |
| | |
| | Pershing LLC 1 Pershing Plz Jersey City NJ 07399-0001 | | | 15.30% | |
S-75
| | | | | | |
Name of Fund and Class | | Name and Address of Owner | | Percentage
of
Ownership | |
| | |
| | Morgan Stanley Smith Barney Harborside Financial Center Plaza 2 3rd Floor Jersey City NJ 07311 | | | 7.31% | |
| | |
| | Charles Schwab & Co Inc Special Custody Acct FBO Customers Attn Mutual Funds 101 Montgomery St San Francisco CA 94104-4151 | | | 7.07% | |
| | |
| | National Financial Services LLC For the Exclusive Benefit of our Customers Attn Mutual Fund Dept 4th Floor 499 Washington Blvd Jersey City NJ 07310-2010 | | | 5.82% | |
| | |
| | First Clearing, LLC Special Custody Acct for the Exclusive Benefit of Customer 2801 Market St Saint Louis MO 63103-2523 | | | 5.46% | |
| | |
Nuveen Large Cap Growth Opportunities Fund
Class R3 Shares | | TD Ameritrade Trust Co PO Box 17748 Denver CO 80217-0748 | | | 21.46% | |
| | |
| | Counsel Trust DBA MATC FBO Empower Ret Plan Savings 1251 Waterfront Place Suite 525 Pittsburgh PA 15222-4228 | | | 10.38% | |
| | |
| | Taynik & Co C/O Investors Bank & Trust Attn Mutual Fund Processing 200 Clarendon St FPG 90 Boston MA 02116-5097 | | | 9.10% | |
| | |
| | PIMS/Prudential Retirement as Nominee for the TTEE/Cust Pl Fortney & Weygandt Inc 401 k 31269 Bradley Rd North Olmsted OH 44070-3875 | | | 7.38% | |
| | |
| | Great-West Trust Co LLC FBO Putnam FBO Recordkeeping for Various Benef 8515 E Orchard Rd 2T2 Greenwood Village CO 80111-5002 | | | 6.18% | |
| | |
Nuveen Large Cap Growth Opportunities Fund
Class I Shares | | Band & Co C/O US Bank PO Box 1787 Milwaukee WI 53201-1787 | | | 41.50% | |
S-76
| | | | | | |
Name of Fund and Class | | Name and Address of Owner | | Percentage
of
Ownership | |
| | |
| | Washington & Co C/O US Bank PO Box 1787 Milwaukee WI 53201-1787 | | | 16.16% | |
| | |
| | Capinco C/O US Bank PO Box 1787 Milwaukee WI 53201-1787 | | | 13.58% | |
| | |
Nuveen Large Cap Select Fund
Class A Shares | | Charles Schwab & Co Inc Special Custody Acct FBO Customers Attn Mutual Funds 101 Montgomery St San Francisco CA 94104-4151 | | | 44.35% | |
| | |
| | First Clearing, LLC Special Custody Acct for the Exclusive Benefit of Customer 2801 Market St Saint Louis MO 63103-2523 | | | 10.03% | |
| | |
| | National Financial Services LLC For the Exclusive Benefit of our Customers Attn Mutual Fund Dept 4th Floor 499 Washington Blvd Jersey City NJ 07310-2010 | | | 8.59% | |
| | |
| | UBS WM USA Omni Account M/F Attn Department Manager 1000 Harbor Blvd Fl 5 Weehawken NJ 07086-6761 | | | 5.85% | |
| | |
Nuveen Large Cap Select Fund
Class C Shares | | Pershing LLC 1 Pershing Plz Jersey City NJ 07399-0001 | | | 51.32% | |
| | |
| | Delbert B Hopkins & Sharon Hopkins Jt Caring Trust Delbert B Hopkins & Sharon Hopkins Tr U/A 07/11/2006 11311 N Cowboy Trl Prescott AZ 86305-5583 | | | 17.45% | |
| | |
| | State Street Bank & Trust Cust David M Vandenberg SEP IRA 108 S H St Lakeview OR 97630-1856 | | | 7.47% | |
| | |
| | Raymond James Omnibus for Mutual Funds House Acct Attn: Courtney Waller 880 Carillon Parkway St Petersburg FL 33716-1102 | | | 5.79% | |
S-77
| | | | | | |
Name of Fund and Class | | Name and Address of Owner | | Percentage
of
Ownership | |
| | |
| | Merrill Lynch Pierce Fenner & Smith Safekeeping Attn Physical Team 4800 Deer Lake Dr E Jacksonville FL 32246-6484 | | | 5.35% | |
| | |
Nuveen Large Cap Select Fund
Class I Shares | | Capinco C/O US Bank PO Box 1787 Milwaukee WI 53201-1787 | | | 47.57% | |
| | |
| | Band & Co C/O US Bank PO Box 1787 Milwaukee WI 53201-1787 | | | 40.91% | |
| | |
| | Washington & Co C/O US Bank PO Box 1787 Milwaukee WI 53201-1787 | | | 7.44% | |
| | |
Nuveen Mid Cap Growth Opportunities Fund
Class A Shares | | National Financial Services LLC For the Exclusive Benefit of our Customers Attn Mutual Fund Dept 4th Floor 499 Washington Blvd Jersey City NJ 07310-2010 | | | 23.84% | |
| | |
| | Charles Schwab & Co Inc Special Custody Acct FBO Customers Attn Mutual Funds 101 Montgomery St San Francisco CA 94104-4151 | | | 12.03% | |
| | |
| | State Street Bank 401k Plan FBO ADP Access 401(k) Product 1 Lincoln St Boston MA 02111-2901 | | | 6.87% | |
| | |
Nuveen Mid Cap Growth Opportunities Fund
Class B Shares | | Charles Schwab & Co Inc Special Custody Acct FBO Customers Attn Mutual Funds 101 Montgomery St San Francisco CA 94104-4151 | | | 23.48% | |
| | |
| | Pershing LLC 1 Pershing Plz Jersey City NJ 07399-0001 | | | 11.05% | |
S-78
| | | | | | |
Name of Fund and Class | | Name and Address of Owner | | Percentage
of
Ownership | |
| | |
| | First Clearing, LLC Special Custody Acct for the Exclusive Benefit of Customer 2801 Market St Saint Louis MO 63103-2523 | | | 9.61% | |
| | |
| | National Financial Services LLC For the Exclusive Benefit of our Customers Attn Mutual Fund Dept 4th Floor 499 Washington Blvd Jersey City NJ 07310-2010 | | | 5.86% | |
| | |
Nuveen Mid Cap Growth Opportunities Fund
Class C Shares | | Pershing LLC 1 Pershing Plz Jersey City NJ 07399-0001 | | | 14.54% | |
| | |
| | Merrill Lynch Pierce Fenner & Smith Attn Physical Team 4800 Deer Lake Dr E Jacksonville FL 32246-6484 | | | 14.02% | |
| | |
| | First Clearing, LLC Special Custody Acct for the Exclusive Benefit of Customer 2801 Market St Saint Louis MO 63103-2523 | | | 12.75% | |
| | |
| | National Financial Services LLC For the Exclusive Benefit of our Customers Attn Mutual Fund Dept 4th Floor 499 Washington Blvd Jersey City NJ 07310-2010 | | | 11.22% | |
| | |
| | UBS WM USA Omni Account M/F Attn Department Manager 1000 Harbor Blvd Fl 5 Weehawken NJ 07086-6761 | | | 5.52% | |
| | |
| | Morgan Stanley Smith Barney Harborside Financial Center Plaza 2 3rd Floor Jersey City NJ 07311 | | | 5.47% | |
| | |
Nuveen Mid Cap Growth Opportunities Fund
Class R3 Shares | | Hartford Life Insurance Company Separate Account Attn UIT Operations PO Box 2999 Hartford CT 06104-2999 | | | 18.71% | |
| | |
| | State Street Bank 401k Plan FBO ADP Access 401(k) Product 1 Lincoln St Boston MA 02111-2901 | | | 13.83% | |
S-79
| | | | | | |
Name of Fund and Class | | Name and Address of Owner | | Percentage
of
Ownership | |
| | |
| | National Financial Services LLC For the Exclusive Benefit of our Customers Attn Mutual Fund Dept 4th Floor 499 Washington Blvd Jersey City NJ 07310-2010 | | | 10.34% | |
| | |
| | DCGT as TTEE and/or Cust FBO Principal Financial Group Quali Fied FIA Omnibus Attn NPIO Trade Desk 711 High St Des Moines IA 50392-0001 | | | 7.10% | |
| | |
| | DCGT as TTEE and/or Cust FBO Principal Financial Group Quali Fied Prin Advtg Omnibus Attn NPIO Trade Desk 711 High St Des Moines IA 50392-0001 | | | 5.08% | |
| | |
Nuveen Mid Cap Growth Opportunities Fund
Class I Shares | | Band & Co C/O US Bank PO Box 1787 Milwaukee WI 53201-1787 | | | 24.53% | |
| | |
| | National Financial Services LLC For the Exclusive Benefit of our Customers Attn Mutual Fund Dept 4th Floor 499 Washington Blvd Jersey City NJ 07310-2010 | | | 21.62% | |
| | |
| | Great-West Trust Co LLC Trustee/C FBO Retirement Plans 8515 E Orchard Rd 2T2 Greenwood Vlg CO 80111-5002 | | | 16.13% | |
| | |
| | Capinco C/O US Bank PO Box 1787 Milwaukee WI 53201-1787 | | | 8.95% | |
| | |
| | Washington & Co C/O US Bank PO Box 1787 Milwaukee WI 53201-1787 | | | 8.10% | |
| | |
Nuveen Mid Cap Index Fund
Class A Shares | | Hartford Life Insurance Company Separate Account Attn UIT Operations PO Box 2999 Hartford CT 06104-2999 | | | 37.67% | |
S-80
| | | | | | |
Name of Fund and Class | | Name and Address of Owner | | Percentage
of
Ownership | |
| | |
Nuveen Mid Cap Index Fund
Class C Shares | | American Enterprise Investment Serv 707 2nd Ave S Minneapolis MN 55402-2405 | | | 33.87% | |
| | |
| | First Clearing, LLC Special Custody Acct for the Exclusive Benefit of Customer 2801 Market St Saint Louis MO 63103-2523 | | | 14.87% | |
| | |
| | Morgan Stanley Smith Barney Harborside Financial Center Plaza 2 3rd Floor Jersey City NJ 07311 | | | 9.58% | |
| | |
Nuveen Mid Cap Index Fund
Class R3 Shares | | Hartford Life Insurance Company Separate Account Attn UIT Operations PO Box 2999 Hartford CT 06104-2999 | | | 52.58% | |
| | |
| | State Street Bank 401k Plan FBO ADP Access 401(k) Product 1 Lincoln St Boston MA 02111-2901 | | | 9.64% | |
| | |
Nuveen Mid Cap Index Fund
Class I Shares | | Band & Co C/O US Bank PO Box 1787 Milwaukee WI 53201-1787 | | | 32.94% | |
| | |
| | Capinco C/O US Bank PO Box 1787 Milwaukee WI 53201-1787 | | | 11.27% | |
| | |
| | Washington & Co C/O US Bank PO Box 1787 Milwaukee WI 53201-1787 | | | 9.95% | |
| | |
| | Great-West Trust Co LLC Trustee/C FBO Retirement Plans 8515 E Orchard Rd 2T2 Greenwood Vlg CO 80111-5002 | | | 9.52% | |
| | |
Nuveen Mid Cap Select Fund
Class A Shares | | Charles Schwab & Co Inc Special Custody Acct FBO Customers Attn Mutual Funds 101 Montgomery St San Francisco CA 94104-4151 | | | 24.63% | |
S-81
| | | | | | |
Name of Fund and Class | | Name and Address of Owner | | Percentage
of
Ownership | |
| | |
| | UBS WM USA Omni Account M/F Attn Department Manager 1000 Harbor Blvd Fl 5 Weehawken NJ 07086-6761 | | | 7.94% | |
| | |
| | Pershing LLC 1 Pershing Plz Jersey City NJ 07399-0001 | | | 5.37% | |
| | |
Nuveen Mid Cap Select Fund
Class C Shares | | Pershing LLC 1 Pershing Plz Jersey City NJ 07399-0001 | | | 11.78% | |
| | |
| | UBS WM USA Omni Account M/F Attn Department Manager 1000 Harbor Blvd Fl 5 Weehawken NJ 07086-6761 | | | 11.24% | |
| | |
| | State Street Bank & Trust Cust Tom S Reed SEP IRA 19486 Elena Ln Jamul CA 91935-6835 | | | 9.24% | |
| | |
Nuveen Mid Cap Select Fund
Class I Shares | | Band & Co C/O US Bank PO Box 1787 Milwaukee WI 53201-1787 | | | 38.12% | |
| | |
| | Washington & Co C/O US Bank PO Box 1787 Milwaukee WI 53201-1787 | | | 37.52% | |
| | |
| | Capinco C/O US Bank PO Box 1787 Milwaukee WI 53201-1787 | | | 11.76% | |
| | |
| | Great-West Trust Co LLC Trustee/C FBO Retirement Plans 8515 E Orchard Rd 2T2 Greenwood Vlg CO 80111-5002 | | | 8.83% | |
| | |
Nuveen Mid Cap Value Fund
Class A Shares | | Charles Schwab & Co Inc Special Custody Acct FBO Customers Attn Mutual Funds 101 Montgomery St San Francisco CA 94104-4151 | | | 23.34% | |
| | |
| | Pershing LLC 1 Pershing Plz Jersey City NJ 07399-0001 | | | 10.33% | |
S-82
| | | | | | |
Name of Fund and Class | | Name and Address of Owner | | Percentage
of
Ownership | |
| | |
| | Charles Schwab & Co Inc Special Custody Account For Benefit of Customers Attn Mutual Funds 101 Montgomery St San Francisco CA 94104-4151 | | | 9.21% | |
| | |
| | National Financial Services LLC For the Exclusive Benefit of our Customers Attn Mutual Fund Dept 4th Floor 499 Washington Blvd Jersey City NJ 07310-2010 | | | 5.95% | |
| | |
Nuveen Mid Cap Value Fund
Class B Shares | | Charles Schwab & Co Inc Special Custody Acct FBO Customers Attn Mutual Funds 101 Montgomery St San Francisco CA 94104-4151 | | | 22.71% | |
| | |
| | Pershing LLC 1 Pershing Plz Jersey City NJ 07399-0001 | | | 10.85% | |
| | |
| | State Street Bank & Trust Cust Nuca Vladislav IRA 7021 43rd St Stickney IL 60402-4302 | | | 6.15% | |
| | |
| | National Financial Services LLC For the Exclusive Benefit of our Customers Attn Mutual Fund Dept 4th Floor 499 Washington Blvd Jersey City NJ 07310-2010 | | | 5.21% | |
| | |
| | First Clearing, LLC Special Custody Acct for the Exclusive Benefit of Customer 2801 Market St Saint Louis MO 63103-2523 | | | 5.06% | |
| | |
Nuveen Mid Cap Value Fund
Class C Shares | | Morgan Stanley Smith Barney Harborside Financial Center Plaza 2 3rd Floor Jersey City NJ 07311 | | | 25.38% | |
| | |
| | Pershing LLC 1 Pershing Plz Jersey City NJ 07399-0001 | | | 13.92% | |
| | |
| | LPL Financial 9785 Towne Centre Dr San Diego CA 92121-1968 | | | 7.01% | |
S-83
| | | | | | |
Name of Fund and Class | | Name and Address of Owner | | Percentage
of
Ownership | |
| | |
Nuveen Mid Cap Value Fund
Class R3 Shares | | National Financial Services LLC For the Exclusive Benefit of our Customers Attn Mutual Fund Dept 4th Floor 499 Washington Blvd Jersey City NJ 07310-2010 | | | 17.23% | |
| | |
| | State Street Bank 401k Plan FBO ADP Access 401(k) Product 1 Lincoln St Boston MA 02111-2901 | | | 5.90% | |
| | |
Nuveen Mid Cap Value Fund
Class I Shares | | Band & Co C/O US Bank PO Box 1787 Milwaukee WI 53201-1787 | | | 38.08% | |
| | |
| | Capinco C/O US Bank PO Box 1787 Milwaukee WI 53201-1787 | | | 25.41% | |
| | |
| | Washington & Co C/O US Bank PO Box 1787 Milwaukee WI 53201-1787 | | | 17.09% | |
| | |
| | Great-West Trust Co LLC Trustee/C FBO Retirement Plans 8515 E Orchard Rd 2T2 Greenwood Vlg CO 80111-5002 | | | 6.57% | |
| | |
Nuveen Quantitative Enhanced Core Equity Fund
Class A Shares | | Charles Schwab & Co Inc Special Custody Account For Benefit of Customers Attn Mutual Funds 101 Montgomery St San Francisco CA 94104-4151 | | | 82.85% | |
| | |
| | American Enterprise Investment Serv 707 2nd Ave S Minneapolis MN 55402-2405 | | | 6.18% | |
| | |
Nuveen Quantitative Enhanced Core Equity Fund
Class C Shares | | Raymond James Omnibus for Mutual Funds House Acct Attn: Courtney Waller 880 Carillon Parkway St Petersburg FL 33716-1102 | | | 100.00% | |
S-84
| | | | | | |
Name of Fund and Class | | Name and Address of Owner | | Percentage
of
Ownership | |
| | |
Nuveen Quantitative Enhanced Core Equity Fund
Class I Shares | | Capinco C/O US Bank PO Box 1787 Milwaukee WI 53201-1787 | | | 52.73% | |
| | |
| | Band & Co C/O US Bank PO Box 1787 Milwaukee WI 53201-1787 | | | 45.41% | |
| | |
Nuveen Small Cap Growth Opportunities Fund
Class A Shares | | Charles Schwab & Co Inc Special Custody Acct FBO Customers Attn Mutual Funds 101 Montgomery St San Francisco CA 94104-4151 | | | 25.83% | |
| | |
| | National Financial Services LLC For the Exclusive Benefit of our Customers Attn Mutual Fund Dept 4th Floor 499 Washington Blvd Jersey City NJ 07310-2010 | | | 9.01% | |
| | |
Nuveen Small Cap Growth Opportunities Fund
Class B Shares | | Charles Schwab & Co Inc Special Custody Acct FBO Customers Attn Mutual Funds 101 Montgomery St San Francisco CA 94104-4151 | | | 41.75% | |
| | |
| | National Financial Services LLC For the Exclusive Benefit of our Customers Attn Mutual Fund Dept 4th Floor 499 Washington Blvd Jersey City NJ 07310-2010 | | | 31.46% | |
| | |
Nuveen Small Cap Growth Opportunities Fund
Class C Shares | | First Clearing, LLC Special Custody Acct for the Exclusive Benefit of Customer 2801 Market St Saint Louis MO 63103-2523 | | | 21.05% | |
| | |
| | Pershing LLC 1 Pershing Plz Jersey City NJ 07399-0001 | | | 12.09% | |
| | |
| | National Financial Services LLC For the Exclusive Benefit of our Customers Attn Mutual Fund Dept 4th Floor 499 Washington Blvd Jersey City NJ 07310-2010 | | | 10.42% | |
S-85
| | | | | | |
Name of Fund and Class | | Name and Address of Owner | | Percentage
of
Ownership | |
| | |
| | Raymond James Omnibus for Mutual Funds House Acct Attn: Courtney Waller 880 Carillon Parkway St Petersburg FL 33716-1102 | | | 7.53% | |
| | |
| | Charles Schwab & Co Inc Special Custody Acct FBO Customers Attn Mutual Funds 101 Montgomery St San Francisco CA 94104-4151 | | | 5.66% | |
| | |
| | Morgan Stanley Smith Barney Harborside Financial Center Plaza 2 3rd Floor Jersey City NJ 07311 | | | 5.65% | |
| | |
Nuveen Small Cap Growth Opportunities Fund
Class R3 Shares | | TD Ameritrade Trust Company PO Box 17748 Denver CO 80217-0748 | | | 36.85% | |
| | |
| | Frontier Trust Co FBO Ability Services Network Inc 401 PO Box 10758 Fargo ND 58106-0758 | | | 12.02% | |
| | |
| | Don P Hargroder FBO Abbeville/Lafayette Courtesy 401k 4750 Johnston St PO Box 61130 Lafayette LA 70596-1130 | | | 8.19% | |
| | |
Nuveen Small Cap Growth Opportunities Fund
Class I Shares | | Band & Co C/O US Bank PO Box 1787 Milwaukee WI 53201-1787 | | | 57.08% | |
| | |
| | Capinco C/O US Bank PO Box 1787 Milwaukee WI 53201-1787 | | | 18.00% | |
| | |
| | Great-West Trust Co LLC Trustee/C FBO Retirement Plans 8515 E Orchard Rd 2T2 Greenwood Vlg CO 80111-5002 | | | 7.22% | |
| | |
| | Washington & Co C/O US Bank PO Box 1787 Milwaukee WI 53201-1787 | | | 6.07% | |
S-86
| | | | | | |
Name of Fund and Class | | Name and Address of Owner | | Percentage
of
Ownership | |
| | |
Nuveen Small Cap Index Fund
Class A Shares | | Hartford Life Insurance Company Separate Account Attn UIT Operations PO Box 2999 Hartford CT 06104-2999 | | | 37.89% | |
| | |
| | Charles Schwab & Co Inc Special Custody Account For Benefit of Customers Attn Mutual Funds 101 Montgomery St San Francisco CA 94104-4151 | | | 5.02% | |
| | |
Nuveen Small Cap Index Fund
Class C Shares | | Raymond James Omnibus for Mutual Funds House Acct Attn: Courtney Waller 880 Carillon Way St Petersburg FL 33716-1102 | | | 25.89% | |
| | |
| | First Clearing, LLC Special Custody Acct for the Exclusive Benefit of Customer 2801 Market St Saint Louis MO 63103-2523 | | | 16.63% | |
| | |
| | Merrill Lynch Pierce Fenner & Smith Attn Physical Team 4800 Deer Lake Dr E Jacksonville FL 32246-6484 | | | 10.47% | |
| | |
| | Pershing LLC 1 Pershing Plz Jersey City NJ 07399-0001 | | | 8.95% | |
| | |
| | State Street Bank & Trust Cust Catherine M Henderson IRA 4504 Village Crest Dr Flower Mound TX 75022-1029 | | | 7.73% | |
| | |
| | Charles Schwab & Co Inc Special Custody Acct FBO Customers Attn Mutual Funds 101 Montgomery St San Francisco CA 94104-4151 | | | 5.12% | |
| | |
Nuveen Small Cap Index Fund
Class R3 Shares | | Hartford Life Insurance Company Separate Account Attn UIT Operations PO Box 2999 Hartford CT 06104-2999 | | | 38.33% | |
S-87
| | | | | | |
Name of Fund and Class | | Name and Address of Owner | | Percentage
of
Ownership | |
| | |
| | Massachusetts Mutual Life Insurance Co 1295 State St MIP C255 Springfield MA 01111-0001 | | | 19.96% | |
| | |
| | AUL American Unit Trust Attn Separate Accts PO Box 368 Indianapolis IN 46206-0368 | | | 8.22% | |
| | |
Nuveen Small Cap Index Fund
Class I Shares | | Band & Co C/O US Bank PO Box 1787 Milwaukee WI 53201-1787 | | | 45.57% | |
| | |
| | Great-West Trust Co LLC Trustee/C FBO Retirement Plans 8515 E Orchard Rd 2T2 Greenwood Vlg CO 80111-5002 | | | 25.63% | |
| | |
| | Capinco C/O US Bank PO Box 1787 Milwaukee WI 53201-1787 | | | 8.87% | |
| | |
Nuveen Small Cap Select Fund
Class A Shares | | Great West Life & Annuity GWLA-FFII-First Amer Sm Cap Sel A 8515 East Orchard Rd 2T2 Greenwood Vlg CO 80111-5002 | | | 15.56% | |
| | |
| | Charles Schwab & Co Inc Special Custody Acct FBO Customers Attn Mutual Funds 101 Montgomery St San Francisco CA 94104-4151 | | | 10.63% | |
| | |
| | Charles Schwab & Co Inc Special Custody Account For Benefit of Customers Attn Mutual Funds 101 Montgomery St San Francisco CA 94104-4151 | | | 10.00% | |
| | |
| | National Financial Services LLC For the Exclusive Benefit of our Customers Attn Mutual Fund Dept 4th Floor 499 Washington Blvd Jersey City NJ 07310-2010 | | | 9.36% | |
S-88
| | | | | | |
Name of Fund and Class | | Name and Address of Owner | | Percentage
of
Ownership | |
| | |
Nuveen Small Cap Select Fund
Class B Shares | | First Clearing, LLC Special Custody Acct for the Exclusive Benefit of Customer 2801 Market St Saint Louis MO 63103-2523 | | | 20.98% | |
| | |
| | Charles Schwab & Co Inc Special Custody Acct FBO Customers Attn Mutual Funds 101 Montgomery St San Francisco CA 94104-4151 | | | 18.86% | |
| | |
| | Pershing LLC 1 Pershing Plz Jersey City NJ 07399-0001 | | | 9.25% | |
| | |
| | National Financial Services LLC For the Exclusive Benefit of our Customers Attn Mutual Fund Dept 4th Floor 499 Washington Blvd Jersey City NJ 07310-2010 | | | 9.02% | |
| | |
Nuveen Small Cap Select Fund
Class C Shares | | National Financial Services LLC For the Exclusive Benefit of our Customers Attn Mutual Fund Dept 4th Floor 499 Washington Blvd Jersey City NJ 07310-2010 | | | 32.65% | |
| | |
| | Pershing LLC 1 Pershing Plz Jersey City NJ 07399-0001 | | | 15.35% | |
| | |
| | RBC Capital Markets LLC Mutual Fund Omnibus Processing Omnibus Attn Mutual Fund Ops Manager 510 Marquette Ave S Minneapolis MN 55402-1110 | | | 8.85% | |
| | |
| | UBS WM USA Omni Account M/F Attn Department Manager 1000 Harbor Blvd Fl 5 Weehawken NJ 07086-6761 | | | 7.33% | |
| | |
| | First Clearing, LLC Special Custody Acct for the Exclusive Benefit of Customer 2801 Market St Saint Louis MO 63103-2523 | | | 5.26% | |
S-89
| | | | | | |
Name of Fund and Class | | Name and Address of Owner | | Percentage
of
Ownership | |
| | |
Nuveen Small Cap Select Fund
Class R3 Shares | | National Financial Services LLC For the Exclusive Benefit of our Customers Attn Mutual Fund Dept 4th Floor 499 Washington Blvd Jersey City NJ 07310-2010 | | | 15.10% | |
| | |
| | Hartford Life Insurance Company Separate Account Attn UIT Operations PO Box 2999 Hartford CT 06104-2999 | | | 12.18% | |
| | |
| | Taynik & Co C/O Investors Bank & Trust Attn Mutual Fund Processing 200 Clarendon St FPG 90 Boston MA 02116-5097 | | | 11.23% | |
| | |
| | DCGT as TTEE and/or Cust FBO Principal Financial Group Quali fied Fia Omnibus Attn NPIO Trade Desk 711 High St Des Moines IA 50392-0001 | | | 6.35% | |
| | |
| | State Street Bank 401k Plan FBO ADP Access 401(k) Product 1 Lincoln St Boston MA 02111-2901 | | | 5.94% | |
| | |
| | Massachusetts Mutual Life Insurance Co 1295 State St MIP C255 Springfield MA 01111-0001 | | | 5.18% | |
| | |
Nuveen Small Cap Select Fund
Class I Shares | | Great-West Trust Co LLC Trustee/C FBO Retirement Plans 8515 E Orchard Rd 2T2 Greenwood Vlg CO 80111-5002 | | | 20.19% | |
| | |
| | Band & Co C/O US Bank PO Box 1787 Milwaukee WI 53201-1787 | | | 14.50% | |
| | |
| | National Financial Services LLC For the Exclusive Benefit of our Customers Attn Mutual Fund Dept 4th Floor 499 Washington Blvd Jersey City NJ 07310-2010 | | | 9.67% | |
| | |
| | DWS Trust Co TTEE ADP Enterprise Product PO Box 1757 Salem NH 03079-1143 | | | 8.65% | |
S-90
| | | | | | |
Name of Fund and Class | | Name and Address of Owner | | Percentage
of
Ownership | |
| | |
| | Standard Insurance Company 1100 SW 6th Ave Ste P11A Portland OR 97204-1015 | | | 8.47% | |
| | |
| | Washington & Co C/O US Bank PO Box 1787 Milwaukee WI 53201-1787 | | | 6.82% | |
| | |
| | Taynik & Co C/O Investors Bank & Trust Attn Mutual Fund Processing 200 Clarendon St FPG 90 Boston MA 02116-5097 | | | 6.10% | |
| | |
| | Capinco C/O US Bank PO Box 1787 Milwaukee WI 53201-1787 | | | 5.52% | |
| | |
Nuveen Small Cap Value Fund
Class A Shares | | Charles Schwab & Co Inc Special Custody Acct FBO Customers Attn Mutual Funds 101 Montgomery St San Francisco CA 94104-4151 | | | 38.22% | |
| | |
| | UBS WM USA Omni Account M/F Attn Department Manager 1000 Harbor Blvd Fl 5 Weehawken NJ 07086-6761 | | | 5.35% | |
| | |
Nuveen Small Cap Value Fund
Class C Shares | | Raymond James Omnibus for Mutual Funds House Acct Attn: Courtney Waller 880 Carillon Way St Petersburg FL 33716-1102 | | | 16.08% | |
| | |
| | Charles Schwab & Co Inc Special Custody Acct FBO Customers Attn Mutual Funds 101 Montgomery St San Francisco CA 94104-4151 | | | 12.06% | |
| | |
| | Merrill Lynch Pierce Fenner & Smith Attn Physical Team 4800 Deer Lake Dr E Jacksonville FL 32246-6484 | | | 9.78% | |
| | |
| | Pershing LLC 1 Pershing Plz Jersey City NJ 07399-0001 | | | 9.07% | |
S-91
| | | | | | |
Name of Fund and Class | | Name and Address of Owner | | Percentage
of
Ownership | |
| | |
| | UBS WM USA Omni Account M/F Attn Department Manager 1000 Harbor Blvd Fl 5 Weehawken NJ 07086-6761 | | | 5.38% | |
| | |
Nuveen Small Cap Value Fund
Class R3 Shares | | National Financial Services LLC For the Exclusive Benefit of our Customers Attn Mutual Fund Dept 4th Floor 499 Washington Blvd Jersey City NJ 07310-2010 | | | 24.00% | |
| | |
| | AUL Group Retirement Account Attn Separate Accts PO Box 368 Indianapolis IN 46206-0368 | | | 13.46% | |
| | |
| | PIMS/Prudential Retirement As Nominee for the TTEE/Cust Pl Prudential SmartSolution IRA 280 Trumbull St. Hartford CT 06103-3509 | | | 7.46% | |
| | |
| | Frontier Trust Co FBO Various Retirement Plans PO Box 10758 Fargo ND 58106-0758 | | | 6.75% | |
| | |
| | AUL American Unit Trust Attn Separtae Accts PO Box 368 Indianapolis IN 46206-0368 | | | 6.68% | |
| | |
| | PIMS/Prudential Retirement As Nominee for the TTEE/Cust Pl Prudential SmartSolution IRA 280 Trumbull St. Hartford CT 06103-3509 | | | 6.31% | |
| | |
| | DCGT as TTEE and/or Cust FBO Principal Financial Group Quali fied FIA Omnibus Attn NPIO Trade Desk 711 High St Des Moines IA 50392-0001 | | | 5.11% | |
| | |
Nuveen Small Cap Value Fund
Class I Shares | | Great-West Trust Co LLC Trustee/C FBO Retirement Plans 8515 E Orchard Rd 2T2 Greenwood Vlg CO 80111-5002 | | | 42.05% | |
| | |
| | Band & Co C/O US Bank PO Box 1787 Milwaukee WI 53201-1787 | | | 25.14% | |
S-92
| | | | | | |
Name of Fund and Class | | Name and Address of Owner | | Percentage
of
Ownership | |
| | |
| | Capinco C/O US Bank PO Box 1787 Milwaukee WI 53201-1787 | | | 13.43% | |
| | |
| | National Financial Services LLC For the Exclusive Benefit of our Customers Attn Mutual Fund Dept 4th Floor 499 Washington Blvd Jersey City NJ 07310-2010 | | | 7.93% | |
| | |
| | Washington & Co PO Box 1787 Milwaukee WI 53201-1787 | | | 5.65% | |
| | |
Nuveen Tactical Market Opportunities Fund
Class A Shares | | American Enterprise Investment Serv 707 2nd Ave S Minneapolis MN 55402-2405 | | | 24.01% | |
| | |
| | UBS WM USA Omni Account M/F Attn Department Manager 1000 Harbor Blvd Fl 5 Weehawken NJ 07086-6761 | | | 16.74% | |
| | |
| | Pershing LLC 1 Pershing Plz Jersey City NJ 07399-0001 | | | 12.40% | |
| | |
| | Raymond James Omnibus for Mutual Funds House Acct Attn: Courtney Waller 880 Carillon Way St Petersburg FL 33716-1102 | | | 11.18% | |
| | |
| | National Financial Services LLC For the Exclusive Benefit of our Customers Attn Mutual Fund Dept 4th Floor 499 Washington Blvd Jersey City NJ 07310-2010 | | | 10.59% | |
| | |
| | LPL Financial FBO Customer Accounts Attn Mutual Fund Operations PO Box 509046 San Diego CA 92150-9046 | | | 9.69% | |
| | |
Nuveen Tactical Market Opportunities Fund
Class C Shares | | National Financial Services LLC For the Exclusive Benefit of our Customers Attn Mutual Fund Dept 4th Floor 499 Washington Blvd Jersey City NJ 07310-2010 | | | 20.25% | |
S-93
| | | | | | |
Name of Fund and Class | | Name and Address of Owner | | Percentage
of
Ownership | |
| | |
| | Raymond James Omnibus for Mutual Funds House Acct Attn: Courtney Waller 880 Carillon Way St Petersburg FL 33716-1102 | | | 12.92% | |
| | |
| | American Enterprise Investment Serv 707 2nd Ave S Minneapolis MN 55402-2405 | | | 10.25% | |
| | |
| | Morgan Stanley Smith Barney Harborside Financial Center Plaza 2 3rd Floor Jersey City NJ 07311 | | | 8.08% | |
| | |
| | Pershing LLC 1 Pershing Plz Jersey City NJ 07399-0001 | | | 5.80% | |
| | |
Nuveen Tactical Market Opportunities Fund
Class I Shares | | Capinco C/O US Bank PO Box 1787 Milwaukee WI 53201-1787 | | | 33.65% | |
| | |
| | Charles Schwab & Co Inc Special Custody Account For Benefit of Customers Attn Mutual Funds 101 Montgomery St San Francisco CA 94104-4151 | | | 21.85% | |
| | |
| | National Financial Services LLC For the Exclusive Benefit of our Customers Attn Mutual Fund Dept 4th Floor 499 Washington Blvd Jersey City NJ 07310-2010 | | | 12.70% | |
| | |
| | LPL Financial FBO Customer Accounts Attn Mutual Fund Operations PO Box 509046 San Diego CA 92150-9046 | | | 11.32% | |
| | |
| | Raymond James Omnibus for Mutual Funds House Acct Attn: Courtney Waller 880 Carillon Way St Petersburg FL 33716-1102 | | | 6.06% | |
S-94
TAX MATTERS
Federal Income Tax Matters
This section summarizes some of the main U.S. federal income tax consequences of owning shares of a Fund. This section is current as of the date of this SAI. Tax laws and interpretations change frequently, and this summary does not describe all of the tax consequences to all taxpayers. For example, this summary generally does not describe your situation if you are a corporation, a non-U.S. person, a broker-dealer or other investor with special circumstances, or if you are investing through a tax-deferred account, such as an IRA or 401(k) plan. In addition, this section does not describe your state, local or non-U.S. tax consequences. This federal income tax summary is based in part on the advice of counsel to the Funds. The Internal Revenue Service could disagree with any conclusions set forth in this section. In addition, Funds’ counsel was not asked to review, and has not reached a conclusion with respect to the federal income tax treatment of the assets to be deposited in the Funds. Consequently, this summary may not be sufficient for you to use for the purpose of avoiding penalties under federal tax law. As with any investment, you should seek advice based on your individual circumstances from your own tax professional.
Fund Status
Each Fund intends to qualify as a “regulated investment company” under the federal tax laws. If a Fund qualifies as a regulated investment company and distributes its income as required by the tax law, the Fund generally will not pay federal income taxes. If a Fund fails for any taxable year to qualify as a regulated investment company for federal income tax purposes, the Fund itself will generally be subject to federal income taxation (which will reduce the amount of Fund income available for distribution) and your tax consequences will be different from those described in this section (for example, all distributions to you will generally be taxed as ordinary income, even if those distributions are derived from capital gains realized by a Fund).
Qualification as a Regulated Investment Company
As a regulated investment company, a Fund generally will not be subject to federal income tax on the portion of its investment company taxable income (as that term is defined in the Code, but without regard to the deduction for dividends paid) and net capital gain (i.e., the excess of net long-term capital gain over net short-term capital loss), that it distributes to shareholders, provided that it distributes at least 90% of its investment company taxable income and 90% of its net tax-exempt interest income for the year (the “Distribution Requirement”) and satisfies certain other requirements of the Code that are described below. Each Fund also intends to make such distributions as are necessary to avoid the otherwise applicable 4% non-deductible excise tax on certain undistributed earnings.
In addition to satisfying the Distribution Requirement, each Fund must, among other things, derive in each taxable year at least 90% of its gross income from (1) dividends, interest, certain payments with respect to securities loans, gains from the sale or disposition of stock, securities or non-U.S. currencies and other income (including but not limited to gains from options, futures or forward contracts) derived with respect to its business of investing in such stock, securities or currencies, and (2) net income derived from an interest in “qualified publicly traded partnerships” (as such term is defined in the Code). Each Fund must also satisfy an asset diversification test in order to qualify as a regulated investment company. Under this test, at the close of each quarter of a Fund’s taxable year, (1) 50% or more of the value of the Fund’s assets must be represented by cash and cash items (including receivables), United States government securities, securities of other regulated investment companies, and other securities, with such other securities limited, in respect of any one issuer, to an amount not greater than 5% of the value of the Fund’s assets and 10% of the outstanding voting securities of such issuer and (2) not more than 25% of the value of the Fund’s assets may be invested in securities of (a) any one issuer (other than U.S. government securities or securities of other regulated investment companies), or of two or more issuers which the Fund controls and which are engaged in the same, similar or related trades or businesses or (b) in the securities of one or more
S-95
“qualified publicly traded partnerships” (as such term is defined in the Code). There are certain exceptions for failure to qualify if the failure is for reasonable cause or is de minimis, and certain corrective action is taken and certain tax payments are made by the Fund.
Distributions
Fund distributions are generally taxable. After the end of each year, you will receive a tax statement that separates your Fund’s distributions into two categories, ordinary income distributions and capital gains dividends. Ordinary income distributions are generally taxed at your ordinary tax rate, however, as further discussed below, certain ordinary income distributions received from the Fund may be taxed at the capital gains tax rates. Generally, you will treat all capital gains dividends as long-term capital gains regardless of how long you have owned your shares. To determine your actual tax liability for your capital gains dividends, you must calculate your total net capital gain or loss for the tax year after considering all of your other taxable transactions, as described below. In addition, a Fund may make distributions that represent a return of capital for tax purposes and thus will generally not be taxable to you. The tax status of your distributions from your Fund is not affected by whether you reinvest your distributions in additional shares or receive them in cash. The income from your Fund that you must take into account for federal income tax purposes is not reduced by amounts used to pay a deferred sales fee, if any. The tax laws may require you to treat distributions made to you in January as if you had received them on December 31 of the previous year. Under the “Health Care and Education Reconciliation Act of 2010,” income from the Fund may also be subject to a new 3.8 percent “medicare tax” imposed for taxable years beginning after 2012. This tax will generally apply to your net investment income if your adjusted gross income exceeds certain threshold amounts, which are $250,000 in the case of married couples filing joint returns and $200,000 in the case of single individuals.
Dividends Received Deduction
A corporation that owns shares generally will not be entitled to the dividends received deduction with respect to many dividends received from the Funds, because the dividends received deduction is generally not available for distributions from regulated investment companies. However, certain ordinary income dividends on shares that are attributable to qualifying dividends received by a Fund from certain corporations may be reported by the Fund as being eligible for the dividends received deduction.
If You Sell or Redeem Shares
If you sell or redeem your shares, you will generally recognize a taxable gain or loss. To determine the amount of this gain or loss, you must subtract your tax basis in your shares from the amount you receive in the transaction. Your tax basis in your shares is generally equal to the cost of your shares, generally including sales charges. In some cases, however, you may have to adjust your tax basis after you purchase your shares.
Taxation of Capital Gains and Losses
If you are an individual, the maximum marginal federal tax rate for net capital gain is generally 20% for taxpayers in the 39.6% tax bracket, 15% for taxpayers in the 25%, 28%, 33% and 35% tax brackets and 0% for taxpayers in the 10% and 15% tax brackets.
Net capital gain equals net long-term capital gain minus net short-term capital loss for the taxable year. Capital gain or loss is long-term if the holding period for the asset is more than one year and is short-term if the holding period for the asset is one year or less. You must exclude the date you purchase your shares to determine your holding period. However, if you receive a capital gain dividend from your Fund and sell your share at a loss after holding it for six months or less, the loss will be recharacterized as long-term capital loss to the extent of the capital gain dividend received. The tax rates for capital gains realized from assets held for one year or less are generally the same as for ordinary income. The Code treats certain capital gains as ordinary income in special situations.
S-96
Taxation of Certain Ordinary Income Dividends
Ordinary income dividends received by an individual shareholder from a regulated investment company such as the Fund are generally taxed at the same rates that apply to net capital gain (as discussed above), provided certain holding period requirements are satisfied and provided the dividends are attributable to qualifying dividends received by the Fund itself. The Fund will provide notice to its shareholders of the amount of any distribution which may be taken into account as a dividend which is eligible for the capital gains tax rates.
In-Kind Distributions
Under certain circumstances, as described in the Prospectus, you may receive an in-kind distribution of Fund securities when you redeem shares or when your Fund terminates. This distribution will be treated as a sale for federal income tax purposes and you will generally recognize gain or loss, generally based on the value at that time of the securities and the amount of cash received. The Internal Revenue Service could, however, assert that a loss may not be currently deducted.
Exchanges
If you exchange shares of a Fund for shares of another Nuveen Mutual Fund, the exchange would generally be considered a sale for federal income tax purposes.
Deductibility of Fund Expenses
Expenses incurred and deducted by your Fund will generally not be treated as income taxable to you. In some cases, however, you may be required to treat your portion of these Fund expenses as income. In these cases you may be able to take a deduction for these expenses. However, certain miscellaneous itemized deductions, such as investment expenses, may be deducted by individuals only to the extent that all of these deductions exceed 2% of the individual’s adjusted gross income. Some individuals may also be subject to further limitations on the amount of their itemized deductions, depending on their income.
Non-U.S. Tax Credit
If your Fund invests in any non-U.S. securities, the tax statement that you receive may include an item showing non-U.S. taxes your Fund paid to other countries. In this case, dividends taxed to you will include your share of the taxes your Fund paid to other countries. You may be able to deduct or receive a tax credit for your share of these taxes.
Investments in Certain Non-U.S. Corporations
If your Fund holds an equity interest in any “passive foreign investment companies” (“PFICs”), which are generally certain foreign corporations that receive at least 75% of their annual gross income from passive sources (such as interest, dividends, certain rents and royalties or capital gains) or that hold at least 50% of their assets in investments producing such passive income, your Fund could be subject to U.S. federal income tax and additional interest charges on gains and certain distributions with respect to those equity interests, even if all the income or gain is timely distributed to its shareholders. Your Fund will not be able to pass through to its shareholders any credit or deduction for such taxes. Your Fund may be able to make an election that could ameliorate these adverse tax consequences. In this case, your Fund would recognize as ordinary income any increase in the value of such PFIC shares, and as ordinary loss any decrease in such value to the extent it did not exceed prior increases included in income. Under this election, your Fund might be required to recognize in a year income in excess of its distributions from PFICs and its proceeds from dispositions of PFIC stock during that year, and such income would nevertheless be subject to the distribution requirement and would be taken into account for purposes of the 4% excise tax. Dividends paid by PFICs will not be treated as qualified dividend income.
S-97
Non-U.S. Investors
If you are a non-U.S. investor (i.e., an investor other than a U.S. citizen or resident or a U.S. corporation, partnership, estate or trust), you should be aware that, generally, subject to applicable tax treaties, distributions from a Fund will be characterized as dividends for federal income tax purposes (other than dividends which a Fund properly reports as capital gain dividends) and will be subject to U.S. income taxes, including withholding taxes, subject to certain exceptions described below. However, distributions received by a non-U.S. investor from a Fund that are properly reported by a Fund as capital gain dividends may not be subject to U.S. federal income taxes, including withholding taxes, provided that a Fund makes certain elections and certain other conditions are met. In the case of dividends with respect to taxable years of the Fund beginning prior to 2014, distributions from the Fund that are properly reported by the Fund as an interest-related dividend attributable to certain interest income received by the Fund or as a short-term capital gain dividend attributable to certain net short-term capital gain income received by the Fund may not be subject to U.S. federal income taxes, including withholding taxes when received by certain foreign investors, provided that the Fund makes certain elections and certain other conditions are met. In addition, distributions in respect of interests in the Fund after December 31, 2013 may be subject to a U.S. withholding tax of 30% in the case of distributions to (i) certain non-U.S. financial institutions that have not entered into an agreement with the U.S. Treasury to collect and disclose certain information and are not resident in a jurisdiction that has entered into such an agreement with the U.S. Treasury and (ii) certain other non-U.S. entities that do not provide certain certifications and information about the entity’s U.S. owners. Dispositions of interests in the Fund by such persons may be subject to such withholding after December 31, 2016.
Capital Loss Carry-Forward
When a Fund has a capital loss carry-forward, it does not make capital gains distributions until the loss has been offset or expired. As of October 31, 2012, the following Funds had capital loss carry-forwards available for federal income tax purposes, expiring in the year indicated.
| | | | | | |
Fund | | Expiration Year | | Capital Loss Carry-Forwards (000’s omitted) |
Nuveen Dividend Value Fund | | 2016 | | $32,868,293 |
| | | | |
Nuveen Large Cap Select Fund | | 2016 | | 16,448,599 |
| | 2017 | | 54,315,490 |
| | | | |
Nuveen Mid Cap Select Fund | | 2016 | | 4,674,453 |
| | 2017 | | 15,708,192 |
| | | | | | |
Nuveen Mid Cap Value Fund | | 2017 | | 55,371,090 |
| | | | |
Nuveen Small Cap Value Fund | | 2017 | | 31,952,601 |
When a Fund lends portfolio securities to a borrower as described above in “Investment Policies and Techniques—Lending of Portfolio Securities,” payments in lieu of dividends made by the borrower to the Fund will not constitute “qualified dividends” taxable at the same rate as long-term capital gains, even if the actual dividends would have constituted qualified dividends had the Fund held the securities. Such payments in lieu of dividends are taxable as ordinary income.
The foregoing relates only to federal income taxation and is a general summary of the federal tax law in effect as of the date of this SAI.
S-98
PURCHASE AND REDEMPTION OF FUND SHARES
As described in the Prospectus, the Funds provide you with alternative ways of purchasing Fund shares based upon your individual investment needs and preferences.
Each class of shares of a Fund represents an interest in the same portfolio of investments. Each class of shares is identical in all respects except that each class bears its own class expenses, including distribution and administration expenses, and each class has exclusive voting rights with respect to any distribution or service plan applicable to its shares. As a result of the differences in the expenses borne by each class of shares, net income per share, dividends per share and net asset value per share will vary among a Fund’s classes of shares. There are no conversion, preemptive or other subscription rights, except that Class B shares automatically convert into Class A shares as described below.
Shareholders of each class will share expenses proportionately for services that are received equally by all shareholders. A particular class of shares will bear only those expenses that are directly attributable to that class, where the type or amount of services received by a class varies from one class to another. For example, class-specific expenses generally will include distribution and service fees for those classes that pay such fees.
The expenses to be borne by specific classes of shares may include (i) transfer agency fees attributable to a specific class of shares, (ii) printing and postage expenses related to preparing and distributing materials such as shareholder reports, prospectuses and proxy statements to current shareholders of a specific class of shares, (iii) SEC and state securities registration fees incurred by a specific class of shares, (iv) the expense of administrative personnel and services required to support the shareholders of a specific class of shares, (v) litigation or other legal expenses relating to a specific class of shares, (vi) directors’ fees or expenses incurred as a result of issues relating to a specific class of shares, (vii) accounting expenses relating to a specific class of shares and (viii) any additional incremental expenses subsequently identified and determined to be properly allocated to one or more classes of shares.
Class A Shares
Class A shares may be purchased at a public offering price equal to the applicable net asset value per share plus an up-front sales charge imposed at the time of purchase as set forth in the Prospectus. Shareholders may qualify for a reduced sales charge, or the sales charge may be waived in its entirety, as described below. Class A shares are also subject to an annual service fee of 0.25%. See “Distribution and Service Plan.” Set forth below is an example of the method of computing the offering price of the Class A shares of each of the Funds except for Nuveen Equity Index Fund, Nuveen Mid Cap Index Fund, Nuveen Quantitative Enhanced Core Equity Fund and Nuveen Small Cap Index Fund because these Funds do not have an up-front sales charge on Class A shares. The example assumes a purchase on October 31, 2012 of Class A shares of a Fund aggregating less than $50,000 subject to the schedule of sales charges set forth in the Prospectus at a price based upon the net asset value of the Class A shares.
| | | | | | | | | | | | | | | | |
| | | Nuveen Dividend
Value Fund | | | Nuveen
International
Fund | | | Nuveen
International
Select Fund | | | Nuveen Large Cap
Growth Opportunities
Fund | |
Net Asset Value per
share | | $ | 14.60 | | | $ | 9.54 | | | $ | 8.96 | | | $ | 34.09 | |
| Per Share Sales Charge—5.75% of public offering price (6.10%, 6.08%, 6.14% and 6.10%, respectively, of net asset value per share) | | | 0.89 | | | | 0.58 | | | | 0.55 | | | | 2.08 | |
| | | | | | | | | | | | | | | | |
| Per Share Offering Price to the Public | | $ | 15.49 | | | $ | 10.12 | | | $ | 9.51 | | | $ | 36.17 | |
| | | | | | | | | | | | | | | | |
S-99
| | | | | | | | | | | | | | | | |
| | | Nuveen Large Cap
Select Fund | | | Nuveen Mid Cap
Growth Opportunities
Fund | | | Nuveen Mid Cap
Select Fund | | | Nuveen Mid Cap
Value Fund | |
| Net Asset Value per share | | $ | 13.42 | | | $ | 42.38 | | | $ | 10.30 | | | $ | 23.22 | |
| Per Share Sales Charge—5.75% of public offering price (6.11%, 6.11%, 6.12% and 6.12%, respectively, of net asset value per share) | | | 0.82 | | | | 2.59 | | | | 0.63 | | | | 1.42 | |
| | | | | | | | | | | | | | | | |
| Per Share Offering Price to the Public | | $ | 14.24 | | | $ | 44.97 | | | $ | 10.93 | | | $ | 24.64 | |
| | | | | | | | | | | | | | | | |
| | | | |
| | | Nuveen Small Cap
Growth Opportunities
Fund | | | Nuveen Small Cap
Select Fund | | | Nuveen Small Cap
Value Fund | | | Nuveen Tactical
Market Opportunities
Fund | |
| Net Asset Value per share | | $ | 21.25 | | | $ | 13.54 | | | $ | 12.63 | | | $ | 11.29 | |
| Per Share Sales Charge—5.75% of public offering price (6.12%, 6.13%, 6.10% and 6.11%, respectively, of net asset value per share) | | | 1.30 | | | | 0.83 | | | | 0.77 | | | | 0.69 | |
| | | | | | | | | | | | | | | | |
| Per Share Offering Price to the Public | | $ | 22.55 | | | $ | 14.37 | | | $ | 13.40 | | | $ | 11.98 | |
| | | | | | | | | | | | | | | | |
Each Fund receives the entire net asset value of all Class A shares that are sold. The Distributor retains the full applicable sales charge from which it pays the uniform reallowances shown in the Prospectus to financial intermediaries.
Reduction or Elimination of Up-Front Sales Charge on Class A Shares
Rights of Accumulation. You may qualify for a reduced sales charge on a purchase of Class A shares of a Fund if the amount of your purchase, when added to the value that day of all of your shares of any Nuveen Mutual Fund, falls within the amounts stated in the Class A Sales Charges and Commissions table in “How You Can Buy and Sell Shares” in the Prospectus. You or your financial advisor must notify the Distributor or the Fund’s transfer agent of any cumulative discount whenever you plan to purchase Class A shares of a Fund that you wish to qualify for a reduced sales charge.
Letter of Intent. You may qualify for a reduced sales charge on a purchase of Class A shares of a Fund if you plan to purchase Class A shares of Nuveen Mutual Funds over the next 13 months and the total amount of your purchases would, if purchased at one time, qualify you for one of the reduced sales charges shown in the Class A Sales Charges and Commissions table in “How You Can Buy and Sell Shares” in the Prospectus. In order to take advantage of this option, you must complete the applicable section of the Application Form or sign and deliver to your financial advisor or other financial intermediary or to the Fund’s transfer agent a written Letter of Intent in a form acceptable to the Distributor. A Letter of Intent states that you intend, but are not obligated, to purchase over the next 13 months a stated total amount of Class A shares that would qualify you for a reduced sales charge shown above. You may count shares of all Nuveen Mutual Funds that you already own and any Class C and Class I shares of a Nuveen Mutual Fund that you purchase over the next 13 months towards completion of your investment program, but you will receive a reduced sales charge only on new Class A shares you purchase with a sales charge over the 13 months. You cannot count towards completion of your investment program Class A shares that you purchase without a sales charge through investment of distributions from a Nuveen Mutual Fund or a Nuveen Defined Portfolio, or otherwise.
S-100
By establishing a Letter of Intent, you agree that your first purchase of Class A shares of a Fund following execution of the Letter of Intent will be at least 5% of the total amount of your intended purchases. You further agree that shares representing 5% of the total amount of your intended purchases will be held in escrow pending completion of these purchases. All dividends and capital gains distributions on Class A shares held in escrow will be credited to your account. If total purchases, less redemptions, prior to the expiration of the 13 month period equal or exceed the amount specified in your Letter of Intent, the Class A shares held in escrow will be transferred to your account. If the total purchases, less redemptions, are less than the amount specified, you must pay the Distributor an amount equal to the difference between the amounts paid for these purchases and the amounts which would have been paid if the higher sales charge had been applied. If you do not pay the additional amount within 20 days after written request by the Distributor or your financial advisor, the Distributor will redeem an appropriate number of your escrowed Class A shares to meet the required payment. By establishing a Letter of Intent, you irrevocably appoint the Distributor as attorney to give instructions to redeem any or all of your escrowed shares, with full power of substitution in the premises.
You or your financial advisor must notify the Distributor or the Funds’ transfer agent whenever you make a purchase of Fund shares that you wish to be covered under the Letter of Intent option.
For purposes of determining whether you qualify for a reduced sales charge as described under Rights of Accumulation and Letter of Intent, you may include together with your own purchases those made by your spouse or domestic partner and your children under the age of 21 years, whether these purchases are made through a taxable or non-taxable account. You may also include purchases made by a corporation, partnership or sole proprietorship which is 100% owned, either alone or in combination, by any of the foregoing. In addition, a trustee or other fiduciary can count all shares purchased for a single trust, estate or other single fiduciary account that has multiple accounts (including one or more employee benefit plans of the same employer).
Elimination of Sales Charge on Class A Shares. Class A shares of a Fund may be purchased at net asset value without a sales charge by the following categories of investors:
| | • | | investors purchasing $1,000,000 or more; |
| | • | | current and former trustees/directors of the Nuveen Funds; |
| | • | | full-time and retired employees and directors of Nuveen Investments, and subsidiaries thereof, or their immediate family members (immediate family members are defined as their spouses or domestic partners, parents, children, grandparents, grandchildren, parents-in-law, sons-in-law and daughters-in-law, siblings, a sibling’s spouse and a spouse’s siblings); |
| | • | | any person who, for at least the last 90 days, has been an officer, director or employee of any financial intermediary, or their immediate family members; |
| | • | | bank or broker-affiliated trust departments investing funds over which they exercise exclusive discretionary investment authority and that are held in a fiduciary, agency, advisory, custodial or similar capacity; |
| | • | | investors purchasing on a periodic fee, asset-based fee or no transaction fee basis through a broker-dealer sponsored mutual fund purchase program; |
| | • | | clients of investment advisers, financial planners or other financial intermediaries that charge periodic or asset-based fees for their services; |
| | • | | employer-sponsored retirement plans except SEPs, SAR-SEPs, SIMPLE IRAs and KEOGH plans; and |
| | • | | investors purchasing through a financial intermediary that has entered into an agreement with the Distributor to offer the Funds’ shares to self-directed investment brokerage accounts and that may or may not charge a transaction fee to its customers. |
Any Class A shares purchased pursuant to a special sales charge waiver must be acquired for investment purposes and on the condition that they will not be transferred or resold except through redemption by the Funds. You or your financial advisor must notify the Distributor or your Fund’s transfer agent whenever you make a purchase of Class A shares of any Fund that you wish to be covered under these special sales charge waivers.
S-101
Class A shares of any Fund may be issued at net asset value without a sales charge in connection with the acquisition by a Fund of another investment company. All purchases under the special sales charge waivers will be subject to minimum purchase requirements as established by the Funds.
The reduced sales charge programs may be modified or discontinued by the Funds at any time. For more information about the purchase of Class A shares or the reduced sales charge program, or to obtain the required application forms, call Nuveen Investor Services toll-free at (800) 257-8787.
Class B Shares
The applicable Funds will only issue Class B shares (i) upon the exchange of Class B shares from another Nuveen Mutual Fund and (ii) for purposes of dividend reinvestment. Class B shares are not available for new accounts or for additional investment into existing accounts.
You may be subject to a contingent deferred sales charge (“CDSC”) if you redeem your Class B shares prior to the end of the sixth year after purchase. See “Reduction or Elimination of Contingent Deferred Sales Charge” below.
Class B shares acquired through the reinvestment of dividends are not subject to a CDSC. Any CDSC will be imposed on the lower of the redeemed shares’ cost or net asset value at the time of redemption.
Class B shares will automatically convert to Class A shares eight years after purchase. The purpose of the conversion is to limit the distribution fees you pay over the life of your investment. All conversions will be done at net asset value without the imposition of any sales load, fee, or other charge, so that the value of each shareholder’s account immediately before conversion will be the same as the value of the account immediately after conversion. Class B shares acquired through reinvestment of distributions will convert into Class A shares based on the date of the initial purchase to which such shares relate. For this purpose, Class B shares acquired through reinvestment of distributions will be attributed to particular purchases of Class B shares in accordance with such procedures as the Board of Trustees may determine from time to time. Class B shares that are converted to Class A shares will remain subject to an annual service fee that is identical in amount for both Class B shares and Class A shares. Since net asset value per share of the Class B shares and the Class A shares may differ at the time of conversion, a shareholder may receive more or fewer Class A shares than the number of Class B shares converted. Any conversion of Class B shares into Class A shares will be subject to the continuing availability of an opinion of counsel or a private letter ruling from the Internal Revenue Service to the effect that the conversion of shares would not constitute a taxable event under federal income tax law. Conversion of Class B shares into Class A shares might be suspended if such an opinion or ruling were no longer available.
Class C Shares
You may purchase Class C shares at a public offering price equal to the applicable net asset value per share without any up-front sales charge. Class C shares are subject to an annual distribution fee of 0.75% to compensate the Distributor for paying your financial advisor or other financial intermediary an ongoing sales commission. Class C shares are also subject to an annual service fee of 0.25% to compensate financial intermediaries for providing you with ongoing financial advice and other account services. The Distributor compensates financial intermediaries for sales of Class C shares at the time of the sale at a rate of 1% of the amount of Class C shares purchased, which represents an advance of the first year’s distribution fee of 0.75% plus an advance on the first year’s annual service fee of 0.25%. See “Distribution and Service Plan.”
Class C share purchase orders equaling or exceeding $1,000,000 will not be accepted. In addition, purchase orders for a single purchaser that, when added to the value that day of all of such purchaser’s shares of any class of any Nuveen Mutual Fund, cause the purchaser’s cumulative total of shares in Nuveen Mutual Funds to equal or exceed the aforementioned limit will not be accepted. Purchase orders for a single purchaser equal to or exceeding the foregoing limit should be placed only for Class A shares, unless such purchase has been reviewed and approved as suitable for the client by the appropriate compliance personnel of the financial intermediary, and the Fund receives written confirmation of such approval.
S-102
Redemption of Class C shares within 12 months of purchase may be subject to a CDSC of 1% of the lower of the purchase price or redemption proceeds. Because Class C shares do not convert to Class A shares and continue to pay an annual distribution fee indefinitely, Class C shares should normally not be purchased by an investor who expects to hold shares for significantly longer than eight years.
Reduction or Elimination of Contingent Deferred Sales Charge
Class A shares are normally redeemed at net asset value, without any CDSC. However, in the case of Class A shares purchased at net asset value without a sales charge because the purchase amount exceeded $1 million, a CDSC is imposed on any redemption within 12 months of purchase. In the case of Class B shares redeemed within six years of purchase, a CDSC is imposed, beginning at 5% for redemptions within the first two years, and declining by 1% each year thereafter until disappearing after the sixth year. Class C shares are redeemed at net asset value, without any CDSC, except that a CDSC of 1% is imposed upon any redemption within 12 months of purchase (except in cases where a shareholder is eligible for a waiver).
In determining whether a CDSC is payable, each Fund will first redeem shares not subject to any charge and then will redeem shares held for the longest period, unless the shareholder specifies another order. No CDSC is charged on shares purchased as a result of automatic reinvestment of dividends or capital gains paid. In addition, no CDSC will be charged on exchanges of shares into another Nuveen Mutual Fund. The holding period is calculated on a monthly basis and begins on the first day of the month in which the purchase was made. The CDSC is assessed on an amount equal to the lower of the then current market value or the cost of the shares being redeemed. Accordingly, no sales charge is imposed on increases of net asset value above the initial purchase price. The Distributor receives the amount of any CDSC shareholders pay.
The CDSC may be waived or reduced under the following circumstances: (i) in the event of total disability (as evidenced by a determination by the federal Social Security Administration) of the shareholder (including a registered joint owner) occurring after the purchase of the shares being redeemed; (ii) in the event of the death of the shareholder (including a registered joint owner); (iii) for redemptions made pursuant to a systematic withdrawal plan, up to 1% monthly, 3% quarterly, 6% semiannually or 12% annually of an account’s net asset value depending on the frequency of the plan as designated by the shareholder; (iv) involuntary redemptions caused by operation of law; (v) redemptions in connection with a payment of account or plan fees; (vi) redemptions in connection with the exercise of a reinstatement privilege whereby the proceeds of a redemption of a Fund’s shares subject to a sales charge are reinvested in shares of certain Funds within a specified number of days; (vii) redemptions in connection with the exercise of a Fund’s right to redeem all shares in an account that does not maintain a certain minimum balance or that the Board of Directors has determined may have material adverse consequences to the shareholders of a Fund; (viii) in whole or in part for redemptions of shares by shareholders with accounts in excess of specified breakpoints that correspond to the breakpoints under which the up-front sales charge on Class A shares is reduced pursuant to Rule 22d-1 under the Act; (ix) redemptions of shares purchased under circumstances or by a category of investors for which Class A shares could be purchased at net asset value without a sales charge; (x) redemptions of Class A, Class B or Class C shares if the proceeds are transferred to an account managed by the Adviser and the Adviser refunds the advanced service and distribution fees to the Distributor; (xi) redemptions of Class C shares in cases where the Distributor did not advance the first year’s service and distribution fees when such shares were purchased; and (xii) redemptions of Class A shares where the Distributor did not pay a sales commission when such shares were purchased. If a Fund waives or reduces the CDSC, such waiver or reduction would be uniformly applied to all Fund shares in the particular category. In waiving or reducing a CDSC, the Funds will comply with the requirements of Rule 22d-1 under the 1940 Act.
In addition, the CDSC will be waived in connection with the following redemptions of shares held by an employer-sponsored qualified defined contribution retirement plan: (i) partial or complete redemptions in connection with a distribution without penalty under Section 72(t) of the Code from a retirement plan: (a) upon attaining age 59 1/2, (b) as part of a series of substantially equal periodic payments, or (c) upon separation from service and attaining age 55; (ii) partial or complete redemptions in connection with a qualifying loan or hardship withdrawal; (iii) complete redemptions in
S-103
connection with termination of employment, plan termination or transfer to another employer’s plan or IRA; and (iv) redemptions resulting from the return of an excess contribution. The CDSC will also be waived in connection with the following redemptions of shares held in an IRA account: (i) for redemptions made pursuant to an IRA systematic withdrawal based on the shareholder’s life expectancy including, but not limited to, substantially equal periodic payments described in Code Section 72(t)(A)(iv) prior to age 59 1/2; and (ii) for redemptions to satisfy required minimum distributions after age 70 1/2 from an IRA account (with the maximum amount subject to this waiver being based only upon the shareholder’s Nuveen IRA accounts).
Class R3 Shares
Class R3 shares are available for purchase at the offering price, which is the net asset value per share without any up-front sales charge, from the applicable Funds. Class R3 shares are subject to annual distribution and service fees of 0.50% of the Funds’ average daily net assets. The annual 0.25% service fee compensates your financial advisor or other financial intermediary for providing ongoing service to you. The annual 0.25% distribution fee compensates the Distributor for paying your financial advisor or other financial intermediary an ongoing sales commission.
Class R3 shares are only available for purchase by eligible retirement plans. Eligible retirement plans include, but are not limited to, 401(k) plans, 457 plans, employer-sponsored 403(b) plans, profit sharing and money purchase pension plans, defined benefit plans, non-qualified deferred compensation plans and health care benefit funding plans. In addition, Class R3 shares are available only to retirement plans where Class R3 shares are held on the books of the Funds through omnibus accounts (either at the retirement plan level or at the level of the retirement plan’s financial intermediary). Class R3 shares are not available to traditional and Roth IRAs, Coverdell Education Savings Accounts, SEPs, SAR-SEPs, SIMPLE IRAs or individual 403(b) plans.
The administrator of a retirement plan or employee benefits office can provide plan participants with detailed information on how to participate in the retirement plan and how to elect a Fund as an investment option. Retirement plan participants may be permitted to elect different investment options, alter the amounts contributed to the retirement plan, or change how contributions are allocated among investment options in accordance with the retirement plan’s specific provisions. The retirement plan administrator or employee benefits office should be consulted for details. For questions about their accounts, participants should contact their employee benefits office, the retirement plan administrator, or the organization that provides recordkeeping services for the retirement plan.
Eligible retirement plans may open an account and purchase Class R3 shares directly from the Funds or by contacting any financial intermediary authorized to sell Class R3 shares of the Funds. Financial intermediaries may provide or arrange for the provision of some or all of the shareholder servicing and account maintenance services required by retirement plan accounts and their retirement plan participants, including, without limitation, transfers of registration and dividend payee changes.
Financial intermediaries may also perform other functions, including generating confirmation statements, and may arrange with retirement plan administrators for other investment or administrative services. Financial intermediaries may independently establish and charge retirement plans and retirement plan participants transaction fees and/or other additional amounts for such services, which may change over time. Similarly, retirement plans may charge retirement plan participants for certain expenses. These fees and additional amounts could reduce investment returns in Class R3 shares of the Funds.
Financial intermediaries and retirement plans may have omnibus accounts and similar arrangements with a Fund and may be paid for providing shareholder servicing and other services. A financial intermediary or retirement plan may be paid for its services directly or indirectly by the Funds or the Distributor. The Distributor may pay a financial intermediary an additional amount for sub-transfer agency or other administrative services. Such sub-transfer agency or other administrative services may include, but are not limited to, the following: processing and mailing trade confirmations, monthly statements, prospectuses, annual reports, semiannual reports and shareholder notices and other required communications; capturing and processing tax data; issuing and mailing dividend checks to shareholders who have selected cash distributions; preparing record date
S-104
shareholder lists for proxy solicitations; collecting and posting distributions to shareholder accounts; and establishing and maintaining systematic withdrawals, automated investment plans and shareholder account registrations. Your retirement plan may establish various minimum investment requirements for Class R3 shares of the Funds and may also establish certain privileges with respect to purchases, redemptions and exchanges of Class R3 shares or the reinvestment of dividends. Retirement plan participants should contact their retirement plan administrator with respect to these issues. This SAI should be read in conjunction with the retirement plan’s and/or the financial intermediary’s materials regarding their fees and services.
Class R6 shares
Class R6 shares are available from the applicable Funds to the following classes of investors, provided they meet the minimum investment and other eligibility requirements set forth below:
| | • | | Qualified retirement plans, including: 401(k) plans, employer sponsored 403(b) plans, profit sharing pension plans, money purchase pension plans, target benefit plans, defined benefit pension plans and Taft Hartley multi-employer pension plans (collectively, “Qualified Plans”); |
| | • | | Foundations and endowment funds; |
| | • | | Any state, county, or city, or its instrumentality, department, authority or agency; |
| | • | | 457 plans, including 457(b) governmental entity plans and tax exempt plans; |
| | • | | Omnibus or other pooled accounts registered to insurance companies, trust companies, bank trust departments, registered investment advisor firms and family offices; |
| | • | | Investment companies, both affiliated and not affiliated with the Adviser; |
| | • | | Corporations, including corporate non-qualified deferred compensation plans of such corporations; |
| | • | | Collective investment trusts; |
| | • | | Discretionary accounts managed by the Advisor or its affiliates; and |
| | • | | 529 savings plans held in plan-level omnibus accounts. |
There is no minimum initial investment for qualified retirement plans; however, the shares must be held through plan-level or omnibus accounts held on the books of the Funds. All other eligible investors must meet a minimum initial investment of at least $5 million in each Fund in which they invest. Class R6 shares are only available through financial intermediaries that have entered into an agreement with the Distributor to offer Class R6 shares. Class R6 shares are only available in cases where neither the investor nor the intermediary will receive any commission payments, account servicing fees, record keeping fees, 12b-1 fees, sub-transfer agent fees, so called “finder’s fees,” administration fees or similar fees with respect to Class R6 shares. Class R6 shares are not available directly to traditional or Roth IRAs, Coverdell Savings Accounts, Keoghs, SEPs, SARSEPs, or SIMPLE IRAs. Class R6 shares also are not available through retail, advisory fee-based wrap platforms.
Class I Shares
Class I shares are available for purchase by clients of financial intermediaries who charge such clients an ongoing fee for advisory, investment, consulting or related services. Such clients may include individuals, corporations, endowments and foundations. The minimum initial investment for such clients is $100,000, but this minimum will be lowered to $250 for clients of financial intermediaries that have accounts holding Class I shares with an aggregate value of at least $100,000. The Distributor may also lower the minimum to $250 for clients of financial intermediaries anticipated to reach this Class I share holdings level.
Class I shares are also available for purchase by family offices and their clients. A family office is a company that provides certain financial and other services to a high net worth family or families. The minimum initial investment for family offices and their clients is $100,000, but this minimum will be lowered to $250 for clients of family offices that have accounts holding Class I shares with an aggregate value of at least $100,000. The Distributor may also lower the minimum to $250 for clients of family offices anticipated to reach this Class I share holdings level.
S-105
Class I shares also are available for purchase, with no minimum initial investment, by the following categories of investors:
| | • | | employer-sponsored retirement plans, except SEPs, SAR-SEPs, SIMPLE IRAs and KEOGH plans; |
| | • | | bank or broker-affiliated trust departments investing funds over which they exercise exclusive discretionary investment authority and that are held in a fiduciary, agency, advisory, custodial or similar capacity; |
| | • | | advisory accounts of Nuveen Fund Advisors and its affiliates, including other Nuveen Mutual Funds whose investment policies permit investments in other investment companies; |
| | • | | any registered investment company that is not affiliated with the Nuveen Funds and which invests in securities of other investment companies; |
| | • | | any plan organized under section 529 under the Code (i.e., a 529 plan); |
| | • | | current and former trustees/directors of any Nuveen Fund, and their immediate family members (“immediate family members” are defined as spouses or domestic partners, parents, children, grandparents, grandchildren, parents-in-law, sons-in-law and daughters-in-law, siblings, a sibling’s spouse and a spouse’s siblings); |
| | • | | officers, directors and former directors of Nuveen Investments and its affiliates, and their immediate family members; |
| | • | | full-time and retired employees of Nuveen Investments and its affiliates, and their immediate family members; and |
| | • | | any person who, for at least the last 90 days, has been an officer, director or employee of any financial intermediary, and their immediate family members. |
Any shares purchased by investors falling within any of the last four categories listed above must be acquired for investment purposes and on the condition that they will not be transferred or resold except through redemption by a Fund.
Holders of Class I shares may purchase additional Class I shares using dividends and capital gains distributions on their shares.
If you are eligible to purchase either Class I shares or Class A shares without a sales charge at net asset value, you should be aware of the differences between these two classes of shares. Class A shares are subject to an annual service fee to compensate financial intermediaries for providing you with ongoing account services. Class I shares are not subject to a distribution or service fee and, consequently, holders of Class I shares may not receive the same types or levels of services from financial intermediaries. In choosing between Class A shares and Class I shares, you should weigh the benefits of the services to be provided by financial intermediaries against the annual service fee imposed upon the Class A shares.
Shareholder Programs
Exchange Privilege
You may exchange Fund shares into an identically registered account for the same class of another Nuveen Mutual Fund available in your state. Your exchange must meet the minimum purchase requirements of the fund into which you are exchanging. You may also, under certain limited circumstances, exchange between certain classes of shares of the same Fund. An exchange between classes of shares of the same Fund may not be considered a taxable event; please consult your own tax advisor for further information.
If you hold your shares directly with a Fund, you may exchange your shares by either sending a written request to the applicable Fund, c/o Nuveen Investor Services, P.O. Box 8530, Boston, Massachusetts 02266-8530 or by calling Nuveen Investor Services toll free at (800) 257-8787.
If you exchange shares between different Nuveen Mutual Funds and your shares are subject to a CDSC, no CDSC will be charged at the time of the exchange. However, if you subsequently redeem
S-106
the shares acquired through the exchange, the redemption may be subject to a CDSC, depending on when you purchased your original shares and the CDSC schedule of the fund from which you exchanged your shares. If you exchange between classes of shares of the same Fund and your original shares are subject to a CDSC, the CDSC will be assessed at the time of the exchange.
For federal income tax purposes, an exchange between different Nuveen Mutual Funds constitutes a sale and purchase of shares and may result in capital gain or loss. Before making any exchange, you should obtain the Prospectus for the Nuveen Mutual Fund you are purchasing and read it carefully. If the registration of the account for the Fund you are purchasing is not exactly the same as that of the fund account from which the exchange is made, written instructions from all holders of the account from which the exchange is being made must be received, with signatures guaranteed by a member of an approved Medallion Signature Guarantee Program or in such other manner as may be acceptable to the Fund. You may also exchange shares by telephone if you authorize telephone exchanges by checking the applicable box on the Application Form or by calling Nuveen Investor Services toll-free at (800) 257-8787 to obtain an authorization form. Each Fund reserves the right to revise or suspend the exchange privilege, limit the amount or number of exchanges, or reject any exchange. Shareholders will be provided with at least 60 days’ notice of any material revision to or termination of the exchange privilege.
The exchange privilege is not intended to permit a Fund to be used as a vehicle for short-term trading. Excessive exchange activity may interfere with portfolio management, raise expenses and otherwise have an adverse effect on all shareholders. In order to limit excessive exchange activity and in other circumstances where Fund management believes doing so would be in the best interest of the Fund, each Fund reserves the right to revise or terminate the exchange privilege, or limit the amount or number of exchanges or reject any exchange. Shareholders would be notified of any such action to the extent required by law. See “Frequent Trading Policy” below.
Reinstatement Privilege
If you redeemed Class A or Class C shares of a Fund or any other Nuveen Mutual Fund that were subject to a sales charge or a CDSC, you have up to one year to reinvest all or part of the full amount of the redemption in the same class of shares of the Fund at net asset value. The reinstatement privilege for Class B shares is no longer available. This reinstatement privilege can be exercised only once for any redemption, and reinvestment will be made at the net asset value next calculated after reinstatement of the appropriate class of Fund shares. If you reinstate shares that were subject to a CDSC, your holding period as of the redemption date also will be reinstated for purposes of calculating a CDSC and the CDSC paid at redemption will be refunded. The federal income tax consequences of any capital gain realized on a redemption will not be affected by reinstatement, but a capital loss may be disallowed in whole or in part depending on the timing, the amount of the reinvestment and the fund from which the redemption occurred.
Suspension of Right of Redemption
Each Fund may suspend the right of redemption of Fund shares or delay payment more than seven days (a) during any period when the New York Stock Exchange (the “NYSE”) is closed (other than customary weekend and holiday closings), (b) when trading in the markets the Fund normally utilizes is restricted or an emergency exists as determined by the SEC so that trading of the Fund’s investments or determination of its net asset value is not reasonably practicable, or (c) for any other periods that the SEC by order may permit for protection of Fund shareholders.
Redemption In-Kind
The Funds have reserved the right to redeem in-kind (that is, to pay redemption requests in cash and portfolio securities, or wholly in portfolio securities). The Funds voluntarily have committed to pay in cash all requests for redemption by any shareholder, limited as to each shareholder during any 90-day period to the lesser of $250,000 or 1% of the net asset value of a Fund at the beginning of the 90-day period.
S-107
Frequent Trading Policy
The Funds’ Frequent Trading Policy is as follows:
Nuveen Mutual Funds are intended as long-term investments and not as short-term trading vehicles. At the same time, the Funds recognize the need of investors to periodically make purchases and redemptions of Fund shares when rebalancing their portfolios and as their financial needs or circumstances change. Nuveen Mutual Funds have adopted the following Frequent Trading Policy that seeks to balance these needs against the potential for higher operating costs, portfolio management disruption and other inefficiencies that can be caused by excessive trading of Fund shares.
1. Definition of Round Trip
A Round Trip trade is the purchase and subsequent redemption of Fund shares, including by exchange. Each side of a Round Trip trade may be comprised of either a single transaction or a series of closely-spaced transactions.
2. Round Trip Trade Limitations
Nuveen Mutual Funds limit the frequency of Round Trip trades that may be placed in a Fund. Subject to certain exceptions noted below, the Funds limit an investor to two Round Trips per trailing 60-day period.
3. Enforcement
Trades placed in violation of the foregoing policies are subject to rejection or cancellation by Nuveen Mutual Funds. Nuveen Mutual Funds may also bar an investor (and/or the investor’s financial advisor) who has violated these policies from opening new accounts with the Funds and may restrict the investor’s existing account(s) to redemptions only. Nuveen Mutual Funds reserve the right, in their sole discretion, to (a) interpret the terms and application of these policies, (b) waive unintentional or minor violations (including transactions below certain dollar thresholds) if Nuveen Mutual Funds determine that doing so does not harm the interests of Fund shareholders, and (c) exclude certain classes of redemptions from the application of the trading restrictions set forth above.
Nuveen Mutual Funds reserve the right to impose restrictions on purchases or exchanges that are more restrictive than those stated above if they determine, in their sole discretion, that a proposed transaction or series of transactions involve market timing or excessive trading that is likely to be detrimental to the Funds. The Funds may also modify or suspend the Frequent Trading Policy without notice during periods of market stress or other unusual circumstances.
The ability of Nuveen Mutual Funds to implement the Frequent Trading Policy for omnibus accounts at certain financial intermediaries may be dependent on receiving from those intermediaries sufficient shareholder information to permit monitoring of trade activity and enforcement of the Funds’ Frequent Trading Policy. In addition, the Funds may rely on a financial intermediary’s policy to restrict market timing and excessive trading if the Funds believe that the policy is reasonably designed to prevent market timing that is detrimental to the Funds. Such policy may be more or less restrictive than the Funds’ Policy. The Funds cannot ensure that these financial intermediaries will in all cases apply the Funds’ policy or their own policies, as the case may be, to accounts under their control.
Exclusions from the Frequent Trading Policy
As stated above, certain redemptions are eligible for exclusion from the Frequent Trading Policy, including: (i) redemptions or exchanges by shareholders investing through the fee-based platforms of certain financial intermediaries (where the intermediary charges an asset-based or comprehensive “wrap” fee for its services) that are effected by the financial intermediaries in connection with systematic portfolio rebalancing; (ii) when there is a verified trade error correction, which occurs when a dealer firm sends a trade to correct an earlier trade made in error and then the firm sends an explanation to the Nuveen Mutual Funds confirming that the trade is actually an error correction; (iii) in the event of total disability (as evidenced by a determination by the federal Social Security Administration) of the shareholder (including a registered joint owner) occurring after the purchase of the shares being redeemed; (iv) in the event of the death of the shareholder (including a registered
S-108
joint owner); (v) redemptions made pursuant to a systematic withdrawal plan, up to 1% monthly, 3% quarterly, 6% semiannually or 12% annually of an account’s net asset value depending on the frequency of the plan as designated by the shareholder; (vi) redemptions of shares that were purchased through a systematic investment program; (vii) involuntary redemptions caused by operation of law; (viii) redemptions in connection with a payment of account or plan fees; (ix) redemptions or exchanges by any “fund of funds” advised by the Adviser; and (x) redemptions in connection with the exercise of a Fund’s right to redeem all shares in an account that does not maintain a certain minimum balance or that the board has determined may have material adverse consequences to the shareholders of a Fund.
In addition, the following redemptions of shares by an employer-sponsored qualified defined contribution retirement plan are excluded from the Frequent Trading Policy: (i) partial or complete redemptions in connection with a distribution without penalty under Section 72(t) of the Code from a retirement plan: (a) upon attaining age 59 1/2; (b) as part of a series of substantially equal periodic payments; or (c) upon separation from service and attaining age 55; (ii) partial or complete redemptions in connection with a qualifying loan or hardship withdrawal; (iii) complete redemptions in connection with termination of employment, plan termination, transfer to another employer’s plan or IRA or changes in a plan’s recordkeeper; and (iv) redemptions resulting from the return of an excess contribution. Also, the following redemptions of shares held in an IRA account are excluded from the application of the Frequent Trading Policy: (i) redemptions made pursuant to an IRA systematic withdrawal based on the shareholder’s life expectancy including, but not limited to, substantially equal periodic payments described in Code Section 72(t)(A)(iv) prior to age 59 1/2; and (ii) redemptions to satisfy required minimum distributions after age 70 1/2 from an IRA account.
Distribution and Service Plan
NIF has adopted a Distribution and Service Plan with respect to the Class A, Class B, Class C and Class R3 shares of the Funds pursuant to Rule 12b-1 under the 1940 Act (the “Plan”). Rule 12b-1 provides in substance that a mutual fund may not engage directly or indirectly in financing any activity which is primarily intended to result in the sale of shares, except pursuant to a plan adopted under the Rule. The Plan authorizes the Funds to pay the Distributor distribution and/or shareholder servicing fees on the Funds’ Class A, Class B, Class C and Class R3 shares as described below. The distribution fees under the Plan are used for primary purpose of compensating participating intermediaries for their sales of the Funds. The shareholder servicing fees are used primarily for the purpose of providing compensation for the ongoing servicing and/or maintenance of shareholder accounts.
The Class A shares pay to the Distributor a shareholder servicing fee at an annual rate of 0.25% of the average daily net assets of the Class A shares. The fee may be used by the Distributor to provide compensation for shareholder servicing activities with respect to the Class A shares. The shareholder servicing fee is intended to compensate the Distributor for ongoing servicing and/or maintenance of shareholder accounts and may be used by the Distributor to provide compensation to participating intermediaries through whom shareholders hold their shares for ongoing servicing and/or maintenance of shareholder accounts. This fee is calculated and paid each month based on average daily net assets of Class A shares of each Fund for that month.
The Class B shares pay to the Distributor a shareholder servicing fee at the annual rate of 0.25% of the average daily net assets of the Class B shares. The fee may be used by the Distributor to provide compensation for shareholder servicing activities with respect to the Class B shares beginning one year after purchase. The Class B shares also pay to the Distributor a distribution fee at the annual rate of 0.75% of the average daily net assets of the Class B shares. The distribution fee is intended to compensate the Distributor for advancing a commission to participating intermediaries purchasing Class B shares.
The Class C shares pay to the Distributor a shareholder servicing fee at the annual rate of 0.25% of the average daily net assets of the Class C shares. The fee may be used by the Distributor to provide compensation for shareholder servicing activities with respect to the Class C shares. This fee is calculated and paid each month based on average daily net assets of the Class C shares. The Class C shares pay to the Distributor a distribution fee at the annual rate of 0.75% of the average daily net assets of the Class C shares. The Distributor may use the distribution fee to provide compensation to participating intermediaries through which shareholders hold their shares beginning one year after purchase.
S-109
The Class R3 shares pay to the Distributor a shareholder servicing fee at the annual rate of 0.25% of the average daily net assets of the Class R3 shares. The fee may be used by the Distributor to provide compensation for shareholder servicing activities with respect to the Class R3 shares. This fee is calculated and paid each month based on average daily net assets of the Class R3 shares. The Class R3 shares also pay to the Distributor a distribution fee at the annual rate of 0.25% of the average daily net assets of Class R3 shares. The fee may be used by the Distributor to provide initial and ongoing sales compensation to its investment executives and to participating intermediaries in connection with sales of Class R3 shares and to pay for advertising and other promotional expenses in connection with the distribution of Class R3 shares. This fee is calculated and paid each month based on average daily net assets of the Class R3 shares.
The Distributor receives no compensation for distribution of the Class R6 or Class I shares.
The Plan is a “compensation-type” plan under which the Distributor is entitled to receive the distribution and shareholder servicing fees regardless of whether its actual distribution and shareholder servicing expenses are more or less than the amount of the fees. It is therefore possible that the Distributor may realize a profit in a particular year as a result of these payments. The Plan recognizes that the Distributor and the Adviser, in their discretion, may from time to time use their own assets to pay for certain additional costs of distributing Class A, Class B, Class C and Class R3 shares. Any such arrangements to pay such additional costs may be commenced or discontinued by the Distributor or the Adviser at any time. With the exception of the Distributor and its affiliates, no “interested person” of NIF, as that term is defined in the 1940 Act, and no director of NIF has a direct or indirect financial interest in the operation of the Plan or any related agreement.
Under the Plan, the Funds’ Treasurer reports the amounts expended under the Plan and the purposes for which such expenditures were made to the Board of Directors for their review on a quarterly basis. The Plan provides that it will continue in effect for a period of more than one year from the date of its execution only so long as such continuance is specifically approved at least annually by the vote of a majority of the Board members of NIF and by the vote of the majority of those Board members of NIF who are not “interested persons” (as that term is defined in the 1940 Act) of NIF and who have no direct or indirect financial interest in the operation of the Plan or in any agreement related to such plan.
The Funds paid the following 12b-1 fees to the Distributor for the fiscal year ended October 31, 2012 with respect to the Class A shares, Class B shares, Class C shares and Class R3 shares of the Funds. As noted above, no 12b-1 fees are paid with respect to Class R6 or Class I shares.
| | | | |
Fund | | 12b-1 Fees
Incurred by
each Fund for
the Fiscal Year Ended
October 31, 2012 | |
Nuveen Dividend Value Fund | | | | |
Class A | | $ | 518,426 | |
Class B | | | 21,229 | |
Class C | | | 239,263 | |
Class R3 | | | 81,368 | |
| |
Nuveen Equity Index Fund | | | | |
Class A | | | 333,032 | |
Class B | | | 32,762 | |
Class C | | | 82,583 | |
Class R3 | | | 127,510 | |
| |
Nuveen International Fund | | | | |
Class A | | | 53,238 | |
Class C | | | 17,250 | |
Class R3 | | | 181 | |
S-110
| | | | |
Fund | | 12b-1 Fees
Incurred by
each Fund for
the Fiscal Year Ended
October 31, 2012 | |
Nuveen International Select Fund | | | | |
Class A | | $ | 10,118 | |
Class C | | | 6,834 | |
| |
Nuveen Large Cap Growth Opportunities Fund | | | | |
Class A | | | 283,170 | |
Class B | | | 18,905 | |
Class C | | | 102,167 | |
Class R3 | | | 37,298 | |
| |
Nuveen Large Cap Select Fund | | | | |
Class A | | | 7,413 | |
Class C | | | 1,819 | |
| |
Nuveen Mid Cap Growth Opportunities Fund | | | | |
Class A | | | 756,831 | |
Class B | | | 33,040 | |
Class C | | | 164,638 | |
Class R3 | | | 192,925 | |
| |
Nuveen Mid Cap Index Fund | | | | |
Class A | | | 229,762 | |
Class C | | | 40,193 | |
Class R3 | | | 466,134 | |
| |
Nuveen Mid Cap Select Fund | | | | |
Class A | | | 27,995 | |
Class C | | | 17,480 | |
| |
Nuveen Mid Cap Value Fund | | | | |
Class A | | | 104,179 | |
Class B | | | 17,998 | |
Class C | | | 85,681 | |
Class R3 | | | 61,265 | |
| |
Nuveen Quantitative Enhanced Core Equity Fund | | | | |
Class A | | | 343 | |
Class C | | | 1,164 | |
| |
Nuveen Small Cap Growth Opportunities Fund | | | | |
Class A | | | 93,790 | |
Class B | | | 10,515 | |
Class C | | | 16,189 | |
Class R3 | | | 12,466 | |
| |
Nuveen Small Cap Index Fund | | | | |
Class A | | | 62,312 | |
Class C | | | 12,759 | |
Class R3 | | | 83,519 | |
| |
Nuveen Small Cap Select Fund | | | | |
Class A | | | 521,432 | |
Class B | | | 24,850 | |
Class C | | | 121,924 | |
Class R3 | | | 96,427 | |
S-111
| | | | |
Fund | | 12b-1 Fees
Incurred by
each Fund for
the Fiscal Year Ended
October 31, 2012 | |
Nuveen Small Cap Value Fund | | | | |
Class A | | $ | 81,707 | |
Class C | | | 14,717 | |
Class R3 | | | 12,320 | |
| |
Nuveen Tactical Market Opportunities Fund | | | | |
Class A | | | 97,281 | |
Class C | | | 79,873 | |
If a Fund closes to new investors, it may continue to make payments under the Plan. Such payments would be made for the various services provided to existing shareholders by the Participating Intermediaries receiving such payments.
General Matters
The Funds have authorized one or more brokers to accept on their behalf purchase and redemption orders. Such brokers are authorized to designate other intermediaries to accept purchase and redemption orders on the Funds’ behalf. The Funds will be deemed to have received a purchase or redemption order when an authorized broker or, if applicable, a broker’s authorized designee accepts the order. Customer orders received by such broker (or their designee) will be priced at the applicable Fund’s net asset value next computed after they are accepted by an authorized broker (or their designee). Orders accepted by an authorized broker (or their designee) before the close of regular trading on the NYSE will receive that day’s share price; orders accepted after the close of trading will receive the next business day’s share price.
If you choose to invest in a Fund, an account will be opened and maintained for you by BFDS, the Funds’ shareholder services agent. Shares will be registered in the name of the investor or the investor’s financial advisor. A change in registration or transfer of shares held in the name of a financial advisor may only be made by an order in good standing form from the financial advisor acting on the investor’s behalf. Each Fund reserves the right to reject any purchase order and to waive or increase minimum investment requirements.
The Funds do not issue share certificates. For certificated shares previously issued, a fee of 1% of the current market value will be charged if the certificate is lost, stolen or destroyed. The fee is paid to Seaboard Surety Company for insurance of the lost, stolen or destroyed certificate.
Distribution Arrangements
The Distributor sells shares to or through brokers, dealers, banks or other qualified financial intermediaries (collectively referred to as “Dealers”), or others, in a manner consistent with the then effective registration statement of NIF. Pursuant to the Distribution Agreement, the Distributor, at its own expense, finances certain activities incident to the sale and distribution of the Funds’ shares, including printing and distributing of prospectuses and statements of additional information to other than existing shareholders, the printing and distributing of sales literature, advertising and payment of compensation and giving of concessions to Dealers.
The Distributor receives for its services the excess, if any, of the sales price of a Fund’s shares less the net asset value of those shares, and reallows a majority or all of such amounts to the Dealers who sold the shares. The Distributor also receives distribution fees pursuant to a distribution plan adopted by NIF pursuant to Rule 12b-1 and described herein under “Distribution and Service Plan.” The Distributor also receives any CDSCs imposed on redemptions of shares, but any amounts as to which a reinstatement privilege is not exercised are set off against and reduce amounts otherwise payable to the Distributor pursuant to the distribution plan. The Distributor may also act as a Dealer.
S-112
The following tables set forth the amount of underwriting commissions paid by the Funds, the amount of such commissions retained by the Distributor, and the amount of compensation on redemptions and repurchases for the period from January 1, 2011 through October 31, 2011 and the fiscal year ended October 31, 2012:
| | | | | | | | | | | | | | | | | | | | | | | | |
| | | Total Underwriting
Commissions | | | Underwriting Commissions
Retained by Distributor | | | Compensation on
Redemptions and
Repurchases | |
Fund | | January 1,
2011
through
October 31,
2011 | | | Fiscal
Year Ended
October 31,
2012 | | | January 1,
2011
through
October 31,
2011 | | | Fiscal
Year Ended
October 31,
2012 | | | January 1,
2011
through
October 31,
2011 | | | Fiscal
Year Ended
October 31,
2012 | |
Nuveen Dividend Value Fund | | $ | 263,178 | | | $ | 391,945 | | | $ | 27,081 | | | $ | 47,493 | | | $ | 7,857 | | | $ | 9,522 | |
Nuveen Equity Index Fund | | | 2,327 | | | | — | | | | 207 | | | | — | | | | 5,314 | | | | 2,679 | |
Nuveen International Fund | | | 9,426 | | | | 15,113 | | | | 1,186 | | | | 1,905 | | | | 1,785 | | | | 677 | |
Nuveen International Select Fund | | | 4,245 | | | | 4,563 | | | | 468 | | | | 574 | | | | 800 | | | | 163 | |
Nuveen Large Cap Growth Opportunities Fund | | | 104,580 | | | | 137,319 | | | | 11,739 | | | | 15,708 | | | | 2,571 | | | | 3,640 | |
Nuveen Large Cap Select Fund | | | 3,488 | | | | 2,242 | | | | 392 | | | | 285 | | | | — | | | | 246 | |
Nuveen Mid Cap Growth Opportunities Fund | | | 139,136 | | | | 142,215 | | | | 14,775 | | | | 16,148 | | | | 7,619 | | | | 6,120 | |
Nuveen Mid Cap Index Fund | | | 3,746 | | | | — | | | | 365 | | | | — | | | | 913 | | | | 608 | |
Nuveen Mid Cap Select Fund | | | 12,218 | | | | 7,845 | | | | 1,536 | | | | 990 | | | | 1,002 | | | | 459 | |
Nuveen Mid Cap Value Fund | | | 26,857 | | | | 14,637 | | | | 3,440 | | | | 1,719 | | | | 4,689 | | | | 1,115 | |
Nuveen Quantitative Enhanced Core Equity Fund | | | — | | | | — | | | | — | | | | — | | | | 45 | | | | — | |
Nuveen Small Cap Growth Opportunities Fund | | | 21,969 | | | | 31,623 | | | | 3,005 | | | | 3,974 | | | | 461 | | | | 352 | |
Nuveen Small Cap Index Fund | | | 135 | | | | — | | | | 11 | | | | — | | | | 75 | | | | — | |
Nuveen Small Cap Select Fund | | | 69,811 | | | | 35,204 | | | | 8,448 | | | | 4,439 | | | | 3,421 | | | | 2,500 | |
Nuveen Small Cap Value Fund | | | 12,003 | | | | 16,525 | | | | 1,534 | | | | 2,133 | | | | 557 | | | | 505 | |
Nuveen Tactical Market Opportunities Fund | | | 6,683 | | | | 232,532 | | | | 829 | | | | 27,907 | | | | — | | | | 1,781 | |
S-113
Prior to the Transaction, Quasar Distributors, LLC (“Quasar”) 615 East Michigan Street, Milwaukee, WI 53202, served as the distributor for the Funds’ shares pursuant to a Distribution Agreement dated July 1, 2007 (the “Quasar Distribution Agreement”). Quasar is a wholly-owned subsidiary of U.S. Bancorp.
The following tables set forth the amount of underwriting commissions paid by the Funds, the amount of such commissions retained by Quasar and the amount of compensation on redemptions and repurchases during the fiscal year ended October 31, 2010 and for the period from November 1, 2010 through December 31, 2010:
| | | | | | | | |
| | | Total Underwriting Commissions | |
Fund | | Fiscal Year Ended
October 31, 2010 | | | November 1, 2010 through
December 31, 2010 | |
| Nuveen Dividend Value Fund | | $ | 272,650 | | | $ | 35,234 | |
| Nuveen Equity Index Fund | | | 74,903 | | | | 13,485 | |
| Nuveen International Fund | | | 15,999 | | | | 1,485 | |
| Nuveen International Select Fund | | | 30,613 | | | | 1,811 | |
Nuveen Large Cap Growth Opportunities Fund | | | 41,641 | | | | 13,043 | |
| Nuveen Large Cap Select Fund | | | 10,545 | | | | 2,741 | |
| Nuveen Mid Cap Growth Opportunities Fund | | | 79,356 | | | | 34,013 | |
| Nuveen Mid Cap Index Fund | | | 57,832 | | | | 7,179 | |
| Nuveen Mid Cap Select Fund | | | 11,733 | | | | 1,539 | |
| Nuveen Mid Cap Value Fund | | | 20,512 | | | | 2,333 | |
Nuveen Quantitative Enhanced Core Equity Fund | | | — | | | | — | |
Nuveen Small Cap Growth Opportunities Fund | | | 45,684 | | | | 2,836 | |
| Nuveen Small Cap Index Fund | | | 8,327 | | | | 1,458 | |
| Nuveen Small Cap Select Fund | | | 69,953 | | | | 5,764 | |
| Nuveen Small Cap Value Fund | | | 9,098 | | | | 3,104 | |
| Nuveen Tactical Market Opportunities Fund 1 | | | — | | | | — | |
| 1 | | Commenced operations on December 30, 2009. |
| | | | | | | | |
| | | Underwriting Commissions
Retained by Quasar | |
Fund | | Fiscal Year Ended
October 31, 2010 | | | November 1, 2010 through
December 31, 2010 | |
| Nuveen Dividend Value Fund | | $ | 27,122 | | | $ | 3,199 | |
| Nuveen Equity Index Fund | | | 9,703 | | | | 1,143 | |
| Nuveen International Fund | | | 2,174 | | | | 135 | |
Nuveen International Select Fund | | | 3,005 | | | | 154 | |
Nuveen Large Cap Growth Opportunities Fund | | | 5,463 | | | | 1,183 | |
Nuveen Large Cap Select Fund | | | 1,164 | | | | 256 | |
Nuveen Mid Cap Growth Opportunities Fund | | | 11,462 | | | | 3,152 | |
Nuveen Mid Cap Index Fund | | | 5,504 | | | | 681 | |
Nuveen Mid Cap Select Fund | | | 1,897 | | | | 133 | |
Nuveen Mid Cap Value Fund | | | 2,326 | | | | 234 | |
Nuveen Quantitative Enhanced Core Equity Fund | | | — | | | | — | |
Nuveen Small Cap Growth Opportunities Fund | | | 4,983 | | | | 269 | |
Nuveen Small Cap Index Fund | | | 889 | | | | 126 | |
Nuveen Small Cap Select Fund | | | 7,825 | | | | 519 | |
Nuveen Small Cap Value Fund | | | 1,128 | | | | 290 | |
Nuveen Tactical Market Opportunities Fund 1 | | | — | | | | — | |
| 1 | | Commenced operations on December 30, 2009. |
S-114
| | | | | | | | |
| | | Compensation on Redemptions
and Repurchases | |
Fund | | Fiscal Year Ended
October 31, 2010 | | | November 1, 2010 through
December 31, 2010 | |
Nuveen Dividend Value Fund | | $ | 10,779 | | | $ | 1,141 | |
Nuveen Equity Index Fund | | | 7,229 | | | | 581 | |
Nuveen International Fund | | | 1,878 | | | | 229 | |
Nuveen International Select Fund | | | 23 | | | | — | |
Nuveen Large Cap Growth Opportunities Fund | | | 3,964 | | | | 335 | |
Nuveen Large Cap Select Fund | | | — | | | | 22 | |
Nuveen Mid Cap Growth Opportunities Fund | | | 14,598 | | | | 1,244 | |
Nuveen Mid Cap Index Fund | | | 950 | | | | 31 | |
Nuveen Mid Cap Select Fund | | | 1,736 | | | | 866 | |
Nuveen Mid Cap Value Fund | | | 5,570 | | | | 636 | |
Nuveen Quantitative Enhanced Core Equity Fund | | | — | | | | — | |
Nuveen Small Cap Growth Opportunities Fund | | | 1,128 | | | | — | |
Nuveen Small Cap Index Fund | | | 28 | | | | 8 | |
Nuveen Small Cap Select Fund | | | 8,127 | | | | 999 | |
Nuveen Small Cap Value Fund | | | 1,369 | | | | 281 | |
Nuveen Tactical Market Opportunities Fund 1 | | | 1,736 | | | | — | |
| 1 | | Commenced operations on December 30, 2009. |
To help financial advisors and investors better understand and more efficiently use the Funds to reach their investment goals, the Distributor may advertise and create specific investment programs and systems. For example, this may include information on how to use the Funds to accumulate assets for future education needs or periodic payments such as insurance premiums. The Distributor may produce software, electronic information sites or additional sales literature to promote the advantages of using the Funds to meet these and other specific investor needs. In addition, wholesale representatives of the Distributor may visit financial advisors on a regular basis to educate them about the Funds and to encourage the sale of Fund shares to their clients. The costs and expenses associated with these efforts may include travel, lodging, sponsorship at educational seminars and conferences, entertainment and meals to the extent permitted by law. Nuveen wholesalers may receive additional compensation if they meet certain targets for sales of one or more Nuveen Mutual Funds.
Additional Payments to Financial Intermediaries and Other Payments
In addition to the sales charge payments and the distribution, service and transfer agency fees described in the Prospectus and elsewhere in this SAI, the Adviser and/or the Distributor may make additional payments out of its own assets to selected intermediaries that sell shares of the Nuveen Mutual Funds (such as brokers, dealers, banks, registered investment advisers, retirement plan administrators and other intermediaries; hereinafter, individually, “Intermediary,” and collectively, “Intermediaries”) under the categories described below for the purposes of promoting the sale of Fund shares, maintaining share balances and/or for sub-accounting, administrative or shareholder processing services.
The amounts of these payments could be significant and may create an incentive for an Intermediary or its representatives to recommend or offer shares of the Nuveen Mutual Funds to its customers. The Intermediary may elevate the prominence or profile of the Funds within the Intermediary’s organization by, for example, placing the Funds on a list of preferred or recommended funds and/or granting the Adviser and/or the Distributor preferential or enhanced opportunities to promote the Funds in various ways within the Intermediary’s organization.
These payments are made pursuant to negotiated agreements with Intermediaries. The payments do not change the price paid by investors for the purchase of a share or the amount a Fund will
S-115
receive as proceeds from such sales. Furthermore, these payments are not reflected in the fees and expenses listed in the fee table section of the Funds’ Prospectus and described above because they are not paid by the Funds.
The categories of payments described below are not mutually exclusive, and a single Intermediary may receive payments under all categories.
The Adviser and/or the Distributor may also make other additional payments out of its own assets as described under “Other Payments” below.
Marketing Support Payments and Program Servicing Payments
The Adviser and/or the Distributor may make payments for marketing support and/or program servicing to selected Intermediaries that are registered as holders or dealers of record for accounts invested in one or more of the Nuveen Mutual Funds or that make Nuveen Mutual Fund shares available through employee benefit plans or fee-based advisory programs to compensate them for the variety of services they provide.
Marketing Support Payments. Services for which an Intermediary receives marketing support payments may include business planning assistance, advertising, educating the Intermediary’s personnel about the Nuveen Mutual Funds in connection with shareholder financial planning needs, placement on the Intermediary’s preferred or recommended fund company list, and access to sales meetings, sales representatives and management representatives of the Intermediary. In addition, Intermediaries may be compensated for enabling representatives of the Adviser and/or the Distributor to participate in and/or present at conferences or seminars, sales or training programs for invited registered representatives and other employees, client and investor events and other events sponsored by the Intermediary.
The Adviser and/or the Distributor compensate Intermediaries differently depending upon, among other factors, the number or value of Nuveen Mutual Funds shares that the Intermediary sells or may sell, the value of the assets invested in the Nuveen Mutual Funds by the Intermediary’s customers, redemption rates, ability to attract and retain assets, reputation in the industry and the level and/or type of marketing assistance and educational activities provided by the Intermediary. Such payments are generally asset-based but also may include the payment of a lump sum.
Program Servicing Payments. Services for which an Intermediary receives program servicing payments typically include recordkeeping, reporting, or transaction processing, but may also include services rendered in connection with fund/investment selection and monitoring, employee enrollment and education, plan balance rollover or separation, or other similar services. An Intermediary may perform program services itself or may arrange with a third party to perform program services.
Program servicing payments typically apply to employee benefit plans, such as retirement plans, or fee-based advisory programs but may apply to retail sales and assets in certain situations. The payments are based on such factors as the type and nature of services or support furnished by the Intermediary and are generally asset-based.
Marketing Support and Program Servicing Payment Guidelines. In the case of any one Intermediary, marketing support and program servicing payments are not expected, with certain limited exceptions, to exceed, in the aggregate, 0.35% of the average net assets of Fund shares attributable to that Intermediary on an annual basis. In connection with the sale of a business by U.S. Bank N.A. to Great-West Life & Annuity Insurance Company (“Great-West”), the Adviser and/or the Distributor has a services agreement with GWFS Equities, Inc., an affiliate of Great-West, which provides for payments of up to 0.60% of the average net assets of Fund shares attributable to GWFS Equities, Inc. on an annual basis.
Other Payments
From time to time, the Adviser and/or the Distributor, at its expense, may provide other compensation to Intermediaries that sell or arrange for the sale of shares of the Funds, which may be in addition to marketing support and program servicing payments described above. For example, the Adviser and/or the Distributor may: (i) compensate Intermediaries for National Securities Clearing Corporation networking system services (e.g., shareholder communication, account statements, trade
S-116
confirmations, and tax reporting) on an asset-based or per account basis; (ii) compensate Intermediaries for providing Fund shareholder trading information; (iii) make one-time or periodic payments to reimburse selected Intermediaries for items such as ticket charges (i.e., fees that an Intermediary charges its representatives for effecting transactions in Fund shares) of up to $25 per purchase or exchange order, operational charges (e.g., fees that an Intermediary charges for establishing a Fund on its trading system), and literature printing and/or distribution costs; (iv) at the direction of a retirement plan’s sponsor, reimburse or pay direct expenses of an employee benefit plan that would otherwise be payable by the plan; and (v) provide payments to broker-dealers to help defray their technology or infrastructure costs.
When not provided for in a marketing support or program servicing agreement, the Adviser and/or the Distributor may pay Intermediaries for enabling the Adviser and/or the Distributor to participate in and/or present at conferences or seminars, sales or training programs for invited registered representatives and other Intermediary employees, client and investor events and other Intermediary-sponsored events, and for travel expenses, including lodging incurred by registered representatives and other employees in connection with prospecting, asset retention and due diligence trips. These payments may vary depending upon the nature of the event. The Adviser and/or the Distributor make payments for such events as it deems appropriate, subject to its internal guidelines and applicable law.
The Adviser and/or the Distributor occasionally sponsors due diligence meetings for registered representatives during which they receive updates on various Nuveen Mutual Funds and are afforded the opportunity to speak with portfolio managers. Although invitations to these meetings are not conditioned on selling a specific number of shares, those who have shown an interest in Nuveen Mutual Funds are more likely to be considered. To the extent permitted by their firm’s policies and procedures, all or a portion of registered representatives’ expenses in attending these meetings may be covered by the Adviser and/or the Distributor.
Representatives of the Distributor or its affiliates may receive additional compensation from the Adviser and/or the Distributor if certain targets are met for sales of one or more Nuveen Mutual Funds. Such compensation may vary by Fund and by Intermediary.
Other compensation may be offered to the extent not prohibited by state laws or any self-regulatory agency, such as FINRA. Investors can ask their Intermediary for information about any payments it receives from the Adviser and/or the Distributor and the services it provides for those payments.
Investors may wish to take Intermediary payment arrangements into account when considering and evaluating any recommendations relating to Fund shares.
Intermediaries Receiving Additional Payments
The following is a list of Intermediaries receiving one or more of the types of payments discussed above as of February 22, 2013:
ADP Broker-Dealer, Inc.
Alliance Fund Distributors
American United Life Insurance Company
Ameriprise Financial Services, Inc.
Ascensus (formerly BISYS Retirement Services, Inc.)
Benefit Plans Administrative Services, Inc.
Benefit Trust Company
Charles Schwab & Co., Inc.
Chase Investment Services
Citigroup Global Markets Inc.
Commonwealth Equity Services, LLP, DBA Commonwealth Financial Network
CPI Qualified Plan Consultants, Inc.
Digital Retirement Solutions, Inc.
Dyatech, LLC
Edward Jones
S-117
ExpertPlan, Inc.
Fidelity Brokerage Services LLC/National Financial Services LLC
Fidelity Investments Institutional Operations Company, Inc. (FIIOC)/Fidelity Advisors
Retirement
Genesis Employee Benefits, Inc. DBA America’s VEBA Solution
Great West Life and Annuity Insurance Co.
GWFS Equities, Inc.
Hartford Life Insurance Company
Hartford Securities Distribution Company, Inc.
Hewitt Associates LLC
ICMA Retirement Corporation
ING Life Insurance and Annuity Company/ING Institutional Plan Services LLC/ING Financial
Advisors, LLC (formerly CitiStreet LLC/CitiStreet Advisors LLC)
J.P. Morgan Retirement Plan Services, LLC
Janney Montgomery Scott LLC
Lincoln Retirement Services Company LLC/AMG Service Corp.
Linsco/Private Ledger Corp.
Marshall & Ilsley Trust Company, N.A.
Massachusetts Mutual Life Insurance Company
Mercer HR Outsourcing LLC
Merrill Lynch, Pierce, Fenner & Smith Inc.
Mid Atlantic Capital Corporation
Morgan Stanley & Co., Incorporated/Morgan Stanley Smith Barney LLC
MSCS Financial Services, LLC
Nationwide Financial Services, Inc.
Newport Retirement Services, Inc.
NYLife Distributors LLC
Pershing LLC
Princeton Retirement Group/GPC Securities, Inc.
Principal Life Insurance Company
Prudential Insurance Company of America (The)
Prudential Investment Management Services, LLC/Prudential Investments LLC
Raymond James & Associates/Raymond James Financial Services, Inc.
RBC Capital Markets, LLC
Reliance Trust Company
Retirement Plan Company, LLC (The)
Robert W. Baird & Co., Inc.
Savings Institute and Bank
Smith Barney
Stifel, Nicolaus & Co., Inc.
T. Rowe Price Investment Services, Inc./T. Rowe Price Retirement Plan Services, Inc.
TD Ameritrade, Inc.
TD Ameritrade Trust Company (formerly Fiserv Trust Company/International Clearing Trust Company)
TIAA-CREF Individual & Institutional Services, LLC
U.S. Bancorp Investments, Inc.
U.S. Bank N.A.
UBS Financial Services, Inc.
Unified Trust Company, N.A.
VALIC Retirement Services Company (formerly AIG Retirement Services Company)
Vanguard Group, Inc.
Wells Fargo Advisors, LLC
Wells Fargo Bank, N.A.
Wilmington Trust Company
Wilmington Trust Retirement and Institutional Services Company (formerly AST Capital Trust Company)
S-118
Any additions, modifications or deletions to the list of Intermediaries identified above that have occurred since February 22, 2013 are not reflected in the list.
FINANCIAL STATEMENTS
The audited financial statements for each Fund’s most recent fiscal year appear in each Fund’s Annual Report dated October 31, 2012. Each Fund’s Annual Report is incorporated by reference into this SAI and is available without charge by calling (800) 257-8787.
S-119
APPENDIX A
RATINGS OF INVESTMENTS
Standard & Poor’s Ratings Group—A brief description of the applicable Standard & Poor’s (“S&P”) rating symbols and their meanings (as published by S&P) follows:
Issue Credit Ratings
A S&P issue credit rating is a forward-looking opinion about the creditworthiness of an obligor with respect to a specific financial obligation, a specific class of financial obligations, or a specific financial program (including ratings on medium-term note programs and commercial paper programs). It takes into consideration the creditworthiness of guarantors, insurers, or other forms of credit enhancement on the obligation and takes into account the currency in which the obligation is denominated. The opinion reflects S&P’s view of the obligor’s capacity and willingness to meet its financial commitments as they come due, and may assess terms, such as collateral security and subordination, which could affect ultimate payment in the event of default.
Issue credit ratings can be either long-term or short-term. Short-term ratings are generally assigned to those obligations considered short-term in the relevant market. In the U.S., for example, that means obligations with an original maturity of no more than 365 days—including commercial paper. Short-term ratings are also used to indicate the creditworthiness of an obligor with respect to put features on long-term obligations. The result is a dual rating, in which the short-term rating addresses the put feature, in addition to the usual long-term rating. Medium-term notes are assigned long-term ratings.
Long-Term Issue Credit Ratings
Issue credit ratings are based, in varying degrees, on S&P’s analysis of the following considerations:
1. Likelihood of payment—capacity and willingness of the obligor to meet its financial commitment on an obligation in accordance with the terms of the obligation;
2. Nature of and provisions of the obligation;
3. Protection afforded by, and relative position of, the obligation in the event of bankruptcy, reorganization, or other arrangement under the laws of bankruptcy and other laws affecting creditors’ rights.
Issue ratings are an assessment of default risk, but may incorporate an assessment of relative seniority or ultimate recovery in the event of default. Junior obligations are typically rated lower than senior obligations, to reflect the lower priority in bankruptcy, as noted above. (Such differentiation may apply when an entity has both senior and subordinated obligations, secured and unsecured obligations, or operating company and holding company obligations.)
| | |
| |
| AAA | | An obligation rated ‘AAA’ has the highest rating assigned by S&P. The obligor’s capacity to meet its financial commitment on the obligation is extremely strong. |
| |
| AA | | An obligation rated ‘AA’ differs from the highest-rated obligations only to a small degree. The obligor’s capacity to meet its financial commitment on the obligation is very strong. |
| |
| A | | An obligation rated ‘A’ is somewhat more susceptible to the adverse effects of changes in circumstances and economic conditions than obligations in higher-rated categories. However, the obligor’s capacity to meet its financial commitment on the obligation is still strong. |
| |
| BBB | | An obligation rated ‘BBB’ exhibits adequate protection parameters. However, adverse economic conditions or changing circumstances are more likely to lead to a weakened capacity of the obligor to meet its financial commitment on the obligation. |
Obligations rated ‘BB’, ‘B’, ‘CCC’, ‘CC’, and ‘C’ are regarded as having significant speculative characteristics. ‘BB’ indicates the least degree of speculation and ‘C’ the highest. While such
A-1
obligations will likely have some quality and protective characteristics, these may be outweighed by large uncertainties or major exposures to adverse conditions.
| | |
| |
| BB | | An obligation rated ‘BB’ is less vulnerable to nonpayment than other speculative issues. However, it faces major ongoing uncertainties or exposure to adverse business, financial, or economic conditions which could lead to the obligor’s inadequate capacity to meet its financial commitment on the obligation. |
| |
| B | | An obligation rated ‘B’ is more vulnerable to nonpayment than obligations rated ‘BB’, but the obligor currently has the capacity to meet its financial commitment on the obligation. Adverse business, financial, or economic conditions will likely impair the obligor’s capacity or willingness to meet its financial commitment on the obligation. |
| |
| CCC | | An obligation rated ‘CCC’ is currently vulnerable to nonpayment, and is dependent upon favorable business, financial, and economic conditions for the obligor to meet its financial commitment on the obligation. In the event of adverse business, financial, or economic conditions, the obligor is not likely to have the capacity to meet its financial commitment on the obligation. |
| |
| CC | | An obligation rated ‘CC’ is currently highly vulnerable to nonpayment. |
| |
| C | | A ‘C’ rating is assigned to obligations that are currently highly vulnerable to nonpayment, obligations that have payment arrearages allowed by the terms of the documents, or obligations of an issuer that is the subject of a bankruptcy petition or similar action which have not experienced a payment default. Among others, the ‘C’ rating may be assigned to subordinated debt, preferred stock or other obligations on which cash payments have been suspended in accordance with the instrument’s terms or when preferred stock is the subject of a distressed exchange offer, whereby some or all of the issue is either repurchased for an amount of cash or replaced by other instruments having a total value that is less than par. |
| |
| D | | An obligation rated ‘D’ is in payment default. The ‘D’ rating category is used when payments on an obligation are not made on the date due unless S&P believes that such payments will be made within five business days, irrespective of any grace period. The ‘D’ rating also will be used upon the filing of a bankruptcy petition or the taking of similar action if payments on an obligation are jeopardized. An obligation’s rating is lowered to ‘D’ upon completion of a distressed exchange offer, whereby some or all of the issue is either repurchased for an amount of cash or replaced by other instruments having a total value that is less than par. |
Plus (+) or Minus (–): The ratings from ‘AA’ to ‘CCC’ may be modified by the addition of a plus or minus sign to show relative standing within the major rating categories.
| | |
| |
| NR | | This indicates that no rating has been requested, that there is insufficient information on which to base a rating, or that S&P does not rate a particular obligation as a matter of policy. |
Short-Term Issue Credit Ratings
| | |
| |
| A-1 | | A short-term obligation rated ‘A-1’ is rated in the highest category by S&P. The obligor’s capacity to meet its financial commitment on the obligation is strong. Within this category, certain obligations are designated with a plus sign (+). This indicates that the obligor’s capacity to meet its financial commitment on these obligations is extremely strong. |
| |
| A-2 | | A short-term obligation rated ‘A-2’ is somewhat more susceptible to the adverse effects of changes in circumstances and economic conditions than obligations in higher rating categories. However, the obligor’s capacity to meet its financial commitment on the obligation is satisfactory. |
| |
| A-3 | | A short-term obligation rated ‘A-3’ exhibits adequate protection parameters. However, adverse economic conditions or changing circumstances are more likely to lead to a weakened capacity of the obligor to meet its financial commitment on the obligation. |
A-2
| | | | |
| |
| | B | | | A short-term obligation rated ‘B’ is regarded as vulnerable and has significant speculative characteristics. The obligor currently has the capacity to meet its financial commitments; however, it faces major ongoing uncertainties which could lead to the obligor’s inadequate capacity to meet its financial commitments. |
| |
| | C | | | A short-term obligation rated ‘C’ is currently vulnerable to nonpayment and is dependent upon favorable business, financial, and economic conditions for the obligor to meet its financial commitment on the obligation. |
| |
| | D | | | A short-term obligation rated ‘D’ is in payment default. The ‘D’ rating category is used when payments on an obligation are not made on the date due, unless S&P believes that such payments will be made within any stated grace period. However, any stated grace period longer than five business days will be treated as five business days. The ‘D’ rating also will be used upon the filing of a bankruptcy petition or the taking of a similar action if payments on an obligation are jeopardized. |
Moody’s Investors Service, Inc.—A brief description of the applicable Moody’s Investors Service, Inc. (“Moody’s”) rating symbols and their meanings (as published by Moody’s) follows.
Ratings assigned on Moody’s global long-term and short-term rating scales are forward-looking opinions of the relative credit risks of financial obligations issued by non-financial corporates, financial institutions, structured finance vehicles, project finance vehicles, and public sector entities. Long-term ratings are assigned to issuers or obligations with an original maturity of one year or more and reflect both on the likelihood of a default on contractually promised payments and the expected financial loss suffered in the event of default. Short-term ratings are assigned to obligations with an original maturity of thirteen months or less and reflect the likelihood of a default on contractually promised payments.
Long-Term Obligation Ratings
| | |
| |
| Aaa | | Obligations rated Aaa are judged to be of the highest quality, subject to the lowest level of credit risk. |
| |
| Aa | | Obligations rated Aa are judged to be of high quality and are subject to very low credit risk. |
| |
| A | | Obligations rated A are judged to be upper-medium grade and are subject to low credit risk. |
| |
| Baa | | Obligations rated Baa are judged to be medium-grade and subject to moderate credit risk and as such may possess certain speculative characteristics. |
| |
| Ba | | Obligations rated Ba are judged to be speculative and are subject to substantial credit risk. |
| |
| B | | Obligations rated B are considered speculative and are subject to high credit risk. |
| |
| Caa | | Obligations rated Caa are judged to be speculative of poor standing and are subject to very high credit risk. |
| |
| Ca | | Obligations rated Ca are highly speculative and are likely in, or very near, default, with some prospect of recovery of principal and interest. |
| |
| C | | Obligations rated C are the lowest rated and are typically in default, with little prospect for recovery of principal or interest. |
Note: Moody’s appends numerical modifiers 1, 2, and 3 to each generic rating classification from Aa through Caa. The modifier 1 indicates that the obligation ranks in the higher end of its generic rating category; the modifier 2 indicates a mid-range ranking; and the modifier 3 indicates a ranking in the lower end of that generic rating category.
Short-Term Obligation Ratings
| | |
| |
| P-1 | | Issuers (or supporting institutions) rated Prime-1 have a superior ability to repay short-term debt obligations. |
| |
| P-2 | | Issuers (or supporting institutions) rated Prime-2 have a strong ability to repay short-term debt obligations. |
| |
| P-3 | | Issuers (or supporting institutions) rated Prime-3 have an acceptable ability to repay short-term obligations. |
| |
| NP | | Issuers (or supporting institutions) rated Not Prime do not fall within any of the Prime rating categories. |
A-3
Medium-Term Note Program Ratings
Moody’s assigns provisional ratings to medium-term note (MTN) programs and definitive ratings to the individual debt securities issued from them (referred to as drawdowns or notes).
MTN program ratings are intended to reflect the ratings likely to be assigned to drawdowns issued from the program with the specified priority of claim (e.g. senior or subordinated). To capture the contingent nature of a program rating, Moody’s assigns provisional ratings to MTN programs. A provisional rating is denoted by a (P) in front of the rating.
The rating assigned to a drawdown from a rated MTN program or bank/deposit note program is definitive in nature, and may differ from the program rating if the drawdown is exposed to additional credit risks besides the issuer’s default, such as links to the defaults of other issuers, or has other structural features that warrant a different rating. In some circumstances, no rating may be assigned to a drawdown.
Moody’s encourages market participants to contact Moody’s Ratings Desks or visit www.moodys.com directly if they have questions regarding ratings for specific notes issued under a medium-term note program. Unrated notes issued under an MTN program may be assigned an NR (not rated) symbol.
U.S. Municipal Short-Term Debt and Demand Obligation Ratings
Short-Term Obligation Ratings
The Municipal Investment Grade (MIG) scale is used to rate US municipal bond anticipation notes of up to three years maturity. Municipal notes rated on the MIG scale may be secured by either pledged revenues or proceeds of a take-out financing received prior to note maturity. MIG ratings expire at the maturity of the obligation, and the issuer’s long-term rating is only one consideration in assigning the MIG rating. MIG ratings are divided into three levels—MIG 1 through MIG 3—while speculative grade short-term obligations are designated SG.
| | |
| |
| MIG 1 | | This designation denotes superior credit quality. Excellent protection is afforded by established cash flows, highly reliable liquidity support, or demonstrated broad-based access to the market for refinancing. |
| |
| MIG 2 | | This designation denotes strong credit quality. Margins of protection are ample, although not as large as in the preceding group. |
| |
| MIG 3 | | This designation denotes acceptable credit quality. Liquidity and cash-flow protection may be narrow, and market access for refinancing is likely to be less well-established. |
| |
| SG | | This designation denotes speculative-grade credit quality. Debt instruments in this category may lack sufficient margins of protection. |
Demand Obligation Ratings
In the case of variable rate demand obligations (VRDOs), a two-component rating is assigned; a long or short-term debt rating and a demand obligation rating. The first element represents Moody’s evaluation of risk associated with scheduled principal and interest payments. The second element represents Moody’s evaluation of risk associated with the ability to receive purchase price upon demand (“demand feature”). The second element uses a rating from a variation of the MIG scale called the Variable Municipal Investment Grade (VMIG) scale.
| | |
| |
| VMIG 1 | | This designation denotes superior credit quality. Excellent protection is afforded by the superior short-term credit strength of the liquidity provider and structural and legal protections that ensure the timely payment of purchase price upon demand. |
| |
| VMIG 2 | | This designation denotes strong credit quality. Good protection is afforded by the strong short-term credit strength of the liquidity provider and structural and legal protections that ensure the timely payment of purchase price upon demand. |
A-4
| | |
| |
| VMIG 3 | | This designation denotes acceptable credit quality. Adequate protection is afforded by the satisfactory short-term credit strength of the liquidity provider and structural and legal protections that ensure the timely payment of purchase price upon demand. |
| |
| SG | | This designation denotes speculative-grade credit quality. Demand features rated in this category may be supported by a liquidity provider that does not have an investment grade short-term rating or may lack the structural and/or legal protections necessary to ensure the timely payment of purchase price upon demand. |
Fitch Ratings—A brief description of the applicable Fitch Ratings (“Fitch”) ratings symbols and meanings (as published by Fitch) follows:
Fitch’s credit ratings provide an opinion on the relative ability of an entity to meet financial commitments, such as interest, preferred dividends, repayment of principal, insurance claims or counterparty obligations. Credit ratings are used by investors as indications of the likelihood of receiving the money owed to them in accordance with the terms on which they invested. The agency’s credit ratings cover the global spectrum of corporate, sovereign (including supranational and sub-national), financial, bank, insurance, municipal and other public finance entities and the securities or other obligations they issue, as well as structured finance securities backed by receivables or other financial assets.
The terms “investment grade” and “speculative grade” have established themselves over time as shorthand to describe the categories ‘AAA’ to ‘BBB’ (investment grade) and ‘BB’ to ‘D’ (speculative grade). The terms “investment grade” and “speculative grade” are market conventions, and do not imply any recommendation or endorsement of a specific security for investment purposes. “Investment grade” categories indicate relatively low to moderate credit risk, while ratings in the “speculative” categories either signal a higher level of credit risk or that a default has already occurred.
A designation of “Not Rated” or “NR” is used to denote securities not rated by Fitch where Fitch has rated some, but not all, securities comprising an issuance capital structure.
Credit ratings express risk in relative rank order, which is to say they are ordinal measures of credit risk and are not predictive of a specific frequency of default or loss.
Fitch’s credit ratings do not directly address any risk other than credit risk. In particular, ratings do not deal with the risk of a market value loss on a rated security due to changes in interest rates, liquidity and other market considerations. However, in terms of payment obligation on the rated liability, market risk may be considered to the extent that it influences the ability of an issuer to pay upon a commitment. Ratings nonetheless do not reflect market risk to the extent that they influence the size or other conditionality of the obligation to pay upon a commitment (for example, in the case of index-linked bonds).
In the default components of ratings assigned to individual obligations or instruments, the agency typically rates to the likelihood of non-payment or default in accordance with the terms of that instrument’s documentation. In limited cases, Fitch may include additional considerations (i.e. rate to a higher or lower standard than that implied in the obligation’s documentation). In such cases, the agency will make clear the assumptions underlying the agency’s opinion in the accompanying rating commentary.
International Long-Term Ratings
Issuer Credit Rating Scales
Investment Grade
| | |
| |
| AAA | | Highest credit quality. ‘AAA’ ratings denote the lowest expectation of default risk. They are assigned only in cases of exceptionally strong capacity for payment of financial commitments. This capacity is highly unlikely to be adversely affected by foreseeable events. |
A-5
| | |
| |
| AA | | Very high credit quality. ‘AA’ ratings denote expectations of very low default risk. They indicate very strong capacity for payment of financial commitments. This capacity is not significantly vulnerable to foreseeable events. |
| |
| A | | High credit quality. ‘A’ ratings denote expectations of low default risk. The capacity for payment of financial commitments is considered strong. This capacity may, nevertheless, be more vulnerable to adverse business or economic conditions than is the case for higher ratings. |
| |
| BBB | | Good credit quality. ‘BBB’ ratings indicate that expectations of default risk are currently low. The capacity for payment of financial commitments is considered adequate but adverse business or economic conditions are more likely to impair this capacity. |
Speculative Grade
| | |
| |
| BB | | Speculative. ‘BB’ ratings indicate an elevated vulnerability to default risk, particularly in the event of adverse changes in business or economic conditions over time; however, business or financial flexibility exists which supports the servicing of financial commitments. |
| |
| B | | Highly speculative. ‘B’ ratings indicate that material default risk is present, but a limited margin of safety remains. Financial commitments are currently being met; however, capacity for continued payment is vulnerable to deterioration in the business and economic environment. |
| |
| CCC | | Substantial credit risk. Default is a real possibility. |
| |
| CC | | Very high levels of credit risk. Default of some kind appears probable. |
| |
| C | | Exceptionally high levels of credit risk. Default is imminent or inevitable, or the issuer is in standstill. Conditions that are indicative of a ‘C’ category rating for an issuer include: • the issuer has entered into a grace or cure period following non-payment of a material financial obligation; • the issuer has entered into a temporary negotiated waiver or standstill agreement following a payment default on a material financial obligation; or • Fitch otherwise believes a condition of ‘RD’ or ‘D’ to be imminent or inevitable, including through the formal announcement of a distressed debt exchange. |
| |
| RD | | Restricted default. ‘RD’ ratings indicate an issuer that in Fitch’s opinion has experienced an uncured payment default on a bond, loan or other material financial obligation but which has not entered into bankruptcy filings, administration, receivership, liquidation or other formal winding-up procedure, and which has not otherwise ceased operating. This would include: • the selective payment default on a specific class or currency of debt; • the uncured expiry of any applicable grace period, cure period or default forbearance period following a payment default on a bank loan, capital markets security or other material financial obligation; • the extension of multiple waivers or forbearance periods upon a payment default on one or more material financial obligations, either in series or in parallel; or • execution of a distressed debt exchange on one or more material financial obligations. |
A-6
| | |
| |
| D | | Default. ‘D’ ratings indicate an issuer that in Fitch’s opinion has entered into bankruptcy filings, administration, receivership, liquidation or other formal winding-up procedure, or which has otherwise ceased business. Default ratings are not assigned prospectively to entities or their obligations; within this context, non-payment on an instrument that contains a deferral feature or grace period will generally not be considered a default until after the expiration of the deferral or grace period, unless a default is otherwise driven by bankruptcy or other similar circumstance, or by a distressed debt exchange. “Imminent” default typically refers to the occasion where a payment default has been intimated by the issuer, and is all but inevitable. This may, for example, be where an issuer has missed a scheduled payment, but (as is typical) has a grace period during which it may cure the payment default. Another alternative would be where an issuer has formally announced a distressed debt exchange, but the date of the exchange still lies several days or weeks in the immediate future. In all cases, the assignment of a default rating reflects the agency’s opinion as to the most appropriate rating category consistent with the rest of its universe of ratings, and may differ from the definition of default under the terms of an issuer’s financial obligations or local commercial practice. |
International Short-Term Ratings
A short-term issuer or obligation rating is based in all cases on the short-term vulnerability to default of the rated entity or security stream and relates to the capacity to meet financial obligations in accordance with the documentation governing the relevant obligation. Short-Term Ratings are assigned to obligations whose initial maturity is viewed as “short term” based on market convention. Typically, this means up to 13 months for corporate, sovereign, and structured obligations, and up to 36 months for obligations in U.S. public finance markets.
| | |
| |
| F1 | | Highest short-term credit quality. Indicates the strongest intrinsic capacity for timely payment of financial commitments; may have an added “+” to denote any exceptionally strong credit feature. |
| |
| F2 | | Good short-term credit quality. Good intrinsic capacity for timely payment of financial commitments. |
| |
| F3 | | Fair short-term credit quality. The intrinsic capacity for timely payment of financial commitments is adequate. |
| |
| B | | Speculative short-term credit quality. Minimal capacity for timely payment of financial commitments, plus heightened vulnerability to near term adverse changes in financial and economic conditions. |
| |
| C | | High short-term default risk. Default is a real possibility. |
| |
| RD | | Restricted default. Indicates an entity that has defaulted on one or more of its financial commitments, although it continues to meet other financial obligations. Applicable to entity ratings only. |
| |
| D | | Default. Indicates a broad-based default event for an entity, or the default of a short-term obligation. |
Notes to Long-term and Short-term ratings:
The modifiers “+” or “-” may be appended to a rating to denote relative status within major rating categories. Such suffixes are not added to the ‘AAA’ Long-Term Rating category, or categories below ‘B’.
‘WD’ indicates that the rating has been withdrawn and the issue or issuer is no longer rated by Fitch.
Rating Watch: Rating Watches indicate that there is a heightened probability of a rating change and the likely direction of such a change. These are designated as “Positive”, indicating a potential
A-7
upgrade, “Negative”, for a potential downgrade, or “Evolving”, if ratings may be raised, lowered or affirmed. However, ratings that are not on Rating Watch can be raised or lowered without being placed on Rating Watch first, if circumstances warrant such an action. A Rating Watch is typically event-driven and, as such, it is generally resolved over a relatively short period.
A-8
APPENDIX B

PROXY VOTING POLICY AND PROCEDURES
I. STATEMENT OF POLICY
Proxy voting is an important right of shareholders and reasonable care and diligence must be undertaken to ensure that such rights are properly and timely exercised. When Altrinsic has discretion to vote the proxies of its clients, it will vote those proxies in the best interest of its clients and in accordance with these policies. Certain clients may retain proxy voting authority and in those circumstances Altrinsic has no proxy voting responsibility.
II. PROXY VOTING PROCEDURES
All proxies received by Altrinsic will be forwarded to a Portfolio Manager, or his designee, with a list of accounts that hold the security, together with the number of votes each account controls (reconciling any duplications), and the date by which Altrinsic must vote the proxy in order to allow enough time for the completed proxy to be returned to the issuer prior to the vote taking place. Operations will keep a record or be able to readily access a report from the electronic filing of each proxy received.
Absent material conflicts (See §IV below), a Portfolio Manager, or his designee, will determine how Altrinsic should vote the proxy. The Portfolio Manager or his designee will send its decision on how Altrinsic will vote a proxy to Operations. Operations will then forward the proxy with the proposed vote to the Chief Compliance Officer (“CCO”) for review. Upon completion of her review, the CCO will sign the proxy ballot and return it to Operations. Operations is responsible for voting the proxy either by mail or electronically in a timely and appropriate manner.
Altrinsic or its clients may retain a third party to assist it in coordinating and voting proxies with respect to client securities. After a vote has been case, Operations will provide the CCO with a proxy vote report. The CCO will review this report to confirm that the proxy was voted in accordance with the provided instructions and was voted in a timely manner. Currently Altrinsic does not directly engage with any third party proxy voting companies for research or other services.
III. VOTING GUIDELINES
In the absence of specific voting guidelines from the client, Altrinsic will vote proxies in the best interest of its clients. Each proposal will be evaluated separately but the following guidelines will generally be followed:
| | • | | Altrinsic will vote in favor of routine corporate housekeeping proposals, including election of directors (where no corporate governance issues are implicated) and selection of auditors; and |
| | • | | Altrinsic will vote against proposals that make it more difficult to replace members of the issuer’s board of directors, including proposals to stagger the board, cause management to be overrepresented on the board, introduce cumulative voting, introduce unequal voting rights and create supermajority voting. |
For other proposals, Altrinsic shall determine on a case-by-case basis the vote which is in the best interests of its clients and may take into account certain factors, including but not limited to:
| | • | | Whether the proposal was recommended by management and Altrinsic’s opinion of management; |
| | • | | The effect on shareholder value; |
| | • | | The issuer’s business practices; |
| | • | | Stock dilution and equity based compensation; |
B-1
| | • | | Whether the proposal acts to entrench existing management; and |
| | • | | Whether the proposal fairly compensates management for past and future performance. |
IV. CONFLICTS OF INTEREST
The CCO will review the proxy vote proposed by the Portfolio Manager, or his designee, and identify any conflicts of interest that exist between Altrinsic and its clients. Such conflicts could include, but are not limited to, Altrinsic’s or its affiliates’ relationships with the issuer or its affiliates.
If a potential or actual conflict exists, Altrinsic will determine whether voting in accordance with the voting guidelines and factors described above is in the best interests of the client including clients that are subject to ERISA. If Altrinsic determines that a material conflict exists and that voting in accordance with the voting guidelines and factors described above is not in the best interests of the clients, Altrinsic will make the appropriate disclosures to clients and either request that the client vote the proxy(s) or abstain from voting.
V. DISCLOSURE
Clients may contact the CCO in order to obtain information on how Altrinsic voted such client’s proxies and/or to request a copy of these policies and procedures. If a client requests this information, the CCO will provide a written response to the client that lists, with respect to each voted proxy about which the client has inquired (a) the name of the issuer; (b) the proposal voted upon and (c) how Altrinsic voted the client’s proxy.
VI. RECORDKEEPING
The CCO will maintain files relating to Altrinsic’s proxy voting policy, procedures and voting decisions in an easily accessible place. Records will be maintained and preserved for five years from the end of the fiscal year during which the last entry was made on a record, with records for the first two years kept in the offices of Altrinsic. The following records will be included in the files:
| | • | | Copies of this proxy voting policy and procedures, and any amendments thereto; |
| | • | | A record of each vote that Altrinsic casts1; |
| | • | | A copy of Altrinsic’s review and resolution of any proxy voting conflicts; and |
| | • | | A copy of each written client request for information on how Altrinsic voted such client’s proxies, and a copy of any written response to any client request for information on how Altrinsic voted its proxies. |
Operations will retain copies of each proxy statement that Altrinsic receives, provided however, that Altrinsic may rely on obtaining a copy of proxy statements from the SEC’s EDGAR system for those proxy statements that are so available2 and any document that Altrinsic created that was material to making a decision how to vote proxies, or that memorializes the decision.
Effective: January 1, 2013
| 1 | Altrinsic may rely on a third party to train a copy of the votes cast, provided the third party undertakes to provide a copy of the record promptly upon request. |
| 2 | Altrinsic may choose instead to have a third party retain a copy of proxy statements, provided that the third party undertakes to provide a copy of the proxy statements promptly upon request. |
B-2
PROXY VOTING POLICY OF
LAZARD ASSET MANAGEMENT LLC
AND
LAZARD ASSET MANAGEMENT (CANADA), INC.
A. Introduction
Lazard Asset Management LLC and Lazard Asset Management (Canada), Inc. (together, “Lazard”) provide investment management services for client accounts, including proxy voting services. As a fiduciary, Lazard is obligated to vote proxies in the best interests of its clients. Lazard has developed a structure that is designed to ensure that proxy voting is conducted in an appropriate manner, consistent with clients’ best interests, and within the framework of this Proxy Voting Policy (the “Policy”). Lazard has adopted this Policy in order to satisfy its fiduciary obligation and the requirements of Rule 206(4)-6 under the Investment Advisers Act of 1940, as amended.
Lazard manages assets for a variety of clients, including individuals, Taft-Hartley plans, governmental plans, foundations and endowments, corporations, and investment companies and other collective investment vehicles. To the extent that proxy voting authority is delegated to Lazard, Lazard’s general policy is to vote proxies on a given issue the same for all of its clients. This Policy is based on the view that Lazard, in its role as investment adviser, must vote proxies based on what it believes will maximize shareholder value as a long-term investor, and the votes that it casts on behalf of all its clients are intended to accomplish that objective. This Policy recognizes that there may be times when meeting agendas or proposals may create the appearance of a material conflict of interest for Lazard. When such a conflict may appear, Lazard will seek to alleviate the potential conflict by voting consistent with pre-approved guidelines or, in situations where the pre-approved guideline is to vote case-by-case, with the recommendation of an independent source. More information on how Lazard handles conflicts is provided in Section F of this Policy.
B. Responsibility to Vote Proxies
Generally, Lazard is willing to accept delegation from its clients to vote proxies. Lazard does not delegate that authority to any other person or entity, but retains complete authority for voting all proxies on behalf of its clients. Not all clients delegate proxy-voting authority to Lazard, however, and Lazard will not vote proxies, or provide advice to clients on how to vote proxies, in the absence of a specific delegation of authority or an obligation under applicable law. For example, securities that are held in an investment advisory account for which Lazard exercises no investment discretion, are not voted by Lazard, nor are shares that a client has authorized their custodian bank to use in a stock loan program which passes voting rights to the party with possession of the shares.
As discussed more fully in Section G of this Policy, there may be times when Lazard determines that it would be in the best interests of its clients to abstain from voting proxies.
C. General Administration
1. Overview
Lazard’s proxy voting process is administered by its Proxy Operations Department (“ProxyOps”), which reports to Lazard’s Chief Operations Officer. Oversight of the process is provided by Lazard’s Legal / Compliance Department and by a Proxy Committee currently consisting of Managing Directors, LAM’s General Counsel and Chief Compliance Officer, portfolio managers and other investment personnel of Lazard. The Proxy Committee meets at least semi-annually to review this Policy and consider changes to it, as well as specific proxy voting guidelines (the “Approved Guidelines”), which are discussed below. Meetings may be convened more frequently (for example, to discuss a specific proxy agenda or proposal) as requested by the Manager of ProxyOps, any member of the Proxy Committee, or Lazard’s General Counsel or Chief Compliance Officer. A representative of Lazard’s Legal / Compliance Department must be present at all Proxy Committee meetings.
2. Role of Third Parties
To assist it in its proxy-voting responsibilities, Lazard currently subscribes to several research and other proxy-related services offered by Institutional Shareholder Services, Inc. (“ISS”), one of the
B-3
world’s largest providers of proxy-voting services. ISS provides Lazard with its independent analysis and recommendation regarding virtually every proxy proposal that Lazard votes on behalf of its clients, with respect to both U.S. and non-U.S. securities.
ISS provides other proxy-related administrative services to Lazard. ISS receives on Lazard’s behalf all proxy information sent by custodians that hold securities of Lazard’s clients. ISS posts all relevant information regarding the proxy on its password-protected website for Lazard to review, including meeting dates, all agendas and ISS’ analysis. ProxyOps reviews this information on a daily basis and regularly communicates with representatives of ISS to ensure that all agendas are considered and proxies are voted on a timely basis. ISS also provides Lazard with vote execution, recordkeeping and reporting support services.
3. Voting Process
Lazard’s Proxy Committee has approved specific proxy voting guidelines regarding various common proxy proposals (the “Approved Guidelines”). As discussed more fully below in Section D of this Policy, depending on the proposal, an Approved Guideline may provide that Lazard should vote for or against the proposal, or that the proposal should be considered on a case-by-case basis.
Where the Approved Guideline for a particular type of proxy proposal is to vote on a case-by case basis, Lazard believes that input from a portfolio manager or research analysts with knowledge of the issuer and its securities (collectively, “Portfolio Management”) is essential. Portfolio Management is, in Lazard’s view, best able to evaluate the impact that the outcome on a particular proposal will have on the value of the issuer’s shares. Consequently, the Manager of ProxyOps seeks Portfolio Management’s recommendation on how to vote all such proposals. Similarly, with respect to certain Lazard strategies, as discussed more fully in Sections F and G below, the Manager of ProxyOps will consult with Portfolio Management to determine when it would be appropriate to abstain from voting.
In seeking Portfolio Management’s recommendation, the Manager of ProxyOps provides ISS’ recommendation and analysis. Portfolio Management provides the Manager of ProxyOps with its recommendation and the reasons behind it. ProxyOps will generally vote as recommended by Portfolio Management, subject to certain strategy-specific situations or situations where there may appear to be a material conflict of interest, in which case an alternative approach may be followed. (See Sections F and G below.) Depending on the facts surrounding a particular case-by-case proposal, or Portfolio Management’s recommendation on a case-by-case proposal, the Manager of ProxyOps may consult with Lazard’s Chief Compliance Officer or General Counsel, and may seek the final approval of the Proxy Committee regarding Portfolio Management’s recommendation. If necessary, and in cases where there is a possibility of a split vote among Portfolio Management teams as described in Section G.1. below, a meeting of the Proxy Committee will be convened to discuss the proposal and reach a final decision on Lazard’s vote.
Subject to certain strategy-specific situations, ProxyOps generally votes all routine proposals (described below) according to the Approved Guidelines. For non-routine proposals where the Approved Guideline is to vote for or against, ProxyOps will provide Portfolio Management with both the Approved Guideline, as well as ISS’ recommendation and analysis. Unless Portfolio Management disagrees with the Approved Guideline for the specific proposal, ProxyOps will generally vote the proposal according to the Approved Guideline. If Portfolio Management disagrees, however, it will provide its reason for doing so. All the relevant information will be provided to the Proxy Committee members for a final determination of such non-routine items. It is expected that the final vote will be cast according to the Approved Guideline, absent a compelling reason for not doing so, and subject to situations where there may be the appearance of a material conflict of interest or certain strategy-specific situations, in which case an alternative approach may be followed. (See Sections F and G, below.)
D. Specific Proxy Items
Shareholders receive proxies involving many different proposals. Many proposals are routine in nature, such as a non-controversial election of Directors or a change in a company’s name. Others are more complicated, such as items regarding corporate governance and shareholder rights, changes to capital structure, stock option plans and other executive compensation issues, mergers and other
B-4
significant transactions and social or political issues. Following are the Approved Guidelines for a significant proportion of the proxy proposals on which Lazard regularly votes. Of course, other proposals may be presented from time to time. Those proposals will be discussed with the Proxy Committee to determine how they should be voted and, if it is anticipated that they may re-occur, to adopt an Approved Guideline.
Certain strategy-specific considerations may result in Lazard voting proxies other than according to Approved Guidelines, not voting shares at all, issuing standing instructions to ISS on how to vote certain proxy matters or other differences from how Lazard votes or handles its proxy voting. These considerations are discussed in more detail in Section G, below.
1. Routine Items
Lazard generally votes routine items as recommended by the issuer’s management and board of directors, and against any shareholder proposals regarding those routine matters, based on the view that management is in a better position to evaluate the need for them. Lazard considers routine items to be those that do not change the structure, charter, bylaws, or operations of an issuer in any way that is material to shareholder value. Routine items generally include:
| | • | | routine election or re-election of directors; |
| | • | | appointment or election of auditors, in the absence of any controversy or conflict regarding the auditors; |
| | • | | issues relating to the timing or conduct of annual meetings; and |
2. Corporate Governance and Shareholder Rights Matters
Many proposals address issues related to corporate governance and shareholder rights. These items often relate to a board of directors and its committees, anti-takeover measures, and the conduct of the company’s shareholder meetings.
a. Board of Directors and Its Committees
Lazard votes in favor of provisions that it believes will increase the effectiveness of an issuer’s board of directors. Lazard believes that in most instances, a board and the issuer’s management are in the best position to make the determination how to best increase a board’s effectiveness. Lazard does not believe that establishing burdensome requirements regarding a board will achieve this objective. Lazard has Approved Guidelines to vote:
| | • | | For the establishment of an independent nominating committee, audit committee or compensation committee of a board of directors; |
| | • | | For a requirement that a substantial majority (e.g. 2/3) of a US or UK company’s directors be independent; |
| | • | | On a case-by-case basis regarding the election of directors where the board does not have independent “key committees” or sufficient independence; |
| | • | | For proposals that a board’s committees be comprised solely of independent directors or consist of a majority of independent directors; |
| | • | | For proposals to limit directors’ liability; broaden indemnification of directors; and approve indemnification agreements for officers and directors, unless doing so would affect shareholder interests in a specific pending or threatened litigation; or for indemnification due to negligence in these cases voting is on a case-by-case basis; |
| | • | | For proposals seeking to de-classify a board and Against proposals seeking to classify a board; |
| | • | | On a case-by-case basis on all proposals relating to cumulative voting; |
| | • | | Against shareholder proposals, absent a demonstrable need, proposing the establishment of additional committees; and on a case-by-case basis regarding the establishment of shareholder advisory committees. |
| | • | | Against shareholder proposals seeking union or special-interest representation on the board; |
B-5
| | • | | Against shareholder proposals seeking to establish term limits or age limits for directors; |
| | • | | On a case-by-case basis on shareholder proposals seeking to require that the issuer’s chairman and chief executive officer be different individuals; |
| | • | | Against shareholder proposals seeking to establish director stock-ownership requirements; and |
| | • | | Against shareholder proposals seeking to change the size of a board, requiring women or minorities to serve on a board, or requiring two candidates for each board seat. |
b. Anti-takeover Measures
Certain proposals are intended to deter outside parties from taking control of a company. Such proposals could entrench management and adversely affect shareholder rights and the value of the company’s shares. Consequently, Lazard has adopted Approved Guidelines to vote:
| | • | | Against proposals to adopt supermajority vote requirements, or increase vote requirements, for mergers or for the removal of directors; |
| | • | | On a case-by-case basis regarding shareholder rights plans (also known as “poison pill plans”) and For proposals seeking to require all poison pill plans be submitted to shareholder vote; |
| | • | | Against proposals seeking to adopt fair price provisions and For proposals seeking to rescind them; |
| | • | | Against “blank check” preferred stock; and |
| | • | | On a case-by-case basis regarding other provisions seeking to amend a company’s by-laws or charter regarding anti-takeover provisions. |
c. Conduct of Shareholder Meetings
Lazard generally opposes any effort by management to restrict or limit shareholder participation in shareholder meetings, and is in favor of efforts to enhance shareholder participation. Lazard has therefore adopted Approved Guidelines to vote:
| | • | | Against proposals to adjourn meetings; |
| | • | | Against proposals seeking to eliminate or restrict shareholders’ right to call a special meeting; |
| | • | | For proposals providing for confidential voting; |
| | • | | Against efforts to eliminate or restrict right of shareholders to act by written consent; |
| | • | | Against proposals to adopt supermajority vote requirements, or increase vote requirements, and |
| | • | | On a case-by-case basis on changes to quorum requirements. |
3. Changes to Capital Structure
Lazard receives many proxies that include proposals relating to a company’s capital structure. These proposals vary greatly, as each one is unique to the circumstances of the company involved, as well as the general economic and market conditions existing at the time of the proposal. A board and management may have many legitimate business reasons in seeking to effect changes to the issuer’s capital structure, including raising additional capital for appropriate business reasons, cash flow and market conditions. Lazard generally believes that these decisions are best left to management, absent apparent reasons why they should not be. Consequently, Lazard has adopted Approved Guidelines to vote:
| | • | | For management proposals to increase or decrease authorized common or preferred stock (unless it is believed that doing so is intended to serve as an anti-takeover measure); |
| | • | | For stock splits and reverse stock splits; |
| | • | | On a case-by-case basis on matters affecting shareholder rights, such as amending votes-per-share; |
| | • | | On a case-by-case basis on management proposals to issue a new class of common or preferred shares; |
B-6
| | • | | For management proposals to adopt or amend dividend reinvestment plans; |
| | • | | Against changes in capital structure designed to be used in poison pill plans; and |
| | • | | On a case-by-case basis on proposals seeking to approve or amend stock ownership limitations or transfer restrictions. |
4. Stock Option Plans and Other Executive Compensation Issues
Lazard supports efforts by companies to adopt compensation and incentive programs to attract and retain the highest caliber management possible, and to align the interests of a board, management and employees with those of shareholders. Lazard favors programs intended to reward management and employees for positive, long-term performance. However, Lazard will evaluate whether it believes, under the circumstances, that the level of compensation is appropriate or excessive. Lazard has Approved Guidelines to vote:
| | • | | On a case-by-case basis regarding all stock option plans; |
| | • | | Against restricted stock plans that do not involve any performance criteria; |
| | • | | For employee stock purchase plans; |
| | • | | On a case-by-case basis for stock appreciation rights plans; |
| | • | | For deferred compensation plans; |
| | • | | Against proposals to approve executive loans to exercise options; |
| | • | | Against proposals to re-price underwater options; |
| | • | | On a case-by-case basis regarding shareholder proposals to eliminate or restrict severance agreements, and For proposals to submit severance agreements to shareholders for approval; and Against proposals to limit executive compensation or to require executive compensation to be submitted for shareholder approval, unless, with respect to the latter submitting compensation plans for shareholder approval is required by local law or practice. |
5. Mergers and Other Significant Transactions
Shareholders are asked to consider a number of different types of significant transactions, including mergers, acquisitions, sales of all or substantially all of a company’s assets, reorganizations involving business combinations and liquidations. Each of these transactions is unique. Therefore, Lazard’s Approved Guideline is to vote on each of these transactions on a case-by-case basis.
6. Social and Political Issues
Proposals involving social and political issues take many forms and cover a wide array of issues. Some examples are: adoption of principles to limit or eliminate certain business activities, or limit or eliminate business activities in certain countries; adoption of certain conservation efforts; reporting of charitable contributions or political contributions or activities; or the adoption of certain principles regarding employment practices or discrimination policies. These items are often presented by shareholders and are often opposed by the company’s management and its board of directors.
Lazard generally supports the notion that corporations should be expected to act as good citizens, but, as noted above, is obligated to vote on social and political proposals in a way that it believes will most increase shareholder value. As a result, Lazard has adopted Approved Guidelines to vote on a case-by-case basis for most social and political issue proposals. Lazard will generally vote for the approval of anti-discrimination policies.
E. Voting Non-U.S. Securities
Lazard invests in non-U.S. securities on behalf of many clients. Laws and regulations regarding shareholder rights and voting procedures differ dramatically across the world. In certain countries, the requirements or restrictions imposed before proxies may be voted may outweigh any benefit that could be realized by voting the proxies involved. For example, certain countries restrict a shareholder’s ability to sell shares for a certain period of time if the shareholder votes proxies at a meeting (a practice known as “share blocking”). In other instances, the costs of voting a proxy (i.e., by being required to send a representative to the meeting) may simply outweigh any benefit to the client
B-7
if the proxy is voted. Generally, the Manager of ProxyOps will consult with Portfolio Management to determine whether they believe it is in the interest of the clients to vote the proxies. In these instances, the Proxy Committee will have the authority to decide that it is in the best interest of its clients not to vote the proxies.
There may be other instances where Portfolio Management may wish to refrain from voting proxies (See Section G.1. below). Due to the nature of the strategy, a decision to refrain from voting proxies for securities held by the Korea Corporate Governance strategy managed by Lazard (“KCG”), certain Japanese securities or emerging market securities will generally be determined by Portfolio Management. (See Section G.1. below.)
F. Conflicts of Interest
1. Overview
Lazard is required to vote proxies in the best interests of its clients. It is essential, therefore, that material conflicts of interest or the appearance of a material conflict be avoided.
Potential conflicts of interest are inherent in Lazard’s organizational structure and in the nature of its business. Following are examples of situations that could present a conflict of interest or the appearance of a conflict of interest:
| | • | | Lazard Frères & Co. LLC (“LF&Co.”), Lazard’s parent and a registered broker-dealer, or an investment banking affiliate has a relationship with a company the shares of which are held in accounts of Lazard clients, and has provided services to the company with respect to an upcoming significant proxy proposal (i.e., a merger or other significant transaction); |
| | • | | Lazard serves as an investment adviser for a company the management of which supports a particular proposal, and shares of the company are held in accounts of Lazard clients; |
| | • | | Lazard serves as an investment adviser for the pension plan of an organization that sponsors a proposal; or |
| | • | | A Lazard employee who would otherwise be involved in the decision-making process regarding a particular proposal has a material relationship with the issuer or owns shares of the issuer. |
2. General Policy and Consequences of Violations
All proxies must be voted in the best interest of each Lazard client, without any consideration of the interests of any other Lazard client (unrelated to the economic effect of the proposal being voted on share price), Lazard, LF&Co. or any of their Managing Directors, officers, employees or affiliates. ProxyOps is responsible for all proxy voting in accordance with this Policy after consulting with the appropriate member or members of Portfolio Management, the Proxy Committee and/or the Legal / Compliance Department. No other officers or employees of Lazard, LF&Co. or their affiliates may influence or attempt to influence the vote on any proposal. Doing so will be a violation of this Policy. Any communication between an officer or employee of LF&Co. and an officer or employee of Lazard trying to influence how a proposal should be voted is prohibited, and is a violation of this Policy. Violations of this Policy could result in disciplinary action, including letter of censure, fine or suspension, or termination of employment. Any such conduct may also violate state and Federal securities and other laws, as well as Lazard’s client agreements, which could result in severe civil and criminal penalties being imposed, including the violator being prohibited from ever working for any organization engaged in a securities business. Every officer and employee of Lazard who participates in any way in the decision-making process regarding proxy voting is responsible for considering whether they have a conflicting interest or the appearance of a conflicting interest on any proposal. A conflict could arise, for example, if an officer or employee has a family member who is an officer of the issuer or owns securities of the issuer. If an officer or employee believes such a conflict exists or may appear to exist, he or she should notify the Chief Compliance Officer immediately and, unless determined otherwise, should not continue to participate in the decision-making process.
3. Monitoring for Conflicts and Voting When a Material Conflict Exists
ProxyOps monitors for potential conflicts of interest that could be viewed as influencing the outcome of Lazard’s voting decision. Consequently, the steps that Lazard takes to monitor conflicts,
B-8
and voting proposals when the appearance of a material conflict exists, differ depending on whether the Approved Guideline for the specific item is clearly defined to vote for or against, or is to vote on a case-by-case basis. Any questions regarding application of these conflict procedures, including whether a conflict exists, should be addressed to LAM’s Chief Compliance Officer or General Counsel.
a. Where Approved Guideline Is For or Against
Lazard has an Approved Guideline to vote for or against regarding most proxy agenda/proposals. Generally, unless Portfolio Management disagrees with the Approved Guideline for a specific proposal, ProxyOps votes according to the Approved Guideline. It is therefore necessary to consider whether an apparent conflict of interest exists when Portfolio Management disagrees with the Approved Guideline. ProxyOps will use its best efforts to determine whether a conflict of interest or potential conflict of interest exists. If there is no material conflict, the proxy will be voted as outlined in this Policy. If conflict appears to exist, then the proposal will be voted according to the Approved Guideline.
b. Where Approved Guideline Is Case-by-Case
In situations where the Approved Guideline is to vote case-by-case and a material conflict of interest appears to exist, Lazard’s policy is to vote the proxy item according to the recommendation of an independent source, currently ISS. The Manager of ProxyOps will use his best efforts to determine whether a conflict of interest or a potential conflict of interest may exist. If a conflict exists, and Lazard policy is to vote “case-by-case”, then ProxyOps will vote in accordance with the concurring recommendations of the two services offered by ISS, the Proxy Advisor Service and the Proxy Voter Service. If the two ISS services’ recommendations are contrary to each other, ProxyOps will obtain a recommendation from a third independent source that provides voting advisory services, and will defer to the majority recommendation. If a recommendation from the Proxy Committee approved third independent source is not available, Lazard will follow the recommendation of ISS’ Proxy Advisor service. In addition, in the event of a conflict that arises in connection with a proposal for a Lazard mutual fund, Lazard will vote shares for or against the proposal in proportion to shares voted by other shareholders.
G. Other Matters
1. Issues Relating to Management of Specific Lazard Strategies
Due to the nature of certain strategies managed by Lazard, specifically its emerging markets and KCG strategies, there may be times when Lazard believes that it may not be in the best interests of its clients to vote in accordance with the Approved Guidelines, or to vote proxies at all. In certain markets, the fact that Lazard is voting proxies may become public information, and, given the nature of those markets, may impact the price of the securities involved. With respect to the KCG strategy, Lazard may simply require more time to fully understand and address a situation prior to determining what would be in the best interests of shareholders. In these cases ProxyOps will look to Portfolio Management to provide guidance on proxy voting rather than vote in accordance with the Approved Guidelines.
Additionally, particularly with respect to certain Japanese securities, Lazard may not receive notice of a shareholder meeting in time to vote proxies for, or may simply be prevented from voting proxies in connection with, a particular meeting. Due to the compressed time frame for notification of shareholder meetings and Lazard’s obligation to vote proxies on behalf of its clients, Lazard may issue standing instructions to ISS on how to vote on certain matters.
Different strategies managed by Lazard may hold the same securities. However, due to the differences between the strategies and their related investment objectives (e.g., the KCG strategy and an emerging-markets strategy), one Portfolio Management team may desire to vote differently than the other, or one team may desire to abstain from voting proxies while the other may desire to vote proxies. In this event, Lazard would generally defer to the recommendation of the KCG team to determine what action would be in the best interests of its clients. However, under unusual circumstances, the votes may be split between the two teams. In such event, a meeting of the Proxy Committee will be held to determine whether it would be appropriate to split the votes.
B-9
2. Stock Lending
As noted in Section B above, Lazard does not generally vote proxies for securities that a client has authorized their custodian bank to use in a stock loan program, which passes voting rights to the party with possession of the shares. Under certain circumstances, Lazard may determine to recall loaned stocks in order to vote the proxies associated with those securities. For example, if Lazard determines that the entity in possession of the stock has borrowed the stock solely to be able to obtain control over the issuer of the stock by voting proxies, or if the client should specifically request Lazard to vote the shares on loan, Lazard may determine to recall the stock and vote the proxies itself. However, it is expected that this will be done only in exceptional circumstances. In such event, Portfolio Management will make this determination and ProxyOps will vote the proxies in accordance with the Approved Guidelines.
H. Review of Policy
The Proxy Committee will review this Policy at least semi-annually to consider whether any changes should be made to it or to any of the Approved Guidelines. Questions or concerns regarding the Policy should be raised with Lazard’s General Counsel or Chief Compliance Officer.
B-10
MAI-FSTK-0613D

Mutual Funds
Nuveen Equity Funds
For investors seeking long-term capital appreciation.
Annual Report
September 30, 2012
| | | | | | | | |
| | | Share Class / Ticker Symbol |
| | | | |
| Fund Name | | Class A | | Class C | | Class R3 | | Class I |
Nuveen Symphony Large-Cap Growth Fund | | NCGAX | | NCGCX | | NSGQX | | NSGIX |
Nuveen Symphony Mid-Cap Core Fund | | NCCAX | | NCCCX | | NMCRX | | NCCIX |
Nuveen Symphony International Equity Fund | | NSIAX | | NSECX | | NSREX | | NSIEX |
Nuveen Symphony Optimized Alpha Fund | | NOPAX | | NOPCX | | — | | NOPRX |
LIFE IS COMPLEX.
Nuveen makes things e-simple.
It only takes a minute to sign up for e-Reports. Once enrolled, you’ll receive an e-mail as soon as your Nuveen Fund information is ready. No more waiting for delivery by regular mail. Just click on the link within the e-mail to see the report and save it on your computer if you wish.
Free e-Reports right to your e-mail!
www.investordelivery.com
If you receive your Nuveen Fund distributions and statements from your financial advisor or brokerage account.
OR
www.nuveen.com/accountaccess
If you receive your Nuveen Fund distributions and statements directly from Nuveen.
| | | | | | |
| Must be preceded by or accompanied by a prospectus. | | NOT FDIC INSURED | | MAY LOSE VALUE | | NO BANK GUARANTEE |
Table of Contents
Chairman’s
Letter to Shareholders

Dear Shareholders,
Investors have many reasons to remain cautious. The challenges in the Euro area continue to cast a shadow over global economies and financial markets. The political support for addressing fiscal issues is eroding as the economic and social impacts become more visible. Despite strong action by the European Central Bank, member nations appear unwilling to surrender sufficient sovereignty to unify the Euro area financial system or strengthen its banks. The gains made in reducing deficits, and the hard-won progress on winning popular acceptance of the need for economic austerity, are at risk. To their credit, European political leaders press on to find compromise solutions, but there is increasing concern that time is running out.
In the U.S., the extended period of increasing corporate earnings that enabled the equity markets to withstand the downward pressures coming from weakening job creation and slower economic growth appears to be coming to an end. The Fed remains committed to low interest rates and announced a third phase of quantitative easing (QE3) scheduled to continue until mid-2015. The recent election results have removed a major element of uncertainty in the U.S. political picture, but it remains to be seen whether the outcome will reduce the highly partisan atmosphere in Congress and enable progress on the many pressing fiscal and budgetary issues that must be resolved in the coming months.
During the last twelve months, U.S. investors have experienced a solid recovery in the domestic equity markets with increasing volatility as the ‘fiscal cliff’ approaches. The experienced investment teams at Nuveen keep their eye on a longer time horizon and use their practiced investment disciplines to negotiate through market peaks and valleys to achieve long-term goals for investors. Experienced professionals pursue investments that will weather short-term volatility and at the same time, seek opportunities that are created by markets that overreact to negative developments. Monitoring this process is an important consideration for the Fund Board as it oversees your Nuveen Fund on your behalf.
As always, I encourage you to contact your financial consultant if you have any questions about your investment in a Nuveen Fund. On behalf of the other members of your Fund Board, we look forward to continuing to earn your trust in the months and years ahead.
Sincerely,

Robert P. Bremner
Chairman of the Board
November 21, 2012
Portfolio Managers’ Comments
Certain statements in this report are forward-looking statements. Discussions of specific investments are for illustration only and are not intended as recommendations of individual investments. The forward-looking statements and other views expressed herein are those of the portfolio managers as of the date of this report. Actual future results or occurrences may differ significantly from those anticipated in any forward-looking statements and the views expressed herein are subject to change at any time, due to numerous market and other factors. The Funds disclaim any obligation to update publicly or revise any forward-looking statements or views expressed herein.
These Funds feature management by Symphony Asset Management LLC, an affiliate of Nuveen Investments. Gunther Stein, Director of Investment Strategies at Symphony, and Ross Sakamoto, CFA and Co-Director of Equity, and Joel Drescher, Co-Director of Equity serve as the portfolio managers for all the Funds. We recently spoke with the portfolio managers about general economic and market conditions, key investment strategies and Fund performance for the twelve-month period ended September 30, 2012.
What factors affected the U.S. economy and the equity market environments during the twelve-month reporting period ended September 30, 2012?
During the period, the U.S. economy’s progress toward recovery from recession remained sluggish but, for the most part, positive. The most recent figures available for U.S. gross domestic product (GDP) showed the economy had an annualized growth rate of 2.0% in the third quarter 2012. This marked the 13th consecutive quarter of positive growth. Inflation remained well contained, with the Consumer Price Index (CPI) rising 2.0% year-over-year as of September 2012. Core CPI (which excludes food and energy) increased 2.0% during the period, within the Fed’s unofficial objective of 2.0% or lower for this inflation measure.
Labor market conditions slowly improved, with the national unemployment rate registering 7.8% in September 2012. U.S. unemployment had been stalled out in the low 8% range since the beginning of the year. Meanwhile, the housing market was an unfamiliar bright spot as home prices had risen for three consecutive months at the end of the reporting period. Other encouraging signs included improved sales of existing homes and more robust home construction and an increase in the price of new homes. The most recent data available at the time this report was prepared, showed the average home price increased 2.0% for the 12 months ended August 2012, according to the S&P/Case-Shiller Index of 20 major metropolitan areas. However, with prices down more than one-third from their peak in the summer of 2006, housing has not fully recovered.
The Federal Reserve (Fed) maintained its efforts to improve the overall economic environment by continuing to hold the benchmark Fed Funds rate at the record low level of zero to 0.25% that it had established in December 2008. At its October 2012 meeting (following the end of this reporting period), the central bank affirmed its opinion that economic conditions would likely warrant keeping the rate at “exceptionally low levels” through mid-2015. The Fed also announced that it would extend its Operation Twist program, lengthening the average maturity of its holdings of U.S. Treasury securities, through the end of December 2012. The goals of this program are to lower longer-term interest rates, make broader financial conditions more accommodating, support a
stronger economic recovery and help ensure that inflation remains at levels consistent with the Fed’s mandates of maximum employment and price stability.
U.S. equity markets were likewise impacted by the same risk environment, but ended up producing strong double-digit returns for the period as a whole. Large-cap U.S. stocks, as measured by the S&P 500® Index, ended the one-year period with a 10.20% return, reaching a level not seen since the beginning of 2008. The small- and mid-cap segments produced returns of 31.91% and 28.03%, as measured by the Russell 2000® and the Russell Midcap® Indexes, respectively. The best-performing areas of the U.S. equity market during the year included the telecommunications, technology, consumer discretionary and health care sectors. Meanwhile, the steps taken in Europe to reduce financial risk helped overseas markets recover some of their losses from earlier in the period. Developed markets posted a 12-month return of 13.75% according to the MSCI EAFE Index, which tracks the performance of stocks from markets in Europe, Australasia and the Far East. Emerging markets also recovered after their dramatic sell-off in 2011, ending the fiscal year period with a 16.93% return, as measured by the MSCI Emerging Markets Index.
How did the Funds perform during the twelve-month period ended September 30, 2012?
The tables in the Fund Performance and Expense Ratios section of this report provide total return performance information for the Funds’ Class A Shares at net asset value (NAV) for the one-year, five-year and since inception periods ending September 30, 2012. The tables also compare the Funds’ returns to comparative market indexes and Lipper classification averages. A more detailed account of each Fund’s performance is provided later in this report.
What was the primary investment strategy for each Fund, and how did this strategy affect the Fund’s performance for the twelve-month period ended September 30, 2012?
Nuveen Symphony Large-Cap Growth Fund
The Fund’s Class A Shares at NAV outperformed both the Russell 1000® Growth Index and the Lipper Multi-Cap Growth Funds Classification Average during the reporting period.
The Fund seeks to offer long-term capital appreciation potential by investing in a portfolio of large-capitalization growth stocks selected using a bottom-up process that combines quantitative methods for screening and risk control with qualitative methods for security selection and portfolio construction. Quantitative screening simplifies and disciplines the stock-selection process, sharpening the focus of the research team that makes investment decisions. Qualitative methods then add in-depth analysis of earnings quality, industry trends, trading characteristics and accounting practices. Overall, the Fund tries to avoid credit sensitive companies, such as those with high financial leverage or vulnerable capital structures, and shows a preference for firms with strong cash flow generation, conservative management and market leadership.
During the reporting period, the Fund’s information technology, materials and financial holdings contributed positively to performance. One of our top performing stocks was
Apple, Inc. Apple’s new iPhone and iPad have had success beyond street expectations. Moreover, the company announced it would begin paying a dividend and institute a share repurchase program this year. The last time the company paid a dividend was in 1995. Another information technology holding that contributed to performance was QUALCOMM, Inc. Investors continue to be positive about this digital wireless communication equipment manufacturer as it is a major component supplier to Apple’s newest iPhone and sales expectations have been very strong. Finally, the consumer staples holding Philip Morris International was a good performer. The stock price surged after the company issued a better than expected full year outlook in February and has continued to outperform the market after three consecutive quarters of solid execution despite economic challenges in Europe.
We had several positions which negatively impacted performance, including Superior Energy Services, Inc., an oilfield services and equipment company serving onshore and offshore oil and gas drilling projects globally. Shares underperformed as concerns about oversupply in the North American pressure pumping business coincided with a sharp decline in natural gas prices. Also underperforming was Joy Global Inc., which manufactures and markets underground mining and surface mining equipment. The stock’s slide began shortly after the company reported in line first quarter 2012 revenue and earnings per share that were offset by modestly weaker margins. The company also revised guidance down twice as deceleration in China’s economy impacted the markets. Lastly, International Game Technology detracted from performance. The company designs and manufactures computerized casino gaming systems. The company missed earnings due to increased price competition and uncertainty in the operating environment.
Nuveen Symphony Mid-Cap Core Fund
The Fund’s Class A Shares at NAV slightly underperformed both the Russell Midcap® Index and the Lipper Mid-Cap Core Funds Classification Average during the reporting period.
The Fund seeks to provide long-term capital appreciation by investing in mid-capitalization core equities using a bottom-up process that combines quantitative methods for screening and risk control with qualitative methods for security selection and portfolio construction. Quantitative screening simplifies and disciplines the stock-selection process, sharpening the focus of the research team that makes investment decisions. Qualitative methods then add in-depth analysis of earnings quality, industry trends, trading characteristics and accounting practices. Overall, the Fund tries to avoid credit sensitive companies with high financial leverage or vulnerable capital structures, and shows a preference for firms with strong cash flow generation, conservative management and market leadership.
Our energy, financial and consumer discretionary holdings contributed positively to performance versus the benchmark. One such position was Tesoro Corporation, an independent petroleum refiner and marketer, which saw share prices increase in August following strong earnings, dividend initiation, a new share repurchase program and the acquisition of BP’s Carson City refinery. CF Industries Holdings, Inc., a worldwide manufacturer and distributor of fertilizers, also contributed to performance. The company’s
outperformance was attributable to rising corn prices, high corn acreage, and relatively low natural gas costs. Company-specific initiatives such as capacity expansion and capital allocation were also beneficial. Also positively contributing to performance was Kansas City Southern, a railroad company controlling a network located throughout the Midwest and into Mexico. The stock performed well as the company consistently beat core earnings projections and realized solid growth in its carload traffic. We believe the company is well positioned to benefit from cross-border rail traffic coming out of Mexico and into the United States. Mexico has attracted increased investment from U.S. companies looking to outsource manufacturing due to China’s rising labor costs. The expansion of the Port of Lazaro Cardenas in Southwestern Mexico should also increase volume.
Several positions contributed to under performance during the reporting period. In particular, Superior Energy Services, Inc., an oilfield services and equipment company serving onshore and offshore oil and gas drilling projects globally, declined as concerns about oversupply in the North American pressure pumping business coincided with a sharp decline in natural gas prices. As a result, the company issued conservative 2012 earnings per share guidance. Also detracting from performance was First Niagara Financial Group Inc., which provides a range of retail and commercial banking services. Share prices fell after the company posted mixed first quarter 2012 results due to the sluggish economy and less favorable interest rates weighing on the purchase of HSBC branches. Lastly, Titanium Metals Corporation negatively impacted performance. Share prices underperformed as industrial titanium demand and declines in spot titanium ingot pricing coincided with investors’ concerns of the company’s revenue exposure to Europe.
Nuveen Symphony International Equity Fund
The Fund’s Class A Shares at NAV outperformed the MSCI EAFE Index and performed in line with the Lipper International Multi-Cap Growth Funds Classification Average during the reporting period.
The Fund seeks to provide portfolio diversification potential and exposure to the performance of international companies through a portfolio of both growth and value non-U.S. equity securities. Stocks are selected using a bottom-up process that combines quantitative methods for screening and risk control with qualitative methods for security selection and portfolio construction. Quantitative screening simplifies and disciplines the stock-selection process, sharpening the focus of the research team that makes investment decisions. Qualitative methods then add in-depth analysis of earnings quality, industry trends, trading characteristics and accounting practices.
During the reporting period, Japan, the U.S. and Hong Kong contributed positively to performance from a country perspective. Financials, utilities and consumer discretionary contributed to performance from a sector perspective versus the benchmark. Hannover Rueckversicherung AG, the fourth largest re-insurer globally, saw share prices steadily increase as the company consistently posted top line property and casualty growth. ASML Holding also contributed positively to performance. The company provides lithography systems to the semiconductor industry for manufacturing complex integrated circuits. During the reporting period, ASML’s stock price continued to improve after concerns that an economic slowdown would dampen spending on new semiconductor equipment.
ASML orders remained stable at the beginning of the reporting period, and the company continued to exceed analysts’ expectations.
Australia, Sweden and United Kingdom holdings underperformed versus the benchmark from a country perspective. The electronics and energy sectors detracted from performance from a sector perspective versus the benchmark. Nippon Electric Glass Company Limited, which manufactures glass for various electronic uses, underperformed due to a continued decline in LCD glass prices. These lower prices were driven by lower demand and aggressive pricing by rivals. Also negatively impacting performance was Repsol YPF S.A., an integrated oil company that explores for and produces crude oil and natural gas. Repsol’s stock price declined on rumors that Argentina was planning to nationalize the YPF unit of Repsol. Lastly, Canon Inc. detracted from performance. Share prices underperformed the MSCI EAFE Index in dollar terms during the first quarter 2012 due to Japanese yen depreciation against the U.S. dollar. In the second quarter 2012, however, Canon lagged the index as the strengthening yen and macroeconomic deterioration weighed on sales expectations.
Nuveen Symphony Optimized Alpha Fund
The Fund’s Class A Shares at NAV underperformed both the S&P 500® Index and the Lipper Large-Cap Core Funds Classification Average during the reporting period.
The Fund seeks to provide long-term capital appreciation potential with lower absolute volatility than the broad equity market by constructing a portfolio with stocks having relatively low performance correlations. The stocks are selected using a bottom-up process that consists of a combination of quantitative screens and fundamental research, which seek to create portfolios that deliver consistent returns.
The quantitative screens employ models to identify stocks with higher return potential, assessment of analyst opinions, earnings quality, current valuation and insider behavior. We also focus on portfolio construction, using a process designed to optimize for the highest projected return per unit of total risk, relative to a benchmark. In general, the Fund tries to avoid credit sensitive companies with high financial leverage, and vulnerable capital structures, and shows a preference for firms with strong cash flow generation, conservative management and market leadership.
Our energy, industrials and information technology holdings contributed positively to performance versus the benchmark. One of our top performing stocks included Apple, Inc. Apple’s new iPhone and iPad have had success beyond street expectations. Moreover, the company announced it would begin paying a dividend and institute a share repurchase program this year. The last time the company paid a dividend was in 1995. Also contributing to performance was Biogen Idec Inc., which benefited from positive drug developments which increased sales momentum. Lastly, General Electric Company also aided performance after the company raised its quarterly dividend and called for a double-digit increase in fiscal 2012 profit during its outlook meeting in late 2011.
Several holdings detracted from performance, including Visteon Corporation. Share prices of this global automotive supplier declined after announcing the sale of its lighting
business to Varroc. International Game Technology also detracted from performance. The company, which designs and manufactures computerized casino gaming systems, missed earnings due to increasing price competition and an increasingly uncertain operating environment. Lastly, Chesapeake Energy Corporation underperformed. This U.S. based producer of natural gas, natural gas liquids, and oil traded lower following disclosure of liquidity issues despite the company’s attractive portfolio of assets.
Risk Considerations
Mutual fund investing involves risk; principal loss is possible. Equity investments are subject to market risk. Foreign investments involve additional risks, including currency fluctuation, political and economic instability, lack of liquidity and differing legal and accounting standards. These risks are magnified in emerging markets. Investments in small- and mid-cap companies are subject to greater volatility.
Fund Performance and Expense Ratios
The Fund Performance and Expense Ratios for each Fund are shown on the following eight pages.
Returns quoted represent past performance, which is no guarantee of future results. Current performance may be higher or lower than the performance shown. Investment returns and principal value will fluctuate so that when shares are redeemed, they may be worth more or less than their original cost. Returns without sales charges would be lower if the sales charge were included. Returns do not reflect the deduction of taxes that a shareholder would pay on Fund distributions or the redemption of Fund shares.
Returns may reflect a contractual agreement between certain Funds and the investment adviser to waive certain fees and expenses; see Notes to Financial Statements, Footnote 7 — Management Fees and Other Transactions with Affiliates for more information. In addition, returns may reflect a voluntary expense limitation by the Funds’ investment adviser that may be modified or discontinued at any time without notice. For the most recent month-end performance visit www.nuveen.com or call (800) 257-8787.
Returns reflect differences in sales charges and expenses, which are primarily differences in distribution and service fees. Fund returns assume reinvestment of dividends and capital gains.
Comparative index and Lipper return information is provided for the Funds’ Class A Shares at net asset value (NAV) only.
The expense ratios shown reflect the Funds’ total operating expenses (before fee waivers and/or expense reimbursements, if any) as shown in the Funds’ most recent prospectus. The expense ratios include management fees and other fees and expenses.
Fund Performance and Expense Ratios (continued)
Nuveen Symphony Large-Cap Growth Fund
Refer to the first page of this Fund Performance and Expense Ratios section for further explanation of the information included within this page.
Fund Performance
Average Annual Total Returns as of September 30, 2012
| | | | | | | | | | | | |
| |
| | | Average Annual | |
| | | |
| | | 1-Year | | | 5-Year | | | Since
Inception* | |
Class A Shares at NAV | | | 32.70% | | | | 5.41% | | | | 6.28% | |
Class A Shares at maximum Offering Price | | | 25.08% | | | | 4.18% | | | | 5.20% | |
Russell 1000® Growth Index** | | | 29.19% | | | | 3.24% | | | | 4.74% | |
Lipper Multi-Cap Growth Funds Classification Average** | | | 26.13% | | | | 0.92% | | | | 3.24% | |
| | | |
Class C Shares | | | 31.68% | | | | 4.63% | | | | 5.49% | |
Class R3 Shares | | | 32.32% | | | | 5.14% | | | | 6.00% | |
Class I Shares | | | 33.00% | | | | 5.66% | | | | 6.54% | |
Class A Shares have a maximum 5.75% sales charge (Offering Price). Class A Share purchases of $1 million or more are sold at net asset value without an up-front sales charge but may be subject to a contingent deferred sales charge (CDSC), also known as a back-end sales charge, if redeemed within twelve months of purchase. Class C Shares have a 1% CDSC for redemptions within less than twelve months, which is not reflected in the one-year total return. Class R3 Shares have no sales charge and are available to only certain retirement plans. Class I Shares have no sales charge and may be purchased under limited circumstances or by specified classes of investors.
Expense Ratios as of Most Recent Prospectus
| | | | | | | | |
| | |
| | | Gross
Expense
Ratios | | | Net
Expense
Ratios | |
Class A Shares | | | 2.36% | | | | 1.23% | |
Class C Shares | | | 3.18% | | | | 1.98% | |
Class R3 Shares | | | 2.67% | | | | 1.48% | |
Class I Shares | | | 2.26% | | | | 0.98% | |
The Fund’s investment adviser has agreed to waive fees and/or reimburse expenses through January 31, 2013 so that total annual Fund operating expenses (excluding 12b-1 distribution and/or service fees, interest expenses, taxes, acquired fund fees and expenses, fees incurred in acquiring and disposing of portfolio securities and extraordinary expenses) do not exceed 1.00% (1.35% after January 31, 2013) of the average daily net assets of any class of Fund shares. The expense limitation expiring January 31, 2013, may be terminated or modified prior to that date only with the approval of the Board of Trustees of the Fund. The expense limitation in effect thereafter may be terminated or modified only with the approval of shareholders of the Fund.
| * | Since inception returns for Class A, C and I Shares, and for the comparative index and Lipper classification average, are from 12/15/06. Class A, C, and I Share returns are actual. Class R3 Shares commenced operations on 9/29/09. The returns for Class R3 Shares are actual for the periods since class inception on 9/29/09; returns prior to class inception are Class I Share returns adjusted for the differences in sales charges and expenses, which are primarily differences in distribution and service fees. |
| ** | Refer to the Glossary of Terms Used in this Report for definitions. Indexes and Lipper averages are not available for direct investment. |
Growth of an Assumed $10,000 Investment as of September 30, 2012 – Class A Shares
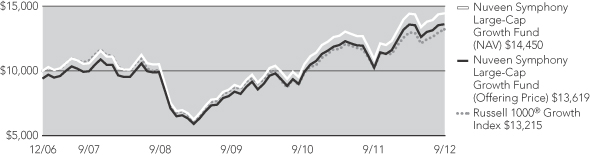
The graph does not reflect the deduction of taxes that a shareholder may pay on Fund distributions or the redemption of Fund shares.
Fund Performance and Expense Ratios (continued)
Nuveen Symphony Mid-Cap Core Fund
Refer to the first page of this Fund Performance and Expense Ratios section for further explanation of the information included within this page.
Fund Performance
Average Annual Total Returns as of September 30, 2012
| | | | | | | | | | | | |
| |
| | | Average Annual | |
| | | |
| | | 1-Year | | | 5-Year | | | Since
Inception* | |
Class A Shares at NAV | | | 25.66% | | | | 2.66% | | | | 4.74% | |
Class A Shares at maximum Offering Price | | | 18.42% | | | | 1.45% | | | | 3.77% | |
Russell Midcap® Index** | | | 28.03% | | | | 2.24% | | | | 4.80% | |
Lipper Mid-Cap Core Funds Classification Average** | | | 26.02% | | | | 1.10% | | | | 3.72% | |
| | | |
Class C Shares | | | 24.77% | | | | 1.90% | | | | 3.96% | |
Class R3 Shares | | | 25.38% | | | | 2.40% | | | | 4.47% | |
Class I Shares | | | 26.00% | | | | 2.92% | | | | 5.01% | |
Class A Shares have a maximum 5.75% sales charge (Offering Price). Class A Share purchases of $1 million or more are sold at net asset value without an up-front sales charge but may be subject to a contingent deferred sales charge (CDSC), also known as a back-end sales charge, if redeemed within twelve months of purchase. Class C Shares have a 1% CDSC for redemptions within less than twelve months, which is not reflected in the one-year total return. Class R3 Shares have no sales charge and are available to only certain retirement plans. Class I Shares have no sales charge and may be purchased under limited circumstances or by specified classes of investors.
Expense Ratios as of Most Recent Prospectus
| | | | | | | | |
| | |
| | | Gross
Expense
Ratios | | | Net
Expense
Ratios | |
Class A Shares | | | 4.57% | | | | 1.38% | |
Class C Shares | | | 5.46% | | | | 2.13% | |
Class R3 Shares | | | 5.38% | | | | 1.63% | |
Class I Shares | | | 4.86% | | | | 1.13% | |
The Fund’s investment adviser has agreed to waive fees and/or reimburse expenses through January 31, 2013 so that total annual Fund operating expenses (excluding 12b-1 distribution and/or service fees, interest expenses, taxes, acquired fund fees and expenses, fees incurred in acquiring and disposing of portfolio securities and extraordinary expenses) do not exceed 1.15% (1.40% after January 31, 2013) of the average daily net assets of any class of Fund shares. The expense limitation expiring January 31, 2013, may be terminated or modified prior to that date only with the approval of the Board of Trustees of the Fund. The expense limitation in effect thereafter may be terminated or modified only with the approval of shareholders of the Fund.
| * | Since inception returns for Class A, C and I Shares, and for the comparative index and Lipper category average, are from 5/31/06. Class A, C, and I Share returns are actual. Class R3 Shares commenced operations on 5/05/09. The returns for Class R3 Shares are actual for the periods since class inception on 5/05/09; returns prior to class inception are Class I Share returns adjusted for the differences in sales charges and expenses, which are primarily differences in distribution and service fees. |
| ** | Refer to the Glossary of Terms Used in this Report for definitions. Indexes and Lipper averages are not available for direct investment. |
Growth of an Assumed $10,000 Investment as of September 30, 2012 – Class A Shares
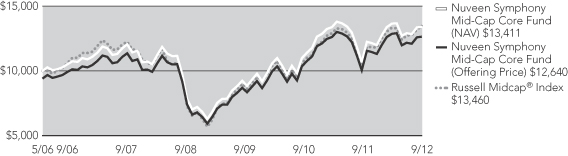
The graph does not reflect the deduction of taxes that a shareholder may pay on Fund distributions or the redemption of Fund shares.
Fund Performance and Expense Ratios (continued)
Nuveen Symphony International Equity Fund
Refer to the first page of this Fund Performance and Expense Ratios section for further explanation of the information included within this page.
Fund Performance
Average Annual Total Returns as of September 30, 2012
| | | | | | | | |
| |
| | | Average Annual | |
| | |
| | | 1-Year | | | Since
Inception* | |
Class A Shares at NAV | | | 17.07% | | | | -5.36% | |
Class A Shares at maximum Offering Price | | | 10.35% | | | | -6.64% | |
MSCI EAFE Index** | | | 13.75% | | | | -4.97% | |
Lipper International Multi-Cap Growth Funds Classification Average** | | | 17.09% | | | | -4.01% | |
| | |
Class C Shares | | | 16.18% | | | | -6.07% | |
Class R3 Shares | | | 16.81% | | | | -5.59% | |
Class I Shares | | | 17.38% | | | | -5.12% | |
Class A Shares have a maximum 5.75% sales charge (Offering Price). Class A Share purchases of $1 million or more are sold at net asset value without an up-front sales charge but may be subject to a contingent deferred sales charge (CDSC), also known as a back-end sales charge, if redeemed within twelve months of purchase. Class C Shares have a 1% CDSC for redemptions within less than twelve months, which is not reflected in the one-year total return. Class R3 Shares have no sales charge and are available to only certain retirement plans. Class I Shares have no sales charge and may be purchased under limited circumstances or by specified classes of investors.
Expense Ratios as of Most Recent Prospectus
| | | | | | | | |
| | |
| | | Gross
Expense
Ratios | | | Net
Expense
Ratios | |
Class A Shares | | | 10.21% | | | | 1.37% | |
Class C Shares | | | 10.95% | | | | 2.12% | |
Class R3 Shares | | | 10.55% | | | | 1.62% | |
Class I Shares | | | 10.01% | | | | 1.12% | |
The Fund’s investment adviser has agreed to waive fees and/or reimburse expenses through January 31, 2013 so that total annual Fund operating expenses (excluding 12b-1 distribution and/or service fees, interest expenses, taxes, acquired fund fees and expenses, fees incurred in acquiring and disposing of portfolio securities and extraordinary expenses) do not exceed 1.13% (1.38% after January 31, 2013) of the average daily net assets of any class of Fund shares. The expense limitation expiring January 31, 2013, may be terminated or modified prior to that date only with the approval of the Board of Trustees of the Fund. The expense limitation in effect thereafter may be terminated or modified only with the approval of shareholders of the Fund.
| * | Since inception returns for Class A, C and I Shares, and for the comparative index and Lipper category average, are from 5/30/08. Class A, C, and I Share returns are actual. Class R3 Shares commenced operations on 10/05/10. The returns for Class R3 Shares are actual for the periods since class inception on 10/05/10; returns prior to class inception are Class I Share returns adjusted for the differences in sales charges and expenses, which are primarily differences in distribution and service fees. |
| ** | Refer to the Glossary of Terms Used in this Report for definitions. Indexes and Lipper averages are not available for direct investment. |
Growth of an Assumed $10,000 Investment as of September 30, 2012 – Class A Shares
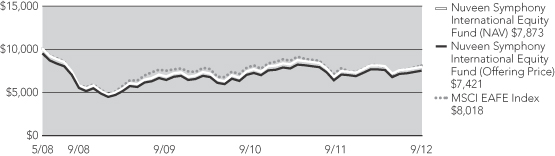
The graph does not reflect the deduction of taxes that a shareholder may pay on Fund distributions or the redemption of Fund shares.
Fund Performance and Expense Ratios (continued)
Nuveen Symphony Optimized Alpha Fund
Refer to the first page of this Fund Performance and Expense Ratios section for further explanation of the information included within this page.
Fund Performance
Average Annual Total Returns as of September 30, 2012
| | | | | | | | | | | | |
| |
| | | Average Annual | |
| | | |
| | | 1-Year | | | 5-Year | | | Since
Inception* | |
Class A Shares at NAV | | | 26.17% | | | | 2.73% | | | | 2.73% | |
Class A Shares at maximum Offering Price | | | 18.95% | | | | 1.52% | | | | 1.52% | |
S&P 500® Index** | | | 30.20% | | | | 1.05% | | | | 1.05% | |
Lipper Large-Cap Core Funds Classification Average** | | | 27.49% | | | | 0.01% | | | | 0.01% | |
| | | |
Class C Shares | | | 25.24% | | | | 1.96% | | | | 1.96% | |
Class I Shares | | | 26.56% | | | | 2.99% | | | | 2.98% | |
Class A Shares have a maximum 5.75% sales charge (Offering Price). Class A Share purchases of $1 million or more are sold at net asset value without an up-front sales charge but may be subject to a contingent deferred sales charge (CDSC), also known as a back-end sales charge, if redeemed within twelve months of purchase. Class C Shares have a 1% CDSC for redemptions within less than twelve months, which is not reflected in the one-year total return. Class I Shares have no sales charge and may be purchased under limited circumstances or by specified classes of investors.
Expense Ratios as of Most Recent Prospectus
| | | | | | | | |
| | |
| | | Gross
Expense
Ratios | | | Net
Expense
Ratios | |
Class A Shares | | | 5.79% | | | | 1.23% | |
Class C Shares | | | 6.72% | | | | 1.98% | |
Class I Shares | | | 5.56% | | | | 0.98% | |
The Fund’s investment adviser has agreed to waive fees and/or reimburse expenses through January 31, 2013 so that total annual Fund operating expenses (excluding 12b-1 distribution and/or service fees, interest expenses, taxes, acquired fund fees and expenses, fees incurred in acquiring and disposing of portfolio securities and extraordinary expenses) do not exceed 1.00% (1.45% after January 31, 2013) of the average daily net assets of any class of Fund shares. The expense limitation expiring January 31, 2013, may be terminated or modified prior to that date only with the approval of the Board of Trustees of the Fund. The expense limitation in effect thereafter may be terminated or modified only with the approval of shareholders of the Fund.
| * | Since inception returns are from 9/28/07. |
| ** | Refer to the Glossary of Terms Used in this Report for definitions. Indexes and Lipper averages are not available for direct investment. |
Growth of an Assumed $10,000 Investment as of September 30, 2012 – Class A Shares
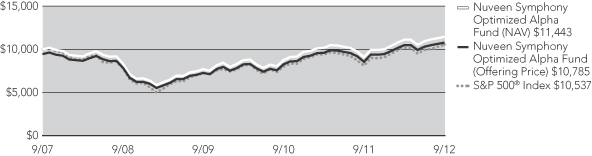
The graph does not reflect the deduction of taxes that a shareholder may pay on Fund distributions or the redemption of Fund shares.
Holding Summaries as of September 30, 2012
This data relates to the securities held in each Fund’s portfolio of investments. It should not be construed as a measure of performance for the Fund itself.
Nuveen Symphony Large-Cap Growth Fund
Portfolio Allocation1
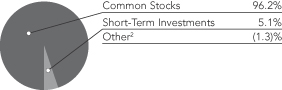
Nuveen Symphony Mid-Cap Core Fund
Portfolio Allocation1
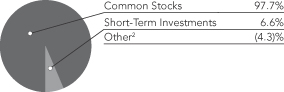
| | | | |
| Portfolio Composition1 | | | |
| Computers & Peripherals | | | 10.9% | |
| Software | | | 8.5% | |
| IT Services | | | 5.8% | |
| Chemicals | | | 5.0% | |
| Semiconductors & Equipment | | | 4.9% | |
| Machinery | | | 4.7% | |
| Specialty Retail | | | 4.7% | |
| Health Care Providers & Services | | | 4.6% | |
| Internet Software & Services | | | 4.5% | |
| Tobacco | | | 4.1% | |
| Hotels, Restaurants & Leisure | | | 2.9% | |
| Pharmaceuticals | | | 2.8% | |
| Multiline Retail | | | 2.6% | |
| Media | | | 2.5% | |
| Food & Staples Retailing | | | 2.3% | |
| Biotechnology | | | 2.0% | |
| Health Care Equipment & Supplies | | | 1.9% | |
| Retail REIT | | | 1.9% | |
| Oil, Gas & Consumable Fuels | | | 1.9% | |
| Short-Term Investments | | | 5.1% | |
| Other4 | | | 16.4% | |
| | | | |
| Portfolio Composition1 | | | |
| Specialty Retail | | | 9.6% | |
| Insurance | | | 6.2% | |
| Chemicals | | | 5.9% | |
| Health Care Providers & Services | | | 5.5% | |
| Machinery | | | 5.4% | |
| Multi-Utilities | | | 5.3% | |
| Oil, Gas & Consumable Fuels | | | 5.2% | |
| Retail REIT | | | 5.1% | |
| Capital Markets | | | 4.7% | |
| Software | | | 4.5% | |
| IT Services | | | 3.8% | |
| Semiconductors & Equipment | | | 3.1% | |
| Apparel, Accesories & Luxury Goods | | | 3.0% | |
| Beverages | | | 2.8% | |
| Household Durables | | | 2.4% | |
| Building Products | | | 2.3% | |
| Hotels, Restaurants & Leisure | | | 2.3% | |
| Short-Term Investments | | | 6.6% | |
| Other5 | | | 16.3% | |
| | | | |
Top Five Common Stock
Holdings3 | |
| Apple, Inc. | | | 9.2% | |
| Microsoft Corporation | | | 4.0% | |
| Google Inc., Class A | | | 2.9% | |
| Amgen Inc. | | | 2.1% | |
| Oracle Corporation | | | 2.1% | |
| | | | |
| Top Five Common Stock Holdings3 | |
| CBL & Associates Properties Inc. | | | 2.2% | |
| Tesoro Corporation | | | 2.0% | |
| Taubman Centers Inc. | | | 1.9% | |
| CF Industries Holdings, Inc. | | | 1.8% | |
| CenterPoint Energy, Inc | | | 1.8% | |
| 1 | As a percentage of net assets as of September 30, 2012. Holdings are subject to change. |
| 2 | Other assets less liabilities. |
| 3 | As a percentage of total common stocks as of September 30, 2012. Holdings are subject to change. |
| 4 | Includes other assets less liabilities and all industries less than 1.9% of total net assets. |
| 5 | Includes other assets less liabilities and all industries less than 2.3% of total net assets. |
This data relates to the securities held in each Fund’s portfolio of investments. It should not be construed as a measure of performance for the Fund itself.
Nuveen Symphony International Equity Fund
Portfolio Allocation1
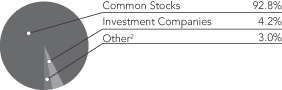
Nuveen Symphony Optimized Alpha Fund
Portfolio Allocation1
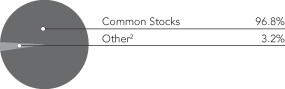
| | | | |
| Portfolio Composition1 | | | |
| Commercial Banks | | | 12.9% | |
| Oil, Gas & Consumable Fuels | | | 7.5% | |
| Pharmaceuticals | | | 7.0% | |
| Metals & Mining | | | 6.2% | |
| Insurance | | | 5.6% | |
| Food Products | | | 4.5% | |
| Investment Companies | | | 4.2% | |
| Textiles, Apparel & Luxury Goods | | | 3.8% | |
| Real Estate Management & Development | | | 3.6% | |
| Electrical Equipment | | | 3.4% | |
| Automobiles | | | 2.9% | |
| Chemicals | | | 2.8% | |
| Wireless Telecommunication Services | | | 2.8% | |
| Industrial Conglomerates | | | 2.6% | |
| Machinery | | | 2.4% | |
| Beverages | | | 2.3% | |
| Food & Staples Retailing | | | 2.2% | |
| Semiconductors & Equipment | | | 2.2% | |
| Multiline Retail | | | 1.9% | |
| Other4 | | | 19.2% | |
| | | | |
| Portfolio Composition1 | | | |
| Pharmaceuticals | | | 7.2% | |
| Oil, Gas & Consumable Fuels | | | 6.6% | |
| Computers & Peripherals | | | 6.2% | |
| Specialty Retail | | | 5.3% | |
| Real Estate Investment Trust | | | 4.7% | |
| Software | | | 4.3% | |
| Insurance | | | 4.3% | |
| Tobacco | | | 4.2% | |
| Commercial Banks | | | 3.6% | |
| Multi-Utilities | | | 3.4% | |
| Biotechnology | | | 3.0% | |
| Food Products | | | 2.9% | |
| Beverages | | | 2.8% | |
| Diversified Telecommunication Services | | | 2.7% | |
| IT Services | | | 2.7% | |
| Semiconductors & Equipment | | | 2.7% | |
| Health Care Equipment & Supplies | | | 2.6% | |
| Industrial Conglomerates | | | 2.2% | |
| Metals & Mining | | | 2.2% | |
| Multiline Retail | | | 1.8% | |
| Aerospace & Defense | | | 1.8% | |
| Machinery | | | 1.7% | |
| Food & Staples Retailing | | | 1.6% | |
| Other6 | | | 19.5% | |
| | | | |
Top Five Common Stock
Holdings3 | |
| Hannover Rueckversicherung AG | | | 2.8% | |
| DnB NOR ASA | | | 2.5% | |
| Coca-Cola Amatil Limited | | | 2.4% | |
| ASM Lithography Holding NV | | | 2.4% | |
| Royal Dutch Shell PLC, Class B Shares | | | 2.3% | |
| | | | |
| Country Allocation5 | | | |
| United Kingdom | | | 22.9% | |
| Japan | | | 12.7% | |
| France | | | 7.8% | |
| Australia | | | 6.3% | |
| Germany | | | 5.9% | |
| United States | | | 5.8% | |
| Canada | | | 5.0% | |
| Switzerland | | | 4.9% | |
| Netherlands | | | 4.0% | |
| Norway | | | 3.8% | |
| Luxembourg | | | 3.2% | |
| Other | | | 17.7% | |
| | | | |
Top Five Common Stock
Holdings3 | |
| Apple, Inc. | | | 6.4% | |
| Johnson & Johnson | | | 3.3% | |
| Altria Group, Inc. | | | 2.9% | |
| Microsoft Corporation | | | 2.7% | |
| Verizon Communications Inc. | | | 2.3% | |
| 1 | As a percentage of net assets as of September 30, 2012. Holdings are subject to change. |
| 2 | Others assets less liabilities. |
| 3 | As a percentage of total common stocks as of September 30, 2012. Holdings are subject to change. |
| 4 | Includes other assets less liabilities and all industries less than 2.2% of total net assets. |
| 5 | As a percentage of total investments as of September 30, 2012. Holdings are subject to change. |
| 6 | Includes other assets less liabilities and all industries less than 1.7% of total net assets. |
Expense Examples
As a shareholder of one or more of the Funds, you incur two types of costs: (1) transaction costs, including up-front and back-end sales charges (loads) or redemption fees, where applicable; and (2) ongoing costs, including management fees; distribution and service (12b-1) fees, where applicable; and other Fund expenses. The Examples below are intended to help you understand your ongoing costs (in dollars) of investing in the Funds and to compare these costs with the ongoing costs of investing in other mutual funds.
The Examples below are based on an investment of $1,000 invested at the beginning of the period and held for the period.
The information under “Actual Performance,” together with the amount you invested, allows you to estimate actual expenses incurred over the reporting period. Simply divide your account value by $1,000 (for example, an $8,600 account value divided by $1,000 = 8.60) and multiply the result by the cost shown for your share class, in the row entitled “Expenses Incurred During Period” to estimate the expenses incurred on your account during this period.
The information under “Hypothetical Performance,” provides information about hypothetical account values and hypothetical expenses based on the respective Fund’s actual expense ratio and an assumed rate of return of 5% per year before expenses, which is not the Fund’s actual return. The hypothetical account values and expenses may not be used to estimate the actual ending account balance or expense you incurred for the period. You may use this information to compare the ongoing costs of investing in the Fund and other Funds. To do so, compare this 5% hypothetical example with the 5% hypothetical examples that appear in the shareholder reports of the other funds.
Please note that the expenses shown in the table are meant to highlight your ongoing costs only and do not reflect any transaction costs. Therefore, the hypothetical information is useful in comparing ongoing costs only, and will not help you determine the relative total costs of owning different funds or share classes. In addition, if these transaction costs were included, your costs would have been higher.
Nuveen Symphony Large-Cap Growth Fund
| | | | | | | | | | | | | | | | | | | | | | | | | | | | | | | | | | |
| | | | | | | | | | | | | | | | | Hypothetical Performance | |
| | | Actual Performance | | | | | (5% annualized return before expenses) | |
| | | A Shares | | | C Shares | | | R3 Shares | | | I Shares | | | | | A Shares | | | C Shares | | | R3 Shares | | | I Shares | |
| Beginning Account Value (4/01/12) | | $ | 1,000.00 | | | $ | 1,000.00 | | | $ | 1,000.00 | | | $ | 1,000.00 | | | | | $ | 1,000.00 | | | $ | 1,000.00 | | | $ | 1,000.00 | | | $ | 1,000.00 | |
| Ending Account Value (9/30/12) | | $ | 1,002.40 | | | $ | 998.30 | | | $ | 1,000.80 | | | $ | 1,003.50 | | | | | $ | 1,018.90 | | | $ | 1,015.15 | | | $ | 1,017.65 | | | $ | 1,020.15 | |
| Expenses Incurred During Period | | $ | 6.11 | | | $ | 9.84 | | | $ | 7.35 | | | $ | 4.86 | | | | | $ | 6.16 | | | $ | 9.92 | | | $ | 7.41 | | | $ | 4.90 | |
For each class of the Fund, expenses are equal to the Portfolio’s annualized net expense ratio of 1.22%, 1.97%, 1.47% and ..97% for Classes A, C, R3 and I, respectively, multiplied by the average account value over the period, multiplied by 183/366 (to reflect the one-half year period).
Nuveen Symphony Mid-Cap Core Fund
| | | | | | | | | | | | | | | | | | | | | | | | | | | | | | | | | | |
| | | | | | | | | | | | | | | | | Hypothetical Performance | |
| | | Actual Performance | | | | | (5% annualized return before expenses) | |
| | | A Shares | | | C Shares | | | R3 Shares | | | I Shares | | | | | A Shares | | | C Shares | | | R3 Shares | | | I Shares | |
| Beginning Account Value (4/01/12) | | $ | 1,000.00 | | | $ | 1,000.00 | | | $ | 1,000.00 | | | $ | 1,000.00 | | | | | $ | 1,000.00 | | | $ | 1,000.00 | | | $ | 1,000.00 | | | $ | 1,000.00 | |
| Ending Account Value (9/30/12) | | $ | 981.20 | | | $ | 977.50 | | | $ | 980.00 | | | $ | 982.20 | | | | | $ | 1,018.15 | | | $ | 1,014.40 | | | $ | 1,016.90 | | | $ | 1,019.40 | |
| Expenses Incurred During Period | | $ | 6.79 | | | $ | 10.48 | | | $ | 8.02 | | | $ | 5.55 | | | | | $ | 6.91 | | | $ | 10.68 | | | $ | 8.17 | | | $ | 5.65 | |
For each class of the Fund, expenses are equal to the Portfolio’s annualized net expense ratio of 1.37%, 2.12%, 1.62% and 1.12% for Classes A, C, R3 and I, respectively, multiplied by the average account value over the period, multiplied by 183/366 (to reflect the one-half year period).
Nuveen Symphony International Equity Fund
| | | | | | | | | | | | | | | | | | | | | | | | | | | | | | | | | | |
| | | | | | | | | | | | | | | | | Hypothetical Performance | |
| | | Actual Performance | | | | | (5% annualized return before expenses) | |
| | | A Shares | | | C Shares | | | R3 Shares | | | I Shares | | | | | A Shares | | | C Shares | | | R3 Shares | | | I Shares | |
| Beginning Account Value (4/01/12) | | $ | 1,000.00 | | | $ | 1,000.00 | | | $ | 1,000.00 | | | $ | 1,000.00 | | | | | $ | 1,000.00 | | | $ | 1,000.00 | | | $ | 1,000.00 | | | $ | 1,000.00 | |
| Ending Account Value (9/30/12) | | $ | 976.50 | | | $ | 972.50 | | | $ | 975.30 | | | $ | 977.80 | | | | | $ | 1,018.25 | | | $ | 1,014.50 | | | $ | 1,017.00 | | | $ | 1,019.50 | |
| Expenses Incurred During Period | | $ | 6.67 | | | $ | 10.36 | | | $ | 7.90 | | | $ | 5.44 | | | | | $ | 6.81 | | | $ | 10.58 | | | $ | 8.07 | | | $ | 5.55 | |
For each class of the Fund, expenses are equal to the Portfolio’s annualized net expense ratio of 1.35%, 2.10%, 1.60% and 1.10% for Classes A, C, R3 and I, respectively, multiplied by the average account value over the period, multiplied by 183/366 (to reflect the one-half year period).
Nuveen Symphony Optimized Alpha Fund
| | | | | | | | | | | | | | | | | | | | | | | | | | |
| | | | | | | | | | | | | | Hypothetical Performance | |
| | | Actual Performance | | | | | (5% annualized return before expenses) | |
| | | A Shares | | | C Shares | | | I Shares | | | | | A Shares | | | C Shares | | | I Shares | |
| Beginning Account Value (4/01/12) | | $ | 1,000.00 | | | $ | 1,000.00 | | | $ | 1,000.00 | | | | | $ | 1,000.00 | | | $ | 1,000.00 | | | $ | 1,000.00 | |
| Ending Account Value (9/30/12) | | $ | 1,029.80 | | | $ | 1,025.70 | | | $ | 1,031.20 | | | | | $ | 1,018.85 | | | $ | 1,015.10 | | | $ | 1,020.10 | |
| Expenses Incurred During Period | | $ | 6.24 | | | $ | 10.03 | | | $ | 4.98 | | | | | $ | 6.21 | | | $ | 9.97 | | | $ | 4.95 | |
For each class of the Fund, expenses are equal to the Portfolio’s annualized net expense ratio of 1.23%, 1.98% and .98% for Classes A, C and I, respectively, multiplied by the average account value over the period, multiplied by 183/366 (to reflect the one-half year period).
Report of
Independent Registered Public Accounting Firm
To the Board of Trustees and Shareholders of
Nuveen Investment Trust II:
In our opinion, the accompanying statements of assets and liabilities, including the portfolios of investments, and the related statements of operations, of changes in net assets, and the financial highlights present fairly, in all material respects, the financial position of Nuveen Symphony Large-Cap Growth Fund, Nuveen Symphony Mid-Cap Core Fund, Nuveen Symphony International Equity Fund, and Nuveen Symphony Optimized Alpha Fund (each a series of the Nuveen Investment Trust II, hereinafter referred to as the “Funds”) at September 30, 2012, the results of each of their operations for the period then ended, and the change in each of their net assets and the financial highlights for each of the periods presented, in conformity with accounting principles generally accepted in the United States of America. These financial statements and financial highlights (hereafter referred to as “financial statements”) are the responsibility of the Funds’ management; our responsibility is to express an opinion on these financial statements based on our audits. We conducted our audits of these financial statements in accordance with the standards of the Public Company Accounting Oversight Board (United States). Those standards require that we plan and perform the audit to obtain reasonable assurance about whether the financial statements are free of material misstatement. An audit includes examining, on a test basis, evidence supporting the amounts and disclosures in the financial statements, assessing the accounting principles used and significant estimates made by management, and evaluating the overall financial statement presentation. We believe that our audits, which included confirmation of securities at September 30, 2012 by correspondence with the custodian and brokers, provides a reasonable basis for our opinion.
PRICEWATERHOUSECOOPERS LLP
Chicago, IL
November 28, 2012
Portfolio of Investments
Nuveen Symphony Large-Cap Growth Fund
September 30, 2012
| | | | | | | | | | | | | | |
| Shares | | | Description (1) | | | | | | | | Value | |
| | | | | | | | | | | | | | |
| | | | COMMON STOCKS – 96.2% | | | | | | | | | | |
| | | | | |
| | | | Aerospace & Defense – 1.2% | | | | | | | | | | |
| | | | | |
| | 10,063 | | | United Technologies Corporation | | | | | | | | $ | 787,832 | |
| | | | Air Freight & Logistics – 1.0% | | | | | | | | | | |
| | | | | |
| | 5,789 | | | C.H. Robinson Worldwide, Inc. | | | | | | | | | 338,946 | |
| | | | | |
| | 3,592 | | | FedEx Corporation | | | | | | | | | 303,955 | |
| | | | Total Air Freight & Logistics | | | | | | | | | 642,901 | |
| | | | Apparel, Accessories & Luxury Goods – 1.4% | | | | | | | | | | |
| | | | | |
| | 9,703 | | | PVH Corporation | | | | | | | | | 909,365 | |
| | | | Beverages – 0.7% | | | | | | | | | | |
| | | | | |
| | 9,971 | | | Dr. Pepper Snapple Group | | | | | | | | | 444,009 | |
| | | | Biotechnology – 2.0% | | | | | | | | | | |
| | | | | |
| | 15,497 | | | Amgen Inc. | | | | | | | | | 1,306,707 | |
| | | | Capital Markets – 0.8% | | | | | | | | | | |
| | | | | |
| | 4,089 | | | Affiliated Managers Group Inc., (2) | | | | | | | | | 502,947 | |
| | | | Chemicals – 5.0% | | | | | | | | | | |
| | | | | |
| | 3,755 | | | CF Industries Holdings, Inc. | | | | | | | | | 834,511 | |
| | | | | |
| | 5,725 | | | Eastman Chemical Company | | | | | | | | | 326,382 | |
| | | | | |
| | 9,995 | | | LyondellBasell Industries NV | | | | | | | | | 516,342 | |
| | | | | |
| | 11,373 | | | Monsanto Company | | | | | | | | | 1,035,170 | |
| | | | | |
| | 7,141 | | | Westlake Chemical Corporation | | | | | | | | | 521,721 | |
| | | | Total Chemicals | | | | | | | | | 3,234,126 | |
| | | | Communications Equipment – 1.0% | | | | | | | | | | |
| | | | | |
| | 6,041 | | | F5 Networks, Inc., (2) | | | | | | | | | 632,493 | |
| | | | Computers & Peripherals – 10.9% | | | | | | | | | | |
| | | | | |
| | 8,627 | | | Apple, Inc. | | | | | | | | | 5,756,452 | |
| | | | | |
| | 37,564 | | | EMC Corporation, (2) | | | | | | | | | 1,024,370 | |
| | | | | |
| | 8,941 | | | NetApp, Inc., (2) | | | | | | | | | 293,980 | |
| | | | Total Computers & Peripherals | | | | | | | | | 7,074,802 | |
| | | | Consumer Finance – 1.6% | | | | | | | | | | |
| | | | | |
| | 26,561 | | | Discover Financial Services | | | | | | | | | 1,055,269 | |
| | | | Diversified Telecommunication Services – 1.5% | | | | | | | | | | |
| | | | | |
| | 20,662 | | | Verizon Communications Inc. | | | | | | | | | 941,567 | |
| | | | Electrical Equipment – 0.5% | | | | | | | | | | |
| | | | | |
| | 5,089 | | | Rockwell Automation, Inc. | | | | | | | | | 353,940 | |
| | | | Energy Equipment & Services – 1.0% | | | | | | | | | | |
| | | | | |
| | 7,763 | | | Oil States International Inc., (2) | | | | | | | | | 616,848 | |
| | | | Food & Staples Retailing – 2.3% | | | | | | | | | | |
| | | | | |
| | 11,715 | | | Costco Wholesale Corporation | | | | | | | | | 1,172,964 | |
| | | | | |
| | 3,450 | | | Whole Foods Market, Inc. | | | | | | | | | 336,030 | |
| | | | Total Food & Staples Retailing | | | | | | | | | 1,508,994 | |
| | | | Food Products – 1.3% | | | | | | | | | | |
| | | | | |
| | 7,836 | | | Kraft Foods Inc., Class A Shares | | | | | | | | | 324,019 | |
| | | | | |
| | 6,912 | | | Mead Johnson Nutrition Company, Class A Shares | | | | | | | | | 506,511 | |
| | | | Total Food Products | | | | | | | | | 830,530 | |
Portfolio of Investments
Nuveen Symphony Large-Cap Growth Fund (continued)
September 30, 2012
| | | | | | | | | | | | | | |
| Shares | | | Description (1) | | | | | | | | Value | |
| | | | | | | | | | | | | | |
| | | | Gas Utilities – 0.9% | | | | | | | | | | |
| | | | | |
| | 6,411 | | | ONEOK, Inc. | | | | | | | | $ | 309,715 | |
| | | | | |
| | 14,629 | | | Questar Corporation | | | | | | | | | 297,408 | |
| | | | Total Gas Utilities | | | | | | | | | 607,123 | |
| | | | Health Care Equipment & Supplies – 1.9% | | | | | | | | | | |
| | | | | |
| | 13,273 | | | Baxter International, Inc. | | | | | | | | | 799,831 | |
| | | | | |
| | 11,441 | | | ResMed Inc. | | | | | | | | | 463,017 | |
| | | | Total Health Care Equipment & Supplies | | | | | | | | | 1,262,848 | |
| | | | Health Care Providers & Services – 4.6% | | | | | | | | | | |
| | | | | |
| | 5,885 | | | Davita Inc., (2) | | | | | | | | | 609,745 | |
| | | | | |
| | 12,185 | | | Express Scripts, Holding Company, (2) | | | | | | | | | 763,634 | |
| | | | | |
| | 22,444 | | | HCA Holdings Inc. | | | | | | | | | 746,263 | |
| | | | | |
| | 10,064 | | | McKesson HBOC Inc. | | | | | | | | | 865,806 | |
| | | | Total Health Care Providers & Services | | | | | | | | | 2,985,448 | |
| | | | Hotels, Restaurants & Leisure – 2.9% | | | | | | | | | | |
| | | | | |
| | 19,489 | | | Brinker International Inc. | | | | | | | | | 687,962 | |
| | | | | |
| | 9,121 | | | Marriott International, Inc., Class A | | | | | | | | | 356,631 | |
| | | | | |
| | 16,871 | | | Starbucks Corporation | | | | | | | | | 856,203 | |
| | | | Total Hotels, Restaurants & Leisure | | | | | | | | | 1,900,796 | |
| | | | Household Products – 0.8% | | | | | | | | | | |
| | | | | |
| | 4,573 | | | Colgate-Palmolive Company | | | | | | | | | 490,317 | |
| | | | Insurance – 0.5% | | | | | | | | | | |
| | | | | |
| | 9,371 | | | Valdius Holdings Limited | | | | | | | | | 317,771 | |
| | | | Internet Software & Services – 4.5% | | | | | | | | | | |
| | | | | |
| | 22,886 | | | eBay Inc., (2) | | | | | | | | | 1,107,911 | |
| | | | | |
| | 2,376 | | | Google Inc., Class A, (2) | | | | | | | | | 1,792,692 | |
| | | | Total Internet Software & Services | | | | | | | | | 2,900,603 | |
| | | | IT Services – 5.8% | | | | | | | | | | |
| | | | | |
| | 3,611 | | | Alliance Data Systems Corporation, (2) | | | | | | | | | 512,581 | |
| | | | | |
| | 4,796 | | | International Business Machines Corporation (IBM) | | | | | | | | | 994,930 | |
| | | | | |
| | 16,368 | | | Lender Processing Services Inc. | | | | | | | | | 456,504 | |
| | | | | |
| | 2,195 | | | MasterCard, Inc. | | | | | | | | | 990,999 | |
| | | | | |
| | 6,015 | | | Teradata Corporation, (2) | | | | | | | | | 453,591 | |
| | | | | |
| | 12,898 | | | VeriFone Holdings Inc., (2) | | | | | | | | | 359,209 | |
| | | | Total IT Services | | | | | | | | | 3,767,814 | |
| | | | Machinery – 4.7% | | | | | | | | | | |
| | | | | |
| | 8,180 | | | Caterpillar Inc. | | | | | | | | | 703,807 | |
| | | | | |
| | 6,462 | | | Cummins Inc. | | | | | | | | | 595,861 | |
| | | | | |
| | 11,184 | | | Ingersoll Rand Company Limited, Class A | | | | | | | | | 501,267 | |
| | | | | |
| | 5,167 | | | Joy Global Inc. | | | | | | | | | 289,662 | |
| | | | | |
| | 10,259 | | | SPX Corporation | | | | | | | | | 671,041 | |
| | | | | |
| | 3,990 | | | Wabtec Corporation | | | | | | | | | 320,357 | |
| | | | Total Machinery | | | | | | | | | 3,081,995 | |
| | | | Media – 2.5% | | | | | | | | | | |
| | | | | |
| | 11,615 | | | Scripps Networks Interactive, Class A Shares | | | | | | | | | 711,186 | |
| | | | | |
| | 9,408 | | | Time Warner Cable, Class A | | | | | | | | | 894,324 | |
| | | | Total Media | | | | | | | | | 1,605,510 | |
| | | | | | | | | | | | | | |
| Shares | | | Description (1) | | | | | | | | Value | |
| | | | | | | | | | | | | | |
| | | | Multiline Retail – 2.6% | | | | | | | | | | |
| | | | | |
| | 16,406 | | | Macy’s, Inc. | | | | | | | | $ | 617,194 | |
| | | | | |
| | 17,305 | | | Target Corporation | | | | | | | | | 1,098,348 | |
| | | | Total Multiline Retail | | | | | | | | | 1,715,542 | |
| | | | Oil, Gas & Consumable Fuels – 1.9% | | | | | | | | | | |
| | | | | |
| | 5,404 | | | Chevron Corporation | | | | | | | | | 629,890 | |
| | | | | |
| | 10,785 | | | Murphy Oil Corporation | | | | | | | | | 579,047 | |
| | | | Total Oil, Gas & Consumable Fuels | | | | | | | | | 1,208,937 | |
| | | | Personal Products – 0.5% | | | | | | | | | | |
| | | | | |
| | 5,351 | | | Estee Lauder Companies Inc., Class A | | | | | | | | | 329,461 | |
| | | | Pharmaceuticals – 2.8% | | | | | | | | | | |
| | | | | |
| | 16,047 | | | Abbott Laboratories | | | | | | | | | 1,100,182 | |
| | | | | |
| | 14,555 | | | Eli Lilly and Company | | | | | | | | | 690,053 | |
| | | | Total Pharmaceuticals | | | | | | | | | 1,790,235 | |
| | | | Retail REIT – 1.9% | | | | | | | | | | |
| | | | | |
| | 5,092 | | | Simon Property Group, Inc. | | | | | | | | | 773,017 | |
| | | | | |
| | 6,181 | | | Taubman Centers Inc. | | | | | | | | | 474,268 | |
| | | | Total Retail REIT | | | | | | | | | 1,247,285 | |
| | | | Road & Rail – 1.1% | | | | | | | | | | |
| | | | | |
| | 6,102 | | | Union Pacific Corporation | | | | | | | | | 724,307 | |
| | | | Semiconductors & Equipment – 4.9% | | | | | | | | | | |
| | | | | |
| | 21,272 | | | Avago Technologies Limited | | | | | | | | | 741,648 | |
| | | | | |
| | 17,253 | | | Broadcom Corporation, Class A | | | | | | | | | 596,609 | |
| | | | | |
| | 42,319 | | | Intel Corporation | | | | | | | | | 959,795 | |
| | | | | |
| | 9,794 | | | Linear Technology Corporation | | | | | | | | | 311,939 | |
| | | | | |
| | 44,561 | | | NVIDIA Corporation, (2) | | | | | | | | | 594,444 | |
| | | | Total Semiconductors & Equipment | | | | | | | | | 3,204,435 | |
| | | | Software – 8.5% | | | | | | | | | | |
| | | | | |
| | 23,935 | | | Cadence Design Systems, Inc., (2) | | | | | | | | | 307,924 | |
| | | | | |
| | 84,549 | | | Microsoft Corporation | | | | | | | | | 2,517,869 | |
| | | | | |
| | 41,405 | | | Oracle Corporation | | | | | | | | | 1,303,843 | |
| | | | | |
| | 22,546 | | | Tibco Software Inc., (2) | | | | | | | | | 681,566 | |
| | | | | |
| | 7,056 | | | VMware Inc. | | | | | | | | | 682,597 | |
| | | | Total Software | | | | | | | | | 5,493,799 | |
| | | | Specialized REIT – 0.8% | | | | | | | | | | |
| | | | | |
| | 10,873 | | | Rayonier Inc. | | | | | | | | | 532,886 | |
| | | | Specialty Retail – 4.7% | | | | | | | | | | |
| | | | | |
| | 36,165 | | | American Eagle Outfitters, Inc. | | | | | | | | | 762,358 | |
| | | | | |
| | 17,592 | | | Home Depot, Inc. | | | | | | | | | 1,062,029 | |
| | | | | |
| | 13,374 | | | Ross Stores, Inc. | | | | | | | | | 863,960 | |
| | | | | |
| | 7,580 | | | Williams-Sonoma Inc. | | | | | | | | | 333,293 | |
| | | | Total Specialty Retail | | | | | | | | | 3,021,640 | |
| | | | Textiles, Apparel, & Luxury Goods – 1.1% | | | | | | | | | | |
| | | | | |
| | 19,298 | | | Deckers Outdoor Corporation, (2) | | | | | | | | | 707,079 | |
| | | | Tobacco – 4.1% | | | | | | | | | | |
| | | | | |
| | 27,329 | | | Altria Group, Inc. | | | | | | | | | 912,515 | |
| | | | | |
| | 7,176 | | | Lorillard Inc. | | | | | | | | | 835,646 | |
Portfolio of Investments
Nuveen Symphony Large-Cap Growth Fund (continued)
September 30, 2012
| | | | | | | | | | | | | | | | | | |
| Shares | | | Description (1) | | | | | | | | | | Value | |
| | | | Tobacco (continued) | | | | | | | | | | | | | | |
| | | | | | | | | | | | | | | | | | |
| | | | | |
| | 10,480 | | | Philip Morris International | | | | | | | | | | | | $ | 942,573 | |
| | | | Total Tobacco | | | | | | | | | | | | | 2,690,734 | |
| | | | Total Common Stocks (cost $58,060,406) | | | | | | | | | | | | | 62,428,895 | |
| | | | | |
Principal
Amount (000) | | | Description (1) | | Coupon | | | Maturity | | | | | Value | |
| | | | SHORT-TERM INVESTMENTS – 5.1% | | | | | | | | | | | | | | |
| | | | | |
| | | | Repurchase Agreements – 5.1% | | | | | | | | | | | | | | |
| | | | | |
| $ | 3,304 | | | Repurchase Agreement with State Street Bank, dated 9/28/12, repurchase price $3,304,118, collateralized by $3,360,000 U.S. Treasury Notes, 0.375%, due 4/15/15, value $3,372,540 | | | 0.010% | | | | 10/01/12 | | | | | $ | 3,304,115 | |
| | | | Total Short-Term Investments (cost $3,304,115) | | | | | | | | | | | | | 3,304,115 | |
| | | | Total Investments (cost $61,364,521) – 101.3% | | | | | | | | | | | | | 65,733,010 | |
| | | | Other Assets Less Liabilities – (1.3)% | | | | | | | | | | | | | (835,963) | |
| | | | Net Assets – 100% | | | | | | | | | | | | $ | 64,897,047 | |
| | | | For Fund portfolio compliance purposes, the Fund’s industry classifications refer to any one or more of the industry sub-classifications used by one or more widely recognized market indexes or ratings group indexes, and/or as defined by Fund management. This definition may not apply for purposes of this report, which may combine industry sub-classifications into sectors for reporting ease. |
| | (1) | | All percentages shown in the Portfolio of Investments are based on net assets. |
| | (2) | | Non-income producing; issuer has not declared a dividend within the past twelve months. |
| | REIT | | Real Estate Investment Trust. |
See accompanying notes to financial statements.
Portfolio of Investments
Nuveen Symphony Mid-Cap Core Fund
September 30, 2012
| | | | | | | | | | | | | | |
| Shares | | | Description (1) | | | | | | | | Value | |
| | | | | | | | | | | | | | |
| | | | COMMON STOCKS – 97.7% | | | | | | | | | | |
| | | | | |
| | | | Apparel, Accessories & Luxury Goods – 3.0% | | | | | | | | | | |
| | | | | |
| | 1,096 | | | Michael Kors Holdings Limited, (2) | | | | | | | | $ | 58,285 | |
| | | | | |
| | 738 | | | PVH Corporation | | | | | | | | | 69,165 | |
| | | | Total Apparel, Accessories & Luxury Goods | | | | | | | | | 127,450 | |
| | | | Beverages – 2.8% | | | | | | | | | | |
| | | | | |
| | 1,313 | | | Dr. Pepper Snapple Group | | | | | | | | | 58,468 | |
| | | | | |
| | 1,257 | | | Molson Coors Brewing Company, Class B | | | | | | | | | 56,628 | |
| | | | Total Beverages | | | | | | | | | 115,096 | |
| | | | Building Products – 2.3% | | | | | | | | | | |
| | | | | |
| | 1,720 | | | Fortune Brands Home & Security, (2) | | | | | | | | | 46,457 | |
| | | | | |
| | 1,051 | | | Lennox International Inc. | | | | | | | | | 50,826 | |
| | | | Total Building Products | | | | | | | | | 97,283 | |
| | | | Capital Markets – 4.7% | | | | | | | | | | |
| | | | | |
| | 518 | | | Affiliated Managers Group Inc., (2) | | | | | | | | | 63,714 | |
| | | | | |
| | 1,247 | | | Ameriprise Financial, Inc. | | | | | | | | | 70,692 | |
| | | | | |
| | 2,440 | | | Invesco LTD | | | | | | | | | 60,976 | |
| | | | Total Capital Markets | | | | | | | | | 195,382 | |
| | | | Chemicals – 5.9% | | | | | | | | | | |
| | | | | |
| | 338 | | | CF Industries Holdings, Inc. | | | | | | | | | 75,117 | |
| | | | | |
| | 4,554 | | | Huntsman Corporation | | | | | | | | | 67,991 | |
| | | | | |
| | 2,234 | | | Interpid Potash Inc., (2) | | | | | | | | | 47,986 | |
| | | | | |
| | 761 | | | Westlake Chemical Corporation | | | | | | | | | 55,599 | |
| | | | Total Chemicals | | | | | | | | | 246,693 | |
| | | | Commercial Banks – 1.3% | | | | | | | | | | |
| | | | | |
| | 6,309 | | | KeyCorp. | | | | | | | | | 55,141 | |
| | | | Commercial Services & Supplies – 1.9% | | | | | | | | | | |
| | | | | |
| | 1,340 | | | Avery Dennison Corporation | | | | | | | | | 42,639 | |
| | | | | |
| | 1,391 | | | Republic Services, Inc. | | | | | | | | | 38,266 | |
| | | | Total Commercial Services & Supplies | | | | | | | | | 80,905 | |
| | | | Communication Equipment – 0.7% | | | | | | | | | | |
| | | | | |
| | 271 | | | F5 Networks, Inc., (2) | | | | | | | | | 28,374 | |
| | | | Computers & Peripherals – 0.4% | | | | | | | | | | |
| | | | | |
| | 24 | | | Apple, Inc. | | | | | | | | | 16,014 | |
| | | | Construction & Engineering – 1.7% | | | | | | | | | | |
| | | | | |
| | 2,851 | | | Quanta Services Incorporated, (2) | | | | | | | | | 70,420 | |
| | | | Electric Utilities – 1.5% | | | | | | | | | | |
| | | | | |
| | 1,344 | | | Edison International | | | | | | | | | 61,407 | |
| | | | Electronic Equipment & Instruments – 0.8% | | | | | | | | | | |
| | | | | |
| | 1,829 | | | Jabil Circuit Inc. | | | | | | | | | 34,239 | |
| | | | Energy Equipment & Services – 0.8% | | | | | | | | | | |
| | | | | |
| | 445 | | | Oil States International Inc., (2) | | | | | | | | | 35,360 | |
| | | | Food Products – 0.9% | | | | | | | | | | |
| | | | | |
| | 524 | | | Mead Johnson Nutrition Company, Class A Shares | | | | | | | | | 38,399 | |
| | | | Health Care Equipment & Supplies – 2.2% | | | | | | | | | | |
| | | | | |
| | 2,037 | | | Hologic Inc., (2) | | | | | | | | | 41,229 | |
| | | | | |
| | 1,291 | | | ResMed Inc. | | | | | | | | | 52,247 | |
| | | | Total Health Care Equipment & Supplies | | | | | | | | | 93,476 | |
Portfolio of Investments
Nuveen Symphony Mid-Cap Core Fund (continued)
September 30, 2012
| | | | | | | | | | | | | | |
| Shares | | | Description (1) | | | | | | | | Value | |
| | | | | | | | | | | | | | |
| | | | Health Care Providers & Services – 5.5% | | | | | | | | | | |
| | | | | |
| | 2,402 | | | Brookdale Senior Living Inc., (2) | | | | | | | | $ | 55,774 | |
| | | | | |
| | 512 | | | Davita Inc., (2) | | | | | | | | | 53,048 | |
| | | | | |
| | 1,928 | | | HCA Holdings Inc. | | | | | | | | | 64,106 | |
| | | | | |
| | 6,939 | | | Health Management Associates Inc., (2) | | | | | | | | | 58,218 | |
| | | | Total Health Care Providers & Services | | | | | | | | | 231,146 | |
| | | | Hotels, Restaurants & Leisure – 2.3% | | | | | | | | | | |
| | | | | |
| | 1,212 | | | Brinker International Inc. | | | | | | | | | 42,784 | |
| | | | | |
| | 165 | | | Chipotle Mexican Grill, Class A Shares | | | | | | | | | 52,394 | |
| | | | Total Hotels, Restaurants & Leisure | | | | | | | | | 95,178 | |
| | | | Household Durables – 2.4% | | | | | | | | | | |
| | | | | |
| | 1,463 | | | Lennar Corporation, Class A | | | | | | | | | 50,869 | |
| | | | | |
| | 3,297 | | | Pulte Corporation, (2) | | | | | | | | | 51,104 | |
| | | | Total Household Durables | | | | | | | | | 101,973 | |
| | | | Insurance – 6.2% | | | | | | | | | | |
| | | | | |
| | 399 | | | Allied World Assurance Holdings | | | | | | | | | 30,823 | |
| | | | | |
| | 500 | | | Everest Reinsurance Group Ltd | | | | | | | | | 53,480 | |
| | | | | |
| | 1,187 | | | Marsh & McLennan Companies, Inc. | | | | | | | | | 40,275 | |
| | | | | |
| | 808 | | | Torchmark Corporation | | | | | | | | | 41,491 | |
| | | | | |
| | 1,500 | | | Valdius Holdings Limited | | | | | | | | | 50,865 | |
| | | | | |
| | 1,126 | | | WR Berkley Corporation | | | | | | | | | 42,214 | |
| | | | Total Insurance | | | | | | | | | 259,148 | |
| | | | IT Services – 3.8% | | | | | | | | | | |
| | | | | |
| | 359 | | | Alliance Data Systems Corporation, (2) | | | | | | | | | 50,960 | |
| | | | | |
| | 2,416 | | | Lender Processing Services Inc. | | | | | | | | | 67,382 | |
| | | | | |
| | 521 | | | Teradata Corporation, (2) | | | | | | | | | 39,289 | |
| | | | Total IT Services | | | | | | | | | 157,631 | |
| | | | Machinery – 5.4% | | | | | | | | | | |
| | | | | |
| | 1,602 | | | Ingersoll Rand Company Limited, Class A | | | | | | | | | 71,802 | |
| | | | | |
| | 640 | | | SPX Corporation | | | | | | | | | 41,862 | |
| | | | | |
| | 663 | | | Wabtec Corporation | | | | | | | | | 53,232 | |
| | | | | |
| | 2,300 | | | Xylem Inc. | | | | | | | | | 57,845 | |
| | | | Total Machinery | | | | | | | | | 224,741 | |
| | | | Multi-Utilities – 5.3% | | | | | | | | | | |
| | | | | |
| | 911 | | | Alliant Energy Corporation | | | | | | | | | 39,528 | |
| | | | | |
| | 1,699 | | | Ameren Corporation | | | | | | | | | 55,506 | |
| | | | | |
| | 3,389 | | | CenterPoint Energy, Inc. | | | | | | | | | 72,186 | |
| | | | | |
| | 2,281 | | | CMS Energy Corporation | | | | | | | | | 53,718 | |
| | | | Total Multi-Utilities | | | | | | | | | 220,938 | |
| | | | Oil, Gas & Consumable Fuels – 5.2% | | | | | | | | | | |
| | | | | |
| | 1,595 | | | HollyFrontier Company | | | | | | | | | 65,826 | |
| | | | | |
| | 1,230 | | | Marathon Petroleum Corporation | | | | | | | | | 67,146 | |
| | | | | |
| | 1,983 | | | Tesoro Corporation, (2) | | | | | | | | | 83,088 | |
| | | | Total Oil, Gas & Consumable Fuels | | | | | | | | | 216,060 | |
| | | | Pharmaceuticals – 1.8% | | | | | | | | | | |
| | | | | |
| | 1,679 | | | Warner Chilcott Limited, (2) | | | | | | | | | 22,667 | |
| | | | | |
| | 598 | | | Watson Pharmaceuticals Inc., (2) | | | | | | | | | 50,926 | |
| | | | Total Pharmaceuticals | | | | | | | | | 73,593 | |
| | | | | | | | | | | | | | |
| Shares | | | Description (1) | | | | | | | | Value | |
| | | | | | | | | | | | | | |
| | | | Residential REIT – 0.9% | | | | | | | | | | |
| | | | | |
| | 262 | | | Essex Property Trust Inc. | | | | | | | | $ | 38,839 | |
| | | | Retail REIT – 5.1% | | | | | | | | | | |
| | | | | |
| | 4,155 | | | CBL & Associates Properties Inc. | | | | | | | | | 88,668 | |
| | | | | |
| | 1,540 | | | Tanger Factory Outlet Centers | | | | | | | | | 49,788 | |
| | | | | |
| | 998 | | | Taubman Centers Inc. | | | | | | | | | 76,577 | |
| | | | Total Retail REIT | | | | | | | | | 215,033 | |
| | | | Semiconductors & Equipment – 3.1% | | | | | | | | | | |
| | | | | |
| | 1,231 | | | Avago Technologies Limited | | | | | | | | | 42,919 | |
| | | | | |
| | 3,521 | | | NVIDIA Corporation, (2) | | | | | | | | | 46,970 | |
| | | | | |
| | 1,608 | | | Skyworks Solutions Inc., (2) | | | | | | | | | 37,893 | |
| | | | Total Semiconductors & Equipment | | | | | | | | | 127,782 | |
| | | | Software – 4.5% | | | | | | | | | | |
| | | | | |
| | 4,469 | | | Cadence Design Systems, Inc., (2) | | | | | | | | | 57,494 | |
| | | | | |
| | 1,536 | | | Fortinet Inc., (2) | | | | | | | | | 37,079 | |
| | | | | |
| | 758 | | | Micros Systems, Inc., (2) | | | | | | | | | 37,233 | |
| | | | | |
| | 1,884 | | | Tibco Software Inc., (2) | | | | | | | | | 56,953 | |
| | | | Total Software | | | | | | | | | 188,759 | |
| | | | Specialized REIT – 1.7% | | | | | | | | | | |
| | | | | |
| | 3,092 | | | Omega Healthcare Investors Inc. | | | | | | | | | 70,281 | |
| | | | Specialty Retail – 9.6% | | | | | | | | | | |
| | | | | |
| | 3,066 | | | American Eagle Outfitters, Inc. | | | | | | | | | 64,631 | |
| | | | | |
| | 794 | | | Dick’s Sporting Goods Inc. | | | | | | | | | 41,169 | |
| | | | | |
| | 1,586 | | | Foot Locker, Inc. | | | | | | | | | 56,303 | |
| | | | | |
| | 1,241 | | | Limited Brands, Inc. | | | | | | | | | 61,132 | |
| | | | | |
| | 583 | | | PetSmart Inc. | | | | | | | | | 40,215 | |
| | | | | |
| | 1,062 | | | Ross Stores, Inc. | | | | | | | | | 68,605 | |
| | | | | |
| | 1,457 | | | Signet Jewelers Limited | | | | | | | | | 71,043 | |
| | | | Total Specialty Retail | | | | | | | | | 403,098 | |
| | | | Textiles, Apparel & Luxury Goods – 1.5% | | | | | | | | | | |
| | | | | |
| | 1,727 | | | Deckers Outdoor Corporation, (2) | | | | | | | | | 63,277 | |
| | | | Tobacco – 1.0% | | | | | | | | | | |
| | | | | |
| | 343 | | | Lorillard Inc. | | | | | | | | | 39,942 | |
| | | | Wireless Telecommunication Services – 1.5% | | | | | | | | | | |
| | | | | |
| | 329 | | | Crown Castle International Corporation, (2) | | | | | | | | | 21,089 | |
| | | | | |
| | 1,795 | | | Metropcs Communications Inc. | | | | | | | | | 21,019 | |
| | | | | |
| | 3,802 | | | Sprint Nextel Corporation, (2) | | | | | | | | | 20,985 | |
| | | | Total Wireless Telecommunication Services | | | | | | | | | 63,093 | |
| | | | Total Common Stocks (cost $3,643,578) | | | | | | | | | 4,086,151 | |
Portfolio of Investments
Nuveen Symphony Mid-Cap Core Fund (continued)
September 30, 2012
| | | | | | | | | | | | | | | | | | |
Principal
Amount (000) | | | Description (1) | | Coupon | | | Maturity | | | | | Value | |
| | | | | | | | | | | | | | | | | | |
| | | | SHORT-TERM INVESTMENTS – 6.6% | | | | | | | | | | | | | | |
| | | | | |
| | | | Repurchase Agreements – 6.6% | | | | | | | | | | | | | | |
| | | | | |
| $ | 275 | | | Repurchase Agreement with Fixed Income Clearing Corporation, dated 9/28/12, repurchase price $275,241, collateralized by $210,000 U.S. Treasury Notes, 4.500%, due 8/15/39, value $285,516 | | | 0.010% | | | | 10/01/12 | | | | | $ | 275,241 | |
| | | | Total Short-Term Investments (cost $275,241) | | | | | | | | | | | | | 275,241 | |
| | | | Total Investments (cost $3,918,819) – 104.3% | | | | | | | | | | | | | 4,361,392 | |
| | | | Other Assets Less Liabilities – (4.3)% | | | | | | | | | | | | | (181,391) | |
| | | | Net Assets – 100% | | | | | | | | | | | | $ | 4,180,001 | |
| | | | For Fund portfolio compliance purposes, the Fund’s industry classifications refer to any one or more of the industry sub-classifications used by one or more widely recognized market indexes or ratings group indexes, and/or as defined by Fund management. This definition may not apply for purposes of this report, which may combine industry sub-classifications into sectors for reporting ease. |
| | (1) | | All percentages shown in the Portfolio of Investments are based on net assets. |
| | (2) | | Non-income producing; issuer has not declared a dividend within the past twelve months. |
| | REIT | | Real Estate Investment Trust. |
See accompanying notes to financial statements.
Portfolio of Investments
Nuveen Symphony International Equity Fund
September 30, 2012
| | | | | | | | | | | | | | |
| Shares | | | Description (1) | | | | | | | | Value | |
| | | | | | | | | | | | | | |
| | | | COMMON STOCKS – 92.8% | | | | | | | | | | |
| | | | | |
| | | | Automobiles – 2.9% | | | | | | | | | | |
| | | | | |
| | 193 | | | Honda Motor Company Limited | | | | | | | | $ | 5,928 | |
| | | | | |
| | 453 | | | Honda Motor Company Limited, ADR | | | | | | | | | 13,998 | |
| | | | | |
| | 304 | | | Toyota Motor Corporation | | | | | | | | | 11,842 | |
| | | | Total Automobiles | | | | | | | | | 31,768 | |
| | | | Beverages – 2.3% | | | | | | | | | | |
| | | | | |
| | 1,760 | | | Coca-Cola Amatil Limited | | | | | | | | | 24,756 | |
| | | | Capital Markets – 0.5% | | | | | | | | | | |
| | | | | |
| | 423 | | | UBS AG | | | | | | | | | 5,150 | |
| | | | Chemicals – 2.8% | | | | | | | | | | |
| | | | | |
| | 773 | | | Kuraray Company Limited | | | | | | | | | 8,786 | |
| | | | | |
| | 232 | | | Nitto Denko Corporation | | | | | | | | | 11,059 | |
| | | | | |
| | 249 | | | Potash Corporation of Saskatchewan | | | | | | | | | 10,823 | |
| | | | Total Chemicals | | | | | | | | | 30,668 | |
| | | | Commercial Banks – 12.9% | | | | | | | | | | |
| | | | | |
| | 812 | | | Banco Itau Holdings Financeira, S.A., Sponsored ADR | | | | | | | | | 12,407 | |
| | | | | |
| | 867 | | | Banco Santander Central S.A., ADR | | | | | | | | | 6,468 | |
| | | | | |
| | 113 | | | BNP Paribas S.A. | | | | | | | | | 5,370 | |
| | | | | |
| | 2,062 | | | DnB NOR ASA | | | | | | | | | 25,285 | |
| | | | | |
| | 729 | | | Hang Seng Bank | | | | | | | | | 11,178 | |
| | | | | |
| | 1,460 | | | HSBC Holdings PLC | | | | | | | | | 13,516 | |
| | | | | |
| | 961 | | | Mitsubishi UFJ Financial Group, Inc., ADR | | | | | | | | | 4,507 | |
| | | | | |
| | 3,179 | | | Mizuho Financial Group | | | | | | | | | 5,173 | |
| | | | | |
| | 139 | | | Societe Generale | | | | | | | | | 3,948 | |
| | | | | |
| | 819 | | | Standard Chartered PLC | | | | | | | | | 18,515 | |
| | | | | |
| | 373 | | | Sumitomo Mitsui Financial Group | | | | | | | | | 11,662 | |
| | | | | |
| | 206 | | | Toronto-Dominion Bank | | | | | | | | | 17,168 | |
| | | | | |
| | 64 | | | Toronto-Dominion Bank | | | | | | | | | 5,338 | |
| | | | Total Commercial Banks | | | | | | | | | 140,535 | |
| | | | Commercial Services & Supplies – 0.8% | | | | | | | | | | |
| | | | | |
| | 236 | | | Aggreko PLC | | | | | | | | | 8,815 | |
| | | | Construction & Engineering – 0.8% | | | | | | | | | | |
| | | | | |
| | 238 | | | Royal Boskalis Westminster NV | | | | | | | | | 8,603 | |
| | | | Diversified Telecommunication Services – 0.4% | | | | | | | | | | |
| | | | | |
| | 191 | | | Telefonica Brasil S.A. | | | | | | | | | 4,152 | |
| | | | Electrical Equipment – 3.4% | | | | | | | | | | |
| | | | | |
| | 145 | | | ABB Limited | | | | | | | | | 2,720 | |
| | | | | |
| | 515 | | | ABB Limited, ADR | | | | | | | | | 9,631 | |
| | | | | |
| | 46 | | | Nidec Corporation | | | | | | | | | 3,366 | |
| | | | | |
| | 312 | | | Nidec Corporation, ADR | | | | | | | | | 5,738 | |
| | | | | |
| | 525 | | | Sensata Techologies Holdings, (2) | | | | | | | | | 15,629 | |
| | | | Total Electrical Equipment | | | | | | | | | 37,084 | |
| | | | Electronic Equipment & Instruments – 1.8% | | | | | | | | | | |
| | | | | |
| | 594 | | | Hoya Corporation | | | | | | | | | 13,054 | |
| | | | | |
| | 1,132 | | | Nippon Electric Glass Company Limited | | | | | | | | | 6,252 | |
| | | | Total Electronic Equipment & Instruments | | | | | | | | | 19,306 | |
Portfolio of Investments
Nuveen Symphony International Equity Fund (continued)
September 30, 2012
| | | | | | | | | | | | | | |
| Shares | | | Description (1) | | | | | | | | Value | |
| | | | | | | | | | | | | | |
| | | | Energy Equipment & Services – 1.0% | | | | | | | | | | |
| | | | | |
| | 96 | | | Subsea 7 S.A. | | | | | | | | $ | 2,215 | |
| | | | | |
| | 359 | | | Subsea 7 S.A., ADR | | | | | | | | | 8,296 | |
| | | | Total Energy Equipment & Services | | | | | | | | | 10,511 | |
| | | | Food & Staples Retailing – 2.2% | | | | | | | | | | |
| | | | | |
| | 897 | | | Jeronimo Martins SGPS | | | | | | | | | 14,968 | |
| | | | | |
| | 746 | | | Koninklijke Ahold NV, Sponsored ADR | | | | | | | | | 9,295 | |
| | | | Total Food & Staples Retailing | | | | | | | | | 24,263 | |
| | | | Food Products – 4.5% | | | | | | | | | | |
| | | | | |
| | 103 | | | Nestle S.A. | | | | | | | | | 6,494 | |
| | | | | |
| | 227 | | | Nestle S.A., Sponsored ADR | | | | | | | | | 14,349 | |
| | | | | |
| | 617 | | | Unilever PLC | | | | | | | | | 22,437 | |
| | | | | |
| | 159 | | | Unilever PLC, ADR | | | | | | | | | 5,807 | |
| | | | Total Food Products | | | | | | | | | 49,087 | |
| | | | Health Care Providers & Services – 1.7% | | | | | | | | | | |
| | | | | |
| | 257 | | | Fresenius SE, ADR | | | | | | | | | 18,864 | |
| | | | Household Durables – 0.8% | | | | | | | | | | |
| | | | | |
| | 646 | | | Brookfield Residential Properties Inc., (2) | | | | | | | | | 9,031 | |
| | | | Industrial Conglomerates – 2.6% | | | | | | | | | | |
| | | | | |
| | 1,876 | | | Fraser and Neave Limited | | | | | | | | | 13,575 | |
| | | | | |
| | 151 | | | Rheinmetall AG | | | | | | | | | 7,044 | |
| | | | | |
| | 79 | | | Siemens AG, Sponsored ADR | | | | | | | | | 7,879 | |
| | | | Total Industrial Conglomerates | | | | | | | | | 28,498 | |
| | | | Insurance – 5.6% | | | | | | | | | | |
| | | | | |
| | 440 | | | Hannover Rueckversicherung AG | | | | | | | | | 28,116 | |
| | | | | |
| | 329 | | | Prudential Corporation PLC | | | | | | | | | 4,258 | |
| | | | | |
| | 373 | | | Prudential Corporation PLC, ADR | | | | | | | | | 9,698 | |
| | | | | |
| | 480 | | | SCOR SE, ADR | | | | | | | | | 12,377 | |
| | | | | |
| | 282 | | | XL Capital Ltd, Class A | | | | | | | | | 6,776 | |
| | | | Total Insurance | | | | | | | | | 61,225 | |
| | | | Internet Software & Services – 0.7% | | | | | | | | | | |
| | | | | |
| | 228 | | | Tencent Holdings Limited | | | | | | | | | 7,792 | |
| | | | Machinery – 2.4% | | | | | | | | | | |
| | | | | |
| | 175 | | | Kone OYJ | | | | | | | | | 12,110 | |
| | | | | |
| | 527 | | | Nabtesco Corporation | | | | | | | | | 9,677 | |
| | | | | |
| | 101 | | | Vallourec S.A. | | | | | | | | | 4,277 | |
| | | | Total Machinery | | | | | | | | | 26,064 | |
| | | | Media – 0.9% | | | | | | | | | | |
| | | | | |
| | 152 | | | WPP Group PLC | | | | | | | | | 10,356 | |
| | | | Metals & Mining – 6.2% | | | | | | | | | | |
| | | | | |
| | 139 | | | BHP Billiton PLC | | | | | | | | | 4,764 | |
| | | | | |
| | 166 | | | BHP Billiton PLC, ADR | | | | | | | | | 11,389 | |
| | | | | |
| | 977 | | | Iluka Resources Limited | | | | | | | | | 10,063 | |
| | | | | |
| | 350 | | | Rio Tinto Limited | | | | | | | | | 19,373 | |
| | | | | |
| | 418 | | | Umicore | | | | | | | | | 21,849 | |
| | | | Total Metals & Mining | | | | | | | | | 67,438 | |
| | | | | | | | | | | | | | |
| Shares | | | Description (1) | | | | �� | | | | Value | |
| | | | | | | | | | | | | | |
| | | | Multiline Retail – 1.9% | | | | | | | | | | |
| | | | | |
| | 371 | | | Next PLC | | | | | | | | $ | 20,669 | |
| | | | Office Electronics – 0.6% | | | | | | | | | | |
| | | | | |
| | 208 | | | Canon Inc. | | | | | | | | | 6,658 | |
| | | | Oil, Gas & Consumable Fuels – 7.5% | | | | | | | | | | |
| | | | | |
| | 563 | | | BG PLC | | | | | | | | | 11,364 | |
| | | | | |
| | 469 | | | BG PLC., Sponsored ADR | | | | | | | | | 9,521 | |
| | | | | |
| | 400 | | | Repsol YPF S.A | | | | | | | | | 7,757 | |
| | | | | |
| | 648 | | | Royal Dutch Shell PLC, Class B Shares | | | | | | | | | 23,000 | |
| | | | | |
| | 184 | | | StatoilHydro ASA | | | | | | | | | 4,750 | |
| | | | | |
| | 398 | | | StatoilHydro ASA, Sponsored ADR | | | | | | | | | 10,264 | |
| | | | | |
| | 65 | | | Total S.A., Sponsored ADR | | | | | | | | | 3,257 | |
| | | | | |
| | 245 | | | Total S.A. | | | | | | | | | 12,153 | |
| | | | Total Oil, Gas & Consumable Fuels | | | | | | | | | 82,066 | |
| | | | Personal Products – 0.8% | | | | | | | | | | |
| | | | | |
| | 68 | | | L’Oreal | | | | | | | | | 8,412 | |
| | | | Pharmaceuticals – 7.0% | | | | | | | | | | |
| | | | | |
| | 266 | | | AstraZeneca PLC, Sponsored ADR | | | | | | | | | 12,731 | |
| | | | | |
| | 58 | | | Novartis AG | | | | | | | | | 3,549 | |
| | | | | |
| | 159 | | | Novartis AG, Sponsored ADR | | | | | | | | | 9,740 | |
| | | | | |
| | 140 | | | Novo Nordisk A/S | | | | | | | | | 22,117 | |
| | | | | |
| | 316 | | | Sanofi-Aventis, Sponsored ADR | | | | | | | | | 13,607 | |
| | | | | |
| | 57 | | | Sanofi-Synthelabo, S.A. | | | | | | | | | 4,860 | |
| | | | | |
| | 237 | | | Teva Pharmaceutical Industries Limited, Sponsored ADR | | | | | | | | | 9,814 | |
| | | | Total Pharmaceuticals | | | | | | | | | 76,418 | |
| | | | Real Estate Investment Trust – 1.4% | | | | | | | | | | |
| | | | | |
| | 1,120 | | | Westfield Group | | | | | | | | | 11,804 | |
| | | | | |
| | 1,120 | | | Westfield Realty Trust | | | | | | | | | 3,358 | |
| | | | Total Real Estate Investment Trust | | | | | | | | | 15,162 | |
| | | | Real Estate Management & Development – 3.6% | | | | | | | | | | |
| | | | | |
| | 179 | | | Altisource Portfolio Solutions S.A., (2) | | | | | | | | | 15,439 | |
| | | | | |
| | 619 | | | Brookfield Properties Corporation | | | | | | | | | 10,288 | |
| | | | | |
| | 2,995 | | | Hysan Development Company | | | | | | | | | 13,615 | |
| | | | Total Real Estate Management & Development | | | | | | | | | 39,342 | |
| | | | Semiconductors & Equipment - 2.2% | | | | | | | | | | |
| | | | | |
| | 445 | | | ASM Lithography Holding NV | | | | | | | | | 23,888 | |
| | | | Software - 0.8% | | | | | | | | | | |
| | | | | |
| | 194 | | | Check Point Software Technology Limited, (2) | | | | | | | | | 9,343 | |
| | | | Textiles, Apparel & Luxury Goods - 3.8% | | | | | | | | | | |
| | | | | |
| | 695 | | | Burberry Group PLC | | | | | | | | | 11,234 | |
| | | | | |
| | 98 | | | LVMH Moet Hennessy | | | | | | | | | 14,734 | |
| | | | | |
| | 4,534 | | | Yue Yuen Industrial Holdings Limited | | | | | | | | | 15,261 | |
| | | | Total Textiles, Apparel & Luxury Goods | | | | | | | | | 41,229 | |
| | | | Tobacco - 1.6% | | | | | | | | | | |
| | | | | |
| | 123 | | | British American Tobacco PLC | | | | | | | | | 6,315 | |
| | | | | |
| | 113 | | | British American Tobacco PLC, ADR | | | | | | | | | 11,598 | |
| | | | Total Tobacco | | | | | | | | | 17,913 | |
Portfolio of Investments
Nuveen Symphony International Equity Fund (continued)
September 30, 2012
| | | | | | | | | | | | | | |
| Shares | | | Description (1) | | | | | | | | Value | |
| | | | | | | | | | | | | | |
| | | | Trading Companies & Distributors – 1.6% | | | | | | | | | | |
| | | | | |
| | 1,210 | | | Mitsui & Company Limited | | | | | | | | $ | 17,022 | |
| | | | Wireless Telecommunication Services – 2.8% | | | | | | | | | | |
| | | | | |
| | 198 | | | Millicom International Cellular S.A. | | | | | | | | | 18,372 | |
| | | | | |
| | 4,264 | | | Vodafone Group PLC | | | | | | | | | 12,099 | |
| | | | Total Wireless Telecommunication Services | | | | | | | | | 30,471 | |
| | | | Total Common Stocks (cost $912,183) | | | | | | | | | 1,012,559 | |
| | | | | |
| Shares | | | Description (1) | | | | | | | | Value | |
| | | | INVESTMENT COMPANIES – 4.2% | | | | | | | | | | |
| | | | | |
| | 617 | | | iShares MSCI EAFE Index Fund | | | | | | | | $ | 32,701 | |
| | | | | |
| | 183 | | | iShares MSCI Hong Kong Index Fund | | | | | | | | | 3,331 | |
| | | | | |
| | 1,081 | | | iShares MSCI Japan Index Fund | | | | | | | | | 9,902 | |
| | | | Total Investment Companies (cost $44,745) | | | | | | | | | 45,934 | |
| | | | Total Investments (cost $956,928) – 97.0% | | | | | | | | | 1,058,493 | |
| | | | Other Assets Less Liabilities – 3.0% | | | | | | | | | 32,607 | |
| | | | Net Assets – 100% | | | | | | | | $ | 1,091,100 | |
| | | | For Fund portfolio compliance purposes, the Fund’s industry classifications refer to any one or more of the industry sub-classifications used by one or more widely recognized market indexes or ratings group indexes, and/or as defined by Fund management. This definition may not apply for purposes of this report, which may combine industry sub-classifications into sectors for reporting ease. |
| | (1) | | All percentages shown in the Portfolio of Investments are based on net assets. |
| | (2) | | Non-income producing; issuer has not declared a dividend within the past twelve months. |
| | ADR | | American Depositary Receipt. |
See accompanying notes to financial statements.
Portfolio of Investments
Nuveen Symphony Optimized Alpha Fund
September 30, 2012
| | | | | | | | | | | | | | |
| Shares | | | Description (1) | | | | | | | | Value | |
| | | | | | | | | | | | | | |
| | | | COMMON STOCKS – 96.8% | | | | | | | | | | |
| | | | | |
| | | | Aerospace & Defense – 1.8% | | | | | | | | | | |
| | | | | |
| | 492 | | | Honeywell International Inc. | | | | | | | | $ | 29,397 | |
| | | | | |
| | 279 | | | United Technologies Corporation | | | | | | | | | 21,843 | |
| | | | Total Aerospace & Defense | | | | | | | | | 51,240 | |
| | | | Beverages – 2.8% | | | | | | | | | | |
| | | | | |
| | 1,280 | | | Coca-Cola Company | | | | | | | | | 48,550 | |
| | | | | |
| | 707 | | | Dr. Pepper Snapple Group | | | | | | | | | 31,483 | |
| | | | Total Beverages | | | | | | | | | 80,033 | |
| | | | Biotechnology – 3.0% | | | | | | | | | | |
| | | | | |
| | 342 | | | Amgen Inc. | | | | | | | | | 28,837 | |
| | | | | |
| | 195 | | | Biogen Idec Inc., (2) | | | | | | | | | 29,100 | |
| | | | | |
| | 435 | | | Gilead Sciences, Inc., (2) | | | | | | | | | 28,854 | |
| | | | Total Biotechnology | | | | | | | | | 86,791 | |
| | | | Chemicals – 1.5% | | | | | | | | | | |
| | | | | |
| | 133 | | | CF Industries Holdings, Inc. | | | | | | | | | 29,558 | |
| | | | | |
| | 234 | | | Mosaic Company | | | | | | | | | 13,481 | |
| | | | Total Chemicals | | | | | | | | | 43,039 | |
| | | | Commercial Banks – 3.6% | | | | | | | | | | |
| | | | | |
| | 456 | | | M&T Bank Corporation | | | | | | | | | 43,393 | |
| | | | | |
| | 509 | | | SunTrust Banks, Inc. | | | | | | | | | 14,389 | |
| | | | | |
| | 1,359 | | | Wells Fargo & Company | | | | | | | | | 46,926 | |
| | | | Total Commercial Banks | | | | | | | | | 104,708 | |
| | | | Commercial Services & Supplies – 0.9% | | | | | | | | | | |
| | | | | |
| | 809 | | | Waste Management, Inc. | | | | | | | | | 25,953 | |
| | | | Communications Equipment – 1.2% | | | | | | | | | | |
| | | | | |
| | 758 | | | Cisco Systems, Inc. | | | | | | | | | 14,470 | |
| | | | | |
| | 318 | | | QUALCOMM, Inc. | | | | | | | | | 19,872 | |
| | | | Total Communications Equipment | | | | | | | | | 34,342 | |
| | | | Computers & Peripherals – 6.2% | | | | | | | | | | |
| | | | | |
| | 268 | | | Apple, Inc. | | | | | | | | | 178,826 | |
| | | | Consumer Finance – 0.5% | | | | | | | | | | |
| | | | | |
| | 254 | | | Capital One Financial Corporation | | | | | | | | | 14,481 | |
| | | | Diversified Financial Services – 0.9% | | | | | | | | | | |
| | | | | |
| | 615 | | | JPMorgan Chase & Co. | | | | | | | | | 24,895 | |
| | | | Diversified Telecommunication Services – 2.7% | | | | | | | | | | |
| | | | | |
| | 331 | | | CenturyLink Inc. | | | | | | | | | 13,372 | |
| | | | | |
| | 1,447 | | | Verizon Communications Inc. | | | | | | | | | 65,940 | |
| | | | Total Diversified Telecommunication Services | | | | | | | | | 79,312 | |
| | | | Electric Utilities – 1.2% | | | | | | | | | | |
| | | | | |
| | 741 | | | Southern Company | | | | | | | | | 34,153 | |
| | | | Energy Equipment & Services – 1.4% | | | | | | | | | | |
| | | | | |
| | 499 | | | National-Oilwell Varco Inc. | | | | | | | | | 39,975 | |
| | | | Food & Staples Retailing – 1.6% | | | | | | | | | | |
| | | | | |
| | 451 | | | Costco Wholesale Corporation | | | | | | | | | 45,156 | |
Portfolio of Investments
Nuveen Symphony Optimized Alpha Fund (continued)
September 30, 2012
| | | | | | | | | | | | | | |
| Shares | | | Description (1) | | | | | | | | Value | |
| | | | | | | | | | | | | | |
| | | | Food Products – 2.9% | | | | | | | | | | |
| | | | | |
| | 495 | | | H.J. Heinz Company | | | | | | | | $ | 27,695 | |
| | | | | |
| | 695 | | | Kraft Foods Inc., Class A Shares | | | | | | | | | 28,738 | |
| | | | | |
| | 372 | | | Mead Johnson Nutrition Company, Class A Shares | | | | | | | | | 27,260 | |
| | | | Total Food Products | | | | | | | | | 83,693 | |
| | | | Gas Utilities – 0.5% | | | | | | | | | | |
| | | | | |
| | 319 | | | ONEOK, Inc. | | | | | | | | | 15,411 | |
| | | | Health Care Equipment & Supplies – 2.6% | | | | | | | | | | |
| | | | | |
| | 312 | | | Baxter International, Inc. | | | | | | | | | 18,801 | |
| | | | | |
| | 365 | | | Becton, Dickinson and Company | | | | | | | | | 28,674 | |
| | | | | |
| | 353 | | | Medtronic, Inc. | | | | | | | | | 15,221 | |
| | | | | |
| | 241 | | | Stryker Corporation | | | | | | | | | 13,414 | |
| | | | Total Health Care Equipment & Supplies | | | | | | | | | 76,110 | |
| | | | Health Care Providers & Services – 0.9% | | | | | | | | | | |
| | | | | |
| | 319 | | | McKesson HBOC Inc. | | | | | | | | | 27,444 | |
| | | | Hotels, Restaurants & Leisure – 1.4% | | | | | | | | | | |
| | | | | |
| | 802 | | | Starbucks Corporation | | | | | | | | | 40,702 | |
| | | | Household Durables – 0.6% | | | | | | | | | | |
| | | | | |
| | 1,115 | | | Pulte Corporation, (2) | | | | | | | | | 17,283 | |
| | | | Industrial Conglomerates – 2.2% | | | | | | | | | | |
| | | | | |
| | 2,818 | | | General Electric Company | | | | | | | | | 63,997 | |
| | | | Insurance – 4.3% | | | | | | | | | | |
| | | | | |
| | 784 | | | AFLAC Incorporated | | | | | | | | | 37,538 | |
| | | | | |
| | 221 | | | Everest Reinsurance Group Ltd | | | | | | | | | 23,638 | |
| | | | | |
| | 728 | | | Hartford Financial Services Group, Inc. | | | | | | | | | 14,152 | |
| | | | | |
| | 393 | | | Marsh & McLennan Companies, Inc. | | | | | | | | | 13,334 | |
| | | | | |
| | 147 | | | PartnerRe Limited | | | | | | | | | 10,919 | |
| | | | | |
| | 467 | | | Torchmark Corporation | | | | | | | | | 23,980 | |
| | | | Total Insurance | | | | | | | | | 123,561 | |
| | | | Internet Software & Services – 1.4% | | | | | | | | | | |
| | | | | |
| | 54 | | | Google Inc., Class A, (2) | | | | | | | | | 40,743 | |
| | | | IT Services – 2.7% | | | | | | | | | | |
| | | | | |
| | 185 | | | Accenture Limited | | | | | | | | | 12,956 | |
| | | | | |
| | 317 | | | International Business Machines Corporation (IBM) | | | | | | | | | 65,762 | |
| | | | Total IT Services | | | | | | | | | 78,718 | |
| | | | Life Sciences Tools & Services – 0.7% | | | | | | | | | | |
| | | | | |
| | 366 | | | Thermo Fisher Scientific, Inc. | | | | | | | | | 21,532 | |
| | | | Machinery – 1.7% | | | | | | | | | | |
| | | | | |
| | 323 | | | Caterpillar Inc. | | | | | | | | | 27,791 | |
| | | | | |
| | 1,054 | | | Harsco Corporation | | | | | | | | | 21,639 | |
| | | | Total Machinery | | | | | | | | | 49,430 | |
| | | | Media – 0.6% | | | | | | | | | | |
| | | | | |
| | 528 | | | Comcast Corporation, Class A | | | | | | | | | 18,887 | |
| | | | Metals & Mining – 2.2% | | | | | | | | | | |
| | | | | |
| | 263 | | | Newmont Mining Corporation | | | | | | | | | 14,731 | |
| | | | | |
| | 1,408 | | | Southern Copper Corporation | | | | | | | | | 48,379 | |
| | | | Total Metals & Mining | | | | | | | | | 63,110 | |
| | | | | | | | | | | | | | |
| Shares | | | Description (1) | | | | | | | | Value | |
| | | | | | | | | | | | | | |
| | | | Multiline Retail – 1.8% | | | | | | | | | | |
| | | | | |
| | 809 | | | Target Corporation | | | | | | | | $ | 51,347 | |
| | | | Multi-Utilities – 3.4% | | | | | | | | | | |
| | | | | |
| | 1,367 | | | CenterPoint Energy, Inc. | | | | | | | | | 29,117 | |
| | | | | |
| | 577 | | | Consolidated Edison, Inc. | | | | | | | | | 34,557 | |
| | | | | |
| | 244 | | | DTE Energy Company | | | | | | | | | 14,625 | |
| | | | | |
| | 670 | | | Public Service Enterprise Group Incorporated | | | | | | | | | 21,561 | |
| | | | Total Multi-Utilities | | | | | | | | | 99,860 | |
| | | | Oil, Gas & Consumable Fuels – 6.6% | | | | | | | | | | |
| | | | | |
| | 556 | | | Chevron Corporation | | | | | | | | | 64,807 | |
| | | | | |
| | 236 | | | Exxon Mobil Corporation | | | | | | | | | 21,582 | |
| | | | | |
| | 1,139 | | | Marathon Oil Corporation | | | | | | | | | 33,680 | |
| | | | | |
| | 800 | | | Marathon Petroleum Corporation | | | | | | | | | 43,672 | |
| | | | | |
| | 613 | | | Phillips 66 | | | | | | | | | 28,425 | |
| | | | Total Oil, Gas & Consumable Fuels | | | | | | | | | 192,166 | |
| | | | Paper & Forest Products – 1.0% | | | | | | | | | | |
| | | | | |
| | 824 | | | International Paper Company | | | | | | | | | 29,928 | |
| | | | Pharmaceuticals – 7.2% | | | | | | | | | | |
| | | | | |
| | 337 | | | Abbott Laboratories | | | | | | | | | 23,105 | |
| | | | | |
| | 1,341 | | | Johnson & Johnson | | | | | | | | | 92,408 | |
| | | | | |
| | 640 | | | Merck & Company Inc. | | | | | | | | | 28,864 | |
| | | | | |
| | 764 | | | Watson Pharmaceuticals Inc., (2) | | | | | | | | | 65,062 | |
| | | | Total Pharmaceuticals | | | | | | | | | 209,439 | |
| | | | Real Estate Investment Trust – 4.7% | | | | | | | | | | |
| | | | | |
| | 395 | | | American Capital Agency Corporation | | | | | | | | | 13,663 | |
| | | | | |
| | 1,184 | | | Annaly Capital Management Inc. | | | | | | | | | 19,939 | |
| | | | | |
| | 372 | | | Digital Realty Trust Inc. | | | | | | | | | 25,984 | |
| | | | | |
| | 732 | | | Equity One Inc. | | | | | | | | | 15,416 | |
| | | | | |
| | 1,154 | | | Omega Healthcare Investors Inc. | | | | | | | | | 26,230 | |
| | | | | |
| | 237 | | | Simon Property Group, Inc. | | | | | | | | | 35,979 | |
| | | | Total Real Estate Investment Trust | | | | | | | | | 137,211 | |
| | | | Road & Rail – 1.1% | | | | | | | | | | |
| | | | | |
| | 272 | | | Norfolk Southern Corporation | | | | | | | | | 17,307 | |
| | | | | |
| | 121 | | | Union Pacific Corporation | | | | | | | | | 14,363 | |
| | | | Total Road & Rail | | | | | | | | | 31,670 | |
| | | | Semiconductors & Equipment – 2.7% | | | | | | | | | | |
| | | | | |
| | 1,718 | | | Intel Corporation | | | | | | | | | 38,964 | |
| | | | | |
| | 640 | | | Linear Technology Corporation | | | | | | | | | 20,384 | |
| | | | | |
| | 1,448 | | | NVIDIA Corporation, (2) | | | | | | | | | 19,316 | |
| | | | Total Semiconductors & Equipment | | | | | | | | | 78,664 | |
| | | | Software – 4.3% | | | | | | | | | | |
| | | | | |
| | 2,586 | | | Microsoft Corporation | | | | | | | | | 77,011 | |
| | | | | |
| | 1,139 | | | Oracle Corporation | | | | | | | | | 35,867 | |
| | | | | |
| | 113 | | | VMware Inc. | | | | | | | | | 10,932 | |
| | | | Total Software | | | | | | | | | 123,810 | |
Portfolio of Investments
Nuveen Symphony Optimized Alpha Fund (continued)
September 30, 2012
| | | | | | | | | | | | | | |
| Shares | | | Description (1) | | | | | | | | Value | |
| | | | | | | | | | | | | | |
| | | | Specialty Retail – 5.3% | | | | | | | | | | |
| | | | | |
| | 1,718 | | | American Eagle Outfitters, Inc. | | | | | | | | $ | 36,215 | |
| | | | | |
| | 240 | | | Home Depot, Inc. | | | | | | | | | 14,489 | |
| | | | | |
| | 565 | | | Limited Brands, Inc. | | | | | | | | | 27,832 | |
| | | | | |
| | 628 | | | Ross Stores, Inc. | | | | | | | | | 40,569 | |
| | | | | |
| | 796 | | | Williams-Sonoma Inc. | | | | | | | | | 35,000 | |
| | | | Total Specialty Retail | | | | | | | | | 154,105 | |
| | | | Textiles, Apparel & Luxury Goods – 0.5% | | | | | | | | | | |
| | | | | |
| | 412 | | | Deckers Outdoor Corporation, (2) | | | | | | | | | 15,096 | |
| | | | Tobacco – 4.2% | | | | | | | | | | |
| | | | | |
| | 2,407 | | | Altria Group, Inc. | | | | | | | | | 80,370 | |
| | | | | |
| | 301 | | | Philip Morris International | | | | | | | | | 27,071 | |
| | | | | |
| | 299 | | | Reynolds American Inc. | | | | | | | | | 12,958 | |
| | | | Total Tobacco | | | | | | | | | 120,399 | |
| | | | Total Investments (cost $2,328,797) – 96.8% | | | | | | | | | 2,807,220 | |
| | | | Other Assets Less Liabilities – 3.2% | | | | | | | | | 91,318 | |
| | | | Net Assets – 100% | | | | | | | | $ | 2,898,538 | |
| | | | For Fund portfolio compliance purposes, the Fund’s industry classifications refer to any one or more of the industry sub-classifications used by one or more widely recognized market indexes or ratings group indexes, and/or as defined by Fund management. This definition may not apply for purposes of this report, which may combine industry sub-classifications into sectors for reporting ease. |
| | (1) | | All percentages shown in the Portfolio of Investments are based on net assets. |
| | (2) | | Non-income producing; issuer has not declared a dividend within the past twelve months. |
See accompanying notes to financial statements.
Statement of Assets and Liabilities
September 30, 2012
| | | | | | | | | | | | | | | | |
| | | Symphony
Large-Cap
Growth | | | Symphony
Mid-Cap
Core | | | Symphony
International
Equity | | | Symphony
Optimized
Alpha | |
Assets | | | | | | | | | | | | | | | | |
Investments, at value (cost $61,364,521, $3,918,819, $956,928 and $2,328,797, respectively) | | $ | 65,733,010 | | | $ | 4,361,392 | | | $ | 1,058,493 | | | $ | 2,807,220 | |
Cash | | | — | | | | — | | | | 51,210 | | | | 64,994 | |
Cash denominated in foreign currencies (cost $–, $–, $438
and $–, respectively) | | | — | | | | — | | | | 444 | | | | — | |
Receivables: | | | | | | | | | | | | | | | | |
Dividends | | | 101,648 | | | | 9,234 | | | | 3,196 | | | | 6,919 | |
Investments sold | | | — | | | | 247,792 | | | | — | | | | 105,905 | |
Reclaims | | | — | | | | — | | | | 300 | | | | — | |
Shares sold | | | 1,311,973 | | | | 5,236 | | | | 5,000 | | | | 119,246 | |
Other assets | | | 228 | | | | 200 | | | | 199 | | | | 199 | |
Total assets | | | 67,146,859 | | | | 4,623,854 | | | | 1,118,842 | | | | 3,104,483 | |
Liabilities | | | | | | | | | | | | | | | | |
Payables: | | | | | | | | | | | | | | | | |
Investments purchased | | | 2,084,294 | | | | 371,302 | | | | — | | | | 110,987 | |
Shares redeemed | | | 15,220 | | | | 26,244 | | | | — | | | | 45,643 | |
Accrued expenses: | | | | | | | | | | | | | | | | |
Management fees | | | 39,425 | | | | 12,161 | | | | 19,349 | | | | 32,441 | |
Trustees fees | | | 202 | | | | 21 | | | | 6 | | | | 14 | |
12b-1 distribution and service fees | | | 17,006 | | | | 970 | | | | 154 | | | | 313 | |
Other | | | 93,665 | | | | 33,155 | | | | 8,233 | | | | 16,547 | |
Total liabilities | | | 2,249,812 | | | | 443,853 | | | | 27,742 | | | | 205,945 | |
Net assets | | $ | 64,897,047 | | | $ | 4,180,001 | | | $ | 1,091,100 | | | $ | 2,898,538 | |
Class A Shares | | | | | | | | | | | | | | | | |
Net assets | | $ | 36,679,705 | | | $ | 2,025,555 | | | $ | 109,836 | | | $ | 876,913 | |
Shares outstanding | | | 1,456,177 | | | | 80,813 | | | | 7,337 | | | | 39,093 | |
Net asset value per share | | $ | 25.19 | | | $ | 25.06 | | | $ | 14.97 | | | $ | 22.43 | |
Offering price per share (net asset value per share plus maximum sales charge of 5.75% of offering price) | | $ | 26.73 | | | $ | 26.59 | | | $ | 15.88 | | | $ | 23.80 | |
Class C Shares | | | | | | | | | | | | | | | | |
Net assets | | $ | 11,841,450 | | | $ | 548,258 | | | $ | 136,505 | | | $ | 170,011 | |
Shares outstanding | | | 492,736 | | | | 22,918 | | | | 9,203 | | | | 7,736 | |
Net asset value and offering price per share | | $ | 24.03 | | | $ | 23.92 | | | $ | 14.83 | | | $ | 21.98 | |
Class R3 Shares | | | | | | | | | | | | | | | | |
Net assets | | $ | 2,371,819 | | | $ | 272,476 | | | $ | 51,696 | | | | N/A | |
Shares outstanding | | | 94,233 | | | | 10,883 | | | | 3,448 | | | | N/A | |
Net asset value and offering price per share | | $ | 25.17 | | | $ | 25.04 | | | $ | 14.99 | | | | N/A | |
Class I Shares | | | | | | | | | | | | | | | | |
Net assets | | $ | 14,004,073 | | | $ | 1,333,712 | | | $ | 793,063 | | | $ | 1,851,614 | |
Shares outstanding | | | 549,118 | | | | 52,537 | | | | 52,929 | | | | 82,374 | |
Net asset value and offering price per share | | $ | 25.50 | | | $ | 25.39 | | | $ | 14.98 | | | $ | 22.48 | |
Net assets consist of: | | | | | | | | | | | | | | | | |
Capital paid-in | | $ | 60,718,878 | | | $ | 3,813,670 | | | $ | 1,356,243 | | | $ | 2,314,496 | |
Undistributed (Over-distribution of) net investment income | | | 347,004 | | | | 12,684 | | | | 16,413 | | | | 34,578 | |
Accumulated net realized gain (loss) | | | (537,324 | ) | | | (88,926 | ) | | | (383,124 | ) | | | 71,041 | |
Net unrealized appreciation (depreciation) | | | 4,368,489 | | | | 442,573 | | | | 101,568 | | | | 478,423 | |
Net assets | | $ | 64,897,047 | | | $ | 4,180,001 | | | $ | 1,091,100 | | | $ | 2,898,538 | |
Authorized shares | | | Unlimited | | | | Unlimited | | | | Unlimited | | | | Unlimited | |
Par value per share | | $ | 0.01 | | | $ | 0.01 | | | $ | 0.01 | | | $ | 0. 01 | |
| N/A | – After the close of business May 30, 2012, Symphony Optimized Alpha liquidated all of its Class R3 Shares. |
See accompanying notes to financial statements.
Statement of Operations
Year Ended September 30, 2012
| | | | | | | | | | | | | | | | |
| | | Symphony
Large-Cap
Growth | | | Symphony
Mid-Cap
Core | | | Symphony
International
Equity | | | Symphony
Optimized
Alpha | |
Dividends and Interest Income (net of foreign tax withheld of $1,995, $–, $2,683 and $277, respectively) | | $ | 424,752 | | | $ | 60,248 | | | $ | 30,459 | | | $ | 64,236 | |
Expenses | | | | | | | | | | | | | | | | |
Management fees | | | 162,273 | | | | 24,575 | | | | 7,731 | | | | 16,253 | |
12b-1 service fees – Class A | | | 37,312 | | | | 4,531 | | | | 527 | | | | 1,911 | |
12b-1 distribution and service fees –
Class C | | | 47,064 | | | | 6,615 | | | | 2,176 | | | | 2,871 | |
12b-1 distribution and service fees –
Class R3(1) | | | 2,311 | | | | 1,268 | | | | 249 | | | | 195 | |
Shareholder servicing agent fees and expenses | | | 24,210 | | | | 3,637 | | | | 620 | | | | 2,793 | |
Custodian’s fees and expenses | | | 25,835 | | | | 12,302 | | | | 14,409 | | | | 11,809 | |
Trustees fees and expenses | | | 752 | | | | 258 | | | | 194 | | | | 233 | |
Professional fees | | | 56,809 | | | | 25,617 | | | | 23,065 | | | | 22,854 | |
Shareholder reporting expenses | | | 60,755 | | | | 25,815 | | | | 9,531 | | | | 22,510 | |
Federal and state registration fees | | | 40,776 | | | | 30,618 | | | | 15,269 | | | | 7,199 | |
Other expenses | | | 4,799 | | | | 4,526 | | | | 4,210 | | | | 4,002 | |
Total expenses before custodian fee credit and expense reimbursement | | | 462,896 | | | | 139,762 | | | | 77,981 | | | | 92,630 | |
Custodian fee credit | | | (7 | ) | | | (27 | ) | | | (37 | ) | | | (40 | ) |
Expense reimbursement | | | (141,111 | ) | | | (89,178 | ) | | | (63,999 | ) | | | (64,050 | ) |
Net expenses | | | 321,778 | | | | 50,557 | | | | 13,945 | | | | 28,540 | |
Net investment income (loss) | | | 102,974 | | | | 9,691 | | | | 16,514 | | | | 35,696 | |
Realized and Unrealized Gain (Loss) | | | | | | | | | | | | | | | | |
Net realized gain (loss) from investments and foreign currency | | | (222,369 | ) | | | 101,623 | | | | 8,999 | | | | 243,885 | |
Change in net unrealized appreciation (depreciation) of investments and foreign currency | | | 3,849,534 | | | | 580,300 | | | | 117,052 | | | | 271,036 | |
Net realized and unrealized gain (loss) | | | 3,627,165 | | | | 681,923 | | | | 126,051 | | | | 514,921 | |
Net increase (decrease) in net assets from operations | | $ | 3,730,139 | | | $ | 691,614 | | | $ | 142,565 | | | $ | 550,617 | |
| (1) | After the close of business on May 30, 2012, Symphony Optimized Alpha liquidated all of its Class R3 Shares. |
See accompanying notes to financial statements.
Statement of Changes in Net Assets
| | | | | | | | | | | | | | | | |
| | | Symphony Large-Cap Growth | | | Symphony Mid-Cap Core | |
| | | Year Ended
9/30/12 | | | Year Ended
9/30/11 | | | Year Ended
9/30/12 | | | Year Ended
9/30/11 | |
Operations | | | | | | | | | | | | | | | | |
Net investment income (loss) | | $ | 102,974 | | | $ | (595 | ) | | $ | 9,691 | | | $ | (4,467 | ) |
Net realized gain (loss) from investments and foreign currency | | | (222,369 | ) | | | 1,771,603 | | | | 101,623 | | | | (5,479 | ) |
Change in net unrealized appreciation (depreciation) of
investments and foreign currency | | | 3,849,534 | | | | (1,048,876 | ) | | | 580,300 | | | | (364,537 | ) |
Net increase (decrease) in net assets from operations | | | 3,730,139 | | | | 722,132 | | | | 691,614 | | | | (374,483 | ) |
Distributions to Shareholders | | | | | | | | | | | | | | | | |
From net investment income: | | | | | | | | | | | | | | | | |
Class A | | | — | | | | — | | | | — | | | | — | |
Class C | | | — | | | | — | | | | — | | | | — | |
Class R3 | | | — | | | | — | | | | — | | | | — | |
Class I | | | (195 | ) | | | — | | | | — | | | | — | |
From accumulated net realized gains: | | | | | | | | | | | | | | | | |
Class A | | | (259,547 | ) | | | — | | | | — | | | | — | |
Class C | | | (154,543 | ) | | | — | | | | — | | | | — | |
Class R3 | | | (7,057 | ) | | | — | | | | — | | | | — | |
Class I | | | (263,637 | ) | | | — | | | | — | | | | — | |
Decrease in net assets from distributions to shareholders | | | (684,979 | ) | | | — | | | | — | | | | — | |
Fund Share Transactions | | | | | | | | | | | | | | | | |
Proceeds from sale of shares | | | 62,774,983 | | | | 7,742,981 | | | | 2,323,044 | | | | 2,515,358 | |
Net proceeds from shares issued to shareholders due to reinvestment of distributions | | | 530,191 | | | | — | | | | — | | | | — | |
| | | 63,305,174 | | | | 7,742,981 | | | | 2,323,044 | | | | 2,515,358 | |
Cost of shares redeemed | | | (7,406,131 | ) | | | (11,080,238 | ) | | | (1,665,010 | ) | | | (475,642 | ) |
Net increase (decrease) in net assets from Fund share transactions | | | 55,899,043 | | | | (3,337,257 | ) | | | 658,034 | | | | 2,039,716 | |
Net increase (decrease) in net assets | | | 58,944,203 | | | | (2,615,125 | ) | | | 1,349,648 | | | | 1,665,233 | |
Net assets at the beginning of period | | | 5,952,844 | | | | 8,567,969 | | | | 2,830,353 | | | | 1,165,120 | |
Net assets at the end of period | | $ | 64,897,047 | | | $ | 5,952,844 | | | $ | 4,180,001 | | | $ | 2,830,353 | |
Undistributed (Over-distribution of) net investment income
at the end of period | | $ | 347,004 | | | $ | 195 | | | $ | 12,684 | | | $ | — | |
See accompanying notes to financial statements.
Statement of Changes in Net Assets (continued)
| | | | | | | | | | | | | | | | |
| | | Symphony International Equity | | | Symphony Optimized Alpha | |
| | | Year Ended
9/30/12 | | | Year Ended
9/30/11 | | | Year Ended
9/30/12 | | | Year Ended
9/30/11 | |
Operations | | | | | | | | | | | | | | | | |
Net investment income (loss) | | $ | 16,514 | | | $ | 13,300 | | | $ | 35,696 | | | $ | 26,550 | |
Net realized gain (loss) from investments and foreign currency | | | 8,999 | | | | 40,159 | | | | 243,885 | | | | 304,552 | |
Change in net unrealized appreciation (depreciation) of
investments and foreign currency | | | 117,052 | | | | (157,074 | ) | | | 271,036 | | | | (213,631 | ) |
Net increase (decrease) in net assets from operations | | | 142,565 | | | | (103,615 | ) | | | 550,617 | | | | 117,471 | |
Distributions to Shareholders | | | | | | | | | | | | | | | | |
From net investment income: | | | | | | | | | | | | | | | | |
Class A | | | (3,164 | ) | | | (4,708 | ) | | | (6,821 | ) | | | (2,764 | ) |
Class C | | | (1,962 | ) | | | (1,681 | ) | | | (704 | ) | | | — | |
Class R3(1) | | | (579 | ) | | | (705 | ) | | | (380 | ) | | | (188 | ) |
Class I | | | (6,342 | ) | | | (6,903 | ) | | | (13,082 | ) | | | (13,989 | ) |
From accumulated net realized gains: | | | | | | | | | | | | | | | | |
Class A | | | — | | | | — | | | | — | | | | — | |
Class C | | | — | | | | — | | | | — | | | | — | |
Class R3(1) | | | — | | | | — | | | | — | | | | — | |
Class I | | | — | | | | — | | | | — | | | | — | |
Decrease in net assets from distributions to shareholders | | | (12,047 | ) | | | (13,997 | ) | | | (20,987 | ) | | | (16,941 | ) |
Fund Share Transactions | | | | | | | | | | | | | | | | |
Proceeds from sale of shares | | | 520,286 | | | | 407,564 | | | | 1,185,112 | | | | 684,696 | |
Net proceeds from shares issued to shareholders due to
reinvestment of distributions | | | 1,699 | | | | 2,689 | | | | 11,219 | | | | 6,859 | |
| | | 521,985 | | | | 410,253 | | | | 1,196,331 | | | | 691,555 | |
Cost of shares redeemed | | | (524,635 | ) | | | (145,077 | ) | | | (1,042,352 | ) | | | (1,009,124 | ) |
Net increase (decrease) in net assets from Fund share transactions | | | (2,650 | ) | | | 265,176 | | | | 153,979 | | | | (317,569 | ) |
Net increase (decrease) in net assets | | | 127,868 | | | | 147,564 | | | | 683,609 | | | | (217,039 | ) |
Net assets at the beginning of period | | | 963,232 | | | | 815,668 | | | | 2,214,929 | | | | 2,431,968 | |
Net assets at the end of period | | $ | 1,091,100 | | | $ | 963,232 | | | $ | 2,898,538 | | | $ | 2,214,929 | |
Undistributed (Over-distribution of) net investment income
at the end of period | | $ | 16,413 | | | $ | 12,032 | | | $ | 34,578 | | | $ | 19,869 | |
| (1) – | After the close of business on May 30, 2012, Symphony Optimized Alpha liquidated all of its Class R3 Shares. |
See accompanying notes to financial statements.
[THIS PAGE INTENTIONALLY LEFT BLANK]
Financial Highlights
| | | | | | | | | | | | | | | | | | | | | | | | | | | | | | | | | | | | | | | | |
| Selected data for a share outstanding throughout each period: | | | | | | | | | | | | | | | | | | | |
| | | | | | | | |
| Class (Commencement Date) | | | | | | | | | | | | | | | | | | | | | | | | | |
| | | | | | Investment Operations | | | Less Distributions | | | | | | | |
| | | | | | | | | |
SYMPHONY
LARGE-CAP GROWTH | | | | | | | | | | | | | | | | | | | | | | | | | | | | |
| | | Beginning
Net
Asset
Value | | | Net
Invest-
ment
Income
(Loss)(a) | | | Net
Realized/
Unrealized
Gain
(Loss) | | | Total | | | Net
Invest-
ment
Income | | | Capital
Gains(b) | | | Return
of
Capital | | | Total | | | Ending
Net
Asset
Value | | | Total
Return(c) | |
Class A (12/06) | | | | | | | | | | | | | | | | | | | | | | | | | | | | | | | | | | | | | |
Year Ended 9/30: | | | | | | | | | | | | | | | | | | | | | | | | | | | | | | | | | | | | | |
2012 | | $ | 21.34 | | | $ | .12 | | | $ | 6.23 | | | $ | 6.35 | | | $ | — | | | $ | (2.50 | ) | | $ | — | | | $ | (2.50 | ) | | $ | 25.19 | | | | 32.70 | % |
2011 | | | 20.63 | | | | — | ** | | | .71 | | | | .71 | | | | — | | | | — | | | | — | | | | — | | | | 21.34 | | | | 3.44 | |
2010 | | | 17.50 | | | | — | ** | | | 3.14 | | | | 3.14 | | | | (.01 | ) | | | — | | | | — | | | | (.01 | ) | | | 20.63 | | | | 17.96 | |
2009(g) | | | 16.43 | | | | .01 | | | | 1.06 | | | | 1.07 | | | | — | | | | — | | | | — | | | | — | | | | 17.50 | | | | 6.51 | |
Year Ended 7/31: | | | | | | | | | | | | | | | | | | | | | | | | | | | | | | | | | | | | | |
2009 | | | 20.57 | | | | .01 | | | | (4.15 | ) | | | (4.14 | ) | | | — | | | | — | | | | — | | | | — | | | | 16.43 | | | | (20.13 | ) |
2008 | | | 20.78 | | | | (.07 | ) | | | (.04 | ) | | | (.11 | ) | | | — | | | | (.04 | ) | | | (.06 | ) | | | (.10 | ) | | | 20.57 | | | | (.55 | ) |
Class C (12/06) | | | | | | | | | | | | | | | | | | | | | | | | | | | | | | | | | | | | | |
Year Ended 9/30: | | | | | | | | | | | | | | | | | | | | | | | | | | | | | | | | | | | | | |
2012 | | | 20.61 | | | | (.05 | ) | | | 5.97 | | | | 5.92 | | | | — | | | | (2.50 | ) | | | — | | | | (2.50 | ) | | | 24.03 | | | | 31.68 | |
2011 | | | 20.07 | | | | (.19 | ) | | | .73 | | | | .54 | | | | — | | | | — | | | | — | | | | — | | | | 20.61 | | | | 2.69 | |
2010 | | | 17.15 | | | | (.17 | ) | | | 3.09 | | | | 2.92 | | | | — | | | | — | | | | — | | | | — | | | | 20.07 | | | | 17.03 | |
2009(g) | | | 16.11 | | | | (.01 | ) | | | 1.05 | | | | 1.04 | | | | — | | | | — | | | | — | | | | — | | | | 17.15 | | | | 6.46 | |
Year Ended 7/31: | | | | | | | | | | | | | | | | | | | | | | | | | | | | | | | | | | | | | |
2009 | | | 20.32 | | | | (.11 | ) | | | (4.10 | ) | | | (4.21 | ) | | | — | | | | — | | | | — | | | | — | | | | 16.11 | | | | (20.72 | ) |
2008 | | | 20.68 | | | | (.22 | ) | | | (.04 | ) | | | (.26 | ) | | | — | | | | (.04 | ) | | | (.06 | ) | | | (.10 | ) | | | 20.32 | | | | (1.28 | ) |
Class R3 (9/09) | | | | | | | | | | | | | | | | | | | | | | | | | | | | | | | | | | | | | |
Year Ended 9/30: | | | | | | | | | | | | | | | | | | | | | | | | | | | | | | | | | | | | | |
2012 | | | 21.38 | | | | .09 | | | | 6.20 | | | | 6.29 | | | | — | | | | (2.50 | ) | | | — | | | | (2.50 | ) | | | 25.17 | | | | 32.32 | |
2011 | | | 20.72 | | | | (.07 | ) | | | .73 | | | | .66 | | | | — | | | | — | | | | — | | | | — | | | | 21.38 | | | | 3.19 | |
2010 | | | 17.61 | | | | (.08 | ) | | | 3.19 | | | | 3.11 | | | | — | | | | — | | | | — | | | | — | | | | 20.72 | | | | 17.66 | |
2009(f) | | | 17.69 | | | | — | ** | | | (.08 | ) | | | (.08 | ) | | | — | | | | — | | | | — | | | | — | | | | 17.61 | | | | (.45 | ) |
Class I (12/06) | | | | | | | | | | | | | | | | | | | | | | | | | | | | | | | | | | | | | |
Year Ended 9/30: | | | | | | | | | | | | | | | | | | | | | | | | | | | | | | | | | | | | | |
2012 | | | 21.53 | | | | .21 | | | | 6.26 | | | | 6.47 | | | | — | | | | (2.50 | ) | | | — | | | | (2.50 | ) | | | 25.50 | | | | 33.00 | |
2011 | | | 20.77 | | | | .04 | | | | .72 | | | | .76 | | | | — | | | | — | | | | — | | | | — | | | | 21.53 | | | | 3.66 | |
2010 | | | 17.62 | | | | .02 | | | | 3.18 | | | | 3.20 | | | | (.05 | ) | | | — | | | | — | | | | (.05 | ) | | | 20.77 | | | | 18.19 | |
2009(g) | | | 16.53 | | | | .01 | | | | 1.08 | | | | 1.09 | | | | — | | | | — | | | | — | | | | — | | | | 17.62 | | | | 6.59 | |
Year Ended 7/31: | | | | | | | | | | | | | | | | | | | | | | | | | | | | | | | | | | | | | |
2009 | | | 20.63 | | | | .05 | | | | (4.15 | ) | | | (4.10 | ) | | | — | | | | — | | | | — | | | | — | | | | 16.53 | | | | (19.91 | ) |
2008 | | | 20.81 | | | | (.04 | ) | | | (.02 | ) | | | (.06 | ) | | | (.02 | ) | | | (.04 | ) | | | (.06 | ) | | | (.12 | ) | | | 20.63 | | | | (.28 | ) |
| | | | | | | | | | | | | | | | | | | | | | |
| | | | | | | | | | | | | | | | | |
| | | | | |
| | | | | | | | | | | | | | | | | |
| Ratios/Supplemental Data | |
| | | |
Ratios to Average
Net Assets Before
Reimbursement(e) | | | Ratios to Average
Net Assets After
Reimbursement(d)(e) | | | | |
Ending
Net
Assets
(000) | | | Expenses | | | Net
Invest-
ment
Income
(Loss) | | | Expenses | | | Net
Invest-
ment
Income
(Loss) | | | Portfolio
Turnover
Rate | |
| | | | | | | | | | | | | | | | | | | | | | |
| | | | | | | | | | | | | | | | | | | | | | |
| $ | 36,680 | | | | 1.79 | % | | | (.06 | )% | | | 1.22 | % | | | .51 | % | | | 106 | % |
| | 2,107 | | | | 2.36 | | | | (1.15 | ) | | | 1.23 | | | | (.02 | ) | | | 151 | |
| | 1,063 | | | | 2.69 | | | | (1.40 | ) | | | 1.29 | | | | — | *** | | | 70 | |
| | 236 | | | | 3.41 | * | | | (1.82 | )* | | | 1.35 | * | | | .25 | * | | | 10 | |
| | | | | | | | | | | | | | | | | | | | | | |
| | 215 | | | | 1.94 | | | | (.52 | ) | | | 1.35 | | | | .06 | | | | 109 | |
| | 257 | | | | 3.14 | | | | (2.16 | ) | | | 1.33 | | | | (.35 | ) | | | 110 | |
| | | | | | | | | | | | | | | | | | | | | | |
| | | | | | | | | | | | | | | | | | | | | | |
| | 11,841 | | | | 2.57 | | | | (.82 | ) | | | 1.97 | | | | (.22 | ) | | | 106 | |
| | 1,326 | | | | 3.18 | | | | (2.01 | ) | | | 1.98 | | | | (.80 | ) | | | 151 | |
| | 367 | | | | 3.43 | | | | (2.26 | ) | | | 2.06 | | | | (.89 | ) | | | 70 | |
| | 661 | | | | 4.13 | * | | | (2.53 | )* | | | 2.09 | * | | | (.50 | )* | | | 10 | |
| | | | | | | | | | | | | | | | | | | | | | |
| | 621 | | | | 2.84 | | | | (1.49 | ) | | | 2.10 | | | | (.75 | ) | | | 109 | |
| | 254 | | | | 3.89 | | | | (2.91 | ) | | | 2.09 | | | | (1.11 | ) | | | 110 | |
| | | | | | | | | | | | | | | | | | | | | | |
| | | | | | | | | | | | | | | | | | | | | | |
| | 2,372 | | | | 1.99 | | | | (.14 | ) | | | 1.47 | | | | .38 | | | | 106 | |
| | 60 | | | | 2.67 | | | | (1.50 | ) | | | 1.48 | | | | (.31 | ) | | | 151 | |
| | 59 | | | | 3.05 | | | | (1.90 | ) | | | 1.56 | | | | (.41 | ) | | | 70 | |
| | 50 | | | | 2.11 | * | | | (2.11 | )* | | | 1.59 | * | | | (1.59 | )* | | | 10 | |
| | | | | | | | | | | | | | | | | | | | | | |
| | | | | | | | | | | | | | | | | | | | | | |
| | 14,004 | | | | 1.61 | | | | .25 | | | | .97 | | | | .89 | | | | 106 | |
| | 2,460 | | | | 2.26 | | | | (1.11 | ) | | | .98 | | | | .16 | | | | 151 | |
| | 7,080 | | | | 2.57 | | | | (1.42 | ) | | | 1.06 | | | | .09 | | | | 70 | |
| | 5,831 | | | | 3.12 | * | | | (1.51 | )* | | | 1.09 | * | | | .51 | * | | | 10 | |
| | | | | | | | | | | | | | | | | | | | | | |
| | 5,709 | | | | 1.68 | | | | (.27 | ) | | | 1.10 | | | | .31 | | | | 109 | |
| | 3,011 | | | | 2.40 | | | | (1.56 | ) | | | 1.09 | | | | (.25 | ) | | | 110 | |
| (a) | Per share Net Investment Income (Loss) is calculated using the average daily shares method. |
| (b) | Distributions from Capital Gains include short-term capital gains, if any. |
| (c) | Total return is the combination of changes in net asset value without any sales charge, reinvested dividend income at net asset value and reinvested capital gains distributions at net asset value, if any. Total returns are not annualized. |
| (d) | After expense reimbursement from the Adviser, where applicable. |
| (e) | Ratios do not reflect the effect of custodian fee credits earned on the Fund’s net cash on deposit with the custodian bank, where applicable. |
| (f) | For the period September 29, 2009 (commencement of operations) through September 30, 2009. |
| (g) | For the two months ended September 30, 2009. |
| ** | Rounds to less than $.01 per share. |
| *** | Rounds to less than .01%. |
See accompanying notes to financial statements.
Financial Highlights (continued)
| | | | | | | | | | | | | | | | | | | | | | | | | | | | | | | | | | | | |
| Selected data for a share outstanding throughout each period: | | | | |
| | | | | | | |
| Class (Commencement Date) | | | | | | | | | | | | | | | | | | | | | | |
| | | | | | Investment Operations | | | Less Distributions | | | | | | | |
| | | | | | | |
| SYMPHONY MID-CAP CORE | | | | | | | | | | | | | | | | | | | | | | |
| | | Beginning
Net
Asset
Value | | | Net
Invest-
ment
Income
Loss(a) | | | Net
Realized/
Unrealized
Gain
(Loss) | | | Total | | | Net
Invest-
ment
Income | | | Capital
Gains(b) | | | Total | | | Ending
Net
Asset
Value | | | Total
Return(c) | |
Class A (5/06) | | | | | | | | | | | | | | | | | | | | | | | | | | | | | | | | | |
Year Ended 9/30: | | | | | | | | | | | | | | | | | | | | | | | | | | | | | | | | | |
2012 | | $ | 19.95 | | | $ | .09 | | | $ | 5.02 | | | $ | 5.11 | | | $ | — | | | $ | — | | | $ | — | | | $ | 25.06 | | | | 25.66 | % |
2011 | | | 20.54 | | | | .01 | | | | (.60 | ) | | | (.59 | ) | | | — | | | | — | | | | — | | | | 19.95 | | | | (2.87 | ) |
2010 | | | 17.29 | | | | — | ** | | | 3.28 | | | | 3.28 | | | | (.03 | ) | | | — | | | | (.03 | ) | | | 20.54 | | | | 18.96 | |
2009(g) | | | 15.87 | | | | .01 | | | | 1.41 | | | | 1.42 | | | | — | | | | — | | | | — | | | | 17.29 | | | | 8.95 | |
Year Ended 7/31: | | | | | | | | | | | | | | | | | | | | | | | | | | | | | | | | | |
2009 | | | 20.84 | | | | .02 | | | | (4.99 | ) | | | (4.97 | ) | | | — | | | | — | | | | — | | | | 15.87 | | | | (23.85 | ) |
2008 | | | 22.44 | | | | (.08 | ) | | | (.11 | ) | | | (.19 | ) | | | — | | | | (1.41 | ) | | | (1.41 | ) | | | 20.84 | | | | (.95 | ) |
Class C (5/06) | | | | | | | | | | | | | | | | | | | | | | | | | | | | | | | | | |
Year Ended 9/30: | | | | | | | | | | | | | | | | | | | | | | | | | | | | | | | | | |
2012 | | | 19.18 | | | | (.12 | ) | | | 4.86 | | | | 4.74 | | | | — | | | | — | | | | — | | | | 23.92 | | | | 24.77 | |
2011 | | | 19.90 | | | | (.17 | ) | | | (.55 | ) | | | (.72 | ) | | | — | | | | — | | | | — | | | | 19.18 | | | | (3.62 | ) |
2010 | | | 16.85 | | | | (.13 | ) | | | 3.18 | | | | 3.05 | | | | — | | | | — | | | | — | | | | 19.90 | | | | 18.10 | |
2009(g) | | | 15.49 | | | | (.01 | ) | | | 1.37 | | | | 1.36 | | | | — | | | | — | | | | — | | | | 16.85 | | | | 8.78 | |
Year Ended 7/31: | | | | | | | | | | | | | | | | | | | | | | | | | | | | | | | | | |
2009 | | | 20.50 | | | | (.09 | ) | | | (4.92 | ) | | | (5.01 | ) | | | — | | | | — | | | | — | | | | 15.49 | | | | (24.44 | ) |
2008 | | | 22.25 | | | | (.24 | ) | | | (.10 | ) | | | (.34 | ) | | | — | | | | (1.41 | ) | | | (1.41 | ) | | | 20.50 | | | | (1.66 | ) |
Class R3 (5/09) | | | | | | | | | | | | | | | | | | | | | | | | | | | | | | | | | |
Year Ended 9/30: | | | | | | | | | | | | | | | | | | | | | | | | | | | | | | | | | |
2012 | | | 19.98 | | | | .02 | | | | 5.04 | | | | 5.06 | | | | — | | | | — | | | | — | | | | 25.04 | | | | 25.38 | |
2011 | | | 20.62 | | | | (.07 | ) | | | (.57 | ) | | | (.64 | ) | | | — | | | | — | | | | — | | | | 19.98 | | | | (3.10 | ) |
2010 | | | 17.37 | | | | (.05 | ) | | | 3.30 | | | | 3.25 | | | | — | | | | — | | | | — | | | | 20.62 | | | | 18.71 | |
2009(g) | | | 15.95 | | | | .01 | | | | 1.41 | | | | 1.42 | | | | — | | | | — | | | | — | | | | 17.37 | | | | 8.83 | |
Year Ended 7/31: | | | | | | | | | | | | | | | | | | | | | | | | | | | | | | | | | |
2009(f) | | | 14.73 | | | | (.02 | ) | | | 1.24 | | | | 1.22 | | | | — | | | | — | | | | — | | | | 15.95 | | | | 8.35 | |
Class I (5/06) | | | | | | | | | | | | | | | | | | | | | | | | | | | | | | | | | |
Year Ended 9/30: | | | | | | | | | | | | | | | | | | | | | | | | | | | | | | | | | |
2012 | | | 20.15 | | | | .23 | | | | 5.01 | | | | 5.24 | | | | — | | | | — | | | | — | | | | 25.39 | | | | 26.00 | |
2011 | | | 20.70 | | | | .06 | | | | (.61 | ) | | | (.55 | ) | | | — | | | | — | | | | — | | | | 20.15 | | | | (2.66 | ) |
2010 | | | 17.41 | | | | .05 | | | | 3.30 | | | | 3.35 | | | | (.06 | ) | | | — | | | | (.06 | ) | | | 20.70 | | | | 19.30 | |
2009(g) | | | 15.98 | | | | .02 | | | | 1.41 | | | | 1.43 | | | | — | | | | — | | | | — | | | | 17.41 | | | | 8.95 | |
Year Ended 7/31: | | | | | | | | | | | | | | | | | | | | | | | | | | | | | | | | | |
2009 | | | 20.93 | | | | .06 | | | | (5.01 | ) | | | (4.95 | ) | | | — | | | | — | | | | — | | | | 15.98 | | | | (23.65 | ) |
2008 | | | 22.47 | | | | (.02 | ) | | | (.11 | ) | | | (.13 | ) | | | — | | | | (1.41 | ) | | | (1.41 | ) | | | 20.93 | | | | (.68 | ) |
| | | | | | | | | | | | | | | | | | | | | | |
| | | | | | | | | | | | | | | | | |
| | | | | |
| | | | | | | | | | | | | | | | | |
| Ratios/Supplemental Data | |
| | | |
Ratios to Average
Net Assets Before
Reimbursement(e) | | | Ratios to Average
Net Assets After
Reimbursement(d)(e) | | | | |
Ending
Net
Assets
(000) | | | Expenses | | | Net
Invest-
ment
Income
(Loss) | | | Expenses | | | Net
Invest-
ment
Income
(Loss) | | | Portfolio
Turnover
Rate | |
| | | | | | | | | | | | | | | | | | | | | | |
| | | | | | | | | | | | | | | | | | | | | | |
| $ | 2,026 | | | | 4.06 | % | | | (2.33 | )% | | | 1.37 | % | | | .36 | % | | | 138 | % |
| | 1,591 | | | | 4.57 | | | | (3.17 | ) | | | 1.38 | | | | .02 | | | | 93 | |
| | 339 | | | | 13.18 | | | | (11.79 | ) | | | 1.39 | | | | .01 | | | | 82 | |
| | 233 | | | | 12.75 | * | | | (10.81 | )* | | | 1.40 | * | | | .54 | * | | | 17 | |
| | | | | | | | | | | | | | | | | | | | | | |
| | 214 | | | | 9.20 | | | | (7.72 | ) | | | 1.40 | | | | .08 | | | | 118 | |
| | 261 | | | | 3.08 | | | | (2.14 | ) | | | 1.38 | | | | (.44 | ) | | | 99 | |
| | | | | | | | | | | | | | | | | | | | | | |
| | | | | | | | | | | | | | | | | | | | | | |
| | 548 | | | | 4.92 | | | | (3.34 | ) | | | 2.12 | | | | (.54 | ) | | | 138 | |
| | 674 | | | | 5.46 | | | | (4.08 | ) | | | 2.13 | | | | (.75 | ) | | | 93 | |
| | 314 | | | | 13.95 | | | | (12.55 | ) | | | 2.14 | | | | (.74 | ) | | | 82 | |
| | 211 | | | | 13.49 | * | | | (11.56 | )* | | | 2.14 | * | | | (.21 | )* | | | 17 | |
| | | | | | | | | | | | | | | | | | | | | | |
| | 194 | | | | 9.73 | | | | (8.24 | ) | | | 2.15 | | | | (.66 | ) | | | 118 | |
| | 256 | | | | 3.83 | | | | (2.89 | ) | | | 2.14 | | | | (1.20 | ) | | | 99 | |
| | | | | | | | | | | | | | | | | | | | | | |
| | | | | | | | | | | | | | | | | | | | | | |
| | 272 | | | | 4.33 | | | | (2.60 | ) | | | 1.62 | | | | .10 | | | | 138 | |
| | 207 | | | | 5.38 | | | | (4.04 | ) | | | 1.63 | | | | (.28 | ) | | | 93 | |
| | 210 | | | | 13.64 | | | | (12.26 | ) | | | 1.64 | | | | (.25 | ) | | | 82 | |
| | 177 | | | | 13.00 | * | | | (11.06 | )* | | | 1.64 | * | | | .29 | * | | | 17 | |
| | | | | | | | | | | | | | | | | | | | | | |
| | 162 | | | | 23.32 | * | | | (22.36 | )* | | | 1.65 | * | | | (.69 | )* | | | 118 | |
| | | | | | | | | | | | | | | | | | | | | | |
| | | | | | | | | | | | | | | | | | | | | | |
| | 1,334 | | | | 3.37 | | | | (1.28 | ) | | | 1.12 | | | | .97 | | | | 138 | |
| | 358 | | | | 4.86 | | | | (3.49 | ) | | | 1.13 | | | | .23 | | | | 93 | |
| | 302 | | | | 13.20 | | | | (11.82 | ) | | | 1.14 | | | | .25 | | | | 82 | |
| | 262 | | | | 12.56 | * | | | (10.63 | )* | | | 1.14 | * | | | .79 | * | | | 17 | |
| | | | | | | | | | | | | | | | | | | | | | |
| | 233 | | | | 7.20 | | | | (5.66 | ) | | | 1.15 | | | | .40 | | | | 118 | |
| | 518 | | | | 2.83 | | | | (1.89 | ) | | | 1.14 | | | | (.19 | ) | | | 99 | |
| (a) | Per share Net Investment Income (Loss) is calculated using the average daily shares method. |
| (b) | Distributions from Capital Gains include short-term capital gains, if any. |
| (c) | Total return is the combination of changes in net asset value without any sales charge, reinvested dividend income at net asset value and reinvested capital gains distributions at net asset value, if any. Total returns are not annualized. |
| (d) | After expense reimbursement from the Adviser, where applicable. |
| (e) | Ratios do not reflect the effect of custodian fee credits earned on the Fund’s net cash on deposit with the custodian bank, where applicable. |
| (f) | For the period May 5, 2009 (commencement of operations) through July 31, 2009. |
| (g) | For the two months ended September 30, 2009. |
| ** | Rounds to less than $.01 per share. |
See accompanying notes to financial statements.
Financial Highlights (continued)
| | | | | | | | | | | | | | | | | | | | | | | | | | | | | | | | | | | | |
| Selected data for a share outstanding throughout each period: | | | | |
| | | | | | | |
| Class (Commencement Date) | | | | | | | | | | | | | | | | | | | | | | |
| | | | | | Investment Operations | | | Less Distributions | | | | | | | |
| | | | | | | | |
SYMPHONY
INTERNATIONAL EQUITY | | | | | | | | | | | | | | | | | | | | | | | | | |
| | | Beginning
Net
Asset
Value | | | Net
Invest-
ment
Income
(Loss)(a) | | | Net
Realized/
Unrealized
Gain
(Loss) | | | Total | | | Net
Invest-
ment
Income | | | Capital
Gains(b) | | | Total | | | Ending
Net
Asset
Value | | | Total
Return(c) | |
Class A (5/08) | | | | | | | | | | | | | | | | | | | | | | | | | | | | | | | | | |
Year Ended 9/30: | | | | | | | | | | | | | | | | | | | | | | | | | | | | | | | | | |
2012 | | $ | 12.97 | | | $ | .23 | | | $ | 1.98 | | | $ | 2.21 | | | $ | (.21 | ) | | $ | — | | | $ | (.21 | ) | | $ | 14.97 | | | | 17.07 | % |
2011 | | | 14.44 | | | | .22 | | | | (1.45 | ) | | | (1.23 | ) | | | (.24 | ) | | | — | | | | (.24 | ) | | | 12.97 | | | | (8.70 | ) |
2010 | | | 13.98 | | | | .19 | | | | .53 | | | | .72 | | | | (.26 | ) | | | — | | | | (.26 | ) | | | 14.44 | | | | 5.20 | |
2009(g) | | | 12.81 | | | | .01 | | | | 1.16 | | | | 1.17 | | | | — | | | | — | | | | — | | | | 13.98 | | | | 9.13 | |
Year Ended 7/31: | | | | | | | | | | | | | | | | | | | | | | | | | | | | | | | | | |
2009 | | | 17.52 | | | | .24 | | | | (4.93 | ) | | | (4.69 | ) | | | (.02 | ) | | | — | | | | (.02 | ) | | | 12.81 | | | | (26.76 | ) |
2008(f) | | | 20.00 | | | | — | ** | | | (2.48 | ) | | | (2.48 | ) | | | — | | | | — | | | | — | | | | 17.52 | | | | (12.40 | ) |
Class C (5/08) | | | | | | | | | | | | | | | | | | | | | | | | | | | | | | | | | |
Year Ended 9/30: | | | | | | | | | | | | | | | | | | | | | | | | | | | | | | | | | |
2012 | | | 12.84 | | | | .10 | | | | 1.98 | | | | 2.08 | | | | (.09 | ) | | | — | | | | (.09 | ) | | | 14.83 | | | | 16.18 | |
2011 | | | 14.31 | | | | .11 | | | | (1.45 | ) | | | (1.34 | ) | | | (.13 | ) | | | — | | | | (.13 | ) | | | 12.84 | | | | (9.41 | ) |
2010 | | | 13.87 | | | | .10 | | | | .51 | | | | .61 | | | | (.17 | ) | | | — | | | | (.17 | ) | | | 14.31 | | | | 4.43 | |
2009(g) | | | 12.73 | | | | (.01 | ) | | | 1.15 | | | | 1.14 | | | | — | | | | — | | | | — | | | | 13.87 | | | | 8.96 | |
Year Ended 7/31: | | | | | | | | | | | | | | | | | | | | | | | | | | | | | | | | | |
2009 | | | 17.49 | | | | .15 | | | | (4.91 | ) | | | (4.76 | ) | | | — | | | | — | | | | — | | | | 12.73 | | | | (27.22 | ) |
2008(f) | | | 20.00 | | | | (.03 | ) | | | (2.48 | ) | | | (2.51 | ) | | | — | | | | — | | | | — | | | | 17.49 | | | | (12.55 | ) |
Class R3 (10/10) | | | | | | | | | | | | | | | | | | | | | | | | | | | | | | | | | |
Year Ended 9/30: | | | | | | | | | | | | | | | | | | | | | | | | | | | | | | | | | |
2012 | | | 12.98 | | | | .21 | | | | 1.97 | | | | 2.18 | | | | (.17 | ) | | | — | | | | (.17 | ) | | | 14.99 | | | | 16.81 | |
2011(h) | | | 14.50 | | | | .18 | | | | (1.50 | ) | | | (1.32 | ) | | | (.20 | ) | | | — | | | | (.20 | ) | | | 12.98 | | | | (9.22 | ) |
Class I (5/08) | | | | | | | | | | | | | | | | | | | | | | | | | | | | | | | | | |
Year Ended 9/30: | | | | | | | | | | | | | | | | | | | | | | | | | | | | | | | | | |
2012 | | | 12.98 | | | | .30 | | | | 1.94 | | | | 2.24 | | | | (.24 | ) | | | — | | | | (.24 | ) | | | 14.98 | | | | 17.38 | |
2011 | | | 14.45 | | | | .26 | | | | (1.46 | ) | | | (1.20 | ) | | | (.27 | ) | | | — | | | | (.27 | ) | | | 12.98 | | | | (8.49 | ) |
2010 | | | 13.98 | | | | .25 | | | | .51 | | | | .76 | | | | (.29 | ) | | | — | | | | (.29 | ) | | | 14.45 | | | | 5.50 | |
2009(g) | | | 12.81 | | | | .02 | | | | 1.15 | | | | 1.17 | | | | — | | | | — | | | | — | | | | 13.98 | | | | 9.13 | |
Year Ended 7/31: | | | | | | | | | | | | | | | | | | | | | | | | | | | | | | | | | |
2009 | | | 17.52 | | | | .28 | | | | (4.93 | ) | | | (4.65 | ) | | | (.06 | ) | | | — | | | | (.06 | ) | | | 12.81 | | | | (26.52 | ) |
2008(f) | | | 20.00 | | | | .01 | | | | (2.49 | ) | | | (2.48 | ) | | | — | | | | — | | | | — | | | | 17.52 | | | | (12.40 | ) |
| | | | | | | | | | | | | | | | | | | | | | |
| | | | | | | | | | | | | | | | | |
| | | | | |
| | | | | | | | | | | | | | | | | |
| Ratios/Supplemental Data | |
| | | |
Ratios to Average
Net Assets Before
Reimbursement(e) | | | Ratios to Average
Net Assets After
Reimbursement(d)(e) | | | | |
Ending
Net
Assets
(000) | | | Expenses | | | Net
Invest-
ment
Income
(Loss) | | | Expenses | | | Net
Invest-
ment
Income
(Loss) | | | Portfolio
Turnover
Rate | |
| | | | | | | | | | | | | | | | | | | | | | |
| | | | | | | | | | | | | | | | | | | | | | |
| $ | 110 | | | | 9.39 | % | | | (6.43 | )% | | | 1.35 | % | | | 1.60 | % | | | 22 | % |
| | 270 | | | | 10.20 | | | | (7.43 | ) | | | 1.36 | | | | 1.41 | | | | 34 | |
| | 231 | | | | 12.44 | | | | (9.70 | ) | | | 1.37 | | | | 1.38 | | | | 100 | |
| | 175 | | | | 11.44 | * | | | (9.62 | )* | | | 1.37 | * | | | .45 | * | | | 2 | |
| | | | | | | | | | | | | | | | | | | | | | |
| | 160 | | | | 8.42 | | | | (4.87 | ) | | | 1.38 | | | | 2.17 | | | | 117 | |
| | 219 | | | | 11.09 | * | | | (9.84 | )* | | | 1.37 | * | | | (.11 | )* | | | 6 | |
| | | | | | | | | | | | | | | | | | | | | | |
| | | | | | | | | | | | | | | | | | | | | | |
| | 137 | | | | 9.68 | | | | (6.85 | ) | | | 2.10 | | | | .73 | | | | 22 | |
| | 314 | | | | 10.94 | | | | (8.08 | ) | | | 2.11 | | | | .75 | | | | 34 | |
| | 179 | | | | 13.21 | | | | (10.36 | ) | | | 2.12 | | | | .73 | | | | 100 | |
| | 173 | | | | 12.20 | * | | | (10.37 | )* | | | 2.13 | * | | | (.30 | )* | | | 2 | |
| | | | | | | | | | | | | | | | | | | | | | |
| | 159 | | | | 13.74 | | | | (10.36 | ) | | | 2.13 | | | | 1.25 | | | | 117 | |
| | 219 | | | | 11.84 | * | | | (10.59 | )* | | | 2.13 | * | | | (.87 | )* | | | 6 | |
| | | | | | | | | | | | | | | | | | | | | | |
| | | | | | | | | | | | | | | | | | | | | | |
| | 52 | | | | 8.17 | | | | (5.10 | ) | | | 1.60 | | | | 1.47 | | | | 22 | |
| | 45 | | | | 10.54 | * | | | (7.76 | )* | | | 1.61 | * | | | 1.17 | * | | | 34 | |
| | | | | | | | | | | | | | | | | | | | | | |
| | | | | | | | | | | | | | | | | | | | | | |
| | 793 | | | | 6.35 | | | | (3.17 | ) | | | 1.10 | | | | 2.07 | | | | 22 | |
| | 335 | | | | 10.00 | | | | (7.23 | ) | | | 1.11 | | | | 1.66 | | | | 34 | |
| | 405 | | | | 12.10 | | | | (9.16 | ) | | | 1.12 | | | | 1.82 | | | | 100 | |
| | 520 | | | | 11.19 | * | | | (9.36 | )* | | | 1.12 | * | | | .70 | * | | | 2 | |
| | | | | | | | | | | | | | | | | | | | | | |
| | 476 | | | | 13.45 | | | | (9.93 | ) | | | 1.13 | | | | 2.39 | | | | 117 | |
| | 438 | | | | 10.84 | * | | | (9.59 | )* | | | 1.11 | * | | | .14 | * | | | 6 | |
| (a) | Per share Net Investment Income (Loss) is calculated using the average daily shares method. |
| (b) | Distributions from Capital Gains include short-term capital gains, if any. |
| (c) | Total return is the combination of changes in net asset value without any sales charge, reinvested dividend income at net asset value and reinvested capital gains distributions at net asset value, if any. Total returns are not annualized. |
| (d) | After expense reimbursement from the Adviser, where applicable. |
| (e) | Ratios do not reflect the effect of custodian fee credits earned on the Fund’s net cash on deposit with the custodian bank, where applicable. |
| (f) | For the period May 30, 2008 (commencement of operations) through July 31, 2008. |
| (g) | For the two months ended September 30, 2009. |
| (h) | For the period October 5, 2010 (commencement of operations) through September 30, 2011. |
| ** | Rounds to less than $.01 per share. |
See accompanying notes to financial statements.
Financial Highlights (continued)
| | | | | | | | | | | | | | | | | | | | | | | | | | | | | | | | | | | | |
| Selected data for a share outstanding throughout each period: | | | | |
| | | | | | | |
| Class (Commencement Date) | | | | | | | | | | | | | | | | | | | | | | |
| | | | | | Investment Operations | | | Less Distributions | | | | | | | |
| | | | | | | |
| SYMPHONY OPTIMIZED ALPHA | | | | | | | | | | | | | | | | | | | | | | |
| | | Beginning
Net
Asset
Value | | | Net
Invest-
ment
Income
(Loss)(a) | | | Net
Realized/
Unrealized
Gain
(Loss) | | | Total | | | Net
Invest-
ment
Income | | | Capital
Gains(b) | | | Total | | | Ending
Net
Asset
Value | | | Total
Return(c) | |
Class A (9/07) | | | | | | | | | | | | | | | | | | | | | | | | | | | | | | | | | |
Year Ended 9/30: | | | | | | | | | | | | | | | | | | | | | | | | | | | | | | | | | |
2012 | | $ | 17.94 | | | $ | .29 | | | $ | 4.38 | | | $ | 4.67 | | | $ | (.18 | ) | | $ | — | | | $ | (.18 | ) | | $ | 22.43 | | | | 26.17 | % |
2011 | | | 17.40 | | | | .20 | | | | .45 | | | | .65 | | | | (.11 | ) | | | — | | | | (.11 | ) | | | 17.94 | | | | 3.69 | |
2010 | | | 15.33 | | | | .05 | | | | 2.05 | | | | 2.10 | | | | (.03 | ) | | | — | | | | (.03 | ) | | | 17.40 | | | | 13.69 | |
2009(g) | | | 14.61 | | | | .01 | | | | .71 | | | | .72 | | | | — | | | | — | | | | — | | | | 15.33 | | | | 4.93 | |
Year Ended 7/31: | | | | | | | | | | | | | | | | | | | | | | | | | | | | | | | | | |
2009 | | | 18.27 | | | | .09 | | | | (3.70 | ) | | | (3.61 | ) | | | (.04 | ) | | | (.01 | ) | | | (.05 | ) | | | 14.61 | | | | (19.73 | ) |
2008(f) | | | 20.00 | | | | .01 | | | | (1.74 | ) | | | (1.73 | ) | | | — | | | | — | | | | — | | | | 18.27 | | | | (8.65 | ) |
Class C (9/07) | | | | | | | | | | | | | | | | | | | | | | | | | | | | | | | | | |
Year Ended 9/30: | | | | | | | | | | | | | | | | | | | | | | | | | | | | | | | | | |
2012 | | | 17.58 | | | | .13 | | | | 4.30 | | | | 4.43 | | | | (.03 | ) | | | — | | | | (.03 | ) | | | 21.98 | | | | 25.24 | |
2011 | | | 17.08 | | | | .05 | | | | .45 | | | | .50 | | | | — | | | | — | | | | — | | | | 17.58 | | | | 2.93 | |
2010 | | | 15.14 | | | | (.08 | ) | | | 2.02 | | | | 1.94 | | | | — | | | | — | | | | — | | | | 17.08 | | | | 12.81 | |
2009(g) | | | 14.45 | | | | (.01 | ) | | | .70 | | | | .69 | | | | — | | | | — | | | | — | | | | 15.14 | | | | 4.78 | |
Year Ended 7/31: | | | | | | | | | | | | | | | | | | | | | | | | | | | | | | | | | |
2009 | | | 18.16 | | | | (.01 | ) | | | (3.69 | ) | | | (3.70 | ) | | | — | | | | (.01 | ) | | | (.01 | ) | | | 14.45 | | | | (20.35 | ) |
2008(f) | | | 20.00 | | | | (.11 | ) | | | (1.73 | ) | | | (1.84 | ) | | | — | | | | — | | | | — | | | | 18.16 | | | | (9.20 | ) |
Class I (9/07) | | | | | | | | | | | | | | | | | | | | | | | | | | | | | | | | | |
Year Ended 9/30: | | | | | | | | | | | | | | | | | | | | | | | | | | | | | | | | | |
2012 | | | 17.97 | | | | .36 | | | | 4.38 | | | | 4.74 | | | | (.23 | ) | | | — | | | | (.23 | ) | | | 22.48 | | | | 26.56 | |
2011 | | | 17.43 | | | | .23 | | | | .46 | | | | .69 | | | | (.15 | ) | | | — | | | | (.15 | ) | | | 17.97 | | | | 3.91 | |
2010 | | | 15.35 | | | | .09 | | | | 2.05 | | | | 2.14 | | | | (.06 | ) | | | — | | | | (.06 | ) | | | 17.43 | | | | 13.97 | |
2009(g) | | | 14.63 | | | | .02 | | | | .70 | | | | .72 | | | | — | | | | — | | | | — | | | | 15.35 | | | | 4.92 | |
Year Ended 7/31: | | | | | | | | | | | | | | | | | | | | | | | | | | | | | | | | | |
2009 | | | 18.30 | | | | .12 | | | | (3.70 | ) | | | (3.58 | ) | | | (.08 | ) | | | (.01 | ) | | | (.09 | ) | | | 14.63 | | | | (19.49 | ) |
2008(f) | | | 20.00 | | | | .05 | | | | (1.75 | ) | | | (1.70 | ) | | | — | | | | — | | | | — | | | | 18.30 | | | | (8.50 | ) |
| | | | | | | | | | | | | | | | | | | | | | |
| | | | | | | | | | | | | | | | | | | | | | |
| | | | | |
| | | | | | | | | | | | | | | | | |
| Ratios/Supplemental Data | |
| | | |
Ratios to Average
Net Assets Before
Reimbursement(e) | | | Ratios to Average
Net Assets After
Reimbursement(d)(e) | | | | |
Ending
Net
Assets
(000) | | | Expenses | | | Net
Invest-
ment
Income
(Loss) | | | Expenses | | | Net
Invest-
ment
Income
(Loss) | | | Portfolio
Turnover
Rate | |
| | | | | | | | | | | | | | | | | | | | | | |
| | | | | | | | | | | | | | | | | | | | | | |
| $ | 877 | | | | 4.02 | % | | | (1.38 | )% | | | 1.23 | % | | | 1.42 | % | | | 85 | % |
| | 702 | | | | 5.79 | | | | (3.55 | ) | | | 1.23 | | | | 1.02 | | | | 80 | |
| | 376 | | | | 5.10 | | | | (3.42 | ) | | | 1.39 | | | | .30 | | | | 59 | |
| | 310 | | | | 6.48 | * | | | (4.65 | )* | | | 1.44 | * | | | .39 | * | | | 7 | |
| | | | | | | | | | | | | | | | | | | | | | |
| | 277 | | | | 7.32 | | | | (5.22 | ) | | | 1.45 | | | | .65 | | | | 89 | |
| | 278 | | | | 4.47 | * | | | (3.02 | )* | | | 1.43 | * | | | .02 | * | | | 88 | |
| | | | | | | | | | | | | | | | | | | | | | |
| | | | | | | | | | | | | | | | | | | | | | |
| | 170 | | | | 5.56 | | | | (2.94 | ) | | | 1.98 | | | | .64 | | | | 85 | |
| | 363 | | | | 6.72 | | | | (4.50 | ) | | | 1.98 | | | | .25 | | | | 80 | |
| | 221 | | | | 5.80 | | | | (4.16 | ) | | | 2.14 | | | | (.51 | ) | | | 59 | |
| | 296 | | | | 7.18 | * | | | (5.38 | )* | | | 2.20 | * | | | (.39 | )* | | | 7 | |
| | | | | | | | | | | | | | | | | | | | | | |
| | 282 | | | | 8.30 | | | | (6.19 | ) | | | 2.20 | | | | (.08 | ) | | | 89 | |
| | 227 | | | | 5.17 | * | | | (3.72 | )* | | | 2.19 | * | | | (.74 | )* | | | 88 | |
| | | | | | | | | | | | | | | | | | | | | | |
| | | | | | | | | | | | | | | | | | | | | | |
| | 1,852 | | | | 3.29 | | | | (.60 | ) | | | .98 | | | | 1.71 | | | | 85 | |
| | 1,099 | | | | 5.56 | | | | (3.39 | ) | | | .98 | | | | 1.19 | | | | 80 | |
| | 1,835 | | | | 4.77 | | | | (3.11 | ) | | | 1.14 | | | | .51 | | | | 59 | |
| | 2,177 | | | | 6.18 | * | | | (4.38 | )* | | | 1.19 | * | | | .61 | * | | | 7 | |
| | | | | | | | | | | | | | | | | | | | | | |
| | 2,077 | | | | 7.14 | | | | (5.10 | ) | | | 1.20 | | | | .84 | | | | 89 | |
| | 1,763 | | | | 4.52 | * | | | (3.03 | )* | | | 1.19 | * | | | .30 | * | | | 88 | |
| (a) | Per share Net Investment Income (Loss) is calculated using the average daily shares method. |
| (b) | Distributions from Capital Gains include short-term capital gains, if any. |
| (c) | Total return is the combination of changes in net asset value without any sales charge, reinvested dividend income at net asset value and reinvested capital gains distributions at net asset value, if any. Total returns are not annualized. |
| (d) | After expense reimbursement from the Adviser, where applicable. |
| (e) | Ratios do not reflect the effect of custodian fee credits earned on the Fund’s net cash on deposit with the custodian bank, where applicable. |
| (f) | For the period September 28, 2007 (commencement of operations) through July 31, 2008. |
| (g) | For the two months ended September 30, 2009. |
See accompanying notes to financial statements.
Notes to Financial Statements
1. General Information and Significant Accounting Policies
General Information
The Nuveen Investment Trust II (the “Trust”) is an open-end management investment company registered under the Investment Company Act of 1940, as amended. The Trust is comprised of Nuveen Symphony Large-Cap Growth Fund (“Symphony Large-Cap Growth”), Nuveen Symphony Mid-Cap Core Fund (“Symphony Mid-Cap Core”), Nuveen Symphony International Equity Fund (“Symphony International Equity”) and Nuveen Symphony Optimized Alpha Fund (“Symphony Optimized Alpha”) (each a “Fund” and collectively, the “Funds”), among others. The Trust was organized as a Massachusetts business trust in 1997.
Symphony Large-Cap Growth’s investment objective is to seek long-term capital appreciation. Under normal market conditions, the Fund invests at least 80% of its net assets (plus the amount of any borrowings for investment purposes) in equity securities of companies with market capitalizations at the time of investment comparable to companies in the Russell 1000® Growth Index.
Symphony Mid-Cap Core’s investment objective is to seek long-term capital appreciation. Under normal market conditions, the Fund invests at least 80% of its net assets (plus the amount of any borrowings for investment purposes) in equity securities of companies with market capitalizations at the time of investment comparable to companies in the Russell Midcap® Index.
Symphony International Equity’s investment objective is to seek long-term capital appreciation. Under normal market conditions, the Fund invests primarily in non-U.S. equity securities. The Fund primarily invests in developed countries, but it may invest up to 15% of its net assets in equity securities of companies located in emerging market countries.
Symphony Optimized Alpha’s investment objective is to seek long-term capital appreciation with lower absolute volatility than the broad equity market. Under normal market conditions, the Fund invests at least 80% of its net assets in equity securities of companies with varying market capitalizations. After the close of business on May 30, 2012, the Fund liquidated all shareholder accounts invested in Class R3 Shares and distributed the proceeds of the liquidation.
The Funds’ most recent prospectus provides further description of each Fund’s investment objective, principal investment strategies, and principal risks.
Significant Accounting Policies
The following is a summary of significant accounting policies followed by the Funds in the preparation of their financial statements in accordance with accounting principles generally accepted in the United States (“U.S. GAAP”).
Investment Valuation
Common stocks and other equity-type securities are valued at the last sales price on the securities exchange on which such securities are primarily traded and are generally classified as Level 1 for fair value measurement purposes. Securities primarily traded on the NASDAQ National Market (“NASDAQ”) are valued, except as indicated below, at the NASDAQ Official Closing Price and are generally classified as Level 1. However, securities traded on a securities exchange or NASDAQ for which there were no transactions on a given day or securities not listed on a securities exchange or NASDAQ are valued at the quoted bid price and are generally classified as Level 2. Prices of certain American Depositary Receipts (“ADR”) held by the Fund that trade in the United States are valued based on the last traded price, official closing price, or the most recent bid price of the underlying non-U.S.-traded stock, adjusted as appropriate for the underlying-to-ADR conversion ratio and foreign exchange rate, and from time-to-time may also be adjusted further to take into account material events that may take place after the close of the local non-U.S. market but before the close of the New York Stock Exchange (“NYSE”). These securities may represent a transfer from a Level 1 to a Level 2 security. Investments in investment companies are valued at their respective net asset values on the valuation date. These investment vehicles are generally classified as Level 1.
Investments initially valued in currencies other than the U.S. dollar are converted to the U.S. dollar using exchange rates obtained from pricing services. As a result, the net asset value (“NAV”) of the Funds’ shares may be affected by changes in the value of currencies in relation to the U.S. dollar. The value of securities traded in markets outside the United States or denominated in currencies other than the U.S. dollar may be affected significantly on a day that the NYSE is closed and an investor is not able to purchase, redeem or exchange shares. If significant market events occur between the time of determination of the closing price of a foreign security on an exchange and the time that the Funds’ NAV is determined, or if under the Funds’ procedures, the closing price of a foreign security is not deemed to be reliable, the security would be valued at fair value as determined in accordance with procedures established in good faith by the Funds’ Board of Trustees. These securities are generally classified as Level 2 or Level 3 depending on the priority of the significant inputs.
Repurchase agreements are valued at contract amount plus accrued interest, which approximates market value. These securities are generally classified as Level 2.
Certain securities may not be able to be priced by the pre-established pricing methods as described above. Such securities may be valued by the Funds’ Board of Trustees or its designee at fair value. These securities generally include, but are not limited to, restricted securities (securities which may not be publicly sold without registration under the Securities Act of 1933, as amended) for which a pricing service is unable to provide a market price; securities whose trading has been formally suspended; debt securities that have gone into default and for which there is no current market quotation; a security whose market price is not available from a
pre-established pricing source; a security with respect to which an event has occurred that is likely to materially affect the value of the security after the market has closed but before the calculation of a Fund’s net asset value (as may be the case in non-U.S. markets on which the security is primarily traded) or make it difficult or impossible to obtain a reliable market quotation; and a security whose price, as provided by the pricing service, is not deemed to reflect the security’s fair value. As a general principle, the fair value of a security would appear to be the amount that the owner might reasonably expect to receive for it in a current sale. A variety of factors may be considered in determining the fair value of such securities, which may include consideration of the following: yields or prices of investments of comparable quality, type of issue, coupon, maturity and rating, market quotes or indications of value from security dealers, evaluations of anticipated cash flows or collateral, general market conditions and other information and analysis, including the obligor’s credit characteristics considered relevant. These securities are generally classified as Level 2 or Level 3 depending on the priority of the significant inputs. Regardless of the method employed to value a particular security, all valuations are subject to review by the Funds’ Board of Trustees or its designee.
Refer to Footnote 2 – Fair Value Measurements for further details on the leveling of securities held by the Funds as of the end of the reporting period.
Investment Transactions
Investment transactions are recorded on a trade date basis. Realized gains and losses from investment transactions are determined on the specific identification method, which is the same basis used for federal income tax purposes.
Investment Income
Dividend income is recorded on the ex-dividend date or, for foreign securities, when information is available. Interest income is recorded on an accrual basis.
Income Taxes
Each Fund is a separate taxpayer for federal income tax purposes. Each Fund intends to distribute substantially all of its net investment income and net capital gains to shareholders and to otherwise comply with the requirements of Subchapter M of the Internal Revenue Code applicable to regulated investment companies (“RICs”). Therefore, no federal income tax provision is required.
For all open tax years and all major taxing jurisdictions, management of the Funds has concluded that there are no significant uncertain tax positions that would require recognition in the financial statements. Open tax years are those that are open for examination by taxing authorities (i.e., generally the last four tax year ends and the interim tax period since then). Furthermore, management of the Funds is also not aware of any tax positions for which it is reasonably possible that the total amounts of unrecognized tax benefits will significantly change in the next twelve months.
Dividends and Distributions to Shareholders
Dividends from net investment income and net realized capital gains from investment transactions, if any, are declared and distributed to shareholders at least annually. Furthermore, capital gains are distributed only to the extent they exceed available capital loss carryforwards.
Distributions to shareholders are recorded on the ex-dividend date. The amount and timing of distributions are determined in accordance with federal income tax regulations, which may differ from U.S. GAAP.
Flexible Sales Charge Program
Class A Shares are generally sold with an up-front sales charge and incur a .25% annual 12b-1 service fee. Class A Share purchases of $1 million or more are sold at net asset value without an up-front sales charge but may be subject to a contingent deferred sales charge (“CDSC”) if redeemed within twelve months of purchase. Class C Shares are sold without an up-front sales charge but incur a .75% annual 12b-1 distribution fee and a .25% annual 12b-1 service fee. Class C Shares are subject to a CDSC of 1% if redeemed within twelve months of purchase. Class R3 Shares are sold without an up-front sales charge but incur a .25% annual 12b-1 distribution fee and a .25% annual 12b-1 service fee. Class I Shares are not subject to any sales charge or 12b-1 distribution or service fees.
Foreign Currency Transactions
Each Fund is authorized to engage in foreign currency exchange transactions, including foreign currency exchange contracts, futures, options and swap contracts. To the extent that the Funds invest in securities and/or contracts that are denominated in a currency other than U.S. dollars, the Funds will be subject to currency risk, which is the risk that an increase in the U.S. dollar relative to the foreign currency will reduce returns or portfolio value. Generally, when the U.S. dollar rises in value against a foreign currency, the Funds’ investments denominated in that currency will lose value because its currency is worth fewer U.S. dollars; the opposite effect occurs if the U.S. dollar falls in relative value. Investments and other assets and liabilities denominated in foreign currencies are converted into U.S. dollars on a spot (i.e. cash) basis at the spot rate prevailing in the foreign currency exchange market at the time of valuation. Purchases and sales of investments and income denominated in foreign currencies are translated into U.S. dollars on the respective dates of such transactions.
The books and records of the Funds are maintained in U.S. dollars. Foreign currencies, assets and liabilities are translated into U.S. dollars at 4:00 p.m. Eastern Time. Investment transactions, income and expenses are translated on the respective dates of such transactions. Net realized foreign currency gains and losses resulting from changes in exchange rates include foreign
Notes to Financial Statements (continued)
currency gains and losses between trade date and settlement date of the transactions, foreign currency transactions, and the difference between the amounts of interest and dividends recorded on the books of a Fund and the amounts actually received.
The realized gains and losses resulting from changes in foreign currency exchange rates and changes in foreign exchange rates associated with other assets and liabilities on investments are recognized as a component of “Net realized gain (loss) from investments and foreign currency“ on the Statement of Operations, when applicable.
The unrealized gains and losses resulting from changes in foreign currency exchange rates and changes in foreign exchange rates associated with other assets and liabilities on investments are recognized as a component of “Change in net unrealized appreciation (depreciation) of investments and foreign currency“ on the Statement of Operations, when applicable.
Derivative Financial Instruments
Each Fund is authorized to invest in certain derivative instruments, including foreign currency exchange contracts, futures, options and swap contracts. Although the Funds are authorized to invest in such derivative instruments, and may do so in the future, they did not make any such investments during the fiscal year ended September 30, 2012.
Repurchase Agreements
In connection with transactions in repurchase agreements, it is each Fund’s policy that its custodian take possession of the underlying collateral securities, the fair value of which exceeds the principal amount of the repurchase transaction, including accrued interest, at all times. If the counterparty defaults, and the fair value of the collateral declines, realization of the collateral may be delayed or limited.
Multiclass Operations and Allocations
Income and expenses of the Funds that are not directly attributable to a specific class of shares are prorated among the classes based on the relative net assets of each class. Expenses directly attributable to a class of shares, which presently only include 12b-1 distribution and service fees, are recorded to the specific class.
Realized and unrealized capital gains and losses of the Funds are prorated among the classes based on the relative net assets of each class.
Custodian Fee Credit
Each Fund has an arrangement with the custodian bank whereby certain custodian fees and expenses are reduced by net credits earned on each Fund’s cash on deposit with the bank. Such deposit arrangements are an alternative to overnight investments. Credits for cash balances may be offset by charges for any days on which a Fund overdraws its account at the custodian bank.
Indemnifications
Under the Trust’s organizational documents, its officers and trustees are indemnified against certain liabilities arising out of the performance of their duties to the Trust. In addition, in the normal course of business, the Trust enters into contracts that provide general indemnifications to other parties. The Trust’s maximum exposure under these arrangements is unknown as this would involve future claims that may be made against the Trust that have not yet occurred. However, the Trust has not had prior claims or losses pursuant to these contracts and expects the risk of loss to be remote.
Use of Estimates
The preparation of financial statements in conformity with U.S. GAAP requires management to make estimates and assumptions that affect the reported amounts of assets and liabilities at the date of the financial statements and the reported amounts of increases and decreases in net assets from operations during the reporting period. Actual results may differ from those estimates.
2. Fair Value Measurements
Fair value is defined as the price that the Funds would receive upon selling an investment or transferring a liability in an orderly transaction to an independent buyer in the principal or most advantageous market for the investment. A three-tier hierarchy is used to maximize the use of observable market data and minimize the use of unobservable inputs and to establish classification of fair value measurements for disclosure purposes. Observable inputs reflect the assumptions market participants would use in pricing the asset or liability. Observable inputs are based on market data obtained from sources independent of the reporting entity. Unobservable inputs reflect the reporting entity’s own assumptions about the assumptions market participants would use in pricing the asset or liability. Unobservable inputs are based on the best information available in the circumstances. The following is a summary of the three-tiered hierarchy of valuation input levels.
| | |
| Level 1 – | | Inputs are unadjusted and prices are determined using quoted prices in active markets for identical securities. |
| Level 2 – | | Prices are determined using other significant observable inputs (including quoted prices for similar securities, interest rates, prepayment speeds, credit risk, etc.). |
| Level 3 – | | Prices are determined using significant unobservable inputs (including management’s assumptions in determining the fair value of investments). |
The inputs or methodologies used for valuing securities are not an indication of the risks associated with investing in those securities. The following is a summary of each Fund’s fair value measurements as of the end of the reporting period:
| | | | | | | | | | | | | | | | |
| Symphony Large-Cap Growth | | Level 1 | | | Level 2 | | | Level 3 | | | Total | |
Long-Term Investments*: | | | | | | | | | | | | | | | | |
Common Stocks | | $ | 62,428,895 | | | $ | — | | | $ | — | | | $ | 62,428,895 | |
Short-Term Investments: | | | | | | | | | | | | | | | | |
Repurchase Agreements | | | — | | | | 3,304,115 | | | | — | | | | 3,304,115 | |
Total | | $ | 62,428,895 | | | $ | 3,304,115 | | | $ | — | | | $ | 65,733,010 | |
| | | | | | | | | | | | | | | | |
| | | | |
| Symphony Mid-Cap Core | | Level 1 | | | Level 2 | | | Level 3 | | | Total | |
Long-Term Investments*: | | | | | | | | | | | | | | | | |
Common Stocks | | $ | 4,086,151 | | | $ | — | | | $ | — | | | $ | 4,086,151 | |
Short-Term Investments: | | | | | | | | | | | | | | | | |
Repurchase Agreements | | | — | | | | 275,241 | | | | — | | | | 275,241 | |
Total | | $ | 4,086,151 | | | $ | 275,241 | | | $ | — | | | $ | 4,361,392 | |
| | | | |
| Symphony International Equity | | Level 1 | | | Level 2 | | | Level 3 | | | Total | |
Long-Term Investments*: | | | | | | | | | | | | | | | | |
Common Stocks | | $ | 1,012,559 | | | $ | — | | | $ | — | | | $ | 1,012,559 | |
Investment Companies | | | 45,934 | | | | — | | | | — | | | | 45,934 | |
Total | | $ | 1,058,493 | | | $ | — | | | $ | — | | | $ | 1,058,493 | |
| | | | |
| Symphony Optimized Alpha | | Level 1 | | | Level 2 | | | Level 3 | | | Total | |
Long-Term Investments*: | | | | | | | | | | | | | | | | |
Common Stocks | | $ | 2,807,220 | | | $ | — | | | $ | — | | | $ | 2,807,220 | |
| * | Refer to the Fund’s Portfolio of Investments for industry classifications. |
The table below presents the transfers in and out of the valuation levels for the following Fund as of the end of the reporting period when compared to the valuation levels at the end of the previous fiscal year. Changes in valuation inputs or methodologies may result in transfers into or out of an assigned level within the fair value hierarchy. Transfers in or out of levels are generally due to the availability of publicly available information and to the significance or extent a manager determines that the valuation inputs or methodologies may impact the valuation of those securities.
| | | | | | | | | | | | | | | | | | | | | | | | |
| | | Level 1 | | | Level 2 | | | Level 3 | |
| | | Transfers In | | | (Transfers Out) | | | Transfers In | | | (Transfers Out) | | | Transfers In | | | (Transfers Out) | |
Symphony International Equity | | $ | 648,280 | | | $ | — | | | $ | — | | | $ | (648,280 | ) | | $ | — | | | $ | — | |
The Nuveen funds’ Board of Directors/Trustees is responsible for the valuation process and has delegated the oversight of the daily valuation process to the Adviser’s Valuation Committee. The Valuation Committee, pursuant to the valuation policies and procedures adopted by the Board of Directors/Trustees, is responsible for making fair value determinations, evaluating the effectiveness of the funds’ pricing policies, and reporting to the Board of Directors/Trustees. The Valuation Committee is aided in its efforts by the Adviser’s dedicated Securities Valuation Team, which is responsible for administering the daily valuation process and applying fair value methodologies as approved by the Valuation Committee. When determining the reliability of independent pricing services for investments owned by the funds, the Valuation Committee, among other things, conducts due diligence reviews of the pricing services and monitors the quality of security prices received through various testing reports conducted by the Securities Valuation Team.
The Valuation Committee will consider pricing methodologies it deems relevant and appropriate when making fair value determinations. Examples of possible methodologies include, but are not limited to, multiple of earnings; discount from market of a similar freely traded security; discounted cash-flow analysis; book value or a multiple thereof; risk premium/yield analysis; yield to maturity; and/or fundamental investment analysis. The Valuation Committee will also consider factors it deems relevant and appropriate in light of the facts and circumstances. Examples of possible factors include, but are not limited to, the type of security; the issuer’s financial statements; the purchase price of the security; the discount from market value of unrestricted securities of the same class at the time of purchase; analysts’ research and observations from financial institutions; information regarding any transactions or offers with respect to the security; the existence of merger proposals or tender offers affecting the security; the price and extent of public trading in similar securities of the issuer or comparable companies; and the existence of a shelf registration for restricted securities.
For each portfolio security that has been fair valued pursuant to the policies adopted by the Board of Directors/Trustees, the fair value price is compared against the last available and next available market quotations. The Valuation Committee reviews the results of such testing and fair valuation occurrences are reported to the Board of Directors/Trustees.
Notes to Financial Statements (continued)
3. Derivative Instruments and Hedging Activities
The Funds record derivative instruments at fair value, with changes in fair value recognized on the Statement of Operations, when applicable. Even though the Funds’ investments in derivatives may represent economic hedges, they are not considered to be hedge transactions for financial reporting purposes. The Funds did not invest in derivative instruments during the fiscal year ended September 30, 2012.
4. Fund Shares
Transactions in Fund shares were as follows:
| | | | | | | | | | | | | | | | |
| | | Symphony Large-Cap Growth | |
| | | Year Ended
9/30/12 | | | Year Ended
9/30/11 | |
| | | Shares | | | Amount | | | Shares | | | Amount | |
Shares sold: | | | | | | | | | | | | | | | | |
Class A | | | 1,511,225 | | | $ | 36,283,962 | | | | 93,678 | | | $ | 2,254,508 | |
Class C | | | 459,738 | | | | 10,742,423 | | | | 95,387 | | | | 2,209,428 | |
Class R3 | | | 94,378 | | | | 2,383,976 | | | | — | | | | — | |
Class I | | | 534,471 | | | | 13,364,622 | | | | 136,878 | | | | 3,279,045 | |
Shares issued to shareholders due to reinvestment of distributions: | | | | | | | | | | | | | | | | |
Class A | | | 12,856 | | | | 258,536 | | | | — | | | | — | |
Class C | | | 7,991 | | | | 154,230 | | | | — | | | | — | |
Class R3 | | | — | | | | — | | | | — | | | | — | |
Class I | | | 5,775 | | | | 117,425 | | | | — | | | | — | |
| | | | 2,626,434 | | | | 63,305,174 | | | | 325,943 | | | | 7,742,981 | |
Shares redeemed: | | | | | | | | | | | | | | | | |
Class A | | | (166,604 | ) | | | (4,028,425 | ) | | | (46,477 | ) | | | (1,056,480 | ) |
Class C | | | (39,325 | ) | | | (902,419 | ) | | | (49,329 | ) | | | (1,143,286 | ) |
Class R3 | | | (2,971 | ) | | | (68,212 | ) | | | — | | | | — | |
Class I | | | (105,364 | ) | | | (2,407,075 | ) | | | (363,466 | ) | | | (8,880,472 | ) |
| | | | (314,264 | ) | | | (7,406,131 | ) | | | (459,272 | ) | | | (11,080,238 | ) |
Net increase (decrease) | | | 2,312,170 | | | $ | 55,899,043 | | | | (133,329 | ) | | $ | (3,337,257 | ) |
| | | | | | | | | | | | | | | | |
| | | Symphony Mid-Cap Core | |
| | | Year Ended
9/30/12 | | | Year Ended
9/30/11 | |
| | | Shares | | | Amount | | | Shares | | | Amount | |
Shares sold: | | | | | | | | | | | | | | | | |
Class A | | | 51,329 | | | $ | 1,268,673 | | | | 78,938 | | | $ | 1,860,314 | |
Class C | | | 7,176 | | | | 164,082 | | | | 23,861 | | | | 556,397 | |
Class R3 | | | 541 | | | | 13,495 | | | | 181 | | | | 4,369 | |
Class I | | | 36,260 | | | | 876,794 | | | | 4,101 | | | | 94,278 | |
Shares issued to shareholders due to reinvestment of distributions: | | | | | | | | | | | | | | | | |
Class A | | | — | | | | — | | | | — | | | | — | |
Class C | | | — | | | | — | | | | — | | | | — | |
Class R3 | | | — | | | | — | | | | — | | | | — | |
Class I | | | — | | | | — | | | | — | | | | — | |
| | | | 95,306 | | | | 2,323,044 | | | | 107,081 | | | | 2,515,358 | |
Shares redeemed: | | | | | | | | | | | | | | | | |
Class A | | | (50,250 | ) | | | (1,196,935 | ) | | | (15,689 | ) | | | (350,703 | ) |
Class C | | | (19,407 | ) | | | (431,597 | ) | | | (4,500 | ) | | | (102,609 | ) |
Class R3 | | | (22 | ) | | | (569 | ) | | | — | | | | — | |
Class I | | | (1,500 | ) | | | (35,909 | ) | | | (926 | ) | | | (22,330 | ) |
| | | | (71,179 | ) | | | (1,665,010 | ) | | | (21,115 | ) | | | (475,642 | ) |
Net increase (decrease) | | | 24,127 | | | $ | 658,034 | | | | 85,966 | | | $ | 2,039,716 | |
| | | | | | | | | | | | | | | | |
| | | Symphony International Equity | |
| | | Year Ended
9/30/12 | | | Year Ended
9/30/11 | |
| | | Shares | | | Amount | | | Shares | | | Amount | |
Shares sold: | | | | | | | | | | | | | | | | |
Class A | | | 2,626 | | | $ | 36,949 | | | | 9,996 | | | $ | 156,323 | |
Class C | | | 6,043 | | | | 85,255 | | | | 11,937 | | | | 165,174 | |
Class R3 | | | — | | | | — | | | | 3,448 | | | | 50,000 | |
Class I | | | 28,378 | | | | 398,082 | | | | 2,307 | | | | 36,067 | |
Shares issued to shareholders due to reinvestment of distributions: | | | | | | | | | | | | | | | | |
Class A | | | 44 | | | | 598 | | | | 112 | | | | 1,709 | |
Class C | | | — | | | | — | | | | — | | | | — | |
Class R3 | | | — | | | | — | | | | — | | | | — | |
Class I | | | 81 | | | | 1,101 | | | | 64 | | | | 980 | |
| | | | 37,172 | | | | 521,985 | | | | 27,864 | | | | 410,253 | |
Shares redeemed: | | | | | | | | | | | | | | | | |
Class A | | | (16,149 | ) | | | (217,182 | ) | | | (5,313 | ) | | | (76,030 | ) |
Class C | | | (21,277 | ) | | | (288,198 | ) | | | — | | | | — | |
Class R3 | | | — | | | | — | | | | — | | | | — | |
Class I | | | (1,310 | ) | | | (19,255 | ) | | | (4,650 | ) | | | (69,047 | ) |
| | | | (38,736 | ) | | | (524,635 | ) | | | (9,963 | ) | | | (145,077 | ) |
Net increase (decrease) | | | (1,564 | ) | | $ | (2,650 | ) | | | 17,901 | | | $ | 265,176 | |
| |
| | | Symphony Optimized Alpha | |
| | | Year Ended
9/30/12 | | | Year Ended
9/30/11 | |
| | | Shares | | | Amount | | | Shares | | | Amount | |
Shares sold: | | | | | | | | | | | | | | | | |
Class A | | | 17,349 | | | $ | 374,323 | | | | 21,530 | | | $ | 421,066 | |
Class C | | | 3,806 | | | | 79,485 | | | | 7,707 | | | | 147,920 | |
Class R3(1) | | | — | | | | — | | | | 2,886 | | | | 50,000 | |
Class I | | | 34,796 | | | | 731,304 | | | | 3,384 | | | | 65,710 | |
Shares issued to shareholders due to reinvestment of distributions: | | | | | | | | | | | | | | | | |
Class A | | | 164 | | | | 3,222 | | | | 44 | | | | 841 | |
Class C | | | 4 | | | | 86 | | | | — | | | | — | |
Class R3(1) | | | — | | | | — | | | | — | | | | — | |
Class I | | | 402 | | | | 7,911 | | | | 314 | | | | 6,018 | |
| | | | 56,521 | | | | 1,196,331 | | | | 35,865 | | | | 691,555 | |
Shares redeemed: | | | | | | | | | | | | | | | | |
Class A | | | (17,541 | ) | | | (357,169 | ) | | | (4,069 | ) | | | (80,063 | ) |
Class C | | | (16,712 | ) | | | (334,175 | ) | | | (1 | ) | | | (19 | ) |
Class R3(1) | | | (2,886 | ) | | | (59,694 | ) | | | — | | | | — | |
Class I | | | (13,943 | ) | | | (291,314 | ) | | | (47,860 | ) | | | (929,042 | ) |
| | | | (51,082 | ) | | | (1,042,352 | ) | | | (51,930 | ) | | | (1,009,124 | ) |
Net increase (decrease) | | | 5,439 | | | $ | 153,979 | | | | (16,065 | ) | | $ | (317,569 | ) |
(1) – After the close of business on May 30, 2012, the Fund liquidated all of its Class R3 Shares.
5. Investment Transactions
Purchases and sales (excluding short-term investments, where applicable) during the fiscal year ended September 30, 2012, were as follows:
| | | | | | | | | | | | | | | | |
| | | Symphony
Large-Cap
Growth | | | Symphony
Mid-Cap
Core | | | Symphony International
Equity | | | Symphony Optimized
Alpha | |
Purchases | | $ | 78,613,421 | | | $ | 5,215,827 | | | $ | 213,982 | | | $ | 2,139,719 | |
Sales | | | 25,335,409 | | | | 4,603,693 | | | | 220,142 | | | | 2,060,543 | |
Notes to Financial Statements (continued)
6. Income Tax Information
The following information is presented on an income tax basis. Differences between amounts for financial statement and federal income tax purposes are primarily due to timing differences in recognizing certain gains and losses on investment transactions. To the extent that differences arise that are permanent in nature, such amounts are reclassified within the capital accounts as detailed below. Temporary differences do not require reclassification. Temporary and permanent differences do not impact the net asset values of the Funds.
At September 30, 2012, the cost and unrealized appreciation (depreciation) of investments, as determined on a federal income tax basis, were as follows:
| | | | | | | | | | | | | | | | |
| | | Symphony
Large-Cap
Growth | | | Symphony
Mid-Cap
Core | | | Symphony
International
Equity | | | Symphony
Optimized
Alpha | |
Cost of investments | | $ | 61,577,100 | | | $ | 3,931,008 | | | $ | 964,691 | | | $ | 2,336,026 | |
Gross unrealized: | | | | | | | | | | | | | | | | |
Appreciation | | $ | 5,166,194 | | | $ | 474,962 | | | $ | 176,580 | | | $ | 493,536 | |
Depreciation | | | (1,010,284 | ) | | | (44,578 | ) | | | (82,778 | ) | | | (22,342 | ) |
Net unrealized appreciation (depreciation) of investments | | $ | 4,155,910 | | | $ | 430,384 | | | $ | 93,802 | | | $ | 471,194 | |
Permanent differences, primarily due to net operating losses, reclassification of litigation proceeds and foreign currency reclassifications, resulted in reclassifications among the Funds’ components of net assets at September 30, 2012, the Funds’ tax year end, as follows:
| | | | | | | | | | | | | | | | |
| | | Symphony
Large-Cap
Growth | | | Symphony
Mid-Cap
Core | | | Symphony
International
Equity | | | Symphony
Optimized
Alpha | |
Capital paid-in | | $ | (1,796 | ) | | $ | (2,993 | ) | | $ | — | | | $ | (287 | ) |
Undistributed (Over-distribution of) net investment income | | | 244,030 | | | | 2,993 | | | | (86 | ) | | | — | |
Accumulated net realized gain (loss) | | | (242,234 | ) | | | — | | | | 86 | | | | 287 | |
The tax components of undistributed net ordinary income and net long-term capital gains at September 30, 2012, the Funds’ tax year end, were as follows:
| | | | | | | | | | | | | | | | |
| | | Symphony
Large-Cap
Growth | | | Symphony
Mid-Cap
Core | | | Symphony
International
Equity | | | Symphony
Optimized
Alpha | |
Undistributed net ordinary income* | | $ | 347,004 | | | $ | 12,684 | | | $ | 18,804 | | | $ | 34,578 | |
Undistributed net long-term capital gains | | | — | | | | — | | | | — | | | | 78,272 | |
| * | Net ordinary income consists of net taxable income derived from dividends, interest, and net short-term capital gains, if any. |
The tax character of distributions paid during the Funds’ tax years ended September 30, 2012 and September 30, 2011, was designated for purposes of the dividends paid deduction as follows:
| | | | | | | | | | | | | | | | |
| 2012 | | Symphony
Large-Cap
Growth | | | Symphony
Mid-Cap
Core | | | Symphony
International
Equity | | | Symphony
Optimized
Alpha | |
Distributions from net ordinary income* | | $ | 195 | | | $ | — | | | $ | 12,047 | | | $ | 20,987 | |
Distributions from net long-term capital gains** | | | 684,784 | | | | — | | | | — | | | | — | |
| | | | | | | | | | | | | | | | |
| 2011 | | Symphony
Large-Cap
Growth | | | Symphony
Mid-Cap
Core | | | Symphony
International
Equity | | | Symphony
Optimized
Alpha | |
Distributions from net ordinary income* | | $ | — | | | $ | — | | | $ | 13,997 | | | $ | 16,941 | |
Distributions from net long-term capital gains | | | — | | | | — | | | | — | | | | — | |
| * | Net ordinary income consists of net taxable income derived from dividends, interest, and net short-term capital gains, if any. |
| ** | The Fund designates as long-term capital gain dividend, pursuant to the Internal Revenue Code Section 852(b)(3), the amount necessary to reduce earnings and profits of the Fund related to the net capital gain to zero for the tax year ended September 30, 2012. |
At September 30, 2012, the Funds’ tax year end, the following Funds had unused capital loss carryforwards available for federal income tax purposes to be applied against future capital gains, if any. If not applied, the carryforwards will expire as follows:
| | | | | | | | |
| | | Symphony
Mid-Cap
Core | | | Symphony
International
Equity | |
Expiration: | | | | | | | | |
September 30, 2017 | | $ | 27,180 | | | $ | 372,472 | |
During the Funds’ tax year ended September 30, 2012, the following Funds utilized capital loss carryforwards as follows:
| | | | | | | | | | | | |
| | | Symphony
Mid-Cap
Core | | | Symphony
International
Equity | | | Symphony
Optimized
Alpha | |
Utilized capital loss carryforwards | | $ | 138,501 | | | $ | 13,892 | | | $ | 155,547 | |
On December 22, 2010, the Regulated Investment Company Modernization Act of 2010 (the “Act”) was enacted, which changed various technical rules governing the tax treatment of RICs. The changes are generally effective for taxable years beginning after the date of enactment. One of the more prominent changes addresses capital loss carryforwards. Under the Act, each Fund will be permitted to carry forward capital losses incurred in taxable years beginning after the date of enactment for an unlimited period. However, any losses incurred during those future taxable years will be required to be utilized prior to the losses incurred in pre-enactment taxable years, which carry an expiration date. As a result of this ordering rule, pre-enactment capital loss carryforwards may be more likely to expire unused. Additionally, post-enactment capital loss carryforwards will retain their character as either short-term or long-term capital losses rather than being considered all short-term as permitted under previous regulation.
The Act also contains several provisions aimed at preserving the character of distributions made by a fiscal year RIC during the portion of its taxable year ending after October 31 or December 31, reducing the circumstances under which a RIC might be required to file amended Forms 1099 to restate previously reported distributions.
During the Funds’ tax year ended September 30, 2012, there were no post-enactment capital losses generated by any of the Funds.
The Funds have elected to defer losses incurred from November 1, 2011 through September 30, 2012, the Funds’ tax year end, in accordance with federal income tax rules. These losses are treated as having arisen on the first day of the following fiscal year. The following Funds have elected to defer losses as follows:
| | | | | | | | | | | | |
| | | Symphony
Large-Cap
Growth | | | Symphony
Mid-Cap
Core | | | Symphony
International
Equity | |
Post-October capital losses | | $ | 324,744 | | | $ | 49,556 | | | $ | 5,278 | |
Late-year ordinary losses | | | — | | | | — | | | | — | |
7. Management Fees and Other Transactions with Affiliates
Each Fund’s management fee consists of two components – a fund-level fee, based only on the amount of assets within each individual Fund, and a complex-level fee, based on the aggregate amount of all eligible fund assets managed by Nuveen Fund Advisors, Inc., (the “Adviser”), a wholly-owned subsidiary of Nuveen Investments, Inc. (“Nuveen”). This pricing structure enables each Fund’s shareholders to benefit from growth in the assets within their respective Fund as well as from growth in the amount of complex-wide assets managed by the Adviser.
The annual fund-level fee for each Fund, payable monthly, is calculated according to the following schedule:
| | | | | | | | | | | | | | | | |
| Average Daily Net Assets | | Symphony
Large-Cap
Growth
Fund-Level
Fee Rate | | | Symphony
Mid-Cap
Core
Fund-Level
Fee Rate | | | Symphony
International
Equity
Fund-Level
Fee Rate | | | Symphony
Optimized
Alpha
Fund-Level
Fee Rate | |
For the first $125 million | | | .5000 | % | | | .5500 | % | | | .6000 | % | | | .5000 | % |
For the next $125 million | | | .4875 | | | | .5375 | | | | .5875 | | | | .4875 | |
For the next $250 million | | | .4750 | | | | .5250 | | | | .5750 | | | | .4750 | |
For the next $500 million | | | .4625 | | | | .5125 | | | | .5625 | | | | .4625 | |
For the next $1 billion | | | .4500 | | | | .5000 | | | | .5500 | | | | .4500 | |
For net assets over $2 billion | | | .4250 | | | | .4750 | | | | .5250 | | | | .4250 | |
Notes to Financial Statements (continued)
The annual complex-level fee for each Fund, payable monthly, is calculated according to the following schedule:
| | | | |
| Complex-Level Asset Breakpoint Level* | | Effective Rate at Breakpoint Level | |
$55 billion | | | .2000 | % |
$56 billion | | | .1996 | |
$57 billion | | | .1989 | |
$60 billion | | | .1961 | |
$63 billion | | | .1931 | |
$66 billion | | | .1900 | |
$71 billion | | | .1851 | |
$76 billion | | | .1806 | |
$80 billion | | | .1773 | |
$91 billion | | | .1691 | |
$125 billion | | | .1599 | |
$200 billion | | | .1505 | |
$250 billion | | | .1469 | |
$300 billion | | | .1445 | |
| * | The complex-level fee is calculated based upon the aggregate daily “eligible assets” of all Nuveen Funds. Eligible assets do not include assets attributable to investments in other Nuveen Funds or assets in excess of $2 billion added to the Nuveen Fund complex in connection with the Adviser’s assumption of the management of the former First American Funds effective January 1, 2011. Eligible assets include closed-end fund assets managed by the Adviser that are attributable to financial leverage. For these purposes, financial leverage includes the closed-end funds’ use of preferred stock and borrowings and certain investments in the residual interest certificates (also called inverse floating rate securities) in tender option bond (TOB) trusts, including the portion of assets held by a TOB trust that has been effectively financed by the trust’s issuance of floating rate securities, subject to an agreement by the Adviser as to certain funds to limit the amount of such assets for determining eligible assets in certain circumstances. As of September 30, 2012, the complex-level fee rate for these Funds was .1695%. |
The management fee compensates the Adviser for the overall investment advisory and administrative services and general office facilities. The Adviser is responsible for the Fund’s overall strategy and asset allocation decisions. The Adviser has entered into sub-advisory agreements with Symphony Asset Management LLC (“Symphony”), an affiliate of Nuveen, under which Symphony manages the investment portfolios of the Funds. Symphony is compensated for its services to the Funds from the management fees paid to the Adviser.
The Adviser has agreed to waive fees and/or reimburse expenses (“Expense Cap”) of the following Funds so that total annual Fund operating expenses (excluding 12b-1 distribution and/or service fees, interest expenses, taxes, acquired fund fees and expenses, fees incurred in acquiring and disposing of portfolio securities and extraordinary expenses) do not exceed the average daily net assets of any class of Fund shares in the amounts and for the time periods stated in the following table.
| | | | | | | | | | | | |
| Fund | | Current/ Temporary
Expense Cap | | | Current/ Temporary
Expense Cap
Expiration Date | | | Permanent
Expense Cap | |
Symphony Large-Cap Growth | | | 1.00 | % | | | January 31, 2013 | | | | 1.35 | % |
Symphony Mid-Cap Core | | | 1.15 | | | | January 31, 2013 | | | | 1.40 | |
Symphony International Equity | | | 1.13 | | | | January 31, 2013 | | | | 1.38 | |
Symphony Optimized Alpha | | | 1.00 | | | | January 31, 2013 | | | | 1.45 | |
The Adviser may also voluntarily reimburse expenses from time to time in any of the Funds. Voluntary reimbursements may be terminated at any time at the Adviser’s discretion.
The Trust pays no compensation directly to those of its trustees who are affiliated with the Adviser or to its officers, all of whom receive remuneration for their services to the Trust from the Adviser or its affiliates. The Board of Trustees has adopted a deferred compensation plan for independent trustees that enables trustees to elect to defer receipt of all or a portion of the annual compensation they are entitled to receive from certain Nuveen-advised funds. Under the plan, deferred amounts are treated as though equal dollar amounts had been invested in shares of select Nuveen-advised funds.
During the fiscal year ended September 30, 2012, Nuveen Securities, LLC (the “Distributor”), a wholly-owned subsidiary of Nuveen, collected sales charges on purchases of Class A Shares, the majority of which were paid out as concessions to financial intermediaries as follows:
| | | | | | | | | | | | | | | | |
| | | Symphony
Large-Cap
Growth | | | Symphony
Mid-Cap
Core | | | Symphony
International
Equity | | | Symphony
Optimized
Alpha | |
Sales charges collected (Unaudited) | | $ | 134,074 | | | $ | 11,344 | | | $ | — | | | $ | 3,984 | |
Paid to financial intermediaries (Unaudited) | | | 118,513 | | | | 9,921 | | | | — | | | | 3,525 | |
During the fiscal year ended September 30, 2012, the Distributor compensated financial intermediaries directly with commission advances at the time of purchase as follows:
| | | | | | | | | | | | | | | | |
| | | Symphony
Large-Cap
Growth | | | Symphony
Mid-Cap
Core | | | Symphony
International
Equity | | | Symphony
Optimized
Alpha | |
Commission advances (Unaudited) | | $ | 79,683 | | | $ | 1,244 | | | $ | 114 | | | $ | 393 | |
To compensate for commissions advanced to financial intermediaries, all 12b-1 service and distribution fees collected on Class C Shares during the first year following a purchase are retained by the Distributor. During the fiscal year ended September 30, 2012, the Distributor retained such 12b-1 fees as follows:
| | | | | | | | | | | | | | | | |
| | | Symphony
Large-Cap
Growth | | | Symphony
Mid-Cap
Core | | | Symphony
International
Equity | | | Symphony
Optimized
Alpha | |
12b-1 fees retained (Unaudited) | | $ | 26,624 | | | $ | 4,070 | | | $ | 1,850 | | | $ | 1,970 | |
The remaining 12b-1 fees charged to the Funds were paid to compensate financial intermediaries for providing services to shareholders relating to their investments.
The Distributor also collected and retained CDSC on share redemptions during the fiscal year ended September 30, 2012, as follows:
| | | | | | | | | | | | | | | | |
| | | Symphony
Large-Cap
Growth | | | Symphony
Mid-Cap
Core | | | Symphony
International
Equity | | | Symphony
Optimized
Alpha | |
CDSC retained (Unaudited) | | $ | — | | | $ | — | | | $ | 7 | | | $ | — | |
At September 30, 2012, Nuveen owned shares of the Funds as follows:
| | | | | | | | | | | | | | | | |
| | | Symphony
Large-Cap
Growth | | | Symphony
Mid-Cap
Core | | | Symphony
International
Equity | | | Symphony
Optimized
Alpha | |
Class A | | | — | | | | 2,192 | | | | 3,794 | | | | 2,479 | |
Class C | | | — | | | | 2,290 | | | | 3,820 | | | | 2,528 | |
Class R3 | | | — | | | | 10,183 | | | | 3,448 | | | | N/A | |
Class I | | | — | | | | 34,425 | | | | 38,892 | | | | 41,835 | |
| N/A | – After the close of business on May 30, 2012, Symphony Optimized Alpha liquidated all of its Class R3 Shares. |
8. New Accounting Pronouncements
Financial Accounting Standards Board (“FASB”) Balance Sheet (Topic 210): Disclosures about Offsetting Assets and Liabilities
In December 2011, the FASB issued Accounting Standards Update (“ASU”) No. 2011-11 (“ASU No. 2011-11”) to enhance disclosures about financial instruments and derivative instruments that are subject to offsetting (“netting”) on the Statement of Assets and Liabilities. This information will enable users of the entity’s financial statements to evaluate the effect or potential effect of netting arrangements on the entity’s financial position. ASU No. 2011-11 is effective prospectively during interim or annual periods beginning on or after January 1, 2013. At this time, management is evaluating the implications of this guidance and the impact it will have to the financial statements amounts and footnote disclosures, if any.
Trustees and Officers (Unaudited)
The management of the Funds, including general supervision of the duties performed for the Funds by the Adviser, is the responsibility of the Board of Trustees of the Funds. The number of trustees of the Funds is currently set at ten. None of the trustees who are not “interested” persons of the Funds (referred to herein as “independent trustees”) has ever been a director or employee of, or consultant to, Nuveen or its affiliates. The names and business addresses of the trustees and officers of the Funds, their principal occupations and other affiliations during the past five years, the number of portfolios each oversees and other directorships they hold are set forth below.
The Funds’ Statement of Additional Information (“SAI”) includes more information about the trustees. To request a free copy, call Nuveen Investments at (800) 257-8787 or visit the Funds’ website at www.nuveen.com.
| | | | | | | | |
Name, Birthdate and Address | | Position(s) Held with the Funds | | Year First Elected or Appointed (1) | | Principal Occupation(s) Including other Directorships During Past 5 Years | | Number of Portfolios in Fund Complex Overseen by Trustee |
| | |
| Independent Trustees: | | | | |
Robert P. Bremner 8/22/40 333 W. Wacker Drive Chicago, IL 60606 | | Chairman of the Board and Trustee | | 1996 | | Private Investor and Management Consultant; Treasurer and Director, Humanities Council of Washington, D.C.; Board Member, Independent Directors Council affiliated with the Investment Company Institute. | | 216 |
Jack B. Evans 10/22/48 333 W. Wacker Drive Chicago, IL 60606 | | Trustee | | 1999 | | President, The Hall-Perrine Foundation, a private philanthropic corporation (since 1996); Director and Chairman, United Fire Group, a publicly held company; member of the Board of Regents for the State of Iowa University System; Director, Source Media Group; Life Trustee of Coe College and the Iowa College Foundation; formerly, Director, Alliant Energy; formerly, Director, Federal Reserve Bank of Chicago; formerly, President and Chief Operating Officer, SCI Financial Group, Inc., a regional financial services firm. | | 216 |
William C. Hunter 3/6/48 333 W. Wacker Drive Chicago, IL 60606 | | Trustee | | 2004 | | Dean Emeritus (since June 30, 2012), formerly, Dean, Tippie College of Business, University of Iowa (2006-2012); Director (since 2004) of Xerox Corporation; Director (since 2005), and President (since July 2012) Beta Gamma Sigma, Inc., The International Honor Society; Director of Wellmark, Inc. (since 2009); formerly, Dean and Distinguished Professor of Finance, School of Business at the University of Connecticut (2003-2006); previously, Senior Vice President and Director of Research at the Federal Reserve Bank of Chicago (1995-2003); formerly, Director (1997-2007), Credit Research Center at George Washington University. | | 216 |
David J. Kundert 10/28/42 333 W. Wacker Drive Chicago, IL 60606 | | Trustee | | 2005 | | Director, Northwestern Mutual Wealth Management Company; retired (since 2004) as Chairman, JPMorgan Fleming Asset Management, President and CEO, Banc One Investment Advisors Corporation, and President, One Group Mutual Funds; prior thereto, Executive Vice President, Banc One Corporation and Chairman and CEO, Banc One Investment Management Group; Member, Board of Regents, Luther College; member of the Wisconsin Bar Association; member of Board of Directors, Friends of Boerner Botanical Gardens; member of Board of Directors and Chair of Investment Committee, Greater Milwaukee Foundation. | | 216 |
William J. Schneider 9/24/44 333 W. Wacker Drive Chicago, IL 60606 | | Trustee | | 1996 | | Chairman of Miller-Valentine Partners Ltd., a real estate investment company; formerly, Senior Partner and Chief Operating Officer (retired 2004) of Miller-Valentine Group; member, University of Dayton Business School Advisory Council; member, Mid-America Health System Board; formerly, member and chair, Dayton Philharmonic Orchestra Association; formerly, member, Business Advisory Council, Cleveland Federal Reserve Bank. | | 216 |
Judith M. Stockdale 12/29/47 333 W. Wacker Drive Chicago, IL 60606 | | Trustee | | 1997 | | Executive Director, Gaylord and Dorothy Donnelley Foundation (since 1994); prior thereto, Executive Director, Great Lakes Protection Fund (1990-1994). | | 216 |
Carole E. Stone 6/28/47 333 W. Wacker Drive Chicago, IL 60606 | | Trustee | | 2007 | | Director, Chicago Board Options Exchange (since 2006); Director, C2 Options Exchange, Incorporated (since 2009); formerly, Commissioner, New York State Commission on Public Authority Reform (2005-2010); formerly, Chair, New York Racing Association Oversight Board (2005-2007). | | 216 |
| | | | | | | | |
Name, Birthdate and Address | | Position(s) Held with the Funds | | Year First Elected or Appointed (1) | | Principal Occupation(s) During Past Five Years | | Number of Portfolios in Fund Complex Overseen by Trustee |
Virginia L. Stringer 8/16/44 333 West Wacker Drive Chicago, IL 60606 | | Trustee | | 2011 | | Board Member, Mutual Fund Directors Forum; former governance consultant and non-profit board member; former Owner and President, Strategic Management Resources, Inc. a management consulting firm; former Member, Governing Board, Investment Company Institute’s Independent Directors Council; previously, held several executive positions in general management, marketing and human resources at IBM and The Pillsbury Company; Independent Director, First American Fund Complex (1987-2010) and Chair (1997-2010). | | 216 |
Terence J. Toth 9/29/59 333 W. Wacker Drive Chicago, IL 60606 | | Trustee | | 2008 | | Director, Legal & General Investment Management America, Inc. (since 2008); Managing Partner, Promus Capital (since 2008); formerly, CEO and President, Northern Trust Global Investments (2004-2007); Executive Vice President, Quantitative Management & Securities Lending (2000-2004); prior thereto, various positions with Northern Trust Company (since 1994); member: Chicago Fellowship Board (since 2005), Catalyst Schools of Chicago Board (since 2008); Mather Foundation Board (since 2012) and a member of its investment committee; formerly, member: Northern Trust Mutual Funds Board (2005-2007), Northern Trust Global Investments Board (2004-2007), Northern Trust Japan Board (2004-2007), Northern Trust Securities Inc. Board (2003-2007) and Northern Trust Hong Kong Board (1997-2004). | | 216 |
| | |
| Interested Trustee: | | | | |
John P. Amboian (2) 6/14/61 333 W. Wacker Drive Chicago, IL 60606 | | Trustee | | 2008 | | Chief Executive Officer and Chairman (since 2007) and Director (since 1999) of Nuveen Investments, Inc., formerly, President (1999-2007); Chief Executive Officer (since 2007) of Nuveen Investments Advisers Inc.; Director (since 1998) formerly, Chief Executive Officer (2007-2010) of Nuveen Fund Advisors, Inc. | | 216 |
Name, Birthdate and Address | | Position(s) Held with the Funds | | Year First Elected or Appointed (3) | | Principal Occupation(s) During Past 5 Years | | Number of Portfolios in Fund Complex Overseen by Officer |
| | |
| Officers of the Funds: | | | | |
Gifford R. Zimmerman 9/9/56 333 W. Wacker Drive Chicago, IL 60606 | | Chief Administrative Officer | | 1988 | | Managing Director (since 2002), Assistant Secretary of Nuveen Securities, LLC; Managing Director (since 2004) and Assistant Secretary (since 1994) of Nuveen Investments, Inc.; Managing Director (since 2002), Assistant Secretary (since 1997) and Co-General Counsel (since 2011) of Nuveen Fund Advisors, Inc.; Managing Director, Assistant Secretary and Associate General Counsel of Nuveen Asset Management, LLC (since 2011); Managing Director, Associate General Counsel and Assistant Secretary of Symphony Asset Management LLC (since 2003); Vice President and Assistant Secretary of NWQ Investment Management Company, LLC (since 2002), Nuveen Investments Advisers Inc. (since 2002), Santa Barbara Asset Management, LLC (since 2006) and of Winslow Capital Management, LLC, (since 2010); Chief Administrative Officer and Chief Compliance Officer (since 2006) of Nuveen Commodities Asset Management, LLC; Chartered Financial Analyst. | | 216 |
Margo L. Cook 4/11/64 333 W. Wacker Drive Chicago, IL 60606 | | Vice President | | 2009 | | Executive Vice President (since 2008) of Nuveen Investments, Inc. and of Nuveen Fund Advisors, Inc. (since 2011); Managing Director – Investment Services of Nuveen Commodities Asset Management, LLC (since August 2011) previously, Head of Institutional Asset Management (2007-2008) of Bear Stearns Asset Management; Head of Institutional Asset Management (1986-2007) of Bank of NY Mellon; Chartered Financial Analyst. | | 216 |
Trustees and Officers (Unaudited) (continued)
| | | | | | | | |
Name, Birthdate and Address | | Position(s) Held with the Funds | | Year First Elected or Appointed (3) | | Principal Occupation(s) During Past 5 Years | | Number of Portfolios in Fund Complex Overseen by Officer |
Lorna C. Ferguson 10/24/45 333 W. Wacker Drive Chicago, IL 60606 | | Vice President | | 1998 | | Managing Director (since 2005) of Nuveen Fund Advisors, Inc. and Nuveen Securities, LLC (since 2004). | | 216 |
Stephen D. Foy 5/31/54 333 W. Wacker Drive Chicago, IL 60606 | | Vice President and Controller | | 1998 | | Senior Vice President (since 2010), formerly, Vice President (2005-2010) and Funds Controller of Nuveen Securities, LLC; Vice President of Nuveen Fund Advisors, Inc.; Chief Financial Officer of Nuveen Commodities Asset Management, LLC (since 2010); Certified Public Accountant. | | 216 |
Scott S. Grace 8/20/70 333 W. Wacker Drive Chicago, IL 60606 | | Vice President and Treasurer | | 2009 | | Managing Director, Corporate Finance & Development, Treasurer (since 2009) of Nuveen Securities, LLC; Managing Director and Treasurer (since 2009) of Nuveen Fund Advisors, Inc., Nuveen Investments Advisers, Inc., Nuveen Investments Holdings Inc. and (since 2011) Nuveen Asset Management, LLC; Vice President and Treasurer of NWQ Investment Management Company, LLC, Tradewinds Global Investors, LLC, Symphony Asset Management LLC and Winslow Capital Management, LLC.; Vice President of Santa Barbara Asset Management, LLC; formerly, Treasurer (2006-2009), Senior Vice President (2008-2009), previously, Vice President (2006-2008) of Janus Capital Group, Inc.; formerly, Senior Associate in Morgan Stanley’s Global Financial Services Group (2000-2003); Chartered Accountant Designation. | | 216 |
Walter M. Kelly 2/24/70 333 W. Wacker Drive Chicago, IL 60606 | | Chief Compliance Officer and Vice President | | 2003 | | Senior Vice President (since 2008) and Assistant Secretary (since 2003) of Nuveen Fund Advisors, Inc; Senior Vice President (since 2008) of Nuveen Investments Holdings, Inc; formerly, Senior Vice President (2008-2011) of Nuveen Securities, LLC. | | 216 |
Tina M. Lazar 8/27/61 333 W. Wacker Drive Chicago, IL 60606 | | Vice President | | 2002 | | Senior Vice President (since 2010), formerly, Vice President (2005-2010) of Nuveen Fund Advisors, Inc. | | 216 |
Name, Birthdate and Address | | Position(s) Held with the Funds | | Year First Elected or Appointed (3) | | Principal Occupation(s) Including other Directorships During Past 5 Years | | Number of Portfolios in Fund Complex Overseen by Officer |
Kevin J. McCarthy 3/26/66 333 W. Wacker Drive Chicago, IL 60606 | | Vice President and Secretary | | 2007 | | Managing Director and Assistant Secretary (since 2008), formerly, Vice President (2007-2008), Nuveen Securities, LLC; Managing Director (since 2008), Assistant Secretary (since 2007) and Co-General Counsel (since 2011) of Nuveen Fund Advisors, Inc.; Managing Director, Assistant Secretary and Associate General Counsel (since 2011) of Nuveen Asset Management, LLC; Managing Director (since 2008), and Assistant Secretary, Nuveen Investment Holdings, Inc.; Vice President (since 2007) and Assistant Secretary of Nuveen Investments Advisers Inc., NWQ Investment Management Company, LLC, Tradewinds Global Investors LLC, NWQ Holdings, LLC, Symphony Asset Management LLC, Santa Barbara Asset Management, LLC, and of Winslow Capital Management, LLC. (since 2010); Vice President and Secretary (since 2010) of Nuveen Commodities Asset Management, LLC; prior thereto, Partner, Bell, Boyd & Lloyd LLP (1997-2007). | | 216 |
Kathleen L. Prudhomme 3/30/53 901 Marquette Avenue Minneapolis, MN 55402 | | Vice President and Assistant Secretary | | 2011 | | Managing Director, Assistant Secretary and Co-General Counsel (since 2011) of Nuveen Fund Advisors, Inc.; Managing Director, Assistant Secretary and Associate General Counsel (since 2011) of Nuveen Asset Management, LLC; Managing Director and Assistant Secretary (since 2011) of Nuveen Securities, LLC; formerly, Deputy General Counsel, FAF Advisors, Inc. (2004-2010). | | 216 |
| | | | | | | | |
Name, Birthdate and Address | | Position(s) Held with the Funds | | Year First Elected or Appointed (3) | | Principal Occupation(s) Including other Directorships During Past 5 Years | | Number of Portfolios in Fund Complex Overseen by Officer |
Jeffery M. Wilson 3/13/56 333 West Wacker Drive Chicago, IL 60606 | | Vice President | | 2011 | | Senior Vice President of Nuveen Securities, LLC (since 2011); formerly, Senior Vice President of FAF Advisors, Inc. (2000-2010). | | 99 |
| (1) | Trustees serve an indefinite term until his/her successor is elected or appointed. The year first elected or appointed represents the year in which the trustee was first elected or appointed to any fund in the Nuveen Fund Complex. |
| (2) | Mr. Amboian is an interested trustee because of his position with Nuveen Investments, Inc. and certain of its subsidiaries, which are affiliates of the Nuveen Funds. |
| (3) | Officers serve one year terms through August of each year. The year first elected or appointed represents the year in which the officer was first elected or appointed to any fund in the Nuveen Fund Complex. |
Annual Investment Management Agreement Approval Process
(Unaudited)
The Board of Trustees (each, a “Board” and each Trustee, a “Board Member”) of the Funds, including the Board Members who are not parties to the Funds’ advisory or sub-advisory agreements or “interested persons” of any such parties (the “Independent Board Members”), is responsible for approving the advisory agreements (each, an “Investment Management Agreement”) between each Fund and Nuveen Fund Advisors, Inc. (the “Advisor”) and the sub-advisory agreements (each, a “Sub-Advisory Agreement”) between the Advisor and Symphony Asset Management LLC (the “Sub-Advisor”) (the Investment Management Agreements and the Sub-Advisory Agreements are referred to collectively as the “Advisory Agreements”) and their periodic continuation. Pursuant to the Investment Company Act of 1940, as amended (the “1940 Act”), the Board is required to consider the continuation of the Advisory Agreements on an annual basis. Accordingly, at an in-person meeting held on May 21-23, 2012 (the “May Meeting”), the Board, including a majority of the Independent Board Members, considered and approved the continuation of the Advisory Agreements for the Funds for an additional one-year period.
In preparation for its considerations at the May Meeting, the Board requested and received extensive materials prepared in connection with the review of the Advisory Agreements. The materials provided a broad range of information regarding the Funds, the Advisor and the Sub-Advisor (the Advisor and the Sub-Advisor are collectively, the “Fund Advisers” and each, a “Fund Adviser”). As described in more detail below, the information provided included, among other things, a review of Fund performance, including Fund investment performance assessments against peer groups and appropriate benchmarks, a comparison of Fund fees and expenses relative to peers, a description and assessment of shareholder service levels for the Funds, a summary of the performance of certain service providers, a review of product initiatives and shareholder communications and an analysis of the Advisor’s profitability with comparisons to comparable peers in the managed fund business. As part of its annual review, the Board also held a separate meeting on April 18-19, 2012, to review the Funds’ investment performance and consider an analysis provided by the Advisor of the Sub-Advisor which generally evaluated the Sub-Advisor’s investment team, investment mandate, organizational structure and history, investment philosophy and process, performance of the applicable Fund, and significant changes to the foregoing. As a result of its review of the materials and discussions, the Board presented the Advisor with questions and the Advisor responded.
The materials and information prepared in connection with the annual review of the Advisory Agreements supplement the information and analysis provided to the Board during the year. In this regard, throughout the year, the Board, acting directly or through its committees, regularly reviews the performance and various services provided by the Advisor and the Sub-Advisor. The Board meets at least quarterly as well as at other times as the need arises. At its quarterly meetings, the Board reviews reports by the Advisor which include, among other things, Fund performance, a review of the investment teams and reports on compliance, regulatory matters and risk management. The Board also meets with key investment personnel managing the Fund portfolios during the year. In October 2011, the Board also created two new standing committees (the Open-end Fund Committee and the Closed-end Fund Committee) to assist the full Board in monitoring and gaining a deeper insight into the distinctive issues and business practices of open-end and closed-end funds.
In addition, the Board continues its program of seeking to have the Board Members or a subset thereof visit each sub-advisor to the Nuveen funds at least once over a multiple year rotation, meeting with key investment and business personnel. In this regard, the Independent Board Members attended a presentation by the Sub-Advisor in February 2011. Further, an ad hoc committee of the Board visited the then-current transfer agents of the Nuveen funds in 2011 and the audit committee of the Board visited the various pricing agents for the Nuveen funds in January 2012.
The Board considers factors and information that are relevant to its annual consideration of the renewal of the Advisory Agreements at the meetings held throughout the year. Accordingly, the Board considers the information provided and knowledge gained at these meetings when performing its annual review of the Advisory Agreements. The Independent Board Members are assisted throughout the process by independent legal counsel who provided materials describing applicable law and the duties of directors or trustees in reviewing advisory contracts and met with the Independent Board Members in executive sessions without management present. In addition, it is important to recognize that the management arrangements for the Nuveen funds are the result of many years of review and discussion between the Independent Board Members and fund management and that the Board Members’ conclusions may be based, in part, on their consideration of fee arrangements and other factors developed in previous years.
The Board considered all factors it believed relevant with respect to each Fund, including among other factors: (a) the nature, extent and quality of the services provided by the Fund Advisers, (b) the investment performance of the Fund and Fund Advisers, (c) the advisory fees and costs of the services to be provided to the Fund and the profitability of the Fund Advisers, (d) the extent of any economies of scale, (e) any benefits derived by the Fund Advisers from the relationship with the Fund and (f) other factors. Each Board Member may have accorded different weight to the various factors in reaching his or her conclusions with respect to a Fund’s Advisory Agreements. The Independent Board Members did not identify any single factor as all important or controlling. The Independent Board Members’ considerations were instead based on a comprehensive consideration of all the information presented. The principal factors considered by the Board and its conclusions are described below.
A. Nature, Extent and Quality of Services
In considering renewal of the Advisory Agreements, the Independent Board Members considered the nature, extent and quality of the Fund Adviser’s services, including advisory services and the resulting Fund performance and administrative services. The Independent Board Members further considered the overall reputation and capabilities of the Advisor and its affiliates, the commitment of the
Advisor to provide high quality service to the Funds, their overall confidence in the Advisor’s integrity and the Advisor’s responsiveness to questions and concerns raised by them. The Independent Board Members reviewed materials outlining, among other things, the Fund Adviser’s organization and business; the types of services that the Fund Adviser or its affiliates provide to the Funds; the performance record of the applicable Fund (as described in further detail below); and any initiatives Nuveen had taken for the applicable fund product line.
In considering advisory services, the Board recognized that the Advisor provides various oversight, administrative, compliance and other services for the Funds and the Sub-Advisor generally provides the portfolio investment management services to the Funds. In reviewing the portfolio management services provided to each Fund, the Board reviewed the materials provided by the Nuveen Investment Services Oversight Team analyzing, among other things, the Sub-Advisor’s investment team and changes thereto, organization and history, assets under management, Fund objectives and mandate, the investment team’s philosophy and strategies in managing the Fund, developments affecting the Sub-Advisor or Fund and Fund performance. The Independent Board Members also reviewed portfolio manager compensation arrangements to evaluate each Fund Adviser’s ability to attract and retain high quality investment personnel, preserve stability, and reward performance but not provide an inappropriate incentive to take undue risks. In addition, the Board considered the Advisor’s execution of its oversight responsibilities over the Sub-Advisor. Given the importance of compliance, the Independent Board Members also considered Nuveen’s compliance program, including the report of the chief compliance officer regarding the Funds’ compliance policies and procedures; the resources dedicated to compliance; and the record of compliance with the policies and procedures.
In addition to advisory services, the Board considered the quality and extent of administrative and other non-investment advisory services the Advisor and its affiliates provide to the Funds, including product management, investment services (such as oversight of investment policies and procedures, risk management, and pricing), fund administration, oversight of service providers, shareholder services and communications, administration of Board relations, regulatory and portfolio compliance and legal support. The Board further recognized Nuveen’s additional investments in personnel, including in compliance and risk management. In reviewing the services provided, the Board also reviewed materials describing various notable initiatives and projects the Advisor performed in connection with the open-end fund product line. These initiatives included efforts to eliminate product overlap through mergers or liquidations; commencement of various new funds; elimination of insurance mandates for various funds; updates in investment policies or guidelines for several funds; and reductions in management fees and expense caps for certain funds.
Based on their review, the Independent Board Members found that, overall, the nature, extent and quality of services provided to the respective Funds under each applicable Advisory Agreement were satisfactory.
B. The Investment Performance of the Funds and Fund Advisers
The Board, including the Independent Board Members, reviewed and considered the performance history of each Fund over various time periods. The Board reviewed, among other things, each Fund’s historic investment performance as well as information comparing the Fund’s performance information with that of other funds (the “Performance Peer Group”) based on data compiled by Nuveen that was provided by an independent provider of mutual fund data and with recognized and/or customized benchmarks (i.e., benchmarks derived from multiple recognized benchmarks).
The Board reviewed reports, including a comprehensive analysis of the Funds’ performance and the applicable investment team. In this regard, the Board reviewed each Fund’s total return information compared to the returns of its Performance Peer Group and recognized and/or customized benchmarks for the quarter, one-, three- and five-year periods ending December 31, 2011, as well as performance information reflecting the first quarter of 2012 (or for the periods available for the Nuveen Symphony International Equity Fund (the “International Equity Fund”) and the Nuveen Symphony Optimized Alpha Fund (the “Optimized Alpha Fund”), which did not exist for part of the foregoing time frame).
In reviewing performance comparison information, the Independent Board Members recognized that the usefulness of the comparisons of the performance of certain funds with the performance of their respective Performance Peer Group may be limited because the Performance Peer Group may not adequately represent the objectives and strategies of the applicable funds or may be limited in size or number. The Independent Board Members also noted that the investment experience of a particular shareholder in the Nuveen funds will vary depending on when such shareholder invests in the applicable fund, the class held (if multiple classes are offered in a fund) and the performance of the fund (or respective class) during that shareholder’s investment period. In addition, although the performance below reflects the performance results for the time periods ending as of the most recent calendar year end (unless otherwise indicated), the Board also recognized that selecting a different ending time period may derive different results. Furthermore, while the Board is cognizant of the relevant performance of a fund’s peer set and/or benchmark(s), the Board evaluated fund performance in light of the respective fund’s investment objectives, investment parameters and guidelines and recognized that the objectives, investment parameters and guidelines of peers and/or benchmarks may differ to some extent, thereby resulting in differences in performance results. Nevertheless, with respect to any Nuveen funds that the Board considers to have underperformed their peers and/or benchmarks from time to time, the Board monitors such funds closely and considers any steps necessary or appropriate to address such issues.
In considering the results of the comparisons for the Funds, the Independent Board Members observed, among other things, that the Optimized Alpha Fund and the Nuveen Symphony Large-Cap Growth Fund had demonstrated generally favorable performance in
Annual Investment Management Agreement Approval Process
(Unaudited) (continued)
comparison to peers, performing in the first quartile over various periods. In addition, the Independent Board Members noted that the Nuveen Symphony Mid-Cap Core Fund had lagged its peers somewhat in the short-term one-year period, but demonstrated more favorable performance in the longer three- and five-year periods, whereas the International Equity Fund lagged its peers somewhat in the three-year period but performed in the first quartile in the one-year period.
Based on their review, the Independent Board Members determined that each Fund’s investment performance had been satisfactory.
C. Fees, Expenses and Profitability
1. Fees and Expenses
The Board evaluated the management fees and expenses of each Fund reviewing, among other things, such Fund’s gross management fees, net management fees and net expense ratios in absolute terms as well as compared to the fee and expenses of a comparable universe of funds provided by an independent fund data provider (the “Peer Universe”) and to a more focused subset of funds in the Peer Universe (the “Peer Group”) and any expense limitations.
The Independent Board Members further reviewed the methodology regarding the construction of the applicable Peer Universe and Peer Group. In reviewing the comparisons of fee and expense information, the Independent Board Members took into account that in certain instances various factors such as: the limited size and particular composition of the Peer Universe or Peer Group (including the inclusion of other Nuveen funds in the peer set); expense anomalies; changes in the funds comprising the Peer Universe or Peer Group from year to year; levels of reimbursement or fee waivers; and the timing of information used may impact the comparative data, thereby limiting somewhat the ability to make a meaningful comparison with peers.
In reviewing the fee schedule for a Fund, the Independent Board Members also considered the fund-level and complex-wide breakpoint schedules (described in further detail below) and any fee waivers and reimbursements provided by Nuveen. In reviewing fees and expenses, the Board considered the expenses and fees to be higher if they were over 10 basis points higher, slightly higher if they were approximately 6 to 10 basis points higher, in line if they were within approximately 5 basis points higher than the peer average and below if they were below the peer average of the Peer Group. In reviewing the reports, the Board noted that the overwhelming majority of the Nuveen funds were at, close to or below their Peer Group or Peer Universe (if no separate Peer Group) average based on the net total expense ratio.
The Independent Board Members observed that the Funds had net management fees and net expense ratios (including fee waivers and expense reimbursements, if any) below their respective peer averages.
Based on their review of the fee and expense information provided, the Independent Board Members determined that each Fund’s management fees were reasonable in light of the nature, extent and quality of services provided to the Fund.
2. Comparisons with the Fees of Other Clients
The Independent Board Members further reviewed information regarding the nature of services and range of fees offered by the Advisor to other clients, including separately managed accounts (both retail and institutional accounts), collective trusts, foreign investment funds offered by Nuveen and funds that are not offered by Nuveen but are sub-advised by one of Nuveen’s investment management teams. In evaluating the comparisons of fees, the Independent Board Members noted that the fee rates charged to the Funds and other clients vary, among other things, because of the different services involved and the additional regulatory and compliance requirements associated with registered investment companies, such as the Funds. Accordingly, the Independent Board Members considered the differences in the product types, including, but not limited to, the services provided, the structure and operations, product distribution and costs thereof, portfolio investment policies, investor profiles, account sizes and regulatory requirements. The Independent Board Members noted, in particular, that the range of services provided to the Funds (as discussed above) is much more extensive than that provided to separately managed accounts. Given the inherent differences in the various products, particularly the extensive services provided to the Funds, the Independent Board Members believe such facts justify the different levels of fees.
In considering the fees of the Sub-Advisor, the Independent Board Members also considered the pricing schedule or fees that the Sub-Advisor charges for similar investment management services for other Nuveen funds, funds of other sponsors (if any), and other clients (such as retail and/or institutional managed accounts), as applicable. The Independent Board Members also reviewed the fees that the Sub-Advisor assesses for equity and taxable fixed-income hedge funds it manages, which include a performance fee.
3. Profitability of Fund Advisers
In conjunction with their review of fees, the Independent Board Members also considered the profitability of Nuveen for its advisory activities and its financial condition. The Independent Board Members reviewed the revenues and expenses of Nuveen’s advisory activities for the last two calendar years, the allocation methodology used in preparing the profitability data and an analysis of the key drivers behind the changes in revenues and expenses that impacted profitability in 2011. The Independent Board Members noted this information supplemented the profitability information requested and received during the year to help keep them apprised of developments affecting profitability (such as changes in fee waivers and expense reimbursement
commitments). In this regard, the Independent Board Members noted that they have an Independent Board Member serve as a point person to review and keep them apprised of changes to the profitability analysis and/or methodologies during the year. The Independent Board Members also considered Nuveen’s revenues for advisory activities, expenses, and profit margin compared to that of various unaffiliated management firms with comparable assets under management (based on asset size and asset composition).
In reviewing profitability, the Independent Board Members recognized the Advisor’s continued investment in its business to enhance its services, including capital improvements to investment technology, updated compliance systems, and additional personnel in compliance, risk management, and product development as well as its ability to allocate resources to various areas of the Advisor as the need arises. In addition, in evaluating profitability, the Independent Board Members also recognized the subjective nature of determining profitability which may be affected by numerous factors including the allocation of expenses. Further, the Independent Board Members recognized the difficulties in making comparisons as the profitability of other advisers generally is not publicly available and the profitability information that is available for certain advisers or management firms may not be representative of the industry and may be affected by, among other things, the adviser’s particular business mix, capital costs, types of funds managed and expense allocations. Notwithstanding the foregoing, the Independent Board Members reviewed Nuveen’s methodology and assumptions for allocating expenses across product lines to determine profitability. In reviewing profitability, the Independent Board Members recognized Nuveen’s investment in its fund business. Based on their review, the Independent Board Members concluded that the Advisor’s level of profitability for its advisory activities was reasonable in light of the services provided.
With respect to sub-advisers affiliated with Nuveen, including the Sub-Advisor, the Independent Board Members reviewed the sub-adviser’s revenues, expenses and profitability margins (pre- and post-tax) for its advisory activities and the methodology used for allocating expenses among the internal sub-advisers. Based on their review, the Independent Board Members were satisfied that the Sub-Advisor’s level of profitability was reasonable in light of the services provided.
In evaluating the reasonableness of the compensation, the Independent Board Members also considered other amounts paid to a Fund Adviser by the Funds as well as any indirect benefits (such as soft dollar arrangements, if any) the Fund Adviser and its affiliates receive, or are expected to receive, that are directly attributable to the management of the Funds, if any. See Section E below for additional information on indirect benefits a Fund Adviser may receive as a result of its relationship with the Funds. Based on their review of the overall fee arrangements of each Fund, the Independent Board Members determined that the advisory fees and expenses of the respective Fund were reasonable.
D. Economies of Scale and Whether Fee Levels Reflect These Economies of Scale
With respect to economies of scale, the Independent Board Members have recognized the potential benefits resulting from the costs of a fund being spread over a larger asset base, although economies of scale are difficult to measure and predict with precision, particularly on a fund-by-fund basis. One method to help ensure the shareholders share in these benefits is to include breakpoints in the advisory fee schedule. Generally, management fees for funds in the Nuveen complex are comprised of a fund-level component and a complex-level component, subject to certain exceptions. Accordingly, the Independent Board Members reviewed and considered the applicable fund-level breakpoints in the advisory fee schedules that reduce advisory fees as asset levels increase.
In addition to fund-level advisory fee breakpoints, the Board also considered the Funds’ complex-wide fee arrangement. Pursuant to the complex-wide fee arrangement, the fees of the funds in the Nuveen complex are generally reduced as the assets in the fund complex reach certain levels. The complex-wide fee arrangement seeks to provide the benefits of economies of scale to fund shareholders when total fund complex assets increase, even if assets of a particular fund are unchanged or have decreased. The approach reflects the notion that some of Nuveen’s costs are attributable to services provided to all its funds in the complex and therefore all funds benefit if these costs are spread over a larger asset base. In addition, with the acquisition of the funds previously advised by FAF Advisors, Inc., the Board noted that a portion of such funds’ assets at the time of acquisition were deemed eligible to be included in the complex-wide fee calculation in order to deliver fee savings to shareholders in the combined complex and such funds were subject to differing complex-level fee rates.
Based on their review, the Independent Board Members concluded that the breakpoint schedules and complex-wide fee arrangement were acceptable and reflect economies of scale to be shared with shareholders when assets under management increase.
E. Indirect Benefits
In evaluating fees, the Independent Board Members received and considered information regarding potential “fall out” or ancillary benefits the respective Fund Adviser or its affiliates may receive as a result of its relationship with each Fund. In this regard, the Independent Board Members considered, among other things, any sales charges, distribution fees and shareholder services fees received and retained by the Funds’ principal underwriter, an affiliate of the Advisor, which includes fees received pursuant to any 12b-1 plan. The Independent Board Members, therefore, considered the 12b-1 fees retained by Nuveen during the last calendar year.
In addition to the above, the Independent Board Members considered whether the Fund Advisers received any benefits from soft dollar arrangements whereby a portion of the commissions paid by a Fund for brokerage may be used to acquire research that may be useful to the Fund Adviser in managing the assets of the Funds and other clients. The Independent Board Members recognized that
Annual Investment Management Agreement Approval Process
(Unaudited) (continued)
the Advisor has the authority to pay a higher commission in return for brokerage and research services if it determines in good faith that the commission paid is reasonable in relation to the value of the brokerage and research services provided and may benefit from such soft dollar arrangements. Similarly, the Board recognized that the research received pursuant to soft dollar arrangements by the Advisor may also benefit a Fund and shareholders to the extent the research enhances the ability of the Advisor to manage the Fund. The Independent Board Members noted that the Advisor’s profitability may be somewhat lower if it did not receive the research services pursuant to the soft dollar arrangements and had to acquire such services directly. In addition, the Board considered that the Sub-Advisor currently does not enter into soft dollar arrangements; however, it has adopted a soft dollar policy in the event it does so in the future.
Based on their review, the Independent Board Members concluded that any indirect benefits received by a Fund Adviser as a result of its relationship with the Funds were reasonable and within acceptable parameters.
F. Other Considerations
The Independent Board Members did not identify any single factor discussed previously as all-important or controlling. The Board Members, including the Independent Board Members, unanimously concluded that the terms of each Advisory Agreement are fair and reasonable, that the respective Fund Adviser’s fees are reasonable in light of the services provided to each Fund and that the Advisory Agreements be renewed.
Notes
Glossary of Terms Used in this Report
Average Annual Total Return: This is a commonly used method to express an investment’s performance over a particular, usually multi-year time period. It expresses the return that would have been necessary each year to equal the investment’s actual cumulative performance (including change in NAV or offer price and reinvested dividends and capital gains distributions, if any) over the time period being considered.
Gross Domestic Product (GDP): The total market value of all final goods and services produced in a country/region in a given year, equal to total consumer, investment and government spending, plus the value of exports, minus the value of imports.
Lipper International Multi-Cap Growth Funds Classification Average: Represents the average annualized total return for all reporting funds in the Lipper International Multi-Cap Growth Funds classification. Lipper returns account for the effects of management fees and assume reinvestment of distributions, but do not reflect any applicable sales charges.
Lipper Large-Cap Core Funds Classification Average: Represents the average annualized total return for all reporting funds in the Lipper Large-Cap Core Funds classification. Lipper returns account for the effects of management fees and assume reinvestment of distributions, but do not reflect any applicable sales charges.
Lipper Mid-Cap Core Funds Classification Average: Represents the average annualized total return for all reporting funds in the Lipper Mid-Cap Core Funds classification. Lipper returns account for the effects of management fees and assume reinvestment of distributions, but do not reflect any applicable sales charges.
Lipper Multi-Cap Growth Funds Classification Average: Represents the average annualized total return for all reporting funds in the Lipper Multi-Cap Growth Funds Classification. Lipper returns account for the effects of management fees and assume reinvestment of distributions, but do not reflect any applicable sales charge.
MSCI EAFE Index: The MSCI (Morgan Stanley Capital International) EAFE (Europe, Australasia, Far East) Index is a free float-adjusted market capitalization weighted index designed to measure developed market equity performance, excluding the U.S. and Canada. Index returns assume reinvestment of distributions, but do not reflect any applicable sales charges or management fees.
Net Asset Value (NAV): The net market value of all securities held in a portfolio.
Net Asset Value (NAV) Per Share: The market value of one share of a mutual fund or closed-end fund. For a Fund, the NAV is calculated daily by taking the Fund’s total assets (securities, cash, and accrued earnings), subtracting the Fund’s liabilities, and dividing by the number of shares outstanding.
Russell 1000® Growth Index: An index that measures the performance of those Russell 1000 companies with higher price-to-book ratios and higher forecasted growth values. Index returns assume reinvestment of distributions, but do not reflect any applicable sales charges or management fees.
Russell MidCap® Index: An index constructed to provide a comprehensive and unbiased barometer for the mid-cap segment of the equity market which includes the smallest 800 securities within the Russell 1000 Index. Index returns assume reinvestment of distributions, but do not reflect any applicable sales charges or management fees.
S&P 500® Index: An unmanaged index generally considered representative of the U.S. stock market. Index returns assume reinvestment of distributions, but do not reflect any applicable sales charges or management fees.
Additional Fund Information
Fund Manager
Nuveen Fund Advisors, Inc.
333 West Wacker Drive
Chicago, IL 60606
Sub-Adviser
Symphony Asset Management LLC
555 California Street
Rene Suite 2975
San Francisco, CA 94104
Legal Counsel
Chapman and Cutler LLP
Chicago, IL
Independent Registered Public Accounting Firm
PricewaterhouseCoopers LLP
Chicago, IL
Custodian
State Street Bank & Trust Company
Boston, MA
Transfer Agent and Shareholder Services
Boston Financial
Data Services, Inc.
Nuveen Investor Services
P.O. Box 8530
Boston, MA 02266-8530
(800) 257-8787
Distribution Information: The following Funds hereby designate their percentages of dividends paid from net ordinary income as dividends qualifying for the 70% dividends received deduction (“DRD”) for corporations and their percentages as qualified dividend income (“QDI”) for individuals under Section 1(h)(11) of the Internal Revenue Code as shown in the accompanying table. The actual qualified dividend income distributions will be reported to shareholders on Form 1099-DIV which will be sent to shareholders shortly after calendar year end.
| | | | | | | | |
| Fund | | % of DRD | | | % of QDI | |
Nuveen Symphony Large-Cap Growth Fund | | | 100.00 | % | | | 100.00 | % |
Nuveen Symphony International Equity Fund | | | 0.00 | �� | | | 100.00 | |
Nuveen Symphony Optimized Alpha Fund | | | 100.00 | | | | 100.00 | |
Quarterly Portfolio of Investments and Proxy Voting Information: You may obtain (i) each Fund’s quarterly portfolio of investments, (ii) information regarding how the Funds voted proxies relating to portfolio securities held during the most recent twelve-month period ended June 30, and (iii) a description of the policies and procedures that the Funds used to determine how to vote proxies relating to portfolio securities without charge, upon request, by calling Nuveen Investments at (800) 257-8787 or on Nuveen’s website at www.nuveen.com.
You may also obtain this and other Fund information directly from the Securities and Exchange Commission (SEC). The SEC may charge a copying fee for this information. Visit the SEC on-line at http://www.sec.gov or in person at the SEC’s Public Reference Room in Washington, D.C. Call the SEC at (202) 942-8090 for room hours and operation. You may also request Fund information by sending an e-mail request to publicinfo@sec.gov or by writing to the SEC’s Public Reference Section at 100 F Street NE, Washington, D.C. 20549.
The Financial Industry Regulatory Authority (FINRA) provides a Public Disclosure Program which supplies certain information regarding the disciplinary history of FINRA members and their associated persons in response to either telephone inquiries at (800) 289-9999 or written inquiries at www.finra.org. FINRA also provides an investor brochure that includes information describing the Public Disclosure Program.
Nuveen Investments:
Serving Investors for Generations
Since 1898, financial advisors and their clients have relied on Nuveen Investments to provide dependable investment solutions through continued adherence to proven, long-term investing principles. Today, we offer a range of high quality equity and fixed-income solutions designed to be integral components of a well-diversified core portfolio.
Focused on meeting investor needs.
Nuveen Investments provides high-quality investment services designed to help secure the longterm goals of institutional and individual investors as well as the consultants and financial advisors who serve them. Nuveen Investments markets a wide range of specialized investment solutions which provide investors access to capabilities of its high-quality boutique investment affiliates-Nuveen Asset Management, Symphony Asset Management, NWQ Investment Management Company, Santa Barbara Asset Management, Tradewinds Global Investors, Winslow Capital Management, and Gresham Investment Management. In total, Nuveen Investments managed approximately $220 billion as of September 30, 2012.
Find out how we can help you.
To learn more about how the products and services of Nuveen Investments may be able to help you meet your financial goals, talk to your financial advisor, or call us at (800) 257-8787. Please read the information provided carefully before you invest. Investors should consider the investment objective and policies, risk considerations, charges and expenses of any investment carefully. Where applicable, be sure to obtain a prospectus, which contains this and other relevant information. To obtain a prospectus, please contact your securities representative or Nuveen Investments, 333 W. Wacker Dr., Chicago, IL 60606. Please read the prospectus carefully before you invest or send money.
Learn more about Nuveen Funds at: www.nuveen.com/mf
| | |
Distributed by Nuveen Securities, LLC 333 West Wacker Drive Chicago, IL 60606 www.nuveen.com | | |
MAN-SYMPH-0912P
Mutual Funds
Nuveen Equity Funds
For investors seeking the potential for long-term capital appreciation.
Annual Report
October 31, 2012
| | | | | | | | | | |
| | | Share Class / Ticker Symbol |
| | | | | |
| Fund Name | | Class A | | Class B | | Class C | | Class R3 | | Class I |
Nuveen Large Cap Select Fund | | FLRAX | | — | | FLYCX | | FLSSX | | FLRYX |
Nuveen Mid Cap Select Fund | | FATAX | | — | | FTACX | | — | | FATCX |
Nuveen Small Cap Select Fund | | EMGRX | | ARSBX | | FHMCX | | ASEIX | | ARSTX |
LIFE IS COMPLEX.
Nuveen makes things e-simple.
It only takes a minute to sign up for e-Reports. Once enrolled, you’ll receive an e-mail as soon as your Nuveen Fund information is ready. No more waiting for delivery by regular mail. Just click on the link within the e-mail to see the report and save it on your computer if you wish.
Free e-Reports right to your e-mail!
www.investordelivery.com
If you receive your Nuveen Fund distributions and statements from your financial advisor or brokerage account.
OR
www.nuveen.com/accountaccess
If you receive your Nuveen Fund distributions and statements directly from Nuveen.
| | | | | | |
| Must be preceded by or accompanied by a prospectus. | | NOT FDIC INSURED | | MAY LOSE VALUE | | NO BANK GUARANTEE |
Table of Contents
Chairman’s
Letter to Shareholders
Dear Shareholders,
Investors have many reasons to remain cautious. The challenges in the Euro area continue to cast a shadow over global economies and financial markets. The political support for addressing fiscal issues is eroding as the economic and social impacts become more visible. Despite strong action by the European Central Bank, member nations appear unwilling to surrender sufficient sovereignty to unify the Euro area financial system or strengthen its banks. The gains made in reducing deficits, and the hard-won progress on winning popular acceptance of the need for economic austerity, are at risk. To their credit, European political leaders press on to find compromise solutions, but there is increasing concern that time is running out.
In the U.S., the extended period of increasing corporate earnings that enabled the equity markets to withstand the downward pressures coming from weakening job creation and slower economic growth appears to be coming to an end. The Fed remains committed to low interest rates and announced a third phase of quantitative easing (QE3) scheduled to continue until mid-2015. The recent election results have removed a major element of uncertainty in the U.S. political picture, but it remains to be seen whether the outcome will reduce the highly partisan atmosphere in Congress and enable progress on the many pressing fiscal and budgetary issues that must be resolved in the coming months.
During the last twelve months, U.S. investors have experienced a solid recovery in the domestic equity markets with increasing volatility as the “fiscal cliff” approaches. The experienced investment teams at Nuveen keep their eye on a longer time horizon and use their practiced investment disciplines to negotiate through market peaks and valleys to achieve long-term goals for investors. Experienced professionals pursue investments that will weather short-term volatility and at the same time, seek opportunities that are created by markets that overreact to negative developments. Monitoring this process is an important consideration for the Fund Board as it oversees your Nuveen Fund on your behalf.
As always, I encourage you to contact your financial consultant if you have any questions about your investment in a Nuveen Fund. On behalf of the other members of your Fund Board, we look forward to continuing to earn your trust in the months and years ahead.
Sincerely,
Robert P. Bremner
Chairman of the Board
December 20, 2012
Portfolio Managers’ Comments
Certain statements in this report are forward-looking statements. Discussions of specific investments are for illustration only and are not intended as recommendations of individual investments. The forward-looking statements and other views expressed herein are those of the portfolio managers as of the date of this report. Actual future results or occurrences may differ significantly from those anticipated in any forward-looking statements and the views expressed herein are subject to change at any time, due to numerous market and other factors. The Funds disclaim any obligation to update publicly or revise any forward-looking statements or views expressed herein.
These Funds feature portfolio management by Nuveen Asset Management, LLC, an affiliate of Nuveen Investments.
David Chalupnik, CFA, and Tony Burger, CFA, are the portfolio managers for the Nuveen Large Cap Select Fund. David, who has 28 years of investment experience, assumed portfolio management responsibilities in 2003. Tony has 18 years of investment experience, and joined the management team for the Fund in 2004.
Tony and Scott Tonneson, CFA, are the portfolio managers for the Nuveen Mid Cap Select Fund. Tony assumed portfolio management responsibilities in 2005. Scott, who has 18 years of investment experience, joined the management team for the Fund in 2012.
Allen Steinkopf, CFA, and Mark Traster, CFA, are the portfolio managers for the Nuveen Small Cap Select Fund. Allen, who has 19 years of investment experience, assumed portfolio management responsibilities in 2004. Mark, with 20 years of investment experience, joined the management team for the Fund in 2008.
On the following pages, the portfolio management teams for the Funds examine economic and equity market conditions, key investment strategies and the Funds’ performance for the twelve-month period ended October 31, 2012.
What factors affected the U.S. economy and the equity market environments during the twelve-month reporting period ended October 31, 2012?
During this period, the U.S. economy’s progress toward recovery from recession continued at a moderate pace. In the third quarter 2012, the U.S. economy, as measured by the U.S. gross domestic product (GDP), grew at an annualized rate of 2.7%, up from 1.3% in the second quarter, marking 13 consecutive quarters of positive growth. The Consumer Price Index (CPI) rose 2.2% year-over-year as of October 2012, while the core CPI (which excludes food and energy) increased 2.0% during the period, staying just within the Fed’s unofficial objective of 2.0% or lower for this inflation measure. As of November 2012, (subsequent to this reporting period), the national unemployment rate was 7.7%, the lowest unemployment rate since December 2008 and below the 8.7% level recorded in November 2011. The slight decrease in unemployment rate from 7.9% in October 2012 was primarily due to workers who are no longer counted as part of the workforce. The housing market, long a major weak spot in the economic recovery, showed signs of a turnaround as existing home sales and residential construction indicators improved and home prices rose modestly. According to the S&P/Case-Shiller Index of 20 major metropolitan areas, the average home price rose 3.0% for the twelve months ended September 2012 (the most recent data available at the time this report was prepared). This
marked the largest annual percentage gain for the index since July 2010, although housing prices continued to be off approximately 30% from their mid-2006 peak.
The Federal Reserve (Fed) maintained its efforts to improve the overall economic environment by continuing to hold the benchmark fed funds rate at the record low level of zero to 0.25% set in December 2008. Subsequent to the reporting period, the central bank decided during its December 2012 meeting to keep the fed funds rate at “exceptionally low levels” until either the unemployment rate reaches 6.5% or expected inflation goes above 2.5%. The Fed also affirmed its decision, announced in September 2012, to purchase $40 billion of mortgage-backed securities each month in an effort to stimulate the housing market. In addition to this new, open-ended stimulus program, the Fed plans to continue its program to extend the average maturity of its holdings of U.S. Treasury securities through the end of December 2012. The goals of these actions, which together will increase the Fed’s holdings of longer term securities by approximately $85 billion a month through the end of the year, are to put downward pressure on longer term interest rates, make broader financial conditions more accommodative and support a stronger economic recovery as well as continued progress toward the Fed’s mandates of maximum employment and price stability. However, the outlook for the U.S. economy remained clouded by uncertainty regarding the impending “fiscal cliff”, the combination of tax increases and spending cuts scheduled to take effect beginning in January 2013, and the potential impact on the economy.
Domestic and international equity markets were buffeted by concerns about the tepid U.S. economic recovery, the seemingly unending European debt crisis and a broader slowdown in global growth, particularly in China. In addition to the bold monetary policy moves made by the Fed, the European Central Bank (ECB) pledged to do “whatever it takes” to preserve the euro. The ECB unveiled the Outright Monetary Transactions plan, a conditional yet unlimited bond purchase program designed to ensure that financing is available to European governments who are willing to agree to certain fiscal and structural measures.
As these combined actions helped reduce fears, U.S. and overseas equity markets surprised many investors by rallying steadily later in the period. Broad U.S. stock market indexes approached their all-time highs, posting strong double-digit returns for the period as a whole. Large-cap U.S. stocks led the market with a 15.21% one-year return as of October 31, 2012, as measured by the S&P 500® Index, reaching a level not seen since May of 2008. Domestic small- and mid-cap stocks also produced strong returns of 12.08% and 12.15% during the fiscal year period, as measured by the Russell 2000® and the Russell Midcap® Indexes, respectively. Across all market cap segments, the best-performing areas of the U.S. equity market during the year included the health care, financial and consumer discretionary sectors. Energy was the biggest laggard across the board, while technology stocks also underperformed, particularly in the smaller capitalization ranges. Meanwhile, the steps taken in Europe to reduce financial risk helped overseas markets recover some of their losses from the summer months. Developed markets fared better than emerging markets, posting a 12-month return of 5.15% according to the MSCI EAFE Index, which tracks the performance of stocks from markets in Europe, Australasia and the Far East. Emerging markets never fully recovered after their dramatic sell-off in 2011, ending the fiscal year period with a 2.63% return, as measured by the MSCI Emerging Markets Index.
Nuveen Large Cap Select Fund
How did the Fund perform during the twelve-month period ended October 31, 2012?
The tables in the Fund Performance and Expense Ratios section of this report provide Class A Share total returns for the Fund for the one-year, five-year and since inception periods ended October 31, 2012. The Fund’s Class A Shares at net asset value (NAV) outperformed the Lipper classification average, but underperformed the S&P 500® Index during the twelve-month period.
What strategies were used to manage the Fund during the reporting period? How did these strategies influence performance?
The Fund pursues a long-term capital appreciation strategy by investing primarily in the common stocks of companies that have market capitalizations of $5 billion or greater at the time of purchase. During the reporting period, we continued to utilize our deep, rigorous research approach to find and invest in stocks that we believed had strong and/or improving fundamentals, attractive valuations and a catalyst for future positive relative price performance. We also continued to shift the portfolio to areas of the market that our research suggested were particularly attractive. Throughout most of this time frame, the portfolio emphasized domestic cyclical stocks and sectors that appeared to have solid fundamentals and attractive valuations in the face of a global growth slowdown. Stocks that we sold generally faced an expected or actual deterioration in their fundamental earnings outlook, the realization or removal of the expected catalyst or excessive valuation.
The stock market advanced overall during the reporting period and was led by the financials, consumer discretionary and telecommunications sectors. All three of these segments within the S&P 500® Index gained more than 20% over the reporting period. Meanwhile, the more global cyclical areas such as basic materials, energy and industrials were the worst performers in the benchmark. These areas were weighed down by global growth concerns and an emerging market slowdown. The Fund’s performance versus its Lipper peers benefited from its overweight to the strongly performing financial sector as well as stock selection in financials, technology and the housing-related area of consumer discretionary. However, the Fund underperformed the S&P 500® Index based on negative stock selection in the retail segment of consumer discretionary as well as the energy, technology software and health care sectors. The fiscal year was a difficult period for active managers in general as the market continued to be driven by macro events that positively and negatively impacted economic growth.
In financials, we were rewarded for increasing the Fund’s overweight during the period as the sector was the top performer in the S&P 500® Index. Financials benefited as their credit quality and capital improved, the situation in Europe appeared to stabilize and the stocks continued to sell at very low valuations versus their history and the market. Bank of America Corporation, a large diversified financial company that we bought later in the period, turned in particularly strong results. The company was attractive based on recent improvements to its capital and credit, its potential for significant cost-cutting
opportunities and its valuation, which was below tangible book value. Improving housing market conditions also helped propel the stock price during the period as the firm writes and owns a significant number of mortgages.
Stock selection in the technology hardware sector also provided strong performance for the Fund during the reporting period. Results benefited from our continued emphasis on companies focused on new technology such as smartphones and cloud computing and avoidance of old technology such as personal computers. In particular, Apple, Inc. performed exceptionally well and was also the Fund’s largest holding over the fiscal year. This leading manufacturer of smartphones, desktop and portable computing devices benefited from the introduction of its new iPad and the next generation iPhone. Apple’s product and geographic expansion allowed it to gain meaningful and profitable market share in the computing devices market. While the Fund remained overweight in Apple versus the S&P 500® Index at period end, we did sell some of its shares to realize profits. In addition, the Fund’s lack of ownership in personal computer-related stocks such as Dell Inc. and Hewlett-Packard Co. was beneficial. These larger weights in the index performed poorly as PCs continued to lose market share to tablets and smartphones.
Performance was also aided by our security selection in the housing-related area of consumer discretionary. Several of the Fund’s standouts included: home improvement retailer Home Depot, Inc.; appliance manufacturer Whirlpool Corporation; and home builder D.R. Horton. These companies benefited as a number of positive housing indicators were released as the period progressed. While we continue to own Home Depot and Whirlpool, we sold the Fund’s position in D.R. Horton as it attained our valuation target during the period.
Conversely, in the retail area of consumer discretionary, we owned two turnaround companies in the Fund that did not perform well. Electronics retailer Best Buy Company Inc. had been adjusting its business to offset competition from online retailers by closing underperforming stores, reformatting existing stores, introducing new mobile stores and improving pricing. However, its stock price was not rewarded for these changes during the fiscal year. Office supply store Staples, Inc. continued to be hindered by lower demand for its products in a slow growth environment for employment and small businesses. We sold our Best Buy position during the period. We continued to hold the Fund’s shares of Staples as we believe the company’s significant free cash flow will give it the financial wherewithal to improve the company’s standing going forward.
In the energy sector, the Fund experienced widespread weakness among its holdings, which generally exhibited superior production profiles relative to the industry. Concerns surrounding global growth and lower oil prices during the year led these stocks to underperform the more stable, integrated oil companies that the Fund did not own.
Although our technology hardware names performed well, our stock selection in the technology software and services sector was detrimental to relative performance during the reporting period. Shares of electronics payment provider VeriFone Holdings Inc. fell after its revenue growth in the summer quarter did not meet expectations. The company had increased competition from mobile payment providers, which is negatively impacting growth expectations. While mobile payments are a small piece of the electronics payment
industry, they are becoming more visible and growing. As a result, we sold the Fund’s position in VeriFone during the period. Also, the Fund did not own Microsoft Corporation, a large weight in the index, which performed reasonably well over this time frame with a variety of new products hitting the marketplace.
Finally, the health care sector detracted from relative results as the Fund’s holdings in health maintenance organizations (HMOs) fell short of expectations. In particular, Humana Inc. underperformed because of increased medical costs as more people are getting back to work and using health care services. We sold the Fund’s position in Humana during the fiscal year.
In the final months of the fiscal year, U.S. economic data was better than expected, including improvements in housing and employment and consumer confidence at a five-year high. It also appeared as if economic growth in China bottomed out toward the end of the reporting period and conditions there appeared to be improving. Therefore, we continued to maintain a cyclical positioning to the Fund’s portfolio with overweight positions in financials, consumer discretionary and basic materials. The Fund is underweight in the more stable areas of consumer staples, telecommunications and electric utilities.
Nuveen Mid Cap Select Fund
How did the Fund perform during the twelve-month period ended October 31, 2012?
The tables in the Fund Performance and Expense Ratios section of this report provide Class A Share total returns for the Fund for the one-year, five-year and ten-year periods ended October 31, 2012. The Fund’s Class A Shares at net asset value (NAV) underperformed both the Russell Midcap® Index and the Lipper classification average during the twelve-month period.
What strategies were used to manage the Fund during the reporting period? How did these strategies influence performance?
The Fund seeks to provide long-term capital appreciation by investing primarily in the common stocks of companies with market capitalizations at the time of purchase between approximately $520 million and $17.9 billion. During the reporting period, we continued to implement our “best of the best” investment approach. We started by using a combination of fundamental and quantitative analysis to identify mid-sized companies that we believed had strong fundamentals, attractive valuations and a catalyst for future positive relative performance. We further narrowed down our investable universe by identifying only those stocks that were held in other funds within our firm. We then combined a subset of those stocks into a portfolio that had risk tolerances within our acceptable limits. Generally, stocks we sold faced an expected or actual deterioration in their fundamental earnings outlook, the realization or removal of the expected catalyst or excessive valuation.
During the reporting period, the U.S. economic picture generally improved and the unemployment rate declined. As the job and housing markets showed signs of improvement, the Fund benefited from overweight positions in consumer-sensitive
sectors like consumer discretionary, retail and housing while underweighting the more stable consumer areas like food products. The Fund posted strong gains from several of these consumer-related stocks including Foot Locker, Inc., Jarden Corporation and Whirlpool Corporation during the period. In the retail area, turnaround story Foot Locker, a leading athletic footwear and apparel retailer, benefited from good execution as it continued to beat its competition and gain market share. Jarden, a manufacturer of a variety of outdoor products and consumer goods, advanced as consumers increased their spending on leisure items. In addition, appliance manufacturer Whirlpool performed well as positive housing market indicators increased during the reporting period.
The Fund also experienced continued success from its overweight and strong stock selection within the small-cap market segment. For example, the Fund was rewarded for its position in CNO Financial Group Inc., which develops and administers a variety of retirement and health care-related insurance products to the middle market segment. CNO Financial’s stock price advanced during the period as the company continued to make progress with restructuring efforts. Also in the small-cap space, we purchased shares of Aruba Networks Inc. at a favorable price and its stock price subsequently rose in late summer after U.S. economic data started to show more improvement. Aruba Networks, a provider of cloud computing solutions for mobile devices, benefited from the continued rapid growth in the wireless market. We sold the Fund’s position in this stock as it attained our price target.
The Fund also benefitted from the quantitative influence in its portfolio construction process. Our focus on the most attractively ranked stocks according to our proprietary quantitative model and our underweight to the most unattractively ranked stocks enhanced Fund performance.
The Fund’s overweight and stock selection in the technology hardware and software sectors generally hurt relative results as these industries failed to participate fully in the market advance during the period. The market continued to move toward companies focused on new technology such as smartphones and cloud computing while avoiding old technology such as personal computers. In the telecommunications industry, equipment provider Polycom Inc. saw its share price fall after the company did not meet earnings expectations and investors feared it was losing market share to its largest competitor. Also, the timing of our ownership in Red Hat Inc. was detrimental to the Fund’s performance as the company’s growth potential did not expand after our purchase. Red Hat develops and supports cloud-based software solutions for enterprises.
Despite the market’s strong advance over the fiscal year, the Fund’s overweight position in higher beta stocks hindered results as these stocks generally underperformed. Holdings such as Vocus, Inc., an online software-as-a-service company, underperformed during the period. Although Vocus is in a growing segment, its share prices declined after it provided disappointing guidance while also announcing the strategic acquisition of iContact. Also, global financial trading firm Knight Capital Group Inc. had a stock price decline during the reporting period after a trading system malfunction.
In the final months of the fiscal year, U.S. economic data was better than expected, including improvements in housing and employment as well as consumer confidence at a five-year high. It also appeared as if economic growth in China bottomed out toward the
end of the reporting period and conditions there appeared to be improving. Given the economic uncertainty in the U.S. and Europe, we are keeping the Fund’s sector weights and beta close to its Russell benchmark and allowing stock selection to drive performance.
Nuveen Small Cap Select Fund
How did the Fund perform during the twelve-month period ended October 31, 2012?
The tables in the Fund Performance and Expense Ratios section of this report provide Class A Share total returns for the Fund for the one-year, five-year and ten-year periods ended October 31, 2012. The Fund’s Class A Shares at net asset value (NAV) outperformed the Lipper classification average, but underperformed the Russell 2000® Index during the twelve-month period.
What strategies were used to manage the Fund during the reporting period? How did these strategies influence performance?
The Fund seeks to provide long-term capital appreciation by investing primarily in the common stocks of companies with market capitalizations of less than $3 billion at the time of purchase. During this period, we continued to execute on our strategy of investing in well run, small-cap companies we believe offer good value in order to generate competitive returns for the Fund. We also continued to keep the Fund well diversified, with its sector weightings very close to the weights in the Russell 2000® Index.
The Fund experienced widespread strength across all market sectors except for technology during the period, with particularly strong stock selection in industrials, consumer discretionary, consumer staples, health care and financials. In industrials, the share price of United Rentals Inc. made strong gains. The company rents light and heavy equipment to customers in the manufacturing and construction industries. After we purchased United Rentals at an attractive price in 2011, its business improved as companies opted to rent equipment instead of making capital equipment purchases during the uncertain economy. This positive secular trend, along with a merger with its largest competitor, propelled the stock price. We sold the Fund’s position in United Rentals as it reached our price target. The Fund also saw widespread strength in the machinery industry as a number of holdings executed well including: compressor and equipment producer Robbins & Myers, Inc.; hydraulic and electrical tools producer Actuant Corporation; utility power monitoring company ESCO Technologies Inc.; and power transmission and motion control products supplier Altra Industrial Motion, Inc. The Fund still holds its position in ESCO and Altra but sold the other positions based on valuation.
Outperformance in the consumer discretionary was led by hotel company Gaylord Entertainment Company, which runs several large properties that cater to businesses and conventions. After share prices declined in 2011 due to economic growth concerns, Gaylord’s stock price increased significantly as travel and entertainment bookings improved and the company’s profitability and efficiency increased. More recently, the company benefited from its reorganization as a REIT (Real Estate Investment Trust), which unlocked additional value for shareholders. This position was sold during the period. Also, several of the Fund’s apparel retailers performed well, including significant advances by
clothing conglomerate Ascena Retail Group Inc., women’s clothing retailer Ann Inc. and teen retailer Zumiez, Inc. Each of these companies offers a unique brand that is well targeted.
In consumer staples, the Fund benefited from its exposure to the consumer trend toward natural and organic foods. Share prices of Smart Balance Inc. rose over the period as its natural and organic products were well received by consumers. The company also broadened distribution to more major grocery store chains while it successfully diversified into gluten-free products. Similarly, Hain Celestial Group Inc., a more diversified natural and organic company, also advanced due to increasing consumer demand for its products. This position was sold during the period.
Favorable stock selection in health care was mostly driven by ZOLL Medical Corporation, which designs and manufactures cardiac resuscitation devices. The company continued to post strong operating performance as it successfully rolled out new products, resulting in its acquisition by a Japanese company for a significant premium. Also, medical device company Endologix, Inc. was a solid performer as it released a new stent that was well received by the marketplace. We sold the Fund’s position in Endologix after its stock price increased significantly.
Results were mixed in the financial sector. The Fund benefited from a fairly large position in Delphi Financial Group, Inc., a firm focused on employer’s compensation and life insurance, which was acquired by a Japanese insurance company for a significant premium. Unfortunately, the gains from this holding were partially offset by the Fund’s ownership in global financial trading firm Knight Capital Group Inc., which had a stock price decline during the reporting period after a trading system malfunction.
The technology sector provided disappointing results during the reporting period, leading to the Fund’s underperformance. The Fund was positioned for a better economic backdrop with an overweight in the semiconductor and hardware industries, the two areas that dramatically underperformed. In the economically sensitive semiconductor industry, we thought stocks looked well positioned to have a strong year given their compelling valuations. However, as economies slowed in the U.S., Europe and China, RF Micro Devices, Inc. and International Rectifier Corporation were negatively impacted. RF Micro, a global provider of radio frequency components serving the leading cell phone equipment manufacturers, declined due to a slowdown of phone sales in China. Based on our concerns regarding the company’s positioning in an increasingly competitive market, we eliminated this position. International Rectifier, a power management semiconductor manufacturer that serves a broad array of end markets and applications, also declined due to the slowdown in China. However, the Fund continued to hold International Rectifier as we believe the company has taken steps to effectively manage the prolonged downturn in the semiconductor environment. Elsewhere in technology, telecommunications service providers did not spend as we expected they would, leading to weakness among the Fund’s communication equipment vendors: Polycom Inc., ADTRAN, Inc. and Finisar Corporation. We sold Polycom, ADTRAN and Finisar as we believed these companies became less competitive in their product offerings. We added and later sold a different telecomm equipment vendor, JDS Uniphase Corporation. This company participates in the optical components part of the network and benefited from a broad uptick in capital expenditures.
We also utilized equity futures contracts as part of the management of the Fund. During the period, the Fund had purchased Russell 2000® e-mini index futures to efficiently gain market exposure to a broad base of equity securities in order to manage cash flow activity and minimized tracking error to the Fund’s benchmark index. These contracts were closed during the reporting period.
Risk Considerations
Mutual fund investing involves risk; principal loss is possible.
Nuveen Large Cap Select Fund
Equity investments, such as those held by the Fund, are subject to market risk, derivatives risk, and common stock risk. Foreign investments involve additional risks including currency fluctuations, political and economic instability, and lack of liquidity. These risks are magnified in emerging markets.
Nuveen Mid Cap Select Fund
Equity investments, such as those held by the Fund, are subject to market risk, derivatives risk, and common stock risk. Mid-cap stocks are subject to greater volatility. Foreign investments involve additional risks including currency fluctuations, political and economic instability, and lack of liquidity. These risks are magnified in emerging markets.
Nuveen Small Cap Select Fund
Equity investments, such as those held by the Fund, are subject to market risk, derivatives risk, IPO risk, and common stock risk. Small-cap stocks are subject to greater volatility and liquidity risks. Foreign investments involve additional risks including currency fluctuations, political and economic instability, and lack of liquidity. These risks are magnified in emerging markets.
[THIS PAGE INTENTIONALLY LEFT BLANK]
Fund Performance and Expense Ratios
The Fund Performance and Expense Ratios for each Fund are shown on the following six pages.
Returns quoted represent past performance, which is no guarantee of future results. Current performance may be higher or lower than the performance shown. Investment returns and principal value will fluctuate so that when shares are redeemed, they may be worth more or less than their original cost. Returns without sales charges would be lower if the sales charge were included. Returns do not reflect the deduction of taxes that a shareholder would pay on Fund distributions or the redemption of Fund shares.
Returns may reflect a contractual agreement between certain Funds and the investment adviser to waive certain fees and expenses; see Notes to Financial Statements, Footnote 7 — Management Fees and Other Transactions with Affiliates for more information. In addition, returns may reflect a voluntary expense limitation by the Funds’ investment adviser that may be modified or discontinued at any time without notice. For the most recent month-end performance visit www.nuveen.com or call (800) 257-8787.
Returns reflect differences in sales charges and expenses, which are primarily differences in distribution and service fees. Fund returns assume reinvestment of dividends and capital gains.
Comparative index and Lipper return information is provided for the Funds’ Class A Shares at net asset value (NAV) only.
The expense ratios shown reflect the Funds’ total operating expenses (before fee waivers and/or expense reimbursements, if any) as shown in the Funds’ most recent prospectus. The expense ratios include management fees and other fees and expenses.
Fund Performance and Expense Ratios (continued)
Nuveen Large Cap Select Fund
Refer to the first page of this Fund Performance and Expense Ratios section for further explanation of the information included within this page.
Fund Performance
Average Annual Total Returns as of October 31, 2012
| | | | | | | | | | | | |
| |
| | | Average Annual | |
| | | |
| | | 1-Year | | | 5-Year | | | Since
Inception* | |
Class A Shares at NAV | | | 14.41% | | | | -1.57% | | | | 5.85% | |
Class A Shares at maximum Offering Price | | | 7.79% | | | | -2.73% | | | | 5.21% | |
S&P 500® Index** | | | 15.21% | | | | 0.36% | | | | 7.42% | |
Lipper Large-Cap Core Funds Classification Average** | | | 13.16% | | | | -0.63% | | | | 6.77% | |
| | | |
Class C Shares | | | 13.65% | | | | -2.34% | | | | 5.03% | |
Class R3 Shares | | | 14.15% | | | | -1.81% | | | | 5.60% | |
Class I Shares | | | 14.79% | | | | -1.31% | | | | 6.12% | |
Average Annual Total Returns as of September 30, 2012 (Most Recent Calendar Quarter)
| | | | | | | | | | | | |
| |
| | | Average Annual | |
| | | |
| | | 1-Year | | | 5-Year | | | Since
Inception* | |
Class A Shares at NAV | | | 31.18% | | | | -0.95% | | | | 6.07% | |
Class A Shares at maximum Offering Price | | | 23.68% | | | | -2.11% | | | | 5.43% | |
Class C Shares | | | 30.18% | | | | -1.73% | | | | 5.25% | |
Class R3 Shares | | | 30.87% | | | | -1.18% | | | | 5.83% | |
Class I Shares | | | 31.53% | | | | -0.69% | | | | 6.34% | |
Class A Shares have a maximum 5.75% sales charge (Offering Price). Class A Share purchases of $1 million or more are sold at net asset value without an up-front sales charge but may be subject to a contingent deferred sales charge (CDSC), also known as a back-end sales charge, if redeemed within twelve months of purchase. Class C Shares have a 1% CDSC for redemptions within less than twelve months, which is not reflected in the one-year total return. Class R3 Shares have no sales charge and are available to only certain retirement plans. Class I Shares have no sales charge and may be purchased under limited circumstances or by specified classes of investors.
Expense Ratios as of Most Recent Prospectus
| | | | |
| |
| | | Expense
Ratios | |
Class A Shares | | | 1.19% | |
Class C Shares | | | 1.94% | |
Class R3 Shares | | | 1.44% | |
Class I Shares | | | 0.94% | |
| * | Since inception returns are from 1/31/03. |
| ** | Refer to the Glossary of Terms Used in this Report for definitions. Indexes and Lipper averages are not available for direct investment. |
Growth of an Assumed $10,000 Investment as of October 31, 2012 – Class A Shares
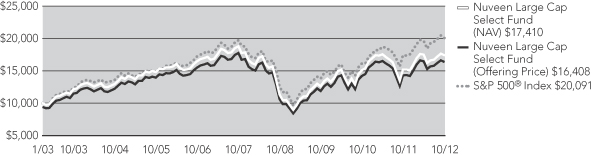
The graphs do not reflect the deduction of taxes that a shareholder may pay on Fund distributions or the redemption of Fund shares.
Fund Performance and Expense Ratios (continued)
Nuveen Mid Cap Select Fund
Refer to the first page of this Fund Performance and Expense Ratios section for further explanation of the information included within this page.
Fund Performance
Average Annual Total Returns as of October 31, 2012
| | | | | | | | | | | | |
| |
| | | Average Annual | |
| | | |
| | | 1-Year | | | 5-Year | | | 10-Year | |
Class A Shares at NAV | | | 8.65% | | | | -0.59% | | | | 7.38% | |
Class A Shares at maximum Offering Price | | | 2.39% | | | | -1.76% | | | | 6.74% | |
Russell Midcap® Index* | | | 12.15% | | | | 1.70% | | | | 10.52% | |
Lipper Mid-Cap Core Funds Classification Average* | | | 10.32% | | | | 0.43% | | | | 8.61% | |
| | | |
Class C Shares | | | 7.93% | | | | -1.33% | | | | 6.59% | |
Class I Shares | | | 8.98% | | | | -0.35% | | | | 7.65% | |
Average Annual Total Returns as of September 30, 2012 (Most Recent Calendar Quarter)
| | | | | | | | | | | | |
| |
| | | Average Annual | |
| | | |
| | | 1-Year | | | 5-Year | | | 10-Year | |
Class A Shares at NAV | | | 26.08% | | | | 0.04% | | | | 9.39% | |
Class A Shares at maximum Offering Price | | | 18.80% | | | | -1.13% | | | | 8.74% | |
Class C Shares | | | 25.10% | | | | -0.70% | | | | 8.58% | |
Class I Shares | | | 26.44% | | | | 0.31% | | | | 9.66% | |
Class A Shares have a maximum 5.75% sales charge (Offering Price). Class A Share purchases of $1 million or more are sold at net asset value without an up-front sales charge but may be subject to a contingent deferred sales charge (CDSC), also known as a back-end sales charge, if redeemed within twelve months of purchase. Class C Shares have a 1% CDSC for redemptions within less than twelve months, which is not reflected in the one-year total return. Class I Shares have no sales charge and may be purchased under limited circumstances or by specified classes of investors.
Expense Ratios as of Most Recent Prospectus
| | | | | | | | |
| | |
| | | Gross
Expense
Ratios | | | Net
Expense
Ratios | |
Class A Shares | | | 1.84% | | | | 1.41% | |
Class C Shares | | | 2.59% | | | | 2.16% | |
Class I Shares | | | 1.59% | | | | 1.16% | |
The Fund’s investment adviser has contractually agreed to waive fees and/or reimburse expenses through February 28, 2013, so that total annual Fund operating expenses, after fee waivers and/or expense reimbursements and excluding acquired fund fees and expenses, do not exceed 1.41%, 2.16% and 1.16%, for Class A, Class C and Class I Shares, respectively. Fee waivers and/or expense reimbursements will not be terminated prior to that time without the approval of the Fund’s Board of Directors.
| * | Refer to the Glossary of Terms Used in this Report for definitions. Indexes and Lipper averages are not available for direct investment. |
Growth of an Assumed $10,000 Investment as of October 31, 2012 – Class A Shares
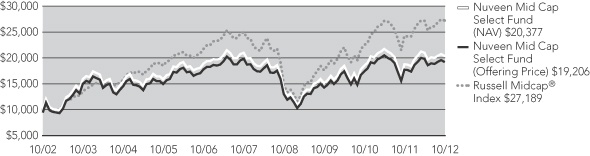
The graphs do not reflect the deduction of taxes that a shareholder may pay on Fund distributions or the redemption of Fund shares.
Fund Performance and Expense Ratios (continued)
Nuveen Small Cap Select Fund
Refer to the first page of this Fund Performance and Expense Ratios section for further explanation of the information included within this page.
Fund Performance
Average Annual Total Returns as of October 31, 2012
| | | | | | | | | | | | |
| |
| | | Average Annual | |
| | | |
| | | 1-Year | | | 5-Year | | | 10-Year | |
Class A Shares at NAV | | | 11.62% | | | | 1.13% | | | | 9.27% | |
Class A Shares at maximum Offering Price | | | 5.19% | | | | -0.06% | | | | 8.62% | |
Russell 2000® Index* | | | 12.08% | | | | 1.19% | | | | 9.58% | |
Lipper Small-Cap Core Funds Classification Average* | | | 10.44% | | | | 0.96% | | | | 9.26% | |
| | | |
Class B Shares w/o CDSC | | | 10.88% | | | | 0.39% | | | | 8.46% | |
Class B Shares w/CDSC | | | 5.88% | | | | 0.21% | | | | 8.46% | |
Class C Shares | | | 10.81% | | | | 0.38% | | | | 8.45% | |
Class R3 Shares | | | 11.42% | | | | 0.89% | | | | 9.05% | |
Class I Shares | | | 12.01% | | | | 1.39% | | | | 9.55% | |
Average Annual Total Returns as of September 30, 2012 (Most Recent Calendar Quarter)
| | | | | | | | | | | | |
| |
| | | Average Annual | |
| | | |
| | | 1-Year | | | 5-Year | | | 10-Year | |
Class A Shares at NAV | | | 34.65% | | | | 2.49% | | | | 10.39% | |
Class A Shares at maximum Offering Price | | | 26.92% | | | | 1.28% | | | | 9.74% | |
Class B Shares w/o CDSC | | | 33.83% | | | | 1.73% | | | | 9.56% | |
Class B Shares w/CDSC | | | 28.83% | | | | 1.54% | | | | 9.56% | |
Class C Shares | | | 33.70% | | | | 1.73% | | | | 9.56% | |
Class R3 Shares | | | 34.49% | | | | 2.25% | | | | 10.17% | |
Class I Shares | | | 35.13% | | | | 2.76% | | | | 10.66% | |
Class A Shares have a maximum 5.75% sales charge (Offering Price). Class A Share purchases of $1 million or more are sold at net asset value without an up-front sales charge but may be subject to a contingent deferred sales charge (CDSC), also known as a back-end sales charge, if redeemed within twelve months of purchase. Class B Shares have a CDSC that begins at 5% for redemptions during the first year and declines periodically until after six years when the charge becomes 0%. Class B Shares automatically convert to Class A Shares eight years after purchase. Class C Shares have a 1% CDSC for redemptions within less than twelve months, which is not reflected in the one-year total return. Class R3 Shares have no sales charge and are available to only certain retirement plans. Class I Shares have no sales charge and may be purchased under limited circumstances or by specified classes of investors.
Expense Ratios as of Most Recent Prospectus
| | | | |
| |
| | | Expense
Ratios | |
Class A Shares | | | 1.32% | |
Class B Shares | | | 2.07% | |
Class C Shares | | | 2.07% | |
Class R3 Shares | | | 1.57% | |
Class I Shares | | | 1.07% | |
| * | Refer to the Glossary of Terms Used in this Report for definitions. Indexes and Lipper averages are not available for direct investment. |
Growth of an Assumed $10,000 Investment as of October 31, 2012 – Class A Shares
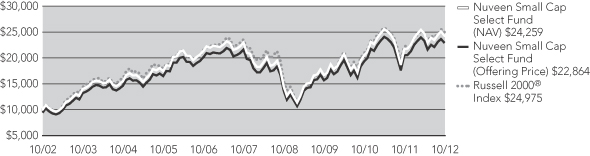
The graphs do not reflect the deduction of taxes that a shareholder may pay on Fund distributions or the redemption of Fund shares.
Holding Summaries as of October 31, 2012
This data relates to the securities held in each Fund’s portfolio of investments. It should not be construed as a measure of performance for the Fund itself.
Nuveen Large Cap Select Fund
Fund Allocation1
| | | | |
| Common Stocks | | | 97.5% | |
| Short-Term Investments | | | 3.2% | |
| Other2 | | | (0.7)% | |
Nuveen Mid Cap Select Fund
Fund Allocation1
| | | | |
| Common Stocks | | | 97.5% | |
| Short-Term Investments | | | 3.0% | |
| Other2 | | | (0.5)% | |
| | | | |
| Portfolio Composition1 | |
| Diversified Financial Services | | | 8.8% | |
| Oil, Gas & Consumable Fuels | | | 7.6% | |
| Pharmaceuticals | | | 6.9% | |
| Machinery | | | 5.6% | |
| Commercial Banks | | | 4.8% | |
| Computers & Peripherals | | | 4.3% | |
| Chemicals | | | 4.1% | |
| Energy Equipment & Services | | | 4.0% | |
| Consumer Finance | | | 4.0% | |
| Specialty Retail | | | 3.9% | |
| Insurance | | | 3.0% | |
| Household Durables | | | 2.9% | |
| IT Services | | | 2.9% | |
| Multiline Retail | | | 2.7% | |
| Diversified Telecommunication Services | | | 2.5% | |
| Internet Software & Services | | | 2.5% | |
| Food Products | | | 2.2% | |
| Health Care Equipment & Supplies | | | 2.1% | |
| Electrical Equipment | | | 2.0% | |
| Short-Term Investments | | | 3.2% | |
| Other3 | | | 20.0% | |
| | | | |
| Portfolio Composition1 | |
| Specialty Retail | | | 7.1% | |
| Machinery | | | 6.5% | |
| Real Estate Investment Trust | | | 6.3% | |
| Chemicals | | | 5.7% | |
| Commercial Banks | | | 5.3% | |
| Consumer Finance | | | 5.0% | |
| Health Care Equipment & Supplies | | | 4.8% | |
| Insurance | | | 4.6% | |
| Software | | | 4.5% | |
| Oil, Gas & Consumable Fuels | | | 4.2% | |
| Electrical Equipment | | | 3.5% | |
| Semiconductors & Equipment | | | 3.1% | |
| Household Durables | | | 2.7% | |
| Biotechnology | | | 2.6% | |
| Electric Utilities | | | 2.5% | |
| Communications Equipment | | | 2.4% | |
| Energy Equipment & Services | | | 2.3% | |
| Commercial Services & Supplies | | | 2.3% | |
| Leisure Equipment & Products | | | 2.0% | |
| Gas Utilities | | | 2.0% | |
| Short-Term Investments | | | 3.0% | |
| Other3 | | | 17.6% | |
| | | | |
| Top Five Common Stock Holdings1 | |
| Apple, Inc. | | | 4.3% | |
| Pfizer Inc. | | | 3.4% | |
| Citigroup Inc. | | | 3.2% | |
| Bank of America Corporation | | | 2.9% | |
| JPMorgan Chase & Co. | | | 2.7% | |
| | | | |
| Top Five Common Stock Holdings1 | |
| SLM Corporation | | | 1.9% | |
| Maxim Integrated Products, Inc. | | | 1.8% | |
| Fifth Third Bancorp. | | | 1.7% | |
| Eaton Corporation | | | 1.6% | |
| Whirlpool Corporation | | | 1.6% | |
| 1 | As a percentage of net assets. Holdings are subject to change. |
| 2 | Other assets less liabilities, which includes investments purchased with collateral from securities lending as presented in the Fund’s Portfolio of Investments. |
| 3 | Other assets less liabilities, which includes investments purchased with collateral from securities lending as presented in the Fund’s Portfolio of Investments and all industries less than 2.0% of net assets. |
Nuveen Small Cap Select Fund
| | | | |
| Fund Allocation1 | | | |
| Common Stocks | | | 98.4% | |
| Short-Term Investments | | | 1.6% | |
| Other2 | | | 0.0% | 3 |
| | | | |
| Portfolio Composition1 | |
| Capital Markets | | | 7.3% | |
| Real Estate Investment Trust | | | 5.6% | |
| Health Care Equipment & Supplies | | | 5.2% | |
| Hotels, Restaurants & Leisure | | | 5.0% | |
| Commercial Banks | | | 4.8% | |
| Semiconductors & Equipment | | | 4.5% | |
| Machinery | | | 4.0% | |
| Oil, Gas & Consumable Fuels | | | 3.9% | |
| Specialty Retail | | | 3.6% | |
| Energy Equipment & Services | | | 3.4% | |
| Software | | | 3.2% | |
| Internet Software & Services | | | 3.1% | |
| Textiles, Apparel & Luxury Goods | | | 3.1% | |
| Construction & Engineering | | | 2.8% | |
| Electrical Equipment | | | 2.8% | |
| Biotechnology | | | 2.8% | |
| Insurance | | | 2.5% | |
| Health Care Providers & Services | | | 2.4% | |
| Food & Staples Retailing | | | 2.4% | |
| Chemicals | | | 2.1% | |
| Gas Utilities | | | 2.1% | |
| Electronic Equipment & Instruments | | | 1.8% | |
| Leisure Equipment & Products | | | 1.8% | |
| Pharmaceuticals | | | 1.8% | |
| Short-Term Investments | | | 1.6% | |
| Other4 | | | 16.4% | |
| | | | |
| Top Five Common Stock Holdings1 | |
| Atmos Energy Corporation | | | 2.1% | |
| Brunswick Corporation | | | 1.8% | |
| Integrated Device Technology, Inc. | | | 1.7% | |
| Ascena Retail Group Inc. | | | 1.7% | |
| ESCO Technologies Inc. | | | 1.7% | |
| 1 | As a percentage of net assets. Holdings are subject to change. |
| 2 | Other assets less liabilities, which includes investments purchased with collateral from securities lending as presented in the Fund’s Portfolio of Investments. |
| 4 | Other assets less liabilities, which includes investments purchased with collateral from securities lending as presented in the Fund’s Portfolio of Investments and all industries less than 1.8% of net assets. |
Expense Examples
As a shareholder of one or more of the Funds, you incur two types of costs: (1) transaction costs, including up-front and back-end sales charges (loads) or redemption fees, where applicable; and (2) ongoing costs, including management fees; distribution and service (12b-1) fees, where applicable; and other Fund expenses. The Examples below are intended to help you understand your ongoing costs (in dollars) of investing in the Funds and to compare these costs with the ongoing costs of investing in other mutual funds.
The Examples below are based on an investment of $1,000 invested at the beginning of the period and held for the period.
The information under “Actual Performance,” together with the amount you invested, allows you to estimate actual expenses incurred over the reporting period. Simply divide your account value by $1,000 (for example, an $8,600 account value divided by $1,000 = 8.60) and multiply the result by the cost shown for your share class, in the row entitled “Expenses Incurred During Period” to estimate the expenses incurred on your account during this period.
The information under “Hypothetical Performance,” provides information about hypothetical account values and hypothetical expenses based on the respective Fund’s actual expense ratio and an assumed rate of return of 5% per year before expenses, which is not the Fund’s actual return. The hypothetical account values and expenses may not be used to estimate the actual ending account balance or expense you incurred for the period. You may use this information to compare the ongoing costs of investing in the Fund and other Funds. To do so, compare this 5% hypothetical example with the 5% hypothetical examples that appear in the shareholder reports of the other funds.
Please note that the expenses shown in the table are meant to highlight your ongoing costs only and do not reflect any transaction costs. Therefore, the hypothetical information is useful in comparing ongoing costs only, and will not help you determine the relative total costs of owning different funds or share classes. In addition, if these transaction costs were included, your costs would have been higher.
Nuveen Large Cap Select Fund
| | | | | | | | | | | | | | | | | | | | | | | | | | | | | | | | | | |
| | | Actual Performance | | | | | Hypothetical Performance
(5% annualized return before expenses) | |
| | | A Shares | | | C Shares | | | R3 Shares | | | I Shares | | | | | A Shares | | | C Shares | | | R3 Shares | | | I Shares | |
| Beginning Account Value (5/01/12) | | $ | 1,000.00 | | | $ | 1,000.00 | | | $ | 1,000.00 | | | $ | 1,000.00 | | | | | $ | 1,000.00 | | | $ | 1,000.00 | | | $ | 1,000.00 | | | $ | 1,000.00 | |
| Ending Account Value (10/31/12) | | $ | 994.10 | | | $ | 991.40 | | | $ | 993.20 | | | $ | 996.30 | | | | | $ | 1,018.60 | | | $ | 1,014.87 | | | $ | 1,017.39 | | | $ | 1,019.96 | |
| Expenses Incurred During Period | | $ | 6.58 | | | $ | 10.29 | | | $ | 7.79 | | | $ | 5.23 | | | | | $ | 6.67 | | | $ | 10.41 | | | $ | 7.88 | | | $ | 5.30 | |
For each class of the Fund, expenses are equal to the Fund’s annualized net expense ratio of 1.31%, 2.05%, 1.55% and 1.04% for Classes A, C, R3 and I, respectively, multiplied by the average account value over the period, multiplied by 184/365 (to reflect the one-half year period).
Nuveen Mid Cap Select Fund
| | | | | | | | | | | | | | | | | | | | | | | | | | |
| | | Actual Performance | | | | | Hypothetical Performance
(5% annualized return before expenses) | |
| | | A Shares | | | C Shares | | | I Shares | | | | | A Shares | | | C Shares | | | I Shares | |
| Beginning Account Value (5/01/12) | | $ | 1,000.00 | | | $ | 1,000.00 | | | $ | 1,000.00 | | | | | $ | 1,000.00 | | | $ | 1,000.00 | | | $ | 1,000.00 | |
| Ending Account Value (10/31/12) | | $ | 970.80 | | | $ | 968.00 | | | $ | 972.10 | | | | | $ | 1,018.05 | | | $ | 1,014.28 | | | $ | 1,019.30 | |
| Expenses Incurred During Period | | $ | 6.99 | | | $ | 10.69 | | | $ | 5.75 | | | | | $ | 7.15 | | | $ | 10.94 | | | $ | 5.89 | |
For each class of the Fund, expenses are equal to the Fund’s annualized net expense ratio of 1.41%, 2.16% and 1.16% for Classes A, C and I, respectively, multiplied by the average account value over the period, multiplied by 184/365 (to reflect the one-half year period).
Nuveen Small Cap Select Fund
| | | | | | | | | | | | | | | | | | | | | | | | | | | | | | | | | | | | | | | | | | |
| | | Actual Performance | | | | | Hypothetical Performance
(5% annualized return before expenses) | |
| | | A Shares | | | B Shares | | | C Shares | | | R3 Shares | | | I Shares | | | | | A Shares | | | B Shares | | | C Shares | | | R3 Shares | | | I Shares | |
| Beginning Account Value (5/01/12) | | $ | 1,000.00 | | | $ | 1,000.00 | | | $ | 1,000.00 | | | $ | 1,000.00 | | | $ | 1,000.00 | | | | | $ | 1,000.00 | | | $ | 1,000.00 | | | $ | 1,000.00 | | | $ | 1,000.00 | | | $ | 1,000.00 | |
| Ending Account Value (10/31/12) | | $ | 984.00 | | | $ | 981.30 | | | $ | 980.50 | | | $ | 982.80 | | | $ | 986.00 | | | | | $ | 1,018.80 | | | $ | 1,014.98 | | | $ | 1,014.98 | | | $ | 1,017.55 | | | $ | 1,020.06 | |
| Expenses Incurred During Period | | $ | 6.28 | | | $ | 10.06 | | | $ | 10.06 | | | $ | 7.53 | | | $ | 5.04 | | | | | $ | 6.55 | | | $ | 10.23 | | | $ | 10.23 | | | $ | 7.66 | | | $ | 5.13 | |
For each class of the Fund, expenses are equal to the Fund’s annualized net expense ratio of 1.26%, 2.02%, 2.02%, 1.51% and 1.01% for Classes A, B, C, R3 and I, respectively, multiplied by the average account value over the period, multiplied by 184/365 (to reflect the one-half year period).
Report of
Independent Registered Public Accounting Firm
To the Board of Directors and Shareholders of
Nuveen Investment Funds Inc.:
In our opinion, the accompanying statement of assets and liabilities, including the portfolios of investments, and the related statements of operations, of changes in net assets and the financial highlights present fairly, in all material respects, the financial position of Nuveen Large Cap Select Fund, Nuveen Mid Cap Select Fund and Nuveen Small Cap Select Fund (the “Funds”) at October 31, 2012, the results of each of their operations for the year then ended, and the change in each of their net assets and the financial highlights for the year then ended, in conformity with accounting principles generally accepted in the United States of America. These financial statements and financial highlights (hereafter referred to as “financial statements”) are the responsibility of the Funds’ management; our responsibility is to express an opinion on these financial statements based on our audits. We conducted our audits of these financial statements in accordance with the standards of the Public Company Accounting Oversight Board (United States). Those standards require that we plan and perform the audit to obtain reasonable assurance about whether the financial statements are free of material misstatement. An audit includes examining, on a test basis, evidence supporting the amounts and disclosures in the financial statements, assessing the accounting principles used and significant estimates made by management, and evaluating the overall financial statement presentation. We believe that our audits, which included confirmation of securities at October 31, 2012 by correspondence with the custodian and brokers, provides a reasonable basis for our opinion. The financial statements of the Funds for the years ended October 31, 2011 and prior were audited by other independent auditors whose report dated December 28, 2011 expressed an unqualified opinion on those statements.
PRICEWATERHOUSECOOPERS LLP
Chicago, IL
December 28, 2012
Portfolio of Investments
Nuveen Large Cap Select Fund
October 31, 2012
| | | | | | | | | | | | | | |
| Shares | | | Description (1) | | | | | | | | Value | |
| | | | COMMON STOCKS – 97.5% | | | | | | | | | | |
| | | | | |
| | | | Aerospace & Defense – 1.7% | | | | | | | | | | |
| | | | | |
| | 9,291 | | | Boeing Company, (2) | | | | | | | | $ | 654,458 | |
| | | | Biotechnology – 1.7% | | | | | | | | | | |
| | | | | |
| | 9,561 | | | Gilead Sciences, Inc., (3) | | | | | | | | | 642,117 | |
| | | | Chemicals – 4.1% | | | | | | | | | | |
| | | | | |
| | 2,102 | | | CF Industries Holdings, Inc. | | | | | | | | | 431,309 | |
| | | | | |
| | 10,608 | | | LyondellBasell Industries NV | | | | | | | | | 566,361 | |
| | | | | |
| | 6,207 | | | Monsanto Company | | | | | | | | | 534,236 | |
| | | | Total Chemicals | | | | | | | | | 1,531,906 | |
| | | | Commercial Banks – 4.8% | | | | | | | | | | |
| | | | | |
| | 27,582 | | | Fifth Third Bancorp. | | | | | | | | | 400,766 | |
| | | | | |
| | 14,995 | | | SunTrust Banks, Inc., (2) | | | | | | | | | 407,864 | |
| | | | | |
| | 29,333 | | | Wells Fargo & Company | | | | | | | | | 988,229 | |
| | | | Total Commercial Banks | | | | | | | | | 1,796,859 | |
| | | | Communications Equipment – 1.5% | | | | | | | | | | |
| | | | | |
| | 11,035 | | | Motorola Solutions Inc. | | | | | | | | | 570,289 | |
| | | | Computers & Peripherals – 4.3% | | | | | | | | | | |
| | | | | |
| | 2,744 | | | Apple, Inc. | | | | | | | | | 1,632,954 | |
| | | | Consumer Finance – 4.0% | | | | | | | | | | |
| | | | | |
| | 14,542 | | | Capital One Financial Corporation | | | | | | | | | 874,992 | |
| | | | | |
| | 36,158 | | | SLM Corporation, (2) | | | | | | | | | 635,658 | |
| | | | Total Consumer Finance | | | | | | | | | 1,510,650 | |
| | | | Diversified Financial Services – 8.8% | | | | | | | | | | |
| | | | | |
| | 116,393 | | | Bank of America Corporation | | | | | | | | | 1,084,783 | |
| | | | | |
| | 31,972 | | | Citigroup Inc., (2) | | | | | | | | | 1,195,433 | |
| | | | | |
| | 24,875 | | | JPMorgan Chase & Co. | | | | | | | | | 1,036,790 | |
| | | | Total Diversified Financial Services | | | | | | | | | 3,317,006 | |
| | | | Diversified Telecommunication Services – 2.5% | | | | | | | | | | |
| | | | | |
| | 21,556 | | | Verizon Communications Inc., (2) | | | | | | | | | 962,260 | |
| | | | Electric Utilities – 1.2% | | | | | | | | | | |
| | | | | |
| | 9,706 | | | Edison International | | | | | | | | | 455,600 | |
| | | | Electrical Equipment – 2.0% | | | | | | | | | | |
| | | | | |
| | 15,574 | | | Emerson Electric Company | | | | | | | | | 754,249 | |
| | | | Energy Equipment & Services – 4.0% | | | | | | | | | | |
| | | | | |
| | 6,812 | | | Cooper Cameron Corporation, (3) | | | | | | | | | 344,960 | |
| | | | | |
| | 6,637 | | | National-Oilwell Varco Inc. | | | | | | | | | 489,147 | |
| | | | | |
| | 9,882 | | | Schlumberger Limited | | | | | | | | | 687,095 | |
| | | | Total Energy Equipment & Services | | | | | | | | | 1,521,202 | |
| | | | Food & Staples Retailing – 1.5% | | | | | | | | | | |
| | | | | |
| | 12,614 | | | CVS Caremark Corporation, (2) | | | | | | | | | 585,290 | |
| | | | Food Products – 2.2% | | | | | | | | | | |
| | | | | |
| | 6,632 | | | Kraft Foods Inc. | | | | | | | | | 301,623 | |
| | | | | |
| | 19,895 | | | Mondelez International Inc., Class A | | | | | | | | | 528,013 | |
| | | | Total Food Products | | | | | | | | | 829,636 | |
| | | | | | | | | | | | | | |
| Shares | | | Description (1) | | | | | | | | Value | |
| | | | Health Care Equipment & Supplies – 2.1% | | | | | | | | | | |
| | | | | |
| | 8,454 | | | Covidien PLC | | | | | | | | $ | 464,547 | |
| | | | | |
| | 8,941 | | | Saint Jude Medical Inc. | | | | | | | | | 342,083 | |
| | | | Total Health Care Equipment & Supplies | | | | | | | | | 806,630 | |
| | | | Health Care Providers & Services – 1.6% | | | | | | | | | | |
| | | | | |
| | 10,723 | | | UnitedHealth Group Incorporated | | | | | | | | | 600,488 | |
| | | | Household Durables – 2.9% | | | | | | | | | | |
| | | | | |
| | 10,486 | | | Jarden Corporation | | | | | | | | | 522,203 | |
| | | | | |
| | 5,981 | | | Whirlpool Corporation, (2) | | | | | | | | | 584,224 | |
| | | | Total Household Durables | | | | | | | | | 1,106,427 | |
| | | | Industrial Conglomerates – 1.4% | | | | | | | | | | |
| | | | | |
| | 25,828 | | | General Electric Company | | | | | | | | | 543,938 | |
| | | | Insurance – 3.0% | | | | | | | | | | |
| | | | | |
| | 13,708 | | | Allstate Corporation | | | | | | | | | 548,046 | |
| | | | | |
| | 10,431 | | | Prudential Financial, Inc. | | | | | | | | | 595,089 | |
| | | | Total Insurance | | | | | | | | | 1,143,135 | |
| | | | Internet & Catalog Retail – 1.2% | | | | | | | | | | |
| | | | | |
| | 760 | | | priceline.com Incorporated, (3) | | | | | | | | | 436,065 | |
| | | | Internet Software & Services – 2.5% | | | | | | | | | | |
| | | | | |
| | 1,389 | | | Google Inc., Class A, (3) | | | | | | | | | 944,201 | |
| | | | IT Services – 2.9% | | | | | | | | | | |
| | | | | |
| | 1,419 | | | MasterCard, Inc., Class A | | | | | | | | | 654,060 | |
| | | | | |
| | 6,278 | | | Teradata Corporation, (3) | | | | | | | | | 428,850 | |
| | | | Total IT Services | | | | | | | | | 1,082,910 | |
| | | | Leisure Equipment & Products – 1.9% | | | | | | | | | | |
| | | | | |
| | 16,033 | | | Brunswick Corporation, (2) | | | | | | | | | 378,218 | |
| | | | | |
| | 3,998 | | | Polaris Industries Inc., (2) | | | | | | | | | 337,831 | |
| | | | Total Leisure Equipment & Products | | | | | | | | | 716,049 | |
| | | | Life Sciences Tools & Services – 1.3% | | | | | | | | | | |
| | | | | |
| | 13,880 | | | Agilent Technologies, Inc., (2) | | | | | | | | | 499,541 | |
| | | | Machinery – 5.6% | | | | | | | | | | |
| | | | | |
| | 7,207 | | | Dover Corporation, (2) | | | | | | | | | 419,592 | |
| | | | | |
| | 15,757 | | | Eaton Corporation, (2) | | | | | | | | | 744,046 | |
| | | | | |
| | 13,456 | | | Ingersoll Rand Company Limited, Class A | | | | | | | | | 632,836 | |
| | | | | |
| | 4,431 | | | SPX Corporation | | | | | | | | | 303,922 | |
| | | | Total Machinery | | | | | | | | | 2,100,396 | |
| | | | Media – 1.1% | | | | | | | | | | |
| | | | | |
| | 3,656 | | | Liberty Media Corporation, Liberty Capital Class A Tracking Stock, (3) | | | | | | | | | 408,266 | |
| | | | Metals & Mining – 1.4% | | | | | | | | | | |
| | | | | |
| | 13,897 | | | Freeport-McMoRan Copper & Gold, Inc. | | | | | | | | | 540,315 | |
| | | | Multiline Retail – 2.7% | | | | | | | | | | |
| | | | | |
| | 13,022 | | | Macy’s, Inc. | | | | | | | | | 495,748 | |
| | | | | |
| | 8,362 | | | Target Corporation | | | | | | | | | 533,077 | |
| | | | Total Multiline Retail | | | | | | | | | 1,028,825 | |
| | | | Oil, Gas & Consumable Fuels – 7.6% | | | | | | | | | | |
| | | | | |
| | 12,821 | | | Anadarko Petroleum Corporation | | | | | | | | | 882,213 | |
| | | | | |
| | 22,657 | | | Marathon Oil Corporation | | | | | | | | | 681,069 | |
Portfolio of Investments
Nuveen Large Cap Select Fund (continued)
October 31, 2012
| | | | | | | | | | | | | | |
| Shares | | | Description (1) | | | | | | | | Value | |
| | | | Oil, Gas & Consumable Fuels (continued) | | | | | | | | | | |
| | | | | |
| | 8,361 | | | Occidental Petroleum Corporation | | | | | | | | $ | 660,185 | |
| | | | | |
| | 6,049 | | | Pioneer Natural Resources Company, (2) | | | | | | | | | 639,077 | |
| | | | Total Oil, Gas & Consumable Fuels | | | | | | | | | 2,862,544 | |
| | | | Paper & Forest Products – 1.1% | | | | | | | | | | |
| | | | | |
| | 11,198 | | | International Paper Company | | | | | | | | | 401,224 | |
| | | | Pharmaceuticals – 6.9% | | | | | | | | | | |
| | | | | |
| | 10,527 | | | GlaxoSmithKline PLC | | | | | | | | | 472,662 | |
| | | | | |
| | 18,289 | | | Merck & Company Inc. | | | | | | | | | 834,527 | |
| | | | | |
| | 51,967 | | | Pfizer Inc. | | | | | | | | | 1,292,419 | |
| | | | Total Pharmaceuticals | | | | | | | | | 2,599,608 | |
| | | | Semiconductors & Equipment – 1.4% | | | | | | | | | | |
| | | | | |
| | 18,710 | | | Maxim Integrated Products, Inc. | | | | | | | | | 514,993 | |
| | | | Software – 0.7% | | | | | | | | | | |
| | | | | |
| | 1,861 | | | Salesforce.com, Inc., (2), (3) | | | | | | | | | 271,669 | |
| | | | Specialty Retail – 3.9% | | | | | | | | | | |
| | | | | |
| | 11,320 | | | Foot Locker, Inc. | | | | | | | | | 379,220 | |
| | | | | |
| | 10,706 | | | Home Depot, Inc. | | | | | | | | | 657,133 | |
| | | | | |
| | 36,449 | | | Staples, Inc., (2) | | | | | | | | | 419,710 | |
| | | | Total Specialty Retail | | | | | | | | | 1,456,063 | |
| | | | Total Common Stocks (cost $33,480,333) | | | | | | | | | 36,827,763 | |
| | | | | |
| Shares | | | Description (1) | | | | | | | | Value | |
| | | | INVESTMENTS PURCHASED WITH COLLATERAL FROM SECURITIES LENDING – 19.0% | | | | | | | | | | |
| | | | | |
| | | | Money Market Funds – 19.0% | | | | | | | | | | |
| | | | | |
| | 7,204,060 | | | Mount Vernon Securities Lending Prime Portfolio, 0.295%, (4), (5) | | | | | | | | $ | 7,204,060 | |
| | | | Total Investments Purchased with Collateral from Securities Lending (cost $7,204,060) | | | | | | | | | 7,204,060 | |
| | | | | |
| Shares | | | Description (1) | | | | | | | | Value | |
| | | | SHORT-TERM INVESTMENTS – 3.2% | | | | | | | | | | |
| | | | | |
| | | | Money Market Funds – 3.2% | | | | | | | | | | |
| | | | | |
| | 1,198,235 | | | First American Treasury Obligations Fund, Class Z, 0.004%, (4) | | | | | | | | $ | 1,198,235 | |
| | | | Total Short-Term Investments (cost $1,198,235) | | | | | | | | | 1,198,235 | |
| | | | Total Investments (cost $41,882,628) – 119.7% | | | | | | | | | 45,230,058 | |
| | | | Other Assets Less Liabilities – (19.7)% | | | | | | | | | (7,451,159) | |
| | | | Net Assets – 100% | | | | | | | | $ | 37,778,899 | |
| | | | For Fund portfolio compliance purposes, the Fund’s industry classifications refer to any one or more of the industry sub-classifications used by one or more widely recognized market indexes or ratings group indexes, and/or as defined by Fund management. This definition may not apply for purposes of this report which may combine industry sub-classifications into sectors for reporting ease. |
| | (1) | | All percentages shown in the Portfolio of Investments are based on net assets. |
| | (2) | | Investment, or a portion of investment, is out on loan for securities lending. The total value of securities out on loan at the end of the reporting period was $7,077,605. |
| | (3) | | Non-income producing; issuer has not declared a dividend within the past twelve months. |
| | (4) | | The rate shown is the annualized seven-day effective yield at the end of the reporting period. |
| | (5) | | The Fund may loan securities representing up to one third of the fair value of its total assets (which includes collateral for securities on loan) to broker dealers, banks, and other institutions. The Fund maintains collateral equal to at least 102% of the fair value of the securities loaned. The cash collateral received by the Fund is invested in this money market fund. See Notes to Financial Statements, Footnote 1 – General Information and Significant Accounting Policies, Securities Lending for more information. |
See accompanying notes to financial statements.
Portfolio of Investments
Nuveen Mid Cap Select Fund
October 31, 2012
| | | | | | | | | | | | | | |
| Shares | | | Description (1) | | | | | | | | Value | |
| | | | COMMON STOCKS – 97.5% | | | | | | | | | | |
| | | | | |
| | | | Aerospace & Defense – 0.8% | | | | | | | | | | |
| | | | | |
| | 2,976 | | | General Dynamics Corporation | | | | | | | | $ | 202,606 | |
| | | | Airlines – 1.1% | | | | | | | | | | |
| | | | | |
| | 6,979 | | | Alaska Air Group, Inc., (3) | | | | | | | | | 266,877 | |
| | | | Biotechnology – 2.6% | | | | | | | | | | |
| | | | | |
| | 2,174 | | | Alexion Pharmaceuticals Inc., (2), (3) | | | | | | | | | 196,486 | |
| | | | | |
| | 2,789 | | | Onyx Pharmaceuticals Inc., (2), (3) | | | | | | | | | 218,546 | |
| | | | | |
| | 1,677 | | | Regeneron Pharmaceuticals, Inc., (2), (3) | | | | | | | | | 238,637 | |
| | | | Total Biotechnology | | | | | | | | | 653,669 | |
| | | | Capital Markets – 1.0% | | | | | | | | | | |
| | | | | |
| | 10,511 | | | Invesco LTD | | | | | | | | | 255,628 | |
| | | | Chemicals – 5.7% | | | | | | | | | | |
| | | | | |
| | 1,564 | | | CF Industries Holdings, Inc. | | | | | | | | | 320,917 | |
| | | | | |
| | 4,292 | | | FMC Corporation | | | | | | | | | 229,708 | |
| | | | | |
| | 5,127 | | | LyondellBasell Industries NV | | | | | | | | | 273,731 | |
| | | | | |
| | 4,544 | | | Minerals Technologies Inc., (2) | | | | | | | | | 325,623 | |
| | | | | |
| | 2,560 | | | PPG Industries, Inc. | | | | | | | | | 299,725 | |
| | | | Total Chemicals | | | | | | | | | 1,449,704 | |
| | | | Commercial Banks – 5.3% | | | | | | | | | | |
| | | | | |
| | 12,659 | | | East West Bancorp Inc. | | | | | | | | | 269,510 | |
| | | | | |
| | 30,543 | | | Fifth Third Bancorp. | | | | | | | | | 443,790 | |
| | | | | |
| | 11,256 | | | SunTrust Banks, Inc., (2) | | | | | | | | | 306,163 | |
| | | | | |
| | 14,957 | | | Webster Financial Corporation | | | | | | | | | 329,054 | |
| | | | Total Commercial Banks | | | | | | | | | 1,348,517 | |
| | | | Commercial Services & Supplies – 2.3% | | | | | | | | | | |
| | | | | |
| | 7,792 | | | G&K Services, Inc., Class A | | | | | | | | | 251,292 | |
| | | | | |
| | 13,039 | | | Tetra Tech, Inc., (2), (3) | | | | | | | | | 338,232 | |
| | | | Total Commercial Services & Supplies | | | | | | | | | 589,524 | |
| | | | Communications Equipment – 2.4% | | | | | | | | | | |
| | | | | |
| | 5,505 | | | Motorola Solutions Inc. | | | | | | | | | 284,498 | |
| | | | | |
| | 9,718 | | | Plantronics Inc., (2) | | | | | | | | | 315,252 | |
| | | | Total Communications Equipment | | | | | | | | | 599,750 | |
| | | | Computers & Peripherals – 0.7% | | | | | | | | | | |
| | | | | |
| | 5,928 | | | Diebold Inc. | | | | | | | | | 176,358 | |
| | | | Consumer Finance – 5.0% | | | | | | | | | | |
| | | | | |
| | 6,563 | | | Capital One Financial Corporation | | | | | | | | | 394,896 | |
| | | | | |
| | 9,469 | | | Discover Financial Services | | | | | | | | | 388,229 | |
| | | | | |
| | 27,608 | | | SLM Corporation, (2) | | | | | | | | | 485,349 | |
| | | | Total Consumer Finance | | | | | | | | | 1,268,474 | |
| | | | Containers & Packaging – 0.9% | | | | | | | | | | |
| | | | | |
| | 6,342 | | | Packaging Corp. of America | | | | | | | | | 223,682 | |
| | | | Diversified Consumer Services – 0.6% | | | | | | | | | | |
| | | | | |
| | 3,419 | | | Coinstar Inc., (2), (3) | | | | | | | | | 160,488 | |
| | | | Diversified Telecommunication Services – 0.8% | | | | | | | | | | |
| | | | | |
| | 25,989 | | | Cbeyond Inc., (3) | | | | | | | | | 199,076 | |
Portfolio of Investments
Nuveen Mid Cap Select Fund (continued)
October 31, 2012
| | | | | | | | | | | | | | |
| Shares | | | Description (1) | | | | | | | | Value | |
| | | | Electric Utilities – 2.5% | | | | | | | | | | |
| | | | | |
| | 7,782 | | | El Paso Electric Company, (2) | | | | | | | | $ | 264,510 | |
| | | | | |
| | 7,111 | | | Pinnacle West Capital Corporation, (2) | | | | | | | | | 376,670 | |
| | | | Total Electric Utilities | | | | | | | | | 641,180 | |
| | | | Electrical Equipment – 3.5% | | | | | | | | | | |
| | | | | |
| | 4,750 | | | Acuity Brands Inc. | | | | | | | | | 307,325 | |
| | | | | |
| | 9,018 | | | General Cable Corporation, (2), (3) | | | | | | | | | 257,284 | |
| | | | | |
| | 2,995 | | | Roper Industries Inc., (2) | | | | | | | | | 326,964 | |
| | | | Total Electrical Equipment | | | | | | | | | 891,573 | |
| | | | Electronic Equipment & Instruments – 1.0% | | | | | | | | | | |
| | | | | |
| | 4,258 | | | Amphenol Corporation, Class A, (2) | | | | | | | | | 256,034 | |
| | | | Energy Equipment & Services – 2.3% | | | | | | | | | | |
| | | | | |
| | 15,853 | | | Basic Energy Services, Inc., (2), (3) | | | | | | | | | 164,713 | |
| | | | | |
| | 26,415 | | | Key Energy Services Inc., (3) | | | | | | | | | 172,754 | |
| | | | | |
| | 3,477 | | | Oil States International Inc., (3) | | | | | | | | | 254,169 | |
| | | | Total Energy Equipment & Services | | | | | | | | | 591,636 | |
| | | | Food & Staples Retailing – 1.1% | | | | | | | | | | |
| | | | | |
| | 7,740 | | | Harris Teeter Supermarkets Incorporated | | | | | | | | | 289,863 | |
| | | | Gas Utilities – 2.0% | | | | | | | | | | |
| | | | | |
| | 7,981 | | | Atmos Energy Corporation | | | | | | | | | 287,077 | |
| | | | | |
| | 4,815 | | | Southwest Gas Corporation | | | | | | | | | 209,308 | |
| | | | Total Gas Utilities | | | | | | | | | 496,385 | |
| | | | Health Care Equipment & Supplies – 4.8% | | | | | | | | | | |
| | | | | |
| | 3,858 | | | Haemonetics Corporation, (3) | | | | | | | | | 315,199 | |
| | | | | |
| | 5,113 | | | ICU Medical, Inc., (2), (3) | | | | | | | | | 303,354 | |
| | | | | |
| | 2,927 | | | Idexx Labs Inc., (2), (3) | | | | | | | | | 281,577 | |
| | | | | |
| | 8,543 | | | Saint Jude Medical Inc. | | | | | | | | | 326,855 | |
| | | | Total Health Care Equipment & Supplies | | | | | | | | | 1,226,985 | |
| | | | Health Care Providers & Services – 1.3% | | | | | | | | | | |
| | | | | |
| | 3,510 | | | McKesson HBOC Inc. | | | | | | | | | 327,518 | |
| | | | Hotels, Restaurants & Leisure – 1.1% | | | | | | | | | | |
| | | | | |
| | 1,699 | | | Panera Bread Company, Class A, (3) | | | | | | | | | 286,519 | |
| | | | Household Durables – 2.7% | | | | | | | | | | |
| | | | | |
| | 5,374 | | | Jarden Corporation | | | | | | | | | 267,625 | |
| | | | | |
| | 4,247 | | | Whirlpool Corporation, (2) | | | | | | | | | 414,847 | |
| | | | Total Household Durables | | | | | | | | | 682,472 | |
| | | | Insurance – 4.6% | | | | | | | | | | |
| | | | | |
| | 6,222 | | | Allstate Corporation | | | | | | | | | 248,756 | |
| | | | | |
| | 30,236 | | | CNO Financial Group Inc., (2) | | | | | | | | | 289,661 | |
| | | | | |
| | 6,050 | | | Prudential Financial, Inc. | | | | | | | | | 345,153 | |
| | | | | |
| | 13,591 | | | Unum Group | | | | | | | | | 275,625 | |
| | | | Total Insurance | | | | | | | | | 1,159,195 | |
| | | | Internet Software & Services – 0.5% | | | | | | | | | | |
| | | | | |
| | 10,917 | | | Constant Contact Inc., (3) | | | | | | | | | 134,716 | |
| | | | Leisure Equipment & Products – 2.0% | | | | | | | | | | |
| | | | | |
| | 9,761 | | | Brunswick Corporation | | | | | | | | | 230,262 | |
| | | | | | | | | | | | | | |
| Shares | | | Description (1) | | | | | | | | Value | |
| | | | Leisure Equipment & Products (continued) | | | | | | | | | | |
| | | | | |
| | 3,279 | | | Polaris Industries Inc., (2) | | | | | | | | $ | 277,076 | |
| | | | Total Leisure Equipment & Products | | | | | | | | | 507,338 | |
| | | | Life Sciences Tools & Services – 1.0% | | | | | | | | | | |
| | | | | |
| | 7,090 | | | Agilent Technologies, Inc., (2) | | | | | | | | | 255,169 | |
| | | | Machinery – 6.5% | | | | | | | | | | |
| | | | | |
| | 10,417 | | | Actuant Corporation, Class A, (2) | | | | | | | | | 294,176 | |
| | | | | |
| | 5,982 | | | Crane Company | | | | | | | | | 251,124 | |
| | | | | |
| | 4,910 | | | Dover Corporation, (2) | | | | | | | | | 285,860 | |
| | | | | |
| | 8,830 | | | Eaton Corporation, (2) | | | | | | | | | 416,953 | |
| | | | | |
| | 8,594 | | | Ingersoll Rand Company Limited, Class A | | | | | | | | | 404,176 | |
| | | | Total Machinery | | | | | | | | | 1,652,289 | |
| | | | Media – 1.5% | | | | | | | | | | |
| | | | | |
| | 23,315 | | | Belo Corp. | | | | | | | | | 174,396 | |
| | | | | |
| | 20,793 | | | Interpublic Group Companies, Inc. | | | | | | | | | 210,009 | |
| | | | Total Media | | | | | | | | | 384,405 | |
| | | | Multiline Retail – 1.3% | | | | | | | | | | |
| | | | | |
| | 8,398 | | | Macy’s, Inc. | | | | | | | | | 319,712 | |
| | | | Multi-Utilities – 0.9% | | | | | | | | | | |
| | | | | |
| | 11,117 | | | CenterPoint Energy, Inc., (2) | | | | | | | | | 240,905 | |
| | | | Oil, Gas & Consumable Fuels – 4.2% | | | | | | | | | | |
| | | | | |
| | 2,679 | | | Concho Resources Inc., (3) | | | | | | | | | 230,715 | |
| | | | | |
| | 9,050 | | | Energy XXI Limited Bermuda, (2) | | | | | | | | | 299,555 | |
| | | | | |
| | 9,294 | | | Marathon Oil Corporation | | | | | | | | | 279,378 | |
| | | | | |
| | 7,153 | | | Plains Exploration & Production Company, (3) | | | | | | | | | 255,076 | |
| | | | Total Oil, Gas & Consumable Fuels | | | | | | | | | 1,064,724 | |
| | | | Personal Products – 1.5% | | | | | | | | | | |
| | | | | |
| | 8,015 | | | Nu Skin Enterprises, Inc., Class A, (2) | | | | | | | | | 379,350 | |
| | | | Real Estate Investment Trust – 6.3% | | | | | | | | | | |
| | | | | |
| | 3,320 | | | Digital Realty Trust Inc. | | | | | | | | | 203,948 | |
| | | | | |
| | 12,016 | | | Invesco Mortgage Capital Inc. | | | | | | | | | 257,503 | |
| | | | | |
| | 8,433 | | | Liberty Property Trust, (2) | | | | | | | | | 296,167 | |
| | | | | |
| | 35,832 | | | MFA Mortgage Investments, Inc. | | | | | | | | | 292,747 | |
| | | | | |
| | 9,446 | | | National Retail Properties, Inc., (2) | | | | | | | | | 299,249 | |
| | | | | |
| | 3,856 | | | PS Business Parks Inc., (2) | | | | | | | | | 247,285 | |
| | | | Total Real Estate Investment Trust | | | | | | | | | 1,596,899 | |
| | | | Road & Rail – 1.0% | | | | | | | | | | |
| | | | | |
| | 25,714 | | | Swift Transportation Company, Class A, (3) | | | | | | | | | 250,712 | |
| | | | Semiconductors & Equipment – 3.1% | | | | | | | | | | |
| | | | | |
| | 61,733 | | | Integrated Device Technology, Inc., (2), (3) | | | | | | | | | 335,828 | |
| | | | | |
| | 16,210 | | | Maxim Integrated Products, Inc. | | | | | | | | | 446,180 | |
| | | | Total Semiconductors & Equipment | | | | | | | | | 782,008 | |
| | | | Software – 4.5% | | | | | | | | | | |
| | | | | |
| | 8,722 | | | BMC Software, Inc., (3) | | | | | | | | | 354,985 | |
| | | | | |
| | 3,229 | | | CommVault Systems, Inc., (3) | | | | | | | | | 201,716 | |
| | | | | |
| | 7,121 | | | Red Hat, Inc., (3) | | | | | | | | | 350,140 | |
Portfolio of Investments
Nuveen Mid Cap Select Fund (continued)
October 31, 2012
| | | | | | | | | | | | | | |
| Shares | | | Description (1) | | | | | | | | Value | |
| | | | Software (continued) | | | | | | | | | | |
| | | | | |
| | 6,944 | | | Synopsys Inc., (3) | | | | | | | | $ | 223,597 | |
| | | | Total Software | | | | | | | | | 1,130,438 | |
| | | | Specialty Retail – 7.1% | | | | | | | | | | |
| | | | | |
| | 6,244 | | | Ann Inc., (2), (3) | | | | | | | | | 219,539 | |
| | | | | |
| | 13,587 | | | Ascena Retail Group Inc., (3) | | | | | | | | | 269,023 | |
| | | | | |
| | 11,959 | | | Foot Locker, Inc. | | | | | | | | | 400,626 | |
| | | | | |
| | 5,063 | | | GNC Holdings Inc., Class A, (2) | | | | | | | | | 195,785 | |
| | | | | |
| | 6,189 | | | PetSmart Inc. | | | | | | | | | 410,887 | |
| | | | | |
| | 27,616 | | | Staples, Inc., (2) | | | | | | | | | 317,997 | |
| | | | Total Specialty Retail | | | | | | | | | 1,813,857 | |
| | | | Total Common Stocks (cost $23,200,417) | | | | | | | | | 24,756,235 | |
| | | | | |
| Shares | | | Description (1) | | | | | | | | Value | |
| | | | INVESTMENTS PURCHASED WITH COLLATERAL FROM SECURITIES LENDING – 31.4% | | | | | | | | | | |
| | | | | |
| | | | Money Market Funds – 31.4% | | | | | | | | | | |
| | | | | |
| | 7,962,828 | | | Mount Vernon Securities Lending Prime Portfolio, 0.295%, (4), (5) | | | | | | | | $ | 7,962,828 | |
| | | | Total Investments Purchased with Collateral from Securities Lending (cost $7,962,828) | | | | | | | | | 7,962,828 | |
| | | | | |
| Shares | | | Description (1) | | | | | | | | Value | |
| | | | SHORT-TERM INVESTMENTS – 3.0% | | | | | | | | | | |
| | | | | |
| | | | Money Market Funds – 3.0% | | | | | | | | | | |
| | | | | |
| | 752,457 | | | First American Treasury Obligations Fund, Class Z, 0.004%, (4) | | | | | | | | $ | 752,457 | |
| | | | Total Short-Term Investments (cost $752,457) | | | | | | | | | 752,457 | |
| | | | Total Investments (cost $31,915,702) – 131.9% | | | | | | | | | 33,471,520 | |
| | | | Other Assets Less Liabilities – (31.9)% | | | | | | | | | (8,093,586) | |
| | | | Net Assets – 100% | | | | | | | | $ | 25,377,934 | |
| | | | For Fund portfolio compliance purposes, the Fund’s industry classifications refer to any one or more of the industry sub-classifications used by one or more widely recognized market indexes or ratings group indexes, and/or as defined by Fund management. This definition may not apply for purposes of this report which may combine industry sub-classifications into sectors for reporting ease. |
| | (1) | | All percentages shown in the Portfolio of Investments are based on net assets. |
| | (2) | | Investment, or a portion of investment, is out on loan for securities lending. The total value of securities out on loan at the end of the reporting period was $7,751,398. |
| | (3) | | Non-income producing; issuer has not declared a dividend within the past twelve months. |
| | (4) | | The rate shown is the annualized seven-day effective yield at the end of the reporting period. |
| | (5) | | The Fund may loan securities representing up to one third of the fair value of its total assets (which includes collateral for securities on loan) to broker dealers, banks, and other institutions. The Fund maintains collateral equal to at least 102% of the fair value of the securities loaned. The cash collateral received by the Fund is invested in this money market fund. See Notes to Financial Statements, Footnote 1 – General Information and Significant Accounting Policies, Securities Lending for more information. |
See accompanying notes to financial statements.
Portfolio of Investments
Nuveen Small Cap Select Fund
October 31, 2012
| | | | | | | | | | | | | | |
| Shares | | | Description (1) | | | | | | | | Value | |
| | | | COMMON STOCKS – 98.4% | | | | | | | | | | |
| | | | | |
| | | | Aerospace & Defense – 1.5% | | | | | | | | | | |
| | | | | |
| | 491,881 | | | Orbital Sciences Corporation, (2), (3) | | | | | | | | $ | 6,591,205 | |
| | | | Airlines – 1.0% | | | | | | | | | | |
| | | | | |
| | 63,190 | | | Allegiant Travel Company, (3) | | | | | | | | | 4,596,441 | |
| | | | Biotechnology – 2.8% | | | | | | | | | | |
| | | | | |
| | 50,283 | | | Alkermes Inc., (2), (3) | | | | | | | | | 931,744 | |
| | | | | |
| | 86,136 | | | Arena Pharmaceuticals, Inc., (2), (3) | | | | | | | | | 681,336 | |
| | | | | |
| | 108,420 | | | Cepheid, Inc., (2), (3) | | | | | | | | | 3,286,210 | |
| | | | | |
| | 58,783 | | | Cubist Pharmaceuticals Inc., (2), (3) | | | | | | | | | 2,521,791 | |
| | | | | |
| | 35,925 | | | Immunogen, Inc., (2), (3) | | | | | | | | | 398,049 | |
| | | | | |
| | 30,516 | | | Ironwood Pharmaceuticals Inc., Class A, (2), (3) | | | | | | | | | 354,901 | |
| | | | | |
| | 38,643 | | | ISIS Pharmaceuticals, Inc., (2), (3) | | | | | | | | | 334,262 | |
| | | | | |
| | 21,649 | | | Pharmacyclics, Inc., (2), (3) | | | | | | | | | 1,322,104 | |
| | | | | |
| | 37,324 | | | Seattle Genetics, Inc., (2), (3) | | | | | | | | | 939,072 | |
| | | | | |
| | 70,232 | | | Theravance Inc., (2), (3) | | | | | | | | | 1,580,922 | |
| | | | Total Biotechnology | | | | | | | | | 12,350,391 | |
| | | | Capital Markets – 7.3% | | | | | | | | | | |
| | | | | |
| | 504,293 | | | Calamos Asset Management, Inc. Class A, (2) | | | | | | | | | 5,446,364 | |
| | | | | |
| | 233,923 | | | Evercore Partners Inc., Class A | | | | | | | | | 6,526,452 | |
| | | | | |
| | 330,055 | | | Medley Capital Corporation | | | | | | | | | 4,752,792 | |
| | | | | |
| | 438,413 | | | Pennantpark Investment Corporation | | | | | | | | | 4,822,543 | |
| | | | | |
| | 135,581 | | | Stifel Financial Corporation, (2), (3) | | | | | | | | | 4,297,918 | |
| | | | | |
| | 205,607 | | | Waddell & Reed Financial, Inc., Class A, (2) | | | | | | | | | 6,852,881 | |
| | | | Total Capital Markets | | | | | | | | | 32,698,950 | |
| | | | Chemicals – 2.1% | | | | | | | | | | |
| | | | | |
| | 205,409 | | | Kraton Performance Polymers Inc., (3) | | | | | | | | | 4,482,024 | |
| | | | | |
| | 71,181 | | | Minerals Technologies Inc., (2) | | | | | | | | | 5,100,830 | |
| | | | Total Chemicals | | | | | | | | | 9,582,854 | |
| | | | Commercial Banks – 4.8% | | | | | | | | | | |
| | | | | |
| | 363,044 | | | Associated Banc-Corp., (2) | | | | | | | | | 4,679,637 | |
| | | | | |
| | 316,249 | | | Cardinal Financial Corporation, (2) | | | | | | | | | 5,050,497 | |
| | | | | |
| | 202,332 | | | East West Bancorp Inc. | | | | | | | | | 4,307,648 | |
| | | | | |
| | 27,531 | | | Home Bancshares, Inc. | | | | | | | | | 953,674 | |
| | | | | |
| | 548,900 | | | Umpqua Holdings Corporation, (2) | | | | | | | | | 6,636,201 | |
| | | | Total Commercial Banks | | | | | | | | | 21,627,657 | |
| | | | Commercial Services & Supplies – 1.3% | | | | | | | | | | |
| | | | | |
| | 265,392 | | | Interface, Inc. | | | | | | | | | 3,797,760 | |
| | | | | |
| | 160,016 | | | Sykes Enterprises Inc., (3) | | | | | | | | | 2,179,418 | |
| | | | Total Commercial Services & Supplies | | | | | | | | | 5,977,178 | |
| | | | Computers & Peripherals – 0.4% | | | | | | | | | | |
| | | | | |
| | 208,153 | | | QLogic Corporation, (3) | | | | | | | | | 1,952,475 | |
| | | | Construction & Engineering – 2.8% | | | | | | | | | | |
| | | | | |
| | 301,529 | | | MasTec Inc., (2), (3) | | | | | | | | | 6,802,494 | |
| | | | | |
| | 273,932 | | | MYR Group Inc., (3) | | | | | | | | | 5,801,880 | |
| | | | Total Construction & Engineering | | | | | | | | | 12,604,374 | |
Portfolio of Investments
Nuveen Small Cap Select Fund (continued)
October 31, 2012
| | | | | | | | | | | | | | |
| Shares | | | Description (1) | | | | | | | | Value | |
| | | | Containers & Packaging – 1.2% | | | | | | | | | | |
| | | | | |
| | 76,478 | | | Rock-Tenn Company, Class A | | | | | | | | $ | 5,597,425 | |
| | | | Diversified Consumer Services – 0.5% | | | | | | | | | | |
| | | | | |
| | 44,621 | | | Coinstar Inc., (2), (3) | | | | | | | | | 2,094,510 | |
| | | | Diversified Telecommunication Services – 1.5% | | | | | | | | | | |
| | | | | |
| | 858,049 | | | Cbeyond Inc., (3) | | | | | | | | | 6,572,655 | |
| | | | Electrical Equipment – 2.8% | | | | | | | | | | |
| | | | | |
| | 40,085 | | | Acuity Brands Inc. | | | | | | | | | 2,593,500 | |
| | | | | |
| | 195,515 | | | General Cable Corporation, (3) | | | | | | | | | 5,578,043 | |
| | | | | |
| | 65,491 | | | Regal-Beloit Corporation | | | | | | | | | 4,268,703 | |
| | | | Total Electrical Equipment | | | | | | | | | 12,440,246 | |
| | | | Electronic Equipment & Instruments – 1.8% | | | | | | | | | | |
| | | | | |
| | 534,502 | | | Newport Corporation, (3) | | | | | | | | | 5,783,312 | |
| | | | | |
| | 76,901 | | | ScanSource, Inc., (3) | | | | | | | | | 2,249,354 | |
| | | | Total Electronic Equipment & Instruments | | | | | | | | | 8,032,666 | |
| | | | Energy Equipment & Services – 3.4% | | | | | | | | | | |
| | | | | |
| | 149,525 | | | Atwood Oceanics Inc., (3) | | | | | | | | | 7,147,295 | |
| | | | | |
| | 884,549 | | | Key Energy Services Inc., (3) | | | | | | | | | 5,784,950 | |
| | | | | |
| | 526,338 | | | Parker Drilling Company, (2), (3) | | | | | | | | | 2,279,044 | |
| | | | Total Energy Equipment & Services | | | | | | | | | 15,211,289 | |
| | | | Food & Staples Retailing – 2.4% | | | | | | | | | | |
| | | | | |
| | 148,985 | | | Harris Teeter Supermarkets Incorporated | | | | | | | | | 5,579,488 | |
| | | | | |
| | 92,650 | | | Natural Grocers by Vitamin Cottage Incorporated, (2), (3) | | | | | | | | | 1,878,942 | |
| | | | | |
| | 203,416 | | | The Chef’s Warehouse Inc., (2), (3) | | | | | | | | | 3,140,743 | |
| | | | Total Food & Staples Retailing | | | | | | | | | 10,599,173 | |
| | | | Food Products – 1.5% | | | | | | | | | | |
| | | | | |
| | 363,020 | | | Smart Balance Inc., (2), (3) | | | | | | | | | 4,319,938 | |
| | | | | |
| | 47,162 | | | Treehouse Foods Inc., (2), (3) | | | | | | | | | 2,525,525 | |
| | | | Total Food Products | | | | | | | | | 6,845,463 | |
| | | | Gas Utilities – 2.1% | | | | | | | | | | |
| | | | | |
| | 261,111 | | | Atmos Energy Corporation | | | | | | | | | 9,392,163 | |
| | | | Health Care Equipment & Supplies – 5.2% | | | | | | | | | | |
| | | | | |
| | 148,066 | | | Align Technology, Inc., (2), (3) | | | | | | | | | 3,935,594 | |
| | | | | |
| | 36,935 | | | ICU Medical, Inc., (2), (3) | | | | | | | | | 2,191,354 | |
| | | | | |
| | 105,259 | | | Integra Lifesciences Holdings Corporation, (2), (3) | | | | | | | | | 4,026,157 | |
| | | | | |
| | 386,276 | | | Merit Medical Systems, Inc., (3) | | | | | | | | | 5,577,825 | |
| | | | | |
| | 31,793 | | | Sirona Dental Systems, Inc., (3) | | | | | | | | | 1,820,467 | |
| | | | | |
| | 167,787 | | | Thoratec Corporation, (3) | | | | | | | | | 5,989,996 | |
| | | | Total Health Care Equipment & Supplies | | | | | | | | | 23,541,393 | |
| | | | Health Care Providers & Services – 2.4% | | | | | | | | | | |
| | | | | |
| | 296,800 | | | HealthSouth Corporation, (2), (3) | | | | | | | | | 6,568,184 | |
| | | | | |
| | 63,946 | | | Mednax Inc., (3) | | | | | | | | | 4,410,995 | |
| | | | Total Health Care Providers & Services | | | | | | | | | 10,979,179 | |
| | | | Hotels, Restaurants & Leisure – 5.0% | | | | | | | | | | |
| | | | | |
| | 299,702 | | | Bravo Brio Restaurant Group, (2), (3) | | | | | | | | | 3,956,066 | |
| | | | | |
| | 176,409 | | | Caribou Coffee Company, Inc., (2), (3) | | | | | | | | | 2,111,616 | |
| | | | | | | | | | | | | | |
| Shares | | | Description (1) | | | | | | | | Value | |
| | | | Hotels, Restaurants & Leisure (continued) | | | | | | | | | | |
| | | | | |
| | 164,693 | | | Life Time Fitness Inc., (2), (3) | | | | | | | | $ | 7,393,069 | |
| | | | | |
| | 10,832 | | | Panera Bread Company, Class A, (3) | | | | | | | | | 1,826,708 | |
| | | | | |
| | 519,972 | | | Ruby Tuesday, Inc., (2), (3) | | | | | | | | | 3,754,198 | |
| | | | | |
| | 212,439 | | | Texas Roadhouse, Inc., (2) | | | | | | | | | 3,458,507 | |
| | | | Total Hotels, Restaurants & Leisure | | | | | | | | | 22,500,164 | |
| | | | Insurance – 2.5% | | | | | | | | | | |
| | | | | |
| | 150,147 | | | First American Corporation | | | | | | | | | 3,415,844 | |
| | | | | |
| | 657,265 | | | Maiden Holdings, Ltd | | | | | | | | | 5,553,889 | |
| | | | | |
| | 50,019 | | | Platinum Underwriters Holdings Limited | | | | | | | | | 2,220,844 | |
| | | | Total Insurance | | | | | | | | | 11,190,577 | |
| | | | Internet Software & Services – 3.1% | | | | | | | | | | |
| | | | | |
| | 276,121 | | | Keynote Systems, Inc. | | | | | | | | | 3,945,769 | |
| | | | | |
| | 107,521 | | | LogMeIn Inc., (2), (3) | | | | | | | | | 2,653,618 | |
| | | | | |
| | 416,877 | | | Vocus, Inc., (2), (3) | | | | | | | | | 7,399,567 | |
| | | | Total Internet Software & Services | | | | | | | | | 13,998,954 | |
| | | | IT Services – 1.3% | | | | | | | | | | |
| | | | | |
| | 281,210 | | | Euronet Worldwide, Inc., (2), (3) | | | | | | | | | 5,705,751 | |
| | | | Leisure Equipment & Products – 1.8% | | | | | | | | | | |
| | | | | |
| | 337,946 | | | Brunswick Corporation, (2) | | | | | | | | | 7,972,146 | |
| | | | Machinery – 4.0% | | | | | | | | | | |
| | | | | |
| | 212,373 | | | Actuant Corporation, Class A | | | | | | | | | 5,997,414 | |
| | | | | |
| | 256,805 | | | Altra Industrial Motion, Inc. | | | | | | | | | 4,627,626 | |
| | | | | |
| | 198,071 | | | ESCO Technologies Inc., (2) | | | | | | | | | 7,415,778 | |
| | | | Total Machinery | | | | | | | | | 18,040,818 | |
| | | | Media – 0.7% | | | | | | | | | | |
| | | | | |
| | 241,177 | | | ReachLocal Inc., (2), (3) | | | | | | | | | 2,976,124 | |
| | | | Metals & Mining – 0.5% | | | | | | | | | | |
| | | | | |
| | 73,715 | | | Schnitzer Steel Industries, Inc., Class A, (2) | | | | | | | | | 2,101,615 | |
| | | | Oil, Gas & Consumable Fuels – 3.9% | | | | | | | | | | |
| | | | | |
| | 339,129 | | | Comstock Resources Inc., (2), (3) | | | | | | | | | 5,805,888 | |
| | | | | |
| | 183,145 | | | Energy XXI Limited Bermuda, (2) | | | | | �� | | | | 6,062,100 | |
| | | | | |
| | 439,529 | | | Goodrich Petroleum Corporation, (2), (3) | | | | | | | | | 5,419,393 | |
| | | | Total Oil, Gas & Consumable Fuels | | | | | | | | | 17,287,381 | |
| | | | Paper & Forest Products – 0.9% | | | | | | | | | | |
| | | | | |
| | 148,475 | | | Buckeye Technologies Inc. | | | | | | | | | 3,890,045 | |
| | | | Pharmaceuticals – 1.8% | | | | | | | | | | |
| | | | | |
| | 160,352 | | | Impax Laboratories Inc., (3) | | | | | | | | | 3,407,480 | |
| | | | | |
| | 100,283 | | | Salix Pharmaceuticals Limited, (3) | | | | | | | | | 3,915,048 | |
| | | | | |
| | 40,652 | | | Vivus, Inc., (2), (3) | | | | | | | | | 605,715 | |
| | | | Total Pharmaceuticals | | | | | | | | | 7,928,243 | |
| | | | Professional Services – 1.6% | | | | | | | | | | |
| | | | | |
| | 393,534 | | | CBIZ Inc., (2), (3) | | | | | | | | | 2,172,308 | |
| | | | | |
| | 377,399 | | | TrueBlue Inc., (2), (3) | | | | | | | | | 4,925,057 | |
| | | | Total Professional Services | | | | | | | | | 7,097,365 | |
Portfolio of Investments
Nuveen Small Cap Select Fund (continued)
October 31, 2012
| | | | | | | | | | | | | | |
| Shares | | | Description (1) | | | | | | | | Value | |
| | | | Real Estate Investment Trust – 5.6% | | | | | | | | | | |
| | | | | |
| | 55,177 | | | EastGroup Properties Inc., (2) | | | | | | | | $ | 2,872,515 | |
| | | | | |
| | 286,624 | | | Invesco Mortgage Capital Inc. | | | | | | | | | 6,142,352 | |
| | | | | |
| | 463,145 | | | MFA Mortgage Investments, Inc. | | | | | | | | | 3,783,895 | |
| | | | | |
| | 175,705 | | | National Retail Properties, Inc., (2) | | | | | | | | | 5,566,334 | |
| | | | | |
| | 67,231 | | | PS Business Parks Inc., (2) | | | | | | | | | 4,311,524 | |
| | | | | |
| | 159,575 | | | Terreno Realty Corporation, (2) | | | | | | | | | 2,435,115 | |
| | | | Total Real Estate Investment Trust | | | | | | | | | 25,111,735 | |
| | | | Road & Rail – 1.3% | | | | | | | | | | |
| | | | | |
| | 208,756 | | | Con-Way, Inc., (2) | | | | | | | | | 6,076,887 | |
| | | | Semiconductors & Equipment – 4.5% | | | | | | | | | | |
| | | | | |
| | 1,408,613 | | | Integrated Device Technology, Inc., (2), (3) | | | | | | | | | 7,662,855 | |
| | | | | |
| | 348,261 | | | International Rectifier Corporation, (2), (3) | | | | | | | | | 5,394,563 | |
| | | | | |
| | 284,251 | | | Semtech Corporation, (2), (3) | | | | | | | | | 7,097,747 | |
| | | | Total Semiconductors & Equipment | | | | | | | | | 20,155,165 | |
| | | | Software – 3.2% | | | | | | | | | | |
| | | | | |
| | 257,714 | | | Fortinet Inc., (3) | | | | | | | | | 4,991,920 | |
| | | | | |
| | 63,180 | | | Guidewire Software Incorporated, (2), (3) | | | | | | | | | 1,935,835 | |
| | | | | |
| | 72,076 | | | Progress Software Corporation, (3) | | | | | | | | | 1,421,339 | |
| | | | | |
| | 1,151,559 | | | Smith Micro Software, Inc., (3) | | | | | | | | | 1,439,449 | |
| | | | | |
| | 100,666 | | | Synchronoss Technologies, Inc., (2), (3) | | | | | | | | | 2,062,646 | |
| | | | | |
| | 197,271 | | | Tangoe Inc., (3) | | | | | | | | | 2,548,741 | |
| | | | Total Software | | | | | | | | | 14,399,930 | |
| | | | Specialty Retail – 3.6% | | | | | | | | | | |
| | | | | |
| | 128,688 | | | Ann Inc., (2), (3) | | | | | | | | | 4,524,670 | |
| | | | | |
| | 374,972 | | | Ascena Retail Group Inc., (3) | | | | | | | | | 7,424,446 | |
| | | | | |
| | 164,128 | | | Zumiez, Inc., (2), (3) | | | | | | | | | 4,154,080 | |
| | | | Total Specialty Retail | | | | | | | | | 16,103,196 | |
| | | | Textiles, Apparel & Luxury Goods – 3.1% | | | | | | | | | | |
| | | | | |
| | 116,433 | | | Columbia Sportswear Company, (2) | | | | | | | | | 6,566,821 | |
| | | | | |
| | 195,985 | | | G III Apparel Group, Limited, (3) | | | | | | | | | 7,243,606 | |
| | | | Total Textiles, Apparel & Luxury Goods | | | | | | | | | 13,810,427 | |
| | | | Thrifts & Mortgage Finance – 1.2% | | | | | | | | | | |
| | | | | |
| | 344,477 | | | Everbank Financial Corporation, (2) | | | | | | | | | 5,249,829 | |
| | | | Total Common Stocks (cost $415,277,935) | | | | | | | | | 440,884,039 | |
| | | | | |
| Shares | | | Description (1) | | | | | | | | Value | |
| | | | INVESTMENTS PURCHASED WITH COLLATERAL FROM SECURITIES LENDING – 32.8% | | | | | | | | | | |
| | | | | |
| | | | Money Market Funds – 32.8% | | | | | | | | | | |
| | | | | |
| | 146,829,843 | | | Mount Vernon Securities Lending Prime Portfolio, 0.295%, (4), (5) | | | | | | | | $ | 146,829,843 | |
| | | | Total Investments Purchased with Collateral from Securities Lending (cost $146,829,843) | | | | | | | | | 146,829,843 | |
| | | | | | | | | | | | | | |
| Shares | | | Description (1) | | | | | | | | Value | |
| | | | SHORT-TERM INVESTMENTS – 1.6% | | | | | | | | | | |
| | | | | |
| | | | Money Market Funds – 1.6% | | | | | | | | | | |
| | | | | |
| | 7,098,142 | | | First American Treasury Obligations Fund, Class Z, 0.004%, (4) | | | | | | | | $ | 7,098,142 | |
| | | | Total Short-Term Investments (cost $7,098,142) | | | | | | | | | 7,098,142 | |
| | | | Total Investments (cost $569,205,920) – 132.8% | | | | | | | | | 594,812,024 | |
| | | | Other Assets Less Liabilities – (32.8)% | | | | | | | | | (146,952,456) | |
| | | | Net Assets – 100% | | | | | | | | $ | 447,859,568 | |
| | | | For Fund portfolio compliance purposes, the Fund’s industry classifications refer to any one or more of the industry sub-classifications used by one or more widely recognized market indexes or ratings group indexes, and/or as defined by Fund management. This definition may not apply for purposes of this report which may combine industry sub-classifications into sectors for reporting ease. |
| | (1) | | All percentages shown in the Portfolio of Investments are based on net assets. |
| | (2) | | Investment, or a portion of investment, is out on loan for securities lending. The total value of securities out on loan at the end of the reporting period was $140,222,641. |
| | (3) | | Non-income producing; issuer has not declared a dividend within the past twelve months. |
| | (4) | | The rate shown is the annualized seven-day effective yield at the end of the reporting period. |
| | (5) | | The Fund may loan securities representing up to one third of the fair value of its total assets (which includes collateral for securities on loan) to broker dealers, banks, and other institutions. The Fund maintains collateral equal to at least 102% of the fair value of the securities loaned. The cash collateral received by the Fund is invested in this money market fund. See Notes to Financial Statements, Footnote 1 – General Information and Significant Accounting Policies, Securities Lending for more information. |
See accompanying notes to financial statements.
Statement of Assets & Liabilities
October 31, 2012
| | | | | | | | | | | | |
| | | Large Cap
Select | | | Mid Cap
Select | | | Small Cap
Select | |
Assets | | | | | | | | | | | | |
Investments, at value (cost $34,678,568, $23,952,874 and $422,376,077, respectively) | | $ | 38,025,998 | | | $ | 25,508,692 | | | $ | 447,982,181 | |
Investments purchased with collateral from securities lending (at cost, which approximates value) | | | 7,204,060 | | | | 7,962,828 | | | | 146,829,843 | |
Cash | | | 36,158 | | | | 59 | | | | 91,010 | |
Receivables: | | | | | | | | | | | | |
Dividends | | | 16,377 | | | | 13,349 | | | | 126,016 | |
Due from broker | | | 819 | | | | 1,262 | | | | 29,657 | |
Investments sold | | | 1,952,935 | | | | — | | | | 410,362 | |
Shares sold | | | 9,660 | | | | 2,439 | | | | 516,427 | |
Other assets | | | 84 | | | | 101 | | | | 6,901 | |
Total assets | | | 47,246,091 | | | | 33,488,730 | | | | 595,992,397 | |
Liabilities | | | | | | | | | | | | |
Payables: | | | | | | | | | | | | |
Collateral from securities lending program | | | 7,204,060 | | | | 7,962,828 | | | | 146,829,843 | |
Investments purchased | | | 2,003,945 | | | | — | | | | — | |
Shares redeemed | | | 222,270 | | | | 95,735 | | | | 688,562 | |
Accrued expenses: | | | | | | | | | | | | |
Directors fees | | | 322 | | | | 212 | | | | 9,675 | |
Management fees | | | 24,694 | | | | 16,785 | | | | 299,660 | |
12b-1 distribution and service fees | | | 841 | | | | 3,761 | | | | 52,207 | |
Other | | | 11,060 | | | | 31,475 | | | | 252,882 | |
Total liabilities | | | 9,467,192 | | | | 8,110,796 | | | | 148,132,829 | |
Net assets | | $ | 37,778,899 | | | $ | 25,377,934 | | | $ | 447,859,568 | |
Class A Shares | | | | | | | | | | | | |
Net assets | | $ | 2,923,638 | | | $ | 10,862,434 | | | $ | 155,623,564 | |
Shares outstanding | | | 217,925 | | | | 1,054,488 | | | | 11,490,089 | |
Net asset value per share | | $ | 13.42 | | | $ | 10.30 | | | $ | 13.54 | |
Offering price per share (net asset value per share plus maximum sales charge of 5.75% of offering price) | | $ | 14.24 | | | $ | 10.93 | | | $ | 14.37 | |
Class B Shares | | | | | | | | | | | | |
Net assets | | | N/A | | | | N/A | | | $ | 2,031,571 | |
Shares outstanding | | | N/A | | | | N/A | | | | 193,728 | |
Net asset value and offering price per share | | | N/A | | | | N/A | | | $ | 10.49 | |
Class C Shares | | | | | | | | | | | | |
Net assets | | $ | 194,760 | | | $ | 1,710,252 | | | $ | 10,058,196 | |
Shares outstanding | | | 15,299 | | | | 182,183 | | | | 831,919 | |
Net asset value and offering price per share | | $ | 12.73 | | | $ | 9.39 | | | $ | 12.09 | |
Class R3 Shares | | | | | | | | | | | | |
Net assets | | $ | 106,419 | | | | N/A | | | $ | 18,386,217 | |
Shares outstanding | | | 8,046 | | | | N/A | | | | 1,396,142 | |
Net asset value and offering price per share | | $ | 13.23 | | | | N/A | | | $ | 13.17 | |
Class I Shares | | | | | | | | | | | | |
Net assets | | $ | 34,554,082 | | | $ | 12,805,248 | | | $ | 261,760,020 | |
Shares outstanding | | | 2,555,722 | | | | 1,185,800 | | | | 17,666,819 | |
Net asset value and offering price per share | | $ | 13.52 | | | $ | 10.80 | | | $ | 14.82 | |
Net assets consist of: | | | | | | | | | | | | |
Capital paid-in | | $ | 105,209,976 | | | $ | 44,161,403 | | | $ | 358,910,203 | |
Undistributed (Over-distribution of) net investment income | | | 167,190 | | | | 117,145 | | | | (18,982 | ) |
Accumulated net realized gain (loss) | | | (70,945,697 | ) | | | (20,456,432 | ) | | | 63,362,243 | |
Net unrealized appreciation (depreciation) | | | 3,347,430 | | | | 1,555,818 | | | | 25,606,104 | |
Net assets | | $ | 37,778,899 | | | $ | 25,377,934 | | | $ | 447,859,568 | |
Authorized shares – per class | | | 2 billion | | | | 2 billion | | | | 2 billion | |
Par value per share | | $ | 0.0001 | | | $ | 0.0001 | | | $ | 0.0001 | |
| N/A - | Large Cap Select does not offer Class B Shares and Mid Cap Select does not offer Class R3 Shares. Class B Shares of Mid Cap Select converted to Class A Shares at the close of business on February 15, 2012 and are no longer available for dividend reinvestment or through an exchange from other Nuveen mutual funds. |
See accompanying notes to financial statements.
Statement of Operations
Year Ended October 31, 2012
| | | | | | | | | | | | |
| | | Large Cap
Select | | | Mid Cap
Select | | | Small Cap
Select | |
Investment Income | | | | | | | | | | | | |
Dividend and interest income (net of foreign tax withheld of $1,865, $596 and $–, respectively) | | $ | 743,329 | | | $ | 477,508 | | | $ | 4,075,307 | |
Securities lending income, net | | | 18,593 | | | | 22,076 | | | | 582,563 | |
Total investment income | | | 761,922 | | | | 499,584 | | | | 4,657,870 | |
Expenses | | | | | | | | | | | | |
Management fees | | | 332,891 | | | | 249,307 | | | | 4,584,082 | |
12b-1 service fees – Class A | | | 7,413 | | | | 27,995 | | | | 521,432 | |
12b-1 distribution and service fees – Class B(1) | | | N/A | | | | 2,177 | | | | 24,850 | |
12b-1 distribution and service fees – Class C | | | 1,819 | | | | 17,480 | | | | 121,924 | |
12b-1 distribution and service fees – Class R3 | | | 535 | | | | N/A | | | | 96,427 | |
Shareholder servicing agent fees and expenses | | | 96,830 | | | | 115,248 | | | | 756,271 | |
Custodian’s fees and expenses | | | 22,367 | | | | 16,016 | | | | 86,987 | |
Directors fees and expenses | | | 1,409 | | | | 955 | | | | 14,930 | |
Professional fees | | | 10,002 | | | | 7,691 | | | | 47,386 | |
Shareholder reporting expenses | | | 4,248 | | | | 17,392 | | | | 169,682 | |
Federal and state registration fees | | | 49,820 | | | | 43,287 | | | | 71,059 | |
Other expenses | | | 7,448 | | | | 6,903 | | | | 29,486 | |
Total expenses before expense reimbursement | | | 534,782 | | | | 504,451 | | | | 6,524,516 | |
Expense reimbursement | | | (34 | ) | | | (135,661 | ) | | | (428,176 | ) |
Net expenses | | | 534,748 | | | | 368,790 | | | | 6,096,340 | |
Net investment income (loss) | | | 227,174 | | | | 130,794 | | | | (1,438,470 | ) |
Realized and Unrealized Gain (Loss) | | | | | | | | | | | | |
Net realized gain (loss) from: | | | | | | | | | | | | |
Investments | | | 5,458,240 | | | | 3,074,977 | | | | 72,006,971 | |
Futures contracts | | | — | | | | — | | | | 1,762,906 | |
Change in net unrealized appreciation (depreciation) of investments | | | 476,212 | | | | (840,405 | ) | | | (482,307 | ) |
Net realized and unrealized gain (loss) | | | 5,934,452 | | | | 2,234,572 | | | | 73,287,570 | |
Net increase (decrease) in net assets from operations | | $ | 6,161,626 | | | $ | 2,365,366 | | | $ | 71,849,100 | |
| N/A - | Large Cap Select does not offer Class B Shares and Mid Cap Select does not offer Class R3 Shares. |
| (1) | Class B Shares of Mid Cap Select converted to Class A Shares at the close of business on February 15, 2012 and are no longer available for dividend reinvestment or through an exchange from other Nuveen mutual funds. |
See accompanying notes to financial statements.
Statement of Changes in Net Assets
| | | | | | | | | | | | | | | | | | | | | | | | |
| | | Large Cap Select | | | Mid Cap Select | | | Small Cap Select | |
| | | Year Ended
10/31/12 | | | Year Ended
10/31/11 | | | Year Ended
10/31/12 | | | Year Ended
10/31/11 | | | Year Ended
10/31/12 | | | Year Ended
10/31/11 | |
Operations | | | | | | | | | | | | | | | | | | | | | | | | |
Net investment income (loss) | | $ | 227,174 | | | $ | 58,871 | | | $ | 130,794 | | | $ | (148,459 | ) | | $ | (1,438,470 | ) | | $ | (4,233,152 | ) |
Net realized gain (loss) from: | | | | | | | | | | | | | | | | | | | | | | | | |
Investments | | | 5,458,240 | | | | 17,580,711 | | | | 3,074,977 | | | | 3,660,893 | | | | 72,006,971 | | | | 112,701,639 | |
Futures contracts | | | — | | | | — | | | | — | | | | 253,183 | | | | 1,762,906 | | | | — | |
Redemptions in-kind | | | — | | | | 3,119,565 | | | | — | | | | — | | | | — | | | | 14,572,758 | |
Change in net unrealized appreciation (depreciation) of investments | | | 476,212 | | | | (16,096,080 | ) | | | (840,405 | ) | | | (2,658,745 | ) | | | (482,307 | ) | | | (67,223,592 | ) |
Net increase (decrease) in net assets from operations | | | 6,161,626 | | | | 4,663,067 | | | | 2,365,366 | | | | 1,106,872 | | | | 71,849,100 | | | | 55,817,653 | |
Distributions to Shareholders | | | | | | | | | | | | | | | | | | | | | | | | |
From net investment income: | | | | | | | | | | | | | | | | | | | | | | | | |
Class A | | | — | | | | — | | | | — | | | | — | | | | — | | | | — | |
Class B(1) | | | N/A | | | | N/A | | | | — | | | | — | | | | — | | | | — | |
Class C | | | — | | | | — | | | | — | | | | — | | | | — | | | | — | |
Class R3 | | | — | | | | — | | | | N/A | | | | N/A | | | | — | | | | — | |
Class I | | | (49,038 | ) | | | (150,204 | ) | | | — | | | | — | | | | — | | | | — | |
From accumulated net realized gains: | | | | | | | | | | | | | | | | | | | | | | | | |
Class A | | | — | | | | — | | | | — | | | | — | | | | (6,635,027 | ) | | | — | |
Class B(1) | | | N/A | | | | N/A | | | | — | | | | — | | | | (85,210 | ) | | | — | |
Class C | | | — | | | | — | | | | — | | | | — | | | | (355,958 | ) | | | — | |
Class R3 | | | — | | | | — | | | | N/A | | | | N/A | | | | (488,508 | ) | | | — | |
Class I | | | — | | | | — | | | | — | | | | — | | | | (5,892,281 | ) | | | — | |
Decrease in net assets from distributions to shareholders | | | (49,038 | ) | | | (150,204 | ) | | | — | | | | — | | | | (13,456,984 | ) | | | — | |
Fund Share Transactions | | | | | | | | | | | | | | | | | | | | | | | | |
Proceeds from sale of shares | | | 2,708,944 | | | | 4,582,330 | | | | 2,158,779 | | | | 2,536,394 | | | | 104,005,532 | | | | 188,172,315 | |
Proceeds from shares issued to shareholders due to reinvestment of distributions | | | 22,258 | | | | 73,066 | | | | — | | | | — | | | | 12,262,815 | | | | — | |
| | | 2,731,202 | | | | 4,655,396 | | | | 2,158,779 | | | | 2,536,394 | | | | 116,268,347 | | | | 188,172,315 | |
Cost of shares redeemed | | | (32,611,841 | ) | | | (66,857,732 | ) | | | (9,196,987 | ) | | | (12,697,979 | ) | | | (313,697,046 | ) | | | (386,973,091 | ) |
Cost of redemptions in-kind | | | — | | | | (15,345,963 | ) | | | — | | | | — | | | | — | | | | (49,354,066 | ) |
Net increase (decrease) in net assets from Fund share transactions | | | (29,880,639 | ) | | | (77,548,299 | ) | | | (7,038,208 | ) | | | (10,161,585 | ) | | | (197,428,699 | ) | | | (248,154,842 | ) |
Net increase (decrease) in net assets | | | (23,768,051 | ) | | | (73,035,436 | ) | | | (4,672,842 | ) | | | (9,054,713 | ) | | | (139,036,583 | ) | | | (192,337,189 | ) |
Net assets at the beginning of period | | | 61,546,950 | | | | 134,582,386 | | | | 30,050,776 | | | | 39,105,489 | | | | 586,896,151 | | | | 779,233,340 | |
Net assets at the end of period | | $ | 37,778,899 | | | $ | 61,546,950 | | | $ | 25,377,934 | | | $ | 30,050,776 | | | $ | 447,859,568 | | | $ | 586,896,151 | |
Undistributed (Over-distribution of) net investment income at the end of period | | $ | 167,190 | | | $ | (10,946 | ) | | $ | 117,145 | | | $ | (10,081 | ) | | $ | (18,982 | ) | | $ | (14,674 | ) |
| N/A - | Large Cap Select does not offer Class B Shares and Mid Cap Select does not offer Class R3 Shares. |
| (1) | Class B Shares of MidCap Select converted to Class A Shares at the close of business on February 15, 2012 and are no longer available for dividend reinvestment or through an exchange from other Nuveen mutual funds. |
See accompanying notes to financial statements.
[THIS PAGE INTENTIONALLY LEFT BLANK]
Financial Highlights
| | | | | | | | | | | | | | | | | | | | | | | | | | | | | | | | |
| Selected data for a share outstanding throughout each period: | | | | |
| | | | | | |
| Class (Commencement Date) | | | | | | | | | | | | | | | | | | | |
| | | | | | Investment Operations | | | Less Distributions | | | | |
| | | | | | | |
| LARGE CAP SELECT | | | | | | | | | | | | | | | | | | | | | | |
Year Ended
October 31, | | Beginning
Net
Asset
Value | | | Net
Invest-
ment
Income
(Loss)(a) | | | Net
Realized/
Unrealized
Gain
(Loss) | | | Total | | | Net
Invest-
ment
Income | | | Capital
Gains(b) | | | Total | | | Ending
Net
Asset
Value | |
Class A (1/03) | | | | | | | | | | | | | | | | | | | | | | | | | | | | | |
2012 | | $ | 11.73 | | | $ | .03 | | | $ | 1.66 | | | $ | 1.69 | | | $ | — | | | $ | — | | | $ | — | | | $ | 13.42 | |
2011 | | | 11.65 | | | | (.02 | ) | | | .10 | | | | .08 | | | | — | | | | — | | | | — | | | | 11.73 | |
2010 | | | 9.80 | | | | (.01 | ) | | | 1.92 | | | | 1.91 | | | | (.06 | ) | | | — | | | | (.06 | ) | | | 11.65 | |
2009 | | | 8.83 | | | | .04 | | | | .97 | | | | 1.01 | | | | (.04 | ) | | | — | | | | (.04 | ) | | | 9.80 | |
2008 | | | 17.05 | | | | .06 | | | | (6.04 | ) | | | (5.98 | ) | | | (.04 | ) | | | (2.20 | ) | | | (2.24 | ) | | | 8.83 | |
Class C (1/03) | | | | | | | | | | | | | | | | | | | | | | | | | | | | | |
2012 | | | 11.21 | | | | (.06 | ) | | | 1.58 | | | | 1.52 | | | | — | | | | — | | | | — | | | | 12.73 | |
2011 | | | 11.22 | | | | (.11 | ) | | | .10 | | | | (.01 | ) | | | — | | | | — | | | | — | | | | 11.21 | |
2010 | | | 9.46 | | | | (.08 | ) | | | 1.84 | | | | 1.76 | | | | — | | | | — | | | | — | | | | 11.22 | |
2009 | | | 8.56 | | | | (.02 | ) | | | .93 | | | | .91 | | | | (.01 | ) | | | — | | | | (.01 | ) | | | 9.46 | |
2008 | | | 16.69 | | | | (.03 | ) | | | (5.90 | ) | | | (5.93 | ) | | | — | | | | (2.20 | ) | | | (2.20 | ) | | | 8.56 | |
Class R3 (1/03) | | | | | | | | | | | | | | | | | | | | | | | | | | | | | |
2012 | | | 11.59 | | | | — | * | | | 1.64 | | | | 1.64 | | | | — | | | | — | | | | — | | | | 13.23 | |
2011 | | | 11.54 | | | | (.05 | ) | | | .10 | | | | .05 | | | | — | | | | — | | | | — | | | | 11.59 | |
2010 | | | 9.74 | | | | (.03 | ) | | | 1.89 | | | | 1.86 | | | | (.06 | ) | | | — | | | | (.06 | ) | | | 11.54 | |
2009 | | | 8.78 | | | | .01 | | | | .98 | | | | .99 | | | | (.03 | ) | | | — | | | | (.03 | ) | | | 9.74 | |
2008 | | | 16.97 | | | | .03 | | | | (6.00 | ) | | | (5.97 | ) | | | (.02 | ) | | | (2.20 | ) | | | (2.22 | ) | | | 8.78 | |
Class I (1/03) | | | | | | | | | | | | | | | | | | | | | | | | | | | | | |
2012 | | | 11.80 | | | | .07 | | | | 1.66 | | | | 1.73 | | | | (.01 | ) | | | — | | | | (.01 | ) | | | 13.52 | |
2011 | | | 11.71 | | | | .01 | | | | .10 | | | | .11 | | | | (.02 | ) | | | — | | | | (.02 | ) | | | 11.80 | |
2010 | | | 9.85 | | | | .02 | | | | 1.92 | | | | 1.94 | | | | (.08 | ) | | | — | | | | (.08 | ) | | | 11.71 | |
2009 | | | 8.87 | | | | .07 | | | | .96 | | | | 1.03 | | | | (.05 | ) | | | — | | | | (.05 | ) | | | 9.85 | |
2008 | | | 17.10 | | | | .09 | | | | (6.05 | ) | | | (5.96 | ) | | | (.07 | ) | | | (2.20 | ) | | | (2.27 | ) | | | 8.87 | |
| | | | | | | | | | | | | | | | | | | | | | | | | | |
| | | | | | | | | | | | | | | | | | | | |
| | | | |
| | | | | | | | | | | | | | |
| | | | Ratios/Supplemental Data | |
| | | | | | | Ratios to Average
Net Assets Before
Reimbursement | | | Ratios to Average
Net Assets After
Reimbursement(d) | | | | |
Total
Return(c) | | | Ending
Net
Assets
(000) | | | Expenses | | | Net
Invest-
ment
Income
(Loss) | | | Expenses | | | Net
Invest-
ment
Income
(Loss) | | | Portfolio
Turnover
Rate | |
| | | | | | | | | | | | | | | | | | | | | | | | | | |
| | 14.41 | % | | $ | 2,924 | | | | 1.43 | % | | | .26 | % | | | 1.43 | % | | | .26 | % | | | 127 | % |
| | .69 | | | | 2,938 | | | | 1.20 | | | | (.18 | ) | | | 1.20 | | | | (.18 | ) | | | 139 | |
| | 19.49 | | | | 3,487 | | | | 1.32 | | | | (.06 | ) | | | 1.32 | | | | (.06 | ) | | | 140 | |
| | 11.54 | | | | 3,292 | | | | 1.29 | | | | .52 | | | | 1.29 | | | | .52 | | | | 185 | |
| | (39.81 | ) | | | 3,608 | | | | 1.21 | | | | .49 | | | | 1.21 | | | | .49 | | | | 210 | |
| | | | | | | | | | | | | | | | | | | | | | | | | | |
| | 13.65 | | | | 195 | | | | 2.18 | | | | (.49 | ) | | | 2.18 | | | | (.49 | ) | | | 127 | |
| | (.09 | ) | | | 183 | | | | 1.95 | | | | (.90 | ) | | | 1.95 | | | | (.90 | ) | | | 139 | |
| | 18.60 | | | | 175 | | | | 2.07 | | | | (.79 | ) | | | 2.07 | | | | (.79 | ) | | | 140 | |
| | 10.64 | | | | 186 | | | | 2.05 | | | | (.23 | ) | | | 2.05 | | | | (.23 | ) | | | 185 | |
| | (40.38 | ) | | | 180 | | | | 1.96 | | | | (.26 | ) | | | 1.96 | | | | (.26 | ) | | | 210 | |
| | | | | | | | | | | | | | | | | | | | | | | | | | |
| | 14.15 | | | | 106 | | | | 1.68 | | | | .02 | | | | 1.68 | | | | .02 | | | | 127 | |
| | .43 | | | | 112 | | | | 1.45 | | | | (.42 | ) | | | 1.45 | | | | (.42 | ) | | | 139 | |
| | 19.11 | | | | 117 | | | | 1.58 | | | | (.32 | ) | | | 1.58 | | | | (.32 | ) | | | 140 | |
| | 11.31 | | | | 66 | | | | 1.56 | | | | .12 | | | | 1.56 | | | | .12 | | | | 185 | |
| | (39.94 | ) | | | 20 | | | | 1.46 | | | | .24 | | | | 1.46 | | | | .24 | | | | 210 | |
| | | | | | | | | | | | | | | | | | | | | | | | | | |
| | 14.79 | | | | 34,554 | | | | 1.18 | | | | .54 | | | | 1.18 | | | | .54 | | | | 127 | |
| | .89 | | | | 58,314 | | | | .95 | | | | .07 | | | | .95 | | | | .07 | | | | 139 | |
| | 19.75 | | | | 130,803 | | | | 1.07 | | | | .21 | | | | 1.07 | | | | .21 | | | | 140 | |
| | 11.81 | | | | 147,231 | | | | 1.04 | | | | .82 | | | | 1.04 | | | | .82 | | | | 185 | |
| | (39.63 | ) | | | 207,904 | | | | .96 | | | | .74 | | | | .96 | | | | .74 | | | | 210 | |
| (a) | Per share Net Investment Income (Loss) is calculated using the average daily shares method. |
| (b) | Distributions from Capital Gains include short-term capital gains, if any. |
| (c) | Total return is the combination of changes in net asset value without any sales charge, reinvested dividend income at net asset value and reinvested capital gains distributions at net asset value, if any. Total returns are not annualized. |
| (d) | After expense reimbursement from the Adviser, where applicable. |
| * | Rounds to less than $.01 per share. |
See accompanying notes to financial statements.
Financial Highlights (continued)
| | | | | | | | | | | | | | | | | | | | | | | | | | | | | | | | |
| Selected data for a share outstanding throughout each period: | | | | |
| | | | | | |
| Class (Commencement Date) | | | | | | | | | | | | | | | | | | | |
| | | | | | Investment Operations | | | Less Distributions | | | | |
| | | | | | |
| MID CAP SELECT (e) | | | | | | | | | | | | | | | | | | | |
Year Ended
October 31, | | Beginning
Net
Asset
Value | | | Net
Invest-
ment
Income
(Loss)(a) | | | Net
Realized/
Unrealized
Gain
(Loss) | | | Total | | | Net
Invest-
ment
Income | | | Capital
Gains(b) | | | Total | | | Ending
Net
Asset
Value | |
Class A (4/94) | | | | | | | | | | | | | | | | | | | | | | | | | |
2012 | | $ | 9.48 | | | $ | .04 | | | $ | .78 | | | $ | .82 | | | $ | — | | | $ | — | | | $ | — | | | $ | 10.30 | |
2011 | | | 9.31 | | | | (.05 | ) | | | .22 | | | | .17 | | | | — | | | | — | | | | — | | | | 9.48 | |
2010 | | | 7.65 | | | | (.02 | ) | | | 1.70 | | | | 1.68 | | | | (.02 | ) | | | — | | | | (.02 | ) | | | 9.31 | |
2009 | | | 7.00 | | | | .03 | | | | .62 | | | | .65 | | | | — | | | | — | | | | — | | | | 7.65 | |
2008 | | | 10.64 | | | | (.01 | ) | | | (3.63 | ) | | | (3.64 | ) | | | — | | | | — | | | | — | | | | 7.00 | |
Class C (2/00) | | | | | | | | | | | | | | | | | | | | | | | | | |
2012 | | | 8.70 | | | | (.03 | ) | | | .72 | | | | .69 | | | | — | | | | — | | | | — | | | | 9.39 | |
2011 | | | 8.61 | | | | (.11 | ) | | | .20 | | | | .09 | | | | — | | | | — | | | | — | | | | 8.70 | |
2010 | | | 7.12 | | | | (.08 | ) | | | 1.57 | | | | 1.49 | | | | — | | | | — | | | | — | | | | 8.61 | |
2009 | | | 6.56 | | | | (.01 | ) | | | .57 | | | | .56 | | | | — | | | | — | | | | — | | | | 7.12 | |
2008 | | | 10.04 | | | | (.08 | ) | | | (3.40 | ) | | | (3.48 | ) | | | — | | | | — | | | | — | | | | 6.56 | |
Class I (4/94) | | | | | | | | | | | | | | | | | | | | | | | | | |
2012 | | | 9.91 | | | | .07 | | | | .82 | | | | .89 | | | | — | | | | — | | | | — | | | | 10.80 | |
2011 | | | 9.71 | | | | (.02 | ) | | | .22 | | | | .20 | | | | — | | | | — | | | | — | | | | 9.91 | |
2010 | | | 7.98 | | | | — | * | | | 1.77 | | | | 1.77 | | | | (.04 | ) | | | — | | | | (.04 | ) | | | 9.71 | |
2009 | | | 7.31 | | | | .06 | | | | .64 | | | | .70 | | | | (.03 | ) | | | — | | | | (.03 | ) | | | 7.98 | |
2008 | | | 11.09 | | | | .01 | | | | (3.79 | ) | | | (3.78 | ) | | | — | | | | — | | | | — | | | | 7.31 | |
| | | | | | | | | | | | | | | | | | | | | | | | | | |
| | | | | | | | | | | | | | | | | | | | |
| | | | |
| | | | | | | | | | | | | | |
| | | | Ratios/Supplemental Data | |
| | | | | | | Ratios to Average
Net Assets Before
Reimbursement | | | Ratios to Average
Net Assets After
Reimbursement(d) | | | | |
Total
Return(c) | | | Ending
Net
Assets
(000) | | | Expenses | | | Net
Invest-
ment
Income
(Loss) | | | Expenses | | | Net
Invest-
ment
Income
(Loss) | | | Portfolio
Turnover
Rate | |
| | | | | | | | | | | | | | | | | | | | | | | | | | |
| | 8.65 | % | | $ | 10,862 | | | | 1.90 | % | | | (.10 | )% | | | 1.41 | % | | | .39 | % | | | 198 | % |
| | 1.83 | | | | 10,829 | | | | 1.97 | | | | (1.04 | ) | | | 1.41 | | | | (.48 | ) | | | 148 | |
| | 22.03 | | | | 12,402 | | | | 1.98 | | | | (.84 | ) | | | 1.41 | | | | (.27 | ) | | | 154 | |
| | 9.32 | | | | 12,487 | | | | 1.92 | | | | (.02 | ) | | | 1.41 | | | | .49 | | | | 186 | |
| | (34.21 | ) | | | 12,848 | | | | 1.60 | | | | (.32 | ) | | | 1.41 | | | | (.13 | ) | | | 170 | |
| | | | | | | | | | | | | | | | | | | | | | | | | | |
| | 7.93 | | | | 1,710 | | | | 2.65 | | | | (.83 | ) | | | 2.16 | | | | (.35 | ) | | | 198 | |
| | 1.05 | | | | 1,771 | | | | 2.71 | | | | (1.78 | ) | | | 2.16 | | | | (1.22 | ) | | | 148 | |
| | 20.93 | | | | 2,332 | | | | 2.73 | | | | (1.60 | ) | | | 2.16 | | | | (1.03 | ) | | | 154 | |
| | 8.54 | | | | 2,526 | | | | 2.67 | | | | (.75 | ) | | | 2.16 | | | | (.24 | ) | | | 186 | |
| | (34.66 | ) | | | 3,068 | | | | 2.35 | | | | (1.07 | ) | | | 2.16 | | | | (.88 | ) | | | 170 | |
| | | | | | | | | | | | | | | | | | | | | | | | | | |
| | 8.98 | | | | 12,805 | | | | 1.65 | | | | .15 | | | | 1.16 | | | | .64 | | | | 198 | |
| | 2.06 | | | | 16,646 | | | | 1.71 | | | | (.77 | ) | | | 1.16 | | | | (.23 | ) | | | 148 | |
| | 22.26 | | | | 23,076 | | | | 1.73 | | | | (.60 | ) | | | 1.16 | | | | (.03 | ) | | | 154 | |
| | 9.62 | | | | 27,030 | | | | 1.67 | | | | .30 | | | | 1.16 | | | | .81 | | | | 186 | |
| | (34.08 | ) | | | 40,409 | | | | 1.35 | | | | (.07 | ) | | | 1.16 | | | | .12 | | | | 170 | |
| (a) | Per share Net Investment Income (Loss) is calculated using the average daily shares method. |
| (b) | Distributions from Capital Gains include short-term capital gains, if any. |
| (c) | Total return is the combination of changes in net asset value without any sales charge, reinvested dividend income at net asset value and reinvested capital gains distributions at net asset value, if any. Total returns are not annualized. |
| (d) | After expense reimbursement from the Adviser, where applicable. |
| (e) | The financial highlights for the period from November 1, 2007 through May 3, 2009 are those of Small-Mid Cap Core Fund, which changed its principal investment strategies and changed its name to Mid Cap Select Fund on May 4, 2009. |
| * | Rounds to less than $.01 per share. |
See accompanying notes to financial statements.
Financial Highlights (continued)
| | | | | | | | | | | | | | | | | | | | | | | | | | | | | | | | |
| Selected data for a share outstanding throughout each period: | | | | |
| | | | | | |
| Class (Commencement Date) | | | | | | | | | | | | | | | | | | | |
| | | | | | Investment Operations | | | Less Distributions | | | | |
| | | | | |
| SMALL CAP SELECT | | | | | | | | | | | | | | | | |
Year Ended
October 31, | | Beginning
Net
Asset
Value | | | Net
Invest-
ment
Income
(Loss)(a) | | | Net
Realized/
Unrealized
Gain
(Loss) | | | Total | | | Net
Invest-
ment
Income | | | Capital
Gains(b) | | | Total | | | Ending
Net
Asset
Value | |
Class A (5/92) | | | | | | | | | | | | | | | | | | | | | | | | | | | | | |
2012 | | $ | 12.44 | | | $ | (.05 | ) | | $ | 1.45 | | | $ | 1.40 | | | $ | — | | | $ | (.30 | ) | | $ | (.30 | ) | | $ | 13.54 | |
2011 | | | 11.72 | | | | (.09 | ) | | | .81 | | | | .72 | | | | — | | | | — | | | | — | | | | 12.44 | |
2010 | | | 9.53 | | | | (.05 | ) | | | 2.24 | | | | 2.19 | | | | — | | | | — | | | | — | | | | 11.72 | |
2009 | | | 8.27 | | | | (.01 | ) | | | 1.27 | | | | 1.26 | | | | — | | | | — | | | | — | | | | 9.53 | |
2008 | | | 14.06 | | | | (.02 | ) | | | (4.92 | ) | | | (4.94 | ) | | | — | | | | (.85 | ) | | | (.85 | ) | | | 8.27 | |
Class B (3/95) | | | | | | | | | | | | | | | | | | | | | | | | | | | | | |
2012 | | | 9.77 | | | | (.12 | ) | | | 1.14 | | | | 1.02 | | | | — | | | | (.30 | ) | | | (.30 | ) | | | 10.49 | |
2011 | | | 9.27 | | | | (.15 | ) | | | .65 | | | | .50 | | | | — | | | | — | | | | — | | | | 9.77 | |
2010 | | | 7.60 | | | | (.10 | ) | | | 1.77 | | | | 1.67 | | | | — | | | | — | | | | — | | | | 9.27 | |
2009 | | | 6.64 | | | | (.05 | ) | | | 1.01 | | | | .96 | | | | — | | | | — | | | | — | | | | 7.60 | |
2008 | | | 11.56 | | | | (.08 | ) | | | (3.99 | ) | | | (4.07 | ) | | | — | | | | (.85 | ) | | | (.85 | ) | | | 6.64 | |
Class C (9/01) | | | | | | | | | | | | | | | | | | | | | | | | | | | | | |
2012 | | | 11.22 | | | | (.13 | ) | | | 1.30 | | | | 1.17 | | | | — | | | | (.30 | ) | | | (.30 | ) | | | 12.09 | |
2011 | | | 10.65 | | | | (.17 | ) | | | .74 | | | | .57 | | | | — | | | | — | | | | — | | | | 11.22 | |
2010 | | | 8.73 | | | | (.12 | ) | | | 2.04 | | | | 1.92 | | | | — | | | | — | | | | — | | | | 10.65 | |
2009 | | | 7.63 | | | | (.06 | ) | | | 1.16 | | | | 1.10 | | | | — | | | | — | | | | — | | | | 8.73 | |
2008 | | | 13.13 | | | | (.09 | ) | | | (4.56 | ) | | | (4.65 | ) | | | — | | | | (.85 | ) | | | (.85 | ) | | | 7.63 | |
Class R3 (1/94) | | | | | | | | | | | | | | | | | | | | | | | | | | | | | |
2012 | | | 12.13 | | | | (.08 | ) | | | 1.42 | | | | 1.34 | | | | — | | | | (.30 | ) | | | (.30 | ) | | | 13.17 | |
2011 | | | 11.46 | | | | (.12 | ) | | | .79 | | | | .67 | | | | — | | | | — | | | | — | | | | 12.13 | |
2010 | | | 9.34 | | | | (.08 | ) | | | 2.20 | | | | 2.12 | | | | — | | | | — | | | | — | | | | 11.46 | |
2009 | | | 8.12 | | | | (.03 | ) | | | 1.25 | | | | 1.22 | | | | — | | | | — | | | | — | | | | 9.34 | |
2008 | | | 13.86 | | | | (.04 | ) | | | (4.85 | ) | | | (4.89 | ) | | | — | | | | (.85 | ) | | | (.85 | ) | | | 8.12 | |
Class I (5/92) | | | | | | | | | | | | | | | | | | | | | | | | | | | | | |
2012 | | | 13.54 | | | | (.02 | ) | | | 1.60 | | | | 1.58 | | | | — | | | | (.30 | ) | | | (.30 | ) | | | 14.82 | |
2011 | | | 12.73 | | | | (.06 | ) | | | .87 | | | | .81 | | | | — | | | | — | | | | — | | | | 13.54 | |
2010 | | | 10.33 | | | | (.03 | ) | | | 2.44 | | | | 2.41 | | | | (.01 | ) | | | — | | | | (.01 | ) | | | 12.73 | |
2009 | | | 8.94 | | | | .02 | | | | 1.37 | | | | 1.39 | | | | — | | | | — | | | | — | | | | 10.33 | |
2008 | | | 15.10 | | | | .01 | | | | (5.31 | ) | | | (5.30 | ) | | | (.01 | ) | | | (.85 | ) | | | (.86 | ) | | | 8.94 | |
| | | | | | | | | | | | | | | | | | | | | | | | | | |
| | | | | | | | | | | | | | | | | | | | |
| | | | |
| | | | | | | | | | | | | | |
| | | | Ratios/Supplemental Data | |
| | | | | | | Ratios to Average
Net Assets Before
Reimbursement | | | Ratios to Average
Net Assets After
Reimbursement(d) | | | | |
Total
Return(c) | | | Ending
Net
Assets
(000) | | | Expenses | | | Net
Invest-
ment
Income
(Loss) | | | Expenses | | | Net
Invest-
ment
Income
(Loss) | | | Portfolio
Turnover
Rate | |
| | | | | | | | | | | | | | | | | | | | | | | | | | |
| | 11.62 | % | | $ | 155,624 | | | | 1.36 | % | | | (.49 | )% | | | 1.28 | % | | | (.41 | )% | | | 71 | % |
| | 6.14 | | | | 275,994 | | | | 1.34 | | | | (.74 | ) | | | 1.30 | | | | (.70 | ) | | | 69 | |
| | 22.98 | | | | 339,826 | | | | 1.25 | | | | (.49 | ) | | | 1.24 | | | | (.48 | ) | | | 88 | |
| | 15.24 | | | | 295,348 | | | | 1.26 | | | | (.09 | ) | | | 1.26 | | | | (.09 | ) | | | 99 | |
| | (37.00 | ) | | | 166,698 | | | | 1.26 | | | | (.15 | ) | | | 1.26 | | | | (.15 | ) | | | 92 | |
| | | | | | | | | | | | | | | | | | | | | | | | | | |
| | 10.88 | | | | 2,032 | | | | 2.11 | | | | (1.21 | ) | | | 2.03 | | | | (1.13 | ) | | | 71 | |
| | 5.39 | | | | 2,866 | | | | 2.09 | | | | (1.51 | ) | | | 2.05 | | | | (1.45 | ) | | | 69 | |
| | 21.97 | | | | 3,925 | | | | 2.00 | | | | (1.23 | ) | | | 1.99 | | | | (1.22 | ) | | | 88 | |
| | 14.46 | | | | 5,511 | | | | 2.01 | | | | (.80 | ) | | | 2.01 | | | | (.80 | ) | | | 99 | |
| | (37.52 | ) | | | 6,249 | | | | 2.01 | | | | (.90 | ) | | | 2.01 | | | | (.90 | ) | | | 92 | |
| | | | | | | | | | | | | | | | | | | | | | | | | | |
| | 10.81 | | | | 10,058 | | | | 2.11 | | | | (1.21 | ) | | | 2.03 | | | | (1.13 | ) | | | 71 | |
| | 5.35 | | | | 14,009 | | | | 2.09 | | | | (1.50 | ) | | | 2.05 | | | | (1.45 | ) | | | 69 | |
| | 21.99 | | | | 17,393 | | | | 2.00 | | | | (1.24 | ) | | | 1.99 | | | | (1.23 | ) | | | 88 | |
| | 14.42 | | | | 16,938 | | | | 2.01 | | | | (.80 | ) | | | 2.01 | | | | (.80 | ) | | | 99 | |
| | (37.44 | ) | | | 17,062 | | | | 2.01 | | | | (.90 | ) | | | 2.01 | | | | (.90 | ) | | | 92 | |
| | | | | | | | | | | | | | | | | | | | | | | | | | |
| | 11.42 | | | | 18,386 | | | | 1.61 | | | | (.69 | ) | | | 1.53 | | | | (.61 | ) | | | 71 | |
| | 5.85 | | | | 20,044 | | | | 1.60 | | | | (1.00 | ) | | | 1.55 | | | | (.95 | ) | | | 69 | |
| | 22.70 | | | | 18,047 | | | | 1.50 | | | | (.72 | ) | | | 1.49 | | | | (.71 | ) | | | 88 | |
| | 15.02 | | | | 24,701 | | | | 1.51 | | | | (.31 | ) | | | 1.51 | | | | (.31 | ) | | | 99 | |
| | (37.19 | ) | | | 23,069 | | | | 1.51 | | | | (.40 | ) | | | 1.51 | | | | (.40 | ) | | | 92 | |
| | | | | | | | | | | | | | | | | | | | | | | | | | |
| | 12.01 | | | | 261,760 | | | | 1.11 | | | | (.19 | ) | | | 1.03 | | | | (.11 | ) | | | 71 | |
| | 6.36 | | | | 273,983 | | | | 1.09 | | | | (.49 | ) | | | 1.05 | | | | (.45 | ) | | | 69 | |
| | 23.30 | | | | 400,042 | | | | 1.00 | | | | (.24 | ) | | | .99 | | | | (.23 | ) | | | 88 | |
| | 15.55 | | | | 322,658 | | | | 1.01 | | | | .19 | | | | 1.01 | | | | .19 | | | | 99 | |
| | (36.86 | ) | | | 289,685 | | | | 1.01 | | | | .10 | | | | 1.01 | | | | .10 | | | | 92 | |
| (a) | Per share Net Investment Income (Loss) is calculated using the average daily shares method. |
| (b) | Distributions from Capital Gains include short-term capital gains, if any. |
| (c) | Total return is the combination of changes in net asset value without any sales charge, reinvested dividend income at net asset value and reinvested capital gains distributions at net asset value, if any. Total returns are not annualized. |
| (d) | After expense reimbursement from the Adviser, where applicable. |
See accompanying notes to financial statements.
Notes to Financial Statements
1. General Information and Significant Accounting Policies
General Information
Nuveen Investment Funds, Inc. (the “Trust”), is an open-end investment company registered under the Investment Company Act of 1940, as amended. The Trust is comprised of Nuveen Large Cap Select Fund (“Large Cap Select”), Nuveen Mid Cap Select Fund (“Mid Cap Select”) and Nuveen Small Cap Select Fund (“Small Cap Select”), (each a “Fund” and collectively, the “Funds”), as diversified funds, among others. The Trust was incorporated in the state of Maryland on August 20, 1987.
Large Cap Select’s investment objective is capital appreciation. Under normal market conditions, the Fund invests at least 80% of its net assets, plus the amount of any borrowings for investment purposes, in common stocks of large-capitalization companies, defined as companies that have market capitalizations of $5 billion or greater at the time of purchase.
Mid Cap Select’s investment objective is long-term growth of capital. Under normal market conditions, the Fund invests at least 80% of its net assets, plus the amount of any borrowings for investment purposes, in common stocks of mid-capitalization companies, defined as companies that have market capitalizations at the time of purchase within the market capitalization range of the companies in the Russell Midcap® Index immediately after its most recent reconstitution prior to such purchase. It is expected that reconstitution of the index will occur each year at the end of June. Immediately after the most recent reconstitution, the range was $520 million to $17.9 billion.
Small Cap Select’s investment objective is capital appreciation. Under normal market conditions, the Fund invests at least 80% of its net assets, plus the amount of any borrowings for investment purposes, in common stocks of small-capitalization companies, defined as companies that have market capitalizations of less than $3 billion at the time of purchase.
Each Fund may invest up to 15% of its total assets in non-dollar denominated equity securities of non-U.S. issuers. Each Fund may invest up to 25% of its assets, collectively, in non-dollar denominated equity securities of non-U.S. issuers and in dollar-denominated equity securities of non-U.S. issuers that are either listed on a U.S. stock exchange or represented by depositary receipts that may or may not be sponsored by a domestic bank. Up to 15% of each Fund’s total assets may be invested in equity securities of emerging market issuers. Each Fund also may invest in options, futures contracts, options on futures contracts and forward foreign currency exchanges contracts (“derivatives”) to manage market or business risk, enhance its return or hedge against adverse movements in currency exchange rates.
The Funds’ most recent prospectus provides further descriptions of each Fund’s investment objective, principal investment strategies and principal risks.
Effective at the close of business on February 15, 2012, Class B Shares of Mid Cap Select were converted to Class A Shares and are no longer available for dividend reinvestment or through an exchange from other Nuveen mutual funds.
Significant Accounting Policies
The following is a summary of significant accounting policies followed by the Funds in the preparation of their financial statements in accordance with accounting principles generally accepted in the United States (“U.S. GAAP”).
Investment Valuation
Common stocks and other equity-type securities are valued at the last sales price on the securities exchange on which such securities are primarily traded and are generally classified as Level 1 for fair value measurement purposes. Securities primarily traded on the NASDAQ National Market (“NASDAQ”) are valued, except as indicated below, at the NASDAQ Official Closing Price and are generally classified as Level 1. However, securities traded on a securities exchange or NASDAQ for which there were no transactions on a given day or securities not listed on a securities exchange or NASDAQ are valued at the quoted bid price and are generally classified as Level 2.
Investments in investment companies are valued at their respective net asset values on the valuation date. These investment vehicles are generally classified as Level 1.
Futures contracts are valued using the closing settlement price or, in the absence of such a price, the last traded price. Futures contracts are generally classified as Level 1.
Certain securities may not be able to be priced by the pre-established pricing methods as described above. Such securities may be valued by the Funds’ Board of Directors or its designee at fair value. These securities generally include, but are not limited to, restricted securities (securities which may not be publicly sold without registration under the Securities Act of 1933, as amended) for which a pricing service is unable to provide a market price; securities whose trading has been formally suspended; debt securities that have gone into default and for which there is no current market quotation; a security whose market price is not available from a pre-established pricing source; a security with respect to which an event has occurred that is likely to materially affect the value of the security after the market has closed but before the calculation of a Fund’s net asset value (as may be the case in non-U.S. markets on which the security is primarily traded) or make it difficult or impossible to obtain a reliable market quotation; and a security whose price, as provided by the pricing service, is not deemed to reflect the security’s fair value. As a general principle, the fair value of a security would appear to be the amount that the owner might reasonably expect to receive for it in a current sale. A variety of factors
may be considered in determining the fair value of such securities, which may include consideration of the following: yields or prices of investments of comparable quality, type of issue, coupon, maturity and rating, market quotes or indications of value from security dealers, evaluations of anticipated cash flows or collateral, general market conditions and other information and analysis, including the obligor’s credit characteristics considered relevant. These securities are generally classified as Level 2 or Level 3 depending on the priority of the significant inputs. Regardless of the method employed to value a particular security, all valuations are subject to review by the Funds’ Board of Directors or its designee.
Refer to Footnote 2 – Fair Value Measurements for further details on the leveling of securities held by the Funds as of the end of the reporting period.
Investment Transactions
Investment transactions are recorded on a trade date basis. Realized gains and losses from investment transactions are determined on the specific identification method, which is the same basis used for federal income tax purposes.
Investment Income
Dividend income is recorded on the ex-dividend date or, for foreign securities, when information is available. Interest income is recorded on an accrual basis. Securities lending income is comprised of fees earned from borrowers and income earned on cash collateral investments, net of lending agent fees.
Income Taxes
Each Fund is a separate taxpayer for federal income tax purposes. Each Fund intends to distribute substantially all of its net investment income and net capital gains to shareholders and to otherwise comply with the requirements of Subchapter M of the Internal Revenue Code applicable to regulated investment companies (“RICs”). Therefore, no federal income tax provision is required.
For all open tax years and all major taxing jurisdictions, management of the Funds has concluded that there are no significant uncertain tax positions that would require recognition in the financial statements. Open tax years are those that are open for examination by taxing authorities (i.e., generally the last four tax year ends and the interim tax period since then). Furthermore, management of the Funds is also not aware of any tax positions for which it is reasonably possible that the total amounts of unrecognized tax benefits will significantly change in the next twelve months.
Dividends and Distributions to Shareholders
Dividends from net investment income and net realized gains from investment transactions, if any, are declared and distributed to shareholders at least annually. Furthermore, capital gains are distributed only to the extent they exceed available capital loss carryforwards.
Distributions to shareholders are recorded on the ex-dividend date. The amount and timing of distributions are determined in accordance with federal income tax regulations, which may differ from U.S. GAAP.
The Funds may receive distributions from holdings in Real Estate Investment Trusts (“REITs”). Distributions from REITs may be characterized as ordinary income, net capital gain, or a return of capital to the REIT shareholder. The proper characterization of REIT distributions is generally not known until after the end of each calendar year. The actual character of distributions to Fund shareholders will be reflected on the Form 1099 received by shareholders after the end of the calendar year. Due to the nature of REIT investments, a portion of the distributions received by the Fund shareholder may represent a return of capital.
Flexible Sales Charge Program
Class A Shares are generally sold with an up-front sales charge and incur a .25% annual 12b-1 service fee. Class A Share purchases of $1 million or more are sold at net asset value without an up-front sales charge but may be subject to a contingent deferred sales charge (“CDSC”) if redeemed within twelve months of purchase. Class B Shares were sold without an up-front sales charge but incur a .75% annual 12b-1 distribution fee and a .25% annual 12b-1 service fee. Class B Shares are subject to a CDSC of up to 5% depending upon the length of time the shares are held by the investor (CDSC is reduced to 0% at the end of six years). Class B Shares automatically convert to Class A Shares eight years after purchase. Class C Shares are sold without an up-front sales charge but incur a .75% annual 12b-1 distribution fee and a .25% annual 12b-1 service fee. Class C Shares are subject to a CDSC of 1% if redeemed within twelve months of purchase. Class R3 Shares are sold without an up-front sales charge but incur a .25% annual 12b-1 distribution and a .25% annual 12b-1 service fee. Class I Shares are not subject to any sales charge or 12b-1 distribution or service fees.
Foreign Currency Transactions
Each Fund is authorized to engage in foreign currency exchange transactions, including foreign currency exchange contracts, futures, options and swap contracts. To the extent that the Funds invest in securities and/or contracts that are denominated in a currency other than U.S. dollars, the Funds will be subject to currency risk, which is the risk that an increase in the U.S. dollar relative to the foreign currency will reduce returns or portfolio value. Generally, when the U.S. dollar rises in value against a foreign currency, the Funds’ investments denominated in that currency will lose value because its currency is worth fewer U.S. dollars; the opposite effect occurs if the U.S. dollar falls in relative value. Investments and other assets and liabilities denominated in foreign currencies are converted into U.S. dollars on a spot (i.e. cash) basis at the spot rate prevailing in the foreign currency exchange market at the time of valuation. Purchases and sales of investments and income denominated in foreign currencies are translated into U.S. dollars on the respective dates of such transactions.
Notes to Financial Statements (continued)
The books and records of the Funds are maintained in U.S. dollars. Foreign currencies, assets and liabilities are translated into U.S. dollars at 4:00 p.m. Eastern Time. Investment transactions, income and expenses are translated on the respective dates of such transactions. Net realized foreign currency gains and losses resulting from changes in exchange rates include foreign currency gains and losses between trade date and settlement date of the transactions, foreign currency transactions, and the difference between the amounts of interest and dividends recorded on the books of a Fund and the amounts actually received.
The realized gains and losses resulting from changes in foreign currency exchange rates and changes in foreign exchange rates associated with other assets and liabilities on investments and derivatives are recognized as a component of “Net realized gain (loss) from investments and foreign currency,” on the Statement of Operations, when applicable.
The unrealized gains and losses resulting from changes in foreign currency exchange rates and changes in foreign exchange rates associated with other assets and liabilities on investments are recognized as a component of “Change in net unrealized appreciation (depreciation) of investments and foreign currency,” on the Statement of Operations, when applicable.
Futures Contracts
Each Fund is subject to equity price risk in the normal course of pursuing its investment objectives and is authorized to invest in futures contracts in an attempt to manage such risk. Upon entering into a futures contract, a Fund is required to deposit with the broker an amount of cash or liquid securities equal to a specified percentage of the contract amount. This is known as the “initial margin.” Cash held by the broker to cover initial margin requirements on open futures contracts, if any, is recognized as “Deposits with brokers for open futures contracts” on the Statement of Assets and Liabilities. Subsequent payments (“variation margin”) are made or received by a Fund each day, depending on the daily fluctuation of the value of the contract. Variation margin is recognized as a receivable and/or payable for “Variation margin on futures contracts” on the Statement of Assets and Liabilities, when applicable.
During the period the futures contract is open, changes in the value of the contract are recognized as an unrealized gain or loss by “marking-to-market” on a daily basis to reflect the changes in market value of the contract, which is recognized as a component of “Change in net unrealized appreciation (depreciation) of futures contracts” on the Statement of Operations. When the contract is closed, a Fund records a realized gain or loss equal to the difference between the value of the contract on the closing date and value of the contract when originally entered into, which is recognized as a component of “Net realized gain (loss) from futures contracts” on the Statement of Operations.
Risks of investments in futures contracts include the possible adverse movement in the price of the securities or indices underlying the contracts, the possibility that there may not be a liquid secondary market for the contracts and/or that a change in the value of the contract may not correlate with a change in the value of the underlying securities or indices.
During the fiscal year ended October 31, 2012, Small Cap Select invested in equity futures contracts as part of the management of the Fund. The Fund purchased Russell 2000 E-Mini Index futures to efficiently gain market exposure to a broad base of equity securities in order to manage cash flow activity and minimized tracking error to the Fund’s benchmark index.
The average number of futures contracts outstanding during the fiscal year ended October 31, 2012, were as follows:
| | | | |
| | | Small Cap
Select | |
Average number of futures contracts outstanding* | | | — | |
| * | The average number of outstanding contracts is calculated based on the outstanding number of contracts at the beginning of the fiscal year and at the end of each fiscal quarter within the current fiscal year. The Fund was not invested in futures contracts at the beginning or end of the current fiscal period. |
Refer to Footnote 3 – Derivative Instruments and Hedging Activities for further details on futures contracts activity.
Market and Counterparty Credit Risk
In the normal course of business each Fund may invest in financial instruments and enter into financial transactions where risk of potential loss exists due to changes in the market (market risk) or failure of the other party to the transaction to perform (counterparty credit risk). The potential loss could exceed the value of the financial assets recorded on the financial statements. Financial assets, which potentially expose each Fund to counterparty credit risk, consist principally of cash due from counterparties on forward, option and swap transactions, when applicable. The extent of each Fund’s exposure to counterparty credit risk in respect to these financial assets approximates their carrying value as recorded on the Statement of Assets and Liabilities. Futures contracts, when applicable, expose a Fund to minimal counterparty credit risk as they are exchange traded and the exchange’s clearinghouse, which is counterparty to all exchange traded futures, guarantees the futures contracts against default.
Each Fund helps manage counterparty credit risk by entering into agreements only with counterparties Nuveen Fund Advisors, Inc. (the “Adviser”), a wholly-owned subsidiary of Nuveen Investments, Inc. (“Nuveen”), believes have the financial resources to honor their obligations and by having the Adviser monitor the financial stability of the counterparties. Additionally, counterparties may be required to pledge collateral daily (based on the daily valuation of the financial asset) on behalf of each Fund with a value approximately equal to the amount of any unrealized gain above a pre-determined threshold. Reciprocally, when each Fund has an unrealized loss, the Funds have instructed the custodian to pledge assets of the Funds as collateral with a value approximately equal to the amount of the unrealized loss above a pre-determined threshold. Collateral pledges are monitored and subsequently adjusted if and when the valuations fluctuate, either up or down, by at least the pre-determined threshold amount.
Multiclass Operations and Allocations
Income and expenses of the Funds that are not directly attributable to a specific class of shares are prorated among the classes based on the relative net assets of each class. Expenses directly attributable to a class of shares, which presently only include 12b-1 distribution fees and shareholder service fees, are recorded to the specific class.
Realized and unrealized capital gains and losses of the Funds are prorated among the classes based on the relative net assets of each class.
Securities Lending
In order to generate additional income, each Fund may lend securities representing up to one-third of the value of its total assets (which includes collateral for securities on loan) to broker-dealers, banks or other institutions. Each Fund’s policy is to receive cash collateral equal to at least 102% of the value of securities loaned, which is recognized as “Collateral from securities lending program” on the Statement of Assets and Liabilities. The adequacy of the collateral is monitored on a daily basis. If the value of the securities on loan increases, such that the level of collateralization falls below 102%, additional collateral is received from the borrower, which is recognized as “Due from broker” on the Statement of Assets and Liabilities, when applicable. As with other extensions of credit, there may be risks of delay in recovery of the securities or even loss of rights in the collateral should the borrower of the security fail financially.
The Funds’ custodian serves as the securities lending agent for the Funds. Each Fund pays the custodian a fee based on the Fund’s proportional share of the custodian’s expense of operating its securities lending program. Collateral for securities on loan is invested in a money market fund, which is recognized as “Investments purchased with collateral from securities lending” on the Statement of Assets and Liabilities.
Income from securities lending, net of fees paid, is recognized on the Statement of Operations as “Securities lending income, net.” Securities lending fees paid by each Fund during the fiscal year ended October 31, 2012, were as follows:
| | | | | | | | | | | | |
| | | |
| | | Large Cap
Select | | | Mid Cap
Select | | | Small Cap
Select | |
Securities lending fees paid | | $ | 2,450 | | | $ | 3,634 | | | $ | 90,318 | |
Indemnifications
Under the Trust’s organizational documents, its officers and directors are indemnified against certain liabilities arising out of the performance of their duties to the Trust. In addition, in the normal course of business, the Trust enters into contracts that provide general indemnifications to other parties. The Trust’s maximum exposure under these arrangements is unknown as this would involve future claims that may be made against the Trust that have not yet occurred. However, the Trust has not had prior claims or losses pursuant to these contracts and expects the risk of loss to be remote.
Use of Estimates
The preparation of financial statements in conformity with U.S. GAAP requires management to make estimates and assumptions that affect the reported amounts of assets and liabilities at the date of the financial statements and the reported amounts of increases and decreases in net assets from operations during the reporting period. Actual results may differ from those estimates.
2. Fair Value Measurements
Fair value is defined as the price that the Funds would receive upon selling an investment or transferring a liability in an orderly transaction to an independent buyer in the principal or most advantageous market for the investment. A three-tier hierarchy is used to maximize the use of observable market data and minimize the use of unobservable inputs and to establish classification of fair value measurements for disclosure purposes. Observable inputs reflect the assumptions market participants would use in pricing the asset or liability. Observable inputs are based on market data obtained from sources independent of the reporting entity. Unobservable inputs reflect the reporting entity’s own assumptions about the assumptions market participants would use in pricing the asset or liability. Unobservable inputs are based on the best information available in the circumstances. The following is a summary of the three-tiered hierarchy of valuation input levels.
| | |
| Level 1 – | | Inputs are unadjusted and prices are determined using quoted prices in active markets for identical securities. |
| Level 2 – | | Prices are determined using other significant observable inputs (including quoted prices for similar securities, interest rates, prepayment speeds, credit risk, etc.). |
| Level 3 – | | Prices are determined using significant unobservable inputs (including management’s assumptions in determining the fair value of investments). |
Notes to Financial Statements (continued)
The inputs or methodologies used for valuing securities are not an indication of the risks associated with investing in those securities. The following is a summary of each Fund’s fair value measurements as of the end of the reporting period:
| | | | | | | | | | | | | | | | |
| Large Cap Select | | Level 1 | | | Level 2 | | | Level 3 | | | Total | |
Long-Term Investments*: | | | | | | | | | | | | | | | | |
Common Stocks | | $ | 36,827,763 | | | $ | — | | | $ | — | | | $ | 36,827,763 | |
Investments Purchased with Collateral from Securities Lending | | | 7,204,060 | | | | — | | | | — | | | | 7,204,060 | |
Short-Term Investments: | | | | | | | | | | | | | | | | |
Money Market Funds | | | 1,198,235 | | | | — | | | | — | | | | 1,198,235 | |
Total | | $ | 45,230,058 | | | $ | — | | | $ | — | | | $ | 45,230,058 | |
| | | | |
| Mid Cap Select | | Level 1 | | | Level 2 | | | Level 3 | | | Total | |
Long-Term Investments*: | | | | | | | | | | | | | | | | |
Common Stocks | | $ | 24,756,235 | | | $ | — | | | $ | — | | | $ | 24,756,235 | |
Investments Purchased with Collateral from Securities Lending | | | 7,962,828 | | | | — | | | | — | | | | 7,962,828 | |
Short-Term Investments: | | | | | | | | | | | | | | | | |
Money Market Funds | | | 752,457 | | | | — | | | | — | | | | 752,457 | |
Total | | $ | 33,471,520 | | | $ | — | | | $ | — | | | $ | 33,471,520 | |
| | | | |
| Small Cap Select | | Level 1 | | | Level 2 | | | Level 3 | | | Total | |
Long-Term Investments*: | | | | | | | | | | | | | | | | |
Common Stocks | | $ | 440,884,039 | | | $ | — | | | $ | — | | | $ | 440,884,039 | |
Investments Purchased with Collateral from Securities Lending | | | 146,829,843 | | | | — | | | | — | | | | 146,829,843 | |
Short-Term Investments: | | | | | | | | | | | | | | | | |
Money Market Funds | | | 7,098,142 | | | | — | | | | — | | | | 7,098,142 | |
Total | | $ | 594,812,024 | | | $ | — | | | $ | — | | | $ | 594,812,024 | |
| * | Refer to the Fund’s Portfolio of Investments for industry classifications. |
The Nuveen funds’ Board of Directors/Trustees is responsible for the valuation process and has delegated the oversight of the daily valuation process to the Adviser’s Valuation Committee. The Valuation Committee, pursuant to the valuation policies and procedures adopted by the Board of Directors/Trustees, is responsible for making fair value determinations, evaluating the effectiveness of the funds’ pricing policies, and reporting to the Board of Directors/Trustees. The Valuation Committee is aided in its efforts by the Adviser’s dedicated Securities Valuation Team, which is responsible for administering the daily valuation process and applying fair value methodologies as approved by the Valuation Committee. When determining the reliability of independent pricing services for investments owned by the funds, the Valuation Committee, among other things, conducts due diligence reviews of the pricing services and monitors the quality of security prices received through various testing reports conducted by the Securities Valuation Team.
The Valuation Committee will consider pricing methodologies it deems relevant and appropriate when making fair value determinations. Examples of possible methodologies include, but are not limited to, multiple of earnings; discount from market of a similar freely traded security; discounted cash-flow analysis; book value or a multiple thereof; risk premium/yield analysis; yield to maturity; and/or fundamental investment analysis. The Valuation Committee will also consider factors it deems relevant and appropriate in light of the facts and circumstances. Examples of possible factors include, but are not limited to, the type of security; the issuer’s financial statements; the purchase price of the security; the discount from market value of unrestricted securities of the same class at the time of purchase; analysts’ research and observations from financial institutions; information regarding any transactions or offers with respect to the security; the existence of merger proposals or tender offers affecting the security; the price and extent of public trading in similar securities of the issuer or comparable companies; and the existence of a shelf registration for restricted securities.
For each portfolio security that has been fair valued pursuant to the policies adopted by the Board of Directors/Trustees, the fair value price is compared against the last available and next available market quotations. The Valuation Committee reviews the results of such testing and fair valuation occurrences are reported to the Board of Directors/Trustees.
3. Derivative Instruments and Hedging Activities
The Funds record derivative instruments at fair value, with changes in fair value recognized on the Statement of Operations, when applicable. Even though the Funds’ investments in derivatives may represent economic hedges, they are not considered to be hedge transactions for financial reporting purposes. For additional information on the derivative instruments in which each Fund was invested during and at the end of the reporting period, refer to the Portfolios of Investments, Financial Statements and Footnote 1 – General Information and Significant Accounting Policies. Small Cap Select invested in derivative instruments during the fiscal year ended October 31, 2012.
The following table presents the amount of net realized gain (loss) recognized for the fiscal year ended October 31, 2012, on derivative instruments, as well as the primary risk exposure associated with each.
| | | | |
| Net Realized Gain (Loss) from Futures Contracts | | Small Cap
Select | |
Risk Exposure | | | | |
Equity | | $ | 1,762,906 | |
4. Fund Shares
Transactions in Fund shares were as follows:
| | | | | | | | | | | | | | | | |
| | | Large Cap Select | |
| | | Year Ended
10/31/12 | | | Year Ended
10/31/11 | |
| | | Shares | | | Amount | | | Shares | | | Amount | |
Shares sold: | | | | | | | | | | | | | | | | |
Class A | | | 25,332 | | | $ | 331,639 | | | | 48,975 | | | | 630,342 | |
Class C | | | 1,390 | | | | 17,576 | | | | 3,506 | | | | 44,297 | |
Class R3 | | | 1,045 | | | | 13,038 | | | | 929 | | | | 11,842 | |
Class I | | | 197,949 | | | | 2,346,691 | | | | 317,616 | | | | 3,895,849 | |
Shares issued to shareholders due to reinvestment of distributions: | | | | | | | | | | | | | | | | |
Class A | | | — | | | | — | | | | — | | | | — | |
Class C | | | — | | | | — | | | | — | | | | — | |
Class R3 | | | — | | | | — | | | | — | | | | — | |
Class I | | | 1,891 | | | | 22,258 | | | | 5,718 | | | | 73,066 | |
| | | | 227,607 | | | | 2,731,202 | | | | 376,744 | | | | 4,655,396 | |
Shares redeemed: | | | | | | | | | | | | | | | | |
Class A | | | (57,942 | ) | | | (729,523 | ) | | | (97,791 | ) | | | (1,234,341 | ) |
Class C | | | (2,456 | ) | | | (29,802 | ) | | | (2,802 | ) | | | (33,700 | ) |
Class R3 | | | (2,655 | ) | | | (34,618 | ) | | | (1,428 | ) | | | (18,315 | ) |
Class I | | | (2,584,843 | ) | | | (31,817,898 | ) | | | (5,270,687 | ) | | | (65,571,376 | ) |
Class I – In-Kind | | | — | | | | — | | | | (1,284,181 | ) | | | (15,345,963 | ) |
| | | | (2,647,896 | ) | | | (32,611,841 | ) | | | (6,656,889 | ) | | | (82,203,695 | ) |
Net increase (decrease) | | | (2,420,289 | ) | | $ | (29,880,639 | ) | | | (6,280,145 | ) | | | (77,548,299 | ) |
| |
| | | Mid Cap Select | |
| | | Year Ended
10/31/12 | | | Year Ended
10/31/11 | |
| | | Shares | | | Amount | | | Shares | | | Amount | |
Shares sold: | | | | | | | | | | | | | | | | |
Class A | | | 111,075 | | | $ | 1,129,105 | | | | 100,917 | | | | 1,030,004 | |
Class B(1) | | | — | | | | — | | | | 1,214 | | | | 10,402 | |
Class C | | | 15,425 | | | | 139,843 | | | | 6,959 | | | | 64,006 | |
Class I | | | 86,341 | | | | 889,831 | | | | 136,645 | | | | 1,431,982 | |
Shares issued to shareholders due to reinvestment of distributions: | | | | | | | | | | | | | | | | |
Class A | | | — | | | | — | | | | — | | | | — | |
Class B(1) | | | — | | | | — | | | | — | | | | — | |
Class C | | | — | | | | — | | | | — | | | | — | |
Class I | | | — | | | | — | | | | — | | | | — | |
| | | | 212,841 | | | | 2,158,779 | | | | 245,735 | | | | 2,536,394 | |
Shares redeemed: | | | | | | | | | | | | | | | | |
Class A | | | (199,282 | ) | | | (2,003,131 | ) | | | (290,360 | ) | | | (2,916,390 | ) |
Class B(1) | | | (100,888 | ) | | | (862,888 | ) | | | (64,355 | ) | | | (547,919 | ) |
Class C | | | (36,782 | ) | | | (341,043 | ) | | | (74,184 | ) | | | (677,927 | ) |
Class I | | | (580,212 | ) | | | (5,989,925 | ) | | | (833,219 | ) | | | (8,555,743 | ) |
| | | | (917,164 | ) | | | (9,196,987 | ) | | | (1,262,118 | ) | | | (12,697,979 | ) |
Net increase (decrease) | | | (704,323 | ) | | $ | (7,038,208 | ) | | | (1,016,383 | ) | | | (10,161,585 | ) |
| (1) | Class B Shares of Mid Cap Select converted to Class A Shares at the close of business on February 15, 2012 and are no longer available for dividend reinvestment or through an exchange from other Nuveen mutual funds. |
Notes to Financial Statements (continued)
| | | | | | | | | | | | | | | | |
| | | Small Cap Select | |
| | | Year Ended
10/31/12 | | | Year Ended
10/30/11 | |
| | | Shares | | | Amount | | | Shares | | | Amount | |
Shares sold: | | | | | | | | | | | | | | | | |
Class A | | | 3,405,459 | | | $ | 44,581,140 | | | | 9,066,714 | | | $ | 118,699,201 | |
Class B | | | 55 | | | | 510 | | | | 829 | | | | 8,923 | |
Class C | | | 33,316 | | | | 400,508 | | | | 44,237 | | | | 520,442 | |
Class R3 | | | 362,918 | | | | 4,572,748 | | | | 732,709 | | | | 9,445,253 | |
Class I | | | 3,848,641 | | | | 54,450,626 | | | | 4,213,928 | | | | 59,498,496 | |
Shares issued to shareholders due to reinvestment of distributions: | | | | | | | | | | | | | | | | |
Class A | | | 555,168 | | | | 6,578,745 | | | | — | | | | — | |
Class B | | | 8,774 | | | | 81,068 | | | | — | | | | — | |
Class C | | | 31,587 | | | | 336,407 | | | | — | | | | — | |
Class R3 | | | 42,049 | | | | 485,669 | | | | — | | | | — | |
Class I | | | 369,469 | | | | 4,780,926 | | | | — | | | | — | |
| | | | 8,657,436 | | | | 116,268,347 | | | | 14,058,417 | | | | 188,172,315 | |
Shares redeemed: | | | | | | | | | | | | | | | | |
Class A | | | (14,663,335 | ) | | | (201,595,961 | ) | | | (15,876,132 | ) | | | (207,042,276 | ) |
Class B | | | (108,436 | ) | | | (1,128,129 | ) | | | (130,715 | ) | | | (1,343,789 | ) |
Class C | | | (482,065 | ) | | | (5,720,510 | ) | | | (428,685 | ) | | | (4,846,091 | ) |
Class R3 | | | (661,413 | ) | | | (8,291,187 | ) | | | (655,473 | ) | | | (8,328,827 | ) |
Class I | | | (6,784,819 | ) | | | (96,961,259 | ) | | | (11,942,604 | ) | | | (165,412,108 | ) |
Class I – In-Kind | | | — | | | | — | | | | (3,470,750 | ) | | | (49,354,066 | ) |
| | | | (22,700,068 | ) | | | (313,697,046 | ) | | | (32,504,359 | ) | | | (436,327,157 | ) |
Net increase (decrease) | | | (14,042,632 | ) | | $ | (197,428,699 | ) | | | (18,445,942 | ) | | $ | (248,154,842 | ) |
Class B Shares that converted to Class A Shares (recognized as a component of Class A Shares sold and Class B Shares redeemed) during the fiscal years ended October 31, 2012 and October 31, 2011, were as follows:
| | | | | | | | |
| Fund | | Year Ended
10/31/12 | | | Year Ended
10/31/11 | |
Mid Cap Select | | | 18,510 | | | | 42,682 | |
Small Cap Select | | | 83,248 | | | | 68,111 | |
5. Investment Transactions
Purchases and sales (excluding investments purchased with collateral from securities lending, short-term investments and derivative transactions, where applicable) during the fiscal year ended October 31, 2012, were as follows:
| | | | | | | | | | | | |
| | | |
| | | Large Cap
Select | | | Mid Cap
Select | | | Small Cap
Select | |
Purchases | | $ | 56,795,241 | | | $ | 54,056,007 | | | $ | 358,032,676 | |
Sales | | | 87,482,127 | | | | 61,049,141 | | | | 551,747,138 | |
6. Income Tax Information
The following information is presented on an income tax basis. Differences between amounts for financial statement and federal income tax purposes are primarily due to timing differences in recognizing certain gains and losses on investment transactions. To the extent that differences arise that are permanent in nature, such amounts are reclassified within the capital accounts as detailed below. Temporary differences do not require reclassification. Temporary and permanent differences do not impact the net asset values of the Funds.
At October 31, 2012, the cost and unrealized appreciation (depreciation) of investments as determined on a federal income tax basis, were as follows:
| | | | | | | | | | | | |
| | | Large Cap
Select | | | Mid Cap
Select | | | Small Cap
Select | |
Cost of investments | | $ | 42,064,233 | | | $ | 31,989,489 | | | $ | 572,223,814 | |
Gross unrealized: | | | | | | | | | | | | |
Appreciation | | $ | 4,148,097 | | | $ | 2,311,473 | | | $ | 57,987,129 | |
Depreciation | | | (982,272 | ) | | | (829,442 | ) | | | (35,398,919 | ) |
Net unrealized appreciation (depreciation) of investments | | $ | 3,165,825 | | | $ | 1,482,031 | | | $ | 22,588,210 | |
Permanent differences, primarily due to net operating losses, tax equalization and REIT adjustments, resulted in reclassifications among the Funds’ components of net assets at October 31, 2012, the Funds’ tax year end, as follows:
| | | | | | | | | | | | |
| | | |
| | | Large Cap
Select | | | Mid Cap
Select | | | Small Cap
Select | |
Capital paid-in | | $ | (4,786 | ) | | $ | — | | | $ | 5,799,953 | |
Undistributed (Over-distribution of) net investment income | | | — | | | | (3,568 | ) | | | 1,434,162 | |
Accumulated net realized gain (loss) | | | 4,786 | | | | 3,568 | | | | (7,234,115 | ) |
The tax components of undistributed net ordinary income and net long-term capital gains at October 31, 2012, the Funds’ tax year end, were as follows:
| | | | | | | | | | | | |
| | | Large Cap
Select | | | Mid Cap
Select | | | Small Cap
Select | |
Undistributed net ordinary income* | | $ | 178,136 | | | $ | 127,226 | | | $ | 11,425,324 | |
Undistributed net long-term capital gains | | | — | | | | — | | | | 54,954,814 | |
| * | Net ordinary income consists of net taxable income derived from dividends, interest and net short-term capital gains, if any. |
The tax character of distributions paid during the Funds’ tax years ended October 31, 2012 and October 31, 2011, was designated for purposes of the dividends paid deduction as follows:
| | | | | | | | | | | | |
| 2012 | | Large Cap
Select | | | Mid Cap
Select | | | Small Cap
Select | |
Distributions from net ordinary income* | | $ | 49,038 | | | | — | | | $ | — | |
Distributions from net long-term capital gains | | | — | | | | — | | | | 13,456,984 | |
| | | | | | | | | | | | |
| 2011 | | Large Cap
Select | | | Mid Cap
Select | | | Small Cap
Select | |
Distributions from net ordinary income* | | $ | 150,204 | | | $ | — | | | $ | — | |
Distributions from net long-term capital gains | | | — | | | | — | | | | — | |
| * | Net ordinary income consists of net taxable income derived from dividends, interest, net short-term capital gains and current year earnings and profits attributable to realized gains, if any. |
At October 31, 2012, the Funds’ tax year end, the following Funds had unused capital loss carryforwards available for federal income tax purposes to be applied against future capital gains, if any. If not applied, the carryforwards will expire as follows:
| | | | | | | | |
| | | Large Cap
Select | | | Mid Cap
Select | |
Expiration: | | | | | | | | |
October 31, 2016 | | $ | 16,448,599 | | | $ | 4,674,453 | |
October 31, 2017 | | | 54,315,490 | | | | 15,708,192 | |
Total | | $ | 70,764,089 | | | $ | 20,382,645 | |
During the Funds’ tax year ended October 31, 2012, the Funds utilized their capital loss carryforwards as follows:
| | | | | | | | |
| | | Large Cap
Select | | | Mid Cap
Select | |
Utilized capital loss carryforwards | | $ | 5,144,732 | | | $ | 3,145,376 | |
On December 22, 2010, the Regulated Investment Company Modernization Act of 2010 (the “Act”) was enacted, which changed various technical rules governing the tax treatment of RICs. The changes are generally effective for taxable years beginning after the date of enactment. One of the more prominent changes addresses capital loss carryforwards. Under the Act, each Fund will be permitted to carry forward capital losses incurred in taxable years beginning after the date of enactment for an unlimited period. However, any losses incurred during those future taxable years will be required to be utilized prior to the losses incurred in pre-enactment taxable years, which carry an expiration date. As a result of this ordering rule, pre-enactment capital loss carryforwards may be more likely to expire unused. Additionally, post-enactment capital loss carryforwards will retain their character as either short-term or long-term capital losses rather than being considered all short-term as permitted under previous regulation.
The Act also contains several provisions aimed at preserving the character of distributions made by a fiscal year RIC during the portion of its taxable year ending after October 31 or December 31, reducing the circumstances under which a RIC might be required to file amended Forms 1099 to restate previously reported distributions.
Notes to Financial Statements (continued)
During the Funds’ tax year ended October 31, 2012, there were no post-enactment capital losses generated by any of the Funds.
7. Management Fees and Other Transactions with Affiliates
Each Fund’s management fee consists of two components – a fund-level fee, based only on the amount of assets within each individual Fund, and a complex-level fee, based on the aggregate amount of all eligible fund assets managed by the Adviser. This pricing structure enables each Fund’s shareholders to benefit from growth in the assets within their respective Fund as well as from growth in the amount of complex-wide assets managed by the Adviser.
The annual fund-level fee for each Fund, payable monthly, is calculated according to the following schedule:
| | | | | | | | | | | | |
| | | |
| Average Daily Net Assets | | Large Cap
Select
Fund-Level
Fee Rate | | | Mid Cap
Select
Fund-Level
Fee Rate | | | Small Cap
Select
Fund-Level
Fee Rate | |
For the first $125 million | | | .5500 | % | | | .7000 | % | | | .7000 | % |
For the next $125 million | | | .5375 | | | | .6875 | | | | .6875 | |
For the next $250 million | | | .5250 | | | | .6750 | | | | .6750 | |
For the next $500 million | | | .5125 | | | | .6625 | | | | .6625 | |
For the next $1 billion | | | .5000 | | | | .6500 | | | | .6500 | |
For net assets over $2 billion | | | .4750 | | | | .6250 | | | | .6250 | |
The annual complex-level fee for each Fund, payable monthly, is determined by taking the complex-level fee rate, which is based on the aggregate amount of “eligible assets” of all Nuveen funds as set forth in the schedule below, and making, as appropriate, an upward adjustment to that rate based upon the percentage of the particular fund’s assets that are not “eligible assets.” The complex-level fee schedule for each Fund is as follows:
| | | | |
| Complex-Level Asset Breakpoint Level* | | Effective Rate at Breakpoint Level | |
$55 billion | | | .2000 | % |
$56 billion | | | .1996 | |
$57 billion | | | .1989 | |
$60 billion | | | .1961 | |
$63 billion | | | .1931 | |
$66 billion | | | .1900 | |
$71 billion | | | .1851 | |
$76 billion | | | .1806 | |
$80 billion | | | .1773 | |
$91 billion | | | .1691 | |
$125 billion | | | .1599 | |
$200 billion | | | .1505 | |
$250 billion | | | .1469 | |
$300 billion | | | .1445 | |
| * | The complex-level fee is calculated based upon the aggregate daily “eligible assets” of all Nuveen Funds. Eligible assets do not include assets attributable to investments in other Nuveen Funds or assets in excess of $2 billion added to the Nuveen Fund complex in connection with the Adviser’s assumption of the management of the former First American Funds effective January 1, 2011. Eligible assets include closed-end fund assets managed by the Adviser that are attributable to financial leverage. For these purposes, financial leverage includes the closed-end funds’ use of preferred stock and borrowings and certain investments in the residual interest certificates (also called inverse floating rate securities) in tender option bond (TOB) trusts, including the portion of assets held by a TOB trust that has been effectively financed by the trust’s issuance of floating rate securities, subject to an agreement by the Adviser as to certain funds to limit the amount of such assets for determining eligible assets in certain circumstances. As of October 31, 2012, the complex-level fee rate for each of these Funds was as follows: |
| | | | |
| Fund | | Complex-Level Fee Rate | |
Large Cap Select | | | .1998 | % |
Mid Cap Select | | | .1998 | |
Small Cap Select | | | .1998 | |
The management fee compensates the Adviser for overall investment advisory and administrative services and general office facilities. The Adviser is responsible for each Fund’s overall strategy and asset allocation decisions. The Adviser has entered into sub-advisory agreements with Nuveen Asset Management, LLC (the “Sub-Adviser”), a wholly-owned subsidiary of the Adviser, under which the Sub-Adviser manages the investment portfolios of the Funds. The Sub-Adviser is compensated for its services to the Funds from the management fees paid to the Adviser.
The Adviser has contractually agreed to waive fees and/or reimburse expenses of Mid Cap Select so that total annual Fund operating expenses, (after fee waivers and/or expense reimbursements and excluding acquired fund fees and expenses) do not exceed the percentages of the average daily net assets of any class of Fund shares in the amounts and for the time periods stated in the following table:
| | | | |
| | | Mid Cap
Select | |
Class A Shares | | | 1.41 | % |
Class C Shares | | | 2.16 | |
Class I Shares | | | 1.16 | |
Expiration Date | | | February 28, 2013 | |
The Adviser has agreed to reimburse management fees across all share classes of Large Cap Select and Small Cap Select through December 31, 2012, to the extent necessary to maintain Class I Share total annual operating expenses, not including any acquired fund fees and expenses, at the applicable percentage of daily net assets listed in the Maximum Expense Level row of the following table, provided that in no event will the Adviser be required to make any reimbursements that would result in an annualized net management fee of less than the applicable percentage of daily net assets listed in the Minimum Management Fee row of the following table.
| | | | | | | | |
| | | Large Cap
Select | | | Small Cap
Select | |
Maximum Expense Level | | | 1.13 | % | | | 1.00 | % |
Minimum Management Fee | | | .75 | | | | .80 | |
The Adviser may also voluntarily reimburse expenses from time to time in any of the Funds. Voluntary reimbursements may be terminated at any time at the Adviser’s discretion.
The Trust pays no compensation directly to those of its directors who are affiliated with the Adviser or to its officers, all of whom receive remuneration for their services to the Trust from the Adviser or its affiliates. The Board of Directors has adopted a deferred compensation plan for independent directors that enable directors to elect to defer receipt of all or a portion of the annual compensation they are entitled to receive from certain Nuveen-advised funds. Under the plan, deferred amounts are treated as though equal dollar amounts had been invested in shares of select Nuveen-advised funds.
During the fiscal year ended October 31, 2012, Nuveen Securities, LLC (the “Distributor”), a wholly-owned subsidiary of Nuveen, collected sales charges on purchases of Class A Shares, the majority of which were paid out as concessions to financial intermediaries as follows:
| | | | | | | | | | | | |
| | | Large Cap
Select | | | Mid Cap
Select | | | Small Cap
Select | |
Sales charges collected (Unaudited) | | $ | 2,242 | | | $ | 7,845 | | | $ | 35,204 | |
Paid to financial intermediaries (Unaudited) | | | 1,957 | | | | 6,855 | | | | 30,765 | |
The Distributor also received 12b-1 service fees on Class A Shares, substantially all of which were paid to compensate financial intermediaries for providing services to shareholders relating to their investments.
During the fiscal year ended October 31, 2012, the Distributor compensated financial intermediaries directly with commission advances at the time of purchase as follows:
| | | | | | | | | | | | |
| | | Large Cap
Select | | | Mid Cap
Select | | | Small Cap
Select | |
Commission advances (Unaudited) | | $ | 147 | | | $ | 421 | | | $ | 3,065 | |
To compensate for commissions advanced to financial intermediaries, all 12b-1 service and distribution fees collected on Class B Shares and Class C Shares during the first year following a purchase were retained by the Distributor. During the fiscal year ended October 31, 2012, the Distributor retained such 12b-1 fees as follows:
| | | | | | | | | | | | |
| | | Large Cap
Select | | | Mid Cap
Select | | | Small Cap
Select | |
12b-1 fees retained (Unaudited) | | $ | 122 | | | $ | 2,721 | | | $ | 25,494 | |
The remaining 12b-1 fees charged to the Funds were paid to compensate financial intermediaries for providing services to shareholders relating to their investments.
The Distributor also collected and retained CDSC on share redemptions during the fiscal year ended October 31, 2012, as follows:
| | | | | | | | | | | | |
| | | Large Cap
Select | | | Mid Cap
Select | | | Small Cap
Select | |
CDSC retained (Unaudited) | | $ | 246 | | | $ | 459 | | | $ | 2,500 | |
Notes to Financial Statements (continued)
8. New Accounting Pronouncements
Financial Accounting Standards Board (“FASB”) Balance Sheet (Topic 210): Disclosures about Offsetting Assets and Liabilities
In December 2011, the FASB issued Accounting Standards Update (“ASU”) No. 2011-11 (“ASU No. 2011-11”) to enhance disclosures about financial instruments and derivative instruments that are subject to offsetting (“netting”) on the Statement of Assets and Liabilities. This information will enable users of the entity’s financial statements to evaluate the effect or potential effect of netting arrangements on the entity’s financial position. ASU No. 2011-11 is effective prospectively during interim or annual periods beginning on or after January 1, 2013. At this time, management is evaluating the implications of this guidance and the impact it will have to the financial statements amounts and footnote disclosures, if any.
Trustees and Officers (Unaudited)
The management of the Funds, including general supervision of the duties performed for the Funds by the Adviser, is the responsibility of the Board of Trustees of the Funds. The number of trustees of the Funds is currently set at ten. None of the trustees who are not “interested” persons of the Funds (referred to herein as “independent trustees”) has ever been a director or employee of, or consultant to, Nuveen or its affiliates. The names and business addresses of the trustees and officers of the Funds, their principal occupations and other affiliations during the past five years, the number of portfolios each oversees and other directorships they hold are set forth below.
The Funds’ Statement of Additional Information (“SAI”) includes more information about the trustees. To request a free copy, call Nuveen Investments at (800) 257-8787 or visit the Funds’ website at www.nuveen.com.
| | | | | | | | |
Name, Birthdate and Address | | Position(s) Held with the Funds | | Year First Elected or Appointed (1) | | Principal Occupation(s) Including other Directorships During Past 5 Years | | Number of Portfolios in Fund Complex Overseen by Trustee |
| | |
| Independent Trustees: | | | | |
Robert P. Bremner 8/22/40 333 W. Wacker Drive Chicago, IL 60606 | | Chairman of the Board and Trustee | | 1996 | | Private Investor and Management Consultant; Treasurer and Director, Humanities Council of Washington, D.C.; Board Member, Independent Directors Council affiliated with the Investment Company Institute. | | 217 |
Jack B. Evans 10/22/48 333 W. Wacker Drive Chicago, IL 60606 | | Trustee | | 1999 | | President, The Hall-Perrine Foundation, a private philanthropic corporation (since 1996); Director and Chairman, United Fire Group, a publicly held company; member of the Board of Regents for the State of Iowa University System; Director, Source Media Group; Life Trustee of Coe College and the Iowa College Foundation; formerly, Director, Alliant Energy; formerly, Director, Federal Reserve Bank of Chicago; formerly, President and Chief Operating Officer, SCI Financial Group, Inc., a regional financial services firm. | | 217 |
William C. Hunter 3/6/48 333 W. Wacker Drive Chicago, IL 60606 | | Trustee | | 2004 | | Dean Emeritus (since June 30, 2012), formerly, Dean, Tippie College of Business, University of Iowa (2006-2012); Director (since 2004) of Xerox Corporation; Director (since 2005), and President (since July 2012) Beta Gamma Sigma, Inc., The International Honor Society; Director of Wellmark, Inc. (since 2009); formerly, Dean and Distinguished Professor of Finance, School of Business at the University of Connecticut (2003-2006); previously, Senior Vice President and Director of Research at the Federal Reserve Bank of Chicago (1995-2003); formerly, Director (1997-2007), Credit Research Center at George Washington University. | | 217 |
David J. Kundert 10/28/42 333 W. Wacker Drive Chicago, IL 60606 | | Trustee | | 2005 | | Director, Northwestern Mutual Wealth Management Company; retired (since 2004) as Chairman, JPMorgan Fleming Asset Management, President and CEO, Banc One Investment Advisors Corporation, and President, One Group Mutual Funds; prior thereto, Executive Vice President, Banc One Corporation and Chairman and CEO, Banc One Investment Management Group; Member, Board of Regents, Luther College; member of the Wisconsin Bar Association; member of Board of Directors, Friends of Boerner Botanical Gardens; member of Board of Directors and Chair of Investment Committee, Greater Milwaukee Foundation. | | 217 |
William J. Schneider 9/24/44 333 W. Wacker Drive Chicago, IL 60606 | | Trustee | | 1996 | | Chairman of Miller-Valentine Partners Ltd., a real estate investment company; formerly, Senior Partner and Chief Operating Officer (retired 2004) of Miller-Valentine Group; member, University of Dayton Business School Advisory Council; member, Mid-America Health System Board; formerly, member and chair, Dayton Philharmonic Orchestra Association; formerly, member, Business Advisory Council, Cleveland Federal Reserve Bank. | | 217 |
Judith M. Stockdale 12/29/47 333 W. Wacker Drive Chicago, IL 60606 | | Trustee | | 1997 | | Executive Director, Gaylord and Dorothy Donnelley Foundation (since 1994); prior thereto, Executive Director, Great Lakes Protection Fund (1990-1994). | | 217 |
Carole E. Stone 6/28/47 333 W. Wacker Drive Chicago, IL 60606 | | Trustee | | 2007 | | Director, Chicago Board Options Exchange (since 2006); Director, C2 Options Exchange, Incorporated (since 2009); formerly, Commissioner, New York State Commission on Public Authority Reform (2005-2010); formerly, Chair, New York Racing Association Oversight Board (2005-2007). | | 217 |
Trustees and Officers (Unaudited) (continued)
| | | | | | | | |
Name, Birthdate and Address | | Position(s) Held with the Funds | | Year First Elected or Appointed (1) | | Principal Occupation(s) During Past Five Years | | Number of Portfolios in Fund Complex Overseen by Trustee |
Virginia L. Stringer 8/16/44 333 West Wacker Drive Chicago, IL 60606 | | Trustee | | 2011 | | Board Member, Mutual Fund Directors Forum; former governance consultant and non-profit board member; former Owner and President, Strategic Management Resources, Inc. a management consulting firm; former Member, Governing Board, Investment Company Institute’s Independent Directors Council; previously, held several executive positions in general management, marketing and human resources at IBM and The Pillsbury Company; Independent Director, First American Fund Complex (1987-2010) and Chair (1997-2010). | | 217 |
Terence J. Toth 9/29/59 333 W. Wacker Drive Chicago, IL 60606 | | Trustee | | 2008 | | Director, Legal & General Investment Management America, Inc. (since 2008); Managing Partner, Promus Capital (since 2008); formerly, CEO and President, Northern Trust Global Investments (2004-2007); Executive Vice President, Quantitative Management & Securities Lending (2000-2004); prior thereto, various positions with Northern Trust Company (since 1994); member: Chicago Fellowship Board (since 2005), Catalyst Schools of Chicago Board (since 2008); Mather Foundation Board (since 2012) and a member of its investment committee; formerly, member: Northern Trust Mutual Funds Board (2005-2007), Northern Trust Global Investments Board (2004-2007), Northern Trust Japan Board (2004-2007), Northern Trust Securities Inc. Board (2003-2007) and Northern Trust Hong Kong Board (1997-2004). | | 217 |
| | |
| Interested Trustee: | | | | |
John P. Amboian (2) 6/14/61 333 W. Wacker Drive Chicago, IL 60606 | | Trustee | | 2008 | | Chief Executive Officer and Chairman (since 2007) and Director (since 1999) of Nuveen Investments, Inc., formerly, President (1999-2007); Chief Executive Officer (since 2007) of Nuveen Investments Advisers Inc.; Director (since 1998) formerly, Chief Executive Officer (2007-2010) of Nuveen Fund Advisors, Inc. | | 217 |
Name, Birthdate and Address | | Position(s) Held with the Funds | | Year First Elected or Appointed (3) | | Principal Occupation(s) During Past 5 Years | | Number of Portfolios in Fund Complex Overseen by Officer |
| | |
| Officers of the Funds: | | | | |
Gifford R. Zimmerman 9/9/56 333 W. Wacker Drive Chicago, IL 60606 | | Chief Administrative Officer | | 1988 | | Managing Director (since 2002), Assistant Secretary of Nuveen Securities, LLC; Managing Director (since 2004) and Assistant Secretary (since 1994) of Nuveen Investments, Inc.; Managing Director (since 2002), Assistant Secretary (since 1997) and Co-General Counsel (since 2011) of Nuveen Fund Advisors, Inc.; Managing Director, Assistant Secretary and Associate General Counsel of Nuveen Asset Management, LLC (since 2011); Managing Director, Associate General Counsel and Assistant Secretary of Symphony Asset Management LLC (since 2003); Vice President and Assistant Secretary of NWQ Investment Management Company, LLC (since 2002), Nuveen Investments Advisers Inc. (since 2002), Santa Barbara Asset Management, LLC (since 2006) and of Winslow Capital Management, LLC, (since 2010); Chief Administrative Officer and Chief Compliance Officer (since 2006) of Nuveen Commodities Asset Management, LLC; Chartered Financial Analyst. | | 217 |
Margo L. Cook 4/11/64 333 W. Wacker Drive Chicago, IL 60606 | | Vice President | | 2009 | | Executive Vice President (since 2008) of Nuveen Investments, Inc. and of Nuveen Fund Advisors, Inc. (since 2011); Managing Director – Investment Services of Nuveen Commodities Asset Management, LLC (since August 2011) previously, Head of Institutional Asset Management (2007-2008) of Bear Stearns Asset Management; Head of Institutional Asset Management (1986-2007) of Bank of NY Mellon; Chartered Financial Analyst. | | 217 |
| | | | | | | | |
Name, Birthdate and Address | | Position(s) Held with the Funds | | Year First Elected or Appointed (3) | | Principal Occupation(s) During Past 5 Years | | Number of Portfolios in Fund Complex Overseen by Officer |
Lorna C. Ferguson 10/24/45 333 W. Wacker Drive Chicago, IL 60606 | | Vice President | | 1998 | | Managing Director (since 2005) of Nuveen Fund Advisors, Inc. and Nuveen Securities, LLC (since 2004). | | 217 |
Stephen D. Foy 5/31/54 333 W. Wacker Drive Chicago, IL 60606 | | Vice President and Controller | | 1998 | | Senior Vice President (since 2010), formerly, Vice President (2005-2010) and Funds Controller of Nuveen Securities, LLC; Vice President of Nuveen Fund Advisors, Inc.; Chief Financial Officer of Nuveen Commodities Asset Management, LLC (since 2010); Certified Public Accountant. | | 217 |
Scott S. Grace 8/20/70 333 W. Wacker Drive Chicago, IL 60606 | | Vice President and Treasurer | | 2009 | | Managing Director, Corporate Finance & Development, Treasurer (since 2009) of Nuveen Securities, LLC; Managing Director and Treasurer (since 2009) of Nuveen Fund Advisors, Inc., Nuveen Investments Advisers, Inc., Nuveen Investments Holdings Inc. and (since 2011) Nuveen Asset Management, LLC; Vice President and Treasurer of NWQ Investment Management Company, LLC, Tradewinds Global Investors, LLC, Symphony Asset Management LLC and Winslow Capital Management, LLC.; Vice President of Santa Barbara Asset Management, LLC; formerly, Treasurer (2006-2009), Senior Vice President (2008-2009), previously, Vice President (2006-2008) of Janus Capital Group, Inc.; formerly, Senior Associate in Morgan Stanley’s Global Financial Services Group (2000-2003); Chartered Accountant Designation. | | 217 |
Walter M. Kelly 2/24/70 333 W. Wacker Drive Chicago, IL 60606 | | Chief Compliance Officer and Vice President | | 2003 | | Senior Vice President (since 2008) and Assistant Secretary (since 2003) of Nuveen Fund Advisors, Inc; Senior Vice President (since 2008) of Nuveen Investments Holdings, Inc; formerly, Senior Vice President (2008-2011) of Nuveen Securities, LLC. | | 217 |
Tina M. Lazar 8/27/61 333 W. Wacker Drive Chicago, IL 60606 | | Vice President | | 2002 | | Senior Vice President (since 2010), formerly, Vice President (2005-2010) of Nuveen Fund Advisors, Inc. | | 217 |
Name, Birthdate and Address | | Position(s) Held with the Funds | | Year First Elected or Appointed (3) | | Principal Occupation(s) Including other Directorships During Past 5 Years | | Number of Portfolios in Fund Complex Overseen by Officer |
Kevin J. McCarthy 3/26/66 333 W. Wacker Drive Chicago, IL 60606 | | Vice President and Secretary | | 2007 | | Managing Director and Assistant Secretary (since 2008), formerly, Vice President (2007-2008), Nuveen Securities, LLC; Managing Director (since 2008), Assistant Secretary (since 2007) and Co-General Counsel (since 2011) of Nuveen Fund Advisors, Inc.; Managing Director, Assistant Secretary and Associate General Counsel (since 2011) of Nuveen Asset Management, LLC; Managing Director (since 2008), and Assistant Secretary, Nuveen Investment Holdings, Inc.; Vice President (since 2007) and Assistant Secretary of Nuveen Investments Advisers Inc., NWQ Investment Management Company, LLC, Tradewinds Global Investors LLC, NWQ Holdings, LLC, Symphony Asset Management LLC, Santa Barbara Asset Management, LLC, and of Winslow Capital Management, LLC. (since 2010); Vice President and Secretary (since 2010) of Nuveen Commodities Asset Management, LLC; prior thereto, Partner, Bell, Boyd & Lloyd LLP (1997-2007). | | 217 |
Kathleen L. Prudhomme 3/30/53 901 Marquette Avenue Minneapolis, MN 55402 | | Vice President and Assistant Secretary | | 2011 | | Managing Director, Assistant Secretary and Co-General Counsel (since 2011) of Nuveen Fund Advisors, Inc.; Managing Director, Assistant Secretary and Associate General Counsel (since 2011) of Nuveen Asset Management, LLC; Managing Director and Assistant Secretary (since 2011) of Nuveen Securities, LLC; formerly, Deputy General Counsel, FAF Advisors, Inc. (2004-2010). | | 217 |
Trustees and Officers (Unaudited) (continued)
| | | | | | | | |
Name, Birthdate and Address | | Position(s) Held with the Funds | | Year First Elected or Appointed (3) | | Principal Occupation(s) Including other Directorships During Past 5 Years | | Number of Portfolios in Fund Complex Overseen by Officer |
Jeffery M. Wilson 3/13/56 333 West Wacker Drive Chicago, IL 60606 | | Vice President | | 2011 | | Senior Vice President of Nuveen Securities, LLC (since 2011); formerly, Senior Vice President of FAF Advisors, Inc. (2000-2010). | | 100 |
| (1) | Trustees serve an indefinite term until his/her successor is elected or appointed. The year first elected or appointed represents the year in which the trustee was first elected or appointed to any fund in the Nuveen Fund Complex. |
| (2) | Mr. Amboian is an interested trustee because of his position with Nuveen Investments, Inc. and certain of its subsidiaries, which are affiliates of the Nuveen Funds. |
| (3) | Officers serve one year terms through August of each year. The year first elected or appointed represents the year in which the officer was first elected or appointed to any fund in the Nuveen Fund Complex. |
Annual Investment Management Agreement Approval Process
(Unaudited)
The Board of Directors (each, a “Board” and each Director, a “Board Member”) of the Funds, including the Board Members who are not parties to the Funds’ advisory or sub-advisory agreements or “interested persons” of any such parties (the “Independent Board Members”), is responsible for approving the advisory agreements (each, an “Investment Management Agreement”) between each Fund and Nuveen Fund Advisors, Inc. (the “Advisor”) and the sub-advisory agreements (each, a “Sub-Advisory Agreement”) between the Advisor and Nuveen Asset Management, LLC (the “Sub-Advisor”) (the Investment Management Agreements and the Sub-Advisory Agreements are referred to collectively as the “Advisory Agreements”) and their periodic continuation. Pursuant to the Investment Company Act of 1940, as amended (the “1940 Act”), the Board is required to consider the continuation of the Advisory Agreements on an annual basis. Accordingly, at an in-person meeting held on May 21-23, 2012 (the “May Meeting”), the Board, including a majority of the Independent Board Members, considered and approved the continuation of the Advisory Agreements for the Funds for an additional one-year period.
In preparation for its considerations at the May Meeting, the Board requested and received extensive materials prepared in connection with the review of the Advisory Agreements. The materials provided a broad range of information regarding the Funds, the Advisor and the Sub-Advisor (the Advisor and the Sub-Advisor are collectively, the “Fund Advisers” and each, a “Fund Adviser”). As described in more detail below, the information provided included, among other things, a review of Fund performance, including Fund investment performance assessments against peer groups and appropriate benchmarks, a comparison of Fund fees and expenses relative to peers, a description and assessment of shareholder service levels for the Funds, a summary of the performance of certain service providers, a review of product initiatives and shareholder communications and an analysis of the Advisor’s profitability with comparisons to comparable peers in the managed fund business. As part of its annual review, the Board also held a separate meeting on April 18-19, 2012, to review the Funds’ investment performance and consider an analysis provided by the Advisor of the Sub-Advisor which generally evaluated the Sub-Advisor’s investment team, investment mandate, organizational structure and history, investment philosophy and process, performance of the applicable Fund, and significant changes to the foregoing. As a result of its review of the materials and discussions, the Board presented the Advisor with questions and the Advisor responded.
The materials and information prepared in connection with the annual review of the Advisory Agreements supplement the information and analysis provided to the Board during the year. In this regard, throughout the year, the Board, acting directly or through its committees, regularly reviews the performance and various services provided by the Advisor and the Sub-Advisor. The Board meets at least quarterly as well as at other times as the need arises. At its quarterly meetings, the Board reviews reports by the Advisor which include, among other things, Fund performance, a review of the investment teams and reports on compliance, regulatory matters and risk management. The Board also meets with key investment personnel managing the Fund portfolios during the year. In October 2011, the Board also created two new standing committees (the Open-end Fund Committee and the Closed-end Fund Committee) to assist the full Board in monitoring and gaining a deeper insight into the distinctive issues and business practices of open-end and closed-end funds.
In addition, the Board continues its program of seeking to have the Board Members or a subset thereof visit each sub-advisor to the Nuveen funds at least once over a multiple year rotation, meeting with key investment and business personnel. Further, an ad hoc committee of the Board visited the then-current transfer agents of the Nuveen funds in 2011 and the audit committee of the Board visited the various pricing agents for the Nuveen funds in January 2012.
The Board considers factors and information that are relevant to its annual consideration of the renewal of the Advisory Agreements at the meetings held throughout the year. Accordingly, the Board considers the information provided and knowledge gained at these meetings when performing its annual review of the Advisory Agreements. The Independent Board Members are assisted throughout the process by independent legal counsel who provided materials describing applicable law and the duties of directors or trustees in reviewing advisory contracts and met with the Independent Board Members in executive sessions without management present. In addition, it is important to recognize that the management arrangements for the Nuveen funds are the result of many years of review and discussion between the Independent Board Members and fund management and that the Board Members’ conclusions may be based, in part, on their consideration of fee arrangements and other factors developed in previous years.
The Board considered all factors it believed relevant with respect to each Fund, including among other factors: (a) the nature, extent and quality of the services provided by the Fund Advisers, (b) the investment performance of the Fund and Fund Advisers, (c) the advisory fees and costs of the services to be provided to the Fund and the profitability of the Fund Advisers, (d) the extent of any economies of scale, (e) any benefits derived by the Fund Advisers from the relationship with the Fund and (f) other factors. Each Board Member may have accorded different weight to the various factors in reaching his or her conclusions with respect to a Fund’s Advisory Agreements. The Independent Board Members did not identify any single factor as all important or controlling. The Independent Board Members’ considerations were instead based on a comprehensive consideration of all the information presented. The principal factors considered by the Board and its conclusions are described below.
A. Nature, Extent and Quality of Services
In considering renewal of the Advisory Agreements, the Independent Board Members considered the nature, extent and quality of the Fund Adviser’s services, including advisory services and the resulting Fund performance and administrative services. The Independent Board Members further considered the overall reputation and capabilities of the Advisor and its affiliates, the commitment of the Advisor to provide high quality service to the Funds, their overall confidence in the Advisor’s integrity and the Advisor’s
Annual Investment Management Agreement Approval Process
(Unaudited) (continued)
responsiveness to questions and concerns raised by them. The Independent Board Members reviewed materials outlining, among other things, the Fund Adviser’s organization and business; the types of services that the Fund Adviser or its affiliates provide to the Funds; the performance record of the applicable Fund (as described in further detail below); and any initiatives Nuveen had taken for the applicable fund product line.
In considering advisory services, the Board recognized that the Advisor provides various oversight, administrative, compliance and other services for the Funds and the Sub-Advisor generally provides the portfolio investment management services to the Funds. In reviewing the portfolio management services provided to each Fund, the Board reviewed the materials provided by the Nuveen Investment Services Oversight Team analyzing, among other things, the Sub-Advisor’s investment team and changes thereto, organization and history, assets under management, Fund objectives and mandate, the investment team’s philosophy and strategies in managing the Fund, developments affecting the Sub-Advisor or Fund and Fund performance. The Independent Board Members also reviewed portfolio manager compensation arrangements to evaluate each Fund Adviser’s ability to attract and retain high quality investment personnel, preserve stability, and reward performance but not provide an inappropriate incentive to take undue risks. In addition, the Board considered the Advisor’s execution of its oversight responsibilities over the Sub-Advisor. Given the importance of compliance, the Independent Board Members also considered Nuveen’s compliance program, including the report of the chief compliance officer regarding the Funds’ compliance policies and procedures; the resources dedicated to compliance; and the record of compliance with the policies and procedures.
In addition to advisory services, the Board considered the quality and extent of administrative and other non-investment advisory services the Advisor and its affiliates provide to the Funds, including product management, investment services (such as oversight of investment policies and procedures, risk management, and pricing), fund administration, oversight of service providers, shareholder services and communications, administration of Board relations, regulatory and portfolio compliance and legal support. The Board further recognized Nuveen’s additional investments in personnel, including in compliance and risk management. In reviewing the services provided, the Board also reviewed materials describing various notable initiatives and projects the Advisor performed in connection with the open-end fund product line. These initiatives included efforts to eliminate product overlap through mergers or liquidations; commencement of various new funds; elimination of insurance mandates for various funds; updates in investment policies or guidelines for several funds; and reductions in management fees and expense caps for certain funds.
Based on their review, the Independent Board Members found that, overall, the nature, extent and quality of services provided to the respective Funds under each applicable Advisory Agreement were satisfactory.
B. The Investment Performance of the Funds and Fund Advisers
The Board, including the Independent Board Members, reviewed and considered the performance history of each Fund over various time periods. The Board reviewed, among other things, each Fund’s historic investment performance as well as information comparing the Fund’s performance information with that of other funds (the “Performance Peer Group”) based on data compiled by Nuveen that was provided by an independent provider of mutual fund data and with recognized and/or customized benchmarks (i.e., benchmarks derived from multiple recognized benchmarks).
The Board reviewed reports, including a comprehensive analysis of the Funds’ performance and the applicable investment team. In this regard, the Board reviewed each Fund’s total return information compared to the returns of its Performance Peer Group and recognized and/or customized benchmarks for the quarter, one-, three- and five-year periods ending December 31, 2011, as well as performance information reflecting the first quarter of 2012.
In reviewing performance comparison information, the Independent Board Members recognized that the usefulness of the comparisons of the performance of certain funds with the performance of their respective Performance Peer Group may be limited because the Performance Peer Group may not adequately represent the objectives and strategies of the applicable funds or may be limited in size or number. The Independent Board Members also noted that the investment experience of a particular shareholder in the Nuveen funds will vary depending on when such shareholder invests in the applicable fund, the class held (if multiple classes are offered in a fund) and the performance of the fund (or respective class) during that shareholder’s investment period. In addition, although the performance below reflects the performance results for the time periods ending as of the most recent calendar year end (unless otherwise indicated), the Board also recognized that selecting a different ending time period may derive different results. Furthermore, while the Board is cognizant of the relevant performance of a fund’s peer set and/or benchmark(s), the Board evaluated fund performance in light of the respective fund’s investment objectives, investment parameters and guidelines and recognized that the objectives, investment parameters and guidelines of peers and/or benchmarks may differ to some extent, thereby resulting in differences in performance results. Nevertheless, with respect to any Nuveen funds that the Board considers to have underperformed their peers and/or benchmarks from time to time, the Board monitors such funds closely and considers any steps necessary or appropriate to address such issues.
In considering the results of the comparisons for the Funds, the Independent Board Members observed, among other things, that the Nuveen Small Cap Select Fund had satisfactory performance compared to its peers, performing in the second or third quartile over various periods, while the Nuveen Mid Cap Select Fund (the “Mid Cap Fund”) and the Nuveen Large Cap Select Fund (the “Large Cap Fund”) lagged their respective peers and/or benchmarks over various periods (although the Large Cap Fund was in the second quartile for the three-year period and the first quartile for the first quarter of 2012). With respect to the Nuveen funds that have shown
periods of underperformance, the Board considered the factors affecting performance and was satisfied with the process followed in seeking to address any performance issues in light of the fund’s investment strategy. In this regard, the Board noted, in particular, the portfolio management team changes for the Mid Cap Fund.
Based on their review, the Independent Board Members determined that, except as noted above, each Fund’s investment performance had been satisfactory.
C. Fees, Expenses and Profitability
1. Fees and Expenses
The Board evaluated the management fees and expenses of each Fund reviewing, among other things, such Fund’s gross management fees, net management fees and net expense ratios in absolute terms as well as compared to the fee and expenses of a comparable universe of funds provided by an independent fund data provider (the “Peer Universe”) and to a more focused subset of funds in the Peer Universe (the “Peer Group”) and any expense limitations.
The Independent Board Members further reviewed the methodology regarding the construction of the applicable Peer Universe and Peer Group. In reviewing the comparisons of fee and expense information, the Independent Board Members took into account that in certain instances various factors such as: the limited size and particular composition of the Peer Universe or Peer Group (including the inclusion of other Nuveen funds in the peer set); expense anomalies; changes in the funds comprising the Peer Universe or Peer Group from year to year; levels of reimbursement or fee waivers; and the timing of information used may impact the comparative data, thereby limiting somewhat the ability to make a meaningful comparison with peers.
In reviewing the fee schedule for a Fund, the Independent Board Members also considered the fund-level and complex-wide breakpoint schedules (described in further detail below) and any fee waivers and reimbursements provided by Nuveen. In reviewing fees and expenses, the Board considered the expenses and fees to be higher if they were over 10 basis points higher, slightly higher if they were approximately 6 to 10 basis points higher, in line if they were within approximately 5 basis points higher than the peer average and below if they were below the peer average of the Peer Group. In reviewing the reports, the Board noted that the overwhelming majority of the Nuveen funds were at, close to or below their Peer Group or Peer Universe (if no separate Peer Group) average based on the net total expense ratio.
The Independent Board Members observed that the Funds had net management fees and net expense ratios (including fee waivers and expense reimbursements, if any) below or in line with their respective peer averages.
Based on their review of the fee and expense information provided, the Independent Board Members determined that each Fund’s management fees were reasonable in light of the nature, extent and quality of services provided to the Fund.
2. Comparisons with the Fees of Other Clients
The Independent Board Members further reviewed information regarding the nature of services and range of fees offered by the Advisor to other clients, including separately managed accounts (both retail and institutional accounts), collective trusts, foreign investment funds offered by Nuveen and funds that are not offered by Nuveen but are sub-advised by one of Nuveen’s investment management teams. In evaluating the comparisons of fees, the Independent Board Members noted that the fee rates charged to the Funds and other clients vary, among other things, because of the different services involved and the additional regulatory and compliance requirements associated with registered investment companies, such as the Funds. Accordingly, the Independent Board Members considered the differences in the product types, including, but not limited to, the services provided, the structure and operations, product distribution and costs thereof, portfolio investment policies, investor profiles, account sizes and regulatory requirements. The Independent Board Members noted, in particular, that the range of services provided to the Funds (as discussed above) is much more extensive than that provided to separately managed accounts. Given the inherent differences in the various products, particularly the extensive services provided to the Funds, the Independent Board Members believe such facts justify the different levels of fees.
In considering the fees of the Sub-Advisor, the Independent Board Members also considered the pricing schedule or fees that the Sub-Advisor charges for similar investment management services for other Nuveen funds, funds of other sponsors (if any), and other clients (such as retail and/or institutional managed accounts).
3. Profitability of Fund Advisers
In conjunction with their review of fees, the Independent Board Members also considered the profitability of Nuveen for its advisory activities and its financial condition. The Independent Board Members reviewed the revenues and expenses of Nuveen’s advisory activities for the last two calendar years, the allocation methodology used in preparing the profitability data and an analysis of the key drivers behind the changes in revenues and expenses that impacted profitability in 2011. The Independent Board Members noted this information supplemented the profitability information requested and received during the year to help keep them apprised of developments affecting profitability (such as changes in fee waivers and expense reimbursement commitments). In this regard, the Independent Board Members noted that they have an Independent Board Member serve as a point person to review and keep them apprised of changes to the profitability analysis and/or methodologies during the year. The
Annual Investment Management Agreement Approval Process
(Unaudited) (continued)
Independent Board Members also considered Nuveen’s revenues for advisory activities, expenses, and profit margin compared to that of various unaffiliated management firms with comparable assets under management (based on asset size and asset composition).
In reviewing profitability, the Independent Board Members recognized the Advisor’s continued investment in its business to enhance its services, including capital improvements to investment technology, updated compliance systems, and additional personnel in compliance, risk management, and product development as well as its ability to allocate resources to various areas of the Advisor as the need arises. In addition, in evaluating profitability, the Independent Board Members also recognized the subjective nature of determining profitability which may be affected by numerous factors including the allocation of expenses. Further, the Independent Board Members recognized the difficulties in making comparisons as the profitability of other advisers generally is not publicly available and the profitability information that is available for certain advisers or management firms may not be representative of the industry and may be affected by, among other things, the adviser’s particular business mix, capital costs, types of funds managed and expense allocations. Notwithstanding the foregoing, the Independent Board Members reviewed Nuveen’s methodology and assumptions for allocating expenses across product lines to determine profitability. In reviewing profitability, the Independent Board Members recognized Nuveen’s investment in its fund business. Based on their review, the Independent Board Members concluded that the Advisor’s level of profitability for its advisory activities was reasonable in light of the services provided.
With respect to sub-advisers affiliated with Nuveen, including the Sub-Advisor, the Independent Board Members reviewed the sub-adviser’s revenues, expenses and profitability margins (pre- and post-tax) for its advisory activities and the methodology used for allocating expenses among the internal sub-advisers. Based on their review, the Independent Board Members were satisfied that the Sub-Advisor’s level of profitability was reasonable in light of the services provided.
In evaluating the reasonableness of the compensation, the Independent Board Members also considered other amounts paid to a Fund Adviser by the Funds as well as any indirect benefits (such as soft dollar arrangements, if any) the Fund Adviser and its affiliates receive, or are expected to receive, that are directly attributable to the management of the Funds, if any. See Section E below for additional information on indirect benefits a Fund Adviser may receive as a result of its relationship with the Funds. Based on their review of the overall fee arrangements of each Fund, the Independent Board Members determined that the advisory fees and expenses of the respective Fund were reasonable.
D. Economies of Scale and Whether Fee Levels Reflect These Economies of Scale
With respect to economies of scale, the Independent Board Members have recognized the potential benefits resulting from the costs of a fund being spread over a larger asset base, although economies of scale are difficult to measure and predict with precision, particularly on a fund-by-fund basis. One method to help ensure the shareholders share in these benefits is to include breakpoints in the advisory fee schedule. Generally, management fees for funds in the Nuveen complex are comprised of a fund-level component and a complex-level component, subject to certain exceptions. Accordingly, the Independent Board Members reviewed and considered the applicable fund-level breakpoints in the advisory fee schedules that reduce advisory fees as asset levels increase.
In addition to fund-level advisory fee breakpoints, the Board also considered the Funds’ complex-wide fee arrangement. Pursuant to the complex-wide fee arrangement, the fees of the funds in the Nuveen complex are generally reduced as the assets in the fund complex reach certain levels. The complex-wide fee arrangement seeks to provide the benefits of economies of scale to fund shareholders when total fund complex assets increase, even if assets of a particular fund are unchanged or have decreased. The approach reflects the notion that some of Nuveen’s costs are attributable to services provided to all its funds in the complex and therefore all funds benefit if these costs are spread over a larger asset base. In addition, with the acquisition of the funds previously advised by FAF Advisors, Inc., the Board noted that a portion of such funds’ assets at the time of acquisition were deemed eligible to be included in the complex-wide fee calculation in order to deliver fee savings to shareholders in the combined complex and such funds were subject to differing complex-level fee rates.
Based on their review, the Independent Board Members concluded that the breakpoint schedules and complex-wide fee arrangement were acceptable and reflect economies of scale to be shared with shareholders when assets under management increase.
E. Indirect Benefits
In evaluating fees, the Independent Board Members received and considered information regarding potential “fall out” or ancillary benefits the respective Fund Adviser or its affiliates may receive as a result of its relationship with each Fund. In this regard, the Independent Board Members considered, among other things, any sales charges, distribution fees and shareholder services fees received and retained by the Funds’ principal underwriter, an affiliate of the Advisor, which includes fees received pursuant to any 12b-1 plan. The Independent Board Members, therefore, considered the 12b-1 fees retained by Nuveen during the last calendar year.
In addition to the above, the Independent Board Members considered whether the Fund Advisers received any benefits from soft dollar arrangements whereby a portion of the commissions paid by a Fund for brokerage may be used to acquire research that may be useful to the Fund Adviser in managing the assets of the Funds and other clients. The Independent Board Members recognized that each Fund Adviser has the authority to pay a higher commission in return for brokerage and research services if it determines in good faith that the commission paid is reasonable in relation to the value of the brokerage and research services provided and may benefit
from such soft dollar arrangements. Similarly, the Board recognized that the research received pursuant to soft dollar arrangements by a Fund Adviser may also benefit a Fund and shareholders to the extent the research enhances the ability of the Fund Adviser to manage the Fund. The Independent Board Members noted that the Fund Advisers’ profitability may be somewhat lower if they did not receive the research services pursuant to the soft dollar arrangements and had to acquire such services directly.
Based on their review, the Independent Board Members concluded that any indirect benefits received by a Fund Adviser as a result of its relationship with the Funds were reasonable and within acceptable parameters.
F. Other Considerations
The Independent Board Members did not identify any single factor discussed previously as all-important or controlling. The Board Members, including the Independent Board Members, unanimously concluded that the terms of each Advisory Agreement are fair and reasonable, that the respective Fund Adviser’s fees are reasonable in light of the services provided to each Fund and that the Advisory Agreements be renewed.
Notes
Notes
Glossary of Terms Used in this Report
Average Annual Total Return: This is a commonly used method to express an investment’s performance over a particular, usually multi-year time period. It expresses the return that would have been necessary each year to equal the investment’s actual cumulative performance (including change in NAV or offer price and reinvested distributions and capital gains, if any) over the time period being considered.
Beta: A measure of the variability of the change in the share price for a fund in relation to a change in the value of the fund’s market benchmark. Securities with betas higher than 1.0 have been, and are expected to be, more volatile than the benchmark; securities with betas lower than 1.0 have been, and are expected to be, less volatile than the benchmark.
Gross Domestic Product (GDP): The total market value of all final goods and services produced in a country/region in a given year, equal to total consumer, investment and government spending, plus the value of exports, minus the value of imports.
Lipper Large-Cap Core Funds Classification Average: Represents the average annualized total return for all reporting funds in the Lipper Large-Cap Core Funds Classification. Lipper returns account for the effects of management fees and assume reinvestment of distributions but do not reflect any applicable sales charges.
Lipper Mid-Cap Core Funds Classification Average: Represents the average annualized total return for all reporting funds in the Lipper Mid-Cap Core Funds Classification. Lipper returns account for the effects of management fees and assume reinvestment of distributions but do not reflect any applicable sales charges.
Lipper Small-Cap Core Funds Classification Average: Represents the average annualized total return for all reporting funds in the Lipper Small-Cap Core Funds Classification. Lipper returns account for the effects of management fees and assume reinvestment of distributions but do not reflect any applicable sales charges.
Net Asset Value (NAV): The net market value of all securities held in a portfolio.
Net Asset Value (NAV) Per Share: The market value of one share of a mutual fund or closed-end fund. For a Fund, the NAV is calculated daily by taking the Fund’s total assets (securities, cash, and accrued earnings), subtracting the Fund’s liabilities, and dividing by the number of shares outstanding.
Russell 2000® Index: An index that measures the performance of the small-cap segment of the U.S. equity universe. The Russell 2000 is a subset of the Russell 3000® Index representing approximately 10% of the total market capitalization of that index. It includes approximately 2,000 of the smallest securities based on a combination of their market cap and current index membership. The index returns assume reinvestment of distributions, but do not reflect any applicable sales charges or management fees.
Russell Midcap® Index: An index that measures the performance of the mid-cap segment of the U.S. equity universe. The Russell Midcap is a subset of the Russell 1000® Index. It includes approximately 800 of the smallest securities based on a combination of their market cap and current index membership. The Russell Midcap represents approximately 31% of the total market capitalization of the Russell 1000 companies. The index returns assume reinvestment of distributions, but do not reflect any applicable sales charges or management fees.
S&P 500® Index: An unmanaged index generally considered representative of the U.S. stock market. The index returns assume reinvestment of distributions, but do not reflect any applicable sales charges or management fees.
Tax Equalization: The practice of treating a portion of the distribution made to a redeeming shareholder, which represents his proportionate part of undistributed net investment income and capital gain as a distribution for tax purposes. Such amounts are referred to as the equalization debits (or payments) and will be considered a distribution to the shareholder of net investment income and capital gain for calculation of the Fund’s dividends paid deduction.
Additional Fund Information
Fund Manager
Nuveen Fund Advisors, Inc.
333 West Wacker Drive
Chicago, IL 60606
Sub-Adviser
Nuveen Asset Management, LLC
333 West Wacker Drive
Chicago, IL 60606
Legal Counsel
Chapman and Cutler LLP
Chicago, IL
Independent Registered Public Accounting Firm
PricewaterhouseCoopers LLP
Chicago, IL
Custodian
U.S. Bank National Association
St. Paul, MN
Transfer Agent and Shareholder Services
Boston Financial
Data Services, Inc.
Nuveen Investor Services
P.O. Box 8530
Boston, MA 02266-8530
(800) 257-8787
Distribution Information: The following Fund hereby designates its percentages of dividends paid from net ordinary income as dividends qualifying for the 70% dividends received deduction (“DRD”) for corporations and its percentages as qualified dividend income (“QDI”) for individuals under Section 1 (h)(11) of the Internal Revenue Code as shown in the accompanying table. The actual qualified dividend income distributions will be reported to shareholders on Form 1099-DIV which will be sent to shareholders shortly after calendar year end.
| | | | | | | | |
| Fund | | % of DRD | | | % of QDI | |
Nuveen Large Cap Select Fund | | | 100 | % | | | 100 | % |
Long-Term Capital Gain Distributions: Nuveen Small Cap Select Fund designated as a long-term capital gain dividend, pursuant to the Internal Revenue Code Section 852(b)(3), $19,094,723, or, if greater, the amount necessary to reduce earnings and profits of the Fund related to net capital gain to zero for the tax year ended October 31, 2012.
Quarterly Portfolio of Investments and Proxy Voting information: You may obtain (i) each Fund’s quarterly portfolio of investments, (ii) information regarding how each Fund voted proxies relating to portfolio securities held during the most recent twelve-month period ended June 30, and (iii) a description of the policies and procedures that each Fund used to determine how to vote proxies relating to portfolio securities without charge, upon request, by calling Nuveen Investments at (800) 257-8787 or on Nuveen’s website at www.nuveen.com.
You may also obtain this and other Fund information directly from the Securities and Exchange Commission (SEC). The SEC may charge a copying fee for this information. Visit the SEC on-line at http://www.sec.gov or in person at the SEC’s Public Reference Room in Washington, D.C. Call the SEC at (202) 942-8090 for room hours and operation. You may also request Fund information by sending an e-mail request to publicinfo@sec.gov or by writing to the SEC’s Public Reference Section at 100 F Street NE, Washington, D.C. 20549.
The Financial Industry Regulatory Authority (FINRA) provides a Public Disclosure Program which supplies certain information regarding the disciplinary history of FINRA members and their associated persons in response to either telephone inquiries at (800) 289-9999 or written inquiries at www.finra.org. FINRA also provides an investor brochure that includes information describing the Public Disclosure Program.
Nuveen Investments:
Serving Investors for Generations
Since 1898, financial advisors and their clients have relied on Nuveen Investments to provide dependable investment solutions through continued adherence to proven, long-term investing principles. Today, we offer a range of high quality equity and fixed-income solutions designed to be integral components of a well-diversified core portfolio.
Focused on meeting investor needs.
Nuveen Investments provides high-quality investment services designed to help secure the longterm goals of institutional and individual investors as well as the consultants and financial advisors who serve them. Nuveen Investments markets a wide range of specialized investment solutions which provide investors access to capabilities of its high-quality boutique investment affiliates-Nuveen Asset Management, Symphony Asset Management, NWQ Investment Management Company, Santa Barbara Asset Management, Tradewinds Global Investors, Winslow Capital Management, and Gresham Investment Management. In total, Nuveen Investments managed approximately $220 billion as of September 30, 2012.
Find out how we can help you.
To learn more about how the products and services of Nuveen Investments may be able to help you meet your financial goals, talk to your financial advisor, or call us at (800) 257-8787. Please read the information provided carefully before you invest. Investors should consider the investment objective and policies, risk considerations, charges and expenses of any investment carefully. Where applicable, be sure to obtain a prospectus, which contains this and other relevant information. To obtain a prospectus, please contact your securities representative or Nuveen Investments, 333 W. Wacker Dr., Chicago, IL 60606. Please read the prospectus carefully before you invest or send money.
Learn more about Nuveen Funds at: www.nuveen.com/mf
| | |
Distributed by Nuveen Securities, LLC 333 West Wacker Drive Chicago, IL 60606 www.nuveen.com | | |
MAN-FSLCT-1012P
Mutual Funds
Nuveen Equity Funds
For investors seeking long-term capital appreciation.
Semi-Annual Report
March 31, 2013
| | | | | | | | |
| | | Share Class / Ticker Symbol |
| | | | |
| Fund Name | | Class A | | Class C | | Class R3 | | Class I |
Nuveen Symphony Large-Cap Growth Fund | | NCGAX | | NCGCX | | NSGQX | | NSGIX |
Nuveen Symphony Mid-Cap Core Fund | | NCCAX | | NCCCX | | NMCRX | | NCCIX |
Nuveen Symphony International Equity Fund | | NSIAX | | NSECX | | NSREX | | NSIEX |
Nuveen Symphony Low Volatility Equity Fund
(formerly Nuveen Symphony Optimized Alpha Fund) | | NOPAX | | NOPCX | | — | | NOPRX |
LIFE IS COMPLEX.
Nuveen makes things e-simple.
It only takes a minute to sign up for e-Reports. Once enrolled, you’ll receive an e-mail as soon as your Nuveen Fund information is ready. No more waiting for delivery by regular mail. Just click on the link within the e-mail to see the report and save it on your computer if you wish.
Free e-Reports right to your e-mail!
www.investordelivery.com
If you receive your Nuveen Fund distributions and statements from your financial advisor or brokerage account.
OR
www.nuveen.com/accountaccess
If you receive your Nuveen Fund distributions and statements directly from Nuveen.
| | | | | | |
| Must be preceded by or accompanied by a prospectus. | | NOT FDIC INSURED | | MAY LOSE VALUE | | NO BANK GUARANTEE |
Table of Contents
Chairman’s
Letter to Shareholders
Dear Shareholders,
The global economy continues to struggle with low growth rates. The European Central Bank’s commitment to “do what it takes” to support sovereign debt markets has stabilized the broader euro area financial markets. The larger member states of the European Union (EU) are working diligently on a tighter financial and banking union and meaningful progress is being made. However, economic conditions in the southern tier members are not improving and their political leaders are becoming more forceful in their demands for loosening the current EU fiscal targets and timetables. Economic growth in emerging market countries continues to be buffeted by lower overseas demand for their manufactured products and raw materials.
In the U.S., the Fed’s commitment to low interest rates through Quantitative Easing is the subject of increasing debate in its policy making deliberations and many independent economists are expressing concern about the economic distortions resulting from negative real interest rates. There are encouraging signs in Congress that both political parties are working toward compromises on previously irreconcilable issues such as reforming immigration laws and the tax code. It is too early to tell whether those efforts will produce meaningful results or pave the way for cooperation on the major fiscal issues that loom ahead. Over the longer term, there are some positive trends for the U.S. economy: house prices are clearly recovering, banks and corporations continue to strengthen their financial positions and incentives for capital investment in the U.S. by domestic and foreign corporations are increasing due to more competitive energy and labor costs.
During the last eighteen months, U.S. investors have benefited from strong returns in the domestic equity markets and steady total returns in many fixed income markets. However, many macroeconomic risks remain unresolved, including negotiating through the many U.S. fiscal issues, achieving a better balance between fiscal discipline and encouraging economic growth in the euro area and reducing the potential economic impact of geopolitical issues, particularly in the Middle East and East Asia. In the face of these uncertainties, the experienced investment professionals at Nuveen Investments seek out investments that are enjoying positive and sustainable returns. At the same time they are always on the alert for risks in markets that are subject to the excessive optimism that can accompany an extended period of abnormally low interest rates. Monitoring this process is a critical function for the Fund Board as it oversees your Nuveen Fund on your behalf.
As always, I encourage you to communicate with your financial consultant if you have any questions about your investment in a Nuveen Fund. On behalf of the other members of your Fund Board, we look forward to continuing to earn your trust in the months and years ahead.
Sincerely,
Robert P. Bremner
Chairman of the Board
May 24, 2013
Portfolio Managers’ Comments
Certain statements in this report are forward-looking statements. Discussions of specific investments are for illustration only and are not intended as recommendations of individual investments. The forward-looking statements and other views expressed herein are those of the portfolio managers as of the date of this report. Actual future results or occurrences may differ significantly from those anticipated in any forward-looking statements and the views expressed herein are subject to change at any time, due to numerous market and other factors. The Funds disclaim any obligation to update publicly or revise any forward-looking statements or views expressed herein.
These Funds feature management by Symphony Asset Management LLC (Symphony), an affiliate of Nuveen Investments. Gunther Stein, Director of Investment Strategies at Symphony, Ross Sakamoto, CFA and Co-Director of Equity and Joel Drescher, Co-Director of Equity serve as the portfolio managers for all the Funds. We recently spoke with the portfolio managers about their key investment strategies and Fund performance for the six-month period ended March 31, 2013.
Effective May 31, 2013 (subsequent to the close of this reporting period), the Nuveen Symphony Optimized Alpha Fund will be renamed the Nuveen Symphony Low Volatility Equity Fund. The Fund’s investment policy will be revised to comply with the “names rule” of the Investment Policy Act of 1940, which is applicable because the word “equity” will be part of the Fund’s name. The following language will be added to the Fund’s current investment policy: “Under normal market conditions, the Fund invests at least 80% of its net assets (plus the amount of any borrowings for investment purposes) in equity securities of companies with varying market capitalizations.” There will be no changes in the Fund’s portfolio management team or any other investment policies.
How did the Funds perform during the six-month reporting period ended March 31, 2013?
The tables in the Fund Performance and Expense Ratios section of this report provide Class A Share total returns for the Fund’s for the six-month, one-year, five-year and since inception periods ended March 31, 2013. The Fund’s Class A Share total returns at net asset value (NAV) are compared with the performance of its corresponding market index and Lipper average. A more detailed account of each Fund’s performance is provided later in this report.
What was the primary investment strategy for each Fund, and how did this strategy affect the Fund’s performance for the six-month period ended March 31, 2013?
Nuveen Symphony Large-Cap Growth Fund
The Fund’s Class A Shares at NAV underperformed both the Russell 1000® Growth Index and the Lipper Multi-Cap Growth Funds Classification Average during the reporting period.
The Fund seeks to offer long-term capital appreciation potential by investing in a portfolio of large-capitalization growth stocks selected using a bottom-up stock selection process that evaluates individual companies through multiple quantitative and qualitative techniques. The Fund invests at least 80% of its net assets (plus the amount of any
borrowings for investment purposes) in equity securities of companies with market capitalizations at the time of investment comparable to companies in the Russell 1000® Growth Index.
Our investment process consists of a combination of quantitative screens and qualitative methods, which seek to create portfolios that deliver consistent returns. The Fund uses three independent quantitative models to rank companies within the Russell 1000® Growth Index according to our assessment of their ability to generate excess share price appreciation. We then optimize a portfolio of these companies based upon pre-determined risk parameters relative to the Russell 1000® Growth Index. A team of fundamental analysts analyzes company specific and macro issues that quantitative systems are not designed to detect and the portfolio manager adjusts the holdings based on the input from the analysts and reoptimizes the portfolio. This blended process seeks to deliver active returns above the Russell 1000® Growth Index.
During the reporting period those sectors that contributed to the Fund’s underperformance versus both its benchmark and Lipper Classification Average included information technology, consumer discretionary and consumer staples sectors. Specific holdings that detracted included VMware Inc. While the company announced fourth quarter 2012 results slightly ahead of expectations, they announced a product realignment and provided weaker than expected 2013 outlook, which hurt the company’s stock performance. Additionally, our holdings in EMC Corporation hurt the Fund’s performance. During the reporting period, the company reported third quarter 2012 results that were modestly below expectations. Subsequently, management lowered the company’s annual outlook.
During the reporting period, the Fund’s materials sector contributed most to performance, followed by health care and industrials. One health care company that contributed to performance was HCA Holdings, Inc. Investors’ interest in the company increased after the firm issued a special cash dividend in December 2012. The company has gained investor attention as it could potentially benefit from “Obama Care,” which we believe may drive patient volumes higher.
The Fund also benefited from holdings in Chicago Bridge & Iron Company. The engineering, procurement and construction (EPC) company, specializes in projects for oil and gas companies. Shares increased as a result of the company issuing initial 2013 guidance reflecting a strong pipeline of new projects and an expected increase in construction activity.
Lastly, Westlake Chemical Corporation also contributed to performance. The stock experienced a strong rally after the company reported strong fourth quarter 2012 results led by a decline in input costs. The company’s primary input cost is ethane, which has declined in price due to over production. Ethane is produced along with other natural gas liquids that continue to have stronger prices. As long as prices hold for the other commodities, producers will continue to drill and inadvertently flood the market with ethane.
Nuveen Symphony Mid-Cap Core Fund
The Fund’s Class A Shares at NAV underperformed both the Russell Midcap® Index and the Lipper Mid-Cap Core Funds Classification Average during the reporting period.
The Fund seeks to offer long-term capital appreciation potential by investing in a portfolio of diversified, mid-cap stocks with sustainable earnings growth over the long term. The Fund invests at least 80% of its net assets (plus the amount of any borrowings for investment purposes) in equity securities of companies with market capitalizations at the time of investment comparable to companies in the Russell Midcap® Index.
Our investment process consists of a combination of quantitative screens and qualitative methods, which seek to create portfolios that deliver consistent returns. The Fund uses three independent quantitative models to rank companies within the Russell Midcap® Index according to our assessment of their ability to generate excess share price appreciation. We then optimize a portfolio of these companies based upon predetermined risk parameters relative to the Russell Midcap® Index. A team of fundamental analysts analyzes company specific and macro issues that quantitative systems are not designed to detect and the portfolio manager adjusts the holdings based on the input from the analysts and reoptimizes the portfolio. This blended process seeks to deliver active returns above that of the Russell Midcap® Index using a bottom-up stock selection process that evaluates individual companies through multiple quantitative and qualitative techniques.
Those sectors that contributed to the Fund’s underperformance versus its benchmark and Lipper Classification Average included consumer discretionary, information technology and consumer staples sectors. Specific holding that detracted from performance included our holdings in Lender Processing Services Inc. Shares declined after the company issued fourth quarter 2012 revenue guidance below analyst’s expectations. Deckers Outdoor Corporation also negatively impacted performance. In October, the company reported top line deceleration with underlying sales below Street consensus and prior guidance.
Financials, health care and consumer discretionary holdings overall contributed positively to performance versus the benchmark. In particular, shares of Signet Jewelers Limited, a specialty retail jeweler, positively impacted performance. Shares increased after the company raised guidance in January 2013 after a stronger than expected holiday season.
Valero Energy Corporation positively contributed to performance. Shares of the largest refiner in North America rallied in late January 2013, as the company posted fourth quarter 2012 earnings above consensus estimates. The results were driven by higher total network throughputs and better than expected ethanol performance.
Westlake Chemical Corporation, another positive contributor to performance, experienced a strong rally after the company reported strong fourth quarter 2012 results led by a decline in input costs. The company’s primary input cost is ethane, which has declined in price due to overproduction. Ethane is produced along with other natural gas liquids that continue to have stronger prices. As long as prices hold for the other commodities, producers will continue to drill and inadvertently flood the market with ethane.
Nuveen Symphony International Equity Fund
The Fund’s Class A Shares at NAV underperformed both the MSCI EAFE Index and the Lipper International Multi-Cap Growth Funds Classification Average during the reporting period.
The Fund seeks to offer long-term capital appreciation potential. The Fund seeks to provide portfolio diversification potential and exposure to the performance of international companies through a portfolio of both growth and value non-U.S. equity securities. The Fund invests at least 80% of its net assets in non-U.S. equity securities. The Fund primarily invests in developed countries, but it may invest up to 15% of its net assets in equity securities of companies located in emerging market countries.
Our investment process consists of a combination of quantitative screens and qualitative methods, which seek to create portfolios that deliver consistent returns. The Fund uses three independent quantitative models to score companies within the Fund’s investable universe according to our assessment of their ability to generate excess share price appreciation. We then optimize a portfolio of these companies based upon predetermined risk parameters relative to the MSCI EAFE Index. Fundamental analysts analyze company specific and macro issues that quantitative systems may not detect and the portfolio manager adjusts the holdings based on the input from the analysts and reoptimizes the portfolio. This blended process seeks to deliver active returns above that of the MSCI EAFE Index using a bottom-up stock selection process that evaluates individual companies through multiple quantitative and qualitative techniques.
During the reporting period, the United Kingdom, Germany and the U.S. contributed positively to performance from a country perspective versus the benchmark. Utilities, materials and telecommunication services contributed to performance from a sector perspective versus the benchmark. The top contributor to relative performance was Brookfield Residential Properties Inc. Shares of the land developer increased when the company announced the acquisition of Playa Capital Company LLC and the formation of a strategic partnership with a U.S. pension fund to develop land in Alberta, Canada.
Hannover Rueckversicherung AG also contributed positively to the Fund’s performance. The fourth largest reinsurer globally has seen prices steadily rise over the past nine months as the company continues to post top line property and casualty (P&C) growth.
The Fund’s performance was also helped by Nitto Denko Corporation. During the reporting period, Japanese stocks in general rallied sharply. The company has been seeing positive growth in its information technology materials segment that makes materials used in smart phones.
Several factors contributed to the Fund’s underperformance. Japan, Australia and Sweden were the top detractors from a country perspective versus the benchmark. The financial, industrials and information technology sectors detracted from performance from a sector perspective versus the benchmark. Specifically, Aggreko PLC detracted from performance. The company is the world’s largest temporary power generation company. Shares traded down due to cyclical softness and a downbeat economic outlook. Fresenius Medical Care AG & Co. KGaA also detracted from performance. The German company specializes in dialysis products and services. The company reported softer than expected earnings as investors grew concerned over the future outlook for government reimbursements for its products and services. Lastly, shares of Umicore S.A. hurt performance. Umicore is a global materials technology group. The company issued guidance lower than analysts were expecting. Mainly, a weaker European market hurt the company’s shares.
Nuveen Symphony Low Volatility Equity Fund (formerly Nuveen Symphony Optimized Alpha Fund)
The Fund’s Class A Shares at NAV underperformed both the S&P 500® Index and the Lipper Large-Cap Core Funds Classification Average during the reporting period.
The Fund seeks long-term capital appreciation with lower absolute volatility than the broad equity market by combining stocks in a portfolio that is beta constrained. The Fund invests at least 80% of its net assets in equity securities of companies with varying market capitalizations. The Fund seeks to produce long-term returns superior to the market with reduced absolute risk. By selecting stocks with low correlation and utilizing risk controls, we believe we may potentially reduce absolute risk while preserving the Fund’s potential to generate returns in excess of the market over the long term.
The Fund is constructed from our best U.S. equity ideas in a way that seeks to provide the highest projected return per unit of absolute risk, as opposed to risk relative to a benchmark. This objective is pursued by selecting attractive, low correlated securities that when combined seek to reduce risk in the portfolio. The construction process seeks to reduce absolute risk by combining stocks with certain characteristics such as low correlation while utilizing risk controls such as industry weight.
Those sectors that detracted from performance, included the information technology, consumer discretionary and financials sectors. During the reporting period, the share prices of large-cap banks in general rose sharply. The Fund was underweighted in large-cap banks versus the benchmark index which contributed to underperformance. Lastly, Apple Inc. detracted from performance during the reporting period. After reaching all-time highs in September 2012, shares of the tech giant detracted from performance. The company faces concerns over eroding market share and fears the company may be losing its flair for innovation.
Overall, energy, health care and materials holdings contributed positively to performance versus the benchmark. One of our top performing stocks included Marathon Petroleum Corp., a petroleum refiner, transporter and marketer. The market reacted favorably after the company announced fourth quarter 2012 earnings based on strong refining performance and the announcement of incremental share repurchases.
Phillips 66 also contributed positively to performance. Shares of the natural liquid gas and petrochemicals producer rallied after the company raised its regular dividend and announced an additional share repurchase program.
Performance was also helped by Omega Healthcare Investors Inc, a health care real estate investment trust (REIT). Shares steadily gained from December 2012 through the end of first quarter in 2013 mainly as investors have been looking for divided yield. As of the end of March 2013 the company’s dividend yield was still attractive.
Risk Considerations
Mutual fund investing involves risk; principal loss is possible. Equity investments are subject to market risk. Foreign investments involve additional risks, including currency fluctuation, political and economic instability, lack of liquidity and differing legal and accounting standards. These risks are magnified in emerging markets. Investments in small- and mid-cap companies are subject to greater volatility.
Fund Performance and Expense Ratios
The Fund Performance and Expense Ratios for each Fund are shown on the following four pages.
Returns quoted represent past performance, which is no guarantee of future results. Current performance may be higher or lower than the performance shown. Investment returns and principal value will fluctuate so that when shares are redeemed, they may be worth more or less than their original cost. Returns without sales charges would be lower if the sales charge were included. Returns do not reflect the deduction of taxes that a shareholder would pay on Fund distributions or the redemption of Fund shares.
Returns may reflect a contractual agreement between certain Funds and the investment adviser to waive certain fees and expenses; see Notes to Financial Statements, Footnote 7 — Management Fees and Other Transactions with Affiliates for more information. In addition, returns may reflect a voluntary expense limitation by the Funds’ investment adviser that may be modified or discontinued at any time without notice. For the most recent month-end performance visit www.nuveen.com or call (800) 257-8787.
Returns reflect differences in sales charges and expenses, which are primarily differences in distribution and service fees. Fund returns assume reinvestment of dividends and capital gains.
Comparative index and Lipper return information is provided for the Funds’ Class A Shares at net asset value (NAV) only.
The expense ratios shown reflect the Funds’ total operating expenses (before fee waivers and/or expense reimbursements, if any) as shown in the Funds’ most recent prospectus. The expense ratios include management fees and other fees and expenses.
Fund Performance and Expense Ratios (continued)
Nuveen Symphony Large-Cap Growth Fund
Refer to the first page of this Fund Performance and Expense Ratios section for further explanation of the information included within this page.
Fund Performance
Average Annual Total Returns as of March 31, 2013
| | | | | | | | | | | | | | | | |
| | |
| | | Cumulative | | | Average Annual | |
| | | | |
| | | 6-Month | | | 1-Year | | | 5-Year | | | Since
Inception* | |
Class A Shares at NAV | | | 4.62% | | | | 4.87% | | | | 8.37% | | | | 6.53% | |
Class A Shares at maximum Offering Price | | | -1.41% | | | | 1.15% | | | | 7.10% | | | | 5.53% | |
Russell 1000® Growth Index** | | | 8.10% | | | | 10.09% | | | | 7.30% | | | | 5.66% | |
Lipper Multi-Cap Growth Funds Classification Average** | | | 9.02% | | | | 8.58% | | | | 5.57% | | | | 4.41% | |
| | | | |
Class C Shares | | | 4.22% | | | | 4.04% | | | | 7.57% | | | | 5.74% | |
Class R3 Shares | | | 4.48% | | | | 4.56% | | | | 8.09% | | | | 6.25% | |
Class I Shares | | | 4.76% | | | | 5.13% | | | | 8.63% | | | | 6.79% | |
Class A Shares have a maximum 5.75% sales charge (Offering Price). Class A Share purchases of $1 million or more are sold at net asset value without an up-front sales charge but may be subject to a contingent deferred sales charge (CDSC), also known as a back-end sales charge, if redeemed within twelve months of purchase. Class C Shares have a 1% CDSC for redemptions within less than twelve months, which is not reflected in the one-year total return. Class R3 Shares have no sales charge and are available to only certain retirement plans. Class I Shares have no sales charge and may be purchased under limited circumstances or by specified classes of investors.
Expense Ratios as of Most Recent Prospectus
| | | | | | | | |
| | |
| | | Gross
Expense
Ratios | | | Net
Expense
Ratios | |
Class A Shares | | | 1.78% | | | | 1.22% | |
Class C Shares | | | 2.56% | | | | 1.97% | |
Class R3 Shares | | | 1.98% | | | | 1.47% | |
Class I Shares | | | 1.60% | | | | 0.97% | |
The Fund’s investment adviser has agreed to waive fees and/or reimburse expenses through January 31, 2014 so that total annual Fund operating expenses (excluding 12b-1 distribution and/or service fees, interest expenses, taxes, acquired fund fees and expenses, fees incurred in acquiring and disposing of portfolio securities and extraordinary expenses) do not exceed 1.00% (1.35% after January 31, 2014) of the average daily net assets of any class of Fund shares. The expense limitation expiring January 31, 2014, may be terminated or modified prior to that date only with the approval of the Board of Trustees of the Fund. The expense limitation in effect thereafter may be terminated or modified only with the approval of shareholders of the Fund.
| * | Since inception returns for Class A, C and I Shares, and for the comparative index and Lipper classification average, are from 12/15/06. Class A, C, and I Share returns are actual. Class R3 Shares commenced operations on 9/29/09. The returns for Class R3 Shares are actual for the periods since class inception on 9/29/09; returns prior to class inception are Class I Share returns adjusted for the differences in sales charges and expenses, which are primarily differences in distribution and service fees. |
| ** | Refer to the Glossary of Terms Used in this Report for definitions. Indexes and Lipper averages are not available for direct investment. |
Nuveen Symphony Mid-Cap Core Fund
Refer to the first page of this Fund Performance and Expense Ratios section for further explanation of the information included within this page.
Fund Performance
Average Annual Total Returns as of March 31, 2013
| | | | | | | | | | | | | | | | |
| | |
| | | Cumulative | | | Average Annual | |
| | | | |
| | | 6-Month | | | 1-Year | | | 5-Year | | | Since
Inception* | |
Class A Shares at NAV | | | 12.42% | | | | 10.31% | | | | 7.43% | | | | 6.19% | |
Class A Shares at maximum Offering Price | | | 5.95% | | | | 3.96% | | | | 6.17% | | | | 5.27% | |
Russell Midcap® Index** | | | 16.21% | | | | 17.30% | | | | 8.37% | | | | 6.77% | |
Lipper Mid-Cap Core Funds Classification Average** | | | 15.75% | | | | 14.92% | | | | 6.95% | | | | 5.75% | |
| | | | |
Class C Shares | | | 11.97% | | | | 9.45% | | | | 6.63% | | | | 5.39% | |
Class R3 Shares | | | 12.23% | | | | 9.99% | | | | 7.16% | | | | 5.91% | |
Class I Shares | | | 12.55% | | | | 10.55% | | | | 7.70% | | | | 6.46% | |
Class A Shares have a maximum 5.75% sales charge (Offering Price). Class A Share purchases of $1 million or more are sold at net asset value without an up-front sales charge but may be subject to a contingent deferred sales charge (CDSC), also known as a back-end sales charge, if redeemed within twelve months of purchase. Class C Shares have a 1% CDSC for redemptions within less than twelve months, which is not reflected in the one-year total return. Class R3 Shares have no sales charge and are available to only certain retirement plans. Class I Shares have no sales charge and may be purchased under limited circumstances or by specified classes of investors.
Expense Ratios as of Most Recent Prospectus
| | | | | | | | |
| | |
| | | Gross
Expense
Ratios | | | Net
Expense
Ratios | |
Class A Shares | | | 4.04% | | | | 1.37% | |
Class C Shares | | | 4.90% | | | | 2.12% | |
Class R3 Shares | | | 4.31% | | | | 1.62% | |
Class I Shares | | | 3.35% | | | | 1.12% | |
The Fund’s investment adviser has agreed to waive fees and/or reimburse expenses through January 31, 2014 so that total annual Fund operating expenses (excluding 12b-1 distribution and/or service fees, interest expenses, taxes, acquired fund fees and expenses, fees incurred in acquiring and disposing of portfolio securities and extraordinary expenses) do not exceed 1.15% (1.40% after January 31, 2014) of the average daily net assets of any class of Fund shares. The expense limitation expiring January 31, 2014, may be terminated or modified prior to that date only with the approval of the Board of Trustees of the Fund. The expense limitation in effect thereafter may be terminated or modified only with the approval of shareholders of the Fund.
| * | Since inception returns for Class A, C and I Shares, and for the comparative index and Lipper category average, are from 5/31/06. Class A, C, and I Share returns are actual. Class R3 Shares commenced operations on 5/05/09. The returns for Class R3 Shares are actual for the periods since class inception on 5/05/09; returns prior to class inception are Class I Share returns adjusted for the differences in sales charges and expenses, which are primarily differences in distribution and service fees. |
| ** | Refer to the Glossary of Terms Used in this Report for definitions. Indexes and Lipper averages are not available for direct investment. |
Fund Performance and Expense Ratios (continued)
Nuveen Symphony International Equity Fund
Refer to the first page of this Fund Performance and Expense Ratios section for further explanation of the information included within this page.
Fund Performance
Average Annual Total Returns as of March 30, 2013
| | | | | | | | | | | | |
| | |
| | | Cumulative | | | Average Annual | |
| | | |
| | | 6-Month | | | 1-Year | | | Since
Inception* | |
Class A Shares at NAV | | | 8.94% | | | | 6.38% | | | | -3.12% | |
Class A Shares at maximum Offering Price | | | 2.69% | | | | 0.23% | | | | -4.30% | |
MSCI EAFE Index** | | | 12.04% | | | | 11.25% | | | | -2.19% | |
Lipper International Multi-Cap Growth Funds Classification Average** | | | 9.61% | | | | 8.78% | | | | -1.71% | |
| | | |
Class C Shares | | | 8.56% | | | | 5.57% | | | | -3.84% | |
Class R3 Shares | | | 8.80% | | | | 6.11% | | | | -3.35% | |
Class I Shares | | | 9.12% | | | | 6.70% | | | | -2.87% | |
Class A Shares have a maximum 5.75% sales charge (Offering Price). Class A Share purchases of $1 million or more are sold at net asset value without an up-front sales charge but may be subject to a contingent deferred sales charge (CDSC), also known as a back-end sales charge, if redeemed within twelve months of purchase. Class C Shares have a 1% CDSC for redemptions within less than twelve months, which is not reflected in the one-year total return. Class R3 Shares have no sales charge and are available to only certain retirement plans. Class I Shares have no sales charge and may be purchased under limited circumstances or by specified classes of investors.
Expense Ratios as of Most Recent Prospectus
| | | | | | | | |
| | |
| | | Gross
Expense
Ratios | | | Net
Expense
Ratios | |
Class A Shares | | | 9.36% | | | | 1.36% | |
Class C Shares | | | 9.65% | | | | 2.11% | |
Class R3 Shares | | | 8.14% | | | | 1.61% | |
Class I Shares | | | 6.32% | | | | 1.11% | |
The Fund’s investment adviser has agreed to waive fees and/or reimburse expenses through January 31, 2014 so that total annual Fund operating expenses (excluding 12b-1 distribution and/or service fees, interest expenses, taxes, acquired fund fees and expenses, fees incurred in acquiring and disposing of portfolio securities and extraordinary expenses) do not exceed 1.13% (1.38% after January 31, 2014) of the average daily net assets of any class of Fund shares. The expense limitation expiring January 31, 2014, may be terminated or modified prior to that date only with the approval of the Board of Trustees of the Fund. The expense limitation in effect thereafter may be terminated or modified only with the approval of shareholders of the Fund.
| * | Since inception returns for Class A, C and I Shares, and for the comparative index and Lipper category average, are from 5/30/08. Class A, C, and I Share returns are actual. Class R3 Shares commenced operations on 10/05/10. The returns for Class R3 Shares are actual for the periods since class inception on 10/05/10; returns prior to class inception are Class I Share returns adjusted for the differences in sales charges and expenses, which are primarily differences in distribution and service fees. |
| ** | Refer to the Glossary of Terms Used in this Report for definitions. Indexes and Lipper averages are not available for direct investment. |
Nuveen Symphony Low Volatility Equity Fund
Refer to the first page of this Fund Performance and Expense Ratios section for further explanation of the information included within this page.
Fund Performance
Average Annual Total Returns as of March 31, 2013
| | | | | | | | | | | | | | | | |
| | |
| | | Cumulative | | | Average Annual | |
| | | | |
| | | 6-Month | | | 1-Year | | | 5-Year | | | Since
Inception* | |
Class A Shares at NAV | | | 9.15% | | | | 12.41% | | | | 6.34% | | | | 4.12% | |
Class A Shares at maximum Offering Price | | | 2.87% | | | | 5.94% | | | | 5.09% | | | | 3.01% | |
S&P 500® Index** | | | 10.19% | | | | 13.96% | | | | 5.81% | | | | 2.75% | |
Lipper Large-Cap Core Funds Classification Average** | | | 10.58% | | | | 12.93% | | | | 4.77% | | | | 1.97% | |
| | | | |
Class C Shares | | | 8.73% | | | | 11.52% | | | | 5.54% | | | | 3.34% | |
Class I Shares | | | 9.27% | | | | 12.68% | | | | 6.60% | | | | 4.37% | |
Class A Shares have a maximum 5.75% sales charge (Offering Price). Class A Share purchases of $1 million or more are sold at net asset value without an up-front sales charge but may be subject to a contingent deferred sales charge (CDSC), also known as a back-end sales charge, if redeemed within twelve months of purchase. Class C Shares have a 1% CDSC for redemptions within less than twelve months, which is not reflected in the one-year total return. Class I Shares have no sales charge and may be purchased under limited circumstances or by specified classes of investors.
Expense Ratios as of Most Recent Prospectus
| | | | | | | | |
| | |
| | | Gross
Expense
Ratios | | | Net
Expense
Ratios | |
Class A Shares | | | 3.99% | | | | 1.23% | |
Class C Shares | | | 5.53% | | | | 1.98% | |
Class I Shares | | | 3.26% | | | | 0.98% | |
The Fund’s investment adviser has agreed to waive fees and/or reimburse expenses through January 31, 2014 so that total annual Fund operating expenses (excluding 12b-1 distribution and/or service fees, interest expenses, taxes, acquired fund fees and expenses, fees incurred in acquiring and disposing of portfolio securities and extraordinary expenses) do not exceed 1.00% (1.45% after January 31, 2014) of the average daily net assets of any class of Fund shares. The expense limitation expiring January 31, 2014, may be terminated or modified prior to that date only with the approval of the Board of Trustees of the Fund. The expense limitation in effect thereafter may be terminated or modified only with the approval of shareholders of the Fund.
| * | Since inception returns are from 9/28/07. |
| ** | Refer to the Glossary of Terms Used in this Report for definitions. Indexes and Lipper averages are not available for direct investment. |
Holding Summaries as of March 31, 2013
This data relates to the securities held in each Fund’s portfolio of investments. It should not be construed as a measure of performance for the Fund itself.
Nuveen Symphony Large-Cap Growth Fund
Portfolio Allocation1
| | | | |
| Common Stocks | | | 98.5% | |
Short-Term Investments | | | 3.0% | |
Other2 | | | (1.5)% | |
Nuveen Symphony Mid-Cap Core Fund
Portfolio Allocation1
| | | | |
| Common Stocks | | | 97.8% | |
Other | | | 2.2% | |
| | | | |
| Portfolio Composition1 | | | |
| Software | | | 9.0% | |
| Computers & Peripherals | | | 7.1% | |
| Machinery | | | 5.4% | |
| Internet Software & Services | | | 4.9% | |
| Specialy Retail | | | 4.9% | |
| Chemicals | | | 4.3% | |
| IT Services | | | 4.2% | |
| Health Care Providers & Services | | | 4.1% | |
| Health Care Equipment & Supplies | | | 3.5% | |
| Food Products | | | 3.5% | |
| Aerospace & Defense | | | 3.3% | |
| Semiconductors & Equipment | | | 3.2% | |
| Pharmaceuticals | | | 2.9% | |
| Biotechnology | | | 2.7% | |
| Household Products | | | 2.6% | |
| Oil, Gas & Consumable Fuels | | | 2.5% | |
| Hotels, Restaurants & Leisure | | | 2.1% | |
| Tobacco | | | 2.0% | |
| Beverages | | | 2.0% | |
| Automobiles | | | 1.9% | |
| Retail REIT | | | 1.9% | |
| Specialized REIT | | | 1.9% | |
| Short-Term Investments | | | 3.0% | |
| Other3 | | | 17.1% | |
| | | | |
| Portfolio Composition1 | | | |
| Insurance | | | 7.8% | |
| Machinery | | | 7.7% | |
| Specialy Retail | | | 6.3% | |
| Capital Markets | | | 6.0% | |
| Software | | | 5.0% | |
| Oil, Gas & Consumable Fuels | | | 5.0% | |
| Retail REIT | | | 4.9% | |
| Household Durables | | | 4.8% | |
| Food Products | | | 4.7% | |
| Chemicals | | | 4.4% | |
| Health Care Equipment & Supplies | | | 4.0% | |
| Health Care Providers & Services | | | 3.3% | |
| Auto Components | | | 3.1% | |
| IT Services | | | 2.9% | |
| Building Products | | | 2.5% | |
| Commercial Banks | | | 2.4% | |
| Automobiles | | | 2.3% | |
| Construction & Engineering | | | 2.2% | |
| Semiconductors & Equipment | | | 1.9% | |
| Multi-Utilities | | | 1.8% | |
| Other4 | | | 17.0% | |
| | | | |
Top Five Common Stock
Holdings1 | |
| Apple Inc. | | | 5.4% | |
| Google Inc.,. Class A | | | 3.3% | |
| Microsoft Corporation | | | 3.1% | |
| Amgen Inc. | | | 2.0% | |
| Philip Morris International | | | 2.0% | |
| | | | |
| Top Five Common Stock Holdings1 | |
| Ameriprise Financial, Inc. | | | 1.6% | |
| Tanger Factory Outlet Centers | | | 1.5% | |
| Lennar Corporation, Class A | | | 1.5% | |
| Invesco LTD | | | 1.5% | |
| Signet Jewelers Limited | | | 1.4% | |
| 1 | As a percentage of net assets. Holdings are subject to change. |
| 2 | Other assets less liabilities. |
| 3 | Includes other assets less liabilities and all industries less than 1.9% of total net assets. |
| 4 | Includes other assets less liabilities and all industries less than 1.8% of total net assets. |
This data relates to the securities held in each Fund’s portfolio of investments. It should not be construed as a measure of performance for the Fund itself.
Nuveen Symphony International Equity Fund
| | | | |
| Portfolio Allocation1 | | | |
| Common Stocks | | | 89.1% | |
Investment Companies | | | 2.3% | |
Short-Term Investments | | | 3.5% | |
Other2 | | | 5.1% | |
Nuveen Symphony Low Volatility Equity Fund
Portfolio Allocation1
| | | | |
| Common Stocks | | | 96.3% | |
Short-Term Investments | | | 3.5% | |
Other | | | 0.2% | |
| | | | |
| Portfolio Composition1 | | | |
| Commercial Banks | | | 11.1% | |
Pharmaceuticals | | | 9.0% | |
Insurance | | | 6.3% | |
Oil, Gas & Consumable Fuels | | | 6.1% | |
| Chemicals | | | 4.7% | |
| Food Products | | | 4.2% | |
| Metals & Mining | | | 3.6% | |
| Textiles, Apparel & Luxury Goods | | | 3.2% | |
| Automobiles | | | 3.1% | |
| Electrical Equipment | | | 3.1% | |
| Wireless Telecommunication Services | | | 2.8% | |
| Real Estate Management & Development | | | 2.6% | |
| Semiconductors & Equipment | | | 2.5% | |
| Food & Staples Retailing | | | 2.3% | |
| Trading Companies & Distributors | | | 2.3% | |
| Investment Companies | | | 2.3% | |
| Machinery | | | 2.1% | |
| Beverages | | | 1.8% | |
| Multiline Retail | | | 1.7% | |
| Tobacco | | | 1.4% | |
| Short-Term Investments | | | 3.5% | |
| Other3 | | | 20.3% | |
| | | | |
| Portfolio Composition1 | | | |
| Oil, Gas & Consumable Fuels | | | 8.4% | |
| Pharmaceuticals | | | 7.4% | |
| Commercial Banks | | | 5.1% | |
| Multi-Utilities | | | 5.1% | |
| Software | | | 5.0% | |
| Food Products | | | 4.9% | |
| Insurance | | | 4.0% | |
| Computers & Peripherals | | | 3.8% | |
| Biotechnology | | | 3.7% | |
| Health Care Equipment & Supplies | | | 3.0% | |
| Real Estate Investment Trust | | | 2.9% | |
| Specialty Retail | | | 2.4% | |
| Aerospace & Defense | | | 2.2% | |
| Diversified Telecommunication Services | | | 2.2% | |
| Industrial Conglomerates | | | 2.1% | |
| Internet Software & Services | | | 2.1% | |
| Communications Equipment | | | 2.0% | |
| Multiline Retail | | | 2.0% | |
| Semiconductors & Equipment | | | 1.9% | |
| Chemicals | | | 1.8% | |
| Media | | | 1.7% | |
| Road & Rail | | | 1.7% | |
| Diversified Financial Services | | | 1.5% | |
| Short-Term Investments | | | 3.5% | |
| Other4 | | | 19.6% | |
| | | | |
Top Five Common Stock
Holdings1 | |
| DnB NOR ASA | | | 2.3% | |
| Toyota Motor Corporation | | | 2.2% | |
| Hannover Rueckversicherung AG | | | 2.0% | |
| Nitto Denko Corporation | | | 1.9% | |
| Coca Cola Amatil Limited | | | 1.8% | |
| | | | |
| Country Allocation1 | | | |
| United Kingdom | | | 22.0% | |
| Japan | | | 13.1% | |
| France | | | 8.1% | |
| United States | | | 7.1% | |
| Germany | | | 6.0% | |
| Australia | | | 5.3% | |
| Netherlands | | | 5.0% | |
| Switzerland | | | 4.9% | |
| Norway | | | 3.4% | |
| Hong Kong | | | 2.9% | |
| Spain | | | 2.6% | |
| Other5 | | | 19.6% | |
| | | | |
Top Five Common Stock
Holdings1 | |
| Johnson & Johnson | | | 3.4% | |
| Apple, Inc. | | | 2.8% | |
| Microsoft Corporation | | | 2.6% | |
| Exxon Mobil Corporation | | | 2.5% | |
| Chevron Corporation | | | 2.3% | |
| 1 | As a percentage of net assets. Holdings are subject to change. |
| 2 | Others assets less liabilities. |
| 3 | Includes other assets less liabilities and all industries less than 1.4% of total net assets. |
| 4 | Includes other assets less liabilities and all industries less than 1.5% of total net assets. |
| 5 | Includes other assets less liabilities and all countries less than 2.6% of total net assets. |
Expense Examples
As a shareholder of one or more of the Funds, you incur two types of costs: (1) transaction costs, including up-front and back-end sales charges (loads) or redemption fees, where applicable; and (2) ongoing costs, including management fees; distribution and service (12b-1) fees, where applicable; and other Fund expenses. The Examples below are intended to help you understand your ongoing costs (in dollars) of investing in the Funds and to compare these costs with the ongoing costs of investing in other mutual funds.
The Examples below are based on an investment of $1,000 invested at the beginning of the period and held through the end of the period.
The information under “Actual Performance,” together with the amount you invested, allows you to estimate actual expenses incurred over the reporting period. Simply divide your account value by $1,000 (for example, an $8,600 account value divided by $1,000 = 8.60) and multiply the result by the cost shown for your share class, in the row entitled “Expenses Incurred During Period” to estimate the expenses incurred on your account during this period.
The information under “Hypothetical Performance,” provides information about hypothetical account values and hypothetical expenses based on the respective Fund’s actual expense ratio and an assumed rate of return of 5% per year before expenses, which is not the Fund’s actual return. The hypothetical account values and expenses may not be used to estimate the actual ending account balance or expense you incurred for the period. You may use this information to compare the ongoing costs of investing in the Fund and other Funds. To do so, compare this 5% hypothetical example with the 5% hypothetical examples that appear in the shareholder reports of the other funds.
Please note that the expenses shown in the table are meant to highlight your ongoing costs only and do not reflect any transaction costs. Therefore, the hypothetical information is useful in comparing ongoing costs only, and will not help you determine the relative total costs of owning different funds or share classes. In addition, if these transaction costs were included, your costs would have been higher.
Nuveen Symphony Large-Cap Growth Fund
| | | | | | | | | | | | | | | | | | | | | | | | | | | | | | | | | | |
| | | | | | | | | | | | | | | | | Hypothetical Performance | |
| | | Actual Performance | | | | | (5% annualized return before expenses) | |
| | | A Shares | | | C Shares | | | R3 Shares | | | I Shares | | | | | A Shares | | | C Shares | | | R3 Shares | | | I Shares | |
| Beginning Account Value (10/01/12) | | $ | 1,000.00 | | | $ | 1,000.00 | | | $ | 1,000.00 | | | $ | 1,000.00 | | | | | $ | 1,000.00 | | | $ | 1,000.00 | | | $ | 1,000.00 | | | $ | 1,000.00 | |
| Ending Account Value (3/31/13) | | $ | 1,046.20 | | | $ | 1,042.20 | | | $ | 1,044.80 | | | $ | 1,047.60 | | | | | $ | 1,018.85 | | | $ | 1,015.11 | | | $ | 1,017.60 | | | $ | 1,020.09 | |
| Expenses Incurred During Period | | $ | 6.22 | | | $ | 10.03 | | | $ | 7.49 | | | $ | 4.95 | | | | | $ | 6.14 | | | $ | 9.90 | | | $ | 7.39 | | | $ | 4.89 | |
For each class of the Fund, expenses are equal to the Fund’s annualized net expense ratio of 1.22%, 1.97%, 1.47% and .97% for Classes A, C, R3 and I, respectively, multiplied by the average account value over the period, multiplied by 182/365 (to reflect the one-half year period).
Nuveen Symphony Mid-Cap Core Fund
| | | | | | | | | | | | | | | | | | | | | | | | | | | | | | | | | | |
| | | | | | | | | | | | | | | | | Hypothetical Performance | |
| | | Actual Performance | | | | | (5% annualized return before expenses) | |
| | | A Shares | | | C Shares | | | R3 Shares | | | I Shares | | | | | A Shares | | | C Shares | | | R3 Shares | | | I Shares | |
| Beginning Account Value (10/01/12) | | $ | 1,000.00 | | | $ | 1,000.00 | | | $ | 1,000.00 | | | $ | 1,000.00 | | | | | $ | 1,000.00 | | | $ | 1,000.00 | | | $ | 1,000.00 | | | $ | 1,000.00 | |
| Ending Account Value (3/31/13) | | $ | 1,124.20 | | | $ | 1,119.70 | | | $ | 1,122.30 | | | $ | 1,125.50 | | | | | $ | 1,018.10 | | | $ | 1,014.36 | | | $ | 1,016.85 | | | $ | 1,019.35 | |
| Expenses Incurred During Period | | $ | 7.26 | | | $ | 11.20 | | | $ | 8.57 | | | $ | 5.94 | | | | | $ | 6.89 | | | $ | 10.65 | | | $ | 8.15 | | | $ | 5.64 | |
For each class of the Fund, expenses are equal to the Fund’s annualized net expense ratio of 1.37%, 2.12%, 1.62% and 1.12% for Classes A, C, R3 and I, respectively, multiplied by the average account value over the period, multiplied by 182/365 (to reflect the one-half year period).
Nuveen Symphony International Equity Fund
| | | | | | | | | | | | | | | | | | | | | | | | | | | | | | | | | | |
| | | | | | | | | | | | | | | | | Hypothetical Performance | |
| | | Actual Performance | | | | | (5% annualized return before expenses) | |
| | | A Shares | | | C Shares | | | R3 Shares | | | I Shares | | | | | A Shares | | | C Shares | | | R3 Shares | | | I Shares | |
| Beginning Account Value (10/01/12) | | $ | 1,000.00 | | | $ | 1,000.00 | | | $ | 1,000.00 | | | $ | 1,000.00 | | | | | $ | 1,000.00 | | | $ | 1,000.00 | | | $ | 1,000.00 | | | $ | 1,000.00 | |
| Ending Account Value (3/31/13) | | $ | 1,089.40 | | | $ | 1,085.60 | | | $ | 1,088.00 | | | $ | 1,091.20 | | | | | $ | 1,018.20 | | | $ | 1,014.46 | | | $ | 1,016.95 | | | $ | 1,019.45 | |
| Expenses Incurred During Period | | $ | 7.03 | | | $ | 10.92 | | | $ | 8.33 | | | $ | 5.74 | | | | | $ | 6.79 | | | $ | 10.55 | | | $ | 8.05 | | | $ | 5.54 | |
For each class of the Fund, expenses are equal to the Fund’s annualized net expense ratio of 1.35%, 2.10%, 1.60% and 1.10% for Classes A, C, R3 and I, respectively, multiplied by the average account value over the period, multiplied by 182/365 (to reflect the one-half year period).
Nuveen Symphony Low Volatility Equity Fund
| | | | | | | | | | | | | | | | | | | | | | | | | | |
| | | | | | | | | | | | | | Hypothetical Performance | |
| | | Actual Performance | | | | | (5% annualized return before expenses) | |
| | | A Shares | | | C Shares | | | I Shares | | | | | A Shares | | | C Shares | | | I Shares | |
| Beginning Account Value (10/01/12) | | $ | 1,000.00 | | | $ | 1,000.00 | | | $ | 1,000.00 | | | | | $ | 1,000.00 | | | $ | 1,000.00 | | | $ | 1,000.00 | |
| Ending Account Value (3/31/13) | | $ | 1,091.50 | | | $ | 1,087.30 | | | $ | 1,092.70 | | | | | $ | 1,018.85 | | | $ | 1,015.11 | | | $ | 1,020.09 | |
| Expenses Incurred During Period | | $ | 6.36 | | | $ | 10.25 | | | $ | 5.06 | | | | | $ | 6.14 | | | $ | 9.90 | | | $ | 4.89 | |
For each class of the Fund, expenses are equal to the Fund’s annualized net expense ratio of 1.22%, 1.97% and .97% for Classes A, C and I, respectively, multiplied by the average account value over the period, multiplied by 182/365 (to reflect the one-half year period).
Portfolio of Investments (Unaudited)
Nuveen Symphony Large-Cap Growth Fund
March 31, 2013
| | | | | | | | | | | | | | |
| Shares | | | Description (1) | | | | | | | | Value | |
| | | | | | | | | | | | | | |
| | | | COMMON STOCKS – 98.5% | | | | | | | | | | |
| | | | | |
| | | | Aerospace & Defense – 3.3% | | | | | | | | | | |
| | | | | |
| | 15,563 | | | BE Aerospace Inc. | | | | | | | | $ | 938,293 | |
| | | | | |
| | 11,351 | | | Honeywell International Inc. | | | | | | | | | 855,298 | |
| | | | | |
| | 18,041 | | | United Technologies Corporation | | | | | | | | | 1,685,571 | |
| | | | Total Aerospace & Defense | | | | | | | | | 3,479,162 | |
| | | | Air Freight & Logistics – 0.9% | | | | | | | | | | |
| | | | | |
| | 10,147 | | | FedEx Corporation | | | | | | | | | 996,435 | |
| | | | Apparel, Accesories & Luxury Goods – 0.8% | | | | | | | | | | |
| | | | | |
| | 8,359 | | | PVH Corporation | | | | | | | | | 892,825 | |
| | | | Auto Components – 1.0% | | | | | | | | | | |
| | | | | |
| | 24,678 | | | Delphi Automotive PLC | | | | | | | | | 1,095,703 | |
| | | | Automobiles – 1.9% | | | | | | | | | | |
| | | | | |
| | 20,322 | | | Harley-Davidson, Inc. | | | | | | | | | 1,083,163 | |
| | | | | |
| | 26,674 | | | Thor Industries, Inc. | | | | | | | | | 981,336 | |
| | | | Total Automobiles | | | | | | | | | 2,064,499 | |
| | | | Beverages – 2.0% | | | | | | | | | | |
| | | | | |
| | 51,780 | | | Coca-Cola Company | | | | | | | | | 2,093,983 | |
| | | | Biotechnology – 2.7% | | | | | | | | | | |
| | | | | |
| | 20,627 | | | Amgen Inc. | | | | | | | | | 2,114,474 | |
| | | | | |
| | 15,292 | | | Gilead Sciences, Inc. | | | | | | | | | 748,238 | |
| | | | Total Biotechnology | | | | | | | | | 2,862,712 | |
| | | | Capital Markets – 0.9% | | | | | | | | | | |
| | | | | |
| | 6,268 | | | Affiliated Managers Group Inc., (2) | | | | | | | | | 962,577 | |
| | | | Chemicals – 4.3% | | | | | | | | | | |
| | | | | |
| | 13,931 | | | Eastman Chemical Company | | | | | | | | | 973,359 | |
| | | | | |
| | 16,655 | | | LyondellBasell Industries NV | | | | | | | | | 1,054,095 | |
| | | | | |
| | 15,016 | | | Monsanto Company | | | | | | | | | 1,586,140 | |
| | | | | |
| | 11,166 | | | Westlake Chemical Corporation | | | | | | | | | 1,044,021 | |
| | | | Total Chemicals | | | | | | | | | 4,657,615 | |
| | | | Computers & Peripherals – 7.1% | | | | | | | | | | |
| | | | | |
| | 13,087 | | | Apple, Inc. | | | | | | | | | 5,792,699 | |
| | | | | |
| | 77,698 | | | EMC Corporation, (2) | | | | | | | | | 1,856,205 | |
| | | | Total Computers & Peripherals | | | | | | | | | 7,648,904 | |
| | | | Construction & Engineering – 0.9% | | | | | | | | | | |
| | | | | |
| | 15,559 | | | Chicago Bridge & Iron Company N.V. | | | | | | | | | 966,214 | |
| | | | Consumer Finance – 1.0% | | | | | | | | | | |
| | | | | |
| | 23,288 | | | Discover Financial Services | | | | | | | | | 1,044,234 | |
| | | | Diversified Telecommunication Services – 0.9% | | | | | | | | | | |
| | | | | |
| | 20,368 | | | Verizon Communications Inc. | | | | | | | | | 1,001,087 | |
| | | | Energy Equipment & Services – 1.0% | | | | | | | | | | |
| | | | | |
| | 12,529 | | | Oil States International Inc., (2) | | | | | | | | | 1,021,991 | |
| | | | Food & Staples Retailing – 1.8% | | | | | | | | | | |
| | | | | |
| | 12,201 | | | Costco Wholesale Corporation | | | | | | | | | 1,294,648 | |
| | | | | |
| | 7,842 | | | Wal-Mart Stores, Inc. | | | | | | | | | 586,817 | |
| | | | Total Food & Staples Retailing | | | | | | | | | 1,881,465 | |
| | | | | | | | | | | | | | |
| Shares | | | Description (1) | | | | | | | | Value | |
| | | | | | | | | | | | | | |
| | | | Food Products – 3.5% | | | | | | | | | | |
| | | | | |
| | 35,168 | | | General Mills, Inc. | | | | | | | | $ | 1,734,134 | |
| | | | | |
| | 12,528 | | | Hershey Foods Corporation | | | | | | | | | 1,096,576 | |
| | | | | |
| | 11,522 | | | Ingredion Inc. | | | | | | | | | 833,271 | |
| | | | Total Food Products | | | | | | | | | 3,663,981 | |
| | | | Health Care Equipment & Supplies – 3.5% | | | | | | | | | | |
| | | | | |
| | 22,377 | | | Baxter International, Inc. | | | | | | | | | 1,625,465 | |
| | | | | |
| | 8,670 | | | Becton, Dickinson and Company | | | | | | | | | 828,939 | |
| | | | | |
| | 18,368 | | | Medtronic, Inc. | | | | | | | | | 862,561 | |
| | | | | |
| | 9,591 | | | ResMed Inc. | | | | | | | | | 444,639 | |
| | | | Total Health Care Equipment & Supplies | | | | | | | | | 3,761,604 | |
| | | | Health Care Providers & Services – 4.1% | | | | | | | | | | |
| | | | | |
| | 18,797 | | | Express Scripts, Holding Company | | | | | | | | | 1,083,647 | |
| | | | | |
| | 29,757 | | | HCA Holdings Inc. | | | | | | | | | 1,209,027 | |
| | | | | |
| | 16,067 | | | McKesson HBOC Inc. | | | | | | | | | 1,734,593 | |
| | | | | |
| | 8,054 | | | Tenet Healthcare Corporation | | | | | | | | | 383,209 | |
| | | | Total Health Care Providers & Services | | | | | | | | | 4,410,476 | |
| | | | Hotels, Restaurants & Leisure – 2.1% | | | | | | | | | | |
| | | | | |
| | 19,416 | | | Las Vegas Sands | | | | | | | | | 1,094,092 | |
| | | | | |
| | 21,213 | | | Starbucks Corporation | | | | | | | | | 1,208,292 | |
| | | | Total Hotels, Restaurants & Leisure | | | | | | | | | 2,302,384 | |
| | | | Household Durables – 1.3% | | | | | | | | | | |
| | | | | |
| | 43,257 | | | D.R. Horton, Inc. | | | | | | | | | 1,051,145 | |
| | | | | |
| | 312 | | | NVR Inc. | | | | | | | | | 336,994 | |
| | | | Total Household Durables | | | | | | | | | 1,388,139 | |
| | | | Household Products – 2.6% | | | | | | | | | | |
| | | | | |
| | 6,784 | | | Clorox Company | | | | | | | | | 600,588 | |
| | | | | |
| | 14,142 | | | Colgate-Palmolive Company | | | | | | | | | 1,669,180 | |
| | | | | |
| | 5,673 | | | Kimberly-Clark Corporation | | | | | | | | | 555,841 | |
| | | | Total Household Products | | | | | | | | | 2,825,609 | |
| | | | Industrial Conglomerates – 0.8% | | | | | | | | | | |
| | | | | |
| | 13,352 | | | Carlisle Companies Inc. | | | | | | | | | 905,132 | |
| | | | Insurance – 1.1% | | | | | | | | | | |
| | | | | |
| | 30,614 | | | Valdius Holdings Limited | | | | | | | | | 1,144,045 | |
| | | | Internet & Catalog Retail – 1.5% | | | | | | | | | | |
| | | | | |
| | 5,925 | | | Amazon.com, Inc. | | | | | | | | | 1,578,953 | |
| | | | Internet Software & Services – 4.9% | | | | | | | | | | |
| | | | | |
| | 26,898 | | | eBay Inc., (2) | | | | | | | | | 1,458,410 | |
| | | | | |
| | 11,709 | | | Facebook Inc., Class A Shares | | | | | | | | | 299,516 | |
| | | | | |
| | 4,431 | | | Google Inc., Class A, (2) | | | | | | | | | 3,518,347 | |
| | | | Total Internet Software & Services | | | | | | | | | 5,276,273 | |
| | | | IT Services – 4.2% | | | | | | | | | | |
| | | | | |
| | 5,793 | | | Alliance Data Systems Corporation, (2) | | | | | | | | | 937,829 | |
| | | | | |
| | 5,512 | | | International Business Machines Corporation (IBM), | | | | | | | | | 1,175,710 | |
| | | | | |
| | 2,370 | | | MasterCard, Inc. | | | | | | | | | 1,282,478 | |
| | | | | |
| | 6,765 | | | Visa Inc. | | | | | | | | | 1,148,968 | |
| | | | Total IT Services | | | | | | | | | 4,544,985 | |
Portfolio of Investments (Unaudited)
Nuveen Symphony Large-Cap Growth Fund (continued)
March 31, 2013
| | | | | | | | | | | | | | |
| Shares | | | Description (1) | | | | | | | | Value | |
| | | | | | | | | | | | | | |
| | | | Life Sciences Tools & Services – 0.5% | | | | | | | | | | |
| | | | | |
| | 11,829 | | | Agilent Technologies, Inc. | | | | | | | | $ | 496,463 | |
| | | | Machinery – 5.4% | | | | | | | | | | |
| | | | | |
| | 11,229 | | | Cummins Inc. | | | | | | | | | 1,300,430 | |
| | | | | |
| | 22,033 | | | Ingersoll Rand Company Limited, Class A | | | | | | | | | 1,212,035 | |
| | | | | |
| | 13,653 | | | Joy Global Inc. | | | | | | | | | 812,627 | |
| | | | | |
| | 16,481 | | | Lincoln Electric Holdings Inc. | | | | | | | | | 892,941 | |
| | | | | |
| | 16,768 | | | Timken Company | | | | | | | | | 948,733 | |
| | | | | |
| | 6,124 | | | Wabtec Corporation | | | | | | | | | 625,322 | |
| | | | Total Machinery | | | | | | | | | 5,792,088 | |
| | | | Media – 1.3% | | | | | | | | | | |
| | | | | |
| | 19,352 | | | Comcast Corporation, Class A | | | | | | | | | 812,978 | |
| | | | | |
| | 9,809 | | | Walt Disney Company | | | | | | | | | 557,151 | |
| | | | Total Media | | | | | | | | | 1,370,129 | |
| | | | Multiline Retail – 0.8% | | | | | | | | | | |
| | | | | |
| | 12,804 | | | Target Corporation | | | | | | | | | 876,434 | |
| | | | Oil, Gas & Consumable Fuels – 2.5% | | | | | | | | | | |
| | | | | |
| | 8,779 | | | Chevron Corporation | | | | | | | | | 1,043,121 | |
| | | | | |
| | 17,426 | | | Murphy Oil Corporation | | | | | | | | | 1,110,559 | |
| | | | | |
| | 8,943 | | | SM Energy Company | | | | | | | | | 529,604 | |
| | | | Total Oil, Gas & Consumable Fuels | | | | | | | | | 2,683,284 | |
| | | | Pharmaceuticals – 2.9% | | | | | | | | | | |
| | | | | |
| | 9,657 | | | Actavis Inc. | | | | | | | | | 889,506 | |
| | | | | |
| | 22,685 | | | Bristol-Myers Squibb Company | | | | | | | | | 934,395 | |
| | | | | |
| | 23,193 | | | Eli Lilly and Company | | | | | | | | | 1,317,130 | |
| | | | Total Pharmaceuticals | | | | | | | | | 3,141,031 | |
| | | | Retail REIT – 1.9% | | | | | | | | | | |
| | | | | |
| | 8,282 | | | Simon Property Group, Inc. | | | | | | | | | 1,313,194 | |
| | | | | |
| | 9,571 | | | Taubman Centers Inc. | | | | | | | | | 743,284 | |
| | | | Total Retail REIT | | | | | | | | | 2,056,478 | |
| | | | Road & Rail – 1.2% | | | | | | | | | | |
| | | | | |
| | 9,378 | | | Union Pacific Corporation | | | | | | | | | 1,335,521 | |
| | | | Semiconductors & Equipment – 3.2% | | | | | | | | | | |
| | | | | |
| | 32,407 | | | Avago Technologies Limtied | | | | | | | | | 1,164,059 | |
| | | | | |
| | 34,933 | | | Broadcom Corporation, Class A | | | | | | | | | 1,211,127 | |
| | | | | |
| | 46,315 | | | Skyworks Solutions Inc. | | | | | | | | | 1,020,319 | |
| | | | Total Semiconductors & Equipment | | | | | | | | | 3,395,505 | |
| | | | Software – 9.0% | | | | | | | | | | |
| | | | | |
| | 67,078 | | | Cadence Design Systems, Inc., (2) | | | | | | | | | 934,397 | |
| | | | | |
| | 18,972 | | | Citrix Systems | | | | | | | | | 1,369,020 | |
| | | | | |
| | 30,119 | | | Fortinet Inc. | | | | | | | | | 713,218 | |
| | | | | |
| | 26,994 | | | Informatica Corporation | | | | | | | | | 930,483 | |
| | | | | |
| | 115,104 | | | Microsoft Corporation | | | | | | | | | 3,293,125 | |
| | | | | |
| | 62,555 | | | Oracle Corporation | | | | | | | | | 2,023,029 | |
| | | | | |
| | 7,638 | | | Red Hat, Inc. | | | | | | | | | 386,177 | |
| | | | Total Software | | | | | | | | | 9,649,449 | |
| | | | | | | | | | | | | | | | | | |
| Shares | | | Description (1) | | | | | | | | | | Value | |
| | | | | | | | | | | | | | | | | | |
| | | | Specialized REIT – 1.9% | | | | | | | | | | | | | | |
| | | | | |
| | 6,756 | | | Public Storage, Inc. | | | | | | | | | | | | $ | 1,029,074 | |
| | | | | |
| | 16,847 | | | Rayonier Inc. | | | | | | | | | | | | | 1,005,260 | |
| | | | Total Specialized REIT | | | | | | | | | | | | | 2,034,334 | |
| | | | Specialty Retail – 4.9% | | | | | | | | | | | | | | |
| | | | | |
| | 16,366 | | | AutoNation Inc. | | | | | | | | | | | | | 716,013 | |
| | | | | |
| | 23,884 | | | Foot Locker, Inc. | | | | | | | | | | | | | 817,788 | |
| | | | | |
| | 30,060 | | | Home Depot, Inc. | | | | | | | | | | | | | 2,097,587 | |
| | | | | |
| | 14,404 | | | L Brands, Inc. | | | | | | | | | | | | | 643,135 | |
| | | | | |
| | 6,492 | | | PetSmart Inc. | | | | | | | | | | | | | 403,153 | |
| | | | | |
| | 10,673 | | | Williams-Sonoma Inc. | | | | | | | | | | | | | 549,873 | |
| | | | Total Specialty Retail | | | | | | | | | | | | | 5,227,549 | |
| | | | Textiles, Apparel & Luxury Goods – 0.9% | | | | | | | | | | | | | | |
| | | | | |
| | 15,501 | | | Nike, Inc., Class B | | | | | | | | | | | | | 914,714 | |
| | | | Tobacco – 2.0% | | | | | | | | | | | | | | |
| | | | | |
| | 22,733 | | | Philip Morris International | | | | | | | | | | | | | 2,107,576 | |
| | | | Total Common Stocks (cost $95,457,472) | | | | | | | | | | | | | 105,551,542 | |
| | | | | |
Principal
Amount (000) | | | Description (1) | | Coupon | | | Maturity | | | | | Value | |
| | | | SHORT-TERM INVESTMENTS – 3.0% | | | | | | | | | | | | | | |
| | | | | |
| | | | Repurchase Agreements – 3.0% | | | | | | | | | | | | | | |
| | | | | |
| $ | 3,230 | | | Repurchase Agreement with State Street Bank, dated 3/28/13, repurchase price $3,229,843, collateralized by $3,160,000 U.S. Treasury Notes, 2.375%, due 10/31/14, value $3,297,580 | | | 0.010% | | | | 4/01/13 | | | | | $ | 3,229,839 | |
| | | | Total Short-Term Investments (cost $3,229,839) | | | | | | | | | | | | | 3,229,839 | |
| | | | Total Investments (cost $98,687,311) – 101.5% | | | | | | | | | | | | | 108,781,381 | |
| | | | Other Assets Less Liabilities – (1.5)% | | | | | | | | | | | | | (1,562,068) | |
| | | | Net Assets – 100% | | | | | | | | | | | | $ | 107,219,313 | |
| | | | For Fund portfolio compliance purposes, the Fund’s industry classifications refer to any one or more of the industry sub-classifications used by one or more widely recognized market indexes or ratings group indexes, and/or as defined by Fund management. This definition may not apply for purposes of this report, which may combine industry sub-classifications into sectors for reporting ease. |
| | (1) | | All percentages shown in the Portfolio of Investments are based on net assets. |
| | (2) | | Non-income producing; issuer has not declared a dividend within the past twelve months. |
| | REIT | | Real Estate Investment Trust. |
See accompanying notes to financial statements.
Portfolio of Investments (Unaudited)
Nuveen Symphony Mid-Cap Core Fund
March 31, 2013
| | | | | | | | | | | | | | |
| Shares | | | Description (1) | | | | | | | | Value | |
| | | | | | | | | | | | | | |
| | | | COMMON STOCKS – 97.8% | | | | | | | | | | |
| | | | | |
| | | | Apparel, Accesories & Luxury Goods – 0.6% | | | | | | | | | | |
| | | | | |
| | 310 | | | PVH Corporation | | | | | | | | $ | 33,111 | |
| | | | Auto Components – 3.1% | | | | | | | | | | |
| | | | | |
| | 1,427 | | | Delphi Automotive PLC | | | | | | | | | 63,359 | |
| | | | | |
| | 693 | | | Lear Corporation | | | | | | | | | 38,025 | |
| | | | | |
| | 1,104 | | | TRW Automotive Holdings Corporation | | | | | | | | | 60,720 | |
| | | | Total Auto Components | | | | | | | | | 162,104 | |
| | | | Automobiles – 2.3% | | | | | | | | | | |
| | | | | |
| | 1,170 | | | Harley-Davidson, Inc. | | | | | | | | | 62,361 | |
| | | | | |
| | 1,567 | | | Thor Industries, Inc. | | | | | | | | | 57,650 | |
| | | | Total Automobiles | | | | | | | | | 120,011 | |
| | | | Beverages – 0.7% | | | | | | | | | | |
| | | | | |
| | 523 | | | Brown-Forman Corporation | | | | | | | | | 37,342 | |
| | | | Building Products – 2.5% | | | | | | | | | | |
| | | | | |
| | 1,518 | | | Fortune Brands Home & Security, (2) | | | | | | | | | 56,819 | |
| | | | | |
| | 3,515 | | | Masco Corporation | | | | | | | | | 71,179 | |
| | | | Total Building Products | | | | | | | | | 127,998 | |
| | | | Capital Markets – 6.0% | | | | | | | | | | |
| | | | | |
| | 339 | | | Affiliated Managers Group Inc., (2) | | | | | | | | | 52,060 | |
| | | | | |
| | 3,989 | | | American Capital Limited | | | | | | | | | 58,219 | |
| | | | | |
| | 1,102 | | | Ameriprise Financial, Inc. | | | | | | | | | 81,162 | |
| | | | | |
| | 2,668 | | | Invesco LTD | | | | | | | | | 77,265 | |
| | | | | |
| | 1,534 | | | SEI Investments Company | | | | | | | | | 44,256 | |
| | | | Total Capital Markets | | | | | | | | | 312,962 | |
| | | | Chemicals – 4.4% | | | | | | | | | | |
| | | | | |
| | 636 | | | Celanese Corporation, Series A | | | | | | | | | 28,016 | |
| | | | | |
| | 977 | | | Eastman Chemical Company | | | | | | | | | 68,263 | |
| | | | | |
| | 1,934 | | | Huntsman Corporation | | | | | | | | | 35,953 | |
| | | | | |
| | 133 | | | NewMarket Corporation | | | | | | | | | 34,628 | |
| | | | | |
| | 690 | | | Westlake Chemical Corporation | | | | | | | | | 64,515 | |
| | | | Total Chemicals | | | | | | | | | 231,375 | |
| | | | Commercial Banks – 2.4% | | | | | | | | | | |
| | | | | |
| | 6,900 | | | KeyCorp. | | | | | | | | | 68,724 | |
| | | | | |
| | 6,876 | | | Regions Financial Corporation | | | | | | | | | 56,314 | |
| | | | Total Commercial Banks | | | | | | | | | 125,038 | |
| | | | Commercial Services & Supplies – 1.2% | | | | | | | | | | |
| | | | | |
| | 1,392 | | | Avery Dennison Corporation | | | | | | | | | 59,953 | |
| | | | Computers & Peripherals – 0.9% | | | | | | | | | | |
| | | | | |
| | 26 | | | Apple, Inc. | | | | | | | | | 11,508 | |
| | | | | |
| | 720 | | | Western Digital Corporation | | | | | | | | | 36,202 | |
| | | | Total Computers & Peripherals | | | | | | | | | 47,710 | |
| | | | Construction & Engineering – 2.2% | | | | | | | | | | |
| | | | | |
| | 929 | | | Chicago Bridge & Iron Company N.V. | | | | | | | | | 57,691 | |
| | | | | |
| | 2,072 | | | Quanta Services Incorporated, (2) | | | | | | | | | 59,218 | |
| | | | Total Construction & Engineering | | | | | | | | | 116,909 | |
| | | | | | | | | | | | | | |
| Shares | | | Description (1) | | | | | | | | Value | |
| | | | | | | | | | | | | | |
| | | | Electric Utilities – 0.7% | | | | | | | | | | |
| | | | | |
| | 645 | | | Pinnacle West Capital Corporation | | | | | | | | $ | 37,339 | |
| | | | Electrical Equipment – 0.9% | | | | | | | | | | |
| | | | | |
| | 724 | | | Eaton PLC | | | | | | | | | 44,345 | |
| | | | Electronic Equipment & Instruments – 1.0% | | | | | | | | | | |
| | | | | |
| | 1,377 | | | Avnet Inc. | | | | | | | | | 49,847 | |
| | | | Energy Equipment & Services – 0.5% | | | | | | | | | | |
| | | | | |
| | 355 | | | Cooper Cameron Corporation | | | | | | | | | 23,146 | |
| | | | Food Products – 4.7% | | | | | | | | | | |
| | | | | |
| | 1,424 | | | ConAgra Foods, Inc. | | | | | | | | | 50,993 | |
| | | | | |
| | 452 | | | Hershey Foods Corporation | | | | | | | | | 39,564 | |
| | | | | |
| | 678 | | | Ingredion Inc. | | | | | | | | | 49,033 | |
| | | | | |
| | 517 | | | JM Smucker Company | | | | | | | | | 51,266 | |
| | | | | |
| | 2,161 | | | Tyson Foods, Inc., Class A | | | | | | | | | 53,636 | |
| | | | Total Food Products | | | | | | | | | 244,492 | |
| | | | Gas Utilities – 0.7% | | | | | | | | | | |
| | | | | |
| | 985 | | | UGI Corporation | | | | | | | | | 37,814 | |
| | | | Health Care Equipment & Supplies – 4.0% | | | | | | | | | | |
| | | | | |
| | 1,320 | | | Hill Rom Holdings Inc. | | | | | | | | | 46,490 | |
| | | | | |
| | 3,011 | | | Hologic Inc., (2) | | | | | | | | | 68,049 | |
| | | | | |
| | 1,117 | | | ResMed Inc. | | | | | | | | | 51,784 | |
| | | | | |
| | 569 | | | Zimmer Holdings, Inc. | | | | | | | | | 42,800 | |
| | | | Total Health Care Equipment & Supplies | | | | | | | | | 209,123 | |
| | | | Health Care Providers & Services – 3.3% | | | | | | | | | | |
| | | | | |
| | 2,305 | | | Brookdale Senior Living Inc., (2) | | | | | | | | | 64,263 | |
| | | | | |
| | 298 | | | CIGNA Corporation | | | | | | | | | 18,586 | |
| | | | | |
| | 302 | | | Davita Inc., (2) | | | | | | | | | 35,814 | |
| | | | | |
| | 1,269 | | | HCA Holdings Inc. | | | | | | | | | 51,559 | |
| | | | Total Health Care Providers & Services | | | | | | | | | 170,222 | |
| | | | Hotels, Restaurants & Leisure – 0.6% | | | | | | | | | | |
| | | | | |
| | 893 | | | Dunkin Brands Group Inc. | | | | | | | | | 32,934 | |
| | | | Household Durables – 4.8% | | | | | | | | | | |
| | | | | |
| | 2,845 | | | D.R. Horton, Inc. | | | | | | | | | 69,134 | |
| | | | | |
| | 1,890 | | | Lennar Corporation, Class A | | | | | | | | | 78,397 | |
| | | | | |
| | 2,128 | | | Newell Rubbermaid Inc. | | | | | | | | | 55,541 | |
| | | | | |
| | 2,306 | | | Pulte Corporation, (2) | | | | | | | | | 46,673 | |
| | | | Total Household Durables | | | | | | | | | 249,745 | |
| | | | Insurance – 7.8% | | | | | | | | | | |
| | | | | |
| | 572 | | | Allied World Assurance Holdings | | | | | | | | | 53,036 | |
| | | | | |
| | 315 | | | Everest Reinsurance Group Ltd | | | | | | | | | 40,906 | |
| | | | | |
| | 1,523 | | | Hartford Financial Services Group, Inc. | | | | | | | | | 39,293 | |
| | | | | |
| | 3,254 | | | Old Republic International Corporation | | | | | | | | | 41,358 | |
| | | | | |
| | 884 | | | Torchmark Corporation | | | | | | | | | 52,863 | |
| | | | | |
| | 1,640 | | | Valdius Holdings Limited | | | | | | | | | 61,287 | |
| | | | | |
| | 1,423 | | | WR Berkley Corporation | | | | | | | | | 63,139 | |
| | | | | |
| | 1,846 | | | XL Capital Ltd, Class A | | | | | | | | | 55,934 | |
| | | | Total Insurance | | | | | | | | | 407,816 | |
Portfolio of Investments (Unaudited)
Nuveen Symphony Mid-Cap Core Fund (continued)
March 31, 2013
| | | | | | | | | | | | | | |
| Shares | | | Description (1) | | | | | | | | Value | |
| | | | | | | | | | | | | | |
| | | | Internet & Catalog Retail – 0.5% | | | | | | | | | | |
| | | | | |
| | 1,246 | | | Liberty Interactive Corporation, Class A Shares | | | | | | | | $ | 26,639 | |
| | | | Internet Software & Services – 0.7% | | | | | | | | | | |
| | | | | |
| | 997 | | | Akamai Technologies, Inc. | | | | | | | | | 35,184 | |
| | | | IT Services – 2.9% | | | | | | | | | | |
| | | | | |
| | 393 | | | Alliance Data Systems Corporation, (2) | | | | | | | | | 63,623 | |
| | | | | |
| | 1,219 | | | Computer Sciences Corporation | | | | | | | | | 60,011 | |
| | | | | |
| | 733 | | | Paychex, Inc. | | | | | | | | | 25,706 | |
| | | | Total IT Services | | | | | | | | | 149,340 | |
| | | | Life Sciences Tools & Services – 0.9% | | | | | | | | | | |
| | | | | |
| | 1,142 | | | Agilent Technologies, Inc. | | | | | | | | | 47,930 | |
| | | | Machinery – 7.7% | | | | | | | | | | |
| | | | | |
| | 1,031 | | | Ingersoll Rand Company Limited, Class A | | | | | | | | | 56,715 | |
| | | | | |
| | 772 | | | Joy Global Inc. | | | | | | | | | 45,949 | |
| | | | | |
| | 868 | | | PACCAR Inc. | | | | | | | | | 43,886 | |
| | | | | |
| | 791 | | | Stanley Black & Decker Inc. | | | | | | | | | 64,047 | |
| | | | | |
| | 1,049 | | | Timken Company | | | | | | | | | 59,352 | |
| | | | | |
| | 619 | | | WABCO Holdings Inc. | | | | | | | | | 43,695 | |
| | | | | |
| | 511 | | | Wabtec Corporation | | | | | | | | | 52,178 | |
| | | | | |
| | 1,338 | | | Xylem Inc. | | | | | | | | | 36,875 | |
| | | | Total Machinery | | | | | | | | | 402,697 | |
| | | | Media – 0.8% | | | | | | | | | | |
| | | | | |
| | 1,425 | | | Cinemark Holdings Inc. | | | | | | | | | 41,952 | |
| | | | Multi-Utilities – 1.8% | | | | | | | | | | |
| | | | | |
| | 887 | | | Ameren Corporation | | | | | | | | | 31,063 | |
| | | | | |
| | 1,203 | | | CenterPoint Energy, Inc. | | | | | | | | | 28,824 | |
| | | | | |
| | 469 | | | DTE Energy Company | | | | | | | | | 32,051 | |
| | | | Total Multi-Utilities | | | | | | | | | 91,938 | |
| | | | Oil, Gas & Consumable Fuels – 5.0% | | | | | | | | | | |
| | | | | |
| | 500 | | | Energen Corporation | | | | | | | | | 26,005 | |
| | | | | |
| | 606 | | | Marathon Petroleum Corporation | | | | | | | | | 54,298 | |
| | | | | |
| | 1,439 | | | Peabody Energy Corporation | | | | | | | | | 30,435 | |
| | | | | |
| | 748 | | | SM Energy Company | | | | | | | | | 44,297 | |
| | | | | |
| | 1,136 | | | Southwestern Energy Company | | | | | | | | | 42,327 | |
| | | | | |
| | 1,375 | | | Valero Energy Corporation | | | | | | | | | 62,549 | |
| | | | Total Oil, Gas & Consumable Fuels | | | | | | | | | 259,911 | |
| | | | Paper & Forest Products – 0.4% | | | | | | | | | | |
| | | | | |
| | 458 | | | International Paper Company | | | | | | | | | 21,334 | |
| | | | Pharmaceuticals – 0.9% | | | | | | | | | | |
| | | | | |
| | 482 | | | Actavis Inc. | | | | | | | | | 44,397 | |
| | | | Real Estate Management & Development – 1.0% | | | | | | | | | | |
| | | | | |
| | 618 | | | Howard Hughes Corporation | | | | | | | | | 51,795 | |
| | | | Retail REIT – 4.9% | | | | | | | | | | |
| | | | | |
| | 2,975 | | | CBL & Associates Properties Inc. | | | | | | | | | 70,210 | |
| | | | | |
| | 2,343 | | | General Growth Properties Inc. | | | | | | | | | 46,579 | |
| | | | | |
| | 2,183 | | | Tanger Factory Outlet Centers | | | | | | | | | 78,981 | |
| | | | | |
| | 772 | | | Taubman Centers Inc. | | | | | | | | | 59,954 | |
| | | | Total Retail REIT | | | | | | | | | 255,724 | |
| | | | | | | | | | | | | | |
| Shares | | | Description (1) | | | | | | | | Value | |
| | | | | | | | | | | | | | |
| | | | Road & Rail – 0.6% | | | | | | | | | | |
| | | | | |
| | 1,484 | | | Hertz Global Holdings Inc. | | | | | | | | $ | 33,034 | |
| | | | Semiconductors & Equipment – 1.9% | | | | | | | | | | |
| | | | | |
| | 1,350 | | | Avago Technologies Limtied | | | | | | | | | 48,492 | |
| | | | | |
| | 1,545 | | | Maxim Integrated Products, Inc. | | | | | | | | | 50,444 | |
| | | | Total Semiconductors & Equipment | | | | | | | | | 98,936 | |
| | | | Software – 5.0% | | | | | | | | | | |
| | | | | |
| | 4,889 | | | Cadence Design Systems, Inc., (2) | | | | | | | | | 68,104 | |
| | | | | |
| | 564 | | | Citrix Systems | | | | | | | | | 40,698 | |
| | | | | |
| | 1,689 | | | Fortinet Inc., (2) | | | | | | | | | 39,996 | |
| | | | | |
| | 740 | | | Intuit, Inc. | | | | | | | | | 48,581 | |
| | | | | |
| | 2,650 | | | Symantec Corporation | | | | | | | | | 65,402 | |
| | | | Total Software | | | | | | | | | 262,781 | |
| | | | Specialty Retail – 6.3% | | | | | | | | | | |
| | | | | |
| | 1,626 | | | AutoNation Inc. | | | | | | | | | 71,138 | |
| | | | | |
| | 1,667 | | | Foot Locker, Inc. | | | | | | | | | 57,078 | |
| | | | | |
| | 875 | | | GNC Holdings Inc. | | | | | | | | | 34,370 | |
| | | | | |
| | 964 | | | L Brands, Inc. | | | | | | | | | 43,052 | |
| | | | | |
| | 381 | | | PetSmart Inc. | | | | | | | | | 23,660 | |
| | | | | |
| | 1,078 | | | Signet Jewelers Limited | | | | | | | | | 72,228 | |
| | | | | |
| | 526 | | | Williams-Sonoma Inc. | | | | | | | | | 27,100 | |
| | | | Total Specialty Retail | | | | | | | | | 328,626 | |
| | | | Trading Companies & Distributors – 0.8% | | | | | | | | | | |
| | | | | |
| | 603 | | | WESCO International Inc. | | | | | | | | | 43,784 | |
| | | | Wireless Telecommunication Services – 0.4% | | | | | | | | | | |
| | | | | |
| | 2,050 | | | Metropcs Communications Inc. | | | | | | | | | 22,345 | |
| | | | Total Common Stocks (cost $4,326,548) – 97.8% | | | | | | | | | 5,099,683 | |
| | | | Other Assets Less Liabilities – 2.2% | | | | | | | | | 113,369 | |
| | | | Net Assets – 100% | | | | | | | | $ | 5,213,052 | |
| | | | For Fund portfolio compliance purposes, the Fund’s industry classifications refer to any one or more of the industry sub-classifications used by one or more widely recognized market indexes or ratings group indexes, and/or as defined by Fund management. This definition may not apply for purposes of this report, which may combine industry sub-classifications into sectors for reporting ease. |
| | (1) | | All percentages shown in the Portfolio of Investments are based on net assets. |
| | (2) | | Non-income producing; issuer has not declared a dividend within the past twelve months. |
| | REIT | | Real Estate Investment Trust. |
See accompanying notes to financial statements.
Portfolio of Investments (Unaudited)
Nuveen Symphony International Equity Fund
March 31, 2013
| | | | | | | | | | | | | | |
| Shares | | | Description (1) | | | | | | | | Value | |
| | | | | | | | | | | | | | |
| | | | COMMON STOCKS – 89.1% | | | | | | | | | | |
| | | | | |
| | | | Automobiles – 3.1% | | | | | | | | | | |
| | | | | |
| | 827 | | | Honda Motor Company Limited, Sponsored ADR | | | | | | | | $ | 31,641 | |
| | | | | |
| | 793 | | | Honda Motor Company Limited | | | | | | | | | 30,327 | |
| | | | | |
| | 2,704 | | | Toyota Motor Corporation | | | | | | | | | 138,597 | |
| | | | Total Automobiles | | | | | | | | | 200,565 | |
| | | | Beverages – 1.8% | | | | | | | | | | |
| | | | | |
| | 7,524 | | | Coca Cola Amatil Limited | | | | | | | | | 114,214 | |
| | | | Capital Markets – 0.5% | | | | | | | | | | |
| | | | | |
| | 2,094 | | | UBS AG | | | | | | | | | 32,095 | |
| | | | Chemicals – 4.7% | | | | | | | | | | |
| | | | | |
| | 3,673 | | | Kuraray Company Limited | | | | | | | | | 51,543 | |
| | | | | |
| | 2,032 | | | Nitto Denko Corporation | | | | | | | | | 121,529 | |
| | | | | |
| | 1,065 | | | Potash Corporation of Saskatchewan | | | | | | | | | 41,830 | |
| | | | | |
| | 1,787 | | | Umicore | | | | | | | | | 83,942 | |
| | | | Total Chemicals | | | | | | | | | 298,844 | |
| | | | Commercial Banks – 11.1% | | | | | | | | | | |
| | | | | |
| | 3,896 | | | Banco Santander Central S.A., ADR | | | | | | | | | 26,532 | |
| | | | | |
| | 1,468 | | | BNP Paribas S.A. | | | | | | | | | 75,346 | |
| | | | | |
| | 10,102 | | | DnB NOR ASA | | | | | | | | | 148,138 | |
| | | | | |
| | 4,174 | | | Grupo Financiero Santander Mexico SAB de CV | | | | | | | | | 64,405 | |
| | | | | |
| | 3,029 | | | Hang Seng Bank | | | | | | | | | 48,503 | |
| | | | | |
| | 7,165 | | | HSBC Holdings PLC | | | | | | | | | 76,480 | |
| | | | | |
| | 4,061 | | | Mitsubishi UFJ Financial Group, Inc., ADR | | | | | | | | | 24,331 | |
| | | | | |
| | 13,579 | | | Mizuho Financial Group | | | | | | | | | 28,994 | |
| | | | | |
| | 594 | | | Societe Generale | | | | | | | | | 19,515 | |
| | | | | |
| | 3,501 | | | Standard Chartered PLC | | | | | | | | | 90,619 | |
| | | | | |
| | 1,973 | | | Sumitomo Mitsui Financial Group | | | | | | | | | 80,484 | |
| | | | | |
| | 5,058 | | | UniCredit SpA | | | | | | | | | 21,590 | |
| | | | Total Commercial Banks | | | | | | | | | 704,937 | |
| | | | Commercial Services & Supplies – 0.9% | | | | | | | | | | |
| | | | | |
| | 2,104 | | | Aggreko PLC | | | | | | | | | 56,969 | |
| | | | Construction & Engineering – 0.8% | | | | | | | | | | |
| | | | | |
| | 1,298 | | | Royal Boskalis Westminster NV | | | | | | | | | 51,562 | |
| | | | Diversified Financial Services – 0.8% | | | | | | | | | | |
| | | | | |
| | 6,761 | | | ING Groep N.V., Ordinary Shares | | | | | | | | | 47,987 | |
| | | | Diversified Telecommunication Services – 0.5% | | | | | | | | | | |
| | | | | |
| | 1,142 | | | Telefonica Brasil S.A. | | | | | | | | | 30,469 | |
| | | | Electrical Equipment – 3.1% | | | | | | | | | | |
| | | | | |
| | 2,202 | | | ABB Limited | | | | | | | | | 50,118 | |
| | | | | |
| | 1,166 | | | ABB Limited | | | | | | | | | 26,297 | |
| | | | | |
| | 1,654 | | | Nidec Corporation, ADR | | | | | | | | | 24,810 | |
| | | | | |
| | 146 | | | Nidec Corporation | | | | | | | | | 8,716 | |
| | | | | |
| | 2,637 | | | Sensata Techologies Holdings, (2) | | | | | | | | | 86,678 | |
| | | | Total Electrical Equipment | | | | | | | | | 196,619 | |
| | | | | | | | | | | | | | |
| Shares | | | Description (1) | | | | | | | | Value | |
| | | | | | | | | | | | | | |
| | | | Electronic Equipment & Instruments – 1.1% | | | | | | | | | | |
| | | | | |
| | 2,794 | | | Hoya Corporation | | | | | | | | $ | 52,416 | |
| | | | | |
| | 4,132 | | | Nippon Electric Glass Company Limited | | | | | | | | | 20,499 | |
| | | | Total Electronic Equipment & Instruments | | | | | | | | | 72,915 | |
| | | | Energy Equipment & Services – 0.8% | | | | | | | | | | |
| | | | | |
| | 1,877 | | | Subsea 7 SA | | | | | | | | | 43,866 | |
| | | | | |
| | 359 | | | Subsea 7 SA, ADR, (3) | | | | | | | | | 8,440 | |
| | | | Total Energy Equipment & Services | | | | | | | | | 52,306 | |
| | | | Food & Staples Retailing – 2.3% | | | | | | | | | | |
| | | | | |
| | 4,450 | | | Jeronimo Martins SGPS | | | | | | | | | 86,676 | |
| | | | | |
| | 746 | | | Koninklijke Ahold NV, Sponsored ADR, (3) | | | | | | | | | 11,451 | |
| | | | | |
| | 3,028 | | | Koninklijke Ahold NV, Sponsored ADR | | | | | | | | | 46,403 | |
| | | | Total Food & Staples Retailing | | | | | | | | | 144,530 | |
| | | | Food Products – 4.2% | | | | | | | | | | |
| | | | | |
| | 227 | | | Nestle S.A., Sponsored ADR, (3) | | | | | | | | | 16,451 | |
| | | | | |
| | 1,497 | | | Nestle SA | | | | | | | | | 108,258 | |
| | | | | |
| | 680 | | | Unilever PLC, ADR | | | | | | | | | 28,723 | |
| | | | | |
| | 2,638 | | | Unilever PLC, ADR | | | | | | | | | 111,591 | |
| | | | Total Food Products | | | | | | | | | 265,023 | |
| | | | Health Care Providers & Services – 1.3% | | | | | | | | | | |
| | | | | |
| | 2,520 | | | Fresenius Medical Care AG | | | | | | | | | 85,327 | |
| | | | Household Durables – 1.1% | | | | | | | | | | |
| | | | | |
| | 2,762 | | | Brookfield Residential Properties Inc. | | | | | | | | | 67,227 | |
| | | | Industrial Conglomerates – 1.0% | | | | | | | | | | |
| | | | | |
| | 646 | | | Rheinmetall AG | | | | | | | | | 29,881 | |
| | | | | |
| | 338 | | | Siemens AG, Sponsored ADR | | | | | | | | | 36,407 | |
| | | | Total Industrial Conglomerates | | | | | | | | | 66,288 | |
| | | | Insurance – 6.3% | | | | | | | | | | |
| | | | | |
| | 14,600 | | | AIA Group Limited | | | | | | | | | 63,760 | |
| | | | | |
| | 1,657 | | | Hannover Rueckversicherung AG | | | | | | | | | 129,969 | |
| | | | | |
| | 2,290 | | | Prudential Corporation PLC | | | | | | | | | 37,057 | |
| | | | | |
| | 1,595 | | | Prudential Corporation PLC | | | | | | | | | 51,614 | |
| | | | | |
| | 2,461 | | | SCOR SE | | | | | | | | | 70,664 | |
| | | | | |
| | 1,581 | | | XL Capital Ltd, Class A | | | | | | | | | 47,904 | |
| | | | Total Insurance | | | | | | | | | 400,968 | |
| | | | Internet Software & Services – 0.9% | | | | | | | | | | |
| | | | | |
| | 928 | | | Tencent Holdings Limited | | | | | | | | | 29,505 | |
| | | | | |
| | 1,233 | | | Yandex NV, Class A Shares | | | | | | | | | 28,507 | |
| | | | Total Internet Software & Services | | | | | | | | | 58,012 | |
| | | | Life Sciences Tools & Services – 0.5% | | | | | | | | | | |
| | | | | |
| | 1,804 | | �� | WuXi PharmaTech Inc. | | | | | | | | | 30,993 | |
| | | | Machinery – 2.1% | | | | | | | | | | |
| | | | | |
| | 748 | | | Kone OYJ | | | | | | | | | 58,824 | |
| | | | | |
| | 2,227 | | | Nabtesco Corporation | | | | | | | | | 45,470 | |
| | | | | |
| | 606 | | | Vallourec S.A. | | | | | | | | | 29,130 | |
| | | | Total Machinery | | | | | | | | | 133,424 | |
Portfolio of Investments (Unaudited)
Nuveen Symphony International Equity Fund (continued)
March 31, 2013
| | | | | | | | | | | | | | |
| Shares | | | Description (1) | | | | | | | | Value | |
| | | | | | | | | | | | | | |
| | | | Media – 1.2% | | | | | | | | | | |
| | | | | |
| | 152 | | | WPP Group PLC | | | | | | | | $ | 12,178 | |
| | | | | |
| | 4,119 | | | WPP Group PLC | | | | | | | | | 65,653 | |
| | | | Total Media | | | | | | | | | 77,831 | |
| | | | Metals & Mining – 3.6% | | | | | | | | | | |
| | | | | |
| | 710 | | | BHP Billiton PLC, ADR | | | | | | | | | 48,585 | |
| | | | | |
| | 1,283 | | | BHP Billiton PLC, ADR | | | | | | | | | 43,761 | |
| | | | | |
| | 5,028 | | | Iluka Resources Limited | | | | | | | | | 48,946 | |
| | | | | |
| | 1,496 | | | Rio Tinto Limited | | | | | | | | | 89,092 | |
| | | | Total Metals & Mining | | | | | | | | | 230,384 | |
| | | | Multiline Retail – 1.7% | | | | | | | | | | |
| | | | | |
| | 1,586 | | | Next PLC | | | | | | | | | 105,214 | |
| | | | Oil, Gas & Consumable Fuels – 6.1% | | | | | | | | | | |
| | | | | |
| | 4,586 | | | BG Group PLC | | | | | | | | | 78,671 | |
| | | | | |
| | 469 | | | BG PLC., Sponsored ADR, (3) | | | | | | | | | 8,043 | |
| | | | | |
| | 2,099 | | | Repsol YPF S.A | | | | | | | | | 42,646 | |
| | | | | |
| | 3,379 | | | Royal Dutch Shell PLC, Class B Shares | | | | | | | | | 112,183 | |
| | | | | |
| | 1,220 | | | StatoilHydro ASA | | | | | | | | | 29,493 | |
| | | | | |
| | 1,702 | | | StatoilHydro ASA | | | | | | | | | 41,903 | |
| | | | | |
| | 278 | | | Total S.A., Sponsored ADR | | | | | | | | | 13,338 | |
| | | | | |
| | 1,323 | | | Total S.A. | | | | | | | | | 63,350 | |
| | | | Total Oil, Gas & Consumable Fuels | | | | | | | | | 389,627 | |
| | | | Personal Products – 0.7% | | | | | | | | | | |
| | | | | |
| | 291 | | | L’Oreal | | | | | | | | | 46,142 | |
| | | | Pharmaceuticals – 9.0% | | | | | | | | | | |
| | | | | |
| | 1,137 | | | AstraZeneca PLC, Sponsored ADR | | | | | | | | | 56,827 | |
| | | | | |
| | 986 | | | Bayer AG, Sponsored ADR | | | | | | | | | 101,706 | |
| | | | | |
| | 680 | | | Novartis AG, Sponsored ADR | | | | | | | | | 48,443 | |
| | | | | |
| | 439 | | | Novartis AG, Sponsored ADR | | | | | | | | | 31,192 | |
| | | | | |
| | 686 | | | Novo Nordisk A/S | | | | | | | | | 111,456 | |
| | | | | |
| | 1,351 | | | Sanofi-Aventis | | | | | | | | | 69,009 | |
| | | | | |
| | 427 | | | Sanofi-Synthelabo, SA | | | | | | | | | 43,388 | |
| | | | | |
| | 2,092 | | | Shire plc, ADR | | | | | | | | | 63,701 | |
| | | | | |
| | 1,227 | | | Teva Pharmaceutical Industries Limited, Sponsored ADR | | | | | | | | | 48,687 | |
| | | | Total Pharmaceuticals | | | | | | | | | 574,409 | |
| | | | Real Estate Investment Trust – 1.3% | | | | | | | | | | |
| | | | | |
| | 5,855 | | | Westfield Group | | | | | | | | | 66,141 | |
| | | | | |
| | 4,788 | | | Westfield Realty Trust | | | | | | | | | 15,055 | |
| | | | Total Real Estate Investment Trust | | | | | | | | | 81,196 | |
| | | | Real Estate Management & Development – 2.6% | | | | | | | | | | |
| | | | | |
| | 874 | | | Altisource Portfolio Solutions S.A., (2) | | | | | | | | | 60,962 | |
| | | | | |
| | 2,646 | | | Brookfield Properties Corporation | | | | | | | | | 45,426 | |
| | | | | |
| | 11,995 | | | Hysan Development Company | | | | | | | | | 60,805 | |
| | | | Total Real Estate Management & Development | | | | | | | | | 167,193 | |
| | | | Road & Rail – 0.6% | | | | | | | | | | |
| | | | | |
| | 500 | | | East Japan Railway Company | | | | | | | | | 41,058 | |
| | | | | | | | | | | | | | | | | | |
| Shares | | | Description (1) | | | | | | | | | | Value | |
| | | | | | | | | | | | | | | | | | |
| | | | Semiconductors & Equipment – 2.5% | | | | | | | | | | | | | | |
| | | | | |
| | 1,464 | | | ASM Lithography Holding NV | | | | | | | | | | | | $ | 99,567 | |
| | | | | |
| | 2,030 | | | NXP Semiconductors NV | | | | | | | | | | | | | 61,428 | |
| | | | Total Semiconductors & Equipment | | | | | | | | | | | | | 160,995 | |
| | | | Software – 1.2% | | | | | | | | | | | | | | |
| | | | | |
| | 952 | | | Check Point Software Technology Limited | | | | | | | | | | | | | 44,734 | |
| | | | | |
| | 5,040 | | | Giant Interactive Group, Inc., ADR | | | | | | | | | | | | | 32,760 | |
| | | | Total Software | | | | | | | | | | | | | 77,494 | |
| | | | Textiles, Apparel & Luxury Goods – 3.2% | | | | | | | | | | | | | | |
| | | | | |
| | 2,971 | | | Burberry Group PLC | | | | | | | | | | | | | 59,995 | |
| | | | | |
| | 494 | | | LVMH Moet Hennessy | | | | | | | | | | | | | 84,790 | |
| | | | | |
| | 19,034 | | | Yue Yuen Industrial Holdings Limited | | | | | | | | | | | | | 62,159 | |
| | | | Total Textiles, Apparel & Luxury Goods | | | | | | | | | | | | | 206,944 | |
| | | | Tobacco – 1.4% | | | | | | | | | | | | | | |
| | | | | |
| | 743 | | | British American Tobacco PLC | | | | | | | | | | | | | 39,818 | |
| | | | | |
| | 483 | | | British American Tobacco PLC | | | | | | | | | | | | | 51,705 | |
| | | | Total Tobacco | | | | | | | | | | | | | 91,523 | |
| | | | Trading Companies & Distributors – 2.3% | | | | | | | | | | | | | | |
| | | | | |
| | 6,688 | | | Ashtead Group PLC | | | | | | | | | | | | | 59,601 | |
| | | | | |
| | 6,010 | | | Mitsui & Company Limited | | | | | | | | | | | | | 84,147 | |
| | | | Total Trading Companies & Distributors | | | | | | | | | | | | | 143,748 | |
| | | | Wireless Telecommunication Services – 2.8% | | | | | | | | | | | | | | |
| | | | | |
| | 1,200 | | | KDDI Corporation | | | | | | | | | | | | | 50,035 | |
| | | | | |
| | 846 | | | Millicom International Cellular SA | | | | | | | | | | | | | 67,576 | |
| | | | | |
| | 20,658 | | | Vodafone Group PLC | | | | | | | | | | | | | 58,571 | |
| | | | Total Wireless Telecommunication Services | | | | | | | | | | | | | 176,182 | |
| | | | Total Common Stocks (cost $5,182,041) | | | | | | | | | | | | | 5,681,214 | |
| | | | | |
| Shares | | | Description (1) | | | | | | | | | | Value | |
| | | | INVESTMENT COMPANIES – 2.3% | | | | | | | | | | | | | | |
| | | | | |
| | 2,493 | | | iShares MSCI EAFE Index Fund | | | | | | | | | | | | $ | 147,037 | |
| | | | Total Investment Companies (cost $129,939) | | | | | | | | | | | | | 147,037 | |
| | | | | |
Principal
Amount (000) | | | Description (1) | | Coupon | | | Maturity | | | | | Value | |
| | | | SHORT-TERM INVESTMENTS – 3.5% | | | | | | | | | | | | | | |
| | | | | |
| | | | Repurchase Agreements – 3.5% | | | | | | | | | | | | | | |
| | | | | |
| $ | 221 | | | Repurchase Agreement with State Street Bank, dated 3/28/13, repurchase price $220,677, collateralized by $220,000 U.S. Treasury Notes, 1.375%, due 11/30/15, value $227,065 | | | 0.010% | | | | 4/01/13 | | | | | $ | 220,676 | |
| | | | Total Short-Term Investments (cost $220,676) | | | | | | | | | | | | | 220,676 | |
| | | | Total Investments (cost $5,532,656) – 94.9% | | | | | | | | | | | | | 6,048,927 | |
| | | | Other Assets Less Liabilities – 5.1% | | | | | | | | | | | | | 324,515 | |
| | | | Net Assets – 100% | | | | | | | | | | | | $ | 6,373,442 | |
| | | | For Fund portfolio compliance purposes, the Fund’s industry classifications refer to any one or more of the industry sub-classifications used by one or more widely recognized market indexes or ratings group indexes, and/or as defined by Fund management. This definition may not apply for purposes of this report, which may combine industry sub-classifications into sectors for reporting ease. |
| | (1) | | All percentages shown in the Portfolio of Investments are based on net assets. |
| | (2) | | Non-income producing; issuer has not declared a dividend within the past twelve months. |
| | (3) | | For fair value measurement disclosure purposes, Common Stocks classified as Level 2. See Notes to Financial Statements, Footnote 1 – General Information and Significant Accounting Policies, Investment Valuation for more information. |
| | ADR | | American Depositary Receipt. |
See accompanying notes to financial statements.
Portfolio of Investments (Unaudited)
Nuveen Symphony Low Volatility Equity Fund
(formerly Nuveen Symphony Optimized Alpha Fund)
March 31, 2013
| | | | | | | | | | | | | | |
| Shares | | | Description (1) | | | | | | | | Value | |
| | | | | | | | | | | | | | |
| | | | COMMON STOCKS – 96.3% | | | | | | | | | | |
| | | | | |
| | | | Aerospace & Defense – 2.2% | | | | | | | | | | |
| | | | | |
| | 823 | | | Honeywell International Inc. | | | | | | | | $ | 62,013 | |
| | | | | |
| | 608 | | | United Technologies Corporation | | | | | | | | | 56,805 | |
| | | | Total Aerospace & Defense | | | | | | | | | 118,818 | |
| | | | Automobiles – 1.4% | | | | | | | | | | |
| | | | | |
| | 1,856 | | | General Motors Company | | | | | | | | | 51,634 | |
| | | | | |
| | 477 | | | Harley-Davidson, Inc. | | | | | | | | | 25,424 | |
| | | | Total Automobiles | | | | | | | | | 77,058 | |
| | | | Beverages – 1.0% | | | | | | | | | | |
| | | | | |
| | 1,273 | | | Coca-Cola Company | | | | | | | | | 51,480 | |
| | | | Biotechnology – 3.7% | | | | | | | | | | |
| | | | | |
| | 573 | | | Amgen Inc. | | | | | | | | | 58,738 | |
| | | | | |
| | 325 | | | Biogen Idec Inc., (2) | | | | | | | | | 62,696 | |
| | | | | |
| | 1,461 | | | Gilead Sciences, Inc., (2) | | | | | | | | | 71,487 | |
| | | | Total Biotechnology | | | | | | | | | 192,921 | |
| | | | Capital Markets – 0.6% | | | | | | | | | | |
| | | | | |
| | 405 | | | Ameriprise Financial, Inc. | | | | | | | | | 29,828 | |
| | | | Chemicals – 1.8% | | | | | | | | | | |
| | | | | |
| | 565 | | | Eastman Chemical Company | | | | | | | | | 39,477 | |
| | | | | |
| | 893 | | | LyondellBasell Industries NV | | | | | | | | | 56,518 | |
| | | | Total Chemicals | | | | | | | | | 95,995 | |
| | | | Commercial Banks – 5.1% | | | | | | | | | | |
| | | | | |
| | 766 | | | M&T Bank Corporation | | | | | | | | | 79,021 | |
| | | | | |
| | 664 | | | PNC Financial Services Group, Inc. | | | | | | | | | 44,156 | |
| | | | | |
| | 5,038 | | | Regions Financial Corporation | | | | | | | | | 41,261 | |
| | | | | |
| | 852 | | | SunTrust Banks, Inc. | | | | | | | | | 24,546 | |
| | | | | |
| | 2,274 | | | Wells Fargo & Company | | | | | | | | | 84,115 | |
| | | | Total Commercial Banks | | | | | | | | | 273,099 | |
| | | | Commercial Services & Supplies – 1.3% | | | | | | | | | | |
| | | | | |
| | 1,723 | | | Waste Management, Inc. | | | | | | | | | 67,559 | |
| | | | Communications Equipment – 2.0% | | | | | | | | | | |
| | | | | |
| | 2,361 | | | Cisco Systems, Inc. | | | | | | | | | 49,369 | |
| | | | | |
| | 877 | | | QUALCOMM, Inc. | | | | | | | | | 58,715 | |
| | | | Total Communications Equipment | | | | | | | | | 108,084 | |
| | | | Computers & Peripherals – 3.8% | | | | | | | | | | |
| | | | | |
| | 337 | | | Apple, Inc. | | | | | | | | | 149,166 | |
| | | | | |
| | 2,207 | | | EMC Corporation | | | | | | | | | 52,725 | |
| | | | Total Computers & Peripherals | | | | | | | | | 201,891 | |
| | | | Consumer Finance – 0.6% | | | | | | | | | | |
| | | | | |
| | 705 | | | Discover Financial Services | | | | | | | | | 31,612 | |
| | | | Diversified Financial Services – 1.5% | | | | | | | | | | |
| | | | | |
| | 1,647 | | | JPMorgan Chase & Co. | | | | | | | | | 78,167 | |
| | | | Diversified Telecommunication Services – 2.2% | | | | | | | | | | |
| | | | | |
| | 2,420 | | | Verizon Communications Inc. | | | | | | | | | 118,943 | |
| | | | | | | | | | | | | | |
| Shares | | | Description (1) | | | | | | | | Value | |
| | | | | | | | | | | | | | |
| | | | Electric Utilities – 1.3% | | | | | | | | | | |
| | | | | |
| | 1,705 | | | NV Energy Inc. | | | | | | | | $ | 34,151 | |
| | | | | |
| | 585 | | | Pinnacle West Capital Corporation | | | | | | | | | 33,866 | |
| | | | Total Electric Utilities | | | | | | | | | 68,017 | |
| | | | Food & Staples Retailing – 1.0% | | | | | | | | | | |
| | | | | |
| | 513 | | | Costco Wholesale Corporation | | | | | | | | | 54,434 | |
| | | | Food Products – 4.9% | | | | | | | | | | |
| | | | | |
| | 1,660 | | | ConAgra Foods, Inc. | | | | | | | | | 59,445 | |
| | | | | |
| | 1,109 | | | General Mills, Inc. | | | | | | | | | 54,685 | |
| | | | | |
| | 536 | | | Ingredion Inc. | | | | | | | | | 38,764 | |
| | | | | |
| | 612 | | | JM Smucker Company | | | | | | | | | 60,686 | |
| | | | | |
| | 1,541 | | | Mondelez International Inc. | | | | | | | | | 47,170 | |
| | | | Total Food Products | | | | | | | | | 260,750 | |
| | | | Health Care Equipment & Supplies – 3.0% | | | | | | | | | | |
| | | | | |
| | 565 | | | Abbott Laboratories | | | | | | | | | 19,956 | |
| | | | | |
| | 524 | | | Baxter International, Inc. | | | | | | | | | 38,063 | |
| | | | | |
| | 610 | | | Becton, Dickinson and Company | | | | | | | | | 58,322 | |
| | | | | |
| | 895 | | | Medtronic, Inc. | | | | | | | | | 42,029 | |
| | | | Total Health Care Equipment & Supplies | | | | | | | | | 158,370 | |
| | | | Health Care Providers & Services – 1.4% | | | | | | | | | | |
| | | | | |
| | 384 | | | HCA Holdings Inc. | | | | | | | | | 15,602 | |
| | | | | |
| | 534 | | | McKesson HBOC Inc. | | | | | | | | | 57,651 | |
| | | | Total Health Care Providers & Services | | | | | | | | | 73,253 | |
| | | | Hotels, Restaurants & Leisure – 1.2% | | | | | | | | | | |
| | | | | |
| | 1,116 | | | Starbucks Corporation | | | | | | | | | 63,567 | |
| | | | Household Durables – 1.3% | | | | | | | | | | |
| | | | | |
| | 695 | | | Lennar Corporation, Class A | | | | | | | | | 28,829 | |
| | | | | |
| | 1,866 | | | Pulte Corporation | | | | | | | | | 37,768 | |
| | | | Total Household Durables | | | | | | | | | 66,597 | |
| | | | Household Products – 1.2% | | | | | | | | | | |
| | | | | |
| | 861 | | | Procter & Gamble Company | | | | | | | | | 66,349 | |
| | | | Industrial Conglomerates – 2.1% | | | | | | | | | | |
| | | | | |
| | 4,715 | | | General Electric Company | | | | | | | | | 109,011 | |
| | | | Insurance – 4.0% | | | | | | | | | | |
| | | | | |
| | 369 | | | Everest Reinsurance Group Ltd | | | | | | | | | 47,918 | |
| | | | | |
| | 1,220 | | | Hartford Financial Services Group, Inc. | | | | | | | | | 31,476 | |
| | | | | |
| | 3,761 | | | Old Republic International Corporation | | | | | | | | | 47,802 | |
| | | | | |
| | 416 | | | PartnerRe Limited | | | | | | | | | 38,734 | |
| | | | | |
| | 782 | | | Torchmark Corporation | | | | | | | | | 46,764 | |
| | | | Total Insurance | | | | | | | | | 212,694 | |
| | | | Internet & Catalog Retail – 0.5% | | | | | | | | | | |
| | | | | |
| | 102 | | | Amazon.com, Inc. | | | | | | | | | 27,182 | |
| | | | Internet Software & Services – 2.1% | | | | | | | | | | |
| | | | | |
| | 455 | | | eBay Inc. | | | | | | | | | 24,670 | |
| | | | | |
| | 108 | | | Google Inc., Class A, (2) | | | | | | | | | 85,755 | |
| | | | Total Internet Software & Services | | | | | | | | | 110,425 | |
Portfolio of Investments (Unaudited)
Nuveen Symphony Low Volatility Equity Fund (continued)
March 31, 2013
| | | | | | | | | | | | | | |
| Shares | | | Description (1) | | | | | | | | Value | |
| | | | | | | | | | | | | | |
| | | | IT Services – 1.4% | | | | | | | | | | |
| | | | | |
| | 125 | | | International Business Machines Corporation (IBM) | | | | | | | | $ | 26,663 | |
| | | | | |
| | 46 | | | MasterCard, Inc. | | | | | | | | | 24,892 | |
| | | | | |
| | 150 | | | Visa Inc. | | | | | | | | | 25,476 | |
| | | | Total IT Services | | | | | | | | | 77,031 | |
| | | | Life Sciences Tools & Services – 1.1% | | | | | | | | | | |
| | | | | |
| | 286 | | | Agilent Technologies, Inc. | | | | | | | | | 12,003 | |
| | | | | |
| | 612 | | | Thermo Fisher Scientific, Inc. | | | | | | | | | 46,812 | |
| | | | Total Life Sciences Tools & Services | | | | | | | | | 58,815 | |
| | | | Machinery – 1.2% | | | | | | | | | | |
| | | | | |
| | 1,258 | | | Harsco Corporation | | | | | | | | | 31,161 | |
| | | | | |
| | 558 | | | Joy Global Inc. | | | | | | | | | 33,212 | |
| | | | Total Machinery | | | | | | | | | 64,373 | |
| | | | Media – 1.7% | | | | | | | | | | |
| | | | | |
| | 1,529 | | | Comcast Corporation, Class A | | | | | | | | | 64,233 | |
| | | | | |
| | 465 | | | Walt Disney Company | | | | | | | | | 26,412 | |
| | | | Total Media | | | | | | | | | 90,645 | |
| | | | Multiline Retail – 2.0% | | | | | | | | | | |
| | | | | |
| | 1,562 | | | Target Corporation | | | | | | | | | 106,919 | |
| | | | Multi-Utilities – 5.1% | | | | | | | | | | |
| | | | | |
| | 747 | | | Ameren Corporation | | | | | | | | | 26,160 | |
| | | | | |
| | 2,866 | | | CenterPoint Energy, Inc. | | | | | | | | | 68,669 | |
| | | | | |
| | 968 | | | Consolidated Edison, Inc. | | | | | | | | | 59,077 | |
| | | | | |
| | 612 | | | DTE Energy Company | | | | | | | | | 41,824 | |
| | | | | |
| | 2,127 | | | Public Service Enterprise Group Incorporated | | | | | | | | | 73,041 | |
| | | | Total Multi-Utilities | | | | | | | | | 268,771 | |
| | | | Oil, Gas & Consumable Fuels – 8.4% | | | | | | | | | | |
| | | | | |
| | 1,036 | | | Chevron Corporation | | | | | | | | | 123,098 | |
| | | | | |
| | 1,491 | | | Exxon Mobil Corporation | | | | | | | | | 134,354 | |
| | | | | |
| | 407 | | | Marathon Oil Corporation | | | | | | | | | 13,724 | |
| | | | | |
| | 737 | | | Marathon Petroleum Corporation | | | | | | | | | 66,035 | |
| | | | | |
| | 1,026 | | | Phillips 66 | | | | | | | | | 71,789 | |
| | | | | |
| | 314 | | | SM Energy Company | | | | | | | | | 18,595 | |
| | | | | |
| | 481 | | | Southwestern Energy Company | | | | | | | | | 17,922 | |
| | | | Total Oil Gas & Consumable Fuels | | | | | | | | | 445,517 | |
| | | | Paper & Forest Products – 1.0% | | | | | | | | | | |
| | | | | |
| | 1,118 | | | International Paper Company | | | | | | | | | 52,076 | |
| | | | Pharmaceuticals – 7.4% | | | | | | | | | | |
| | | | | |
| | 565 | | | AbbVie Inc. | | | | | | | | | 23,041 | |
| | | | | |
| | 1,281 | | | Actavis Inc. | | | | | | | | | 117,993 | |
| | | | | |
| | 2,244 | | | Johnson & Johnson | | | | | | | | | 182,953 | |
| | | | | |
| | 1,565 | | | Merck & Company Inc. | | | | | | | | | 69,220 | |
| | | | Total Pharmaceuticals | | | | | | | | | 393,207 | |
| | | | Real Estate Investment Trust – 2.9% | | | | | | | | | | |
| | | | | |
| | 1,930 | | | Omega Healthcare Investors Inc. | | | | | | | | | 58,595 | |
| | | | | |
| | 136 | | | Public Storage, Inc. | | | | | | | | | 20,716 | |
| | | | | |
| | 236 | | | Rayonier Inc. | | | | | | | | | 14,082 | |
| | | | | |
| | 396 | | | Simon Property Group, Inc. | | | | | | | | | 62,790 | |
| | | | Total Real Estate Investment Trust | | | | | | | | | 156,183 | |
| | | | | | | | | | | | | | | | | | |
| Shares | | | Description (1) | | | | | | | | | | Value | |
| | | | | | | | | | | | | | | | | | |
| | | | Real Estate Management & Development – 0.7% | | | | | | | | | | | | | | |
| | | | | |
| | 437 | | | Howard Hughes Corporation | | | | | | | | | | | | $ | 36,625 | |
| | | | Road & Rail – 1.7% | | | | | | | | | | | | | | |
| | | | | |
| | 654 | | | Norfolk Southern Corporation | | | | | | | | | | | | | 50,410 | |
| | | | | |
| | 298 | | | Union Pacific Corporation | | | | | | | | | | | | | 42,438 | |
| | | | Total Road & Rail | | | | | | | | | | | | | 92,848 | |
| | | | Semiconductors & Equipment – 1.9% | | | | | | | | | | | | | | |
| | | | | |
| | 702 | | | Broadcom Corporation, Class A | | | | | | | | | | | | | 24,338 | |
| | | | | |
| | 1,590 | | | Intel Corporation | | | | | | | | | | | | | 34,742 | |
| | | | | |
| | 1,071 | | | Linear Technology Corporation | | | | | | | | | | | | | 41,094 | |
| | | | Total Semiconductors & Equipment | | | | | | | | | | | | | 100,174 | |
| | | | Software – 5.0% | | | | | | | | | | | | | | |
| | | | | |
| | 436 | | | Citrix Systems | | | | | | | | | | | | | 31,462 | |
| | | | | |
| | 1,065 | | | Fortinet Inc. | | | | | | | | | | | | | 25,219 | |
| | | | | |
| | 4,819 | | | Microsoft Corporation | | | | | | | | | | | | | 137,872 | |
| | | | | |
| | 2,199 | | | Oracle Corporation | | | | | | | | | | | | | 71,116 | |
| | | | Total Software | | | | | | | | | | | | | 265,669 | |
| | | | Specialty Retail – 2.4% | | | | | | | | | | | | | | |
| | | | | |
| | 776 | | | Home Depot, Inc. | | | | | | | | | | | | | 54,149 | |
| | | | | |
| | 525 | | | PetSmart Inc. | | | | | | | | | | | | | 32,603 | |
| | | | | |
| | 386 | | | Signet Jewelers Limited | | | | | | | | | | | | | 25,862 | |
| | | | | |
| | 288 | | | Williams-Sonoma Inc. | | | | | | | | | | | | | 14,836 | |
| | | | Total Specialty Retail | | | | | | | | | | | | | 127,450 | |
| | | | Textiles, Apparel & Luxury Goods – 0.4% | | | | | | | | | | | | | | |
| | | | | |
| | 214 | | | PVH Corporation | | | | | | | | | | | | | 22,857 | |
| | | | Tobacco – 0.8% | | | | | �� | | | | | | | | | |
| | | | | |
| | 446 | | | Philip Morris International | | | | | | | | | | | | | 41,349 | |
| | | | Total Common Stocks (cost $4,341,758) | | | | | | | | | | | | | 5,116,613 | |
| | | | | |
Principal
Amount (000) | | | Description (1) | | Coupon | | | Maturity | | | | | Value | |
| | | | SHORT-TERM INVESTMENTS – 3.5% | | | | | | | | | | | | | | |
| | | | | |
| | | | Repurchase Agreements – 3.5% | | | | | | | | | | | | | | |
| | | | | |
| $ | 189 | | | Repurchase Agreement with State Street Bank, dated 3/28/13, repurchase price $188,716 collateralized by $190,000 U.S. Treasury Notes, 1.375%, due 11/30/15, value $196,102 | | | 0.010% | | | | 4/01/13 | | | | | $ | 188,715 | |
| | | | Total Short-Term Investments (cost $188,715) | | | | | | | | | | | | | 188,715 | |
| | | | Total Investments (cost $4,530,473) – 99.8% | | | | | | | | | | | | | 5,305,328 | |
| | | | Other Assets Less Liabilities – 0.2% | | | | | | | | | | | | | 11,271 | |
| | | | Net Assets – 100% | | | | | | | | | | | | $ | 5,316,599 | |
| | | | For Fund portfolio compliance purposes, the Fund’s industry classifications refer to any one or more of the industry sub-classifications used by one or more widely recognized market indexes or ratings group indexes, and/or as defined by Fund management. This definition may not apply for purposes of this report, which may combine industry sub-classifications into sectors for reporting ease. |
| | (1) | | All percentages shown in the Portfolio of Investments are based on net assets. |
| | (2) | | Non-income producing; issuer has not declared a dividend within the past twelve months. |
See accompanying notes to financial statements.
Statement of Assets and Liabilities (Unaudited)
March 31, 2013
| | | | | | | | | | | | | | | | |
| | | Symphony
Large-Cap
Growth | | | Symphony
Mid-Cap
Core | | | Symphony
International
Equity | | | Symphony
Low
Volatility
Equity | |
Assets | | | | | | | | | | | | | | | | |
Investments, at value (cost $98,687,311, $4,326,548, $5,532,656 and $4,530,473, respectively) | | $ | 108,781,381 | | | $ | 5,099,683 | | | $ | 6,048,927 | | | $ | 5,305,328 | |
Cash | | | 27,956 | | | | 97,910 | | | | 810 | | | | 2,101 | |
Cash denominated in foreign currencies
(cost $–, $–, $1,576 and $–, respectively) | | | — | | | | — | | | | 1,577 | | | | — | |
Receivables: | | | | | | | | | | | | | | | | |
Dividends | | | 83,878 | | | | 3,541 | | | | 23,923 | | | | 3,927 | |
From Adviser | | | — | | | | 6,106 | | | | 9,405 | | | | 6,227 | |
Investments sold | | | — | | | | 37,260 | | | | — | | | | — | |
Reclaims | | | — | | | | — | | | | 1,051 | | | | — | |
Shares sold | | | 690,962 | | | | 13,426 | | | | 350,905 | | | | 2,373 | |
Other assets | | | 59 | | | | 3,548 | | | | — | | | | — | |
Total assets | | | 109,584,236 | | | | 5,261,474 | | | | 6,436,598 | | | | 5,319,956 | |
Liabilities | | | | | | | | | | | | | | | | |
Payables: | | | | | | | | | | | | | | | | |
Investments purchased | | | 2,039,410 | | | | 41,408 | | | | 60,476 | | | | — | |
Shares redeemed | | | 204,083 | | | | 5,650 | | | | — | | | | 24 | |
Accrued expenses: | | | | | | | | | | | | | | | | |
Management fees | | | 52,001 | | | | — | | | | — | | | | — | |
Trustees fees | | | 876 | | | | 50 | | | | 57 | | | | 38 | |
12b-1 distribution and service fees | | | 27,910 | | | | 1,314 | | | | 162 | | | | 972 | |
Other | | | 40,643 | | | | — | | | | 2,461 | | | | 2,323 | |
Total liabilities | | | 2,364,923 | | | | 48,422 | | | | 63,156 | | | | 3,357 | |
Net assets | | $ | 107,219,313 | | | $ | 5,213,052 | | | $ | 6,373,442 | | | $ | 5,316,599 | |
Class A Shares | | | | | | | | | | | | | | | | |
Net assets | | $ | 54,423,211 | | | $ | 2,589,202 | | | $ | 86,537 | | | $ | 2,858,035 | |
Shares outstanding | | | 2,084,794 | | | | 92,577 | | | | 5,324 | | | | 120,443 | |
Net asset value per share | | $ | 26.10 | | | $ | 27.97 | | | $ | 16.25 | | | $ | 23.73 | |
Offering price per share (net asset value per share plus maximum sales charge of 5.75% of offering price) | | $ | 27.70 | | | $ | 29.68 | | | $ | 17.24 | | | $ | 25.18 | |
Class C Shares | | | | | | | | | | | | | | | | |
Net assets | | $ | 19,185,060 | | | $ | 714,245 | | | $ | 126,918 | | | $ | 475,394 | |
Shares outstanding | | | 767,393 | | | | 26,657 | | | | 7,882 | | | | 20,381 | |
Net asset value and offering price per share | | $ | 25.00 | | | $ | 26.79 | | | $ | 16.10 | | | $ | 23.33 | |
Class R3 Shares | | | | | | | | | | | | | | | | |
Net assets | | $ | 2,463,513 | | | $ | 389,193 | | | $ | 49,834 | | | | N/A | |
Shares outstanding | | | 94,328 | | | | 13,913 | | | | 3,058 | | | | N/A | |
Net asset value and offering price per share | | $ | 26.12 | | | $ | 27.97 | | | $ | 16.30 | | | | N/A | |
Class I Shares | | | | | | | | | | | | | | | | |
Net assets | | $ | 31,147,529 | | | $ | 1,520,412 | | | $ | 6,110,153 | | | $ | 1,983,170 | |
Shares outstanding | | | 1,180,062 | | | | 53,739 | | | | 376,082 | | | | 83,506 | |
Net asset value and offering price per share | | $ | 26.39 | | | $ | 28.29 | | | $ | 16.25 | | | $ | 23.75 | |
Net assets consist of: | | | | | | | | | | | | | | | | |
Capital paid-in | | $ | 99,035,446 | | | $ | 4,303,658 | | | $ | 6,196,309 | | | $ | 4,446,123 | |
Undistributed (Over-distribution of) net investment income | | | 186,878 | | | | 9,028 | | | | 25,833 | | | | 23,845 | |
Accumulated net realized gain (loss) | | | (2,097,081 | ) | | | 127,231 | | | | (365,057 | ) | | | 71,776 | |
Net unrealized appreciation (depreciation) | | | 10,094,070 | | | | 773,135 | | | | 516,357 | | | | 774,855 | |
Net assets | | $ | 107,219,313 | | | $ | 5,213,052 | | | $ | 6,373,442 | | | $ | 5,316,599 | |
Authorized shares – per class | | | Unlimited | | | | Unlimited | | | | Unlimited | | | | Unlimited | |
Par value per share | | $ | 0.01 | | | $ | 0.01 | | | $ | 0.01 | | | $ | 0.01 | |
| N/A | – Symphony Low Volatility Equity does not offer Class R3 Shares. |
See accompanying notes to financial statements.
Statement of Operations (Unaudited)
Six Months Ended March 31, 2013
| | | | | | | | | | | | | | | | |
| | | Symphony
Large-Cap
Growth | | | Symphony
Mid-Cap
Core | | | Symphony
International
Equity | | | Symphony
Low
Volatility
Equity | |
Investment Income | | $ | 1,151,495 | | | $ | 61,626 | | | $ | 71,841 | | | $ | 60,498 | |
Expenses | | | | | | | | | | | | | | | | |
Management fees | | | 289,075 | | | | 16,897 | | | | 20,599 | | | | 13,638 | |
12b-1 service fees – Class A | | | 54,916 | | | | 2,863 | | | | 131 | | | | 2,429 | |
12b-1 distribution and service fees – Class C | | | 74,993 | | | | 3,225 | | | | 684 | | | | 1,526 | |
12b-1 distribution and service fees – Class R3 | | | 5,887 | | | | 883 | | | | 136 | | | | N/A | |
Shareholders servicing agent fees and expenses | | | 45,849 | | | | 1,468 | | | | 275 | | | | 1,112 | |
Custodian fees and expenses | | | 12,145 | | | | 7,446 | | | | 26,120 | | | | 8,069 | |
Trustees fees and expenses | | | 2,082 | | | | 291 | | | | 300 | | | | 265 | |
Professional fees | | | 3,225 | | | | 4,388 | | | | 13,819 | | | | 5,403 | |
Shareholder reporting expenses | | | 36,156 | | | | 1,231 | | | | 4,534 | | | | 2,100 | |
Federal and state registration fees | | | 36,223 | | | | 24,930 | | | | 25,083 | | | | 20,212 | |
Other expenses | | | 3,380 | | | | 2,514 | | | | 2,467 | | | | 2,474 | |
Total expenses before fee waiver/expense reimbursement | | | 563,931 | | | | 66,136 | | | | 94,148 | | | | 57,228 | |
Fee waiver/expense reimbursement | | | (8,914 | ) | | | (32,849 | ) | | | (63,742 | ) | | | (33,504 | ) |
Net expenses | | | 555,017 | | | | 33,287 | | | | 30,406 | | | | 23,724 | |
Net investment income (loss) | | | 596,478 | | | | 28,339 | | | | 41,435 | | | | 36,774 | |
Realized and Unrealized Gain (Loss) | | | | | | | | | | | | | | | | |
Net realized gain (loss) from investments and foreign currency | | | (1,559,757 | ) | | | 216,157 | | | | 18,067 | | | | 80,734 | |
Change in net unrealized appreciation (depreciation) of investments and foreign currency | | | 5,725,581 | | | | 330,562 | | | | 414,789 | | | | 296,432 | |
Net realized and unrealized gain (loss) | | | 4,165,824 | | | | 546,719 | | | | 432,856 | | | | 377,166 | |
Net increase (decrease) in net assets from operations | | $ | 4,762,302 | | | $ | 575,058 | | | $ | 474,291 | | | $ | 413,940 | |
| N/A | – Symphony Low Volatility Equity does not offer Class R3 Shares. |
See accompanying notes to financial statements.
Statement of Changes in Net Assets (Unaudited)
| | | | | | | | | | | | | | | | |
| | | Symphony Large-Cap Growth | | | Symphony Mid-Cap Core | |
| | | Six Months Ended
3/31/2013 | | | Year Ended
9/30/12 | | | Six Months Ended
3/31/2013 | | | Year Ended
9/30/12 | |
Operations | | | | | | | | | | | | | | | | |
Net investment income (loss) | | $ | 596,478 | | | $ | 102,974 | | | $ | 28,339 | | | $ | 9,691 | |
Net realized gain (loss) from investments and foreign currency | | | (1,559,757 | ) | | | (222,369 | ) | | | 216,157 | | | | 101,623 | |
Change in net unrealized appreciation (depreciation) of
investments and foreign currency | | | 5,725,581 | | | | 3,849,534 | | | | 330,562 | | | | 580,300 | |
Net increase (decrease) in net assets from operations | | | 4,762,302 | | | | 3,730,139 | | | | 575,058 | | | | 691,614 | |
Distributions to Shareholders | | | | | | | | | | | | | | | | |
From net investment income: | | | | | | | | | | | | | | | | |
Class A | | | (405,181 | ) | | | — | | | | (16,667 | ) | | | — | |
Class C | | | (24,498 | ) | | | — | | | | (94 | ) | | | — | |
Class R3 | | | (14,970 | ) | | | — | | | | (1,741 | ) | | | — | |
Class I | | | (311,955 | ) | | | (195 | ) | | | (13,493 | ) | | | — | |
From accumulated net realized gains: | | | | | | | | | | | | | | | | |
Class A | | | — | | | | (259,547 | ) | | | — | | | | — | |
Class C | | | — | | | | (154,543 | ) | | | — | | | | — | |
Class R3 | | | — | | | | (7,057 | ) | | | — | | | | — | |
Class I | | | — | | | | (263,637 | ) | | | — | | | | — | |
Decrease in net assets from distributions to shareholders | | | (756,604 | ) | | | (684,979 | ) | | | (31,995 | ) | | | — | |
Fund Share Transactions | | | | | | | | | | | | | | | | |
Proceeds from sale of shares | | | 59,660,847 | | | | 62,774,983 | | | | 860,227 | | | | 2,323,044 | |
Proceeds from shares issued to shareholders due to reinvestment of distributions | | | 677,182 | | | | 530,191 | | | | 19,126 | | | | — | |
| | | 60,338,029 | | | | 63,305,174 | | | | 879,353 | | | | 2,323,044 | |
Cost of shares redeemed | | | (22,021,461 | ) | | | (7,406,131 | ) | | | (389,365 | ) | | | (1,665,010 | ) |
Net increase (decrease) in net assets from Fund share transactions | | | 38,316,568 | | | | 55,899,043 | | | | 489,988 | | | | 658,034 | |
Net increase (decrease) in net assets | | | 42,322,266 | | | | 58,944,203 | | | | 1,033,051 | | | | 1,349,648 | |
Net assets at the beginning of period | | | 64,897,047 | | | | 5,952,844 | | | | 4,180,001 | | | | 2,830,353 | |
Net assets at the end of period | | $ | 107,219,313 | | | $ | 64,897,047 | | | $ | 5,213,052 | | | $ | 4,180,001 | |
Undistributed (Over-distribution of) net investment income at
the end of period | | $ | 186,878 | | | $ | 347,004 | | | $ | 9,028 | | | $ | 12,684 | |
See accompanying notes to financial statements.
| | | | | | | | | | | | | | | | |
| | | Symphony International Equity | | | Symphony Low Volatility Equity | |
| | | Six Months Ended
3/31/2013 | | | Year Ended
9/30/12 | | | Six Months Ended
3/31/2013 | | | Year Ended
9/30/12 | |
Operations | | | | | | | | | | | | | | | | |
Net investment income (loss) | | $ | 41,435 | | | $ | 16,514 | | | $ | 36,774 | | | $ | 35,696 | |
Net realized gain (loss) from investments and foreign currency | | | 18,067 | | | | 8,999 | | | | 80,734 | | | | 243,885 | |
Change in net unrealized appreciation (depreciation) of
investments and foreign currency | | | 414,789 | | | | 117,052 | | | | 296,432 | | | | 271,036 | |
Net increase (decrease) in net assets from operations | | | 474,291 | | | | 142,565 | | | | 413,940 | | | | 550,617 | |
Distributions to Shareholders | | | | | | | | | | | | | | | | |
From net investment income: | | | | | | | | | | | | | | | | |
Class A | | | (380 | ) | | | (3,164 | ) | | | (22,092 | ) | | | (6,821 | ) |
Class C | | | — | | | | (1,962 | ) | | | (1,004 | ) | | | (704 | ) |
Class R3 | | | (65 | ) | | | (579 | ) | | | N/A | | | | (380 | ) |
Class I | | | (31,570 | ) | | | (6,342 | ) | | | (24,411 | ) | | | (13,082 | ) |
From accumulated net realized gains: | | | | | | | | | | | | | | | | |
Class A | | | — | | | | — | | | | (38,837 | ) | | | — | |
Class C | | | — | | | | — | | | | (5,450 | ) | | | — | |
Class R3 | | | — | | | | — | | | | N/A | | | | — | |
Class I | | | — | | | | — | | | | (35,712 | ) | | | — | |
Decrease in net assets from distributions to shareholders | | | (32,015 | ) | | | (12,047 | ) | | | (127,506 | ) | | | (20,987 | ) |
Fund Share Transactions | | | | | | | | | | | | | | | | |
Proceeds from sale of shares | | | 4,905,614 | | | | 520,286 | | | | 2,326,706 | | | | 1,185,112 | |
Proceeds from shares issued to shareholders due to reinvestment of distributions | | | 27,873 | | | | 1,699 | | | | 58,569 | | | | 11,219 | |
| | | 4,933,487 | | | | 521,985 | | | | 2,385,275 | | | | 1,196,331 | |
Cost of shares redeemed | | | (93,421 | ) | | | (524,635 | ) | | | (253,648 | ) | | | (1,042,352 | ) |
Net increase (decrease) in net assets from Fund share transactions | | | 4,840,066 | | | | (2,650 | ) | | | 2,131,627 | | | | 153,979 | |
Net increase (decrease) in net assets | | | 5,282,342 | | | | 127,868 | | | | 2,418,061 | | | | 683,609 | |
Net assets at the beginning of period | | | 1,091,100 | | | | 963,232 | | | | 2,898,538 | | | | 2,214,929 | |
Net assets at the end of period | | $ | 6,373,442 | | | $ | 1,091,100 | | | $ | 5,316,599 | | | $ | 2,898,538 | |
Undistributed (Over-distribution of) net investment income at
the end of period | | $ | 25,833 | | | $ | 16,413 | | | $ | 23,845 | | | $ | 34,578 | |
| N/A – | After the close of business on May 30, 2012, Symphony Low Volatility Equity liquidated all of its Class R3 Shares. |
See accompanying notes to financial statements.
Financial Highlights (Unaudited)
| | | | | | | | | | | | | | | | | | | | | | | | | | | | | | | | | | | | |
| Selected data for a share outstanding throughout each period: | | | | | | | | | | | | | | | | |
| | | | | | | |
| Class (Commencement Date) | | | | | | | | | | | | | | | | | | | | | | |
| | | | | | Investment Operations | | | Less Distributions | | | �� | |
| | | | | | | | |
SYMPHONY
LARGE-CAP GROWTH | | | | | | | | | | | | | | | | | | | | | | | | | |
| | | Beginning
Net
Asset
Value | | | Net
Invest-
ment
Income
(Loss)(a) | | | Net
Realized/
Unrealized
Gain
(Loss) | | | Total | | | From
Net
Invest-
ment
Income | | | From
Accum-
ulated
Net
Realized
Gains | | | Return
of
Capital | | | Total | | | Ending
Net
Asset
Value | |
Class A (12/06) | | | | | | | | | | | | | | | | | | | | | | | | | | | | | | | | | |
Year Ended 9/30: | | | | | | | | | | | | | | | | | | | | | | | | | | | | | | | | | |
2013(f) | | $ | 25.19 | | | $ | .18 | | | $ | .95 | | | $ | 1.13 | | | $ | (.22 | ) | | $ | — | | | $ | — | | | $ | (.22 | ) | | $ | 26.10 | |
2012 | | | 21.34 | | | | .12 | | | | 6.23 | | | | 6.35 | | | | — | | | | (2.50 | ) | | | — | | | | (2.50 | ) | | | 25.19 | |
2011 | | | 20.63 | | | | — | ** | | | .71 | | | | .71 | | | | — | | | | — | | | | — | | | | — | | | | 21.34 | |
2010 | | | 17.50 | | | | — | ** | | | 3.14 | | | | 3.14 | | | | (.01 | ) | | | — | | | | — | | | | (.01 | ) | | | 20.63 | |
2009(e) | | | 16.43 | | | | .01 | | | | 1.06 | | | | 1.07 | | | | — | | | | — | | | | — | | | | — | | | | 17.50 | |
Year Ended 7/31: | | | | | | | | | | | | | | | | | | | | | | | | | | | | | | | | | |
2009 | | | 20.57 | | | | .01 | | | | (4.15 | ) | | | (4.14 | ) | | | — | | | | — | | | | — | | | | — | | | | 16.43 | |
2008 | | | 20.78 | | | | (.07 | ) | | | (.04 | ) | | | (.11 | ) | | | — | | | | (.04 | ) | | | (.06 | ) | | | (.10 | ) | | | 20.57 | |
Class C (12/06) | | | | | | | | | | | | | | | | | | | | | | | | | | | | | | | | | |
Year Ended 9/30: | | | | | | | | | | | | | | | | | | | | | | | | | | | | | | | | | |
2013(f) | | | 24.03 | | | | .08 | | | | .93 | | | | 1.01 | | | | (.04 | ) | | | — | | | | — | | | | (.04 | ) | | | 25.00 | |
2012 | | | 20.61 | | | | (.05 | ) | | | 5.97 | | | | 5.92 | | | | — | | | | (2.50 | ) | | | — | | | | (2.50 | ) | | | 24.03 | |
2011 | | | 20.07 | | | | (.19 | ) | | | .73 | | | | .54 | | | | — | | | | — | | | | — | | | | — | | | | 20.61 | |
2010 | | | 17.15 | | | | (.17 | ) | | | 3.09 | | | | 2.92 | | | | — | | | | — | | | | — | | | | — | | | | 20.07 | |
2009(e) | | | 16.11 | | | | (.01 | ) | | | 1.05 | | | | 1.04 | | | | — | | | | — | | | | — | | | | — | | | | 17.15 | |
Year Ended 7/31: | | | | | | | | | | | | | | | | | | | | | | | | | | | | | | | | | |
2009 | | | 20.32 | | | | (.11 | ) | | | (4.10 | ) | | | (4.21 | ) | | | — | | | | — | | | | — | | | | — | | | | 16.11 | |
2008 | | | 20.68 | | | | (.22 | ) | | | (.04 | ) | | | (.26 | ) | | | — | | | | (.04 | ) | | | (.06 | ) | | | (.10 | ) | | | 20.32 | |
Class R3 (9/09) | | | | | | | | | | | | | | | | | | | | | | | | | | | | | | | | | |
Year Ended 9/30: | | | | | | | | | | | | | | | | | | | | | | | | | | | | | | | | | |
2013(f) | | | 25.17 | | | | .15 | | | | .96 | | | | 1.11 | | | | (.16 | ) | | | — | | | | — | | | | (.16 | ) | | | 26.12 | |
2012 | | | 21.38 | | | | .09 | | | | 6.20 | | | | 6.29 | | | | — | | | | (2.50 | ) | | | — | | | | (2.50 | ) | | | 25.17 | |
2011 | | | 20.72 | | | | (.07 | ) | | | .73 | | | | .66 | | | | — | | | | — | | | | — | | | | — | | | | 21.38 | |
2010 | | | 17.61 | | | | (.08 | ) | | | 3.19 | | | | 3.11 | | | | — | | | | — | | | | — | | | | — | | | | 20.72 | |
2009(d) | | | 17.69 | | | | — | ** | | | (.08 | ) | | | (.08 | ) | | | — | | | | — | | | | — | | | | — | | | | 17.61 | |
Class I (12/06) | | | | | | | | | | | | | | | | | | | | | | | | | | | | | | | | | |
Year Ended 9/30: | | | | | | | | | | | | | | | | | | | | | | | | | | | | | | | | | |
2013(f) | | | 25.50 | | | | .22 | | | | .96 | | | | 1.18 | | | | (.29 | ) | | | — | | | | — | | | | (.29 | ) | | | 26.39 | |
2012 | | | 21.53 | | | | .21 | | | | 6.26 | | | | 6.47 | | | | — | | | | (2.50 | ) | | | — | | | | (2.50 | ) | | | 25.50 | |
2011 | | | 20.77 | | | | .04 | | | | .72 | | | | .76 | | | | — | | | | — | | | | — | | | | — | | | | 21.53 | |
2010 | | | 17.62 | | | | .02 | | | | 3.18 | | | | 3.20 | | | | (.05 | ) | | | — | | | | — | | | | (.05 | ) | | | 20.77 | |
2009(e) | | | 16.53 | | | | .01 | | | | 1.08 | | | | 1.09 | | | | — | | | | — | | | | — | | | | — | | | | 17.62 | |
Year Ended 7/31: | | | | | | | | | | | | | | | | | | | | | | | | | | | | | | | | | |
2009 | | | 20.63 | | | | .05 | | | | (4.15 | ) | | | (4.10 | ) | | | — | | | | — | | | | — | | | | — | | | | 16.53 | |
2008 | | | 20.81 | | | | (.04 | ) | | | (.02 | ) | | | (.06 | ) | | | (.02 | ) | | | (.04 | ) | | | (.06 | ) | | | (.12 | ) | | | 20.63 | |
| | | | | | | | | | | | | | | | | | | | | | | | | | |
| | | | | | | | | | | | | | | | | | | | |
| | | | | | |
| | | | | | | | | | | | | | | | | | | | |
| Ratios/Supplemental Data | |
| | | | | | |
Ratios to Average
Net Assets Before
Waiver/Reimbursement | | | Ratios to Average
Net Assets After
Waiver/Reimbursement(c) | | | | |
Total
Return(b) | | |
Ending
Net
Assets
(000) | | | Expenses | | | Net
Invest-
ment
Income
(Loss) | | | Expenses | | | Net
Invest-
ment
Income
(Loss) | | | Portfolio
Turnover
Rate | |
| | | | | | | | | | | | | | | | | | | | | | | | | | |
| | | | | | | | | | | | | | | | | | | | | | | | | | |
| | 4.62 | % | | $ | 54,423 | | | | 1.24 | %* | | | 1.41 | %* | | | 1.22 | %* | | | 1.43 | %* | | | 63 | % |
| | 32.70 | | | | 36,680 | | | | 1.79 | | | | (.06 | ) | | | 1.22 | | | | .51 | | | | 106 | |
| | 3.44 | | | | 2,107 | | | | 2.36 | | | | (1.15 | ) | | | 1.23 | | | | (.02 | ) | | | 151 | |
| | 17.96 | | | | 1,063 | | | | 2.69 | | | | (1.40 | ) | | | 1.29 | | | | — | *** | | | 70 | |
| | 6.51 | | | | 236 | | | | 3.41 | * | | | (1.82 | )* | | | 1.35 | * | | | .25 | * | | | 10 | |
| | | | | | | | | | | | | | | | | | | | | | | | | | |
| | (20.13 | ) | | | 215 | | | | 1.94 | | | | (.52 | ) | | | 1.35 | | | | .06 | | | | 109 | |
| | (.55 | ) | | | 257 | | | | 3.14 | | | | (2.16 | ) | | | 1.33 | | | | (.35 | ) | | | 110 | |
| | | | | | | | | | | | | | | | | | | | | | | | | | |
| | | | | | | | | | | | | | | | | | | | | | | | | | |
| | 4.22 | | | | 19,185 | | | | 1.99 | * | | | .62 | * | | | 1.97 | * | | | .64 | * | | | 63 | |
| | 31.68 | | | | 11,841 | | | | 2.57 | | | | (.82 | ) | | | 1.97 | | | | (.22 | ) | | | 106 | |
| | 2.69 | | | | 1,326 | | | | 3.18 | | | | (2.01 | ) | | | 1.98 | | | | (.80 | ) | | | 151 | |
| | 17.03 | | | | 367 | | | | 3.43 | | | | (2.26 | ) | | | 2.06 | | | | (.89 | ) | | | 70 | |
| | 6.46 | | | | 661 | | | | 4.13 | * | | | (2.53 | )* | | | 2.09 | * | | | (.50 | )* | | | 10 | |
| | | | | | | | | | | | | | | | | | | | | | | | | | |
| | (20.72 | ) | | | 621 | | | | 2.84 | | | | (1.49 | ) | | | 2.10 | | | | (.75 | ) | | | 109 | |
| | (1.28 | ) | | | 254 | | | | 3.89 | | | | (2.91 | ) | | | 2.09 | | | | (1.11 | ) | | | 110 | |
| | | | | | | | | | | | | | | | | | | | | | | | | | |
| | | | | | | | | | | | | | | | | | | | | | | | | | |
| | 4.48 | | | | 2,464 | | | | 1.49 | * | | | 1.19 | * | | | 1.47 | * | | | 1.21 | * | | | 63 | |
| | 32.32 | | | | 2,372 | | | | 1.99 | | | | (.14 | ) | | | 1.47 | | | | .38 | | | | 106 | |
| | 3.19 | | | | 60 | | | | 2.67 | | | | (1.50 | ) | | | 1.48 | | | | (.31 | ) | | | 151 | |
| | 17.66 | | | | 59 | | | | 3.05 | | | | (1.90 | ) | | | 1.56 | | | | (.41 | ) | | | 70 | |
| | (.45 | ) | | | 50 | | | | 2.11 | * | | | (2.11 | )* | | | 1.59 | * | | | (1.59 | )* | | | 10 | |
| | | | | | | | | | | | | | | | | | | | | | | | | | |
| | | | | | | | | | | | | | | | | | | | | | | | | | |
| | 4.76 | | | | 31,148 | | | | .99 | * | | | 1.71 | * | | | .97 | * | | | 1.74 | * | | | 63 | |
| | 33.00 | | | | 14,004 | | | | 1.61 | | | | .25 | | | | .97 | | | | .89 | | | | 106 | |
| | 3.66 | | | | 2,460 | | | | 2.26 | | | | (1.11 | ) | | | .98 | | | | .16 | | | | 151 | |
| | 18.19 | | | | 7,080 | | | | 2.57 | | | | (1.42 | ) | | | 1.06 | | | | .09 | | | | 70 | |
| | 6.59 | | | | 5,831 | | | | 3.12 | * | | | (1.51 | )* | | | 1.09 | * | | | .51 | * | | | 10 | |
| | | | | | | | | | | | | | | | | | | | | | | | | | |
| | (19.91 | ) | | | 5,709 | | | | 1.68 | | | | (.27 | ) | | | 1.10 | | | | .31 | | | | 109 | |
| | (.28 | ) | | | 3,011 | | | | 2.40 | | | | (1.56 | ) | | | 1.09 | | | | (.25 | ) | | | 110 | |
| (a) | Per share Net Investment Income (Loss) is calculated using the average daily shares method. |
| (b) | Total return is the combination of changes in net asset value without any sales charge, reinvested dividend income at net asset value and reinvested capital gains distributions at net asset value, if any. Total returns are not annualized. |
| (c) | After fee waiver and/or expense reimbursement from the Adviser, where applicable. |
| (d) | For the period September 29, 2009 (commencement of operations) through September 30, 2009. |
| (e) | For the two months ended September 30, 2009. |
| (f) | For the six months ended March 31, 2013. |
| ** | Rounds to less than $.01 per share. |
| *** | Rounds to less than .01%. |
See accompanying notes to financial statements.
Financial Highlights (Unaudited) (continued)
| | | | | | | | | | | | | | | | | | | | | | | | | | | | | | | | |
| Selected data for a share outstanding throughout each period: | |
| | | | | | |
| Class (Commencement Date) | | | | | | | | | | | | | | | | | | | |
| | | | | | Investment Operations | | | Less Distributions | | | | |
| | | | | | |
| SYMPHONY MID-CAP CORE | | | | | | | | | | | | | | | | | | | |
| | | Beginning
Net
Asset
Value | | | Net
Invest-
ment
Income
Loss(a) | | | Net
Realized/
Unrealized
Gain
(Loss) | | | Total | | | From
Net
Invest-
ment
Income | | | From
Accum-
ulated
Net
Realized
Gains | | | Total | | | Ending
Net
Asset
Value | |
Class A (5/06) | | | | | | | | | | | | | | | | | | | | | | | | | | | | | |
Year Ended 9/30: | | | | | | | | | | | | | | | | | | | | | | | | | | | | | |
2013(f) | | $ | 25.06 | | | $ | .16 | | | $ | 2.94 | | | $ | 3.10 | | | $ | (.19 | ) | | $ | — | | | $ | (.19 | ) | | $ | 27.97 | |
2012 | | | 19.95 | | | | .09 | | | | 5.02 | | | | 5.11 | | | | — | | | | — | | | | — | | | | 25.06 | |
2011 | | | 20.54 | | | | .01 | | | | (.60 | ) | | | (.59 | ) | | | — | | | | — | | | | — | | | | 19.95 | |
2010 | | | 17.29 | | | | — | ** | | | 3.28 | | | | 3.28 | | | | (.03 | ) | | | — | | | | (.03 | ) | | | 20.54 | |
2009(e) | | | 15.87 | | | | .01 | | | | 1.41 | | | | 1.42 | | | | — | | | | — | | | | — | | | | 17.29 | |
Year Ended 7/31: | | | | | | | | | | | | | | | | | | | | | | | | | | | | | |
2009 | | | 20.84 | | | | .02 | | | | (4.99 | ) | | | (4.97 | ) | | | — | | | | — | | | | — | | | | 15.87 | |
2008 | | | 22.44 | | | | (.08 | ) | | | (.11 | ) | | | (.19 | ) | | | — | | | | (1.41 | ) | | | (1.41 | ) | | | 20.84 | |
Class C (5/06) | | | | | | | | | | | | | | | | | | | | | | | | | | | | | |
Year Ended 9/30: | | | | | | | | | | | | | | | | | | | | | | | | | | | | | |
2013(f) | | | 23.92 | | | | .06 | | | | 2.81 | | | | 2.87 | | | | — | ** | | | — | | | | — | ** | | | 26.79 | |
2012 | | | 19.18 | | | | (.12 | ) | | | 4.86 | | | | 4.74 | | | | — | | | | — | | | | — | | | | 23.92 | |
2011 | | | 19.90 | | | | (.17 | ) | | | (.55 | ) | | | (.72 | ) | | | — | | | | — | | | | — | | | | 19.18 | |
2010 | | | 16.85 | | | | (.13 | ) | | | 3.18 | | | | 3.05 | | | | — | | | | — | | | | — | | | | 19.90 | |
2009(e) | | | 15.49 | | | | (.01 | ) | | | 1.37 | | | | 1.36 | | | | — | | | | — | | | | — | | | | 16.85 | |
Year Ended 7/31: | | | | | | | | | | | | | | | | | | | | | | | | | | | | | |
2009 | | | 20.50 | | | | (.09 | ) | | | (4.92 | ) | | | (5.01 | ) | | | — | | | | — | | | | — | | | | 15.49 | |
2008 | | | 22.25 | | | | (.24 | ) | | | (.10 | ) | | | (.34 | ) | | | — | | | | (1.41 | ) | | | (1.41 | ) | | | 20.50 | |
Class R3 (5/09) | | | | | | | | | | | | | | | | | | | | | | | | | | | | | |
Year Ended 9/30: | | | | | | | | | | | | | | | | | | | | | | | | | | | | | |
2013(f) | | | 25.04 | | | | .12 | | | | 2.94 | | | | 3.06 | | | | (.13 | ) | | | — | | | | (.13 | ) | | | 27.97 | |
2012 | | | 19.98 | | | | .02 | | | | 5.04 | | | | 5.06 | | | | — | | | | — | | | | — | | | | 25.04 | |
2011 | | | 20.62 | | | | (.07 | ) | | | (.57 | ) | | | (.64 | ) | | | — | | | | — | | | | — | | | | 19.98 | |
2010 | | | 17.37 | | | | (.05 | ) | | | 3.30 | | | | 3.25 | | | | — | | | | — | | | | — | | | | 20.62 | |
2009(e) | | | 15.95 | | | | .01 | | | | 1.41 | | | | 1.42 | | | | — | | | | — | | | | — | | | | 17.37 | |
Year Ended 7/31: | | | | | | | | | | | | | | | | | | | | | | | | | | | | | |
2009(d) | | | 14.73 | | | | (.02 | ) | | | 1.24 | | | | 1.22 | | | | — | | | | — | | | | — | | | | 15.95 | |
Class I (5/06) | | | | | | | | | | | | | | | | | | | | | | | | | | | | | |
Year Ended 9/30: | | | | | | | | | | | | | | | | | | | | | | | | | | | | | |
2013(f) | | | 25.39 | | | | .19 | | | | 2.96 | | | | 3.15 | | | | (.25 | ) | | | — | | | | (.25 | ) | | | 28.29 | |
2012 | | | 20.15 | | | | .23 | | | | 5.01 | | | | 5.24 | | | | — | | | | — | | | | — | | | | 25.39 | |
2011 | | | 20.70 | | | | .06 | | | | (.61 | ) | | | (.55 | ) | | | — | | | | — | | | | — | | | | 20.15 | |
2010 | | | 17.41 | | | | .05 | | | | 3.30 | | | | 3.35 | | | | (.06 | ) | | | — | | | | (.06 | ) | | | 20.70 | |
2009(e) | | | 15.98 | | | | .02 | | | | 1.41 | | | | 1.43 | | | | — | | | | — | | | | — | | | | 17.41 | |
Year Ended 7/31: | | | | | | | | | | | | | | | | | | | | | | | | | | | | | |
2009 | | | 20.93 | | | | .06 | | | | (5.01 | ) | | | (4.95 | ) | | | — | | | | — | | | | — | | | | 15.98 | |
2008 | | | 22.47 | | | | (.02 | ) | | | (.11 | ) | | | (.13 | ) | | | — | | | | (1.41 | ) | | | (1.41 | ) | | | 20.93 | |
| | | | | | | | | | | | | | | | | | | | | | | | | | |
| | | | | | | | | | | | | | | | | | | | |
| | | | | | |
| | | | | | | | | | | | | | | | | | | | |
| Ratios/Supplemental Data | |
| | | | | | |
Ratios to Average
Net Assets Before
Waiver/Reimbursement | | | Ratios to Average
Net Assets After
Waiver/Reimbursement(c) | | | | |
Total
Return(b) | | | Ending
Net
Assets
(000) | | | Expenses | | | Net
Invest-
ment
Income
(Loss) | | | Expenses | | | Net
Invest-
ment
Income
(Loss) | | | Portfolio
Turnover
Rate | |
| | | | | | | | | | | | | | | | | | | | | | | | | | |
| | | | | | | | | | | | | | | | | | | | | | | | | | |
| | 12.42 | % | | $ | 2,589 | | | | 2.77 | %* | | | (.13 | )%* | | | 1.37 | %* | | | 1.27 | %* | | | 99 | % |
| | 25.66 | | | | 2,026 | | | | 4.06 | | | | (2.33 | ) | | | 1.37 | | | | .36 | | | | 138 | |
| | (2.87 | ) | | | 1,591 | | | | 4.57 | | | | (3.17 | ) | | | 1.38 | | | | .02 | | | | 93 | |
| | 18.96 | | | | 339 | | | | 13.18 | | | | (11.79 | ) | | | 1.39 | | | | .01 | | | | 82 | |
| | 8.95 | | | | 233 | | | | 12.75 | * | | | (10.81 | )* | | | 1.40 | * | | | .54 | * | | | 17 | |
| | | | | | | | | | | | | | | | | | | | | | | | | | |
| | (23.85 | ) | | | 214 | | | | 9.20 | | | | (7.72 | ) | | | 1.40 | | | | .08 | | | | 118 | |
| | (.95 | ) | | | 261 | | | | 3.08 | | | | (2.14 | ) | | | 1.38 | | | | (.44 | ) | | | 99 | |
| | | | | | | | | | | | | | | | | | | | | | | | | | |
| | | | | | | | | | | | | | | | | | | | | | | | | | |
| | 11.97 | | | | 714 | | | | 3.52 | * | | | (.91 | )* | | | 2.12 | * | | | .49 | * | | | 99 | |
| | 24.77 | | | | 548 | | | | 4.92 | | | | (3.34 | ) | | | 2.12 | | | | (.54 | ) | | | 138 | |
| | (3.62 | ) | | | 674 | | | | 5.46 | | | | (4.08 | ) | | | 2.13 | | | | (.75 | ) | | | 93 | |
| | 18.10 | | | | 314 | | | | 13.95 | | | | (12.55 | ) | | | 2.14 | | | | (.74 | ) | | | 82 | |
| | 8.78 | | | | 211 | | | | 13.49 | * | | | (11.56 | )* | | | 2.14 | * | | | (.21 | )* | | | 17 | |
| | | | | | | | | | | | | | | | | | | | | | | | | | |
| | (24.44 | ) | | | 194 | | | | 9.73 | | | | (8.24 | ) | | | 2.15 | | | | (.66 | ) | | | 118 | |
| | (1.66 | ) | | | 256 | | | | 3.83 | | | | (2.89 | ) | | | 2.14 | | | | (1.20 | ) | | | 99 | |
| | | | | | | | | | | | | | | | | | | | | | | | | | |
| | | | | | | | | | | | | | | | | | | | | | | | | | |
| | 12.23 | | | | 389 | | | | 3.03 | * | | | (.44 | )* | | | 1.62 | * | | | .97 | * | | | 99 | |
| | 25.38 | | | | 272 | | | | 4.33 | | | | (2.60 | ) | | | 1.62 | | | | .10 | | | | 138 | |
| | (3.10 | ) | | | 207 | | | | 5.38 | | | | (4.04 | ) | | | 1.63 | | | | (.28 | ) | | | 93 | |
| | 18.71 | | | | 210 | | | | 13.64 | | | | (12.26 | ) | | | 1.64 | | | | (.25 | ) | | | 82 | |
| | 8.83 | | | | 177 | | | | 13.00 | * | | | (11.06 | )* | | | 1.64 | * | | | .29 | * | | | 17 | |
| | | | | | | | | | | | | | | | | | | | | | | | | | |
| | 8.35 | | | | 162 | | | | 23.32 | * | | | (22.36 | )* | | | 1.65 | * | | | (.69 | )* | | | 118 | |
| | | | | | | | | | | | | | | | | | | | | | | | | | |
| | | | | | | | | | | | | | | | | | | | | | | | | | |
| | 12.55 | | | | 1,520 | | | | 2.50 | * | | | .10 | * | | | 1.12 | * | | | 1.49 | * | | | 99 | |
| | 26.00 | | | | 1,334 | | | | 3.37 | | | | (1.28 | ) | | | 1.12 | | | | .97 | | | | 138 | |
| | (2.66 | ) | | | 358 | | | | 4.86 | | | | (3.49 | ) | | | 1.13 | | | | .23 | | | | 93 | |
| | 19.30 | | | | 302 | | | | 13.20 | | | | (11.82 | ) | | | 1.14 | | | | .25 | | | | 82 | |
| | 8.95 | | | | 262 | | | | 12.56 | * | | | (10.63 | )* | | | 1.14 | * | | | .79 | * | | | 17 | |
| | | | | | | | | | | | | | | | | | | | | | | | | | |
| | (23.65 | ) | | | 233 | | | | 7.20 | | | | (5.66 | ) | | | 1.15 | | | | .40 | | | | 118 | |
| | (.68 | ) | | | 518 | | | | 2.83 | | | | (1.89 | ) | | | 1.14 | | | | (.19 | ) | | | 99 | |
| (a) | Per share Net Investment Income (Loss) is calculated using the average daily shares method. |
| (b) | Total return is the combination of changes in net asset value without any sales charge, reinvested dividend income at net asset value and reinvested capital gains distributions at net asset value, if any. Total returns are not annualized. |
| (c) | After fee waiver and/or expense reimbursement from the Adviser, where applicable. |
| (d) | For the period May 5, 2009 (commencement of operations) through July 31, 2009. |
| (e) | For the two months ended September 30, 2009. |
| (f) | For the six months ended March 31, 2013. |
| ** | Rounds to less than $.01 per share. |
See accompanying notes to financial statements.
Financial Highlights (Unaudited) (continued)
| | | | | | | | | | | | | | | | | | | | | | | | | | | | | | | | |
| Selected data for a share outstanding throughout each period: | |
| | | | | | |
| Class (Commencement Date) | | | | | | | | | | | | | | | | | | | |
| | | | | | Investment Operations | | | Less Distributions | | | | |
| | | | | | | |
SYMPHONY
INTERNATIONAL EQUITY | | | | | | | | | | | | | | | | | | | | | | |
| | | Beginning
Net
Asset
Value | | | Net
Invest-
ment
Income
(Loss)(a) | | | Net
Realized/
Unrealized
Gain
(Loss) | | | Total | | | From
Net
Invest-
ment
Income | | | From
Accum-
ulated
Net
Realized
Gains | | | Total | | | Ending
Net
Asset
Value | |
Class A (5/08) | | | | | | | | | | | | | | | | | | | | | | | | | | | | | |
Year Ended 9/30: | | | | | | | | | | | | | | | | | | | | | | | | | | | | | |
2013(g) | | $ | 14.97 | | | $ | .09 | | | $ | 1.25 | | | $ | 1.34 | | | $ | (.06 | ) | | $ | — | | | $ | (.06 | ) | | $ | 16.25 | |
2012 | | | 12.97 | | | | .23 | | | | 1.98 | | | | 2.21 | | | | (.21 | ) | | | — | | | | (.21 | ) | | | 14.97 | |
2011 | | | 14.44 | | | | .22 | | | | (1.45 | ) | | | (1.23 | ) | | | (.24 | ) | | | — | | | | (.24 | ) | | | 12.97 | |
2010 | | | 13.98 | | | | .19 | | | | .53 | | | | .72 | | | | (.26 | ) | | | — | | | | (.26 | ) | | | 14.44 | |
2009(e) | | | 12.81 | | | | .01 | | | | 1.16 | | | | 1.17 | | | | — | | | | — | | | | — | | | | 13.98 | |
Year Ended 7/31: | | | | | | | | | | | | | | | | | | | | | | | | | | | | | |
2009 | | | 17.52 | | | | .24 | | | | (4.93 | ) | | | (4.69 | ) | | | (.02 | ) | | | — | | | | (.02 | ) | | | 12.81 | |
2008(d) | | | 20.00 | | | | — | ** | | | (2.48 | ) | | | (2.48 | ) | | | — | | | | — | | | | — | | | | 17.52 | |
Class C (5/08) | | | | | | | | | | | | | | | | | | | | | | | | | | | | | |
Year Ended 9/30: | | | | | | | | | | | | | | | | | | | | | | | | | | | | | |
2013(g) | | | 14.83 | | | | .03 | | | | 1.24 | | | | 1.27 | | | | — | | | | — | | | | — | | | | 16.10 | |
2012 | | | 12.84 | | | | .10 | | | | 1.98 | | | | 2.08 | | | | (.09 | ) | | | — | | | | (.09 | ) | | | 14.83 | |
2011 | | | 14.31 | | | | .11 | | | | (1.45 | ) | | | (1.34 | ) | | | (.13 | ) | | | — | | | | (.13 | ) | | | 12.84 | |
2010 | | | 13.87 | | | | .10 | | | | .51 | | | | .61 | | | | (.17 | ) | | | — | | | | (.17 | ) | | | 14.31 | |
2009(e) | | | 12.73 | | | | (.01 | ) | | | 1.15 | | | | 1.14 | | | | — | | | | — | | | | — | | | | 13.87 | |
Year Ended 7/31: | | | | | | | | | | | | | | | | | | | | | | | | | | | | | |
2009 | | | 17.49 | | | | .15 | | | | (4.91 | ) | | | (4.76 | ) | | | — | | | | — | | | | — | | | | 12.73 | |
2008(d) | | | 20.00 | | | | (.03 | ) | | | (2.48 | ) | | | (2.51 | ) | | | — | | | | — | | | | — | | | | 17.49 | |
Class R3 (10/10) | | | | | | | | | | | | | | | | | | | | | | | | | | | | | |
Year Ended 9/30: | | | | | | | | | | | | | | | | | | | | | | | | | | | | | |
2013(g) | | | 14.99 | | | | .07 | | | | 1.26 | | | | 1.33 | | | | (.02 | ) | | | — | | | | (.02 | ) | | | 16.30 | |
2012 | | | 12.98 | | | | .21 | | | | 1.97 | | | | 2.18 | | | | (.17 | ) | | | — | | | | (.17 | ) | | | 14.99 | |
2011(f) | | | 14.50 | | | | .18 | | | | (1.50 | ) | | | (1.32 | ) | | | (.20 | ) | | | — | | | | (.20 | ) | | | 12.98 | |
Class I (5/08) | | | | | | | | | | | | | | | | | | | | | | | | | | | | | |
Year Ended 9/30: | | | | | | | | | | | | | | | | | | | | | | | | | | | | | |
2013(g) | | | 14.98 | | | | .13 | | | | 1.23 | | | | 1.36 | | | | (.09 | ) | | | — | | | | (.09 | ) | | | 16.25 | |
2012 | | | 12.98 | | | | .30 | | | | 1.94 | | | | 2.24 | | | | (.24 | ) | | | — | | | | (.24 | ) | | | 14.98 | |
2011 | | | 14.45 | | | | .26 | | | | (1.46 | ) | | | (1.20 | ) | | | (.27 | ) | | | — | | | | (.27 | ) | | | 12.98 | |
2010 | | | 13.98 | | | | .25 | | | | .51 | | | | .76 | | | | (.29 | ) | | | — | | | | (.29 | ) | | | 14.45 | |
2009(e) | | | 12.81 | | | | .02 | | | | 1.15 | | | | 1.17 | | | | — | | | | — | | | | — | | | | 13.98 | |
Year Ended 7/31: | | | | | | | | | | | | | | | | | | | | | | | | | | | | | |
2009 | | | 17.52 | | | | .28 | | | | (4.93 | ) | | | (4.65 | ) | | | (.06 | ) | | | — | | | | (.06 | ) | | | 12.81 | |
2008(d) | | | 20.00 | | | | .01 | | | | (2.49 | ) | | | (2.48 | ) | | | — | | | | — | | | | — | | | | 17.52 | |
| | | | | | | | | | | | | | | | | | | | | | | | | | |
| | | | | | | | | | | | | | | | | | | | |
| | | | | | |
| | | | | | | | | | | | | | | | | | | | |
| Ratios/Supplemental Data | |
| | | | | | |
Ratios to Average
Net Assets Before
Waiver/Reimbursement | | | Ratios to Average
Net Assets After
Waiver/Reimbursement(c) | | | | |
Total
Return(b) | | | Ending
Net
Assets
(000) | | | Expenses | | |
Net
Invest-
ment
Income
(Loss) | | | Expenses | | | Net
Invest-
ment
Income
(Loss) | | | Portfolio
Turnover
Rate | |
| | | | | | | | | | | | | | | | | | | | | | | | | | |
| | | | | | | | | | | | | | | | | | | | | | | | | | |
| | 8.94 | % | | $ | 87 | | | | 3.82 | %* | | | (1.38 | )%* | | | 1.35 | %* | | | 1.09 | %* | | | 12 | % |
| | 17.07 | | | | 110 | | | | 9.39 | | | | (6.43 | ) | | | 1.35 | | | | 1.60 | | | | 22 | |
| | (8.70 | ) | | | 270 | | | | 10.20 | | | | (7.43 | ) | | | 1.36 | | | | 1.41 | | | | 34 | |
| | 5.20 | | | | 231 | | | | 12.44 | | | | (9.70 | ) | | | 1.37 | | | | 1.38 | | | | 100 | |
| | 9.13 | | | | 175 | | | | 11.44 | * | | | (9.62 | )* | | | 1.37 | * | | | .45 | * | | | 2 | |
| | | | | | | | | | | | | | | | | | | | | | | | | | |
| | (26.76 | ) | | | 160 | | | | 8.42 | | | | (4.87 | ) | | | 1.38 | | | | 2.17 | | | | 117 | |
| | (12.40 | ) | | | 219 | | | | 11.09 | * | | | (9.84 | )* | | | 1.37 | * | | | (.11 | )* | | | 6 | |
| | | | | | | | | | | | | | | | | | | | | | | | | | |
| | | | | | | | | | | | | | | | | | | | | | | | | | |
| | 8.56 | | | | 127 | | | | 4.59 | * | | | (2.10 | )* | | | 2.10 | * | | | .39 | * | | | 12 | |
| | 16.18 | | | | 137 | | | | 9.68 | | | | (6.85 | ) | | | 2.10 | | | | .73 | | | | 22 | |
| | (9.41 | ) | | | 314 | | | | 10.94 | | | | (8.08 | ) | | | 2.11 | | | | .75 | | | | 34 | |
| | 4.43 | | | | 179 | | | | 13.21 | | | | (10.36 | ) | | | 2.12 | | | | .73 | | | | 100 | |
| | 8.96 | | | | 173 | | | | 12.20 | * | | | (10.37 | )* | | | 2.13 | * | | | (.30 | )* | | | 2 | |
| | | | | | | | | | | | | | | | | | | | | | | | | | |
| | (27.22 | ) | | | 159 | | | | 13.74 | | | | (10.36 | ) | | | 2.13 | | | | 1.25 | | | | 117 | |
| | (12.55 | ) | | | 219 | | | | 11.84 | * | | | (10.59 | )* | | | 2.13 | * | | | (.87 | )* | | | 6 | |
| | | | | | | | | | | | | | | | | | | | | | | | | | |
| | | | | | | | | | | | | | | | | | | | | | | | | | |
| | 8.80 | | | | 50 | | | | 4.10 | * | | | (1.59 | )* | | | 1.60 | * | | | .91 | * | | | 12 | |
| | 16.81 | | | | 52 | | | | 8.17 | | | | (5.10 | ) | | | 1.60 | | | | 1.47 | | | | 22 | |
| | (9.22 | ) | | | 45 | | | | 10.54 | * | | | (7.76 | )* | | | 1.61 | * | | | 1.17 | * | | | 34 | |
| | | | | | | | | | | | | | | | | | | | | | | | | | |
| | | | | | | | | | | | | | | | | | | | | | | | | | |
| | 9.12 | | | | 6,110 | | | | 3.47 | * | | | (.78 | )* | | | 1.10 | * | | | 1.59 | * | | | 12 | |
| | 17.38 | | | | 793 | | | | 6.35 | | | | (3.17 | ) | | | 1.10 | | | | 2.07 | | | | 22 | |
| | (8.49 | ) | | | 335 | | | | 10.00 | | | | (7.23 | ) | | | 1.11 | | | | 1.66 | | | | 34 | |
| | 5.50 | | | | 405 | | | | 12.10 | | | | (9.16 | ) | | | 1.12 | | | | 1.82 | | | | 100 | |
| | 9.13 | | | | 520 | | | | 11.19 | * | | | (9.36 | )* | | | 1.12 | * | | | .70 | * | | | 2 | |
| | | | | | | | | | | | | | | | | | | | | | | | | | |
| | (26.52 | ) | | | 476 | | | | 13.45 | | | | (9.93 | ) | | | 1.13 | | | | 2.39 | | | | 117 | |
| | (12.40 | ) | | | 438 | | | | 10.84 | * | | | (9.59 | )* | | | 1.11 | * | | | .14 | * | | | 6 | |
| (a) | Per share Net Investment Income (Loss) is calculated using the average daily shares method. |
| (b) | Total return is the combination of changes in net asset value without any sales charge, reinvested dividend income at net asset value and reinvested capital gains distributions at net asset value, if any. Total returns are not annualized. |
| (c) | After fee waiver and/or expense reimbursement from the Adviser, where applicable. |
| (d) | For the period May 30, 2008 (commencement of operations) through July 31, 2008. |
| (e) | For the two months ended September 30, 2009. |
| (f) | For the period October 5, 2010 (commencement of operations) through September 30, 2011. |
| (g) | For the six months ended March 31, 2013. |
| ** | Rounds to less than $.01 per share. |
See accompanying notes to financial statements.
Financial Highlights (Unaudited) (continued)
| | | | | | | | | | | | | | | | | | | | | | | | | | | | | | | | |
| Selected data for a share outstanding throughout each period: | |
| | | | | | |
| Class (Commencement Date) | | | | | | | | | | | | | | | | | | | |
| | | | | | Investment Operations | | | Less Distributions | | | | |
| | | | | | |
| SYMPHONY LOW VOLATILITY EQUITY | | | | | | | | | | | | | | | | | | | |
| | | Beginning
Net
Asset
Value | | | Net
Invest-
ment
Income
(Loss)(a) | | | Net
Realized/
Unrealized
Gain
(Loss) | | | Total | | | From
Net
Invest-
ment
Income | | | From
Accum-
ulated
Net
Realized
Gains | | | Total | | | Ending
Net
Asset
Value | |
Class A (9/07) | | | | | | | | | | | | | | | | | | | | | | | | | | | | | |
Year Ended 9/30: | | | | | | | | | | | | | | | | | | | | | | | | | | | | | |
2013(f) | | $ | 22.43 | | | $ | .20 | | | $ | 1.77 | | | $ | 1.97 | | | $ | (.24 | ) | | $ | (.43 | ) | | $ | (.67 | ) | | $ | 23.73 | |
2012 | | | 17.94 | | | | .29 | | | | 4.38 | | | | 4.67 | | | | (.18 | ) | | | — | | | | (.18 | ) | | | 22.43 | |
2011 | | | 17.40 | | | | .20 | | | | .45 | | | | .65 | | | | (.11 | ) | | | — | | | | (.11 | ) | | | 17.94 | |
2010 | | | 15.33 | | | | .05 | | | | 2.05 | | | | 2.10 | | | | (.03 | ) | | | — | | | | (.03 | ) | | | 17.40 | |
2009(e) | | | 14.61 | | | | .01 | | | | .71 | | | | .72 | | | | — | | | | — | | | | — | | | | 15.33 | |
Year Ended 7/31: | | | | | | | | | | | | | | | | | | | | | | | | | | | | | |
2009 | | | 18.27 | | | | .09 | | | | (3.70 | ) | | | (3.61 | ) | | | (.04 | ) | | | (.01 | ) | | | (.05 | ) | | | 14.61 | |
2008(d) | | | 20.00 | | | | .01 | | | | (1.74 | ) | | | (1.73 | ) | | | — | | | | — | | | | — | | | | 18.27 | |
Class C (9/07) | | | | | | | | | | | | | | | | | | | | | | | | | | | | | |
Year Ended 9/30: | | | | | | | | | | | | | | | | | | | | | | | | | | | | | |
2013(f) | | | 21.98 | | | | .10 | | | | 1.76 | | | | 1.86 | | | | (.08 | ) | | | (.43 | ) | | | (.51 | ) | | | 23.33 | |
2012 | | | 17.58 | | | | .13 | | | | 4.30 | | | | 4.43 | | | | (.03 | ) | | | — | | | | (.03 | ) | | | 21.98 | |
2011 | | | 17.08 | | | | .05 | | | | .45 | | | | .50 | | | | — | | | | — | | | | — | | | | 17.58 | |
2010 | | | 15.14 | | | | (.08 | ) | | | 2.02 | | | | 1.94 | | | | — | | | | — | | | | — | | | | 17.08 | |
2009(e) | | | 14.45 | | | | (.01 | ) | | | .70 | | | | .69 | | | | — | | | | — | | | | — | | | | 15.14 | |
Year Ended 7/31: | | | | | | | | | | | | | | | | | | | | | | | | | | | | | |
2009 | | | 18.16 | | | | (.01 | ) | | | (3.69 | ) | | | (3.70 | ) | | | — | | | | (.01 | ) | | | (.01 | ) | | | 14.45 | |
2008(d) | | | 20.00 | | | | (.11 | ) | | | (1.73 | ) | | | (1.84 | ) | | | — | | | | — | | | | — | | | | 18.16 | |
Class I (9/07) | | | | | | | | | | | | | | | | | | | | | | | | | | | | | |
Year Ended 9/30: | | | | | | | | | | | | | | | | | | | | | | | | | | | | | |
2013(f) | | | 22.48 | | | | .22 | | | | 1.77 | | | | 1.99 | | | | (.29 | ) | | | (.43 | ) | | | (.72 | ) | | | 23.75 | |
2012 | | | 17.97 | | | | .36 | | | | 4.38 | | | | 4.74 | | | | (.23 | ) | | | — | | | | (.23 | ) | | | 22.48 | |
2011 | | | 17.43 | | | | .23 | | | | .46 | | | | .69 | | | | (.15 | ) | | | — | | | | (.15 | ) | | | 17.97 | |
2010 | | | 15.35 | | | | .09 | | | | 2.05 | | | | 2.14 | | | | (.06 | ) | | | — | | | | (.06 | ) | | | 17.43 | |
2009(e) | | | 14.63 | | | | .02 | | | | .70 | | | | .72 | | | | — | | | | — | | | | — | | | | 15.35 | |
Year Ended 7/31: | | | | | | | | | | | | | | | | | | | | | | | | | | | | | |
2009 | | | 18.30 | | | | .12 | | | | (3.70 | ) | | | (3.58 | ) | | | (.08 | ) | | | (.01 | ) | | | (.09 | ) | | | 14.63 | |
2008(d) | | | 20.00 | | | | .05 | | | | (1.75 | ) | | | (1.70 | ) | | | — | | | | — | | | | — | | | | 18.30 | |
| | | | | | | | | | | | | | | | | | | | | | | | | | |
| | | | | | | | | | | | | | | | | | | | | | | | | | |
| | | | | | |
| | | | | | | | | | | | | | | | | | | | |
| Ratios/Supplemental Data | |
| | | | | | |
Ratios to Average
Net Assets Before
Waiver/Reimbursement | | | Ratios to Average
Net Assets After
Waiver/Reimbursement(c) | | | | |
Total
Return(b) | | |
Ending
Net
Assets
(000) | | | Expenses | | | Net
Invest-
ment
Income
(Loss) | | | Expenses | | | Net
Invest-
ment
Income
(Loss) | | | Portfolio
Turnover
Rate | |
| | | | | | | | | | | | | | | | | | | | | | | | | | |
| | | | | | | | | | | | | | | | | | | | | | | | | | |
| | 9.15 | % | | $ | 2,858 | | | | 2.82 | %* | | | .20 | %* | | | 1.22 | %* | | | 1.80 | %* | | | 45 | % |
| | 26.17 | | | | 877 | | | | 4.02 | | | | (1.38 | ) | | | 1.23 | | | | 1.42 | | | | 85 | |
| | 3.69 | | | | 702 | | | | 5.79 | | | | (3.55 | ) | | | 1.23 | | | | 1.02 | | | | 80 | |
| | 13.69 | | | | 376 | | | | 5.10 | | | | (3.42 | ) | | | 1.39 | | | | .30 | | | | 59 | |
| | 4.93 | | | | 310 | | | | 6.48 | * | | | (4.65 | )* | | | 1.44 | * | | | .39 | * | | | 7 | |
| | | | | | | | | | | | | | | | | | | | | | | | | | |
| | (19.73 | ) | | | 277 | | | | 7.32 | | | | (5.22 | ) | | | 1.45 | | | | .65 | | | | 89 | |
| | (8.65 | ) | | | 278 | | | | 4.47 | * | | | (3.02 | )* | | | 1.43 | * | | | .02 | * | | | 88 | |
| | | | | | | | | | | | | | | | | | | | | | | | | | |
| | | | | | | | | | | | | | | | | | | | | | | | | | |
| | 8.73 | | | | 475 | | | | 3.64 | * | | | (.80 | )* | | | 1.97 | * | | | .88 | * | | | 45 | |
| | 25.24 | | | | 170 | | | | 5.56 | | | | (2.94 | ) | | | 1.98 | | | | .64 | | | | 85 | |
| | 2.93 | | | | 363 | | | | 6.72 | | | | (4.50 | ) | | | 1.98 | | | | .25 | | | | 80 | |
| | 12.81 | | | | 221 | | | | 5.80 | | | | (4.16 | ) | | | 2.14 | | | | (.51 | ) | | | 59 | |
| | 4.78 | | | | 296 | | | | 7.18 | * | | | (5.38 | )* | | | 2.20 | * | | | (.39 | )* | | | 7 | |
| | | | | | | | | | | | | | | | | | | | | | | | | | |
| | (20.35 | ) | | | 282 | | | | 8.30 | | | | (6.19 | ) | | | 2.20 | | | | (.08 | ) | | | 89 | |
| | (9.20 | ) | | | 227 | | | | 5.17 | * | | | (3.72 | )* | | | 2.19 | * | | | (.74 | )* | | | 88 | |
| | | | | | | | | | | | | | | | | | | | | | | | | | |
| | | | | | | | | | | | | | | | | | | | | | | | | | |
| | 9.27 | | | | 1,983 | | | | 2.64 | * | | | .28 | * | | | .97 | * | | | 1.95 | * | | | 45 | |
| | 26.56 | | | | 1,852 | | | | 3.29 | | | | (.60 | ) | | | .98 | | | | 1.71 | | | | 85 | |
| | 3.91 | | | | 1,099 | | | | 5.56 | | | | (3.39 | ) | | | .98 | | | | 1.19 | | | | 80 | |
| | 13.97 | | | | 1,835 | | | | 4.77 | | | | (3.11 | ) | | | 1.14 | | | | .51 | | | | 59 | |
| | 4.92 | | | | 2,177 | | | | 6.18 | * | | | (4.38 | )* | | | 1.19 | * | | | .61 | * | | | 7 | |
| | | | | | | | | | | | | | | | | | | | | | | | | | |
| | (19.49 | ) | | | 2,077 | | | | 7.14 | | | | (5.10 | ) | | | 1.20 | | | | .84 | | | | 89 | |
| | (8.50 | ) | | | 1,763 | | | | 4.52 | * | | | (3.03 | )* | | | 1.19 | * | | | .30 | * | | | 88 | |
| (a) | Per share Net Investment Income (Loss) is calculated using the average daily shares method. |
| (b) | Total return is the combination of changes in net asset value without any sales charge, reinvested dividend income at net asset value and reinvested capital gains distributions at net asset value, if any. Total returns are not annualized. |
| (c) | After fee waiver and/or expense reimbursement from the Adviser, where applicable. |
| (d) | For the period September 28, 2007 (commencement of operations) through July 31, 2008. |
| (e) | For the two months ended September 30, 2009. |
| (f) | For the six months ended March 31, 2013. |
See accompanying notes to financial statements.
Notes to Financial Statements (Unaudited)
1. General Information and Significant Accounting Policies
General Information
The Nuveen Investment Trust II (the “Trust”) is an open-end management investment company registered under the Investment Company Act of 1940, as amended. The Trust is comprised of Nuveen Symphony Large-Cap Growth Fund (“Symphony Large-Cap Growth”), Nuveen Symphony Mid-Cap Core Fund (“Symphony Mid-Cap Core”), Nuveen Symphony International Equity Fund (“Symphony International Equity”) and Nuveen Symphony Low Volatility Equity Fund (“Symphony Low Volatility Equity”) formerly Nuveen Symphony Optimized Alpha Fund (each a “Fund” and collectively, the “Funds”), as diversified funds, among others. The Trust was organized as a Massachusetts business trust in 1997.
On December 31, 2012, the Funds’ investment adviser converted from a Delaware corporation to a Delaware limited liability company. As a result, Nuveen Fund Advisors, Inc., a wholly-owned subsidiary of Nuveen Investments, Inc. (“Nuveen”), changed its name to Nuveen Fund Advisors, LLC (the “Adviser”). There were no changes to the identities or roles of any personnel as a result of the change.
Symphony Large-Cap Growth’s investment objective is to seek long-term capital appreciation. Under normal market conditions, the Fund invests at least 80% of its net assets (plus the amount of any borrowings for investment purposes) in equity securities of companies with market capitalizations at the time of investment comparable to companies in the Russell 1000® Growth Index.
Symphony Mid-Cap Core’s investment objective is to seek long-term capital appreciation. Under normal market conditions, the Fund invests at least 80% of its net assets (plus the amount of any borrowings for investment purposes) in equity securities of companies with market capitalizations at the time of investment comparable to companies in the Russell Midcap® Index.
Symphony International Equity’s investment objective is to seek long-term capital appreciation. Under normal market conditions, the Fund invests at least 80% of its net assets in non-U.S. equity securities. The Fund primarily invests in developed countries, but it may invest up to 15% of its net assets in equity securities of companies located in emerging market countries.
Symphony Low Volatility Equity’s investment objective is to seek long-term capital appreciation with lower absolute volatility than the broad equity market. Under normal market conditions, the Fund invests at least 80% of its net assets in equity securities of companies with varying market capitalizations. After the close of business on May 30, 2012, the Fund liquidated all shareholder accounts invested in Class R3 Shares and distributed the proceeds of the liquidation.
Effective May 31, 2013 (subsequent to the close of this reporting period), the Nuveen Symphony Optimized Alpha Fund will be renamed the Nuveen Symphony Low Volatility Equity Fund.
The Funds’ most recent prospectus provides further description of each Fund’s investment objective, principal investment strategies, and principal risks.
Significant Accounting Policies
The following is a summary of significant accounting policies followed by the Funds in the preparation of their financial statements in accordance with accounting principles generally accepted in the United States (“U.S. GAAP”).
Investment Valuation
Common stocks and other equity-type securities are valued at the last sales price on the securities exchange on which such securities are primarily traded and are generally classified as Level 1 for fair value measurement purposes. Securities primarily traded on the NASDAQ National Market (“NASDAQ”) are valued, except as indicated below, at the NASDAQ Official Closing Price and are generally classified as Level 1. However, securities traded on a securities exchange or NASDAQ for which there were no transactions on a given day or securities not listed on a securities exchange or NASDAQ are valued at the quoted bid price and are generally classified as Level 2. Prices of certain American Depositary Receipts (“ADR”) held by the Fund that trade in the United States are valued based on the last traded price, official closing price, or the most recent bid price of the underlying non-U.S.-traded stock, adjusted as appropriate for the underlying-to-ADR conversion ratio and foreign exchange rate, and from time-to-time may also be adjusted further to take into account material events that may take place after the close of the local non-U.S. market but before the close of the New York Stock Exchange (“NYSE”), which may represent a transfer from a Level 1 to a Level 2 security.
Investments in investment companies are valued at their respective net asset values on the valuation date. These investment vehicles are generally classified as Level 1.
Investments initially valued in currencies other than the U.S. dollar are converted to the U.S. dollar using exchange rates obtained from pricing services. As a result, the net asset value (“NAV”) of the Funds’ shares may be affected by changes in the value of currencies in relation to the U.S. dollar. The value of securities traded in markets outside the United States or denominated in currencies other than the U.S. dollar may be affected significantly on a day that the NYSE is closed and an investor is not able to purchase, redeem or exchange shares. If significant market events occur between the time of determination of the closing price of a foreign security on an exchange and the time that the Funds’ NAV is determined, or if under the Funds’ procedures, the closing price of a foreign security is not deemed to be reliable, the security would be valued at fair value as determined in accordance with procedures established in
good faith by the Funds’ Board of Trustees. These securities are generally classified as Level 2 or Level 3 depending on the priority of the significant inputs.
Repurchase agreements are valued at contract amount plus accrued interest, which approximates market value. These securities are generally classified as Level 2.
Certain securities may not be able to be priced by the pre-established pricing methods as described above. Such securities may be valued by the Funds’ Board of Trustees or its designee at fair value. These securities generally include, but are not limited to, restricted securities (securities which may not be publicly sold without registration under the Securities Act of 1933, as amended) for which a pricing service is unable to provide a market price; securities whose trading has been formally suspended; debt securities that have gone into default and for which there is no current market quotation; a security whose market price is not available from a pre-established pricing source; a security with respect to which an event has occurred that is likely to materially affect the value of the security after the market has closed but before the calculation of a Fund’s net asset value (as may be the case in non-U.S. markets on which the security is primarily traded) or make it difficult or impossible to obtain a reliable market quotation; and a security whose price, as provided by the pricing service, is not deemed to reflect the security’s fair value. As a general principle, the fair value of a security would appear to be the amount that the owner might reasonably expect to receive for it in a current sale. A variety of factors may be considered in determining the fair value of such securities, which may include consideration of the following: yields or prices of investments of comparable quality, type of issue, coupon, maturity and rating, market quotes or indications of value from security dealers, evaluations of anticipated cash flows or collateral, general market conditions and other information and analysis, including the obligor’s credit characteristics considered relevant. These securities are generally classified as Level 2 or Level 3 depending on the priority of the significant inputs. Regardless of the method employed to value a particular security, all valuations are subject to review by the Funds’ Board of Trustees or its designee.
Refer to Footnote 2 – Fair Value Measurements for further details on the leveling of securities held by the Funds as of the end of the reporting period.
Investment Transactions
Investment transactions are recorded on a trade date basis. Realized gains and losses from investment transactions are determined on the specific identification method, which is the same basis used for federal income tax purposes.
Investment Income
Dividend income is recorded on the ex-dividend date or, for foreign securities, when information is available. Interest income is recorded on an accrual basis.
Professional Fees
Professional fees presented on the Statement of Operations consist of legal fees incurred in the normal course of operations, audit fees, tax consulting fees and, in some cases, workout expenditures. Workout expenditures are incurred in an attempt to protect or enhance an investment, or to pursue other claims or legal actions on behalf of Fund shareholders. Legal fee refund presented on the Statement of Operations reflects a refund of workout expenditures paid in a prior reporting period, when applicable.
Income Taxes
Each Fund is a separate taxpayer for federal income tax purposes. Each Fund intends to distribute substantially all of its net investment income and net capital gains to shareholders and to otherwise comply with the requirements of Subchapter M of the Internal Revenue Code applicable to regulated investment companies. Therefore, no federal income tax provision is required.
For all open tax years and all major taxing jurisdictions, management of the Funds has concluded that there are no significant uncertain tax positions that would require recognition in the financial statements. Open tax years are those that are open for examination by taxing authorities (i.e., generally the last four tax year ends and the interim tax period since then). Furthermore, management of the Funds is also not aware of any tax positions for which it is reasonably possible that the total amounts of unrecognized tax benefits will significantly change in the next twelve months.
Dividends and Distributions to Shareholders
Dividends from net investment income and net realized capital gains from investment transactions, if any, are declared and distributed to shareholders at least annually. Furthermore, capital gains are distributed only to the extent they exceed available capital loss carryforwards.
Distributions to shareholders are recorded on the ex-dividend date. The amount and timing of distributions are determined in accordance with federal income tax regulations, which may differ from U.S. GAAP.
Share Classes and Sales Charges
Class A Shares are generally sold with an up-front sales charge and incur a .25% annual 12b-1 service fee. Class A Share purchases of $1 million or more are sold at net asset value without an up-front sales charge but may be subject to a contingent deferred sales charge (“CDSC”) if redeemed within twelve months of purchase. Class C Shares are sold without an up-front sales charge but incur a .75% annual 12b-1 distribution fee and a .25% annual 12b-1 service fee. Class C Shares are subject to a CDSC of 1% if redeemed
Notes to Financial Statements (Unaudited) (continued)
within twelve months of purchase. Class R3 Shares are sold without an up-front sales charge but incur a .25% annual 12b-1 distribution fee and a .25% annual 12b-1 service fee. Class I Shares are not subject to any sales charge or 12b-1 distribution or service fees.
Foreign Currency Transactions
Each Fund is authorized to engage in foreign currency exchange transactions, including forward foreign currency exchange, futures, options and swap contracts. To the extent that the Funds invest in securities and/or contracts that are denominated in a currency other than U.S. dollars, the Funds will be subject to currency risk, which is the risk that an increase in the U.S. dollar relative to the foreign currency will reduce returns or portfolio value. Generally, when the U.S. dollar rises in value against a foreign currency, the Funds’ investments denominated in that currency will lose value because its currency is worth fewer U.S. dollars; the opposite effect occurs if the U.S. dollar falls in relative value. Investments and other assets and liabilities denominated in foreign currencies are converted into U.S. dollars on a spot (i.e. cash) basis at the spot rate prevailing in the foreign currency exchange market at the time of valuation. Purchases and sales of investments and income denominated in foreign currencies are translated into U.S. dollars on the respective dates of such transactions.
The books and records of the Funds are maintained in U.S. dollars. Foreign currencies, assets and liabilities are translated into U.S. dollars at 4:00 p.m. Eastern Time. Investment transactions, income and expenses are translated on the respective dates of such transactions. Net realized foreign currency gains and losses resulting from changes in exchange rates include foreign currency gains and losses between trade date and settlement date of the transactions, foreign currency transactions, and the difference between the amounts of interest and dividends recorded on the books of a Fund and the amounts actually received.
The realized gains and losses resulting from changes in foreign currency exchange rates and changes in foreign exchange rates associated with other assets and liabilities on investments are recognized as a component of “Net realized gain (loss) from investments and foreign currency“ on the Statement of Operations, when applicable.
The unrealized gains and losses resulting from changes in foreign currency exchange rates and changes in foreign exchange rates associated with other assets and liabilities on investments are recognized as a component of “Change in net unrealized appreciation (depreciation) of investments and foreign currency“ on the Statement of Operations, when applicable.
Derivative Financial Instruments
Each Fund is authorized to invest in certain derivative instruments, including futures, options and swap contracts. Although the Funds are authorized to invest in such derivative instruments, and may do so in the future, they did not make any such investments during the six months ended March 31, 2013.
Repurchase Agreements
In connection with transactions in repurchase agreements, it is each Fund’s policy that its custodian take possession of the underlying collateral securities, the fair value of which exceeds the principal amount of the repurchase transaction, including accrued interest, at all times. If the counterparty defaults, and the fair value of the collateral declines, realization of the collateral may be delayed or limited.
Multiclass Operations and Allocations
Income and expenses of the Funds that are not directly attributable to a specific class of shares are prorated among the classes based on the relative net assets of each class. Expenses directly attributable to a class of shares, which presently only include 12b-1 distribution and service fees, are recorded to the specific class.
Realized and unrealized capital gains and losses of the Funds are prorated among the classes based on the relative net assets of each class.
Indemnifications
Under the Trust’s organizational documents, its officers and trustees are indemnified against certain liabilities arising out of the performance of their duties to the Trust. In addition, in the normal course of business, the Trust enters into contracts that provide general indemnifications to other parties. The Trust’s maximum exposure under these arrangements is unknown as this would involve future claims that may be made against the Trust that have not yet occurred. However, the Trust has not had prior claims or losses pursuant to these contracts and expects the risk of loss to be remote.
Use of Estimates
The preparation of financial statements in conformity with U.S. GAAP requires management to make estimates and assumptions that affect the reported amounts of assets and liabilities at the date of the financial statements and the reported amounts of increases and decreases in net assets from operations during the reporting period. Actual results may differ from those estimates.
2. Fair Value Measurements
Fair value is defined as the price that the Funds would receive upon selling an investment or transferring a liability in an orderly transaction to an independent buyer in the principal or most advantageous market for the investment. A three-tier hierarchy is used to maximize the use of observable market data and minimize the use of unobservable inputs and to establish classification of fair value measurements for disclosure purposes. Observable inputs reflect the assumptions market participants would use in pricing the asset or liability. Observable inputs are based on market data obtained from sources independent of the reporting entity. Unobservable
inputs reflect the reporting entity’s own assumptions about the assumptions market participants would use in pricing the asset or liability. Unobservable inputs are based on the best information available in the circumstances. The following is a summary of the three-tiered hierarchy of valuation input levels.
| | |
| Level 1 – | | Inputs are unadjusted and prices are determined using quoted prices in active markets for identical securities. |
| Level 2 – | | Prices are determined using other significant observable inputs (including quoted prices for similar securities, interest rates, prepayment speeds, credit risk, etc.). |
| Level 3 – | | Prices are determined using significant unobservable inputs (including management’s assumptions in determining the fair value of investments). |
The inputs or methodologies used for valuing securities are not an indication of the risks associated with investing in those securities. The following is a summary of each Fund’s fair value measurements as of the end of the reporting period:
| | | | | | | | | | | | | | | | |
| Symphony Large-Cap Growth | | Level 1 | | | Level 2 | | | Level 3 | | | Total | |
Long-Term Investments*: | | | | | | | | | | | | | | | | |
Common Stocks | | $ | 105,551,542 | | | $ | — | | | $ | — | | | $ | 105,551,542 | |
Short-Term Investments: | | | | | | | | | | | | | | | | |
Repurchase Agreements | | | — | | | | 3,229,839 | | | | — | | | | 3,229,839 | |
Total | | $ | 105,551,542 | | | $ | 3,229,839 | | | $ | — | | | $ | 108,781,381 | |
| | | | |
| Symphony Mid-Cap Core | | Level 1 | | | Level 2 | | | Level 3 | | | Total | |
Long-Term Investments*: | | | | | | | | | | | | | | | | |
Common Stocks | | $ | 5,009,683 | | | $ | — | | | $ | — | | | $ | 5,009,683 | |
| | | | |
| Symphony International Equity | | Level 1 | | | Level 2 | | | Level 3 | | | Total | |
Long-Term Investments*: | | | | | | | | | | | | | | | | |
Common Stocks | | $ | 5,636,829 | | | $ | 44,385 | | | $ | — | | | $ | 5,681,214 | |
Investment Companies | | | 147,037 | | | | — | | | | — | | | | 147,037 | |
Short-Term Investments: | | | | | | | | | | | | | | | | |
Repurchase Agreements | | | — | | | | 220,676 | | | | — | | | | 220,676 | |
Total | | $ | 5,783,866 | | | $ | 265,061 | | | $ | — | | | $ | 6,048,927 | |
| | | | |
| Symphony Low Volatility Equity | | Level 1 | | | Level 2 | | | Level 3 | | | Total | |
Long-Term Investments*: | | | | | | | | | | | | | | | | |
Common Stocks | | $ | 5,116,613 | | | $ | — | | | $ | — | | | $ | 5,116,613 | |
Short-Term Investments: | | | | | | | | | | | | | | | | |
Repurchase Agreements | | | — | | | | 188,715 | | | | — | | | | 188,715 | |
Total | | $ | 5,116,613 | | | $ | 188,715 | | | $ | — | | | $ | 5,305,328 | |
| * | Refer to the Fund’s Portfolio of Investments for industry classifications and breakdown of Common Stocks classified as Level 2. |
The Nuveen funds’ Board of Directors/Trustees is responsible for the valuation process and has delegated the oversight of the daily valuation process to the Adviser’s Valuation Committee. The Valuation Committee, pursuant to the valuation policies and procedures adopted by the Board of Directors/Trustees, is responsible for making fair value determinations, evaluating the effectiveness of the funds’ pricing policies and reporting to the Board of Directors/Trustees. The Valuation Committee is aided in its efforts by the Adviser’s dedicated Securities Valuation Team, which is responsible for administering the daily valuation process and applying fair value methodologies as approved by the Valuation Committee. When determining the reliability of independent pricing services for investments owned by the funds, the Valuation Committee, among other things, conducts due diligence reviews of the pricing services and monitors the quality of security prices received through various testing reports conducted by the Securities Valuation Team.
The Valuation Committee will consider pricing methodologies it deems relevant and appropriate when making fair value determinations. Examples of possible methodologies include, but are not limited to, multiple of earnings; discount from market of a similar freely traded security; discounted cash-flow analysis; book value or a multiple thereof; risk premium/yield analysis; yield to maturity; and/or fundamental investment analysis. The Valuation Committee will also consider factors it deems relevant and appropriate in light of the facts and circumstances. Examples of possible factors include, but are not limited to, the type of security; the issuer’s financial statements; the purchase price of the security; the discount from market value of unrestricted securities of the same class at the time of purchase; analysts’ research and observations from financial institutions; information regarding any transactions or offers with respect to the security; the existence of merger proposals or tender offers affecting the security; the price and extent of public trading in similar securities of the issuer or comparable companies; and the existence of a shelf registration for restricted securities.
Notes to Financial Statements (Unaudited) (continued)
For each portfolio security that has been fair valued pursuant to the policies adopted by the Board of Directors/Trustees, the fair value price is compared against the last available and next available market quotations. The Valuation Committee reviews the results of such testing and fair valuation occurrences are reported to the Board of Directors/Trustees.
3. Derivative Instruments and Hedging Activities
The Funds record derivative instruments at fair value, with changes in fair value recognized on the Statement of Operations, when applicable. Even though the Funds’ investments in derivatives may represent economic hedges, they are not considered to be hedge transactions for financial reporting purposes. The Funds did not invest in derivative instruments during the six months ended March 31, 2013.
4. Fund Shares
Transactions in Fund shares were as follows:
| | | | | | | | | | | | | | | | |
| | | Symphony Large-Cap Growth | |
| | | Six Months Ended
3/31/2013 | | | Year Ended
9/30/12 | |
| | | Shares | | | Amount | | | Shares | | | Amount | |
Shares sold: | | | | | | | | | | | | | | | | |
Class A | | | 1,191,710 | | | $ | 29,902,776 | | | | 1,511,225 | | | $ | 36,283,962 | |
Class C | | | 331,858 | | | | 7,946,215 | | | | 459,738 | | | | 10,742,423 | |
Class R3 | | | 26,549 | | | | 657,762 | | | | 94,378 | | | | 2,383,976 | |
Class I | | | 836,581 | | | | 21,154,094 | | | | 534,471 | | | | 13,364,622 | |
Shares issued to shareholders due to reinvestment of distributions: | | | | | | | | | | | | | | | | |
Class A | | | 16,765 | | | | 403,356 | | | | 12,856 | | | | 258,536 | |
Class C | | | 1,059 | | | | 24,457 | | | | 7,991 | | | | 154,230 | |
Class R3 | | | 621 | | | | 14,970 | | | | — | | | | — | |
Class I | | | 9,642 | | | | 234,399 | | | | 5,775 | | | | 117,425 | |
| | | | 2,414,785 | | | | 60,338,029 | | | | 2,626,434 | | | | 63,305,174 | |
Shares redeemed: | | | | | | | | | | | | | | | | |
Class A | | | (579,858 | ) | | | (14,508,931 | ) | | | (166,604 | ) | | | (4,028,425 | ) |
Class C | | | (58,260 | ) | | | (1,395,178 | ) | | | (39,325 | ) | | | (902,419 | ) |
Class R3 | | | (27,075 | ) | | | (665,248 | ) | | | (2,971 | ) | | | (68,212 | ) |
Class I | | | (215,279 | ) | | | (5,452,104 | ) | | | (105,364 | ) | | | (2,407,075 | ) |
| | | | (880,472 | ) | | | (22,021,461 | ) | | | (314,264 | ) | | | (7,406,131 | ) |
Net increase (decrease) | | | 1,534,313 | | | $ | 38,316,568 | | | | 2,312,170 | | | $ | 55,899,043 | |
| |
| | | Symphony Mid-Cap Core | |
| | | Six Months Ended
3/31/2013 | | | Year Ended
9/30/12 | |
| | | Shares | | | Amount | | | Shares | | | Amount | |
Shares sold: | | | | | | | | | | | | | | | | |
Class A | | | 20,378 | | | $ | 515,170 | | | | 51,329 | | | $ | 1,268,673 | |
Class C | | | 4,531 | | | | 109,722 | | | | 7,176 | | | | 164,082 | |
Class R3 | | | 3,016 | | | | 75,499 | | | | 541 | | | | 13,495 | |
Class I | | | 6,267 | | | | 159,836 | | | | 36,260 | | | | 876,794 | |
Shares issued to shareholders due to reinvestment of distributions: | | | | | | | | | | | | | | | | |
Class A | | | 560 | | | | 13,810 | | | | — | | | | — | |
Class C | | | 4 | | | | 84 | | | | — | | | | — | |
Class R3 | | | 18 | | | | 449 | | | | — | | | | — | |
Class I | | | 192 | | | | 4,783 | | | | — | | | | — | |
| | | | 34,966 | | | | 879,353 | | | | 95,306 | | | | 2,323,044 | |
Shares redeemed: | | | | | | | | | | | | | | | | |
Class A | | | (9,174 | ) | | | (234,743 | ) | | | (50,250 | ) | | | (1,196,935 | ) |
Class C | | | (796 | ) | | | (20,259 | ) | | | (19,407 | ) | | | (431,597 | ) |
Class R3 | | | (4 | ) | | | (100 | ) | | | (22 | ) | | | (569 | ) |
Class I | | | (5,257 | ) | | | (134,263 | ) | | | (1,500 | ) | | | (35,909 | ) |
| | | | (15,231 | ) | | | (389,365 | ) | | | (71,179 | ) | | | (1,665,010 | ) |
Net increase (decrease) | | | 19,735 | | | $ | 489,988 | | | | 24,127 | | | $ | 658,034 | |
| | | | | | | | | | | | | | | | |
| |
| | | Symphony International Equity | |
| | | Six Months Ended
3/31/2013 | | | Year Ended
9/30/12 | |
| | | Shares | | | Amount | | | Shares | | | Amount | |
Shares sold: | | | | | | | | | | | | | | | | |
Class A | | | 512 | | | $ | 7,928 | | | | 2,626 | | | $ | 36,949 | |
Class C | | | 330 | | | | 5,328 | | | | 6,043 | | | | 85,255 | |
Class R3 | | | — | | | | — | | | | — | | | | — | |
Class I | | | 322,661 | | | | 4,892,358 | | | | 28,378 | | | | 398,082 | |
Shares issued to shareholders due to reinvestment of distributions: | | | | | | | | | | | | | | | | |
Class A | | | 11 | | | | 168 | | | | 44 | | | | 598 | |
Class C | | | — | | | | — | | | | — | | | | — | |
Class R3 | | | — | | | | — | | | | — | | | | — | |
Class I | | | 1,773 | | | | 27,705 | | | | 81 | | | | 1,101 | |
| | | | 325,287 | | | | 4,933,487 | | | | 37,172 | | | | 521,985 | |
Shares redeemed: | | | | | | | | | | | | | | | | |
Class A | | | (2,536 | ) | | | (40,703 | ) | | | (16,149 | ) | | | (217,182 | ) |
Class C | | | (1,651 | ) | | | (26,021 | ) | | | (21,277 | ) | | | (288,198 | ) |
Class R3 | | | (390 | ) | | | (6,357 | ) | | | — | | | | — | |
Class I | | | (1,281 | ) | | | (20,340 | ) | | | (1,310 | ) | | | (19,255 | ) |
| | | | (5,858 | ) | | | (93,421 | ) | | | (38,736 | ) | | | (524,635 | ) |
Net increase (decrease) | | | 319,429 | | | $ | 4,840,066 | | | | (1,564 | ) | | $ | (2,650 | ) |
| |
| | | Symphony Low Volatility Equity | |
| | | Six Months Ended
3/31/2013 | | | Year Ended
9/30/12 | |
| | | Shares | | | Amount | | | Shares | | | Amount | |
Shares sold: | | | | | | | | | | | | | | | | |
Class A | | | 84,692 | | | $ | 1,902,407 | | | | 17,349 | | | $ | 374,323 | |
Class C | | | 12,462 | | | | 274,770 | | | | 3,806 | | | | 79,485 | |
Class R3 | | | N/A | | | | N/A | | | | — | | | | — | |
Class I | | | 6,570 | | | | 149,529 | | | | 34,796 | | | | 731,304 | |
Shares issued to shareholders due to reinvestment of distributions: | | | | | | | | | | | | | | | | |
Class A | | | 1,171 | | | | 25,099 | | | | 164 | | | | 3,222 | |
Class C | | | 198 | | | | 4,173 | | | | 4 | | | | 86 | |
Class R3 | | | N/A | | | | N/A | | | | — | | | | — | |
Class I | | | 1,366 | | | | 29,297 | | | | 402 | | | | 7,911 | |
| | | | 106,459 | | | | 2,385,275 | | | | 56,521 | | | | 1,196,331 | |
Shares redeemed: | | | | | | | | | | | | | | | | |
Class A | | | (4,513 | ) | | | (102,195 | ) | | | (17,541 | ) | | | (357,169 | ) |
Class C | | | (15 | ) | | | (345 | ) | | | (16,712 | ) | | | (334,175 | ) |
Class R3 | | | N/A | | | | N/A | | | | (2,886 | ) | | | (59,694 | ) |
Class I | | | (6,804 | ) | | | (151,108 | ) | | | (13,943 | ) | | | (291,314 | ) |
| | | | (11,332 | ) | | | (253,648 | ) | | | (51,082 | ) | | | (1,042,352 | ) |
Net increase (decrease) | | | 95,127 | | | $ | 2,131,627 | | | | 5,439 | | | $ | 153,979 | |
N/A – After the close of business on May 30, 2012, the Fund liquidated all of its Class R3 Shares.
5. Investment Transactions
Purchases and sales (excluding short-term investments, where applicable) during the six months ended March 31, 2013, were as follows:
| | | | | | | | | | | | | | | | |
| | | Symphony
Large-Cap
Growth | | | Symphony
Mid-Cap
Core | | | Symphony International
Equity | | | Symphony Low
Volatility
Equity | |
Purchases | | $ | 91,902,863 | | | $ | 5,011,332 | | | $ | 4,926,921 | | | $ | 3,663,873 | |
Sales | | | 52,946,026 | | | | 4,544,518 | | | | 589,446 | | | | 1,731,643 | |
Notes to Financial Statements (Unaudited) (continued)
6. Income Tax Information
The following information is presented on an income tax basis. Differences between amounts for financial statement and federal income tax purposes are primarily due to timing differences in recognizing certain gains and losses on investment transactions. To the extent that differences arise that are permanent in nature, such amounts are reclassified within the capital accounts as detailed below. Temporary differences do not require reclassification. Temporary and permanent differences do not impact the net asset values of the Funds.
As of March 31, 2013, the cost and unrealized appreciation (depreciation) of investments, as determined on a federal income tax basis, were as follows:
| | | | | | | | | | | | | | | | |
| | | Symphony
Large-Cap
Growth | | | Symphony
Mid-Cap
Core | | | Symphony
International
Equity | | | Symphony
Low
Volatility
Equity | |
Cost of investments | | $ | 98,899,890 | | | $ | 4,338,737 | | | $ | 5,540,419 | | | $ | 4,537,702 | |
Gross unrealized: | | | | | | | | | | | | | | | | |
Appreciation | | $ | 11,292,909 | | | $ | 794,820 | | | $ | 658,852 | | | $ | 786,419 | |
Depreciation | | | (1,411,418 | ) | | | (33,874 | ) | | | (150,344 | ) | | | (18,793 | ) |
Net unrealized appreciation (depreciation) of investments | | $ | 9,881,491 | | | $ | 760,946 | | | $ | 508,508 | | | $ | 767,626 | |
Permanent differences, primarily due to net operating losses, reclassification of litigation proceeds and foreign currency reclassifications, resulted in reclassifications among the Funds’ components of net assets as of September 30, 2012, the Funds’ last tax year end, as follows:
| | | | | | | | | | | | | | | | |
| | | Symphony
Large-Cap
Growth | | | Symphony
Mid-Cap
Core | | | Symphony
International
Equity | | | Symphony
Low
Volatility
Equity | |
Capital paid-in | | $ | (1,796 | ) | | $ | (2,993 | ) | | $ | — | | | $ | (287 | ) |
Undistributed (Over-distribution of) net investment income | | | 244,030 | | | | 2,993 | | | | (86 | ) | | | — | |
Accumulated net realized gain (loss) | | | (242,234 | ) | | | — | | | | 86 | | | | 287 | |
The tax components of undistributed net ordinary income and net long-term capital gains as of September 30, 2012, the Funds’ last tax year end, were as follows:
| | | | | | | | | | | | | | | | |
| | | Symphony
Large-Cap
Growth | | | Symphony
Mid-Cap
Core | | | Symphony
International
Equity | | | Symphony
Low
Volatility
Equity | |
Undistributed net ordinary income* | | $ | 347,004 | | | $ | 12,684 | | | $ | 18,804 | | | $ | 34,578 | |
Undistributed net long-term capital gains | | | — | | | | — | | | | — | | | | 78,272 | |
| * | Net ordinary income consists of net taxable income derived from dividends, interest, and net short-term capital gains, if any. |
The tax character of distributions paid during the Funds’ last tax year ended September 30, 2012, was designated for purposes of the dividends paid deduction as follows:
| | | | | | | | | | | | | | | | |
| | | Symphony
Large-Cap
Growth | | | Symphony
Mid-Cap
Core | | | Symphony
International
Equity | | | Symphony
Low
Volatility
Equity | |
Distributions from net ordinary income* | | $ | 195 | | | $ | — | | | $ | 12,047 | | | $ | 20,987 | |
Distributions from net long-term capital gains | | | 684,784 | | | | — | | | | — | | | | — | |
| * | Net ordinary income consists of net taxable income derived from dividends, interest, and net short-term capital gains, if any. |
As of September 30, 2012, the Funds’ last tax year end, the following Funds had unused capital loss carryforwards available for federal income tax purposes to be applied against future capital gains, if any. If not applied, the carryforwards will expire as follows:
| | | | | | | | |
| | | Symphony
Mid-Cap
Core | | | Symphony
International
Equity | |
Expiration: | | | | | | | | |
September 30, 2017 | | $ | 27,180 | | | $ | 372,472 | |
During the Funds’ last tax year ended September 30, 2012, the following Funds utilized capital loss carryforwards as follows:
| | | | | | | | | | | | |
| | | Symphony
Mid-Cap
Core | | | Symphony
International
Equity | | | Symphony
Low
Volatility
Equity | |
Utilized capital loss carryforwards | | $ | 138,501 | | | $ | 13,892 | | | $ | 155,547 | |
Under the Regulated Investment Company Modernization Act of 2010, capital losses incurred by the Funds after December 31, 2010, will not be subject to expiration. During the Funds’ last tax year ended September 30, 2012, there were no post-enactment capital losses generated by any of the Funds.
The Funds have elected to defer losses incurred from November 1, 2011 through September 30, 2012, the Funds’ last tax year end, in accordance with federal income tax rules. These losses are treated as having arisen on the first day of the current fiscal year. The following Funds have elected to defer losses as follows:
| | | | | | | | | | | | |
| | | Symphony
Large-Cap
Growth | | | Symphony
Mid-Cap
Core | | | Symphony
Low
Volatility
Equity | |
Post-October capital losses | | $ | 324,744 | | | $ | 49,556 | | | $ | 5,278 | |
Late-year ordinary losses | | | — | | | | — | | | | — | |
7. Management Fees and Other Transactions with Affiliates
Each Fund’s management fee consists of two components – a fund-level fee, based only on the amount of assets within each individual Fund, and a complex-level fee, based on the aggregate amount of all eligible fund assets managed by the Adviser. This pricing structure enables each Fund’s shareholders to benefit from growth in the assets within their respective Fund as well as from growth in the amount of complex-wide assets managed by the Adviser.
The annual fund-level fee for each Fund, payable monthly, is calculated according to the following schedule:
| | | | | | | | | | | | | | | | |
| Average Daily Net Assets | | Symphony
Large-Cap
Growth
Fund-Level
Fee Rate | | | Symphony
Mid-Cap
Core
Fund-Level
Fee Rate | | | Symphony
International
Equity
Fund-Level
Fee Rate | | | Symphony
Low
Volatility
Equity
Fund-Level
Fee Rate | |
For the first $125 million | | | .5000 | % | | | .5500 | % | | | .6000 | % | | | .5000 | % |
For the next $125 million | | | .4875 | | | | .5375 | | | | .5875 | | | | .4875 | |
For the next $250 million | | | .4750 | | | | .5250 | | | | .5750 | | | | .4750 | |
For the next $500 million | | | .4625 | | | | .5125 | | | | .5625 | | | | .4625 | |
For the next $1 billion | | | .4500 | | | | .5000 | | | | .5500 | | | | .4500 | |
For net assets over $2 billion | | | .4250 | | | | .4750 | | | | .5250 | | | | .4250 | |
The annual complex-level fee for each Fund, payable monthly, is calculated according to the following schedule:
| | | | |
| Complex-Level Asset Breakpoint Level* | | Effective Rate at Breakpoint Level | |
$55 billion | | | .2000 | % |
$56 billion | | | .1996 | |
$57 billion | | | .1989 | |
$60 billion | | | .1961 | |
$63 billion | | | .1931 | |
$66 billion | | | .1900 | |
$71 billion | | | .1851 | |
$76 billion | | | .1806 | |
$80 billion | | | .1773 | |
$91 billion | | | .1691 | |
$125 billion | | | .1599 | |
$200 billion | | | .1505 | |
$250 billion | | | .1469 | |
$300 billion | | | .1445 | |
| * | The complex-level fee is calculated based upon the aggregate daily “eligible assets” of all Nuveen Funds. Eligible assets do not include assets attributable to investments in other Nuveen Funds or assets in excess of $2 billion added to the Nuveen Fund complex in connection with the Adviser’s assumption of the management of the former First American Funds effective January 1, 2011. Eligible assets include closed-end fund assets managed by the Adviser that are attributable to financial leverage. For these purposes, financial leverage includes the closed-end funds’ use of preferred stock and borrowings and certain investments in the residual interest certificates (also called inverse floating rate securities) in tender option bond (TOB) trusts, including the portion of assets held by a TOB trust that has been effectively financed by the trust’s issuance of floating rate securities, subject to an agreement by the Adviser as to certain funds to limit the amount of such assets for determining eligible assets in certain circumstances. As of March 31, 2013, the complex-level fee rate for these Funds was .1668%. |
Notes to Financial Statements (Unaudited) (continued)
The management fee compensates the Adviser for the overall investment advisory and administrative services and general office facilities. The Adviser is responsible for each Fund’s overall strategy and asset allocation decisions. The Adviser has entered into sub-advisory agreements with Symphony Asset Management LLC (“Symphony”), an affiliate of Nuveen, under which Symphony manages the investment portfolios of the Funds. Symphony is compensated for its services to the Funds from the management fees paid to the Adviser.
The Adviser has agreed to waive fees and/or reimburse expenses (“Expense Cap”) of the Funds so that total annual Fund operating expenses (excluding 12b-1 distribution and/or service fees, interest expenses, taxes, acquired fund fees and expenses, fees incurred in acquiring and disposing of portfolio securities and extraordinary expenses) do not exceed the average daily net assets of any class of Fund shares in the amounts and for the time periods stated in the following table.
| | | | | | | | | | | | |
| Fund | | Temporary
Expense Cap | | | Temporary
Expense Cap
Expiration Date | | | Permanent
Expense Cap | |
Symphony Large-Cap Growth | | | 1.00 | % | | | January 31, 2014 | | | | 1.35 | % |
Symphony Mid-Cap Core | | | 1.15 | | | | January 31, 2014 | | | | 1.40 | |
Symphony International Equity | | | 1.13 | | | | January 31, 2014 | | | | 1.38 | |
Symphony Low Volatility Equity | | | 1.00 | | | | January 31, 2014 | | | | 1.45 | |
The Adviser may also voluntarily reimburse expenses from time to time in any of the Funds. Voluntary reimbursements may be terminated at any time at the Adviser’s discretion.
The Trust pays no compensation directly to those of its trustees who are affiliated with the Adviser or to its officers, all of whom receive remuneration for their services to the Trust from the Adviser or its affiliates. The Board of Trustees has adopted a deferred compensation plan for independent trustees that enables trustees to elect to defer receipt of all or a portion of the annual compensation they are entitled to receive from certain Nuveen-advised funds. Under the plan, deferred amounts are treated as though equal dollar amounts had been invested in shares of select Nuveen-advised funds.
During the six months ended March 31, 2013, Nuveen Securities, LLC (the “Distributor”), a wholly-owned subsidiary of Nuveen, collected sales charges on purchases of Class A Shares, the majority of which were paid out as concessions to financial intermediaries as follows:
| | | | | | | | | | | | | | | | |
| | | Symphony
Large-Cap
Growth | | | Symphony
Mid-Cap
Core | | | Symphony
International
Equity | | | Symphony
Low
Volatility
Equity | |
Sales charges collected | | $ | 172,853 | | | $ | 4,361 | | | $ | 440 | | | $ | 9,370 | |
Paid to financial intermediaries | | | 151,700 | | | | 4,210 | | | | 385 | | | | 8,205 | |
During the six months ended March 31, 2013, the Distributor compensated financial intermediaries directly with commission advances at the time of purchase as follows:
| | | | | | | | | | | | | | | | |
| | | Symphony
Large-Cap
Growth | | | Symphony
Mid-Cap
Core | | | Symphony
International
Equity | | | Symphony
Low
Volatility
Equity | |
Commission advances | | $ | 67,896 | | | $ | 4,297 | | | $ | 50 | | | $ | 1,864 | |
To compensate for commissions advanced to financial intermediaries, all 12b-1 service and distribution fees collected on Class C Shares during the first year following a purchase are retained by the Distributor. During the six months ended March 31, 2013, the Distributor retained such 12b-1 fees as follows:
| | | | | | | | | | | | | | | | |
| | | Symphony
Large-Cap
Growth | | | Symphony
Mid-Cap
Core | | | Symphony
International
Equity | | | Symphony
Low
Volatility
Equity | |
12b-1 fees retained | | $ | 49,599 | | | $ | 1,165 | | | $ | 395 | | | $ | 821 | |
The remaining 12b-1 fees charged to the Funds were paid to compensate financial intermediaries for providing services to shareholders relating to their investments.
The Distributor also collected and retained CDSC on share redemptions during the six months ended March 31, 2013, as follows:
| | | | | | | | | | | | | | | | |
| | | Symphony
Large-Cap
Growth | | | Symphony
Mid-Cap
Core | | | Symphony
International
Equity | | | Symphony
Low
Volatility
Equity | |
CDSC retained | | $ | 593 | | | $ | — | | | $ | — | | | $ | — | |
As of March 31, 2013, Nuveen owned shares of the Funds as follows:
| | | | | | | | | | | | | | | | |
| | | Symphony
Large-Cap
Growth | | | Symphony
Mid-Cap
Core | | | Symphony
International
Equity | | | Symphony
Low
Volatility
Equity | |
Class A Shares | | | — | | | | 2,192 | | | | 3,069 | | | | 2,479 | |
Class C Shares | | | — | | | | 2,290 | | | | 3,095 | | | | 2,528 | |
Class R3 Shares | | | — | | | | 10,183 | | | | 3,058 | | | | N/A | |
Class I Shares | | | — | | | | 34,425 | | | | 38,892 | | | | 41,835 | |
| N/A | – Symphony Low Volatility Equity does not offer Class R3 Shares. |
8. New Accounting Pronouncements
Financial Accounting Standards Board (“FASB”) Balance Sheet (Topic 210): Disclosures about Offsetting Assets and Liabilities In January 2013, Accounting Standards Update (“ASU”) 2013-01, Clarifying the Scope of Disclosures about Offsetting Assets and Liabilities, replaced ASU 2011-11, Disclosures about Offsetting Assets and Liabilities. ASU 2013-01 is effective for fiscal years beginning on or after January 1, 2013. ASU 2011-11 was intended to enhance disclosure requirements on the offsetting of financial assets and liabilities. ASU 2013-01 limits the scope of the new balance sheet offsetting disclosures to derivatives, repurchase agreements and securities lending transactions to the extent that they are (1) offset in the financial statements or (2) subject to an enforceable master netting arrangement or similar agreement. Management is currently evaluating the application of ASU 2013-01 and its impact to the financial statements and footnote disclosures, if any.
9. Subsequent Events
Fund Reorganizations
On April 19, 2013, the Board of Directors/Trustees of Nuveen Investment Funds, Inc. (“NIF”) and the Trust approved the reorganizations for certain Funds included in this report (each a “Reorganization” and collectively, the “Reorganizations”).
The approved Reorganizations are as follows:
| | |
| Acquired Funds | | Acquiring Funds |
Nuveen Mid Cap Select Fund, a series of NIF | | Symphony Mid-Cap Core |
| |
Nuveen Quantitative Enhanced Core Equity Fund, a series of NIF | | Symphony Low Volatility Equity |
The Adviser proposed the Reorganizations of the Acquired Funds into the Acquiring Funds, as well as a number of other fund reorganizations between funds with similar investment objectives and policies, as part of an initiative to eliminate certain redundancies among the products it offers and in an effort to achieve certain operating efficiencies. The Board of Directors/Trustees has determined that the Reorganizations were in the best interest of the Acquired Funds and that the interests of existing shareholders will not be diluted as a result of the Reorganizations.
In order for the Reorganizations to occur, they must be approved by the shareholders of the Acquired Funds. A special meeting of the Acquired Funds’ shareholders for the purpose of voting on the Reorganizations is expected to be held in late August 2013. If the required shareholder approvals are obtained on the meeting date, it is anticipated that the Reorganizations will be consummated shortly after the special shareholder meeting. Upon shareholder approval of the Reorganizations, each Acquired Fund will transfer all of its assets and liabilities to the Acquiring Fund in exchange for Acquiring Fund shares of equal value. These Acquiring Fund shares will then be distributed to the shareholders of each Acquired Fund and the Acquired Funds will be terminated. As a result of the Reorganizations, shareholders of each Acquired Fund will become shareholders of each Acquiring Fund. The shareholders of each Acquired Fund will receive Acquiring Fund shares with a total value equal to the total value of their Acquired Fund shares immediately prior to the closing of each Reorganization. Further information regarding the proposed Reorganizations of the Acquired Funds will be contained in proxy materials that are expected to be sent to the Acquired Funds’ shareholders in late July 2013.
Glossary of Terms Used in this Report
Average Annual Total Return: This is a commonly used method to express an investment’s performance over a particular, usually multi-year time period. It expresses the return that would have been necessary each year to equal the investment’s actual cumulative performance (including change in NAV or offer price and reinvested dividends and capital gains distributions, if any) over the time period being considered.
Beta: A measure of the volatility of a portfolio relative to the overall market. A beta less than 1.0 indicates lower risk than the market; a beta greater than 1.0 indicates higher risk than the market.
Gross Domestic Product (GDP): The total market value of all final goods and services produced in a country/region in a given year, equal to total consumer, investment and government spending, plus the value of exports, minus the value of imports.
Lipper International Multi-Cap Growth Funds Classification Average: Represents the average annualized total return for all reporting funds in the Lipper International Multi-Cap Growth Funds classification. Lipper returns account for the effects of management fees and assume reinvestment of distributions, but do not reflect any applicable sales charges.
Lipper Large-Cap Core Funds Classification Average: Represents the average annualized total return for all reporting funds in the Lipper Large-Cap Core Funds classification. Lipper returns account for the effects of management fees and assume reinvestment of distributions, but do not reflect any applicable sales charges.
Lipper Mid-Cap Core Funds Classification Average: Represents the average annualized total return for all reporting funds in the Lipper Mid-Cap Core Funds classification. Lipper returns account for the effects of management fees and assume reinvestment of distributions, but do not reflect any applicable sales charges.
Lipper Multi-Cap Growth Funds Classification Average: Represents the average annualized total return for all reporting funds in the Lipper Multi-Cap Growth Funds classification. Lipper returns account for the effects of management fees and assume reinvestment of distributions, but do not reflect any applicable sales charges.
MSCI EAFE Index: The MSCI (Morgan Stanley Capital International) EAFE (Europe, Australasia, Far East) Index is a free float-adjusted market capitalization weighted index designed to measure developed market equity performance, excluding the U.S. and Canada. Index returns assume reinvestment of distributions, but do not reflect any applicable sales charges or management fees.
Net Asset Value (NAV): The net market value of all securities held in a portfolio.
Net Asset Value (NAV) Per Share: The market value of one share of a mutual fund or closed-end fund. For a Fund, the NAV is calculated daily by taking the Fund’s total assets (securities, cash, and accrued earnings), subtracting the Fund’s liabilities, and dividing by the number of shares outstanding.
Russell 1000® Growth Index: An index that measures the performance of those Russell 1000 companies with higher price-to-book ratios and higher forecasted growth values. Index returns assume reinvestment of distributions, but do not reflect any applicable sales charges or management fees.
Russell MidCap® Index: An index constructed to provide a comprehensive and unbiased barometer for the mid-cap segment of the equity market, which includes the smallest 800 securities within the Russell 1000 Index. Index returns assume reinvestment of distributions, but do not reflect any applicable sales charges or management fees.
S&P 500® Index: An unmanaged index generally considered representative of the U.S. stock market. Index returns assume reinvestment of distributions, but do not reflect any applicable sales charges or management fees.
Additional Fund Information
Fund Manager
Nuveen Fund Advisors, LLC
333 West Wacker Drive
Chicago, IL 60606
Sub-Adviser
Symphony Asset Management LLC
555 California Street
Rene Suite 2975
San Francisco, CA 94104
Legal Counsel
Chapman and Cutler LLP
Chicago, IL
Independent Registered Public Accounting Firm
PricewaterhouseCoopers LLP
Chicago, IL
Custodian
State Street Bank & Trust Company
Boston, MA
Transfer Agent and Shareholder Services
Boston Financial
Data Services, Inc.
Nuveen Investor Services
P.O. Box 8530
Boston, MA 02266-8530
(800) 257-8787
Quarterly Form N-Q Portfolio of Investments Information: Each Fund is required to file its complete schedule of portfolio holdings with the Securities and Exchange Commission (SEC) for the first and third quarters of each fiscal year on Form N-Q. You may obtain this information directly from the SEC. Visit the SEC on-line at http://www.sec.gov or in person at the SEC’s Public Reference Room in Washington, D.C. Call the SEC toll-free at (800) SEC -0330 for room hours and operation.
Nuveen Funds’ Proxy Voting Information: You may obtain (i) information regarding how each Fund voted proxies relating to portfolio securities held during the most recent twelve-month period ended June 30, and (ii) a description of the policies and procedures that each Fund used to determine how to vote proxies relating to portfolio securities without charge, upon request, by calling Nuveen Investments toll-free at (800) 257-8787 or on Nuveen’s website at www.nuveen.com. You may also obtain this information directly from the SEC. Visit the SEC on-line at http://www.sec.gov.
The Financial Industry Regulatory Authority (FINRA) provides a Public Disclosure Program which supplies certain information regarding the disciplinary history of FINRA members and their associated persons in response to either telephone inquiries at (800) 289-9999 or written inquiries at www.finra.org. FINRA also provides an investor brochure that includes information describing the Public Disclosure Program.
Nuveen Investments:
Serving Investors for Generations
Since 1898, financial advisors and their clients have relied on Nuveen Investments to provide dependable investment solutions through continued adherence to proven, long-term investing principles. Today, we offer a range of high quality equity and fixed-income solutions designed to be integral components of a well-diversified core portfolio.
Focused on meeting investor needs.
Nuveen Investments provides high-quality investment services designed to help secure the longterm goals of institutional and individual investors as well as the consultants and financial advisors who serve them. Nuveen Investments markets a wide range of specialized investment solutions which provide investors access to capabilities of its high-quality boutique investment affiliates–Nuveen Asset Management, Symphony Asset Management, NWQ Investment Management Company, Santa Barbara Asset Management, Tradewinds Global Investors, Winslow Capital Management, and Gresham Investment Management. In total, Nuveen Investments managed $224 billion as of March 31, 2013.
Find out how we can help you.
To learn more about how the products and services of Nuveen Investments may be able to help you meet your financial goals, talk to your financial advisor, or call us at (800) 257-8787. Please read the information provided carefully before you invest. Investors should consider the investment objective and policies, risk considerations, charges and expenses of any investment carefully. Where applicable, be sure to obtain a prospectus, which contains this and other relevant information. To obtain a prospectus, please contact your securities representative or Nuveen Investments, 333 W. Wacker Dr., Chicago, IL 60606. Please read the prospectus carefully before you invest or send money.
Learn more about Nuveen Funds at: www.nuveen.com/mf
| | |
Distributed by Nuveen Securities, LLC 333 West Wacker Drive Chicago, IL 60606 www.nuveen.com | | |
MSA-SYMPH-0313P

Mutual Funds
Nuveen Equity Funds
For investors seeking the potential for long-term capital appreciation.
Semi-Annual Report
April 30, 2013
| | | | | | | | | | |
| | | Share Class / Ticker Symbol |
| | | | | |
| Fund Name | | Class A | | Class B | | Class C | | Class R3 | | Class I |
Nuveen Large Cap Select Fund | | FLRAX | | — | | FLYCX | | — | | FLRYX |
Nuveen Mid Cap Select Fund | | FATAX | | — | | FTACX | | — | | FATCX |
Nuveen Small Cap Select Fund | | EMGRX | | ARSBX | | FHMCX | | ASEIX | | ARSTX |
LIFE IS COMPLEX.
Nuveen makes things e-simple.
It only takes a minute to sign up for e-Reports. Once enrolled, you’ll receive an e-mail as soon as your Nuveen Fund information is ready. No more waiting for delivery by regular mail. Just click on the link within the e-mail to see the report and save it on your computer if you wish.
Free e-Reports right to your e-mail!
www.investordelivery.com
If you receive your Nuveen Fund distributions and statements from your financial advisor or brokerage account.
OR
www.nuveen.com/accountaccess
If you receive your Nuveen Fund distributions and statements directly from Nuveen.
| | | | | | |
| Must be preceded by or accompanied by a prospectus. | | NOT FDIC INSURED | | MAY LOSE VALUE | | NO BANK GUARANTEE |
Table of Contents
Chairman’s
Letter to Shareholders

Dear Shareholders,
After nine years of serving as lead director and independent chairman of the Nuveen Fund Board, my term of office is coming to an end. It has been a privilege to use this space to communicate with you on some of the broad economic trends in the U.S. and abroad and how they are impacting the investment environment in which your funds operate. In addition, I have enjoyed offering some perspective on how your Board views the various Nuveen investment teams as they apply their investment disciplines in that investment environment.
My term has coincided with a particularly challenging period for both mutual fund sponsors and investors. Since 2000 there have been three periods of unusually strong stock market growth and two major market declines. Recent years have been characterized by a search for yield in fixed income securities to compensate for an extended period of very low interest rates. Funds are investing more in foreign and emerging markets that require extensive research capabilities to overcome the more limited transparency and higher volatility in those markets. New fund concepts often incorporate derivative financial instruments that offer efficient ways to hedge investment risk or gain exposure to selected markets. Fund trading teams operate in many new domestic and international venues with quite different characteristics. Electronic trading and global communication networks mean that fund managers must be able to thrive in financial markets that react instantaneously to newsworthy events and are more interconnected than ever.
Nuveen has committed additional resources to respond to these changes in the fund industry environment. It has added IT and research resources to assemble and evaluate the increased flow of detailed information on economies, markets and individual companies. Based on its experience during the financial crisis of 2008-09, Nuveen has expanded its resources dedicated to valuing and trading portfolio securities with a particular focus on stressed financial market conditions. It has added systems and experienced risk management professionals to work with investment teams to better help evaluate whether their funds’ risk exposures are appropriate in view of the return targets. The investment teams have also reflected on recent experience to reaffirm or modify their investment disciplines. Finally, experienced professionals and IT resources have been added to address new regulatory requirements designed to better inform and protect investors. The Board has enthusiastically encouraged these initiatives.
The Nuveen Fund Board has always viewed itself as your representatives to assure that Nuveen brings together experienced people, proven technologies and effective processes designed to produce results that meet investor expectations. It is important to note that our activities are highlighted by the annual contract renewal process. Despite its somewhat formal language, I strongly encourage you to read the summary because it offers an insight into our oversight process. The report is included in the back of this or a subsequent shareholder report. The renewal process is very comprehensive and includes a number of evaluations and discussions between the Board and Nuveen during the year. The summary also describes what has been achieved across the Nuveen fund complex and at individual funds such as yours.
As I leave the chairmanship and resume my role as a member of the Board, please be assured that I and my fellow Board members will continue to hold your interests uppermost in our minds as we oversee the management of your funds and that we greatly appreciate your confidence in your Nuveen fund.
Very sincerely,

Robert P. Bremner
Chairman of the Board
June 21, 2013
Portfolio Managers’ Comments
Certain statements in this report are forward-looking statements. Discussions of specific investments are for illustration only and are not intended as recommendations of individual investments. The forward-looking statements and other views expressed herein are those of the portfolio managers as of the date of this report. Actual future results or occurrences may differ significantly from those anticipated in any forward-looking statements and the views expressed herein are subject to change at any time, due to numerous market and other factors. The Funds disclaim any obligation to update publicly or revise any forward-looking statements or views expressed herein.
Approved Fund Reorganization
The Board of Directors/Trustees of Nuveen Investment Funds, Inc. (“NIF”) and Nuveen Investment Trust II (“NIT II”) has approved the reorganization of Nuveen Mid Cap Select Fund (the “Acquired Fund”), a series of NIF, into Nuveen Symphony Mid-Cap Core Fund (the “Acquiring Fund”) a series of NIT II.
In order for the reorganization to occur, it must be approved by the shareholders of the Acquired Fund.
If the Acquired Fund’s shareholders approve the reorganization, the Acquired Fund will transfer all of its assets and liabilities to the Acquiring Fund in exchange for Acquiring Fund shares of equal value. These Acquiring Fund shares will then be distributed to Acquired Fund shareholders and the Acquired Fund will be terminated. As a result of these transactions, Acquired Fund shareholders will become shareholders of the Acquiring Fund and will cease to be shareholders of the Acquired Fund. Each Acquired Fund shareholder will receive Acquiring Fund shares with a total value equal to the total value of that shareholder’s Acquired Fund shares immediately prior to the closing of the reorganization.
A special meeting of the Acquired Fund’s shareholders for the purpose of voting on the reorganization is expected to be held in late September 2013. If the required approval is obtained, it is anticipated that the reorganization will be consummated shortly after the special shareholder meeting. Further information regarding the proposed reorganization will be contained in proxy materials that are expected to be sent to shareholders of the Acquired Fund in late August 2013.
The Acquired Fund will continue sales and redemptions of its shares as described in the prospectus until shortly before its reorganization. However, holders of shares purchased after the record date set for the Acquired Fund’s special meeting of shareholders will not be entitled to vote those shares at the special meeting.
Nuveen Large Cap Select Fund
Nuveen Mid Cap Select Fund
Nuveen Small Cap Select Fund
These Funds feature portfolio management by Nuveen Asset Management, LLC, an affiliate of Nuveen Investments.
David Chalupnik, CFA, and Tony Burger, CFA, are the portfolio managers for the Nuveen Large Cap Select Fund. David assumed portfolio management responsibilities in 2003 and Tony and joined the management team for the Fund in 2004.
Tony and Scott Tonneson, CFA, are the portfolio managers for the Nuveen Mid Cap Select Fund. Tony assumed portfolio management responsibilities in 2005 and Scott joined the management team for the Fund in 2012.
Allen Steinkopf, CFA, and Mark Traster, CFA, are the portfolio managers for the Nuveen Small Cap Select Fund. Allen assumed portfolio management responsibilities in 2004 and Mark joined the management team for the Fund in 2008.
On the following pages, the portfolio management teams for the Funds examine key investment strategies and the Funds’ performance for the six-month period ended April 30, 2013.
Nuveen Large Cap Select Fund
How did the Fund perform during the six-month reporting period ended April 30, 2013?
The tables in the Fund Performance and Expense Ratios section of this report provide Class A Share total returns for the Fund for the six-month, one-year, five-year and ten-year periods ended April 30, 2013. The Fund’s Class A Shares at net asset value (NAV) outperformed the S&P 500® Index and the Lipper classification average over the six-month period.
What strategies were used to manage the Fund during the reporting period? How did these strategies influence performance?
The Fund pursues a long-term capital appreciation strategy by investing primarily in the common stocks of companies that have market capitalizations of $5 billion or greater at the time of purchase. During the reporting period, we continued to utilize our deep, rigorous research approach to find and invest in stocks that we believed had strong and/or improving fundamentals, attractive valuations and a catalyst for future positive relative price performance. We also continued to shift the Fund’s portfolio to areas of the market that our research suggested were particularly attractive. Throughout most of this time frame, the Fund emphasized domestic cyclical stocks and sectors that appeared to have solid fundamentals and attractive valuations in the face of a global growth slowdown. Stocks that we sold generally faced an expected or actual deterioration in their fundamental earnings outlook, the realization or removal of the expected catalyst or excessive valuation.
The stock market advanced strongly during the reporting period led by the consumer discretionary, health care and financial sectors, while the worst performing segments of the benchmark were information technology and energy. The Fund’s outperformance of the S&P 500® Index and its Lipper peers resulted from both favorable stock selection and sector weights. On a sector basis, Fund results were aided by overweight positions in the three strongest performing sectors: consumer discretionary, health care and financial, as well as an underweight stance in technology. The Fund also experienced widespread strong stock selection during the period, particularly in the energy, industrials, consumer staples and consumer discretionary sectors. The only areas that were detrimental to Fund returns were its weighting in cash during a strongly advancing stock market and security selection in the health care sector.
The energy sector was the best performing area for the Fund on a relative basis. In particular, the Fund benefited from not owning Exxon Mobil Corp., which is a large weight in the index. We didn’t own this stock due to concerns surrounding the company’s declining production growth on a year-over-year basis. Although Exxon Mobil does produce substantial free cash flow, the company is using it to buy back shares instead of conducting more M&A activity to help its production situation. The Fund also saw strong results from its position in Anadarko Petroleum Corp., an exploration and production firm
that is very efficient at growing production. The company excels at finding oil and natural gas and then profitably selling down its assets. Anadarko Petroleum continued to benefit from several large discoveries in the deep waters of the Gulf of Mexico and onshore in Colorado, as well as selling down some of its assets in Mozambique.
In the industrials sector, the Fund’s outperformance was driven by several positions including Eaton Corporation PLC, a leading provider of electrical, hydraulic and mechanical power solutions. During the fourth quarter of 2012, Eaton closed on its acquisition of competitor Cooper Industries PLC, which is already proving to be a very accretive deal in terms of both revenue generating and cost saving synergies. The acquisition is also leading to a more highly valued combined entity. In addition, the Fund benefited from a position in electrical products conglomerate Emerson Electric Company during the period. Emerson Electric continued to be rewarded for executing well as it recently embarked on a value enhancing strategy. Part of the strategy includes divesting out of its non-core embedded computing and power business, which makes computers, motherboards and chips that are mounted to other devices, due to sustained weakness in this area. At the same time, the company has announced plans to make acquisitions in its core business area. Finally, in industrials, we held onto the Fund’s position in Boeing Company throughout its recent troubles with its lithium ion battery on the company’s flagship Dreamliner airplane. Although Boeing’s stock took a hit after the new passenger jet was grounded by the FAA, we believed the company would quickly resolve the problem. Toward the end of the period, the FAA approved the new battery design and Boeing benefited from increased demand and production of the Dreamliner, which is generating significant free cash flow. While we continued to own both Boeing and Eaton, we sold Emerson Electric toward the end of the period as we believed its stock price had reached fair valuation.
In consumer staples, the Fund benefited from very strong stock selection as all four companies we held in the sector outperformed during the period. The best performing name for the Fund in consumer staples was national drug retailer Walgreen Co. Its stock price advanced significantly as the company benefited from several catalysts including: the resolution of its longstanding dispute with drug benefits provider Express Scripts Inc.; a somewhat bad flu season; and the announcement of an attractive new drug distribution deal with AmerisourceBergen Corporation. The Fund also benefited from its position in Tyson Foods Inc., a leading global producer of chicken, beef and pork products. Tyson Foods showed solid gains during this reporting period after selling off in 2012 due to concerns about drought conditions. Several favorable industry trends are helping the company improve its volumes and margins this year including: the closure of one of its competitor’s large beef processing plants that accounted for about 4% of industry volume; Japan’s recent approval of virtually all beef imports from the United States, which the country had banned since the mad cow outbreak in December 2003; the recent outbreak of the bird flu in China, which is improving demand for its chicken products; and expectations for lower grain input costs. In addition, the Fund benefited from owning ConAgra Foods Inc., a large packaged food company. We liked ConAgra because it generated significant free cash flow and was very inexpensive when we purchased it. In 2013, the company made an accretive acquisition of Ralcorp Holdings Inc., a private label food manufacturer, which is resulting in greater synergies than expected.
Three of the Fund’s holdings in the consumer discretionary sector also outperformed. Our ownership of Best Buy Co. Inc. worked well for the Fund. We re-established a position in this leading electronics retailer, which had underperformed for the Fund in 2012, and its stock subsequently advanced during the period. Best Buy benefited from a solid turnaround plan unveiled by its new management team, which included a strategic move to feature Samsung products in a new “store within a store” format, the closure of underperforming stores and competitive pricing. Another consumer discretionary holding, boat and marine engine manufacturer Brunswick Corporation, maintained its strong run. Brunswick continued to be rewarded for its significant cost cutting efforts during the financial crisis and tremendous operating leverage. Also, the company’s results were supported by improvements in housing and employment data, which led to stronger consumer demand for big ticket items. We did decide to sell Brunswick at the end of the period based on the Fund’s large gain in the position and our concerns about a U.S. economic slowdown. The Fund also benefited from its position in Jarden Corporation, a highly diversified consumer products company that manufactures items ranging from camping and ski equipment to small appliances. Jarden’s management team continued to execute well, generating significant free cash flow for the company which it used to make small acquisitions and also to consistently buy back company shares.
The Fund experienced widespread strength during the period and saw very few pockets of underperformance. The only sector where the Fund lagged on a relative basis was health care, mostly due to its position in UnitedHealth Group Incorporated, a health maintenance organization (HMO). The company fell short of expectations as cost increases and pricing concerns as well as uncertainty surrounding the Affordable Care Act weighed on the stock. While we believe UnitedHealth is a solid, well managed company, we decided to sell it after the period ended because of the uncertainty around the Affordable Care Act and other industry dynamics. Also, our cash position of slightly less than 1% of net assets in a strongly advancing market environment was a drag on the Fund’s return.
Toward the end of this semi-annual reporting period, U.S. and global economic data started to show signs of slowing. Therefore, we positioned the Fund with underweights to the more global growth oriented areas of energy and industrials and neutral in materials. However, we continued to maintain an overweight position in consumer discretionary as we believe the U.S. consumer will hold up better due to improvements in U.S. housing, employment and stock market data. We also moved to an overweight position in the health care sector, as we are finding many good, stable names at attractive valuations. The Fund remains underweight in utilities, which is an expensive stable sector, and consumer staples. It is also slightly underweight in financials, particularly banks and real estate investment trusts (REITs), as fundamentals remain fairly mixed in terms of earnings growth. Although capital and credit quality have improved for financial firms, demand for loans is sluggish and net interest margins are compressed because the rates that companies can charge are so low. We increased the Fund’s technology weight during the period as many of these names are very inexpensive, but also are generating significant cash flows. In technology, we continued to seek out companies with new products in the pipeline that can reignite their growth.
Nuveen Mid Cap Select Fund
How did the Fund perform during the six-month reporting period ended April 30, 2013?
The tables in the Fund Performance and Expense Ratios section of this report provide Class A Share total returns for the Fund for the six-month, one-year, five-year and ten-year periods ended April 30, 2013. The Fund’s Class A Shares at net asset value (NAV) underperformed the Russell Mid Cap® Index and the Lipper classification average over the six-month period.
What strategies were used to manage the Fund during the reporting period? How did these strategies influence performance?
The Fund seeks to provide long-term capital appreciation by investing primarily in the common stocks of companies with market capitalizations at the time of purchase between approximately $600 million and $20.4 billion, the range of the Russell Mid Cap® Index during this period. During the reporting period, we continued to implement our “best of the best” investment approach. We started by using a combination of fundamental and quantitative analysis to identify mid-sized companies that we believed had strong fundamentals, attractive valuations and a catalyst for future positive relative performance. We further narrowed down our investable universe by identifying only those stocks that were held in other funds within our firm. We then combined a subset of those stocks into a portfolio that had risk tolerances within our acceptable limits. Generally, stocks we sold faced an expected or actual deterioration in their fundamental earnings outlook, the realization or removal of the expected catalyst or excessive valuation.
The mid-cap segment of the stock market advanced strongly during the reporting period, turning in results above larger-cap equities. While the Fund produced attractive absolute returns during the six-month period, it underperformed the Russell Mid Cap® Index and the Lipper peer average due primarily to stock selection. In terms of negative contributors, two of the Fund’s more significant sector bets hurt results during the period. The Fund was positioned with an underweight in consumer staples, which ended up being one of the top performing sectors in the index. Likewise, the Fund had an overweight stance in materials, which was the worst performing sector in the benchmark over the six months.
The Fund’s biggest detractor was Energy XXI Ltd., an exploration and production company that sold off significantly during a period when the energy sector was up more than 10%. Although Energy XXI has historically been a solid performer for the Fund, its latest production numbers have come in short of expectations. While the company has been successful extracting oil from assets it recently purchased from Exxon Mobil, its pipeline infrastructure can’t transport the product fast enough. We continue to own Energy XXI in the Fund because we believe the company will be able to solve its infrastructure issues. Performance was also hindered by a position in specialty pharmaceutical firm Impax Laboratories Inc. We originally purchased Impax Laboratories because its valuation was very attractive, it was generating significant free cash flow and it had a number of new drugs in the pipeline. Although it had already received an FDA warning letter about one of its manufacturing facilities, we believed this issue would be quickly resolved. Subsequent to our purchase, the company received a second FDA letter
addressing new manufacturing issues, which further delayed the approval of one of its new drugs to treat Parkinson’s disease. Also, one of the Fund’s specialty retail holdings, Ann Inc., which sells apparel, shoes and accessories under the Ann Taylor and LOFT brand names, performed poorly during the period. Ann was negatively impacted by a modest Christmas sell through and a difficult start to 2013 due, in part, to the reinitiation of former payroll tax rates and the IRS delay in processing income tax returns relative to last year. We sold out of the Fund’s positions in both Impax Laboratories and Ann. Another laggard was IDEXX Laboratories Inc., a manufacturer and distributor of various diagnostic tools and technology solutions to improve veterinary care and food and water safety. IDEXX Laboratories, which has historically been a consistent growth company, changed the way it distributed its products and, as a result, had to alter its sales force. The resulting drop in its organic growth rate caused investors to call its valuation into question. Because we couldn’t forecast when the sales force adjustment would resolve itself, we sold the Fund’s position in IDEXX Laboratories. Finally, performance suffered from a position in CF Industries Holdings, Inc., a large fertilizer company that had previously performed very well as it benefited from last year’s drought conditions. CF Industries gave back some of its gains during the period as this spring’s wet weather conditions have led to less demand for fertilizer, combined with a tougher pricing environment and greater supply. We continue to own this stock due to its attractive valuation and significant free cash flow. We also believe CF Industries will benefit from low natural gas prices in the United States.
Despite the Fund’s underperformance, several of the Fund’s themes were successful including an overweight to smaller-cap names within the benchmark range. For example, small-cap industrial holding Alaska Air Group, Inc. aided the Fund’s results during the six-month period. This regional air carrier continued to maintain the best operating metrics in the industry in terms of return on invested capital, operating margin and balance sheet strength. Alaska Air has executed well against its plan and recently announced it would be initiating a stock buyback. This news, coupled with increased bag fees and a better fuel hedge strategy, is keeping our outlook positive for this stock. Another beneficial smaller-cap industrial name was Swift Transportation Company, which operates broad based transportation services including truckload carriers and rail intermodal services across North America. The company benefited from increased demand for intermodal shipping, which transports freight in special double stacked containers using multiple methods such as railroads, ships and trucks without any direct handling of the freight. Over the period, Swift experienced strong earnings growth, improving profitability and solid stock price performance as a result. Boat and marine engine manufacturer Brunswick Corporation was also a positive contributor to results at the lower end of the Fund’s capitalization range. Brunswick continued to be rewarded for its significant cost cutting efforts during the financial crisis and its tremendous operating leverage. In addition, the company’s results were supported by improvements in housing and employment data, which led to stronger consumer demand for big ticket items. We did decide to sell Brunswick at the end of the period based on the Fund’s large gain in the position and our concerns about a U.S. economic slowdown.
During the market’s strong advance over the six-month period, the Fund’s tilt toward higher beta stocks also helped results as these stocks generally outperformed. For
example, in the energy sector, shares of Plains Exploration & Production Co. advanced significantly. The company engages in the exploration and production of oil and natural gas from onshore and offshore properties in the United States. Plains Exploration & Production received a buyout offer from the world’s leading copper producer, Freeport-McMoRan Copper & Gold Inc., in December 2012 that helped propel the stock.
Elsewhere in the Fund, performance was aided by a position in Tyson Foods Inc., a leading global producer of chicken, beef and pork products. Tyson Foods showed solid gains during this reporting period after selling off in 2012 due to concerns about drought conditions. Several favorable industry trends are helping the company improve its volumes and margins this year including: the closure of one of its competitor’s large beef processing plants that accounted for about 4% of industry volume; Japan’s recent approval of virtually all beef imports from the United States, which the country had banned since the mad cow outbreak in December 2003; the recent outbreak of the bird flu in China, which is improving demand for its chicken products; and expectations for lower grain input costs.
Toward the end of the reporting period, U.S. and global economic data started to show signs of slowing. Therefore, we positioned the Fund with underweights to the more global growth oriented areas, particularly energy. We continued to maintain a modest overweight in consumer discretionary, and especially the retail industry, as we believe the U.S. consumer will hold up better due to improvements in U.S. housing, employment and stock market data. We also moved the Fund to an overweight position in the health care sector as we were finding many good, stable names at attractive valuations. Within the financial sector, the Fund is slightly underweight in banks, where fundamentals remain fairly mixed in terms of earnings growth, but overweight in financial diversifieds as consumers’ balance sheets continue to improve. We are keeping the Fund’s smaller-cap tilt in place and maintaining our strategy’s heavy influence on our quantitative model, which is currently leading us to favor more attractively valued names within the Russell benchmark. Our focus continues to be on selecting stocks with strong or improving fundamentals, attractive valuations relative to their history or the market and identifiable catalysts that should allow us to realize their value.
Nuveen Small Cap Select Fund
How did the Fund perform during the six-month reporting period ended April 30, 2013?
The tables in the Fund Performance and Expense Ratios section of this report provide Class A Share total returns for the Fund for the six-month, one-year, five-year and ten-year periods ended April 30, 2013. The Fund’s Class A Shares at net asset value (NAV) underperformed the Russell 2000® Index and the Lipper classification average over the six-month period.
What strategies were used to manage the Fund during the reporting period? How did these strategies influence performance?
The Fund seeks to provide long-term capital appreciation by investing primarily in the common stocks of companies with market capitalizations of less than $3 billion at the time of purchase. During this period, we continued to execute on our strategy of investing in
well run, small-cap companies we believe offer good value in order to generate competitive returns for the Fund. We also continued to keep the Fund well diversified, with its sector weightings very close to the weights in the Russell 2000® Index.
Small-cap stocks produced very strong results during the reporting period, outperforming large-cap equities, as measured by the S&P 500® Index. While the Fund produced attractive absolute returns, it underperformed the Russell 2000® Index and the Lipper peer average due primarily to stock selection.
The Fund’s biggest detractors were found in the energy sector. Fund holding Energy XXI Ltd., an exploration and production company, sold off significantly during a period when the energy sector overall was up by more than 10%. Although Energy XXI has historically been a solid performer for the Fund, its latest production numbers have come in short of expectations. While the company has been successful extracting oil from assets it recently purchased from Exxon Mobil, its pipeline infrastructure can’t transport the product fast enough. We continue to own Energy XXI in the Fund because we believe the company will be able to solve its infrastructure issues. Also, late in 2012, North America’s onshore oil services industry was hit hard as natural gas prices declined precipitously and drilling dried up as well. With valuations at very low levels, we bought positions in two service providers: Key Energy Services Inc. and Parker Drilling Company. Both of these companies subsequently struggled as the rest of the oil and gas services sector rallied due to a rise in natural gas prices and strong oil prices. Key Energy, in particular, was hindered by specific issues surrounding its assets in Mexico. The Mexican government abruptly decided to change the focus of its country’s drilling activity to its Southern end, away from Key Energy’s equipment. We continued to hold both Parker Drilling and Keys Energy in the Fund; however, we are re-evaluating the investment thesis on both of these ideas as well as the energy sector as a whole.
The Fund also underperformed in the health care sector on a relative basis. The shortfall was primarily due to its underweight in biotechnology, an industry that advanced even more than the strongly performing health care sector overall. In addition, we had two unsuccessful stock picks during the period. The Fund owned a position in Merit Medical Systems, Inc., a small company that makes disposable medical products primarily for hospitals. Unlike most companies, Merit Medical chose not to pass on the new Affordable Care Act device tax to its customers in an effort to be more competitive. As a result, the company had to lower its guidance and its stock price fell significantly. We continued to hold Merit Medical as we believe this is a temporary setback for a well managed company. Also, the Fund was hurt by its position in specialty pharmaceutical firm Impax Laboratories Inc. We originally purchased Impax Laboratories because its valuation was very attractive, it was generating significant free cash flow and it had a number of new drugs in the pipeline. Although it had already received an FDA warning letter about one of its manufacturing facilities, we believed this issue would be quickly resolved. Subsequent to our purchase, the company received a second FDA letter addressing new manufacturing issues, which further delayed the approval of one of its new drugs to treat Parkinson’s disease. We sold out of Impax Laboratories based on this news.
Despite the Fund’s underperformance, the Fund did experience a number of strong small-cap performers during the six months. The Fund’s best results were found in the materials
sector as two of our holdings benefited from industry consolidation and an improved pricing environment. Paper and specialty fiber company Buckeye Technologies Inc. advanced significantly during the six-month period after Georgia-Pacific LLC announced that it would acquire the firm. The Fund also owned containerboard and packaging firm Rock-Tenn Company, which began to reap rewards from its Smurfit-Stone acquisition from the previous year. Rock-Tenn also benefited from favorable industry fundamentals such as improved pricing, higher demand and lower inventory.
Elsewhere in the Fund, specialty retailer Tile Shop Holdings, Inc. advanced dramatically after we added it to the portfolio in November. Tile Shop, which offers top notch tile products in its well formatted stores, benefited from increasing sales due to the pickup in both the housing market and the economy overall. We continue to own this stock, but did trim the Fund’s weight due to its strong returns. In industrials, temporary blue collar staffing company TrueBlue Inc. showed solid results as the economy and the construction industry improved. However, we did end up trimming the Fund’s position in TrueBlue toward the end of the period due to valuation and risk management. While utilities don’t typically have a big presence in this portfolio, we did benefit from ownership in Atmos Energy Corporation, a regulated gas utility in Texas. Atmos Energy’s stock price advanced during the period as the company continued to experience volume growth and pay out an attractive dividend. We took some profits in Atmos Energy and lowered the Fund’s exposure as its valuation appeared somewhat stretched.
Results were mixed in the technology sector, where the Fund’s semiconductor holdings performed very well, including International Rectifier Corp., Semtech Corporation and Integrated Device Technology Inc. After the highly cyclical semiconductor segment sold off strongly last year, the tide started to turn during this period. Integrated Device Technology benefited from better traction for its flash card controller product sold to wireless telecommunication providers. The other two companies were aided by a revival in demand for electronic equipment. Semtech has significant exposure to the telecommunications end market, while International Rectifier has more industrial and automotive computer exposure. Also in technology, Euronet Worldwide, Inc. advanced significantly over this six-month time frame as the company continued to post strong earnings. Euronet, which owns cash machines and other electronic payment systems primarily in Europe, benefited as European banks tried to raise capital by selling their cash machines. Elsewhere in technology, several of the Fund’s holdings in the software as a service (SaaS) segment fell short. For example, online SaaS marketing company Vocus continued to struggle during the period. While Vocus remains in a growing segment and has a solid offering, the company is taking longer to gain traction with its product line after last year’s strategic acquisition. Shares continued to decline after its profitability dropped further. Two other holdings in the SaaS industry, Keynote Systems Inc. and LogMeIn Inc. also disappointed. Keynote Systems, a provider of on demand testing and monitoring products that help improve mobile communications and internet performance, saw its margins come in as execution for its main product was not very strong. Shares of LogMeIn, the market’s leading remote connection and troubleshooting provider for cloud based services, fell significantly after the company posted solid fourth quarter 2012 results, but guided to revenue growth for calendar 2013 that was considerably below investors’ expectations. We continued to hold onto Vocus as we believe it has a quality
product that is hitting the market at the right time. Although Vocus has struggled as of late, we believe its transition period is over and the company will show improved execution and results going forward. However, we sold LogMeIn out of the Fund.
The Fund’s financial exposure underperformed slightly, mostly due to our underweight position in a sector that advanced more than 17% over this time frame; however, individual stock selection was strong. Within the sector and our Fund, the insurance industry led the way. Fund positions such as Maiden Holdings Ltd., Tower Group Companies and First American Financial Corporation aided results. Insurance related stocks had been selling below book value as people worried about the payouts needed to cover recent catastrophes such as Hurricane Sandy. However, these stocks performed well after claims were not as bad as some worst case scenarios had predicted, while the most recent pricing and renewal cycles were strong. Also in financials, the Fund gained from its ownership in investment bank Evercore Partners Inc. and asset manager Waddell & Reed Financial Inc. Evercore benefited from a significant fourth quarter increase in mergers and acquisitions and other corporate deals as the U.S. economy showed signs of improvement. Waddell & Reed saw strong flows into its mutual funds as performance was favorable and the economy picked up steam.
Risk Considerations
Mutual fund investing involves risk; principal loss is possible.
Nuveen Large Cap Select Fund
Equity investments, such as those held by the Fund, are subject to market risk, derivatives risk, and common stock risk. Foreign investments involve additional risks including currency fluctuations, political and economic instability, and lack of liquidity. These risks are magnified in emerging markets.
Nuveen Mid Cap Select Fund
Equity investments, such as those held by the Fund, are subject to market risk, derivatives risk, and common stock risk. Mid-cap stocks are subject to greater volatility. Foreign investments involve additional risks including currency fluctuations, political and economic instability, and lack of liquidity. These risks are magnified in emerging markets.
Nuveen Small Cap Select Fund
Equity investments, such as those held by the Fund, are subject to market risk, derivatives risk, IPO risk, and common stock risk. Small-cap stocks are subject to greater volatility and liquidity risks. Foreign investments involve additional risks including currency fluctuations, political and economic instability, and lack of liquidity. These risks are magnified in emerging markets.
Fund Performance and Expense Ratios
The Fund Performance and Expense Ratios for each Fund are shown on the following three pages.
Returns quoted represent past performance, which is no guarantee of future results. Current performance may be higher or lower than the performance shown. Investment returns and principal value will fluctuate so that when shares are redeemed, they may be worth more or less than their original cost. Returns without sales charges would be lower if the sales charge were included. Returns do not reflect the deduction of taxes that a shareholder would pay on Fund distributions or the redemption of Fund shares.
Returns may reflect a contractual agreement between certain Funds and the investment adviser to waive certain fees and expenses; see Notes to Financial Statements, Footnote 7 — Management Fees and Other Transactions with Affiliates for more information. In addition, returns may reflect a voluntary expense limitation by the Funds’ investment adviser that may be modified or discontinued at any time without notice. For the most recent month-end performance visit www.nuveen.com or call (800) 257-8787.
Returns reflect differences in sales charges and expenses, which are primarily differences in distribution and service fees. Fund returns assume reinvestment of dividends and capital gains.
Comparative index and Lipper return information is provided for the Funds’ Class A Shares at net asset value (NAV) only.
The expense ratios shown reflect the Funds’ total operating expenses (before fee waivers and/or expense reimbursements, if any) as shown in the Funds’ most recent prospectus. The expense ratios include management fees and other fees and expenses.
Fund Performance and Expense Ratios (continued)
Nuveen Large Cap Select Fund
Refer to the first page of this Fund Performance and Expense Ratios section for further explanation of the information included within this page.
Fund Performance
Average Annual Total Returns as of April 30, 2013
| | | | | | | | | | | | | | | | |
| | |
| | | Cumulative | | | Average Annual | |
| | | | |
| | | 6-Month | | | 1-Year | | | 5-Year | | | 10-Year | |
Class A Shares at NAV | | | 15.30% | | | | 14.61% | | | | 3.36% | | | | 6.66% | |
Class A Shares at maximum Offering Price | | | 8.66% | | | | 8.05% | | | | 2.14% | | | | 6.03% | |
S&P 500® Index* | | | 14.42% | | | | 16.89% | | | | 5.21% | | | | 7.88% | |
Lipper Large-Cap Core Funds Classification Average* | | | 14.17% | | | | 15.80% | | | | 4.21% | | | | 7.37% | |
| | | | |
Class C Shares | | | 14.84% | | | | 13.85% | | | | 2.59% | | | | 5.84% | |
Class I Shares | | | 15.38% | | | | 14.96% | | | | 3.61% | | | | 6.93% | |
Average Annual Total Returns as of March 31, 2013 (Most Recent Calendar Quarter)
| | | | | | | | | | | | | | | | |
| | |
| | | Cumulative | | | Average Annual | |
| | | | |
| | | 6-Month | | | 1-Year | | | 5-Year | | | 10-Year | |
Class A Shares at NAV | | | 12.49% | | | | 12.74% | | | | 4.45% | | | | 7.25% | |
Class A Shares at maximum Offering Price | | | 6.03% | | | | 6.25% | | | | 3.22% | | | | 6.62% | |
Class C Shares | | | 12.06% | | | | 11.88% | | | | 3.67% | | | | 6.43% | |
Class I Shares | | | 12.60% | | | | 12.93% | | | | 4.70% | | | | 7.53% | |
Class A Shares have a maximum 5.75% sales charge (Offering Price). Class A Share purchases of $1 million or more are sold at net asset value without an up-front sales charge but may be subject to a contingent deferred sales charge (CDSC), also known as a back-end sales charge, if redeemed within twelve months of purchase. Class C Shares have a 1% CDSC for redemptions within less than twelve months, which is not reflected in the one-year total return. Class I Shares have no sales charge and may be purchased under limited circumstances or by specified classes of investors.
Expense Ratios as of Most Recent Prospectus
| | | | |
| |
| | | Expense
Ratios | |
Class A Shares | | | 1.41% | |
Class C Shares | | | 2.16% | |
Class I Shares | | | 1.16% | |
| * | Refer to the Glossary of Terms Used in this Report for definitions. Indexes and Lipper averages are not available for direct investment. |
Nuveen Mid Cap Select Fund
Refer to the first page of this Fund Performance and Expense Ratios section for further explanation of the information included within this page.
Fund Performance
Average Annual Total Returns as of April 30, 2013
| | | | | | | | | | | | | | | | |
| | |
| | | Cumulative | | | Average Annual | |
| | | | |
| | | 6-Month | | | 1-Year | | | 5-Year | | | 10-Year | |
Class A Shares at NAV | | | 15.06% | | | | 11.70% | | | | 4.22% | | | | 8.05% | |
Class A Shares at maximum Offering Price | | | 8.43% | | | | 5.25% | | | | 2.99% | | | | 7.42% | |
Russell Midcap® Index* | | | 18.90% | | | | 19.20% | | | | 7.24% | | | | 11.63% | |
Lipper Mid-Cap Core Funds Classification Average* | | | 17.15% | | | | 16.12% | | | | 5.74% | | | | 9.74% | |
| | | | |
Class C Shares | | | 14.59% | | | | 10.93% | | | | 3.43% | | | | 7.24% | |
Class I Shares | | | 15.13% | | | | 11.92% | | | | 4.45% | | | | 8.30% | |
Average Annual Total Returns as of March 31, 2013 (Most Recent Calendar Quarter)
| | | | | | | | | | | | | | | | |
| | |
| | | Cumulative | | | Average Annual | |
| | | | |
| | | 6-Month | | | 1-Year | | | 5-Year | | | 10-Year | |
Class A Shares at NAV | | | 12.59% | | | | 10.17% | | | | 4.91% | | | | 8.79% | |
Class A Shares at maximum Offering Price | | | 6.12% | | | | 3.88% | | | | 3.68% | | | | 8.31% | |
Class C Shares | | | 12.12% | | | | 9.38% | | | | 4.14% | | | | 8.15% | |
Class I Shares | | | 12.67% | | | | 10.46% | | | | 5.17% | | | | 9.23% | |
Class A Shares have a maximum 5.75% sales charge (Offering Price). Class A Share purchases of $1 million or more are sold at net asset value without an up-front sales charge but may be subject to a contingent deferred sales charge (CDSC), also known as a back-end sales charge, if redeemed within twelve months of purchase. Class C Shares have a 1% CDSC for redemptions within less than twelve months, which is not reflected in the one-year total return. Class I Shares have no sales charge and may be purchased under limited circumstances or by specified classes of investors.
Expense Ratios as of Most Recent Prospectus
| | | | | | | | |
| | |
| | | Gross
Expense
Ratios | | | Net
Expense
Ratios | |
Class A Shares | | | 1.84% | | | | 1.41% | |
Class C Shares | | | 2.59% | | | | 2.16% | |
Class I Shares | | | 1.59% | | | | 1.16% | |
The Fund’s investment adviser has contractually agreed to waive fees and/or reimburse other Fund expenses through February 28, 2014, so that total annual Fund operating expenses, after fee waivers and/or expense reimbursements and excluding acquired fund fees and expenses, do not exceed 1.41%, 2.16% and 1.16%, for Class A, Class C and Class I Shares, respectively. Fee waivers and/or expense reimbursements will not be terminated prior to that time without the approval of the Fund’s Board of Directors.
| * | Refer to the Glossary of Terms Used in this Report for definitions. Indexes and Lipper averages are not available for direct investment. |
Fund Performance and Expense Ratios (continued)
Nuveen Small Cap Select Fund
Refer to the first page of this Fund Performance and Expense Ratios section for further explanation of the information included within this page.
Fund Performance
Average Annual Total Returns as of April 30, 2013
| | | | | | | | | | | | | | | | |
| | |
| | | Cumulative | | | Average Annual | |
| | | | |
| | | 6-Month | | | 1-Year | | | 5-Year | | | 10-Year | |
Class A Shares at NAV | | | 12.71% | | | | 10.91% | | | | 7.33% | | | | 10.04% | |
Class A Shares at maximum Offering Price | | | 6.20% | | | | 4.53% | | | | 6.06% | | | | 9.40% | |
Russell 2000® Index* | | | 16.58% | | | | 17.69% | | | | 7.27% | | | | 10.47% | |
Lipper Small-Cap Core Funds Classification Average* | | | 15.74% | | | | 15.47% | | | | 6.81% | | | | 10.27% | |
| | | | |
Class B Shares w/o CDSC | | | 12.24% | | | | 10.14% | | | | 6.54% | | | | 9.22% | |
Class B Shares w/CDSC | | | 7.78% | | | | 5.76% | | | | 6.38% | | | | 9.22% | |
Class C Shares | | | 12.28% | | | | 10.09% | | | | 6.52% | | | | 9.23% | |
Class R3 Shares | | | 12.51% | | | | 10.58% | | | | 7.06% | | | | 9.80% | |
Class I Shares | | | 12.78% | | | | 11.20% | | | | 7.59% | | | | 10.32% | |
Average Annual Total Returns as of March 31, 2013 (Most Recent Calendar Quarter)
| | | | | | | | | | | | | | | | |
| | |
| | | Cumulative | | | Average Annual | |
| | | | |
| | | 6-Month | | | 1-Year | | | 5-Year | | | 10-Year | |
Class A Shares at NAV | | | 11.47% | | | | 10.06% | | | | 8.91% | | | | 11.00% | |
Class A Shares at maximum Offering Price | | | 5.10% | | | | 3.70% | | | | 7.63% | | | | 10.34% | |
Class B Shares w/o CDSC | | | 10.96% | | | | 9.15% | | | | 8.10% | | | | 10.17% | |
Class B Shares w/CDSC | | | 6.55% | | | | 4.81% | | | | 7.95% | | | | 10.17% | |
Class C Shares | | | 11.04% | | | | 9.29% | | | | 8.11% | | | | 10.17% | |
Class R3 Shares | | | 11.35% | | | | 9.81% | | | | 8.66% | | | | 10.77% | |
Class I Shares | | | 11.62% | | | | 10.39% | | | | 9.20% | | | | 11.28% | |
Class A Shares have a maximum 5.75% sales charge (Offering Price). Class A Share purchases of $1 million or more are sold at net asset value without an up-front sales charge but may be subject to a contingent deferred sales charge (CDSC), also known as a back-end sales charge, if redeemed within twelve months of purchase. Class B Shares have a CDSC that begins at 5% for redemptions during the first year and declines periodically until after six years when the charge becomes 0%. Class B Shares automatically convert to Class A Shares eight years after purchase. Class C Shares have a 1% CDSC for redemptions within less than twelve months, which is not reflected in the one-year total return. Class R3 Shares have no sales charge and are only available for purchase by eligible retirement plans. Class I Shares have no sales charge and may be purchased under limited circumstances or by specified classes of investors.
Expense Ratios as of Most Recent Prospectus
| | | | |
| |
| | | Expense
Ratios | |
Class A Shares | | | 1.36% | |
Class B Shares | | | 2.11% | |
Class C Shares | | | 2.11% | |
Class R3 Shares | | | 1.61% | |
Class I Shares | | | 1.11% | |
| * | Refer to the Glossary of Terms Used in this Report for definitions. Indexes and Lipper averages are not available for direct investment. |
Holding Summaries as of April 30, 2013
This data relates to the securities held in each Fund’s portfolio of investments. It should not be construed as a measure of performance for the Fund itself.
Nuveen Large Cap Select Fund
Portfolio Allocation1
| | | | |
| Common Stocks | | | 98.2% | |
| Short-Term Investments | | | 0.0% | 2 |
| Other3 | | | 1.8% | |
Nuveen Mid Cap Select Fund
Portfolio Allocation1
| | | | |
| Common Stocks | | | 99.3% | |
| Short-Term Investments | | | 0.8% | |
| Other3 | | | (0.1)% | |
| | | | |
| Portfolio Composition1 | |
| Pharmaceuticals | | | 7.4% | |
| Oil, Gas & Consumable Fuels | | | 7.0% | |
| Diversified Financial Services | | | 6.9% | |
| Food Products | | | 5.6% | |
| Software | | | 5.2% | |
| Internet Software & Services | | | 4.7% | |
| Insurance | | | 4.2% | |
| Biotechnology | | | 3.8% | |
| Communications Equipment | | | 3.7% | |
| Chemicals | | | 3.6% | |
| Diversified Telecommunication Services | | | 3.5% | |
| Electric Utilities | | | 3.4% | |
| Specialty Retail | | | 3.4% | |
| Health Care Providers & Services | | | 3.3% | |
| Aerospace & Defense | | | 3.1% | |
| Health Care Equipment & Supplies | | | 2.8% | |
| Electrical Equipment | | | 2.4% | |
| Energy Equipment & Services | | | 2.2% | |
| Food & Staples Retailing | | | 2.2% | |
| Household Durables | | | 2.1% | |
| Semiconductors & Equipment | | | 2.1% | |
| Short-Term Investments | | | 0.0% | 2 |
| Other4 | | | 17.4% | |
| | | | |
| Portfolio Composition1 | |
| Real Estate Investment Trust | | | 6.9% | |
| Biotechnology | | | 5.1% | |
| Electric Utilities | | | 4.9% | |
| Electrical Equipment | | | 4.6% | |
| Insurance | | | 4.5% | |
| Chemicals | | | 4.3% | |
| Specialty Retail | | | 3.9% | |
| Consumer Finance | | | 3.8% | |
| Food Products | | | 3.8% | |
| Software | | | 3.7% | |
| Oil, Gas & Consumable Fuels | | | 3.5% | |
| Machinery | | | 3.5% | |
| Semiconductors & Equipment | | | 3.4% | |
| Household Durables | | | 2.7% | |
| Commercial Banks | | | 2.3% | |
| Health Care Providers & Services | | | 2.3% | |
| Capital Markets | | | 2.3% | |
| Communications Equipment | | | 2.2% | |
| Health Care Equipment & Supplies | | | 2.1% | |
| Personal Products | | | 1.7% | |
| Gas Utilities | | | 1.5% | |
| Paper & Forest Products | | | 1.5% | |
| Internet Software & Services | | | 1.4% | |
| Airlines | | | 1.4% | |
| IT Services | | | 1.4% | |
| Energy Equipment & Services | | | 1.4% | |
| Short-Term Investments | | | 0.8% | |
| Other5 | | | 19.1% | |
| | | | |
| Top Five Common Stock Holdings1 | |
| Verizon Communication, Inc. | | | 3.5% | |
| Pfizer Inc. | | | 3.0% | |
| Google Inc., Class A | | | 3.0% | |
| Citigroup Inc. | | | 2.8% | |
| Edison International | | | 2.5% | |
| | | | |
| Top Five Common Stock Holdings1 | |
| Tyson Foods Inc., Class A | | | 1.7% | |
| Nu Skin Enterprises Inc., Class A | | | 1.7% | |
| SLM Corporation | | | 1.6% | |
| Edison International | | | 1.6% | |
| Rockwell Automation Inc. | | | 1.6% | |
| | | | |
| 1 | As a percentage of net assets. Holdings are subject to change. |
| 3 | Other assets less liabilities, which includes investments purchased with collateral from securities lending as presented in the Fund’s Portfolio of Investments. |
| 4 | Other assets less liabilities, which includes investments purchased with collateral from securities lending as presented in the Fund’s Portfolio of Investments and all industries less than 2.1% of net assets. |
| 5 | Other assets less liabilities, which includes investments purchased with collateral from securities lending as presented in the Fund’s Portfolio of Investments and all industries less than 1.4%. |
Holding Summaries (continued)
Nuveen Small Cap Select Fund
| | | | |
| Portfolio Allocation1 | | | |
| Common Stocks | | | 96.9% | |
| Short-Term Investments | | | 3.7% | |
| Other2 | | | (0.6)% | |
| | | | |
| Portfolio Composition1 | |
| Real Estate Investment Trust | | | 6.7% | |
| Capital Markets | | | 6.4% | |
| Specialty Retail | | | 5.5% | |
| Machinery | | | 4.9% | |
| Health Care Equipment & Supplies | | | 4.9% | |
| Semiconductors & Equipment | | | 4.7% | |
| Commercial Banks | | | 4.4% | |
| Insurance | | | 4.0% | |
| Food & Staples Retailing | | | 3.2% | |
| Energy Equipment & Services | | | 3.1% | |
| Oil, Gas & Consumable Fuels | | | 2.9% | |
| Construction & Engineering | | | 2.9% | |
| Biotechnology | | | 2.8% | |
| IT Services | | | 2.8% | |
| Software | | | 2.6% | |
| Health Care Providers & Services | | | 2.3% | |
| Household Durables | | | 2.0% | |
| Food Products | | | 2.0% | |
| Hotels, Restaurants & Leisure | | | 2.0% | |
| Gas Utilities | | | 1.9% | |
| Professional Services | | | 1.8% | |
| Textiles, Apparel & Luxury Goods | | | 1.8% | |
| Thrifts & Mortgage Finance | | | 1.6% | |
| Short-Term Investments | | | 3.8% | |
| Other3 | | | 19.0% | |
| | | | |
| Top Five Common Stock Holdings1 | |
| Waddell & Reed Financial Inc., Class A | | | 2.0% | |
| Euronet Worldwide Inc. | | | 1.9% | |
| Atmos Energy Corporation | | | 1.9% | |
| G III Apparel Group, Limited | | | 1.8% | |
| International Rectifier Corporation | | | 1.6% | |
| 1 | As a percentage of net assets. Holdings are subject to change. |
| 2 | Other assets less liabilities, which includes investments purchased with collateral from securities lending as presented in the Fund’s Portfolio of Investments. |
| 3 | Other assets less liabilities, which includes investments purchased with collateral from securities lending as presented in the Fund’s Portfolio of Investments and all industries less than 1.6% of net assets. |
Expense Examples
As a shareholder of one or more of the Funds, you incur two types of costs: (1) transaction costs, including up-front and back-end sales charges (loads) or redemption fees, where applicable; and (2) ongoing costs, including management fees; distribution and service (12b-1) fees, where applicable; and other Fund expenses. The Examples below are intended to help you understand your ongoing costs (in dollars) of investing in the Funds and to compare these costs with the ongoing costs of investing in other mutual funds.
The Examples below are based on an investment of $1,000 invested at the beginning of the period and held through the end of the period.
The information under “Actual Performance,” together with the amount you invested, allows you to estimate actual expenses incurred over the reporting period. Simply divide your account value by $1,000 (for example, an $8,600 account value divided by $1,000 = 8.60) and multiply the result by the cost shown for your share class, in the row entitled “Expenses Incurred During Period” to estimate the expenses incurred on your account during this period.
The information under “Hypothetical Performance,” provides information about hypothetical account values and hypothetical expenses based on the respective Fund’s actual expense ratio and an assumed rate of return of 5% per year before expenses, which is not the Fund’s actual return. The hypothetical account values and expenses may not be used to estimate the actual ending account balance or expense you incurred for the period. You may use this information to compare the ongoing costs of investing in the Fund and other Funds. To do so, compare this 5% hypothetical example with the 5% hypothetical examples that appear in the shareholder reports of the other funds.
Please note that the expenses shown in the table are meant to highlight your ongoing costs only and do not reflect any transaction costs. Therefore, the hypothetical information is useful in comparing ongoing costs only, and will not help you determine the relative total costs of owning different funds or share classes. In addition, if these transaction costs were included, your costs would have been higher.
Nuveen Large Cap Select Fund
| | | | | | | | | | | | | | | | | | | | | | | | | | |
| | | Actual Performance | | Hypothetical Performance
(5% annualized return before expenses) | |
| | | A Shares | | | C Shares | | | I Shares | | | | | A Shares | | | C Shares | | | I Shares | |
| Beginning Account Value (11/01/12) | | $ | 1,000.00 | | | $ | 1,000.00 | | | $ | 1,000.00 | | | | | $ | 1,000.00 | | | $ | 1,000.00 | | | $ | 1,000.00 | |
| Ending Account Value (4/30/13) | | $ | 1,153.00 | | | $ | 1,148.40 | | | $ | 1,153.80 | | | | | $ | 1,018.15 | | | $ | 1,014.43 | | | $ | 1,019.39 | |
| Expenses Incurred During Period | | $ | 7.15 | | | $ | 11.13 | | | $ | 5.82 | | | | | $ | 6.71 | | | $ | 10.44 | | | $ | 5.46 | |
For each class of the Fund, expenses are equal to the Fund’s annualized net expense ratio of 1.34%, 2.09% and 1.09% for Classes A, C, R3 and I, respectively, multiplied by the average account value over the period, multiplied by 181/365 (to reflect the one-half year period).
Nuveen Mid Cap Select Fund
| | | | | | | | | | | | | | | | | | | | | | | | | | |
| | | Actual Performance | | | | | Hypothetical Performance
(5% annualized return before expenses) | |
| | | A Shares | | | C Shares | | | I Shares | | | | | A Shares | | | C Shares | | | I Shares | |
| Beginning Account Value (11/01/12) | | $ | 1,000.00 | | | $ | 1,000.00 | | | $ | 1,000.00 | | | | | $ | 1,000.00 | | | $ | 1,000.00 | | | $ | 1,000.00 | |
| Ending Account Value (4/30/13) | | $ | 1,150.60 | | | $ | 1,145.90 | | | $ | 1,151.30 | | | | | $ | 1,017.80 | | | $ | 1,014.08 | | | $ | 1,019.04 | |
| Expenses Incurred During Period | | $ | 7.52 | | | $ | 11.49 | | | $ | 6.19 | | | | | $ | 7.05 | | | $ | 10.79 | | | $ | 5.81 | |
For each class of the Fund, expenses are equal to the Fund’s annualized net expense ratio of 1.41%, 2.16% and 1.16% for Classes A, C and I, respectively, multiplied by the average account value over the period, multiplied by 181/365 (to reflect the one-half year period).
Nuveen Small Cap Select Fund
| | | | | | | | | | | | | | | | | | | | | | | | | | | | | | | | | | | | | | | | | | |
| | | Actual Performance | | | | | Hypothetical Performance
(5% annualized return before expenses) | |
| | | A Shares | | | B Shares | | | C Shares | | | R3 Shares | | | I Shares | | | | | A Shares | | | B Shares | | | C Shares | | | R3 Shares | | | I Shares | |
| Beginning Account Value (11/01/12) | | $ | 1,000.00 | | | $ | 1,000.00 | | | $ | 1,000.00 | | | $ | 1,000.00 | | | $ | 1,000.00 | | | | | $ | 1,000.00 | | | $ | 1,000.00 | | | $ | 1,000.00 | | | $ | 1,000.00 | | | $ | 1,000.00 | |
| Ending Account Value (4/30/13) | | $ | 1,127.10 | | | $ | 1,122.40 | | | $ | 1,122.80 | | | $ | 1,125.10 | | | $ | 1,127.80 | | | | | $ | 1,018.25 | | | $ | 1,014.53 | | | $ | 1,014.53 | | | $ | 1,017.01 | | | $ | 1,019.49 | |
| Expenses Incurred During Period | | $ | 6.96 | | | $ | 10.89 | | | $ | 10.90 | | | $ | 8.27 | | | $ | 5.65 | | | | | $ | 6.61 | | | $ | 10.34 | | | $ | 10.34 | | | $ | 7.85 | | | $ | 5.36 | |
For each class of the Fund, expenses are equal to the Fund’s annualized net expense ratio of 1.32%, 2.07%, 2.07%, 1.57% and 1.07% for Classes A, B, C, R3 and I, respectively, multiplied by the average account value over the period, multiplied by 181/365 (to reflect the one-half year period).
Portfolio of Investments (Unaudited)
Nuveen Large Cap Select Fund
April 30, 2013
| | | | | | | | | | | | | | |
| Shares | | | Description (1) | | | | | | | | Value | |
| | | | COMMON STOCKS – 98.2% | | | | | | | | | | |
| | | | | |
| | | | Aerospace & Defense – 3.1% | | | | | | | | | | |
| | | | | |
| | 6,649 | | | Boeing Company | | | | | | | | $ | 607,785 | |
| | | | | |
| | 6,117 | | | United Technologies Corporation | | | | | | | | | 558,421 | |
| | | | Total Aerospace & Defense | | | | | | | | | 1,166,206 | |
| | | | Auto Components – 0.9% | | | | | | | | | | |
| | | | | |
| | 4,159 | | | BorgWarner Inc., (2) | | | | | | | | | 325,109 | |
| | | | Biotechnology – 3.8% | | | | | | | | | | |
| | | | | |
| | 4,946 | | | Celgene Corporation, (2) | | | | | | | | | 583,974 | |
| | | | | |
| | 16,267 | | | Gilead Sciences, Inc., (2), (3) | | | | | | | | | 823,761 | |
| | | | Total Biotechnology | | | | | | | | | 1,407,735 | |
| | | | Building Products – 1.0% | | | | | | | | | | |
| | | | | |
| | 18,662 | | | Masco Corporation | | | | | | | | | 362,789 | |
| | | | Capital Markets – 0.7% | | | | | | | | | | |
| | | | | |
| | 12,278 | | | Morgan Stanley, (3) | | | | | | | | | 271,958 | |
| | | | Chemicals – 3.6% | | | | | | | | | | |
| | | | | |
| | 1,439 | | | CF Industries Holding, Inc. | | | | | | | | | 268,388 | |
| | | | | |
| | 7,255 | | | LyondellBasell Industries NV | | | | | | | | | 440,379 | |
| | | | | |
| | 6,115 | | | Monsanto Company | | | | | | | | | 653,204 | |
| | | | Total Chemicals | | | | | | | | | 1,361,971 | |
| | | | Commercial Banks – 1.9% | | | | | | | | | | |
| | | | | |
| | 18,413 | | | Wells Fargo & Company | | | | | | | | | 699,326 | |
| | | | Communications Equipment – 3.7% | | | | | | | | | | |
| | | | | |
| | 41,145 | | | Cisco Systems, Inc. | | | | | | | | | 860,753 | |
| | | | | |
| | 8,940 | | | Motorola Solutions Inc. | | | | | | | | | 511,368 | |
| | | | Total Communications Equipment | | | | | | | | | 1,372,121 | |
| | | | Consumer Finance – 2.0% | | | | | | | | | | |
| | | | | |
| | 35,621 | | | SLM Corporation, (3) | | | | | | | | | 735,574 | |
| | | | Diversified Financial Services – 6.9% | | | | | | | | | | |
| | | | | |
| | 51,407 | | | Bank of America Corporation | | | | | | | | | 632,820 | |
| | | | | |
| | 22,333 | | | Citigroup Inc. | | | | | | | | | 1,042,058 | |
| | | | | |
| | 18,337 | | | JPMorgan Chase & Co. | | | | | | | | | 898,696 | |
| | | | Total Diversified Financial Services | | | | | | | | | 2,573,574 | |
| | | | Diversified Telecommunication Services – 3.5% | | | | | | | | | | |
| | | | | |
| | 24,076 | | | Verizon Communications Inc. | | | | | | | | | 1,297,937 | |
| | | | Electric Utilities – 3.4% | | | | | | | | | | |
| | | | | |
| | 17,258 | | | Edison International | | | | | | | | | 928,480 | |
| | | | | |
| | 15,090 | | | NV Energy Inc. | | | | | | | | | 326,397 | |
| | | | Total Electric Utilities | | | | | | | | | 1,254,877 | |
| | | | Electrical Equipment – 2.4% | | | | | | | | | | |
| | | | | |
| | 7,739 | | | Eaton Corporation PLC | | | | | | | | | 475,252 | |
| | | | | |
| | 5,138 | | | Rockwell Automation, Inc. | | | | | | | | | 435,600 | |
| | | | Total Electrical Equipment | | | | | | | | | 910,852 | |
| | | | Energy Equipment & Services – 2.2% | | | | | | | | | | |
| | | | | |
| | 6,710 | | | Cooper Cameron Corporation, (2) | | | | | | | | | 413,001 | |
| | | | | |
| | 9,621 | | | Halliburton Company | | | | | | | | | 411,490 | |
| | | | Total Energy Equipment & Services | | | | | | | | | 824,491 | |
| | | | | | | | | | | | | | |
| Shares | | | Description (1) | | | | | | | | Value | |
| | | | Food & Staples Retailing – 2.2% | | | | | | | | | | |
| | | | | |
| | 16,535 | | | Walgreen Co. | | | | | | | | $ | 818,648 | |
| | | | Food Products – 5.6% | | | | | | | | | | |
| | | | | |
| | 22,200 | | | ConAgra Foods, Inc. | | | | | | | | | 785,214 | |
| | | | | |
| | 25,681 | | | Mondelez International Inc., Class A | | | | | | | | | 807,667 | |
| | | | | |
| | 20,913 | | | Tyson Foods, Inc., Class A | | | | | | | | | 515,087 | |
| | | | Total Food Products | | | | | | | | | 2,107,968 | |
| | | | Health Care Equipment & Supplies – 2.8% | | | | | | | | | | |
| | | | | |
| | 6,400 | | | Becton, Dickinson and Company | | | | | | | | | 603,520 | |
| | | | | |
| | 7,149 | | | Covidien PLC | | | | | | | | | 456,392 | |
| | | | Total Health Care Equipment & Supplies | | | | | | | | | 1,059,912 | |
| | | | Health Care Providers & Services – 3.3% | | | | | | | | | | |
| | | | | |
| | 8,356 | | | CIGNA Corporation | | | | | | | | | 552,917 | |
| | | | | |
| | 11,217 | | | UnitedHealth Group Incorporated | | | | | | | | | 672,235 | |
| | | | Total Health Care Providers & Services | | | | | | | | | 1,225,152 | |
| | | | Household Durables – 2.1% | | | | | | | | | | |
| | | | | |
| | 8,734 | | | Jarden Corporation, (2) | | | | | | | | | 393,117 | |
| | | | | |
| | 3,489 | | | Whirlpool Corporation | | | | | | | | | 398,723 | |
| | | | Total Household Durables | | | | | | | | | 791,840 | |
| | | | Insurance – 4.2% | | | | | | | | | | |
| | | | | |
| | 13,505 | | | Allstate Corporation | | | | | | | | | 665,256 | |
| | | | | |
| | 12,192 | | | Lincoln National Corporation | | | | | | | | | 414,650 | |
| | | | | |
| | 7,828 | | | Prudential Financial, Inc. | | | | | | | | | 472,968 | |
| | | | Total Insurance | | | | | | | | | 1,552,874 | |
| | | | Internet & Catalog Retail – 1.2% | | | | | | | | | | |
| | | | | |
| | 632 | | | priceline.com Incorporated, (2) | | | | | | | | | 439,866 | |
| | | | Internet Software & Services – 4.7% | | | | | | | | | | |
| | | | | |
| | 16,591 | | | AOL Inc. | | | | | | | | | 641,076 | |
| | | | | |
| | 1,369 | | | Google Inc., Class A, (2) | | | | | | | | | 1,128,836 | |
| | | | Total Internet Software & Services | | | | | | | | | 1,769,912 | |
| | | | IT Services – 1.5% | | | | | | | | | | |
| | | | | |
| | 981 | | | MasterCard, Inc., Class A | | | | | | | | | 542,424 | |
| | | | Leisure Equipment & Products – 1.0% | | | | | | | | | | |
| | | | | |
| | 4,529 | | | Polaris Industries Inc. | | | | | | | | | 390,355 | |
| | | | Life Sciences Tools & Services – 1.0% | | | | | | | | | | |
| | | | | |
| | 9,019 | | | Agilent Technologies, Inc. | | | | | | | | | 373,747 | |
| | | | Machinery – 1.0% | | | | | | | | | | |
| | | | | |
| | 5,549 | | | Dover Corporation, (3) | | | | | | | | | 382,770 | |
| | | | Media – 1.1% | | | | | | | | | | |
| | | | | |
| | 3,601 | | | Liberty Media Corporation, (2) | | | | | | | | | 413,683 | |
| | | | Multiline Retail – 1.2% | | | | | | | | | | |
| | | | | |
| | 10,062 | | | Macy’s, Inc. | | | | | | | | | 448,765 | |
| | | | Oil, Gas & Consumable Fuels – 7.0% | | | | | | | | | | |
| | | | | |
| | 6,835 | | | Anadarko Petroleum Corporation | | | | | | | | | 579,335 | |
| | | | | |
| | 6,456 | | | Chevron Corporation | | | | | | | | | 787,697 | |
| | | | | |
| | 7,698 | | | Devon Energy Corporation, (3) | | | | | | | | | 423,852 | |
Portfolio of Investments (Unaudited)
Nuveen Large Cap Select Fund (continued)
April 30, 2013
| | | | | | | | | | | | | | |
| Shares | | | Description (1) | | | | | | | | Value | |
| | | | Oil, Gas & Consumable Fuels (continued) | | | | | | | | | | |
| | | | | |
| | 13,274 | | | Marathon Oil Corporation | | | | | | | | $ | 433,662 | |
| | | | | |
| | 4,426 | | | Occidental Petroleum Corporation | | | | | | | | | 395,065 | |
| | | | Total Oil, Gas & Consumable Fuels | | | | | | | | | 2,619,611 | |
| | | | Paper & Forest Products – 1.1% | | | | | | | | | | |
| | | | | |
| | 9,045 | | | International Paper Company | | | | | | | | | 424,934 | |
| | | | Pharmaceuticals – 7.4% | | | | | | | | | | |
| | | | | |
| | 8,138 | | | GlaxoSmithKline PLC, (3) | | | | | | | | | 420,246 | |
| | | | | |
| | 17,739 | | | Merck & Company Inc. | | | | | | | | | 833,733 | |
| | | | | |
| | 39,111 | | | Pfizer Inc. | | | | | | | | | 1,136,957 | |
| | | | | |
| | 11,139 | | | Zoetis Incorporated | | | | | | | | | 367,810 | |
| | | | Total Pharmaceuticals | | | | | | | | | 2,758,746 | |
| | | | Semiconductors & Equipment – 2.1% | | | | | | | | | | |
| | | | | |
| | 12,526 | | | Maxim Integrated Products, Inc. | | | | | | | | | 387,429 | |
| | | | | |
| | 17,662 | | | Skyworks Solutions Inc., (2), (3) | | | | | | | | | 389,800 | |
| | | | Total Semiconductors & Equipment | | | | | | | | | 777,229 | |
| | | | Software – 5.2% | | | | | | | | | | |
| | | | | |
| | 27,381 | | | CA Inc. | | | | | | | | | 738,466 | |
| | | | | |
| | 21,570 | | | Oracle Corporation | | | | | | | | | 707,065 | |
| | | | | |
| | 20,977 | | | Symantec Corporation, (2) | | | | | | | | | 509,741 | |
| | | | Total Software | | | | | | | | | 1,955,272 | |
| | | | Specialty Retail – 3.4% | | | | | | | | | | |
| | | | | |
| | 12,097 | | | Best Buy Co., Inc., (3) | | | | | | | | | 314,401 | |
| | | | | |
| | 11,152 | | | Foot Locker, Inc. | | | | | | | | | 388,870 | |
| | | | | |
| | 14,350 | | | Lowe’s Companies, Inc. | | | | | | | | | 551,326 | |
| | | | Total Specialty Retail | | | | | | | | | 1,254,597 | |
| | | | Totol Common Stocks (cost $31,282,028) | | | | | | | | | 36,672,825 | |
| | | | | |
| Shares | | | Description (1) | | | | | | | | Value | |
| | | | INVESTMENTS PURCHASED WITH COLLATERAL FROM SECURITIES LENDING – 9.1% | | | | | | | | | | |
| | | | | |
| | | | Money Market Funds – 9.1% | | | | | | | | | | |
| | | | | |
| | 3,370,739 | | | Mount Vernon Securities Lending Prime Portfolio, 0.214%, (4), (5) | | | | | | | | $ | 3,370,739 | |
| | | | Total Investments Purchased with Collateral from Securities Lending (cost $3,370,739) | | | | | | | | | 3,370,739 | |
| | | | | |
| Shares | | | Description (1) | | | | | | | | Value | |
| | | | SHORT-TERM INVESTMENTS – 0.0% | | | | | | | | | | |
| | | | | |
| | | | Money Market Funds – 0.0% | | | | | | | | | | |
| | | | | |
| | 12,798 | | | First American Treasury Obligations Fund, Class Z, 0.000%, (4) | | | | | | | | $ | 12,798 | |
| | | | Total Short-Term Investments (cost $12,798) | | | | | | | | | 12,798 | |
| | | | Total Investments (cost $34,665,565) – 107.3% | | | | | | | | | 40,056,362 | |
| | | | Other Assets Less Liabilities – (7.3)% | | | | | | | | | (2,714,602) | |
| | | | Net Assets – 100% | | | | | | | | $ | 37,341,760 | |
| | | | For Fund portfolio compliance purposes, the Fund’s industry classifications refer to any one or more of the industry sub-classifications used by one or more widely recognized market indexes or ratings group indexes, and/or as defined by Fund management. This definition may not apply for purposes of this report which may combine industry sub-classifications into sectors for reporting ease. |
| | (1) | | All percentages shown in the Portfolio of Investments are based on net assets. |
| | (2) | | Non-income producing; issuer has not declared a dividend within the past twelve months. |
| | (3) | | Investment, or a portion of investment, is out on loan for securities lending. The total value of securities out on loan as of the end of the reporting period was $3,298,304. |
| | (4) | | The rate shown is the annualized seven-day effective yield as of the end of the reporting period. |
| | (5) | | The Fund may loan securities representing up to one third of the fair value of its total assets (which includes collateral for securities on loan) to broker dealers, banks, and other institutions. The Fund maintains collateral equal to at least 102% of the fair value of the securities loaned. The cash collateral received by the Fund is invested in this money market fund. See Notes to Financial Statements, Footnote 1 – General Information and Significant Accounting Policies, Securities Lending for more information. |
See accompanying notes to financial statements.
Portfolio of Investments (Unaudited)
Nuveen Mid Cap Select Fund
April 30, 2013
| | | | | | | | | | | | | | |
| Shares | | | Description (1) | | | | | | | | Value | |
| | | | COMMON STOCKS – 99.3% | | | | | | | | | | |
| | | | | |
| | | | Airlines – 1.4% | | | | | | | | | | |
| | | | | |
| | 6,254 | | | Alaska Air Group, Inc., (2) | | | | | | | | $ | 385,497 | |
| | | | Auto Components – 1.0% | | | | | | | | | | |
| | | | | |
| | 3,257 | | | BorgWarner Inc., (2) | | | | | | | | | 254,600 | |
| | | | Biotechnology – 5.1% | | | | | | | | | | |
| | | | | |
| | 7,950 | | | Alkermes Inc., (2), (3) | | | | | | | | | 243,350 | |
| | | | | |
| | 4,026 | | | Cubist Pharmaceuticals Inc., (2) | | | | | | | | | 184,874 | |
| | | | | |
| | 9,680 | | | Myriad Genentics Inc., (2) | | | | | | | | | 269,588 | |
| | | | | |
| | 3,671 | | | Onyx Pharmaceuticals Inc., (2) | | | | | | | | | 348,011 | |
| | | | | |
| | 1,525 | | | Regeneron Pharmaceuticals, Inc., (2), (3) | | | | | | | | | 328,089 | |
| | | | Total Biotechnology | | | | | | | | | 1,373,912 | |
| | | | Building Products – 1.0% | | | | | | | | | | |
| | | | | |
| | 13,514 | | | Masco Corporation | | | | | | | | | 262,712 | |
| | | | Capital Markets – 2.3% | | | | | | | | | | |
| | | | | |
| | 1,784 | | | Affiliated Managers Group Inc., (2) | | | | | | | | | 277,733 | |
| | | | | |
| | 7,765 | | | Waddell & Reed Financial, Inc., Class A | | | | | | | | | 332,886 | |
| | | | Total Capital Markets | | | | | | | | | 610,619 | |
| | | | Chemicals – 4.3% | | | | | | | | | | |
| | | | | |
| | 2,444 | | | Airgas, Inc. | | | | | | | | | 236,213 | |
| | | | | |
| | 1,564 | | | CF Industries Holdings, Inc. | | | | | | | | | 291,702 | |
| | | | | |
| | 4,047 | | | LyondellBasell Industries NV | | | | | | | | | 245,653 | |
| | | | | |
| | 2,560 | | | PPG Industries, Inc., (3) | | | | | | | | | 376,678 | |
| | | | Total Chemicals | | | | | | | | | 1,150,246 | |
| | | | Commercial Banks – 2.3% | | | | | | | | | | |
| | | | | |
| | 20,491 | | | Fifth Third Bancorp. | | | | | | | | | 348,962 | |
| | | | | |
| | 9,355 | | | SunTrust Banks, Inc. | | | | | | | | | 273,634 | |
| | | | Total Commercial Banks | | | | | | | | | 622,596 | |
| | | | Commercial Services & Supplies – 0.9% | | | | | | | | | | |
| | | | | |
| | 9,141 | | | Tetra Tech, Inc., (2) | | | | | | | | | 240,317 | |
| | | | Communications Equipment – 2.2% | | | | | | | | | | |
| | | | | |
| | 4,130 | | | Motorola Solutions Inc. | | | | | | | | | 236,236 | |
| | | | | |
| | 7,926 | | | Plantronics Inc. | | | | | | | | | 347,317 | |
| | | | Total Communications Equipment | | | | | | | | | 583,553 | |
| | | | Construction & Engineering – 1.2% | | | | | | | | | | |
| | | | | |
| | 8,648 | | | Emcor Group Inc. | | | | | | | | | 323,435 | |
| | | | Consumer Finance – 3.8% | | | | | | | | | | |
| | | | | |
| | 4995 | | | Capital One Financial Corporation | | | | | | | | | 288,611 | |
| | | | | |
| | 6,707 | | | Discover Financial Services | | | | | | | | | 293,364 | |
| | | | | |
| | 21,415 | | | SLM Corporation | | | | | | | | | 442,220 | |
| | | | Total Consumer Finance | | | | | | | | | 1,024,195 | |
| | | | Containers & Packaging – 1.1% | | | | | | | | | | |
| | | | | |
| | 2,909 | | | Rock-Tenn Company | | | | | | | | | 291,307 | |
| | | | Diversified Consumer Services – 1.1% | | | | | | | | | | |
| | | | | |
| | 5,521 | | | Coinstar Inc., (2), (3) | | | | | | | | | 291,564 | |
| | | | | | | | | | | | | | |
| Shares | | | Description (1) | | | | | | | | Value | |
| | | | Diversified Financial Services – 1.2% | | | | | | | | | | |
| | | | | |
| | 5,439 | | | Moody’s Corporation, (3) | | | | | | | | $ | 330,963 | |
| | | | Diversified Telecommunication Services – 0.8% | | | | | | | | | | |
| | | | | |
| | 5,511 | | | CenturyLink Inc. | | | | | | | | | 207,048 | |
| | | | Electric Utilities – 4.9% | | | | | | | | | | |
| | | | | |
| | 8,054 | | | Edison International | | | | | | | | | 433,305 | |
| | | | | |
| | 7,782 | | | El Paso Electric Company | | | | | | | | | 291,514 | |
| | | | | |
| | 5,581 | | | Pinnacle West Capital Corporation | | | | | | | | | 339,883 | |
| | | | | |
| | 7,435 | | | Westar Energy Inc. | | | | | | | | | 259,928 | |
| | | | Total Electric Utilities | | | | | | | | | 1,324,630 | |
| | | | Electrical Equipment – 4.6% | | | | | | | | | | |
| | | | | |
| | 7,425 | | | Babcock & Wilcox Company | | | | | | | | | 201,960 | |
| | | | | |
| | 5,510 | | | Eaton Corporation PLC | | | | | | | | | 338,369 | |
| | | | | |
| | 5,058 | | | Rockwell Automation, Inc. | | | | | | | | | 428,817 | |
| | | | | |
| | 2,133 | | | Roper Industries Inc., (3) | | | | | | | | | 255,213 | |
| | | | Total Electrical Equipment | | | | | | | | | 1,224,359 | |
| | | | Electronic Equipment & Instruments – 1.3% | | | | | | | | | | |
| | | | | |
| | 4,745 | | | Amphenol Corporation, Class A | | | | | | | | | 358,342 | |
| | | | Energy Equipment & Services – 1.4% | | | | | | | | | | |
| | | | | |
| | 21,524 | | | Key Energy Services Inc., (2) | | | | | | | | | 127,853 | |
| | | | | |
| | 3,446 | | | Oceaneering International Inc. | | | | | | | | | 241,806 | |
| | | | Total Energy Equipment & Services | | | | | | | | | 369,659 | |
| | | | Food Products – 3.8% | | | | | | | | | | |
| | | | | |
| | 3,831 | | | Mead Johnson Nutrition Company, Class A Shares | | | | | | | | | 310,656 | |
| | | | | |
| | 3,894 | | | Treehouse Foods Inc., (2) | | | | | | | | | 248,087 | |
| | | | | |
| | 18,694 | | | Tyson Foods, Inc., Class A | | | | | | | | | 460,433 | |
| | | | Total Food Products | | | | | | | | | 1,019,176 | |
| | | | Gas Utilities – 1.5% | | | | | | | | | | |
| | | | | |
| | 3,655 | | | Atmos Energy Corporation | | | | | | | | | 162,172 | |
| | | | | |
| | 4,815 | | | Southwest Gas Corporation, (3) | | | | | | | | | 243,976 | |
| | | | Total Gas Utilities | | | | | | | | | 406,148 | |
| | | | Health Care Equipment & Supplies – 2.1% | | | | | | | | | | |
| | | | | |
| | 5,113 | | | ICU Medical, Inc., (2) | | | | | | | | | 308,058 | |
| | | | | |
| | 2,927 | | | Idexx Labs Inc., (2), (3) | | | | | | | | | 257,459 | |
| | | | Total Health Care Equipment & Supplies | | | | | | | | | 565,517 | |
| | | | Health Care Providers & Services – 2.3% | | | | | | | | | | |
| | | | | |
| | 8,918 | | | HealthSouth Corporation, (2) | | | | | | | | | 245,245 | |
| | | | | |
| | 3,510 | | | McKesson HBOC Inc. | | | | | | | | | 371,428 | |
| | | | Total Health Care Providers & Services | | | | | | | | | 616,673 | |
| | | | Health Care Technology – 0.6% | | | | | | | | | | |
| | | | | |
| | 6,823 | | | HMS Holdings Corporation, (2), (3) | | | | | | | | | 172,008 | |
| | | | Hotels, Restaurants & Leisure – 1.1% | | | | | | | | | | |
| | | | | |
| | 1,699 | | | Panera Bread Company, Class A, (2), (3) | | | | | | | | | 301,114 | |
| | | | Household Durables – 2.7% | | | | | | | | | | |
| | | | | |
| | 7035 | | | Jarden Corporation | | | | | | | | | 316,645 | |
| | | | | |
| | 3,672 | | | Whirlpool Corporation | | | | | | | | | 419,636 | |
| | | | Total Household Durables | | | | | | | | | 736,281 | |
Portfolio of Investments (Unaudited)
Nuveen Mid Cap Select Fund (continued)
April 30, 2013
| | | | | | | | | | | | | | |
| Shares | | | Description (1) | | | | | | | | Value | |
| | | | Insurance – 4.5% | | | | | | | | | | |
| | | | | |
| | 6,222 | | | Allstate Corporation | | | | | | | | $ | 306,496 | |
| | | | | |
| | 23,520 | | | CNO Financial Group Inc., (3) | | | | | | | | | 266,246 | |
| | | | | |
| | 9,602 | | | Lincoln National Corporation | | | | | | | | | 326,564 | |
| | | | | |
| | 11,221 | | | Unum Group | | | | | | | | | 312,954 | |
| | | | Total Insurance | | | | | | | | | 1,212,260 | |
| | | | Internet Software & Services – 1.4% | | | | | | | | | | |
| | | | | |
| | 10,044 | | | AOL Inc. | | | | | | | | | 388,100 | |
| | | | IT Services – 1.4% | | | | | | | | | | |
| | | | | |
| | 12,587 | | | Euronet Worldwide, Inc., (2), (3) | | | | | | | | | 384,281 | |
| | | | Leisure Equipment & Products – 1.1% | | | | | | | | | | |
| | | | | |
| | 3,369 | | | Polaris Industries Inc. | | | | | | | | | 290,374 | |
| | | | Life Sciences Tools & Services – 1.0% | | | | | | | | | | |
| | | | | |
| | 6,559 | | | Agilent Technologies, Inc. | | | | | | | | | 271,805 | |
| | | | Machinery – 3.5% | | | | | | | | | | |
| | | | | |
| | 8,593 | | | Actuant Corporation, Class A, (3) | | | | | | | | | 268,961 | |
| | | | | |
| | 5,982 | | | Crane Company | | | | | | | | | 322,011 | |
| | | | | |
| | 4,910 | | | Dover Corporation, (3) | | | | | | | | | 338,692 | |
| | | | Total Machinery | | | | | | | | | 929,664 | |
| | | | Media – 1.0% | | | | | | | | | | |
| | | | | |
| | 2,268 | | | Liberty Media Corporation, (2) | | | | | | | | | 260,548 | |
| | | | Multiline Retail – 1.2% | | | | | | | | | | |
| | | | | |
| | 7,232 | | | Macy’s, Inc. | | | | | | | | | 322,547 | |
| | | | Oil, Gas & Consumable Fuels – 3.5% | | | | | | | | | | |
| | | | | |
| | 11,107 | | | Energy XXI Ltd., (3) | | | | | | | | | 252,573 | |
| | | | | |
| | 6,608 | | | HollyFrontier Company | | | | | | | | | 326,766 | |
| | | | | |
| | 10,906 | | | Marathon Oil Corporation | | | | | | | | | 356,299 | |
| | | | Total Oil, Gas & Consumable Fuels | | | | | | | | | 935,638 | |
| | | | Paper & Forest Products – 1.5% | | | | | | | | | | |
| | | | | |
| | 8,620 | | | International Paper Company | | | | | | | | | 404,968 | |
| | | | Personal Products – 1.7% | | | | | | | | | | |
| | | | | |
| | 8,740 | | | Nu Skin Enterprises, Inc., Class A, (3) | | | | | | | | | 443,380 | |
| | | | Pharmaceuticals – 0.9% | | | | | | | | | | |
| | | | | |
| | 4,665 | | | Salix Pharmaceuticals Limited, (2) | | | | | | | | | 243,933 | |
| | | | Real Estate Investment Trust – 6.9% | | | | | | | | | | |
| | | | | |
| | 3320 | | | Digital Realty Trust, Inc. | | | | | | | | | 234,126 | |
| | | | | |
| | 12,016 | | | Invesco Mortgage Capital Inc., (3) | | | | | | | | | 257,142 | |
| | | | | |
| | 8,433 | | | Liberty Property Trust, (3) | | | | | | | | | 362,535 | |
| | | | | |
| | 16,004 | | | Medical Properties Trust Inc. | | | | | | | | | 257,504 | |
| | | | | |
| | 3,532 | | | Mid-America Apartment Communities | | | | | | | | | 242,754 | |
| | | | | |
| | 3,856 | | | PS Business Parks Inc., (3) | | | | | | | | | 307,709 | |
| | | | | |
| | 7,030 | | | Starwood Property Trust Inc. | | | | | | | | | 193,255 | |
| | | | Total Real Estate Investment Trust | | | | | | | | | 1,855,025 | |
| | | | Road & Rail – 0.7% | | | | | | | | | | |
| | | | | |
| | 14,100 | | | Swift Transportation Company, Class A, (2), (3) | | | | | | | | | 197,682 | |
| | | | | | | | | | | | | | |
| Shares | | | Description (1) | | | | | | | | Value | |
| | | | Semiconductors & Equipment – 3.4% | | | | | | | | | | |
| | | | | |
| | 29,688 | | | Integrated Device Technology, Inc., (2) | | | | | | | | $ | 211,082 | |
| | | | | |
| | 13,658 | | | Maxim Integrated Products, Inc. | | | | | | | | | 422,442 | |
| | | | | |
| | 12,352 | | | Skyworks Solutions Inc., (2), (3) | | | | | | | | | 272,609 | |
| | | | Total Semiconductors & Equipment | | | | | | | | | 906,133 | |
| | | | Software – 3.7% | | | | | | | | | | |
| | | | | |
| | 13,182 | | | CA Inc. | | | | | | | | | 355,519 | |
| | | | | |
| | 15,625 | | | Symantec Corporation, (2) | | | | | | | | | 379,688 | |
| | | | | |
| | 6,944 | | | Synopsys Inc., (2) | | | | | | | | | 246,998 | |
| | | | Total Software | | | | | | | | | 982,205 | |
| | | | Specialty Retail – 3.9% | | | | | | | | | | |
| | | | | |
| | 9,503 | | | Foot Locker, Inc. | | | | | | | | | 331,370 | |
| | | | | |
| | 5,879 | | | PetSmart Inc. | | | | | | | | | 401,180 | |
| | | | | |
| | 23,417 | | | Staples, Inc., (3) | | | | | | | | | 310,041 | |
| | | | Total Specialty Retail | | | | | | | | | 1,042,591 | |
| | | | Textiles, Apparel & Luxury Goods – 1.0% | | | | | | | | | | |
| | | | | |
| | 1,500 | | | Ralph Lauren Corporation | | | | | | | | | 272,370 | |
| | | | Thrifts & Mortgage Finance – 1.0% | | | | | | | | | | |
| | | | | |
| | 16,219 | | | Everbank Financial Corporation, (3) | | | | | | | | | 259,504 | |
| | | | Total Common Stock (cost $23,321,258) | | | | | | | | | 26,649,479 | |
| | | | | |
| Shares | | | Description (1) | | | | | | | | Value | |
| | | | INVESTMENTS PURCHASED WITH COLLATERAL FROM SECURITIES LENDING – 20.8% | | | | | | | | | | |
| | | | | |
| | | | Money Market Funds – 20.8% | | | | | | | | | | |
| | | | | |
| | 5,578,100 | | | Mount Vernon Securities Lending Prime Portfolio, 0.214%, (4), (5) | | | | | | | | $ | 5,578,100 | |
| | | | Total Investments Purchased with Collateral from Securities Lending (cost $5,578,100) | | | | | | | | | 5,578,100 | |
| | | | | |
| Shares | | | Description (1) | | | | | | | | Value | |
| | | | SHORT-TERM INVESTMENTS – 0.8% | | | | | | | | | | |
| | | | | |
| | | | Money Market Funds – 0.8% | | | | | | | | | | |
| | | | | |
| | 212,496 | | | First American Treasury Obligations Fund, Class Z, 0.000%, (4) | | | | | | | | $ | 212,496 | |
| | | | Total Short-Term Investments (cost $212,496) | | | | | | | | | 212,496 | |
| | | | Total Investments (cost $29,111,854) 120.9% | | | | | | | | | 32,440,075 | |
| | | | Other Assets Less Liabilities – (20.9)% | | | | | | | | | (5,606,167) | |
| | | | Net Assets – 100% | | | | | | | | $ | 26,833,908 | |
| | | | For Fund portfolio compliance purposes, the Fund’s industry classifications refer to any one or more of the industry sub-classifications used by one or more widely recognized market indexes or ratings group indexes, and/or as defined by Fund management. This definition may not apply for purposes of this report which may combine industry sub-classifications into sectors for reporting ease. |
| | (1) | | All percentages shown in the Portfolio of Investments are based on net assets. |
| | (2) | | Non-income producing; issuer has not declared a dividend within the past twelve months. |
| | (3) | | Investment, or a portion of investment, is out on loan for securities lending. The total value of securities out on loan as of the end of the reporting period was $5,418,684. |
| | (4) | | The rate shown is the annualized seven-day effective yield as of the end of the reporting period. |
| | (5) | | The Fund may loan securities representing up to one third of the fair value of its total assets (which includes collateral for securities on loan) to broker dealers, banks, and other institutions. The Fund maintains collateral equal to at least 102% of the fair value of the securities loaned. The cash collateral received by the Fund is invested in this money market fund. See Notes to Financial Statements, Footnote 1 – General Information and Significant Accounting Policies, Securities Lending for more information. |
See accompanying notes to financial statements.
Portfolio of Investments (Unaudited)
Nuveen Small Cap Select Fund
April 30, 2013
| | | | | | | | | | | | | | |
| Shares | | | Description (1) | | | | | | | | Value | |
| | | | COMMON STOCKS – 96.9% | | | | | | | | | | |
| | | | | |
| | | | Aerospace & Defense – 1.2% | | | | | | | | | | |
| | | | | |
| | 306,230 | | | Orbital Sciences Corporation, (2) | | | | | | | | $ | 5,518,265 | |
| | | | Airlines – 0.9% | | | | | | | | | | |
| | | | | |
| | 47,706 | | | Allegiant Travel Company | | | | | | | | | 4,288,769 | |
| | | | Auto Components – 0.8% | | | | | | | | | | |
| | | | | |
| | 247,880 | | | Gentherm Inc., (2) | | | | | | | | | 3,775,212 | |
| | | | Biotechnology – 2.8% | | | | | | | | | | |
| | | | | |
| | 41,730 | | | Alkermes Inc., (2) | | | | | | | | | 1,277,355 | |
| | | | | |
| | 71,545 | | | Arena Pharmaceuticals, Inc., (2), (3) | | | | | | | | | 589,531 | |
| | | | | |
| | 60,493 | | | Cepheid, Inc., (2), (3) | | | | | | | | | 2,306,598 | |
| | | | | |
| | 58,290 | | | Cubist Pharmaceuticals Inc., (2), (3) | | | | | | | | | 2,676,677 | |
| | | | | |
| | 27,723 | | | Immunogen, Inc., (2), (3) | | | | | | | | | 444,122 | |
| | | | | |
| | 36,170 | | | ISIS Pharmaceuticals, Inc., (2), (3) | | | | | | | | | 809,846 | |
| | | | | |
| | 18,894 | | | Pharmacyclics, Inc., (2), (3) | | | | | | | | | 1,539,861 | |
| | | | | |
| | 31,563 | | | Seattle Genetics, Inc., (2), (3) | | | | | | | | | 1,166,253 | |
| | | | | |
| | 48,024 | | | Theravance Inc., (2), (3) | | | | | | | | | 1,620,810 | |
| | | | Total Biotechnology | | | | | | | | | 12,431,053 | |
| | | | Capital Markets – 6.4% | | | | | | | | | | |
| | | | | |
| | 126,107 | | | Evercore Partners Inc., Class A | | | | | | | | | 4,760,539 | |
| | | | | |
| | 445,660 | | | Medley Capital Corporation | | | | | | | | | 6,943,383 | |
| | | | | |
| | 505,936 | | | Pennantpark Investment Corporation, (3) | | | | | | | | | 5,919,451 | |
| | | | | |
| | 67,441 | | | Stifel Financial Corporation, (2), (3) | | | | | | | | | 2,172,949 | |
| | | | | |
| | 204,779 | | | Waddell & Reed Financial, Inc., Class A | | | | | | | | | 8,778,876 | |
| | | | Total Capital Markets | | | | | | | | | 28,575,198 | |
| | | | Chemicals – 1.4% | | | | | | | | | | |
| | | | | |
| | 297,882 | | | Chemtura Corporation, (2) | | | | | | | | | 6,332,971 | |
| | | | Commercial Banks – 4.4% | | | | | | | | | | |
| | | | | |
| | 188,690 | | | Associated Banc-Corp. | | | | | | | | | 2,692,606 | |
| | | | | |
| | 315,048 | | | Cardinal Financial Corporation | | | | | | | | | 4,804,482 | |
| | | | | |
| | 249,193 | | | East West Bancorp Inc. | | | | | | | | | 6,062,866 | |
| | | | | |
| | 131,069 | | | Texas Capital BancShares, Inc., (2), (3) | | | | | | | | | 5,460,335 | |
| | | | | |
| | 72,484 | | | Umpqua Holdings Corporation, (3) | | | | | | | | | 869,808 | |
| | | | Total Commercial Banks | | | | | | | | | 19,890,097 | |
| | | | Commercial Services & Supplies – 0.7% | | | | | | | | | | |
| | | | | |
| | 319,383 | | | Innerworkings, Inc., (2), (3) | | | | | | | | | 3,216,187 | |
| | | | Communications Equipment – 1.3% | | | | | | | | | | |
| | | | | |
| | 425,977 | | | JDS Uniphase Corporation, (2) | | | | | | | | | 5,750,690 | |
| | | | Computers & Peripherals – 0.8% | | | | | | | | | | |
| | | | | |
| | 332,270 | | | QLogic Corporation, (2) | | | | | | | | | 3,608,452 | |
| | | | Construction & Engineering – 2.9% | | | | | | | | | | |
| | | | | |
| | 250,354 | | | MasTec Inc., (2), (3) | | | | | | | | | 6,959,841 | |
| | | | | |
| | 265,880 | | | MYR Group Inc., (2) | | | | | | | | | 6,062,064 | |
| | | | Total Construction & Engineering | | | | | | | | | 13,021,905 | |
| | | | Containers & Packaging – 1.0% | | | | | | | | | | |
| | | | | |
| | 44,288 | | | Rock-Tenn Company, Class A | | | | | | | | | 4,435,000 | |
| | | | | | | | | | | | | | |
| Shares | | | Description (1) | | | | | | | | Value | |
| | | | Diversified Telecommunication Services – 1.5% | | | | | | | | | | |
| | | | | |
| | 760,645 | | | Cbeyond Inc., (2) | | | | | | | | $ | 6,678,463 | |
| | | | Electrical Equipment – 1.3% | | | | | | | | | | |
| | | | | |
| | 73,229 | | | Regal-Beloit Corporation | | | | | | | | | 5,757,264 | |
| | | | Electronic Equipment & Instruments – 1.0% | | | | | | | | | | |
| | | | | |
| | 297,645 | | | Newport Corporation, (2) | | | | | | | | | 4,509,322 | |
| | | | Energy Equipment & Services – 3.1% | | | | | | | | | | |
| | | | | |
| | 94,620 | | | Atwood Oceanics Inc., (2), (3) | | | | | | | | | 4,641,111 | |
| | | | | |
| | 823,588 | | | Key Energy Services Inc., (2) | | | | | | | | | 4,892,113 | |
| | | | | |
| | 1,031,696 | | | Parker Drilling Company, (2) | | | | | | | | | 4,250,588 | |
| | | | Total Energy Equipment & Services | | | | | | | | | 13,783,812 | |
| | | | Food & Staples Retailing – 3.2% | | | | | | | | | | |
| | | | | |
| | 133,960 | | | Harris Teeter Supermarkets Incorporated, (3) | | | | | | | | | 5,598,188 | |
| | | | | |
| | 180,881 | | | Natural Grocers by Vitamin Cottage Incorporated, (2), (3) | | | | | | | | | 4,536,495 | |
| | | | | |
| | 224,829 | | | The Chef’s Warehouse Inc., (2), (3) | | | | | | | | | 4,134,605 | |
| | | | Total Food & Staples Retailing | | | | | | | | | 14,269,288 | |
| | | | Food Products – 2.0% | | | | | | | | | | |
| | | | | |
| | 410,710 | | | Boulder Brands Inc., (2), (3) | | | | | | | | | 3,700,497 | |
| | | | | |
| | 80,495 | | | Treehouse Foods Inc., (2) | | | | | | | | | 5,128,336 | |
| | | | Total Food Products | | | | | | | | | 8,828,833 | |
| | | | Gas Utilities – 1.9% | | | | | | | | | | |
| | | | | |
| | 188,168 | | | Atmos Energy Corporation | | | | | | | | | 8,349,014 | |
| | | | Health Care Equipment & Supplies – 4.9% | | | | | | | | | | |
| | | | | |
| | 187,208 | | | Align Technology, Inc., (2), (3) | | | | | | | | | 6,200,329 | |
| | | | | |
| | 118,352 | | | Integra Lifesciences Holdings Corporation, (2), (3) | | | | | | | | | 4,145,871 | |
| | | | | |
| | 568,065 | | | Merit Medical Systems, Inc., (2), (3) | | | | | | | | | 5,493,189 | |
| | | | | |
| | 166,379 | | | Thoratec Corporation, (2) | | | | | | | | | 6,022,920 | |
| | | | Total Health Care Equipment & Supplies | | | | | | | | | 21,862,309 | |
| | | | Health Care Providers & Services – 2.3% | | | | | | | | | | |
| | | | | |
| | 238,155 | | | HealthSouth Corporation, (2) | | | | | | | | | 6,549,263 | |
| | | | | |
| | 40,938 | | | Medax Inc., (2) | | | | | | | | | 3,632,429 | |
| | | | Total Health Care Providers & Services | | | | | | | | | 10,181,692 | |
| | | | Hotels, Restaurants & Leisure – 2.0% | | | | | | | | | | |
| | | | | |
| | 137,167 | | | Life Time Fitness Inc., (2), (3) | | | | | | | | | 6,334,372 | |
| | | | | |
| | 104,766 | | | Texas Roadhouse, Inc. | | | | | | | | | 2,462,001 | |
| | | | Total Hotels, Restaurants & Leisure | | | | | | | | | 8,796,373 | |
| | | | Household Durables – 2.0% | | | | | | | | | | |
| | | | | |
| | 124,046 | | | La Z Boy Inc. | | | | | | | | | 2,240,271 | |
| | | | | |
| | 31,335 | | | Meritage Corporation, (2) | | | | | | | | | 1,528,835 | |
| | | | | |
| | 277,185 | | | Tri Pointe Homes, Incorporated, (2), (3) | | | | | | | | | 5,266,515 | |
| | | | Total Household Durables | | | | | | | | | 9,035,621 | |
| | | | Insurance – 4.0% | | | | | | | | | | |
| | | | | |
| | 150,130 | | | First American Financial Corporation | | | | | | | | | 4,018,980 | |
| | | | | |
| | 651,748 | | | Maiden Holdings, Ltd | | | | | | | | | 6,732,557 | |
| | | | | |
| | 372,173 | | | Tower Group Companies, (3) | | | | | | | | | 7,041,513 | |
| | | | Total Insurance | | | | | | | | | 17,793,050 | |
Portfolio of Investments (Unaudited)
Nuveen Small Cap Select Fund (continued)
April 30, 2013
| | | | | | | | | | | | | | |
| Shares | | | Description (1) | | | | | | | | Value | |
| | | | Internet Software & Services – 1.4% | | | | | | | | | | |
| | | | | |
| | 163,859 | | | Keynote Systems, Inc. | | | | | | | | $ | 1,836,859 | |
| | | | | |
| | 554,646 | | | Vocus, Inc., (2) | | | | | | | | | 4,664,573 | |
| | | | Total Internet Software & Services | | | | | | | | | 6,501,432 | |
| | | | IT Services – 2.8% | | | | | | | | | | |
| | | | | |
| | 278,850 | | | Euronet Worldwide, Inc., (2) | | | | | | | | | 8,513,291 | |
| | | | | |
| | 253,412 | | | Sykes Enterprises Inc., (2) | | | | | | | | | 3,900,011 | |
| | | | Total IT Services | | | | | | | | | 12,413,302 | |
| | | | Leisure Equipment & Products – 0.9% | | | | | | | | | | |
| | | | | |
| | 131,929 | | | Brunswick Corporation, (3) | | | | | | | | | 4,176,872 | |
| | | | Machinery – 4.9% | | | | | | | | | | |
| | | | | |
| | 203,470 | | | Actuant Corporation, Class A | | | | | | | | | 6,368,611 | |
| | | | | |
| | 139,770 | | | Altra Industrial Motion, Inc., (3) | | | | | | | | | 3,724,871 | |
| | | | | |
| | 166,982 | | | ESCO Technologies Inc., (3) | | | | | | | | | 6,006,343 | |
| | | | | |
| | 274,310 | | | Titan International Inc., (3) | | | | | | | | | 6,119,856 | |
| | | | Total Machinery | | | | | | | | | 22,219,681 | |
| | | | Media – 0.9% | | | | | | | | | | |
| | | | | |
| | 242,535 | | | ReachLocal Inc., (2), (3) | | | | | | | | | 4,043,058 | |
| | | | Metals & Mining – 0.8% | | | | | | | | | | |
| | | | | |
| | 179,942 | | | US Silica Holdings Inc. | | | | | | | | | 3,676,215 | |
| | | | Oil, Gas & Consumable Fuels – 2.9% | | | | | | | | | | |
| | | | | |
| | 264,135 | | | Energy XXI Ltd., (3) | | | | | | | | | 6,006,430 | |
| | | | | |
| | 542,259 | | | Goodrich Petroleum Corporation, (2), (3) | | | | | | | | | 7,071,057 | |
| | | | Total Oil, Gas & Consumable Fuels | | | | | | | | | 13,077,487 | |
| | | | Paper & Forest Products – 1.5% | | | | | | | | | | |
| | | | | |
| | 175,623 | | | Buckeye Technologies Inc. | | | | | | | | | 6,601,669 | |
| | | | Pharmaceuticals – 1.0% | | | | | | | | | | |
| | | | | |
| | 90,539 | | | Salix Pharmaceuticals Limited, (2) | | | | | | | | | 4,734,284 | |
| | | | Professional Services – 1.8% | | | | | | | | | | |
| | | | | |
| | 348,335 | | | CBIZ Inc., (2), (3) | | | | | | | | | 2,260,694 | |
| | | | | |
| | 272,632 | | | TrueBlue Inc., (2), (3) | | | | | | | | | 5,648,935 | |
| | | | Total Professional Services | | | | | | | | | 7,909,629 | |
| | | | Real Estate Investment Trust – 6.7% | | | | | | | | | | |
| | | | | |
| | 54,714 | | | EastGroup Properties Inc., (3) | | | | | | | | | 3,450,812 | |
| | | | | |
| | 262,774 | | | Invesco Mortgage Capital Inc. | | | | | | | | | 5,623,364 | |
| | | | | |
| | 211,378 | | | Medical Properties Trust Inc. | | | | | | | | | 3,401,072 | |
| | | | | |
| | 265,687 | | | MFA Mortgage Investments, Inc. | | | | | | | | | 2,462,918 | |
| | | | | |
| | 174,886 | | | National Retail Properties, Inc., (3) | | | | | | | | | 6,939,476 | |
| | | | | |
| | 66,667 | | | PS Business Parks Inc. | | | | | | | | | 5,320,027 | |
| | | | | |
| | 158,236 | | | Terreno Realty Corporation | | | | | | | | | 2,978,002 | |
| | | | Total Real Estate Investment Trust | | | | | | | | | 30,175,671 | |
| | | | Road & Rail – 1.3% | | | | | | | | | | |
| | | | | |
| | 167,200 | | | Con-Way, Inc. | | | | | | | | | 5,651,360 | |
| | | | Semiconductors & Equipment – 4.7% | | | | | | | | | | |
| | | | | |
| | 957,686 | | | Integrated Device Technology, Inc., (2) | | | | | | | | | 6,809,147 | |
| | | | | |
| | 346,697 | | | International Rectifier Corporation, (2), (3) | | | | | | | | | 7,353,443 | |
| | | | | | | | | | | | | | |
| Shares | | | Description (1) | | | | | | | | Value | |
| | | | Semiconductors & Equipment (continued) | | | | | | | | | | |
| | | | | |
| | 210,661 | | | Semtech Corporation, (2) | | | | | | | | $ | 6,755,898 | |
| | | | Total Semiconductors & Equipment | | | | | | | | | 20,918,488 | |
| | | | Software – 2.6% | | | | | | | | | | |
| | | | | |
| | 187,570 | | | Fortinet Inc., (2) | | | | | | | | | 3,368,757 | |
| | | | | |
| | 62,650 | | | Guidewire Software Incorporated, (2) | | | | | | | | | 2,511,012 | |
| | | | | |
| | 854,249 | | | Smith Micro Software, Inc., (2) | | | | | | | | | 1,195,949 | |
| | | | | |
| | 158,961 | | | Synchronoss Technologies, Inc., (2), (3) | | | | | | | | | 4,504,955 | |
| | | | Total Software | | | | | | | | | 11,580,673 | |
| | | | Specialty Retail – 5.5% | | | | | | | | | | |
| | | | | |
| | 149,889 | | | Ann Inc., (2) | | | | | | | | | 4,427,721 | |
| | | | | |
| | 371,825 | | | Ascena Retail Group Inc., (2), (3) | | | | | | | | | 6,878,763 | |
| | | | | |
| | 254,802 | | | Kirkland’s, Inc., (2) | | | | | | | | | 3,072,912 | |
| | | | | |
| | 223,022 | | | Tile Shop Holdings Inc., (2) | | | | | | | | | 5,530,946 | |
| | | | | |
| | 158,422 | | | Zumiez, Inc., (2), (3) | | | | | | | | | 4,589,485 | |
| | | | Total Specialty Retail | | | | | | | | | 24,499,827 | |
| | | | Textiles, Apparel & Luxury Goods – 1.8% | | | | | | | | | | |
| | | | | |
| | 194,340 | | | G III Apparel Group, Limited, (2), (3) | | | | | | | | | 7,901,863 | |
| | | | Thrifts & Mortgage Finance – 1.6% | | | | | | | | | | |
| | | | | |
| | 448,638 | | | Everbank Financial Corporation, (3) | | | | | | | | | 7,178,208 | |
| | | | Total Common Stock (cost $366,087,179) | | | | | | | | | 433,948,559 | |
| | | | | |
| Shares | | | Description (1) | | | | | | | | Value | |
| | | | INVESTMENTS PURCHASED WITH COLLATERAL FROM SECURITIES LENDING – 20.5% | | | | | | | | | | |
| | | | | |
| | | | Money Market Funds – 20.5% | | | | | | | | | | |
| | | | | |
| | 91,784,197 | | | Mount Vernon Securities Lending Prime Portfolio, 0.214%, (4), (5) | | | | | | | | $ | 91,784,197 | |
| | | | Total Investments Purchased with Collateral from Securities Lending (cost $91,784,197) | | | | | | | | | 91,784,197 | |
| | | | | |
| Shares | | | Description (1) | | | | | | | | Value | |
| | | | SHORT-TERM INVESTMENTS – 3.7% | | | | | | | | | | |
| | | | | |
| | | | Money Market Funds – 3.7% | | | | | | | | | | |
| | | | | |
| | 17,002,897 | | | First American Treasury Obligations Fund, Class Z, 0.000%, (4) | | | | | | | | $ | 17,002,897 | |
| | | | Total Short-Term Investments (cost $17,002,897) | | | | | | | | | 17,002,897 | |
| | | | Total Investments (474,874,273) – 121.1% | | | | | | | | | 542,735,653 | |
| | | | Other Assets Less Liabilities – (21.1)% | | | | | | | | | (94,695,380) | |
| | | | Net Assets – 100% | | | | | | | | $ | 448,040,273 | |
| | | | For Fund portfolio compliance purposes, the Fund’s industry classifications refer to any one or more of the industry sub-classifications used by one or more widely recognized market indexes or ratings group indexes, and/or as defined by Fund management. This definition may not apply for purposes of this report which may combine industry sub-classifications into sectors for reporting ease. |
| | (1) | | All percentages shown in the Portfolio of Investments are based on net assets. |
| | (2) | | Non-income producing; issuer has not declared a dividend within the past twelve months. |
| | (3) | | Investment, or a portion of investment, is out on loan for securities lending. The total value of securities out on loan as of the end of the reporting period was $88,116,655. |
| | (4) | | The rate shown is the annualized seven-day effective yield as of the end of the reporting period. |
| | (5) | | The Fund may loan securities representing up to one third of the fair value of its total assets (which includes collateral for securities on loan) to broker dealers, banks, and other institutions. The Fund maintains collateral equal to at least 102% of the fair value of the securities loaned. The cash collateral received by the Fund is invested in this money market fund. See Notes to Financial Statements, Footnote 1 – General Information and Significant Accounting Policies, Securities Lending for more information. |
See accompanying notes to financial statements.
Statement of Assets & Liabilities (Unaudited)
April 30, 2013
| | | | | | | | | | | | |
| | | Large Cap
Select | | | Mid Cap
Select | | | Small Cap
Select | |
Assets | | | | | | | | | | | | |
Investments, at value (cost $31,294,826, $23,533,754 and $383,090,076, respectively) | | | 36,685,623 | | | | 26,861,975 | | | | 450,951,456 | |
Investment purchased with collateral from securities lending (at cost, which approximates value) | | | 3,370,739 | | | | 5,578,100 | | | | 91,784,197 | |
Receivables: | | | | | | | | | | | | |
Dividends | | | 16,948 | | | | 13,585 | | | | 184,694 | |
Due from broker | | | 464 | | | | 5,530 | | | | 21,798 | |
Investments sold | | | 662,289 | | | | — | | | | 3,148,554 | |
Shares sold | | | 154 | | | | 15,883 | | | | 656,342 | |
Other assets | | | 1,429 | | | | 38 | | | | 9,572 | |
Total assets | | | 40,737,646 | | | | 32,475,111 | | | | 546,756,613 | |
Liabilities | | | | | | | | | | | | |
Payables: | | | | | | | | | | | | |
Collateral from securities lending program | | | 3,370,739 | | | | 5,578,100 | | | | 91,784,197 | |
Investments purchased | | | — | | | | — | | | | 4,788,008 | |
Shares redeemed | | | 948 | | | | 21,438 | | | | 1,523,287 | |
Accrued expenses: | | | | | | | | | | | | |
Directors fees | | | 263 | | | | 214 | | | | 11,254 | |
Management fees | | | 22,993 | | | | 12,006 | | | | 324,214 | |
12b-1 distribution and service fees | | | 943 | | | | 3,658 | | | | 48,540 | |
Other | | | — | | | | 25,787 | | | | 236,840 | |
Total liabilities | | | 3,395,886 | | | | 5,641,203 | | | | 98,716,340 | |
Net assets | | $ | 37,341,760 | | | $ | 26,833,908 | | | $ | 448,040,273 | |
Class A Shares | | | | | | | | | | | | |
Net assets | | $ | 3,613,765 | | | $ | 11,086,365 | | | $ | 156,037,182 | |
Shares outstanding | | | 234,679 | | | | 940,612 | | | | 12,142,687 | |
Net asset value and redemption price per share | | $ | 15.40 | | | $ | 11.79 | | | $ | 12.85 | |
Offering price per share (net asset value per share plus maximum sales charge of 5.75 of offering price) | | $ | 16.34 | | | $ | 12.51 | | | $ | 13.63 | |
Class B Shares | | | | | | | | | | | | |
Net assets | | | N/A | | | | N/A | | | $ | 1,675,633 | |
Shares outstanding | | | N/A | | | | N/A | | | | 178,863 | |
Net asset value and offering price per share | | | N/A | | | | N/A | | | $ | 9.37 | |
Class C Shares | | | | | | | | | | | | |
Net assets | | $ | 264,634 | | | $ | 1,802,435 | | | $ | 9,858,752 | |
Shares outstanding | | | 18,093 | | | | 167,566 | | | | 882,710 | |
Net asset value and offering price per share | | $ | 14.63 | | | $ | 10.76 | | | $ | 11.17 | |
Class R3 Shares | | | | | | | | | | | | |
Net assets | | | N/A | | | | N/A | | | $ | 17,518,494 | |
Shares outstanding | | | N/A | | | | N/A | | | | 1,411,390 | |
Net asset value and offering price per share | | | N/A | | | | N/A | | | $ | 12.41 | |
Class I Shares | | | | | | | | | | | | |
Net assets | | $ | 33,463,361 | | | $ | 13,945,108 | | | $ | 262,950,212 | |
Shares outstanding | | | 2,158,761 | | | | 1,129,995 | | | | 18,385,692 | |
Net asset value and offering price per share | | $ | 15.50 | | | $ | 12.34 | | | $ | 14.30 | |
Net assets consist of: | | | | | | | | | | | | |
Capital paid-in | | $ | 99,624,715 | | | $ | 42,148,894 | | | $ | 371,154,082 | |
Undistributed (Over-distribution of) net investment income | | | 74,580 | | | | 65,176 | | | | 616,783 | |
Accumulated net realized gain (loss) | | | (67,748,332 | ) | | | (18,708,383 | ) | | | 8,408,028 | |
Net unrealized appreciation (depreciation) | | | 5,390,797 | | | | 3,328,221 | | | | 67,861,380 | |
Net assets | | $ | 37,341,760 | | | $ | 26,833,908 | | | $ | 448,040,273 | |
Authorized shares – per class | | | 2 billion | | | | 2 billion | | | | 2 billion | |
Par value per share | | $ | 0.0001 | | | $ | 0.0001 | | | $ | 0.0001 | |
| N/A - | Large Cap Select and Mid Cap Select do not offer Class B and Class R3 Shares. At the close of business on March 4, 2013, Large Cap Select liquidated all of its Class R3 Shares. |
See accompanying notes to financial statements.
Statement of Operations (Unaudited)
Six Months Ended April 30, 2013
| | | | | | | | | | | | |
| | | Large Cap
Select | | | Mid Cap
Select | | | Small Cap
Select | |
Investment Income | | | | | | | | | | | | |
Dividend and interest income (net of foreign tax withheld of $5,556, $2,665 and $–, respectively) | | $ | 359,876 | | | $ | 248,010 | | | $ | 3,163,320 | |
Securities lending income, net | | | 4,727 | | | | 20,859 | | | | 180,257 | |
Total investment income | | | 364,603 | | | | 268,869 | | | | 3,343,577 | |
Expenses | | | | | | | | | | | | |
Management fees | | | 140,030 | | | | 115,562 | | | | 1,988,934 | |
12b-1 service fees – Class A | | | 4,094 | | | | 13,635 | | | | 194,018 | |
12b-1 distribution and service fees – Class B | | | N/A | | | | N/A | | | | 9,359 | |
12b-1 distribution and service fees – Class C | | | 1,084 | | | | 8,658 | | | | 49,378 | |
12b-1 distribution and service fees – Class R3(1) | | | 184 | | | | N/A | | | | 45,574 | |
Shareholder servicing agent fees and expenses | | | 12,548 | | | | 35,136 | | | | 325,022 | |
Custodian fees and expenses | | | 8,781 | | | | 8,098 | | | | 42,068 | |
Directors fees and expenses | | | 609 | | | | 509 | | | | 5,396 | |
Professional fees | | | 6,079 | | | | 6,042 | | | | 7,869 | |
Shareholder reporting expenses | | | 3,757 | | | | 21,520 | | | | 30,864 | |
Federal and state registration fees | | | 24,670 | | | | 19,945 | | | | 34,914 | |
Other expenses | | | 6,650 | | | | 6,736 | | | | 17,953 | |
Total expenses before fee waiver/expense reimbursement | | | 208,486 | | | | 235,841 | | | | 2,751,349 | |
Fee waiver/expense reimbursement | | | — | | | | (64,600 | ) | | | (43,537 | ) |
Net expenses | | | 208,486 | | | | 171,241 | | | | 2,707,812 | |
Net investment income (loss) | | | 156,117 | | | | 97,628 | | | | 635,765 | |
Realized and Unrealized Gain (Loss) | | | | | | | | | | | | |
Net realized gain (loss) from Investments | | | 3,197,366 | | | | 1,748,049 | | | | 11,606,367 | |
Change in net unrealized appreciation (depreciation) of investments | | | 2,043,367 | | | | 1,772,403 | | | | 42,255,276 | |
Net realized and unrealized gain (loss) | | | 5,240,733 | | | | 3,520,452 | | | | 53,861,643 | |
Net increase (decrease) in net assets from operations | | $ | 5,396,850 | | | $ | 3,618,080 | | | $ | 54,497,408 | |
| N/A - | Large Cap Select does not offer Class B Shares and Mid Cap Select does not offer Class B and Class R3 Shares. |
| (1) - | At the close of business on March 4, 2013, Large Cap Select liquidated all of its Class R3 Shares. |
See accompanying notes to financial statements.
Statement of Changes in Net Assets (Unaudited)
| | | | | | | | | | | | | | | | | | | | | | | | |
| | | Large Cap Select | | | Mid Cap Select | | | Small Cap Select | |
| | | Six Months Ended
4/30/13 | | | Year Ended
10/31/12 | | | Six Months Ended
4/30/13 | | | Year Ended
10/31/12 | | | Six Months Ended
4/30/13 | | | Year Ended
10/31/12 | |
Operations | | | | | | | | | | | | | | | | | | | | | | | | |
Net investment income (loss) | | $ | 156,117 | | | $ | 227,174 | | | $ | 97,628 | | | $ | 130,794 | | | $ | 635,765 | | | $ | (1,438,470 | ) |
Net realized gain (loss) from: | | | | | | | | | | | | | | | | | | | | | | | | |
Investments | | | 3,197,366 | | | | 5,458,240 | | | | 1,748,049 | | | | 3,074,977 | | | | 11,606,367 | | | | 72,006,971 | |
Futures contracts | | | — | | | | — | | | | — | | | | — | | | | — | | | | 1,762,906 | |
Change in net unrealized appreciation (depreciation) of investments | | | 2,043,367 | | | | 476,212 | | | | 1,772,403 | | | | (840,405 | ) | | | 42,255,276 | | | | (482,307 | ) |
Net increase (decrease) in net assets from operations | | | 5,396,850 | | | | 6,161,626 | | | | 3,618,080 | | | | 2,365,366 | | | | 54,497,408 | | | | 71,849,100 | |
Distributions to Shareholders | | | | | | | | | | | | | | | | | | | | | | | | |
From net investment income: | | | | | | | | | | | | | | | | | | | | | | | | |
Class A | | | (14,322 | ) | | | — | | | | (55,176 | ) | | | — | | | | — | | | | — | |
Class B | | | N/A | | | | N/A | | | | N/A | | | | — | | | | — | | | | — | |
Class C | | | — | | | | — | | | | — | | | | — | | | | — | | | | — | |
Class R3(1) | | | (251 | ) | | | — | | | | N/A | | | | N/A | | | | — | | | | — | |
Class I | | | (234,154 | ) | | | (49,038 | ) | | | (94,421 | ) | | | — | | | | — | | | | — | |
From accumulated net realized gains: | | | | | | | | | | | | | | | | | | | | | | | | |
Class A | | | — | | | | — | | | | — | | | | — | | | | (24,007,903 | ) | | | (6,635,027 | ) |
Class B | | | N/A | | | | N/A | | | | N/A | | | | — | | | | (393,486 | ) | | | (85,210 | ) |
Class C | | | — | | | | — | | | | — | | | | — | | | | (1,721,258 | ) | | | (355,958 | ) |
Class R3(1) | | | — | | | | — | | | | N/A | | | | N/A | | | | (2,881,156 | ) | | | (488,508 | ) |
Class I | | | — | | | | — | | | | — | | | | — | | | | (37,556,779 | ) | | | (5,892,281 | ) |
Decrease in net assets from distributions to shareholders | | | (248,727 | ) | | | (49,038 | ) | | | (149,597 | ) | | | — | | | | (66,560,582 | ) | | | (13,456,984 | ) |
Fund Share Transactions | | | | | | | | | | | | | | | | | | | | | | | | |
Proceeds from sale of shares | | | 1,079,054 | | | | 2,708,944 | | | | 985,431 | | | | 2,158,779 | | | | 42,984,272 | | | | 104,005,532 | |
Proceeds from shares issued to shareholders due to reinvestment of distributions | | | 132,143 | | | | 22,258 | | | | 72,384 | | | | — | | | | 59,872,466 | | | | 12,262,815 | |
| | | 1,211,197 | | | | 2,731,202 | | | | 1,057,815 | | | | 2,158,779 | | | | 102,856,738 | | | | 116,268,347 | |
Cost of shares redeemed | | | (6,796,459 | ) | | | (32,611,841 | ) | | | (3,070,324 | ) | | | (9,196,987 | ) | | | (90,612,859 | ) | | | (313,697,046 | ) |
Net increase (decrease) in net assets from Fund share transactions | | | (5,585,262 | ) | | | (29,880,639 | ) | | | (2,012,509 | ) | | | (7,038,208 | ) | | | 12,243,879 | | | | (197,428,699 | ) |
Net increase (decrease) in net assets | | | (437,139 | ) | | | (23,768,051 | ) | | | 1,455,974 | | | | (4,672,842 | ) | | | 180,705 | | | | (139,036,583 | ) |
Net assets at the beginning of period | | | 37,778,899 | | | | 61,546,950 | | | | 25,377,934 | | | | 30,050,776 | | | | 447,859,568 | | | | 586,896,151 | |
Net assets at the end of period | | $ | 37,341,760 | | | $ | 37,778,899 | | | $ | 26,833,908 | | | $ | 25,377,934 | | | $ | 448,040,273 | | | $ | 447,859,568 | |
Undistributed (Over-distribution of) net investment income at the end of period | | $ | 74,580 | | | $ | 167,190 | | | $ | 65,176 | | | $ | 117,145 | | | $ | 616,783 | | | $ | (18,982 | ) |
| N/A - | Large Cap Select does not offer Class B Shares and Mid Cap Select does not offer Class R3 Shares. Class B Shares of Mid Cap Select converted to Class A Shares at the close of business on February 15, 2012, and are no longer available for dividend reinvestment or through an exchange from other Nuveen mutual funds. |
| (1) | At the close of business on March 4, 2013, Large Cap Select liquidated all of its Class R3 Shares. |
See accompanying notes to financial statements.
[THIS PAGE INTENTIONALLY LEFT BLANK]
Financial Highlights (Unaudited)
| | | | | | | | | | | | | | | | | | | | | | | | | | | | | | | | |
| Selected data for a share outstanding throughout each period: | | | | |
| | | | | | |
| Class (Commencement Date) | | | | | | | | | | | | | | | | | | | |
| | | | | | Investment Operations | | | Less Distributions | | | | |
| | | | | | | |
| LARGE CAP SELECT | | | | | | | | | | | | | | | | | | | | | | |
Year Ended
October 31, | | Beginning
Net
Asset
Value | | | Net
Invest-
ment
Income
(Loss)(a) | | | Net
Realized/
Unrealized
Gain
(Loss) | | | Total | | | From
Net
Invest-
ment
Income | | | From
Accumulated
Net
Realized
Gains | | | Total | | | Ending
Net
Asset
Value | |
Class A (1/03) | | | | | | | | | | | | | | | | | | | | | | | | | | | | | |
2013(d) | | $ | 13.42 | | | $ | .04 | | | $ | 2.00 | | | $ | 2.04 | | | $ | (.06 | ) | | $ | — | | | $ | (.06 | ) | | $ | 15.40 | |
2012 | | | 11.73 | | | | .03 | | | | 1.66 | | | | 1.69 | | | | — | | | | — | | | | — | | | | 13.42 | |
2011 | | | 11.65 | | | | (.02 | ) | | | .10 | | | | .08 | | | | — | | | | — | | | | — | | | | 11.73 | |
2010 | | | 9.80 | | | | (.01 | ) | | | 1.92 | | | | 1.91 | | | | (.06 | ) | | | — | | | | (.06 | ) | | | 11.65 | |
2009 | | | 8.83 | | | | .04 | | | | .97 | | | | 1.01 | | | | (.04 | ) | | | — | | | | (.04 | ) | | | 9.80 | |
2008 | | | 17.05 | | | | .06 | | | | (6.04 | ) | | | (5.98 | ) | | | (.04 | ) | | | (2.20 | ) | | | (2.24 | ) | | | 8.83 | |
Class C (1/03) | | | | | | | | | | | | | | | | | | | | | | | | | | | | | |
2013(d) | | | 12.73 | | | | (.01 | ) | | | 1.91 | | | | 1.90 | | | | — | | | | — | | | | — | | | | 14.63 | |
2012 | | | 11.21 | | | | (.06 | ) | | | 1.58 | | | | 1.52 | | | | — | | | | — | | | | — | | | | 12.73 | |
2011 | | | 11.22 | | | | (.11 | ) | | | .10 | | | | (.01 | ) | | | — | | | | — | | | | — | | | | 11.21 | |
2010 | | | 9.46 | | | | (.08 | ) | | | 1.84 | | | | 1.76 | | | | — | | | | — | | | | — | | | | 11.22 | |
2009 | | | 8.56 | | | | (.02 | ) | | | .93 | | | | .91 | | | | (.01 | ) | | | — | | | | (.01 | ) | | | 9.46 | |
2008 | | | 16.69 | | | | (.03 | ) | | | (5.90 | ) | | | (5.93 | ) | | | — | | | | (2.20 | ) | | | (2.20 | ) | | | 8.56 | |
Class I (1/03) | | | | | | | | | | | | | | | | | | | | | | | | | | | | | |
2013(d) | | | 13.52 | | | | .06 | | | | 2.02 | | | | 2.08 | | | | (.10 | ) | | | — | | | | (.10 | ) | | | 15.50 | |
2012 | | | 11.80 | | | | .07 | | | | 1.66 | | | | 1.73 | | | | (.01 | ) | | | — | | | | (.01 | ) | | | 13.52 | |
2011 | | | 11.71 | | | | .01 | | | | .10 | | | | .11 | | | | (.02 | ) | | | — | | | | (.02 | ) | | | 11.80 | |
2010 | | | 9.85 | | | | .02 | | | | 1.92 | | | | 1.94 | | | | (.08 | ) | | | — | | | | (.08 | ) | | | 11.71 | |
2009 | | | 8.87 | | | | .07 | | | | .96 | | | | 1.03 | | | | (.05 | ) | | | — | | | | (.05 | ) | | | 9.85 | |
2008 | | | 17.10 | | | | .09 | | | | (6.05 | ) | | | (5.96 | ) | | | (.07 | ) | | | (2.20 | ) | | | (2.27 | ) | | | 8.87 | |
| | | | | | | | | | | | | | | | | | | | | | | | | | |
| | | | | | | | | | | | | | | | | | | | |
| | | | |
| | | | | | | | | | | | | | |
| | | | Ratios/Supplemental Data | |
| | | | | | | Ratios to Average
Net Assets Before
Waiver/Reimbursement | | | Ratios to Average
Net Assets After
Waiver/Reimbursement(c) | | | | |
Total
Return(b) | | | Ending
Net
Assets
(000) | | | Expenses | | | Net
Invest-
ment
Income
(Loss) | | | Expenses | | | Net
Invest-
ment
Income
(Loss) | | | Portfolio
Turnover
Rate | |
| | | | | | | | | | | | | | | | | | | | | | | | | | |
| | 15.30 | % | | $ | 3,614 | | | | 1.34 | %* | | | .56 | %* | | | 1.34 | %* | | | .56 | %* | | | 50 | % |
| | 14.41 | | | | 2,924 | | | | 1.43 | | | | .26 | | | | 1.43 | | | | .26 | | | | 127 | |
| | .69 | | | | 2,938 | | | | 1.20 | | | | (.18 | ) | | | 1.20 | | | | (.18 | ) | | | 139 | |
| | 19.49 | | | | 3,487 | | | | 1.32 | | | | (.06 | ) | | | 1.32 | | | | (.06 | ) | | | 140 | |
| | 11.54 | | | | 3,292 | | | | 1.29 | | | | .52 | | | | 1.29 | | | | .52 | | | | 185 | |
| | (39.81 | ) | | | 3,608 | | | | 1.21 | | | | .49 | | | | 1.21 | | | | .49 | | | | 210 | |
| | | | | | | | | | | | | | | | | | | | | | | | | | |
| | 14.84 | | | | 265 | | | | 2.09 | * | | | (.19 | )* | | | 2.09 | * | | | (.19 | )* | | | 50 | |
| | 13.65 | | | | 195 | | | | 2.18 | | | | (.49 | ) | | | 2.18 | | | | (.49 | ) | | | 127 | |
| | (.09 | ) | | | 183 | | | | 1.95 | | | | (.90 | ) | | | 1.95 | | | | (.90 | ) | | | 139 | |
| | 18.60 | | | | 175 | | | | 2.07 | | | | (.79 | ) | | | 2.07 | | | | (.79 | ) | | | 140 | |
| | 10.64 | | | | 186 | | | | 2.05 | | | | (.23 | ) | | | 2.05 | | | | (.23 | ) | | | 185 | |
| | (40.38 | ) | | | 180 | | | | 1.96 | | | | (.26 | ) | | | 1.96 | | | | (.26 | ) | | | 210 | |
| | | | | | | | | | | | | | | | | | | | | | | | | | |
| | 15.38 | | | | 33,463 | | | | 1.09 | * | | | .87 | * | | | 1.09 | * | | | .87 | * | | | 50 | |
| | 14.79 | | | | 34,554 | | | | 1.18 | | | | .54 | | | | 1.18 | | | | .54 | | | | 127 | |
| | .89 | | | | 58,314 | | | | .95 | | | | .07 | | | | .95 | | | | .07 | | | | 139 | |
| | 19.75 | | | | 130,803 | | | | 1.07 | | | | .21 | | | | 1.07 | | | | .21 | | | | 140 | |
| | 11.81 | | | | 147,231 | | | | 1.04 | | | | .82 | | | | 1.04 | | | | .82 | | | | 185 | |
| | (39.63 | ) | | | 207,904 | | | | .96 | | | | .74 | | | | .96 | | | | .74 | | | | 210 | |
| (a) | Per share Net Investment Income (Loss) is calculated using the average daily shares method. |
| (b) | Total return is the combination of changes in net asset value without any sales charge, reinvested dividend income at net asset value and reinvested capital gains distributions at net asset value, if any. Total returns are not annualized. |
| (c) | After fee waiver and/or expense reimbursement from the Adviser, where applicable. |
| (d) | For the six months ended April 30, 2013. |
See accompanying notes to financial statements.
Financial Highlights (Unaudited) (continued)
| | | | | | | | | | | | | | | | | | | | | | | | | | | | | | | | |
| Selected data for a share outstanding throughout each period: | | | | |
| | | | | | |
| Class (Commencement Date) | | | | | | | | | | | | | | | | | | | |
| | | | | | Investment Operations | | | Less Distributions | | | | |
| | | | | | |
| MID CAP SELECT (d) | | | | | | | | | | | | | | | | | | | |
Year Ended
October 31, | | Beginning
Net
Asset
Value | | | Net
Invest-
ment
Income
(Loss)(a) | | | Net
Realized/
Unrealized
Gain
(Loss) | | | Total | | | From
Net
Invest-
ment
Income | | | From
Accumulated
Net
Realized
Gains | | | Total | | | Ending
Net
Asset
Value | |
Class A (4/94) | | | | | | | | | | | | | | | | | | | | | | | | | |
2013(e) | | $ | 10.30 | | | $ | .04 | | | $ | 1.50 | | | $ | 1.54 | | | $ | (.05 | ) | | $ | — | | | $ | (.05 | ) | | $ | 11.79 | |
2012 | | | 9.48 | | | | .04 | | | | .78 | | | | .82 | | | | — | | | | — | | | | — | | | | 10.30 | |
2011 | | | 9.31 | | | | (.05 | ) | | | .22 | | | | .17 | | | | — | | | | — | | | | — | | | | 9.48 | |
2010 | | | 7.65 | | | | (.02 | ) | | | 1.70 | | | | 1.68 | | | | (.02 | ) | | | — | | | | (.02 | ) | | | 9.31 | |
2009 | | | 7.00 | | | | .03 | | | | .62 | | | | .65 | | | | — | | | | — | | | | — | | | | 7.65 | |
2008 | | | 10.64 | | | | (.01 | ) | | | (3.63 | ) | | | (3.64 | ) | | | — | | | | — | | | | — | | | | 7.00 | |
Class C (2/00) | | | | | | | | | | | | | | | | | | | | | | | | | |
2013(e) | | | 9.39 | | | | — | | | | 1.37 | | | | 1.37 | | | | — | | | | — | | | | — | | | | 10.76 | |
2012 | | | 8.70 | | | | (.03 | ) | | | .72 | | | | .69 | | | | — | | | | — | | | | — | | | | 9.39 | |
2011 | | | 8.61 | | | | (.11 | ) | | | .20 | | | | .09 | | | | — | | | | — | | | | — | | | | 8.70 | |
2010 | | | 7.12 | | | | (.08 | ) | | | 1.57 | | | | 1.49 | | | | — | | | | — | | | | — | | | | 8.61 | |
2009 | | | 6.56 | | | | (.01 | ) | | | .57 | | | | .56 | | | | — | | | | — | | | | — | | | | 7.12 | |
2008 | | | 10.04 | | | | (.08 | ) | | | (3.40 | ) | | | (3.48 | ) | | | — | | | | — | | | | — | | | | 6.56 | |
Class I (4/94) | | | | | | | | | | | | | | | | | | | | | | | | | |
2013(e) | | | 10.80 | | | | .05 | | | | 1.57 | | | | 1.62 | | | | (.08 | ) | | | — | | | | (.08 | ) | | | 12.34 | |
2012 | | | 9.91 | | | | .07 | | | | .82 | | | | .89 | | | | — | | | | — | | | | — | | | | 10.80 | |
2011 | | | 9.71 | | | | (.02 | ) | | | .22 | | | | .20 | | | | — | | | | — | | | | — | | | | 9.91 | |
2010 | | | 7.98 | | | | — | * | | | 1.77 | | | | 1.77 | | | | (.04 | ) | | | — | | | | (.04 | ) | | | 9.71 | |
2009 | | | 7.31 | | | | .06 | | | | .64 | | | | .70 | | | | (.03 | ) | | | — | | | | (.03 | ) | | | 7.98 | |
2008 | | | 11.09 | | | | .01 | | | | (3.79 | ) | | | (3.78 | ) | | | — | | | | — | | | | — | | | | 7.31 | |
| | | | | | | | | | | | | | | | | | | | | | | | | | |
| | | | | | | | | | | | | | | | | | | | |
| | | | |
| | | | | | | | | | | | | | |
| | | | Ratios/Supplemental Data | |
| | | | | | | Ratios to Average
Net Assets Before
Waiver/Reimbursement | | | Ratios to Average
Net Assets After
Waiver/Reimbursement(c) | | | | |
Total
Return(b) | | | Ending
Net
Assets
(000) | | | Expenses | | | Net
Invest-
ment
Income
(Loss) | | | Expenses | | | Net
Invest-
ment
Income
(Loss) | | | Portfolio
Turnover
Rate | |
| | | | | | | | | | | | | | | | | | | | | | | | | | |
| | 15.06 | % | | $ | 11,086 | | | | 1.91 | %** | | | .18 | %** | | | 1.41 | %** | | | .68 | %** | | | 57 | % |
| | 8.65 | | | | 10,862 | | | | 1.90 | | | | (.10 | ) | | | 1.41 | | | | .39 | | | | 198 | |
| | 1.83 | | | | 10,829 | | | | 1.97 | | | | (1.04 | ) | | | 1.41 | | | | (.48 | ) | | | 148 | |
| | 22.03 | | | | 12,402 | | | | 1.98 | | | | (.84 | ) | | | 1.41 | | | | (.27 | ) | | | 154 | |
| | 9.32 | | | | 12,487 | | | | 1.92 | | | | (.02 | ) | | | 1.41 | | | | .49 | | | | 186 | |
| | (34.21 | ) | | | 12,848 | | | | 1.60 | | | | (.32 | ) | | | 1.41 | | | | (.13 | ) | | | 170 | |
| | | | | | | | | | | | | | | | | | | | | | | | | | |
| | 14.59 | | | | 1,802 | | | | 2.66 | ** | | | (.57 | )** | | | 2.16 | ** | | | (.07 | )** | | | 57 | |
| | 7.93 | | | | 1,710 | | | | 2.65 | | | | (.83 | ) | | | 2.16 | | | | (.35 | ) | | | 198 | |
| | 1.05 | | | | 1,771 | | | | 2.71 | | | | (1.78 | ) | | | 2.16 | | | | (1.22 | ) | | | 148 | |
| | 20.93 | | | | 2,332 | | | | 2.73 | | | | (1.60 | ) | | | 2.16 | | | | (1.03 | ) | | | 154 | |
| | 8.54 | | | | 2,526 | | | | 2.67 | | | | (.75 | ) | | | 2.16 | | | | (.24 | ) | | | 186 | |
| | (34.66 | ) | | | 3,068 | | | | 2.35 | | | | (1.07 | ) | | | 2.16 | | | | (.88 | ) | | | 170 | |
| | | | | | | | | | | | | | | | | | | | | | | | | | |
| | 15.13 | | | | 13,945 | | | | 1.66 | ** | | | .43 | ** | | | 1.16 | ** | | | .93 | ** | | | 57 | |
| | 8.98 | | | | 12,805 | | | | 1.65 | | | | .15 | | | | 1.16 | | | | .64 | | | | 198 | |
| | 2.06 | | | | 16,646 | | | | 1.71 | | | | (.77 | ) | | | 1.16 | | | | (.23 | ) | | | 148 | |
| | 22.26 | | | | 23,076 | | | | 1.73 | | | | (.60 | ) | | | 1.16 | | | | (.03 | ) | | | 154 | |
| | 9.62 | | | | 27,030 | | | | 1.67 | | | | .30 | | | | 1.16 | | | | .81 | | | | 186 | |
| | (34.08 | ) | | | 40,409 | | | | 1.35 | | | | (.07 | ) | | | 1.16 | | | | .12 | | | | 170 | |
| (a) | Per share Net Investment Income (Loss) is calculated using the average daily shares method. |
| (b) | Total return is the combination of changes in net asset value without any sales charge, reinvested dividend income at net asset value and reinvested capital gains distributions at net asset value, if any. Total returns are not annualized. |
| (c) | After fee waiver and/or expense reimbursement from the Adviser, where applicable. |
| (d) | The financial highlights for the period from November 1, 2007 through May 3, 2009 are those of Small-Mid Cap Core Fund, which changed its principal investment strategies and changed its name to Mid Cap Select Fund on May 4, 2009. |
| (e) | For the six months ended April 30, 2013. |
| * | Rounds to less than $.01 per share. |
See accompanying notes to financial statements.
Financial Highlights (Unaudited) (continued)
| | | | | | | | | | | | | | | | | | | | | | | | | | | | | | | | |
| Selected data for a share outstanding throughout each period: | | | | |
| | | | | | |
| Class (Commencement Date) | | | | | | | | | | | | | | | | | | | |
| | | | | | Investment Operations | | | Less Distributions | | | | |
| | | | | |
| SMALL CAP SELECT | | | | | | | | | | | | | | | | |
Year Ended
October 31, | | Beginning
Net
Asset
Value | | | Net
Invest-
ment
Income
(Loss)(a) | | | Net
Realized/
Unrealized
Gain
(Loss) | | | Total | | | From
Net
Invest-
ment
Income | | | From
Accumulated
Net
Realized
Gains | | | Total | | | Ending
Net
Asset
Value | |
Class A (5/92) | | | | | | | | | | | | | | | | | | | | | | | | | | | | | |
2013(d) | | $ | 13.54 | | | $ | .01 | | | $ | 1.45 | | | $ | 1.46 | | | $ | — | | | $ | (2.15 | ) | | $ | (2.15 | ) | | $ | 12.85 | |
2012 | | | 12.44 | | | | (.05 | ) | | | 1.45 | | | | 1.40 | | | | — | | | | (.30 | ) | | | (.30 | ) | | | 13.54 | |
2011 | | | 11.72 | | | | (.09 | ) | | | .81 | | | | .72 | | | | — | | | | — | | | | — | | | | 12.44 | |
2010 | | | 9.53 | | | | (.05 | ) | | | 2.24 | | | | 2.19 | | | | — | | | | — | | | | — | | | | 11.72 | |
2009 | | | 8.27 | | | | (.01 | ) | | | 1.27 | | | | 1.26 | | | | — | | | | — | | | | — | | | | 9.53 | |
2008 | | | 14.06 | | | | (.02 | ) | | | (4.92 | ) | | | (4.94 | ) | | | — | | | | (.85 | ) | | | (.85 | ) | | | 8.27 | |
Class B (3/95) | | | | | | | | | | | | | | | | | | | | | | | | | | | | | |
2013(d) | | | 10.49 | | | | (.03 | ) | | | 1.06 | | | | 1.03 | | | | — | | | | (2.15 | ) | | | (2.15 | ) | | | 9.37 | |
2012 | | | 9.77 | | | | (.12 | ) | | | 1.14 | | | | 1.02 | | | | — | | | | (.30 | ) | | | (.30 | ) | | | 10.49 | |
2011 | | | 9.27 | | | | (.15 | ) | | | .65 | | | | .50 | | | | — | | | | — | | | | — | | | | 9.77 | |
2010 | | | 7.60 | | | | (.10 | ) | | | 1.77 | | | | 1.67 | | | | — | | | | — | | | | — | | | | 9.27 | |
2009 | | | 6.64 | | | | (.05 | ) | | | 1.01 | | | | .96 | | | | — | | | | — | | | | — | | | | 7.60 | |
2008 | | | 11.56 | | | | (.08 | ) | | | (3.99 | ) | | | (4.07 | ) | | | — | | | | (.85 | ) | | | (.85 | ) | | | 6.64 | |
Class C (9/01) | | | | | | | | | | | | | | | | | | | | | | | | | | | | | |
2013(d) | | | 12.09 | | | | (.03 | ) | | | 1.26 | | | | 1.23 | | | | — | | | | (2.15 | ) | | | (2.15 | ) | | | 11.17 | |
2012 | | | 11.22 | | | | (.13 | ) | | | 1.30 | | | | 1.17 | | | | — | | | | (.30 | ) | | | (.30 | ) | | | 12.09 | |
2011 | | | 10.65 | | | | (.17 | ) | | | .74 | | | | .57 | | | | — | | | | — | | | | — | | | | 11.22 | |
2010 | | | 8.73 | | | | (.12 | ) | | | 2.04 | | | | 1.92 | | | | — | | | | — | | | | — | | | | 10.65 | |
2009 | | | 7.63 | | | | (.06 | ) | | | 1.16 | | | | 1.10 | | | | — | | | | — | | | | — | | | | 8.73 | |
2008 | | | 13.13 | | | | (.09 | ) | | | (4.56 | ) | | | (4.65 | ) | | | — | | | | (.85 | ) | | | (.85 | ) | | | 7.63 | |
Class R3 (1/94) | | | | | | | | | | | | | | | | | | | | | | | | | | | | | |
2013(d) | | | 13.17 | | | | (.01 | ) | | | 1.40 | | | | 1.39 | | | | — | | | | (2.15 | ) | | | (2.15 | ) | | | 12.41 | |
2012 | | | 12.13 | | | | (.08 | ) | | | 1.42 | | | | 1.34 | | | | — | | | | (.30 | ) | | | (.30 | ) | | | 13.17 | |
2011 | | | 11.46 | | | | (.12 | ) | | | .79 | | | | .67 | | | | — | | | | — | | | | — | | | | 12.13 | |
2010 | | | 9.34 | | | | (.08 | ) | | | 2.20 | | | | 2.12 | | | | — | | | | — | | | | — | | | | 11.46 | |
2009 | | | 8.12 | | | | (.03 | ) | | | 1.25 | | | | 1.22 | | | | — | | | | — | | | | — | | | | 9.34 | |
2008 | | | 13.86 | | | | (.04 | ) | | | (4.85 | ) | | | (4.89 | ) | | | — | | | | (.85 | ) | | | (.85 | ) | | | 8.12 | |
Class I (5/92) | | | | | | | | | | | | | | | | | | | | | | | | | | | | | |
2013(d) | | | 14.82 | | | | .03 | | | | 1.60 | | | | 1.63 | | | | — | | | | (2.15 | ) | | | (2.15 | ) | | | 14.30 | |
2012 | | | 13.54 | | | | (.02 | ) | | | 1.60 | | | | 1.58 | | | | — | | | | (.30 | ) | | | (.30 | ) | | | 14.82 | |
2011 | | | 12.73 | | | | (.06 | ) | | | .87 | | | | .81 | | | | — | | | | — | | | | — | | | | 13.54 | |
2010 | | | 10.33 | | | | (.03 | ) | | | 2.44 | | | | 2.41 | | | | (.01 | ) | | | — | | | | (.01 | ) | | | 12.73 | |
2009 | | | 8.94 | | | | .02 | | | | 1.37 | | | | 1.39 | | | | — | | | | — | | | | — | | | | 10.33 | |
2008 | | | 15.10 | | | | .01 | | | | (5.31 | ) | | | (5.30 | ) | | | (.01 | ) | | | (.85 | ) | | | (.86 | ) | | | 8.94 | |
| | | | | | | | | | | | | | | | | | | | | | | | | | |
| | | | | | | | | | | | | | | | | | | | |
| | | | |
| | | | | | | | | | | | | | |
| | | | Ratios/Supplemental Data | |
| | | | | | | Ratios to Average
Net Assets Before
Waiver/Reimbursement | | | Ratios to Average
Net Assets After
Waiver/Reimbursement(c) | | | | |
Total
Return(b) | | | Ending
Net
Assets
(000) | | | Expenses | | | Net
Invest-
ment
Income
(Loss) | | | Expenses | | | Net
Invest-
ment
Income
(Loss) | | | Portfolio
Turnover
Rate | |
| | | | | | | | | | | | | | | | | | | | | | | | | | |
| | 12.71 | % | | $ | 156,037 | | | | 1.34 | %* | | | .15 | %* | | | 1.32 | %* | | | .17 | %* | | | 30 | % |
| | 11.62 | | | | 155,624 | | | | 1.36 | | | | (.49 | ) | | | 1.28 | | | | (.41 | ) | | | 71 | |
| | 6.14 | | | | 275,994 | | | | 1.34 | | | | (.74 | ) | | | 1.30 | | | | (.70 | ) | | | 69 | |
| | 22.98 | | | | 339,826 | | | | 1.25 | | | | (.49 | ) | | | 1.24 | | | | (.48 | ) | | | 88 | |
| | 15.24 | | | | 295,348 | | | | 1.26 | | | | (.09 | ) | | | 1.26 | | | | (.09 | ) | | | 99 | |
| | (37.00 | ) | | | 166,698 | | | | 1.26 | | | | (.15 | ) | | | 1.26 | | | | (.15 | ) | | | 92 | |
| | | | | | | | | | | | | | | | | | | | | | | | | | |
| | 12.24 | | | | 1,676 | | | | 2.09 | * | | | (.59 | )* | | | 2.07 | * | | | (.56 | )* | | | 30 | |
| | 10.88 | | | | 2,032 | | | | 2.11 | | | | (1.21 | ) | | | 2.03 | | | | (1.13 | ) | | | 71 | |
| | 5.39 | | | | 2,866 | | | | 2.09 | | | | (1.51 | ) | | | 2.05 | | | | (1.45 | ) | | | 69 | |
| | 21.97 | | | | 3,925 | | | | 2.00 | | | | (1.23 | ) | | | 1.99 | | | | (1.22 | ) | | | 88 | |
| | 14.46 | | | | 5,511 | | | | 2.01 | | | | (.80 | ) | | | 2.01 | | | | (.80 | ) | | | 99 | |
| | (37.52 | ) | | | 6,249 | | | | 2.01 | | | | (.90 | ) | | | 2.01 | | | | (.90 | ) | | | 92 | |
| | | | | | | | | | | | | | | | | | | | | | | | | | |
| | 12.28 | | | | 9,859 | | | | 2.09 | * | | | (.60 | )* | | | 2.07 | * | | | (.58 | )* | | | 30 | |
| | 10.81 | | | | 10,058 | | | | 2.11 | | | | (1.21 | ) | | | 2.03 | | | | (1.13 | ) | | | 71 | |
| | 5.35 | | | | 14,009 | | | | 2.09 | | | | (1.50 | ) | | | 2.05 | | | | (1.45 | ) | | | 69 | |
| | 21.99 | | | | 17,393 | | | | 2.00 | | | | (1.24 | ) | | | 1.99 | | | | (1.23 | ) | | | 88 | |
| | 14.42 | | | | 16,938 | | | | 2.01 | | | | (.80 | ) | | | 2.01 | | | | (.80 | ) | | | 99 | |
| | (37.44 | ) | | | 17,062 | | | | 2.01 | | | | (.90 | ) | | | 2.01 | | | | (.90 | ) | | | 92 | |
| | | | | | | | | | | | | | | | | | | | | | | | | | |
| | 12.51 | | | | 17,518 | | | | 1.59 | * | | | (.10 | )* | | | 1.57 | * | | | (.08 | )* | | | 30 | |
| | 11.42 | | | | 18,386 | | | | 1.61 | | | | (.69 | ) | | | 1.53 | | | | (.61 | ) | | | 71 | |
| | 5.85 | | | | 20,044 | | | | 1.60 | | | | (1.00 | ) | | | 1.55 | | | | (.95 | ) | | | 69 | |
| | 22.70 | | | | 18,047 | | | | 1.50 | | | | (.72 | ) | | | 1.49 | | | | (.71 | ) | | | 88 | |
| | 15.02 | | | | 24,701 | | | | 1.51 | | | | (.31 | ) | | | 1.51 | | | | (.31 | ) | | | 99 | |
| | (37.19 | ) | | | 23,069 | | | | 1.51 | | | | (.40 | ) | | | 1.51 | | | | (.40 | ) | | | 92 | |
| | | | | | | | | | | | | | | | | | | | | | | | | | |
| | 12.78 | | | | 262,950 | | | | 1.09 | * | | | .39 | * | | | 1.07 | * | | | .41 | * | | | 30 | |
| | 12.01 | | | | 261,760 | | | | 1.11 | | | | (.19 | ) | | | 1.03 | | | | (.11 | ) | | | 71 | |
| | 6.36 | | | | 273,983 | | | | 1.09 | | | | (.49 | ) | | | 1.05 | | | | (.45 | ) | | | 69 | |
| | 23.30 | | | | 400,042 | | | | 1.00 | | | | (.24 | ) | | | .99 | | | | (.23 | ) | | | 88 | |
| | 15.55 | | | | 322,658 | | | | 1.01 | | | | .19 | | | | 1.01 | | | | .19 | | | | 99 | |
| | (36.86 | ) | | | 289,685 | | | | 1.01 | | | | .10 | | | | 1.01 | | | | .10 | | | | 92 | |
| (a) | Per share Net Investment Income (Loss) is calculated using the average daily shares method. |
| (b) | Total return is the combination of changes in net asset value without any sales charge, reinvested dividend income at net asset value and reinvested capital gains distributions at net asset value, if any. Total returns are not annualized. |
| (c) | After fee waiver and/or expense reimbursement from the Adviser, where applicable. |
| (d) | For the six months ended April 30, 2013. |
See accompanying notes to financial statements.
Notes to Financial Statements (Unaudited)
1. General Information and Significant Accounting Policies
General Information
Nuveen Investment Funds, Inc. (the “Trust”), is an open-end investment company registered under the Investment Company Act of 1940, as amended. The Trust is comprised of Nuveen Large Cap Select Fund (“Large Cap Select”), Nuveen Mid Cap Select Fund (“Mid Cap Select”) and Nuveen Small Cap Select Fund (“Small Cap Select”), (each a “Fund” and collectively, the “Funds”), as diversified funds, among others. The Trust was incorporated in the state of Maryland on August 20, 1987.
On December 31, 2012, the Funds’ investment adviser converted from a Delaware corporation to a Delaware limited liability company. As a result, Nuveen Fund Advisors, Inc., a wholly-owned subsidiary of Nuveen Investments, Inc. (“Nuveen”), changed its name to Nuveen Fund Advisors, LLC (the “Adviser”). There were no changes to the identities or roles of any personnel as a result of the change.
Large Cap Select’s investment objective is capital appreciation. Under normal market conditions, the Fund invests at least 80% of its net assets, plus the amount of any borrowings for investment purposes, in common stocks of large-capitalization companies, defined as companies that have market capitalizations of $5 billion or greater at the time of purchase. At the close of business on March 4, 2013, the Fund liquidated all of its Class R3 Shares, and are no longer offered for sale.
Mid Cap Select’s investment objective is long-term growth of capital. Under normal market conditions, the Fund invests at least 80% of its net assets, plus the amount of any borrowings for investment purposes, in common stocks of mid-capitalization companies, defined as companies that have market capitalizations at the time of purchase within the market capitalization range of the companies in the Russell Midcap® Index immediately after its most recent reconstitution prior to such purchase. It is expected that reconstitution of the index will occur each year at the end of June. Immediately after the most recent reconstitution, the range was $699 million to $19.2 billion.
Small Cap Select’s investment objective is capital appreciation. Under normal market conditions, the Fund invests at least 80% of its net assets, plus the amount of any borrowings for investment purposes, in common stocks of small-capitalization companies, defined as companies that have market capitalizations of less than $3 billion at the time of purchase.
Each Fund may invest up to 15% of its total assets in non-dollar denominated equity securities of non-U.S. issuers. Each Fund may invest up to 25% of its assets, collectively, in non-dollar denominated equity securities of non-U.S. issuers and in dollar-denominated equity securities of non-U.S. issuers that are either listed on a U.S. stock exchange or represented by depositary receipts that may or may not be sponsored by a domestic bank. Up to 15% of each Fund’s total assets may be invested in equity securities of emerging market issuers. Each Fund also may invest in options, futures contracts, options on futures contracts and forward foreign currency exchanges contracts (“derivatives”) to manage market or business risk, enhance its return or hedge against adverse movements in currency exchange rates.
The Funds’ most recent prospectus provides further descriptions of each Fund’s investment objective, principal investment strategies and principal risks.
Fund Reorganizations
The Board of Directors/Trustees of the Trust and Nuveen Investment Trust II (“NIT II”) has approved the reorganization of the Nuveen Mid Cap Select Fund (the “Acquired Fund”) into Nuveen Symphony Mid-Cap Core Fund (the “Acquiring Fund”), a series of NIT II.
In order for the Reorganization to occur, it must be approved by the shareholders of the Acquired Fund. A special meeting of the Acquired Fund’s shareholders for the purpose of voting on the Reorganization is expected to be held in September 2013. If the required shareholder approval is obtained, it is anticipated that the Reorganization will be consummated shortly after the special shareholder meeting. Upon shareholder approval of the Reorganization, the Acquired Fund will transfer all of its assets and liabilities to the Acquiring Fund in exchange for Acquiring Fund shares of equal value. These Acquiring Fund shares will then be distributed to the shareholders of the Acquired Fund and the Acquired Fund will be terminated. As a result of the Reorganization, shareholders of the Acquired Fund will become shareholders of the Acquiring Fund. The shareholders of the Acquired Fund will receive Acquiring Fund shares with a total value equal to the total value of their Acquired Fund shares immediately prior to the closing of the Reorganization. Further information regarding the proposed Reorganization of the Acquired Fund will be contained in proxy materials that are expected to be sent to the Acquired Fund’s shareholders in August 2013.
Significant Accounting Policies
The following is a summary of significant accounting policies followed by the Funds in the preparation of their financial statements in accordance with accounting principles generally accepted in the United States (“U.S. GAAP”).
Investment Valuation
Common stocks and other equity-type securities are valued at the last sales price on the securities exchange on which such securities are primarily traded and are generally classified as Level 1 for fair value measurement purposes. Securities primarily traded on the NASDAQ National Market (“NASDAQ”) are valued, except as indicated below, at the NASDAQ Official Closing Price and are generally classified as Level 1. However, securities traded on a securities exchange or NASDAQ for which there were no transactions on a given day or securities not listed on a securities exchange or NASDAQ are valued at the quoted bid price and are generally classified as Level 2.
Investments in investment companies are valued at their respective net asset values on the valuation date. These investment vehicles are generally classified as Level 1.
Futures contracts are valued using the closing settlement price or, in the absence of such a price, the last traded price. Futures contracts are generally classified as Level 1.
Certain securities may not be able to be priced by the pre-established pricing methods as described above. Such securities may be valued by the Funds’ Board of Directors or its designee at fair value. These securities generally include, but are not limited to, restricted securities (securities which may not be publicly sold without registration under the Securities Act of 1933, as amended) for which a pricing service is unable to provide a market price; securities whose trading has been formally suspended; debt securities that have gone into default and for which there is no current market quotation; a security whose market price is not available from a pre-established pricing source; a security with respect to which an event has occurred that is likely to materially affect the value of the security after the market has closed but before the calculation of a Fund’s net asset value (as may be the case in non-U.S. markets on which the security is primarily traded) or make it difficult or impossible to obtain a reliable market quotation; and a security whose price, as provided by the pricing service, is not deemed to reflect the security’s fair value. As a general principle, the fair value of a security would appear to be the amount that the owner might reasonably expect to receive for it in a current sale. A variety of factors may be considered in determining the fair value of such securities, which may include consideration of the following: yields or prices of investments of comparable quality, type of issue, coupon, maturity and rating, market quotes or indications of value from security dealers, evaluations of anticipated cash flows or collateral, general market conditions and other information and analysis, including the obligor’s credit characteristics considered relevant. These securities are generally classified as Level 2 or Level 3 depending on the priority of the significant inputs. Regardless of the method employed to value a particular security, all valuations are subject to review by the Funds’ Board of Trustees or its designee.
Refer to Footnote 2 – Fair Value Measurements for further details on the leveling of securities held by the Funds as of the end of the reporting period.
Investment Transactions
Investment transactions are recorded on a trade date basis. Realized gains and losses from investment transactions are determined on the specific identification method, which is the same basis used for federal income tax purposes.
Investment Income
Dividend income is recorded on the ex-dividend date or, for foreign securities, when information is available. Interest income is recorded on an accrual basis. Securities lending income is comprised of fees earned from borrowers and income earned on cash collateral investments, net of lending agent fees.
Professional Fees
Professional fees presented on the Statement of Operations consist of legal fees incurred in the normal course of operations, audit fees, tax consulting fees and, in some cases, workout expenditures. Workout expenditures are incurred in an attempt to protect or enhance an investment, or to pursue other claims or legal actions on behalf of Fund shareholders. Legal fee refund presented on the Statement of Operations reflects a refund of workout expenditures paid in a prior reporting period, when applicable.
Income Taxes
Each Fund is a separate taxpayer for federal income tax purposes. Each Fund intends to distribute substantially all of its net investment income and net capital gains to shareholders and to otherwise comply with the requirements of Subchapter M of the Internal Revenue Code applicable to regulated investment companies. Therefore, no federal income tax provision is required.
For all open tax years and all major taxing jurisdictions, management of the Funds has concluded that there are no significant uncertain tax positions that would require recognition in the financial statements. Open tax years are those that are open for examination by taxing authorities (i.e., generally the last four tax year ends and the interim tax period since then). Furthermore, management of the Funds is also not aware of any tax positions for which it is reasonably possible that the total amounts of unrecognized tax benefits will significantly change in the next twelve months.
Dividends and Distributions to Shareholders
Dividends from net investment income and net realized gains from investment transactions, if any, are declared and distributed to shareholders at least annually. Furthermore, capital gains are distributed only to the extent they exceed available capital loss carryforwards.
Distributions to shareholders are recorded on the ex-dividend date. The amount and timing of distributions are determined in accordance with federal income tax regulations, which may differ from U.S. GAAP.
The Funds may receive distributions from holdings in Real Estate Investment Trusts (“REITs”). Distributions from REITs may be characterized as ordinary income, net capital gain, or a return of capital to the REIT shareholder. The proper characterization of REIT distributions is generally not known until after the end of each calendar year. The actual character of distributions to Fund shareholders will be reflected on the Form 1099 received by shareholders after the end of the calendar year. Due to the nature of REIT investments, a portion of the distributions received by the Fund shareholder may represent a return of capital.
Notes to Financial Statements (Unaudited) (continued)
Share Classes and Sales Charges
Class A Shares are generally sold with an up-front sales charge and incur a .25% annual 12b-1 service fee. Class A Share purchases of $1 million or more are sold at net asset value without an up-front sales charge but may be subject to a contingent deferred sales charge (“CDSC”) if redeemed within twelve months of purchase. Small Cap Select will issue Class B Shares upon the exchange of Class B Shares from another Nuveen mutual fund or for purposes of dividend reinvestment, but Class B Shares are not available for new accounts or for additional investment into existing accounts. Class B Shares were sold without an up-front sales charge but incur a .75% annual 12b-1 distribution fee and a .25% annual 12b-1 service fee. Class B Shares are subject to a CDSC of up to 5% depending upon the length of time the shares are held by the investor (CDSC is reduced to 0% at the end of six years). Class B Shares automatically convert to Class A Shares eight years after purchase. Class C Shares are sold without an up-front sales charge but incur a .75% annual 12b-1 distribution fee and a .25% annual 12b-1 service fee. Class C Shares are subject to a CDSC of 1% if redeemed within twelve months of purchase. Class R3 Shares are sold without an up-front sales charge but incur a .25% annual 12b-1 distribution and a .25% annual 12b-1 service fee. Class I Shares are not subject to any sales charge or 12b-1 distribution or service fees.
Foreign Currency Transactions
Each Fund is authorized to engage in foreign currency exchange transactions, including foreign currency exchange contracts, futures, options and swap contracts. To the extent that the Funds invest in securities and/or contracts that are denominated in a currency other than U.S. dollars, the Funds will be subject to currency risk, which is the risk that an increase in the U.S. dollar relative to the foreign currency will reduce returns or portfolio value. Generally, when the U.S. dollar rises in value against a foreign currency, the Funds’ investments denominated in that currency will lose value because its currency is worth fewer U.S. dollars; the opposite effect occurs if the U.S. dollar falls in relative value. Investments and other assets and liabilities denominated in foreign currencies are converted into U.S. dollars on a spot (i.e. cash) basis at the spot rate prevailing in the foreign currency exchange market at the time of valuation. Purchases and sales of investments and income denominated in foreign currencies are translated into U.S. dollars on the respective dates of such transactions.
The books and records of the Funds are maintained in U.S. dollars. Foreign currencies, assets and liabilities are translated into U.S. dollars at 4:00 p.m. Eastern Time. Investment transactions, income and expenses are translated on the respective dates of such transactions. Net realized foreign currency gains and losses resulting from changes in exchange rates include foreign currency gains and losses between trade date and settlement date of the transactions, foreign currency transactions, and the difference between the amounts of interest and dividends recorded on the books of a Fund and the amounts actually received.
The realized gains and losses resulting from changes in foreign currency exchange rates and changes in foreign exchange rates associated with other assets and liabilities on investments and derivatives are recognized as a component of “Net realized gain (loss) from investments and foreign currency,” on the Statement of Operations, when applicable.
The unrealized gains and losses resulting from changes in foreign currency exchange rates and changes in foreign exchange rates associated with other assets and liabilities on investments are recognized as a component of “Change in net unrealized appreciation (depreciation) of investments and foreign currency,” on the Statement of Operations, when applicable.
Market and Counterparty Credit Risk
In the normal course of business each Fund may invest in financial instruments and enter into financial transactions where risk of potential loss exists due to changes in the market (market risk) or failure of the other party to the transaction to perform (counterparty credit risk). The potential loss could exceed the value of the financial assets recorded on the financial statements. Financial assets, which potentially expose each Fund to counterparty credit risk, consist principally of cash due from counterparties on forward, option and swap transactions, when applicable. The extent of each Fund’s exposure to counterparty credit risk in respect to these financial assets approximates their carrying value as recorded on the Statement of Assets and Liabilities. Futures contracts, when applicable, expose a Fund to minimal counterparty credit risk as they are exchange traded and the exchange’s clearinghouse, which is counterparty to all exchange traded futures, guarantees the futures contracts against default.
Each Fund helps manage counterparty credit risk by entering into agreements only with counterparties the Adviser believes have the financial resources to honor their obligations and by having the Adviser monitor the financial stability of the counterparties. Additionally, counterparties may be required to pledge collateral daily (based on the daily valuation of the financial asset) on behalf of each Fund with a value approximately equal to the amount of any unrealized gain above a pre-determined threshold. Reciprocally, when each Fund has an unrealized loss, the Funds have instructed the custodian to pledge assets of the Funds as collateral with a value approximately equal to the amount of the unrealized loss above a pre-determined threshold. Collateral pledges are monitored and subsequently adjusted if and when the valuations fluctuate, either up or down, by at least the pre-determined threshold amount.
Multiclass Operations and Allocations
Income and expenses of the Funds that are not directly attributable to a specific class of shares are prorated among the classes based on the relative net assets of each class. Expenses directly attributable to a class of shares, which presently only include 12b-1 distribution fees and shareholder service fees, are recorded to the specific class.
Realized and unrealized capital gains and losses of the Funds are prorated among the classes based on the relative net assets of each class.
Securities Lending
In order to generate additional income, each Fund may lend securities representing up to one-third of the value of its total assets (which includes collateral for securities on loan) to broker-dealers, banks or other institutions. Each Fund’s policy is to receive cash collateral equal to at least 102% of the value of securities loaned, which is recognized as “Collateral from securities lending program” on the Statement of Assets and Liabilities. The adequacy of the collateral is monitored on a daily basis. If the value of the securities on loan increases, such that the level of collateralization falls below 102%, additional collateral is received from the borrower, which is recognized as “Due from broker” on the Statement of Assets and Liabilities, when applicable. As with other extensions of credit, there may be risks of delay in recovery of the securities or even loss of rights in the collateral should the borrower of the security fail financially.
The Funds’ custodian serves as the securities lending agent for the Funds. Each Fund pays the custodian a fee based on the Fund’s proportional share of the custodian’s expense of operating its securities lending program. Collateral for securities on loan is invested in a money market fund, which is recognized as “Investments purchased with collateral from securities lending” on the Statement of Assets and Liabilities.
Income from securities lending, net of fees paid, is recognized on the Statement of Operations as “Securities lending income, net.” Securities lending fees paid by each Fund during the six months ended April 30, 2013, were as follows:
| | | | | | | | | | | | |
| | | |
| | | Large Cap
Select | | | Mid Cap
Select | | | Small Cap
Select | |
Securities lending fees paid | | $ | 552 | | | $ | 3,460 | | | $ | 26,647 | |
Indemnifications
Under the Trust’s organizational documents, its officers and directors are indemnified against certain liabilities arising out of the performance of their duties to the Trust. In addition, in the normal course of business, the Trust enters into contracts that provide general indemnifications to other parties. The Trust’s maximum exposure under these arrangements is unknown as this would involve future claims that may be made against the Trust that have not yet occurred. However, the Trust has not had prior claims or losses pursuant to these contracts and expects the risk of loss to be remote.
Use of Estimates
The preparation of financial statements in conformity with U.S. GAAP requires management to make estimates and assumptions that affect the reported amounts of assets and liabilities at the date of the financial statements and the reported amounts of increases and decreases in net assets from operations during the reporting period. Actual results may differ from those estimates.
2. Fair Value Measurements
Fair value is defined as the price that the Funds would receive upon selling an investment or transferring a liability in an orderly transaction to an independent buyer in the principal or most advantageous market for the investment. A three-tier hierarchy is used to maximize the use of observable market data and minimize the use of unobservable inputs and to establish classification of fair value measurements for disclosure purposes. Observable inputs reflect the assumptions market participants would use in pricing the asset or liability. Observable inputs are based on market data obtained from sources independent of the reporting entity. Unobservable inputs reflect the reporting entity’s own assumptions about the assumptions market participants would use in pricing the asset or liability. Unobservable inputs are based on the best information available in the circumstances. The following is a summary of the three-tiered hierarchy of valuation input levels.
| | |
| Level 1 – | | Inputs are unadjusted and prices are determined using quoted prices in active markets for identical securities. |
| Level 2 – | | Prices are determined using other significant observable inputs (including quoted prices for similar securities, interest rates, prepayment speeds, credit risk, etc.). |
| Level 3 – | | Prices are determined using significant unobservable inputs (including management’s assumptions in determining the fair value of investments). |
The inputs or methodologies used for valuing securities are not an indication of the risks associated with investing in those securities. The following is a summary of each Fund’s fair value measurements as of the end of the reporting period:
| | | | | | | | | | | | | | | | |
| Large Cap Select | | Level 1 | | | Level 2 | | | Level 3 | | | Total | |
Long-Term Investments*: | | | | | | | | | | | | | | | | |
Common Stocks | | $ | 36,672,825 | | | $ | — | | | $ | — | | | $ | 36,672,825 | |
Investments Purchased with Collateral from Securities Lending | | | 3,370,739 | | | | — | | | | — | | | | 3,370,739 | |
Short-Term Investments: | | | | | | | | | | | | | | | | |
Money Market Funds | | | 12,798 | | | | — | | | | — | | | | 12,798 | |
Total | | $ | 40,056,362 | | | $ | — | | | $ | — | | | $ | 40,056,362 | |
Notes to Financial Statements (Unaudited) (continued)
| | | | | | | | | | | | | | | | |
| Mid Cap Select | | Level 1 | | | Level 2 | | | Level 3 | | | Total | |
Long-Term Investments*: | | | | | | | | | | | | | | | | |
Common Stocks | | $ | 26,649,479 | | | $ | — | | | $ | — | | | $ | 26,649,479 | |
Investments Purchased with Collateral from Securities Lending | | | 5,578,100 | | | | — | | | | — | | | | 5,578,100 | |
Short-Term Investments: | | | | | | | | | | | | | | | | |
Money Market Funds | | | 212,496 | | | | — | | | | — | | | | 212,496 | |
Total | | $ | 32,440,075 | | | $ | — | | | $ | — | | | $ | 32,440,075 | |
| | | | |
| Small Cap Select | | Level 1 | | | Level 2 | | | Level 3 | | | Total | |
Long-Term Investments*: | | | | | | | | | | | | | | | | |
Common Stocks | | $ | 433,948,559 | | | $ | — | | | $ | — | | | $ | 433,948,559 | |
Investments Purchased with Collateral from Securities Lending | | | 91,784,197 | | | | — | | | | — | | | | 91,784,197 | |
Short-Term Investments: | | | | | | | | | | | | | | | | |
Money Market Funds | | | 17,002,897 | | | | — | | | | — | | | | 17,002,897 | |
Total | | $ | 542,735,653 | | | $ | — | | | $ | — | | | $ | 542,735,653 | |
| * | Refer to the Fund’s Portfolio of Investments for industry classifications. |
The Nuveen funds’ Board of Directors/Trustees is responsible for the valuation process and has delegated the oversight of the daily valuation process to the Adviser’s Valuation Committee. The Valuation Committee, pursuant to the valuation policies and procedures adopted by the Board of Directors/Trustees, is responsible for making fair value determinations, evaluating the effectiveness of the funds’ pricing policies, and reporting to the Board of Directors/Trustees. The Valuation Committee is aided in its efforts by the Adviser’s dedicated Securities Valuation Team, which is responsible for administering the daily valuation process and applying fair value methodologies as approved by the Valuation Committee. When determining the reliability of independent pricing services for investments owned by the funds, the Valuation Committee, among other things, conducts due diligence reviews of the pricing services and monitors the quality of security prices received through various testing reports conducted by the Securities Valuation Team.
The Valuation Committee will consider pricing methodologies it deems relevant and appropriate when making a fair value determination, based on the facts and circumstances specific to the portfolio instrument. Fair value determinations generally will be derived as follows, using public or private market information:
| | (i.) | If available, fair value determinations shall be derived by extrapolating from recent transactions or quoted prices for identical or comparable securities. |
| | (ii.) | If such information is not available, an analytical valuation methodology may be used based on other available information including, but not limited to: analyst appraisals, research reports, corporate action information, issuer financial statements and shelf registration statements. Such analytical valuation methodologies may include, but are not limited to: multiple of earnings, discount from market value of a similar freely-traded security, discounted cash flow analysis, book value or a multiple thereof, risk premium/yield analysis, yield to maturity and/or fundamental investment analysis. |
The purchase price of a portfolio instrument will be used to fair value the instrument only if no other valuation methodology is available or deemed appropriate, and it is determined that the purchase price fairly reflects the instrument’s current value.
For each portfolio security that has been fair valued pursuant to the policies adopted by the Board of Directors/Trustees, the fair value price is compared against the last available and next available market quotations. The Valuation Committee reviews the results of such testing and fair valuation occurrences are reported to the Board of Directors/Trustees.
3. Derivative Instruments and Hedging Activities
Each Fund is authorized to invest in certain derivative instruments. The Funds record derivative instruments at fair value, with changes in fair value recognized on the Statement of Operations, when applicable. Even though the Funds’ investments in derivatives may represent economic hedges, they are not considered to be hedge transactions for financial reporting purposes. Although the Funds are authorized to invest in derivative instruments, and may do so in the future, they did not make any such investments during the six months ended April 30, 2013.
4. Fund Shares
Transactions in Fund shares were as follows:
| | | | | | | | | | | | | | | | |
| | | Large Cap Select | |
| | | Six Months Ended
4/30/13 | | | Year Ended
10/31/12 | |
| | | Shares | | | Amount | | | Shares | | | Amount | |
Shares sold: | | | | | | | | | | | | | | | | |
Class A | | | 34,517 | | | $ | 484,221 | | | | 25,332 | | | $ | 331,639 | |
Class C | | | 2,996 | | | | 42,986 | | | | 1,390 | | | | 17,576 | |
Class R3(1) | | | 1,190 | | | | 16,638 | | | | 1,045 | | | | 13,038 | |
Class I | | | 37,217 | | | | 535,209 | | | | 197,949 | | | | 2,346,691 | |
Shares issued to shareholders due to reinvestment of distributions: | | | | | | | | | | | | | | | | |
Class A | | | 1,055 | | | | 14,175 | | | | — | | | | — | |
Class C | | | — | | | | — | | | | — | | | | — | |
Class R3(1) | | | 19 | | | | 251 | | | | — | | | | — | |
Class I | | | 8,707 | | | | 117,717 | | | | 1,891 | | | | 22,258 | |
| | | | 85,701 | | | | 1,211,197 | | | | 227,607 | | | | 2,731,202 | |
Shares redeemed: | | | | | | | | | | | | | | | | |
Class A | | | (18,818 | ) | | | (262,298 | ) | | | (57,942 | ) | | | (729,523 | ) |
Class C | | | (202 | ) | | | (2,715 | ) | | | (2,456 | ) | | | (29,802 | ) |
Class R3(1) | | | (9,255 | ) | | | (133,842 | ) | | | (2,655 | ) | | | (34,618 | ) |
Class I | | | (442,885 | ) | | | (6,397,604 | ) | | | (2,584,843 | ) | | | (31,817,898 | ) |
| | | | (471,160 | ) | | | (6,796,459 | ) | | | (2,647,896 | ) | | | (32,611,841 | ) |
Net increase (decrease) | | | (385,459 | ) | | $ | (5,585,262 | ) | | | (2,420,289 | ) | | $ | (29,880,639 | ) |
| |
| | | Mid Cap Select | |
| | | Six Months Ended
4/30/13 | | | Year Ended
10/31/12 | |
| | | Shares | | | Amount | | | Shares | | | Amount | |
Shares sold: | | | | | | | | | | | | | | | | |
Class A | | | 19,936 | | | $ | 223,068 | | | | 111,075 | | | $ | 1,129,105 | |
Class B(2) | | | — | | | | — | | | | — | | | | — | |
Class C | | | 1,590 | | | | 16,374 | | | | 15,425 | | | | 139,843 | |
Class I | | | 62,542 | | | | 745,989 | | | | 86,341 | | | | 889,831 | |
Shares issued to shareholders due to reinvestment of distributions: | | | | | | | | | | | | | | | | |
Class A | | | 4,933 | | | | 51,301 | | | | — | | | | — | |
Class B(2) | | | — | | | | — | | | | — | | | | — | |
Class C | | | — | | | | — | | | | — | | | | — | |
Class I | | | 1,938 | | | | 21,083 | | | | — | | | | — | |
| | | | 90,939 | | | | 1,057,815 | | | | 212,841 | | | | 2,158,779 | |
Shares redeemed: | | | | | | | | | | | | | | | | |
Class A | | | (138,745 | ) | | | (1,541,709 | ) | | | (199,282 | ) | | | (2,003,131 | ) |
Class B(2) | | | — | | | | — | | | | (100,888 | ) | | | (862,888 | ) |
Class C | | | (16,207 | ) | | | (160,306 | ) | | | (36,782 | ) | | | (341,043 | ) |
Class I | | | (120,285 | ) | | | (1,368,309 | ) | | | (580,212 | ) | | | (5,989,925 | ) |
| | | | (275,237 | ) | | | (3,070,324 | ) | | | (917,164 | ) | | | (9,196,987 | ) |
Net increase (decrease) | | | (184,298 | ) | | $ | (2,012,509 | ) | | | (704,323 | ) | | $ | (7,038,208 | ) |
| (1) | After the close of business on March 4, 2013, Large Cap Select liquidated all of its Class R3 Shares. |
| (2) | Class B Shares of Mid Cap Select converted to Class A Shares at the close of business on February 15, 2012 and are no longer available for dividend reinvestment or through an exchange from other Nuveen mutual funds. |
Notes to Financial Statements (Unaudited) (continued)
| | | | | | | | | | | | | | | | |
| | | Small Cap Select | |
| | | Six Months Ended
4/30/13 | | | Year Ended
10/31/12 | |
| | | Shares | | | Amount | | | Shares | | | Amount | |
Shares sold: | | | | | | | | | | | | | | | | |
Class A | | | 1,146,143 | | | $ | 14,550,424 | | | | 3,405,459 | | | $ | 44,581,140 | |
Class B – exchanges | | | 408 | | | | 3,424 | | | | 55 | | | | 510 | |
Class C | | | 21,071 | | | | 225,482 | | | | 33,316 | | | | 400,508 | |
Class R3 | | | 232,828 | | | | 2,850,285 | | | | 362,918 | | | | 4,572,748 | |
Class I | | | 1,809,118 | | | | 25,354,657 | | | | 3,848,641 | | | | 54,450,626 | |
Shares issued to shareholders due to reinvestment of distributions: | | | | | | | | | | | | | | | | |
Class A | | | 2,079,011 | | | | 23,825,468 | | | | 555,168 | | | | 6,578,745 | |
Class B | | | 45,369 | | | | 380,192 | | | | 8,774 | | | | 81,068 | |
Class C | | | 163,836 | | | | 1,636,719 | | | | 31,587 | | | | 336,407 | |
Class R3 | | | 260,032 | | | | 2,881,156 | | | | 42,049 | | | | 485,669 | |
Class I | | | 2,444,971 | | | | 31,148,931 | | | | 369,469 | | | | 4,780,926 | |
| | | | 8,202,787 | | | | 102,856,738 | | | | 8,657,436 | | | | 116,268,347 | |
Shares redeemed: | | | | | | | | | | | | | | | | |
Class A | | | (2,572,556 | ) | | | (32,521,685 | ) | | | (14,663,335 | ) | | | (201,595,961 | ) |
Class B | | | (60,642 | ) | | | (568,569 | ) | | | (108,436 | ) | | | (1,128,129 | ) |
Class C | | | (134,116 | ) | | | (1,485,151 | ) | | | (482,065 | ) | | | (5,720,510 | ) |
Class R3 | | | (477,612 | ) | | | (5,925,688 | ) | | | (661,413 | ) | | | (8,291,187 | ) |
Class I | | | (3,535,216 | ) | | | (50,111,766 | ) | | | (6,784,819 | ) | | | (96,961,259 | ) |
| | | | (6,780,142 | ) | | | (90,612,859 | ) | | | (22,700,068 | ) | | | (313,697,046 | ) |
Net increase (decrease) | | | 1,422,645 | | | $ | 12,243,879 | | | | (14,042,632 | ) | | $ | (197,428,699 | ) |
Class B Shares that converted to Class A Shares (recognized as a component of Class A Shares sold and Class B Shares redeemed) during the six months ended April 30, 2013 and fiscal year ended October 31, 2012, were as follows:
| | | | | | | | |
| Fund | | Six Months Ended
4/30/13 | | | Year Ended
10/31/12 | |
Mid Cap Select | | | — | | | | 18,510 | |
Small Cap Select | | | 9,639 | | | | 83,248 | |
5. Investment Transactions
Purchases and sales (excluding investments purchased with collateral from securities lending and short-term investments, where applicable) during the six months ended April 30, 2013, were as follows:
| | | | | | | | | | | | |
| | | Large Cap
Select | | | Mid Cap
Select | | | Small Cap
Select | |
Purchases | | $ | 18,484,350 | | | $ | 14,705,928 | | | $ | 131,069,641 | |
Sales | | | 23,870,189 | | | | 16,259,156 | | | | 191,194,345 | |
6. Income Tax Information
The following information is presented on an income tax basis. Differences between amounts for financial statement and federal income tax purposes are primarily due to timing differences in recognizing certain gains and losses on investment transactions. To the extent that differences arise that are permanent in nature, such amounts are reclassified within the capital accounts as detailed below. Temporary differences do not require reclassification. Temporary and permanent differences do not impact the net asset values of the Funds.
At April 30, 2013, the cost and unrealized appreciation (depreciation) of investments as determined on a federal income tax basis, were as follows:
| | | | | | | | | | | | |
| | | Large Cap
Select | | | Mid Cap
Select | | | Small Cap
Select | |
Cost of investments | | $ | 34,847,170 | | | $ | 29,185,641 | | | $ | 477,892,167 | |
Gross unrealized: | | | | | | | | | | | | |
Appreciation | | $ | 5,554,058 | | | $ | 3,644,315 | | | $ | 86,578,996 | |
Depreciation | | | (344,866 | ) | | | (389,881 | ) | | | (21,735,510 | ) |
Net unrealized appreciation (depreciation) of investments | | $ | 5,209,192 | | | $ | 3,254,434 | | | $ | 64,843,486 | |
Permanent differences, primarily due to net operating losses, tax equalization and REIT adjustments, resulted in reclassifications among the Funds’ components of net assets at October 31, 2012, the Funds’ last tax year end, as follows:
| | | | | | | | | | | | |
| | | Large Cap
Select | | | Mid Cap
Select | | | Small Cap
Select | |
Capital paid-in | | $ | (4,786 | ) | | $ | — | | | $ | 5,799,953 | |
Undistributed (Over-distribution of) net investment income | | | — | | | | (3,568 | ) | | | 1,434,162 | |
Accumulated net realized gain (loss) | | | 4,786 | | | | 3,568 | | | | (7,234,115 | ) |
The tax components of undistributed net ordinary income and net long-term capital gains at October 31, 2012, the Funds’ last tax year end, were as follows:
| | | | | | | | | | | | |
| | | Large Cap
Select | | | Mid Cap
Select | | | Small Cap
Select | |
Undistributed net ordinary income* | | $ | 178,136 | | | $ | 127,226 | | | $ | 11,425,324 | |
Undistributed net long-term capital gains | | | — | | | | — | | | | 54,954,814 | |
| * | Net ordinary income consists of net taxable income derived from dividends, interest and net short-term capital gains, if any. |
The tax character of distributions paid during the Funds’ last tax year ended October 31, 2012, was designated for purposes of the dividends paid deduction as follows:
| | | | | | | | | | | | |
| | | Large Cap
Select | | | Mid Cap
Select | | | Small Cap
Select | |
Distributions from net ordinary income* | | $ | 49,038 | | | | — | | | $ | — | |
Distributions from net long-term capital gains | | | — | | | | — | | | | 13,456,984 | |
| * | Net ordinary income consists of net taxable income derived from dividends, interest, net short-term capital gains and current year earnings and profits attributable to realized gains, if any. |
At October 31, 2012, the Funds’ last tax year end, the following Funds had unused capital loss carryforwards available for federal income tax purposes to be applied against future capital gains, if any. If not applied, the carryforwards will expire as follows:
| | | | | | | | |
| | | Large Cap
Select | | | Mid Cap
Select | |
Expiration: | | | | | | | | |
October 31, 2016 | | $ | 16,448,599 | | | $ | 4,674,453 | |
October 31, 2017 | | | 54,315,490 | | | | 15,708,192 | |
Total | | $ | 70,764,089 | | | $ | 20,382,645 | |
During the Funds’ last tax year ended October 31, 2012, the Funds utilized their capital loss carryforwards as follows:
| | | | | | | | |
| | | Large Cap
Select | | | Mid Cap
Select | |
Utilized capital loss carryforwards | | $ | 5,144,732 | | | $ | 3,145,376 | |
Under the Regulated Investment Company Modernization Act of 2010, capital losses incurred by the Funds after December 31, 2010, will not be subject to expiration. During the Funds’ last tax year ended October 31, 2012, there were no post-enactment capital losses generated.
7. Management Fees and Other Transactions with Affiliates
Each Fund’s management fee consists of two components – a fund-level fee, based only on the amount of assets within each individual Fund, and a complex-level fee, based on the aggregate amount of all eligible fund assets managed by the Adviser. This pricing structure enables each Fund’s shareholders to benefit from growth in the assets within their respective Fund as well as from growth in the amount of complex-wide assets managed by the Adviser.
The annual fund-level fee for each Fund, payable monthly, is calculated according to the following schedule:
| | | | | | | | | | | | |
| Average Daily Net Assets | | Large Cap
Select
Fund-Level
Fee Rate | | | Mid Cap
Select
Fund-Level
Fee Rate | | | Small Cap
Select
Fund-Level
Fee Rate | |
For the first $125 million | | | .5500 | % | | | .7000 | % | | | .7000 | % |
For the next $125 million | | | .5375 | | | | .6875 | | | | .6875 | |
For the next $250 million | | | .5250 | | | | .6750 | | | | .6750 | |
For the next $500 million | | | .5125 | | | | .6625 | | | | .6625 | |
For the next $1 billion | | | .5000 | | | | .6500 | | | | .6500 | |
For net assets over $2 billion | | | .4750 | | | | .6250 | | | | .6250 | |
Notes to Financial Statements (Unaudited) (continued)
The annual complex-level fee for each Fund, payable monthly, is determined by taking the complex-level fee rate, which is based on the aggregate amount of “eligible assets” of all Nuveen funds as set forth in the schedule below, and making, as appropriate, an upward adjustment to that rate based upon the percentage of the particular fund’s assets that are not “eligible assets.” The complex-level fee schedule for each Fund is as follows:
| | | | |
| Complex-Level Asset Breakpoint Level* | | Effective Rate at Breakpoint Level | |
$55 billion | | | .2000 | % |
$56 billion | | | .1996 | |
$57 billion | | | .1989 | |
$60 billion | | | .1961 | |
$63 billion | | | .1931 | |
$66 billion | | | .1900 | |
$71 billion | | | .1851 | |
$76 billion | | | .1806 | |
$80 billion | | | .1773 | |
$91 billion | | | .1691 | |
$125 billion | | | .1599 | |
$200 billion | | | .1505 | |
$250 billion | | | .1469 | |
$300 billion | | | .1445 | |
| * | The complex-level fee is calculated based upon the aggregate daily “eligible assets” of all Nuveen Funds. Eligible assets do not include assets attributable to investments in other Nuveen Funds or assets in excess of $2 billion added to the Nuveen Fund complex in connection with the Adviser’s assumption of the management of the former First American Funds effective January 1, 2011. Eligible assets include closed-end fund assets managed by the Adviser that are attributable to financial leverage. For these purposes, financial leverage includes the closed-end funds’ use of preferred stock and borrowings and certain investments in the residual interest certificates (also called inverse floating rate securities) in tender option bond (TOB) trusts, including the portion of assets held by a TOB trust that has been effectively financed by the trust’s issuance of floating rate securities, subject to an agreement by the Adviser as to certain funds to limit the amount of such assets for determining eligible assets in certain circumstances. As of April 30, 2013, the complex-level fee rate for each of these Funds was as follows: |
| | | | |
| Fund | | Complex-Level Fee Rate | |
Large Cap Select | | | .2000 | % |
Mid Cap Select | | | .2000 | |
Small Cap Select | | | .2000 | |
The management fee compensates the Adviser for overall investment advisory and administrative services and general office facilities. The Adviser is responsible for each Fund’s overall strategy and asset allocation decisions. The Adviser has entered into sub-advisory agreements with Nuveen Asset Management, LLC (the “Sub-Adviser”), a wholly-owned subsidiary of the Adviser, under which the Sub-Adviser manages the investment portfolios of the Funds. The Sub-Adviser is compensated for its services to the Funds from the management fees paid to the Adviser.
The Adviser has contractually agreed to waive fees and/or reimburse other Fund expenses of Mid Cap Select so that total annual Fund operating expenses, after fee waivers and/or expense reimbursements and excluding acquired fund fees and expenses, do not exceed the percentages of the average daily net assets of any class of Fund shares in the amounts and for the time periods stated in the following table:
| | | | |
| | | Mid Cap
Select | |
Class A Shares | | | 1.41 | % |
Class C Shares | | | 2.16 | |
Class I Shares | | | 1.16 | |
Expiration Date | | | February 28, 2014 | |
The Adviser agreed to reimburse management fees across all share classes of Large Cap Select and Small Cap Select through December 31, 2012, to the extent necessary to maintain Class I Share total annual operating expenses, not including any acquired fund fees and expenses, at the applicable percentage of daily net assets listed in the Maximum Expense Level row of the following table, provided that in no event will the Adviser be required to make any reimbursements that would result in an annualized net management fee of less than the applicable percentage of daily net assets listed in the Minimum Management Fee row of the following table.
| | | | | | | | |
| | | Large Cap
Select | | | Small Cap
Select | |
Maximum Expense Level | | | 1.13 | % | | | 1.00 | % |
Minimum Management Fee | | | .75 | | | | .80 | |
The Adviser may also voluntarily reimburse expenses from time to time in any of the Funds. Voluntary reimbursements may be terminated at any time at the Adviser’s discretion.
The Trust pays no compensation directly to those of its directors who are affiliated with the Adviser or to its officers, all of whom receive remuneration for their services to the Trust from the Adviser or its affiliates. The Board of Directors has adopted a deferred compensation plan for independent directors that enable directors to elect to defer receipt of all or a portion of the annual compensation they are entitled to receive from certain Nuveen-advised funds. Under the plan, deferred amounts are treated as though equal dollar amounts had been invested in shares of select Nuveen-advised funds.
During the six months ended April 30, 2013, Nuveen Securities, LLC (the “Distributor”), a wholly-owned subsidiary of Nuveen, collected sales charges on purchases of Class A Shares, the majority of which were paid out as concessions to financial intermediaries as follows:
| | | | | | | | | | | | |
| | | Large Cap
Select | | | Mid Cap
Select | | | Small Cap
Select | |
Sales charges collected | | $ | 6,916 | | | $ | 21,025 | | | $ | 3,226 | |
Paid to financial intermediaries | | | 6,118 | | | | 18,352 | | | | 2,864 | |
The Distributor also received 12b-1 service fees on Class A Shares, substantially all of which were paid to compensate financial intermediaries for providing services to shareholders relating to their investments.
During the six months ended April 30, 2013, the Distributor compensated financial intermediaries directly with commission advances at the time of purchase as follows:
| | | | | | | | | | | | |
| | | Large Cap
Select | | | Mid Cap
Select | | | Small Cap
Select | |
Commission advances | | $ | 67 | | | $ | 143 | | | $ | 1,264 | |
To compensate for commissions advanced to financial intermediaries, all 12b-1 service and distribution fees collected on Class B Shares and Class C Shares during the first year following a purchase were retained by the Distributor. During the six months ended April 30, 2013, the Distributor retained such 12b-1 fees as follows:
| | | | | | | | | | | | |
| | | Large Cap
Select | | | Mid Cap
Select | | | Small Cap
Select | |
12b-1 fees retained | | $ | 87 | | | $ | 383 | | | $ | 8,670 | |
The remaining 12b-1 fees charged to the Funds were paid to compensate financial intermediaries for providing services to shareholders relating to their investments.
The Distributor also collected and retained CDSC on share redemptions during the six months ended April 30, 2013, as follows:
| | | | | | | | | | | | |
| | | Large Cap
Select | | | Mid Cap
Select | | | Small Cap
Select | |
CDSC retained | | $ | 3 | | | $ | 194 | | | $ | 519 | |
8. New Accounting Pronouncement
Financial Accounting Standards Board (“FASB”) Balance Sheet (Topic 210): Disclosures about Offsetting Assets and Liabilities
In January 2013, Accounting Standards Update (“ASU”) 2013-01, Clarifying the Scope of Disclosures about Offsetting Assets and Liabilities, replaced ASU 2011-11, Disclosures about Offsetting Assets and Liabilities. ASU 2013-01 is effective for fiscal years beginning on or after January 1, 2013. ASU 2011-11 was intended to enhance disclosure requirements on the offsetting of financial assets and liabilities. ASU 2013-01 limits the scope of the new balance sheet offsetting disclosures to derivatives, repurchase agreements and securities lending transactions to the extent that they are (1) offset in the financial statements or (2) subject to an enforceable master netting arrangement or similar agreement. Management is currently evaluating the application of ASU 2013-01 and its impact to the financial statements and footnote disclosures, if any.
Glossary of Terms Used in this Report
Average Annual Total Return: This is a commonly used method to express an investment’s performance over a particular, usually multi-year time period. It expresses the return that would have been necessary each year to equal the investment’s actual cumulative performance (including change in NAV or offer price and reinvested distributions and capital gains, if any) over the time period being considered.
Beta: A measure of the variability of the change in the share price for a fund in relation to a change in the value of the fund’s market benchmark. Securities with betas higher than 1.0 have been, and are expected to be, more volatile than the benchmark; securities with betas lower than 1.0 have been, and are expected to be, less volatile than the benchmark.
Gross Domestic Product (GDP): The total market value of all final goods and services produced in a country/region in a given year, equal to total consumer, investment and government spending, plus the value of exports, minus the value of imports.
Lipper Large-Cap Core Funds Classification Average: Represents the average annualized total return for all reporting funds in the Lipper Large-Cap Core Funds Classification. Lipper returns account for the effects of management fees and assume reinvestment of distributions but do not reflect any applicable sales charges.
Lipper Mid-Cap Core Funds Classification Average: Represents the average annualized total return for all reporting funds in the Lipper Mid-Cap Core Funds Classification. Lipper returns account for the effects of management fees and assume reinvestment of distributions but do not reflect any applicable sales charges.
Lipper Small-Cap Core Funds Classification Average: Represents the average annualized total return for all reporting funds in the Lipper Small-Cap Core Funds Classification. Lipper returns account for the effects of management fees and assume reinvestment of distributions but do not reflect any applicable sales charges.
Market Capitalization: The market capitalization of a company is equal to the number of the company’s common shares outstanding multiplied by the current price of the company’s stock.
Net Asset Value (NAV): The net market value of all securities held in a portfolio.
Net Asset Value (NAV) Per Share: The market value of one share of a mutual fund or closed-end fund. For a Fund, the NAV is calculated daily by taking the Fund’s total assets (securities, cash, and accrued earnings), subtracting the Fund’s liabilities, and dividing by the number of shares outstanding.
Russell 2000® Index: An index that measures the performance of the small-cap segment of the U.S. equity universe. The Russell 2000 is a subset of the Russell 3000® Index representing approximately 10% of the total market capitalization of that index. It includes approximately 2,000 of the smallest securities based on a combination of their market cap and current index membership. The index returns assume reinvestment of distributions, but do not reflect any applicable sales charges or management fees.
Russell Midcap® Index: An index that measures the performance of the mid-cap segment of the U.S. equity universe. The Russell Midcap is a subset of the Russell 1000® Index. It includes approximately 800 of the smallest securities based on a combination of their market cap and current index membership. The Russell Midcap represents approximately 31% of the total market capitalization of the Russell 1000 companies. The index returns assume reinvestment of distributions, but do not reflect any applicable sales charges or management fees.
S&P 500® Index: An unmanaged index generally considered representative of the U.S. stock market. The index returns assume reinvestment of distributions, but do not reflect any applicable sales charges or management fees.
Tax Equalization: The practice of treating a portion of the distribution made to a redeeming shareholder, which represents his proportionate part of undistributed net investment income and capital gain as a distribution for tax purposes. Such amounts are referred to as the equalization debits (or payments) and will be considered a distribution to the shareholder of net investment income and capital gain for calculation of the Fund’s dividends paid deduction.
Additional Fund Information
Fund Manager
Nuveen Fund Advisors, LLC
333 West Wacker Drive
Chicago, IL 60606
Sub-Adviser
Nuveen Asset Management, LLC
333 West Wacker Drive
Chicago, IL 60606
Legal Counsel
Chapman and Cutler LLP
Chicago, IL
Independent Registered Public Accounting Firm
PricewaterhouseCoopers LLP
Chicago, IL
Custodian
U.S. Bank National Association
Milwaukee, WI
Transfer Agent and Shareholder Services
Boston Financial
Data Services, Inc.
Nuveen Investor Services
P.O. Box 8530
Boston, MA 02266-8530
(800) 257-8787
Quarterly Form N-Q Portfolio of Investments Information Each Fund is required to file its complete schedule of portfolio holdings with the Securities and Exchange Commission (SEC) for the first and third quarters of each fiscal year on Form N-Q. You may obtain this information directly from the SEC. Visit the SEC on-line at http://www.sec.gov or in person at the SEC’s Public Reference Room in Washington, D.C. Call the SEC toll-free at (800) SEC-0330 for room hours and operation.
Nuveen Funds’ Proxy Voting Information You may obtain (i) information regarding how each Fund voted proxies relating to portfolio securities held during the most recent twelve-month period ended June 30, without charge, upon request, by calling Nuveen Investments toll free at (800) 257-8787 or on Nuveen’s website at www.nuveen.com and (ii) a description of the policies and procedures that each Fund used to determine how to vote proxies relating to portfolio securities without charge, upon request, by calling Nuveen Investments toll-free at (800) 257-8787. You may also obtain this information directly from the SEC. Visit the SEC on-line at http://www.sec.gov.
The Financial Industry Regulatory Authority (FINRA) provides a Public Disclosure Program which supplies certain information regarding the disciplinary history of FINRA members and their associated persons in response to either telephone inquiries at (800) 289-9999 or written inquiries at www.finra.org. FINRA also provides an investor brochure that includes information describing the Public Disclosure Program.
Nuveen Investments:
Serving Investors for Generations
Since 1898, financial advisors and their clients have relied on Nuveen Investments to provide dependable investment solutions through continued adherence to proven, long-term investing principles. Today, we offer a range of high quality equity and fixed-income solutions designed to be integral components of a well-diversified core portfolio.
Focused on meeting investor needs.
Nuveen Investments provides high-quality investment services designed to help secure the longterm goals of institutional and individual investors as well as the consultants and financial advisors who serve them. Nuveen Investments markets a wide range of specialized investment solutions which provide investors access to capabilities of its high-quality boutique investment affiliates–Nuveen Asset Management, Symphony Asset Management, NWQ Investment Management Company, Santa Barbara Asset Management, Tradewinds Global Investors, Winslow Capital Management, and Gresham Investment Management. In total, Nuveen Investments managed $224 billion as of March 31, 2013.
Find out how we can help you.
To learn more about how the products and services of Nuveen Investments may be able to help you meet your financial goals, talk to your financial advisor, or call us at (800) 257-8787. Please read the information provided carefully before you invest. Investors should consider the investment objective and policies, risk considerations, charges and expenses of any investment carefully. Where applicable, be sure to obtain a prospectus, which contains this and other relevant information. To obtain a prospectus, please contact your securities representative or Nuveen Investments, 333 W. Wacker Dr., Chicago, IL 60606. Please read the prospectus carefully before you invest or send money.
Learn more about Nuveen Funds at: www.nuveen.com/mf
| | |
Distributed by Nuveen Securities, LLC 333 West Wacker Drive Chicago, IL 60606 www.nuveen.com | | |
MSA-FSLCT-0413P
PART C
OTHER INFORMATION
Item 15. Indemnification
Section 4 of Article XII of Registrant’s Declaration of Trust provides as follows:
Subject to the exceptions and limitations contained in this Section 4, every person who is, or has been, a Trustee, officer, employee or agent of the Trust, including persons who serve at the request of the Trust as directors, trustees, officers, employees or agents of another organization in which the Trust has an interest as a shareholder, creditor or otherwise (hereinafter referred to as a “Covered Person”), shall be indemnified by the Trust to the fullest extent permitted by law against liability and against all expenses reasonably incurred or paid by him in connection with any claim, action, suit or proceeding in which he becomes involved as a party or otherwise by virtue of his being or having been such a Trustee, director, officer, employee or agent and against amounts paid or incurred by him in settlement thereof.
No indemnification shall be provided hereunder to a Covered Person:
(a) against any liability to the Trust or its Shareholders by reason of a final adjudication by the court or other body before which the proceeding was brought that he engaged in willful misfeasance, bad faith, gross negligence or reckless disregard of the duties involved in the conduct of his office;
(b) with respect to any matter as to which he shall have been finally adjudicated not to have acted in good faith in the reasonable belief that his action was in the best interests of the Trust; or
(c) in the event of a settlement or other disposition not involving a final adjudication (as provided in paragraph (a) or (b)) and resulting in a payment by a Covered Person, unless there has been either a determination that such Covered Person did not engage in willful misfeasance, bad faith, gross negligence or reckless disregard of the duties involved in the conduct of his office by the court or other body approving the settlement or other disposition or a reasonable determination, based on a review of readily available facts (as opposed to a full trial-type inquiry), that he did not engage in such conduct:
(i) by a vote of a majority of the Disinterested Trustees acting on the matter (provided that a majority of the Disinterested Trustees then in office act on the matter); or
(ii) by written opinion of independent legal counsel.
The rights of indemnification herein provided may be insured against by policies maintained by the Trust, shall be severable, shall not affect any other rights to which any Covered Person may now or hereafter be entitled, shall continue as to a person who has ceased to be such a Covered Person and shall inure to the benefit of the heirs, executors and administrators of such a person. Nothing contained herein shall affect any rights to indemnification to which Trust personnel other than Covered Persons may be entitled by contract or otherwise under law.
Expenses of preparation and presentation of a defense to any claim, action, suit or proceeding subject to a claim for indemnification under this Section 4 shall be advanced by the Trust prior to final disposition thereof upon receipt of an undertaking by or on behalf of the recipient to repay such
C-1
amount if it is ultimately determined that he is not entitled to indemnification under this Section 4, provided that either:
(a) such undertaking is secured by a surety bond or some other appropriate security or the Trust shall be insured against losses arising out of any such advances; or
(b) a majority of the Disinterested Trustees acting on the matter (provided that a majority of the Disinterested Trustees then in office act on the matter) or independent legal counsel in a written opinion shall determine, based upon a review of the readily available facts (as opposed to a full trial-type inquiry), that there is reason to believe that the recipient ultimately will be found entitled to indemnification.
As used in this Section 4, a “Disinterested Trustee” is one (x) who is not an Interested Person of the Trust (including, as such Disinterested Trustee, anyone who has been exempted from being an Interested Person by any rule, regulation or order of the Commission), and (y) against whom none of such actions, suits or other proceedings or another action, suit or other proceeding on the same or similar grounds is then or has been pending.
As used in this Section 4, the words “claim,” “action,” “suit” or “proceeding” shall apply to all claims, actions, suits, proceedings (civil, criminal, administrative or other, including appeals), actual or threatened; and the word “liability” and “expenses” shall include without limitation, attorneys’ fees, costs, judgments, amounts paid in settlement, fines, penalties and other liabilities.
The trustees and officers of the Registrant are covered by the Mutual Fund Professional Liability policy in the aggregate amount of $70,000,000 against liability and expenses of claims of wrongful acts arising out of their position with the Registrant and other Nuveen funds, except for matters that involve willful acts, bad faith, gross negligence and willful disregard of duty (i.e., where the insured did not act in good faith for a purpose he or she reasonably believed to be in the best interest of the Registrant or where he or she had reasonable cause to believe this conduct was unlawful). The policy has a $2,000,000 deductible for operational failures (after the deductible is satisfied, the insurer would cover 90% of any operational failure claims and the Fund would be liable for 10% of any such claims) and $1,000,000 deductible for all other claims.
Insofar as indemnification for liabilities arising under the Securities Act of 1933, as amended, (the “1933 Act”) may be permitted to the officers, trustees or controlling persons of the Registrant pursuant to the Declaration of Trust of the Registrant or otherwise, the Registrant has been advised that in the opinion of the Securities and Exchange Commission such indemnification is against public policy as expressed in the 1933 Act and is, therefore, unenforceable. In the event that a claim for indemnification against such liabilities (other than the payment by the Registrant of expenses incurred or paid by an officer or trustee or controlling person of the Registrant in the successful defense of any action, suit or proceeding) is asserted by such officer, trustee or controlling person in connection with the securities being registered, the Registrant will, unless in the opinion of its counsel the matter has been settled by controlling precedent, submit to a court of appropriate jurisdiction the question of whether such indemnification by it is against public policy as expressed in the 1933 Act and will be governed by the final adjudication of such issue.
C-2
Item 16. Exhibits
| | |
| |
| (1)(a) | | Declaration of Trust of Registrant dated June 27, 1997. (1) |
| |
| (1)(b) | | Amended Establishment and Designation of Classes, dated November 14, 2012. (9) |
| |
| (1)(c) | | Amended and Restated Designation of Series, dated February 28, 2013. (12) |
| |
| (2) | | By-Laws of Registrant, amended and restated as of November 18, 2009. (7) |
| |
| (3) | | Specimen Certificate of Shares of the Registrant. (2) |
| |
| (4) | | Form of Agreement and Plan of Reorganization is filed herewith as Appendix I to Part A of this Registration Statement. |
| |
| (5) | | Not applicable. |
| |
| (6)(a) | | Investment Management Agreement between Registrant and Nuveen Asset Management (n/k/a Nuveen Fund Advisors, LLC), dated November 13, 2007. (6) |
| |
| (6)(b) | | Renewal of Investment Management Agreement between Registrant and Nuveen Fund Advisors, Inc. (n/k/a Nuveen Fund Advisors, LLC and f/k/a Nuveen Asset Management), dated May 23, 2012. (9) |
| |
| (6)(c) | | Amended Schedules A and B of Investment Management Agreement between Registrant and Nuveen Fund Advisors, Inc. (n/k/a Nuveen Fund Advisors, LLC and f/k/a Nuveen Asset Management), dated June 11, 2012. (8) |
| |
| (6)(d) | | Investment Sub-Advisory Agreement between Nuveen Asset Management (n/k/a Nuveen Fund Advisors, LLC) and Symphony Asset Management LLC, dated November 13, 2007. (6) |
| |
| (6)(e) | | Notice of Continuance of Investment Sub-Advisory Agreement between Nuveen Fund Advisors, Inc. (n/k/a Nuveen Fund Advisors, LLC and f/k/a Nuveen Asset Management) and Symphony Asset Management LLC, dated July 30, 2012. (11) |
| |
| (7)(a) | | Distribution Agreement between Registrant and John Nuveen & Co. Incorporated, dated August 1, 1998. (3) |
| |
| (7)(b) | | Renewal of Distribution Agreement between Registrant and Nuveen Securities, LLC (f/k/a Nuveen Investments, LLC), dated August 6, 2012. (9) |
| |
| (7)(c) | | Form of Dealer Distribution, Shareholder Servicing and Fee-Based Program Agreement. (5) |
| |
| (7)(d) | | Form of Nuveen Funds Rule 22c-2 Agreement. (5) |
| |
| (8) | | Not applicable. |
| |
| (9)(a) | | Amended and Restated Master Custodian Agreement between the Nuveen Funds and State Street Bank and Trust Company, dated February 25, 2005. (4) |
| |
| (9)(b) | | Appendix A to the Custodian Agreement, dated December 10, 2012. (10) |
| |
| (10)(a) | | Plan of Distribution and Service Pursuant to Rule 12b-1, dated February 28, 2013. (12) |
| |
| (10)(b) | | Multiple Class Plan Adopted Pursuant to Rule 18f-3, as amended November 14, 2012. (12) |
| |
| (11) | | Opinion and Consent of Vedder Price P.C. (13) |
| |
| (12) | | Form of Opinion and Consent of Vedder Price P.C. supporting the tax matters and consequences to shareholders discussed in the Proxy Statement/Prospectus. (13) |
C-3
| | |
| |
| (13)(a) | | Transfer Agency and Service Agreement between the Nuveen Mutual Funds and Boston Financial Data Services, Inc., dated May 11, 2012. (8) |
| |
| (13)(b) | | Amendment and Schedule A to Transfer Agency and Service Agreement, dated January 30, 2013. (12) |
| |
| (14) | | Consent of Independent Auditor. (13) |
| |
| (15) | | Not applicable. |
| |
| (16) | | Powers of Attorney. (13) |
| |
| (17) | | Form of Proxy is filed herein and appears following the Proxy Statement/Prospectus included in this registration statement. |
| | (1) | Incorporated by reference to the initial registration statement filed on Form N-1A for Registrant. |
| | (2) | Incorporated by reference to the pre-effective amendment no. 1 filed on Form N-1A for Registrant. |
| | (3) | Incorporated by reference to the post-effective amendment no. 2 filed on Form N-1A for Registrant. |
| | (4) | Incorporated by reference to the post-effective amendment no. 18 filed on Form N-1A for Registrant. |
| | (5) | Incorporated by reference to the post-effective amendment no. 23 filed on Form N-1A for Registrant. |
| | (6) | Incorporated by reference to the post-effective amendment no. 37 filed on Form N-1A for Registrant. |
| | (7) | Incorporated by reference to the post-effective amendment no. 69 filed on Form N-1A for Registrant. |
| | (8) | Incorporated by reference to the post-effective amendment no. 84 filed on Form N-1A for Registrant. |
| | (9) | Incorporated by reference to the post-effective amendment no. 86 filed on Form N-1A for Registrant. |
| | (10) | Incorporated by reference to the post-effective amendment no. 88 filed on Form N-1A for Registrant. |
| | (11) | Incorporated by reference to the post-effective amendment no. 89 filed on Form N-1A for Registrant. |
| | (12) | Incorporated by reference to the post-effective amendment no. 92 filed on Form N-1A for Registrant. |
C-4
Item 17. Undertakings
(1) The undersigned Registrant agrees that prior to any public reoffering of the securities registered through the use of a prospectus which is a part of this registration statement by any person or party who is deemed to be an underwriter within the meaning of Rule 145(c) of the 1933 Act, the reoffering prospectus will contain the information called for by the applicable registration form for reofferings by persons who may be deemed underwriters, in addition to the information called for by the other items of the applicable form.
(2) The undersigned Registrant agrees that every prospectus that is filed under paragraph (1) above will be filed as a part of an amendment to the registration statement and will not be used until the amendment is effective, and that, in determining any liability under the 1933 Act, each post-effective amendment shall be deemed to be a new registration statement for the securities offered therein, and the offering of the securities at that time shall be deemed to be the initial bona fide offering of them.
C-5
SIGNATURES
As required by the Securities Act of 1933, this registration statement has been signed on behalf of the registrant, in the City of Chicago, the State of Illinois, on the 2nd day of July, 2013.
| | |
| NUVEEN INVESTMENT TRUST II |
| |
| By: | | /s/ Kathleen L. Prudhomme |
| | Kathleen L. Prudhomme |
| | Vice President and Assistant Secretary |
As required by the Securities Act of 1933, this registration statement has been signed by the following persons in the capacities and on the dates indicated:
| | | | | | |
Signature | | Capacity | | | | Date |
| | | |
/s/ Stephen D. Foy Stephen D. Foy | | Vice President and Controller
(principal financial and
accounting officer) | | | | July 2, 2013 |
| | | |
/s/ Gifford R. Zimmerman Gifford R. Zimmerman | | Chief Administrative Officer
(principal executive officer) | | | | July 2, 2013 |
| | Chairman of the Board and Trustee | | ) | | |
| Robert P. Bremner* | | | | ) | | |
| | | | ) | | |
| | Trustee | | ) | | |
| John P. Amboian* | | | ) | |
| | | | ) | | |
| | Trustee | | ) | | |
| Jack B. Evans* | | | ) | |
| | | | ) | | |
| | Trustee | | ) | | |
| William C. Hunter* | | | ) | | By: /s/ Kathleen L. Prudhomme Kathleen L. Prudhomme Attorney-in-Fact July 2, 2013 |
| | | | ) | |
| | Trustee | | ) | |
| David J. Kundert* | | | ) | |
| | | | ) | | |
| | Trustee | | ) | |
| William J. Schneider* | | | ) | |
| | | | ) | |
| | Trustee | | ) | | |
| Judith M. Stockdale* | | | ) | | |
| | | | ) | | |
| | | | ) | | |
Carole E. Stone* | | Trustee | | ) ) | | |
C-6
| | | | | | |
Signature | | Capacity | | | | Date |
| | | |
Virginia L. Stringer* | | Trustee | | ) ) | | |
| | | | ) | | |
Terence J. Toth* | | Trustee | | ) ) | | |
* An original power of attorney authorizing, among others, Kevin J. McCarthy, Kathleen L. Prudhomme and Gifford R. Zimmerman, to execute this registration statement, and amendments thereto, for each of the trustees of the Registrant on whose behalf this registration statement is filed, has been executed and is filed herewith as exhibit 16.
C-7
EXHIBIT INDEX
| | |
Exhibit No. | | Name of Exhibit |
| |
| 11 | | Opinion and Consent of Counsel |
| |
| 12 | | Form of Opinion and Consent of Tax Counsel Supporting Tax Matters |
| |
| 14 | | Consent of Independent Auditor |
| |
| 16 | | Powers of Attorney |
C-8