UNITED STATES
SECURITIES AND EXCHANGE COMMISSION
Washington, D.C. 20549
FORM N-CSR
CERTIFIED SHAREHOLDER REPORT OF REGISTERED MANAGEMENT
INVESTMENT COMPANIES |
| | Investment Company Act file number 811-08327
Name of Fund: BlackRock Global Growth Fund, Inc.
Fund Address: 100 Bellevue Parkway, Wilmington, DE 19809
Name and address of agent for service: Donald C. Burke, Chief Executive Officer, BlackRock
Global Growth Fund, Inc., 800 Scudders Mill Road, Plainsboro, NJ, 08536. Mailing address:
P.O. Box 9011, Princeton, NJ, 08543-9011
Registrant’s telephone number, including area code: (800) 441-7762
Date of fiscal year end: 08/31/2008
Date of reporting period: 09/01/2007 – 08/31/2008
Item 1 – Report to Stockholders |

EQUITIES FIXED INCOME REAL ESTATE LIQUIDITY ALTERNATIVES BLACKROCK SOLUTIONS
Annual Report
AUGUST 31, 2008 |
BlackRock Fundamental Growth Principal Protected Fund
of BlackRock Principal Protected Trust
BlackRock Global Growth Fund, Inc. |
NOT FDIC INSURED
MAY LOSE VALUE
NO BANK GUARANTEE |
| Table of Contents | | |
| |
|
| |
| | | Page |
| |
|
| |
| A Letter to Shareholders | | 3 |
| Annual Report: | | |
| Fund Summaries | | 4 |
| About Fund Performance | | 8 |
| Disclosure of Expenses | | 8 |
| Portfolio Summaries | | 9 |
| Financial Statements: | | |
| Schedules of Investments | | 10 |
| Statements of Assets and Liabilities | | 16 |
| Statements of Operations | | 18 |
| Statements of Changes in Net Assets | | 19 |
| Financial Highlights | | 20 |
| Notes to Financial Statements | | 25 |
| Report of Independent Registered Public Accounting Firm | | 34 |
| Important Tax Information (Unaudited) | | 35 |
| Disclosure of Advisory Agreement and Subadvisory Agreement | | 36 |
| Officers and Directors/Trustees | | 40 |
| Additional Information | | 44 |
| Mututal Fund Family | | 46 |
A Letter to Shareholders
Dear Shareholder
It has been a tumultuous year for investors, marked by almost daily headlines related to the beleaguered housing market, rising food and energy prices,
and the escalating credit crisis. The news took an extraordinarily heavy tone shortly after the close of this reporting period as the credit crisis boiled over
and triggered unprecedented failures and consolidation in the financial sector, stoking fears of a market and economic collapse and prompting the
largest government rescue plan since the Great Depression.
Through it all, the Federal Reserve Board (the “Fed”) has been aggressive in its attempts to restore order in financial markets. Key moves included
slashing the target federal funds rate 325 basis points (3.25%) between September 2007 and April 2008 and providing numerous cash injections
and lending programs. As the credit crisis took an extreme turn for the worse in September, the Fed, in concert with five other global central banks, cut
interest rates by 50 basis points in a rare move intended to stave off worldwide economic damage from the intensifying financial market turmoil. The
U.S. economy managed to grow at a slow-but-positive pace through the second quarter of the year, though the recent events almost certainly portend
a global economic recession.
Against this backdrop, U.S. stocks experienced intense volatility (steep declines and quick recoveries), generally posting losses for the current reporting
period. Small-cap stocks fared significantly better than their larger counterparts. Non-U.S. markets followed the U.S. on the way down and, notably,
decelerated at a faster pace than domestic equities—a stark reversal of recent years’ trends, when international stocks generally outpaced U.S. stocks.
Treasury securities also traded in a volatile fashion, but rallied overall (yields fell and prices correspondingly rose), as the broader flight-to-quality theme
persisted. The yield on 10-year Treasury issues, which fell to 3.34% in March, climbed to the 4.20% range in mid-June as investors temporarily shifted
out of Treasury issues in favor of riskier assets (such as stocks and other high-quality fixed income sectors), then declined again to 3.83% by period-
end when credit fears resurfaced. Tax-exempt issues posted positive returns, but problems among municipal bond insurers and the collapse in the
market for auction rate securities pressured the group throughout the course of the past year. Economic and financial market distress also dampened
the performance of high yield issues, which were very volatile due to the macro factors noted above. |
| Overall, severe market instability resulted in mixed results for the major benchmark indexes: | | | | |
| Total Returns as of August 31, 2008 | | 6-month | | 12-month |
| |
| |
|
| U.S. equities (S&P 500 Index) | | (2.57)% | | (11.14)% |
| |
| |
|
| Small cap U.S. equities (Russell 2000 Index) | | 8.53 | | (5.48) |
| |
| |
|
| International equities (MSCI Europe, Australasia, Far East Index) | | (10.18) | | (14.41) |
| |
| |
|
| Fixed income (Lehman Brothers U.S. Aggregate Index) | | 0.18 | | 5.86 |
| |
| |
|
| Tax-exempt fixed income (Lehman Brothers Municipal Bond Index) | | 5.12 | | 4.48 |
| |
| |
|
| High yield bonds (Lehman Brothers U.S. Corporate High Yield 2% Issuer Capped Index) | | 0.74 | | (0.66) |
| |
| |
|
| Past performance is no guarantee of future results. Index performance shown for illustrative purposes only. You cannot invest directly in an index. | | |
Through periods of market turbulence, as ever, BlackRock’s full resources are dedicated to the management of our clients’ assets. For our most current
views on the economy and financial markets, we invite you to visit www.blackrock.com/funds. As always, we thank you for entrusting BlackRock with
your investments, and we look forward to continuing to serve you in the months and years ahead.
Sincerely, |

Rob Kapito
President, BlackRock Advisors, LLC |
| THIS PAGE NOT PART OF YOUR FUND REPORT |
Fund Summary BlackRock Fundamental Growth Principal Protected Fund
Portfolio Management Commentary
How did the Fund perform?
•For the 12-month period, Fund results outpaced both of its equity
benchmarks, the S&P 500 Index and the S&P 500 Citigroup
Growth Index, Inc.
What factors influenced performance?
•Favorable stock selection, particularly in the financials and healthcare
sectors, accounted for the majority of the Fund’s outperformance
relative to the S&P 500 Citigroup Growth Index. An overweight in the
materials sector and underweight positions in financials and consumer
discretionary also contributed to performance over the 12 months.
Top-performing stocks in the portfolio included Consol Energy, Inc.,
Monsanto Co., The Mosaic Co., Gilead Sciences, Inc. and Potash Corp.
of Saskatchewan, Inc. Avoidance of American International Group, Inc.
aided results as well.
•In contrast, stock selection in the consumer staples and information
technology sectors, along with an underweight in energy names,
hindered comparative performance. Nvidia Corp., Comcast Corp.,
Hologic, Inc. and EMC Corp. were among the Fund’s weakest-performing
holdings. An underweight early in the period to Amgen, Inc. and Johnson
& Johnson also detracted from results.
Describe recent portfolio activity.
•Over the past 12 months, the Fund’s equity allocation ranged from
a high of approximately 85% of assets to a low of approximately 46%.
Accordingly, the fixed income allocation ranged from approximately 15%
of assets to approximately 54%.
•The Fund’s fixed income component was invested in a U.S.Treasury Strip
with a maturity of November 2009.
•Within the equity portfolio, we decreased the Fund’s weighting in the
financial and industrial sectors. Among our largest sales were General
Electric Co., PepsiCo, Inc., Comcast Corp., Zimmer Holdings, Inc. and
Boeing Co. We increased investments in health care, consumer staples
and, later in the period, consumer discretionary. Our largest purchases
included QUALCOMM, Inc., Johnson & Johnson, Wal-Mart Stores, Inc.,
Apple, Inc. and Costco Wholesale Corp.
Describe Fund positioning at period-end.
•At August 31, 2008, the Fund was invested approximately 46% in equi-
ties and 54% in fixed income securities. The equity portfolio ended the
period with a significant underweight in the energy sector and a moder-
ate underweight in industrials. Overweight positions were held in the
consumer staples, healthcare and information technology sectors.
•Current equity market performance has been significantly influenced by
the ongoing turbulent and uncertain conditions in the credit, financing
and housing markets. While the U.S. may avert a “technical” recession
over the near-term, significant challenges exist to achieving a meaningful
cyclical recovery, suggesting an extended period of sub-trend economic
growth. Although equity prices currently reflect many of these concerns,
we remain cautious in our Fund positioning as equity markets attempt to
stabilize. In such an environment, we continue to favor large company
growth stocks with relatively attractive earnings profiles.
The views expressed reflect the opinions of BlackRock as of the date of this report and are subject to change based on changes in market, economic or other conditions.
These views are not intended to be a forecast of future events and are no guarantee of future results.
Expense Example
| | | | | Actual | | | | | | Hypothetical2 | | |
| | |
| |
| |
| |
| |
| |
|
| | | Beginning | | Ending | | | | Beginning | | Ending | | |
| | | Account Value | | Account Value | | Expenses Paid | | Account Value | | Account Value | | Expenses Paid |
| | | March 1, 2008 | | August 31, 2008 | | During the Period1 | | March 1, 2008 | | August 31, 2008 | | During the Period1 |
| |
| |
| |
| |
| |
| |
|
| Institutional | | $1,000 | | $984.80 | | $ 9.57 | | $1,000 | | $1,015.25 | | $ 9.72 |
| Investor A | | $1,000 | | $983.70 | | $10.80 | | $1,000 | | $1,014.01 | | $10.97 |
| Investor B | | $1,000 | | $979.20 | | $14.52 | | $1,000 | | $1,010.23 | | $14.74 |
| Investor C | | $1,000 | | $980.30 | | $14.52 | | $1,000 | | $1,010.23 | | $14.74 |
| |
| |
| |
| |
| |
| |
|
1 For each class of the Fund, expenses are equal to the annualized expense ratio for the class (1.94% for Institutional, 2.19% for Investor A, 2.95% for Investor B and
2.95% for Investor C), multiplied by the average account value over the period, multiplied by 182/366 (to reflect the one-half year period shown).
2 Hypothetical 5% annual return before expenses is calculated by pro-rating the number of days in the most recent fiscal half year divided by 366.
See “Disclosure of Expenses” on page 8 for further information on how expenses were calculated.
4 ANNUAL REPORT AUGUST 31, 2008
BlackRock Fundamental Growth Principal Protected Fund
Total Return Based on a $10,000 Investment
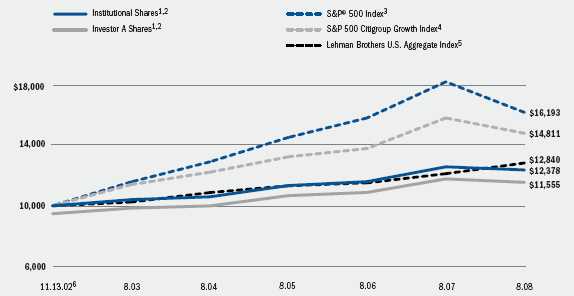
1 Assuming maximum sales charge, if any, transaction costs and other operating expenses, including advisory fees.
2 The Fund consists primarily of common stocks and U.S. Treasury bonds, including zero coupon bonds.
3 This unmanaged Index covers 500 industrial, utility, transportation and financial companies of the U.S. markets (mostly NYSE issues)
representing about 75% of NYSE market capitalization and 30% of NYSE issues. S&P 500 is a registered trademark of the McGraw-Hill
Companies.
4 This unmanaged Index is designed to provide a comprehensive measure of large-cap U.S. equity “growth” performance. It is an unmanaged
float adjusted market capitalization weighted index comprised of stocks representing approximately half the market capitalization of the S&P
500 Index that have been identified as being on the growth end of the growth-value spectrum.
5 This unmanaged market-weighted Index is comprised of investment grade corporate bonds (rated BBB or better), mortgages and U.S. Treasury
and government agency issues with at least one year to maturity.
6 Commencement of operations.
Performance Summary for the Period Ended August 31, 2008
| | | | | | | | | Average Annual Total Returns7 | | | | |
| | | | |
| |
| |
| |
| |
|
| | | | | 1 Year | | | | 5 Years | | | | Since Inception8 |
| | | | |
| |
| |
| |
| |
|
| | | 6-Month | | w/o sales | | w/sales | | w/o sales | | w/sales | | w/o sales | | w/sales |
| | | Total Returns | | charge | | charge | | charge | | charge | | charge | | charge |
| |
| |
| |
| |
| |
| |
| |
|
| Institutional | | (1.52)% | | (1.63)% | | — | | 3.52% | | — | | 3.75% | | — |
| Investor A | | (1.63) | | (1.94) | | (7.09)% | | 3.26 | | 2.15% | | 3.48 | | 2.52% |
| Investor B | | (2.08) | | (2.68) | | (6.77) | | 2.48 | | 2.15 | | 2.69 | | 2.55 |
| Investor C | | (1.97) | | (2.58) | | (3.49) | | 2.49 | | 2.49 | | 2.70 | | 2.70 |
| S&P 500 Index | | (2.57) | | (11.14) | | — | | 6.92 | | — | | 8.67 | | — |
| S&P 500 Citigroup Growth Index | | 0.42 | | (6.40) | | — | | 5.36 | | — | | 7.01 | | — |
| Lehman Brothers U.S. Aggregate Index | | 0.18 | | 5.86 | | — | | 4.61 | | — | | 4.41 | | — |
| |
| |
| |
| |
| |
| |
| |
|
7 Assuming maximum sales charges. See “About Fund Performance” on page 8 for a detailed description of share classes, including any related sales charges and fees.
8 The Fund commenced operations on 11/13/02.
Past performance is not indicative of future results.
If you would like a copy, free of charge, of the most recent annual or quarterly report of Main Place Funding, LLC, the Fund’s Warranty Provider, or its parent corporation,
Bank of America Corporation, please contact the Fund at (800) 441-7762. |
ANNUAL REPORT AUGUST 31, 2008 5
Fund Summary BlackRock Global Growth Fund, Inc.
Portfolio Management Commentary
How did the Fund perform?
•Amid a challenging backdrop for global equities, the Fund outperfor-
med the benchmark MSCI World Index for the 12 months ended
August 31, 2008.
What factors influenced performance?
•Fund performance relative to the benchmark was aided primarily by
favorable stock and country selection. On a sector basis, an under-
weight exposure to the financials sector and overweights in the materials
and industrials sectors benefited performance. Geographically, stock
selection in the U.S. and Canada aided results, as did overweight
positions and stock selection in Australia and Hong Kong. Top relative
performers included Monsanto Co., FTI Consulting, Inc. and Joy Global,
Inc. in the U.S., Petrol Brasileiros SA in Brazil, and Potash Corp. of
Saskatchewan in Canada.
•Conversely, security selection in the utilities and information technology
sectors hindered comparative performance. An overweight exposure to
South Korea and India also detracted modestly from results. The Fund’s
worst-performing holdings on a relative basis included Nvidia Corp.
and Cisco Systems, Inc. in the U.S.; Petroplus Holdings AG in
Switzerland; Hellenic Exchanges Holding in Greece; and BM&F Bovespa
Spa Holdings in Brazil.
Describe recent portfolio activity.
•During the annual period, we increased the Fund’s weighting in the
financials, consumer discretionary, consumer staples, healthcare and
information technology sectors. We reduced Fund exposure to materials,
industrials, energy, telecommunications and utilities. On a geographic
basis, we increased exposure to the U.S., the U.K. and Japan, while
reducing exposure to Australia, Hong Kong, Canada, China and India.
•Our largest purchases over the 12 months included Wal-Mart Stores, Inc.,
QUALCOMM, Inc., Johnson & Johnson and Philip Morris International, Inc.
in the U.S., and Honda Motor Co., Ltd. in Japan. Our most significant
sales or reductions included ABB Ltd. in Switzerland, Hong Kong
Exchanges and Clearing Ltd. in Hong Kong, Teva Pharmaceutical
Industries Ltd. in Israel, and CVS Caremark Corp. and General Electric
Co. in the U.S.
Describe Fund positioning at period-end.
•Current global equity market performance has been significantly
influenced by the ongoing turbulent and uncertain conditions in the
U.S. credit, financing and housing markets. While the U.S. may avert a
“technical” recession over the near-term, questions exist around the
cyclical strength of the overall global economy. While we continue to
have a constructive long-term view, we are concerned with how near-
term cyclical pressures impact the short-term outlook for global equity
markets. In such an environment, we favor larger company growth stocks
with relatively attractive earnings profiles, and prefer the U.S. over other
global markets.
•At August 31, 2008, the Fund held its largest overweight positions in
the information technology, consumer staples, industrials and health-
care sectors, while it was underweight in financials, energy, utilities,
materials and telecommunications. On a geographic basis, the Fund
was slightly overweight in the U.S. (approximately 49% of net assets),
underweight in Europe (approximately 17%) and overweight in Asia
(approximately 21%). Latin America, primarily Brazil, accounted for
approximately 4% of net assets, while total emerging markets exposure
was approximately 11%.
The views expressed reflect the opinions of BlackRock as of the date of this report and are subject to change based on changes in market, economic or other conditions.
These views are not intended to be a forecast of future events and are no guarantee of future results.
Expense Example
| | | | | Actual | | | | | | Hypothetical2 | | |
| | |
| |
| |
| |
| |
| |
|
| | | Beginning | | Ending | | | | Beginning | | Ending | | |
| | | Account Value | | Account Value | | Expenses Paid | | Account Value | | Account Value | | Expenses Paid |
| | | March 1, 2008 | | August 31, 2008 | | During the Period1 | | March 1, 2008 | | August 31, 2008 | | During the Period1 |
| |
| |
| |
| |
| |
| |
|
| Institutional | | $1,000 | | $919.90 | | $ 4.82 | | $1,000 | | $1,019.88 | | $ 5.07 |
| Investor A | | $1,000 | | $918.90 | | $ 6.11 | | $1,000 | | $1,018.53 | | $ 6.42 |
| Investor B | | $1,000 | | $914.90 | | $10.24 | | $1,000 | | $1,014.21 | | $10.77 |
| Investor C | | $1,000 | | $914.90 | | $ 9.86 | | $1,000 | | $1,014.61 | | $10.37 |
| Class R | | $1,000 | | $917.30 | | $ 8.10 | | $1,000 | | $1,016.45 | | $ 8.52 |
| |
| |
| |
| |
| |
| |
|
1 For each class of the Fund, expenses are equal to the expense ratio for the class (1.01% for Institutional, 1.28% for Investor A, 2.15% for Investor B, 2.07% for Investor C
and 1.70% for Class R), multiplied by the average account value over the period, multiplied by 182/366 (to reflect the one-half year period shown).
2 Hypothetical 5% annual return before expenses is calculated by multiplying the number of days in the most recent fiscal half year divided by 366.
See “Disclosure of Expenses” on page 8 for further information on how expenses were calculated.
6 ANNUAL REPORT AUGUST 31, 2008
BlackRock Global Growth Fund, Inc.
Total Return Based on a $10,000 Investment
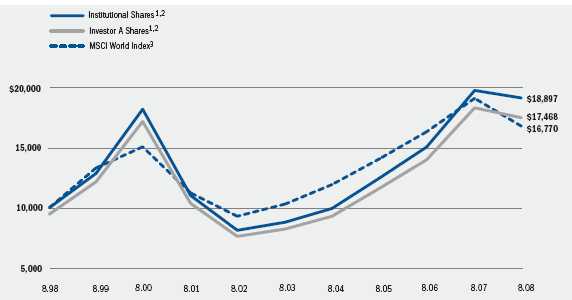
1 Assuming maximum sales charge, if any, transaction costs and other operating expenses, including advisory fees.
2 The Fund invests primarily in equity securities with a particular emphasis on companies located in various foreign countries and the U.S.
that have exhibited above-average growth rates in earnings.
3 This unmanaged market capitalization-weighted index is comprised of a representative sampling of large-, medium- and small-capitalization
companies in 22 countries, including the United States.
Performance Summary for the Period Ended August 31, 2008
| | | | | | | | | Average Annual Total Returns4 | | | | |
| | | | |
| |
| |
| |
| |
|
| | | | | 1 Year | | | | 5 Years | | | | 10 Years |
| | | | |
| |
| |
| |
| |
|
| | | 6-Month | | w/o sales | | w/sales | | w/o sales | | w/sales | | w/o sales | | w/sales |
| | | Total Returns | | charge | | charge | | charge | | charge | | charge | | charge |
| |
| |
| |
| |
| |
| |
| |
|
| Institutional | | (7.96)% | | (4.21)% | | — | | 16.50% | | — | | 6.57% | | — |
| Investor A | | (8.11) | | (4.47) | | (9.49)% | | 16.20 | | 14.96% | | 6.31 | | 5.74% |
| Investor B | | (8.51) | | (5.30) | | (9.56) | | 15.26 | | 15.04 | | 5.64 | | 5.64 |
| Investor C | | (8.51) | | (5.24) | | (6.19) | | 15.28 | | 15.28 | | 5.47 | | 5.47 |
| Class R | | (8.27) | | (4.81) | | — | | 15.99 | | — | | 6.13 | | — |
| MSCI World Index | | (6.32) | | (12.07) | | — | | 10.21 | | — | | 5.31 | | — |
| |
| |
| |
| |
| |
| |
| |
|
4 Assuming maximum sales charges. See “About Fund Performance” on page 8 for a detailed description of share classes, including any related sales charges and fees.
Past performance is not indicative of future results.
ANNUAL REPORT AUGUST 31, 2008 7
About Fund Performance
•Institutional Sharesare not subject to any sales charge. Institutional
Shares bear no ongoing distribution or service fees and are available only
to eligible investors.
•Investor A Sharesincur a maximum initial sales charge (front-end load)
of 5.25% and a service fee of 0.25% per year (but no distribution fee).
•Investor B Sharesare subject to a maximum contingent deferred sales
charge of 4.50% declining to 0% after six years. In addition, Investor B
Shares are subject to a distribution fee of 0.75% per year and a service
fee of 0.25% per year. These shares automatically convert to Investor A
Shares after approximately eight years. (There is no initial sales charge
for automatic share conversions.) All returns for periods greater than
eight years reflect this conversion.
•Investor C Shares are subject to a distribution fee of 0.75% per year and
a service fee of 0.25% per year. In addition, Investor C Shares are subject
to a 1% contingent deferred sales charge if redeemed within one year of
purchase.
•Class R Shares do not incur a maximum initial sales charge (front-end
load) or deferred sales charge. These shares are subject to a distribution
fee of 0.25% per year and a service fee of 0.25% per year. Class R
Shares are available only to certain retirement plans. Prior to inception,
Class R Share performance results are those of Institutional Shares (which
have no distribution or service fees) restated to reflect the Class R Share
fees. Class R Shares are available to BlackRock Global Growth Fund, Inc.
Shareholders only.
Performance information reflects past performance and does not guar-
antee future results. Current performance may be lower or higher than the
performance data quoted. Refer to www.blackrock.com/funds to obtain
performance data current to the most recent month-end. Performance
results do not reflect the deduction of taxes that a shareholder would
pay on fund distributions or the redemption of fund shares. Figures
shown in the performance tables on pages 5 and 7 assume reinvestment
of all dividends and capital gain distributions, if any, at net asset value
on the ex-dividend date. Investment return and principal value of shares
will fluctuate so that shares, when redeemed, may be worth more or
less than their original cost. Dividends paid to each class of shares will
vary because of the different levels of service, distribution and transfer
agency fees applicable to each class, which are deducted from the
income available to be paid to shareholders.
Disclosure of Expenses
Shareholders of these Funds may incur the following charges: (a)
expenses related to transactions, including sales charges, redemption
fees and exchange fees; and (b) operating expenses including advisory
fees, distribution fees including 12b-1 fees, and other Fund expenses.
The expense examples on pages 4 and 6 (which are based on a hypothet-
ical investment of $1,000 invested on March 1, 2008 and held through
August 31, 2008) are intended to assist shareholders both in calculating
expenses based on an investment in each Fund and in comparing
these expenses with similar costs of investing in other mutual funds.
The tables provide information about actual account values and actual
expenses. In order to estimate the expenses a shareholder paid during the
period covered by this report, shareholders can divide their account value
by $1,000 and then multiply the result by the number corresponding
to their share class under the heading entitled “Expenses Paid During
the Period.”
The tables also provide information about hypothetical account values
and hypothetical expenses based on the Funds’ actual expense ratio
and an assumed rate of return of 5% per year before expenses. In order
to assist shareholders in comparing the ongoing expenses of investing
in these Funds and other funds, compare the 5% hypothetical example
with the 5% hypothetical examples that appear in other funds’
shareholder reports.
The expenses shown in the tables are intended to highlight shareholders’
ongoing costs only and do not reflect any transactional expenses, such
as sales charges, redemption fees or exchange fees. Therefore, the hypo-
thetical tables are useful in comparing ongoing expenses only, and will
not help shareholders determine the relative total expenses of owning
different funds. If these transactional expenses were included, shareholder
expenses would have been higher.
Portfolio Information
BlackRock Fundamental Growth Principal Protected Fund, Inc.
Fund Profile as of August 31, 2008
| Ten Largest Holdings | | Percent of |
| (Equity Investments) | | Net Assets |
| |
|
| Apple, Inc. | | 2% |
| Google, Inc. Class A | | 2 |
| QUALCOMM, Inc. | | 2 |
| Johnson & Johnson | | 2 |
| Wal-Mart Stores, Inc. | | 2 |
| The Procter & Gamble Co. | | 2 |
| Cisco Systems, Inc. | | 1 |
| Gilead Sciences, Inc. | | 1 |
| Monsanto Co. | | 1 |
| Microsoft Corp. | | 1 |
| | | Percent of |
| | | Long-Term |
| Asset Mix | | Investments |
| |
|
| |
| Common Stocks | | 46% |
| U.S. Government Obligations | | 54 |
| Five Largest Industries | | Percent of |
| (Equity Investments) | | Net Assets |
| |
|
| Food & Staples Retailing | | 4% |
| Communications Equipment | | 3 |
| Software | | 3 |
| Capital Markets | | 3 |
| Energy Equipment & Services | | 3 |
For Fund compliance purposes, the Fund’s industry classifications refer to any
one or more of the industry sub-classifications used by one or more widely
recognized market indexes, and/or as defined by Fund management. This
definition may not apply for purposes of this report, which may combine
industry sub-classifications for reporting ease.
BlackRock Global Growth Fund, Inc.
Fund Profile as of August 31, 2008
| | | Percent of |
| Ten Largest Holdings | | Net Assets |
| |
|
| Google Inc. Class A | | 2% |
| Wal-Mart Stores, Inc. | | 2 |
| QUALCOMM, Inc. | | 2 |
| Monsanto Co. | | 2 |
| Nestle SA Registered Shares | | 1 |
| Johnson & Johnson | | 1 |
| Cisco Systems, Inc. | | 1 |
| The Procter & Gamble Co. | | 1 |
| Philip Morris International, Inc. | | 1 |
| Honda Motor Co., Ltd. | | 1 |
| | | Percent of |
| Five Largest Industries | | Net Assets |
| |
|
| Commercial Banks | | 8% |
| Food & Staples Retailing | | 5 |
| Software | | 4 |
| Communications Equipment | | 4 |
| Biotechnology | | 4 |
For Fund compliance purposes, the Fund’s industry classifications refer to any one
or more of the industry sub-classifications used by one or more widely recognized
market indexes or ratings group indexes, and/or as defined by Fund management.
This definition may not apply for purposes of this report which may combine indus-
try sub-classifications for reporting ease.
| | | Percent of |
| | | Long-Term |
| Geographic Allocation | | Investments |
| |
|
| United States | | 52% |
| Japan | | 7 |
| United Kingdom | | 7 |
| Hong Kong | | 6 |
| Australia | | 4 |
| Brazil | | 4 |
| Switzerland | | 4 |
| Canada | | 3 |
| India | | 3 |
| France | | 3 |
| Germany | | 2 |
| Spain | | 1 |
| Singapore | | 1 |
| South Korea | | 1 |
| Mexico | | 1 |
| China | | 1 |
ANNUAL REPORT AUGUST 31, 2008 9
Schedule of Investments August 31, 2008
BlackRock Fundamental Growth Principal Protected Fund
(Percentages shown are based on Net Assets)
| Common Stocks | | Shares | | Value |
| |
| |
|
| |
| Aerospace & Defense — 1.1% | | | | |
| Lockheed Martin Corp. | | 3,300 | | $ 384,252 |
| Spirit Aerosystems Holdings, Inc. Class A (a) | | 14,000 | | 319,200 |
| | | | |
|
| | | | | 703,452 |
| |
| |
|
| Beverages — 1.0% | | | | |
| The Coca-Cola Co. | | 6,300 | | 328,041 |
| Diageo Plc | | 16,900 | | 312,126 |
| | | | |
|
| | | | | 640,167 |
| |
| |
|
| Biotechnology — 2.7% | | | | |
| Amgen, Inc. (a) | | 3,800 | | 238,830 |
| Celgene Corp. (a) | | 9,300 | | 644,490 |
| Gilead Sciences, Inc. (a) | | 14,800 | | 779,664 |
| | | | |
|
| | | | | 1,662,984 |
| |
| |
|
| Capital Markets — 2.8% | | | | |
| The Charles Schwab Corp. | | 18,900 | | 453,411 |
| Janus Capital Group, Inc. | | 15,000 | | 404,550 |
| Northern Trust Corp. | | 4,600 | | 369,794 |
| State Street Corp. | | 7,900 | | 534,593 |
| | | | |
|
| | | | | 1,762,348 |
| |
| |
|
| Chemicals — 2.6% | | | | |
| Air Products & Chemicals, Inc. | | 3,200 | | 293,920 |
| Monsanto Co. | | 6,400 | | 731,200 |
| The Mosaic Co. | | 1,100 | | 117,414 |
| Potash Corp. of Saskatchewan, Inc. | | 400 | | 69,440 |
| Praxair, Inc. | | 4,600 | | 413,264 |
| | | | |
|
| | | | | 1,625,238 |
| |
| |
|
| Communications Equipment — 3.4% | | | | |
| Cisco Systems, Inc. (a) | | 38,300 | | 921,115 |
| QUALCOMM, Inc. | | 23,200 | | 1,221,480 |
| | | | |
|
| | | | | 2,142,595 |
| |
| |
|
| Computers & Peripherals — 2.6% | | | | |
| Apple, Inc. (a) | | 7,900 | | 1,339,287 |
| EMC Corp. (a) | | 17,200 | | 262,816 |
| | | | |
|
| | | | | 1,602,103 |
| |
| |
|
| Construction & Engineering — 0.9% | | | | |
| Fluor Corp. | | 2,400 | | 192,312 |
| Jacobs Engineering Group, Inc. (a) | | 2,900 | | 214,078 |
| Quanta Services, Inc. (a) | | 5,000 | | 159,700 |
| | | | |
|
| | | | | 566,090 |
| |
| |
|
| Electrical Equipment — 0.7% | | | | |
| Emerson Electric Co. | | 5,100 | | 238,680 |
| General Cable Corp. (a) | | 3,700 | | 182,114 |
| | | | |
|
| | | | | 420,794 |
| |
| |
|
| Energy Equipment & Services — 2.8% | | | | |
| National Oilwell Varco, Inc. (a) | | 5,718 | | 421,588 |
| Schlumberger Ltd. | | 6,300 | | 593,586 |
| Transocean, Inc. | | 3,956 | | 503,203 |
| Weatherford International Ltd. (a) | | 6,100 | | 235,338 |
| | | | |
|
| | | | | 1,753,715 |
| |
| |
|
| Common Stocks | | Shares | | Value |
| |
| |
|
| |
| Food & Staples Retailing — 3.5% | | | | |
| CVS Caremark Corp. | | 12,800 | | $ 468,480 |
| Costco Wholesale Corp. | | 9,300 | | 623,658 |
| The Kroger Co. | | 5,300 | | 146,386 |
| Wal-Mart Stores, Inc. | | 16,500 | | 974,655 |
| | | | |
|
| | | | | 2,213,179 |
| |
| |
|
| Health Care Equipment & Supplies — 1.6% | | | | |
| Alcon, Inc. | | 1,900 | | 323,551 |
| Hologic, Inc. (a) | | 13,192 | | 279,934 |
| Intuitive Surgical, Inc. (a) | | 1,300 | | 383,851 |
| | | | |
|
| | | | | 987,336 |
| |
| |
|
| Health Care Providers & Services — 0.5% | | | | |
| Express Scripts, Inc. (a) | | 4,200 | | 308,322 |
| |
| |
|
| Hotels, Restaurants & Leisure — 0.8% | | | | |
| McDonald’s Corp. | | 8,500 | | 527,425 |
| |
| |
|
| Household Products — 1.5% | | | | |
| The Procter & Gamble Co. | | 13,500 | | 941,895 |
| |
| |
|
| IT Services — 1.1% | | | | |
| Infosys Technologies Ltd. (b) | | 7,300 | | 301,344 |
| MasterCard, Inc. Class A | | 1,600 | | 388,080 |
| | | | |
|
| | | | | 689,424 |
| |
| |
|
| Internet & Catalog Retail — 0.7% | | | | |
| Amazon.com, Inc. (a) | | 5,200 | | 420,212 |
| |
| |
|
| Internet Software & Services — 2.3% | | | | |
| Akamai Technologies, Inc. (a) | | 7,900 | | 180,910 |
| Google, Inc. Class A (a) | | 2,700 | | 1,250,883 |
| | | | |
|
| | | | | 1,431,793 |
| |
| |
|
| Life Sciences Tools & Services — 1.5% | | | | |
| Covance, Inc. (a) | | 4,000 | | 377,360 |
| Thermo Fisher Scientific, Inc. (a) | | 8,700 | | 526,872 |
| | | | |
|
| | | | | 904,232 |
| |
| |
|
| Machinery — 0.7% | | | | |
| Deere & Co. | | 3,100 | | 218,767 |
| Flowserve Corp. | | 1,100 | | 145,332 |
| SPX Corp. | | 700 | | 83,475 |
| | | | |
|
| | | | | 447,574 |
| |
| |
|
| Metals & Mining — 0.2% | | | | |
| Freeport-McMoRan Copper & Gold, Inc. Class B | | 1,500 | | 133,980 |
| |
| |
|
| Oil, Gas & Consumable Fuels — 0.7% | | | | |
| Chesapeake Energy Corp. | | 2,900 | | 140,360 |
| Petroleo Brasileiro SA (b) | | 6,100 | | 321,714 |
| | | | |
|
| | | | | 462,074 |
| |
| |
|
| Pharmaceuticals — 2.7% | | | | |
| Abbott Laboratories | | 10,600 | | 608,758 |
| Johnson & Johnson | | 15,000 | | 1,056,450 |
| | | | |
|
| | | | | 1,665,208 |
| |
| |
|
| Semiconductors & Semiconductor | | | | |
| Equipment — 1.0% | | | | |
| Intel Corp. | | 28,500 | | 651,795 |
| |
| |
|
| See Notes to Financial Statements. |
Schedule of Investments (concluded)
BlackRock Fundamental Growth Principal Protected Fund
(Percentages shown are based on Net Assets)
| Common Stocks | | Shares | | Value |
| |
| |
|
| Software — 3.2% | | | | |
| Adobe Systems, Inc. (a) | | 14,300 | | $ 612,469 |
| Microsoft Corp. | | 24,400 | | 665,876 |
| Oracle Corp. (a) | | 19,100 | | 418,863 |
| Salesforce.com, Inc. (a) | | 5,600 | | 313,712 |
| | | | |
|
| | | | | 2,010,920 |
| |
| |
|
| Specialty Retail — 1.6% | | | | |
| GameStop Corp. Class A (a) | | 8,900 | | 390,443 |
| Lowe’s Cos., Inc. | | 14,500 | | 357,280 |
| TJX Cos., Inc. | | 6,400 | | 231,936 |
| | | | |
|
| | | | | 979,659 |
| |
| |
|
| Textiles, Apparel & Luxury Goods — 0.6% | | | | |
| Coach, Inc. (a) | | 11,800 | | 342,082 |
| |
| |
|
| Tobacco — 0.8% | | | | |
| Philip Morris International, Inc. | | 9,800 | | 526,260 |
| |
| |
|
| Wireless Telecommunication Services — 0.3% | | | | |
| SBA Communications Corp. Class A (a) | | 5,100 | | 178,143 |
| |
| |
|
| Total Common Stocks — 45.9% | | | | 28,700,999 |
| |
| |
|
| |
| |
| | | Par | | |
| U.S. Government Obligations | | (000) | | |
| |
| |
|
| U.S. Treasury Strips, 3.34%, 11/15/09 (c)(d) | | $34,575 | | 33,748,934 |
| |
| |
|
| Total U.S. Government Obligations — 53.9% | | | | 33,748,934 |
| |
| |
|
| Total Investments (Cost — $56,564,566*) — 99.8% | | | | 62,449,933 |
| Other Assets Less Liabilities — 0.2% | | | | 137,019 |
| | | | |
|
| Net Assets — 100.0% | | | | $ 62,586,952 |
| | |
| |
|
* The cost and unrealized appreciation (depreciation) of investments as of
August 31, 2008, as computed for federal income tax purposes, were
as follows:
| Aggregate cost | | $ 57,258,091 |
| | |
|
| Gross unrealized appreciation | | $ 6,020,944 |
| Gross unrealized depreciation | | (829,102) |
| | |
|
| Net unrealized appreciation | | $ 5,191,842 |
| | |
|
(a) Non-income producing security.
(b) Depositary receipts.
(c) Separately Traded Registered Interest and Principal of Securities (STRIPS).
(d) Represents a zero-coupon bond. Rate shown is the effective yield at the time
of purchase.
•Investments in companies considered to be an affiliate of the Fund,for purposes
of Section 2(a)(3) of the Investment Company Act of 1940, were as follows: |
| | | Net | | |
| Affiliate | | Activity | | Income |
| |
| |
|
| |
| BlackRock Liquidity Series, LLC | | | | |
| Cash Sweep Series | | $(1,219,518) | | $ 26,354 |
| |
| |
|
• For Fund compliance purposes,the Fund’s industry classifications refer to any
one or more of the industry sub-classifications used by one or more widely
recognized market indexes or ratings group indexes, and/or as defined by
Fund management. This definition may not apply for purposes of this report,
which may combine industry sub-classifications for reporting ease. These
industry classifications are unaudited.
| See Notes to Financial Statements. |
Schedule of Investments August 31, 2008
BlackRock Global Growth Fund, Inc.
(Percentages shown are based on Net Assets)
| Common Stocks | | Shares | | Value |
| |
| |
|
| |
| Australia — 4.3% | | | | |
| Chemicals — 0.5% | | | | |
| Incitec Pivot Ltd. | | 24,600 | | $ 3,346,663 |
| |
| |
|
| Commercial Banks — 0.7% | | | | |
| Westpac Banking Corp. | | 243,600 | | 4,868,285 |
| |
| |
|
| Construction & Engineering — 0.7% | | | | |
| Leighton Holdings Ltd. | | 118,100 | | 4,660,443 |
| |
| |
|
| Energy Equipment & Services — 0.5% | | | | |
| WorleyParsons Ltd. | | 105,422 | | 3,318,575 |
| |
| |
|
| Health Care Equipment & Supplies — 0.6% | | | | |
| Cochlear Ltd. | | 77,800 | | 3,650,187 |
| |
| |
|
| Insurance — 0.6% | | | | |
| QBE Insurance Group Ltd. | | 203,900 | | 4,146,930 |
| |
| |
|
| Metals & Mining — 0.4% | | | | |
| BHP Billiton Ltd. | | 75,000 | | 2,634,136 |
| |
| |
|
| Transportation Infrastructure — 0.3% | | | | |
| Transurban Group | | 442,400 | | 2,046,063 |
| |
| |
|
| Total Common Stocks in Australia | | | | 28,671,282 |
| |
| |
|
| Bermuda — 0.5% | | | | |
| Energy Equipment & Services — 0.5% | | | | |
| SeaDrill Ltd. | | 122,500 | | 3,343,083 |
| |
| |
|
| Total Common Stocks in Bermuda | | | | 3,343,083 |
| |
| |
|
| Brazil — 4.0% | | | | |
| Beverages — 0.5% | | | | |
| Cia de Bebidas das Americas (Preference Shares) (a) | | 55,000 | | 3,403,950 |
| |
| |
|
| Commercial Banks — 1.3% | | | | |
| Banco Bradesco SA (a)(b) | | 469,900 | | 8,650,859 |
| |
| |
|
| Diversified Financial Services — 0.4% | | | | |
| BM&F Bovespa SA | | 362,768 | | 2,777,515 |
| |
| |
|
| Metals & Mining — 0.5% | | | | |
| Companhia Vale do Rio Doce (Common Shares) (a) | | 117,800 | | 3,127,590 |
| |
| |
|
| Oil, Gas & Consumable Fuels — 1.3% | | | | |
| Petroleo Brasileiro SA (a) | | 164,100 | | 8,654,634 |
| |
| |
|
| Total Common Stocks in Brazil | | | | 26,614,548 |
| |
| |
|
| Canada — 3.1% | | | | |
| Chemicals — 0.4% | | | | |
| Potash Corp. of Saskatchewan, Inc. | | 16,600 | | 2,881,760 |
| |
| |
|
| Commercial Services & Supplies — 1.1% | | | | |
| Ritchie Bros. Auctioneers, Inc. | | 276,200 | | 7,308,252 |
| |
| |
|
| Communications Equipment — 0.0% | | | | |
| Nortel Networks Corp. (c) | | 8,703 | | 52,479 |
| |
| |
|
| Energy Equipment & Services — 0.4% | | | | |
| Ensign Resource Service Group Inc. | | 118,800 | | 2,675,182 |
| |
| |
|
| Food & Staples Retailing — 0.9% | | | | |
| Shoppers Drug Mart Corp. | | 110,400 | | 5,760,181 |
| |
| |
|
| Oil, Gas & Consumable Fuels — 0.3% | | | | |
| Cameco Corp. | | 65,200 | | 1,961,281 |
| |
| |
|
| Total Common Stocks in Canada | | | | 20,639,135 |
| |
| |
|
| Common Stocks | | Shares | | Value |
| |
| |
|
| |
| China — 0.5% | | | | |
| Electrical Equipment — 0.3% | | | | |
| Suntech Power Holdings Co. Ltd. (a)(b)(c) | | 39,900 | | $ 1,907,619 |
| |
| |
|
| Oil, Gas & Consumable Fuels — 0.2% | | | | |
| China Shenhua Energy Co. Ltd. Class H | | 426,300 | | 1,455,713 |
| |
| |
|
| Total Common Stocks in China | | | | 3,363,332 |
| |
| |
|
| France — 2.6% | | | | |
| Electric Utilities — 0.6% | | | | |
| Electricite de France SA | | 43,300 | | 3,703,198 |
| |
| |
|
| Electrical Equipment — 0.9% | | | | |
| Alstom | | 33,500 | | 3,403,003 |
| Areva SA | | 2,600 | | 2,623,162 |
| | | | |
|
| | | | | 6,026,165 |
| |
| |
|
| Multi-Utilities — 0.5% | | | | |
| Veolia Environnement SA | | 56,025 | | 3,004,998 |
| |
| |
|
| Semiconductors & Semiconductor | | | | |
| Equipment — 0.6% | | | | |
| STMicroelectronics NV | | 331,200 | | 4,326,002 |
| |
| |
|
| Total Common Stocks in France | | | | 17,060,363 |
| |
| |
|
| Germany — 2.3% | | | | |
| Automobiles — 0.6% | | | | |
| Porsche Automobil Holding SE (Preference Shares) | | 27,000 | | 3,790,084 |
| |
| |
|
| Chemicals — 0.7% | | | | |
| Wacker Chemie AG | | 24,800 | | 4,556,791 |
| |
| |
|
| Diversified Financial Services — 0.5% | | | | |
| Deutsche Boerse AG | | 35,200 | | 3,325,502 |
| |
| |
|
| Industrial Conglomerates — 0.5% | | | | |
| Siemens AG | | 29,800 | | 3,234,719 |
| |
| |
|
| Total Common Stocks in Germany | | | | 14,907,096 |
| |
| |
|
| Hong Kong — 5.5% | | | | |
| Chemicals — 0.0% | | | | |
| Sinofert Holdings Ltd. | | 100 | | 65 |
| |
| |
|
| Commercial Banks — 1.7% | | | | |
| Hang Seng Bank Ltd. | | 302,800 | | 5,972,207 |
| Industrial & Commercial Bank of China | | 7,470,600 | | 5,115,218 |
| | | | |
|
| | | | | 11,087,425 |
| |
| |
|
| Communications Equipment — 0.7% | | | | |
| ZTE Corp. | | 988,580 | | 4,689,240 |
| |
| |
|
| Construction & Engineering — 0.4% | | | | |
| China Railway Construction Corp. (c) | | 2,075,000 | | 2,849,481 |
| |
| |
|
| Distributors — 0.4% | | | | |
| China Resources Enterprise, Ltd. | | 950,100 | | 2,571,172 |
| |
| |
|
| Electric Utilities — 0.6% | | | | |
| Cheung Kong Infrastructure Holdings Ltd. | | 992,700 | | 4,305,346 |
| |
| |
|
| Food Products — 0.9% | | | | |
| Chaoda Modern Agriculture Holdings Ltd. | | 2,779,332 | | 2,951,606 |
| China Mengniu Dairy Co., Ltd. | | 963,500 | | 2,907,987 |
| | | | |
|
| | | | | 5,859,593 |
| |
| |
|
| Industrial Conglomerates — 0.4% | | | | |
| NWS Holdings Ltd. | | 1,092,700 | | 2,412,585 |
| |
| |
|
| Wireless Telecommunication Services — 0.4% | | | | |
| China Mobile Ltd. | | 264,500 | | 3,002,604 |
| |
| |
|
| Total Common Stocks in Hong Kong | | | | 36,777,511 |
| |
| |
|
| See Notes to Financial Statements. |
Schedule of Investments (continued)
BlackRock Global Growth Fund, Inc.
(Percentages shown are based on Net Assets)
| Common Stocks | | Shares | | Value |
| |
| |
|
| |
| India — 2.7% | | | | |
| Commercial Banks — 0.5% | | | | |
| HDFC Bank Ltd. | | 104,900 | | $ 3,030,014 |
| |
| |
|
| IT Services — 1.1% | | | | |
| Infosys Technologies Ltd. (a) | | 90,800 | | 3,748,224 |
| Infosys Technologies Ltd. | | 90,200 | | 3,568,964 |
| | | | |
|
| | | | | 7,317,188 |
| |
| |
|
| Metals & Mining — 0.3% | | | | |
| Sterlite Industries India Ltd. | | 145,900 | | 2,064,662 |
| |
| |
|
| Oil, Gas & Consumable Fuels — 0.4% | | | | |
| Reliance Industries Ltd. | | 55,200 | | 2,669,145 |
| |
| |
|
| Wireless Telecommunication Services — 0.4% | | | | |
| Bharti Tele-Ventures Ltd. (c) | | 144,900 | | 2,739,994 |
| |
| |
|
| Total Common Stocks in India | | | | 17,821,003 |
| |
| |
|
| Japan — 6.6% | | | | |
| Automobiles — 1.3% | | | | |
| Honda Motor Co., Ltd. | | 266,500 | | 8,655,298 |
| |
| |
|
| Commercial Banks — 0.7% | | | | |
| Sumitomo Mitsui Financial Group, Inc. | | 800 | | 4,843,378 |
| |
| |
|
| Electronic Equipment & Instruments — 0.8% | | | | |
| Kyocera Corp. | | 61,000 | | 5,112,423 |
| |
| |
|
| Food & Staples Retailing — 0.5% | | | | |
| Seven & I Holdings Co. Ltd. | | 116,400 | | 3,390,447 |
| |
| |
|
| Household Durables — 0.7% | | | | |
| Sony Corp. | | 128,400 | | 4,908,461 |
| |
| |
|
| Machinery — 0.6% | | | | |
| Kurita Water Industries Ltd. | | 124,900 | | 4,064,333 |
| |
| |
|
| Office Electronics — 0.8% | | | | |
| Canon, Inc. | | 120,700 | | 5,412,641 |
| |
| |
|
| Software — 1.2% | | | | |
| Nintendo Co., Ltd. | | 17,700 | | 8,309,440 |
| |
| |
|
| Total Common Stocks in Japan | | | | 44,696,421 |
| |
| |
|
| Mexico — 0.5% | | | | |
| Wireless Telecommunication Services — 0.5% | | | | |
| America Movil, SA de CV (a) | | 69,500 | | 3,570,910 |
| |
| |
|
| Total Common Stocks in Mexico | | | | 3,570,910 |
| |
| |
|
| Norway — 0.3% | | | | |
| Electrical Equipment — 0.3% | | | | |
| Renewable Energy Corp. ASA (c) | | 67,000 | | 2,059,900 |
| |
| |
|
| Total Common Stocks in Norway | | | | 2,059,900 |
| |
| |
|
| Singapore — 1.1% | | | | |
| Food Products — 0.4% | | | | |
| Wilmar International Ltd. | | 1,027,000 | | 2,719,928 |
| |
| |
|
| Industrial Conglomerates — 0.7% | | | | |
| Keppel Corp. Ltd. | | 667,900 | | 4,638,291 |
| |
| |
|
| Total Common Stocks in Singapore | | | | 7,358,219 |
| |
| |
|
| South Korea — 0.7% | | | | |
| Automobiles — 0.3% | | | | |
| Hyundai Motor Co. | | 27,700 | | 1,809,781 |
| |
| |
|
| Semiconductors & Semiconductor | | | | |
| Equipment — 0.4% | | | | |
| Samsung Electronics Co., Ltd. | | 5,400 | | 2,532,988 |
| |
| |
|
| Total Common Stocks in South Korea | | | | 4,342,769 |
| |
| |
|
| Common Stocks | | Shares | | Value |
| |
| |
|
| |
| Spain — 1.4% | | | | |
| Biotechnology — 0.5% | | | | |
| Grifols SA | | 112,900 | | $ 3,351,279 |
| |
| |
|
| Commercial Banks — 0.9% | | | | |
| Banco Santander SA | | 363,100 | | 6,172,476 |
| |
| |
|
| Total Common Stocks in Spain | | | | 9,523,755 |
| |
| |
|
| Switzerland — 4.0% | | | | |
| Electrical Equipment — 0.5% | | | | |
| ABB Ltd. | | 141,800 | | 3,478,033 |
| |
| |
|
| Food Products — 1.4% | | | | |
| Nestle SA Registered Shares | | 216,500 | | 9,538,907 |
| |
| |
|
| Life Sciences Tools & Services — 1.0% | | | | |
| Lonza Group AG Registered Shares | | 45,800 | | 6,465,420 |
| |
| |
|
| Professional Services — 0.6% | | | | |
| SGS SA | | 2,900 | | 3,715,832 |
| |
| |
|
| Textiles, Apparel & Luxury Goods — 0.5% | | | | |
| The Swatch Group Ltd. Registered Shares | | 73,500 | | 3,301,797 |
| |
| |
|
| Total Common Stocks in Switzerland | | | | 26,499,989 |
| |
| |
|
| United Kingdom — 6.3% | | | | |
| Beverages — 1.0% | | | | |
| Diageo Plc | | 372,000 | | 6,870,458 |
| |
| |
|
| Commercial Banks — 2.2% | | | | |
| HSBC Holdings Plc | | 415,000 | | 6,529,927 |
| Standard Chartered Plc | | 302,800 | | 8,188,831 |
| | | | |
|
| | | | | 14,718,758 |
| |
| |
|
| Commercial Services & Supplies — 0.5% | | | | |
| Aggreko Plc | | 267,300 | | 3,502,314 |
| |
| |
|
| Food & Staples Retailing — 0.7% | | | | |
| Tesco Plc | | 663,600 | | 4,599,667 |
| |
| |
|
| Household Products — 1.0% | | | | |
| Reckitt Benckiser Plc | | 126,100 | | 6,374,926 |
| |
| |
|
| Metals & Mining — 0.9% | | | | |
| Anglo American Plc | | 60,000 | | 3,189,351 |
| Rio Tinto Plc Registered Shares | | 33,000 | | 3,132,658 |
| | | | |
|
| | | | | 6,322,009 |
| |
| |
|
| Total Common Stocks in the United Kingdom | | | | 42,388,132 |
| |
| |
|
| United States — 49.1% | | | | |
| Aerospace & Defense — 1.0% | | | | |
| Spirit Aerosystems Holdings, Inc. Class A (c) | | 305,000 | | 6,954,000 |
| |
| |
|
| Beverages — 0.5% | | | | |
| The Coca-Cola Co. | | 68,900 | | 3,587,623 |
| |
| |
|
| Biotechnology — 3.4% | | | | |
| Amgen, Inc. (c) | | 108,600 | | 6,825,510 |
| Celgene Corp. (c) | | 114,100 | | 7,907,130 |
| Gilead Sciences, Inc. (c) | | 147,600 | | 7,775,568 |
| | | | |
|
| | | | | 22,508,208 |
| |
| |
|
| Capital Markets — 3.6% | | | | |
| The Charles Schwab Corp. (b) | | 192,200 | | 4,610,878 |
| Janus Capital Group, Inc. (b) | | 234,800 | | 6,332,556 |
| Northern Trust Corp. | | 84,000 | | 6,752,760 |
| State Street Corp. | | 96,500 | | 6,530,155 |
| | | | |
|
| | | | | 24,226,349 |
| |
| |
|
See Notes to Financial Statements.
Schedule of Investments (continued)
BlackRock Global Growth Fund, Inc.
(Percentages shown are based on Net Assets)
| Common Stocks | | Shares | | Value |
| |
| |
|
| |
| United States (continued) | | | | |
| Chemicals — 1.5% | | | | |
| Monsanto Co. | | 89,100 | | $ 10,179,675 |
| |
| |
|
| Communications Equipment — 3.3% | | | | |
| Cisco Systems, Inc. (c) | | 389,100 | | 9,357,855 |
| QUALCOMM, Inc. | | 239,500 | | 12,609,675 |
| | | | |
|
| | | | | 21,967,530 |
| |
| |
|
| Computers & Peripherals — 1.9% | | | | |
| Apple, Inc. (c) | | 50,700 | | 8,595,171 |
| EMC Corp. (c) | | 271,000 | | 4,140,880 |
| | | | |
|
| | | | | 12,736,051 |
| |
| |
|
| Construction & Engineering — 1.9% | | | | |
| Jacobs Engineering Group, Inc. (c) | | 82,200 | | 6,068,004 |
| Quanta Services, Inc. (b)(c) | | 217,600 | | 6,950,144 |
| | | | |
|
| | | | | 13,018,148 |
| |
| |
|
| Electrical Equipment — 0.2% | | | | |
| General Cable Corp. (c) | | 31,900 | | 1,570,118 |
| |
| |
|
| Electronic Equipment & Instruments — 1.0% | | | | |
| Mettler Toledo International, Inc. (c) | | 62,500 | | 6,575,000 |
| |
| |
|
| Energy Equipment & Services — 2.2% | | | | |
| Core Laboratories NV | | 25,300 | | 3,140,742 |
| National Oilwell Varco, Inc. (c) | | 94,300 | | 6,952,739 |
| Schlumberger Ltd. | | 51,200 | | 4,824,064 |
| | | | |
|
| | | | | 14,917,545 |
| |
| |
|
| Food & Staples Retailing — 3.3% | | | | |
| Costco Wholesale Corp. | | 124,700 | | 8,362,382 |
| Wal-Mart Stores, Inc. | | 231,800 | | 13,692,426 |
| | | | |
|
| | | | | 22,054,808 |
| |
| |
|
| Food Products — 0.5% | | | | |
| Bunge Ltd. (b) | | 34,300 | | 3,065,048 |
| |
| |
|
| Health Care Equipment & Supplies — 0.5% | | | | |
| Intuitive Surgical, Inc. (c) | | 11,300 | | 3,336,551 |
| |
| |
|
| Health Care Providers & Services — 1.0% | | | | |
| Express Scripts, Inc. (b)(c) | | 92,600 | | 6,797,766 |
| |
| |
|
| Hotels, Restaurants & Leisure — 1.0% | | | | |
| McDonald's Corp. | | 105,800 | | 6,564,890 |
| |
| |
|
| Household Products — 1.4% | | | | |
| The Procter & Gamble Co. | | 129,500 | | 9,035,215 |
| |
| |
|
| IT Services — 0.9% | | | | |
| MasterCard, Inc. Class A | | 24,500 | | 5,942,475 |
| |
| |
|
| Internet & Catalog Retail — 0.5% | | | | |
| Amazon.com, Inc. (c) | | 40,600 | | 3,280,886 |
| |
| |
|
| Internet Software & Services — 2.3% | | | | |
| Google, Inc. Class A (c) | | 32,500 | | 15,056,925 |
| |
| |
|
| Life Sciences Tools & Services — 2.1% | | | | |
| Illumina, Inc. (c) | | 71,200 | | 6,132,456 |
| Thermo Fisher Scientific, Inc. (c) | | 132,100 | | 7,999,976 |
| | | | |
|
| | | | | 14,132,432 |
| |
| |
|
| Machinery — 1.3% | | | | |
| Deere & Co. | | 49,200 | | 3,472,044 |
| Joy Global, Inc. | | 49,800 | | 3,537,792 |
| SPX Corp. | | 14,600 | | 1,741,050 |
| | | | |
|
| | | | | 8,750,886 |
| |
| |
|
| Common Stocks | | Shares | | Value |
| |
| |
|
| |
| United States (concluded) | | | | |
| Oil, Gas & Consumable Fuels — 0.5% | | | | |
| Chesapeake Energy Corp. | | 66,600 | | $ 3,223,440 |
| |
| |
|
| Pharmaceuticals — 2.4% | | | | |
| Abbott Laboratories | | 119,000 | | 6,834,170 |
| Johnson & Johnson | | 134,800 | | 9,493,964 |
| | | | |
|
| | | | | 16,328,134 |
| |
| |
|
| Professional Services — 1.0% | | | | |
| FTI Consulting, Inc. (c) | | 93,800 | | 6,884,920 |
| |
| |
|
| Semiconductors & Semiconductor | | | | |
| Equipment — 0.5% | | | | |
| Intel Corp. | | 138,000 | | 3,156,060 |
| |
| |
|
| Software — 3.1% | | | | |
| Adobe Systems, Inc. (c) | | 74,200 | | 3,177,986 |
| Microsoft Corp. | | 259,100 | | 7,070,839 |
| Oracle Corp. (c) | | 157,800 | | 3,460,554 |
| Salesforce.com, Inc. (c) | | 125,000 | | 7,002,500 |
| | | | |
|
| | | | | 20,711,879 |
| |
| |
|
| Specialty Retail — 2.9% | | | | |
| Dick's Sporting Goods, Inc. (c) | | 299,300 | | 6,850,977 |
| GameStop Corp. Class A (c) | | 173,400 | | 7,607,058 |
| Lowe's Cos., Inc. | | 210,900 | | 5,196,576 |
| | | | |
|
| | | | | 19,654,611 |
| |
| |
|
| Textiles, Apparel & Luxury Goods — 1.1% | | | | |
| Polo Ralph Lauren Corp. (b) | | 95,900 | | 7,276,892 |
| |
| |
|
| Tobacco — 1.3% | | | | |
| Philip Morris International, Inc. | | 162,200 | | 8,710,140 |
| |
| |
|
| Wireless Telecommunication Services — 1.0% | | | | |
| SBA Communications Corp. Class A (c) | | 199,000 | | 6,951,070 |
| |
| |
|
| Total Common Stocks in the United States | | | | 329,155,275 |
| |
| |
|
| Total Common Stocks — 95.5% | | | | 638,792,723 |
| |
| |
|
| |
| |
| |
| Rights | | | | |
| |
| |
|
| Australia — 0.0% | | | | |
| Construction & Engineering — 0.0% | | | | |
| Leighton Holdings Ltd. (d)(e) | | 8,435 | | 40,924 |
| |
| |
|
| Total Rights — 0.0% | | | | 40,924 |
| |
| |
|
| Total Long-Term Investments | | | | |
| (Cost — $625,776,343) — 95.5% | | | | 638,833,647 |
| |
| |
|
| |
| |
| | | Beneficial | | |
| | | Interest | | |
| Short-Term Securities | | (000) | | |
| |
| |
|
| BlackRock Liquidity Series, LLC | | | | |
| Cash Sweep Series, 2.41% (f)(g) | | $ 17,662 | | 17,662,404 |
| BlackRock Liquidity Series, LLC | | | | |
| Money Market Series, 2.41% (f)(g)(h) | | 28,753 | | 28,752,550 |
| |
| |
|
| Total Short-Term Securities | | | | |
| (Cost — $46,414,954) — 6.9% | | | | 46,414,954 |
| |
| |
|
| Total Investments (Cost — $672,191,297*) — 102.4% | | | | 685,248,601 |
| Liabilities in Excess of Other Assets — (2.4)% | | | | (16,300,410) |
| | | | |
|
| Net Assets — 100% | | | | $668,948,191 |
| | | | |
|
See Notes to Financial Statements.
Schedule of Investments (concluded)
BlackRock Global Growth Fund, Inc.
* The cost and unrealized appreciation (depreciation) of investments as of
August 31, 2008, as computed for federal income tax purposes, were
as follows:
| Aggregate cost | | $671,418,309 |
| | |
|
| Gross unrealized appreciation | | $ 55,501,261 |
| Gross unrealized depreciation | | (41,670,969) |
| | |
|
| Net unrealized appreciation | | $ 13,830,292 |
| | |
|
(a) Depositary receipts.
(b) Security, or a portion of security, is on loan.
(c) Non-income producing security.
(d) The rights may be exercised until September 22, 2008.
(e) Security is fair valued.
(f) Investments in companies considered to be an affiliate of the Fund, for purposes
of Section 2(a)(3) of the Investment Company Act of 1940, were as follows:
| | | Net | | |
| Affiliate | | Activity | | Income |
| |
| |
|
| |
| BlackRock Liquidity Series, LLC | | | | |
| Cash Sweep Series | | $ (36,150) | | $808,577 |
| BlackRock Liquidity Series, LLC | | | | |
| Money Market Series | | $25,839,400 | | $112,327 |
| |
| |
|
(g) Represents the current yield as of report date.
(h) Security was purchased with the cash proceeds from securities loans.
•For Fund compliance purposes,the Fund's industry classifications refer to any
one or more of the industry sub-classifications used by one or more widely rec-
ognized market indexes or ratings group indexes, and/or as defined by Fund
management. This definition may not apply for purposes of this report which may
combine industry sub-classifications for reporting ease. These industry classifca-
tions are unaudited.
See Notes to Financial Statements.
ANNUAL REPORT AUGUST 31, 2008 15
| Statements of Assets and Liabilities | | | | |
| |
| | | BlackRock | | |
| | | Fundamental | | BlackRock |
| | | Growth | | Global |
| | | Principal | | Growth |
| August 31, 2008 | | Protected Fund | | Fund, Inc. |
| |
| |
|
| |
| Assets | | | | |
| |
| |
|
| |
| Investments at value — unaffiliated1,2 | | $ 62,449,933 | | $ 638,833,647 |
| Investments at value — affiliated3 | | — | | 46,414,954 |
| Cash | | — | | 2,435,606 |
| Foreign currency at value4 | | 2,179 | | 1,395,703 |
| Capital shares sold receivable | | — | | 1,089,388 |
| Interest receivable from affiliates | | 89 | | — |
| Dividends receivable | | 34,271 | | 1,257,236 |
| Investments sold receivable — unaffiliated | | 575,589 | | 14,029,882 |
| Investments sold receivable — affiliated | | 250,099 | | 5,203,142 |
| Securities lending receivable | | — | | 8,963 |
| Other assets | | — | | 38,907 |
| Prepaid expenses | | 1,849 | | 134,596 |
| | |
| |
|
| Total assets | | 63,314,009 | | 710,842,024 |
| |
| |
|
| |
| |
| Liabilities | | | | |
| |
| |
|
| |
| Bank overdraft | | 189,348 | | — |
| Collateral received for securities loaned at value | | — | | 28,752,550 |
| Investments purchased payable — unaffiliated | | 158,400 | | 9,818,490 |
| Investments purchased payable — affiliated | | 71,173 | | 1,471,473 |
| Capital shares redeemed payable | | 147,580 | | 982,314 |
| Investment advisory fees payable | | 31,384 | | 399,518 |
| Other affiliates payable | | 14,610 | | 161,032 |
| Officer’s and Directors’ fees payable | | 21 | | 147 |
| Distribution fees payable | | 45,745 | | 164,836 |
| Financial warranty fee payable | | 40,948 | | — |
| Other liabilities | | 114 | | 4,374 |
| Other accrued expenses | | 27,734 | | 139,099 |
| | |
| |
|
| Total liabilities | | 727,057 | | 41,893,833 |
| | |
| |
|
| Net Assets | | $ 62,586,952 | | $ 668,948,191 |
| |
| |
|
| |
| |
| Net Assets Consist of | | | | |
| |
| |
|
| |
| Institutional Shares, $0.10 par value5 | | $ — | | $ 1,368,223 |
| Investor A Shares, $0.10 par value6 | | — | | 2,022,666 |
| Investor B Shares, $0.10 par value7 | | — | | 188,674 |
| Investor C Shares, $0.10 par value8 | | — | | 625,151 |
| Class R Shares, $0.10 par value9 | | — | | 100,235 |
| Paid-in capital in excess of par | | 55,328,226* | | 947,286,333 |
| Undistributed (distributions in excess of) net investment income | | (1,898) | | 3,613,646 |
| Accumulated net realized gain (loss) | | 1,374,661 | | (299,395,886) |
| Net unrealized appreciation/depreciation | | 5,885,963 | | 13,139,149 |
| | |
| |
|
| Net Assets | | $ 62,586,952 | | $ 668,948,191 |
| | |
| |
|
| |
| * Unlimited number of shares authorized of no par value. | | | | |
| See Notes to Financial Statements. |
| Statements of Assets and Liabilities (concluded) | | | | |
| |
| | | BlackRock | | |
| | | Fundamental | | BlackRock |
| | | Growth | | Global |
| | | Principal | | Growth |
| August 31, 2008 | | Protected Fund | | Fund, Inc. |
| |
| |
|
| Net Asset Value | | | | |
| |
| |
|
| Institutional | | | | |
| Net assets | | $ 2,832,952 | | $ 216,839,116 |
| | |
| |
|
| Shares outstanding | | 291,303 | | 13,682,232 |
| | |
| |
|
| Net asset value | | $ 9.73 | | $ 15.85 |
| | |
| |
|
| Investor A | | | | |
| Net assets | | $ 3,717,327 | | $ 316,147,435 |
| | |
| |
|
| Shares outstanding | | 384,378 | | 20,226,663 |
| | |
| |
|
| Net asset value | | $ 9.67 | | $ 15.63 |
| | |
| |
|
| Investor B | | | | |
| Net assets | | $ 32,048,348 | | $ 27,988,255 |
| | |
| |
|
| Shares outstanding | | 3,405,570 | | 1,886,735 |
| | |
| |
|
| Net asset value | | $ 9.41 | | $ 14.83 |
| | |
| |
|
| Investor C | | | | |
| Net assets | | $ 23,988,325 | | $ 92,737,492 |
| | |
| |
|
| Shares outstanding | | 2,542,313 | | 6,251,513 |
| | |
| |
|
| Net asset value | | $ 9.44 | | $ 14.83 |
| | |
| |
|
| Class R | | | | |
| Net assets | | — | | $ 15,235,893 |
| | |
| |
|
| Shares outstanding | | — | | 1,002,354 |
| | |
| |
|
| Net asset value | | — | | $ 15.20 |
| | |
| |
|
| 1Investments at cost — unaffiliated | | $ 56,564,566 | | $ 625,776,343 |
| | |
| |
|
| 2Securities loaned | | — | | $ 27,848,317 |
| | |
| |
|
| 3Investments at cost — affiliated | | — | | $ 46,414,954 |
| | |
| |
|
| 4Cost of foreign currency | | $ 2,042 | | $ 1,317,249 |
| | |
| |
|
| 5Authorized shares — Institutional | | — | | 100,000,000 |
| | |
| |
|
| 6Authorized shares — Investor A | | — | | 100,000,000 |
| | |
| |
|
| 7Authorized shares — Investor B | | — | | 300,000,000 |
| | |
| |
|
| 8Authorized shares — Investor C | | — | | 100,000,000 |
| | |
| |
|
| 9Authorized shares — Class R | | — | | 300,000,000 |
| | |
| |
|
| See Notes to Financial Statements. |
| Statements of Operations | | | | |
| |
| | | BlackRock | | |
| | | Fundamental | | BlackRock |
| | | Growth | | Global |
| | | Principal | | Growth |
| Year Ended August 31, 2008 | | Protected Fund | | Fund, Inc. |
| |
| |
|
| |
| Investment Income | | | | |
| |
| |
|
| |
| Dividends1 | | $ 493,134 | | $ 13,461,725 |
| Interest | | 930,532 | | — |
| Income from affiliates | | 26,354 | | 808,577 |
| Securities lending | | — | | 112,327 |
| | |
| |
|
| Total income | | 1,450,020 | | 14,382,629 |
| |
| |
|
| |
| |
| Expenses | | | | |
| |
| |
|
| |
| Investment advisory | | 482,310 | | 5,792,001 |
| Service — Investor A | | 10,969 | | 833,667 |
| Service and distribution — Investor B | | 383,258 | | 418,553 |
| Service and distribution — Investor C | | 280,925 | | 940,670 |
| Service and distribution — Class R | | — | | 51,786 |
| Transfer agent — Institutional | | 3,956 | | 286,180 |
| Transfer agent — Investor A | | 4,680 | | 412,143 |
| Transfer agent — Investor B | | 47,104 | | 101,847 |
| Transfer agent — Investor C | | 34,589 | | 151,047 |
| Transfer agent — Class R | | — | | 26,388 |
| Financial warranty | | 603,506 | | — |
| Custodian | | 27,552 | | 297,408 |
| Accounting services | | 68,572 | | 280,895 |
| Printing | | 39,023 | | 85,362 |
| Professional | | 70,516 | | 110,758 |
| Registration | | — | | 95,018 |
| Officer and Directors | | 19,223 | | 40,034 |
| Miscellaneous | | 12,473 | | 57,793 |
| | |
| |
|
| Total expenses | | 2,088,656 | | 9,981,550 |
| Less fees waived by advisor | | (1,341) | | — |
| Less fees paid indirectly | | — | | (2,157) |
| | |
| |
|
| Total expenses after waiver and fees paid indirectly | | 2,087,315 | | 9,979,393 |
| | |
| |
|
| Net investment income (loss) | | (637,295) | | 4,403,236 |
| |
| |
|
| |
| |
| Realized and Unrealized Gain (Loss) | | | | |
| |
| |
|
| |
| Net realized gain (loss) from: | | | | |
| Investments2 | | 2,565,326 | | 70,147,178 |
| Foreign currency | | 953 | | (828,604) |
| Options written | | 147,219 | | 1,680,524 |
| | |
| |
|
| | | 2,713,498 | | 70,999,098 |
| | |
| |
|
| Net change in unrealized appreciation/depreciation on: | | | | |
| Investments3 | | (3,482,460) | | (120,011,556) |
| Foreign currency | | 511 | | 62,234 |
| | |
| |
|
| | | (3,481,949) | | (119,949,322) |
| | |
| |
|
| Total realized and unrealized loss | | (768,451) | | (48,950,224) |
| | |
| |
|
| Net Decrease in Net Assets Resulting from Operations | | $ (1,405,746) | | $ (44,546,988) |
| | |
| |
|
| 1Net of foreign withholding tax | | $ 4,015 | | $ 496,397 |
| | |
| |
|
| 2Including foreign capital gain tax | | $ 681 | | — |
| | |
| |
|
| 3Including deferred foreign capital gain credit | | $ 31,487 | | $ 1,126,307 |
| | |
| |
|
| See Notes to Financial Statements. |
| Statements of Changes in Net Assets | | | | | | | | |
| |
| | | BlackRock | | | | |
| | | Fundamental Growth | | BlackRock |
| | | Principal Protected Fund | | Global Growth Fund, Inc. |
| | | Year Ended August 31, | | Year Ended August 31, |
| | |
| |
|
| Increase (Decrease) in Net Assets: | | 2008 | | 2007 | | 2008 | | 2007 |
| |
| |
| |
| |
|
| Operations | | | | | | | | |
| |
| |
| |
| |
|
| Net investment income (loss) | | $ (637,295) | | $ (591,166) | | $ 4,403,236 | | $ 3,956,446 |
| Net realized gain | | 2,713,498 | | 6,417,235 | | 70,999,098 | | 76,592,338 |
| Net change in unrealized appreciation/depreciation | | (3,481,949) | | 902,532 | | (119,949,322) | | 66,010,249 |
| | |
| |
| |
| |
|
| Net increase (decrease) in net assets resulting from operations | | (1,405,746) | | 6,728,601 | | (44,546,988) | | 146,559,033 |
| |
| |
| |
| |
|
| |
| Dividends and Distributions to Shareholders From | | | | | | | | |
| |
| |
| |
| |
|
| Net investment income: | | | | | | | | |
| Institutional | | — | | — | | (2,410,109) | | (101,798) |
| Investor A | | — | | — | | (1,607,916) | | — |
| Class R | | — | | — | | (23,918) | | — |
| Net realized gain: | | | | | | | | |
| Institutional | | (272,556) | | (284,119) | | — | | — |
| Investor A | | (316,319) | | (414,278) | | — | | — |
| Investor B | | (2,913,518) | | (3,136,898) | | — | | — |
| Investor C | | (2,084,933) | | (2,207,878) | | — | | — |
| | |
| |
| |
| |
|
| Decrease in net assets resulting from dividends and distributions to shareholders | | (5,587,326) | | (6,043,173) | | (4,041,943) | | (101,798) |
| |
| |
| |
| |
|
| |
| Capital Share Transactions | | | | | | | | |
| |
| |
| |
| |
|
| Net increase (decrease) in net assets derived from capital share transactions | | (12,817,870) | | (27,059,310) | | 21,865,740 | | 56,315,507 |
| |
| |
| |
| |
|
| |
| Redemption Fees | | | | | | | | |
| |
| |
| |
| |
|
| Redemption fees | | — | | — | | 104,836 | | 9,997 |
| |
| |
| |
| |
|
| |
| Net Assets | | | | | | | | |
| |
| |
| |
| |
|
| Total increase (decrease) in net assets | | (19,810,942) | | (26,373,882) | | (26,618,355) | | 202,782,739 |
| Beginning of year | | 82,397,894 | | 108,771,776 | | 695,566,546 | | 492,783,807 |
| | |
| |
| |
| |
|
| End of year | | $ 62,586,952 | | $ 82,397,894 | | $ 668,948,191 | | $ 695,566,546 |
| | |
| |
| |
| |
|
| End of year undistributed (distributions in excess of) net investment income | | $ (1,898) | | $ (7,035) | | $ 3,613,646 | | $ 3,657,259 |
| | |
| |
| |
| |
|
| See Notes to Financial Statements. |
| Financial Highlights | | | | | | | | | | | | | | | | BlackRock Fundamental Growth Principal Protected Fund |
| |
| | | | | Institutional | | | | | | | | | | | | Investor A | | | | |
| | |
| |
| |
| |
| |
| |
| |
| |
| |
| |
|
| | | | | Year Ended August 31, | | | | | | | | Year Ended August 31, | | |
| | |
| |
| |
| |
| |
| |
| |
|
| | | 2008 | | 2007 | | | | 2006 | | | | 2005 | | | | 2004 | | 2008 | | 2007 | | 2006 | | | | 2005 | | 2004 |
| |
| |
| |
| |
| |
| |
| |
| |
| |
| |
| |
| |
| |
| |
|
| Per Share Operating Performance | | | | | | | | | | | | | | | | | | | | | | | | | | | | |
| |
| |
| |
| |
| |
| |
| |
| |
| |
| |
| |
| |
| |
| |
|
| |
| Net asset value, beginning of year | | $ 10.59 | | $ 10.37 | | $ 10.57 | | $ 10.52 | | $ 10.40 | | $ 10.56 | | $ 10.36 | | $ 10.57 | | $ 10.49 | | $ 10.38 |
| | |
| |
| |
| |
| |
| |
| |
| |
| |
| |
|
| Net investment income (loss)1 | | 0.01 | | 0.03 | | | | 0.04 | | | | 0.10 | | | | 0.03 | | (0.02) | | —2 | | 0.01 | | | | 0.08 | | —2 |
| Net realized and unrealized gain (loss) | | (0.12) | | 0.81 | | | | 0.21 | | | | 0.63 | | | | 0.16 | | (0.12) | | 0.82 | | 0.20 | | | | 0.63 | | 0.16 |
| | |
| |
| |
| |
| |
| |
| |
| |
| |
| |
| |
| |
| |
| |
|
| Net increase (decrease) from | | | | | | | | | | | | | | | | | | | | | | | | | | | | |
| investment operations | | (0.11) | | 0.84 | | | | 0.25 | | | | 0.73 | | | | 0.19 | | (0.14) | | 0.82 | | 0.21 | | | | 0.71 | | 0.16 |
| | |
| |
| |
| |
| |
| |
| |
| |
| |
| |
| |
| |
| |
| |
|
| Dividends and distributions from: | | | | | | | | | | | | | | | | | | | | | | | | | | | | |
| Net investment income | | — | | — | | | | —3 | | | | — | | | | (0.07) | | — | | — | | —3 | | | | — | | (0.05) |
| Net realized gain | | (0.75) | | (0.62) | | | | (0.45) | | | | (0.68) | | | | — | | (0.75) | | (0.62) | | (0.42) | | | | (0.63) | | — |
| | |
| |
| |
| |
| |
| |
| |
| |
| |
| |
| |
| |
| |
| |
|
| Total dividends and distributions | | (0.75) | | (0.62) | | | | (0.45) | | | | (0.68) | | | | (0.07) | | (0.75) | | (0.62) | | (0.42) | | | | (0.63) | | (0.05) |
| | |
| |
| |
| |
| |
| |
| |
| |
| |
| |
| |
| |
| |
| |
|
| Net asset value, end of year | | $ 9.73 | | $ 10.59 | | $ 10.37 | | $ 10.57 | | $ 10.52 | | $ 9.67 | | $ 10.56 | | $ 10.36 | | $ 10.57 | | $ 10.49 |
| |
| |
| |
| |
| |
| |
| |
| |
| |
| |
|
| |
| Total Investment Return4 | | | | | | | | | | | | | | | | | | | | | | | | | | | | |
| |
| |
| |
| |
| |
| |
| |
| |
| |
| |
| |
| |
| |
| |
|
| Based on net asset value | | (1.63)% | | 8.44% | | | | 2.32% | | | | 7.03% | | | | 1.79% | | (1.94)% | | 8.24% | | 1.99% | | | | 6.82% | | 1.50% |
| |
| |
| |
| |
| |
| |
| |
| |
| |
| |
| |
| |
| |
| |
|
| |
| Ratios to Average Net Assets | | | | | | | | | | | | | | | | | | | | | | | | | | | | |
| |
| |
| |
| |
| |
| |
| |
| |
| |
| |
| |
| |
| |
| |
|
| Total expenses, net of waiver | | 1.89% | | 1.83% | | | | 1.74% | | | | 1.73% | | | | 1.74% | | 2.13% | | 2.08% | | 1.99% | | | | 1.98% | | 1.99% |
| | |
| |
| |
| |
| |
| |
| |
| |
| |
| |
| |
| |
| |
| |
|
| Total expenses | | 1.89% | | 1.83% | | | | 1.74% | | | | 1.73% | | | | 1.75% | | 2.14% | | 2.08% | | 1.99% | | | | 1.98% | | 2.00% |
| | |
| |
| |
| |
| |
| |
| |
| |
| |
| |
| |
| |
| |
| |
|
| Net investment income | | 0.05% | | 0.29% | | | | 0.39% | | | | 0.99% | | | | 0.27% | | (0.18)% | | 0.03% | | 0.14% | | | | 0.75% | | 0.02% |
| |
| |
| |
| |
| |
| |
| |
| |
| |
| |
| |
| |
| |
| |
|
| |
| Supplemental Data | | | | | | | | | | | | | | | | | | | | | | | | | | | | |
| |
| |
| |
| |
| |
| |
| |
| |
| |
| |
| |
| |
| |
| |
|
| Net assets, end of year (000) | | $ 2,833 | | $ 4,040 $ | | 5,333 | | $ 7,306 $ | | 11,675 | | $ 3,717 | | $ 4,846 | | $ 3,265 | | $ 4,955 | | $ 8,309 |
| | |
| |
| |
| |
| |
| |
| |
| |
| |
| |
|
| Portfolio turnover | | 99% | | 81% | | | | 46% | | | | 58% | | | | 71% | | 99% | | 81% | | 46% | | | | 58% | | 71% |
| | |
| |
| |
| |
| |
| |
| |
| |
| |
| |
| |
| |
| |
| |
|
| 1 | Based on average shares outstanding. |
| |
| 2 | Amount is less than $0.01 per share. |
| |
| 3 | Amount is less than ($0.01) per share. |
| |
| 4 | Total investment returns exclude the effects of any sales charges. |
| |
| See Notes to Financial Statements. |
| Financial Highlights (continued) | | | | | | BlackRock Fundamental Growth Principal Protected Fund |
| |
| | | | | | | Investor B | | | | | | | | | | Investor C | | | | |
| | |
| |
| |
| |
| |
| |
| |
| |
| |
| |
|
| | | | | Year Ended August 31, | | | | | | Year Ended August 31, | | |
| | |
| |
| |
| |
| |
| |
|
| | | 2008 | | 2007 | | 2006 | | 2005 | | 2004 | | 2008 | | 2007 | | 2006 | | | | 2005 | | 2004 |
| |
| |
| |
| |
| |
| |
| |
| |
| |
| |
| |
|
| Per Share Operating Performance | | | | | | | | | | | | | | | | | | | | | | |
| |
| |
| |
| |
| |
| |
| |
| |
| |
| |
| |
|
| |
| Net asset value, beginning of year | | $ 10.37 | | $ 10.26 | | $ 10.50 | | $ 10.39 | | $ 10.31 | | $ 10.39 | | $ 10.29 | | $ 10.52 | | $ 10.39 | | $ 10.31 |
| | |
| |
| |
| |
| |
| |
| |
| |
| |
| |
|
| Net investment loss1 | | (0.10) | | (0.07) | | (0.07) | | (0.01) | | (0.08) | | (0.10) | | (0.07) | | (0.07) | | | | (0.01) | | (0.08) |
| Net realized and unrealized gain (loss) | | (0.11) | | 0.80 | | 0.19 | | 0.63 | | 0.16 | | (0.10) | | 0.79 | | 0.20 | | | | 0.63 | | 0.16 |
| | |
| |
| |
| |
| |
| |
| |
| |
| |
| |
| |
|
| Net increase (decrease) from | | | | | | | | | | | | | | | | | | | | | | |
| investment operations | | (0.21) | | 0.73 | | 0.12 | | 0.62 | | 0.08 | | (0.20) | | 0.72 | | 0.13 | | | | 0.62 | | 0.08 |
| | |
| |
| |
| |
| |
| |
| |
| |
| |
| |
| |
|
| Dividends and distributions from: | | | | | | | | | | | | | | | | | | | | | | |
| Net investment income | | — | | — | | —2 | | — | | —2 | | — | | — | | —2 | | | | — | | — |
| Net realized gain | | (0.75) | | (0.62) | | (0.36) | | (0.51) | | — | | (0.75) | | (0.62) | | (0.36) | | | | (0.49) | | — |
| | |
| |
| |
| |
| |
| |
| |
| |
| |
| |
| |
|
| Total dividends and distributions | | (0.75) | | (0.62) | | (0.36) | | (0.51) | | —2 | | (0.75) | | (0.62) | | (0.36) | | | | (0.49) | | — |
| | |
| |
| |
| |
| |
| |
| |
| |
| |
| |
| |
|
| Net asset value, end of year | | $ 9.41 | | $ 10.37 | | $ 10.26 | | $ 10.50 | | $ 10.39 | | $ 9.44 | | $ 10.39 | | $ 10.29 | | $ 10.52 | | $ 10.39 |
| |
| |
| |
| |
| |
| |
| |
| |
| |
| |
|
| |
| Total Investment Return3 | | | | | | | | | | | | | | | | | | | | | | |
| |
| |
| |
| |
| |
| |
| |
| |
| |
| |
| |
|
| Based on net asset value | | (2.68)% | | 7.41% | | 1.16% | | 6.04% | | 0.81% | | (2.58)% | | 7.28% | | 1.23% | | | | 6.05% | | 0.78% |
| |
| |
| |
| |
| |
| |
| |
| |
| |
| |
| |
|
| |
| Ratios to Average Net Assets | | | | | | | | | | | | | | | | | | | | | | |
| |
| |
| |
| |
| |
| |
| |
| |
| |
| |
| |
|
| Total expenses, net of waiver | | 2.90% | | 2.84% | | 2.76% | | 2.75% | | 2.76% | | 2.90% | | 2.84% | | 2.76% | | | | 2.75% | | 2.76% |
| | |
| |
| |
| |
| |
| |
| |
| |
| |
| |
| |
|
| Total expenses | | 2.90% | | 2.84% | | 2.76% | | 2.75% | | 2.76% | | 2.90% | | 2.84% | | 2.76% | | | | 2.75% | | 2.76% |
| | |
| |
| |
| |
| |
| |
| |
| |
| |
| |
| |
|
| Net investment income | | (0.95)% | | (0.72)% | | (0.63)% | | (0.06)% | | (0.74)% | | (0.95)% | | (0.72)% | | (0.63)% | | | | (0.06)% | | (0.75)% |
| |
| |
| |
| |
| |
| |
| |
| |
| |
| |
| |
|
| |
| Supplemental Data | | | | | | | | | | | | | | | | | | | | | | |
| |
| |
| |
| |
| |
| |
| |
| |
| |
| |
| |
|
| Net assets, end of year (000) | | $ 32,048 | | $ 42,614 | | $ 60,613 | | $ 79,793 | | $ 96,961 | | $ 23,988 | | $ 30,898 | | $ 39,561 | | $ 53,459 | | $ 71,216 |
| | |
| |
| |
| |
| |
| |
| |
| |
| |
| |
|
| Portfolio turnover | | 99% | | 81% | | 46% | | 58% | | 71% | | 99% | | 81% | | 46% | | | | 58% | | 71% |
| | |
| |
| |
| |
| |
| |
| |
| |
| |
| |
| |
|
| 1 | Based on average shares outstanding. |
| |
| 2 | Amount is less than ($0.01) per share. |
| |
| 3 | Total investment returns exclude the effects of sales charges. |
| |
| See Notes to Financial Statements. |
| Financial Highlights (continued) | | | | | | | | | | BlackRock Global Growth Fund, Inc. |
| |
| | | | | Institutional | | | | | | | | | | Investor A | | | | | | |
| | |
| |
| |
| |
| |
| |
| |
| |
| |
| |
|
| | | | | Year Ended August 31, | | | | | | Year Ended August 31, | | | | |
| | |
| |
| |
| |
| |
| |
| |
|
| | | 2008 | | 2007 | | 2006 | | 2005 | | 2004 | | 2008 | | 2007 | | 2006 | | | | 2005 | | | | 2004 |
| |
| |
| |
| |
| |
| |
| |
| |
| |
| |
| |
| |
|
| Per Share Operating Performance | | | | | | | | | | | | | | | | | | | | | | | | |
| |
| |
| |
| |
| |
| |
| |
| |
| |
| |
| |
| |
|
| |
| Net asset value, beginning of year | | $ 16.66 | | $ 12.71 | | $ 10.72 | | $ 8.56 | | $ 7.58 | | $ 16.44 | | $ 12.57 | | $ 10.60 | | $ 8.47 | | $ 7.51 |
| | |
| |
| |
| |
| |
| |
| |
| |
| |
| |
|
| Net investment income1 | | 0.16 | | 0.16 | | 0.09 | | 0.16 | | 0.09 | | 0.11 | | 0.11 | | 0.06 | | | | 0.13 | | | | 0.07 |
| Net realized and unrealized gain (loss)2 | | (0.84) | | 3.80 | | 2.07 | | 2.03 | | 0.89 | | (0.83) | | 3.76 | | 2.05 | | | | 2.00 | | | | 0.89 |
| | |
| |
| |
| |
| |
| |
| |
| |
| |
| |
| |
| |
|
| Net increase (decrease) from | | | | | | | | | | | | | | | | | | | | | | | | |
| investment operations | | (0.68) | | 3.96 | | 2.16 | | 2.19 | | 0.98 | | (0.72) | | 3.87 | | 2.11 | | | | 2.13 | | | | 0.96 |
| | |
| |
| |
| |
| |
| |
| |
| |
| |
| |
| |
| |
|
| Dividends from net investment income | | (0.13) | | (0.01) | | (0.17) | | (0.03) | | — | | (0.09) | | — | | (0.14) | | | | —3 | | | | — |
| | |
| |
| |
| |
| |
| |
| |
| |
| |
| |
| |
| |
|
| Net asset value, end of year | | $ 15.85 | | $ 16.66 | | $ 12.71 $ | | 10.72 | | $ 8.56 | | $ 15.63 | | $ 16.44 | | $ 12.57 | | $ 10.60 | | $ 8.47 |
| |
| |
| |
| |
| |
| |
| |
| |
| |
| |
|
| |
| Total Investment Return4 | | | | | | | | | | | | | | | | | | | | | | | | |
| |
| |
| |
| |
| |
| |
| |
| |
| |
| |
| |
| |
|
| Based on net asset value | | (4.21)% | | 31.17% | | 20.41% | | 25.58% | | 12.93% | | (4.47)% | | 30.79% | | 20.13% | | | | 25.17% | | | | 12.78% |
| |
| |
| |
| |
| |
| |
| |
| |
| |
| |
| |
| |
|
| |
| Ratios to Average Net Assets | | | | | | | | | | | | | | | | | | | | | | | | |
| |
| |
| |
| |
| |
| |
| |
| |
| |
| |
| |
| |
|
| Total expenses after fees paid indirectly | | 0.97% | | 1.01% | | 1.12% | | 1.13% | | 1.13% | | 1.25% | | 1.30% | | 1.35% | | | | 1.38% | | | | 1.37% |
| | |
| |
| |
| |
| |
| |
| |
| |
| |
| |
| |
| |
|
| Total expenses before fees paid indirectly . | | 0.97% | | 1.01% | | 1.12% | | 1.13% | | 1.13% | | 1.25% | | 1.30% | | 1.35% | | | | 1.38% | | | | 1.37% |
| | |
| |
| |
| |
| |
| |
| |
| |
| |
| |
| |
| |
|
| Total expenses | | 0.97% | | 1.01% | | 1.12% | | 1.13% | | 1.13% | | 1.25% | | 1.30% | | 1.35% | | | | 1.38% | | | | 1.37% |
| | |
| |
| |
| |
| |
| |
| |
| |
| |
| |
| |
| |
|
| Net investment income | | 0.87% | | 1.07% | | 0.71% | | 1.60% | | 1.05% | | 0.62% | | 0.75% | | 0.53% | | | | 1.35% | | | | 0.87% |
| |
| |
| |
| |
| |
| |
| |
| |
| |
| |
| |
| |
|
| |
| Supplemental Data | | | | | | | | | | | | | | | | | | | | | | | | |
| |
| |
| |
| |
| |
| |
| |
| |
| |
| |
| |
| |
|
| Net assets, end of year (000) | | $ 216,839 $ 284,754 $ 144,560 $ 114,007 $ 106,785 | | $ 316,147 $ 288,912 $ 227,792 | | $ 93,408 $ | | 98,519 |
| | |
| |
| |
| |
|
| Portfolio turnover | | 94% | | 91% | | 80% | | 109% | | 72% | | 94% | | 91% | | 80% | | | | 109% | | | | 72% |
| | |
| |
| |
| |
| |
| |
| |
| |
| |
| |
| |
| |
|
| 1 | Based on average shares outstanding. |
| |
| 2 | Includes a redemption fee, which is less than $0.01 per share. |
| |
| 3 | Amount is less than ($0.01) per share. |
| |
| 4 | Total investment returns exclude the effects of sales charges. |
| |
| See Notes to Financial Statements. |
| Financial Highlights (continued) | | | | | | | | | | BlackRock Global Growth Fund, Inc. |
| |
| | | | | | | Investor B | | | | | | | | | | Investor C | | | | |
| | |
| |
| |
| |
| |
| |
| |
| |
| |
| |
|
| | | | | Year Ended August 31, | | | | | | Year Ended August 31, | | |
| | |
| |
| |
| |
| |
| |
|
| | | 2008 | | 2007 | | 2006 | | 2005 | | 2004 | | 2008 | | 2007 | | 2006 | | | | 2005 | | 2004 |
| |
| |
| |
| |
| |
| |
| |
| |
| |
| |
| |
|
| Per Share Operating Performance | | | | | | | | | | | | | | | | | | | | | | |
| |
| |
| |
| |
| |
| |
| |
| |
| |
| |
| |
|
| |
| Net asset value, beginning of year | | $ 15.66 | | $ 12.07 | | $ 10.17 | | $ 8.19 | | $ 7.32 | | $ 15.65 | | $ 12.06 | | $ 10.17 | | $ 8.19 | | $ 7.32 |
| | |
| |
| |
| |
| |
| |
| |
| |
| |
| |
|
| Net investment income (loss)1 | | (0.04) | | (0.01) | | (0.06) | | 0.05 | | —2 | | (0.02) | | (0.01) | | (0.04) | | | | 0.05 | | —2 |
| Net realized and unrealized gain (loss)3 | | (0.79) | | 3.60 | | 2.00 | | 1.93 | | 0.87 | | (0.80) | | 3.60 | | 1.98 | | | | 1.93 | | 0.87 |
| | |
| |
| |
| |
| |
| |
| |
| |
| |
| |
| |
|
| Net increase (decrease) from | | | | | | | | | | | | | | | | | | | | | | |
| investment operations | | (0.83) | | 3.59 | | 1.94 | | 1.98 | | 0.87 | | (0.82) | | 3.59 | | 1.94 | | | | 1.98 | | 0.87 |
| | |
| |
| |
| |
| |
| |
| |
| |
| |
| |
| |
|
| Dividends from net investment income | | — | | — | | (0.04) | | — | | — | | — | | — | | (0.05) | | | | — | | — |
| | |
| |
| |
| |
| |
| |
| |
| |
| |
| |
| |
|
| Net asset value, end of year | | $ 14.83 | | $ 15.66 | | $ 12.07 | | $ 10.17 | | $ 8.19 | | $ 14.83 | | $ 15.65 | | $ 12.06 | | $ 10.17 | | $ 8.19 |
| |
| |
| |
| |
| |
| |
| |
| |
| |
| |
|
| |
| Total Investment Return4 | | | | | | | | | | | | | | | | | | | | | | |
| |
| |
| |
| |
| |
| |
| |
| |
| |
| |
| |
|
| Based on net asset value | | (5.30)% | | 29.74% | | 19.18% | | 24.18% | | 11.89% | | (5.24)% | | 29.77% | | 19.15% | | | | 24.18% | | 11.89% |
| |
| |
| |
| |
| |
| |
| |
| |
| |
| |
| |
|
| |
| Ratios to Average Net Assets | | | | | | | | | | | | | | | | | | | | | | |
| |
| |
| |
| |
| |
| |
| |
| |
| |
| |
| |
|
| Total expenses after fees paid indirectly | | 2.11% | | 2.15% | | 2.18% | | 2.16% | | 2.16% | | 2.03% | | 2.10% | | 2.16% | | | | 2.18% | | 2.18% |
| | |
| |
| |
| |
| |
| |
| |
| |
| |
| |
| |
|
| Total expenses before fees paid indirectly . | | 2.11% | | 2.15% | | 2.18% | | 2.16% | | 2.16% | | 2.03% | | 2.10% | | 2.16% | | | | 2.18% | | 2.18% |
| | |
| |
| |
| |
| |
| |
| |
| |
| |
| |
| |
|
| Total expenses | | 2.11% | | 2.15% | | 2.18% | | 2.16% | | 2.16% | | 2.03% | | 2.10% | | 2.16% | | | | 2.18% | | 2.18% |
| | |
| |
| |
| |
| |
| |
| |
| |
| |
| |
| |
|
| Net investment income (loss) | | (0.25)% | | (0.10)% | | (0.56)% | | 0.56% | | 0.05% | | (0.15)% | | (0.04)% | | (0.36)% | | | | 0.55% | | 0.05% |
| |
| |
| |
| |
| |
| |
| |
| |
| |
| |
| |
|
| |
| Supplemental Data | | | | | | | | | | | | | | | | | | | | | | |
| |
| |
| |
| |
| |
| |
| |
| |
| |
| |
| |
|
| Net assets, end of year (000) | | $ 27,988 | | $ 47,186 | | $ 62,390$ | | 212,353$ | | 252,691 | | $ 92,737 | | $ 70,835 | | $ 56,567 | | $ 55,507 | | $ 60,771 |
| | |
| |
| |
| |
| |
| |
| |
| |
| |
| |
|
| Portfolio turnover | | 94% | | 91% | | 80% | | 109% | | 72% | | 94% | | 91% | | 80% | | | | 109% | | 72% |
| | |
| |
| |
| |
| |
| |
| |
| |
| |
| |
| |
|
| 1 | Based on average shares outstanding. |
| |
| 2 | Amount is less than $0.01 per share. |
| |
| 3 | Includes a redemption fee, which is less than $0.01 per share. |
| |
| 4 | Total investment returns exclude the effects of sales charges. |
| |
| See Notes to Financial Statements. |
| Financial Highlights (concluded) | | | | | | BlackRock Global Growth Fund, Inc. |
| |
| | | | | | | Class R | | | | | | |
| | |
| |
| |
| |
| |
| |
|
| | | | | Year Ended August 31, | | | | |
| | |
| |
| |
| |
|
| | | 2008 | | 2007 | | 2006 | | | | 2005 | | 2004 |
| |
| |
| |
| |
| |
| |
|
| Per Share Operating Performance | | | | | | | | | | | | |
| |
| |
| |
| |
| |
| |
|
| |
| Net asset value, beginning of year | | $ 16.04 | | $ 12.30 | | $ 10.42 | | $ 8.36 | | $ 7.39 |
| | |
| |
| |
| |
| |
|
| Net investment income1 | | 0.04 | | 0.06 | | 0.03 | | | | 0.06 | | 0.08 |
| Net realized and unrealized gain (loss)2 | | (0.80) | | 3.68 | | 2.00 | | | | 2.01 | | 0.89 |
| | |
| |
| |
| |
| |
| |
|
| Net increase (decrease) from investment operations | | (0.76) | | 3.74 | | 2.03 | | | | 2.07 | | 0.97 |
| | |
| |
| |
| |
| |
| |
|
| Dividends from net investment income | | (0.08) | | — | | (0.15) | | | | (0.01) | | — |
| | |
| |
| |
| |
| |
| |
|
| Net asset value, end of year | | $ 15.20 | | $ 16.04 | | $ 12.30 | | $ 10.42 | | $ 8.36 |
| |
| |
| |
| |
| |
|
| |
| Total Investment Return | | | | | | | | | | | | |
| |
| |
| |
| |
| |
| |
|
| |
| Based on net asset value | | (4.81)% | | 30.41% | | 19.78% | | | | 24.81% | | 13.13% |
| |
| |
| |
| |
| |
| |
|
| |
| Ratios to Average Net Assets | | | | | | | | | | | | |
| |
| |
| |
| |
| |
| |
|
| |
| Total expenses after fees paid indirectly | | 1.63% | | 1.63% | | 1.62% | | | | 1.79% | | 1.56% |
| | |
| |
| |
| |
| |
| |
|
| Total expenses before fees paid indirectly | | 1.63% | | 1.63% | | 1.62% | | | | 1.79% | | 1.56% |
| | |
| |
| |
| |
| |
| |
|
| Total expenses | | 1.63% | | 1.63% | | 1.62% | | | | 1.79% | | 1.56% |
| | |
| |
| |
| |
| |
| |
|
| Net investment income | | 0.26% | | 0.44% | | 0.23% | | | | 0.99% | | 1.36% |
| |
| |
| |
| |
| |
| |
|
| |
| Supplemental Data | | | | | | | | | | | | |
| |
| |
| |
| |
| |
| |
|
| |
| Net assets, end of year (000) | | $ 15,236 | | $ 3,880 | | $ 1,475 | | $ 705 | | $ 166 |
| | |
| |
| |
| |
| |
|
| Portfolio turnover | | 94% | | 91% | | 80% | | | | 109% | | 72% |
| | |
| |
| |
| |
| |
| |
|
| 1 | Based on average shares outstanding. |
| |
| 2 | Includes a redemption fee, which is less than $0.01 per share. |
| |
| See Notes to Financial Statements. |
Notes to Financial Statements
1. Significant Accounting Policies:
BlackRock Fundamental Growth Principal Protected Fund, which is part
of BlackRock Principal Protected Trust (the “Trust”) and BlackRock Global
Growth Fund, Inc. (the “Funds” or individually as the “Fund”) are regis-
tered under the Investment Company Act of 1940, as amended (the
“1940 Act”), as diversified, open-end management investment compa-
nies. The Funds’ financial statements are prepared in conformity with
accounting principles generally accepted in the United States of
America, which may require the use of management accruals and esti-
mates. Actual results may differ from these estimates. The Funds offer
multiple classes of shares. Institutional Shares are sold without a sales
charge and only to certain eligible investors. Investor A Shares are gener-
ally sold with a front-end sales charge. Shares of Investor B and Investor
C may be subject to a contingent deferred sales charge. Class R Shares
are offered only by BlackRock Global Growth Fund, Inc. and are sold
only to certain retirement plans. All classes of shares have identical
voting, dividend, liquidation and other rights and the same terms and
conditions, except that Investor A, Investor B, Investor C and Class R
Shares bear certain expenses related to the shareholder servicing
of such shares, and Investor B, Investor C and Class R Shares also
bear certain expenses related to the distribution of such shares. Each
class has exclusive voting rights with respect to matters relating to
its shareholder servicing and distribution expenditures (except that
Investor B shareholders may vote on material changes to the Investor A
distribution plan).
Shares of BlackRock Fundamental Growth Principal Protected Fund
were offered during the initial offering period but will not be offered
during the Guarantee Period from November 13, 2002 through November
13, 2009 (the “Guarantee Maturity Date”), except in connection with
reinvestment of dividends and distributions. The Fund will be offered
on a continuous basis after the Guarantee Maturity Date without the
principal protection feature.
The following is a summary of significant accounting policies followed by
the Funds:
Valuation of Investments: Equity investments traded on a recognized
securities exchange or the NASDAQ Global Market System are valued at
the last reported sale price that day or the NASDAQ official closing price,
if applicable. For equity investments traded on more than one exchange,
the last reported sale price on the exchange where the stock is primarily
traded is used. Equity investments traded on a recognized exchange for
which there were no sales on that day are valued at the last available
bid price. If no bid price is available, the prior day’s price will be used,
unless it is determined that such prior day’s price no longer reflects
the fair value of the security. Short-term securities are valued at
amortized cost. |
Exchange-traded options are valued at the mean between the last bid
and ask prices at the close of the options market in which the options
trade. An exchange-traded option for which there is no mean price is
valued at the last bid (long positions) or ask (short positions) price. If no
bid or ask price is available, the prior day’s price will be used, unless it
is determined that such prior day’s price no longer reflects the fair value
of the option. Over-the-counter options are valued by an independent
pricing service using a mathematical model which incorporates a num-
ber of market data factors.
The Funds value their bond investments on the basis of last available bid
price or current market quotations provided by dealers or pricing servic-
es selected under the supervision of each Fund’s Board of Directors
(the “Board”). In determining the value of a particular investment, pricing
services may use certain information with respect to transactions in
such investments, quotations from dealers, pricing matrixes, market
transactions in comparable investments, various relationships observed
in the market between investments and calculated yield measures
based on valuation technology commonly employed in the market for
such investments.
In the event that application of these methods of valuation results in a
price for an investment which is deemed not to be representative of the
market value of such investment, the investment will be valued by a
method approved by the Board as reflecting fair value (“Fair Value
Assets”). When determining the price for Fair Value Assets, the invest-
ment advisor and/or sub-advisor seeks to determine the price that the
Funds might reasonably expect to receive from the current sale of that
asset in an arm's-length transaction. Fair value determinations shall be
based upon all available factors that the investment advisor and/or
sub-advisor deems relevant. The pricing of all Fair Value Assets is sub-
sequently reported to the Board or a committee thereof.
Generally, trading in foreign securities is substantially completed each
day at various times prior to the close of business on the New York
Stock Exchange ("NYSE"). The values of such securities used in comput-
ing the net assets of the Funds are determined as of such times. Foreign
currency exchange rates will be determined as of the close of business
on the NYSE. Occasionally, events affecting the values of such securities
and such exchange rates may occur between the times at which they
are determined and the close of business on the NYSE that may not
be reflected in the computation of the Funds’ net assets. If events (for
example, a company announcement, market volatility or a natural disas-
ter) occur during such periods that are expected to materially affect the
value of such securities, those securities will be valued at their fair value
as determined in good faith by the Board or by the investment advisor
using a pricing service and/or procedures approved by the Board. |
Notes to Financial Statements (continued)
Derivative Financial Instruments: The Funds may engage in various
portfolio investment strategies both to increase the return of the Funds
and to hedge, or protect, its exposure to interest rate movements and
movements in the securities markets. Losses may arise if the value
of the contract decreases due to an unfavorable change in the price
of the underlying security, or if the counterparty does not perform under
the contract. |
•Foreign currency exchange contracts — The Funds may enter into for-
eign currency exchange contracts as a hedge against either specific
transactions or portfolio positions. Foreign currency exchange con-
tracts, when used by the Funds, help to manage the overall exposure
to the foreign currency backing some of the investments held by the
Funds. The contract is marked-to-market daily and the change in
market value is recorded by the Funds as an unrealized gain or loss.
When the contract is closed, the Funds record a realized gain or loss
equal to the difference between the value at the time it was opened
and the value at the time it was closed.
•Options — The Funds may purchase and write call and put options.
When the Funds write an option, an amount equal to the premium
received by the Funds are reflected as an asset and an equivalent
liability. The amount of the liability is subsequently marked-to-market
to reflect the current value of the option written. When a security is
purchased or sold through an exercise of an option, the related pre-
mium paid (or received) is added to (or deducted from) the basis of
the security acquired or deducted from (or added to) the proceeds of
the security sold. When an option expires (or the Funds enter into a
closing transaction), the Funds realize a gain or loss on the option to
the extent of the premiums received or paid (or gain or loss to the
extent the cost of the closing transaction exceeds the premium
received or paid).
A call option gives the purchaser of the option the right (but not the
obligation) to buy, and obligates the seller to sell (when the option is
exercised), the underlying position at the exercise price at any time
or at a specified time during the option period. A put option gives the
holder the right to sell and obligates the writer to buy the underlying
position at the exercise price at any time or at a specified time dur-
ing the option period.
Foreign Currency Transactions: Foreign currency amounts are trans-
lated into United States dollars on the following basis: (i) market value
of investment securities, assets and liabilities at the current rate of
exchange; and (ii) purchases and sales of investment securities, income
and expenses at the rates of exchange prevailing on the respective dates
of such transactions. The Funds invest in foreign securities, which may
involve a number of risk factors and special consideration not present
with investments in securities of U.S. corporations. |
The Funds report foreign currency related transactions as components
of realized gains for financial reporting purposes, whereas such compo-
nents are treated as ordinary income for federal income tax purposes.
Zero-Coupon Bonds: The Funds may invest in zero-coupon bonds, which
are normally issued at a significant discount from face value and do not
provide for periodic interest payments. Zero-coupon bonds may experi-
ence greater volatility in market value than similar maturity debt obliga-
tions which provide for regular interest payments.
Investment Transactions and Investment Income: Investment transac-
tions are recorded on the dates the transactions are entered into (the
trade dates). Realized gains and losses on security transactions are
determined on the identified cost basis. Dividend income is recorded
on the ex-dividend dates. Dividends from foreign securities where the
ex-dividend date may have passed are subsequently recorded when
the Funds have determined the ex-dividend date. Interest income is
recognized on the accrual basis. Income and realized and unrealized
gains and losses are allocated daily to each class based on its relative
net assets.
Dividends and Distributions: Dividends and distributions paid by the
Funds are recorded on the ex-dividend dates.
Securities Lending: The Funds may lend securities to financial institu-
tions that provide cash or securities issued or guaranteed by the U.S.
government as collateral, which will be maintained at all times in an
amount equal to at least 100% of the current market value of the
loaned securities. The market value of the loaned securities is deter-
mined at the close of business of the Funds and any additional required
collateral is delivered to the Funds on the next business day. The Funds
typically receive the income on the loaned securities but do not receive
the income on the collateral. Where the Funds receive cash collateral,
they may invest such collateral and retain the amount earned on such
investment, net of any amount rebated to the borrower. The Funds may
receive a flat fee for their loans. Loans of securities are terminable at
any time and the borrower, after notice, is required to return borrowed
securities within the standard time period for settlement of securities
transactions. The Funds may pay reasonable lending agent, administra-
tive and custodial fees in connection with their loans. In the event that
the borrower defaults on its obligation to return borrowed securities |
Notes to Financial Statements (continued)
because of insolvency or for any other reason, the Funds could experi-
ence delays and costs in gaining access to the collateral. The Funds
also could suffer a loss where the value of the collateral falls below the
market value of the borrowed securities, in the event of borrower default
or in the event of losses on investments made with cash collateral.
Income Taxes: It is the Funds’ policy to comply with the requirements of
the Internal Revenue Code applicable to regulated investment compa-
nies and to distribute substantially all of its taxable income to its share-
holders. Therefore, no federal income tax provision is required. Under the
applicable foreign tax law, a withholding tax may be imposed on interest,
dividends and capital gains at various rates.
Effective February 29, 2008, the Funds implemented Financial
Accounting Standards Board ("FASB") Interpretation No. 48, "Accounting
for Uncertainty in Income Taxes — an interpretation of FASB Statement
No. 109" ("FIN 48"). FIN 48 prescribes the minimum recognition thresh-
old a tax position must meet in connection with accounting for uncer-
tainties in income tax positions taken or expected to be taken by an
entity, including investment companies, before being measured and rec-
ognized in the financial statements. The investment advisor has evaluat-
ed the application of FIN 48 to the Funds, and has determined that the
adoption of FIN 48 does not have a material impact on the Funds’ finan-
cial statements. The Funds file U.S. and various state tax returns. No
income tax returns are currently under examination. The statute of limita-
tions on the Funds’ tax returns remains open for the years ended August
31, 2005 through August 31, 2007. The statute of limitations on the
Funds’ state and local tax returns may remain open for an additional
year depending upon the jurisdiction.
Recent accounting pronouncements: In September 2006, Statement
of Financial Accounting Standards No. 157, “Fair Value Measurements”
(“FAS 157”), was issued and is effective for fiscal years beginning after
November 15, 2007. FAS 157 defines fair value, establishes a frame-
work for measuring fair value and expands disclosures about fair value
measurements. The impact on the Funds’ financial statement disclo-
sures, if any, is currently being assessed.
In March 2008, Statement of Financial Accounting Standards No. 161,
"Disclosures about Derivative Instruments and Hedging Activities — an
amendment of FASB Statement No. 133" ("FAS 161"), was issued. FAS
161 is intended to improve financial reporting for derivative instruments
by requiring enhanced disclosure that enables investors to understand
how and why an entity uses derivatives, how derivatives are accounted
for, and how derivative instruments affect an entity’s results of opera-
tions and financial position. In September 2008, FASB Staff Position |
No. 133-1 and FASB Interpretation No. 45-4 (the “FSP”), “Disclosures
about Credit Derivatives and Certain Guarantees: An Amendment of
FASB Statement No. 133 and FASB Interpretation No. 45; and
Clarification of the Effective Date of FASB Statement No. 161” was
issued and is effective for fiscal years and interim periods ending after
November 15, 2008. The FSP amends FASB Statement No. 133,
“Accounting for Derivative Instruments and Hedging Activities,” to require
disclosures by sellers of credit derivatives, including credit derivatives
embedded in hybrid instruments. The FSP also clarifies the effective date
of FAS 161, whereby disclosures required by FAS 161 are effective for
financial statements issued for fiscal years and interim periods begin-
ning after November 15, 2008. The impact on the Funds’ financial state-
ment disclosures, if any, is currently being assessed.
Bank Overdraft: BlackRock Fundamental Growth Principal Protected
Fund recorded a bank overdraft which resulted from estimates of
available cash.
Other: Expenses directly related to the Funds or their classes are
charged to that Fund or class. Other operating expenses shared by
several funds are pro-rated among those funds on the basis of relative
net assets or other appropriate methods. Other expenses of the Funds
are allocated daily to each class based on its relative net assets.
2. Investment Advisory Agreement and Other Transactions with
Affiliates:
Each Fund entered into an Investment Advisory Agreement with
BlackRock Advisors LLC (the “Advisor”), an indirect, wholly owned
subsidiary of BlackRock, Inc., to provide investment advisory and
administration services. Merrill Lynch & Co., Inc. (“Merrill Lynch”) and
The PNC Financial Services Group, Inc. (“PNC”) are principal owners
of BlackRock, Inc.
The Advisor is responsible for the management of each Fund's portfolio
and provides the necessary personnel, facilities, equipment and certain
other services necessary to the operations of the Funds. For such servic-
es, BlackRock Fundamental Growth Principal Protected Fund pays the
Advisor a monthly fee at an annual rate of 0.65% of the average daily
value of the Fund’s net assets. BlackRock Global Growth Fund, Inc. pays
the Advisor a monthly fee at an annual rate of 0.75% of the average
daily value of the Fund’s net assets not exceeding $1.5 billion and |
Notes to Financial Statements (continued)
0.725% of the average daily value of the Fund’s net assets in excess of
$1.5 billion. The Advisor has entered into a contractual agreement with
BlackRock Fundamental Growth Principal Protected Fund under which
the expenses incurred by each class of shares of the Fund (excluding
distribution and/or service fees) will not exceed 1.99% . This arrange-
ment has a one-year term and is automatically renewable.
The Advisor has entered into a separate sub-advisory agreement with
BlackRock Investment Management, LLC ("BIM"), an affiliate of the
Advisor, under which the Advisor pays BIM for services it provides, a
monthly fee that is a percentage of the investment advisory fee paid
by each Fund to the Advisor.
For the year ended August 31, 2008, the Funds reimbursed the Advisor
for certain accounting services, which are included in accounting servic-
es in the Statements of Operations. The reimbursements were as follows: |
| | | Reimbursement |
| | | to Advisor |
| |
|
| BlackRock Fundamental Growth Principal Protected Fund | | $ 1,250 |
| BlackRock Global Growth Fund, Inc | | $13,908 |
| |
|
Each Fund has received an exemptive order from the Securities and
Exchange Commission permitting it to lend portfolio securities to Merrill
Lynch, Pierce, Fenner & Smith Incorporated (“MLPF&S”), a wholly owned
subsidiary of Merrill Lynch, or its affiliates. As of August 31, 2008,
BlackRock Global Growth Fund, Inc. loaned securities with a value of
$12,315,662 to MLPF&S or its affiliates. Pursuant to that order, the
Funds have retained BIM as the securities lending agent for a fee based
on a share of the returns on investment of cash collateral. BIM may, on
behalf of the Funds, invest cash collateral received by the Funds for such
loans, among other things, in a private investment company managed by
the Advisor or in registered money market funds advised by the Advisor
or its affiliates. For the year ended August 31, 2008, BIM received
$28,303 in securities lending agent fees from BlackRock Global Growth
Fund, Inc.
Each Fund has entered into separate Distribution Agreements and
Distribution Plans with FAM Distributors, Inc. ("FAMD") and BlackRock
Distributors, Inc. and its affiliates ("BDI") (collectively, the "Distributor").
FAMD is a wholly owned subsidiary of Merrill Lynch Group, Inc. and BDI
is an affiliate of BlackRock, Inc.
Pursuant to the Distribution Plans adopted by the Funds in accordance
with Rule 12b-1 under the 1940 Act, the Funds pay the Distributor
ongoing service and distribution fees. The fees are accrued daily and
paid monthly at annual rates based upon the average daily net assets of
the shares as follows: |
| | | Service | | Distribution |
| | | Fee | | Fee |
| |
| |
|
| Investor A | | 0.25% | | — |
| Investor B | | 0.25% | | 0.75% |
| Investor C | | 0.25% | | 0.75%�� |
| Class R | | 0.25% | | 0.25% |
| |
| |
|
Pursuant to sub-agreements with the Distributor and broker-dealers,
including MLPF&S, the Distributor provides shareholder servicing and dis-
tribution services to the Funds. The ongoing service fee and/or distribu-
tion fee compensates the Distributor and each broker-dealer (including
MLPF&S) for providing shareholder servicing and/or distribution-related
services to Investor A, Investor B, Investor C and Class R shareholders.
For the year ended August 31, 2008, the Distributor earned underwriting
discounts and direct commissions and its affiliates earned dealer con-
cessions on sales of Investor A Shares as follows: |
| | | Investor A |
| |
|
| BlackRock Fundamental Growth Principal Protected Fund | | — |
| BlackRock Global Growth Fund, Inc | | $274,757 |
| |
|
For the year ended August 31, 2008, affiliates received contingent
deferred sales charges relating to transactions in Investor B and
Investor C Shares as follows: |
| | | Investor B | | Investor C |
| |
| |
|
| BlackRock Fundamental Growth Principal | | | | |
| Protected Fund | | $65,960 | | $ 192 |
| BlackRock Global Growth Fund, Inc | | $20,911 | | $19,326 |
| |
| |
|
In addition, affiliates received contingent deferred sales charges relating
to transactions subject to front-end sales charge waivers on Investor A
Shares as follows: |
| | | Investor A |
| |
|
| BlackRock Fundamental Growth Principal Protected Fund | | — |
| BlackRock Global Growth Fund, Inc | | $31,444 |
| |
|
The Trust, on behalf of BlackRock Fundamental Growth Principal
Protected Fund, has entered into a Financial Warranty Agreement
with Main Place Funding, LLC (the "Warranty Provider"). The Financial
Warranty Agreement is intended to ensure that on the Guarantee
Maturity Date, each shareholder of the Fund will be entitled to redeem
his or her shares for an amount no less than the initial value of that
shareholder's account (less expenses and sales charges not covered by
the Financial Warranty Agreement), provided that all dividends and distri-
butions received from the Fund have been reinvested and no shares |
Notes to Financial Statements (continued)
have been redeemed (the "Guaranteed Amount"). The Fund will pay to
the Warranty Provider, under the Financial Warranty Agreement, an annu-
al fee equal to 0.80% of the Fund's average daily net assets during the
Guarantee Period. If the value of the Fund's assets on the Guarantee
Maturity Date is insufficient to result in the value of each shareholder's
account being at least equal to the shareholder's Guaranteed Amount,
the Warranty Provider will pay the Fund an amount sufficient to ensure
that each shareholder's account can be redeemed for an amount equal
to his or her Guaranteed Amount.
In addition, MLPF&S received commissions on the execution of portfolio
security transactions for the Funds for the year ended August 31, 2008
as follows: |
| | | Commissions |
| |
|
| BlackRock Fundamental Growth Principal Protected Fund | | $ 13,558 |
| BlackRock Global Growth Fund, Inc | | $388,107 |
| |
|
PNC Global Investment Servicing (U.S.) Inc., formerly PFPC Inc., an indi-
rect, wholly owned subsidiary of PNC and an affiliate of the Advisor, is
the Funds’ transfer agent. Each class of the Funds bears the costs of
transfer agent fees associated with such respective classes. Transfer
agent fees borne by each class of the Funds are comprised of those
fees charged for all shareholder communications including mailing of
shareholder reports, dividend and distribution notices, and proxy materi-
als for shareholder meetings, as well as per account and per transaction
fees related to servicing and maintenance of shareholder accounts,
including the issuing, redeeming and transferring of shares of each class
of the Funds, 12b-1 fee calculation, check writing, anti-money launder-
ing services, and customer identification services.
Pursuant to written agreements, certain affiliates provide the Funds with
sub-accounting, recordkeeping, sub-transfer agency and other adminis-
trative services with respect to sub-accounts they service. For these
services, these affiliates receive an annual fee per shareholder account
which will vary depending on share class. For the year ended August 31,
2008, the Funds paid the following amounts in return for these services,
which are included in transfer agent fees in the accompanying
Statements of Operations: |
| | | Shareholder |
| | | Account Fees |
| |
|
| BlackRock Fundamental Growth Principal Protected Fund | | $79,772 |
| BlackRock Global Growth Fund, Inc | | $754,564 |
| |
|
The Funds may earn income on positive cash balances in demand
deposit accounts that are maintained by the transfer agent on behalf of
the Funds. For the year ended August 31, 2008, BlackRock Fundamental
Growth Principal Protected Fund earned $26,354 and BlackRock Global
Growth Fund, Inc. earned $808,577, which is included in income from
affiliates in the Statement of Operations.
The Advisor maintains a call center, which is responsible for providing
certain shareholder services to each Fund, such as responding to share-
holder inquiries and processing transactions based upon instructions
from shareholders with respect to the subscription and redemption of
each Funds’ shares. During the year ended August 31, 2008, the follow-
ing amounts have been accrued by the Funds to reimburse the Advisor
for costs incurred running the call center, which are a component of the
transfer agent fees in the accompanying Statements of Operations. |
| | | Call Center |
| BlackRock Fundamental Growth Principal Protected Fund | | Fees |
| |
|
| Institutional | | $ 46 |
| Investor A | | $ 111 |
| Investor B | | $1,229 |
| Investor C | | $ 760 |
| |
|
| |
| | | Call Center |
| BlackRock Global Growth Fund, Inc. | | Fees |
| |
|
| Institutional | | $ 6,256 |
| Investor A | | $15,503 |
| Investor B | | $ 2,995 |
| Investor C | | $ 4,144 |
| Class R | | $ 237 |
| |
|
Pursuant to the terms of the custody agreement, custodian fees may
be reduced by amounts calculated on uninvested cash balances
(“custodian credits”), which are on the Statements of Operations as
fees paid indirectly.
Certain officers and/or directors of the Funds are officers and/or direc-
tors of BlackRock, Inc. or its affiliates. The Funds reimbursed the Advisor
for compensation paid to the Funds’ Chief Compliance Officer.
3. Investments:
Purchases and sales of investments, excluding short-term securities, for
the year ended August 31, 2008 were as follows: |
| | | Purchases | | Sales |
| |
| |
|
| BlackRock Fundamental Growth Principal | | | | |
| Protected Fund | | $ 70,414,894 | | $ 89,701,113 |
| BlackRock Global Growth Fund, Inc | | $710,315,407 | | $706,178,202 |
| |
| |
|
Notes to Financial Statements (continued)
Transactions in options written for the year ended August 31, 2008 were
as follows:
BlackRock Fundamental Growth Principal Protected Fund
| | | | | Premiums |
| Call Options Written | | Contracts | | Received |
| |
| |
|
| Outstanding call options written, | | | | |
| beginning of year | | — | | — |
| Options written | | 596 | | $ 147,435 |
| Options closed | | (36) | | (17,172) |
| Options expired | | (560) | | (130,263) |
| | |
| |
|
| Outstanding call options written, | | | | |
| end of year | | — | | — |
| | |
| |
|
BlackRock Global Growth Fund, Inc.
| | | | | Premiums |
| Call Options Written | | Contracts | | Received |
| |
| |
|
| Outstanding call options written, | | | | |
| beginning of year | | — | | — |
| Options written | | 7,200 | | $ 1,795,724 |
| Options closed | | (7,200) | | (1,795,724) |
| Options expired | | — | | — |
| | |
| |
|
| Outstanding call options written, | | | | |
| end of year | | — | | — |
| | |
| |
|
4. Short-Term Borrowings:
The Trust, on behalf of BlackRock Fundamental Growth Principal
Protected Fund, and BlackRock Global Growth Fund, Inc., along with
certain other funds managed by the Advisor and its affiliates, are parties
to a $500,000,000 credit agreement with a group of lenders. The Funds
may borrow under the credit agreement to fund shareholder redemptions
and for other lawful purposes other than for leverage. The Funds may
borrow up to the maximum amount allowable under the Funds’ current
Prospectus and Statement of Additional Information, subject to various
other legal, regulatory or contractual limits. On November 21, 2007,
the credit agreement was renewed for one year under substantially the
same terms. The Funds pay a commitment fee of 0.06% per annum
based on each Fund’s pro rata share of the unused portion of the credit
agreement, which is included in miscellaneous in the Statements of
Operations. Amounts borrowed under the credit agreement bear interest
at a rate equal to, at each fund's election, the federal funds rate plus
0.35% or a base rate as defined in the credit agreement. The Funds
did not borrow under the credit agreement during the year ended
August 31, 2008.
5. Commitments:
At August 31, 2008, BlackRock Global Growth Fund, Inc. had entered
into foreign exchange contracts under which it had agreed to purchase
and sell various foreign currencies with approximate values of
$7,026,000 and $3,089,000, respectively.
6. Income Tax Information:
Reclassifications: Accounting principles generally accepted in the United
States of America require that certain components of net assets be
adjusted to reflect permanent differences between financial and tax
reporting. These reclassifications have no effect on net assets or on
net asset values per share. The following permanent differences as of
August 31, 2008 attributable to net operating losses, characterization
of expenses, foreign currency transactions and gains from the sale of
stock of passive foreign investment companies were reclassified to the
following accounts: |
| | | BlackRock | | |
| | | Fundamental | | BlackRock |
| | | Growth | | Global |
| | | Prinicipal | | Growth |
| | | Protected Fund | | Fund, Inc. |
| |
| |
|
| Decrease in paid-in capital | | $(489,200) | | — |
| Increase (decrease) in undistributed | | | | |
| net investment income | | 642,432 | | (404,906) |
| Increase (decrease) in accumulated | | | | |
| net realized gain (loss) | | (153,232) | | 404,906 |
| |
| |
|
| Notes to Financial Statements (continued) | | | | |
| |
| The tax character of distributions paid during the year ended August 31, 2008 was as follows: | | | | |
| |
| | | BlackRock | | BlackRock |
| | | Fundamental | | Global |
| | | Growth Principal | | Growth |
| | | Protected Fund | | Fund, Inc. |
| |
| |
|
| |
| Distributions paid from: | | | | |
| Ordinary income | | | | |
| 8/31/2008 | | — | | $ 4,041,943 |
| 8/31/2007 | | — | | 101,798 |
| Long-term capital gain | | | | |
| 8/31/2008 | | $ 5,587,326 | | — |
| 8/31/2007 | | 6,043,173 | | — |
| | |
| |
|
| Total distributions | | | | |
| 8/31/2008 | | $ 5,587,326 | | $ 4,041,943 |
| | |
| |
|
| 8/31/2007 | | $ 6,043,173 | | $ 101,798 |
| | |
| |
|
| |
| |
| As of August 31, 2008, the components of accumulated earnings/losses on a tax basis were as follows: | | | | |
| |
| | | BlackRock | | BlackRock |
| | | Fundamental | | Global |
| | | Growth Principal | | Growth |
| | | Protected Fund | | Fund, Inc. |
| |
| |
|
| |
| Undistributed long-term net capital gain | | $ 2,068,186 | | $ 3,845,887 |
| Capital loss carryforward | | — | | (299,166,213) |
| Net unrealized gains | | 5,190,540 | | 12,576,527 |
| | |
| |
|
| Total accumulated net earnings (losses) | | $ 7,258,726 | | $(282,743,799) |
| | |
| |
|
The difference between book-basis and tax-basis net unrealized gains is attributable primarily to the deferral of losses on wash sales, the realization
for tax purposes of unrealized gains (losses) on certain foreign currency contracts, the deferral of post-October currency losses for tax purposes, the
deferral of post-October losses on investments in passive foreign investment companies for tax purposes and the timing of income recognition on
partnership interests.
As of August 31, 2008, the Funds had capital loss carryforwards available to offset future realized capital gains through the indicated expiration dates: |
| | | BlackRock | | BlackRock |
| | | Fundamental | | Global |
| | | Growth Principal | | Growth |
| Expires August 31, | | Protected Fund | | Fund, Inc. |
| |
| |
|
| |
| 2009 | | — | | $ 3,964,136 |
| 2010 | | — | | 3,964,136 |
| 2011 | | — | | 291,237,941 |
| | |
| |
|
| Total | | — | | $ 299,166,213 |
| | |
| |
|
| Notes to Financial Statements (continued) | | | | | | | | | | |
| |
| 7. Capital Share Transactions: | | | | | | | | | | | | |
| Transactions in shares for each class were as follows: | | | | | | | | | | | | |
| | | Year Ended | | Year Ended |
| | | August 31, 2008 | | August 31, 2007 |
| | |
| |
| |
| |
|
| BlackRock Fundamental Growth Principal Protected Fund | | Shares | | Dollar Amount | | Shares | | Dollar Amount |
| |
| |
| |
| |
|
| Institutional | | | | | | | | | | | | |
| |
| |
| |
| |
| |
| |
|
| Shares issued to shareholders in reinvestment of distributions | | 35,237 | | $ 256,357 | | 26,309 | | $ 264,144 |
| Shares redeemed | | (125,512) | | | | (1,162,084) | | (159,103) | | | | (1,635,465) |
| | |
| |
| |
| |
| |
| |
|
| Net decrease | | (90,275) | | $ (905,727) | | (132,794) | | $ (1,371,321) |
| |
| |
| |
| |
|
| |
| Investor A | | | | | | | | | | | | |
| |
| |
| |
| |
| |
| |
|
| Shares converted | | — | | | | — | | 456,908* | | $ 4,738,138* |
| Shares issued to shareholders in reinvestment of distributions | | 27,308 | | $ 288,924 | | 38,340 | | | | 384,554 |
| | |
| |
| |
| |
| |
|
| Total issued | | 27,308 | | | | 288,924 | | 495,248 | | | | 5,122,692 |
| Shares redeemed | | (102,006) | | | | (1,048,030) | | (351,226) | | | | (3,610,282) |
| | |
| |
| |
| |
| |
| |
|
| Net increase (decrease) | | (74,698) | | $ (759,106) | | 144,022 | | $ 1,512,410 |
| |
| |
| |
| |
|
| |
| Investor B | | | | | | | | | | | | |
| |
| |
| |
| |
| |
| |
|
| Shares issued to shareholders in reinvestment of distributions | | 258,348 | | $ 2,673,897 | | 289,333 | | $ 2,864,401 |
| Shares redeemed or converted | | (963,784) | | | | (9,572,751) | | (2,084,282)* | | (21,168,467)* |
| | |
| |
| |
| |
| |
|
| Net decrease | | (705,436) | | $ (6,898,854) | | (1,794,949) | | $(18,304,066) |
| |
| |
| |
| |
|
| |
| Investor C | | | | | | | | | | | | |
| |
| |
| |
| |
| |
| |
|
| Shares issued to shareholders in reinvestment of distributions | | 186,552 | | $ 1,936,406 | | 208,109 | | $ 2,066,527 |
| Shares redeemed | | (617,522) | | | | (6,190,589) | | (1,080,561) | | (10,962,860) |
| | |
| |
| |
| |
| |
|
| Net decrease | | (430,970) | | $ (4,254,183) | | (872,452) | | $ (8,896,333) |
| | |
| |
| |
| |
|
| | * In September 2006, certain brokerages, including a wholly owned subsidiary of Merrill Lynch, entered into a remediation agreement with a regulatory organization,
which among other things, permitted certain shareholders of Investor B Shares to convert their shares into the Fund's Investor A Shares. |
| Notes to Financial Statements (concluded) | | | | | | | | |
| | | Year Ended | | Year Ended |
| | | August 31, 2008 | | August 31, 2007 |
| | |
| |
| |
|
| BlackRock Global Growth Fund, Inc. | | Shares | | Dollar Amount | | Shares | | Dollar Amount |
| |
| |
| |
| |
|
| Institutional | | | | | | | | | | |
| |
| |
| |
| |
| |
|
| Shares sold | | 8,160,187 | | $ 148,504,831 | | 9,376,324 | | $146,667,134 |
| Shares issued to shareholders in reinvestment of distributions | | 95,172 | | | | 1,809,694 | | 7,405 | | 94,456 |
| | |
| |
| |
| |
| |
|
| Total issued | | 8,255,359 | | 150,314,525 | | 9,383,729 | | 146,761,590 |
| Shares redeemed | | (11,668,964) | | (202,340,763) | | (3,662,626) | | (54,401,391) |
| | |
| |
| |
| |
|
| Net increase (decrease) | | (3,413,605) | | $ (52,026,238) | | 5,721,103 | | $ 92,360,199 |
| |
| |
| |
| |
|
| Investor A | | | | | | | | | | |
| |
| |
| |
| |
| |
|
| Shares sold and automatic conversion of shares | | 6,854,300 | | $ 120,596,124 | | 2,717,950 | | $ 40,004,152 |
| Shares issued to shareholders in reinvestment of dividends | | 69,508 | | | | 1,306,495 | | — | | — |
| | |
| |
| |
| |
| |
|
| Total issued | | 6,923,808 | | 121,902,619 | | 2,717,950 | | 40,004,152 |
| Shares redeemed | | (4,272,054) | | (73,273,053) | | (3,267,967) | | (46,973,516) |
| | |
| |
| |
| |
|
| Net increase (decrease) | | 2,651,754 | | $ 48,629,566 | | (550,017) | | $ (6,969,364) |
| |
| |
| |
| |
|
| Investor B | | | | | | | | | | |
| |
| |
| |
| |
| |
|
| Shares sold | | 559,983 | | $ 9,525,765 | | 395,665 | | $ 5,600,382 |
| Shares redeemed and automatic conversion of shares | | (1,685,782) | | (27,749,764) | | (2,551,060) | | (34,883,069) |
| | |
| |
| |
| |
|
| Net decrease | | (1,125,799) | | $ (18,223,999) | | (2,155,395) | | $(29,282,687) |
| |
| |
| |
| |
|
| Investor C | | | | | | | | | | |
| |
| |
| |
| |
| |
|
| Shares sold | | 2,840,215 | | $ 48,484,913 | | 759,034 | | $ 11,185,729 |
| Shares redeemed | | (1,115,071) | | (18,116,558) | | (923,246) | | (12,820,027) |
| | |
| |
| |
| |
|
| Net increase (decrease) | | 1,725,144 | | $ 30,368,358 | | (164,212) | | $ (1,634,298) |
| |
| |
| |
| |
|
| Class R | | | | | | | | | | |
| |
| |
| |
| |
| |
|
| Shares sold | | 945,516 | | $ 16,231,513 | | 206,721 | | $ 3,082,368 |
| Shares issued to shareholders in reinvestment of dividends | | 1,304 | | | | 23,918 | | — | | — |
| | |
| |
| |
| |
| |
|
| Total issued | | 946,820 | | | | 16,255,431 | | 206,721 | | 3,082,368 |
| Shares redeemed | | (186,348) | | | | (3,137,378) | | (84,723) | | (1,240,711) |
| | |
| |
| |
| |
| |
|
| Net increase | | 760,472 | | $ 13,118,053 | | 121,998 | | $ 1,841,657 |
| | |
| |
| |
| |
|
For BlackRock Global Growth Fund, Inc., there is a 2% redemption fee on shares redeemed or exchanged that have been held 30 days or less. The
redemption fees are collected and retained by the Fund for the benefit of the remaining shareholders. The redemption fees are recorded as a credit to
paid in capital.
8. Subsequent Events:
On September 15, 2008, Bank of America Corporation announced that it has agreed to acquire Merrill Lynch, one of the principal owners of BlackRock,
Inc. The purchase has been approved by the directors of both companies. Subject to shareholder and regulatory approvals, the transaction is expected
to close in the first quarter of 2009.
Effective October 1, 2008, BlackRock Investments, Inc., an affiliate of the Advisor, replaced FAM Distributors, Inc. and BlackRock Distributors, Inc. as the
sole distributor of the Funds. The service and distribution fees will not change as a result of this transaction. |
Report of Independent Registered Public Accounting Firm
To the Shareholders and Board of Directors/Trustees of BlackRock
Principal Protected Trust and BlackRock Global Growth Fund, Inc.:
We have audited the accompanying statements of assets and liabilities,
including the schedules of investments, of BlackRock Fundamental
Growth Principal Protected Fund, one of the series constituting BlackRock
Principal Protected Trust, and BlackRock Global Growth Fund, Inc. (collec-
tively, the “Funds”) as of August 31, 2008, and the related statements of
operations for the year then ended, the statements of changes in net
assets for each of the two years in the period then ended, and the finan-
cial highlights for each of the three years in the period then ended. These
financial statements and financial highlights are the responsibility of the
Funds’ management. Our responsibility is to express an opinion on these
financial statements and financial highlights based on our audits. The
financial highlights of the Funds for each of the two years in the period
ended August 31, 2005 were audited by other auditors whose reports,
dated October 14, 2005, expressed unqualified opinions on those
financial highlights.
We conducted our audits in accordance with the standards of the Public
Company Accounting Oversight Board (United States). Those standards
require that we plan and perform the audit to obtain reasonable assur-
ance about whether the financial statements and financial highlights are
free of material misstatement. The Funds were not required to have, nor
were we engaged to perform an audit of their internal control over finan-
cial reporting. Our audits included consideration of internal control over
financial reporting as a basis for designing audit procedures that are |
appropriate in the circumstances, but not for the purpose of expressing
an opinion on the effectiveness of the Funds’ internal control over finan-
cial reporting. Accordingly, we express no such opinion. An audit also
includes examining, on a test basis, evidence supporting the amounts
and disclosures in the financial statements, assessing the accounting
principles used and significant estimates made by management, as
well as evaluating the overall financial statement presentation. Our pro-
cedures include confirmation of the securities owned as of August 31,
2008, by correspondence with the custodians and brokers; where replies
were not received from brokers, we performed other auditing procedures.
We believe that our audits provide a reasonable basis for our opinion.
In our opinion, the financial statements and financial highlights referred
to above present fairly, in all material respects, the financial position of
BlackRock Fundamental Growth Principal Protected Fund of BlackRock
Principal Protected Trust and BlackRock Global Growth Fund, Inc. as of
August 31, 2008, the results of their operations for the year then ended,
and the changes in their net assets for each of the two years in the
period then ended, and the financial highlights for each of the three
years in the period then ended, in conformity with accounting principles
generally accepted in the United States of America.
Deloitte & Touche LLP |
Princeton, New Jersey
October 27, 2008 |
Important Tax Information
BlackRock Fundamental Growth Principal Protected Fund of BlackRock Principal Protected Trust distributed long-term capital gains of $0.749737
per share to shareholders of record on December 11, 2007.
The following information is provided with respect to the ordinary income distribution paid by BlackRock Global Growth Fund, Inc to shareholders
of record on October 22, 2007: |
| Qualified Dividend Income for Individuals | | 100%* |
| Dividends Qualifying for the Dividends Received Deduction for Corporations | | 21.75%* |
| Foreign Source Income | | 82.38%* |
| Foreign Taxes Paid Per Share | | $0.010479 |
| |
|
| |
| * Expressed as a percentage of the cash distribution grossed-up for foreign taxes. | | |
The foreign taxes paid represent taxes incurred by the Fund on income received by the Fund from foreign sources. Foreign taxes paid may be
included in taxable income with an offsetting deduction from gross income or may be taken as a credit for taxes paid to foreign governments.
You should consult your tax advisor regarding the appropriate treatment of foreign taxes paid. |
Disclosure of Investment Advisory Agreement and Subadvisory Agreement
The Board of Directors of BlackRock Global Growth Fund, Inc. and the
Board of Trustees of BlackRock Fundamental Growth Principal Protected
Fund, a series of BlackRock Principal Protected Trust (the “Trust”)
(collectively, the “Board,” the members of which are referred to as
“Directors”) met in April and June 2008 to consider the approval of
each of BlackRock Global Growth Fund, Inc.’s and BlackRock Fundamental
Growth Principal Protected Fund’s investment advisory agreement (col-
lectively, the “Advisory Agreement”) with BlackRock Advisors, LLC (the
“Advisor”), each fund’s investment advisor. For simplicity, BlackRock
Global Growth Fund, Inc., BlackRock Fundamental Growth Principal
Protected Fund and the Trust are referred to herein as the “Fund.” The
Board also considered the approval of each of the subadvisory agree-
ments (collectively, the “Subadvisory Agreement”) between the Advisor
and BlackRock Investment Management, LLC (the “Subadvisor”) with
respect to each Fund. The Advisor and the Subadvisor are referred to
herein as “BlackRock.” The Advisory Agreement and the Subadvisory
Agreement are referred to herein as the “Agreements.”
Activities and Composition of the Board
The Board of the Fund consists of fifteen individuals, twelve of whom
are not “interested persons” of the Fund as defined in the Investment
Company Act of 1940, as amended (the “1940 Act”) (the “Independent
Directors”). The Directors are responsible for the oversight of the opera-
tions of the Fund and perform the various duties imposed on the directors
of investment companies by the 1940 Act. The Independent Directors
have retained independent legal counsel to assist them in connection
with their duties. The Chairman of the Board is an Independent Director.
The Board established four standing committees: an Audit Committee, a
Governance and Nominating Committee, a Compliance Committee and
a Performance Oversight Committee, each of which is composed of, and
chaired by Independent Directors.
The Agreements
Upon the consummation of the combination of BlackRock’s investment
management business with Merrill Lynch & Co., Inc.’s investment man-
agement business, including Merrill Lynch Investment Managers, L. ., and
certain affiliates (the “Transaction”), the Fund entered into the Advisory
Agreement with an initial two-year term and the Advisor entered into the
Subadvisory Agreement with the Subadvisor with an initial two-year term.
Consistent with the 1940 Act, prior to the expiration of the Agreements’
respective initial two-year term, the Board is required to consider the
continuation of the Fund’s Agreements on an annual basis. In connec-
tion with this process, the Board assessed, among other things, the
nature, scope and quality of the services provided to the Fund by the
personnel of BlackRock and its affiliates, including investment manage-
ment, administrative services, shareholder services, oversight of fund
accounting and custody, marketing services and assistance in meeting
legal and regulatory requirements. The Board also received and |
assessed information regarding the services provided to the Fund
by certain unaffiliated service providers.
Throughout the year, the Board, acting directly and through its commit-
tees, considers at each of its meetings factors that are relevant to its
annual consideration of the renewal of the Fund’s Agreements, including
the services and support provided to the Fund and its shareholders.
Among the matters the Board considered were: (a) investment perform-
ance for one, three and five years, as applicable, against peer funds,
as well as senior management and portfolio managers’ analysis of the
reasons for underperformance, if applicable; (b) fees, including advisory,
administration, if applicable, and other fees paid to BlackRock and its
affiliates by the Fund, such as transfer agency fees and fees for market-
ing and distribution; (c) Fund operating expenses; (d) the resources
devoted to and compliance reports relating to the Fund’s investment
objective, policies and restrictions, (e) the Fund’s compliance with its
Code of Ethics and compliance policies and procedures; (f) the nature,
cost and character of non-investment management services provided by
BlackRock and its affiliates; (g) BlackRock’s and other service providers’
internal controls; (h) BlackRock’s implementation of the proxy voting
guidelines approved by the Board; (i) the use of brokerage commissions
and spread and execution quality; (j) valuation and liquidity procedures;
and (k) periodic overview of BlackRock’s business, including BlackRock’s
response to the increasing scale of its business.
Board Considerations in Approving the Agreements
The Approval Process: At an in-person meeting held on April 10, 2008,
the Board reviewed materials relating to its consideration of the Agree-
ments. At an in-person meeting held on June 5 – 6, 2008, the Fund’s
Board, including the Independent Directors, unanimously approved the
continuation of the Advisory Agreement between the Advisor and the
Fund for a one-year term ending June 30, 2009 and the Subadvisory
Agreement between the Advisor and BlackRock Investment Management,
LLC for a one-year term ending June 30, 2009. In considering the
approval of the Agreements, the Board received and discussed various
materials provided to it in advance of the April 10, 2008 meeting. As a
result of the discussions that occurred during the April 10, 2008 meet-
ing, the Board requested and BlackRock provided additional informa-
tion, as detailed below, in advance of the June 5 – 6, 2008 Board meet-
ing. The Board considered all factors it believed relevant with respect
to the Fund, including, among other factors: (a) the nature, extent and
quality of the services provided by BlackRock; (b) the investment per-
formance of the Fund and BlackRock portfolio management; (c) the
advisory fee and the cost of the services and profits to be realized by
BlackRock and certain affiliates from the relationship with the Fund;
(d) economies of scale; and (e) other factors. |
Disclosure of Investment Advisory Agreement and Subadvisory Agreement (continued)
Prior to the April 10, 2008 meeting, the Board requested and received
materials specifically relating to the Agreements. The Board is engaged
in an ongoing process with BlackRock to continuously review the nature
and scope of the information provided to better assist its deliberations.
These materials included (a) information independently compiled and
prepared by Lipper, Inc. (“Lipper”) on Fund fees and expenses, and the
investment performance of the Fund as compared with a peer group of
funds as determined by Lipper (“Peers”); (b) information on the prof-
itability of the Agreements to BlackRock and certain affiliates, including
their other relationships with the Fund, and a discussion of fall-out bene-
fits; (c) a general analysis provided by BlackRock concerning investment
advisory fees charged to other clients, such as institutional and closed-
end funds, under similar investment mandates, as well as the perform-
ance of such other clients; (d) a report on economies of scale; (e) sales
and redemption data regarding the Fund’s shares; and (f) an internal
comparison of management fees classified by Lipper, if applicable. At
the April 10, 2008 meeting, the Board requested and subsequently
received from BlackRock (i) a comprehensive analysis of total expenses
on a fund-by-fund basis; (ii) further analysis of investment performance;
(iii) further data regarding Fund profitability, Fund size and Fund fee
levels; and (iv) additional information on sales and redemptions.
The Board also considered other matters it deemed important to the
approval process, such as payments made to BlackRock or its affiliates
relating to the distribution of Fund shares, services related to the valua-
tion and pricing of Fund portfolio holdings, and direct and indirect bene-
fits to BlackRock and its affiliates from their relationship with the Fund.
The Board did not identify any particular information as controlling,
and each Director may have attributed different weights to the various
items considered.
A. Nature, Extent and Quality of the Services: The Board, including the
Independent Directors, reviewed the nature, extent and quality of services
provided by BlackRock, including the investment advisory services and
the resulting performance of the Fund. Throughout the year, the Board
compared Fund performance to the performance of a comparable
group of mutual funds as classified by Lipper and the performance of
at least one relevant index or combination of indices. The Board met
with BlackRock’s senior management personnel responsible for invest-
ment operations, including the senior investment officers. The Board
also reviewed the materials provided by the Fund’s portfolio manage-
ment team discussing Fund performance and the Fund’s investment
objective, strategies and outlook.
The Board considered, among other factors, the number, education and
experience of BlackRock’s investment personnel generally and the Fund’s
portfolio management team, BlackRock’s portfolio trading capabilities,
BlackRock’s use of technology, BlackRock’s commitment to compliance
and BlackRock’s approach to training and retaining portfolio managers |
and other research, advisory and management personnel. The Board
also reviewed BlackRock’s compensation structure with respect to the
Fund’s portfolio management team and BlackRock’s ability to attract
and retain high-quality talent.
In addition to advisory services, the Board considered the quality of
the administrative and non-investment advisory services provided to the
Fund. BlackRock and its affiliates provide the Fund with certain adminis-
trative, transfer agency, shareholder and other services (in addition to any
such services provided to the Fund by third parties) and officers and
other personnel as are necessary for the operations of the Fund. In addi-
tion to investment advisory services, BlackRock and its affiliates provide
the Fund with other services, including (i) preparing disclosure docu-
ments, such as the prospectus, the statement of additional information
and shareholder reports; (ii) assisting with daily accounting and pricing;
(iii) overseeing and coordinating the activities of other service providers;
(iv) organizing Board meetings and preparing the materials for such
Board meetings; (v) providing legal and compliance support; and
(vi) performing other administrative functions necessary for the operation
of the Fund, such as tax reporting and fulfilling regulatory filing require-
ments. The Board reviewed the structure and duties of BlackRock’s fund
administration, accounting, legal and compliance departments.
B. The Investment Performance of the Fund and BlackRock: The Board,
including the Independent Directors, also reviewed and considered the
performance history of the Fund. In preparation for the April 10, 2008
meeting, the Board was provided with reports, independently prepared
by Lipper, which included a comprehensive analysis of the Fund’s per-
formance. The Board also reviewed a narrative and statistical analysis
of the Lipper data that was prepared by BlackRock, which analyzed vari-
ous factors that affect Lipper’s rankings. In connection with its review,
the Board received and reviewed information regarding the investment
performance of the Fund as compared to a representative group of
similar funds as determined by Lipper and to all funds in the Fund’s
applicable Lipper category. The Board was provided with a description
of the methodology used by Lipper to select peer funds. The Board regu-
larly reviews the performance of the Fund throughout the year. The Board
attaches more importance to performance over relatively long periods of
time, typically three to five years.
BlackRock Global Growth Fund, Inc. ranked in the first quartile on a net
basis against its Lipper peer universe for each of the one-, three- and
five-year periods ended December 31, 2007, respectively.
BlackRock Fundamental Growth Principal Protected Fund ranked in the
first, fourth and fourth quartiles on a net basis against its Lipper peer
universe for the one-, three- and five-year periods ended December 31,
2007, respectively. The Board discussed BlackRock Fundamental Growth
Principal Protected Fund’s disappointing performance with BlackRock. |
Disclosure of Investment Advisory Agreement and Subadvisory Agreement (continued)
It was noted that BlackRock Fundamental Growth Principal Protected
Fund’s expenses for the insurance fee (0.80%) detracts from the
Fund’s net performance relative to its peer universe. The BlackRock
Fundamental Growth Principal Protected Fund’s Peers are predominantly
balanced funds, which do not incur an insurance fee similar to principal
protected funds, such as the Fund. The Board discussed the processes
and the resources dedicated to the management of the BlackRock
Fundamental Growth Principal Protected Fund with BlackRock’s manage-
ment and will continue its ongoing dialogue with BlackRock on the
BlackRock Fundamental Growth Principal Protected Fund’s performance.
C. Consideration of the Advisory Fees and the Cost of the Services
and Profits to be Realized by BlackRock and its Affiliates from the
Relationship with the Fund: The Board, including the Independent
Directors, reviewed the Fund’s contractual advisory fee rates compared
with the other funds in its Lipper category. It also compared the Fund’s
total expenses to those of other comparable funds. The Board consid-
ered the services provided and the fees charged by BlackRock to other
types of clients with similar investment mandates, including separately
managed institutional accounts.
The Board received and reviewed statements relating to BlackRock’s
financial condition and profitability with respect to the services it provided
the Fund. The Board was also provided with a profitability analysis that
detailed the revenues earned and the expenses incurred by BlackRock
and certain affiliates that provide services to the Fund. The Board
reviewed BlackRock’s profitability with respect to the Fund and each
fund the Board currently oversees for the year ended December 31,
2007 compared to aggregated profitability data provided for the year
ended December 31, 2005.
In addition, the Board considered the cost of the services provided to
the Fund by BlackRock, and BlackRock’s and its affiliates’ profits relating
to the management and distribution of the Fund and the other funds
advised by BlackRock and its affiliates. As part of its analysis, the Board
reviewed BlackRock’s methodology in allocating its costs to the manage-
ment of the Fund and concluded that there was a reasonable basis for
the allocation. The Board also considered whether BlackRock has the
financial resources necessary to attract and retain high quality invest-
ment management personnel to perform its obligations under the
Agreements and to continue to provide the high quality of services
that are expected by the Board. |
The Board took into account that the BlackRock Global Growth Fund,
Inc. has an advisory fee arrangement that includes breakpoints that
adjust the fee rate downward as the size of the Fund increases, thereby
allowing shareholders the potential to participate in economies of scale.
The Board noted that BlackRock has agreed to contractually cap the
total annual operating expenses, excluding certain expenses, of one
or more share classes of BlackRock Fundamental Growth Principal
Protected Fund, at certain levels. The Board observed that those expense
caps benefited shareholders by keeping total fees down even in the
absence of breakpoints.
D. Economies of Scale: The Board, including the Independent Directors,
considered the extent to which economies of scale might be realized as
the assets of the Fund increase and whether there should be changes in
the advisory fee rate or structure in order to enable the Fund to partici-
pate in these economies of scale. The Board, including the Independent
Directors, considered whether the shareholders would benefit from
economies of scale and whether there was potential for future realization
of economies with respect to the Fund. The Board considered that the
funds in the BlackRock fund complex share common resources and,
as a result, an increase in the overall size of the complex could permit
each fund to incur lower expenses than it would otherwise as stand-
alone entities. The Board also considered the anticipated efficiencies in
the processes of BlackRock’s overall operations as it continues to add
personnel and commit capital to expand the scale of operations. The
Board found, based on its review of comparable funds, that the Fund’s
management fee is appropriate in light of the scale of the Fund.
E. Other Factors: The Board also took into account other ancillary or
“fall-out” benefits that BlackRock may derive from its relationship with
the Fund, both tangible and intangible, such as BlackRock’s ability to
leverage its investment professionals that manage other portfolios, an
increase in BlackRock’s profile in the investment advisory community,
and the engagement of BlackRock’s affiliates as service providers to the
Fund, including for administrative, transfer agency and distribution serv-
ices. The Board also noted that BlackRock may use third party research
obtained by soft dollars generated by transactions in the Fund to assist
itself in managing all or a number of its other client accounts.
In connection with its consideration of the Agreements, the Board also
received information regarding BlackRock’s brokerage and soft dollar
practices. The Board received reports from BlackRock which included
information on brokerage commissions and trade execution practices
throughout the year. |
Disclosure of Investment Advisory Agreement and Subadvisory Agreement (concluded)
Conclusion
The Board approved the continuation of the Advisory Agreement between
the Advisor and the Fund for a one-year term ending June 30, 2009
and the Subadvisory Agreement between the Advisor and BlackRock
Investment Management, LLC for a one-year term ending June 30, 2009.
Based upon their evaluation of all these factors in their totality, the
Board, including the Independent Directors, was satisfied that the terms
of the Agreements were fair and reasonable and in the best interest
of the Fund and the Fund’s shareholders. In arriving at a decision to
approve the Agreements, the Board did not identify any single factor or
group of factors as all-important or controlling, but considered all factors
together. The Independent Directors were also assisted by the advice of
independent legal counsel in making this determination. The contractual
fee arrangements for the Fund reflect the result of several years of review
by the Directors and predecessor Directors, and discussions between the
Directors (and predecessor Directors) and BlackRock. Certain aspects of
the arrangements may be the subject of more attention in some years
than in others, and the Directors’ conclusions may be based in part on
their consideration of these arrangements in prior years. |
| Officers and Directors/Trustees | | | | |
| |
| | | | | | | | | Number of | | |
| | | | | Length of | | | | BlackRock- | | |
| | | Position(s) | | Time Served | | | | Advised Funds | | |
| Name, Address | | Held with | | as a Director/ | | | | and Portfolios | | Public |
| and Year of Birth | | Fund | | Trustee2 | | Principal Occupation(s) During Past 5 Years | | Overseen | | Directorships |
| |
| |
| |
| |
| |
|
| |
| Non-Interested Directors/Trustees1 | | | | | | | | |
| |
| |
| |
| |
|
| Robert M. Hernandez | | Chairman of the | | Since | | Formerly Director, Vice Chairman and Chief Financial Officer of USX | | 37 Funds | | ACE Limited |
| 40 East 52nd Street | | Board, Director/ | | 2007 | | Corporation (energy and steel business) from 1991 to 2001. | | 104 Portfolios | | (insurance company); |
| New York, NY 10022 | | Trustee and | | | | | | | | Eastman Chemical |
| 1944 | | Member of the | | | | | | | | Company (chemical); |
| | | Audit Committee | | | | | | | | RTI International |
| | | | | | | | | | | Metals, Inc. (metals); |
| | | | | | | | | | | TYCO Electronics |
| | | | | | | | | | | (electronics) |
| |
| |
| |
| |
| |
|
| |
| Fred G. Weiss | | Vice Chairman | | Since | | Managing Director, FGW Associates (consulting and investment | | 37 Funds | | Watson |
| 40 East 52nd Street | | of the Board, | | 19983 | | company) since 1997; Director, Michael J. Fox Foundation for | | 104 Portfolios | | Pharmaceutical Inc. |
| New York, NY 10022 | | Chairman of the | | and | | Parkinson’s Research since 2000; Formerly Director of BTG | | | | |
| 1941 | | Audit Committee | | 20074 | | International Plc (a global technology commercialization company) | | | | |
| | | and Director/ | | | | from 2001 to 2007. | | | | |
| | | Trustree | | | | | | | | |
| |
| |
| |
| |
| |
|
| |
| James H. Bodurtha | | Director/Trustee | | Since | | Director, The China Business Group, Inc. (consulting firm) since 1996 | | 37 Funds | | None |
| 40 East 52nd Street | | | | 2007 | | and formerly Executive Vice President thereof from 1996 to 2003; | | 104 Portfolios | | |
| New York, NY 10022 | | | | | | Chairman of the Board, Berkshire Holding Corporation since 1980. | | | | |
| 1944 | | | | | | | | | | |
| |
| |
| |
| |
| |
|
| Bruce R. Bond | | Director/Trustee | | Since | | Formerly Trustee and Member of the Governance Committee, State | | 37 Funds | | None |
| 40 East 52nd Street | | | | 2007 | | Street Research Mutual Funds from 1997 to 2005; Formerly Board | | 104 Portfolios | | |
| New York, NY 10022 | | | | | | Member of Governance, Audit and Finance Committee, Avaya Inc. | | | | |
| 1946 | | | | | | (computer equipment) from 2003 to 2007. | | | | |
| |
| |
| |
| |
| |
|
| Donald W. Burton | | Director/Trustee | | Since | | Managing General Partner, The Burton Partnership, LP (an investment | | 37 Funds | | Knology, Inc. (tele- |
| 40 East 52nd Street | | | | 20023 | | partnership) since 1979; Managing General Partner, The South Atlantic | | 104 Portfolios | | communications); |
| New York, NY 10022 | | | | and | | Venture Funds since 1983; Member of the Investment Advisory Council | | | | Capital Southwest |
| 1944 | | | | 20074 | | of the Florida State Board of Administration from 2001 to 2007. | | | | (financial) |
| |
| |
| |
| |
| |
|
| Honorable | | Director/Trustee | | Since | | Partner and Head of International Practice, Covington and Burling | | 37 Funds | | UPS Corporation |
| Stuart E. Eizenstat | | | | 2007 | | (law firm) since 2001; International Advisory Board Member, The Coca | | 104 Portfolios | | (delivery service) |
| 40 East 52nd Street | | | | | | Cola Company since 2002; Advisory Board Member BT Americas | | | | |
| New York, NY 10022 | | | | | | (telecommunications) since 2004; Member of the Board of Directors, | | | | |
| 1943 | | | | | | Chicago Climate Exchange (environmental) since 2006; Member of the | | | | |
| | | | | | | International Advisory Board GML (energy) since 2003. | | | | |
| |
| |
| |
| |
| |
|
| |
| Kenneth A. Froot | | Director/Trustee | | Since | | Professor, Harvard University since 1992. | | 37 Funds | | None |
| 40 East 52nd Street | | | | 2007 | | | | 104 Portfolios | | |
| New York, NY 10022 | | | | | | | | | | |
| 1957 | | | | | | | | | | |
| |
| |
| |
| |
| |
|
| John F. O’Brien | | Director/Trustee | | Since | | Trustee, Woods Hole Oceanographic Institute since 2003; Formerly | | 37 Funds | | Cabot Corporation |
| 40 East 52nd Street | | | | 20053 | | Director, Allmerica Financial Corporation from 1995 to 2003; Formerly | | 104 Portfolios | | (chemicals); LKQ |
| New York, NY 10022 | | | | and | | Director, ABIOMED from 1989 to 2006; Formerly Director, Ameresco, | | | | Corporation (auto |
| 1943 | | | | 20074 | | Inc. (energy solutions company) from 2006 to 2007. | | | | parts manufacturing); |
| | | | | | | | | | | TJX Companies, Inc. |
| | | | | | | | | | | (retailer) |
| |
| |
| |
| |
| |
|
| |
| Roberta Cooper Ramo | | Director/Trustee | | Since | | Shareholder, Modrall, Sperling, Roehl, Harris & Sisk, .A. (law firm) | | 37 Funds | | None |
| 40 East 52nd Street | | | | 2007 | | since 1993; Chairman of the Board, Cooper’s Inc., (retail) since 2000; | | 104 Portfolios | | |
| New York, NY 10022 | | | | | | Director of ECMC Group (service provider to students, schools and | | | | |
| 1942 | | | | | | lenders) since 2001; President Elect, The American Law Institute, | | | | |
| | | | | | | (non-profit), 2007; Formerly President, American Bar Association from | | | | |
| | | | | | | 1995 to 1996. | | | | |
| |
| |
| | | |
| |
|
| Officers and Directors/Trustees (continued) | | | | |
| |
| | | | | | | | | Number of | | |
| | | | | Length of | | | | BlackRock- | | |
| | | Position(s) | | Time Served | | | | Advised Funds | | |
| Name, Address | | Held with | | as a Director/ | | | | and Portfolios | | Public |
| and Year of Birth | | Fund/Trust | | Trustee2 | | Principal Occupation(s) During Past 5 Years | | Overseen | | Directorships |
| |
| |
| |
| |
| |
|
| |
| Non-Interested Directors/Trustees1 (concluded) | | | | | | |
| |
| |
| |
|
| |
| Jean Margo Reid | | Director/Trustee | | Since | | Self-employed consultant since 2001; Director and Secretary, SCB, | | 37 Funds | | None |
| 40 East 52nd Street | | | | 2007 | | Inc. (holding company) since 1998; Director and Secretary, SCB | | 104 Portfolios | | |
| New York, NY 10022 | | | | | | Partners, Inc. (holding company) since 2000; Director, Covenant | | | | |
| 1945 | | | | | | House (non-profit) from 2001 to 2004. | | | | |
| |
| |
| |
| |
| |
|
| David H. Walsh | | Director/Trustee | | Since | | Director, National Museum of Wildlife Art since 2007; Director, | | 37 Funds | | None |
| 40 East 52nd Street | | | | 20033 | | Ruckleshaus Institute and Haub School of Natural Resources at the | | 104 Portfolios | | |
| New York, NY 10022 | | | | and | | University of Wyoming since 2006; Director, The American Museum | | | | |
| 1941 | | | | 20074 | | of Fly Fishing since 1997; Formerly Consultant with Putnam Investments | | | | |
| | | | | | | from 1993 to 2003; Formerly Director, The National Audubon Society | | | | |
| | | | | | | from 1998 to 2005. | | | | |
| |
| |
| |
| |
| |
|
| |
| Richard R. West | | Director/Trustee | | Since | | Dean Emeritus, New York University’s Leonard N. Stern School of | | 37 Funds | | Bowne & Co., Inc. |
| 40 East 52nd Street | | and Member | | 2007 | | Business Administration since 1995. | | 104 Portfolios | | (financial printers); |
| New York, NY 10022 | | of the Audit | | | | | | | | Vornado Realty Trust |
| 1938 | | Committee | | | | | | | | (real estate |
| | | | | | | | | | | company); |
| | | | | | | | | | | Alexander’s Inc. |
| | | | | | | | | | | (real estate |
| | | | | | | | | | | company) |
| | |
| |
| |
| |
| | |
1 Directors/Trustees serve until their resignation, removal or death, or until December 31 of the year in which they turn 72.
2 Following the combination of Merrill Lynch Investment Managers, L. . (“MLIM”) and BlackRock, Inc. (“BlackRock”) in September 2006, the various legacy MLIM and legacy BlackRock Fund boards were realigned and consolidated into three new Fund boards in 2007. As a result, although the chart shows certain directors/trustees as joining the Fund’s board in 2007, each director/trustee first became a member of the board of directors/trustees of other legacy MLIM or legacy BlackRock Funds as follows: James H. Bodurtha since 1995; Bruce R. Bond since 2005; Donald W. Burton since 2002; Stuart E. Eizenstat since 2001; Kenneth A. Froot since 2005; Robert M. Hernandez since 1996; John F. O’Brien since 2004; Roberta Cooper Ramo since 2000; Jean Margo Reid since 2004; David H. Walsh since 2003; Fred G. Weiss since 1998; and Rich ard R. West since 1978.
3 Length of time served as a Director for BlackRock Global Growth Fund, Inc.
4 Length of time served as a Trustee for BlackRock Fundamental Growth Principal Protected Fund.
| Officers and Directors/Trustees (continued) | | | | |
| |
| | | | | | | | | Number of | | |
| | | | | Length of | | | | BlackRock- | | |
| | | Position(s) | | Time Served | | | | Advised Funds | | |
| Name, Address | | Held with | | as a Director/ | | | | and Portfolios | | Public |
| and Year of Birth | | Fund | | Trustee | | Principal Occupation(s) During Past 5 Years | | Overseen | | Directorships |
| |
| |
| |
| |
| |
|
| |
| Interested Directors/Trustees1 | | | | | | | | |
| |
| |
| |
| |
|
| |
| Richard S. Davis | | Director/Trustee | | Since | | Managing Director, BlackRock, Inc. since 2005; Formerly Chief | | 185 Funds | | None |
| 40 East 52nd Street | | | | 2007 | | Executive Officer, State Street Research & Management Company | | 295 Portfolios | | |
| New York, NY 10022 | | | | | | from 2000 to 2005; Formerly Chairman of the Board of Trustees, | | | | |
| 1945 | | | | | | State Street Research Mutual Funds from 2000 to 2005; Formerly | | | | |
| Chairman, SSR Realty from 2000 to 2004. |
|
| |
| Laurence D. Fink | | Director/Trustee | | Since | | Chairman and Chief Executive Officer of BlackRock, Inc. since its | | 37 Funds | | None |
| 40 East 52nd Street | | | | 2007 | | formation in 1998 and of BlackRock, Inc.’s predecessor entities since | | 104 Portfolios | | |
| New York, NY 10022 | | | | | | 1988 and Chairman of the Executive and Management Committees; | | | | |
| 1952 | | | | | | Formerly Managing Director, The First Boston Corporation, Member of | | | | |
| | | | | | | its Management Committee, Co-head of its Taxable Fixed Income | | | | |
| | | | | | | Division and Head of its Mortgage and Real Estate Products Group; | | | | |
| | | | | | | Chairman of the Board of several of BlackRock’s alternative investment | | | | |
| | | | | | | vehicles; Director of several of BlackRock’s offshore funds; Member of | | | | |
| | | | | | | the Board of Trustees of New York University, Chair of the Financial Affairs | | | | |
| | | | | | | Committee and a member of the Executive Committee, the Ad Hoc | | | | |
| | | | | | | Committee on Board Governance, and the Committee on Trustees; Co- | | | | |
| | | | | | | Chairman of the NYU Hospitals Center Board of Trustees, Chairman of | | | | |
| | | | | | | the Development/Trustee Stewardship Committee and Chairman of the | | | | |
| | | | | | | Finance Committee; Trustee, The Boys’ Club of New York. | | | | |
| |
| |
| |
| |
| |
|
| |
| Henry Gabbay | | Director/Trustee | | Since | | Consultant, BlackRock, Inc. since 2007; Formerly Managing Director, | | 184 Funds | | None |
| 40 East 52nd Street | | | | 2007 | | BlackRock, Inc. from 1989 to 2007; Formerly Chief Administrative | | 294 Portfolios | | |
| New York, NY 10022 | | | | | | Officer, BlackRock Advisors, LLC from 1998 to 2007; Formerly President | | | | |
| 1947 | | | | | | of BlackRock Funds and BlackRock Bond Allocation Target Shares from | | | | |
| | | | | | | 2005 to 2007 and Treasurer of certain closed-end funds in the | | | | |
| BlackRock fund complex from 1989 to 2006. |
1 Messrs. Davis, Fink and Gabbay are all “interested persons,” as defined in the Investment Company Act of 1940, of the Fund based on their positions with BlackRock, Inc. and its affiliates. Directors/Trustees serve until their resignation, removal or death, or until December 31 of the year in which they turn 72.
| Officers and Directors/Trustees (concluded) | | | | |
| |
| |
| | | Position(s) | | | | | | | | |
| Name, Address | | Held with | | Length of | | | | | | |
| and Year of Birth | | Fund | | Time Served | | Principal Occupation(s) During Past 5 Years | | |
| |
| |
| |
| |
|
| Fund Officers1 | | | | | | | | | | |
| |
| |
| |
| |
| |
|
| Donald C. Burke | | Fund | | Since | | Managing Director of BlackRock, Inc. since 2006; Formerly Managing Director of Merrill Lynch Investment |
| 40 East 52nd Street | | President | | 2007 | | Managers, L .P.(“MLIM”) and Fund Asset Management, L .P.(“FAM”) in 2006; First Vice President thereof from |
| New York, NY 10022 | | and Chief | | | | 1997 to 2005; Treasurer thereof from 1999 to 2006 and Vice President thereof from 1990 to 1997. |
| 1960 | | Executive | | | | | | | | |
| | | Officer | | | | | | | | |
| |
| |
| |
| |
| |
|
| Anne F. Ackerley | | Vice | | Since | | Managing Director of BlackRock, Inc. since 2000; Chief Operating Officer of BlackRock’s U.S. Retail Group since |
| 40 East 52nd Street | | President | | 2007 | | 2006; Head of BlackRock’s Mutual Fund Group from 2000 to 2006; Merrill Lynch & Co., Inc. from 1984 to 1986 |
| New York, NY 10022 | | | | | | and from 1988 to 2000, most recently as First Vice President and Operating Officer of the Mergers and |
| 1962 | | | | | | Acquisitions Group. | | | | |
| |
| |
| |
| |
| |
|
| Neal J. Andrews | | Chief | | Since | | Managing Director of BlackRock, Inc. since 2006; Formerly Senior Vice President and Line of Business Head |
| 40 East 52nd Street | | Financial | | 2007 | | of Fund Accounting and Administration at PNC Global Investment Servicing (U.S.) Inc. (formerly PFPC Inc.) |
| New York, NY 10022 | | Officer | | | | from 1992 to 2006. | | | | |
| 1966 | | | | | | | | | | |
| |
| |
| |
| |
| |
|
| Jay M. Fife | | Treasurer | | Since | | Managing Director of BlackRock, Inc. since 2007 and Director in 2006; Formerly Assistant Treasurer of the |
| 40 East 52nd Street | | | | 2007 | | MLIM/FAM advised funds from 2005 to 2006; Director of MLIM Fund Services Group from 2001 to 2006. |
| New York, NY 10022 | | | | | | | | | | |
| 1970 | | | | | | | | | | |
| |
| |
| |
| |
| |
|
| Brian P. Kindelan | | Chief | | Since | | Chief Compliance Officer of the BlackRock-advised Funds since 2007; Anti-Money Laundering Officer of the |
| 40 East 52nd Street | | Compliance | | 2007 | | BlackRock-advised Funds since 2007; Managing Director and Senior Counsel of BlackRock, Inc. since 2005; |
| New York, NY 10022 | | Officer | | | | Director and Senior Counsel of BlackRock Advisors, Inc. from 2001 to 2004 and Vice President and Senior |
| 1959 | | | | | | Counsel thereof from 1998 to 2000; Formerly Senior Counsel of The PNC Bank Corp. from 1995 to 1998. |
| |
| |
| |
|
| Howard B. Surloff | | Secretary | | Since | | Managing Director of BlackRock, Inc. and General Counsel of U.S. Funds at BlackRock, Inc. since 2006; Formerly |
| 40 East 52nd Street | | | | 2007 | | General Counsel (U.S.) of Goldman Sachs Asset Management, LP from 1993 to 2006. |
| New York, NY 10022 | | | | | | | | | | |
| 1965 | | | | | | | | | | |
| | |
| |
| |
| |
| |
|
| | | 1 Officers of the Fund serve at the pleasure of the Board of Directors/Trustees. | | |
| | |
| |
|
| | | Further information about the Funds’ Officers and Directors/Trustees is available in each Fund’s Statement of Additional Information, which can |
| | | be obtained without charge by calling (800) 441-7762. | | | | |
| |
| |
| |
|
| |
| For BlackRock Fundamental | | For BlackRock Global Growth | | For Both Funds: | | |
| Growth Principal Protected Fund: | | Fund, Inc.: | | | | Transfer Agent | | Independent Registered |
| Custodian | | | | Custodian | | | | PNC Global Investment | | Public Accounting Firm |
| Brown Brothers | | | | State Street Bank and Trust Company | | Servicing (U.S.) Inc. | | Deloitte & Touche LLP |
| Harriman & Co. | | | | Boston, MA 02101 | | Wilmington, DE 19809 | | Princeton, NJ 08540 |
| Boston, MA 02109 | | | | | | | | | | |
| | | | | | | | | Accounting Agent | | Legal Counsel |
| | | | | | | | | State Street Bank and Trust | | Willkie Farr & Gallagher LLP |
| | | | | | | | | Company | | New York, NY 10019 |
| | | | | | | | | Princeton, NJ 08540 | | |
| | Additional Information
BlackRock Privacy Principles
BlackRock is committed to maintaining the privacy of its current and
former fund investors and individual clients (collectively, “Clients”) and
to safeguarding their non-public personal information. The following infor-
mation is provided to help you understand what personal information
BlackRock collects, how we protect that information and why in certain
cases we share such information with select parties.
If you are located in a jurisdiction where specific laws, rules or regulations
require BlackRock to provide you with additional or different privacy-related
rights beyond what is set forth below, then BlackRock will comply with
those specific laws, rules or regulations.
BlackRock obtains or verifies personal non-public information from and
about you from different sources, including the following: (i) information
we receive from you or, if applicable, your financial intermediary, on appli-
cations, forms or other documents; (ii) information about your trans-
actions with us, our affiliates, or others; (iii) information we receive from
a consumer reporting agency; and (iv) from visits to our websites. |
| | BlackRock does not sell or disclose to non-affiliated third parties any non-
public personal information about its Clients, except as permitted by law
or as is necessary to respond to regulatory requests or to service Client
accounts. These non-affiliated third parties are required to protect the
confidentiality and security of this information and to use it only for its
intended purpose.
We may share information with our affiliates to service your account or to
provide you with information about other BlackRock products or services
that may be of interest to you. In addition, BlackRock restricts access
to non-public personal information about its Clients to those BlackRock
employees with a legitimate business need for the information. BlackRock
maintains physical, electronic and procedural safeguards that are designed
to protect the non-public personal information of its Clients, including proce-
dures relating to the proper storage and disposal of such information. |
| | Availability of Additional Information |
Electronic copies of most financial reports and prospectuses are available
on the Funds’ website or shareholders can sign up for e-mail notifications
of quarterly statements, annual and semi-annual reports and prospectuses
by enrolling in the Funds’ electronic delivery program.
To enroll:
Shareholders Who Hold Accounts with Investment Advisors, Banks or
Brokerages:
Please contact your financial advisor. Please note that not all investment
advisors, banks or brokerages may offer this service.
Shareholders Who Hold Accounts Directly with BlackRock:
1) Access the BlackRock website at
http://www.blackrock.com/edelivery
2) Click on the applicable link and follow the steps to sign up
3) Log into your account |
Householding
The Funds will mail only one copy of shareholder documents, including
prospectuses, annual and semi-annual reports and proxy statements, to
shareholders with multiple accounts at the same address. This practice is
commonly called “householding” and it is intended to reduce expenses
and eliminate duplicate mailings of shareholder documents. Mailings of
your shareholder documents may be householded indefinitely unless you
instruct us otherwise. If you do not want the mailing of these documents
to be combined with those for other members of your household, please
contact the Funds at (800) 441-7762.
Availability of Proxy Voting Policies and Procedures
A description of the policies and procedures that the Funds use to
determine how to vote proxies relating to portfolio securities is available
(1) without charge, upon request, by calling toll-free (800) 441-7762;
(2) at www.blackrock.com; and (3) on the Securities and Exchange
Commission’s (the “SEC”) website at http://www.sec.gov. |
Availability of Additional Information (concluded)
Availability of Proxy Voting Record
Information about how the Funds votes proxies relating to securities
held in the Funds’ portfolio during the most recent 12-month period
ended June 30 is available upon request and without charge (1) at
www.blackrock.com or by calling (800) 441-7762 and (2) on the
SEC’s website at http://www.sec.gov. |
Availability of Quarterly Portfolio Schedule
The Funds file their complete schedule of portfolio holdings with the SEC
for the first and third quarters of each fiscal year on Form N-Q. The Funds’
Forms N-Q are available on the SEC’s website at http://www.sec.gov
and may also be reviewed and copied at the SEC’s Public Reference
Room in Washington, D.C. Information on the operation of the Public
Reference Room may be obtained by calling (800) SEC-0330. The Funds’
Forms N-Q may also be obtained upon request and without charge by
calling (800) 441-7762. |
Shareholder Privileges
Account Information
Call us at (800) 441-7762 from 8:00 AM to 6:00 PM EST to get infor-
mation about your account balances, recent transactions and share
prices. You can also reach us on the Web at www.blackrock.com/funds.
Automatic Investment Plans
Investor Class shareholders who want to invest regularly can arrange to
have $50 or more automatically deducted from their checking or savings
account and invested in any of the BlackRock funds. |
Systematic Withdrawal Plans
Investor Class shareholders can establish a systematic withdrawal plan
and receive periodic payments of $50 or more from their BlackRock
funds, as long as their account is at least $10,000.
Retirement Plans
Shareholders may make investments in conjunction with Traditional,
Rollover, Roth, Coverdell, Simple IRAs, SEP IRAs and 403(b) Plans. |
A World-Class Mutual Fund Family
BlackRock offers a diverse lineup of open-end mutual funds crossing all investment styles and managed by experts in equity, fixed income and tax-exempt investing.
| Equity Funds | | | | |
| |
| |
|
| |
| BlackRock All-Cap Global Resources Portfolio | | BlackRock Global Opportunities Portfolio | | BlackRock Mid Cap Value Opportunities Fund |
| BlackRock Asset Allocation Portfolio† | | BlackRock Global Resources Portfolio | | BlackRock Natural Resources Trust |
| BlackRock Aurora Portfolio | | BlackRock Global SmallCap Fund | | BlackRock Pacific Fund |
| BlackRock Balanced Capital Fund† | | BlackRock Health Sciences Opportunities Portfolio* | | BlackRock Science & Technology |
| BlackRock Basic Value Fund | | BlackRock Healthcare Fund | | Opportunities Portfolio |
| BlackRock Capital Appreciation Portfolio | | BlackRock Index Equity Portfolio* | | BlackRock Small Cap Core Equity Portfolio |
| BlackRock Equity Dividend Fund | | BlackRock International Fund | | BlackRock Small Cap Growth Equity Portfolio |
| BlackRock EuroFund | | BlackRock International Index Fund | | BlackRock Small Cap Growth Fund II |
| BlackRock Focus Growth Fund | | BlackRock International Opportunities Portfolio | | BlackRock Small Cap Index Fund |
| BlackRock Focus Value Fund | | BlackRock International Value Fund | | BlackRock Small Cap Value Equity Portfolio* |
| BlackRock Fundamental Growth Fund | | BlackRock Large Cap Core Fund | | BlackRock Small/Mid-Cap Growth Portfolio |
| BlackRock Global Allocation Fund† | | BlackRock Large Cap Growth Fund | | BlackRock S&P 500 Index Fund |
| BlackRock Global Dynamic Equity Fund | | BlackRock Large Cap Value Fund | | BlackRock Technology Fund |
| BlackRock Global Emerging Markets Fund | | BlackRock Latin America Fund | | BlackRock U.S. Opportunities Portfolio |
| BlackRock Global Financial Services Fund | | BlackRock Mid-Cap Growth Equity Portfolio | | BlackRock Utilities and Telecommunications Fund |
| BlackRock Global Growth Fund | | BlackRock Mid-Cap Value Equity Portfolio | | BlackRock Value Opportunities Fund |
| |
| |
|
| |
| Fixed Income Funds | | | | |
| |
| |
|
| |
| BlackRock Emerging Market Debt Portfolio | | BlackRock Inflation Protected Bond Portfolio | | BlackRock Short-Term Bond Fund |
| BlackRock Enhanced Income Portfolio | | BlackRock Intermediate Bond Portfolio II | | BlackRock Strategic Income Portfolio |
| BlackRock GNMA Portfolio | | BlackRock Intermediate Government | | BlackRock Total Return Fund |
| BlackRock Government Income Portfolio | | Bond Portfolio | | BlackRock Total Return Portfolio II |
| BlackRock High Income Fund | | BlackRock International Bond Portfolio | | BlackRock World Income Fund |
| BlackRock High Yield Bond Portfolio | | BlackRock Long Duration Bond Portfolio | | |
| BlackRock Income Portfolio | | BlackRock Low Duration Bond Portfolio | | |
| BlackRock Income Builder Portfolio | | BlackRock Managed Income Portfolio | | |
| |
| |
|
| |
| Municipal Bond Funds | | | | |
| |
| |
|
| BlackRock AMT-Free Municipal Bond Portfolio | | BlackRock Intermediate Municipal Fund | | BlackRock New York Municipal Bond Fund |
| BlackRock California Insured Municipal Bond Fund | | BlackRock Kentucky Municipal Bond Portfolio | | BlackRock Ohio Municipal Bond Portfolio |
| BlackRock Delaware Municipal Bond Portfolio | | BlackRock Municipal Insured Fund | | BlackRock Pennsylvania Municipal Bond Fund |
| BlackRock Florida Municipal Bond Fund | | BlackRock National Municipal Fund | | BlackRock Short-Term Municipal Fund |
| BlackRock High Yield Municipal Fund | | BlackRock New Jersey Municipal Bond Fund | | |
| |
| |
|
| |
| Target Risk & Target Date Funds | | | | |
| |
| |
|
| |
| BlackRock Prepared Portfolios | | BlackRock Lifecycle Prepared Portfolios | | |
| Conservative Prepared Portfolio | | Prepared Portfolio 2010 | | Prepared Portfolio 2030 |
| Moderate Prepared Portfolio | | Prepared Portfolio 2015 | | Prepared Portfolio 2035 |
| Growth Prepared Portfolio | | Prepared Portfolio 2020 | | Prepared Portfolio 2040 |
| Aggressive Growth Prepared Portfolio | | Prepared Portfolio 2025 | | Prepared Portfolio 2045 |
| | | | | Prepared Portfolio 2050 |
| * See the prospectus for information on specific limitations on investments in the fund. | | |
| † Mixed asset fund. | | | | |
BlackRock mutual funds are currently distributed by BlackRock Investments, Inc. You should consider the investment objectives, risks, charges and expenses of the funds under consideration carefully before investing. Each fund’s prospectus contains this and other information and is available at www.blackrock.com or by calling (800) 882-0052 or from your financial advisor. The prospectus should be read carefully before investing.

These reports are not authorized for use as an offer of sale or
a solicitation of an offer to buy shares of the Funds unless
accompanied or preceded by the Funds’ current prospectus.
Past performance results shown in this report should not be
considered a representation of future performance. Investment
returns and principal value of shares will fluctuate so that shares,
when redeemed, may be worth more or less than their original
cost. Statements and other information herein are as dated and
are subject to change. Please see BlackRock Global Growth
Fund, Inc.’s prospectus for a description of risks associated
with global investments.
BlackRock Fundamental Growth Principal Protected Fund
of BlackRock Principal Protected Trust
BlackRock Global Growth Fund, Inc.
100 Bellevue Parkway
Wilmington, DE 19809 |

#FGPPGG-8/08
Item 2 – Code of Ethics – The registrant (or the “Fund”) has adopted a code of ethics, as of the end
of the period covered by this report, applicable to the registrant’s principal executive officer,
principal financial officer and principal accounting officer, or persons performing similar
functions. During the period covered by this report, there have been no amendments to or
waivers granted under the code of ethics. A copy of the code of ethics is available without
charge at www.blackrock.com.
Item 3 – Audit Committee Financial Expert – The registrant’s board of directors or trustees, as
applicable (the “board of directors”) has determined that (i) the registrant has the following
audit committee financial experts serving on its audit committee and (ii) each audit
committee financial expert is independent:
Donald W. Burton (not reappointed to the Audit Committee, effective November 1, 2007)
Robert M. Hernandez (term began, effective November 1, 2007)
John F. O’Brien (not reappointed to the Audit Committee, effective November 1, 2007)
David H. Walsh (not reappointed to the Audit Committee, effective November 1, 2007)
Fred G. Weiss
Richard R. West (term began, effective November 1, 2007)
Under applicable securities laws, a person determined to be an audit committee financial
expert will not be deemed an “expert” for any purpose, including without limitation for the
purposes of Section 11 of the Securities Act of 1933, as a result of being designated or
identified as an audit committee financial expert. The designation or identification as an
audit committee financial expert does not impose on such person any duties, obligations, or
liabilities greater than the duties, obligations, and liabilities imposed on such person as a
member of the audit committee and board of directors in the absence of such designation or
identification.
Item 4 – Principal Accountant Fees and Services |
| | | (a) Audit Fees | | (b) Audit-Related Fees1 | | (c) Tax Fees2 | | (d) All Other Fees3 |
| |
| |
| |
| |
|
| | | Current | | Previous | | Current | | Previous | | Current | | Previous | | Current | | Previous |
| | | Fiscal Year | | Fiscal Year | | Fiscal Year | | Fiscal Year | | Fiscal Year | | Fiscal Year | | Fiscal Year | | Fiscal Year |
| Entity Name | | End | | End | | End | | End | | End | | End | | End | | End |
| |
| |
| |
| |
| |
| |
| |
| |
|
| |
| |
| BlackRock Global | | $35,300 | | $37,800 | | $0 | | $0 | | $6,100 | | $6,100 | | $1,049 | | $1,042 |
| Growth Fund, Inc. | | | | | | | | | | | | | | | | |
| |
| |
| |
| |
| |
| |
| |
| |
|
| | 1 The nature of the services include assurance and related services reasonably related to the performance of the audit of
financial statements not included in Audit Fees.
2 The nature of the services include tax compliance, tax advice and tax planning.
3 The nature of the services include a review of compliance procedures and attestation thereto.
(e)(1) Audit Committee Pre-Approval Policies and Procedures:
The registrant’s audit committee (the “Committee”) has adopted policies and
procedures with regard to the pre-approval of services. Audit, audit-related and tax
compliance services provided to the registrant on an annual basis require specific pre-
approval by the Committee. The Committee also must approve other non-audit services
provided to the registrant and those non-audit services provided to the registrant’s affiliated
service providers that relate directly to the operations and the financial reporting of the
registrant. Certain of these non-audit services that the Committee believes are a) consistent
with the SEC’s auditor independence rules and b) routine and recurring services that will
not impair the independence of the independent accountants may be approved by the
Committee without consideration on a specific case-by-case basis (“general pre-approval”).
The term of any general pre-approval is 12 months from the date of the pre-approval, unless |
the Committee provides for a different period. Tax or other non-audit services provided to
the registrant which have a direct impact on the operation or financial reporting of the
registrant will only be deemed pre-approved provided that any individual project does not
exceed $10,000 attributable to the registrant or $50,000 for all of the registrants the
Committee oversees. For this purpose, multiple projects will be aggregated to determine if
they exceed the previously mentioned cost levels.
Any proposed services exceeding the pre-approved cost levels will require specific
pre-approval by the Committee, as will any other services not subject to general pre-
approval (e.g., unanticipated but permissible services). The Committee is informed of each
service approved subject to general pre-approval at the next regularly scheduled in-person
board meeting. At this meeting, an analysis of such services is presented to the Committee
for ratification. The Committee may delegate to one or more of its members the authority to
approve the provision of and fees for any specific engagement of permitted non-audit
services, including services exceeding pre-approved cost levels.
(e)(2) None of the services described in each of Items 4(b) through (d) were approved by
the audit committee pursuant to paragraph (c)(7)(i)(C) of Rule 2-01 of Regulation S-X.
(f) Not Applicable
(g) Affiliates’ Aggregate Non-Audit Fees:
| | | Current Fiscal Year | | Previous Fiscal Year |
| Entity Name | | End | | End |
| |
| |
|
| |
| BlackRock Global Growth | | | | |
| Fund, Inc. | | $294,649 | | $291,642 |
| | | | |
(h) The registrant’s audit committee has considered and determined that the provision of
non-audit services that were rendered to the registrant’s investment adviser (not including
any non-affiliated sub-adviser whose role is primarily portfolio management and is
subcontracted with or overseen by the registrant’s investment adviser), and any entity
controlling, controlled by, or under common control with the investment adviser that
provides ongoing services to the registrant that were not pre-approved pursuant to paragraph
(c)(7)(ii) of Rule 2-01 of Regulation S-X is compatible with maintaining the principal
accountant’s independence.
Regulation S-X Rule 2-01(c)(7)(ii) – $287,500, 0%
Item 5 – Audit Committee of Listed Registrants – Not Applicable
Item 6 – Investments
(a) The registrant’s Schedule of Investments is included as part of the Report to
Stockholders filed under Item 1 of this form.
(b) Not Applicable due to no such divestments during the semi-annual period covered since
the previous Form N-CSR filing.
Item 7 – Disclosure of Proxy Voting Policies and Procedures for Closed-End Management
Investment Companies – Not Applicable
Item 8 – Portfolio Managers of Closed-End Management Investment Companies – Not Applicable
Item 9 – Purchases of Equity Securities by Closed-End Management Investment Company and
Affiliated Purchasers – Not Applicable
Item 10 – Submission of Matters to a Vote of Security Holders – The registrant’s Nominating and
Governance Committee will consider nominees to the board of directors recommended by
shareholders when a vacancy becomes available. Shareholders who wish to recommend a
nominee should send nominations that include biographical information and set forth the
qualifications of the proposed nominee to the registrant’s Secretary. There have been no
material changes to these procedures.
Item 11 – Controls and Procedures
11(a) – The registrant’s principal executive and principal financial officers or persons performing
similar functions have concluded that the registrant’s disclosure controls and procedures (as
defined in Rule 30a-3(c) under the Investment Company Act of 1940, as amended (the
“1940 Act”)) are effective as of a date within 90 days of the filing of this report based on the
evaluation of these controls and procedures required by Rule 30a-3(b) under the 1940 Act
and Rule 15d-15(b) under the Securities Exchange Act of 1934, as amended.
11(b) – There were no changes in the registrant’s internal control over financial reporting (as
defined in Rule 30a-3(d) under the 1940 Act) that occurred during the second fiscal quarter
of the period covered by this report that have materially affected, or are reasonably likely to
materially affect, the registrant’s internal control over financial reporting.
Item 12 – Exhibits attached hereto
12(a)(1) – Code of Ethics – See Item 2
12(a)(2) – Certifications – Attached hereto
12(a)(3) – Not Applicable
12(b) – Certifications – Attached hereto |
Pursuant to the requirements of the Securities Exchange Act of 1934 and the Investment
Company Act of 1940, the registrant has duly caused this report to be signed on its behalf by
the undersigned, thereunto duly authorized.
BlackRock Global Growth Fund, Inc.
By: /s/ Donald C. Burke
Donald C. Burke
Chief Executive Officer of
BlackRock Global Growth Fund, Inc.
Date: October 20, 2008
Pursuant to the requirements of the Securities Exchange Act of 1934 and the Investment
Company Act of 1940, this report has been signed below by the following persons on behalf
of the registrant and in the capacities and on the dates indicated.
By: /s/ Donald C. Burke
Donald C. Burke
Chief Executive Officer (principal executive officer) of
BlackRock Global Growth Fund, Inc.
Date: October 20, 2008
By: Neal J. Andrews
Neal J. Andrews
Chief Financial Officer (principal financial officer) of
BlackRock Global Growth Fund, Inc.
Date: October 20, 2008 |