 April 16, 2009 Investment Banking Presentation Prepared For The Special Committee of the Board of Directors of Logility, Inc. VRA Partners, LLC is a Member FINRA/SIPC. Exhibit (a)(4) |
 2 Preface The information contained herein was prepared by VRA Partners, LLC (“VRA”) in connection with our engagement to advise the Special Committee (the “Special Committee”) of the Board of Directors of Logility, Inc. (“Logility” or the “Company”) with respect to the announcement of a cash tender offer by American Software, Inc. (“Prospective Acquiror”) pursuant to a press release dated March 18, 2009 in which the Prospective Acquiror announced its intention to acquire all of the outstanding shares of Logility’s common stock not already owned by the Prospective Acquiror at a price of $5.10 per share in cash (the “Proposed Acquisition”), and, if appropriate, to render an opinion to the Special Committee with respect to the fairness, from a financial point of view, to the Company’s shareholders other than American Software, Inc. and any of its affiliates, of the consideration to be received in the Proposed Acquisition. This information and our analyses are not intended to be, nor should be, relied upon by any other party. Any disclosure of the contents of this document to third parties by the Special Committee requires VRA’s written consent. This document was prepared utilizing information provided by Logility and American Software, Inc. and obtained from certain other publicly available sources. VRA has relied without independent verification upon the accuracy and completeness of the financial and other information discussed with or reviewed by us for purposes of our analyses except where we have actual knowledge as to the inaccuracy of incompleteness of such information. With respect to the financial forecasts of Logility provided to or discussed with us, we have assumed, without independent verification or investigation, that such forecasts have been reasonably prepared on bases reflecting the best currently available information, estimates and judgments of the management of Logility as to the future financial performance of the Company, and we express no opinion with respect to such forecasts or the assumptions on which the forecasts are based. VRA has not conducted a physical inspection of the properties and facilities of the Company and has not made any evaluations or appraisals of the assets or liabilities (including, without limitation, any potential environmental liabilities), contingent or otherwise, of the Company. VRA’s analyses must be considered as a whole. Selecting portions of our analyses, without considering all analyses, would create an incomplete view. Individual estimates of value contained on our analyses are not necessarily indicative of actual value, which may be significantly more or less favorable than as set forth therein. Estimates of the financial value of reference companies and their securities do not purport to be appraisals or necessarily reflect the actual values of such companies or their securities. Because such estimates are inherently subject to uncertainty, VRA does not assume responsibility for their accuracy. Our analyses are necessarily based upon market, economic and other conditions as they exist on, and can be evaluated as of, the date hereof. It should be understood that, although subsequent developments may affect these analyses, VRA does not have any obligation to update or revise its analyses. |
 3 Section Contents I. Transaction Overview II. Overview of Logility III. Logility Financial Information IV. Logility Stock Performance and Trading Information V. Valuation A. Valuation Methodology B. Reference Public Company Analysis C. Precedent Merger and Acquisition Transaction Analysis D. Premiums Paid Analysis E. Discounted Cash Flow Analysis F. Valuation Summary Appendices A. Reference Public Company Analysis – Business Descriptions B. Premiums Paid Analysis Table of Contents |
 4 On March 18, 2009, American Software, Inc. (“ASI” or the “Prospective Acquiror”) publicly announced that it intends to purchase up to all the outstanding common stock of Logility, Inc. (“Logility” or the “Company”) not currently owned by ASI at a price per share of $5.10 (the “Proposed Acquisition”) in cash through a tender offer. ASI is currently the majority shareholder of Logility, controlling approximately 11,300,000 shares, or 87.9%, of the common shares outstanding of Logility. If ASI is able to acquire all of the outstanding common stock currently not owned by ASI at the proposed price of $5.10 per share, ASI would acquire 1,560,145 common shares and 126,865 net in-the-money options representing total consideration of $8,603,753. The Proposed Acquisition purchase price of $5.10 per share implies the following equity value and enterprise value for the Company: Transaction Overview Summary (1) As of March 5, 2009. (2) Based on offer price of $5.10 per share. Common Stock Shares Outstanding (1) 12,860,145 Vested "In-the-Money" Options Outstanding, Net of Exercise Price (2) 126,865 Common Stock Shares Outstanding 12,987,010 Price Per Share $5.10 Implied Equity Value $66,233,753 Plus: Debt as of 01/31/2009 0 Less: Cash and Investments as of 01/31/2009 47,309,000 Implied Enterprise Value $18,924,753 |
 5 Logility currently has 607,500 options outstanding, including 535,650 vested and 71,800 unvested options: Transaction Overview Options Outstanding Vested Options Incremental Vested Aggregate Exercise Net Value of Options Common Share Equivalent Exercise Price Range Options Proceeds at $5.10/share at $5.10/share $1.69-$5.10 413,400 $1,461,326 $647,014 126,865 $5.11-$7.00 12,050 $71,630 0 0 $7.01-$9.00 81,200 $640,694 0 0 $9.01-$11.00 20,000 $200,360 0 0 $11.01-$16.25 9,000 $123,120 0 0 Total 535,650 $2,497,130 $647,014 126,865 Unvested Options Incremental Unvested Aggregate Exercise Net Value of Options Common Share Equivalent Exercise Price Range Options Proceeds at $5.10/share at $5.10/share $1.69-$5.10 0 $0 $0 0 $5.11-$7.00 0 $0 0 0 $7.01-$9.00 67,800 $553,506 0 0 $9.01-$11.00 4,000 $43,840 0 0 $11.01-$16.25 0 $0 0 0 Total 71,800 $597,346 $0 0 Total Vested and 607,450 $3,094,476 $647,014 126,865 Unvested |
 6 Transaction Overview Transaction Structure and Summary Analysis ($ in thousands) Note: Assumes announcement date of March 18, 2009. (1) Average closing price for relevant number of days including and preceding March 18, 2009. (2) Based on 12,860,145 shares outstanding as of 03/05/2009 plus 126,865 shares from the exercise of in-the-money vested stock options. (3) Excludes excess cash and investments of $47,309,000 as of 01/31/2009. Proposed Acquisition Current Price Per Share Offer Price Per Share As of 04/15/2009 $5.10 $5.13 '% Premium (Discount) to Closing Share Price of $5.00 on 03/18/2009 2.0% 2.6% % Premium (Discount) to Average Closing Price: (1) 360 Day (15.9%) (15.5%) 180 Day 3.5% 4.1% 90 Day 11.4% 12.1% 60 Day 10.9% 11.5% 30 Day 11.5% 12.2% 15 Day 11.6% 12.3% '% Premium (Discount) to 52-Week High ($9.05 on 04/21/2008) (43.6%) (43.3%) '% Premium (Discount) to 52-Week Low ($3.89 on 03/12/2009) 31.1% 31.9% Market Value (2) $66,234 $66,623 Enterprise Value (3) $18,925 $19,314 |
 7 Transaction Overview Transaction Structure and Summary Analysis Proposed Acquisition Current Price Per Share Offer Price Per Share As of 04/15/2009 $5.10 $5.13 Enterprise Value to: LTM Total Revenue 0.45 x 0.46 x Fiscal 2009 Projected Total Revenue 0.46 0.47 Calendar 2009 Projected Total Revenue 0.47 0.47 Fiscal 2010 Projected Total Revenue 0.46 0.47 LTM Maintenance Revenue 0.81 x 0.83 x Fiscal 2009 Projected Maintenance Revenue 0.82 0.84 Calendar 2009 Projected Maintenance Revenue 0.82 0.84 Fiscal 2010 Projected Maintenance Revenue 0.82 0.83 LTM Maintenance Gross Margin 1.04 x 1.06 x Fiscal 2009 Projected Maintenance Gross Margin 1.04 1.06 Calendar 2009 Projected Maintenance Gross Margin 1.04 1.06 Fiscal 2010 Projected Maintenance Gross Margin 1.04 1.06 LTM Adjusted EBITDA 2.0 x 2.0 x Fiscal 2009 Projected Adjusted EBITDA 2.0 2.0 Calendar 2009 Projected Adjusted EBITDA 2.1 2.1 Fiscal 2010 Projected Adjusted EBITDA 2.1 2.2 LTM Adjusted EBIT 2.1 x 2.1 x Fiscal 2009 Projected Adjusted EBIT 2.1 2.1 Calendar 2009 Projected Adjusted EBIT 2.2 2.3 Fiscal 2010 Projected Adjusted EBIT 2.4 2.4 Equity Value to: LTM Adjusted Net Income 10.7 x 10.8 x Fiscal 2009 Projected Adjusted Net Income 11.1 11.1 Calendar 2009 Projected Adjusted Net Income 11.2 11.2 Fiscal 2010 Projected Adjusted Net Income 11.4 11.5 Tangible Book Value as of 01/31/2009 1.48 x 1.49 x Note: Fiscal represents the year ending April 30. Calendar year represents the 12 months ending January 31. Note: Adjustments include stock based compensation and amortization of acquisition-related intangibles. Note: Forward multiples based on management projections provided April 3, 2009. |
 8 Overview of Logility Company Overview Global provider of collaborative supply chain software that optimizes production, distribution, and inventory management between trading partners. Sells two complementary product lines to approximately 1,250 customers worldwide: Focuses on distribution-intensive industries (retail, consumer goods, soft goods, service parts). According to management, competitive differentiators include: Quality of products and domain expertise Quicker implementation relative to competitors Quality of customer service Demand Management Voyager Customer typically has more than $1 billion in sales Approximately 350 active customers Average sale of $300k for license Direct sales channel – gross margins of 75% Prolonged sales cycle –management-level decision Competitive market – pricing pressure Customer typically has less than $1 billion in sales Approximately 900 active customers Average sale of $30k for license Indirect sales channel – gross margins of 50% Shorter sales cycle – operations-level decision Limited competition – prices have been increasing |
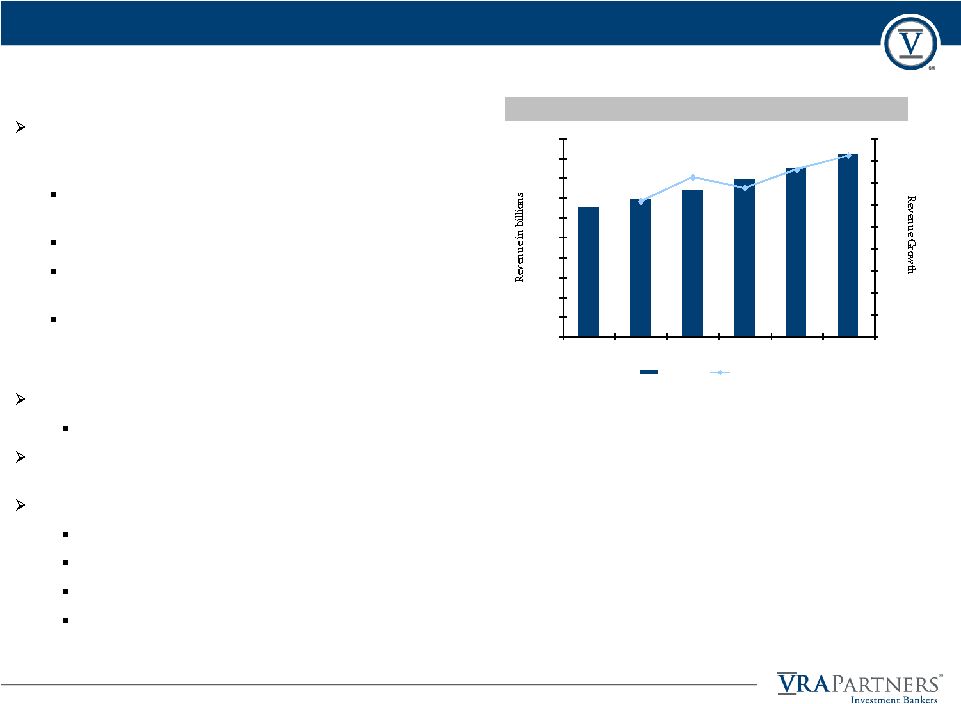
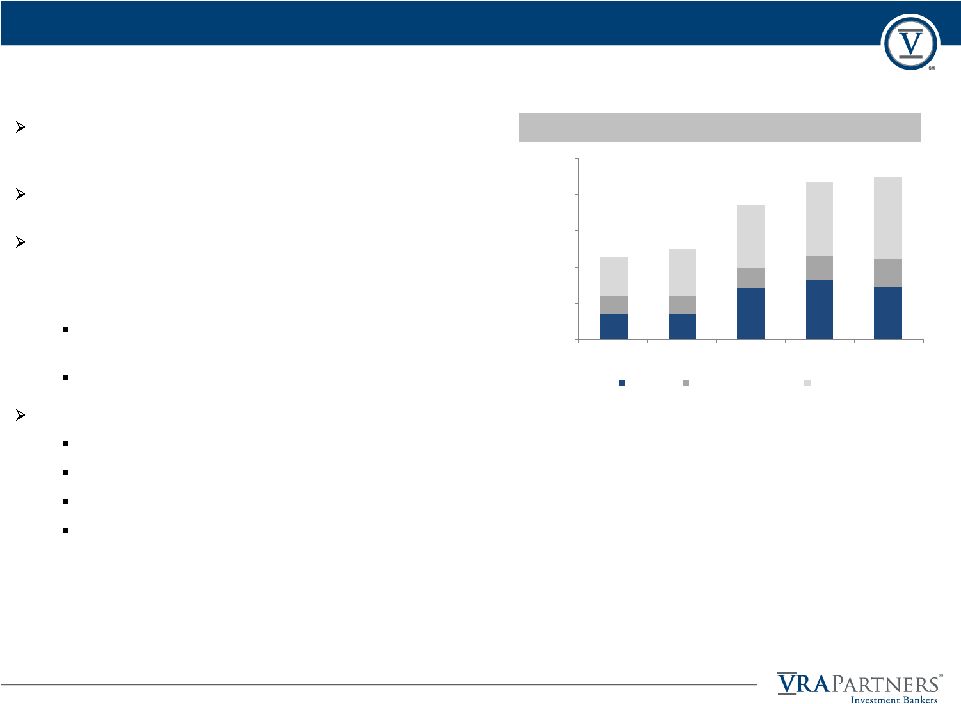 9 Overview of Logility Company Performance During the last five years, Logility has grown revenue at a compounded annual growth rate of 18.4%; maintenance and license revenues have grown at a CAGR of approximately 20%. In early 2008, growth slowed due to economic conditions and management anticipates flat growth in Fiscal 2009 and 2010. However, management, as well as industry observers, believe uncertain economic times can also prompt companies to purchase supply chain management software to reduce inventory risk and costs. Preliminary signs of recovery through strong Q3 results and recent growth in the sales pipeline DMI is modestly cyclical Revenue Growth by Type $0 $10,000 $20,000 $30,000 $40,000 $50,000 2004 2005 2006 2007 2008 License Services and other Maintenance According to management, growth opportunities include: “Fashion Forecasting” – new module providing a blind forecasting solution to apparel customers New versions of both Voyager and DMI soon to be released Further penetration of chemical and oil/gas industry verticals – potential acquisition opportunities Enter the service parts optimization market ($ in thousands) |
 10 Overview of Logility Relationship with ASI Logility is currently 87.9% owned by ASI. ASI financial reporting includes Logility. Logility and ASI Comparison ($ in thousands) Logility ASI Share Price as of 04/15/2009 $5.13 $6.09 Market Capitalization $66,234 $153,962 Debt as of 01/31/2009 $0 $0 Cash and Investments as of 01/31/2009 $47,309 $70,321 Enterprise Value $18,925 $83,641 Financial Data: LTM Revenue $42,392 $80,673 LTM Adjusted EBITDA $9,685 $9,352 LTM Adjusted EBIT $9,178 $7,831 LTM Adjusted Net Earnings $6,189 $3,483 Trading Multiples: EV/LTM Revenue 0.45x 1.04x EV/LTM EBITDA 2.0x 8.9x EV/LTM EBIT 2.1x 10.7x LTM P/E Ratio 10.7x 43.7x % of 52-Week High 56.4% 85.6% Three Month Average Trading Volume 3,240 66,660 Stock Price Change Since Announcement Date 2.6% 35.6% Dividends Per Share $0.00 $0.36 |
 11 Overview of Logility ASI Pro Forma for Logility Acquisition ($ in thousands, except per share data) Fiscal Year Ended or Ending April 30, 2007 2008 2009 Actual Actual Estimate Adjusted EBITDA $12,745 $11,945 Plus: Logility public company expenses 448 472 462 Pro Forma EBITDA $13,193 $12,417 $462 Adjusted EBIT $11,204 $10,441 Plus: Logility public company expenses 448 472 462 Pro Forma EBIT $11,652 $10,913 $462 Adjusted Diluted Earnings Per Share $0.36 $0.30 Adjusted Net Income $9,169 $8,047 Plus: Logility public company expenses (tax-affected) 281 305 462 Plus: Elimination of Minority Interest (tax-affected) 486 488 713 Pro Forma Net Income $9,935 $8,840 $1,174 Pro Forma Diluted Earnings Per Share $0.39 $0.33 Increase in Diluted Earnings Per Share $0.03 $0.03 |
 0 10,000 20,000 30,000 40,000 50,000 60,000 70,000 80,000 90,000 $2.00 $3.00 $4.00 $5.00 $6.00 $7.00 $8.00 $9.00 $10.00 Logility Trading Volume Logility Share Price American Software Share Price 12 Overview of Logility Logility and ASI Stock Price Performance Price Volume Over the Twelve Months Preceding March 18, 2009 (the “Announcement Date”) 4/18/2008: LGTY High - $9.00 12/23/2008: LGTY Low - $4.00 6/17/2008: AMSWA High - $6.68 12/01/2008: AMSWA Low - $2.92 |
 40 60 80 100 120 140 160 Logility Share Price American Software Share Price 13 Overview of Logility Logility and ASI Stock Price Performance Index Price Performance Over the Twelve Months Preceding the Announcement Date |
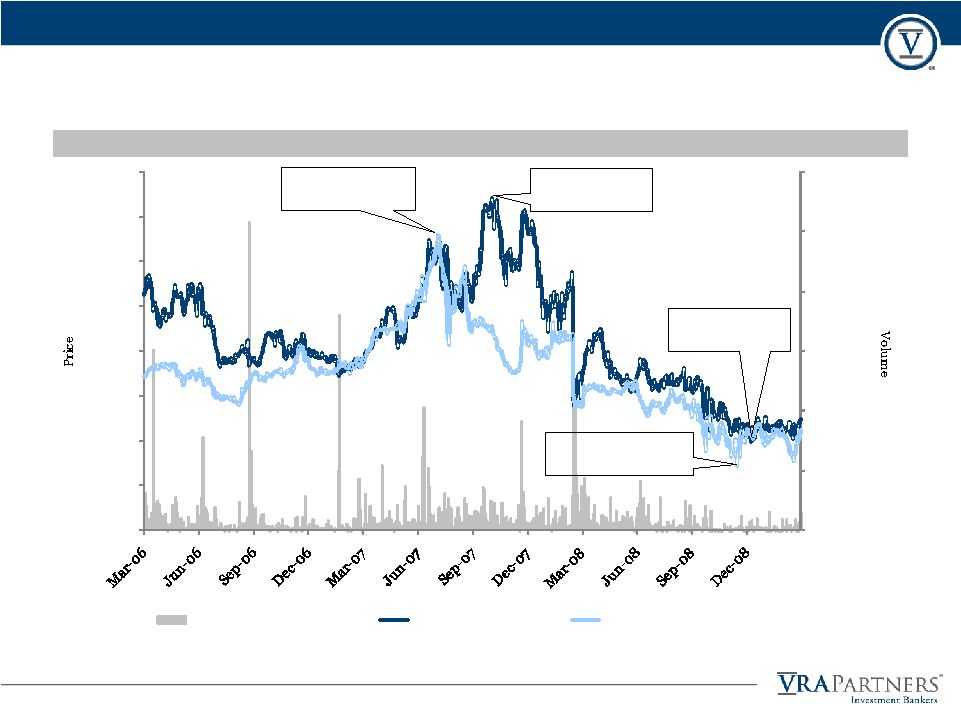 0 50,000 100,000 150,000 200,000 250,000 300,000 $0.00 $2.00 $4.00 $6.00 $8.00 $10.00 $12.00 $14.00 $16.00 Logility Trading Volume Logility Share Price American Software Share Price 14 Price Volume Over the Three Years Preceding the Announcement Date Overview of Logility Logility and ASI Stock Price Performance 10/18/2007: LGTY High - $14.85 7/23/2007: AMSWA High - $13.19 12/23/2008: LGTY Low - $4.00 12/01/2008: AMSWA Low - $2.92 |
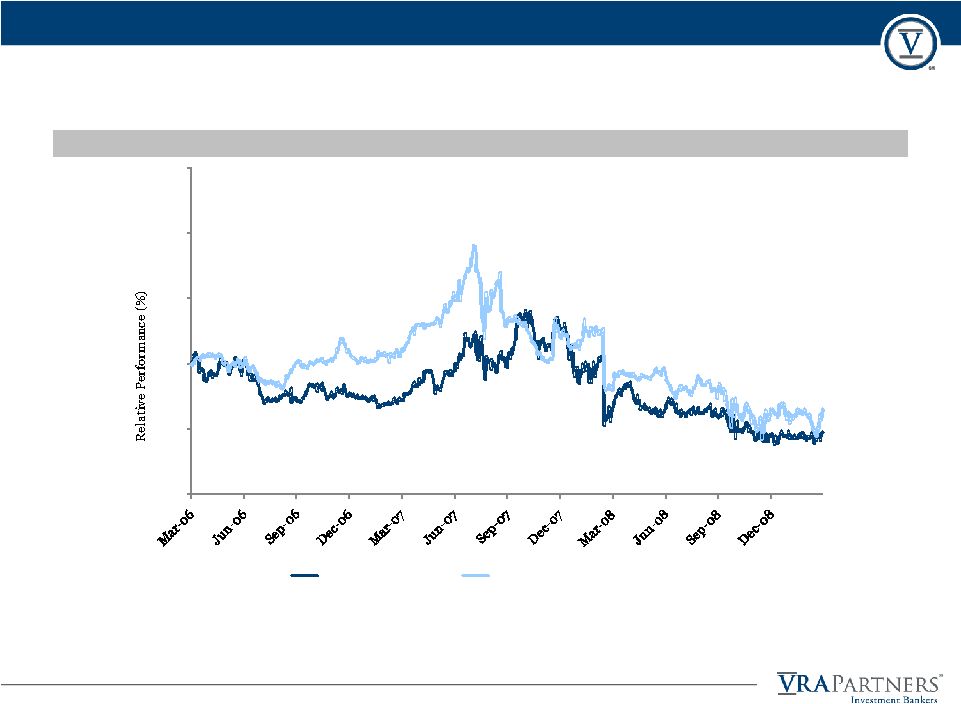 15 Index Price Performance Over the Three Years Preceding the Announcement Date Overview of Logility Logility and ASI Stock Price Performance 0 50 100 150 200 250 Logility Share Price American Software Share Price 0 50 100 150 200 250 Logility Share Price American Software Share Price |
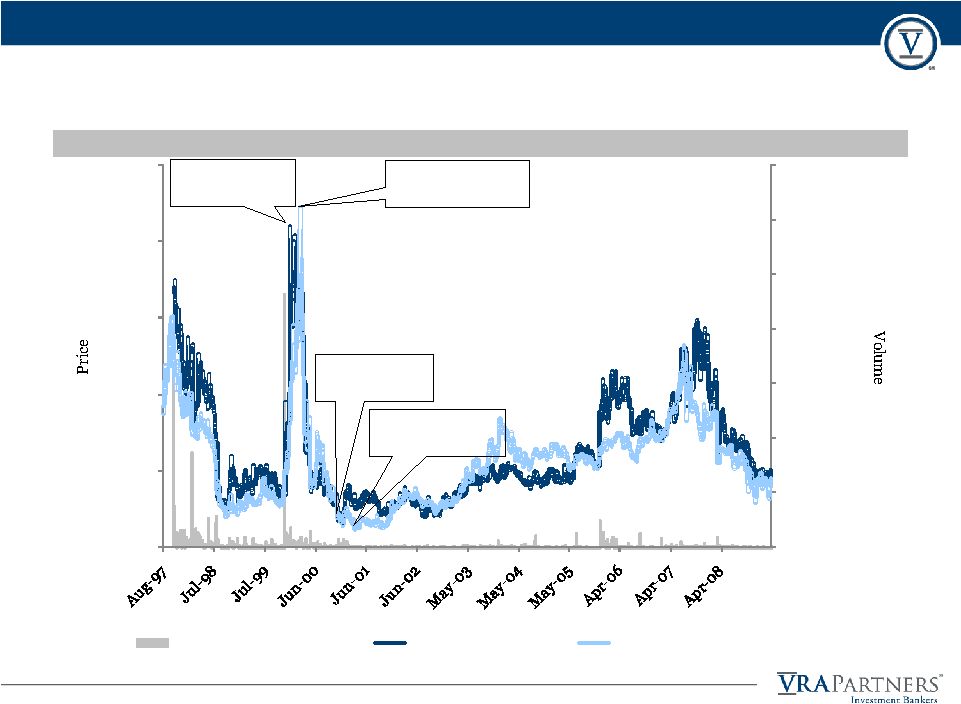 0 1,000,000 2,000,000 3,000,000 4,000,000 5,000,000 6,000,000 7,000,000 $0.00 $5.00 $10.00 $15.00 $20.00 $25.00 Logility Trading Volume Logility Share Price American Software Share Price 16 Price Volume from Logility IPO to the Announcement Date Overview of Logility Logility and ASI Stock Price Performance 12/30/1999: LGTY High - $21.00 12/29/2000: LGTY Low - $1.56 3/13/2000: AMSWA High - $22.25 4/5/2001: AMSWA Low - $1.13 |
 0 20 40 60 80 100 120 140 160 180 Logility Share Price American Software Share Price 17 Index Price Performance from Logility IPO to the Announcement Date Overview of Logility Logility and ASI Stock Price Performance |
 18 Price Volume Since the Announcement Date Overview of Logility Logility and ASI Stock Price Performance 3/18/2009: LGTY Low - $5.00 4/6/2009: LGTY High - $5.48 4/15/2009: AMSWA High - $6.09 As of 4/15/2009. 0 10,000 20,000 30,000 40,000 50,000 $4.00 $4.25 $4.50 $4.75 $5.00 $5.25 $5.50 $5.75 $6.00 $6.25 Logility Trading Volume Logility Share Price American Software Share Price 3/18/2009: AMSWA Low - $4.49 |
 95 100 105 110 115 120 125 130 135 140 Logility Share Price American Software Share Price 19 Index Price Performance Since the Announcement Date Overview of Logility Logility and ASI Stock Price Performance As of 4/15/2009. |
 20 Overview of Logility Logility and ASI Trading Multiples Enterprise Value to LTM Total Revenue Enterprise Value to LTM EBITDA Price to LTM Cash Earnings Per Share 0.0x 0.5x 1.0x 1.5x 2.0x 2.5x ASI Logility 0.0x 2.0x 4.0x 6.0x 8.0x 10.0x 12.0x 14.0x 16.0x ASI Logility 0.0x 5.0x 10.0x 15.0x 20.0x 25.0x 30.0x 35.0x 40.0x 45.0x 50.0x ASI Logility |
 ($ in millions) 21 Overview of Logility Financial Comparison to Publicly Traded Competitors Financial Profile Comparison to Competitors (1) Excludes capitalized R&D costs. (2) Includes both capitalized and expensed R&D costs. i2 Technologies, JDA Software American Logility, Inc. Inc. Group Inc. Oracle Corp. SAP AG Software, Inc. LTM Revenue $42.4 $255.8 $390.3 $23,630.0 $15,454.2 $80.7 LTM Maintenance Revenue $23.2 $85.4 $182.8 $4,601.0 $4,593.0 $28.4 LTM CAPEX (1) $0.1 $1.3 $8.6 $539.0 $473.7 $0.9 LTM R&D (2) $7.5 $29.2 $53.9 $2,771.0 $2,270.0 $9.5 1 Year Revenue Growth 2.6% (1.7%) 4.5% 24.6% 3.3% 5.5% 3 Year Revenue CAGR 19.4% (8.8%) 21.8% 26.0% 15.3% 7.7% 5 Year Revenue CAGR 44.8% (11.3%) 13.5% 20.1% 11.8% 26.5% LTM Gross Margin 68.0% 57.2% 63.7% 79.0% 68.9% 53.1% LTM EBITDA Margin 22.8% 15.3% 24.9% 47.2% 32.8% 11.6% LTM EBIT Margin 21.7% 13.9% 22.5% 46.0% 27.9% 9.7% LTM Return-on-Assets (ROA) 8.4% 8.0% 5.9% 13.2% 14.4% 3.6% LTM Return-on-Equity (ROE) 11.8% 151.9% 0.8% 26.2% 28.1% 3.3% LTM CAPEX / Revenue 0.2% 0.5% 2.2% 2.3% 3.1% 1.1% LTM R&D / Revenue 17.8% 11.4% 13.8% 11.7% 14.7% 11.8% |
 22 Overview of Logility Industry Conditions SCM Application Revenue Estimates Current economic conditions have impacted the market and have created uncertainty over short-term growth. 2009 and 2010 global IT spending expected to decline 9% and 1%, respectively Market has become increasingly competitive, especially for large implementations where SAP and Oracle mostly compete, creating pricing pressure on market participants. There has been a recent slowdown in industry consolidation activity from prior years. Past notable activity includes: Infor made five acquisitions in 2006 and 2007 SAP made four acquisitions in 2006 and 2007 JDA acquired Manugistics in 2006 in addition to one other software business I2 made two acquisitions in 2006 and 2007 Source: AMR Research, 2008; Goldman Sachs 0% 1% 2% 3% 4% 5% 6% 7% 8% 9% $0.0 $1.0 $2.0 $3.0 $4.0 $5.0 $6.0 $7.0 $8.0 $9.0 $10.0 2007 2008 2009 2010 2011 2012 Revenue Revenue Growth Supply chain management (“SCM”) applications market represents a $6.5 billion industry expected to grow at a CAGR of 7% through 2012 Increasing trend of global sourcing puts emphasis on supply chain planning Replacement market is strong International market penetration (U.S. customers represent 58% of overall market) Increased adoption from mid-market companies (40% of the market consists of companies with +$1 billion sales) |
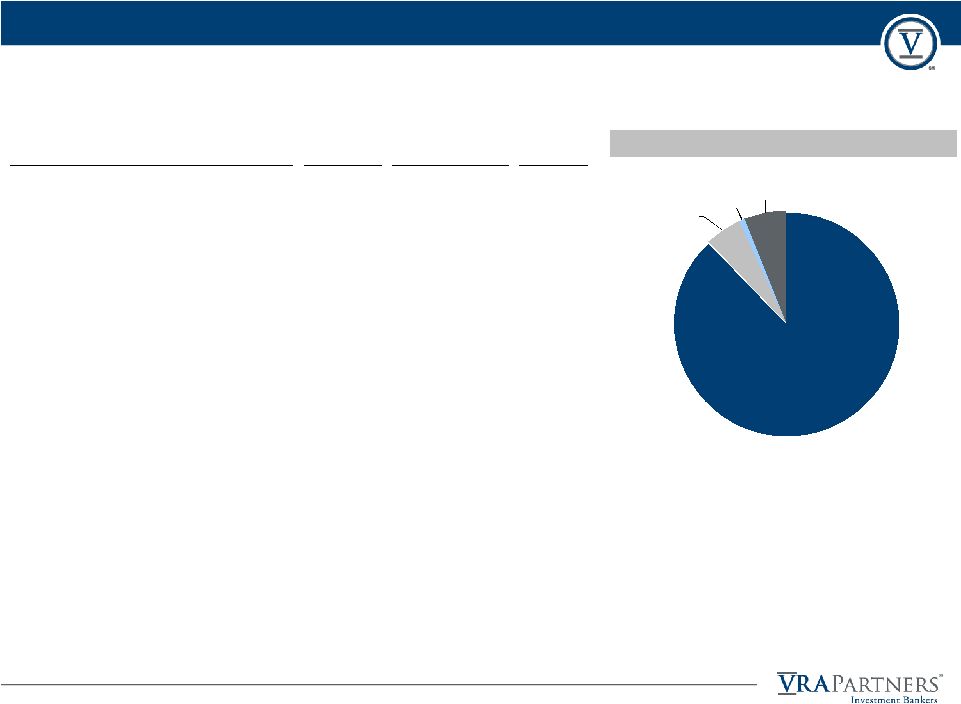 23 Overview of Logility Ownership Profile Ownership Breakout ($ in thousands) American Software 88% Institutions 5% Insiders 1% Retail 6% Percent of Total Market Holder Shares Shares Outstanding (1) Value (2) American Software, Inc. 11,300,000 87.87% $57,630 Dimensional Fund Advisors LP 348,664 2.71% 1,778 California Public Employees' Retirement System 121,490 0.94% 620 Renaissance Technologies Corp. 78,100 0.61% 398 J. Michael Edenfield 51,500 0.40% 263 H. Allan Dow 48,721 0.38% 248 Lapides Asset Management, LLC 34,995 0.27% 178 Northern Trust Investments, National Association 23,607 0.18% 120 Lotsoff Capital Management 21,600 0.17% 110 Spark L.P. 15,149 0.12% 77 Northern Trust Investments, N.A. 11,951 0.09% 61 BNY Mellon Wealth Management 10,093 0.08% 51 Barclays Global Investors, National Association 4,442 0.03% 23 Parker H. Petit 4,000 0.03% 20 John A. White 3,500 0.03% 18 Frederick E. Cooper 1,000 0.01% 5 Wells Fargo Bank, National Association, Asset Management Arm 2,425 0.02% 12 Royce & Associates, LLC 1,900 0.01% 10 AXA Rosenberg Investment Management LLC 1,040 0.01% 5 SG Asset Management Alternative Investments 700 0.01% 4 UBS Securities LLC, Investment Arm 514 0.00% 3 Grantham, Mayo, Van Otterloo & Co. LLC 200 0.00% 1 Deutsche Investment Management Americas Inc. 46 0.00% 0 Note: Institutional shares are based on holder's most recent 13F filing. Note: Insider ownership based on Logility DEF 14A filed on July 28, 2008. (1) Based on a total of 12,860,145 shares outstanding as of March 5, 2009. (2) Based on the offer price of $5.10 |
 24 Overview of Logility Logility Change in Ownership Over Time 3/31/2007 6/30/2007 9/30/2007 12/31/2007 3/31/2008 Institution Shares Shares Change Shares Change Shares Change Shares Change American Software, Inc. 11,300,000 11,300,000 - 11,300,000 - 11,300,000 - 11,300,000 - Dimensional Fund Advisors LP 342,030 342,399 369 334,169 (8,230) 340,427 6,258 350,953 10,526 California Public Employees' Retirement System 45,400 45,400 - 45,400 - 121,490 76,090 121,490 - Renaissance Technologies Corp. - 25,500 25,500 42,700 17,200 57,300 14,600 68,900 11,600 J. Michael Edenfield 55,000 35,184 (19,816) 35,184 - 35,184 - 35,184 - H. Allan Dow 58,721 48,721 (10,000) 48,721 - 48,721 - 48,721 - Lapides Asset Management, LLC - - - - - - - 23,000 23,000 Northern Trust Investments, National Association 27,783 24,007 (3,776) 24,007 - 24,007 - 24,007 - Lotsoff Capital Management - 38,300 38,300 42,100 3,800 �� 56,000 13,900 31,300 (24,700) Spark L.P. 24,200 38,700 14,500 40,724 2,024 49,200 8,476 41,900 (7,300) Northern Trust Investments, N.A. 12,238 12,238 - 12,538 300 12,538 - 12,538 - BNY Mellon Wealth Management 10,093 10,093 - 10,093 - 10,093 - 10,093 - Barclays Global Investors, National Association 4,835 4,835 - 4,442 (393) 4,442 - 4,442 - Parker H. Petit 3,000 3,000 - 3,000 - 3,000 - 3,000 - John A. White 2,500 2,500 - 2,500 - 2,500 - 2,500 - Frederick E. Cooper - - - - - - - - - Wells Fargo Bank, National Association, Asset Management Arm 2,425 2,425 - 2,425 - 2,425 - 2,425 - Royce & Associates, LLC - - - - - 4,500 4,500 4,500 - AXA Rosenberg Investment Management LLC 1,300 1,200 (100) 3,300 2,100 4,400 1,100 3,900 (500) SG Asset Management Alternative Investments - - - - - 700 700 700 - UBS Securities LLC, Investment Arm 1,064 - (1,064) 100 100 - (100) 265 265 Grantham, Mayo, Van Otterloo & Co. LLC - - - - - - - - - Deutsche Investment Management Americas Inc. - 45 45 45 - 46 1 205 159 Bjurman, Barry & Associates - - - 67,065 67,065 213,367 146,302 - (213,367) Credit Suisse Securities (USA) LLC, Investment Arm - 10,340 10,340 - (10,340) - - - - FAF Advisors, Inc. - - - - - - - 7,000 7,000 FrontPoint Partners LLC - - - 19,016 19,016 - (19,016) - - Morgan Stanley Investment Management Inc. 10,398 75 (10,323) - (75) - - - - Newton Investment Management Limited - - - 750 750 750 - 750 - QVT Financial LP - - - - - - - - - Reinhart Partners, Inc. - - - - - 16,930 16,930 45,931 29,001 SSgA Funds Management Inc. 43,300 43,300 - 43,300 - 43,300 - 43,300 - State Street Global Advisors, Inc. 47,200 47,200 - 47,200 - 47,593 393 47,593 - Technical Financial Services LLC - - - - - 200 200 - (200) Teton Advisors, Inc - - - 18,498 18,498 - (18,498) - - The Vanguard Group, Inc. 11,314 - (11,314) - - - - - - Wellington Management Company L.L.P. 66,209 51,901 (14,308) 52,302 401 24,302 (28,000) - (24,302) Total Institutional Ownership 649,789 697,958 48,169 810,174 112,216 1,034,010 223,836 845,192 (188,818) Total Institutional Ownership as a % of Total 5.0% 5.4% 6.3% 8.0% 6.5% Shares Outstanding Insider Ownership 11,419,221 11,389,405 (29,816) 11,389,405 - 11,389,405 - 11,389,405 - Insider Ownership as a % of Total Shares Oustanding 88.5% 88.3% 87.9% 87.9% 88.0% Stock Price Information for Relevant Quarter: High Closing Price $8.14 $11.30 $13.03 $14.85 $12.75 Low Closing Price $6.96 $8.11 $9.28 $10.96 $5.56 Average Closing Price $7.52 $9.39 $11.30 $13.17 $9.34 Note: Institutional shares are based on holder's most recent 13F filing. Note: Insider ownership based on Logility DEF 14A filed on July 28, 2008. |
 25 Overview of Logility Logility Change in Ownership Over Time 6/30/2008 9/30/2008 12/31/2008 3/31/2009 Institution Shares Change Shares Change Shares Change Shares Change American Software, Inc. 11,300,000 - 11,300,000 - 11,300,000 - 11,300,000 - Dimensional Fund Advisors LP 349,141 (1,812) 348,860 (281) 348,664 (196) 348,664 - California Public Employees' Retirement System 121,490 - 121,490 - 121,490 - 121,490 - Renaissance Technologies Corp. 74,600 5,700 77,300 2,700 78,100 800 78,100 - J. Michael Edenfield 51,500 16,316 51,500 - 51,500 - 51,500 - H. Allan Dow 48,721 - 48,721 - 48,721 - 48,721 - Lapides Asset Management, LLC 27,000 4,000 27,000 - 34,995 7,995 34,995 - Northern Trust Investments, National Association 24,007 - 24,007 - 23,607 (400) 23,607 - Lotsoff Capital Management 31,300 - 31,300 - 21,600 (9,700) 21,600 - Spark L.P. 23,600 (18,300) 17,100 (6,500) 15,149 (1,951) 15,149 - Northern Trust Investments, N.A. 12,538 - 12,038 (500) 11,951 (87) 11,951 - BNY Mellon Wealth Management 10,093 - 10,093 - 10,093 - 10,093 - Barclays Global Investors, National Association 4,442 - 4,442 - 4,442 - 4,442 - Parker H. Petit 3,000 - 3,000 - 3,000 - 4,000 1,000 John A. White 2,500 - 2,500 - 2,500 - 3,500 1,000 Frederick E. Cooper - - - - - - 1,000 1,000 Wells Fargo Bank, National Association, Asset Management Arm 2,425 - 2,425 - 2,425 - 2,425 - Royce & Associates, LLC 1,900 (2,600) 1,900 - 1,900 - 1,900 - AXA Rosenberg Investment Management LLC 2,716 (1,184) 1,640 (1,076) 1,040 (600) 1,040 - SG Asset Management Alternative Investments 700 - 700 - 700 - 700 - UBS Securities LLC, Investment Arm 577 312 - (577) 514 514 514 - Grantham, Mayo, Van Otterloo & Co. LLC 200 200 200 - 200 - 200 - Deutsche Investment Management Americas Inc. 1,671 1,466 1,655 (16) 46 (1,609) 46 - Bjurman, Barry & Associates - - - - - - - - Credit Suisse Securities (USA) LLC, Investment Arm - - - - - - - - FAF Advisors, Inc. - (7,000) - - - - - - FrontPoint Partners LLC - - - - - - - - Morgan Stanley Investment Management Inc. 20,000 20,000 - (20,000) - - - - Newton Investment Management Limited 750 - - (750) - - - - QVT Financial LP 21,015 21,015 20,014 (1,001) - (20,014) - - Reinhart Partners, Inc. - (45,931) - - - - - - SSgA Funds Management Inc. - (43,300) - - - - - - State Street Global Advisors, Inc. - (47,593) - - - - - - Technical Financial Services LLC - - - - - - - - Teton Advisors, Inc - - - - - - - - The Vanguard Group, Inc. - - - - - - - - Wellington Management Company L.L.P. - - - - - - - - Total Institutional Ownership 730,165 (115,027) 702,164 (28,001) 676,916 (25,248) 676,916 - Total Institutional Ownership as a % of Total 5.6% 5.4% 5.3% 5.3% Shares Outstanding Insider Ownership 11,405,721 16,316 11,405,721 - 11,405,721 - 11,408,721 3,000 Insider Ownership as a % of Total Shares Oustanding 88.1% 88.5% 88.5% 88.7% Stock Price Information for Relevant Quarter: High Closing Price $9.00 $7.59 $6.69 $5.30 Low Closing Price $6.23 $6.15 $4.00 $4.12 Average Closing Price $7.43 $6.64 $4.98 $4.71 Note: Institutional shares are based on holder's most recent 13F filing. Note: Insider ownership based on Logility DEF 14A filed on July 28, 2008. |
  Insiders 12.2% Institutions 56.0% Retail 31.8% 26 Overview of Logility American Software Ownership Profile Ownership Breakout Percent of Total Market Holder Shares Shares Outstanding (1) Value (2) James C. Edenfield 2,041,587 8.08% $11,760 Brown Capital Management Inc. 1,908,251 7.55% $10,992 Renaissance Technologies Corp. 1,598,900 6.32% $9,210 Barclays Global Investors, National Association 1,229,872 4.86% $7,084 Wells Capital Management Incorporated 977,823 3.87% $5,632 Thomas L. Newberry 941,724 3.73% $5,424 Lombardia Capital Partners, LLC 836,824 3.31% $4,820 Dimensional Fund Advisors LP 761,563 3.01% $4,387 Al Frank Asset Management, Inc. 733,297 2.90% $4,224 Perritt Capital Management, Inc. 623,000 2.46% $3,588 Lapides Asset Management, LLC 542,000 2.14% $3,122 Wellington Management Company L.L.P. 533,966 2.11% $3,076 New York State Common Retirement Fund 506,786 2.00% $2,919 Tocqueville Asset Management LP 449,433 1.78% $2,589 The Vanguard Group, Inc. 326,406 1.29% $1,880 State Street Global Advisors, Inc. 268,080 1.06% $1,544 Bmo Harris Investment Management Inc 257,721 1.02% $1,484 Fifth Third Asset Management, Inc. 172,950 0.68% $996 Eagle Asset Management, Inc. 169,510 0.67% $976 Royce & Associates, LLC 166,200 0.66% $957 Goldman, Sachs & Co., Asset Management Arm 158,158 0.63% $911 Northern Trust Global Advisors Inc. 148,231 0.59% $854 Teachers Insurance and Annuity Association College Retirement Equities Fund 144,750 0.57% $834 Northern Trust Investments, N.A. 141,172 0.56% $813 TIAA-CREF Investment Management, LLC 130,601 0.52% $752 California Public Employees' Retirement System 115,990 0.46% $668 Axiom Asset Management, LLC 99,144 0.39% $571 Citigroup Inc., Asset Management Arm 84,080 0.33% $484 BlackRock Investment Management LLC 75,900 0.30% $437 Davenport Asset Management 67,810 0.27% $391 Punch & Associates, Inc. 65,000 0.26% $374 BNY Mellon Wealth Management 64,494 0.26% $371 Wells Fargo Bank, National Association, Asset Management Arm 40,698 0.16% $234 SG Asset Management Alternative Investments 28,800 0.11% $166 J. Michael Edenfield 22,308 0.09% $128 UBS Securities LLC, Investment Arm 6,231 0.02% $36 Barclays Global Investors Limited 5,955 0.02% $34 Deutsche Investment Management Americas Inc. 1,700 0.01% $10 Indicates common ownership with Logilit Note: Institutional shares are based on holder's most recent 13F filing. Note: Insider ownership based on Logility DEF 14A filed on July 28, 2008. (1) Based on a total of 25,281,077 shares outstanding as of March 10, 2009. (2) Based on share price as of 4/15/2009. |
 27 Logility Financial Information Historical Income Statements ($ in thousands, except per share data) Latest Twelve Month Period Fiscal Year Ended April 30, Ended Nine Months Ended 2004 2005 2006 2007 2008 1/31/2009 1/31/2008 1/31/2009 Revenues: License $6,656 $6,717 $13,889 $16,242 $14,554 $13,097 $10,409 $8,952 Services and other 5,179 5,203 5,796 6,830 7,807 6,049 5,985 4,227 Maintenance 10,991 12,956 17,618 20,691 22,547 23,246 16,636 17,335 Total revenues 22,826 24,876 37,303 43,763 44,908 42,392 33,030 30,514 Cost of revenues: License 4,054 3,965 3,783 5,864 6,007 5,221 4,518 3,732 Services and other 2,632 2,721 3,585 3,697 3,804 3,348 2,898 2,442 Maintenance 1,780 3,031 4,134 4,858 4,943 5,000 3,609 3,666 Write down of capitalized computer - 703 - - 1,196 - 1,196 - software development costs Total cost of revenues 8,466 10,420 11,502 14,419 15,950 13,569 12,221 9,840 Gross margin 14,360 14,456 25,801 29,344 28,958 28,823 20,809 20,674 Operating expenses: Research and development 2,116 3,170 4,747 5,378 5,341 5,227 3,909 3,795 Sales and marketing 7,239 8,046 10,123 9,778 10,337 10,218 7,279 7,160 General and administrative 3,157 3,715 4,675 5,310 4,625 4,633 3,484 3,492 Provision (recovery) for doubtful accounts 45 197 (53) 7 - - - - Amortization of acquisition-related intangibles - 204 350 350 350 349 263 262 Total operating expenses 12,557 15,332 19,842 20,823 20,653 20,427 14,935 14,709 Operating income (loss) (EBIT) 1,803 (876) 5,959 8,521 8,305 8,396 5,874 5,965 Investment impairment (382) (100) (281) - - - - - Interest income - - 843 1,228 1,535 1,535 - - Other income (expense), net 285 397 (95) 375 115 (1,195) 1,451 141 Earnings (loss) before income taxes 1,706 (579) 6,426 10,124 9,955 8,736 7,325 6,106 (Provision) benefit for income taxes - (27) 1,587 (4,130) (3,923) (3,056) (2,971) (2,104) Net earnings (loss) $1,706 ($606) $8,013 $5,994 $6,032 $5,680 $4,354 $4,002 Diluted net earnings (loss) per common share $0.13 ($0.05) $0.60 $0.45 $0.45 $0.43 $0.33 $0.31 EBITDA $2,250 ($412) $6,621 $9,211 $8,954 $8,903 $6,369 $6,318 Depreciation and amortization $4,280 $3,064 $2,556 $3,295 $3,090 $2,819 $2,381 $2,110 Less: Capitalized development amortization (3,833) (2,600) (1,894) (2,605) (2,441) (2,312) (1,886) (1,757) Depreciation expense (excl. capitalized development amortization) $447 $464 $662 $690 $649 $507 $495 $353 Capital expenditures $86 $415 $196 $269 $197 $69 $189 $61 Additions to capitalized development costs $3,292 $2,750 $2,423 $2,264 $2,155 $2,312 $1,635 $1,504 |
 28 Logility Financial Information Adjustments to Historical Annual Income Statements Consistent with Logility’s earnings press releases, VRA made the following adjustments for stock-based compensation and non-recurring / one-time items to the Company’s operating results. ($ in thousands, except per share data) |
 29 Logility Financial Information Quarterly Income Statements ($ in thousands, except per share data) Quarter Ended 4/30/2007 7/31/2007 10/31/2007 1/31/2008 4/30/2008 7/31/2008 10/31/2008 1/31/2009 Revenues: License $5,698 $4,677 $3,399 $2,333 $4,145 $2,009 $3,272 $3,671 Services and other 1,940 2,013 2,039 1,933 1,822 1,569 1,387 1,271 Maintenance 5,102 5,275 5,696 5,665 5,911 5,810 5,824 5,701 Total revenues 12,740 11,965 11,134 9,931 11,878 9,388 10,483 10,643 Cost of revenues: License 1,672 1,634 1,520 1,364 1,489 1,252 1,486 994 Services and other 1,126 1,022 1,023 853 906 902 790 750 Maintenance 1,183 1,080 1,267 1,261 1,334 1,191 1,264 1,211 Write down of capitalized computer - - - 1,196 - - - - software development costs Total cost of revenues 3,981 3,736 3,810 4,674 3,729 3,345 3,540 2,955 Gross margin 8,759 8,229 7,324 5,257 8,149 6,043 6,943 7,688 Operating expenses: Research and development 1,665 1,352 1,318 1,239 1,432 1,265 1,287 1,243 Sales and marketing 2,468 2,452 2,426 2,402 3,057 2,475 2,248 2,437 General and administrative 1,496 1,337 1,293 854 1,141 1,229 1,129 1,134 Provision (recovery) for doubtful accounts - - - - - - - - Amortization of acquisition-related intangibles 87 88 87 87 88 88 87 87 Total operating expenses 5,716 5,229 5,124 4,582 5,718 5,057 4,751 4,901 Operating income (loss) (EBIT) 3,043 3,000 2,200 675 2,431 986 2,192 2,787 Investment impairment - - - - - - - - Interest income - - - 538 - - - - Other income (expense), net 377 409 504 - 199 156 29 (44) Earnings (loss) before income taxes 3,420 3,409 2,704 1,213 2,630 1,142 2,221 2,743 (Provision) benefit for income taxes (1,532) (1,562) (1,031) (378) (953) (448) (669) (987) Net earnings (loss) $1,888 $1,847 $1,673 $835 $1,677 $694 $1,552 $1,756 Diluted net earnings (loss) per common share $0.14 $0.14 $0.13 $0.06 $0.13 $0.05 $0.12 $0.14 EBITDA $3,217 $3,175 $2,369 $826 $2,585 $1,124 $2,322 $2,893 Depreciation and amortization $821 $813 $807 $761 $709 $693 $715 $702 Less: Capitalized development amortization (647) (638) (638) (610) (555) (555) (585) (596) Depreciation expense (excl. capitalized development amortization) $174 $175 $169 $151 $154 $138 $130 $106 Capital expenditures $42 $46 $79 $64 $8 $20 $24 $28 Additions to capitalized development costs $586 $525 $630 $480 $520 $507 $516 $482 |
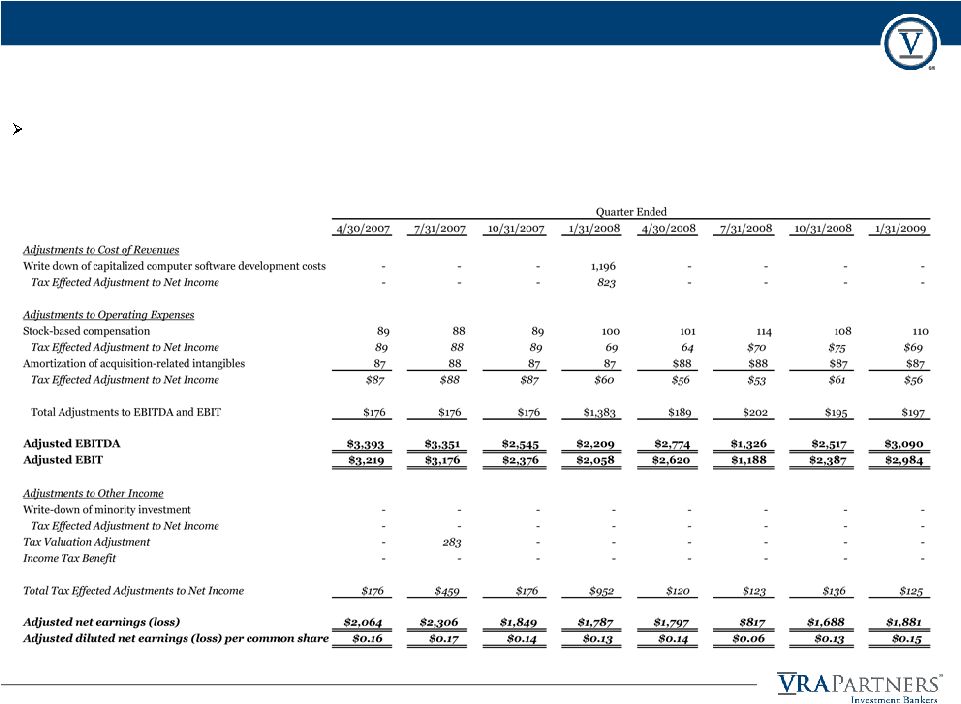 30 Logility Financial Information Adjustments to Historical Quarterly Income Statements Consistent with Logility’s earnings press releases, VRA made the following adjustments for stock-based compensation and non-recurring / one-time items to the Company’s operating results. ($ in thousands, except per share data) |
 31 Logility Financial Information Forecasted Income Statements ($ in thousands, except per share data) Fiscal Fiscal Calendar Quarter Ended Year Ending Quarter Ended Year Ending Year Ending (1) 7/31/2008 10/31/2008 1/31/2009 4/30/2009 4/30/2009 7/31/2009 10/31/2009 1/31/2010 4/30/2010 4/30/2010 12/31/2009 Revenues: Actual Actual Actual Estimate Estimate Estimate Estimate Estimate Estimate Estimate Estimate License $2,009 $3,272 $3,671 $3,500 $12,452 $2,250 $2,680 $3,500 $4,000 $12,430 $11,930 Services and other 1,569 1,387 1,271 1,400 5,627 1,400 1,520 1,300 1,280 5,500 5,620 Maintenance 5,810 5,824 5,701 5,752 23,087 5,795 5,780 5,785 5,827 23,187 23,112 Total revenues 9,388 10,483 10,643 10,652 41,166 9,445 9,980 10,585 11,107 41,117 40,662 Cost of revenues: License 1,252 1,486 994 943 4,675 1,005 1,147 1,211 1,211 4,574 4,306 Services and other 902 790 750 793 3,235 904 777 773 793 3,247 3,247 Maintenance 1,191 1,264 1,211 1,218 4,884 1,200 1,243 1,220 1,243 4,906 4,881 Write down of capitalized computer - - - - - - - - - - - software development costs Total cost of revenues 3,345 3,540 2,955 2,954 12,794 3,109 3,167 3,204 3,247 12,727 12,434 Gross margin 6,043 6,943 7,688 7,698 28,372 6,336 6,813 7,381 7,860 28,390 28,228 Operating expenses: Research and development 1,265 1,287 1,243 1,163 4,958 1,074 1,170 1,320 1,462 5,026 4,727 Sales and marketing 2,475 2,248 2,437 2,646 9,806 2,395 2,559 2,726 2,889 10,569 10,326 General and administrative 1,229 1,129 1,134 1,194 4,686 1,255 1,138 1,177 1,184 4,754 4,764 Provision (recovery) for doubtful accounts - - - 25 25 25 25 25 25 100 100 Amortization of acquisition-related intangibles 88 87 87 87 349 88 88 87 87 350 350 Total operating expenses 5,057 4,751 4,901 5,115 19,824 4,837 4,980 5,335 5,647 20,799 20,267 Operating income (loss) (EBIT) 986 2,192 2,787 2,583 8,548 1,499 1,833 2,046 2,213 7,591 7,961 Investment impairment - - - - - - - - - - - Interest income - - - 345 345 300 300 300 300 1,200 1,245 Other income (expense), net 156 29 (44) (220) (79) (70) (70) (70) (70) (280) (430) Earnings (loss) before income taxes 1,142 2,221 2,743 2,708 8,814 1,729 2,063 2,276 2,443 8,511 8,776 (Provision) benefit for income taxes (448) (669) (987) (1,002) (3,106) (609) (727) (802) (860) (2,998) (3,140) Net earnings (loss) $694 $1,552 $1,756 $1,706 $5,708 $1,120 $1,336 $1,474 $1,583 $5,513 $5,636 Diluted net earnings (loss) per common share $0.05 $0.12 $0.14 $0.13 $0.44 $0.09 $0.10 $0.11 $0.12 $0.42 $0.43 EBITDA $1,124 $2,322 $2,893 $2,734 $9,073 $1,650 $1,984 $2,241 $2,497 $8,372 $8,609 Depreciation and amortization $693 $715 $702 $285 $2,395 $535 $660 $660 $660 $2,515 $2,140 Less: Capitalized development amortization (555) (585) (596) (134) ($1,870) (384) (509) (465) (376) (1,734) (1,492) Depreciation expense (excl. capitalized development amortization) $138 $130 $106 $151 $525 $151 $151 $195 $284 $781 $648 Capital expenditures $20 $24 $28 $20 $92 $20 $20 $20 $20 $80 $80 Additions to capitalized development costs $507 $516 $482 $400 $1,905 $400 $400 $350 $300 $1,450 $1,550 Note: Forward looking financial information provided by Logility management on April 3, 2009. (1) Represents the sum of estimated quarters ending 4/30/2009, 7/31/2009, 10/31/2009, and 1/31/2010. |
 32 Logility Financial Information Adjustments to Forecasted Income Statements ($ in thousands, except per share data) Fiscal Fiscal Calendar Quarter Ended Year Ending Quarter Ended Year Ending Year Ending (1) 7/31/2008 10/31/2008 1/31/2009 4/30/2009 4/30/2009 7/31/2009 10/31/2009 1/31/2010 4/30/2010 4/30/2010 12/31/2009 Actual Actual Actual Estimate Estimate Estimate Estimate Estimate Estimate Estimate Estimate EBITDA $1,124 $2,322 $2,893 $2,734 $9,073 $1,650 $1,984 $2,241 $2,497 $8,372 $8,609 Plus: Stock-based compensation 114 108 110 110 442 113 115 115 115 458 453 Adjusted EBITDA $1,238 $2,430 $3,003 $2,844 $9,515 $1,763 $2,099 $2,356 $2,612 $8,830 $9,062 EBIT $986 $2,192 $2,787 $2,583 $8,548 $1,499 $1,833 $2,046 $2,213 $7,591 $7,961 Plus: Stock-based compensation 114 108 110 110 442 113 115 115 115 458 453 Adjusted EBIT $1,100 $2,300 $2,897 $2,693 $8,990 $1,612 $1,948 $2,161 $2,328 $8,049 $8,414 Net earnings $694 $1,552 $1,756 $1,706 $5,708 $1,120 $1,336 $1,474 $1,583 $5,513 $5,636 Plus: Stock based compensation tax-affected 69 75 70 69 284 73 74 74 75 297 291 Adjusted net earnings $763 $1,627 $1,826 $1,775 $5,992 $1,193 $1,410 $1,548 $1,658 $5,810 $5,927 Adjusted diluted net earnings per share $0.06 $0.12 $0.14 $0.14 $0.46 $0.09 $0.11 $0.12 $0.13 $0.44 $0.45 Note: Forward looking financial information provided by Logility management on April 3, 2009. (1) Represents the sum of estimated quarters ending 4/30/2009, 7/31/2009, 10/31/2009, and 1/31/2010. |
 33 Logility Financial Information Annual Income Statement Analysis 2.0% 18.7% 22.7% 24.2% 22.8% 24.5% 22.7% 23.1% 21.5% EBIT as a Percentage of Total Revenue 7.9% (3.5)% 16.0% 19.5% 18.5% 19.8% 17.8% 19.5% 20.8% 18.5% Adjusted EBIT as a Percentage of Total Revenue 7.9% 0.1% 16.9% 21.1% 22.8% 21.7% 23.0% 21.5% 21.8% 19.6% Net Earnings as a Percentage of Total Revenue 7.5% (2.4)% 21.5% 13.7% 13.4% 13.4% 13.2% 13.1% 13.9% 13.4% Adjusted Net Earnings as a Percentage of Total Revenue 9.1% 1.6% 18.9% 14.7% 16.7% 14.6% 17.2% 14.4% 14.6% 14.1% Latest Twelve Month Period Fiscal Year Ended April 30, Ended Nine Months Ended Fiscal Year Ending April 30 2004 2005 2006 2007 2008 1/31/2009 1/31/2008 1/31/2009 2009 2010 Year-Over-Year Revenue Growth: Actual Actual Actual Actual Actual Actual Actual Actual Estimate Estimate License (16.8)% 0.9% 106.8% 16.9% (10.4)% (18.7)% (1.3)% (14.0)% (14.4)% (0.2)% Services and other (13.0)% 0.5% 11.4% 17.8% 14.3% (24.8)% 25.3% (29.4)% (27.9)% (2.3)% Maintenance 1.0% 17.9% 36.0% 17.4% 9.0% 6.9% 6.7% 4.2% 2.4% 0.4% Total revenues (8.1)% 9.0% 50.0% 17.3% 2.6% (7.6)% 6.9% (7.6)% (8.3)% (0.1)% Gross Margin by Service Line: License 39.1% 41.0% 72.8% 63.9% 58.7% 60.1% 56.6% 58.3% 62.5% 63.2% Services and other 49.2% 47.7% 38.1% 45.9% 51.3% 44.7% 51.6% 42.2% 42.5% 41.0% Maintenance 83.8% 76.6% 76.5% 76.5% 78.1% 78.5% 78.3% 78.9% 78.8% 78.8% Total gross margin (excl. write-down) 62.9% 60.9% 69.2% 67.1% 67.1% 68.0% 66.6% 67.8% 68.9% 69.0% Operating Expenses as a Percentage of Total Revenue: Research and development 9.3% 12.7% 12.7% 12.3% 11.9% 12.3% 11.8% 12.4% 12.0% 12.2% Sales and marketing 31.7% 32.3% 27.1% 22.3% 23.0% 24.1% 22.0% 23.5% 23.8% 25.7% General and administrative 13.8% 14.9% 12.5% 12.1% 10.3% 10.9% 10.5% 11.4% 11.4% 11.6% Provision (recovery) for doubtful accounts 0.2% 0.8% (0.1)% 0.0% 0.0% 0.0% 0.0% 0.0% 0.1% 0.2% Amortization of acquisition-related intangibles 0.0% 0.8% 0.9% 0.8% 0.8% 0.8% 0.8% 0.9% 0.8% 0.9% Total operating expenses 55.0% 61.6% 53.2% 47.6% 46.0% 48.2% 45.2% 48.2% 48.2% 50.6% EBITDA as a Percentage of Total Revenue 9.9% (1.7)% 17.7% 21.0% 19.9% 21.0% 19.3% 20.7% 22.0% 20.4% Adjusted EBITDA as a Percentage of Total Revenue 9.9% Note: Forward looking financial information provided by Logility management on April 3, 2009. |
 34 Logility Financial Information Quarterly Income Statement Analysis Note: Forward looking financial information provided by Logility management on April 3, 2009. Quarter Ended or Ending 4/30/2008 7/31/2008 10/31/2008 1/31/2009 4/30/2009 7/31/2009 10/31/2009 1/31/2010 4/30/2010 Actual Actual Actual Actual Estimate Estimate Estimate Estimate Estimate License (27.3)% (57.0)% (3.7)% 57.4% (15.6)% 12.0% (18.1)% (4.7)% 14.3% Services and other (6.1)% (22.1)% (32.0)% (34.2)% (23.2)% (10.8)% 9.6% 2.3% (8.6)% Maintenance 15.9% 10.1% 2.2% 0.6% (2.7)% (0.3)% (0.8)% 1.5% 1.3% Total revenues (6.8)% (21.5)% (5.8)% 7.2% (10.3)% 0.6% (4.8)% (0.5)% 4.3% Gross Margin by Service Line: License 64.1% 37.7% 54.6% 72.9% 73.1% 55.3% 57.2% 65.4% 69.7% Services and other 50.3% 42.5% 43.0% 41.0% 43.4% 35.4% 48.9% 40.5% 38.0% Maintenance 77.4% 79.5% 78.3% 78.8% 78.8% 79.3% 78.5% 78.9% 78.7% Total gross margin (excl. write-down) 68.6% 64.4% 66.2% 72.2% 72.3% 67.1% 68.3% 69.7% 70.8% Research and development 12.1% 13.5% 12.3% 11.7% 10.9% 11.4% 11.7% 12.5% 13.2% Sales and marketing 25.7% 26.4% 21.4% 22.9% 24.8% 25.4% 25.6% 25.8% 26.0% General and administrative 9.6% 13.1% 10.8% 10.7% 11.2% 13.3% 11.4% 11.1% 10.7% Provision (recovery) for doubtful accounts 0.0% 0.0% 0.0% 0.0% 0.2% 0.3% 0.3% 0.2% 0.2% Amortization of acquisition-related intangibles 0.7% 0.9% 0.8% 0.8% 0.8% 0.9% 0.9% 0.8% 0.8% Total operating expenses 48.1% 53.9% 45.3% 46.0% 48.0% 51.2% 49.9% 50.4% 50.8% EBITDA as a Percentage of Total Revenue 21.8% 12.0% 22.2% 27.2% 25.7% 17.5% 19.9% 21.2% 22.5% Adjusted EBITDA as a Percentage of Total Revenue 23.4% 14.1% 24.0% 29.0% 26.7% 18.7% 21.0% 22.3% 23.5% EBIT as a Percentage of Total Revenue 20.5% 10.5% 20.9% 26.2% 24.2% 15.9% 18.4% 19.3% 19.9% Adjusted EBIT as a Percentage of Total Revenue 22.1% 12.7% 22.8% 28.0% 25.3% 17.1% 19.5% 20.4% 21.0% Net Earnings as a Percentage of Total Revenue 14.1% 7.4% 14.8% 16.5% 16.0% 11.9% 13.4% 13.9% 14.3% Adjusted Net Earnings as a Percentage of Total Revenue 15.1% 8.7% 16.1% 17.7% 16.7% 12.6% 14.1% 14.6% 14.9% Operating Expenses as a Percentage of Total Revenue: Year-Over-Year Revenue Growth: |
 35 Logility Financial Information Historical Balance Sheets ($ in thousands) As of April 30, As of 2004 2005 2006 2007 2008 1/31/2009 Assets Current Assets Cash and cash equivalents $10,467 $7,824 $6,128 $16,144 $38,719 $28,752 Investments, current 20,364 16,899 20,332 16,172 4,013 6,626 Trade accounts receivable, billed 3,166 4,228 5,308 7,764 6,897 6,218 Trade accounts receivable, unbilled 813 1,252 1,777 1,412 1,424 427 Deferred income taxes - - 2,922 1,361 74 74 Due from American Software, Inc. - - - 1,167 - - Prepaid expenses and other current assets 466 1,663 1,673 1,995 2,256 2,450 Total Current Assets 35,276 31,866 38,140 46,015 53,383 44,547 Investments, noncurrent - 996 499 - - 11,931 Furniture, equipment and purchased software, net 230 472 457 436 401 298 Capitalized software development costs 6,406 5,854 6,382 6,042 4,560 4,399 Goodwill - 6,103 5,809 5,809 5,809 5,809 Other intangibles, net - 2,138 1,688 1,288 871 590 Other assets 456 380 99 67 48 41 Total other assets 7,092 15,943 14,934 13,642 11,689 23,068 Total Assets $42,368 $47,809 $53,074 $59,657 $65,072 $67,615 Liabilities and Shareholders' Equity Current Liabilities Accounts payable $131 $352 $346 $275 $543 $371 Accrued compensation and related costs 1,106 972 2,792 2,110 1,282 1,286 Accrued reseller commissions - - - 1,459 1,013 858 Other current liabilities 530 2,283 1,751 2,111 965 729 Deferred revenue 5,869 9,696 10,534 11,350 12,622 11,581 Due to American Software, Inc. 2,458 3,560 2,087 - 638 650 Total Current Liabilities 10,094 16,863 17,510 17,305 17,063 15,475 Deferred income taxes, long term - - 1,674 1,940 1,620 1,577 Total Liabilities 10,094 16,863 19,184 19,245 18,683 17,052 Shareholders' Equity Preferred stock - - - - - - Common stock - - - - - - Additional paid-in capital 44,927 44,974 41,539 42,179 43,249 43,898 Retained earnings (7,382) (7,988) 25 6,019 12,051 16,054 Treasury stock (5,271) (6,040) (7,674) (7,786) (8,911) (9,389) Total Shareholders' Equity 32,274 30,946 33,890 40,412 46,389 50,563 Total Liabilities and Shareholders' Equity $42,368 $47,809 $53,074 $59,657 $65,072 $67,615 |
 36 Logility Financial Information Historical Balance Sheet Analysis (1)Excludes cash. ($ in thousands) Fiscal Year Ended April 30, As of 2004 2005 2006 2007 2008 1/31/2009 Liquidity Net Working Capital (1) ($3,191) ($6,160) ($3,743) ($4,773) ($5,774) ($5,656) Current Ratio 0.6 x 0.5 x 0.8 x 0.7 x 0.6 x 0.6 x Working Capital Management A/R Turnover 7.2 x 5.9 x 7.0 x 5.6 x 6.5 x 6.8 x Average Days Receivable 50.6 62.0 51.9 64.8 56.1 53.5 Average Days Payable 5.6 12.3 11.0 7.0 12.4 10.0 Cash and Cash Equivalents $10,467 $7,824 $6,128 $16,144 $38,719 $28,752 Investments, Current 20,364 16,899 20,332 16,172 4,013 6,626 Investments, Noncurrent - 996 499 - - 11,931 Total Cash and Investments $30,831 $25,719 $26,959 $32,316 $42,732 $47,309 |
 37 Logility Financial Information Cash and Cash Equivalents ($ in thousands) (1)Logility, Inc. acquired Demand Management, Inc. on September 30, 2004 for $9.5 million in cash. Fiscal Year Ended April 30, 2008 2009 Q1 Q2 Q3 Q4 Q1 Q2 Q3 Cash and Cash Equivalents $29,252 $39,672 $41,372 $38,719 $26,133 $25,418 $28,752 Investments, Current 6,968 0 0 4,013 18,296 12,421 6,626 Investments, Noncurrent - - - - - 7,404 11,931 Total Cash and Investments $36,220 $39,672 $41,372 $42,732 $44,429 $45,243 $47,309 Quarterly Increase (Decrease) 3,904 3,452 1,700 1,360 1,697 814 2,066 Cumulative Increase (Decrease) 15,224 18,676 20,376 21,736 23,433 24,247 26,313 Fiscal Year Ended April 30, 2005 2006 2007 Q2 (1) Q3 Q4 Q1 Q2 Q3 Q4 Q1 Q2 Q3 Q4 Cash and Cash Equivalents $633 $5,795 $7,824 $5,472 $5,698 $6,286 $6,128 $5,795 $7,531 $11,612 $16,144 Investments, Current 19,863 16,838 16,899 17,931 17,618 19,916 20,332 22,716 22,268 20,275 16,172 Investments, Noncurrent 500 500 996 996 1,732 499 499 - - - - Total Cash and Investments $20,996 $23,133 $25,719 $24,399 $25,048 $26,701 $26,959 $28,511 $29,799 $31,887 $32,316 Quarterly Increase (Decrease) - 2,137 2,586 (1,320) 649 1,653 258 1,552 1,288 2,088 429 Cumulative Increase (Decrease) - 2,137 4,723 3,403 4,052 5,705 5,963 7,515 8,803 10,891 11,320 |
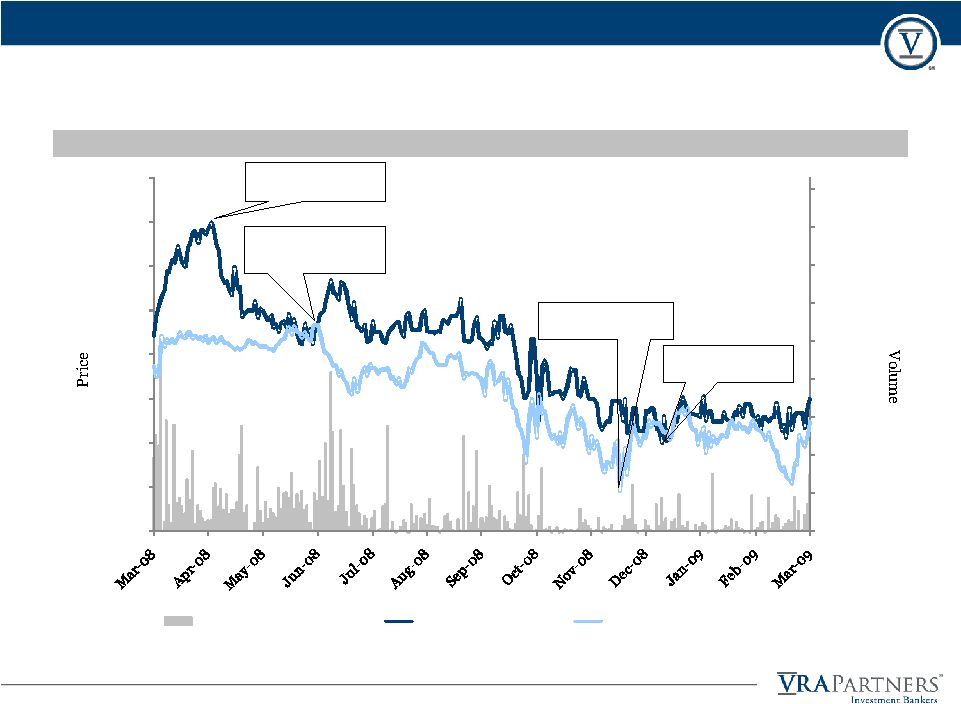
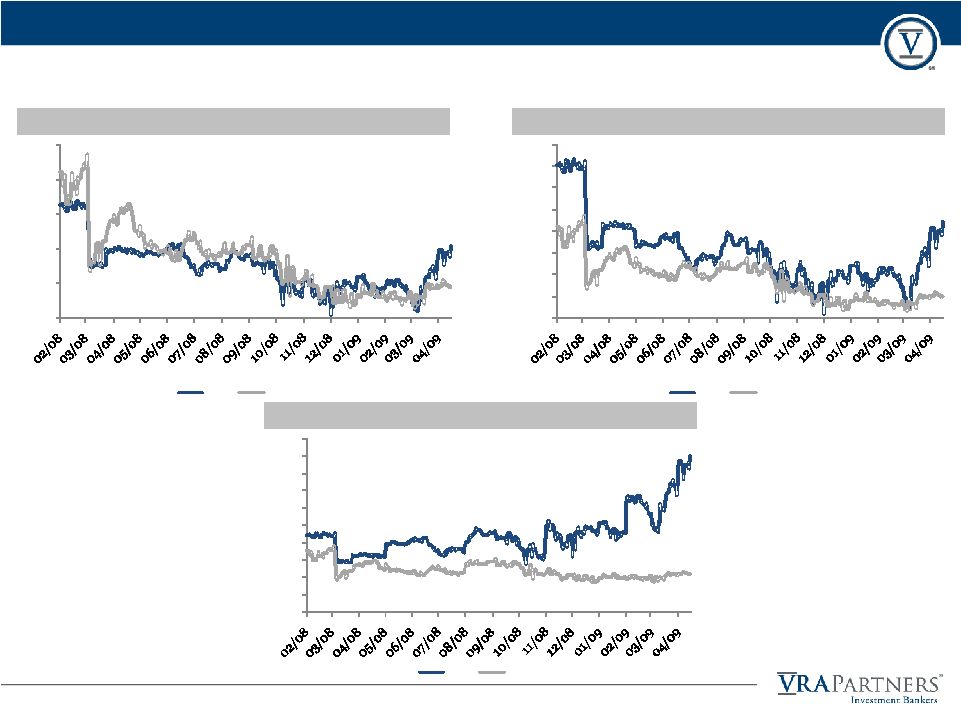
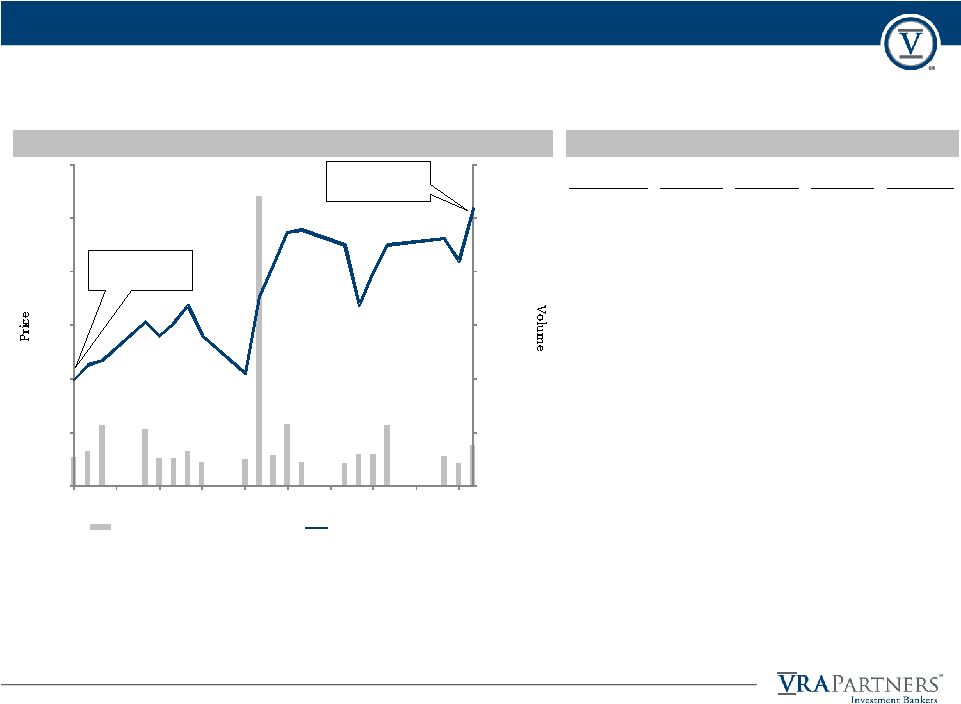
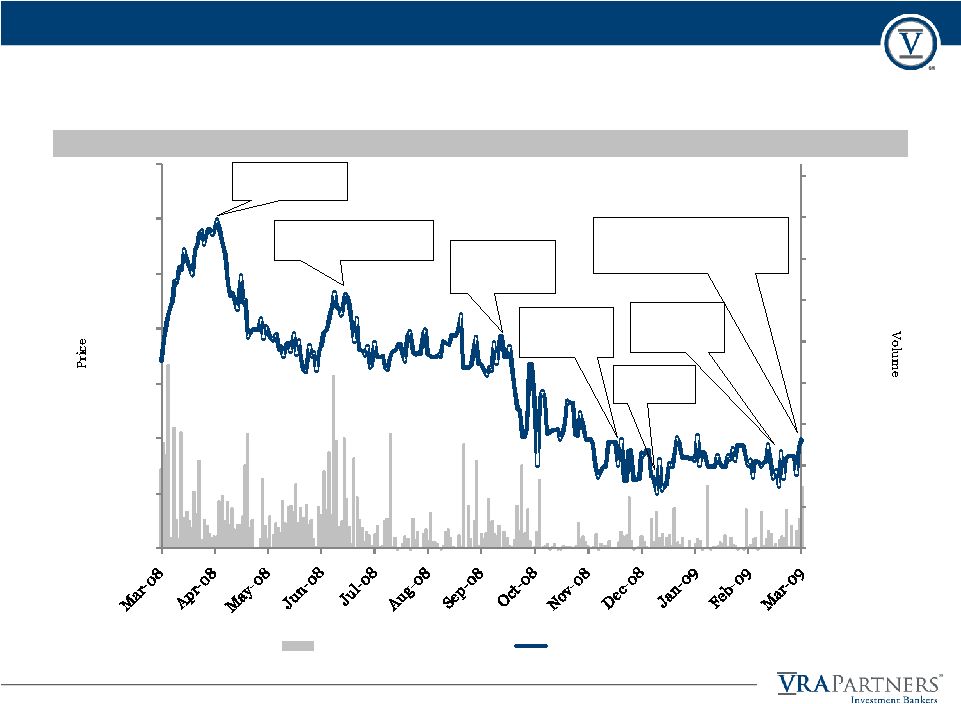 0 10,000 20,000 30,000 40,000 50,000 60,000 70,000 80,000 90,000 $3.00 $4.00 $5.00 $6.00 $7.00 $8.00 $9.00 $10.00 Logility Trading Volume Logility Share Price 38 Logility Stock Performance and Trading Information Stock Price Performance and Trading Volume Price Volume Over the Twelve Months Preceding the Announcement Date 6/18/2008: Fiscal 2008 results announced 9/4/2008: Q1 results announced 12/4/2008: Q2 results announced 3/6/2009: Q3 results announced 3/18/2009: American Software offers to acquire 11.2% of Logility at $5.10 per share 3/18/2008: High - $9.00 12/23/08: Low - $4.00 |
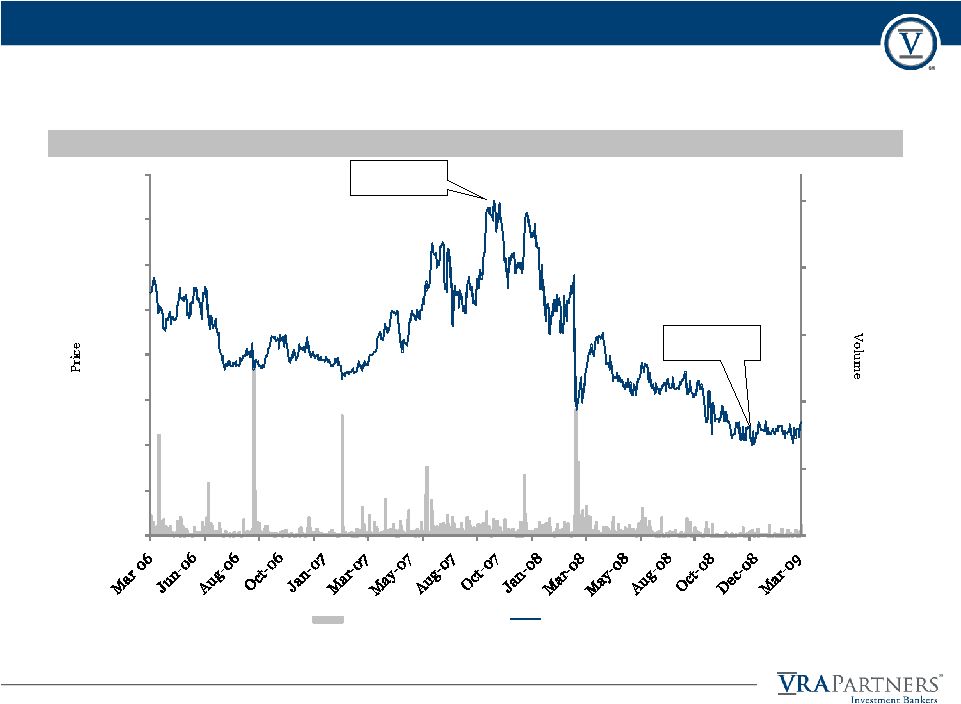 39 Logility Stock Performance and Trading Information Stock Price Performance and Trading Volume Price Volume Over the Three Years Preceding the Announcement Date 10/18/2007: High - $14.85 12/23/2008: Low - $4.00 0 100 200 300 400 500 $0.00 $2.00 $4.00 $6.00 $8.00 $10.00 $12.00 $14.00 $16.00 Logility Trading Volume Logility Share Price |
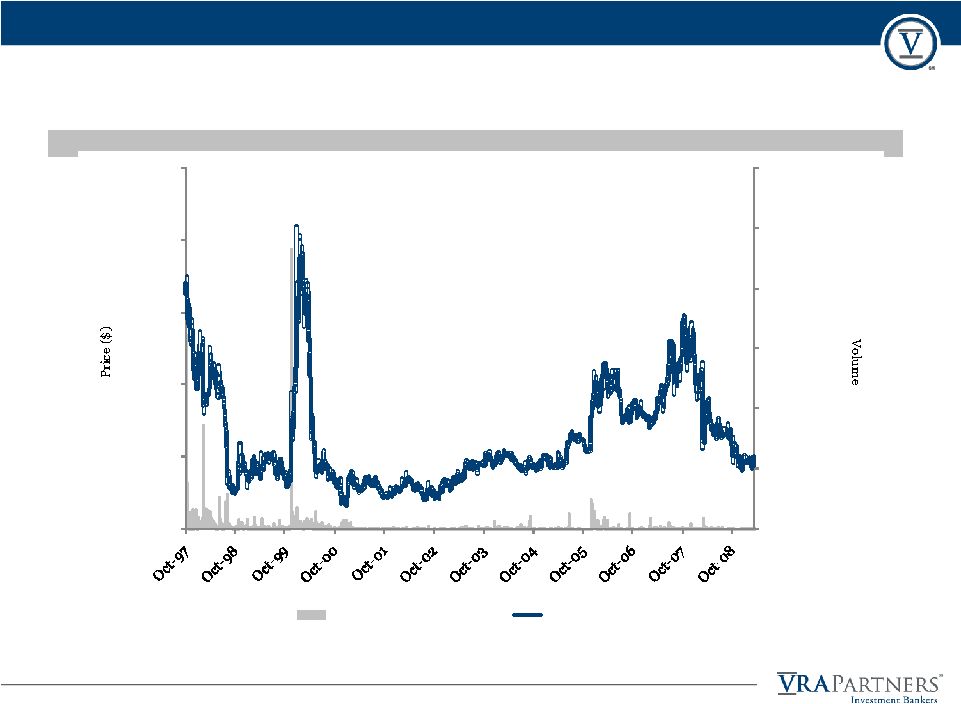 40 Logility Stock Performance and Trading Information Stock Price Performance and Trading Volume Price Volume from IPO to the Announcement Date 12/30/1999: High - $21.00 12/29/2000: Low - $1.56 0 1,000,000 2,000,000 3,000,000 4,000,000 5,000,000 6,000,000 $0.00 $5.00 $10.00 $15.00 $20.00 $25.00 Logility Trading Volume Logility Share Price |
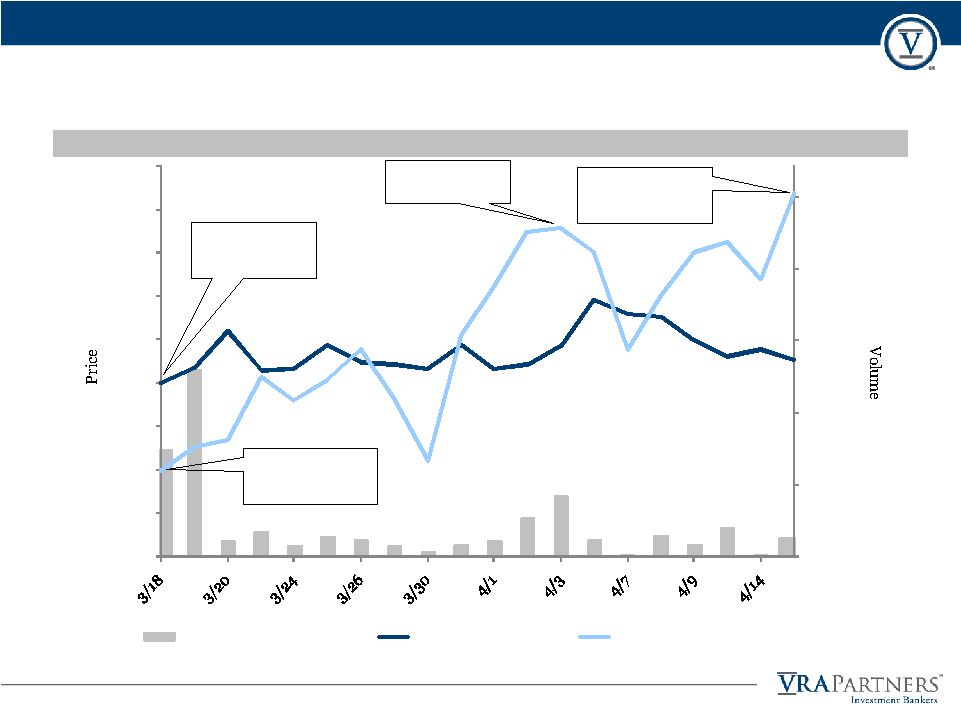
 41 Logility Stock Performance and Trading Information Stock Price Performance and Trading Volume Price Volume from the Announcement Date to Current As of 4/15/2009. Trading Information 3/18/2009: Low - $5.00 4/6/2009: High - $5.48 Trading Date High Low Close Volume 4/15/2009 $5.16 $5.11 $5.13 2,450 4/14/2009 5.19 5.16 5.19 210 4/13/2009 5.25 5.10 5.15 4,070 4/9/2009 5.25 5.24 5.25 1,650 4/8/2009 5.38 5.11 5.38 2,850 4/7/2009 5.40 5.14 5.40 200 4/6/2009 5.48 5.14 5.48 2,190 4/3/2009 5.48 5.10 5.21 8,400 4/2/2009 5.22 5.00 5.11 5,340 4/1/2009 5.08 4.99 5.08 2,040 3/31/2009 5.22 5.03 5.22 1,620 3/30/2009 5.08 4.98 5.08 710 3/27/2009 5.11 5.08 5.11 1,400 3/26/2009 5.12 5.06 5.12 2,300 3/25/2009 5.22 5.05 5.22 2,670 3/24/2009 5.08 5.03 5.08 1,450 3/23/2009 5.26 5.07 5.07 3,460 3/20/2009 5.57 5.24 5.30 2,100 3/19/2009 5.71 4.90 5.09 25,870 3/18/2009 5.00 4.13 5.00 14,900 0 5,000 10,000 15,000 20,000 25,000 30,000 $4.50 $4.75 $5.00 $5.25 $5.50 $5.75 3/18 3/21 3/24 3/27 3/30 4/2 4/5 4/8 4/11 4/14 Logility Trading Volume Logility Share Prce |
 42 Logility Stock Performance and Trading Information American Software Stock Price Performance and Trading Volume Price Volume from the Announcement Date to Current As of 4/15/2009. Trading Information 3/18/2009: Low - $4.49 4/15/2009: High - $6.09 Trading Date High Low Close Volume 4/15/2009 $6.10 $5.48 $6.09 74,200 4/14/2009 5.82 5.40 5.60 41,120 4/13/2009 5.81 5.42 5.81 53,610 4/9/2009 5.84 5.47 5.75 111,570 4/8/2009 5.54 5.16 5.50 58,990 4/7/2009 5.74 5.18 5.19 58,400 4/6/2009 5.87 5.55 5.75 40,530 4/3/2009 5.93 5.66 5.89 43,350 4/2/2009 6.00 5.67 5.87 114,190 4/1/2009 5.56 5.03 5.56 56,850 3/31/2009 5.49 4.50 5.27 540,260 3/30/2009 4.89 4.51 4.55 47,820 3/27/2009 5.23 4.80 4.91 44,380 3/26/2009 5.19 5.01 5.19 62,410 3/25/2009 5.08 4.72 5.02 51,530 3/24/2009 5.19 4.87 4.90 51,460 3/23/2009 5.03 4.62 5.03 105,840 3/20/2009 4.82 4.47 4.67 113,190 3/19/2009 4.67 4.30 4.63 62,540 3/18/2009 4.49 3.95 4.49 52,870 0 100,000 200,000 300,000 400,000 500,000 600,000 $3.50 $4.00 $4.50 $5.00 $5.50 $6.00 $6.50 3/18 3/21 3/24 3/27 3/30 4/2 4/5 4/8 4/11 4/14 American Software Trading Volume American Software Share Price |
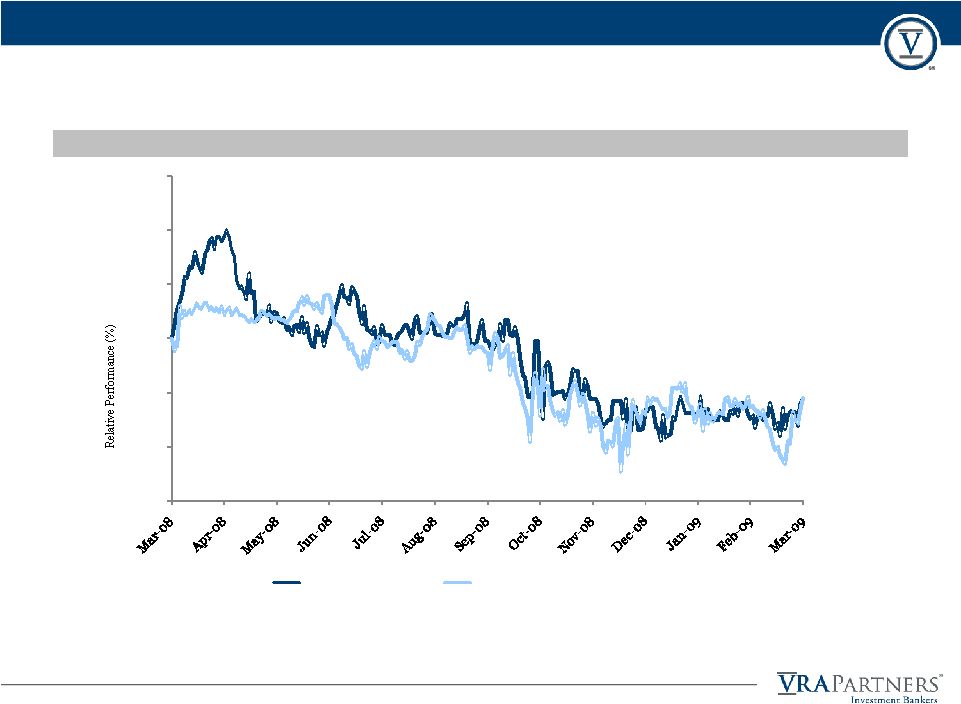
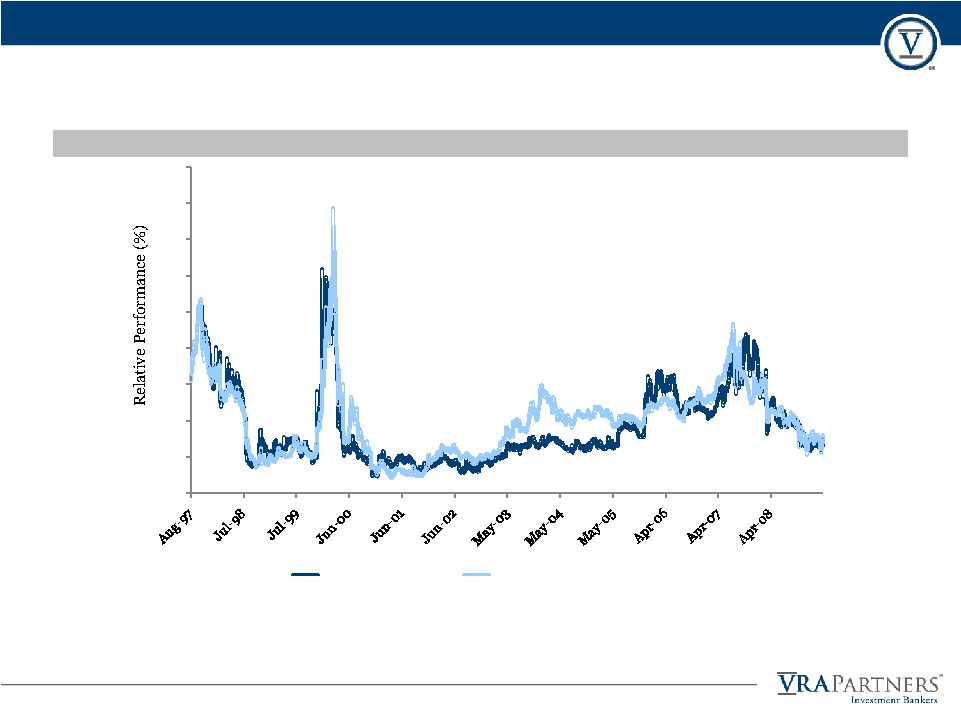
 43 Logility Stock Performance and Trading Information Logility Versus Major Market Indices Last Twelve Months Preceding the Announcement Date Last Three Years Preceding the Announcement Date (1) Includes Epicor Software Corp. (EPIC), I2 Technologies, Inc. (ITWO), JDA Software Group Inc. (JDAS), Lawson Software, Inc. (LWSN), Manhattan Associates, Inc. (MANH), Oracle Corp. (ORCL), QAD Inc. (QADI) and SAP AG (SAP). % Change Logility (22.24%) American Software (21.91%) Russell 2000 (38.76%) NASDAQ (34.26%) Enterprise Software (1) (24.12%) % Change Logility (52.61%) American Software (34.93%) Russell 2000 (43.99%) NASDAQ (35.56%) Enterprise Software (1) (8.80%) 40 60 80 100 120 140 160 Logility American Software Russell 2000 NASDAQ Enterprise Software (1) 0 50 100 150 200 250 Logility American Software Russell 2000 NASDAQ Enterprise Software (1) |
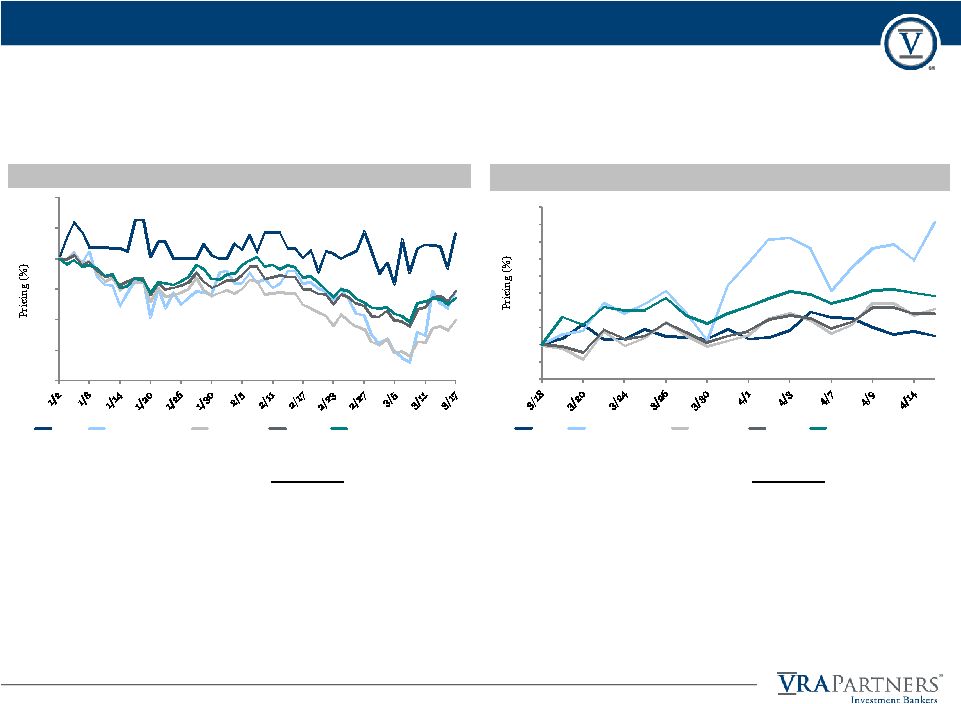 44 Logility Stock Performance and Trading Information Logility Versus Major Market Indices January 1, 2009 to the Announcement Date Announcement Date to Current % Change Logility 8.22% American Software (10.85%) Russell 2000 (20.21%) NASDAQ (10.42%) Enterprise Software (1) (13.05%) % Change Logility 2.60% American Software 35.63% Russell 2000 10.42% NASDAQ 9.09% Enterprise Software (1) 14.17% 60 70 80 90 100 110 120 Logility American Software Russell 2000 NASDAQ Enterprise Software (1) 90 95 100 105 110 115 120 125 130 135 140 Logility American Software Russell 2000 NASDAQ Enterprise Software (1) As of April 15, 2009. (1) Includes Epicor Software Corp. (EPIC), I2 Technologies, Inc. (ITWO), JDA Software Group Inc. (JDAS), Lawson Software, Inc. (LWSN), Manhattan Associates, Inc. (MANH), Oracle Corp. (ORCL), QAD Inc. (QADI) and SAP AG (SAP). |
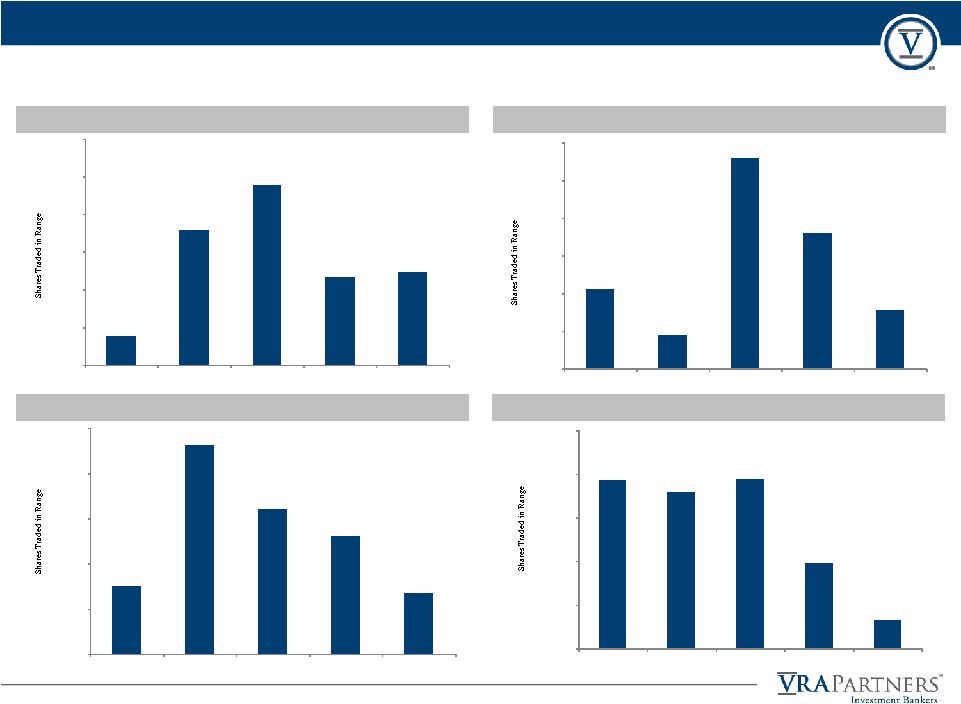 $1.56 - $5.44 $5.45 -$9.33 $9.34 - $13.22 $13.23 - $17.11 $17.12 -$21.00 0 5,000,000 10,000,000 15,000,000 20,000,000 25,000,000 0 500,000 1,000,000 1,500,000 2,000,000 2,500,000 $4.00 - $6.17 $6.18 - $8.34 $8.35 - $10.51 $10.52 - $12.68 $12.69 - $14.85 0 100000 200000 300000 400000 500000 600000 $4.00 - $5.00 $5.01 - $6.00 $6.01 - $7.00 $7.01 - $8.00 $8.01 - $9.00 $4.12 - $4.31 $4.32 - $4.50 $4.51 - $4.69 $4.70 - $4.88 $4.89 - $5.07 0 10,000 20,000 30,000 40,000 50,000 60,000 45 Logility Stock Performance and Trading Information Logility Trading Distribution January 1, 2009 to Announcement Date 5.4% 25.9% 34.4% 16.7% 17.6% Last Three Years Preceding Announcement Date 11.3% 34.9% 24.2% 19.6% 10.1% Last Twelve Months Preceding Announcement Date 15.3% 6.5% 40.8% 26.1% 11.3% IPO to Announcement Date 27.7% 25.7% 27.9% 14.0% 4.7% |
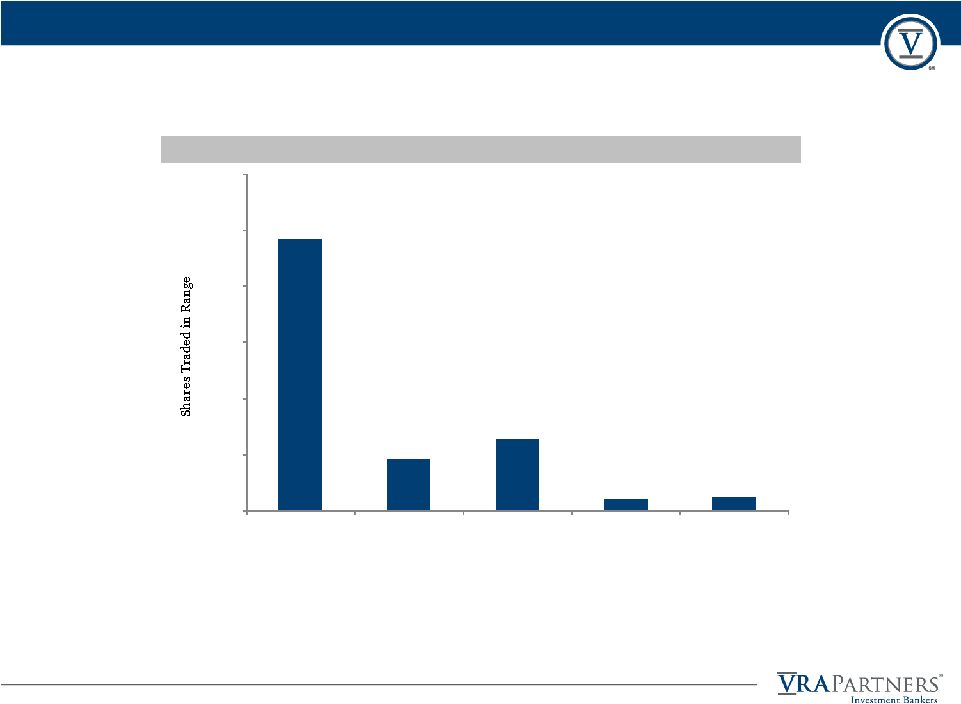 $5.00 - $5.09 $5.10 - $5.19 $5.20 - $5.28 $5.29 - $5.38 $5.39 - $5.48 0 10,000 20,000 30,000 40,000 50,000 60,000 46 Logility Stock Performance and Trading Information Logility Trading Distribution Announcement Date to Current 64.9% 12.1% 17.0% 2.8% 3.2% As of 4/15/2009. |
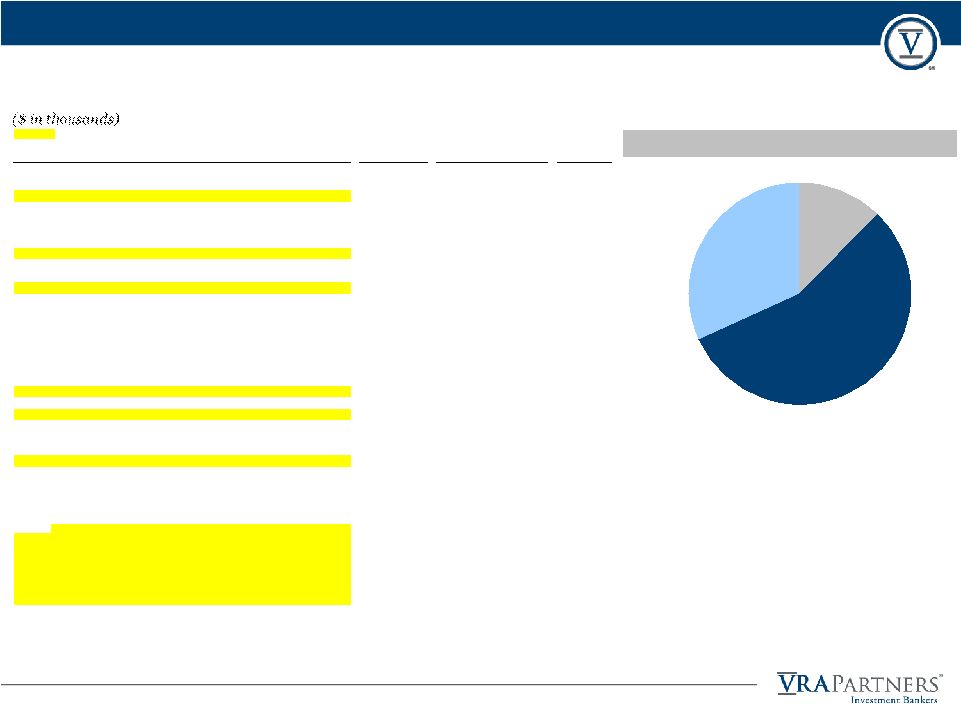
 47 Valuation Methodology Summary Financials The following chart summarizes the financial information used in VRA’s valuation analysis: ($ in thousands) Relevant Period LTM Calendar 1/31/2009 2009E Revenue $42,392 $40,662 Maintenance Revenue $23,246 Not used Adjusted EBITDA $9,685 $9,062 Adjusted EBIT $9,178 Not used Adjusted Net Income $6,189 $5,927 Book Value $50,563 Not used Tangible Book Value $44,754 Not used |
 48 Financial and Trading Data for Reference Publicly Traded Companies Reference Public Company Analysis Financial Data ($ in millions) As of 4/15/2009. Note: Financial data as of most recent company filings. (1)Market value of equity plus net debt. (2)Excludes non-recurring and extraordinary items. Equity Market Enterprise Total Latest Twelve Months Company Name Value Value (1) Cash Debt Revenue EBITDA (2) EBITDA% EBIT (2) EBIT% Selected Enterprise Software Companies Epicor Software Corporation 269.0 504.7 89.8 325.5 487.9 76.3 15.6% 68.1 14.0% I2 Technologies, Inc. 181.8 23.1 243.8 85.1 255.8 39.0 15.3% 35.5 13.9% JDA Software Group Inc. 379.6 346.9 32.7 0.0 390.3 97.4 24.9% 87.7 22.5% Lawson Software, Inc. 818.2 745.8 317.8 245.4 804.2 106.4 13.2% 90.4 11.2% Manhattan Associates, Inc. 339.0 250.3 88.7 0.0 337.2 53.8 15.9% 44.3 13.1% Oracle Corp. 92,641.7 92,585.7 11,294.0 11,238.0 23,630.0 11,144.0 47.2% 10,880.0 46.0% QAD Inc. 91.7 77.2 31.5 17.0 263.4 7.0 2.7% (3.2) NM SAP AG 36,043.6 36,965.2 2,309.0 3,230.6 15,454.2 5,075.0 32.8% 4,312.0 27.9% American Software, Inc. $154.0 $83.6 $70.3 $0.0 $80.7 $9.4 11.6% $7.8 9.7% Logility Inc. 66.2 18.9 47.3 0.0 42.4 9.7 22.8% 9.2 21.7% |
  49 As of 4/15/2009. Note: Financial data as of most recent company filings. (1)Excludes non-cash items such as stock-based compensation, non-recurring and extraordinary items. (2)Represents cash earnings per share as presented in each company’s earnings press release. Calendar year forward looking consensus estimates provided by Reuters. (3)Represents Management’s projections as of April 3, 2009. Trading Multiples for Reference Publicly Traded Companies Reference Public Company Analysis Trading Multiples ($ in millions, except per share data) Enterprise Value to Enterprise Value to 5 Year Est. Market Value % of 52 Wk. Enterprise Value to LTM: Estimated 2009 (2) : LTM Maintenance P/E Ratio (2) EPS Growth to Tangible Company High Revenue EBITDA (1) EBIT (1) Revenue EBITDA Revenue Gross Profit LTM 2009 2010 Rate Book Value Selected Enterprise Software Companies Epicor Software Corporation 40.0% 1.03 6.6 7.4 1.10 7.6 2.62 3.50 6.8 7.7 6.8 12.0% NM I2 Technologies, Inc. 56.7% 0.09 0.6 0.7 0.10 NA 0.27 0.31 9.7 15.2 11.7 10.0% 1.60 JDA Software Group Inc. 57.5% 0.89 3.6 4.0 0.93 4.0 1.90 2.53 8.2 8.3 7.6 NA 6.43 Lawson Software, Inc. 57.1% 0.93 7.0 8.2 1.06 6.6 2.21 2.75 14.3 14.2 NM 10.0% 32.32 * Manhattan Associates, Inc. 51.9% 0.74 4.7 5.6 0.96 7.7 NA NA 10.4 23.5 18.3 12.5% 3.05 Oracle Corp. 78.7% 3.92 * 8.3 8.5 4.06 * 8.5 NA NA 12.9 13.2 11.9 14.1% NM QAD Inc. 36.8% 0.29 11.0 * NM 0.35 7.1 NA NA NM 45.8 * 49.7 * NA 2.19 SAP AG 72.2% 2.39 7.3 8.6 2.36 8.0 NA NA 11.7 11.7 10.3 10.3% 11.64 * High 78.7% 3.92 x 11.0 x 8.6 x 4.06 x 8.5 x 2.62 x 3.50 x 14.3 x 45.8 x 49.7 x 14.1% 32.32 x Mean 56.4% 0.91 5.4 6.1 0.98 7.1 1.75 2.27 10.6 13.4 11.1 11.5% 3.32 Median 56.9% 0.91 6.8 7.4 1.01 7.6 2.06 2.64 10.4 13.7 11.7 11.1% 4.74 Low 36.8% 0.09 0.6 0.7 0.10 4.0 0.27 0.31 6.8 7.7 6.8 10.0% 1.60 Excludes Oracle and SAP High 57.5% 1.03 x 11.0 8.2 x 1.10 x 7.7 x 2.62 x 3.50 x 14.3 x 45.8 x 49.7 x 12.5% 32.32 x Mean 50.0% 0.66 4.5 5.2 0.75 6.6 1.75 2.27 9.9 13.8 11.1 11.1% 3.32 Median 54.3% 0.82 5.6 5.6 0.94 7.1 2.06 2.64 9.7 14.7 11.7 11.0% 3.05 Low 36.8% 0.09 0.6 0.7 0.10 4.0 0.27 0.31 6.8 7.7 6.8 10.0% 1.60 American Software, Inc. 90.6% 1.04 x 8.9 x 10.7 x 1.02 x 6.5 x 2.95 x 3.99 x 43.7 x 30.3 x 16.6 x 17.0% 2.24 x Logility Inc. (3) 56.4% 0.45 2.0 2.1 0.47 2.1 0.81 1.04 10.7 11.2 NA NA 1.48 |
 50 Reference Public Company Analysis Multiple Analysis As of 4/15/2009. Note: Financial data as of most recent company filings. (1)Market value of equity plus net debt. (2)Excludes non-recurring and extraordinary items. Proposed Multiples for Peer Companies Acquisition at Mean Median High Low $5.10 / share Enterprise Value to Net Sales LTM 0.91 x 0.91 x 3.92 x 0.09 x 0.45 x Calendar 2009P 0.98 1.01 4.06 0.10 0.47 Enterprise Value to LTM Maintenance Net sales 1.75 x 2.06 x 2.62 x 0.27 x 0.81 x Gross Profit 2.27 2.64 3.50 0.31 1.04 Enterprise Value to EBITDA LTM 5.4 x 6.8 x 11.0 x 0.6 x 2.0 x Calendar 2009P 7.1 7.6 8.5 4.0 2.1 Enterprise Value to EBIT LTM 6.1 x 7.4 x 8.6 x 0.7 x 2.1 x Equity Value to Net Income LTM 10.6 x 10.4 x 14.3 x 6.8 x 10.7 x Calendar 2009P 13.4 13.7 45.8 7.7 11.2 Equity Value to Tangible Book Value at 1/31/2009 3.32 x 4.74 x 32.32 x 1.60 x 1.48 x |
 51 Reference Public Company Analysis Multiple Analysis – Excludes SAP and Oracle As of 4/15/2009. Note: Financial data as of most recent company filings. (1)Market value of equity plus net debt. (2)Excludes non-recurring and extraordinary items. Proposed Multiples for Peer Companies Acquisition at Mean Median High Low $5.10 / share Enterprise Value to Net Sales LTM 0.66 x 0.82 x 1.03 x 0.09 x 0.45 x Calendar 2009P 0.75 0.94 1.10 0.10 0.47 Enterprise Value to LTM Maintenance Net sales 1.75 x 2.06 x 2.62 x 0.27 x 0.81 x Gross Profit 2.27 2.64 3.50 0.31 1.04 Enterprise Value to EBITDA LTM 4.5 x 5.6 x 11.0 x 0.6 x 2.0 x Calendar 2009P 6.6 7.1 7.7 4.0 2.1 Enterprise Value to EBIT LTM 5.2 x 5.6 x 8.2 x 0.7 x 2.1 x Equity Value to Net Income LTM 9.9 x 9.7 x 14.3 x 6.8 x 10.7 x Calendar 2009P 13.8 14.7 45.8 7.7 11.2 Equity Value to Tangible Book Value at 1/31/2009 3.32 x 3.05 x 32.32 x 1.60 x 1.48 x |
 52 Reference Public Company Analysis Implied Valuation ($ in thousands, except per share data) Mean Implied Net Debt Implied Implied Logility Peer Enterprise at Equity Equity Value Valuation Metric Weighting Financials Multiple Value 1/31/2009 Value Per Share (1) Enterprise Value to Net Sales: 30.0% LTM 18.0% $42,392 0.91 x $38,566 ($47,309) $85,875 $6.61 Calendar 2009E 12.0% 40,662 0.98 39,878 (47,309) 87,187 6.71 Enterprise Value to Adjusted EBITDA: 35.0% LTM 21.0% $9,685 5.4 x $52,612 ($47,309) $99,921 $7.69 Calendar 2009P 14.0% 9,062 7.1 64,009 (47,309) 111,318 8.57 Enterprise Value to Adjusted EBIT: 10.0% LTM 10.0% $9,178 6.1 x $56,374 ($47,309) $103,683 $7.98 Equity Value to Adjusted Net Income 20.0% LTM 12.0% $6,189 10.6 x $18,260 ($47,309) $65,569 $5.05 Calendar 2009P 8.0% 5,927 13.4 32,157 (47,309) 79,466 6.12 Equity Value to Tangible Book Value 5.0% $44,754 3.32 x $101,243 ($47,309) $148,552 11.44 at 1/31/2009 Mean $50,387 $97,696 $7.52 Median 46,245 93,554 7.20 Weighted Mean 47,200 94,509 7.28 High 101,243 148,552 11.44 Low 18,260 65,569 5.05 As of 4/15/2009. *Excluded from mean NA – Not available NM – Not meaningful (1)Assumes 12,987,010 fully diluted shares outstanding. |
 53 Reference Public Company Analysis Implied Valuation – Excludes SAP and Oracle ($ in thousands, except per share data) Mean Implied Net Debt Implied Implied Logility Peer Enterprise at Equity Equity Value Valuation Metric Weighting Financials Multiple Value 1/31/2009 Value Per Share (1) Enterprise Value to Net Sales: 30.0% LTM 18.0% $42,392 0.66 x $28,094 ($47,309) $75,403 $5.81 Calendar 2009E 12.0% 40,662 0.75 30,532 (47,309) 77,841 5.99 Enterprise Value to Adjusted EBITDA: 35.0% LTM 21.0% $9,685 4.5 x $43,455 ($47,309) $90,764 $6.99 Calendar 2009P 14.0% 9,062 6.6 59,820 (47,309) 107,129 8.25 Enterprise Value to Adjusted EBIT: 10.0% LTM 10.0% $9,178 5.2 x $47,567 ($47,309) $94,876 $7.31 Equity Value to Adjusted Net Income 20.0% LTM 12.0% $6,189 9.9 x $13,965 ($47,309) $61,274 $4.72 Calendar 2009P 8.0% 5,927 13.8 34,420 (47,309) 81,729 6.29 Equity Value to Tangible Book Value 5.0% $44,754 3.32 x $101,243 ($47,309) $148,552 11.44 at 1/31/2009 Mean $44,887 $92,196 $7.10 Median 38,938 86,247 6.64 Weighted Mean 40,469 87,778 6.76 High 101,243 148,552 11.44 Low 13,965 61,274 4.72 As of 4/15/2009. *Excluded from mean NA – Not available NM – Not meaningful (1)Assumes 12,987,010 fully diluted shares outstanding. |
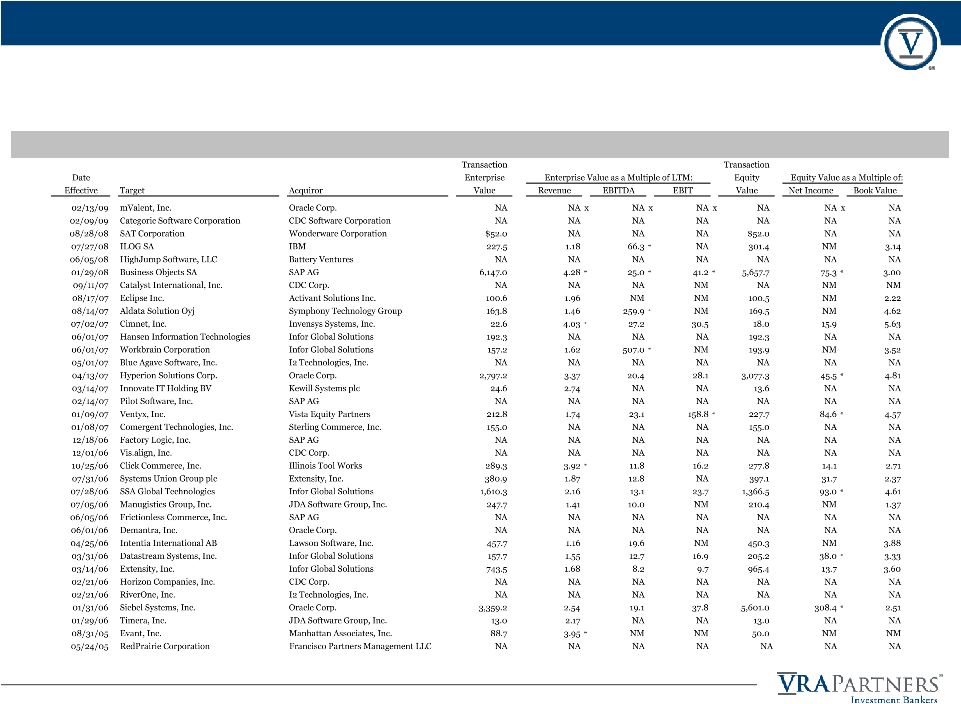 54 Precedent Merger and Acquisition Transaction Analysis Summary Summary of Precedent M&A Transactions ($ in millions) Note: Transactions include change of control premium. * Excluded from mean NA – Not available NM – Not meaningful |
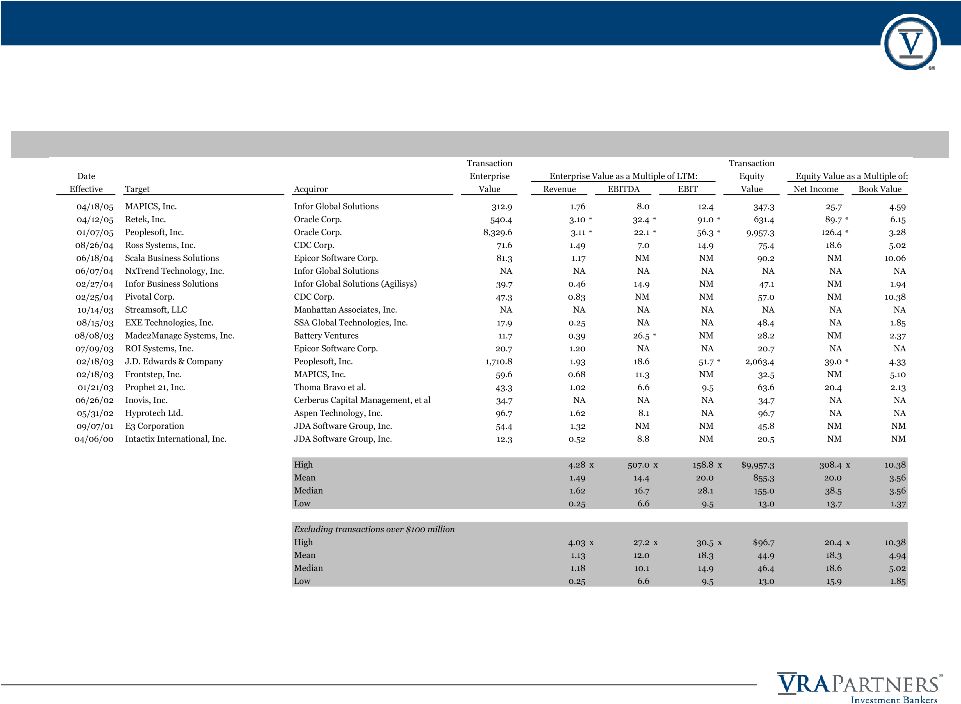 55 Precedent Merger and Acquisition Transaction Analysis Summary Summary of Precedent M&A Transactions ($ in millions) Note: Transactions include change of control premium. * Excluded from mean NA – Not available NM – Not meaningful |
 56 Precedent Merger and Acquisition Transaction Analysis Multiple Analysis Proposed Multiples for Precedent Transactions Acquisition at Mean Median High Low $5.10 / share Enterprise Value to: LTM Net Sales 1.49 x 1.62 x 4.28 x 0.25 x 0.45 x LTM Adjusted EBITDA 14.4 16.7 507.0 6.6 2.0 LTM Adjusted EBIT 20.0 28.1 158.8 9.5 2.1 Equity Value to: LTM Adjusted Net Income 20.0 x 38.5 x 308.4 x 13.7 x 10.7 x Book Value 3.56 3.56 10.38 1.37 1.31 |
 57 Precedent Merger and Acquisition Transaction Analysis Multiple Analysis – Transactions Under $100 million Proposed Multiples for Precedent Transactions Acquisition at Mean Median High Low $5.10 / share Enterprise Value to: LTM Net Sales 1.13 x 1.18 x 4.03 x 0.25 x 0.45 x LTM Adjusted EBITDA 12.0 10.1 27.2 6.6 2.0 LTM Adjusted EBIT 18.3 14.9 30.5 9.5 2.1 Equity Value to: LTM Adjusted Net Income 18.3 x 18.6 x 20.4 x 15.9 x 10.7 x Book Value 4.94 5.02 10.38 1.85 1.31 |
 58 Precedent Merger and Acquisition Transaction Analysis Implied Valuation ($ in thousands, except per share data) Mean Implied Net Debt Implied Implied Logility Transaction Enterprise at Equity Equity Value Valuation Metric Weighting Financials Multiple Value 1/31/09 Value Per Share (1) Enterprise Value to: LTM Net Sales 30.0% $42,392 1.49 x $63,175 ($47,309) $110,484 $8.51 LTM Adjusted EBITDA 35.0% $9,685 14.4 x $139,340 ($47,309) $186,649 $14.37 LTM Adjusted EBIT 10.0% $9,178 20.0 x $183,319 ($47,309) $230,628 $17.76 Equity Value to: LTM Adjusted Net Income 20.0% $6,189 20.0 x $76,560 ($47,309) $123,869 $9.54 Book Value at 1/31/2009 5.0% $50,563 3.56 x $132,884 ($47,309) $180,193 $13.87 Mean $119,056 $166,365 $12.81 Median 132,884 180,193 13.87 Weighted Mean 108,009 155,318 11.96 High 183,319 230,628 17.76 Low 63,175 110,484 8.51 *Excluded from mean NA – Not available NM – Not meaningful (1)Assumes 12,987,010 fully diluted shares outstanding. |
 59 Precedent Merger and Acquisition Transaction Analysis Implied Valuation – Transactions Under $100 million ($ in thousands, except per share data) Mean Implied Net Debt Implied Implied Logility Transaction Enterprise at Equity Equity Value Valuation Metric Weighting Financials Multiple Value 1/31/09 Value Per Share (1) Enterprise Value to: LTM Net Sales 30.0% $42,392 1.13 x $47,961 ($47,309) $95,270 $7.34 LTM Adjusted EBITDA 35.0% $9,685 12.0 x $116,113 ($47,309) $163,422 $12.58 LTM Adjusted EBIT 10.0% $9,178 18.3 x $168,223 ($47,309) $215,532 $16.60 Equity Value to: LTM Adjusted Net Income 20.0% $6,189 18.3 x $65,986 ($47,309) $113,295 $8.72 Book Value at 1/31/2009 5.0% $50,563 4.94 x $202,578 ($47,309) $249,887 $19.24 Mean $120,172 $167,481 $12.90 Median 116,113 163,422 12.58 Weighted Mean 95,176 142,485 10.97 High 202,578 249,887 19.24 Low 47,961 95,270 7.34 *Excluded from mean NA – Not available NM – Not meaningful (1)Assumes 12,987,010 fully diluted shares outstanding. |
 60 Premiums Paid Analysis Methodology VRA reviewed premiums paid in certain recently announced merger and acquisition transactions with the following criteria: Majority Shareholder Purchasing Remaining Shares —Announcement date between January 1, 2004 and Current —U.S. based target Transactions in the Application Software Sector —Announcement date between January 1, 2004 and Current —U.S. based target |
 61 Majority Shareholder Purchasing Remaining Shares Premiums Paid Analysis Implied Valuation ($ in thousands, except per share data) *Excluded from mean NA - Not available NM - Not meaningful (1) Assumes announcement date of March 18, 2009 after trading closed. (2) Assumes 12,987,010 fully diluted shares outstanding. (3) Closing price on March 18, 2009. (4) Closing price on March 12, 2009. (5) Closing price on February 5, 2009. Implied Logility Relevant Mean Equity Value Implied Net Debt at Implied Valuation Parameter (1) Stock Price Premium (%) Per Share Equity Value (2) 01/31/09 Enterprise Value Stock Price 1 Day Prior to Announcement $5.00 (3) 22.6 % $6.13 $79,627 ($47,309) $32,318 Stock Price 5 Days Prior to Announcement $4.69 (4) 22.5 % $5.75 $74,638 ($47,309) $27,329 Stock Price 30 Days Prior to Announcement $4.63 (5) 23.7 % $5.73 $74,390 ($47,309) $27,081 Mean $5.87 $76,218 $28,909 Median 5.75 74,638 27,329 High 6.13 79,627 32,318 Low 5.73 74,390 27,081 |
 62 Premiums Paid Analysis Implied Valuation Transactions in the Application Software Sector ($ in thousands, except per share data) *Excluded from mean NA - Not available NM - Not meaningful (1) Assumes announcement date of March 18, 2009 after trading closed. (2) Assumes 12,987,010 fully diluted shares outstanding. (3) Closing price on March 18, 2009. (4) Closing price on March 12, 2009. (5) Closing price on February 5, 2009. Implied Logility Relevant Mean Equity Value Implied Net Debt at Implied Valuation Parameter (1) Stock Price Premium (%) Per Share Equity Value (2) 01/31/09 Enterprise Value Stock Price 1 Day Prior to Announcement $5.00 (3) 25.1 % $6.25 $81,210 ($47,309) $33,901 Stock Price 5 Days Prior to Announcement $4.69 (4) 27.5 % $5.98 $77,631 ($47,309) $30,322 Stock Price 30 Days Prior to Announcement $4.63 (5) 32.2 % $6.12 $79,474 ($47,309) $32,165 Mean $6.12 $79,438 $32,129 Median 6.12 79,474 32,165 High 6.25 81,210 33,901 Low 5.98 77,631 30,322 |
 63 Discounted Cash Flow Analysis Free Cash Flow Calculation ($ in thousands) Historical Fiscal Year Ended April 30, Projected Fiscal Year Ending April 30, PROJECTED CASH FLOWS 2007 2008 2009 2010 2011 2012 2013 2014 Revenue $43,763 $44,908 $41,166 $41,117 $42,351 $44,468 $47,581 $50,911 % Growth NA 2.6% (8.3%) (0.1%) 3.0% 5.0% 7.0% 7.0% Cost of Revenue 14,419 15,950 12,794 12,727 13,109 13,764 14,728 15,759 Gross Margin $29,344 $28,958 $28,372 $28,390 $29,242 $30,704 $32,853 $35,153 % of Revenue 67.1% 64.5% 68.9% 69.0% 69.0% 69.0% 69.0% 69.0% Selling, General and Admin. Expenses (1) 20,133 20,004 18,857 19,560 19,925 20,698 21,909 23,443 Adjusted EBITDA (1) $9,211 $8,954 $9,515 $8,830 $9,317 $10,005 $10,944 $11,710 % of Revenue 21.0% 19.9% 23.1% 21.5% 22.0% 22.5% 23.0% 23.0% Depreciation Expense 690 649 525 781 804 845 904 967 % of Revenue 1.6% 1.4% 1.3% 1.9% 1.9% 1.9% 1.9% 1.9% Adjusted EBIT (2) $8,521 $8,305 $8,990 $8,049 $8,513 $9,161 $10,040 $10,743 Effective Tax Rate 35.2% 35.2% 35.2% 35.2% 35.2% CASH SOURCES Earnings Before Interest and After Tax $5,214 $5,514 $5,934 $6,503 $6,959 Depreciation and Amortization Expense 781 804 845 904 967 TOTAL SOURCES $5,995 $6,319 $6,778 $7,407 $7,926 CASH USES Capital Expenditures $80 $100 $100 $100 $100 Increase (Decrease) in Current Assets - Excl. Cash (12) 293 502 738 790 (Increase) Decrease in Current Liabilities - Excl. Short-Term Debt 20 (449) (771) (1,134) (1,213) Increase (Decrease) in Working Capital 8 (157) (269) (395) (423) TOTAL USES $88 ($57) ($169) ($295) ($323) FREE CASH FLOW $5,907 $6,375 $6,947 $7,702 $8,249 Note: Represents a five year discounted cash flow analysis. Forecasted 2010 financial information represents Logility management estimates. Forecasted 2011 through 2014 estimates reflect forecasted growth expectations in the supply chain management software industry by industry trade publications. (1) Excludes depreciation expense, amortization (incl. capitalized development amortization) and stock-based compensation expense. (2) Excludes capitalized development amortization and stock-based compensation expense. |
 64 Discounted Cash Flow Analysis Implied Valuation ($ in thousands, except per share data) Note: Represents a five year discounted cash flow analysis. Forecasted 2010 financial information represents Logility management estimates. Forecasted 2011 through 2014 estimates reflect forecasted growth expectations in the supply chain management software industry by industry trade publications. Discount Rate 15.00% 17.50% 20.00% 22.50% 25.00% Present Value of Cash Flows: $23,030 $21,651 $20,399 $19,260 $18,220 Present Value of Terminal Value 4.0 x $23,287 $20,913 $18,823 $16,979 $15,348 4.5 x $26,198 $23,527 $21,176 $19,102 $17,267 Exit Multiple 5.0 x $29,109 $26,141 $23,529 $21,224 $19,185 Firm Value to EBITDA 5.5 x $32,020 $28,755 $25,882 $23,347 $21,104 6.0 x $34,931 $31,369 $28,235 $25,469 $23,022 Implied Enterprise Value 4.0 x $46,317 $42,564 $39,223 $36,240 $33,568 Exit Multiple 4.5 x $49,228 $45,178 $41,576 $38,362 $35,487 Firm Value to EBITDA 5.0 x $52,139 $47,792 $43,929 $40,484 $37,406 5.5 x $55,050 $50,406 $46,282 $42,607 $39,324 6.0 x $57,960 $53,020 $48,635 $44,729 $41,243 Implied Equity Value 4.0 x $93,626 $89,873 $86,532 $83,549 $80,877 Exit Multiple 4.5 x $96,537 $92,487 $88,885 $85,671 $82,796 Firm Value to EBITDA 5.0 x $99,448 $95,101 $91,238 $87,793 $84,715 5.5 x $102,359 $97,715 $93,591 $89,916 $86,633 6.0 x $105,269 $100,329 $95,944 $92,038 $88,552 Implied Equity Value Per Share 4.0 x $7.21 $6.92 $6.66 $6.43 $6.23 Exit Multiple 4.5 x $7.43 $7.12 $6.84 $6.60 $6.38 Firm Value to EBITDA 5.0 x $7.66 $7.32 $7.03 $6.76 $6.52 5.5 x $7.88 $7.52 $7.21 $6.92 $6.67 6.0 x $8.11 $7.73 $7.39 $7.09 $6.82 |
 65 Discounted Cash Flow Analysis Sensitivity Analysis Equity Value Per Share Change in (1) EBITDA Margin (2) -10.0% -8.0% -6.0% -4.0% -2.0% 0.0% 2.0% 4.0% 6.0% 8.0% 10.0% -10.00% $4.84 $5.04 $5.23 $5.43 $5.62 $5.82 $6.02 $6.21 $6.41 $6.60 $6.80 -8.00% $4.97 $5.18 $5.39 $5.60 $5.82 $6.03 $6.24 $6.45 $6.67 $6.88 $7.09 -6.00% $5.10 $5.33 $5.56 $5.79 $6.02 $6.25 $6.48 $6.71 $6.94 $7.17 $7.40 -4.00% $5.25 $5.50 $5.75 $6.00 $6.24 $6.49 $6.74 $6.99 $7.24 $7.49 $7.74 -2.00% $5.41 $5.68 $5.94 $6.21 $6.48 $6.75 $7.02 $7.29 $7.56 $7.82 $8.09 0.00% $5.58 $5.87 $6.16 $6.45 $6.74 $7.03 $7.32 $7.61 $7.90 $8.19 $8.48 2.00% $5.75 $6.07 $6.38 $6.69 $7.01 $7.32 $7.63 $7.95 $8.26 $8.57 $8.88 4.00% $5.95 $6.28 $6.62 $6.96 $7.30 $7.63 $7.97 $8.31 $8.65 $8.98 $9.32 6.00% $6.15 $6.52 $6.88 $7.24 $7.61 $7.97 $8.33 $8.70 $9.06 $9.42 $9.79 8.00% $6.37 $6.76 $7.15 $7.54 $7.94 $8.33 $8.72 $9.11 $9.50 $9.89 $10.29 10.00% $6.60 $7.02 $7.45 $7.87 $8.29 $8.71 $9.13 $9.55 $9.97 $10.39 $10.82 Change in Projected Annual Revenue Growth (1) Represents the absolute change in projected revenue growth rate for each year in the projection period. For example, a -1.0% change to base case projected revenue growth rate of 5% results in a 4% revenue growth rate. (2) Represents the absolute change in the projected EBITDA margin for each year in the projection period. For example, a -0.50% change to management’s projected EBITDA margin of 19% results in a 18.5% EBITDA margin. |
 66 Valuation Summary Valuation Ranges ($ in thousands, except per share data) Enterprise Value Equity Value Valuation Methodology Low Median Mean Wgt. Mean High Low Median Mean Wgt. Mean High Reference Public Company Analysis $18,260 $46,245 $50,387 $47,200 $101,243 $65,569 $93,554 $97,696 $94,509 $148,552 Reference Public Company Analysis Excluding $13,965 $38,938 $44,887 $40,469 $101,243 $61,274 $86,247 $92,196 $87,778 $148,552 SAP and ORCL Precedent M&A Transaction Analysis $63,175 $132,884 $119,056 $108,009 $183,319 $110,484 $180,193 $166,365 $155,318 $230,628 Precedent M&A Transaction Analysis Transactions Under $100 Million $47,961 $116,113 $120,172 $95,176 $202,578 $95,270 $163,422 $167,481 $142,485 $249,887 Discounted Cash Flow Analysis $33,568 $43,929 $44,350 $44,350 $57,960 $80,877 $91,238 $91,659 $91,659 $105,269 Premiums Paid Analysis: Majority Shareholder Purchasing Remaining Shares $27,081 $27,329 $28,909 $28,909 $32,318 $74,390 $74,638 $76,218 $76,218 $79,627 Transactions in the Application Software Sector $30,322 $32,165 $32,129 $32,129 $33,901 $77,631 $79,474 $79,438 $79,438 $81,210 Equity Value Per Share Valuation Methodology Low Median Mean Wgt. Mean High Reference Public Company Analysis $5.05 $7.20 $7.52 $7.28 $11.44 Reference Public Company Analysis Excluding $4.72 $6.64 $7.10 $6.76 $11.44 SAP and ORCL Precedent M&A Transaction Analysis $8.51 $13.87 $12.81 $11.96 $17.76 Precedent M&A Transaction Analysis Transactions Under $100 Million $7.34 $12.58 $12.90 $10.97 $19.24 Discounted Cash Flow Analysis $6.23 $7.03 $7.06 $7.06 $8.11 Premiums Paid Analysis: Majority Shareholder Purchasing Remaining Shares $5.73 $5.75 $5.87 $5.87 $6.13 Transactions in the Application Software Sector $5.98 $6.12 $6.12 $6.12 $6.25 |
 Reference Public Company Analysis Business Descriptions 67 Company Business Description Selected Enterprise Software Companies Epicor Software Corporation Designs, develops, markets, and supports enterprise application software solutions and services; its solutions enable companies to focus on their customers, suppliers, partners, and employees through enterprise-wide management of resources and information. I2 Technologies, Inc. Provides supply chain management solutions worldwide; offers a range of products and solutions for manufacturing and planning; transportation and distribution management; merchandising, assortment, and allocation planning; execution, collaboration, and visibility; supplier relationship management; and data management and business analytics. JDA Software Group Inc. Provides enterprise software solutions and offers demand management solutions for forecasting methodologies; allocation, replenishment, and fulfillment solutions; merchandise planning solutions for strategic financial and operating planning activities; and merchandise operations systems for managing inventory. Lawson Software, Inc. Provides enterprise software; solutions include enterprise financial management, human capital management, business intelligence, asset management, enterprise performance management, supply chain management, service management, manufacturing operations, business project management, and industry-tailored applications. Manhattan Associates, Inc. Develops and provides supply chain software solutions for the planning and execution of supply chain activities worldwide; its solutions enable customers to manage their supply chain ecosystems and utilizes a service-oriented architecture and collaborative gateways to facilitate supply chain transformations Oracle Corp. Engages in the development, manufacture, distribution, servicing, and marketing of database, middleware, and application software worldwide; provides licenses for database management software, application server software, business intelligence software, identification and access management software, analytics software, content management software, development tools, and data integration software. QAD Inc. Provides enterprise software applications, professional services, and application support for manufacturing companies; offers customer-and demand-facing operations and supply chain solutions. SAP AG Develops, markets, and sells enterprise application software products; offers industry-specific solutions for midsize companies; on-demand solution for midsize companies; and SAP Business One, which provides capabilities for various work involved in managing a small business, such as financials, sales, and customer support. |
 68 Premiums Paid Analysis Majority Shareholder Purchasing Remaining Shares Implied Implied Total Transaction Transaction Premium (%) Date Transaction Equity Percent Enterprise 1 Day Prior to 5 Days Prior to 30 Days Prior to Announced Target Primary Industry Acquiror Value Value Repurchased Value Announcement Announcement Announcement 03/23/09 Cox Radio Inc. Broadcasting Cox Media Group, Inc. $65.2 $302.0 21.6% $707.7 15.1 16.9 -25.8 * % 02/27/09 Vita Food Products Inc. Packaged Foods and Meats Individual Investor (Company Director) 3.3 7.7 42.2% 7.7 250.0 * 250.0 * 400.0 * 02/26/09 OpenTV Corp. Application Software Kudelski SA 128.4 147.5 87.1% 46.3 35.0 27.4 12.5 02/09/09 Galaxy Nutritional Foods Inc. Packaged Foods and Meats Mill Road Capital; Galaxy Partners 4.6 9.7 46.9% 6.8 111.8 * 80.0 * 44.0 01/27/09 NET2S Group Internet Software and Services BT Group plc 2.4 110.3 2.2% 109.7 85.6 * 85.6 * 58.3 01/15/09 Hiland Holdings GP LP Oil and Gas Storage and Transportation Individual Investor (Company Director) 27.1 69.1 39.2% 451.1 21.2 -14.0 * 29.6 12/09/08 Global Med Technologies Inc. Application Software Victory Park Capital Advisors, LLC 32.0 37.4 85.6% 45.4 25.0 57.1 * 22.2 08/07/08 Confirmit ASA Application Software Sebastian Holdings Inc. 5.5 90.4 6.1% 81.5 0.4 0.9 28.6 07/30/08 Zones Inc. Technology Distributors Individual Investor (Company CEO) 45.3 92.6 48.9% 97.9 15.9 -6.7 * -10.6 * 07/21/08 Genentech Inc. Biotechnology Roche Holdings, Inc. 46,722.4 100,115.3 46.7% 99,217.7 16.1 26.0 27.1 06/26/08 Five Star Products Inc. Distributors National Patent Development Corp. 1.7 6.7 24.9% 37.0 33.3 33.3 14.3 04/25/08 Tarrant Apparel Group Apparel, Accessories and Luxury Goods Company Management 12.7 26.0 49.0% 44.1 28.8 30.8 26.9 03/05/08 Atari, Inc. Home Entertainment Software Infogrames Entertainment SA 11.0 22.6 48.6% 31.2 0.0 0.0 29.2 03/05/08 Nationwide Financial Services, Inc. Life and Health Insurance Nationwide 2,863.0 7,659.0 37.4% 9,550.7 28.3 18.0 19.0 02/28/08 GS AgriFuels Corporation Industrial Machinery GreenShift Corporation 1.5 14.5 10.0% 54.3 9.9 19.1 25.0 11/15/07 Atlantic Coast Entertainment Holdings Casinos and Gaming Icahn Enterprises, L.P. 12.3 211.2 5.8% 202.6 20.3 NA 22.1 10/03/07 Suntron Corp. Electronic Manufacturing Services Blum Capital, Thayer Capital Partners 3.2 31.8 10.2% 51.9 -5.0 * 5.5 5.5 09/07/07 Emerson Radio Corp. Consumer Electronics Grande Holdings Ltd. 7.3 106.1 6.8% 87.7 50.5 50.5 52.2 08/08/07 Digital Angel Corp. Electronic Equipment Manufacturers Applied Digital Solutions Inc. 32.5 72.5 44.8% 85.0 22.1 22.1 16.8 07/17/07 Alfa Corp. Property and Casualty Insurance Alfa Mutual Insurance Company 832.6 1,767.5 47.1% 2,071.3 44.4 44.6 29.5 05/14/07 Spear & Jackson Inc. Household Appliances United Pacific Industries Ltd. 4.3 11.2 38.3% 4.0 78.2 * 70.5 * 81.5 * 04/22/07 Optical Communication Products Inc. Communications Equipment Oplink Communications Inc. 78.7 187.8 41.9% 70.9 19.6 20.4 21.3 02/23/07 Refac Optical Group Specialty Stores Palisade Capital Management LLC 10.7 106.7 10.0% 106.7 50.4 56.3 52.3 02/22/07 Great American Financial Resources Life and Health Insurance American Financial Group Inc. 245.8 1,170.5 21.0% 1,203.3 13.2 15.0 11.8 01/24/07 21st Century Insurance Group Property and Casualty Insurance American International Group, Inc. 806.6 1,935.2 41.7% 2,009.7 34.6 31.2 24.9 12/20/06 Crested Corp. Diversified Metals and Mining US Energy Corp. 12.4 42.8 29.0% 52.6 14.2 13.2 7.8 10/07/05 Micro Therapeutics Inc. Healthcare Equipment ev3, Inc. 93.6 312.7 29.9% 309.7 9.8 15.2 7.6 01/17/05 Unitedglobalcom Inc. Alternative Carriers Liberty Global Inc. 3,481.4 7,503.0 46.4% 11,508.8 -0.7 * 3.2 1.8 01/15/04 Phosphate Resource Partners LP Fertilizers and Agricultural Chemicals Mosaic Global Holdings Inc. 53.5 110.6 48.4% 684.6 12.1 24.0 2.7 Mean 22.6 22.5 23.7 % Median 35.9 35.6 35.8 $ in millions except per share data, * Excluded from mean NA – Not available NM – Not meaningful |
 69 Premiums Paid Analysis Transactions in the Application Software Industry Implied Implied Transaction Transaction Premium (%) Date Equity Enterprise 1 Day Prior to 5 Days Prior to 30 Days Prior to Announced Target Acquiror Value Value Announcement Announcement Announcement 02/26/09 OpenTV Corp. Kudelski SA $147.5 $46.3 35.0 27.4 12.5 % 02/14/09 Retalix Ltd. NA (not publicly disclosed) 163.1 130.4 32.5 30.7 37.7 12/09/08 Global Med Technologies Inc. Victory Park Capital Advisors, LLC 37.4 45.4 25.0 57.1 22.2 10/06/08 Guidance Software, Inc. AccessData Corporation 104.2 70.5 12.8 -1.3 * -29.8 * 09/08/08 Pharsight Corp. Tripos International 52.2 39.4 37.5 17.5 17.0 09/03/08 Captaris Inc. Open Text, Inc. 129.3 109.5 30.8 36.4 42.4 08/07/08 Confirmit ASA Sebastian Holdings Inc. 90.4 81.5 0.4 0.9 28.6 07/15/08 Intervoice Inc. Convergys Corporation 322.3 269.6 26.9 47.3 29.9 07/09/08 Confirmit ASA Sebastian Holdings Inc. 93.0 84.1 28.6 29.3 28.6 07/03/08 Financial Objects plc Temenos UK Ltd. 52.9 43.3 83.2 * 86.1 * 76.5 * 06/18/08 Insightful Corp. Tibco Software Inc. 24.3 15.3 1.1 -1.6 * 12.7 06/16/08 Motive Inc. Lucent Technologies Inc. 61.9 44.8 43.9 26.0 48.7 05/19/08 AmaTech AG SMARTRAC N.V. 0.7 0.7 -7.0 * -14.9 * -9.1 * 05/16/08 Diversified Opportunities, Inc. QRSciences Holdings Ltd. 0.6 0.7 -30.0 * -30.0 * -36.4 * 05/09/08 Confirmit ASA Sebastian Holdings Inc. 69.7 60.7 0.6 3.6 2.4 05/07/08 Enliven Marketing Technologies DG FastChannel, Inc. 76.9 79.8 6.4 6.5 6.4 04/09/08 TouchStone Software Corp. Phoenix Technologies Ltd. 17.9 17.0 18.4 26.5 34.6 03/31/08 Ansoft Corp. Ansys, Inc. 759.3 826.3 39.3 30.0 34.2 03/23/08 L-1 Secure Credentialing, Inc L-1 Identity Solutions Inc. 306.3 277.9 44.8 65.1 41.5 03/20/08 Synplicity Inc. Synopsys Inc. 211.8 215.8 52.1 54.4 85.6 03/17/08 BladeLogic, Inc. BMC Software Inc. 783.6 810.6 18.6 26.0 60.9 02/20/08 SYS Kratos Defense & Security Solutions, Inc. 52.4 54.9 65.9 71.3 77.0 01/31/08 Fundtech Ltd. Clal Industries and Investments 194.9 152.9 13.2 14.7 -6.4 * 01/16/08 BEA Systems Inc. Oracle Corp. 7,974.0 7,109.1 24.4 30.8 28.8 12/26/07 Document Sciences Corp. EMC Corporation 61.5 82.4 79.2 * 75.6 * 73.1 * 10/25/07 BravoSolution US BravoSolution SpA 4.1 13.3 -46.9 * -45.9 * -48.4 * 10/07/07 Business Objects SA SAP AG 5,657.7 6,147.0 18.2 32.4 35.1 08/28/07 NAVTEQ Corp. Nokia Inc. 7,706.6 7,611.4 28.8 34.6 46.3 08/13/07 Gensym Corp. Versata Inc. 18.5 15.5 11.9 11.9 6.8 07/20/07 Opsware Inc. Hewlett-Packard Company 1,507.8 1,626.8 35.1 50.3 42.5 07/18/07 Applix Inc. Cognos Inc. 286.8 307.8 7.6 5.7 9.8 05/15/07 Agile Software Corp. Oracle Corp. 480.3 332.5 11.6 10.4 17.7 05/02/07 Cimnet Inc. Invensys Systems, Inc. 18.0 22.6 -4.7 * 9.0 13.0 04/26/07 Arkona Inc. DealerTrack Holdings, Inc. 46.2 59.1 3.8 6.2 6.2 04/25/07 Castelle Captaris Inc. 16.2 10.4 15.2 14.5 24.2 04/11/07 Mobius Management Systems Inc. Allen Systems Group, Inc. 197.8 165.0 35.3 34.2 37.5 03/31/07 Workbrain Corporation Infor Global Solutions, Inc. 193.9 157.2 21.6 25.0 34.6 $ in millions except per share data, * Excluded from mean NA – Not available NM – Not meaningful |
 70 Premiums Paid Analysis Transactions in the Application Software Industry Implied Implied Transaction Transaction Premium (%) Date Equity Enterprise 1 Day Prior to 5 Days Prior to 30 Days Prior to Announced Target Acquiror Value Value Announcement Announcement Announcement 03/22/07 Kronos, Inc. Hellman & Friedman; JMI Equity 1,767.1 1,777.6 21.8 35.4 35.9 03/14/07 Pitney Bowes Software Pitney Bowes Inc. 440.8 390.5 54.8 49.2 44.4 03/05/07 CorVu Corp. Rocket Software, Inc. 19.8 25.0 42.9 14.3 29.0 02/28/07 Hyperion Solutions Corp. Oracle Corp. 3,077.3 2,797.2 20.7 15.9 25.4 02/11/07 Witness Systems Inc. Verint Systems Inc. 939.1 935.8 23.5 20.9 29.7 01/26/07 Altiris Inc. Symantec Corporation 969.8 875.6 23.1 25.6 27.9 11/18/06 Netsmart Technologies Inc. Bessemer Venture; InSight Venture 108.0 109.1 12.2 26.5 25.4 11/16/06 ACD Systems International Inc. Management 10.7 1.5 163.6 * 90.2 * 100.0 * 10/23/06 MetaSolv Inc. Oracle Corp. 209.1 163.9 23.5 19.5 36.7 10/18/06 OpenTV Corp. Kudelski SA 420.8 361.9 26.3 28.1 20.4 10/14/06 Open Solutions Inc. Providence Equity; Carlyle Group 769.5 1,283.4 25.5 29.2 34.1 08/31/06 Intergraph Corp. Hellman & Friedman; JMI Equity; TPG 1,294.3 1,083.2 18.0 20.9 26.6 08/28/06 InterVideo Inc. Corel Corporation 182.5 95.8 35.4 34.4 33.1 08/09/06 FileNet Corporation IBM 1,485.4 1,114.5 1.7 10.4 28.1 08/07/06 Reynolds & Reynolds Co. The Reynolds and Reynolds Company 2,571.4 2,841.2 14.0 13.0 31.2 08/03/06 MRO Software Inc. IBM 686.9 587.9 19.4 33.5 24.6 07/25/06 Mercury Interactive Corp. Hewlett-Packard Company 4,638.3 4,322.0 34.5 37.2 46.7 06/05/06 Onyx Software Corp. Made2Manage Systems, Inc. 88.8 73.9 14.6 11.6 5.0 05/14/06 SSA Global Technologies, Inc. Infor Global Solutions, Inc. 1,366.5 1,610.3 25.1 24.0 25.8 04/24/06 Manugistics Group Inc. JDA Software Group Inc. 210.4 247.7 4.2 8.7 16.3 04/11/06 Portal Software Inc. Oracle Corp. 211.7 217.4 12.6 17.5 39.6 03/10/06 Artemis International Solutions Corp. Versata Inc. 17.4 28.3 18.5 28.0 14.3 03/01/06 Dassault Systems Enovia Corp. Dassault Systemes SA 378.8 310.3 19.4 24.1 38.6 02/07/06 Segue Software Inc. Borland Software Corp. 103.8 98.9 27.9 30.4 27.5 01/04/06 Datastream Systems Inc. Infor Global Solutions, Inc. 205.2 157.7 15.3 24.4 29.1 12/19/05 NEON Systems Inc. DataDirect Technologies 59.3 51.3 31.9 26.5 47.6 12/07/05 Versata Inc. Trilogy Software, Inc. 3.3 0.0 90.6 * 90.6 * 82.0 * 11/15/05 Intellisync Corp. Nokia Corp. 354.3 411.1 -9.5 * 7.1 23.5 11/06/05 Extensity Inc. Golden Gate Capital 965.6 743.7 26.2 26.7 21.4 11/03/05 Verity Inc. Autonomy Corp. plc 484.0 353.4 28.7 36.4 32.4 10/20/05 Captiva Software Corp. EMC Corporation 297.5 315.8 24.5 32.1 10.2 09/26/05 HPL Technologies Inc. Synopsys Inc. 12.4 11.4 3.4 0.0 -14.3 * 09/21/05 CCC Information Services Group Inc. Investcorp 442.0 634.5 2.6 5.4 10.5 09/12/05 Seibel Systems, Inc. Oracle Corp. 5,601.0 3,359.2 16.8 28.3 29.4 08/03/05 E.piphany Inc. SSA Global Technologies, Inc. 325.8 159.6 7.7 11.1 18.3 07/29/05 Extended Systems Inc. Sybase, Inc. 69.5 61.3 29.7 24.3 39.4 07/29/05 MDSI Mobile Data Solutions Inc. Vista Equity Partners 67.2 45.6 55.3 62.9 60.0 $ in millions except per share data, * Excluded from mean NA – Not available NM – Not meaningful |
 71 Premiums Paid Analysis Transactions in the Application Software Industry Implied Implied Transaction Transaction Premium (%) Date Equity Enterprise 1 Day Prior to 5 Days Prior to 30 Days Prior to Announced Target Acquiror Value Value Announcement Announcement Announcement 07/05/05 Aspect Communications Corp. Aspect Software, Inc. 714.7 792.8 3.6 1.0 14.1 06/27/05 SeeBeyond Technology Corp. Sun Microsystems Inc. 364.6 291.6 34.1 33.7 39.3 06/09/05 Niku Corp. CA, Inc. 321.1 283.3 27.3 33.3 71.4 05/12/05 Infodata Systems Inc. McDonald Bradley, Inc. 7.4 5.7 -2.5 * 0.0 -9.5 * 04/28/05 MDI Achieve Inc. Logibec Groupe Informatique Ltee 27.0 24.9 31.0 31.8 51.3 04/17/05 Adobe Macromedia Software LLC Adobe Systems Inc. 3,692.8 3,314.6 25.1 18.1 19.3 04/07/05 Concord Communications Inc. CA, Inc. 314.5 331.9 71.0 68.0 64.1 03/31/05 Corillian Payment Solutions, Inc. Corillian Corporation 22.4 21.2 33.6 38.1 3.6 03/20/05 Pinnacle Systems Inc. Avid Technology Inc. 453.3 361.2 30.2 52.6 51.2 03/13/05 Ascential Software Corp. IBM 1,324.8 844.1 17.8 16.7 15.6 01/26/05 MAPICS Inc. Infor Global Solutions, Inc. 375.9 341.2 14.6 14.0 25.3 01/17/05 IMPAC Medical Systems Inc. Elekta AB 239.8 197.4 21.5 21.2 25.7 01/07/05 JPMorgan Chase Vastera, Inc. JPMorgan Chase Bank, National Association 126.8 74.9 50.0 14.1 23.0 01/03/05 Tecnomatix Technologies Ltd. Siemens PLM Software 207.4 224.5 10.6 21.2 32.8 12/16/04 Veritas Software Corp. Symantec Corporation 12,973.7 11,335.1 9.1 23.1 39.0 12/01/04 Nassda Corp. Synopsys Inc. 192.2 90.8 63.6 60.9 89.7 * 08/10/04 Primus Knowledge Solutions, Inc. Art Technology Group Inc. 28.8 21.7 17.2 15.0 24.5 06/29/04 Inet Technologies Inc. Tektronix, Inc. 483.7 311.6 13.6 17.0 38.1 06/28/04 Catalyst International Inc. Comvest Investment Partners 19.7 21.6 78.6 92.3 78.6 05/07/04 Viziqor Solutions Behrman Capital; Quadrangle Capital 1.8 34.9 -63.6 * -60.0 * -66.7 * 04/28/04 Marimba Inc. BMC Software Inc. 217.5 185.6 62.1 59.6 40.1 04/10/04 SciQuest, Inc. Trinity Ventures 25.3 14.8 57.2 66.7 58.4 04/06/04 Barra Inc. MSCI Inc. 859.2 651.8 9.0 17.3 21.2 03/01/04 Landacorp Inc. SHPS Holdings, Inc. 50.0 35.6 3.0 3.7 -4.0 * 02/04/04 Novadigm Inc. Hewlett-Packard Company 138.7 117.0 23.3 33.1 48.7 01/27/04 Sanchez Computer Associates Inc. Fidelity Information Services, Inc. 175.4 147.1 14.8 39.5 68.4 Mean 25.1 27.5 32.2 % Median 22.5 25.8 28.9 $ in millions except per share data, * Excluded from mean NA – Not available NM – Not meaningful |