 May 6, 2009 Discussion Materials VRA Partners, LLC is a Member FINRA/SIPC. Exhibit (a)(6) |
 2 Preface The information contained herein was prepared by VRA Partners, LLC (“VRA”) in connection with our engagement to advise the Special Committee (the “Special Committee”) of the Board of Directors of Logility, Inc. (“Logility” or the “Company”). Pursuant to a press release dated March 18, 2009, American Software, Inc. (the “Prospective Acquiror) announced its intention to acquire all of the outstanding shares of Logility’s common stock not already owned by the Prospective Acquiror at a price of $5.10 per share in cash (the “Proposed Acquisition”). On May 6, 2009, the Special Committee of the Board of Directors of the Prospective Acquiror communicated to the Special Committee of Logility an increased offer price of $6.35 per share in cash, representing an increase of 24.5% over the initial $5.10 per share offer. In addition to advising the Special Committee regarding the Proposed Acquisition, VRA, if appropriate, will render an opinion to the Special Committee with respect to the fairness, from a financial point of view, to the Company’s shareholders other than American Software, Inc. and any of its affiliates, of the consideration to be received in the Proposed Acquisition. This information and our analyses are not intended to be, nor should be, relied upon by any other party. Any disclosure of the contents of this document to third parties by the Special Committee requires VRA’s written consent. This document was prepared utilizing information provided by Logility and American Software, Inc. and obtained from certain other publicly available sources. VRA has relied without independent verification upon the accuracy and completeness of the financial and other information discussed with or reviewed by us for purposes of our analyses except where we have actual knowledge as to the inaccuracy of incompleteness of such information. With respect to the financial forecasts of Logility provided to or discussed with us, we have assumed, without independent verification or investigation, that such forecasts have been reasonably prepared on bases reflecting the best currently available information, estimates and judgments of the management of Logility as to the future financial performance of the Company, and we express no opinion with respect to such forecasts or the assumptions on which the forecasts are based. VRA has not conducted a physical inspection of the properties and facilities of the Company and has not made any evaluations or appraisals of the assets or liabilities (including, without limitation, any potential environmental liabilities), contingent or otherwise, of the Company. VRA’s analyses must be considered as a whole. Selecting portions of our analyses, without considering all analyses, would create an incomplete view. Individual estimates of value contained on our analyses are not necessarily indicative of actual value, which may be significantly more or less favorable than as set forth therein. Estimates of the financial value of reference companies and their securities do not purport to be appraisals or necessarily reflect the actual values of such companies or their securities. Because such estimates are inherently subject to uncertainty, VRA does not assume responsibility for their accuracy. Our analyses are necessarily based upon market, economic and other conditions as they exist on, and can be evaluated as of, the date hereof. It should be understood that, although subsequent developments may affect these analyses, VRA does not have any obligation to update or revise its analyses. |
 3 On March 18, 2009, American Software, Inc. (“ASI” or the “Prospective Acquiror”) publicly announced that it intends to purchase up to all the outstanding common stock of Logility, Inc. (“Logility” or the “Company”) not currently owned by ASI at a price per share of $5.10 (the “Proposed Acquisition”) in cash through a tender offer. On May 6, 2009, the Special Committee of the Board of Directors of the Prospective Acquiror communicated to the Special Committee of Logility an increased offer price of $6.35 per share in cash, representing a 24.5% increase over the initial $5.10 per share offer. ASI is currently the majority shareholder of Logility, controlling approximately 11,300,000 shares, or 87.9%, of the common shares outstanding of Logility. If ASI is able to acquire all of the outstanding common stock currently not owned by ASI at the revised proposed price of $6.35 per share, ASI would acquire 1,560,145 common shares and 184,271 net in-the-money options representing total consideration of $11,077,042. The Proposed Acquisition purchase price of $6.35 per share implies the following equity value and enterprise value for the Company: Transaction Overview Summary (1) As of March 5, 2009. (2) Based on offer price of $6.35 per share. 12,860,145 184,271 13,044,416 $6.35 $82,832,042 0 47,309,000 Common Stock Shares Outstanding (1) Vested "In-the-Money" Options Outstanding, Net of Exercise Price (2) Common Stock Shares Outstanding Price Per Share Implied Equity Value Plus: Debt as of 01/31/2009 Less: Cash and Investments as of 01/31/2009 Implied Enterprise Value $35,523,042 |
 4 Logility currently has 607,450 options outstanding, including 535,650 vested and 71,800 unvested options: Transaction Overview Options Outstanding Vested Options Incremental Vested Aggregate Exercise Net Value of Options Common Share Equivalent Exercise Price Range Options Proceeds at $6.35/share at $6.35/share $1.69-$5.10 413,400 $1,461,326 $1,163,764 183,270 $5.11-$7.00 12,050 $71,630 6,357 1,001 $7.01-$9.00 81,200 $640,694 0 0 $9.01-$11.00 20,000 $200,360 0 0 $11.01-$16.25 9,000 $123,120 0 0 Total 535,650 $2,497,130 $1,170,121 184,271 Unvested Options Incremental Unvested Aggregate Exercise Net Value of Options Common Share Equivalent Exercise Price Range Options Proceeds at $6.35/share at $6.35/share $1.69-$5.10 0 $0 $0 0 $5.11-$7.00 0 $0 0 0 $7.01-$9.00 67,800 $553,506 0 0 $9.01-$11.00 4,000 $43,840 0 0 $11.01-$16.25 0 $0 0 0 Total 71,800 $597,346 $0 0 Total Vested and 607,450 $3,094,476 $1,170,121 184,271 Unvested |
 5 Transaction Overview Transaction Structure and Summary Analysis ($ in thousands, except per share data) Note: Assumes announcement date of March 18, 2009. (1) Average closing price for relevant number of days including and preceding March 18, 2009. (2) Based on 12,860,145 shares outstanding as of 03/05/2009 plus 184,271 shares from the exercise of in-the-money vested stock options. (3) Based on 12,860,145 shares outstanding as of 03/05/2009 plus 126,865 shares from the exercise of in-the-money vested stock options. (4) Excludes excess cash and investments of $47,309,000 as of 01/31/2009. Initial Revised Proposed Acquisition Proposed Acquisition Current Price Per Share Offer Price Per Share Offer Price Per Share As of 05/05/2009 $5.10 $6.35 $5.11 '% Premium (Discount) to Closing Share Price of $5.00 on 03/18/2009 2.0% 27.0% 2.2% % Premium (Discount) to Average Closing Price: (1) 360 Day (15.9%) 4.7% (15.8%) 180 Day 3.5% 28.8% 3.7% 90 Day 11.4% 38.7% 11.6% 60 Day 10.9% 38.1% 11.1% 30 Day 11.5% 38.8% 11.7% 15 Day 11.6% 38.9% 11.8% '% Premium (Discount) to 52-Week High ($8.13 on 04/21/2008) (37.3%) (21.9%) (37.1%) '% Premium (Discount) to 52-Week Low ($3.89 on 03/12/2009) 31.1% 63.2% 31.4% Market Value $66,234 (2) $82,832 (3) $66,364 (2) Enterprise Value (4) $18,925 $35,523 $19,055 |
 6 Transaction Overview Transaction Structure and Summary Analysis Initial Revised Proposed Acquisition Proposed Acquisition Current Price Per Share Offer Price Per Share Offer Price Per Share As of 05/05/2009 $5.10 $6.35 $5.11 Enterprise Value to: LTM Total Revenue 0.45 x 0.84 x 0.45 x Fiscal 2009 Projected Total Revenue 0.46 0.86 0.46 Calendar 2009 Projected Total Revenue 0.47 0.87 0.47 Fiscal 2010 Projected Total Revenue 0.46 0.86 0.46 LTM Maintenance Revenue 0.81 x 1.53 x 0.82 x Fiscal 2009 Projected Maintenance Revenue 0.82 1.54 0.83 Calendar 2009 Projected Maintenance Revenue 0.82 1.54 0.82 Fiscal 2010 Projected Maintenance Revenue 0.82 1.53 0.82 LTM Maintenance Gross Margin 1.04 x 1.95 x 1.04 x Fiscal 2009 Projected Maintenance Gross Margin 1.04 1.95 1.05 Calendar 2009 Projected Maintenance Gross Margin 1.04 1.95 1.05 Fiscal 2010 Projected Maintenance Gross Margin 1.04 1.94 1.04 LTM Adjusted EBITDA 2.0 x 3.7 x 2.0 x Fiscal 2009 Projected Adjusted EBITDA 2.0 3.7 2.0 Calendar 2009 Projected Adjusted EBITDA 2.1 3.9 2.1 Fiscal 2010 Projected Adjusted EBITDA 2.1 4.0 2.2 LTM Adjusted EBIT 2.1 x 3.9 x 2.1 x Fiscal 2009 Projected Adjusted EBIT 2.1 4.0 2.1 Calendar 2009 Projected Adjusted EBIT 2.2 4.2 2.3 Fiscal 2010 Projected Adjusted EBIT 2.4 4.4 2.4 Equity Value to: LTM Adjusted Net Income 10.7 x 13.4 x 10.7 x Fiscal 2009 Projected Adjusted Net Income 11.1 13.8 11.1 Calendar 2009 Projected Adjusted Net Income 11.2 14.0 11.2 Fiscal 2010 Projected Adjusted Net Income 11.4 14.3 11.4 Tangible Book Value as of 01/31/2009 1.48 x 1.85 x 1.48 x Note: Fiscal represents the year ending April 30. Calendar year represents the 12 months ending January 31. Note: Adjustments include stock based compensation and amortization of acquisition-related intangibles. Note: Forward multiples based on management projections provided April 3, 2009. |
 7 Overview of Logility Relationship with ASI Logility is currently 87.9% owned by ASI. ASI financial reporting includes Logility. Logility and ASI Comparison ($ in thousands, except per share data) Logility ASI Share Price as of 05/05/2009 $6.35 (1) $5.05 Market Capitalization $82,832 $127,669 Debt as of 01/31/2009 $0 $0 Cash and Investments as of 01/31/2009 $47,309 $70,321 Enterprise Value $35,523 $57,348 Financial Data: LTM Revenue $42,392 $80,673 LTM Adjusted EBITDA $9,685 $9,352 LTM Adjusted EBIT $9,178 $7,831 LTM Adjusted Net Earnings $6,189 $3,483 Trading Multiples: EV/LTM Revenue 0.84x 0.71x EV/LTM EBITDA 3.7x 6.1x EV/LTM EBIT 3.9x 7.3x LTM P/E Ratio 13.4x 36.2x % of 52-Week High 70.2% 75.1% Three Month Average Trading Volume 3,240 66,660 Stock Price Change Since Announcement Date 27.0% 12.5% Dividends Per Share $0.00 $0.36 (1) Represents revised offer price. |
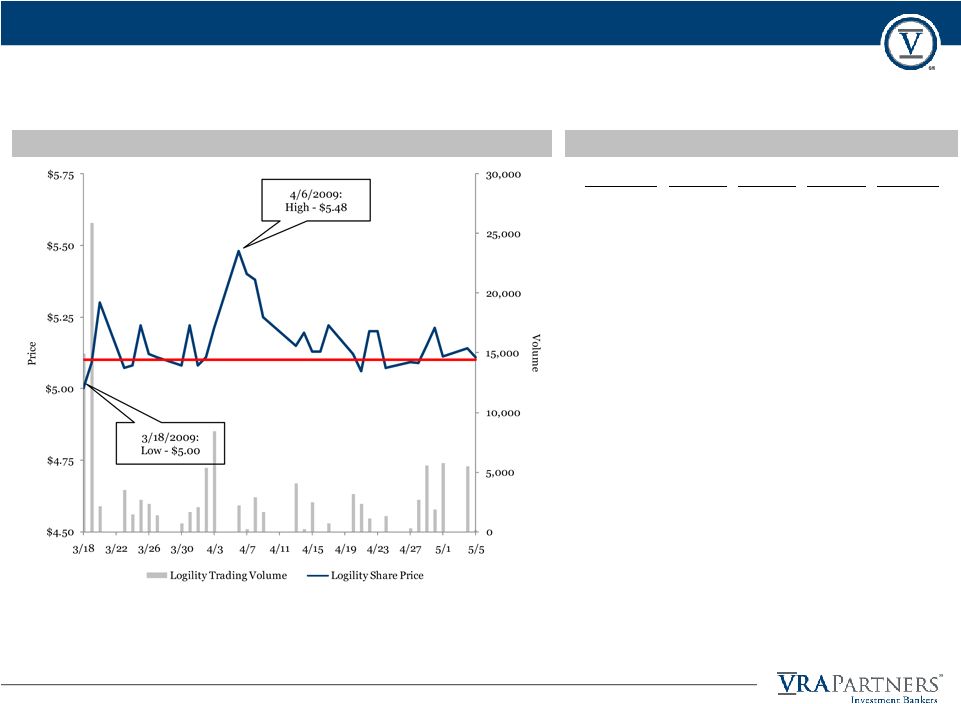 8 Logility Stock Performance and Trading Information Stock Price Performance and Trading Volume Price Volume from the Announcement Date to Current As of 5/5/2009. Trading Information Trading Date High Low Close Volume 5/5/2009 $5.11 $5.11 $5.11 140 5/4/2009 5.25 5.02 5.14 5,500 5/1/2009 5.14 5.09 5.11 5,780 4/30/2009 5.31 5.10 5.21 1,820 4/29/2009 5.35 5.09 5.15 5,580 4/28/2009 5.09 5.01 5.09 2,660 4/27/2009 5.09 5.00 5.09 300 4/24/2009 5.20 5.06 5.07 1,320 4/23/2009 - - - - 4/22/2009 5.20 5.19 5.20 1,080 4/21/2009 5.13 4.77 5.06 2,340 4/20/2009 5.25 5.12 5.12 3,140 4/17/2009 5.37 5.12 5.22 700 4/16/2009 - - - - 4/15/2009 5.16 5.11 5.13 2,450 4/14/2009 5.19 5.16 5.19 210 4/13/2009 5.25 5.10 5.15 4,070 4/9/2009 5.25 5.24 5.25 1,650 4/8/2009 5.38 5.11 5.38 2,850 4/7/2009 5.40 5.14 5.40 200 4/6/2009 5.48 5.14 5.48 2,190 4/3/2009 5.48 5.10 5.21 8,400 4/2/2009 5.22 5.00 5.11 5,340 4/1/2009 5.08 4.99 5.08 2,040 3/31/2009 5.22 5.03 5.22 1,620 3/30/2009 5.08 4.98 5.08 710 3/27/2009 5.11 5.08 5.11 1,400 3/26/2009 5.12 5.06 5.12 2,300 3/25/2009 5.22 5.05 5.22 2,670 3/24/2009 5.08 5.03 5.08 1,450 3/23/2009 5.26 5.07 5.07 3,460 3/20/2009 5.57 5.24 5.30 2,100 3/19/2009 5.71 4.90 5.09 25,870 3/18/2009 5.00 4.13 5.00 14,900 |
 9 Logility Stock Performance and Trading Information American Software Stock Price Performance and Trading Volume Price Volume from the Announcement Date to Current As of 5/5/2009. Trading Information Trading Date High Low Close Volume 5/5/2009 $5.35 $5.04 $5.05 35,280 5/4/2009 5.58 5.18 5.25 52,990 5/1/2009 5.62 5.24 5.34 26,080 4/30/2009 5.75 5.34 5.55 46,110 4/29/2009 5.70 4.87 5.57 141,370 4/28/2009 5.30 4.92 5.10 104,960 4/27/2009 5.49 5.02 5.06 72,240 4/24/2009 5.99 5.60 5.63 46,630 4/23/2009 6.07 5.66 5.68 61,880 4/22/2009 6.31 5.82 6.08 63,200 4/21/2009 6.00 5.05 5.97 88,230 4/20/2009 5.97 5.26 5.31 58,610 4/17/2009 6.33 5.54 5.72 52,350 4/16/2009 6.12 5.38 6.11 105,970 4/15/2009 6.10 5.48 6.09 74,200 4/14/2009 5.82 5.40 5.60 41,120 4/13/2009 5.81 5.42 5.81 53,610 4/9/2009 5.84 5.47 5.75 111,570 4/8/2009 5.54 5.16 5.50 58,990 4/7/2009 5.74 5.18 5.19 58,400 4/6/2009 5.87 5.55 5.75 40,530 4/3/2009 5.93 5.66 5.89 43,350 4/2/2009 6.00 5.67 5.87 114,190 4/1/2009 5.56 5.03 5.56 56,850 3/31/2009 5.49 4.50 5.27 540,260 3/30/2009 4.89 4.51 4.55 47,820 3/27/2009 5.23 4.80 4.91 44,380 3/26/2009 5.19 5.01 5.19 62,410 3/25/2009 5.08 4.72 5.02 51,530 3/24/2009 5.19 4.87 4.90 51,460 3/23/2009 5.03 4.62 5.03 105,840 3/20/2009 4.82 4.47 4.67 113,190 3/19/2009 4.67 4.30 4.63 62,540 3/18/2009 4.49 3.95 4.49 52,870 |
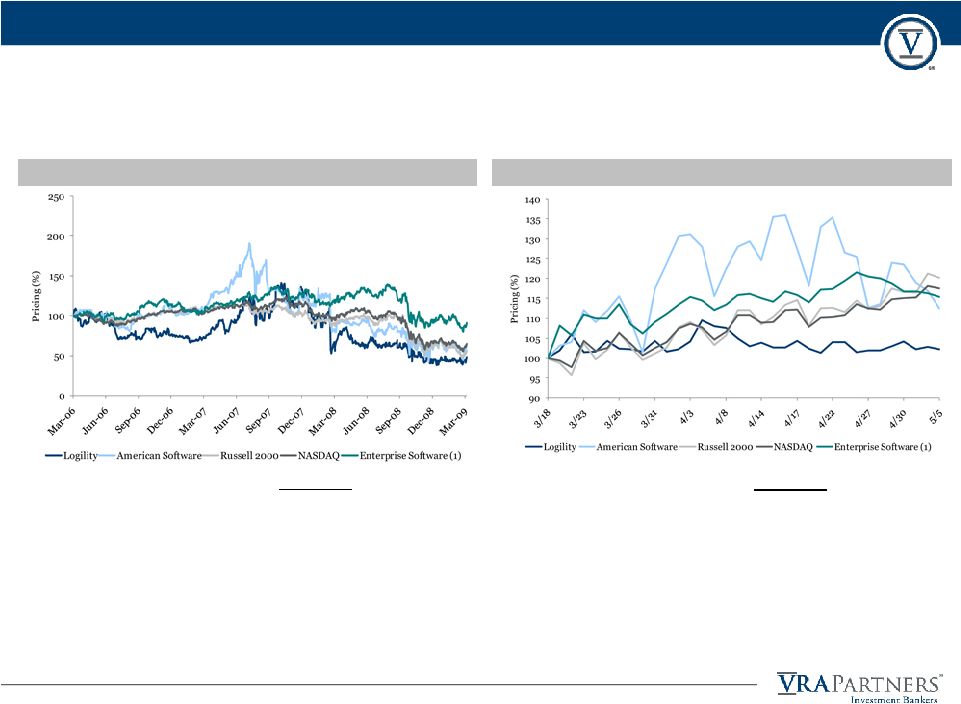 10 Logility Stock Performance and Trading Information Logility Versus Major Market Indices Last Three Years Preceding the Announcement Date % Change Logility (52.61%) American Software (34.93%) Russell 2000 (43.99%) NASDAQ (35.56%) Enterprise Software (1) (8.80%) Announcement Date to Current % Change Logility 2.20% American Software 12.47% Russell 2000 20.33% NASDAQ 17.63% Enterprise Software (1) 15.45% (1) Includes Epicor Software Corp. (EPIC), I2 Technologies, Inc. (ITWO), JDA Software Group Inc. (JDAS), Lawson Software, Inc. (LWSN), Manhattan Associates, Inc. (MANH), Oracle Corp. (ORCL), QAD Inc. (QADI) and SAP AG (SAP). |
 11 Financial and Trading Data for Reference Publicly Traded Companies Reference Public Company Analysis Financial Data ($ in millions) As of 5/5/2009. Note: Financial data as of most recent company filings. (1)Market value of equity plus net debt. (2)Excludes non-recurring and extraordinary items. Equity Market Enterprise Total Latest Twelve Months Company Name Value Value (1) Cash Debt Revenue EBITDA (2) EBITDA% EBIT (2) EBIT% Selected Enterprise Software Companies Epicor Software Corporation $307.3 $543.0 $89.8 $325.5 $487.9 $76.3 15.6% $68.1 14.0% I2 Technologies, Inc. 216.3 57.6 243.8 85.1 255.8 39.0 15.3% 35.5 13.9% JDA Software Group Inc. 457.0 394.0 63.0 0.0 379.8 92.2 24.3% 82.7 21.8% Lawson Software, Inc. 958.6 886.2 317.8 245.4 804.2 106.4 13.2% 90.4 11.2% Manhattan Associates, Inc. 392.8 303.6 89.2 0.0 309.7 45.6 14.7% 36.1 11.7% Oracle Corp. 94,734.7 94,678.7 11,294.0 11,238.0 23,630.0 11,144.0 47.2% 10,880.0 46.0% QAD Inc. 116.0 101.5 31.5 17.0 263.4 7.0 2.7% (3.2) NM SAP AG 46,486.6 47,364.7 3,898.2 4,776.3 15,372.0 4,952.4 32.2% 4,209.0 27.4% American Software, Inc. $127.7 $57.3 $70.3 $0.0 $80.7 $9.4 11.6% $7.8 9.7% Logility Inc. 82.8 35.5 47.3 0.0 42.4 9.7 22.8% 9.2 21.7% |
 12 As of 5/5/2009. Note: Financial data as of most recent company filings. (1)Excludes non-cash items such as stock-based compensation, non-recurring and extraordinary items. (2)Represents cash earnings per share as presented in each company’s earnings press release. Calendar year forward looking consensus estimates provided by Reuters. (3)Represents Management’s projections as of April 3, 2009. Trading Multiples for Reference Publicly Traded Companies Reference Public Company Analysis Trading Multiples ($ in millions, except per share data) Enterprise Value to Enterprise Value to 5 Year Est. Market Value % of 52 Wk. Enterprise Value to LTM: Estimated 2009 (2) : LTM Maintenance P/E Ratio (2) EPS Growth to Tangible Company High Revenue EBITDA (1) EBIT (1) Revenue EBITDA Revenue Gross Profit LTM 2009 2010 Rate Book Value Selected Enterprise Software Companies Epicor Software Corporation 56.6% 1.11 x 7.1 x 8.0 x 1.19 x 8.2 x 2.82 x 3.77 x 7.8 x 8.8 x 7.8 x 12.0% NM x I2 Technologies, Inc. 67.5% 0.23 1.5 1.6 0.26 NA 0.67 0.77 11.6 22.2 17.1 10.0% 1.91 JDA Software Group Inc. 69.7% 1.04 4.3 4.8 1.12 5.1 2.19 2.93 10.4 11.5 10.4 NA 5.22 Lawson Software, Inc. 66.9% 1.10 8.3 9.8 1.26 8.3 2.63 3.27 16.8 16.6 NM 10.0% 37.86 * Manhattan Associates, Inc. 61.4% 0.98 6.7 8.4 1.19 9.9 NA NA 15.5 20.9 17.2 12.5% 3.83 Oracle Corp. 80.5% 4.01 * 8.5 8.7 4.15 * 8.6 NA NA 13.2 13.4 12.1 14.1% NM QAD Inc. 46.6% 0.39 14.5 * NM 0.46 9.3 NA NA NM 58.0 * 62.8 * NA 2.77 SAP AG 93.2% 3.08 9.6 11.3 3.17 10.2 NA NA 15.3 17.3 14.1 10.3% 26.04 * High 93.2% 4.01 x 14.5 x 11.3 x 4.15 x 10.2 x 2.82 x 3.77 x 16.8 x 58.0 x 62.8 x 14.1% 37.86 x Mean 67.8% 1.13 6.6 7.5 1.24 8.5 2.08 2.68 12.9 15.8 13.1 11.5% 3.43 Median 67.2% 1.07 7.7 8.4 1.19 8.6 2.41 3.10 13.2 16.9 14.1 11.1% 4.52 Low 46.6% 0.23 1.5 1.6 0.26 5.1 0.67 0.77 7.8 8.8 7.8 10.0% 1.91 Excludes Oracle and SAP High 69.7% 1.11 x 14.5 x 9.8 x 1.26 x 9.9 x 2.82 x 3.77 x 16.8 x 58.0 x 62.8 x 12.5% 37.86 x Mean 61.4% 0.81 5.6 6.5 0.91 8.2 2.08 2.68 12.4 16.0 13.1 11.1% 3.43 Median 64.1% 1.01 6.9 8.0 1.15 8.3 2.41 3.10 11.6 18.8 17.1 11.0% 3.83 Low 46.6% 0.23 1.5 1.6 0.26 5.1 0.67 0.77 7.8 8.8 7.8 10.0% 1.91 American Software, Inc. 75.1% 0.71 x 6.1 x 7.3 x 0.70 x 4.4 x 2.02 x 2.74 x 36.2 x 25.1 x 13.8 x 17.0% 1.85 x Logility Inc. (3) 70.2% 0.84 3.7 3.9 0.87 3.9 1.53 1.95 13.4 14.0 NA NA 1.85 |
 13 Reference Public Company Analysis Multiple Analysis As of 5/5/2009. Note: Financial data as of most recent company filings. (1)Market value of equity plus net debt. (2)Excludes non-recurring and extraordinary items. Multiples for Proposed Peer Companies Acquisition at Mean Median High Low $6.35 / share Enterprise Value to Net Sales LTM 1.13 x 1.07 x 4.01 x 0.23 x 0.84 x Calendar 2009P 1.24 1.19 4.15 0.26 0.87 Enterprise Value to LTM Maintenance Net sales 2.08 x 2.41 x 2.82 x 0.67 x 1.53 x Gross Profit 2.68 3.10 3.77 0.77 1.95 Enterprise Value to EBITDA LTM 6.6 x 7.7 x 14.5 x 1.5 x 3.7 x Calendar 2009P 8.5 8.6 10.2 5.1 3.9 Enterprise Value to EBIT LTM 7.5 x 8.4 x 11.3 x 1.6 x 3.9 x Equity Value to Net Income LTM 12.9 x 13.2 x 16.8 x 7.8 x 13.4 x Calendar 2009P 15.8 16.9 58.0 8.8 14.0 Equity Value to Tangible Book Value at 1/31/2009 3.43 x 4.52 x 37.86 x 1.91 x 1.85 x |
 14 Reference Public Company Analysis Multiple Analysis – Excludes SAP and Oracle As of 5/5/2009. Note: Financial data as of most recent company filings. (1)Market value of equity plus net debt. (2)Excludes non-recurring and extraordinary items. Multiples for Proposed Peer Companies Acquisition at Mean Median High Low $6.35 / share Enterprise Value to Net Sales LTM 0.81 x 1.01 x 1.11 x 0.23 x 0.84 x Calendar 2009P 0.91 1.15 1.26 0.26 0.87 Enterprise Value to LTM Maintenance Net sales 2.08 x 2.41 x 2.82 x 0.67 x 1.53 x Gross Profit 2.68 3.10 3.77 0.77 1.95 Enterprise Value to EBITDA LTM 5.6 x 6.9 x 14.5 x 1.5 x 3.7 x Calendar 2009P 8.2 8.3 9.9 5.1 3.9 Enterprise Value to EBIT LTM 6.5 x 8.0 x 9.8 x 1.6 x 3.9 x Equity Value to Net Income LTM 12.4 x 11.6 x 16.8 x 7.8 x 13.4 x Calendar 2009P 16.0 18.8 58.0 8.8 14.0 Equity Value to Tangible Book Value at 1/31/2009 3.43 x 3.83 x 37.86 x 1.91 x 1.85 x |
 15 Reference Public Company Analysis Implied Valuation ($ in thousands, except per share data) Mean Implied Net Debt Implied Implied Logility Peer Enterprise at Equity Equity Value Valuation Metric Weighting Financials Multiple Value 1/31/2009 Value Per Share (1) Enterprise Value to Net Sales: 30.0% LTM 18.0% $42,392 1.13 x $47,990 ($47,309) $95,299 $7.31 Calendar 2009E 12.0% 40,662 1.24 50,256 (47,309) 97,565 7.48 Enterprise Value to Adjusted EBITDA: 35.0% LTM 21.0% $9,685 6.6 x $63,519 ($47,309) $110,828 $8.50 Calendar 2009P 14.0% 9,062 8.5 77,181 (47,309) 124,490 9.54 Enterprise Value to Adjusted EBIT: 10.0% LTM 10.0% $9,178 7.5 x $68,869 ($47,309) $116,178 $8.91 Equity Value to Adjusted Net Income 20.0% LTM 12.0% $6,189 12.9 x $32,802 ($47,309) $80,111 $6.14 Calendar 2009P 8.0% 5,927 15.8 46,483 (47,309) 93,792 7.19 Equity Value to Tangible Book Value 5.0% $44,754 3.43 x $106,247 ($47,309) $153,556 $11.77 at 1/31/2009 Mean $61,668 $108,977 $8.35 Median 56,888 104,197 7.99 Weighted Mean 58,667 105,976 8.12 High 106,247 153,556 11.77 Low 32,802 80,111 6.14 As of 5/5/2009. *Excluded from mean NA – Not available NM – Not meaningful (1) Assumes 13,044,416 fully diluted shares outstanding. |
 16 Reference Public Company Analysis Implied Valuation – Excludes SAP and Oracle ($ in thousands, except per share data) Mean Implied Net Debt Implied Implied Logility Peer Enterprise at Equity Equity Value Valuation Metric Weighting Financials Multiple Value 1/31/2009 Value Per Share (1) Enterprise Value to Net Sales: 30.0% LTM 18.0% $42,392 0.81 x $34,218 ($47,309) $81,527 $6.25 Calendar 2009E 12.0% 40,662 0.91 37,116 (47,309) 84,425 6.47 Enterprise Value to Adjusted EBITDA: 35.0% LTM 21.0% $9,685 5.6 x $53,945 ($47,309) $101,254 $7.76 Calendar 2009P 14.0% 9,062 8.2 73,952 (47,309) 121,261 9.30 Enterprise Value to Adjusted EBIT: 10.0% LTM 10.0% $9,178 6.5 x $59,786 ($47,309) $107,095 $8.21 Equity Value to Adjusted Net Income 20.0% LTM 12.0% $6,189 12.4 x $29,521 ($47,309) $76,830 $5.89 Calendar 2009P 8.0% 5,927 16.0 47,643 (47,309) 94,952 7.28 Equity Value to Tangible Book Value 5.0% $44,754 3.43 x $106,247 ($47,309) $153,556 $11.77 at 1/31/2009 Mean $55,303 $102,612 $7.87 Median 50,794 98,103 7.52 Weighted Mean 50,940 98,249 7.53 High 106,247 153,556 11.77 Low 29,521 76,830 5.89 As of 5/5/2009. *Excluded from mean NA – Not available NM – Not meaningful (1) Assumes 13,044,416 fully diluted shares outstanding. |
 17 Precedent Merger and Acquisition Transaction Analysis Summary Summary of Precedent M&A Transactions ($ in millions) Note: Transactions include change of control premium. * Excluded from mean NA – Not available NM – Not meaningful Transaction Transaction Date Enterprise Enterprise Value as a Multiple of LTM: Equity Equity Value as a Multiple of: Effective Target Acquiror Value Revenue EBITDA EBIT Value Net Income Book Value 02/13/09 mValent, Inc. Oracle Corp. NA NA x NA x NA x NA NA x NA 02/09/09 Categoric Software Corporation CDC Software Corporation NA NA NA NA NA NA NA 08/28/08 SAT Corporation Wonderware Corporation $52.0 NA NA NA $52.0 NA NA 07/27/08 ILOG SA IBM 227.5 1.18 66.3 * NA 301.4 NM 3.14 06/05/08 HighJump Software, LLC Battery Ventures NA NA NA NA NA NA NA 01/29/08 Business Objects SA SAP AG 6,147.0 4.28 * 25.0 * 41.2 * 5,657.7 75.3 * 3.00 09/11/07 Catalyst International, Inc. CDC Corp. NA NA NA NM NA NM NM 08/17/07 Eclipse Inc. Activant Solutions Inc. 100.6 1.96 NM NM 100.5 NM 2.22 08/14/07 Aldata Solution Oyj Symphony Technology Group 163.8 1.46 259.9 * NM 169.5 NM 4.62 07/02/07 Cimnet, Inc. Invensys Systems, Inc. 22.6 4.03 * 27.2 30.5 18.0 15.9 5.63 06/01/07 Hansen Information Technologies Infor Global Solutions 192.3 NA NA NA 192.3 NA NA 06/01/07 Workbrain Corporation Infor Global Solutions 157.2 1.62 507.0 * NM 193.9 NM 3.52 05/01/07 Blue Agave Software, Inc. I2 Technologies, Inc. NA NA NA NA NA NA NA 04/13/07 Hyperion Solutions Corp. Oracle Corp. 2,797.2 3.37 20.4 28.1 3,077.3 45.5 * 4.81 03/14/07 Innovate IT Holding BV Kewill Systems plc 24.6 2.74 NA NA 13.6 NA NA 02/14/07 Pilot Software, Inc. SAP AG NA NA NA NA NA NA NA 01/09/07 Ventyx, Inc. Vista Equity Partners 212.8 1.74 23.1 158.8 * 227.7 84.6 * 4.57 01/08/07 Comergent Technologies, Inc. Sterling Commerce, Inc. 155.0 NA NA NA 155.0 NA NA 12/18/06 Factory Logic, Inc. SAP AG NA NA NA NA NA NA NA 12/01/06 Vis.align, Inc. CDC Corp. NA NA NA NA NA NA NA 10/25/06 Click Commerce, Inc. Illinois Tool Works 289.3 3.92 * 11.8 16.2 277.8 14.1 2.71 07/31/06 Systems Union Group plc Extensity, Inc. 380.9 1.87 12.8 NA 397.1 31.7 2.37 07/28/06 SSA Global Technologies Infor Global Solutions 1,610.3 2.16 13.1 23.7 1,366.5 93.0 * 4.61 07/05/06 Manugistics Group, Inc. JDA Software Group, Inc. 247.7 1.41 10.0 NM 210.4 NM 1.37 06/05/06 Frictionless Commerce, Inc. SAP AG NA NA NA NA NA NA NA 06/01/06 Demantra, Inc. Oracle Corp. NA NA NA NA NA NA NA 04/25/06 Intentia International AB Lawson Software, Inc. 457.7 1.16 19.6 NM 450.3 NM 3.88 03/31/06 Datastream Systems, Inc. Infor Global Solutions 157.7 1.55 12.7 16.9 205.2 38.0 * 3.33 03/14/06 Extensity, Inc. Infor Global Solutions 743.5 1.68 8.2 9.7 965.4 13.7 3.60 02/21/06 Horizon Companies, Inc. CDC Corp. NA NA NA NA NA NA NA 02/21/06 RiverOne, Inc. I2 Technologies, Inc. NA NA NA NA NA NA NA 01/31/06 Siebel Systems, Inc. Oracle Corp. 3,359.2 2.54 19.1 37.8 5,601.0 308.4 * 2.51 01/29/06 Timera, Inc. JDA Software Group, Inc. 13.0 2.17 NA NA 13.0 NA NA 08/31/05 Evant, Inc. Manhattan Associates, Inc. 88.7 3.95 * NM NM 50.0 NM NM 05/24/05 RedPrairie Corporation Francisco Partners Management LLC NA NA NA NA NA NA NA |
 18 Precedent Merger and Acquisition Transaction Analysis Summary Summary of Precedent M&A Transactions ($ in millions) Note: Transactions include change of control premium. * Excluded from mean NA – Not available NM – Not meaningful Transaction Transaction Date Enterprise Enterprise Value as a Multiple of LTM: Equity Equity Value as a Multiple of: Effective Target Acquiror Value Revenue EBITDA EBIT Value Net Income Book Value 04/18/05 MAPICS, Inc. Infor Global Solutions 312.9 1.76 8.0 12.4 347.3 25.7 4.59 04/12/05 Retek, Inc. Oracle Corp. 540.4 3.10 * 32.4 * 91.0 * 631.4 89.7 * 6.15 01/07/05 Peoplesoft, Inc. Oracle Corp. 8,329.6 3.11 * 22.1 * 56.3 * 9,957.3 126.4 * 3.28 08/26/04 Ross Systems, Inc. CDC Corp. 71.6 1.49 7.0 14.9 75.4 18.6 5.02 06/18/04 Scala Business Solutions Epicor Software Corp. 81.3 1.17 NM NM 90.2 NM 10.06 06/07/04 NxTrend Technology, Inc. Infor Global Solutions NA NA NA NA NA NA NA 02/27/04 Infor Business Solutions Infor Global Solutions (Agilisys) 39.7 0.46 14.9 NM 47.1 NM 1.94 02/25/04 Pivotal Corp. CDC Corp. 47.3 0.83 NM NM 57.0 NM 10.38 10/14/03 Streamsoft, LLC Manhattan Associates, Inc. NA NA NA NA NA NA NA 08/15/03 EXE Technologies, Inc. SSA Global Technologies, Inc. 17.9 0.25 NA NA 48.4 NA 1.85 08/08/03 Made2Manage Systems, Inc. Battery Ventures 11.7 0.39 26.5 * NM 28.2 NM 2.37 07/09/03 ROI Systems, Inc. Epicor Software Corp. 20.7 1.20 NA NA 20.7 NA NA 02/18/03 J.D. Edwards & Company Peoplesoft, Inc. 1,710.8 1.93 18.6 51.7 * 2,063.4 39.0 * 4.33 02/18/03 Frontstep, Inc. MAPICS, Inc. 59.6 0.68 11.3 NM 32.5 NM 5.10 01/21/03 Prophet 21, Inc. Thoma Bravo et al. 43.3 1.02 6.6 9.5 63.6 20.4 2.13 06/26/02 Inovis, Inc. Cerberus Capital Management, et al 34.7 NA NA NA 34.7 NA NA 05/31/02 Hyprotech Ltd. Aspen Technology, Inc. 96.7 1.62 8.1 NA 96.7 NA NA 09/07/01 E3 Corporation JDA Software Group, Inc. 54.4 1.32 NM NM 45.8 NM NM 04/06/00 Intactix International, Inc. JDA Software Group, Inc. 12.3 0.52 8.8 NM 20.5 NM NM High 4.28 x 507.0 x 158.8 x $9,957.3 308.4 x 10.38 Mean 1.49 14.4 20.0 855.3 20.0 3.56 Median 1.62 16.7 28.1 155.0 38.5 3.56 Low 0.25 6.6 9.5 13.0 13.7 1.37 Excluding transactions over $100 million High 4.03 x 27.2 x 30.5 x $96.7 20.4 x 10.38 Mean 1.13 12.0 18.3 44.9 18.3 4.94 Median 1.18 10.1 14.9 46.4 18.6 5.02 Low 0.25 6.6 9.5 13.0 15.9 1.85 |
 19 Precedent Merger and Acquisition Transaction Analysis Multiple Analysis Multiples for Proposed Precedent Transactions Acquisition at Mean Median High Low $6.35 / share Enterprise Value to: LTM Net Sales 1.49 x 1.62 x 4.28 x 0.25 x 0.84 x LTM Adjusted EBITDA 14.4 16.7 507.0 6.6 3.7 LTM Adjusted EBIT 20.0 28.1 158.8 9.5 3.9 Equity Value to: LTM Adjusted Net Income 20.0 x 38.5 x 308.4 x 13.7 x 13.4 x Book Value 3.56 3.56 10.38 1.37 1.64 |
 20 Precedent Merger and Acquisition Transaction Analysis Multiple Analysis – Transactions Under $100 million Multiples for Proposed Precedent Transactions Acquisition at Mean Median High Low $6.35 / share Enterprise Value to: LTM Net Sales 1.13 x 1.18 x 4.03 x 0.25 x 0.84 x LTM Adjusted EBITDA 12.0 10.1 27.2 6.6 3.7 LTM Adjusted EBIT 18.3 14.9 30.5 9.5 3.9 Equity Value to: LTM Adjusted Net Income 18.3 x 18.6 x 20.4 x 15.9 x 13.4 x Book Value 4.94 5.02 10.38 1.85 1.64 |
 21 Precedent Merger and Acquisition Transaction Analysis Implied Valuation ($ in thousands, except per share data) Mean Implied Net Debt Implied Implied Logility Transaction Enterprise at Equity Equity Value Valuation Metric Weighting Financials Multiple Value 1/31/09 Value Per Share (1) Enterprise Value to: LTM Net Sales 30.0% $42,392 1.49 x $63,175 ($47,309) $110,484 $8.47 LTM Adjusted EBITDA 35.0% $9,685 14.4 x $139,340 ($47,309) $186,649 $14.31 LTM Adjusted EBIT 10.0% $9,178 20.0 x $183,319 ($47,309) $230,628 $17.68 Equity Value to: LTM Adjusted Net Income 20.0% $6,189 20.0 x $76,560 ($47,309) $123,869 $9.50 Book Value at 1/31/2009 5.0% $50,563 3.56 x $132,884 ($47,309) $180,193 $13.81 Mean $119,056 $166,365 $12.75 Median 132,884 180,193 13.81 Weighted Mean 108,009 155,318 11.91 High 183,319 230,628 17.68 Low 63,175 110,484 8.47 *Excluded from mean NA – Not available NM – Not meaningful (1)Assumes 13,044,416 fully diluted shares outstanding. |
 22 Precedent Merger and Acquisition Transaction Analysis Implied Valuation – Transactions Under $100 million ($ in thousands, except per share data) Mean Implied Net Debt Implied Implied Logility Transaction Enterprise at Equity Equity Value Valuation Metric Weighting Financials Multiple Value 1/31/09 Value Per Share (1) Enterprise Value to: LTM Net Sales 30.0% $42,392 1.13 x $47,961 ($47,309) $95,270 $7.30 LTM Adjusted EBITDA 35.0% $9,685 12.0 x $116,113 ($47,309) $163,422 $12.53 LTM Adjusted EBIT 10.0% $9,178 18.3 x $168,223 ($47,309) $215,532 $16.52 Equity Value to: LTM Adjusted Net Income 20.0% $6,189 18.3 x $65,986 ($47,309) $113,295 $8.69 Book Value at 1/31/2009 5.0% $50,563 4.94 x $202,578 ($47,309) $249,887 $19.16 Mean $120,172 $167,481 $12.84 Median 116,113 163,422 12.53 Weighted Mean 95,176 142,485 10.92 High 202,578 249,887 19.16 Low 47,961 95,270 7.30 *Excluded from mean NA – Not available NM – Not meaningful (1)Assumes 13,044,416 fully diluted shares outstanding. |
 23 Premiums Paid Analysis Methodology VRA reviewed premiums paid in certain recently announced merger and acquisition transactions with the following criteria: Majority Shareholder Purchasing Remaining Shares — Announcement date between January 1, 2004 and Current — U.S. based target Transactions in the Application Software Sector — Announcement date between January 1, 2004 and Current — U.S. based target |
 24 Majority Shareholder Purchasing Remaining Shares Premiums Paid Analysis Implied Valuation ($ in thousands, except per share data) Implied Logility Relevant Mean Equity Value Implied Net Debt at Implied Valuation Parameter (1) Stock Price Premium (%) Per Share Equity Value (2) 01/31/09 Enterprise Value Stock Price 1 Day Prior to Announcement $5.00 (3) 23.5 % $6.18 $80,561 ($47,309) $33,252 Stock Price 5 Days Prior to Announcement $4.69 (4) 24.0 % $5.81 $75,839 ($47,309) $28,530 Stock Price 30 Days Prior to Announcement $4.63 (5) 24.8 % $5.78 $75,383 ($47,309) $28,074 Mean $5.92 $77,261 $29,952 Median 5.81 75,839 28,530 High 6.18 80,561 33,252 Low 5.78 75,383 28,074 *Excluded from mean NA - Not available NM - Not meaningful (1) Assumes announcement date of March 18, 2009 after trading closed. (2) Assumes 13,044,416 fully diluted shares outstanding. (3) Closing price on March 18, 2009. (4) Closing price on March 12, 2009. (5) Closing price on February 5, 2009. |
 25 Premiums Paid Analysis Majority Shareholder Purchasing Remaining Shares Implied Implied Total Transaction Transaction Premium (%) Date Transaction Equity Percent Enterprise 1 Day Prior to 5 Days Prior to 30 Days Prior to Announced Target Primary Industry Acquiror Value Value Repurchased Value Announcement Announcement Announcement 03/25/09 Hearst-Argyle Television Inc. Broadcasting Hearst Broadcasting, Inc $75.9 $421.6 18.0% $1,205.6 115.3 * 150.0 * 157.2 * % 03/23/09 Cox Radio Inc. Broadcasting Cox Media Group, Inc. 65.2 302.0 21.6% 707.7 15.1 16.9 -25.8 * 02/27/09 Vita Food Products Inc. Packaged Foods and Meats Individual Investor (Company Director) 3.3 7.7 42.2% 7.7 250.0 * 250.0 * 400.0 * 02/26/09 OpenTV Corp. Application Software Kudelski SA 128.4 147.5 87.1% 46.3 35.0 27.4 12.5 02/09/09 Galaxy Nutritional Foods Inc. Packaged Foods and Meats Mill Road Capital; Galaxy Partners 4.6 9.7 46.9% 6.8 111.8 * 80.0 * 44.0 01/27/09 NET2S Group Internet Software and Services BT Group plc 2.4 110.3 2.2% 109.7 85.6 * 85.6 * 58.3 01/15/09 Hiland Holdings GP LP Oil and Gas Storage and Transportation Individual Investor (Company Director) 27.1 69.1 39.2% 451.1 21.2 -14.0 * 29.6 12/09/08 Global Med Technologies Inc. Application Software Victory Park Capital Advisors, LLC 32.0 37.4 85.6% 45.4 25.0 57.1 * 22.2 08/07/08 Confirmit ASA Application Software Sebastian Holdings Inc. 5.5 90.4 6.1% 81.5 0.4 0.9 28.6 07/30/08 Zones Inc. Technology Distributors Individual Investor (Company CEO) 45.3 92.6 48.9% 97.9 15.9 -6.7 * -10.6 * 07/21/08 Genentech Inc. Biotechnology Roche Holdings, Inc. 46,722.4 100,115.3 46.7% 99,217.7 16.1 26.0 27.1 06/26/08 Five Star Products Inc. Distributors National Patent Development Corp. 1.7 6.7 24.9% 37.0 33.3 33.3 14.3 04/25/08 Tarrant Apparel Group Apparel, Accessories and Luxury Goods Company Management 12.7 26.0 49.0% 44.1 28.8 30.8 26.9 03/05/08 Atari, Inc. Home Entertainment Software Infogrames Entertainment SA 11.0 22.6 48.6% 31.2 0.0 0.0 29.2 03/05/08 Nationwide Financial Services, Inc. Life and Health Insurance Nationwide 2,863.0 7,659.0 37.4% 9,550.7 28.3 18.0 19.0 02/28/08 GS AgriFuels Corporation Industrial Machinery GreenShift Corporation 1.5 14.5 10.0% 54.3 9.9 19.1 25.0 11/15/07 Atlantic Coast Entertainment Holdings Casinos and Gaming Icahn Enterprises, L.P. 12.3 211.2 5.8% 202.6 20.3 NA 22.1 10/22/07 Waste Industries USA Inc. Environmental and Facilities Services Mgmt, Macquaire and Goldman Sachs 268.8 538.4 49.9% 702.3 40.2 42.3 32.8 10/03/07 Suntron Corp. Electronic Manufacturing Services Blum Capital, Thayer Capital Partners 3.2 31.8 10.2% 51.9 -5.0 * 5.5 5.5 09/07/07 Emerson Radio Corp. Consumer Electronics Grande Holdings Ltd. 7.3 106.1 6.8% 87.7 50.5 50.5 52.2 08/08/07 Digital Angel Corp. Electronic Equipment Manufacturers Applied Digital Solutions Inc. 32.5 72.5 44.8% 85.0 22.1 22.1 16.8 07/17/07 Alfa Corp. Property and Casualty Insurance Alfa Mutual Insurance Company 832.6 1,767.5 47.1% 2,071.3 44.4 44.6 29.5 05/14/07 Spear & Jackson Inc. Household Appliances United Pacific Industries Ltd. 4.3 11.2 38.3% 4.0 78.2 * 70.5 * 81.5 * 04/22/07 Optical Communication Products Inc. Communications Equipment Oplink Communications Inc. 78.7 187.8 41.9% 70.9 19.6 20.4 21.3 02/23/07 Refac Optical Group Specialty Stores Palisade Capital Management LLC 10.7 106.7 10.0% 106.7 50.4 56.3 52.3 02/22/07 Great American Financial Resources Life and Health Insurance American Financial Group Inc. 245.8 1,170.5 21.0% 1,203.3 13.2 15.0 11.8 01/24/07 21st Century Insurance Group Property and Casualty Insurance American International Group, Inc. 806.6 1,935.2 41.7% 2,009.7 34.6 31.2 24.9 12/20/06 Crested Corp. Diversified Metals and Mining US Energy Corp. 12.4 42.8 29.0% 52.6 14.2 13.2 7.8 10/06/06 NetRatings Inc. Internet Software and Services The Nielsen Company B.V. 328.3 757.1 43.4% 610.3 44.0 47.6 41.6 04/27/06 Erie Family Life Insurance Co. Life and Health Insurance Erie Indemnity Co. 75.2 302.4 24.9% 346.9 2.4 1.8 1.6 03/17/06 William Lyon Homes Homebuilding Individual Investor (Company CEO) 245.9 944.7 26.0% 1,858.4 44.3 50.8 27.4 10/07/05 Micro Therapeutics Inc. Healthcare Equipment ev3, Inc. 93.6 312.7 29.9% 309.7 9.8 15.2 7.6 09/06/05 7-Eleven Inc. Food Retail IYG Holding Company 1,182.3 4,330.6 27.3% 5,622.5 6.9 34.7 18.0 04/14/05 Rubicon Medical Corporation Semiconductor Equipment Boston Scientific Corporation 80.6 82.2 50.0% 113.8 -0.7 * 0.7 26.1 01/17/05 Unitedglobalcom Inc. Cable and Satellite Liberty Global Inc. 3,481.4 7,503.0 46.4% 11,508.8 -0.7 * 3.2 1.8 08/02/04 Cox Communications Inc. Broadband Communications Cox Enterprises, Inc. 8,531.9 22,452.4 38.0% 28,999.5 33.2 31.7 32.4 01/15/04 Phosphate Resource Partners LP Fertilizers and Agricultural Chemicals Mosaic Global Holdings Inc. 53.5 110.6 48.4% 684.6 2.7 12.1 24.0 Mean 23.5 % 24.0 % 24.8 % Median 22.1 26.7 25.0 $ in millions except per share data, * Excluded from mean NA – Not available NM – Not meaningful |
 26 Premiums Paid Analysis Implied Valuation Transactions in the Application Software Sector ($ in thousands, except per share data) Implied Logility Relevant Mean Equity Value Implied Net Debt at Implied Valuation Parameter (1) Stock Price Premium (%) Per Share Equity Value (2) 01/31/09 Enterprise Value Stock Price 1 Day Prior to Announcement $5.00 (3) 25.1 % $6.25 $81,569 ($47,309) $34,260 Stock Price 5 Days Prior to Announcement $4.69 (4) 27.5 % $5.98 $77,975 ($47,309) $30,666 Stock Price 30 Days Prior to Announcement $4.63 (5) 32.2 % $6.12 $79,825 ($47,309) $32,516 Mean $6.12 $79,789 $32,480 Median 6.12 79,825 32,516 High 6.25 81,569 34,260 Low 5.98 77,975 30,666 *Excluded from mean NA - Not available NM - Not meaningful (1) Assumes announcement date of March 18, 2009 after trading closed. (2) Assumes 13,044,416 fully diluted shares outstanding. (3) Closing price on March 18, 2009. (4) Closing price on March 12, 2009. (5) Closing price on February 5, 2009. |
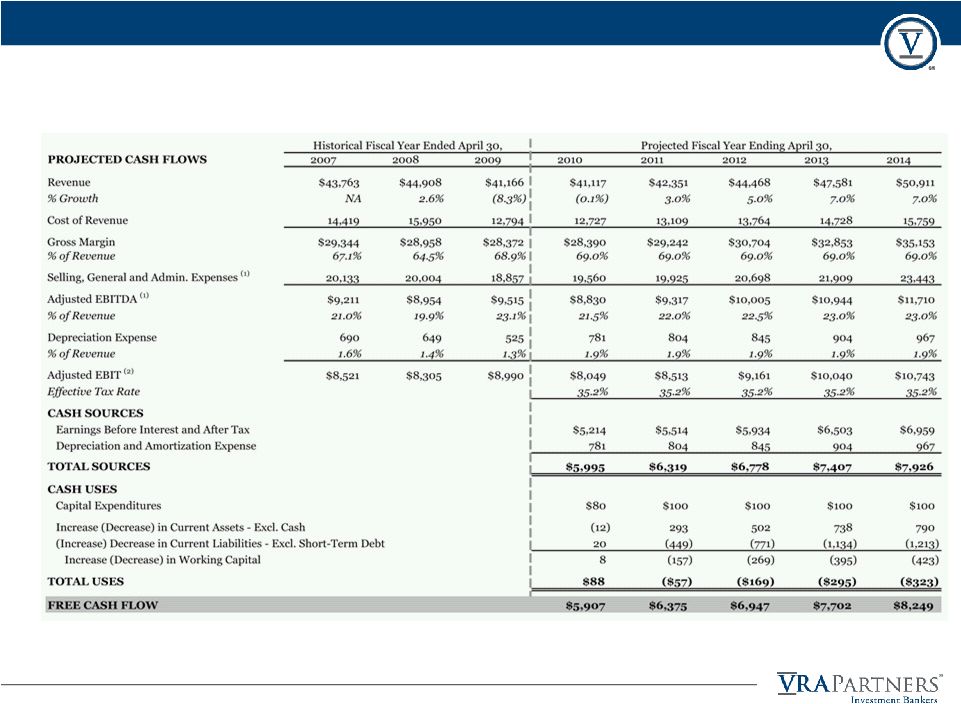 27 Discounted Cash Flow Analysis Free Cash Flow Calculation ($ in thousands) Note: Represents a five year discounted cash flow analysis. Forecasted 2010 financial information represents Logility management estimates. Forecasted 2011 through 2014 estimates reflect forecasted growth expectations in the supply chain management software industry by industry trade publications. (1) Excludes depreciation expense, amortization (incl. capitalized development amortization) and stock-based compensation expense. (2) Excludes capitalized development amortization and stock-based compensation expense. |
 28 Discounted Cash Flow Analysis Implied Valuation ($ in thousands, except per share data) Discount Rate 15.00% 17.50% 20.00% 22.50% 25.00% Present Value of Cash Flows: $23,030 $21,651 $20,399 $19,260 $18,220 Present Value of Terminal Value 4.0 x $23,287 $20,913 $18,823 $16,979 $15,348 4.5 x $26,198 $23,527 $21,176 $19,102 $17,267 Exit Multiple 5.0 x $29,109 $26,141 $23,529 $21,224 $19,185 Firm Value to EBITDA 5.5 x $32,020 $28,755 $25,882 $23,347 $21,104 6.0 x $34,931 $31,369 $28,235 $25,469 $23,022 Implied Enterprise Value 4.0 x $46,317 $42,564 $39,223 $36,240 $33,568 Exit Multiple 4.5 x $49,228 $45,178 $41,576 $38,362 $35,487 Firm Value to EBITDA 5.0 x $52,139 $47,792 $43,929 $40,484 $37,406 5.5 x $55,050 $50,406 $46,282 $42,607 $39,324 6.0 x $57,960 $53,020 $48,635 $44,729 $41,243 Implied Equity Value 4.0 x $93,626 $89,873 $86,532 $83,549 $80,877 Exit Multiple 4.5 x $96,537 $92,487 $88,885 $85,671 $82,796 Firm Value to EBITDA 5.0 x $99,448 $95,101 $91,238 $87,793 $84,715 5.5 x $102,359 $97,715 $93,591 $89,916 $86,633 6.0 x $105,269 $100,329 $95,944 $92,038 $88,552 Implied Equity Value Per Share 4.0 x $7.18 $6.89 $6.63 $6.40 $6.20 Exit Multiple 4.5 x $7.40 $7.09 $6.81 $6.57 $6.35 Firm Value to EBITDA 5.0 x $7.62 $7.29 $6.99 $6.73 $6.49 5.5 x $7.85 $7.49 $7.17 $6.89 $6.64 6.0 x $8.07 $7.69 $7.36 $7.06 $6.79 Note: Represents a five year discounted cash flow analysis. Forecasted 2010 financial information represents Logility management estimates. Forecasted 2011 through 2014 estimates reflect forecasted growth expectations in the supply chain management software industry by industry trade publications. |
 29 Discounted Cash Flow Analysis Sensitivity Analysis (1) Represents the absolute change in projected revenue growth rate for each year in the projection period. For example, a -1.0% change to base case projected revenue growth rate of 5% results in a 4% revenue growth rate. (2) Represents the absolute change in the projected EBITDA margin for each year in the projection period. For example, a -0.50% change to management’s projected EBITDA margin of 19% results in a 18.5% EBITDA margin. Equity Value Per Share Change in -10.0% -8.0% -6.0% -4.0% -2.0% 0.0% 2.0% 4.0% 6.0% 8.0% 10.0% -10.00% $4.82 $5.01 $5.21 $5.40 $5.60 $5.79 $5.99 $6.19 $6.38 $6.58 $6.77 -8.00% $4.94 $5.16 $5.37 $5.58 $5.79 $6.00 $6.21 $6.43 $6.64 $6.85 $7.06 -6.00% $5.08 $5.31 $5.54 $5.77 $6.00 $6.23 $6.45 $6.68 $6.91 $7.14 $7.37 -4.00% $5.23 $5.47 $5.72 $5.97 $6.22 $6.46 $6.71 $6.96 $7.21 $7.45 $7.70 -2.00% $5.38 $5.65 $5.92 $6.19 $6.45 $6.72 $6.99 $7.26 $7.52 $7.79 $8.06 0.00% $5.55 $5.84 $6.13 $6.42 $6.71 $6.99 $7.28 $7.57 $7.86 $8.15 $8.44 2.00% $5.73 $6.04 $6.35 $6.66 $6.98 $7.29 $7.60 $7.91 $8.22 $8.53 $8.85 4.00% $5.92 $6.26 $6.59 $6.93 $7.26 $7.60 $7.94 $8.27 $8.61 $8.94 $9.28 6.00% $6.12 $6.49 $6.85 $7.21 $7.57 $7.93 $8.30 $8.66 $9.02 $9.38 $9.74 8.00% $6.34 $6.73 $7.12 $7.51 $7.90 $8.29 $8.68 $9.07 $9.46 $9.85 $10.24 10.00% $6.57 $6.99 $7.41 $7.83 $8.25 $8.67 $9.09 $9.51 $9.93 $10.35 $10.77 Change in Projected Annual Revenue Growth (1) EBITDA Margin (2) |
 30 Valuation Summary Valuation Ranges ($ in thousands, except per share data) Enterprise Value Equity Value Valuation Methodology Low Median Mean Wgt. Mean High Low Median Mean Wgt. Mean High Reference Public Company Analysis $32,802 $56,888 $61,668 $58,667 $106,247 $80,111 $104,197 $108,977 $105,976 $153,556 Reference Public Company Analysis Excluding $29,521 $50,794 $55,303 $50,940 $106,247 $76,830 $98,103 $102,612 $98,249 $153,556 SAP and ORCL Precedent M&A Transaction Analysis $63,175 $132,884 $119,056 $108,009 $183,319 $110,484 $180,193 $166,365 $155,318 $230,628 Precedent M&A Transaction Analysis Transactions Under $100 Million $47,961 $116,113 $120,172 $95,176 $202,578 $95,270 $163,422 $167,481 $142,485 $249,887 Discounted Cash Flow Analysis $33,568 $43,929 $44,350 $44,350 $57,960 $80,877 $91,238 $91,659 $91,659 $105,269 Premiums Paid Analysis: Majority Shareholder Purchasing Remaining Shares $28,074 $28,530 $29,952 $29,952 $33,252 $75,383 $75,839 $77,261 $77,261 $80,561 Transactions in the Application Software Sector $30,666 $32,516 $32,480 $32,480 $34,260 $77,975 $79,825 $79,789 $79,789 $81,569 Equity Value Per Share Valuation Methodology Low Median Mean Wgt. Mean High Reference Public Company Analysis $6.14 $7.99 $8.35 $8.12 $11.77 Reference Public Company Analysis Excluding $5.89 $7.52 $7.87 $7.53 $11.77 SAP and ORCL Precedent M&A Transaction Analysis $8.47 $13.81 $12.75 $11.91 $17.68 Precedent M&A Transaction Analysis Transactions Under $100 Million $7.30 $12.53 $12.84 $10.92 $19.16 Discounted Cash Flow Analysis $6.20 $6.99 $7.03 $7.03 $8.07 Premiums Paid Analysis: Majority Shareholder Purchasing Remaining Shares $5.78 $5.81 $5.92 $5.92 $6.18 Transactions in the Application Software Sector $5.98 $6.12 $6.12 $6.12 $6.25 |
 31 Sum of the Parts Analysis LTM Adj. EPS P/E Ratio Reference Company (exl. Net Interest Income) (exl. Net Interest Income) Epicor Software Corporation $0.75 6.9 x I2 Technologies, Inc. $0.89 11.1 JDA Software Group Inc. $1.76 8.3 Lawson Software, Inc. $0.35 16.6 Manhattan Associates, Inc. $1.12 15.2 Oracle Corp. $1.50 12.7 QAD Inc. ($0.70) NM SAP AG $2.51 15.1 Mean 12.3 x Median 12.7 High 16.6 Low 6.9 Implied Equity Value Per Share Mean $8.98 Median $9.15 High $10.86 Low $6.62 |