UNITED STATES
SECURITIES AND EXCHANGE COMMISSION
WASHINGTON, D.C. 20549
FORM N-CSR
CERTIFIED SHAREHOLDER REPORT OF REGISTERED
MANAGEMENT INVESTMENT COMPANIES
| 811-08411 |
| The James Advantage Funds |
(Exact name of registrant as specified in charter)
1349 Fairground Road
| Xenia, Ohio 45385 |
(Address of principal executive offices) (Zip code)
Barry R. James
P.O. Box 8
| Alpha, Ohio 45301 |
(Name and address of agent for service)
Registrant’s telephone number, including area code: (937) 426-7640
Date of fiscal year end: June 30
Date of reporting period: July 1, 2014 – June 30, 2015
Item 1. Reports to Stockholders.
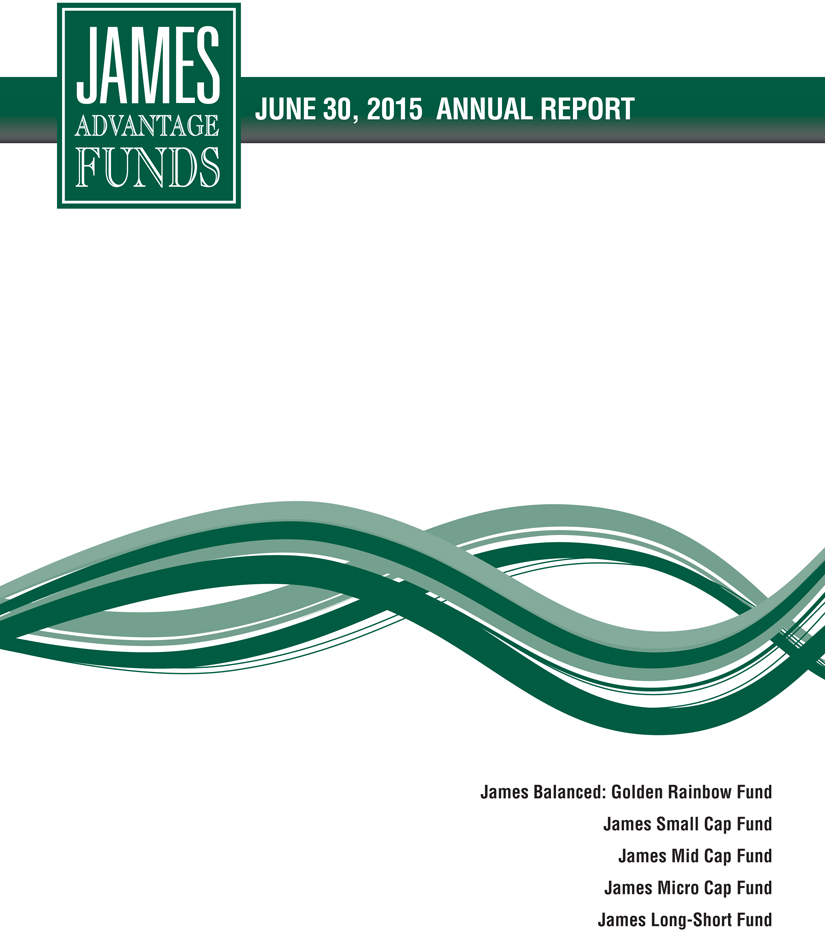
TABLE OF CONTENTS
| Shareholder Letter | 1 |
| Growth of $10,000 Charts | 4 |
| Representation of Schedules of Investments | 7 |
| Disclosure of Fund Expenses | 8 |
| Schedule of Investments | |
| James Balanced: Golden Rainbow Fund | 9 |
| James Small Cap Fund | 18 |
| James Mid Cap Fund | 21 |
| James Micro Cap Fund | 23 |
| James Long-Short Fund | 25 |
| Statements of Assets and Liabilities | 31 |
| Statements of Operations | 33 |
| Statements of Changes in Net Assets | 34 |
| Financial Highlights | |
| James Balanced: Golden Rainbow Fund - Retail Class | 40 |
| James Balanced: Golden Rainbow Fund - Institutional Class | 41 |
| James Small Cap Fund | 42 |
| James Mid Cap Fund | 43 |
| James Micro Cap Fund | 44 |
| James Long-Short Fund | 45 |
| Notes to Financial Statements | 46 |
| Report of Independent Registered Public Accounting Firm | 54 |
| Additional Information | 55 |
| Disclosure Regarding Approval of Fund Advisory Agreements | 56 |
| Trustees & Officers | 59 |
| Privacy Policy | 61 |
| James Advantage Funds | Shareholder Letter |
| June 30, 2015 (Unaudited) |
I am very pleased to write you today about the James Advantage Funds and our continued growth. Our Funds have passed $4.5 billion in total assets, with the James Balanced: Golden Rainbow Fund leading the way at $4.3 billion as of June 30. We always try to keep in mind the reason that most shareholders have trusted their savings with us: seeking growth without excessive risk and preservation of capital in bad times. We are very proud of the James Balanced: Golden Rainbow Fund’s long-term track record and our entire staff are dedicated to helping with your success.
Over the last year the markets have been roiled by Court decisions, Russian adventurism, more bad news from Greece and serious concerns over the viability of the Euro, one of the world’s most important currencies. Astronomical increases in the value of Chinese stocks, then a breath-taking drop in their markets also muddied the investment waters here at home. Still, through all this stocks actually rose. Bonds experienced a run in the second half of 2014, only to fall on their collective face in the first half of 2015. What a year! So, here are my thoughts about the year and how your Funds fared.
The Market Over the Past Year
The S&P 500® Index, a commonly used barometer of the stock market, rose by 7.42% over the twelve months ended June 30, 2015, an acceptable return given the market’s tremendous uncertainties. The Dow Jones Industrial Average rose about the same, 7.19%, while smaller capitalization stocks, represented by the Russell 2000® Index, rose 6.49%. The Barclays U.S. Aggregate Government/Credit Bond Index, a popular measure of the fixed income markets, rose a paltry 1.69%.
When looking at the various sector performances based on price appreciation (not total return) we will review those in the Russell 3000® Index because it includes both large and small capitalization companies whereas the S&P 500® Index is heavily weighted towards the large caps. The Health Care Sector led the market over the twelve months, rising 24.89%. In second place were Consumer Cyclical stocks, rising less than half as much at 12.11%. The year was, in fact, a tale of two markets though, as three sectors declined over the year: the Basic Materials Sector fell by 3.66%, the Utilities Sector dropped by 5.67%, and the Energy Sector, crushed by falling oil prices, retreated 26.34%. Overall, the Russell 3000® Index rose by a total return of 7.29%.
Bonds, especially long term Treasury bonds, did well in the last half of 2014 and even through the first quarter of 2015, but retreated in the second quarter of 2015. Weakness in the U.S. economy seemed to be weather related as consumer spending was lackluster until May and June, especially in housing and automobile sales. Bond investors, fearing a Fed rate hike, fled the fixed income market, putting downward pressure on bond prices and pinning remaining hopes of a bond market rally on continued deterioration of the Greek credit crisis. Any good news on that front sent prices of high quality bonds still lower.
Investment Goals and Objectives
Our Research team uses our proprietary approach to try and identify bargain securities, those that offer good relative value, profitability, and relative strength. In our experience, these stocks typically hold up better in difficult markets and have the potential to trade higher as the market rallies. We do not drift from our style simply because the markets are embracing a current, but temporary, fad. We believe value investing will outperform over the long run, a fact supported by much academic research.
The objectives of each Fund are stated in its Prospectus, and each Fund has a benchmark that may help investors understand broad trends and portfolio performance. Of course, benchmarks don’t take into account risks, unusual trends, or investment goals.
Investment Philosophy
We do our own research and our process has many facets: quantitative data collection and analysis from a large stock database, back-tested models for reliability and a strong nine member Investment Committee. The Investment Committee has a great deal of experience, exceeding over 200 years in total with James. We believe our combination of quantitative modeling and hands-on management makes us unique and creates the James Advantage Funds.
Fund Performance
The James Balanced: Golden Rainbow Fund Retail Class shares rose 2.90% over the twelve months ended June 30, 2015. Its blended secondary benchmark, a composite index comprised of the Russell 2000® Index, the S&P 500® Index and the Barclays Capital U.S. Intermediate Government/Credit Bond Index, rose by 4.51%. The Fund trailed this benchmark as bond holdings added little to the Fund’s total return and our type of value investing lagged growth stocks over the year. This is reflected in the indexes: the S&P 500® Value Index returned only 4.55% over the 12 months, but the S&P 500® Growth Index returned 10.06%. Looking at the Russell 3000®, we see Value returning 3.86% and Growth returning 10.68%. Clearly, this was not a year for value investors. Combining value stocks with the low returns on bonds resulted in a modest return for the Fund.
| Annual Report | June 30, 2015 | 1 |
| Shareholder Letter | James Advantage Funds |
| June 30, 2015 (Unaudited) |
The James Small Cap Fund declined by 1.21% over the fiscal year versus a rise of 6.49% for the Russell 2000® Index, its benchmark. The Russell 2000® Value index more closely reflects your Fund performance, rising only 0.78%. Investments in Energy and Utility stocks were a drag on the portfolio.
The James Mid Cap Fund fell 0.86% over the year while its benchmark, the S&P 400® MidCap Value Index, rose 3.53%. Again, we see exposure in Energy and Utility stocks dragging performance down.
The James Micro Cap Fund rose a solid 7.95% while its benchmark, the Russell Microcap® Index, rose 8.21% over the fiscal year. This Fund focuses on companies with market capitalizations at the time of purchase no larger than the stocks in the Russell Microcap® Index, including exchange traded funds that invest primarily in such securities.
Finally, the James Long-Short Fund fell 4.06%, while its benchmark, the S&P 500® Index, rose 7.42%. The Long-Short Fund can be leveraged up to 130%, but does not have to be leveraged, nor is it required to have any short positions at all. This Fund attempts to take advantage of volatile markets where we can capitalize on market swings, both up and down. The Fund’s prospectus advises shareholders and potential shareholders not to expect a tight correlation to the S&P 500® Index. The Fund lagged its benchmark because many of the stocks sold short were growth stocks, which outperformed the stocks held in long positions. The Fund did not use any bond investments during the year.
Please see the following charts for longer term comparisons for all our Funds.
Expectations for the Future
Our stock risk indicators remained positive at fiscal year end. On the other hand, our long term bond indicators, which had been positive for decades, have turned neutral. We believe bonds won’t produce the returns of the past, but they are an important stabilizer for portfolios. We think stocks exhibit potential, especially U.S. stocks. We have increased the allocation to stocks in the James Balanced: Golden Rainbow Fund, moving from 42.9% in stocks on June 30, 2014, to 54.6% stocks on June 30, 2015. We also moved the Fund’s bond duration (risk profile) lower, moving from 5.497 to 4.33. From time to time the Fund’s adviser issues special studies on topics of interest and recently issued a special study on June 29, 2015 advising its clients to buy stocks on market weakness generated by the deliberations in Europe over the Greece Crisis. We expect the Federal Reserve will, in fact, commence its long discussed lift-off of rates later in 2015, but we think this is priced into the stock market. Even with a shift, rates are likely to remain low through 2016.
We note the consumer is better off than in recent years, but the improvement is gradual and wages have remained flat, even as the unemployment rate dropped to 5.3%. We believe the Federal Reserve’s focus on the lack of wage inflation will restrain rapid moves to higher rates. Meanwhile, the U.S. consumer continues to buy new cars and new homes, pushing those measures of economic activity to impressive levels. Retailers, who had a very disappointing first six months of 2015, should fare much better in the second half of the year.
Our enthusiasm for U.S. stocks is tempered by rising concerns about China. After rising over 150% over twelve months, the Shanghai stock exchange plunged by 25% from June 12, 2015, through the end of the month, wiping out trillions of dollars in value. Excessive margin debt, an unclear regulatory framework and mounting concerns over China’s rising debt burden have led some investors to question whether the government is able to continue to prop up the stock market in the world’s second largest economy. These problems may spill over to our markets from time to time. We will be monitoring this carefully.
Currently, while we are positive on stocks, we think it is prudent to be alert to the exogenous events that influence our markets, both stocks and bonds. Any increase in bond yields can have a positive long term impact for shareholders by improving cash flows and increasing the portfolio’s income where bonds are held. We have no plans to ever be completely out of the bond market for our balanced portfolios.

Barry R. James, CFA, CIC
President
President
| 2 | www.jamesfunds.com |
| James Advantage Funds | Shareholder Letter |
| June 30, 2015 (Unaudited) |
You should carefully consider the investment objectives, potential risks, management fees, and charges and expenses of a Fund before investing. The Funds’ prospectuses contain this and other information. You may obtain a current copy of a Fund’s prospectus by calling 1-800-995-2637.
Past performance is no guarantee of future results. The investment return and principal value of an investment in any Fund will fluctuate so that an investor’s shares, when redeemed, may be worth more or less than their original cost.
The statements and opinions expressed are those of the author and are as of the date of this report. All information is historical, subject to change, and not indicative of future results. It should not be assumed that an investment in the securities mentioned will be profitable in the future. This information is not a recommendation to buy or sell.
Barry R. James is a registered representative of ALPS Distributors, Inc.
CFA® is a trademark owned by the CFA Institute.
The Dow Jones Industrial Average is a price-weighted overage of 30 actively traded Blue-Chip stocks.
The Russell 3000 Index is a stock market index of US stocks. The index measures the performance of 3,000 publicly held US companies based on total market capitalization, which represents approximately 98% of the investable US equity market. The Index returns do not reflect the deduction of expenses. The Index returns assume reinvestment of all distributions and do not reflect the deduction of taxes and fees. Individuals cannot invest directly in the Index.
The S&P 500® Growth Index is a market-capitalization-weighted index developed by Standard and Poor’s consisting of those stocks within the S&P 500 Index that exhibit strong growth characteristics. The Index is a numerical ranking system based on three growth factors and four value factors to determine the constituents and their weightings. The Index returns do not reflect the deduction of expenses. The Index returns assume reinvestment of all distributions and do not reflect the deduction of taxes and fees. Individuals cannot invest directly in the Index.
The S&P 500® Value Index is market-capitalization-weighted index developed by Standard and Poor’s consisting of those stocks within the S&P 500 Index that exhibit strong value characteristics. The Index uses a numerical ranking system based on four value factors and three growth factors to determine the constituents and their weightings. The Index returns do not reflect the deduction of expenses. The Index returns assume reinvestment of all distributions and do not reflect the deduction of taxes and fees. Individuals cannot invest directly in the Index.
| Annual Report | June 30, 2015 | 3 |
| Growth of $10,000 Charts | James Advantage Funds |
| June 30, 2015 (Unaudited) |
Comparison of the Change in Value of a $10,000 Investment in the James Balanced: Golden Rainbow Fund – Retail Class
James Balanced: Golden Rainbow Fund – Retail Class
Average Annual Total Returns
Average Annual Total Returns
1 Year | 5 Years | 10 Years | Since Inception(1) | |
| James Balanced: Golden Rainbow – Retail Class | 2.90% | 9.12% | 6.92% | 8.28% |
S&P 500® Index | 7.42% | 17.34% | 7.89% | 9.55% |
Russell 2000® Index | 6.49% | 17.08% | 8.40% | 10.24% |
| Barclays Capital U.S. Intermediate Government/ Credit Bond Index | 1.68% | 2.79% | 4.02% | 5.69% |
Blended Index(2) | 4.51% | 10.10% | 6.51% | 8.22% |
(1) | Inception was July 1, 1991. |
(2) | The Blended Index is comprised of a 25% weighting in the S&P 500® Index, a 25% weighting in the Russell 2000® Index and a 50% weighting in the Barclays Capital U.S. Intermediate Government/Credit Bond Index. |
| The total annual operating expense ratio as stated in the fee table of the most recent prospectus, dated November 1, 2014, was 1.01%. |
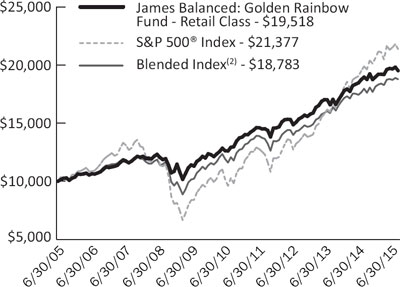
Comparison of the Change in Value of a $50,000 Investment in the James Balanced: Golden Rainbow Fund – Institutional Class
James Balanced: Golden Rainbow Fund – Institutional Class Average Annual Total Returns
1 Year | 5 Years | Since Inception(1) | |
| James Balanced: Golden Rainbow – Institutional Class | 3.20% | 9.40% | 11.53% |
S&P 500® Index | 7.42% | 17.34% | 21.14% |
Russell 2000® Index | 6.49% | 17.08% | 23.05% |
| Barclays Capital U.S. Intermediate Government/ Credit Bond Index | 1.68% | 2.79% | 3.84% |
Blended Index(2) | 4.51% | 10.10% | 13.05% |
(1) | Inception was March 2, 2009. |
(2) | The Blended Index is comprised of a 25% weighting in the S&P 500® Index, a 25% weighting in the Russell 2000® Index and a 50% weighting in the Barclays Capital U.S. Intermediate Government/Credit Bond Index. |
| The total annual operating expense ratio as stated in the fee table of the most recent prospectus, dated November 1, 2014, was 0.76%. |
Past performance does not guarantee future results. The performance data quoted represents past performance and current returns may be lower or higher. The investment return and principal value will fluctuate so that an investor’s shares, when redeemed, may be worth more or less than the original cost. These performance figures do not reflect the deduction of taxes that a shareholder would pay on Fund distributions or the redemption of Fund shares. Please call 1-800-995-2637 for most recent month-end performance information.
The S&P 500® Index is an unmanaged index of 500 common stocks chosen for market size, liquidity and industry group representation.
The Russell 2000® Index is a widely recognized, unmanaged index comprised of the 2,000 smallest U.S. domiciled publicly-traded common stocks of the Russell 3000® Index, which represents approximately 8% of the total market capitalization of the Russell 3000® Index, an unmanaged index of the 3,000 largest U.S. domiciled publicly-traded common stocks by market capitalization.
The Barclays Capital U.S. Intermediate Government/Credit Bond Index measures the performance of U.S. Dollar denominated U.S. Treasuries, government-related and investment grade U.S. corporate securities that have a remaining maturity of greater than one year and less than ten years.
The S&P 500® Index, Russell 2000® Index, Barclays Capital U.S. Intermediate Government/Credit Bond Index and Blended Index are widely recognized unmanaged indices of security prices and are representative of a broader market and range of securities than is found in the Fund’s portfolio. The Index returns do not reflect the deduction of expenses, which have been deducted from a Fund’s returns. The Index returns assume reinvestment of all distributions and do not reflect the deduction of taxes and fees. Individuals cannot invest directly in any Index; however, an individual can invest in exchange traded funds or other investment vehicles that attempt to track the performance of a benchmark index.
| 4 | www.jamesfunds.com |
| James Advantage Funds | Growth of $10,000 Charts |
| June 30, 2015 (Unaudited) |
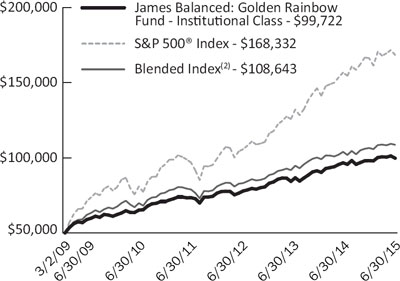
Comparison of the Change in Value of a $10,000 Investment in the James Small Cap Fund
James Small Cap Fund
Average Annual Total Returns
Average Annual Total Returns
| 1 Year | 5 Years | 10 Years | Since Inception(1) | |
| James Small Cap Fund | -1.21% | 15.00% | 6.00% | 8.49% |
Russell 2000® Index | 6.49% | 17.08% | 8.40% | 9.35% |
(1) | Fund inception was October 2, 1998. |
| The total annual operating expense ratio as stated in the fee table of the most recent prospectus, dated November 1, 2014, was 1.51%. |
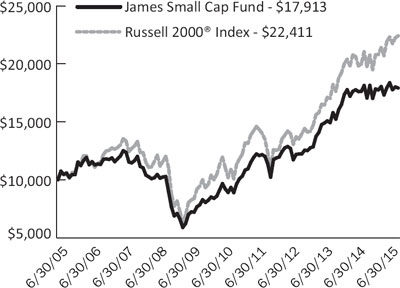
Comparison of the Change in Value of a $10,000 Investment in the James Mid Cap Fund
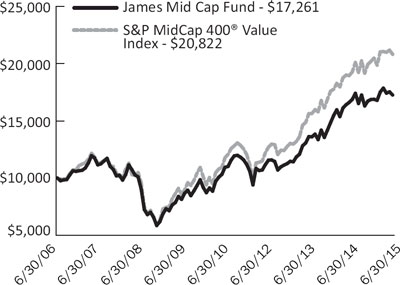
James Mid Cap Fund
Average Annual Total Returns
Average Annual Total Returns
| 1 Year | 5 Years | Since Inception(1) | |
| James Mid Cap Fund | -0.86% | 14.65% | 6.25% |
S&P MidCap 400® Value Index | 3.53% | 17.25% | 8.49% |
(1) | Fund inception was June 30, 2006. |
| The total annual operating expense ratio as stated in the fee table of the most recent prospectus, dated November 1, 2014, was 1.51%. |
Past performance does not guarantee future results. The performance data quoted represents past performance and current returns may be lower or higher. The investment return and principal value will fluctuate so that an investor’s shares, when redeemed, may be worth more or less than the original cost. These performance figures do not reflect the deduction of taxes that a shareholder would pay on Fund distributions or the redemption of Fund shares. Please call 1-800-995-2637 for most recent month-end performance information.
Mid, Small and Micro Cap investing involve greater risk not associated with investing in more established companies, such as greater price volatility, business risk, less liquidity and increased competitive threat.
The Mid-Cap Fund invests in stocks of mid-cap companies which tend to be more volatile and can be less liquid than stocks of large-cap companies. Diversification does not guarantee a profit or protect against loss. Current and future portfolio holdings are subject to risk.
The Russell 2000® Value Index is a widely recognized, unmanaged index that measures the performance of those Russell 2000® Index companies with lower price-to-book ratios and lower forecasted growth values.
The Russell 2000® Index is a widely recognized, unmanaged index comprised of the 2,000 smallest U.S. domiciled publicly-traded common stocks of the Russell 3000® Index, which represents approximately 8% of the total market capitalization of the Russell 3000® Index, an unmanaged index of the 3,000 largest U.S. domiciled publicly-traded common stocks by market capitalization.
The S&P MidCap 400® Value Index is a recognized, unmanaged index of mid cap stocks considered to be value stocks using Standard and
Poor’s methodology.
Poor’s methodology.
The Russell 2000® Index and S&P MidCap Value 400® Index are widely recognized unmanaged indices of security prices and are representative of a broader market and range of securities than is found in the Fund’s portfolio. The Index returns do not reflect the deduction of expenses, which have been deducted from a Fund’s returns. The Index returns assume reinvestment of all distributions and do not reflect the deduction of taxes and fees. Individuals cannot invest directly in any Index; however, an individual can invest in exchange traded funds or other investment vehicles that attempt to track the performance of a benchmark index.
| Annual Report | June 30, 2015 | 5 |
| Growth of $10,000 Charts | James Advantage Funds |
| June 30, 2015 (Unaudited) |
Comparison of the Change in Value of a $10,000 Investment in the James Micro Cap Fund
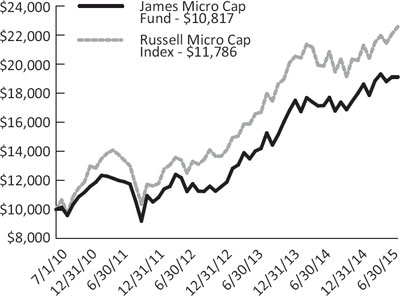
James Micro Cap Fund
Average Annual Total Returns
| 1 Year | Since Inception(1) | |
| James Micro Cap Fund | 7.95% | 13.86% |
Russell Microcap® Index | 8.21% | 17.71% |
(1) | Fund inception was July 1, 2010. |
| The total annual operating expense ratio as stated in the fee table of the most recent prospectus, dated November 1, 2014 was 1.51%. |
Comparison of the Change in Value of a $10,000 Investment in the James Long-Short Fund
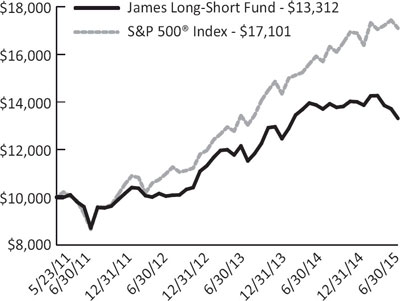
James Long-Short Fund
Average Annual Total Returns
| 1 Year | Since Inception(1) | |
| James Long-Short Fund | -4.06% | 7.22% |
S&P 500® Index | 7.42% | 13.97% |
(1) | Fund inception was May 23, 2011. |
| The total annual operating expense ratio as stated in the fee table of the most recent prospectus, dated November 1, 2014, was 2.59%. |
Past performance does not guarantee future results. The performance data quoted represents past performance and current returns may be lower or higher. The investment return and principal value will fluctuate so that an investor’s shares, when redeemed, may be worth more or less than the original cost. These performance figures do not reflect the deduction of taxes that a shareholder would pay on Fund distributions or the redemption of Fund shares. Please call 1-800-995-2637 for most recent month-end performance information.
Mid, Small and Micro Cap investing involve greater risk not associated with investing in more established companies, such as greater price volatility, business risk, less liquidity and increased competitive threat.
Short selling incurs significant additional risk; theoretically, stocks sold short have unlimited upside risk potential. In addition, this strategy depends on the Adviser’s ability to correctly identify undervalued and overvalued stocks, and that the stock markets are reasonable and efficient. Periods of extreme volatility may harm the performance of this product. The Long-Short Fund may have a high portfolio turnover rate. A high portfolio turnover rate can result in increased brokerage commission costs and may expose taxable shareholders to potentially larger current tax liability.
The Russell Microcap® Index measures the performance of the microcap segment of the U.S. equity market. It makes up less than 3% of the U.S. equity market. It includes 1,000 of the smallest securities in the small cap Russell 2000® Index, plus the next smallest eligible securities by market cap.
The S&P 500® Index is an unmanaged index of 500 common stocks chosen for market size, liquidity and industry group representation.
The S&P 500® Index and Russell Microcap® Index are widely recognized unmanaged indices of security prices and are representative of a broader market and range of securities than is found in the Fund’s portfolio. The Index returns do not reflect the deduction of expenses, which have been deducted from a Fund’s returns. The Index returns assume reinvestment of all distributions and do not reflect the deduction of taxes and fees. Individuals cannot invest directly in any Index; however, an individual can invest in exchange traded funds or other investment vehicles that attempt to track the performance of a benchmark index.
| 6 | www.jamesfunds.com |
| James Advantage Funds | Representation of Schedules of Investments |
| June 30, 2015 (Unaudited) |
The illustrations below provide the industry sectors for the James Balanced: Golden Rainbow Fund, James Small Cap Fund, James Mid Cap Fund, James Micro Cap Fund and James Long-Short Fund.
James Balanced: Golden Rainbow Fund - Industry Sector Allocation (% of Net Assets) 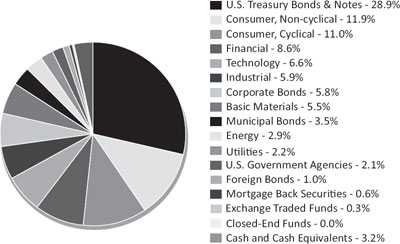 |
James Small Cap Fund - Industry Sector Allocation (% of Net Assets)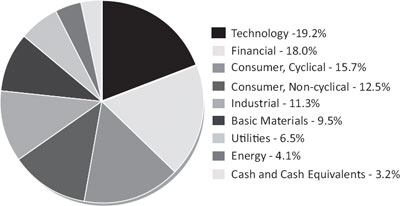 |
James Mid Cap Fund - Industry Sector Allocation (% of Net Assets) 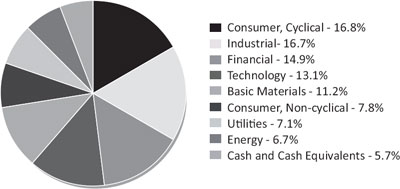 |
James Micro Cap Fund - Industry Sector Allocation (% of Net Assets) 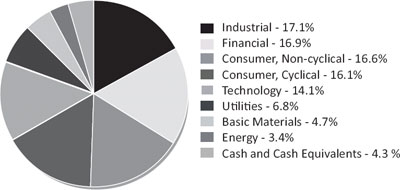 |
James Long-Short Fund - Industry Sector Allocation (% of Net Assets) (Cash and Cash Equivalents and Other Liabilities in Excess of Assets not included) 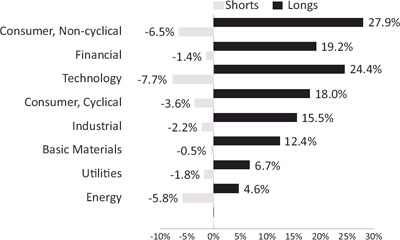 |
| Annual Report | June 30, 2015 | 7 |
| Disclosure of Fund Expenses | James Advantage Funds |
June 30, 2015 (Unaudited)
Example. As a shareholder of a Fund, you incur two types of costs: (1) transaction costs, including reinvested dividends or other distributions, and redemption fees; and (2) ongoing costs, including management fees, distribution (12b-1) fees and other Fund expenses. This example is intended to help you understand your ongoing costs (in dollars) of investing in the Funds and to compare these costs with the ongoing costs of investing in other mutual funds.
The example is based on an investment of $1,000 invested at the beginning of the period and held for the entire period January 1, 2015 through June 30, 2015.
Actual Expenses. The first line of the table below provides information about actual account values and actual expenses. You may use the information in this line, together with the amount you invested, to estimate the expenses that you paid over the period. Simply divide your account value by $1,000 (for example, an $8,600 account value divided by $1,000 = 8.6), then multiply the result by the number in the first line under the heading “Expense Paid During Period” to estimate the expenses you paid on your account during this period.
Hypothetical Example for Comparison Purposes. The second line of the table below provides information about hypothetical account values and hypothetical expenses based on a Fund’s actual expense ratio and an assumed rate of return of 5% per year before expenses, which is not the Fund’s actual returns. The hypothetical account values and expenses may not be used to estimate the actual ending account balance or expenses you paid for the period. You may use this information to compare the ongoing costs of investing in a Fund and other mutual funds. To do so, compare this 5% hypothetical example with the 5% hypothetical examples that appear in the shareholder reports of the other funds.
Please note that expenses shown in the table are meant to highlight and help you compare ongoing costs only. The calculations assume no shares were bought or sold during the period. Your actual costs may have been higher or lower, depending on the amount of your investment and the timing of any purchases or redemptions.
Net Expense Ratio Annualized June 30, 2015(a) | Beginning Account Value January 1, 2015 | Ending Account Value June 30, 2015 | Expense Paid During Period(b) | |||||||||||||||
| James Balanced: Golden Rainbow Fund | ||||||||||||||||||
| Retail Class Actual | 0.97% | $ | 1,000.00 | $ | 1,015.60 | $ | 4.85 | |||||||||||
| Retail Class Hypothetical (5% return before expenses) | 0.97% | $ | 1,000.00 | $ | 1,019.98 | $ | 4.86 | |||||||||||
| Institutional Class Actual | 0.72% | $ | 1,000.00 | $ | 1,016.60 | $ | 3.60 | |||||||||||
| Institutional Class Hypothetical (5% return before expenses) | 0.72% | $ | 1,000.00 | $ | 1,021.22 | $ | 3.61 | |||||||||||
| James Small Cap Fund | ||||||||||||||||||
| Actual | 1.50% | $ | 1,000.00 | $ | 992.90 | $ | 7.41 | |||||||||||
| Hypothetical (5% return before expenses) | 1.50% | $ | 1,000.00 | $ | 1,017.36 | $ | 7.50 | |||||||||||
| James Mid Cap Fund | ||||||||||||||||||
| Actual | 1.50% | $ | 1,000.00 | $ | 1,022.00 | $ | 7.52 | |||||||||||
| Hypothetical (5% return before expenses) | 1.50% | $ | 1,000.00 | $ | 1,017.36 | $ | 7.50 | |||||||||||
| James Micro Cap Fund | ||||||||||||||||||
| Actual | 1.50% | $ | 1,000.00 | $ | 1,026.50 | $ | 7.54 | |||||||||||
| Hypothetical (5% return before expenses) | 1.50% | $ | 1,000.00 | $ | 1,017.36 | $ | 7.50 | |||||||||||
| James Long‐Short Fund | ||||||||||||||||||
| Actual | 2.69%(c) | $ | 1,000.00 | $ | 950.50 | $ | 13.01 | |||||||||||
| Hypothetical (5% return before expenses) | 2.69%(c) | $ | 1,000.00 | $ | 1,011.46 | $ | 13.42 | |||||||||||
(a) | Annualized, based on the Fund’s most recent fiscal half year expenses. |
(b) | Expenses are equal to the Fund’s annualized expense ratio multiplied by the average account value over the period, multiplied by the number of days in the most recent fiscal half year (181), divided by 365. |
(c) | Dividend and interest expense on securities sold short and interest expense totaled 1.19% (annualized) of average net assets for the six months ended June 30, 2015. |
| 8 | www.jamesfunds.com |
| James Balanced: Golden Rainbow Fund | Schedule of Investments |
| June 30, 2015 |
| Shares or Principal Amount | Value | ||||||
| COMMON STOCKS-54.6% | |||||||
| Basic Materials-5.5% | |||||||
| 38,920 | Alcoa, Inc. | $ | 433,958 | ||||
| 70,000 | Avery Dennison Corp. | 4,265,800 | |||||
| 465,980 | Celanese Corp., Series A | 33,494,642 | |||||
| 667,050 | CF Industries Holdings, Inc. | 42,877,974 | |||||
| 318,930 | Cooper Tire & Rubber Co. | 10,789,402 | |||||
| 40,930 | Cytec Industries, Inc. | 2,477,493 | |||||
| 833,790 | Dow Chemical Co. | 42,665,034 | |||||
| 57,000 | Ferro Corp.* | 956,460 | |||||
| 993,430 | Goodyear Tire & Rubber Co. | 29,951,915 | |||||
| 240,000 | Huntsman Corp. | 5,296,800 | |||||
| 150,000 | Lydall, Inc.* | 4,434,000 | |||||
| 426,630 | Newmont Mining Corp. | 9,966,077 | |||||
| 666,900 | Westlake Chemical Corp. | 45,742,671 | |||||
| 233,352,226 | |||||||
| Consumer, Cyclical-11.0% | |||||||
| 1,553,820 | Alaska Air Group, Inc. | 100,112,622 | |||||
| 507,040 | Best Buy Co., Inc. | 16,534,575 | |||||
| 299,990 | Cato Corp., Class A | 11,627,612 | |||||
| 404,890 | Delta Air Lines, Inc. | 16,632,881 | |||||
| 399,840 | Dillard’s, Inc., Class A | 42,059,170 | |||||
| 696,660 | DIRECTV* | 64,643,081 | |||||
| 486,220 | Foot Locker, Inc. | 32,581,602 | |||||
| 902,440 | Ford Motor Co. | 13,545,624 | |||||
| 682,700 | Hanesbrands, Inc. | 22,747,564 | |||||
| 431,370 | Hawaiian Holdings, Inc.* | 10,245,038 | |||||
| 54,530 | Insight Enterprises, Inc.* | 1,630,992 | |||||
| 789,820 | Macy’s, Inc. | 53,289,155 | |||||
| 126,870 | Multi-Color Corp. | 8,104,456 | |||||
| 76,200 | PharMerica Corp.* | 2,537,460 | |||||
| 77,500 | Republic Airways Holdings, Inc.* | 711,450 | |||||
| 526,620 | RR Donnelley & Sons Co. | 9,178,987 | |||||
| 320,000 | Skechers U.S.A., Inc., Class A* | 35,132,800 | |||||
| 736,900 | Southwest Airlines Co. | 24,384,021 | |||||
| 29,810 | Viacom, Inc., Class A | 1,933,775 | |||||
| 38,460 | Viacom, Inc., Class B | 2,486,054 | |||||
| 470,118,919 | |||||||
| Consumer, Non-cyclical-11.9% | |||||||
| 302,580 | Aetna, Inc. | 38,566,847 | |||||
| 382,115 | Anthem, Inc. | 62,720,356 | |||||
| 251,155 | DeVry Education Group, Inc. | 7,529,627 | |||||
| 741,540 | Dr Pepper Snapple Group, Inc. | 54,058,266 | |||||
| 146,730 | DST Systems, Inc. | 18,485,045 | |||||
| 389,650 | Eli Lilly & Co. | 32,531,878 | |||||
| 27,400 | Helen of Troy, Ltd.* | 2,671,226 | |||||
| 165,270 | Ingles Markets, Inc., Class A | 7,894,948 | |||||
| 1,011,860 | Kroger Co. | 73,369,969 | |||||
| 27,728 | ManpowerGroup, Inc. | 2,478,329 | |||||
| 629,650 | Merck & Co., Inc. | 35,845,974 | |||||
| 918,030 | Mylan NV* | 62,297,516 | |||||
| 397,930 | Newell Rubbermaid, Inc. | 16,358,902 | |||||
| See Notes to Financial Statements. | |
| Annual Report | June 30, 2015 | 9 |
| Schedule of Investments | James Balanced: Golden Rainbow Fund |
| Shares or Principal Amount | Value | ||||||
| Consumer, Non-cyclical (continued) | |||||||
| 30,000 | Omega Protein Corp.* | $ | 412,500 | ||||
| 298,533 | Omnicare, Inc. | 28,136,735 | |||||
| 698,720 | Pfizer, Inc. | 23,428,082 | |||||
| 26,200 | Sanderson Farms, Inc. | 1,969,192 | |||||
| 575 | Seaboard Corp.* | 2,069,425 | |||||
| 422,225 | SUPERVALU, Inc.* | 3,415,800 | |||||
| 247,560 | UnitedHealth Group, Inc. | 30,202,320 | |||||
| 504,442,937 | |||||||
| Energy-2.9% | |||||||
| 91,260 | Baker Hughes, Inc. | 5,630,742 | |||||
| 234,140 | Chevron Corp. | 22,587,486 | |||||
| 250,510 | ConocoPhillips | 15,383,819 | |||||
| 150,420 | Exxon Mobil Corp. | 12,514,944 | |||||
| 52,750 | Helmerich & Payne, Inc. | 3,714,655 | |||||
| 40,184 | HollyFrontier Corp. | 1,715,455 | |||||
| 424,340 | Tesoro Corp. | 35,818,539 | |||||
| 339,990 | Valero Energy Corp. | 21,283,374 | |||||
| 73,860 | World Fuel Services Corp. | 3,541,587 | |||||
| 122,190,601 | |||||||
| Financial-8.6% | |||||||
| 115,800 | ACE, Ltd. | 11,774,544 | |||||
| 450,923 | American Financial Group, Inc. | 29,328,032 | |||||
| 606,430 | AmTrust Financial Services, Inc. | 39,727,229 | |||||
| 132,165 | Argo Group International Holdings, Ltd. | 7,361,590 | |||||
| 657,740 | Aspen Insurance Holdings, Ltd. | 31,505,746 | |||||
| 88,278 | FBL Financial Group, Inc., Class A | 5,095,406 | |||||
| 947,280 | Fifth Third Bancorp | 19,722,369 | |||||
| 162,000 | Goldman Sachs Group, Inc. | 33,823,980 | |||||
| 25,573 | Hersha Hospitality Trust, REIT | 655,679 | |||||
| 12,810 | Horace Mann Educators Corp. | 466,028 | |||||
| 378,300 | JPMorgan Chase & Co. | 25,633,608 | |||||
| 1,169,390 | KeyCorp | 17,564,238 | |||||
| 296,420 | Montpelier Re Holdings, Ltd. | 11,708,590 | |||||
| 348,200 | Nelnet, Inc., Class A | 15,080,542 | |||||
| 231,390 | Outerwall, Inc. | 17,611,093 | |||||
| 267,530 | Piper Jaffray Cos.* | 11,675,009 | |||||
| 60,180 | PNC Financial Services Group, Inc. | 5,756,217 | |||||
| 135,130 | Torchmark Corp. | 7,867,269 | |||||
| 542,304 | Travelers Cos., Inc. | 52,419,105 | |||||
| 377,025 | Unum Group | 13,478,644 | |||||
| 182,880 | XL Group PLC | 6,803,136 | |||||
| 365,058,054 | |||||||
| Industrial-5.9% | |||||||
| 104,120 | AMERCO | 34,037,869 | |||||
| 715,170 | American Axle & Manufacturing Holdings, Inc.* | 14,954,205 | |||||
| 360,000 | American Railcar Industries, Inc. | 17,510,400 | |||||
| 274,110 | Ball Corp. | 19,228,816 | |||||
| 177,572 | CNH Industrial NV | 1,647,868 | |||||
| 13,670 | Crown Holdings, Inc.* | 723,280 | |||||
| 13,580 | Dana Holding Corp. | 279,476 | |||||
| See Notes to Financial Statements. | |
| 10 | www.jamesfunds.com |
| James Balanced: Golden Rainbow Fund | Schedule of Investments |
| June 30, 2015 |
| Shares or Principal Amount | Value | ||||||
| Industrial (continued) | |||||||
| 76,190 | Deere & Co. | $ | 7,394,239 | ||||
| 258,695 | Greenbrier Cos., Inc. | 12,119,861 | |||||
| 460,540 | Jarden Corp.* | 23,832,945 | |||||
| 1,054,400 | Magna International, Inc. | 59,141,296 | |||||
| 163,560 | Meritor, Inc.* | 2,145,907 | |||||
| 179,710 | Ryder System, Inc. | 15,701,263 | |||||
| 77,700 | Sonoco Products Co. | 3,330,222 | |||||
| 640,350 | Trinity Industries, Inc. | 16,924,451 | |||||
| 300,000 | Tsakos Energy Navigation, Ltd. | 2,859,000 | |||||
| 223,090 | United Rentals, Inc.* | 19,547,146 | |||||
| 251,378,244 | |||||||
| Technology-6.6% | |||||||
| 75,000 | AAR Corp. | 2,390,250 | |||||
| 55,000 | ACCO Brands Corp.* | 427,350 | |||||
| 100,060 | Amkor Technology, Inc.* | 598,359 | |||||
| 206,150 | Apple, Inc. | 25,856,364 | |||||
| 318,220 | Arrow Electronics, Inc.* | 17,756,676 | |||||
| 211,540 | Avnet, Inc. | 8,696,409 | |||||
| 62,000 | Cisco Systems, Inc. | 1,702,520 | |||||
| 220,420 | Corning, Inc. | 4,348,887 | |||||
| 841,840 | Deluxe Corp. | 52,194,080 | |||||
| 400,230 | Intel Corp. | 12,172,995 | |||||
| 330,780 | Lexmark International, Inc., Class A | 14,620,476 | |||||
| 144,220 | Lockheed Martin Corp. | 26,810,498 | |||||
| 250,650 | Northrop Grumman Corp. | 39,760,609 | |||||
| 20,100 | Orbotech, Ltd.* | 418,080 | |||||
| 228,950 | PDL BioPharma, Inc. | 1,472,148 | |||||
| 114,050 | Symantec Corp. | 2,651,663 | |||||
| 152,930 | SYNNEX Corp. | 11,192,947 | |||||
| 208,460 | Tower Semiconductor, Ltd.* | 3,218,622 | |||||
| 150,000 | VASCO Data Security International, Inc.* | 4,528,500 | |||||
| 645,930 | Western Digital Corp. | 50,653,831 | |||||
| 281,471,264 | |||||||
| Utilities-2.2% | |||||||
| 230,540 | American Electric Power Co., Inc. | 12,211,704 | |||||
| 200,000 | AT&T, Inc. | 7,104,000 | |||||
| 121,070 | BCE, Inc. | 5,145,475 | |||||
| 189,210 | BT Group PLC, Sponsored ADR | 13,413,097 | |||||
| 129,400 | DTE Energy Co. | 9,658,416 | |||||
| 109,700 | Edison International | 6,097,126 | |||||
| 70,610 | IDACORP, Inc. | 3,964,046 | |||||
| 47,700 | PG&E Corp. | 2,342,070 | |||||
| 60,090 | Pinnacle West Capital Corp. | 3,418,520 | |||||
| 75,180 | PNM Resources, Inc. | 1,849,428 | |||||
| 360,650 | Portland General Electric Co. | 11,959,154 | |||||
| 122,280 | Public Service Enterprise Group, Inc. | 4,803,158 | |||||
| 9,080 | TELUS Corp. | 312,715 | |||||
| 216,920 | UGI Corp. | 7,472,894 | |||||
| 370,770 | Vonage Holdings Corp.* | 1,820,481 | |||||
| See Notes to Financial Statements. | |
| Annual Report | June 30, 2015 | 11 |
| Schedule of Investments | James Balanced: Golden Rainbow Fund |
| Shares or Principal Amount | Value | ||||||
| Utilities (continued) | |||||||
| 65,860 | Westar Energy, Inc. | $ | 2,253,729 | ||||
| 93,826,013 | |||||||
TOTAL COMMON STOCKS (Cost $1,851,296,229) | 2,321,838,258 | ||||||
CLOSED-END FUNDS-0.0%(a) | |||||||
| 76,550 | Eaton Vance Risk-Managed Diversified Equity Income Fund | 827,505 | |||||
| 10,000 | Nuveen Municipal Opportunity Fund, Inc. | 136,100 | |||||
| 40,000 | Nuveen Premium Income Municipal Fund 2, Inc. | 531,200 | |||||
TOTAL CLOSED-END FUNDS (Cost $1,355,923) | 1,494,805 | ||||||
| EXCHANGE TRADED FUNDS-0.3% | |||||||
| 69,710 | iShares® MSCI Canada ETF | 1,859,166 | |||||
| 51,510 | iShares® MSCI Philippines ETF | 1,983,135 | |||||
| 86,270 | iShares® MSCI Poland Capped ETF | 1,970,407 | |||||
| 131,060 | iShares® MSCI Singapore ETF | 1,647,424 | |||||
| 50,820 | iShares® MSCI Switzerland Capped ETF | 1,664,355 | |||||
| 10,000 | iShares® National AMT-Free Municipal Bond ETF | 1,082,100 | |||||
| 122,900 | SPDR® Nuveen Barclays Short Term Municipal Bond ETF | 2,984,012 | |||||
TOTAL EXCHANGE TRADED FUNDS (Cost $13,148,234) | 13,190,599 | ||||||
| CORPORATE BONDS-5.8% | |||||||
| Basic Materials-0.2% | |||||||
| $ | 5,000,000 | E.I. du Pont de Nemours & Co., 2.750%, 4/1/16 | 5,082,005 | ||||
| 1,500,000 | E.I. du Pont de Nemours & Co., 5.750%, 3/15/19 | 1,699,521 | |||||
| 6,781,526 | |||||||
| Consumer, Cyclical-0.3% | |||||||
| 5,000,000 | eBay, Inc., 2.600%, 7/15/22 | 4,638,825 | |||||
| 5,000,000 | Home Depot, Inc., 5.950%, 4/1/41 | 6,066,105 | |||||
| 785,000 | McDonald’s Corp., 5.700%, 2/1/39 | 873,728 | |||||
| 2,000,000 | Wal-Mart Stores, Inc., 5.250%, 9/1/35 | 2,263,914 | |||||
| 13,842,572 | |||||||
| Consumer, Non-cyclical-1.5% | |||||||
| 10,000,000 | Coca-Cola Co., 3.200%, 11/1/23 | 10,086,920 | |||||
| 5,000,000 | Colgate-Palmolive Co., 3.150%, 8/5/15 | 5,011,345 | |||||
| 3,000,000 | Hershey Co., 4.125%, 12/1/20 | 3,285,333 | |||||
| 5,475,000 | Johnson & Johnson, 4.500%, 9/1/40 | 5,805,893 | |||||
| 5,000,000 | Merck & Co. Inc, 2.800%, 5/18/23 | 4,912,925 | |||||
| 10,000,000 | Merck & Co., Inc., 4.150%, 5/18/43 | 9,683,330 | |||||
| 10,000,000 | PepsiCo, Inc., 5.000%, 6/1/18 | 10,956,080 | |||||
| 10,000,000 | Stryker Corp., 2.000%, 9/30/16 | 10,107,100 | |||||
| 5,465,000 | Wyeth LLC, 5.500%, 2/15/16 | 5,631,644 | |||||
| 65,480,570 | |||||||
| Energy-1.1% | |||||||
| 5,000,000 | Apache Corp., 3.250%, 4/15/22 | 4,911,565 | |||||
| 5,000,000 | BP Capital Markets PLC, 3.245%, 5/6/22 | 5,007,960 | |||||
| See Notes to Financial Statements. | |
| 12 | www.jamesfunds.com |
| James Balanced: Golden Rainbow Fund | Schedule of Investments |
| June 30, 2015 |
| Shares or Principal Amount | Value | ||||||
| Energy (continued) | |||||||
| $ | 10,000,000 | Diamond Offshore Drilling, Inc., 5.875%, 5/1/19 | $ | 11,183,330 | |||
| 5,000,000 | Occidental Petroleum Corp., 1.750%, 2/15/17 | 5,044,645 | |||||
| 5,050,000 | Shell International Finance BV, 2.375%, 8/21/22 | 4,875,492 | |||||
| 5,000,000 | Shell International Finance BV, 6.375%, 12/15/38 | 6,267,425 | |||||
| 10,000,000 | Statoil ASA, 2.250%, 11/8/19 | 10,021,980 | |||||
| 47,312,397 | |||||||
| Financial-1.5% | |||||||
| 5,000,000 | Aflac, Inc., 2.650%, 2/15/17 | 5,117,110 | |||||
| 5,000,000 | Bank of America Corp., 1.777%, 4/27/16(b) | 5,029,450 | |||||
| 5,000,000 | Berkshire Hathaway, Inc., 3.750%, 8/15/21 | 5,367,870 | |||||
| 5,000,000 | Citigroup, Inc., 4.450%, 1/10/17 | 5,223,195 | |||||
| 10,000,000 | General Electric Capital Corp., 1.075%, 4/15/20(b) | 10,070,060 | |||||
| 2,000,000 | General Electric Capital Corp., 6.875%, 1/10/39 | 2,677,034 | |||||
| 15,000,000 | JPMorgan Chase & Co., 2.600%, 1/15/16 | 15,118,395 | |||||
| 5,000,000 | Morgan Stanley & Co., 3.450%, 11/2/15 | 5,045,335 | |||||
| 5,000,000 | Morgan Stanley & Co., 4.750%, 3/22/17 | 5,274,040 | |||||
| 5,000,000 | UBS AG, 5.875%, 12/20/17 | 5,499,585 | |||||
| 64,422,074 | |||||||
| Industrial-0.2% | |||||||
| 1,000,000 | Caterpillar, Inc., 7.900%, 12/15/18 | 1,200,268 | |||||
| 1,000,000 | Caterpillar, Inc., 8.250%, 12/15/38 | 1,487,535 | |||||
| 5,000,000 | United Technologies Corp., 3.100%, 6/1/22 | 5,033,870 | |||||
| 7,721,673 | |||||||
| Technology-0.8% | |||||||
| 8,000,000 | Google, Inc., 3.625%, 5/19/21 | 8,571,344 | |||||
| 5,000,000 | Intel Corp., 3.300%, 10/1/21 | 5,214,140 | |||||
| 3,000,000 | International Business Machines Corp., 1.950%, 7/22/16 | 3,042,852 | |||||
| 7,000,000 | International Business Machines Corp., 1.875%, 8/1/22 | 6,527,038 | |||||
| 3,700,000 | Microsoft Corp., 5.200%, 6/1/39 | 4,130,839 | |||||
| 5,000,000 | Oracle Corp., 2.500%, 10/15/22 | 4,812,040 | |||||
| 32,298,253 | |||||||
| Utilities-0.2% | |||||||
| 5,000,000 | Duke Energy Florida, Inc., Series A, 5.800%, 9/15/17 | 5,472,815 | |||||
| 4,600,000 | San Diego Gas & Electric Co., 3.000%, 8/15/21 | 4,712,065 | |||||
| 10,184,880 | |||||||
TOTAL CORPORATE BONDS (Cost $247,637,731) | 248,043,945 | ||||||
| MORTGAGE BACKED SECURITIES-0.6% | |||||||
| Federal National Mortgage Association-0.5% | |||||||
| 15,065,591 | 3.500%, 9/1/33 | 15,737,801 | |||||
| 2,429,913 | 4.500%, 9/1/40 | 2,552,050 | |||||
| 18,289,851 | |||||||
| See Notes to Financial Statements. | |
| Annual Report | June 30, 2015 | 13 |
| Schedule of Investments | James Balanced: Golden Rainbow Fund |
| Shares or Principal Amount | Value | ||||||
| Government National Mortgage Association-0.1% | |||||||
| $ | 4,780,731 | 4.000%, 12/20/40 | $ | 5,116,874 | |||
TOTAL MORTGAGE BACKED SECURITIES (Cost $22,819,019) | 23,406,725 | ||||||
| U.S. GOVERNMENT AGENCIES-2.1% | |||||||
| Federal Farm Credit Banks-0.9% | |||||||
| 10,000,000 | 1.750%, 5/28/20 | 9,897,630 | |||||
| 10,000,000 | 2.380%, 5/15/23 | 9,663,660 | |||||
| 10,000,000 | 3.250%, 7/7/25 | 9,981,920 | |||||
| 10,000,000 | 3.220%, 3/26/31 | 9,777,530 | |||||
| 39,320,740 | |||||||
| Federal Home Loan Bank-0.4% | |||||||
| 5,000,000 | 1.600%, 10/22/20 | 4,905,555 | |||||
| 10,000,000 | 2.430%, 10/11/22 | 9,829,520 | |||||
| 14,735,075 | |||||||
| Federal Home Loan Banks-0.7% | |||||||
| 25,000,000 | 2.125%, 6/25/25 (b) | 24,985,125 | |||||
| 5,850,000 | 3.270%, 7/7/25 | 5,852,691 | |||||
| 30,837,816 | |||||||
| United States Department of Housing and Urban Development-0.1% | |||||||
| 5,000,000 | 2.050%, 8/1/19 | 5,097,130 | |||||
TOTAL U.S. GOVERNMENT AGENCIES (Cost $91,023,211) | 89,990,761 | ||||||
| U.S. TREASURY BONDS & NOTES-28.9% | |||||||
| U.S. Treasury Bonds-3.3% | |||||||
| 60,000,000 | 5.375%, 2/15/31 | 80,493,720 | |||||
| 40,000,000 | 3.125%, 2/15/42 | 40,037,520 | |||||
| 20,000,000 | 2.750%, 8/15/42 | 18,542,180 | |||||
| 139,073,420 | |||||||
| U.S. Treasury Inflation Indexed Bonds-0.1% | |||||||
| 5,295,851 | 0.625%, 2/15/43 | 4,652,490 | |||||
| U.S. Treasury Inflation Indexed Notes-0.7% | |||||||
| 12,986,835 | 1.625%, 1/15/18 | 13,712,267 | |||||
| 16,133,113 | 0.125%, 1/15/22 | 15,962,957 | |||||
| 29,675,224 | |||||||
| U.S. Treasury Notes-24.8% | |||||||
| 35,000,000 | 2.000%, 1/31/16 | 35,377,335 | |||||
| 15,000,000 | 0.250%, 5/15/16 | 14,992,965 | |||||
| 41,000,000 | 1.000%, 9/30/16 | 41,294,708 | |||||
| 125,000,000 | 0.375%, 10/31/16 | 124,863,250 | |||||
| 58,000,000 | 4.625%, 2/15/17 | 61,806,250 | |||||
| 50,000,000 | 0.875%, 10/15/17 | 50,089,850 | |||||
| 100,000,000 | 0.875%, 11/15/17 | 100,132,800 | |||||
| 150,000,000 | 1.500%, 8/31/18 | 151,851,600 | |||||
| 160,000,000 | 2.750%, 2/15/19 | 168,337,440 | |||||
| 175,000,000 | 1.500%, 10/31/19 | 174,945,400 | |||||
| 95,000,000 | 2.625%, 11/15/20 | 99,178,480 | |||||
| See Notes to Financial Statements. | |
| 14 | www.jamesfunds.com |
| James Balanced: Golden Rainbow Fund | Schedule of Investments |
| June 30, 2015 |
| Shares or Principal Amount | Value | ||||||
| U.S. Treasury Notes (continued) | |||||||
| $ | 30,000,000 | 2.750%, 11/15/23 | $ | 31,150,770 | |||
| 1,054,020,848 | |||||||
TOTAL U.S. TREASURY BONDS & NOTES (Cost $1,221,062,919) | 1,227,421,982 | ||||||
| FOREIGN BONDS-1.0% | |||||||
| Australia Government-0.2% | |||||||
| AUD | 10,000,000 | 5.250%, 3/15/19 | 8,571,807 | ||||
| Canada Government-0.2% | |||||||
| CAD | 5,000,000 | 3.750%, 6/1/19 | 4,485,188 | ||||
| CAD | 5,000,000 | 3.500%, 6/1/20 | 4,501,922 | ||||
| 8,987,110 | |||||||
| International Bank for Reconstruction & Development-0.1% | |||||||
| TRY | 8,000,000 | 6.000%, 7/23/15 | 2,975,770 | ||||
| Netherlands Government-0.1% | |||||||
| EUR | 3,000,000 | 4.000%, 7/15/19(c) | 3,874,570 | ||||
| New Zealand Government Bond-0.3% | |||||||
| NZD | 15,000,000 | 5.000%, 3/15/19 | 10,893,553 | ||||
| Queensland Treasury Corp.-0.1% | |||||||
| AUD | 5,000,000 | 6.000%, 10/14/15 | 3,900,937 | ||||
TOTAL FOREIGN BONDS (Cost $44,173,942) | 39,203,747 | ||||||
| MUNICIPAL BONDS-3.5% | |||||||
California-0.0%(a) | |||||||
| 1,000,000 | Citrus Community College District General Obligation Unlimited Bonds, Series B, 4.750%, 6/1/31 | 1,076,610 | |||||
Colorado-0.0%(a) | |||||||
| 1,000,000 | Adams County School District No. 14 General Obligation Unlimited Bonds, 5.000%, 12/1/26 | 1,061,660 | |||||
| Connecticut-0.2% | |||||||
| 5,350,000 | State of Connecticut, Series D, 5.000%, 11/1/25 | 6,194,926 | |||||
| Florida-0.3% | |||||||
| 10,775,000 | Florida State Board of Education Capital Outlay General Obligation Bonds, Series C, 5%, 6/1/2023, 5.000%, 6/1/23 | 12,987,000 | |||||
| 1,000,000 | Florida State Board of Education Capital Outlay General Obligation Bonds, Series D, 5.000%, 6/1/38 | 1,094,810 | |||||
| 14,081,810 | |||||||
| Georgia-0.2% | |||||||
| 3,000,000 | State of Georgia General Obligation Unlimited Bonds, Series B, 4.500%, 1/1/29 | 3,273,570 | |||||
| 5,000,000 | State of Georgia General Obligation Unlimited Bonds, Series D, 5.000%, 2/1/25 | 5,978,900 | |||||
| 9,252,470 | |||||||
| Hawaii-0.3% | |||||||
| 9,000,000 | City and County of Honolulu General Obligation Unlimited Bonds, Series B, 5.000%, 11/1/25 | 10,608,210 | |||||
| See Notes to Financial Statements. | |
| Annual Report | June 30, 2015 | 15 |
| Schedule of Investments | James Balanced: Golden Rainbow Fund |
| Shares or Principal Amount | Value | ||||||
Illinois-0.0%(a) | |||||||
| $ | 500,000 | Kane & DeKalb Counties Community Unit School District No. 302 Kaneland General Obligation Unlimited Bonds (School Building), 5.500%, 2/1/28 | $ | 512,975 | |||
| 1,000,000 | Village of Bolingbrook General Obligation Unlimited Bonds, 5.000%, 1/1/37 | 1,068,630 | |||||
| 1,581,605 | |||||||
| Maryland-0.1% | |||||||
| 5,000,000 | County of Montgomery General Obligation Unlimited Bonds, Series A, 3.000%, 11/1/29 | 4,824,250 | |||||
Massachusetts-0.0%(a) | |||||||
| 1,000,000 | Commonwealth of Massachusetts General Obligation Limited Bonds, Series C, 5.250%, 8/1/22 | 1,090,500 | |||||
Michigan-0.0%(a) | |||||||
| 1,000,000 | Marysville Public School District General Obligation Unlimited Bonds (School Building & Site), 5.000%, 5/1/32 | 1,063,680 | |||||
| Ohio-1.0% | |||||||
| 7,450,000 | Beavercreek City School District General Obligation Unlimited Bonds, 3.250%, 12/1/36 | 6,839,547 | |||||
| 5,450,000 | City of Columbus General Obligation Various Purpose Limited Tax Bonds, Series B, 3.250%, 8/15/24 | 5,711,436 | |||||
| 5,000,000 | County of Cuyahoga General Obligation Limited (Capital Improvement), Series A, 4.000%, 12/1/37 | 5,104,650 | |||||
| Greenville City School District General Obligation Unlimited Bonds (School Improvement): | |||||||
| 5,000,000 | 5.000%, 1/1/46 | 5,283,150 | |||||
| 11,000,000 | 5.500%, 1/1/51 | 11,986,810 | |||||
| 1,100,000 | Miamisburg City School District General Obligation Unlimited Bonds (School Facilities Construction & Improvement), 5.000%, 12/1/33 | 1,212,981 | |||||
| 500,000 | Mount Healthy City School District General Obligation Unlimited Bonds (School Improvement), 5.000%, 12/1/26 | 556,620 | |||||
| 1,000,000 | Ohio State University General Recipients Revenue Bonds, Series C, 4.910%, 6/1/40 | 1,136,480 | |||||
| 105,000 | Ohio State University Prerefunded Revenue Bonds, Series A, 5.000%, 12/1/28 | 118,488 | |||||
| 895,000 | Ohio State University Unrefunded Revenue Bonds, Series A, 5.000%, 12/1/28 | 995,688 | |||||
| 500,000 | Springboro Community City School District General Obligation Unlimited Bonds, 5.250%, 12/1/23 | 597,495 | |||||
| State of Ohio General Obligation Unlimited Bonds, Series A: | |||||||
| 365,000 | 5.375%, 9/1/28 | 407,103 | |||||
| 635,000 | 5.375%, 9/1/28 | 700,316 | |||||
| 1,000,000 | Wright State University Revenue Bonds, 4.000%, 5/1/18 | 1,066,170 | |||||
| 41,716,934 | |||||||
| Pennsylvania-0.6% | |||||||
| 20,000,000 | Commonwealth of Pennsylvania General Obligation Unlimited Bonds, First Series, 5.000%, 6/1/24 | 23,137,800 | |||||
| Texas-0.4% | |||||||
| 1,000,000 | Friendswood Independent School District General Obligation Unlimited Bonds (Schoolhouse), 5.000%, 2/15/37 | 1,073,740 | |||||
| 1,000,000 | Judson Independent School District General Obligation Unlimited Bonds (School Building), 5.000%, 2/1/37 | 1,052,800 | |||||
| 500,000 | Lamar Consolidated Independent School District General Obligation Unlimited Bonds (Schoolhouse), 5.000%, 2/15/38 | 528,025 | |||||
| 7,150,000 | New Caney Independent School District General Obligation Unlimited Bonds (School Building), Series AD, 5.000%, 2/15/35 | 7,357,636 | |||||
| 5,335,000 | Port of Houston Authority General Obligation Unlimited Bonds, Series D-1, 5.000%, 10/1/35 | 6,164,059 | |||||
| 1,000,000 | Tyler Independent School District General Obligation Unlimited Bonds (School Building), 5.000%, 2/15/34 | 1,084,630 | |||||
| 17,260,890 | |||||||
| Washington-0.3% | |||||||
| 5,000,000 | State of Washington General Obligation Unlimited Bonds, Series D, 4.000%, 2/1/37 | 5,063,350 | |||||
| See Notes to Financial Statements. | |
| 16 | www.jamesfunds.com |
| James Balanced: Golden Rainbow Fund | Schedule of Investments |
| June 30, 2015 |
| Shares or Principal Amount | Value | ||||||
| Washington (continued) | |||||||
| $ | 5,845,000 | State of Washington General Obligation Various Purpose Unlimited Bonds, Series D, 5.000%, 2/1/20 | $ | 6,764,769 | |||
| 11,828,119 | |||||||
| Wisconsin-0.1% | |||||||
| 5,000,000 | State of Wisconsin General Obligation Unlimited Bonds, Series C, 5.000%, 5/1/25 | 5,829,000 | |||||
TOTAL MUNICIPAL BONDS (Cost $147,718,980) | 150,608,464 | ||||||
| SHORT TERM INVESTMENTS-4.1% | |||||||
| Mutual Funds-4.1% | |||||||
| 174,735,225 | First American Government Obligations Fund, Class Y, 7-Day Yield 0.006% | 174,735,225 | |||||
TOTAL SHORT TERM INVESTMENTS (Cost $174,735,225) | 174,735,225 | ||||||
TOTAL INVESTMENT SECURITIES-100.9% (Cost $3,814,971,413) | 4,289,934,511 | ||||||
| OTHER LIABILITIES IN EXCESS OF ASSETS-(0.9)% | (38,943,960 | ) | |||||
| NET ASSETS-100.0% | $ | 4,250,990,551 | |||||
For Fund compliance purposes, the Fund’s industry classifications refer to any one or more of the industry sub-classifications used by one or more widely recognized market indexes or ratings group indexes, and/or as defined by Fund management. Those definitions may not apply for purposes of this report, which may combine industry sub-classifications for reporting ease. Industries are shown as a percentage of net assets.
* | Non-income producing security. |
(a) | Less than 0.05% of Net Assets. |
(b) | Floating or variable rate security. Interest rate disclosed is that which is in effect at June 30, 2015. |
(c) | Securities exempt from registration under Rule 144A of the Securities Act of 1933. These securities may be sold in the ordinary course of business in transactions exempt from registration, normally to qualified institutional buyers. At period end, the aggregate market value of those securities was $3,874,570, representing 0.09% of net assets. |
| AG - Aktiengesellschaft is a German term that refers to a corporation that is limited by shares, i.e., owned by shareholders |
| ADR - American Depositary Receipt |
| ASA - Allmennaksjeselskap is the Norwegian term for public limited company |
| AUD - Australian Dollar |
| BV - Besloten Vennootschap is the Dutch term for private limited liability company |
| CAD - Canadian Dollar |
| ETF - Exchange Traded Fund |
| EUR - Euro |
| LLC - Limited Liability Company |
| Ltd. - Limited |
| MSCI - Morgan Stanley Capital International |
| NV - Naamloze Vennootschap is the Dutch term for a public limited liability corporation |
| NZD - New Zealand Dollar |
| PLC - Public Limited Company |
| REIT - Real Estate Investment Trust |
| SPDR - Standard & Poor’s Depositary Receipts |
| TRY - Turkish Lira |
| See Notes to Financial Statements. | |
| Annual Report | June 30, 2015 | 17 |
| Schedule of Investments | James Small Cap Fund |
| June 30, 2015 |
| Shares | Value | ||||||
| COMMON STOCKS-96.8% | |||||||
| Basic Materials-9.5% | |||||||
| 27,010 | A Schulman, Inc. | $ | 1,180,877 | ||||
| 29,430 | Cooper Tire & Rubber Co. | 995,617 | |||||
| 27,410 | Innospec, Inc. | 1,234,546 | |||||
| 133,210 | Lydall, Inc.* | 3,937,688 | |||||
| 14,675 | Minerals Technologies, Inc. | 999,808 | |||||
| 48,910 | Neenah Paper, Inc. | 2,883,734 | |||||
| 13,475 | OCI Resources LP | 330,137 | |||||
| 98,375 | Richmont Mines, Inc.* | 311,849 | |||||
| 11,874,256 | |||||||
| Consumer, Cyclical-15.7% | |||||||
| 32,358 | Asbury Automotive Group, Inc.* | 2,932,282 | |||||
| 72,024 | Cato Corp., Class A | 2,791,650 | |||||
| 7,630 | Cherokee, Inc. | 215,013 | |||||
| 34,224 | Flexsteel Industries, Inc. | 1,474,712 | |||||
| 164,625 | Hawaiian Holdings, Inc.* | 3,909,844 | |||||
| 79,037 | Insight Enterprises, Inc.* | 2,363,997 | |||||
| 11,465 | Meritage Homes Corp.* | 539,887 | |||||
| 42,530 | Multi-Color Corp. | 2,716,816 | |||||
| 31,490 | Patrick Industries, Inc.* | 1,198,195 | |||||
| 54,950 | PC Connection, Inc. | 1,359,463 | |||||
| 8,305 | Wayside Technology Group, Inc. | 164,605 | |||||
| 19,666,464 | |||||||
| Consumer, Non-cyclical-12.5% | |||||||
| 32,595 | Cardtronics, Inc.* | 1,207,645 | |||||
| 7,660 | Coca-Cola Bottling Co. Consolidated | 1,157,196 | |||||
| 16,055 | Helen of Troy, Ltd.* | 1,565,202 | |||||
| 39,300 | Ingles Markets, Inc., Class A | 1,877,361 | |||||
| 30,297 | John B Sanfilippo & Son, Inc. | 1,572,414 | |||||
| 14,080 | Lannett Co., Inc* | 836,915 | |||||
| 45,057 | National HealthCare Corp. | 2,928,254 | |||||
| 32,063 | Natural Health Trends Corp. | 1,329,332 | |||||
| 49,180 | Natus Medical, Inc.* | 2,093,101 | |||||
| 60,780 | Pointer Telocation, Ltd.* | 527,267 | |||||
| 32,470 | Superior Uniform Group, Inc. | 537,054 | |||||
| 15,631,741 | |||||||
| Energy-4.1% | |||||||
| 210,300 | Advantage Oil & Gas, Ltd.* | 1,331,199 | |||||
| 59,593 | Delek US Holdings, Inc. | 2,194,214 | |||||
| 136,433 | Star Gas Partners LP | 1,204,703 | |||||
| 9,650 | World Fuel Services Corp. | 462,718 | |||||
| 5,192,834 | |||||||
| Financial-18.0% | |||||||
| 51,090 | Aircastle, Ltd. | 1,158,210 | |||||
| 29,033 | Argo Group International Holdings, Ltd. | 1,617,138 | |||||
| 33,875 | Aspen Insurance Holdings, Ltd. | 1,622,613 | |||||
| 27,190 | Ellington Residential Mortgage, REIT | 388,273 | |||||
| 29,136 | ePlus, Inc.* | 2,233,274 | |||||
| See Notes to Financial Statements. | |
| 18 | www.jamesfunds.com |
| James Small Cap Fund | Schedule of Investments |
| June 30, 2015 |
| Shares | Value | ||||||
| Financial (continued) | |||||||
| 35,945 | FBL Financial Group, Inc., Class A | $ | 2,074,745 | ||||
| 84,800 | FelCor Lodging Trust, Inc., REIT | 837,824 | |||||
| 34,293 | Hersha Hospitality Trust, REIT | 879,260 | |||||
| 78,471 | MainSource Financial Group, Inc. | 1,722,439 | |||||
| 86,533 | Montpelier Re Holdings, Ltd. | 3,418,054 | |||||
| 3,240 | MutualFirst Financial, Inc. | 75,265 | |||||
| 28,640 | Nelnet, Inc., Class A | 1,240,398 | |||||
| 47,450 | Outerwall, Inc. | 3,611,420 | |||||
| 11,888 | Piper Jaffray Cos.* | 518,792 | |||||
| 42,625 | Premier Financial Bancorp, Inc. | 658,556 | |||||
| 34,303 | Reading International, Inc., Class A* | 475,097 | |||||
| 22,531,358 | |||||||
| Industrial-11.3% | |||||||
| 56,860 | American Axle & Manufacturing Holdings, Inc.* | 1,188,943 | |||||
| 71,990 | Covenant Transportation Group, Inc., Class A* | 1,804,069 | |||||
| 25,625 | Dana Holding Corp. | 527,362 | |||||
| 23,520 | Gentherm, Inc.* | 1,291,483 | |||||
| 64,630 | Headwaters, Inc.* | 1,177,559 | |||||
| 6,335 | L.S. Starrett Co., Class A | 95,025 | |||||
| 84,275 | Meritor, Inc.* | 1,105,688 | |||||
| 7,330 | SL Industries, Inc.* | 283,011 | |||||
| 218,175 | SORL Auto Parts, Inc.* | 711,250 | |||||
| 12,818 | Strattec Security Corp. | 880,597 | |||||
| 131,688 | Supreme Industries, Inc., Class A | 1,128,566 | |||||
| 115,415 | Tsakos Energy Navigation, Ltd. | 1,099,905 | |||||
| 37,105 | Unifi, Inc.* | 1,243,018 | |||||
| 57,080 | USA Truck, Inc.* | 1,211,808 | |||||
| 38,320 | Willdan Group, Inc.* | 428,418 | |||||
| 14,176,702 | |||||||
| Technology-19.2% | |||||||
| 53,915 | AAR Corp. | 1,718,271 | |||||
| 161,520 | ACCO Brands Corp.* | 1,255,010 | |||||
| 41,675 | Cascade Microtech, Inc.* | 634,502 | |||||
| 24,220 | Cohu, Inc. | 320,431 | |||||
| 46,623 | Deluxe Corp. | 2,890,626 | |||||
| 48,525 | FormFactor, Inc.* | 446,430 | |||||
| 30,515 | Leidos Holdings, Inc. | 1,231,891 | |||||
| 93,750 | Mentor Graphics Corp. | 2,477,812 | |||||
| 100,325 | Mind CTI, Ltd. | 260,845 | |||||
| 66,860 | NCI, Inc., Class A | 690,664 | |||||
| 137,350 | Orbotech, Ltd.* | 2,856,880 | |||||
| 75,885 | Pericom Semiconductor Corp. | 997,888 | |||||
| 68,355 | Sanmina Corp.* | 1,378,037 | |||||
| 19,555 | SYNNEX Corp. | 1,431,230 | |||||
| 192,566 | Tower Semiconductor, Ltd.* | 2,973,219 | |||||
| 60,285 | VASCO Data Security International, Inc.* | 1,820,004 | |||||
| 85,650 | ZAGG, Inc.* | 678,348 | |||||
| 24,062,088 | |||||||
| Utilities-6.5% | |||||||
| 33,840 | Gas Natural, Inc. | 348,552 | |||||
| See Notes to Financial Statements. | |
| Annual Report | June 30, 2015 | 19 |
| Schedule of Investments | James Small Cap Fund |
| June 30, 2015 |
| Shares | Value | |||||
| Utilities (continued) | ||||||
| 8,575 | IDACORP, Inc. | $ | 481,400 | |||
| 53,510 | Inteliquent, Inc. | 984,584 | ||||
| 44,510 | PNM Resources, Inc. | 1,094,946 | ||||
| 51,210 | Portland General Electric Co. | 1,698,124 | ||||
| 705,488 | Vonage Holdings Corp.* | 3,463,946 | ||||
| 8,071,552 | ||||||
TOTAL COMMON STOCKS (Cost $97,119,489) | 121,206,995 | |||||
| SHORT TERM INVESTMENTS-5.8% | ||||||
| Mutual Funds-5.8% | ||||||
| 7,224,591 | First American Government Obligations Fund, Class Y, 7-Day Yield 0.006% | 7,224,591 | ||||
TOTAL SHORT TERM INVESTMENTS (Cost $7,224,591) | 7,224,591 | |||||
TOTAL INVESTMENT SECURITIES-102.6% (Cost $104,344,080) | 128,431,586 | |||||
| OTHER LIABILITIES IN EXCESS OF ASSETS-(2.6)% | (3,286,098 | ) | ||||
| NET ASSETS-100.0% | $ | 125,145,488 | ||||
| For Fund compliance purposes, the Fund’s industry classifications refer to any one or more of the industry sub-classifications used by one or more widely recognized market indexes or ratings group indexes, and/or as defined by Fund management. Those definitions may not apply for purposes of this report, which may combine industry sub-classifications for reporting ease. Industries are shown as a percentage of net assets. | ||||||
* | Non-income producing security. |
| LP - Limited Partnership |
| Ltd. - Limited |
| REIT - Real Estate Investment Trust |
| See Notes to Financial Statements. | |
| 20 | www.jamesfunds.com |
| James Mid Cap Fund | Schedule of Investments |
| June 30, 2015 |
| Shares | Value | ||||||
| COMMON STOCKS-94.3% | |||||||
| Basic Materials-11.2% | |||||||
| 4,500 | A Schulman, Inc. | $ | 196,740 | ||||
| 5,000 | Avery Dennison Corp. | 304,700 | |||||
| 5,000 | Celanese Corp., Series A | 359,400 | |||||
| 10,000 | Cooper Tire & Rubber Co. | 338,300 | |||||
| 7,329 | Cytec Industries, Inc. | 443,624 | |||||
| 12,000 | Goodyear Tire & Rubber Co. | 361,800 | |||||
| 4,000 | Newmont Mining Corp. | 93,440 | |||||
| 10,000 | Olin Corp. | 269,500 | |||||
| 2,367,504 | |||||||
| Consumer, Cyclical-16.8% | |||||||
| 16,500 | Alaska Air Group, Inc. | 1,063,095 | |||||
| 3,500 | Asbury Automotive Group, Inc.* | 317,170 | |||||
| 8,000 | Cato Corp., Class A | 310,080 | |||||
| 5,000 | Dillard’s, Inc., Class A | 525,950 | |||||
| 6,500 | Foot Locker, Inc. | 435,565 | |||||
| 8,444 | Hawaiian Holdings, Inc.* | 200,545 | |||||
| 4,500 | Skechers U.S.A., Inc., Class A* | 494,055 | |||||
| 5,000 | Vista Outdoor, Inc.* | 224,500 | |||||
| 3,570,960 | |||||||
| Consumer, Non-cyclical-7.8% | |||||||
| 4,000 | DST Systems, Inc. | 503,920 | |||||
| 6,000 | Helen of Troy, Ltd.* | 584,940 | |||||
| 4,500 | Ingles Markets, Inc., Class A | 214,965 | |||||
| 100 | Seaboard Corp.* | 359,900 | |||||
| 1,663,725 | |||||||
| Energy-6.7% | |||||||
| 8,000 | Delek US Holdings, Inc. | 294,560 | |||||
| 8,250 | HollyFrontier Corp. | 352,193 | |||||
| 5,000 | Tesoro Corp. | 422,050 | |||||
| 7,220 | World Fuel Services Corp. | 346,199 | |||||
| 1,415,002 | |||||||
| Financial-14.9% | |||||||
| 7,000 | Allied World Assurance Co. Holdings AG | 302,540 | |||||
| 8,775 | American Financial Group, Inc. | 570,726 | |||||
| 3,585 | AmTrust Financial Services, Inc. | 234,853 | |||||
| 4,000 | Aspen Insurance Holdings, Ltd. | 191,600 | |||||
| 12,000 | CBL & Associates Properties, Inc., REIT | 194,400 | |||||
| 10,000 | Horace Mann Educators Corp. | 363,800 | |||||
| 10,000 | Montpelier Re Holdings, Ltd. | 395,000 | |||||
| 11,350 | Nelnet, Inc., Class A | 491,569 | |||||
| 11,000 | XL Group PLC | 409,200 | |||||
| 3,153,688 | |||||||
| Industrial-16.7% | |||||||
| 3,000 | AMERCO | 980,730 | |||||
| 15,000 | American Axle & Manufacturing Holdings, Inc.* | 313,650 | |||||
| 6,000 | Gentherm, Inc.* | 329,460 | |||||
| See Notes to Financial Statements. | |
| Annual Report | June 30, 2015 | 21 |
| Schedule of Investments | James Mid Cap Fund |
| June 30, 2015 |
| Shares | Value | |||||
| Industrial (continued) | ||||||
| 5,000 | Greenbrier Cos., Inc. | $ | 234,250 | |||
| 16,565 | Hollysys Automation Technologies, Ltd. | 398,057 | ||||
| 17,437 | Jarden Corp.* | 902,364 | ||||
| 15,498 | Meritor, Inc.* | 203,334 | ||||
| 2,000 | Ryder System, Inc. | 174,740 | ||||
| 3,536,585 | ||||||
| Technology-13.1% | ||||||
| 14,110 | AAR Corp. | 449,686 | ||||
| 7,750 | Arrow Electronics, Inc.* | 432,450 | ||||
| 7,000 | Avnet, Inc. | 287,770 | ||||
| 13,950 | Deluxe Corp. | 864,900 | ||||
| 5,000 | Orbital ATK, Inc. | 366,800 | ||||
| 5,000 | SYNNEX Corp. | 365,950 | ||||
| 2,767,556 | ||||||
| Utilities-7.1% | ||||||
| 15,550 | CMS Energy Corp. | 495,112 | ||||
| 4,975 | DTE Energy Co. | 371,334 | ||||
| 4,000 | IDACORP, Inc. | 224,560 | ||||
| 8,000 | Portland General Electric Co. | 265,280 | ||||
| 4,500 | UGI Corp. | 155,025 | ||||
| 1,511,311 | ||||||
TOTAL COMMON STOCKS (Cost $14,767,274) | 19,986,331 | |||||
| SHORT TERM INVESTMENTS-5.7% | ||||||
| Mutual Funds-5.7% | ||||||
| 1,201,019 | First American Government Obligations Fund, Class Y, 7-Day Yield 0.006% | 1,201,019 | ||||
TOTAL SHORT TERM INVESTMENTS (Cost $1,201,019) | 1,201,019 | |||||
TOTAL INVESTMENT SECURITIES-100.0% (Cost $15,968,293) | 21,187,350 | |||||
OTHER ASSETS IN EXCESS OF LIABILITIES-0.0%(a) | 2,377 | |||||
| NET ASSETS-100.0% | $ | 21,189,727 | ||||
| For Fund compliance purposes, the Fund’s industry classifications refer to any one or more of the industry sub-classifications used by one or more widely recognized market indexes or ratings group indexes, and/or as defined by Fund management. Those definitions may not apply for purposes of this report, which may combine industry sub-classifications for reporting ease. Industries are shown as a percentage of net assets. | ||||||
* | Non-income producing security. |
(a) | Less than 0.05% of Net Assets. |
| AG - Aktiengesellschaft is a German term that refers to a corporation that is limited by shares, i.e., owned by shareholders |
| Ltd. - Limited |
| PLC - Public Limited Company. |
| REIT - Real Estate Investment Trust |
| See Notes to Financial Statements. | |
| 22 | www.jamesfunds.com |
| James Micro Cap Fund | Schedule of Investments |
| June 30, 2015 |
| Shares | Value | ||||||
| COMMON STOCKS-95.7% | |||||||
| Basic Materials-4.7% | |||||||
| 19,780 | Lydall, Inc.* | $ | 584,697 | ||||
| 9,215 | OCI Resources LP | 225,768 | |||||
| 102,085 | Richmont Mines, Inc.* | 323,609 | |||||
| 1,134,074 | |||||||
| Consumer, Cyclical-16.1% | |||||||
| 5,225 | Cherokee, Inc. | 147,241 | |||||
| 23,426 | Flexsteel Industries, Inc. | 1,009,426 | |||||
| 18,545 | Hawaiian Holdings, Inc.* | 440,444 | |||||
| 6,260 | Multi-Color Corp. | 399,889 | |||||
| 21,586 | Patrick Industries, Inc.* | 821,347 | |||||
| 37,593 | PC Connection, Inc. | 930,051 | |||||
| 5,455 | Wayside Technology Group, Inc. | 108,118 | |||||
| 3,856,516 | |||||||
| Consumer, Non-cyclical-16.6% | |||||||
| 5,270 | Coca-Cola Bottling Co. Consolidated | 796,139 | |||||
| 12,480 | Ingles Markets, Inc., Class A | 596,170 | |||||
| 20,746 | John B Sanfilippo & Son, Inc. | 1,076,717 | |||||
| 21,934 | Natural Health Trends Corp. | 909,384 | |||||
| 30,335 | Pointer Telocation, Ltd.* | 263,156 | |||||
| 21,362 | Superior Uniform Group, Inc. | 353,327 | |||||
| 3,994,893 | |||||||
| Energy-3.4% | |||||||
| 93,311 | Star Gas Partners LP | 823,936 | |||||
| 823,936 | |||||||
| Financial-16.9% | |||||||
| 18,595 | Ellington Residential Mortgage, REIT | 265,537 | |||||
| 19,948 | ePlus, Inc.* | 1,529,014 | |||||
| 55,463 | MainSource Financial Group, Inc. | 1,217,413 | |||||
| 2,230 | MutualFirst Financial, Inc. | 51,803 | |||||
| 8,447 | Piper Jaffray Cos.* | 368,627 | |||||
| 20,370 | Premier Financial Bancorp, Inc. | 314,716 | |||||
| 22,579 | Reading International, Inc., Class A* | 312,719 | |||||
| 4,059,829 | |||||||
| Industrial-17.1% | |||||||
| 49,225 | Covenant Transportation Group, Inc., Class A* | 1,233,578 | |||||
| 4,320 | L.S. Starrett Co., Class A | 64,800 | |||||
| 5,050 | SL Industries, Inc.* | 194,980 | |||||
| 109,963 | SORL Auto Parts, Inc.* | 358,479 | |||||
| 8,781 | Strattec Security Corp. | 603,255 | |||||
| 62,933 | Supreme Industries, Inc., Class A | 539,336 | |||||
| 39,060 | USA Truck, Inc.* | 829,244 | |||||
| 24,615 | Willdan Group, Inc.* | 275,196 | |||||
| 4,098,868 | |||||||
| Technology-14.1% | |||||||
| 26,225 | Cascade Microtech, Inc.* | 399,276 | |||||
| See Notes to Financial Statements. | |
| Annual Report | June 30, 2015 | 23 |
| Schedule of Investments | James Micro Cap Fund |
| June 30, 2015 |
| Shares | Value | ||||||
| Technology (continued) | |||||||
| 16,595 | Cohu, Inc. | $ | 219,552 | ||||
| 33,250 | FormFactor, Inc.* | 305,900 | |||||
| 68,620 | Mind CTI, Ltd. | 178,412 | |||||
| 38,960 | NCI, Inc., Class A | 402,457 | |||||
| 34,641 | Orbotech, Ltd.* | 720,533 | |||||
| 51,900 | Pericom Semiconductor Corp. | 682,485 | |||||
| 58,580 | ZAGG, Inc.* | 463,953 | |||||
| 3,372,568 | |||||||
| Utilities-6.8% | |||||||
| 22,348 | Gas Natural, Inc. | 230,184 | |||||
| 42,650 | Inteliquent, Inc. | 784,760 | |||||
| 127,550 | Vonage Holdings Corp.* | 626,271 | |||||
| 1,641,215 | |||||||
TOTAL COMMON STOCKS (Cost $18,266,523) | 22,981,899 | ||||||
| SHORT TERM INVESTMENTS-6.3% | |||||||
| Mutual Funds-6.3% | |||||||
| 1,519,394 | First American Government Obligations Fund, Class Y, 7-Day Yield 0.006% | 1,519,394 | |||||
TOTAL SHORT TERM INVESTMENTS (Cost $1,519,394) | 1,519,394 | ||||||
TOTAL INVESTMENT SECURITIES-102.0% (Cost $19,785,917) | 24,501,293 | ||||||
| OTHER LIABILITIES IN EXCESS OF ASSETS-(2.0)% | (475,413 | ) | |||||
| NET ASSETS-100.0% | $ | 24,025,880 | |||||
For Fund compliance purposes, the Fund’s industry classifications refer to any one or more of the industry sub-classifications used by one or more widely recognized market indexes or ratings group indexes, and/or as defined by Fund management. Those definitions may not apply for purposes of this report, which may combine industry sub-classifications for reporting ease. Industries are shown as a percentage of net assets.
* | Non-income producing security. |
| LP - Limited Partnership |
| Ltd. - Limited |
| REIT - Real Estate Investment Trust |
| See Notes to Financial Statements. | |
| 24 | www.jamesfunds.com |
| James Long-Short Fund | Schedule of Investments |
| June 30, 2015 |
| Shares | Value | ||||||
| COMMON STOCKS-128.7% | |||||||
| Basic Materials-12.4% | |||||||
| 11,310 | Avery Dennison Corp. | $ | 689,231 | ||||
| 9,930 | Celanese Corp., Series A(a) | 713,768 | |||||
| 12,340 | Cooper Tire & Rubber Co.(a) | 417,462 | |||||
| 3,820 | Cytec Industries, Inc. | 231,225 | |||||
| 13,750 | Dow Chemical Co.(a) | 703,588 | |||||
| 28,190 | Goodyear Tire & Rubber Co.(a) | 849,929 | |||||
| 7,780 | Innospec, Inc.(a) | 350,411 | |||||
| 8,430 | Lydall, Inc.*(a) | 249,191 | |||||
| 4,204,805 | |||||||
| Consumer, Cyclical-18.0% | |||||||
| 16,740 | Alaska Air Group, Inc.(a) | 1,078,558 | |||||
| 14,110 | Cato Corp., Class A(a) | 546,903 | |||||
| 3,240 | Dillard’s, Inc., Class A(a) | 340,816 | |||||
| 32,420 | Hanesbrands, Inc.(a) | 1,080,234 | |||||
| 5,410 | Meritage Homes Corp.*(a) | 254,757 | |||||
| 3,500 | Multi-Color Corp.(a) | 223,580 | |||||
| 37,170 | Republic Airways Holdings, Inc.*(a) | 341,221 | |||||
| 18,270 | RR Donnelley & Sons Co. | 318,446 | |||||
| 7,500 | Skechers U.S.A., Inc., Class A*(a) | 823,425 | |||||
| 28,530 | Southwest Airlines Co.(a) | 944,058 | |||||
| 1,970 | Wal-Mart Stores, Inc.(a) | 139,732 | |||||
| 6,091,730 | |||||||
| Consumer, Non-cyclical-27.9% | |||||||
| 5,980 | Aetna, Inc.(a) | 762,211 | |||||
| 2,600 | Anthem, Inc. | 426,764 | |||||
| 13,970 | Dr Pepper Snapple Group, Inc.(a) | 1,018,413 | |||||
| 6,340 | DST Systems, Inc. | 798,713 | |||||
| 4,625 | Eli Lilly & Co.(a) | 386,141 | |||||
| 10,260 | Helen of Troy, Ltd.*(a) | 1,000,248 | |||||
| 18,580 | Kroger Co.(a) | 1,347,236 | |||||
| 11,580 | Merck & Co., Inc.(a) | 659,249 | |||||
| 17,365 | Pfizer, Inc.(a) | 582,249 | |||||
| 2,420 | Sanderson Farms, Inc.(a) | 181,887 | |||||
| 40,870 | SUPERVALU, Inc.*(a) | 330,638 | |||||
| 16,060 | UnitedHealth Group, Inc.(a) | 1,959,320 | |||||
| 9,453,069 | |||||||
| Energy-4.6% | |||||||
| 1,340 | Exxon Mobil Corp. | 111,488 | |||||
| 2,700 | HollyFrontier Corp. | 115,263 | |||||
| 10,340 | Tesoro Corp.(a) | 872,799 | |||||
| 4,110 | Valero Energy Corp.(a) | 257,286 | |||||
| 4,420 | World Fuel Services Corp.(a) | 211,939 | |||||
| 1,568,775 | |||||||
| Financial-19.2% | |||||||
| 13,950 | AmTrust Financial Services, Inc. | 913,865 | |||||
| 6,760 | FBL Financial Group, Inc., Class A(a) | 390,187 | |||||
| 2,480 | Goldman Sachs Group, Inc.(a) | 517,799 | |||||
| See Notes to Financial Statements. | |
| Annual Report | June 30, 2015 | 25 |
| Schedule of Investments | James Long-Short Fund |
| June 30, 2015 |
| Shares | Value | ||||||
| Financial (continued) | |||||||
| 9,940 | JPMorgan Chase & Co.(a) | $ | 673,534 | ||||
| 77,090 | KeyCorp(a) | 1,157,892 | |||||
| 12,410 | Piper Jaffray Cos.*(a) | 541,572 | |||||
| 17,650 | PNC Financial Services Group, Inc.(a) | 1,688,223 | |||||
| 6,390 | Travelers Cos., Inc.(a) | 617,657 | |||||
| 6,500,729 | |||||||
| Industrial-15.5% | |||||||
| 970 | AMERCO(a) | 317,103 | |||||
| 15,270 | Greenbrier Cos., Inc.(a) | 715,400 | |||||
| 21,710 | Magna International, Inc.(a) | 1,217,714 | |||||
| 24,780 | Meritor, Inc.* | 325,114 | |||||
| 10,320 | Ryder System, Inc.(a) | 901,658 | |||||
| 34,490 | Smith & Wesson Holding Corp.*(a) | 572,189 | |||||
| 7,820 | Sonoco Products Co.(a) | 335,165 | |||||
| 44,480 | Tsakos Energy Navigation, Ltd.(a) | 423,894 | |||||
| 5,040 | United Rentals, Inc.*(a) | 441,605 | |||||
| 5,249,842 | |||||||
| Technology-24.4% | |||||||
| 44,220 | ACCO Brands Corp.*(a) | 343,589 | |||||
| 6,800 | Apple, Inc.(a) | 852,890 | |||||
| 26,395 | Deluxe Corp.(a) | 1,636,490 | |||||
| 7,955 | Lockheed Martin Corp.(a) | 1,478,834 | |||||
| 6,570 | Northrop Grumman Corp.(a) | 1,042,199 | |||||
| 32,920 | Orbotech, Ltd.* | 684,736 | |||||
| 15,430 | Symantec Corp.(a) | 358,748 | |||||
| 41,720 | Tower Semiconductor, Ltd.*(a) | 644,157 | |||||
| 20,760 | VASCO Data Security International, Inc.*(a) | 626,744 | |||||
| 7,730 | Western Digital Corp.(a) | 606,187 | |||||
| 8,274,574 | |||||||
| Utilities-6.7% | |||||||
| 6,760 | American Electric Power Co., Inc.(a) | 358,077 | |||||
| 6,270 | Edison International(a) | 348,487 | |||||
| 13,005 | PNM Resources, Inc.(a) | 319,923 | |||||
| 18,075 | UGI Corp.(a) | 622,684 | |||||
| 125,555 | Vonage Holdings Corp.*(a) | 616,475 | |||||
| 2,265,646 | |||||||
TOTAL COMMON STOCKS (Cost $38,243,686) | 43,609,170 | ||||||
| See Notes to Financial Statements. | |
| 26 | www.jamesfunds.com |
| James Long-Short Fund | Schedule of Investments |
| June 30, 2015 |
| Shares | Value | ||||||
| SHORT TERM INVESTMENTS-1.6% | |||||||
| Mutual Funds-1.6% | |||||||
| 538,798 | First American Government Obligations Fund, Class Y, 7-Day Yield 0.006% | $ | 538,798 | ||||
TOTAL SHORT TERM INVESTMENTS (Cost $538,798) | 538,798 | ||||||
TOTAL INVESTMENT SECURITIES-130.3% (Cost $38,782,484) | 44,147,968 | ||||||
SECURITIES SOLD SHORT-(29.5)% (Proceeds $9,948,431) | (10,010,785 | ) | |||||
| OTHER LIABILITIES IN EXCESS OF ASSETS-(0.8)% | (246,739 | ) | |||||
| NET ASSETS-100.0% | $ | 33,890,444 | |||||
| Shares | Value | ||||||
| SCHEDULE OF SECURITIES SOLD SHORT | |||||||
| COMMON STOCKS-(29.5)% | |||||||
| Basic Materials-(0.5)% | |||||||
| (8,735 | ) | Goldcorp, Inc. | $ | (141,507 | ) | ||
| (1,475 | ) | Platform Specialty Products Corp. | (37,731 | ) | |||
| (179,238 | ) | ||||||
| Consumer, Cyclical-(3.6)% | |||||||
| (1,120 | ) | Alibaba Group Holding, Ltd. | (92,143 | ) | |||
| (225 | ) | Amazon.com, Inc. | (97,670 | ) | |||
| (13,990 | ) | Arcos Dorados Holdings, Inc., Class A | (73,588 | ) | |||
| (3,010 | ) | Carmike Cinemas, Inc. | (79,885 | ) | |||
| (3,850 | ) | Coherus Biosciences, Inc. | (111,265 | ) | |||
| (5,475 | ) | eLong, Inc., Sponsored ADR | (92,637 | ) | |||
| (1,705 | ) | Liberty Global PLC, Class A | (92,189 | ) | |||
| (2,320 | ) | Liberty Media Corp., Class A | (83,613 | ) | |||
| (3,275 | ) | Lumber Liquidators Holdings, Inc. | (67,825 | ) | |||
| (4,980 | ) | Pandora Media, Inc. | (77,389 | ) | |||
| (9,875 | ) | Pep Boys - Manny Moe & Jack | (121,166 | ) | |||
| (2,125 | ) | Sands China Ltd., ADR | (73,950 | ) | |||
| (1,325 | ) | Wayfair, Inc., Class A | (49,873 | ) | |||
| (2,750 | ) | Zoe’s Kitchen, Inc. | (112,585 | ) | |||
| (1,225,778 | ) | ||||||
| Consumer, Non-cyclical-(6.5)% | |||||||
| (6,200 | ) | Amphastar Pharmaceuticals, Inc. | (108,996 | ) | |||
| (12,945 | ) | Boulder Brands, Inc. | (89,838 | ) | |||
| (4,510 | ) | Brookdale Senior Living, Inc. | (156,497 | ) | |||
| (6,275 | ) | Capital Senior Living Corp. | (153,738 | ) | |||
| (6,850 | ) | Depomed, Inc. | (147,001 | ) | |||
| (2,375 | ) | DexCom, Inc. | (189,953 | ) | |||
| (5,985 | ) | Insulet Corp. | (185,445 | ) | |||
| (450 | ) | Intercept Pharmaceuticals, Inc. | (108,621 | ) | |||
| (4,095 | ) | Karyopharm Therapeutics, Inc. | (111,425 | ) | |||
| (1,475 | ) | Keurig Green Mountain, Inc. | (113,029 | ) | |||
| (2,720 | ) | KYTHERA Biopharmaceuticals, Inc. | (204,843 | ) | |||
| (770 | ) | Nevro Corp. | (41,388 | ) | |||
| (5,475 | ) | StoneMor Partners LP | (165,071 | ) | |||
| (18,000 | ) | TherapeuticsMD, Inc. | (141,480 | ) | |||
| See Notes to Financial Statements. | |
| Annual Report | June 30, 2015 | 27 |
| Schedule of Investments | James Long-Short Fund |
| June 30, 2015 |
| Shares | Value | ||||||
| Consumer, Non-cyclical (continued) | |||||||
| (4,950 | ) | Wright Medical Group, Inc. | $ | (129,987 | ) | ||
| (2,955 | ) | ZS Pharma, Inc. | (154,812 | ) | |||
| (2,202,124 | ) | ||||||
| Energy-(5.8)% | |||||||
| (10,625 | ) | Atlas Resource Partners LP | (66,512 | ) | |||
| (5,110 | ) | Baytex Energy Corp. | (79,614 | ) | |||
| (3,025 | ) | Cheniere Energy Partners LP | (93,321 | ) | |||
| (1,925 | ) | Clayton Williams Energy, Inc. | (126,569 | ) | |||
| (3,105 | ) | CrossAmerica Partners LP | (87,778 | ) | |||
| (1,825 | ) | CSI Compressco LP | (32,613 | ) | |||
| (15,330 | ) | Eclipse Resources Corp. | (80,636 | ) | |||
| (2,000 | ) | Gulfport Energy Corp. | (80,500 | ) | |||
| (1,890 | ) | InterOil Corp. | (113,778 | ) | |||
| (10,450 | ) | Kosmos Energy, Ltd. | (88,093 | ) | |||
| (8,150 | ) | Legacy Reserves LP | (69,845 | ) | |||
| (4,765 | ) | Memorial Resource Development Corp. | (90,392 | ) | |||
| (3,375 | ) | NGL Energy Partners LP | (102,364 | ) | |||
| (4,025 | ) | NOW, Inc. | (80,138 | ) | |||
| (5,680 | ) | Parsley Energy, Inc., Class A | (98,946 | ) | |||
| (3,305 | ) | Pattern Energy Group, Inc. | (93,796 | ) | |||
| (1,690 | ) | PDC Energy, Inc. | (90,652 | ) | |||
| (575 | ) | Pioneer Natural Resources Co. | (79,747 | ) | |||
| (3,950 | ) | Rice Energy, Inc. | (82,278 | ) | |||
| (6,950 | ) | Sanchez Energy Corp. | (68,110 | ) | |||
| (5,975 | ) | Stone Energy Corp. | (75,225 | ) | |||
| (2,925 | ) | Summit Midstream Partners LP | (96,642 | ) | |||
| (1,375 | ) | Western Gas Partners LP | (87,134 | ) | |||
| (1,964,683 | ) | ||||||
| Financial-(1.4)% | |||||||
| (9,550 | ) | Hudson City Bancorp, Inc. | (94,354 | ) | |||
| (2,600 | ) | Interactive Brokers Group, Inc., Class A | (108,056 | ) | |||
| (1,650 | ) | Oaktree Capital Group LLC | (87,747 | ) | |||
| (5,125 | ) | The St. Joe Co. | (79,591 | ) | |||
| (5,350 | ) | Weibo Corp., Sponsored ADR | (91,699 | ) | |||
| (461,447 | ) | ||||||
| Industrial-(2.2)% | |||||||
| (3,650 | ) | Golar LNG, Ltd. | (170,820 | ) | |||
| (9,250 | ) | Horsehead Holding Corp. | (108,410 | ) | |||
| (4,225 | ) | SunPower Corp. | (120,032 | ) | |||
| (735 | ) | Tesla Motors, Inc. | (197,171 | ) | |||
| (15,010 | ) | UTi Worldwide, Inc. | (149,950 | ) | |||
| (746,383 | ) | ||||||
| Technology-(7.7)% | |||||||
| (1,740 | ) | 21Vianet Group, Inc., ADR | (35,705 | ) | |||
| (500 | ) | 58.com, Inc., ADR | (32,030 | ) | |||
| (3,400 | ) | Acacia Research Corp. | (29,818 | ) | |||
| (980 | ) | ACADIA Pharmaceuticals, Inc. | (41,042 | ) | |||
| (1,605 | ) | Accelerate Diagnostics, Inc. | (41,425 | ) | |||
| (575 | ) | Adeptus Health, Inc., Class A | (54,619 | ) | |||
| (2,175 | ) | Advaxis, Inc. | (44,218 | ) | |||
| (1,425 | ) | Aerovironment, Inc. | (37,164 | ) | |||
| (5,350 | ) | Agenus, Inc. | (46,170 | ) | |||
| See Notes to Financial Statements. | |
| 28 | www.jamesfunds.com |
| James Long-Short Fund | Schedule of Investments |
| June 30, 2015 |
| Shares | Value | ||||||
| Technology (continued) | |||||||
| (870 | ) | Atara Biotherapeutics, Inc. | $ | (45,901 | ) | ||
| (630 | ) | Autodesk, Inc. | (31,547 | ) | |||
| (875 | ) | Barracuda Networks, Inc. | (34,667 | ) | |||
| (1,700 | ) | Bellicum Pharmaceuticals, Inc. | (36,159 | ) | |||
| (1,100 | ) | Benefitfocus, Inc. | (48,235 | ) | |||
| (275 | ) | Bluebird Bio, Inc. | (46,302 | ) | |||
| (2,530 | ) | Callidus Software, Inc. | (39,417 | ) | |||
| (435 | ) | Clovis Oncology, Inc. | (38,228 | ) | |||
| (1,025 | ) | Cogent Communications Holdings, Inc. | (34,686 | ) | |||
| (800 | ) | CommVault Systems, Inc. | (33,928 | ) | |||
| (1,285 | ) | Cornerstone OnDemand, Inc. | (44,718 | ) | |||
| (1,175 | ) | Cree, Inc. | (30,585 | ) | |||
| (2,775 | ) | Cypress Semiconductor Corp. | (32,634 | ) | |||
| (2,140 | ) | Epizyme, Inc. | (51,360 | ) | |||
| (1,470 | ) | Exact Sciences Corp. | (43,718 | ) | |||
| (950 | ) | Fluidigm Corp. | (22,990 | ) | |||
| (930 | ) | Fortinet, Inc. | (38,437 | ) | |||
| (1,295 | ) | Genomic Health, Inc. | (35,988 | ) | |||
| (1,500 | ) | GoDaddy, Inc., Class A | (42,285 | ) | |||
| (2,105 | ) | HMS Holdings Corp. | (36,143 | ) | |||
| (1,750 | ) | Hortonworks, Inc. | (44,310 | ) | |||
| (4,300 | ) | ImmunoGen, Inc. | (61,834 | ) | |||
| (3,450 | ) | inContact, Inc. | (34,052 | ) | |||
| (3,705 | ) | Intralinks Holdings, Inc. | (44,127 | ) | |||
| (2,325 | ) | InvenSense, Inc. | (35,107 | ) | |||
| (2,600 | ) | Ironwood Pharmaceuticals, Inc. | (31,356 | ) | |||
| (3,140 | ) | Keryx Biopharmaceuticals, Inc. | (31,337 | ) | |||
| (675 | ) | Kite Pharma, Inc. | (41,155 | ) | |||
| (175 | ) | LinkedIn Corp., Class A | (36,160 | ) | |||
| (3,810 | ) | LivePerson, Inc. | (37,376 | ) | |||
| (1,700 | ) | MakeMyTrip, Ltd. | (33,456 | ) | |||
| (1,375 | ) | The Medicines Co. | (39,339 | ) | |||
| (1,475 | ) | Nimble Storage, Inc. | (41,389 | ) | |||
| (3,345 | ) | Novadaq Technologies, Inc. | (40,508 | ) | |||
| (3,600 | ) | OPOWER, Inc. | (41,436 | ) | |||
| (245 | ) | Palo Alto Networks, Inc. | (42,802 | ) | |||
| (675 | ) | Proofpoint, Inc. | (42,977 | ) | |||
| (1,695 | ) | PROS Holdings, Inc. | (35,781 | ) | |||
| (190 | ) | Puma Biotechnology, Inc. | (22,183 | ) | |||
| (2,975 | ) | RealD, Inc. | (36,682 | ) | |||
| (950 | ) | RealPage, Inc. | (18,117 | ) | |||
| (225 | ) | Receptos, Inc. | (42,761 | ) | |||
| (930 | ) | RigNet, Inc. | (28,430 | ) | |||
| (615 | ) | Sage Therapeutics, Inc. | (44,895 | ) | |||
| (2,730 | ) | Sarepta Therapeutics, Inc. | (83,074 | ) | |||
| (490 | ) | ServiceNow, Inc. | (36,412 | ) | |||
| (530 | ) | Shutterstock, Inc. | (31,079 | ) | |||
| (820 | ) | Sina Corp. | (43,923 | ) | |||
| (520 | ) | Sohu.com, Inc. | (30,727 | ) | |||
| (1,380 | ) | Spectranetics Corp. | (31,754 | ) | |||
| (535 | ) | Splunk, Inc. | (37,247 | ) | |||
| (1,400 | ) | SunEdison, Inc. | (41,874 | ) | |||
| (375 | ) | Tableau Software, Inc., Class A | (43,237 | ) | |||
| See Notes to Financial Statements. | |
| Annual Report | June 30, 2015 | 29 |
Schedule of Investments | James Long-Short Fund |
June 30, 2015 |
| Shares | Value | ||||||
| Technology (continued) | |||||||
| (1,240 | ) | Varonis Systems, Inc. | $ | (27,392 | ) | ||
| (275 | ) | Vertex Pharmaceuticals, Inc. | (33,957 | ) | |||
| (1,805 | ) | Youku, Inc., ADR | (44,277 | ) | |||
| (1,400 | ) | Zayo Group Holdings, Inc. | (36,008 | ) | |||
| (1,625 | ) | Zendesk, Inc. | (36,091 | ) | |||
| (365 | ) | Zillow, Inc., Class A | (31,660 | ) | |||
| (2,626,401 | ) | ||||||
| Utilities-(1.8)% | |||||||
| (5,600 | ) | Covanta Holding Corp. | (118,664 | ) | |||
| (3,325 | ) | Dynegy, Inc. | (97,256 | ) | |||
| (16,900 | ) | Frontier Communications Corp. | (83,655 | ) | |||
| (1,075 | ) | Grupo Televisa SAB, Sponsored ADR | (41,732 | ) | |||
| (4,550 | ) | NRG Energy, Inc. | (104,104 | ) | |||
| (2,625 | ) | NRG Yield, Inc., Class A | (57,724 | ) | |||
| (2,675 | ) | TerraForm Power, Inc., Class A | (101,596 | ) | |||
| (604,731 | ) | ||||||
| TOTAL COMMON STOCKS SOLD SHORT | (10,010,785 | ) | |||||
| RIGHTS-0.0% | |||||||
| (320) | Furiex Pharmaceuticals, CVR(b)(c) | 0 | |||||
| TOTAL RIGHTS SOLD SHORT | 0 | ||||||
| TOTAL SECURITIES SOLD SHORT-(29.5)% | |||||||
| (Proceeds $9,948,431) | $ | (10,010,785 | ) | ||||
For Fund compliance purposes, the Fund’s industry classifications refer to any one or more of the industry sub-classifications used by one or more widely recognized market indexes or ratings group indexes, and/or as defined by Fund management. Those definitions may not apply for purposes of this report, which may combine industry sub-classifications for reporting ease. Industries are shown as a percentage of net assets.
* | Non-income producing security. |
(a) | Security position is either entirely or partially help in a segregated account as collateral for securities sold short, aggregating a total security position market value of $27,406,245. |
(b) | Security fair valued using methods determined in good faith by the Pricing Committee. As of June 30, 2015, the total market value of these securities was $0, representing 0.0% of net assets. |
(c) | Security considered illiquid. On June 30, 2015, the total market value of these securities was $0, representing 0.0% of net assets. |
| ADR - American Depositary Receipt |
| CVR - Contingent Value Right |
| LLC - Limited Liability Company |
| LP - Limited Partnership |
| Ltd. - Limited |
| PLC - Public Limited Company |
| SAB - Sociedad Anonima Busatil is the Spanish term used for publicly held company |
| See Notes to Financial Statements. | |
| 30 | www.jamesfunds.com |
| James Advantage Funds | Statements of Assets and Liabilities |
| June 30, 2015 |
James Balanced: Golden Rainbow Fund | James Small Cap Fund | James Mid Cap Fund | James Micro Cap Fund | James Long-Short Fund | ||||||||||||||||
| ASSETS: | ||||||||||||||||||||
| Investment securities: | ||||||||||||||||||||
| At cost | $ | 3,814,971,413 | $ | 104,344,080 | $ | 15,968,293 | $ | 19,785,917 | $ | 38,782,484 | ||||||||||
| At value | $ | 4,289,934,511 | $ | 128,431,586 | $ | 21,187,350 | $ | 24,501,293 | $ | 44,147,968 | ||||||||||
| Cash | 88,545 | 9,735 | 2,740 | – | – | |||||||||||||||
| Deposits with brokers for securities sold short | – | – | – | – | 97,675 | |||||||||||||||
| Dividends and interest receivable | 14,330,868 | 62,542 | 17,217 | 13,994 | 34,161 | |||||||||||||||
| Receivable for securities sold | – | 454,868 | – | – | 332,792 | |||||||||||||||
| Receivable for capital shares sold | 5,078,899 | 15,093 | 8,674 | 12,240 | 600 | |||||||||||||||
| Other assets | 144,255 | – | – | – | – | |||||||||||||||
| Total Assets | 4,309,577,078 | 128,973,824 | 21,215,981 | 24,527,527 | 44,613,196 | |||||||||||||||
| LIABILITIES: | ||||||||||||||||||||
| Payable due to broker for securities sold short | – | – | – | – | 567,278 | |||||||||||||||
| Payable for interest expense | – | – | – | – | 379 | |||||||||||||||
| Payable for securities sold short (proceeds $–, $–, $–, $– and $9,948,431, respectively) | – | – | – | – | 10,010,785 | |||||||||||||||
| Payable for dividends on securities sold short | – | – | – | – | 9,400 | |||||||||||||||
| Payable for capital shares redeemed | 3,528,051 | 210,752 | – | – | 91,660 | |||||||||||||||
| Payable for securities purchased | 51,673,386 | 3,459,784 | – | 472,233 | – | |||||||||||||||
| Accrued expenses: | ||||||||||||||||||||
| Management fees | 2,238,814 | 131,449 | 21,867 | 29,414 | 36,021 | |||||||||||||||
| 12b‐1 distribution and service fees | 612,466 | 26,351 | 4,387 | – | 7,229 | |||||||||||||||
| Trustee fees | 2,355 | – | – | – | – | |||||||||||||||
| Other payables | 531,455 | – | – | – | – | |||||||||||||||
| Total Liabilities | 58,586,527 | 3,828,336 | 26,254 | 501,647 | 10,722,752 | |||||||||||||||
| Net Assets | $ | 4,250,990,551 | $ | 125,145,488 | $ | 21,189,727 | $ | 24,025,880 | $ | 33,890,444 | ||||||||||
| NET ASSETS CONSIST OF: | ||||||||||||||||||||
| Paid‐in capital | $ | 3,703,617,395 | $ | 96,390,375 | $ | 14,851,878 | $ | 20,079,826 | $ | 31,198,965 | ||||||||||
| Accumulated net investment income/(loss) | 73,489 | (160,754 | ) | (21,753 | ) | (27,241 | ) | (154,104 | ) | |||||||||||
| Accumulated net realized gain/(loss) on investments, securities sold short and translation of assets and liabilities denominated in foreign currency | 72,380,513 | 4,828,361 | 1,140,545 | (742,081 | ) | (2,457,547 | ) | |||||||||||||
| Net unrealized appreciation on investments, securities sold short and translation of assets and liabilities denominated in foreign currency | 474,919,154 | 24,087,506 | 5,219,057 | 4,715,376 | 5,303,130 | |||||||||||||||
| Net Assets | $ | 4,250,990,551 | $ | 125,145,488 | $ | 21,189,727 | $ | 24,025,880 | $ | 33,890,444 | ||||||||||
| See Notes to Financial Statements. | |
| Annual Report | June 30, 2015 | 31 |
| Statements of Assets and Liabilities | James Advantage Funds |
| June 30, 2015 |
James Balanced: Golden Rainbow Fund | James Small Cap Fund | James Mid Cap Fund | James Micro Cap Fund | James Long-Short Fund | ||||||||||||||||
| PRICING OF RETAIL CLASS SHARES: | ||||||||||||||||||||
| Net assets | $ | 2,973,349,867 | N/A | N/A | N/A | N/A | ||||||||||||||
| Shares of beneficial interest outstanding (unlimited number of shares authorized, no par) | 119,127,493 | N/A | N/A | N/A | N/A | |||||||||||||||
| Net assets value, offering price and redemption price per share | $ | 24.96 | N/A | N/A | N/A | N/A | ||||||||||||||
| PRICING OF INSTITUTIONAL CLASS SHARES: | ||||||||||||||||||||
| Net assets | $ | 1,277,640,684 | N/A | N/A | N/A | N/A | ||||||||||||||
| Shares of beneficial interest outstanding (unlimited number of shares authorized, no par) | 51,691,719 | N/A | N/A | N/A | N/A | |||||||||||||||
| Net assets value, offering price and redemption price per share | $ | 24.72 | N/A | N/A | N/A | N/A | ||||||||||||||
| PRICING OF SHARES | ||||||||||||||||||||
| Net assets | N/A | $ | 125,145,488 | $ | 21,189,727 | $ | 24,025,880 | $ | 33,890,444 | |||||||||||
| Shares of beneficial interest outstanding (unlimited number of shares authorized, no par) | N/A | 3,738,838 | 1,425,754 | 1,590,260 | 2,560,534 | |||||||||||||||
| Net assets value, offering price and redemption price per share | N/A | $ | 33.47 | $ | 14.86 | $ | 15.11 | $ | 13.24 | |||||||||||
| See Notes to Financial Statements. | |
| 32 | www.jamesfunds.com |
| James Advantage Funds | Statements of Operations |
| For the Year Ended June 30, 2015 |
James Balanced: Golden Rainbow Fund | James Small Cap Fund | James Mid Cap Fund | James Micro Cap Fund | James Long-Short Fund | ||||||||||||||||
| INVESTMENT INCOME: | ||||||||||||||||||||
| Dividends (Net of withholding taxes of $182,078, $9,979, $105, $5,097 and $1,925, respectively) | $ | 32,561,131 | $ | 2,214,126 | $ | 256,398 | $ | 346,197 | $ | 557,073 | ||||||||||
| Interest | 36,978,823 | – | – | – | – | |||||||||||||||
| Total Investment Income | 69,539,954 | 2,214,126 | 256,398 | 346,197 | 557,073 | |||||||||||||||
| EXPENSES: | ||||||||||||||||||||
| Management fees | 24,417,030 | 1,784,703 | 233,602 | 275,736 | 388,438 | |||||||||||||||
| 12b‐1 distribution and service fees ‐ Retail Class | 6,808,449 | – | – | – | – | |||||||||||||||
| 12b‐1 distribution and service fees | – | 358,341 | 46,895 | – | 77,965 | |||||||||||||||
| Dividend expense on securities sold short | – | – | – | – | 88,869 | |||||||||||||||
| Broker fees and charges on securities sold short | – | – | – | – | 285,928 | |||||||||||||||
| Administration fee | 1,216,713 | – | – | – | – | |||||||||||||||
| Transfer agent fee | 324,583 | – | – | – | – | |||||||||||||||
| Interest expense | – | 323 | – | 36 | 569 | |||||||||||||||
| Custodian fees | 321,801 | – | – | – | – | |||||||||||||||
| Professional fees | 169,729 | – | – | – | – | |||||||||||||||
| Trustee fees | 174,352 | 7,004 | 875 | 832 | 1,388 | |||||||||||||||
| Registration fees | 314,913 | – | – | – | – | |||||||||||||||
| Shareholder report printing and mailing | 390,051 | – | – | – | – | |||||||||||||||
| Other expenses | 103,536 | – | – | – | – | |||||||||||||||
| Total Expenses | 34,241,157 | 2,150,371 | 281,372 | 276,604 | 843,157 | |||||||||||||||
| Net Investment Income/(Loss) | 35,298,797 | 63,755 | (24,974 | ) | 69,593 | (286,084 | ) | |||||||||||||
| REALIZED AND UNREALIZED GAIN ON INVESTMENTS: | ||||||||||||||||||||
| Net realized gain/(loss) from: | ||||||||||||||||||||
| Investments | 105,377,919 | 13,922,731 | 1,310,582 | 125,414 | (247,813 | ) | ||||||||||||||
| Securities sold short | – | – | – | – | (1,296,429 | ) | ||||||||||||||
| Foreign currency transactions | (98,550 | ) | – | – | – | – | ||||||||||||||
| Net change in unrealized appreciation/(depreciation)on investments | (30,721,339 | ) | (16,372,684 | ) | (1,497,518 | ) | 1,199,893 | (108,496 | ) | |||||||||||
| Net change in unrealized appreciation on securities sold short | – | – | – | – | 458,024 | |||||||||||||||
| Net change in unrealized depreciation on foreign currency translation | (38,434 | ) | – | – | – | – | ||||||||||||||
| Net Realized and Unrealized Gain/(Loss) on Investments | 74,519,596 | (2,449,953 | ) | (186,936 | ) | 1,325,307 | (1,194,714 | ) | ||||||||||||
| Net Increase/(Decrease) in Net Assets Resulting from Operations | $ | 109,818,393 | $ | (2,386,198 | ) | $ | (211,910 | ) | $ | 1,394,900 | $ | (1,480,798 | ) | |||||||
| See Notes to Financial Statements. | |
| Annual Report | June 30, 2015 | 33 |
| Statements of Changes in Net Assets | James Balanced: Golden Rainbow Fund |
For the Year Ended June 30, 2015 | For the Year Ended June 30, 2014 | |||||||
| FROM OPERATIONS: | ||||||||
| Net investment income | $ | 35,298,797 | $ | 29,345,350 | ||||
| Net realized gain from investments and foreign currency transactions | 105,279,369 | 92,300,568 | ||||||
| Net change in unrealized appreciation/(depreciation) on investments and foreign currency translation | (30,759,773 | ) | 252,558,077 | |||||
| Net Increase in net assets resulting from operations | 109,818,393 | 374,203,995 | ||||||
| DISTRIBUTIONS TO SHAREHOLDERS: | ||||||||
| Retail Class Shares: | ||||||||
| From net investment income | (20,167,201 | ) | (21,653,078 | ) | ||||
| From net realized gain on investments | (88,883,031 | ) | (20,059,389 | ) | ||||
| Institutional Class Shares: | ||||||||
| From net investment income | (11,369,896 | ) | (8,835,117 | ) | ||||
| From net realized gain on investments | (35,788,504 | ) | (6,601,353 | ) | ||||
| Decrease in net assets from distributions to shareholders | (156,208,632 | ) | (57,148,937 | ) | ||||
| CAPITAL SHARE TRANSACTIONS: | ||||||||
| Retail Class Shares: | ||||||||
| Proceeds from shares sold | 1,083,291,781 | 970,253,861 | ||||||
| Net asset value of shares issued in reinvestment of distributions to shareholders | 106,212,553 | 40,193,298 | ||||||
| Payments for shares redeemed | (673,909,544 | ) | (492,466,806 | ) | ||||
| Net Increase in net assets from Retail Class capital share transactions | 515,594,790 | 517,980,353 | ||||||
| Institutional Class Shares: | ||||||||
| Proceeds from shares sold | 663,031,846 | 337,410,291 | ||||||
| Net asset value of shares issued in reinvestment of distributions to shareholders | 32,935,059 | 8,869,386 | ||||||
| Payments for shares redeemed | (213,184,051 | ) | (173,813,285 | ) | ||||
| Net Increase in net assets from Institutional Class capital share transactions | 482,782,854 | 172,466,392 | ||||||
| Total Increase in Net Assets | 951,987,405 | 1,007,501,803 | ||||||
| NET ASSETS: | ||||||||
| Beginning of year | 3,299,003,146 | 2,291,501,343 | ||||||
| End of year | $ | 4,250,990,551 | $ | 3,299,003,146 | ||||
| Accumulated Net Investment Income | $ | 73,489 | $ | 1,368 | ||||
| See Notes to Financial Statements. | |
| 34 | www.jamesfunds.com |
| James Balanced: Golden Rainbow Fund | Statements of Changes in Net Assets |
For the Year Ended June 30, 2015 | For the Year Ended June 30, 2014 | |||||||
| SUMMARY OF CAPITAL SHARE ACTIVITY: | ||||||||
| Retail Class Shares: | ||||||||
| Shares sold | 43,126,510 | 40,672,165 | ||||||
| Shares issued in reinvestment of distributions to shareholders | 4,294,108 | 1,676,454 | ||||||
| Shares redeemed | (26,927,316 | ) | (20,699,717 | ) | ||||
| Net Increase in shares outstanding | 20,493,302 | 21,648,902 | ||||||
| Shares outstanding, beginning of period | 98,634,191 | 76,985,289 | ||||||
| Shares outstanding, end of period | 119,127,493 | 98,634,191 | ||||||
| Institutional Class Shares: | ||||||||
| Shares sold | 26,756,542 | 14,287,435 | ||||||
| Shares issued in reinvestment of distributions to shareholders | 1,342,995 | 372,687 | ||||||
| Shares redeemed | (8,578,394 | ) | (7,356,017 | ) | ||||
| Net Increase in shares outstanding | 19,521,143 | 7,304,105 | ||||||
| Shares outstanding, beginning of period | 32,170,576 | 24,866,471 | ||||||
| Shares outstanding, end of period | 51,691,719 | 32,170,576 | ||||||
| See Notes to Financial Statements. | |
| Annual Report | June 30, 2015 | 35 |
| Statements of Changes in Net Assets | James Small Cap Fund |
For the Year Ended June 30, 2015 | For the Year Ended June 30, 2014 | |||||||
| FROM OPERATIONS: | ||||||||
| Net investment income/(loss) | $ | 63,755 | $ | (856 | ) | |||
| Net realized gain from investments | 13,922,731 | 30,606,598 | ||||||
| Net change in unrealized depreciation on investments | (16,372,684 | ) | (1,104,934 | ) | ||||
| Net Increase/(Decrease) in net assets resulting from operations | (2,386,198 | ) | 29,500,808 | |||||
| DISTRIBUTIONS TO SHAREHOLDERS: | ||||||||
| From net investment income | – | (4,195,369 | ) | |||||
| Decrease in net assets from distributions to shareholders | – | (4,195,369 | ) | |||||
| CAPITAL SHARE TRANSACTIONS: | ||||||||
| Proceeds from shares sold | 19,950,230 | 52,552,673 | ||||||
| Net asset value of shares issued in reinvestment of distributions to shareholders | – | 3,188,000 | ||||||
| Payments for shares redeemed | (55,955,457 | ) | (78,780,404 | ) | ||||
| Net Decrease in net assets from capital share transactions | (36,005,227 | ) | (23,039,731 | ) | ||||
| Total Increase/(Decrease) in Net Assets | (38,391,425 | ) | 2,265,708 | |||||
| NET ASSETS: | ||||||||
| Beginning of year | 163,536,913 | 161,271,205 | ||||||
| End of year | $ | 125,145,488 | $ | 163,536,913 | ||||
| Accumulated Net Investment Loss | $ | (160,754 | ) | $ | (146,122 | ) | ||
| SUMMARY OF CAPITAL SHARE ACTIVITY: | ||||||||
| Shares sold | 602,780 | 1,650,863 | ||||||
| Shares issued in reinvestment of distributions to shareholders | – | 96,753 | ||||||
| Shares redeemed | (1,690,399 | ) | (2,548,336 | ) | ||||
| Net Decrease in shares outstanding | (1,087,619 | ) | (800,720 | ) | ||||
| Shares outstanding, beginning of period | 4,826,457 | 5,627,177 | ||||||
| Shares outstanding, end of period | 3,738,838 | 4,826,457 | ||||||
| See Notes to Financial Statements. | |
| 36 | www.jamesfunds.com |
| James Mid Cap Fund | Statements of Changes in Net Assets |
For the Year Ended June 30, 2015 | For the Year Ended June 30, 2014 | |||||||
| FROM OPERATIONS: | ||||||||
| Net investment income/(loss) | $ | (24,974 | ) | $ | 8,284 | |||
| Net realized gain from investments | 1,310,582 | 1,353,284 | ||||||
| Net change in unrealized appreciation/(depreciation) on investments | (1,497,518 | ) | 3,023,969 | |||||
| Net Increase/(Decrease) in net assets resulting from operations | (211,910 | ) | 4,385,537 | |||||
| DISTRIBUTIONS TO SHAREHOLDERS: | ||||||||
| From net investment income | (8,282 | ) | (44,965 | ) | ||||
| From net realized gain on investments | (1,523,309 | ) | (445,588 | ) | ||||
| Decrease in net assets from distributions to shareholders | (1,531,591 | ) | (490,553 | ) | ||||
| CAPITAL SHARE TRANSACTIONS: | ||||||||
| Proceeds from shares sold | 5,839,177 | 3,235,678 | ||||||
| Net asset value of shares issued in reinvestment of distributions to shareholders | 1,395,032 | 445,408 | ||||||
| Payments for shares redeemed | (2,932,412 | ) | (3,587,463 | ) | ||||
| Net Increase in net assets from capital share transactions | 4,301,797 | 93,623 | ||||||
| Total Increase in Net Assets | 2,558,296 | 3,988,607 | ||||||
| NET ASSETS: | ||||||||
| Beginning of year | 18,631,431 | 14,642,824 | ||||||
| End of year | $ | 21,189,727 | $ | 18,631,431 | ||||
| Accumulated Net Investment Income/(Loss) | $ | (21,753 | ) | $ | 8,283 | |||
| SUMMARY OF CAPITAL SHARE ACTIVITY: | ||||||||
| Shares sold | 385,493 | 219,801 | ||||||
| Shares issued in reinvestment of distributions to shareholders | 96,071 | 30,687 | ||||||
| Shares redeemed | (190,331 | ) | (245,358 | ) | ||||
| Net Increase in shares outstanding | 291,233 | 5,130 | ||||||
| Shares outstanding, beginning of period | 1,134,521 | 1,129,391 | ||||||
| Shares outstanding, end of period | 1,425,754 | 1,134,521 | ||||||
| See Notes to Financial Statements. | |
| Annual Report | June 30, 2015 | 37 |
| Statements of Changes in Net Assets | James Micro Cap Fund |
For the Year Ended June 30, 2015 | For the Year Ended June 30, 2014 | |||||||
| FROM OPERATIONS: | ||||||||
| Net investment income/(loss) | $ | 69,593 | $ | (46,220 | ) | |||
| Net realized gain from investments | 125,414 | 3,491,006 | ||||||
| Net change in unrealized appreciation/(depreciation) on investments | 1,199,893 | (296,945 | ) | |||||
| Net Increase in net assets resulting from operations | 1,394,900 | 3,147,841 | ||||||
| DISTRIBUTIONS TO SHAREHOLDERS: | ||||||||
| From net investment income | (28,924 | ) | (14,357 | ) | ||||
| From net realized gain on investments | (3,160,652 | ) | – | |||||
| Decrease in net assets from distributions to shareholders | (3,189,576 | ) | (14,357 | ) | ||||
| CAPITAL SHARE TRANSACTIONS: | ||||||||
| Proceeds from shares sold | 9,202,348 | 4,477,035 | ||||||
| Net asset value of shares issued in reinvestment of distributions to shareholders | 2,984,065 | 13,928 | ||||||
| Payments for shares redeemed, net of redemption fees | (2,621,653 | ) | (3,185,478 | ) | ||||
| Net Increase in net assets from capital share transactions | 9,564,760 | 1,305,485 | ||||||
| Total Increase in Net Assets | 7,770,084 | 4,438,969 | ||||||
| NET ASSETS: | ||||||||
| Beginning of year | 16,255,796 | 11,816,827 | ||||||
| End of year | $ | 24,025,880 | $ | 16,255,796 | ||||
| Accumulated Net Investment Loss | $ | (27,241 | ) | $ | (53,368 | ) | ||
| SUMMARY OF CAPITAL SHARE ACTIVITY: | ||||||||
| Shares sold | 606,052 | 284,561 | ||||||
| Shares issued in reinvestment of distributions to shareholders | 208,473 | 815 | ||||||
| Shares redeemed | (158,389 | ) | (197,895 | ) | ||||
| Net Increase in shares outstanding | 656,136 | 87,481 | ||||||
| Shares outstanding, beginning of period | 934,124 | 846,643 | ||||||
| Shares outstanding, end of period | 1,590,260 | 934,124 | ||||||
| See Notes to Financial Statements. | |
| 38 | www.jamesfunds.com |
| James Long-Short Fund | Statements of Changes in Net Assets |
For the Year Ended June 30, 2015 | For the Year Ended June 30, 2014 | |||||||
| FROM OPERATIONS: | ||||||||
| Net investment loss | $ | (286,084 | ) | $ | (74,753 | ) | ||
| Net realized gain/(loss) from investments | (1,544,242 | ) | 164,164 | |||||
| Net change in unrealized appreciation on investments and securities sold short | 349,528 | 2,595,332 | ||||||
| Net Increase/(Decrease) in net assets resulting from operations | (1,480,798 | ) | 2,684,743 | |||||
| CAPITAL SHARE TRANSACTIONS: | ||||||||
| Proceeds from shares sold | 20,956,361 | 8,883,357 | ||||||
| Payments for shares redeemed | (9,031,159 | ) | (3,816,320 | ) | ||||
| Net Increase in net assets from capital share transactions | 11,925,202 | 5,067,037 | ||||||
| Total Increase in Net Assets | 10,444,404 | 7,751,780 | ||||||
| NET ASSETS: | ||||||||
| Beginning of year | 23,446,040 | 15,694,260 | ||||||
| End of year | $ | 33,890,444 | $ | 23,446,040 | ||||
| Accumulated Net Investment Loss | $ | (154,104 | ) | $ | (45,556 | ) | ||
| SUMMARY OF CAPITAL SHARE ACTIVITY: | ||||||||
| Shares sold | 1,516,178 | 678,509 | ||||||
| Shares redeemed | (654,209 | ) | (321,186 | ) | ||||
| Net Increase in shares outstanding | 861,969 | 357,323 | ||||||
| Shares outstanding, beginning of period | 1,698,565 | 1,341,242 | ||||||
| Shares outstanding, end of period | 2,560,534 | 1,698,565 | ||||||
| See Notes to Financial Statements. | |
| Annual Report | June 30, 2015 | 39 |
| Financial Highlights | James Balanced: Golden Rainbow Fund – Retail Class |
| For a share outstanding throughout the years indicated. | |
For the Year Ended June 30, 2015 | For the Year Ended June 30, 2014 | For the Year Ended June 30, 2013 | For the Year Ended June 30, 2012 | For the Year Ended June 30, 2011 | ||||||||||||||||
| Net asset value - beginning of year | $ | 25.28 | $ | 22.55 | $ | 20.93 | $ | 20.66 | $ | 18.32 | ||||||||||
| Income from investment operations: | ||||||||||||||||||||
| Net investment income | 0.22 | (a) | 0.24 | (a) | 0.32 | (a) | 0.25 | 0.24 | ||||||||||||
| Net realized and unrealized gain | 0.49 | 2.96 | 1.75 | 0.55 | 2.50 | |||||||||||||||
| Total from investment operations | 0.71 | 3.20 | 2.07 | 0.80 | 2.74 | |||||||||||||||
| Less distributions: | ||||||||||||||||||||
| From net investment income | (0.18 | ) | (0.24 | ) | (0.30 | ) | (0.23 | ) | (0.24 | ) | ||||||||||
| From net realized gain on investments | (0.85 | ) | (0.23 | ) | (0.15 | ) | (0.30 | ) | (0.16 | ) | ||||||||||
| Total distributions | (1.03 | ) | (0.47 | ) | (0.45 | ) | (0.53 | ) | (0.40 | ) | ||||||||||
| Net asset value at end of year | $ | 24.96 | $ | 25.28 | $ | 22.55 | $ | 20.93 | $ | 20.66 | ||||||||||
| Total return | 2.90 | % | 14.32 | % | 9.98 | % | 3.98 | % | 15.01 | % | ||||||||||
| Net assets, end of year (in thousands) | $ | 2,973,350 | $ | 2,493,030 | $ | 1,735,736 | $ | 1,249,228 | $ | 937,696 | ||||||||||
| Ratios/Supplemental Data: | ||||||||||||||||||||
| Ratio of net expenses to average net assets | 0.97 | % | 1.00 | % | 1.04 | % | 1.07 | % | 1.12 | % | ||||||||||
| Ratio of net investment income to average net assets | 0.86 | % | 0.99 | % | 1.45 | % | 1.26 | % | 1.27 | % | ||||||||||
| Portfolio turnover rate | 43 | % | 32 | % | 58 | % | 36 | % | 36 | % | ||||||||||
(a) | Calculated using the average shares method. |
| See Notes to Financial Statements. | |
| 40 | www.jamesfunds.com |
| James Balanced: Golden Rainbow Fund – Institutional Class | Financial Highlights |
| For a share outstanding throughout the years indicated. | |
For the Year Ended June 30, 2015 | For the Year Ended June 30, 2014 | For the Year Ended June 30, 2013 | For the Year Ended June 30, 2012 | For the Year Ended June 30, 2011 | ||||||||||||||||
| Net asset value - beginning of year | $ | 25.05 | $ | 22.35 | $ | 20.81 | $ | 20.61 | $ | 18.33 | ||||||||||
| Income from investment operations: | ||||||||||||||||||||
| Net investment income | 0.28 | (a) | 0.29 | (a) | 0.38 | (a) | 0.33 | 0.32 | ||||||||||||
| Net realized and unrealized gain | 0.50 | 2.94 | 1.73 | 0.52 | 2.47 | |||||||||||||||
| Total from investment operations | 0.78 | 3.23 | 2.11 | 0.85 | 2.79 | |||||||||||||||
| Less distributions: | ||||||||||||||||||||
| From net investment income | (0.26 | ) | (0.30 | ) | (0.42 | ) | (0.35 | ) | (0.35 | ) | ||||||||||
| From net realized gain on investments | (0.85 | ) | (0.23 | ) | (0.15 | ) | (0.30 | ) | (0.16 | ) | ||||||||||
| Total distributions | (1.11 | ) | (0.53 | ) | (0.57 | ) | (0.65 | ) | (0.51 | ) | ||||||||||
| Paid-in capital from redemption fees | – | – | 0.00 | (b) | – | – | ||||||||||||||
| Net asset value at end of year | $ | 24.72 | $ | 25.05 | $ | 22.35 | $ | 20.81 | $ | 20.61 | ||||||||||
| Total return | 3.20 | % | 14.59 | % | 10.26 | % | 4.22 | % | 15.27 | % | ||||||||||
| Net assets, end of year (in thousands) | $ | 1,277,641 | $ | 805,973 | $ | 555,766 | $ | 304,731 | $ | 130,870 | ||||||||||
| Ratios/Supplemental Data: | ||||||||||||||||||||
| Ratio of net expenses to average net assets | 0.73 | % | 0.75 | % | 0.79 | % | 0.82 | % | 0.87 | % | ||||||||||
| Ratio of net investment income to average net assets | 1.11 | % | 1.24 | % | 1.71 | % | 1.52 | % | 1.52 | % | ||||||||||
| Portfolio turnover rate | 43 | % | 32 | % | 58 | % | 36 | % | 36 | % | ||||||||||
(a) | Calculated using the average shares method. |
(b) | Amount rounds to less than $0.005 per share. |
| See Notes to Financial Statements. | |
| Annual Report | June 30, 2015 | 41 |
| Financial Highlights | James Small Cap Fund |
| For a share outstanding throughout the years indicated. | |
For the Year Ended June 30, 2015 | For the Year Ended June 30, 2014 | For the Year Ended June 30, 2013 | For the Year Ended June 30, 2012 | For the Year Ended June 30, 2011 | ||||||||||||||||
| Net asset value - beginning of year | $ | 33.88 | $ | 28.66 | $ | 23.89 | $ | 23.88 | $ | 17.51 | ||||||||||
| Income/(Loss) from investment operations: | ||||||||||||||||||||
| Net investment income/(loss) | 0.01 | (a) | (0.00 | )(a)(b) | 0.36 | (a) | 0.15 | 0.05 | ||||||||||||
| Net realized and unrealized gain/(loss) | (0.42 | ) | 6.12 | 4.92 | (0.11 | ) | 6.35 | |||||||||||||
| Total from investment operations | (0.41 | ) | 6.12 | 5.28 | 0.04 | 6.40 | ||||||||||||||
| Less distributions: | ||||||||||||||||||||
| From net investment income | – | (0.90 | ) | (0.51 | ) | (0.03 | ) | (0.03 | ) | |||||||||||
| Total distributions | – | (0.90 | ) | (0.51 | ) | (0.03 | ) | (0.03 | ) | |||||||||||
| Net asset value at end of year | $ | 33.47 | $ | 33.88 | $ | 28.66 | $ | 23.89 | $ | 23.88 | ||||||||||
| Total return | (1.21 | )% | 21.46 | % | 22.51 | % | 0.16 | % | 36.59 | % | ||||||||||
| Net assets, end of year (in thousands) | $ | 125,145 | $ | 163,537 | $ | 161,271 | $ | 134,727 | $ | 81,505 | ||||||||||
| Ratios/Supplemental Data: | ||||||||||||||||||||
| Ratio of net expenses to average net assets | 1.50 | % | 1.50 | % | 1.50 | % | 1.50 | % | 1.50 | % | ||||||||||
| Ratio of net investment income/(loss) to average net assets | 0.04 | % | (0.00 | )%(c) | 1.39 | % | 0.58 | % | 0.23 | % | ||||||||||
| Portfolio turnover rate | 76 | % | 62 | % | 41 | % | 89 | % | 60 | % | ||||||||||
(a) | Calculated using the average shares method. |
(b) | Amount rounds to less than ($0.005) per share. |
(c) | Amount rounds to less than (0.005%). |
| See Notes to Financial Statements. | |
| 42 | www.jamesfunds.com |
| James Mid Cap Fund | Financial Highlights |
| For a share outstanding throughout the years indicated. | |
For the Year Ended June 30, 2015 | For the Year Ended June 30, 2014 | For the Year Ended June 30, 2013 | For the Year Ended June 30, 2012 | For the Year Ended June 30, 2011 | ||||||||||||||||
| Net asset value - beginning of year | $ | 16.42 | $ | 12.97 | $ | 10.69 | $ | 11.38 | $ | 8.59 | ||||||||||
| Income/(Loss) from investment operations: | ||||||||||||||||||||
| Net investment income/(loss) | (0.02 | )(a) | 0.01 | (a) | 0.08 | (a) | 0.04 | 0.01 | ||||||||||||
| Net realized and unrealized gain/(loss) | (0.15 | ) | 3.87 | 2.23 | (0.64 | ) | 2.82 | |||||||||||||
| Total from investment operations | (0.17 | ) | 3.88 | 2.31 | (0.60 | ) | 2.83 | |||||||||||||
| Less distributions: | ||||||||||||||||||||
| From net investment income | (0.01 | ) | (0.04 | ) | (0.03 | ) | (0.09 | ) | (0.04 | ) | ||||||||||
| From net realized gain on investments | (1.38 | ) | (0.39 | ) | – | – | – | |||||||||||||
| Total distributions | (1.39 | ) | (0.43 | ) | (0.03 | ) | (0.09 | ) | (0.04 | ) | ||||||||||
| Net asset value at end of year | $ | 14.86 | $ | 16.42 | $ | 12.97 | $ | 10.69 | $ | 11.38 | ||||||||||
| Total return | (0.86 | )% | 30.34 | % | 21.68 | % | (5.26 | )% | 32.97 | % | ||||||||||
| Net assets, end of year (in thousands) | $ | 21,190 | $ | 18,631 | $ | 14,643 | $ | 12,657 | $ | 13,403 | ||||||||||
| Ratios/Supplemental Data: | ||||||||||||||||||||
| Ratio of net expenses to average net assets | 1.50 | % | 1.50 | % | 1.50 | % | 1.50 | % | 1.50 | % | ||||||||||
| Ratio of net investment income/(loss) to average net assets | (0.13 | )% | 0.05 | % | 0.64 | % | 0.32 | % | 0.13 | % | ||||||||||
| Portfolio turnover rate | 50 | % | 31 | % | 26 | % | 36 | % | 56 | % | ||||||||||
(a) | Calculated using the average shares method. |
| See Notes to Financial Statements. | |
| Annual Report | June 30, 2015 | 43 |
| Financial Highlights | James Micro Cap Fund |
| For a share outstanding throughout the periods indicated. | |
For the Year Ended June 30, 2015 | For the Year Ended June 30, 2014 | For the Year Ended June 30, 2013 | For the Year Ended June 30, 2012 | For the Year Ended June 30, 2011 (a) | ||||||||||||||||
| Net asset value - beginning of year | $ | 17.40 | $ | 13.96 | $ | 11.71 | $ | 11.91 | $ | 10.00 | ||||||||||
| Income/(Loss) from investment operations: | ||||||||||||||||||||
| Net investment income/(loss) | 0.06 | (b) | (0.05 | )(b) | 0.14 | (b) | (0.01 | ) | (0.03 | ) | ||||||||||
| Net realized and unrealized gain/(loss) | 1.12 | 3.50 | 2.25 | (0.13 | ) | 1.94 | ||||||||||||||
| Total from investment operations | 1.18 | 3.45 | 2.39 | (0.14 | ) | 1.91 | ||||||||||||||
| Less distributions: | ||||||||||||||||||||
| From net investment income | (0.02 | ) | (0.01 | ) | (0.14 | ) | – | – | ||||||||||||
| From net realized gain on investments | (3.45 | ) | – | – | (0.06 | ) | – | |||||||||||||
| Total distributions | (3.47 | ) | (0.01 | ) | (0.14 | ) | (0.06 | ) | – | |||||||||||
| Paid-in capital from redemption fees | 0.00 | (c) | 0.00 | (c) | 0.00 | (c) | 0.00 | (c) | – | |||||||||||
| Net asset value at end of year | $ | 15.11 | $ | 17.40 | $ | 13.96 | $ | 11.71 | $ | 11.91 | ||||||||||
| Total return | 7.95 | % | 24.75 | % | 20.64 | % | (1.15 | )% | 19.10 | % | ||||||||||
| Net assets, end of year (in thousands) | $ | 24,026 | $ | 16,256 | $ | 11,817 | $ | 10,173 | $ | 9,745 | ||||||||||
| Ratios/Supplemental Data: | ||||||||||||||||||||
| Ratio of net expenses to average net assets | 1.50 | % | 1.50 | % | 1.50 | % | 1.50 | % | 1.50 | % | ||||||||||
| Ratio of net investment income/(loss) to average net assets | 0.38 | % | (0.31 | )% | 1.12 | % | (0.14 | )% | (0.31 | )% | ||||||||||
| Portfolio turnover rate | 52 | % | 96 | % | 46 | % | 85 | % | 69 | % | ||||||||||
(a) | Fund commenced operations on July 1, 2010. |
(b) | Calculated using the average shares method. |
(c) | Amount rounds to less than $0.005 per share. |
| See Notes to Financial Statements. | |
| 44 | www.jamesfunds.com |
| James Long-Short Fund | Financial Highlights |
| For a share outstanding throughout the periods indicated. | |
For the Year Ended June 30, 2015 | For the Year Ended June 30, 2014 | For the Year Ended June 30, 2013 | For the Year Ended June 30, 2012 | For the Period Ended June 30, 2011 (a) | ||||||||||||||||
| Net asset value - beginning of year | $ | 13.80 | $ | 11.70 | $ | 9.99 | $ | 10.10 | $ | 10.00 | ||||||||||
| Income/(Loss) from investment operations: | ||||||||||||||||||||
| Net investment income/(loss) | (0.13 | )(b) | (0.06 | )(b) | 0.04 | (b) | (0.04 | ) | (0.00 | )(c) | ||||||||||
| Net realized and unrealized gain/(loss) | (0.43 | ) | 2.16 | 1.71 | (0.05 | ) | 0.10 | |||||||||||||
| Total from investment operations | (0.56 | ) | 2.10 | 1.75 | (0.09 | ) | 0.10 | |||||||||||||
| Less distributions: | ||||||||||||||||||||
| From net investment income | – | – | (0.04 | ) | (0.02 | ) | – | |||||||||||||
| Total distributions | – | – | (0.04 | ) | (0.02 | ) | – | |||||||||||||
| Net asset value at end of year | $ | 13.24 | $ | 13.80 | $ | 11.70 | $ | 9.99 | $ | 10.10 | ||||||||||
| Total return | (4.06 | )% | 17.95 | % | 17.57 | % | (0.93 | )% | 1.00 | %(d) | ||||||||||
| Net assets, end of year (in thousands) | $ | 33,890 | $ | 23,446 | $ | 15,694 | $ | 9,160 | $ | 10,718 | ||||||||||
| Ratios/Supplemental Data: | ||||||||||||||||||||
Ratio of net expenses to average net assets(e) | 2.70 | % | 2.57 | % | 2.70 | % | 2.66 | % | 1.73 | %(f) | ||||||||||
| Ratio of net investment income/(loss) to average net assets | (0.92 | )% | (0.44 | )% | 0.35 | % | (0.44 | )% | (1.03 | )%(f) | ||||||||||
| Portfolio turnover rate | 117 | % | 171 | % | 58 | % | 159 | % | 0 | %(d) | ||||||||||
(a) | Fund commenced operations on May 23, 2011. |
(b) | Calculated using the average shares method. |
(c) | Amount rounds to less than ($0.005) per share. |
(d) | Not Annualized. |
(e) | Dividend and interest expense on securities sold short and interest expense totaled 1.20%, 1.07%, 1.20%, 1.15% and 0.23% (annualized) of average net assets for the years ended June 30, 2015, June 30, 2014, June 30, 2013 and June 30, 2012 and for the period ended June 30, 2011, respectively. |
(f) | Annualized. |
| See Notes to Financial Statements. | |
| Annual Report | June 30, 2015 | 45 |
| Notes to Financial Statements | James Advantage Funds |
| June 30, 2015 |
| 1. ORGANIZATION |
The James Advantage Funds (the “Trust”) is an open-end management investment company that was organized as an Ohio business trust on August 29, 1997. The Trust is registered under the Investment Company Act of 1940, as amended (the “1940 Act”). James Balanced: Golden Rainbow Fund, James Small Cap Fund, James Mid Cap Fund and James Micro Cap Fund are each a diversified series of the Trust, and James Long-Short Fund is a non-diversified series of the Trust (individually a “Fund,” collectively the “Funds”). Each class of James Balanced: Golden Rainbow Fund represents an interest in the same portfolio of investments and has the same rights, but differs primarily in distribution fees and shareholder features. The Retail Class shares are subject to distribution (12b-1) fees but have a lower minimum investment requirement and offer certain shareholder services not available to Institutional Class shareholders. The Institutional Class shares are not subject to distribution (12b-1) fees and are available only through investment advisers and bank trust departments that have made arrangements for shares of all of their clients investing in the Fund to be held in an omnibus account (as well as other entities that are approved by management of the Trust).
James Balanced: Golden Rainbow Fund seeks to provide total return through a combination of growth and income and preservation of capital in declining markets. The Fund seeks to achieve its objective by investing primarily in common stocks and/or debt securities that the Fund’s adviser, James Investment Research, Inc. (“James” or the “Adviser”), believes are undervalued.
James Small Cap Fund seeks to provide long-term capital appreciation. The Fund seeks to achieve its objective by investing primarily in common stocks of small capitalization companies. The Adviser defines small capitalization as those companies with market capitalizations at the time of purchase no larger than the stocks in the Fund’s benchmark, the Russell 2000® Index. As of June 30, 2015, the stock with the maximum capitalization in the Russell 2000® Index had a capitalization of $4.70 billion.
James Mid Cap Fund seeks to provide long-term capital appreciation. The Fund seeks to achieve its objective by investing primarily in common stocks of mid capitalization companies. The Adviser defines mid capitalization companies as those with market capitalizations at the time of purchase that fall within the range of the S&P 400® MidCap Value Index. As of June 30, 2015, the stock with the maximum capitalization in the S&P 400® MidCap Value Index had a capitalization of $9.97 billion.
James Micro Cap Fund seeks to provide long-term capital appreciation. The Fund seeks to achieve its objective by investing primarily in common stocks of micro capitalization companies. Micro capitalization companies are defined as those companies with market capitalizations at the time of purchase no larger than the stocks in the Russell Microcap® Index, including exchange traded funds (“ETFs”) that invest primarily in such securities. As of June 30, 2015, the stock with the maximum capitalization in the Russell Microcap® Index had a capitalization of $1.27 billion.
James Long-Short Fund seeks to provide long-term capital appreciation. The Fund seeks to achieve its objective by investing primarily in foreign and domestic equity securities that the Adviser believes are undervalued and more likely to appreciate, and by selling short equity securities that the Adviser believes are overvalued and more likely to depreciate. The Fund also may take long positions in domestic and foreign fixed income securities that the Adviser believes are more likely to appreciate in the interest rate and spread environment anticipated by the Adviser, and short positions in fixed income securities that the Adviser believes are more likely to depreciate in the interest rate and spread environment anticipated by the Adviser. The Fund seeks to achieve positive returns on both the long positions and short positions that it takes in various securities.
| 2. SIGNIFICANT ACCOUNTING POLICIES |
The following is a summary of significant accounting policies followed by the Funds in preparation of their financial statements, in accordance with accounting principles generally accepted in the United States of America (“GAAP”). The Funds are considered an investment company for financial reporting purposes under GAAP.
Share Valuation
The net asset value per share of each Fund, other than the James Balanced: Golden Rainbow Fund, is calculated daily by dividing the total value of the Fund’s assets, less liabilities, by the number of shares outstanding. The net asset value per share of each class of shares of the James Balanced: Golden Rainbow Fund is calculated daily by dividing the total value of the Fund’s assets attributable to that class, less liabilities attributable to that class, by the number of outstanding shares of that class. The offering price and redemption price per share is equal to the net asset value per share, except that shares of the James Micro Cap Fund are subject to a redemption fee of 2% if redeemed within 180 days of purchase. Redemption fees received by the James Micro Cap Fund were $48 and $1,956 for years ended June 30, 2015 and June 30, 2014, respectively. The redemption fee is reflected in the “Payment for shares redeemed, net of redemption fees” in the Statements of Changes in Net Assets.
| 46 | www.jamesfunds.com |
| James Advantage Funds | Notes to Financial Statements |
| June 30, 2015 |
Securities Valuation
Securities are valued at fair value. The Funds’ portfolio securities, including short positions, are valued as of the close of the New York Stock Exchange (“NYSE”) (generally, 4:00 p.m., Eastern time) on each day that the NYSE is open for business. Equity securities that are traded on any exchange, including closed-end funds and exchange-traded funds, are valued at the last quoted sale price on the exchange or market in which such securities are principally traded. Lacking a last sale price, a security is valued at its last bid price except when, in James’s opinion, the last bid price does not accurately reflect the current value of the security. Securities that are traded on the NASDAQ® over-the-counter market are valued at their NASDAQ® Official Closing Price (“NOCP”) for all NASDAQ® National Market (“NNM”) and NASDAQ® Capital Market® securities. When market quotations are not readily available, if an event occurs after the close of the trading market (but before the time as of which a Fund calculates its net asset value) that materially affects a security’s value, when James determines that the market quotation does not accurately reflect the current value or when a non-144A restricted security is being valued, that security will be valued at its fair value as determined in good faith in conformity with guidelines adopted by and subject to review of the Board of Trustees (the “Board”). Fixed income securities may also be valued at evaluated prices provided by an independent, recognized pricing service, which determines valuations based upon market transactions for normal, institutional‐size trading units of securities or a matrix method which considers yield or price of comparable bonds provided by a pricing service. If the Adviser decides that a price provided by the pricing service does not accurately reflect the fair market value of the securities or when prices are not readily available from a pricing service, those securities will be priced at fair value as determined in good faith by the Adviser. Short-term investments in fixed-income securities with maturities of less than 60 days when acquired, or which subsequently are within 60 days of maturity, are valued by using the amortized cost method of valuation, which the Board has determined will approximate fair value. Shares of open-end investment companies are valued at net asset value.
For valuation purposes, quotations of foreign securities in a foreign currency are converted to U.S. dollar equivalents at the time of pricing the Funds. The values of foreign portfolio securities are generally based upon market quotations which, depending upon the exchange or market, may be last sale price, last bid price or the average of the last bid and asked prices as of, in each case, the close of the appropriate exchange or another designated time.
The calculation of the share price of each Fund that holds foreign securities in its portfolio does not take place contemporaneously with the determination of the values of many of the foreign portfolio securities used in such calculation. Events affecting the values of foreign portfolio securities that occur between the time their prices are determined and the calculation of a Fund’s share price may be taken into account in the determination of the value of those securities.
In accordance with the Trust’s good faith pricing guidelines, James is required to consider all appropriate factors relevant to the value of securities for which it has determined other pricing sources are not available or reliable as described above. There is no single standard for determining fair value, since fair value depends upon the circumstances of each individual case. As a general principle, the current fair value of an issue of securities being valued by the Adviser would appear to be the amount that the owner might reasonably expect to receive for them upon their current sale. Methods which are in accordance with this principle may, for example, be based on (i) a multiple of earnings, (ii) a discount from market of a similar freely traded security (including a derivative security or a basket of securities traded on other markets, exchanges or among dealers), or (iii) yield to maturity with respect to debt issues, or a combination of these and other methods.
Various inputs are used in determining the value of the Funds’ investments. These inputs are summarized in the three broad levels listed below:
| Level 1 - | Unadjusted quoted prices in active markets for identical, unrestricted assets or liabilities that a Fund has the ability to access at the measurement date; |
| Level 2 - | Quoted prices which are not active, quoted prices for similar assets or liabilities in active markets or inputs other than quoted prices that are observable (either directly or indirectly) for substantially the full term of the asset or liability; and |
| Level 3 - | Significant unobservable prices or inputs (including a Fund’s own assumptions in determining the fair value of investments) where there is little or no market activity for the asset or liability at the measurement date. |
The inputs or methodologies used for valuing securities are not necessarily an indication of the risk associated with investing in those securities. For example, securities maturing within 60 days of the reporting date are valued using amortized cost, in accordance with rules under the 1940 Act. Generally, amortized cost approximates the current fair value of a security, but since the value is not obtained from a quoted price in an active market, such securities are reflected as Level 2.
| Annual Report | June 30, 2015 | 47 |
| Notes to Financial Statements | James Advantage Funds |
| June 30, 2015 |
The following is a summary of the inputs used to value the Funds’ investments as of June 30, 2015:
| James Balanced: Golden Rainbow Fund | |||||||||||||
| Valuation Inputs | |||||||||||||
Investments in Securities at Value* | Level 1 | Level 2 | Level 3 | Total | |||||||||
| Common Stocks | $ | 2,321,838,258 | $ | – | $ | – | $ | 2,321,838,258 | |||||
| Closed-End Funds | 1,494,805 | – | – | 1,494,805 | |||||||||
| Exchange Traded Funds | 13,190,599 | – | – | 13,190,599 | |||||||||
| Corporate Bonds | – | 248,043,945 | – | 248,043,945 | |||||||||
| Mortgage Backed Securities | – | 23,406,725 | – | 23,406,725 | |||||||||
| U.S. Government Agencies | – | 89,990,761 | – | 89,990,761 | |||||||||
| U.S. Treasury Bonds & Notes | 1,227,421,982 | – | – | 1,227,421,982 | |||||||||
| Foreign Bonds | – | 39,203,747 | – | 39,203,747 | |||||||||
| Municipal Bonds | – | 150,608,464 | – | 150,608,464 | |||||||||
| Short Term Investments | 174,735,225 | – | – | 174,735,225 | |||||||||
| Total | $ | 3,738,680,869 | $ | 551,253,642 | $ | – | $ | 4,289,934,511 | |||||
| James Small Cap Fund | |||||||||||||
| Valuation Inputs | |||||||||||||
Investments in Securities at Value* | Level 1 | Level 2 | Level 3 | Total | |||||||||
| Common Stocks | $ | 121,206,995 | $ | – | $ | – | $ | 121,206,995 | |||||
| Short Term Investments | 7,224,591 | – | – | 7,224,591 | |||||||||
| Total | $ | 128,431,586 | $ | – | $ | – | $ | 128,431,586 | |||||
| James Mid Cap Fund | |||||||||||||
| Valuation Inputs | |||||||||||||
Investments in Securities at Value* | Level 1 | Level 2 | Level 3 | Total | |||||||||
| Common Stocks | $ | 19,986,331 | $ | – | $ | – | $ | 19,986,331 | |||||
| Short Term Investments | 1,201,019 | – | – | 1,201,019 | |||||||||
| Total | $ | 21,187,350 | $ | – | $ | – | $ | 21,187,350 | |||||
| James Micro Cap Fund | |||||||||||||
| Valuation Inputs | |||||||||||||
Investments in Securities at Value* | Level 1 | Level 2 | Level 3 | Total | |||||||||
| Common Stocks | $ | 22,981,899 | $ | – | $ | – | $ | 22,981,899 | |||||
| Short Term Investments | 1,519,394 | – | – | 1,519,394 | |||||||||
| Total | $ | 24,501,293 | $ | – | $ | – | $ | 24,501,293 | |||||
| James Long-Short Fund | |||||||||||||
| Valuation Inputs | |||||||||||||
Investments in Securities at Value* | Level 1 | Level 2 | Level 3 | Total | |||||||||
| Common Stocks | $ | 43,609,170 | $ | – | $ | – | $ | 43,609,170 | |||||
| Short Term Investments | 538,798 | – | – | 538,798 | |||||||||
| Total | $ | 44,147,968 | $ | – | $ | – | $ | 44,147,968 | |||||
| Valuation Inputs | |||||||||||||
| Other Financial Instruments* | Level 1 | Level 2 | Level 3 | Total | |||||||||
| Liabilities | |||||||||||||
| Securities Sold Short | |||||||||||||
| Common Stocks | $ | (10,010,785 | ) | $ | – | $ | – | $ | (10,010,785 | ) | |||
Rights(1) | – | – | 0 | 0 | |||||||||
| TOTAL | $ | (10,010,785 | ) | $ | – | $ | 0 | $ | (10,010,785 | ) | |||
* | For detailed descriptions of sector and industry, see the accompanying Schedule of Investments. |
(1) | Furiex Pharmaceuticals, CVR rights are illiquid and considered Level 3. The market value of the rights was $0 as of 6/30/15. |
| 48 | www.jamesfunds.com |
| James Advantage Funds | Notes to Financial Statements |
| June 30, 2015 |
The Funds recognize transfer between levels as of the end of period. For the year ended June 30, 2015, the Funds did not have any transfer between Level 1 and Level 2 securities.
Investment Transactions
Investment transactions are recorded on a trade date basis. Gains and losses are determined using the specific identification method, which liquidates all losses first, before any gains. Securities purchased or sold on a when-issued or delayed delivery basis may have extended settlement periods. Any securities so purchased are subject to market fluctuation during this period. The James Balanced: Golden Rainbow Fund will instruct its custodian to segregate assets in a separate account with a current value at least equal to the amount of its when-issued and delayed delivery purchase commitments. As of June 30, 2015, the Funds did not hold when-issued securities or delayed delivery purchase commitments.
Withholding taxes on foreign dividends have been provided for in accordance with the Trust’s understanding of the applicable country’s tax rules and rates.
Foreign Currency Translation
The market value of investment securities and other assets and liabilities denominated in foreign currencies are translated into U.S. dollars at the current exchange rate, provided by WM Reuters, at the close of each business day. Purchases and sales of securities, income receipts and expense payments are translated into U.S. dollars based at the exchange rate on the date of the transaction.
Reported net realized foreign exchange gains or losses arise from sales and maturities of short-term securities, sales of foreign currencies, currency gains or losses realized and between the trade and settlement dates on securities transactions, and the difference between the amounts of dividends, interest, and foreign withholding taxes recorded on the Funds’ books and the U.S. dollar equivalent of the amounts actually received or paid. Net unrealized foreign exchange gains and losses arise from the changes in the value of assets and liabilities including investments in securities at the reporting period, resulting from changes in the exchange rate. The portion of realized and unrealized gains or losses on investments due fluctuations in foreign currency exchange rates is not separately disclosed and is included in realized and unrealized gains or losses on investments, when applicable.
Short Sales and Segregated Cash
The James Long-Short Fund may actively sell short equity and fixed income securities. Short sales are transactions in which the Fund sells a security it does not own in anticipation of a decline in the market value of that security. To complete such a transaction, the Fund must borrow the security to deliver to the buyer upon the short sale; the Fund is then obligated to replace the security borrowed by purchasing it in the open market at some later date.
The Fund will incur a loss if the market price of the security increases between the date of the short sale and the date on which the Fund replaces the borrowed security. The Fund will realize a gain if the security declines in value between those dates. The Fund is required to pay any dividend or interest due on securities sold short. Such dividends and interest are recorded as an expense. The Fund may pay fees or charges on the assets borrowed for securities sold short.
All short sales are collateralized, as required by the Fund’s prime broker. The Fund maintains the collateral in segregated accounts consisting of cash and/or high-grade liquid assets sufficient to collateralize the market value of the Fund’s short positions.
Investment Income
Dividend income and dividend expense on long securities and securities sold short are recorded on the ex‐dividend date. Interest income is determined on the basis of interest accrued, adjusted for amortization of premiums and accretion of discounts on all debt securities. Amortization and accretion is calculated using the effective yield method.
Dividend income includes dividends earned on Real Estate Investment Trusts (“REITs”), which may include a return of capital. As such, important taxation issues may arise, which the Funds account for when information is provided by the issuing REIT.
Due to the actual character of dividends paid by REITs not being available until the end of the calendar year, the net investment income and long-term capital gains of the Funds can be different on the tax return compared to this annual report. Substantial unanticipated levels of return of capital may affect the Funds’ earnings and profits from which distributions are made.
Distributions received from Limited Partnership investments of a Fund are usually recorded as a return of capital and are excluded from available income in the calculation of distributions paid by the Funds. Return of capital is recorded as a reduction to the cost of investments in the Statements of Assets and Liabilities and in the Schedule of Investments.
Dividends and Distributions to Shareholders
Net investment income, if any, is generally declared and distributed to shareholders of each Fund on at least an annual basis. Net realized capital gains from security transactions, if any, are distributed to shareholders not less frequently than annually. Furthermore, capital gains are distributed only to the extent they exceed available capital loss carryforwards. Distributions to shareholders of net investment income and net realized capital gains are recorded on the ex-dividend date. The amount and timing of distributions are determined in accordance with federal income tax regulations, which may differ from GAAP.
Allocation of Income and Expense
Investment income earned, realized capital gains and losses, and unrealized appreciation and depreciation for the James Balanced: Golden Rainbow Fund is allocated daily to each class of shares based upon its proportionate share of total net assets of the Fund. Class-specific expenses are charged directly to the class incurring the expense. Common expenses, which are not attributable to a specific class, are allocated daily to each class of shares based upon its proportionate share of total net assets of the Fund. Expenses not directly billed to a particular Fund are allocated proportionally among all Funds daily in relation to net assets of each Fund or another reasonable measure.
| Annual Report | June 30, 2015 | 49 |
| Notes to Financial Statements | James Advantage Funds |
| June 30, 2015 |
Use of Estimates
The preparation of financial statements in conformity with GAAP requires management to make estimates and assumptions that affect the reported amounts of assets and liabilities and disclosure of contingent assets and liabilities at the date of the financial statements and the reported amounts of increases and decreases in net assets from operations during the reporting period. Actual results could differ from those estimates.
Federal Income Taxes
The Funds generally intend to distribute all taxable income and capital gains to shareholders, if any, and to otherwise continue to comply with the requirements of Subchapter M of the Internal Revenue Code of 1986, as amended, applicable to regulated investment companies. Therefore, no federal tax provision is required.
As of and during the year ended June 30, 2015, the Funds did not have a liability for any unrecognized tax benefits. The Funds file U.S. federal, state, and local tax returns as required. The Funds’ tax returns are subject to examination by the relevant tax authorities until expiration of the applicable statute of limitations, which is generally three years after the filing of the tax return for federal purposes and four years for most state returns. Tax returns for open years have incorporated no uncertain tax positions that require a provision for income taxes.
Reclassifications, which are determined in accordance with federal income tax regulations, result primarily from the differences in the GAAP (book) and tax treatment of certain investments such as partnerships, grantor trusts, collateralized debt instruments, foreign currency and, in some cases expenses paid on positions held short.
James Balanced: Golden Rainbow Fund | James Small Cap Fund | James Mid Cap Fund | James Micro Cap Fund | James Long-Short Fund | ||||||||||||
| Paid-in capital | $ | (667 | ) | $ | (1 | ) | $ | (3,221 | ) | $ | (1 | ) | $ | (156,801 | ) | |
| Accumulated net investment income/(loss) | (3,689,579 | ) | (78,387 | ) | 3,220 | (14,542 | ) | 177,536 | ||||||||
| Accumulated net realized gain/(loss) | 3,690,246 | 78,388 | 1 | 14,543 | (20,735 | ) | ||||||||||
| Included in the amounts reclassified above were net operating losses offset to Paid-in capital, were as follows | $ | – | $ | – | $ | 3,221 | $ | – | $ | 156,801 | ||||||
As of June 30, 2015, the components of distributable earnings on a tax basis were as follows:
James Balanced: Golden Rainbow Fund | James Small Cap Fund | James Mid Cap Fund | James Micro Cap Fund | James Long-Short Fund | ||||||||||||
| Tax cost of portfolio investments | $ | 3,817,255,625 | $ | 104,311,940 | $ | 15,968,293 | $ | 19,767,145 | $ | 39,185,024 | ||||||
| Gross unrealized appreciation | $ | 553,533,829 | $ | 26,155,355 | $ | 5,681,158 | $ | 5,519,172 | $ | 6,307,258 | ||||||
| Gross unrealized depreciation | (80,854,943 | ) | (2,035,709 | ) | (462,101 | ) | (785,024 | ) | (1,344,314 | ) | ||||||
| Net depreciation of foreign currency and derivatives | (43,944 | ) | – | – | – | (62,354 | ) | |||||||||
| Net unrealized appreciation | 472,634,942 | 24,119,646 | 5,219,057 | 4,734,148 | 4,900,590 | |||||||||||
| Accumulated capital gains/(losses) | 77,342,586 | 4,796,221 | 1,140,545 | (760,853 | ) | (2,052,940 | ) | |||||||||
| Undistributed ordinary income | 73,489 | – | – | – | – | |||||||||||
| Other cumulative effect of timing differences | (2,677,861 | ) | (160,754 | ) | (21,753 | ) | (27,241 | ) | (156,171 | ) | ||||||
| Total | $ | 547,373,156 | $ | 28,755,113 | $ | 6,337,849 | $ | 3,946,054 | $ | 2,691,479 | ||||||
| 50 | www.jamesfunds.com |
| James Advantage Funds | Notes to Financial Statements |
| June 30, 2015 |
The difference between the cost of portfolio investments on a tax basis and financial statement cost for the Funds is due primarily to the deferral of wash sale losses and to the differing treatment of certain investments under income tax regulations and GAAP.
The tax character of distributions paid for the year ended June 30, 2015 was as follows:
James Balanced: Golden Rainbow Fund | James Small Cap Fund | James Mid Cap Fund | James Micro Cap Fund | James Long-Short Fund | ||||||||||||
| Ordinary Income | $ | 36,104,504 | $ | – | $ | 50,911 | $ | 29,482 | $ | – | ||||||
| Long-Term Capital Gains | 120,104,128 | – | 1,480,680 | 3,160,094 | – | |||||||||||
| Total | $ | 156,208,632 | $ | – | $ | 1,531,591 | $ | 3,189,576 | $ | – | ||||||
The tax character of distributions paid for the year ended June 30, 2014 was as follows:
James Balanced: Golden Rainbow Fund | James Small Cap Fund | James Mid Cap Fund | James Micro Cap Fund | James Long-Short Fund | ||||||||||||
| Ordinary Income | $ | 30,488,195 | $ | 4,195,369 | $ | 44,965 | $ | 14,357 | $ | – | ||||||
| Long-Term Capital Gains | 26,660,742 | – | 445,588 | – | – | |||||||||||
| Total | $ | 57,148,937 | $ | 4,195,369 | $ | 490,553 | $ | 14,357 | $ | – | ||||||
Pre‐Enactment Capital Losses
During the year ended June 30, 2015, James Small Cap Fund utilized Pre‐Act capital loss carryovers in the amount of $8,759,066. The Pre-Act capital losses arose in fiscal years beginning prior to December 22, 2010, and were utilized prior to their expiration date of June 30, 2018.
Post‐Enactment Capital Losses
Under the tax code, Capital Losses are carried over to future tax years and will retain their character as either short‐term or long-term capital losses. These losses do not include any late year capital losses (losses arising in the period from November 1st through June 30th) that the funds have elected to defer for the current fiscal year. The Funds’ ability to utilize capital loss carryforwards in the future may be limited under the Internal Revenue Code and related regulations based on the results of future transactions.
Capital losses carried forward to the next tax year were as follows:
| Short Term | Long Term | ||||||
| James Long-Short Fund | $ | 638,551 | $ | – | |||
The Funds elect to defer to the period ending June 30, 2016 capital losses recognized during the period November 1, 2014 through June 30, 2015 in the amount of:
| Amount | ||||
| James Balanced: Golden Rainbow Fund | $ | 2,677,861 | ||
| James Micro Cap Fund | 760,853 | |||
| James Long-Short Fund | 1,414,389 | |||
The Funds elect to defer to the year ended June 30, 2016 late year ordinary losses in the amount of:
| Amount | ||||
| James Small Cap Fund | $ | 159,147 | ||
| James Mid Cap Fund | 21,753 | |||
| James Micro Cap Fund | 26,472 | |||
| James Long‐Short Fund | 154,104 | |||
| 3. INVESTMENT TRANSACTIONS |
Purchases and sales (including maturities) of investments in long-term U.S. Government obligations for the year ended June 30, 2015 were as follows:
| Purchases | Sales | ||||||
| James Balanced: Golden Rainbow Fund | $ | 978,159,951 | $ | 1,000,499,280 | |||
Purchases and sales (including maturities) of investments in other long-term securities for the year ended June 30, 2015 were as follows:
| Purchases | Sales | ||||||
| James Balanced: Golden Rainbow Fund | $ | 1,444,831,993 | $ | 572,342,525 | |||
| James Small Cap Fund | 105,453,219 | 140,032,014 | |||||
| James Mid Cap Fund | 11,361,592 | 8,922,228 | |||||
| James Micro Cap Fund | 15,097,911 | 9,053,628 | |||||
| James Long-Short Fund | 60,921,477 | 39,299,263 | |||||
For the year ended June 30, 2015, the cost of securities purchased to cover short sales and the proceeds from securities sold short were $55,945,209 and $56,040,011, respectively, for the Long-Short Fund.
| Annual Report | June 30, 2015 | 51 |
| Notes to Financial Statements | James Advantage Funds |
| June 30, 2015 |
| 4. MANAGEMENT FEE AND OTHER TRANSACTIONS WITH AFFILIATES |
Investment Management Agreement
The Funds retain James to manage the Funds’ investments. The investment decisions for the Funds are made by a committee of James’ personnel, which is primarily responsible for the day‐to‐day management of each Fund’s portfolio. The Funds pay James on a monthly basis at the annual rate set forth below of the Funds’ average daily net assets.
| James Balanced: Golden Rainbow Fund | |
| Average Total Net Assets | Contractual Fee |
| Up to and including $500 million | 0.74% |
| Over $500 million and including $1 billion | 0.70% |
| Over $1 billion and including $2 billion | 0.65% |
| Over $2 billion | 0.60% |
| James Small Cap Fund | |
| Average Total Net Assets | Contractual Fee |
| Up to and including $500 million | 1.25% |
| Over $500 million and including $1 billion | 1.20% |
| Over $1 billion and including $2 billion | 1.15% |
| Over $2 billion | 1.10% |
| James Mid Cap Fund | |
| Average Total Net Assets | Contractual Fee |
| Up to and including $500 million | 1.25% |
| Over $500 million and including $1 billion | 1.20% |
| Over $1 billion and including $2 billion | 1.15% |
| Over $2 billion | 1.10% |
| James Micro Cap Fund | |
| Average Total Net Assets | Contractual Fee |
| Up to and including $500 million | 1.50% |
| Over $500 million | 1.45% |
| James Long-Short Fund | |
| Average Total Net Assets | Contractual Fee |
| Up to and including $500 million | 1.25% |
| Over $500 million and including $1 billion | 1.20% |
| Over $1 billion and including $2 billion | 1.15% |
| Over $2 billion | 1.10% |
Advisory fees for the James Small Cap Fund, James Mid Cap Fund, James Micro Cap Fund and James Long-Short Fund are reduced by the fees and expenses of the non‐interested trustees incurred by the applicable Fund.
Under the investment management agreement, James is responsible for the payment of all operating expenses of the James Small Cap Fund, James Mid Cap Fund, James Micro Cap Fund and James Long-Short Fund, except for brokerage fees and commissions, taxes, interest (including dividend expense on securities sold short), fees and expenses of non-interested person trustees, 12b-1 expenses and extraordinary expenses.
Administrative Services Agreement
ALPS Fund Services, Inc. (“ALPS” or the “Administrator”) serves as administrator to the Funds. ALPS receives a monthly fee paid by James Balanced: Golden Rainbow Fund, for itself, and paid by James for the James Small Cap Fund, James Mid Cap Fund, James Micro Cap Fund and James Long-Short Fund, subject to a minimum monthly fee. Pursuant to an administrative agreement, ALPS will provide operational services to the Funds including, but not limited to fund accounting and fund administration and generally assist in each Fund’s operations.
Transfer Agency and Services Agreement
ALPS, pursuant to a Transfer Agency and Services Agreement with the Trust, serves as transfer agent for the Funds. Under the Transfer Agency and Services Agreement, ALPS receives an annual minimum fee, a fee based upon the number of shareholder accounts and is also reimbursed for out‐of‐pocket expenses. These fees and reimbursements for out-of-pocket expenses are paid and reimbursed by James Balanced: Golden Rainbow Fund, for itself, and by James for the James Small Cap Fund, James Mid Cap Fund, James Micro Cap Fund and James Long-Short Fund.
Plans of Distribution
The James Balanced: Golden Rainbow Fund (Retail Class), James Small Cap Fund, James Mid Cap Fund and James Long Short Fund have adopted a plan pursuant to Rule 12b‐1 under the 1940 Act (collectively, the “Plans”) under which each Fund may incur expenses related to distribution of its shares and for services provided to shareholders. Payments under a Plan are made to James, which uses them to pay distribution and shareholder service expenses on behalf of and as agent of the Fund. The amount payable by each Fund (the Retail Class of the James Balanced: Golden Rainbow Fund), other than the James Micro Cap Fund, under its Plan is 0.25% of its average daily net assets for the year. The Plans are compensation plans, which means that payments are made to James regardless of 12b‐1 expenses actually incurred. Therefore, payments under a Plan may exceed distribution and shareholder service expenses incurred pursuant to the Plan, and James is permitted to retain the excess. It is also possible that 12b‐1 expenses paid by James for a period will exceed the payments received by James, in which case James may pay such excess expenses out of its own resources. Payments received by James under the Plans are in addition to the fees paid to James pursuant to the Management Agreements. The Plans require that James act in the Funds’ best interests in expending the payments it receives from the Funds and use payments solely for the purpose of paying distribution and shareholder services expenses on behalf of the Funds. The Funds’ distributor, ALPS Distributors, Inc., validates all payment amounts to be made to brokers that have properly executed dealer agreements with the Funds before James will make such payments. The
| 52 | www.jamesfunds.com |
| James Advantage Funds | Notes to Financial Statements |
| June 30, 2015 |
| 5. COMMITMENTS AND CONTINGENCIES |
expenses of the Funds’ Plans are reflected as 12b-1 distribution and service fees – Retail Class on the Statements of Operations.
The Funds indemnify the Trust’s officers and trustees for certain liabilities that might arise from their performance of their duties to the Funds. Additionally, in the normal course of business, the Funds enter into contracts that contain a variety of representations and warranties and that provide general indemnifications. The Funds’ maximum exposure under these arrangements is unknown, as this would involve future claims that may be made against the Funds that have not yet occurred. However, based on experience, the Funds expect the risk of loss to be remote.
| 6. LINE OF CREDIT |
Each Fund has a revolving line of credit agreement with U.S. Bank, N.A. (the “Bank”). Borrowings under these arrangements are secured by investments held in the Funds’ portfolios as notated on the Schedules of Investments and bear interest at the Bank’s prime rate. For the year ended June 30, 2015, the James Small Cap Fund, the James Micro Cap Fund and the James Long-Short Fund utilized their line of credit. The average amount of borrowings was $1,790,000 over 2 days with a weighted-average interest rate of 3.25% for the James Small Cap Fund, the average amount of borrowings was $100,000 over 4 days with a weighted-average interest rate of 3.25% for James Micro Cap Fund and the average amount of borrowings was $2,100,000 over 1 day with a weighted-average interest rate of 3.25% for James Long-Short Fund. As of June 30, 2015, the James Small Cap Fund, the James Micro Cap Fund and the James Long-Short Fund did not have outstanding balances with respect to the line of credit. Interest on funded and unfunded loans can be found under interest expense on the Statements of Operations. For the remaining Funds, there were no borrowings on their line of credit during the year. Each Fund’s line of credit agreement expired on July 13, 2015 and was renewed for one year. The terms of the agreements can be characterized as follows:
| Fund | Maximum Balance Available | Interest Rate | Expiration Date | |||||
| James Balanced: | ||||||||
| Golden Rainbow Fund | $ | 50,000,000 | Prime Rate* | July 12, 2016 | ||||
| James Small Cap Fund | $ | 6,500,000 | Prime Rate* | July 12, 2016 | ||||
| James Mid Cap Fund | $ | 715,000 | Prime Rate* | July 12, 2016 | ||||
| James Micro Cap Fund | $ | 540,000 | Prime Rate* | July 12, 2016 | ||||
| James Long-Short Fund | $ | 3,000,000 | Prime Rate* | July 12, 2016 | ||||
| * | The rate at which the Bank announces as its prime lending rate. |
| Annual Report | June 30, 2015 | 53 |
| Report of Independent Registered Public Accounting Firm James Advantage Funds |
To the Board of Trustees and Shareholders of James Advantage Funds:
We have audited the accompanying statements of assets and liabilities, including the schedules of investments, of James Advantage Funds (the “Funds”) comprised of James Balanced: Golden Rainbow Fund, James Small Cap Fund, James Mid Cap Fund, James Micro Cap Fund, and James Long-Short Fund, as of June 30, 2015, and the related statements of operations for the year then ended, the statements of changes in net assets for each of the two years in the period then ended, and the financial highlights for each of the periods presented. These financial statements and financial highlights are the responsibility of the Funds’ management. Our responsibility is to express an opinion on these financial statements and financial highlights based on our audits.
We conducted our audits in accordance with the standards of the Public Company Accounting Oversight Board (United States). Those standards require that we plan and perform the audit to obtain reasonable assurance about whether the financial statements and financial highlights are free of material misstatement. The Funds are not required to have, nor were we engaged to perform, an audit of their internal control over financial reporting. Our audits included consideration of internal control over financial reporting as a basis for designing audit procedures that are appropriate in the circumstances, but not for the purpose of expressing an opinion on the effectiveness of the Funds’ internal control over financial reporting. Accordingly, we express no such opinion. An audit also includes examining, on a test basis, evidence supporting the amounts and disclosures in the financial statements, assessing the accounting principles used and significant estimates made by management, as well as evaluating the overall financial statement presentation. Our procedures included confirmation of securities owned as of June 30, 2015, by correspondence with the custodian and brokers; where replies were not received from brokers, we performed other auditing procedures. We believe that our audits provide a reasonable basis for our opinion.
In our opinion, the financial statements and financial highlights referred to above present fairly, in all material respects, the financial position of each of the portfolios constituting the James Advantage Funds as of June 30, 2015, the results of their operations for the year then ended, the changes in their net assets for each of the two years in the period then ended, and the financial highlights for each of the periods presented, in conformity with accounting principles generally accepted in the United States of America.
DELOITTE & TOUCHE LLP
Denver, Colorado
August 26, 2015
| 54 | www.jamesfunds.com |
| James Advantage Funds | Additional Information |
| June 30, 2015 (Unaudited) |
| PROXY VOTING GUIDELINES |
James is responsible for exercising the voting rights associated with the securities purchased and held by the Funds. A description of the policies and procedures that James uses in fulfilling this responsibility and information regarding how those proxies were voted during the most recent 12-month period ended June 30 are available without charge upon request by calling toll free 1‐800‐995‐2637. These items are also available on the Securities and Exchange Commission’s website at http://www.sec.gov.
| QUARTERLY PORTFOLIO DISCLOSURE |
James files a complete listing of portfolio holdings for each Fund as of the end of the first and third quarters of each fiscal year on Form N-Q. The complete listing (i) is available on the Commission’s website; (ii) may be reviewed and copied at the Commission’s Public Reference Room in Washington, DC; and (iii) will be made available to shareholders upon request by calling 1‐800‐995‐2637. Information on the operation of the Public Reference Room may be obtained by calling 1‐800‐SEC‐0330.
| TAX DESIGNATIONS |
Qualified Dividend Income
The percentage of ordinary income dividends distributed during the calendar year ended December 31, 2014 are designated as qualified dividend income (QDI) as defined in Section 1(h)(11) of the Internal Revenue Code in the following percentages:
| Amount | |
| James Balanced: Golden Rainbow Fund | 67.58% |
| James Small Cap Fund | 0% |
| James Mid Cap Fund | 100.00% |
| James Micro Cap Fund | 100.00% |
| James Long-Short Fund | 0% |
Dividends Received Deduction
For corporate shareholders, the following ordinary dividends paid during the calendar year ended December 31, 2014 qualify for the corporate dividends received deduction:
| Amount | |
| James Balanced: Golden Rainbow Fund | 63.31% |
| James Small Cap Fund | 0% |
| James Mid Cap Fund | 45.38% |
| James Micro Cap Fund | 100.00% |
| James Long-Short Fund | 0% |
Pursuant to Section 852(b)(3) of the Internal Revenue Code, James Balanced: Golden Rainbow Fund designated $120,104,128; James Mid Cap Fund designated $1,480,680; and James Micro Cap Fund designated $3,160,094 as long-term capital gains dividend.
| Annual Report | June 30, 2015 | 55 |
Disclosure Regarding Approval of Fund Advisory Agreements | James Advantage Funds |
| June 30, 2015 (Unaudited) |
The Board of Trustees, including a majority of the Trustees who are not “interested persons” of the Trust (the “Independent Trustees”), approved the continuation of the Management Agreements with James Investment Research, Inc. (the “Adviser”) for the James Balanced: Golden Rainbow Fund, the James Small Cap Fund, the James Long‐Short Fund, the James Mid Cap Fund and the James Micro Cap Fund at a meeting on February 25, 2015.
The Independent Trustees were assisted by independent legal counsel throughout the contract review process. They discussed the proposed continuances in executive session with such counsel at which no representatives of management or the Adviser were present. The Independent Trustees relied upon the advice of independent legal counsel and their own business judgment in determining the material factors to be considered in evaluating each Management Agreement and the weight to be given to each such factor. Among other factors, the Trustees considered for each Fund the Fund’s performance; the nature, extent and quality of the services provided; the costs of the services provided; the nature and cost of services provided to comparable accounts managed by the Adviser; any profits realized by the Adviser; the Adviser’s compliance policies; the extent to which economies of scale will be realized as the Fund grows; and whether fees reflect those economies of scale. The conclusions reached by the Independent Trustees were based on a comprehensive evaluation of all of the information provided and were not the result of any one factor. Moreover, each Independent Trustee may have afforded different weight to the various factors in reaching his conclusions with respect to each Agreement.
At the February 25, 2015 Board meeting, after the conclusion of the executive session, a representative of the Adviser referred the Trustees to the materials that had been provided to them for purposes of their consideration of the Management Agreements for the Funds. The representative reviewed the services provided by the Adviser to the Funds, as well as comparisons of: (i) the fees charged by the Adviser to the Funds against fees charged to certain private account and other registered investment company clients of the Adviser; and (ii) the scope of advisory services provided to the Funds against advisory services provided to certain other clients of the Adviser. The representative noted the time spent by the Adviser servicing the Funds’ shareholders. The representative reported that there were no material changes in the structure or relationships of the Adviser.
The representative then reviewed a description of the other services provided to the Funds. The representative reviewed the marketing services provided, noting that the cost of these services was, in part, reimbursed through the Funds’ 12b-1 plans and emphasized that the Adviser is fully committed to marketing the Funds. The Trustees acknowledged that the Trustees could not take into consideration any marketing expenses incurred by the Adviser in determining whether the management fee for any Fund is reasonable. The representative reminded the Trustees that an employee of an affiliate of the Adviser serves as the CCO of the Funds and that the Adviser pays the CCO costs of the Funds pursuant to the Management Agreements. The representative also noted that the Adviser monitors the expenses of each Fund and gives careful attention to the allocation of expenses among the Funds.
Based on: (i) the information regarding the services provided by the Adviser to the Funds and to certain private account clients employing similar strategies, and (ii) the Adviser’s fee schedules for such other non-Fund clients, and further bearing in mind the limitations of comparing different types of managed accounts and the different levels of service typically associated with such accounts, the Trustees determined that the fee structures applicable to the Adviser’s other clients were not indicative of any unreasonableness with respect to the advisory fees payable by the Funds under the Management Agreements.
The representative next reviewed with the Trustees the management fees and expense ratios of each Fund as reflected in each Fund’s prospectus dated November 1, 2014, comparing them with the management fees and expense ratios of a peer group of funds with the same, or very similar, investment objectives and strategies. The Trustees were also presented with net expense ratios for each Fund as reflected in the Funds’ annual report for the year ended June 30, 2014, compared against net expense ratio information for the same peer group. The representative reminded the Trustees that the peer groups were generally the same peer groups as had been used for comparison purposes at prior Board meetings, updated to reflect changes due to closed funds. The representative noted that each peer group had been selected based on the investment style and strategies employed by the Funds, as well as by asset size.
The representative noted that the expense ratio was more meaningful than the actual management fee for all of the Funds, except the James Balanced: Golden Rainbow Fund, because they have a universal fee structure where the Adviser generally pays all of the expenses of the Fund and is compensated with a higher management fee relative to the peer groups. The representative further noted that most of the funds in the peer group comparisons do not share this structure.
The Trustees further noted that some of the funds in the peer groups were one class of a fund that had many classes and, thus, benefit from economies of scale provided by the other classes. The representative then reviewed with the Trustees the calculation of the net adjusted management fee for each of the universal fee Funds (the fee after deduction of all direct expenses, other than distribution-related expenses, paid by the Adviser). The Trustees noted that the comparison of the net adjusted management fee with the average management fee for its peer group was extremely helpful in their analysis, as expense ratios are affected by a number of factors other than management fees. They remarked that for each of the Long-Short Fund and the Mid Cap Fund the net management fee was substantially less than the average management fee for its peer
| 56 | www.jamesfunds.com |
| James Advantage Funds | Disclosure Regarding Approval of Fund Advisory Agreements |
| June 30, 2015 (Unaudited) |
group, and that for each of the Small Cap and Micro Cap Funds the net adjusted management fee was much closer to the average fee for its peer group.
The Trustees also considered the Adviser’s assertion that, in its view, most of the advisers to peer group funds do not engage in comparable proprietary research and therefore do not have the same costs or expenditure of time that the Adviser has in performing its advisory services. The representative represented this as significant justification for the Adviser to have higher fees than average, as compared to other advisers.
Based on the information provided, the Trustees determined that the net expense ratios for the James Small Cap Fund, James Mid Cap Fund, James Micro Cap Fund and the James Long Short Fund, although generally higher than their respective peer group median expense ratios, were reasonable in light of the long-term performance of each Fund, the services provided by the Adviser, and the net adjusted management fees paid by each Fund. With respect to the James Balanced: Golden Rainbow Fund, the Trustees determined that the actual management fee rate payable to the Adviser was generally slightly higher than, but within a reasonable range of, the average peer group management fee rate for the Fund, in light of the Fund’s long-term performance and the services provided by the Adviser.
Comparisons with the Morningstar peer groups were also presented in the materials. The representative then reviewed comparisons of the Funds’ performance with their respective benchmarks.
The Trustees then discussed each Fund’s performance. The representative reviewed with the Trustees the data provided in the board materials, including one-year, three-year, five-year and ten-year (or since inception, as applicable) average annual total returns for each Fund as of December 31, 2014. The Trustees also reviewed comparisons of each Fund’s performance against peer group performance, Morningstar group performance and respective benchmarks.
With respect to the James Balanced: Golden Rainbow Fund, they noted that the Fund’s Retail Class had outperformed its peer group average and Morningstar group average for the one-, three-, five- and ten-year periods. For the James Small Cap Fund, the Trustees noted that the Fund had outperformed its peer group average and Morningstar group average for the five-year period while lagging slightly for the one-, three- and ten-year periods. The Trustees then noted that the James Long-Short Fund had outperformed its peer group average and Morningstar group average for both the one-year and three-year periods. The Trustees then noted that the Mid Cap Fund had outperformed its peer group average for the five-year period, but underperformed its peer group average and its Morningstar group average for the one-year, three-year and since inception periods. For the James Micro Cap Fund, the Trustees noted that the Fund had outperformed its peer group average and Morningstar group average for the one- and three-year periods . The Trustees also noted that, while they acknowledged that performance relative to benchmarks and peer groups was important, they were also focused on how successful a fund is in meeting its investment objectives over the long term. At the conclusion of their review of the above Funds’ performance, the Trustees noted that the Adviser regularly analyzes each Fund’s performance, and may make changes in the weight it gives certain factors as a result of the analysis.
Based on the information provided, the Trustees determined that: (i) the performance of the James Balanced: Golden Rainbow Fund, the James Long Short Fund and the James Micro Cap Fund was generally favorable over the periods considered for each respective Fund; (ii) the performance of the James Small Cap Fund was generally favorable over the five-year period and within an acceptable range of its peer averages for the other periods considered; and (iii) the performance of the James Mid Cap Fund lagged slightly, but was within an acceptable range of, its peer averages for the periods considered.
The Trustees reviewed a profitability analysis provided by the Adviser with respect to each Fund for the twelve months ended September 30, 2014, reflecting revenues net of certain fees and expenses under the Management Agreements, and incorporating the Adviser’s assumptions and estimates of, among other items, direct expenses and wage allocation for each Fund. The Trustees also considered the Adviser’s discussion of a third-party profitability benchmark bulletin, which discussed the range of profit margins in the mutual fund industry. The Trustees also took note of other long term industry and cyclical trends regarding profitability generally. The Trustees reviewed the expense and profitability information and, after discussion with the representative, concluded that the information provided was adequate for them to determine whether the overall profitability was reasonable. Finally, the Trustees reviewed the Adviser’s financial statements in order to assess the financial condition and stability of the Adviser.
While the Trustees indicated their belief that distribution expenses paid by the Adviser could reasonably be taken into account in considering the Adviser’s profitability, they indicated that their review of profitability without deduction of distribution expenses reflected an acceptable level of profitability with respect to each Fund, particularly when wages were included at a level that would reflect the cost of hiring an equivalent team of portfolio managers that do their own research. They emphasized the difficulty of looking at profitability on an objective basis, noting that profitability was an uncertain determination and that an adviser should not be penalized for being more efficient (and thus more profitable). After further discussion, the Trustees acknowledged that the profitability levels of those Funds that were profitable to the Adviser were in the acceptable range.
| Annual Report | June 30, 2015 | 57 |
Disclosure Regarding Approval of Fund Advisory Agreements | James Advantage Funds |
| June 30, 2015 (Unaudited) |
The Independent Trustees noted that their review of the analysis in executive session included a calculation of profitability without deduction of distribution-related expenses, as well as a consideration of the appropriate level of wage expenses to be included. They also stated that they had considered the proper allocation of common expenses, indicating that they had determined it was more appropriate to allocate expenses pro rata, based on assets, than to allocate them equally among the Funds.
The Trustees considered whether economies of scale in the provision of services to the Funds will be passed along to the shareholders under the Management Agreements. The Trustees noted the Adviser’s reminder that the Adviser had added breakpoints in the management fee for each of the Funds. The Trustees acknowledged that the Adviser was entitled to reasonable profits.
The Trustees reviewed and considered any other incidental benefits derived or to be derived by the Adviser from its relationship with the Funds. The representative noted that the Adviser does not have any soft dollar arrangements with broker-dealers. The representative acknowledged that the Adviser benefits from its association with the Funds and that it currently benefits from favorable press generated by the Funds.
At this point, the Trustees indicated that it was their consensus that the information presented and the discussion of the information were adequate for making a determination regarding the renewal of the Management Agreements. The Trustees stated that they were satisfied with the Adviser’s and each Fund’s performance, and they complimented the Adviser on its adherence to its basic methodology, particularly when it was out of favor. The Trustees then concluded that, based on their review of the management fees and overall expense comparisons, as well as all information relating to the profitability of the Adviser, that the management fees for each Fund were reasonable and that the arrangements were not generating excessive profits to the Adviser. The Trustees further concluded that the fee breakpoints would make each Fund’s management fee reflective of economies of scale.
As to the nature, extent and quality of services provided by the Adviser, the Trustees expressed their common opinion that the Adviser’s personnel are appropriately qualified, that the Adviser provides excellent services to the Funds and that the extent of the services is consistent with the Board’s expectations. In this regard, the Trustees noted that they had discussed each Fund’s possible investment in closed-end mutual funds and exchange-traded funds, such as iShares and similar products, which would be used to gain exposure to particular investment products, indexes or foreign market sectors or indices. After discussion, it was their unanimous conclusion that the fees to be paid to the Adviser are based on services provided that are in addition to, rather than duplicative of, the services provided under the advisory agreements of the ETFs and similar products. The Trustees also indicated that they believed, based on their quarterly meetings in executive session with the Adviser’s (and the Funds’) CCO, that the Adviser had maintained an appropriate compliance program through the reporting period.
After further discussion, and based upon all of the above-mentioned factors and their related conclusions, with no single factor or conclusion being determinative and with each Trustee not necessarily attributing the same weight to each factor, the Trustees unanimously determined that the continuation of each Management Agreement for an additional year was in the best interests of the applicable Fund and its shareholders.
| 58 | www.jamesfunds.com |
| James Advantage Funds | Trustees & Officers |
| June 30, 2015 (Unaudited) |
Additional information regarding the Fund’s trustees is included in the Statement of Additional Information, which can be obtained without charge by calling 1-800-995-2637.
| INTERESTED TRUSTEES | ||||
| Name/Address/Age | Position(s) With Fund/Time Served/ During Past 5 years1 | Principal Occupation by Trustee | Number of Portfolios in Fund Complex Overseen | Other Directorships Held by Trustee Outside During the Past Five Years |
Barry R. James2, CFA James Investment Research, Inc. 1349 Fairground Road Beavercreek, OH 45385 Age: 58 | President & Trustee since 1997 | President and CEO, James Investment Research (2005-Present), Executive Vice President, James Investment Research (2000-2006), CEO, James Capital Alliance (2005-Present) and Director (1992- Present) | 5 | Director, Heart to Honduras (2006 – Present) Director, FAIR Foundation (2010 – Present) |
INDEPENDENT TRUSTEES | ||||
Name/Address*/Age | Position(s) With Fund/Time Served/ During Past 5 years1 | Principal Occupation by Trustee | Number of Portfolios in Fund Complex Overseen | Other Directorships Held by Trustee Outside During the Past Five Years |
Anthony P. D’Angelo Age: 85 | Trustee since 1997 | Retired, Professor Emeritus, Graduate School of Logistics and Acquisitions Management, Air Force Institute of Technology, Wright-Patterson AFB, Ohio(Retired since 1999) | 5 | None |
Leslie L. Brandon Age: 73 | Trustee since 2003 | Retired Partner, Ernst & Young LLP, Columbus, OH (1966-2000) | 5 | None |
Ronald D. Brown Age 62 | Trustee since 2014 | Chief Operating Officer, The Armor Group (2013-Present); Chief Financial Officer, Makino Inc. (2010 - 2013); Managing Director, Taft Business Consulting LLC. (2009 - 2013); Chairman & Chief Executive Officer, | 5 | Director of AO Smith Corporation (2001 - present); Board Trustee of University of Cincinnati (2013 - present); Director of Makino Inc. (2010 - 2013) |
Robert F. Chelle Age 67 | Trustee since 2014 | Retired Entrepreneur-In-Residence and Founding Director of the L. William Crotty Center for Entrepreneurial Leadership at the University of Dayton (1999 – 2015) | 5 | Director of DRT Mfg. Co., The Siebenthaler Company, PNC Bank – Dayton Region, Prime Controls Mfg. Co. and School Outfitters; Trustee of The Entrepreneur’s Center – An Edison Business Incubator |
Richard C. Russell Age: 68 | Trustee since 2003 | Consultant, Danis Companies (construction and real estate development firm), (2002-present) | 5 | Director, Excellence in Motivation (1994-present); Director, Dayton Reliable Tool (1999-present) |
| * | All Trustees may be contacted at c/o The James Advantage Funds, Attn: Secretary, 1349 Fairground Road, Beavercreek, OH 45385 |
| 1 | Each Trustee is elected to serve in accordance with the Declaration of Trust and Bylaws of the Trust until his or her successor is duly elected and qualified. |
| 2 | Mr. James is an “interested person” of the Trust as defined in the 1940 Act because of his relationship to James Investment Research, Inc., which serves as the investment adviser to the Trust. |
| Annual Report | June 30, 2015 | 59 |
| Trustees & Officers | James Advantage Funds |
| June 30, 2015 (Unaudited) |
| OFFICERS | ||
| Name/Address/Age | Position(s) With Fund/Time Served | Principal Occupation by Officer |
Thomas L. Mangan James Investment Research, Inc. 1349 Fairground Road Beavercreek, OH 45385 Age: 65 | Vice President, Secretary and Chief Financial Officer since 1997 | Senior Vice President, James Investment Research, Inc. |
Lesley Ott James Investment Research, Inc. 1349 Fairground Road Beavercreek, OH 45385 Age: 32 | Chief Compliance Officer since 2012 | Chief Compliance Officer, James Investment Research, Inc. and James Capital Alliance, Inc. (since 2012), Deputy Chief Compliance Officer, James Investment Research, Inc. and James Capital Alliance, Inc. (2010-2012), Operations Associate, James Capital Alliance, Inc. (2006-2010). |
Richard Brian Culpepper James Investment Research, Inc. 1349 Fairground Road Beavercreek, OH 45385 Age: 43 | Assistant Secretary since 2011 | Vice President, James Investment Research, Inc. (since 2014), First Vice President of James Investment Research, Inc. (since 2009). |
Andrea E. Kuchli, c/o ALPS Fund Services, Inc. 1290 Broadway, Ste. 1100 Denver, CO 80203 Age: 29 | Assistant Secretary since 2015 | Vice President and Senior Counsel of ALPS Fund Services, Inc. since February 2015, Associate Attorney, Davis Graham & Stubbs LLP, April 2014 to February 2015, Associate Attorney, Dechert LLP, 2011 to April 2014. Ms. Kuchli is also the Secretary of the Westcore Trust. |
Amy Broerman James Investment Research, Inc. 1349 Fairground Road Beavercreek, OH 45385 Age: 43 | Treasurer since 2012 | Assistant Vice President of Operations, James Investment Research, Inc. (since 2008), Assistant Treasurer of James Advantage Funds (2002-2012). |
Jennell Panella c/o ALPS Fund Services, Inc. 1290 Broadway, Ste. 1100 Denver, CO 80203 Age: 41 | Assistant Treasurer since 2013 | Fund Controller of ALPS Fund Services, Inc. (since June 2012), Financial Reporting Manager, Parker Global Strategies, LLC (2009-2012). |
Brian P. Shepardson James Investment Research, Inc. 1349 Fairground Road Beavercreek, OH 45385 Age: 42 | Assistant Treasurer since 2015 | First Vice President, James Investment Research, Inc. |
| 60 | www.jamesfunds.com |
| James Advantage Funds | Privacy Policy |
| June 30, 2015 (Unaudited) |
Facts
What does James Advantage Funds do with your personal information?
Why?
Financial companies choose how they share your personal information. Federal law gives consumers the right to limit some, but not all sharing. Federal law also requires us to tell you how we collect, share, and protect your personal information. Please read this notice carefully to understand what we do.
What?
The types of personal information we collect and share depends on the product or service that you have with us. This information can include:
| ● | Social Security number and wire transfer instructions |
| ● | account transactions and transaction history |
| ● | investment experience and purchase history |
When you are no longer our customer, we continue to share your information as described in this notice.
How?
All financial companies need to share customers’ personal information to run their everyday business. In the section below, we list the reasons financial companies can share their customers’ personal information; the reasons James Advantage Funds chooses to share; and whether you can limit this sharing.
| Reasons we can share your personal information: | Does James Advantage Funds share information? | Can you limit this sharing? |
| For our everyday business purposes - such as to process your transactions, maintain your account(s), respond to court orders and legal investigations, or report to credit bureaus. | YES | NO |
| For our marketing purposes - to offer our products and services to you. | YES | NO |
| For joint marketing with other financial companies. | NO | We don’t share |
| For our affiliates’ everyday business purposes - information about your transactions and records. | NO | We don’t share |
| For our affiliates’ everyday business purposes - information about your credit worthiness. | NO | We don’t share |
| For our affiliates to market to you | NO | We don’t share |
| For non-affiliates to market to you | NO | We don’t share |
Questions? Call 1-800-99 James
| What we do: | |
| How does James Advantage Funds protect my personal information? | To protect your personal information from unauthorized access and use, we use security measures that comply with federal law. These measures include computer safeguards and secured files and buildings. Our service providers are held accountable for adhering to strict policies and procedures to prevent any misuse of your nonpublic personal information. |
How does James Advantage Funds collect my personal information? | We collect your personal information, for example, when you ● open an account or deposit money ● direct us to buy securities or direct us to sell your securities ● seek advice about your investments We also collect your personal information from others, such as credit bureaus, affiliates, or other companies. |
| Why can’t I limit all sharing? | Federal law gives you the right to limit only: ● sharing for affiliates’ everyday business purposes – information about your creditworthiness. ● affiliates from using your information to market to you. ● sharing for nonaffiliates to market to you. State laws and individual companies may give you additional rights to limit sharing. |
| Definitions | ||
| Affiliates | Companies related by common ownership or control. They can be financial and non-financial companies. ● Our affiliates include financial companies, such as James Investment Research, Inc. and James Capital Alliance. | |
| Non-affiliates | Companies not related by common ownership or control. They can be financial and non-financial companies. ● James Advantage Funds does not share with nonaffiliates so they can market to you. | |
| Joint marketing | A formal agreement between nonaffiliated financial companies that together market financial products or services to you. ● James Advantage Funds does not jointly market. | |
| Annual Report | June 30, 2015 | 61 |
Item 2. Code of Ethics.
| (a) | As of the end of the period covered by this report, the registrant has adopted a code of ethics that applies to the registrant’s principal executive officer, principal financial officer, principal accounting officer or controller, or persons performing similar functions, regardless of whether these individuals are employed by the registrant or a third party. |
| (b) | For purposes of this item, “code of ethics” means written standards that are reasonably designed to deter wrongdoing and to promote: |
| (1) | Honest and ethical conduct, including the ethical handling of actual or apparent conflicts of interest between personal and professional relationships; |
| (2) | Full, fair, accurate, timely, and understandable disclosure in reports and documents that a registrant files with, or submits to, the Commission and in other public communications made by the registrant; |
| (3) | Compliance with applicable governmental laws, rules, and regulations; |
| (4) | The prompt internal reporting of violations of the code to an appropriate person or persons identified in the code; and |
| (5) | Accountability for adherence to the code. |
| (c) | Amendments: During the period covered by this report, there were no amendments to the provisions of the code of ethics. |
| (d) | Waivers: During the period covered by this report, the registrant has not granted any express or implicit waivers from the provisions of the code of ethics. |
| (e) | Not applicable to this report. |
| (f) | The Registrant’s Code of Ethics is attached as an Exhibit hereto. |
Item 3. Audit Committee Financial Expert.
| (a) | The registrant’s board of trustees has determined that Leslie L. Brandon is an audit committee financial expert. Mr. Brandon is independent for purposes of this Item 3. |
| (b) | For purposes of this Item, an “audit committee financial expert” means a person who has the following attributes: |
| (1) | An understanding of generally accepted accounting principles and financial statements; |
| (2) | The ability to assess the general application of such principles in connection with the accounting for estimates, accruals, and reserves; |
| (3) | Experience preparing, auditing, analyzing, or evaluating financial statements that present a breadth and level of complexity of accounting issues that are generally comparable to the breadth and complexity of issues that can reasonably be expected to be raised by the registrant’s financial statements, or experience actively supervising one or more persons engaged in such activities; |
| (4) | An understanding of internal control over financial reporting; and |
| (5) | An understanding of audit committee functions. |
| (c) | A person shall have acquired such attributes through: |
| (1) | Education and experience as a principal financial officer, principal accounting officer, controller, public accountant, or auditor or experience in one or more positions that involve the performance of similar functions; |
| (2) | Experience actively supervising a principal financial officer, principal accounting officer, controller, public accountant, auditor, or person performing similar functions; |
| (3) | Experience overseeing or assessing the performance of companies or public accountants with respect to the preparation, auditing, or evaluation of financial statements; or |
| (4) | Other relevant experience. |
(d)
| (1) | A person who is determined to be an audit committee financial expert will not be deemed an “expert” for any purpose, including without limitation for purposes of Section 11 of the Securities Act of 1933 (15 U.S.C. 77k), as a result of being designated or identified as an audit committee financial expert pursuant to this Item. |
| (2) | The designation or identification of a person as an audit committee financial expert pursuant to this Item does not impose on such person any duties, obligations, or liability that are greater than the duties, obligations, and liability imposed on such person as a member of the audit committee and board of directors in the absence of such designation or identification. |
| (3) | The designation or identification of a person as an audit committee financial expert pursuant to this Item does not affect the duties, obligations, or liability of any other member of the audit committee or board of directors. |
Item 4. Principal Accountant Fees and Services.
| (a) | Audit Fees. |
| June 30, 2015 | June 30, 2014 |
| $89,000 | $86,500 |
Such audit fees represent the aggregate fees billed for the fiscal years ended June 30, 2015 and June 30, 2014 for professional services rendered by Deloitte & Touche LLP for the audit of the registrant’s annual financial statements.
| (b) | Audit-Related Fees. |
| Registrant | Adviser | |
| June 30, 2015 | $0 | $0 |
| June 30, 2014 | $0 | $0 |
Neither the registrant nor the adviser was billed any fees by Deloitte & Touche LLP for the fiscal years ended June 30, 2015 and June 30, 2014 for assurance and related services that were reasonably related to the performance of the audit of the registrant’s financial statement and not otherwise included under “Audit Fees” above.
| (c) | Tax Fees. |
| Registrant | Adviser | |
| June 30, 2015 | $12,360 | $0 |
| June 30, 2014 | $12,000 | $0 |
“Tax fees” shown in the table above were for services provided by Deloitte & Touche LLP in relation to the preparation of excise filings and income tax returns for the registrant.
| (d) | All Other Fees. |
| Registrant | Adviser | |
| June 30, 2015 | $0 | $0 |
| June 30, 2014 | $0 | $0 |
The registrant was not billed any fees by Deloitte & Touche LLP for products and services provided by Deloitte & Touche LLP, other than the services reported above in items (a) - (c), for the fiscal years ended June 30, 2015 and June 30, 2014.
| (e) | Pre-Approval Policies and Procedures. |
| (1) | Pursuant to the registrant’s Audit Committee Charter (the “Charter”), the Audit Committee is directly responsible for the appointment, termination, compensation, and oversight of the work of any registered public accounting firm employed by the registrant. In addition, the Charter provides that the Audit Committee is responsible for reviewing and approving in advance any and all proposals under which the independent auditor would provide “permissible non-audit services” (as defined in the Charter) to the registrant or to the investment adviser to the registrant (not including any sub-adviser whose role is primarily portfolio management and that is sub-contracted or overseen by the investment adviser to the registrant) or any entity controlling, controlled by, or under common control with the investment adviser that provides ongoing services to the registrant if those permissible non-audit services relate directly to the operations and financial reporting of the registrant. In determining whether to pre-approve non-audit services, the Audit Committee considers whether such services are consistent with the independent auditor’s independence. |
(2)
| Registrant | Adviser | |
| Audit Related | 100% | n/a |
| Tax Fees | 100% | n/a |
| Other Fees | n/a | n/a |
| (f) | Not applicable to the registrant. |
| (g) | Aggregate non-audit fees billed by the registrant’s accountant: |
| Registrant | Adviser | |
| June 30, 2015 | $16,270 | $0 |
| June 30, 2014 | $19,416 | $0 |
| (h) | The registrant’s audit committee of the board of trustees has considered that the provision of non-audit services that were rendered to an entity controlling, controlled by, or under common control with the registrant’s investment adviser that provides ongoing services to the registrant for the fiscal years ended June 30, 2015 and June 30, 2014, as identified above, that were not pre-approved pursuant to paragraph (c)(7)(ii) of Rule 2-01 of Regulation S-X, are compatible with maintaining Deloitte & Touche LLP’s independence. |
Item 5. Audit Committee of Listed Registrants.
Not applicable to the registrant.
Item 6. Investments.
| (a) | The Schedule of Investments is included as part of the report to shareholders filed under Item 1 of this Form. |
| (b) | Not applicable to the registrant. |
Item 7. Disclosure of Proxy Voting Policies and Procedures for Closed-End Management Investment Companies.
Not applicable to the registrant.
Item 8. Portfolio Managers of Closed-End Management Investment Companies.
Not applicable to the registrant.
Item 9. Purchases of Equity Securities by Closed-End Management Investment Company and Affiliates Purchasers.
Not applicable to the registrant.
Item 10. Submission of Matters to a Vote of Security Holders.
The registrant has not adopted procedures by which shareholders may recommend nominees to the registrant’s board of trustees.
Item 11. Controls and Procedures.
| (a) | Based on an evaluation of the registrant’s disclosure controls and procedures (as defined in Rule 30a-3(c) under the Investment Company Act of 1940, as amended), the registrant’s principal executive officer and principal financial officer have concluded that the registrant’s disclosure controls and procedures are effective as of a date within 90 days of the filing date of this report. |
| (b) | There were no significant changes in the registrant’s internal control over financial reporting (as defined in Rule 30a-3(d) under the Investment Company Act of 1940, as amended) that occurred during the second fiscal quarter of the period covered by this Report that have materially affected, or are reasonably likely to materially affect, the registrant’s internal control over financial reporting. |
Item 12. Exhibits.
| (a)(1) | Registrant’s Code of Ethics for Principal Executive and Principal Financial Officers, which is the subject of the disclosure required by Item 2 of Form N-CSR, is attached hereto as Exhibit 12(a)(1). |
| (a)(2) | Certifications required by Item 12(a)(2) of Form N-CSR are filed herewith as Exhibit 99.CERT. |
| (a)(3) | Not applicable. |
| (b) | Certifications required by Item 12(b) of Form N-CSR are filed herewith as Exhibit 99.906CERT. |
SIGNATURES
Pursuant to the requirements of the Securities Exchange Act of 1934 and the Investment Company Act of 1940, the Registrant has duly caused this Report to be signed on its behalf by the undersigned, thereunto duly authorized.
(Registrant) The James Advantage Funds
By (Signature and Title)
/s/ Barry R. James | |
| Barry R. James | |
| President |
Date: September 4, 2015
Pursuant to the requirements of the Securities Exchange Act of 1934 and the Investment Company Act of 1940, this report has been signed below by the following persons on behalf of the registrant and in the capacities and on the dates indicated.
By (Signature and Title)
| /s/ Barry R. James | |
| Barry R. James | |
| President |
Date: September 4, 2015
By (Signature and Title)
| /s/ Thomas L. Mangan | |
| Thomas L. Mangan | |
| Chief Financial Officer |
Date: September 4, 2015