
| Shareholder Letter | 1 |
| Growth of $10,000 or $50,000 Charts | 5 |
| Representation of Schedules of Investments | 9 |
| Disclosure of Fund Expenses | 10 |
| Schedule of Investments | |
| James Balanced: Golden Rainbow Fund | 11 |
| James Small Cap Fund | 24 |
| James Mid Cap Fund | 27 |
| James Micro Cap Fund | 30 |
| James Aggressive Allocation Fund | 33 |
| James Long-Short Fund | 36 |
| Statements of Assets and Liabilities | 40 |
| Statements of Operations | 42 |
| Statements of Changes in Net Assets | 43 |
| Financial Highlights | |
| James Balanced: Golden Rainbow Fund - Retail Class | 50 |
| James Balanced: Golden Rainbow Fund - Institutional Class | 51 |
| James Small Cap Fund | 52 |
| James Mid Cap Fund | 53 |
| James Micro Cap Fund | 54 |
| James Aggressive Allocation Fund | 55 |
| James Long-Short Fund | 56 |
| Notes to Financial Statements | 57 |
| Report of Independent Registered Public Accounting Firm | 65 |
| Additional Information | 66 |
| Disclosure Regarding Approval of Fund Advisory Agreements | 67 |
| Trustees & Officers | 70 |
| Privacy Policy | 72 |
| James Advantage Funds | Shareholder Letter |
June 30, 2017 (Unaudited)
| Annual Report | June 30, 2017 | 1 |
| Shareholder Letter | James Advantage Funds |
June 30, 2017 (Unaudited)
| • | The stock and bond markets have had to adapt to a rising Fed Funds rate. The Federal Reserve (Fed) has started to tighten and is now even looking to reduce holdings on their balance sheet. Much of the stock advance in the last 9 years has come because of the support of the Federal Reserve. |
| • | The market has digested the Presidential election and rallied strongly based on the hope of lower regulations and lower taxes. Hope may eventually run dry, but it has sustained the market since the election. |
| • | Our economy, while underwhelming, has been stronger than most of the world and this strength attracts investors into the U.S. markets. |
| 2 | www.jamesfunds.com |
| James Advantage Funds | Shareholder Letter |
June 30, 2017 (Unaudited)
| Annual Report | June 30, 2017 | 3 |
| Shareholder Letter | James Advantage Funds |
June 30, 2017 (Unaudited)
| 4 | www.jamesfunds.com |
| James Advantage Funds | Growth of $10,000 or $50,000 Charts |
June 30, 2017 (Unaudited)
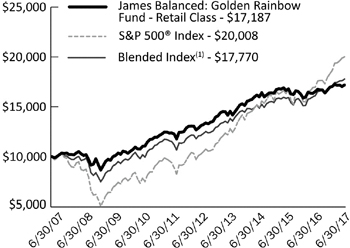
| 1 Year | 5 Years | 10 Years | Since Inception(2) | |
| James Balanced: Golden Rainbow – Retail Class | 3.92% | 5.96% | 5.56% | 7.75% |
S&P 500® Index | 17.90% | 14.63% | 7.18% | 9.64% |
Blended Index(1) | 10.21% | 8.03% | 5.92% | 8.03% |
Russell 2000® Index | 24.60% | 13.70% | 6.92% | 10.05% |
| Barclays Capital U.S. Intermediate Government/Credit Bond Index | ‐0.21% | 1.77% | 3.87% | 5.41% |
(1) | The Blended Index is comprised of a 25% weighting in the S&P 500® Index, a 25% weighting in the Russell 2000® Index and a 50% weighting in the Barclays Capital U.S. Intermediate Government/Credit Bond Index. |
(2) | Inception was July 1, 1991. |
The total annual operating expense ratio as stated in the fee table of the most recent prospectus, dated November 1, 2016, was 0.97%. |
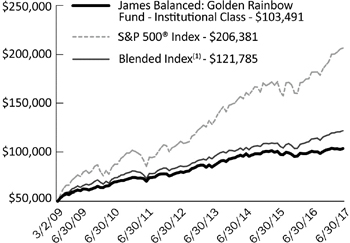
| 1 Year | 5 Years | Since Inception(2) | |
| James Balanced: Golden Rainbow – Institutional Class | 4.23%(3) | 6.24% | 9.13% |
S&P 500® Index | 17.90% | 14.63% | 18.56% |
Blended Index(1) | 10.21% | 8.03% | 11.28% |
Russell 2000® Index | 24.60% | 13.70% | 19.20% |
| Barclays Capital U.S. Intermediate Government/ Credit Bond Index | ‐0.21% | 1.77% | 3.41% |
(1) | The Blended Index is comprised of a 25% weighting in the S&P 500® Index, a 25% weighting in the Russell 2000® Index and a 50% weighting in the Barclays Capital U.S. Intermediate Government/Credit Bond Index. |
(2) | Inception was March 2, 2009. |
(3) | Excludes adjustments in accordance with accounting principles generally accepted in the United States of America and as such, the net asset value and total return for shareholder transactions reported to the market may differ from the net asset value for financial reporting purposes. |
| The total annual operating expense ratio as stated in the fee table of the most recent prospectus, dated November 1, 2016, was 0.72%. |
| Annual Report | June 30, 2017 | 5 |
| Growth of $10,000 or $50,000 Charts | James Advantage Funds |
June 30, 2017 (Unaudited)
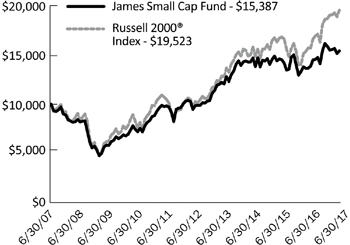
Average Annual Total Returns
| 1 Year | 5 Years | 10 Years | Since Inception(1) | |
| James Small Cap Fund | 11.36% | 9.32% | 4.40% | 7.90% |
Russell 2000® Index | 24.60% | 13.70% | 6.92% | 9.18% |
(1) | Fund inception was October 2, 1998. |
The total annual operating expense ratio as stated in the fee table of the most recent prospectus, dated November 1, 2016, was 1.51%. |
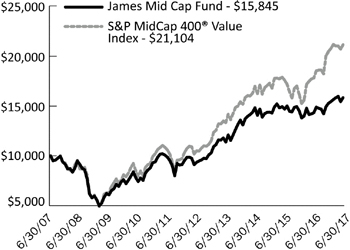
| 1 Year | 5 Years | 10 Years | Since Inception(1) | |
| James Mid Cap Fund | 10.50% | 11.13% | 4.71% | 5.81% |
S&P MidCap 400® Value Index | 18.47% | 14.98% | 7.75% | 8.68% |
(1) | Fund inception was June 30, 2006. |
The total annual operating expense ratio as stated in the fee table of the most recent prospectus, dated November 1, 2016, was 1.51%. |
| 6 | www.jamesfunds.com |
| James Advantage Funds | Growth of $10,000 or $50,000 Charts |
June 30, 2017 (Unaudited)
Average Annual Total Returns
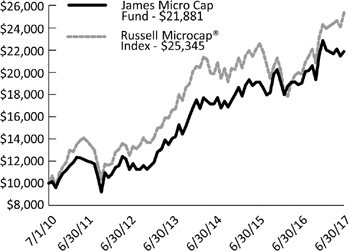
| 1 Year | 5 Year | Since Inception(1) | |
| James Micro Cap Fund | 14.90% | 13.20% | 11.84% |
Russell Microcap® Index | 27.61% | 13.73% | 14.21% |
(1) | Fund inception was July 1, 2010. |
The total annual operating expense ratio as stated in the fee table of the most recent prospectus, dated November 1, 2016, was 1.51%. |
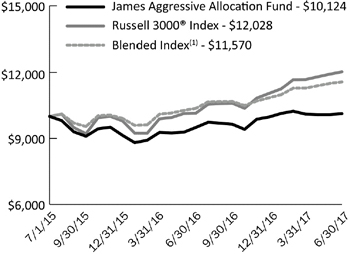
Average Annual Total Returns
| 1 Year | Since Inception(2) | |
| James Aggressive Allocation Fund | 6.54% | 0.62% |
Russell 3000® Index | 18.51% | 9.67% |
Blended Index(1) | 11.60% | 7.56% |
(1) | The Blended Index is comprised of a 35% weighting in the Barclays U.S. Aggregate Government/Credit Bond Index and a 65% weighting in the Russell 3000® Index. |
(2) | Fund inception was July 1, 2015. |
The total annual operating expense ratio as stated in the fee table of the most recent prospectus, dated November 1, 2016, was 1.01%. |
| Annual Report | June 30, 2017 | 7 |
| Growth of $10,000 or $50,000 Charts | James Advantage Funds |
June 30, 2017 (Unaudited)
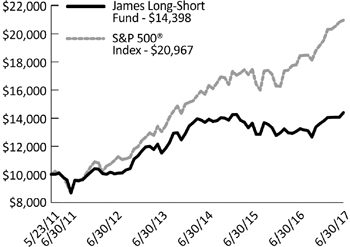
Average Annual Total Returns
| 1 Year | 5 Years | Since Inception(1) | |
| James Long‐Short Fund | 10.32% | 7.55% | 6.15% |
S&P 500® Index | 17.90% | 14.63% | 12.90% |
(1) | Fund inception was May 23, 2011. |
The total annual operating expense ratio as stated in the fee table of the most recent prospectus, dated November 1, 2016, was 2.53%. |
| 8 | www.jamesfunds.com |
| James Advantage Funds | Representation of Schedules of Investments |
June 30, 2017 (Unaudited)
| * | Holdings are subject to change, and may not reflect the current or future position of the portfolio. |
| Annual Report | June 30, 2017 | 9 |
| Disclosure of Fund Expenses | James Advantage Funds |
June 30, 2017 (Unaudited)
Net Expense Ratio Annualized June 30, 2017(a) | Beginning Account Value January 1, 2017 | Ending Account Value June 30, 2017 | Expense Paid During Period(b) | |
| James Balanced: Golden Rainbow Fund | ||||
| Retail Class Actual | 0.97% | $1,000.00 | $1,013.70 | $4.84 |
| Retail Class Hypothetical (5% return before expenses) | 0.97% | $1,000.00 | $1,019.98 | $4.86 |
| Institutional Class Actual | 0.72% | $1,000.00 | $1,014.70 | $3.60 |
| Institutional Class Hypothetical (5% return before expenses) | 0.72% | $1,000.00 | $1,021.22 | $3.61 |
| James Small Cap Fund | ||||
| Actual | 1.50% | $1,000.00 | $953.40 | $7.27 |
| Hypothetical (5% return before expenses) | 1.50% | $1,000.00 | $1,017.36 | $7.50 |
| James Mid Cap Fund | ||||
| Actual | 1.50% | $1,000.00 | $1,036.90 | $7.58 |
| Hypothetical (5% return before expenses) | 1.50% | $1,000.00 | $1,017.36 | $7.50 |
| James Micro Cap Fund | ||||
| Actual | 1.50% | $1,000.00 | $956.80 | $7.28 |
| Hypothetical (5% return before expenses) | 1.50% | $1,000.00 | $1,017.36 | $7.50 |
| James Aggressive Allocation Fund | ||||
| Actual | 0.98% | $1,000.00 | $1,015.20 | $4.90 |
| Hypothetical (5% return before expenses) | 0.98% | $1,000.00 | $1,019.93 | $4.91 |
| James Long-Short Fund | ||||
| Actual | 1.57%(c) | $1,000.00 | $1,057.60 | $8.01 |
| Hypothetical (5% return before expenses) | 1.57%(c) | $1,000.00 | $1,017.01 | $7.85 |
| (a) | Annualized, based on the Fund's most recent fiscal half year expenses. |
| (b) | Expenses are equal to the Fund's annualized expense ratio multiplied by the average account value over the period, multiplied by the number of days in the most recent fiscal half year (181), divided by 365. |
| (c) | Dividend and interest expense on securities sold short and interest expense totaled 0.07% (annualized) of average net assets for the six months ended June 30, 2017. Total annual operating expense of 1.57% includes the 0.07% of dividend and interest expense. |
| 10 | www.jamesfunds.com |
| James Balanced: Golden Rainbow Fund | Schedule of Investments |
| June 30, 2017 |
| Shares or Principal Amount | Value | |||||
| COMMON STOCKS‐46.56% | ||||||
| Basic Materials‐6.04% | ||||||
| 170,565 | AK Steel Holding Corp.* | $ | 1,120,612 | |||
| 46,770 | Arconic, Inc. | 1,059,340 | ||||
| 273,670 | Avery Dennison Corp. | 24,184,218 | ||||
| 33,065 | Brady Corp., Class A | 1,120,903 | ||||
| 21,095 | Cabot Corp. | 1,127,106 | ||||
| 485,865 | Celanese Corp., Series A | 46,128,023 | ||||
| 326,280 | Cloud Peak Energy, Inc.* | 1,151,768 | ||||
| 254,850 | Cooper Tire & Rubber Co. | 9,200,085 | ||||
| 179,445 | Dow Chemical Co. | 11,317,596 | ||||
| 80,395 | Ferro Corp.* | 1,470,425 | ||||
| 1,095,420 | Goodyear Tire & Rubber Co. | 38,295,883 | ||||
| 50,105 | Huntsman Corp. | 1,294,713 | ||||
| 279,655 | Innospec, Inc. | 18,331,385 | ||||
| 31,500 | International Paper Co. | 1,783,215 | ||||
| 18,870 | KMG Chemicals, Inc. | 918,403 | ||||
| 30,130 | Koppers Holdings, Inc.* | 1,089,199 | ||||
| 75,525 | Kronos Worldwide, Inc. | 1,376,066 | ||||
| 47,660 | Louisiana‐Pacific Corp.* | 1,149,083 | ||||
| 13,915 | LyondellBasell Industries NV, Class A | 1,174,287 | ||||
| 47,010 | Neenah Paper, Inc. | 3,772,553 | ||||
| 412,820 | Newmont Mining Corp. | 13,371,240 | ||||
| 20,505 | Nucor Corp. | 1,186,624 | ||||
| 61,850 | Orion Engineered Carbons SA | 1,233,908 | ||||
| 93,230 | Platform Specialty Products Corp.* | 1,182,156 | ||||
| 74,590 | Rayonier Advanced Materials, Inc. | 1,172,555 | ||||
| 115,050 | Ryerson Holding Corp.* | 1,138,995 | ||||
| 35,945 | Steel Dynamics, Inc. | 1,287,190 | ||||
| 18,150 | Trinseo SA | 1,246,905 | ||||
| 127,160 | Universal Forest Products, Inc. | 11,102,340 | ||||
| 86,000 | Westlake Chemical Corp. | 5,694,060 | ||||
| 205,680,836 | ||||||
| Consumer, Cyclical‐7.57% | ||||||
| 317,220 | Alaska Air Group, Inc. | 28,473,667 | ||||
| 20,700 | AMC Networks, Inc.* | 1,105,587 | ||||
| 158,300 | Arcos Dorados Holdings, Inc., Class A* | 1,179,335 | ||||
| 21,290 | Asbury Automotive Group, Inc.* | 1,203,949 | ||||
| 22,950 | Atlas Air Worldwide Holdings, Inc.* | 1,196,842 | ||||
| 81,510 | AV Homes, Inc.* | 1,634,275 | ||||
| 183,060 | Avianca Holdings SA, Sponsored ADR | 1,189,890 | ||||
| 615,710 | Best Buy Co., Inc. | 35,298,654 | ||||
| 79,420 | Big 5 Sporting Goods Corp. | 1,036,431 | ||||
| 375,395 | Big Lots, Inc. | 18,131,578 | ||||
| 81,795 | Builders FirstSource, Inc.* | 1,253,099 | ||||
| 32,890 | CalAtlantic Group, Inc. | 1,162,661 | ||||
| 21,060 | Carnival Corp. | 1,380,904 | ||||
| 16,163 | Cars.com, Inc.* | 430,421 | ||||
| 33,035 | Central Garden & Pet Co., Class A* | 991,711 | ||||
| 73,030 | Century Communities, Inc.* | 1,811,144 | ||||
| 11,215 | Children's Place, Inc. | 1,145,051 | ||||
| 60,060 | China Yuchai International, Ltd. | 1,093,693 | ||||
| 127,770 | Commercial Vehicle Group, Inc.* | 1,079,656 | ||||
| 197,840 | Container Store Group, Inc.* | 1,171,213 | ||||
| See Notes to Financial Statements. |
| Annual Report | June 30, 2017 | 11 |
| Schedule of Investments | James Balanced: Golden Rainbow Fund |
| June 30, 2017 |
| Shares or Principal Amount | Value | |||||
| Consumer, Cyclical (continued) | ||||||
| 10,710 | Copa Holdings SA, Class A | $ | 1,253,070 | |||
| 14,875 | Darden Restaurants, Inc. | 1,345,295 | ||||
| 42,085 | Discovery Communications, Inc., Class A* | 1,087,056 | ||||
| 43,080 | Discovery Communications, Inc., Class C* | 1,086,047 | ||||
| 15,620 | DISH Network Corp., Class A* | 980,311 | ||||
| 37,125 | DR Horton, Inc. | 1,283,411 | ||||
| 76,335 | Extended Stay America, Inc. | 1,477,846 | ||||
| 120,740 | Fiat Chrysler Automobiles NV* | 1,283,466 | ||||
| 42,520 | Flexsteel Industries, Inc. | 2,300,757 | ||||
| 190,000 | Foot Locker, Inc. | 9,363,200 | ||||
| 607,670 | Ford Motor Co. | 6,799,827 | ||||
| 56,490 | FTD Cos., Inc.* | 1,129,800 | ||||
| 36,360 | General Motors Co. | 1,270,055 | ||||
| 18,485 | Group 1 Automotive, Inc. | 1,170,470 | ||||
| 12,925 | Hasbro, Inc. | 1,441,267 | ||||
| 44,930 | Haverty Furniture Cos., Inc. | 1,127,743 | ||||
| 316,610 | Hawaiian Holdings, Inc.* | 14,864,839 | ||||
| 39,140 | Herman Miller, Inc. | 1,189,856 | ||||
| 58,680 | ILG, Inc. | 1,613,113 | ||||
| 30,140 | Insight Enterprises, Inc.* | 1,205,299 | ||||
| 52,240 | International Game Technology PLC | 955,992 | ||||
| 61,910 | KB Home | 1,483,983 | ||||
| 62,710 | Kimball International, Inc., Class B | 1,046,630 | ||||
| 144,595 | Lennar Corp., Class A | 7,709,805 | ||||
| 37,760 | Liberty Formula One, Class A* | 1,322,733 | ||||
| 23,760 | Liberty Ventures, Series A* | 1,242,410 | ||||
| 61,880 | M/I Homes, Inc.* | 1,766,674 | ||||
| 12,535 | Marriott Vacations Worldwide Corp. | 1,475,996 | ||||
| 41,510 | MDC Holdings, Inc. | 1,466,548 | ||||
| 19,375 | Meredith Corp. | 1,151,844 | ||||
| 122,690 | Meritage Homes Corp.* | 5,177,518 | ||||
| 51,570 | MSG Networks, Inc., Class A* | 1,157,747 | ||||
| 17,990 | Nexstar Media Group, Inc., Class A | 1,075,802 | ||||
| 253,350 | Office Depot, Inc. | 1,428,894 | ||||
| 45,340 | Patrick Industries, Inc.* | 3,303,019 | ||||
| 45,970 | PCM, Inc.* | 861,938 | ||||
| 66,675 | Penn National Gaming, Inc.* | 1,426,845 | ||||
| 52,610 | PulteGroup, Inc. | 1,290,523 | ||||
| 30,765 | Sinclair Broadcast Group, Inc., Class A | 1,012,169 | ||||
| 39,290 | SkyWest, Inc. | 1,379,079 | ||||
| 577,710 | Southwest Airlines Co. | 35,898,899 | ||||
| 48,490 | TEGNA, Inc. | 698,741 | ||||
| 13,535 | Thor Industries, Inc. | 1,414,678 | ||||
| 115,150 | Tilly's, Inc., Class A | 1,168,773 | ||||
| 50,000 | Time Warner, Inc. | 5,020,500 | ||||
| 34,800 | Toll Brothers, Inc. | 1,374,948 | ||||
| 40,540 | Twenty‐First Century Fox, Inc., Class B | 1,129,850 | ||||
| 17,625 | United Continental Holdings, Inc.* | 1,326,281 | ||||
| 27,315 | Viacom, Inc., Class B | 916,965 | ||||
| 127,135 | Wabash National Corp. | 2,794,427 | ||||
| 149,005 | Wal‐Mart Stores, Inc. | 11,276,698 | ||||
| 11,800 | Wyndham Worldwide Corp. | 1,184,838 | ||||
| 257,184,236 | ||||||
| See Notes to Financial Statements. |
| 12 | www.jamesfunds.com |
| James Balanced: Golden Rainbow Fund | Schedule of Investments |
| June 30, 2017 |
| Shares or Principal Amount | Value | |||||
| Consumer, Non‐cyclical‐4.67% | ||||||
| 34,390 | Adtalem Global Education, Inc. | $ | 1,305,100 | |||
| 78,625 | Anthem, Inc. | 14,791,721 | ||||
| 22,950 | Brink's Co. | 1,537,650 | ||||
| 93,310 | Brookdale Senior Living, Inc.* | 1,372,590 | ||||
| 194,044 | DST Systems, Inc. | 11,972,515 | ||||
| 14,470 | Eagle Pharmaceuticals, Inc.* | 1,141,538 | ||||
| 18,635 | Express Scripts Holding Co.* | 1,189,658 | ||||
| 20,770 | Fresh Del Monte Produce, Inc. | 1,057,401 | ||||
| 122,150 | Grand Canyon Education, Inc.* | 9,577,781 | ||||
| 14,045 | HCA Healthcare, Inc.* | 1,224,724 | ||||
| 100,000 | Ingles Markets, Inc., Class A | 3,330,000 | ||||
| 35,895 | John B Sanfilippo & Son, Inc. | 2,265,333 | ||||
| 46,390 | Kelly Services, Inc., Class A | 1,041,455 | ||||
| 66,070 | Lantheus Holdings, Inc.* | 1,166,136 | ||||
| 180,358 | ManpowerGroup, Inc. | 20,136,971 | ||||
| 20,560 | Medifast, Inc. | 852,623 | ||||
| 85,000 | Merck & Co., Inc. | 5,447,650 | ||||
| 65,000 | Mylan NV* | 2,523,300 | ||||
| 142,360 | Natural Health Trends Corp. | 3,964,726 | ||||
| 116,870 | Omega Protein Corp. | 2,091,973 | ||||
| 700,000 | Pfizer, Inc. | 23,513,000 | ||||
| 113,069 | Sanderson Farms, Inc. | 13,076,430 | ||||
| 380 | Seaboard Corp. | 1,518,100 | ||||
| 385,000 | Toro Co. | 26,676,650 | ||||
| 45,050 | TrueBlue, Inc.* | 1,193,825 | ||||
| 19,825 | Tupperware Brands Corp. | 1,392,310 | ||||
| 19,770 | Tyson Foods, Inc., Class A | 1,238,195 | ||||
| 20,630 | Weis Markets, Inc. | 1,005,094 | ||||
| 157,604,449 | ||||||
| Energy‐1.09% | ||||||
| 196,705 | Chesapeake Energy Corp.* | 977,624 | ||||
| 140,435 | Cosan, Ltd., Class A | 900,188 | ||||
| 92,540 | FutureFuel Corp. | 1,396,429 | ||||
| 2,005,900 | McDermott International, Inc.* | 14,382,303 | ||||
| 11,040 | REX American Resources Corp.* | 1,066,022 | ||||
| 88,890 | Star Gas Partners LP | 963,568 | ||||
| 174,950 | Tesoro Corp. | 16,375,320 | ||||
| 80,500 | Transocean, Ltd.* | 662,515 | ||||
| 36,723,969 | ||||||
| Financial‐10.14% | ||||||
| 40,795 | Aaron's, Inc. | 1,586,925 | ||||
| 28,190 | AerCap Holdings NV* | 1,308,862 | ||||
| 61,100 | AGNC Investment Corp., REIT | 1,300,819 | ||||
| 33,475 | Air Lease Corp. | 1,250,626 | ||||
| 53,755 | Aircastle, Ltd. | 1,169,171 | ||||
| 63,055 | Ally Financial, Inc. | 1,317,849 | ||||
| 129,448 | American Financial Group, Inc. | 12,863,248 | ||||
| 609,372 | Annaly Capital Management, Inc., REIT | 7,342,933 | ||||
| 186,295 | Apollo Investment Corp. | 1,190,425 | ||||
| 66,675 | Ares Management LP | 1,200,150 | ||||
| 200,000 | Argo Group International Holdings, Ltd. | 12,120,000 | ||||
| 180,920 | Ashford Hospitality Trust, Inc., REIT | 1,099,994 | ||||
| See Notes to Financial Statements. |
| Annual Report | June 30, 2017 | 13 |
| Schedule of Investments | James Balanced: Golden Rainbow Fund |
| June 30, 2017 |
| Shares or Principal Amount | Value | |||||
| Financial (continued) | ||||||
| 32,380 | Assured Guaranty, Ltd. | $ | 1,351,541 | |||
| 72,140 | B. Riley Financial, Inc. | 1,338,197 | ||||
| 53,280 | Bank of America Corp. | 1,292,573 | ||||
| 109,000 | Bank of Montreal | 8,004,960 | ||||
| 112,200 | BGC Partners, Inc., Class A | 1,418,208 | ||||
| 37,725 | CBRE Group, Inc., Class A* | 1,373,190 | ||||
| 833,101 | Chimera Investment Corp., REIT | 15,520,672 | ||||
| 28,350 | CNA Financial Corp. | 1,382,062 | ||||
| 38,530 | CoreCivic, Inc., REIT | 1,062,657 | ||||
| 39,230 | CorEnergy Infrastructure Trust, Inc., REIT | 1,317,736 | ||||
| 7,720 | Credicorp, Ltd. | 1,384,891 | ||||
| 6,520 | Credit Acceptance Corp.* | 1,676,553 | ||||
| 151,110 | CYS Investments, Inc., REIT | 1,270,835 | ||||
| 80,320 | Enova International, Inc.* | 1,192,752 | ||||
| 6,625 | Enstar Group, Ltd.* | 1,316,056 | ||||
| 64,050 | ePlus, Inc.* | 4,746,105 | ||||
| 33,905 | Essent Group, Ltd.* | 1,259,232 | ||||
| 16,285 | Evercore Partners, Inc., Class A | 1,148,092 | ||||
| 5,365 | Everest Re Group, Ltd. | 1,365,875 | ||||
| 123,300 | EZCORP, Inc., Class A* | 949,410 | ||||
| 882,250 | Fifth Third Bancorp | 22,903,210 | ||||
| 219,865 | First BanCorp* | 1,273,018 | ||||
| 32,070 | FNF Group | 1,437,698 | ||||
| 96,700 | Forestar Group, Inc.* | 1,658,405 | ||||
| 107,650 | Franklin Resources, Inc. | 4,821,643 | ||||
| 39,277 | GEO Group, Inc., REIT | 1,161,421 | ||||
| 5,470 | Goldman Sachs Group, Inc. | 1,213,793 | ||||
| 37,990 | Green Dot Corp., Class A* | 1,463,755 | ||||
| 82,150 | Hercules Capital, Inc. | 1,087,666 | ||||
| 38,050 | Hospitality Properties Trust, REIT | 1,109,157 | ||||
| 66,650 | Host Hotels & Resorts, Inc., REIT | 1,217,695 | ||||
| 36,590 | Houlihan Lokey, Inc. | 1,276,991 | ||||
| 35,555 | International Bancshares Corp. | 1,246,203 | ||||
| 48,910 | Jernigan Capital, Inc., REIT | 1,076,020 | ||||
| 518,825 | JPMorgan Chase & Co. | 47,420,605 | ||||
| 982,600 | KeyCorp | 18,413,924 | ||||
| 66,600 | LGI Homes, Inc.* | 2,675,988 | ||||
| 18,960 | Lincoln National Corp. | 1,281,317 | ||||
| 26,160 | Loews Corp. | 1,224,550 | ||||
| 59,070 | Maui Land & Pineapple Co., Inc.* | 1,199,121 | ||||
| 122,655 | MGIC Investment Corp.* | 1,373,736 | ||||
| 29,655 | Morgan Stanley | 1,321,427 | ||||
| 20,310 | MutualFirst Financial, Inc. | 725,067 | ||||
| 78,055 | Nationstar Mortgage Holdings, Inc.* | 1,396,404 | ||||
| 377,630 | Nelnet, Inc., Class A | 17,752,386 | ||||
| 71,845 | New Residential Investment Corp., REIT | 1,117,908 | ||||
| 62,070 | Old Republic International Corp. | 1,212,227 | ||||
| 47,150 | Outfront Media, Inc., REIT | 1,090,108 | ||||
| 55,920 | People's Utah Bancorp | 1,498,656 | ||||
| 17,880 | Piper Jaffray Cos. | 1,071,906 | ||||
| 144,825 | Principal Financial Group, Inc. | 9,278,938 | ||||
| 11,760 | Prudential Financial, Inc. | 1,271,726 | ||||
| 69,055 | Radian Group, Inc. | 1,129,049 | ||||
| 74,175 | Redwood Trust, Inc., REIT | 1,263,942 | ||||
| See Notes to Financial Statements. |
| 14 | www.jamesfunds.com |
| James Balanced: Golden Rainbow Fund | Schedule of Investments |
| June 30, 2017 |
| Shares or Principal Amount | Value | |||||
| Financial (continued) | ||||||
| 53,200 | RLJ Lodging Trust, REIT | $ | 1,057,084 | |||
| 78,170 | Summit Hotel Properties, Inc., REIT | 1,457,871 | ||||
| 233,270 | Torchmark Corp. | 17,845,155 | ||||
| 60,120 | TPG Specialty Lending, Inc. | 1,229,454 | ||||
| 334,224 | Travelers Cos., Inc. | 42,289,363 | ||||
| 44,705 | Triton International, Ltd. | 1,494,935 | ||||
| 127,500 | Two Harbors Investment Corp., REIT | 1,263,525 | ||||
| 501,760 | Unum Group | 23,397,069 | ||||
| 29,310 | Walker & Dunlop, Inc.* | 1,431,207 | ||||
| 3,531 | World Acceptance Corp.* | 264,507 | ||||
| 342,518,429 | ||||||
| Industrial‐5.60% | ||||||
| 110,560 | Advanced Emissions Solutions, Inc. | 1,012,730 | ||||
| 50,000 | AGCO Corp. | 3,369,500 | ||||
| 413,190 | American Axle & Manufacturing Holdings, Inc.* | 6,445,764 | ||||
| 135,075 | American Outdoor Brands Corp.* | 2,993,262 | ||||
| 80,370 | Argan, Inc. | 4,822,200 | ||||
| 53,560 | CAI International, Inc.* | 1,264,016 | ||||
| 72,130 | Casella Waste Systems, Inc., Class A* | 1,183,653 | ||||
| 69,050 | Ceco Environmental Corp. | 633,879 | ||||
| 12,185 | Cooper‐standard Holding, Inc.* | 1,229,101 | ||||
| 146,090 | Costamare, Inc. | 1,067,918 | ||||
| 8,265 | Cummins, Inc. | 1,340,748 | ||||
| 68,155 | Dana, Inc. | 1,521,901 | ||||
| 182,500 | Deere & Co. | 22,555,175 | ||||
| 16,595 | Delphi Automotive PLC | 1,454,552 | ||||
| 233,835 | DHT Holdings, Inc. | 970,415 | ||||
| 13,075 | Dycom Industries, Inc.* | 1,170,474 | ||||
| 52,400 | FedEx Corp. | 11,388,092 | ||||
| 19,940 | GATX Corp. | 1,281,544 | ||||
| 177,000 | Global Brass & Copper Holdings, Inc. | 5,407,350 | ||||
| 25,480 | Greenbrier Cos., Inc. | 1,178,450 | ||||
| 17,600 | Hill‐Rom Holdings, Inc. | 1,401,136 | ||||
| 13,305 | LCI Industries | 1,362,432 | ||||
| 9,300 | Lear Corp. | 1,321,344 | ||||
| 865,890 | Magna International, Inc. | 40,116,684 | ||||
| 30,730 | MasTec, Inc.* | 1,387,460 | ||||
| 73,855 | Meritor, Inc.* | 1,226,732 | ||||
| 28,260 | Methode Electronics, Inc. | 1,164,312 | ||||
| 66,730 | Milacron Holdings Corp.* | 1,173,781 | ||||
| 15,030 | NACCO Industries, Inc., Class A | 1,064,876 | ||||
| 36,820 | NN, Inc. | 1,010,709 | ||||
| 17,785 | Oshkosh Corp. | 1,225,031 | ||||
| 20,540 | Owens Corning | 1,374,537 | ||||
| 60,430 | Owens‐Illinois, Inc.* | 1,445,486 | ||||
| 28,690 | Park‐Ohio Holdings Corp. | 1,093,089 | ||||
| 50,590 | Quad/Graphics, Inc. | 1,159,523 | ||||
| 216,910 | Sonoco Products Co. | 11,153,512 | ||||
| 64,970 | Stoneridge, Inc.* | 1,001,188 | ||||
| 19,280 | Sturm Ruger & Co., Inc. | 1,198,252 | ||||
| 21,185 | Tenneco, Inc. | 1,225,129 | ||||
| 56,550 | Tower International, Inc. | 1,269,548 | ||||
| 45,730 | Trinity Industries, Inc. | 1,281,812 | ||||
| See Notes to Financial Statements. |
| Annual Report | June 30, 2017 | 15 |
| Schedule of Investments | James Balanced: Golden Rainbow Fund |
| Shares or Principal Amount | Value | |||||
| Industrial (continued) | ||||||
| 37,840 | Tutor Perini Corp.* | $ | 1,087,900 | |||
| 309,085 | United Rentals, Inc.* | 34,836,970 | ||||
| 54,900 | Vectrus, Inc.* | 1,774,368 | ||||
| 13,075 | Visteon Corp.* | 1,334,435 | ||||
| 26,230 | XPO Logistics, Inc.* | 1,695,245 | ||||
| 13,385 | Zebra Technologies Corp., Class A* | 1,345,460 | ||||
| 189,021,675 | ||||||
| Technology-8.63% | ||||||
| 743,437 | ACCO Brands Corp.* | 8,661,041 | ||||
| 18,635 | Advanced Energy Industries, Inc.* | 1,205,498 | ||||
| 54,390 | Alpha & Omega Semiconductor, Ltd.* | 906,681 | ||||
| 74,235 | Amaya, Inc.* | 1,328,806 | ||||
| 106,925 | Amkor Technology, Inc.* | 1,044,657 | ||||
| 15,450 | Analog Devices, Inc. | 1,202,010 | ||||
| 15,740 | Anixter International, Inc.* | 1,230,868 | ||||
| 31,860 | Applied Materials, Inc. | 1,316,137 | ||||
| 316,400 | Arrow Electronics, Inc.* | 24,812,088 | ||||
| 27,625 | Avnet, Inc. | 1,074,060 | ||||
| 36,700 | Broadcom, Ltd. | 8,552,935 | ||||
| 57,175 | Brooks Automation, Inc. | 1,240,126 | ||||
| 81,585 | Cabot Microelectronics Corp. | 6,023,421 | ||||
| 21,290 | CDW Corp. | 1,331,264 | ||||
| 19,075 | Cirrus Logic, Inc.* | 1,196,384 | ||||
| 363,070 | Cisco Systems, Inc. | 11,364,091 | ||||
| 30,095 | CommScope Holding Co., Inc.* | 1,144,513 | ||||
| 487,810 | Corning, Inc. | 14,658,690 | ||||
| 711,500 | Deluxe Corp. | 49,250,030 | ||||
| 44,890 | Ducommun, Inc.* | 1,417,626 | ||||
| 99,930 | Eastman Kodak Co.* | 909,363 | ||||
| 175,000 | Ebix, Inc. | 9,432,500 | ||||
| 15,970 | EnerSys | 1,157,026 | ||||
| 19,180 | Engility Holdings, Inc.* | 544,712 | ||||
| 52,840 | Entegris, Inc.* | 1,159,838 | ||||
| 195,330 | Extreme Networks, Inc.* | 1,800,943 | ||||
| 46,040 | First Solar, Inc.* | 1,836,075 | ||||
| 70,500 | HP, Inc. | 1,232,340 | ||||
| 37,110 | II‐VI, Inc.* | 1,272,873 | ||||
| 461,500 | Intel Corp. | 15,571,010 | ||||
| 14,270 | InterDigital, Inc. | 1,103,071 | ||||
| 47,120 | International Business Machines Corp. | 7,248,470 | ||||
| 137,120 | Iridium Communications, Inc.* | 1,515,176 | ||||
| 15,130 | j2 Global, Inc. | 1,287,412 | ||||
| 42,915 | Jabil, Inc. | 1,252,689 | ||||
| 72,130 | KEMET Corp.* | 923,264 | ||||
| 65,685 | Knowles Corp.* | 1,111,390 | ||||
| 62,765 | Kulicke & Soffa Industries, Inc.* | 1,193,790 | ||||
| 35,325 | Liberty Global PLC, Class C* | 1,101,434 | ||||
| 89,930 | Lockheed Martin Corp. | 24,965,467 | ||||
| 39,210 | Logitech International SA | 1,437,439 | ||||
| 81,460 | Marvell Technology Group, Ltd. | 1,345,719 | ||||
| 43,170 | Micron Technology, Inc.* | 1,289,056 | ||||
| 18,370 | MKS Instruments, Inc. | 1,236,301 | ||||
| 18,565 | Moog, Inc., Class A* | 1,331,482 | ||||
| 16 | www.jamesfunds.com |
| James Balanced: Golden Rainbow Fund | Schedule of Investments |
| Shares or Principal Amount | Value | |||||
| Technology (continued) | ||||||
| 14,790 | Motorola Solutions, Inc. | $ | 1,282,885 | |||
| 22,680 | Nanometrics, Inc.* | 573,577 | ||||
| 27,925 | NCR Corp.* | 1,140,457 | ||||
| 30,140 | NetApp, Inc. | 1,207,107 | ||||
| 17,500 | Northrop Grumman Corp. | 4,492,425 | ||||
| 81,045 | ON Semiconductor Corp.* | 1,137,872 | ||||
| 301,625 | Orbotech, Ltd.* | 9,839,008 | ||||
| 85,720 | PC Connection, Inc. | 2,319,583 | ||||
| 21,520 | Plexus Corp.* | 1,131,306 | ||||
| 17,300 | Qorvo, Inc.* | 1,095,436 | ||||
| 30,880 | Sanmina Corp.* | 1,176,528 | ||||
| 26,820 | Seagate Technology PLC | 1,039,275 | ||||
| 261,550 | SYNNEX Corp. | 31,375,538 | ||||
| 16,920 | TE Connectivity, Ltd. | 1,331,266 | ||||
| 13,675 | Tech Data Corp.* | 1,381,175 | ||||
| 40,875 | Teradata Corp.* | 1,205,404 | ||||
| 38,610 | Teradyne, Inc. | 1,159,458 | ||||
| 54,925 | Tower Semiconductor, Ltd.* | 1,309,961 | ||||
| 75,160 | TTM Technologies, Inc.* | 1,304,778 | ||||
| 70,120 | Unisys Corp.* | 897,536 | ||||
| 121,340 | Viavi Solutions, Inc.* | 1,277,710 | ||||
| 14,735 | Western Digital Corp. | 1,305,521 | ||||
| 291,203,572 | ||||||
| Utilities-2.82% | ||||||
| 225,520 | American Electric Power Co., Inc. | 15,666,874 | ||||
| 943,700 | AT&T, Inc. | 35,605,801 | ||||
| 314,850 | CenterPoint Energy, Inc. | 8,620,593 | ||||
| 79,620 | DTE Energy Co. | 8,423,000 | ||||
| 16,190 | Entergy Corp. | 1,242,906 | ||||
| 60,940 | IDT Corp., Class B | 875,708 | ||||
| 20,345 | National Fuel Gas Co. | 1,136,065 | ||||
| 18,335 | PG&E Corp. | 1,216,894 | ||||
| 97,210 | Pinnacle West Capital Corp. | 8,278,404 | ||||
| 78,220 | PNM Resources, Inc. | 2,991,915 | ||||
| 240,510 | UGI Corp. | 11,643,089 | ||||
| 95,701,249 | ||||||
TOTAL COMMON STOCKS (Cost $1,185,378,801) | 1,575,638,415 | |||||
EXCHANGE TRADED FUNDS-0.74% | ||||||
| 107,910 | iShares® MSCI All Peru Capped ETF | 3,654,912 | ||||
| 109,760 | iShares® MSCI Canada ETF | 2,937,178 | ||||
| 94,410 | iShares® MSCI Chile Capped ETF | 3,934,065 | ||||
| 30,590 | iShares® MSCI Philippines ETF | 1,096,040 | ||||
| 7,000 | iShares® National AMT-Free Municipal Bond ETF | 770,840 | ||||
| 454,760 | iShares® Silver Trust ETF* | 7,144,280 | ||||
| 44,610 | SPDR® Gold Shares ETF* | 5,264,872 | ||||
TOTAL EXCHANGE TRADED FUNDS (Cost $21,876,687) | 24,802,187 | |||||
| Annual Report | June 30, 2017 | 17 |
| Schedule of Investments | James Balanced: Golden Rainbow Fund |
| Shares or Principal Amount | Value | ||||||
| CORPORATE BONDS-10.62 % | |||||||
| Basic Materials-0.05% | |||||||
| $ | 1,500,000 | E.I. du Pont de Nemours & Co., 5.750%, 3/15/19 | $ | 1,594,348 | |||
| Communications-0.25% | |||||||
| 8,000,000 | Alphabet, Inc., 3.625%, 5/19/21 | 8,468,016 | |||||
| Consumer, Cyclical-0.60% | |||||||
| 5,000,000 | eBay, Inc., 2.600%, 7/15/22 | 4,955,425 | |||||
| 5,000,000 | Home Depot, Inc., 2.700%, 4/1/23 | 5,072,195 | |||||
| 5,000,000 | Home Depot, Inc., 5.950%, 4/1/41 | 6,618,960 | |||||
| 785,000 | McDonald's Corp., 5.700%, 2/1/39 | 947,353 | |||||
| 2,000,000 | Wal-Mart Stores, Inc., 5.250%, 9/1/35 | 2,441,982 | |||||
| 20,035,915 | |||||||
| Consumer, Non-cyclical-1.40% | |||||||
| 10,000,000 | Coca-Cola Co., 3.200%, 11/1/23 | 10,375,620 | |||||
| 1,950,000 | Dr Pepper Snapple Group, Inc., 2.530%, 11/15/21 | 1,948,844 | |||||
| 3,000,000 | Hershey Co., 4.125%, 12/1/20 | 3,204,267 | |||||
| 5,475,000 | Johnson & Johnson, 4.500%, 9/1/40 | 6,256,020 | |||||
| 5,000,000 | Merck & Co., Inc., 2.800%, 5/18/23 | 5,094,085 | |||||
| 10,000,000 | Merck & Co., Inc., 4.150%, 5/18/43 | 10,670,750 | |||||
| 10,000,000 | PepsiCo, Inc., 5.000%, 6/1/18 | 10,322,820 | |||||
| 47,872,406 | |||||||
| Energy-1.34% | |||||||
| 5,000,000 | Apache Corp., 3.250%, 4/15/22 | 5,072,355 | |||||
| 5,000,000 | BP Capital Markets PLC, 3.245%, 5/6/22 | 5,142,845 | |||||
| 8,271,000 | Chevron Corp., 3.326%, 11/17/25 | 8,477,626 | |||||
| 2,000,000 | Phillips 66, 4.300%, 4/1/22 | 2,142,852 | |||||
| 5,050,000 | Shell International Finance BV, 2.375%, 8/21/22 | 5,020,296 | |||||
| 5,000,000 | Shell International Finance BV, 6.375%, 12/15/38 | 6,660,580 | |||||
| 2,625,000 | Shell International Finance BV, 4.375%, 5/11/45 | 2,751,108 | |||||
| 10,000,000 | Statoil ASA, 2.250%, 11/8/19 | 10,063,460 | |||||
| 45,331,122 | |||||||
| Financial-3.56% | |||||||
| 8,000,000 | Aflac, Inc., 3.625%, 11/15/24 | 8,378,352 | |||||
| 3,000,000 | American Express Credit Corp., 2.125%, 7/27/18 | 3,011,955 | |||||
| 5,250,000 | American Express Credit Corp., 2.600%, 9/14/20 | 5,320,975 | |||||
| 5,000,000 | Australia & New Zealand Banking Group, Ltd., 2.625%, 5/19/22 | 5,005,800 | |||||
| 8,100,000 | Berkshire Hathaway, Inc., 3.750%, 8/15/21 | 8,622,369 | |||||
| 10,000,000 | GE Capital International Funding Co. Unlimited Co., 2.342%, 11/15/20 | 10,079,070 | |||||
| 10,000,000 | Goldman Sachs Group, Inc., 2.600%, 4/23/20 | 10,092,140 | |||||
| 10,000,000 | HSBC Holdings PLC, 4.000%, 3/30/22 | 10,545,840 | |||||
| 11,000,000 | JPMorgan Chase & Co., 4.250%, 10/15/20 | 11,679,734 | |||||
| 5,000,000 | National Australia Bank, Ltd., 2.500%, 5/22/22 | 4,971,045 | |||||
| 5,000,000 | National Rural Utilities Cooperative Finance Corp., 2.450%, 6/15/22 | 4,954,240 | |||||
| 15,956,000 | PNC Bank NA, 1.950%, 3/4/19 | 15,985,487 | |||||
| 6,000,000 | PNC Bank NA, 2.950%, 2/23/25 | 5,986,134 | |||||
| 5,000,000 | UBS AG, 5.875%, 12/20/17 | 5,101,695 | |||||
| 5,305,000 | US Bank NA Cincinnati, 1.473%, 1/24/20(a) | 5,323,928 | |||||
| 5,000,000 | Wells Fargo & Co., 2.500%, 3/4/21 | 5,016,855 | |||||
| 120,075,619 | |||||||
| Industrial-0.80% | |||||||
| 1,000,000 | Caterpillar, Inc., 7.900%, 12/15/18 | 1,087,867 | �� | ||||
| 1,000,000 | Caterpillar, Inc., 8.250%, 12/15/38 | 1,622,520 | |||||
| 18 | www.jamesfunds.com |
| James Balanced: Golden Rainbow Fund | Schedule of Investments |
| Shares or Principal Amount | Value | ||||||
| Industrial (continued) | |||||||
| $ | 10,000,000 | General Electric Co., 1.958%, 4/15/20(a) | $ | 10,176,560 | |||
| 1,000,000 | General Electric Co., 2.700%, 10/9/22 | 1,017,009 | |||||
| 2,000,000 | General Electric Co., 6.875%, 1/10/39 | 2,902,368 | |||||
| 5,000,000 | United Parcel Service, Inc., 2.350%, 5/16/22 | 5,023,225 | |||||
| 5,000,000 | United Technologies Corp., 3.100%, 6/1/22 | 5,165,965 | |||||
| 26,995,514 | |||||||
| Technology-2.30% | |||||||
| 3,419,000 | Apple, Inc., 1.550%, 2/7/20 | 3,401,936 | |||||
| 10,000,000 | Apple, Inc., 1.379%, 2/7/20(a) | 10,024,370 | |||||
| 5,000,000 | Intel Corp., 3.300%, 10/1/21 | 5,227,715 | |||||
| 5,000,000 | Intel Corp., 2.875%, 5/11/24 | 5,017,640 | |||||
| 7,000,000 | International Business Machines Corp., 1.875%, 8/1/22 | 6,822,998 | |||||
| 9,000,000 | Microsoft Corp., 1.850%, 2/6/20 | 9,022,320 | |||||
| 3,700,000 | Microsoft Corp., 5.200%, 6/1/39 | 4,501,738 | |||||
| 10,000,000 | Microsoft Corp., 3.500%, 11/15/42 | 9,859,000 | |||||
| 7,266,000 | Oracle Corp., 2.500%, 10/15/22 | 7,304,284 | |||||
| 6,000,000 | Oracle Corp., 2.400%, 9/15/23 | 5,921,292 | |||||
| 10,000,000 | QUALCOMM, Inc., 4.650%, 5/20/35 | 10,909,430 | |||||
| 78,012,723 | |||||||
| Utilities-0.32% | |||||||
| 5,000,000 | Duke Energy Florida LLC, 5.800%, 9/15/17 | 5,042,055 | |||||
| 1,000,000 | Georgia Power Co., 5.400%, 6/1/18 | 1,033,136 | |||||
| 4,600,000 | San Diego Gas & Electric Co., 3.000%, 8/15/21 | 4,731,633 | |||||
| 10,806,824 | |||||||
| TOTAL CORPORATE BONDS (Cost $354,148,133) | 359,192,487 | ||||||
| Shares or Principal Amount | Value | ||||||
| MUNICIPAL BONDS-6.01% | |||||||
| Connecticut-0.18% | |||||||
| 5,350,000 | State of Connecticut, Series D, 5.000%, 11/1/25 | 6,058,287 | |||||
| Florida-0.41% | |||||||
| 10,775,000 | Florida State Board of Education Capital Outlay General Obligation Bonds, Series C, 5.000%, 6/1/23 | 12,857,269 | |||||
| 1,000,000 | Florida State Board of Education Capital Outlay General Obligation Bonds, Series D, 5.000%, 6/1/38 | 1,045,570 | |||||
| 13,902,839 | |||||||
| Georgia-0.27% | |||||||
| 3,000,000 | State of Georgia General Obligation Unlimited Bonds, Series B, 4.500%, 1/1/29 | 3,120,510 | |||||
| 5,000,000 | State of Georgia General Obligation Unlimited Bonds, Series D, 5.000%, 2/1/25 | 5,961,150 | |||||
| 9,081,660 | |||||||
| Hawaii-0.31% | |||||||
| 9,000,000 | City and County of Honolulu General Obligation Unlimited Bonds, Series B, 5.000%, 11/1/25 | 10,554,210 | |||||
| Illinois-0.03% | |||||||
| 1,000,000 | Village of Bolingbrook General Obligation Unlimited Bonds, 5.000%, 1/1/37 | 1,012,050 | |||||
| Maryland-0.15% | |||||||
| 5,000,000 | County of Montgomery General Obligation Unlimited Bonds, Series A, 3.000%, 11/1/29 | 5,071,050 | |||||
| Annual Report | June 30, 2017 | 19 |
| Schedule of Investments | James Balanced: Golden Rainbow Fund |
June 30, 2017
| Shares or Principal Amount | Value | |||||||
| Massachusetts-0.03% | ||||||||
| $ | 1,000,000 | Commonwealth of Massachusetts General Obligation Limited Bonds, Series C, Prefunded 8/1/17 @ 100, 5.250%, 8/1/22(b) | $ | 1,003,020 | ||||
| Ohio-1.90% | ||||||||
| 7,450,000 | Beavercreek City School District General Obligation Unlimited Bonds, 3.250%, 12/1/36 | 7,386,228 | ||||||
| 6,395,000 | City of Cincinnati General Obligation Unlimited Bonds, Series A,, 3.000%, 12/1/27 | 6,643,510 | ||||||
| 5,450,000 | City of Columbus General Obligation Various Purpose Limited Tax Bonds, Series B, 3.250%, 8/15/24 | 5,885,455 | ||||||
| 5,000,000 | County of Cuyahoga General Obligation Limited (Capital Improvement), Series A, 4.000%, 12/1/37 | 5,150,700 | ||||||
| 2,580,000 | County of Trumbull OH General Obligation Limited Notes, Series B, 2.000%, 8/31/17 | 2,582,967 | ||||||
| Greenville City School District General Obligation Unlimited Bonds (School Improvement): | ||||||||
| 5,000,000 | 5.000%, 1/1/46 | 5,590,400 | ||||||
| 11,000,000 | 5.500%, 1/1/51 | 12,204,720 | ||||||
| 1,100,000 | Miamisburg City School District General Obligation Unlimited Bonds (School Facilities Construction & Improvement), Prerefunded 12/1/18 @ 100, 5.000%, 12/1/33(b) | 1,160,654 | ||||||
| 500,000 | Mount Healthy City School District General Obligation Unlimited Bonds (School Improvement), Prefunded 6/1/18 @ 100, 5.000%, 12/1/26(b) | 517,880 | ||||||
| 1,000,000 | Ohio State University General Recipients Revenue Bonds, Series C, 4.910%, 6/1/40 | 1,195,630 | ||||||
| 105,000 | Ohio State University Revenue Bonds, Series A, Prefunded 12/1/18 @ 100, 5.000%, 12/1/28(b) | 110,790 | ||||||
| 500,000 | Springboro Community City School District General Obligation Unlimited Bonds, 5.250%, 12/1/23 | 588,050 | ||||||
| State of Ohio General Obligation Unlimited Bonds, Series A, Prefunded 3/1/18 @ 100: | ||||||||
| 365,000 | 5.375%, 9/1/28(b) | 375,384 | ||||||
| 635,000 | 5.375%, 9/1/28(b) | 653,275 | ||||||
| 3,475,000 | State of Ohio General Obligation Unlimited Bonds, Series C, 5.000%, 9/1/19 | 3,760,958 | ||||||
| 6,900,000 | State of Ohio General Obligation Unlimited Bonds, Series S, 5.000%, 5/1/28 | 8,397,714 | ||||||
| 790,000 | The Ohio State University Revenue Bonds, Series A, Prefunded 12/01/18 @100, 5.000%, 12/1/28(b) | 833,560 | ||||||
| 105,000 | The Ohio State University Revenue Bonds, Series A, Unrefunded, 5.000%, 12/1/28 | 110,684 | ||||||
| 1,000,000 | Wright State University Revenue Bonds, 4.000%, 5/1/18 | 1,019,860 | ||||||
| 64,168,419 | ||||||||
| Pennsylvania-1.36% | ||||||||
| Commonwealth of Pennsylvania General Obligation Unlimited Bonds, First Series: | ||||||||
| 20,000,000 | 5.000%, 6/1/24 | 23,051,000 | ||||||
| 12,005,000 | 5.000%, 3/15/25 | 14,380,669 | ||||||
| 7,050,000 | 5.000%, 9/15/26 | 8,605,653 | ||||||
| 46,037,322 | ||||||||
| Tennessee-0.17% | ||||||||
| 5,000,000 | Metropolitan Government of Nashville & Davidson County TN General Obligation Unlimited Bonds, Series C, 4.000%, 7/1/24 | 5,736,750 | ||||||
| Texas-0.69% | ||||||||
| 1,000,000 | Friendswood Independent School District General Obligation Unlimited Bonds (Schoolhouse), Prefunded 2/15/18 @ 100, 5.000%, 2/15/37(b) | 1,024,620 | ||||||
| 5,000,000 | Houston Texas Independent School District General Obligation Limited Bonds, Series A, 5.000%, 2/15/28 | 6,096,750 | ||||||
| 5,335,000 | Port of Houston Authority General Obligation Unlimited Bonds, Series D-1, 5.000%, 10/1/35 | 5,918,329 | ||||||
| 7,620,000 | Referendum Transportation Community Mobility General Obligation Unlimited Bonds, Series A, 5.000%, 10/1/25 | 9,432,493 | ||||||
| Tyler Independent School District General Obligation Unlimited Bonds, Prefunded 2/15/18 @ 100: | ||||||||
| 475,000 | 5.000%, 2/15/34(b) | 486,547 | ||||||
| 290,000 | 5.000%, 2/15/34(b) | 297,050 | ||||||
| 235,000 | Tyler Independent School District General Obligation Unlimited Bonds, Unrefunded 2016, 5.000%, 2/15/34 | 240,631 | ||||||
| 23,496,420 | ||||||||
See Notes to Financial Statements.
| 20 | www.jamesfunds.com |
| James Balanced: Golden Rainbow Fund | Schedule of Investments |
June 30, 2017
| Shares or Principal Amount | Value | |||||||
| Washington-0.34% | ||||||||
| $ | 5,000,000 | State of Washington General Obligation Unlimited Bonds, Series D, 4.000%, 2/1/37 | $ | 5,249,000 | ||||
| 5,845,000 | State of Washington General Obligation Various Purpose Unlimited Bonds, Series D, 5.000%, 2/1/20 | 6,406,821 | ||||||
| 11,655,821 | ||||||||
| Wisconsin-0.17% | ||||||||
| 5,000,000 | State of Wisconsin General Obligation Unlimited Bonds, Series C, Prefunded 5/1/21 @ 100, 5.000%, 5/1/25(b) | 5,681,050 | ||||||
| TOTAL MUNICIPAL BONDS (Cost $199,277,766) | 203,458,898 | |||||||
| Shares or Principal Amount | Value | |||||||
| U.S. GOVERNMENT AGENCIES-6.45% | ||||||||
| Federal Agricultural Mortgage Corporation-0.29% | ||||||||
| $ | 10,000,000 | 1.379%, 1/3/22(a) | 10,012,320 | |||||
| Federal Farm Credit Banks-1.64% | ||||||||
| 10,000,000 | 1.170%, 5/16/19 | 9,945,600 | ||||||
| 10,000,000 | 2.350%, 5/2/24 | 9,858,580 | ||||||
| 5,725,000 | 2.750%, 11/6/26 | 5,732,236 | ||||||
| 10,000,000 | 3.300%, 3/22/27 | 10,056,720 | ||||||
| 10,000,000 | 2.800%, 6/2/28 | 9,792,490 | ||||||
| 10,000,000 | 3.220%, 3/26/31 | 10,157,980 | ||||||
| 55,543,606 | ||||||||
| Federal Home Loan Banks-3.54% | ||||||||
| 50,000,000 | 1.000%, 8/28/18 | 49,743,450 | ||||||
| 11,250,000 | 1.200%, 5/23/19 | 11,183,951 | ||||||
| 5,000,000 | 1.600%, 10/22/20 | 4,943,445 | ||||||
| 10,000,000 | 2.050%, 6/9/23 | 9,899,700 | ||||||
| 10,000,000 | 2.620%, 4/28/26 | 9,790,540 | ||||||
| 10,000,000 | 3.000%, 7/12/27 | 9,848,920 | ||||||
| 5,981,481 | 3.000%, 4/18/31 | 5,975,955 | ||||||
| 19,000,000 | 2.000%, 6/30/31(c) | 18,337,356 | ||||||
| 119,723,317 | ||||||||
| Federal Home Loan Mortgage Corporation-0.44% | ||||||||
| 5,000,000 | 1.125%, 8/26/19(c) | 4,978,670 | ||||||
| 10,000,000 | 1.800%, 4/13/20 | 9,993,760 | ||||||
| 14,972,430 | ||||||||
| Tennessee Valley Authority-0.39% | ||||||||
| 10,000,000 | 5.250%, 9/15/39 | 13,140,440 | ||||||
| United States Department of Housing and Urban Development-0.15% | ||||||||
| 5,000,000 | 2.050%, 8/1/19 | 5,022,645 | ||||||
| TOTAL U.S. GOVERNMENT AGENCIES (Cost $220,298,219) | 218,414,758 | |||||||
| Shares or Principal Amount | Value | |||||||
| MORTGAGE BACKED SECURITIES-0.46% | ||||||||
| Federal National Mortgage Association-0.37% | ||||||||
| 10,809,012 | 3.500%, 9/1/33 | 11,280,132 | ||||||
| 1,274,113 | 4.500%, 9/1/40 | 1,340,915 | ||||||
| 12,621,047 | ||||||||
See Notes to Financial Statements.
| Annual Report | June 30, 2017 | 21 |
| Schedule of Investments | James Balanced: Golden Rainbow Fund |
June 30, 2017
| Shares or Principal Amount | Value | |||||||
| Government National Mortgage Association-0.09% | ||||||||
| $ | 2,897,784 | 4.000%, 12/20/40 | $ | 3,075,355 | ||||
| TOTAL MORTGAGE BACKED SECURITIES (Cost $15,317,614) | 15,696,402 | |||||||
| Shares or Principal Amount | Value | |||||||
| U.S. TREASURY BONDS & NOTES-25.07% | ||||||||
| U.S. Treasury Bonds-7.48% | ||||||||
| $ | 97,500,000 | 2.625%, 11/15/20 | 100,619,220 | |||||
| 48,000,000 | 2.125%, 5/15/25 | 47,692,512 | ||||||
| 60,000,000 | 2.000%, 8/15/25 | 58,968,720 | ||||||
| 20,000,000 | 2.375%, 5/15/27 | 20,128,900 | ||||||
| 25,000,000 | 3.000%, 2/15/47 | 25,833,975 | ||||||
| 253,243,327 | ||||||||
| U.S. Treasury Notes-14.57% | ||||||||
| 5,000,000 | 0.875%, 11/15/17 | 4,995,500 | ||||||
| 155,000,000 | 1.500%, 8/31/18 | 155,290,625 | ||||||
| 180,000,000 | 2.750%, 2/15/19 | 184,000,860 | ||||||
| 30,000,000 | 1.250%, 6/30/19 | 29,901,570 | ||||||
| 25,000,000 | 0.750%, 7/15/19 | 24,676,750 | ||||||
| 30,000,000 | 1.375%, 9/30/20 | 29,776,170 | ||||||
| 15,000,000 | 1.125%, 2/28/21 | 14,694,720 | ||||||
| 25,000,000 | 1.750%, 5/31/22 | 24,850,575 | ||||||
| 25,000,000 | 2.000%, 6/30/24 | 24,695,300 | ||||||
| 492,882,070 | ||||||||
| United States Treasury Inflation Indexed Bonds-3.02% | ||||||||
| 30,927,620 | 1.625%, 1/15/18 | 31,068,557 | ||||||
| 32,544,600 | 0.625%, 7/15/21 | 33,350,892 | ||||||
| 37,809,100 | 0.125%, 1/15/22 | 37,748,568 | ||||||
| 102,168,017 | ||||||||
| TOTAL U.S. TREASURY BONDS & NOTES (Cost $846,652,688) | 848,293,414 | |||||||
| Shares or Principal Amount | Value | |||||||
| FOREIGN BONDS-0.80% | ||||||||
| Australia Government Bond-0.24% | ||||||||
| AUD 10,000,000 | 5.250%, 3/15/19 | 8,133,989 | ||||||
| New Zealand Government Bond-0.34% | ||||||||
| NZD 15,000,000 | 5.000%, 3/15/19 | 11,522,125 | ||||||
| Singapore Government-0.22% | ||||||||
| SGD 10,000,000 | 2.250%, 6/1/21 | 7,466,686 | ||||||
| TOTAL FOREIGN BONDS (Cost $27,536,735) | 27,122,800 | |||||||
See Notes to Financial Statements.
| 22 | www.jamesfunds.com |
| James Balanced: Golden Rainbow Fund | Schedule of Investments |
June 30, 2017
| Shares or Principal Amount | Value | |||||||
| SHORT TERM INVESTMENTS-5.20% | ||||||||
| Mutual Fund-5.20% | ||||||||
| 175,877,619 | First American Treasury Obligations Fund, Class Z, 7-Day Yield 0.839% | $ | 175,877,619 | |||||
| TOTAL SHORT TERM INVESTMENTS (Cost $175,877,619) | 175,877,619 | |||||||
| TOTAL INVESTMENT SECURITIES-101.91% (Cost $3,046,364,262) | 3,448,496,980 | |||||||
| OTHER LIABILITIES IN EXCESS OF OTHER ASSETS-(1.91)% | (64,616,789 | ) | ||||||
| NET ASSETS-100.00% | $ | 3,383,880,191 | ||||||
For Fund compliance purposes, the Fund's industry classifications refer to any one or more of the industry sub-classifications used by one or more widely recognized market indexes or ratings group indexes, and/or as defined by Fund management. Those definitions may not apply for purposes of this report, which may combine industry sub-classifications for reporting ease. Industries are shown as a percentage of net assets.
* | Non-income producing security. |
(a) | Floating or variable rate security. Interest rate disclosed is that which is in effect at June 30, 2017. |
(b) | Prefunded Issues are bonds which are prerefunded and collateralized by U.S. Treasury securities held in escrow and used to pay principal and interest on tax exempt issues and to retire the bonds in full at the earliest refunding date. |
(c) | Step coupon. Coupon increases periodically based upon a predetermined schedule. Interest rate disclosed is that which is in effect as of June 30, 2017. |
AUD - Australian Dollar
NZD - New Zealand Dollar
SGD - Singapore Dollar
See Notes to Financial Statements.
| Annual Report | June 30, 2017 | 23 |
| Schedule of Investments | James Small Cap Fund |
June 30, 2017
| Shares | Value | |||||
| COMMON STOCKS‐96.23% | ||||||
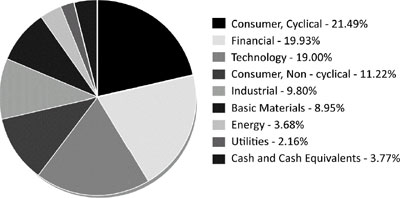
| Basic Materials‐8.95% | ||||||
| 94,060 | AK Steel Holding Corp.* | $ | 617,974 | |||
| 16,420 | Cooper Tire & Rubber Co. | 592,762 | ||||
| 48,030 | Ferro Corp.* | 878,469 | ||||
| 37,810 | Harsco Corp.* | 608,741 | ||||
| 43,750 | Kronos Worldwide, Inc. | 797,125 | ||||
| 21,830 | Lydall, Inc.* | 1,128,611 | ||||
| 34,840 | Orion Engineered Carbons SA | 695,058 | ||||
| 10,665 | Trinseo SA | 732,686 | ||||
| 6,051,426 | ||||||
| Consumer, Cyclical‐21.49% | ||||||
| 91,140 | Arcos Dorados Holdings, Inc., Class A* | 678,993 | ||||
| 10,580 | Asbury Automotive Group, Inc.* | 598,299 | ||||
| 15,125 | Big Lots, Inc. | 730,537 | ||||
| 29,520 | Bloomin' Brands, Inc. | 626,710 | ||||
| 49,020 | Builders FirstSource, Inc.* | 750,986 | ||||
| 15,160 | Century Communities, Inc.* | 375,968 | ||||
| 6,135 | Children's Place, Inc. | 626,383 | ||||
| 11,674 | Flexsteel Industries, Inc. | 631,680 | ||||
| 50,770 | Gray Television, Inc.* | 695,549 | ||||
| 11,910 | Hawaiian Holdings, Inc.* | 559,175 | ||||
| 14,300 | Insight Enterprises, Inc.* | 571,857 | ||||
| 28,720 | Intrawest Resorts Holdings, Inc.* | 681,813 | ||||
| 24,110 | MDC Holdings, Inc. | 851,806 | ||||
| 11,275 | Meredith Corp. | 670,299 | ||||
| 29,405 | MSG Networks, Inc., Class A* | 660,142 | ||||
| 148,830 | Office Depot, Inc. | 839,401 | ||||
| 11,460 | Patrick Industries, Inc.* | 834,861 | ||||
| 39,060 | Penn National Gaming, Inc.* | 835,884 | ||||
| 21,395 | SkyWest, Inc. | 750,965 | ||||
| 14,320 | SodaStream International, Ltd.* | 766,406 | ||||
| 35,560 | Wabash National Corp. | 781,609 | ||||
| 14,519,323 | ||||||
| Consumer, Non‐cyclical‐11.22% | ||||||
| 20,935 | Adtalem Global Education, Inc. | 794,483 | ||||
| 13,970 | Grand Canyon Education, Inc.* | 1,095,388 | ||||
| 34,053 | Natural Health Trends Corp. | 948,376 | ||||
| 6,985 | Sanderson Farms, Inc. | 807,815 | ||||
| 25,470 | Tivity Health, Inc.* | 1,014,980 | ||||
| 21,910 | TrueBlue, Inc.* | 580,615 | ||||
| 16,440 | Viad Corp. | 776,790 | ||||
| 46,870 | Weight Watchers International, Inc.* | 1,566,395 | ||||
| 7,584,842 | ||||||
| Energy‐3.68% | ||||||
| 78,970 | Atwood Oceanics, Inc.* | 643,605 | ||||
| 119,300 | McDermott International, Inc.* | 855,381 | ||||
| 90,773 | Star Gas Partners LP | 983,979 | ||||
| 2,482,965 | ||||||
| 24 | www.jamesfunds.com |
| James Small Cap Fund | Schedule of Investments |
June 30, 2017
| Shares | Value | |||||
| Financial‐19.93% | ||||||
| 24,580 | Aaron's, Inc. | $ | 956,162 | |||
| 30,550 | Aircastle, Ltd. | 664,463 | ||||
| 22,041 | Argo Group International Holdings, Ltd. | 1,335,685 | ||||
| 33,870 | Carlyle Group LP | 668,932 | ||||
| 17,420 | Chimera Investment Corp., REIT | 324,535 | ||||
| 9,510 | CorEnergy Infrastructure Trust, Inc., REIT | 319,441 | ||||
| 26,382 | ePlus, Inc.* | 1,954,906 | ||||
| 21,580 | Green Dot Corp., Class A* | 831,477 | ||||
| 21,540 | Houlihan Lokey, Inc. | 751,746 | ||||
| 42,005 | KCG Holdings, Inc., Class A* | 837,580 | ||||
| 32,501 | MainSource Financial Group, Inc. | 1,089,109 | ||||
| 11,700 | People's Utah Bancorp | 313,560 | ||||
| 11,540 | Piper Jaffray Cos. | 691,823 | ||||
| 43,345 | Redwood Trust, Inc., REIT | 738,599 | ||||
| 46,300 | Summit Hotel Properties, Inc., REIT | 863,495 | ||||
| 19,000 | Sunstone Hotel Investors, Inc., REIT | 306,280 | ||||
| 17,195 | Walker & Dunlop, Inc.* | 839,632 | ||||
| 13,487,425 | ||||||
| Industrial‐9.80% | ||||||
| 25,980 | American Outdoor Brands Corp.* | 575,717 | ||||
| 9,740 | Argan, Inc. | 584,400 | ||||
| 6,975 | Cooper‐standard Holding, Inc.* | 703,568 | ||||
| 39,205 | Dana, Inc. | 875,448 | ||||
| 7,890 | Dycom Industries, Inc.* | 706,313 | ||||
| 11,990 | GATX Corp. | 770,597 | ||||
| 43,240 | Meritor, Inc.* | 718,216 | ||||
| 28,990 | Quad/Graphics, Inc. | 664,451 | ||||
| 9,330 | Sturm Ruger & Co., Inc. | 579,860 | ||||
| 7,830 | Tenneco, Inc. | 452,809 | ||||
| 6,631,379 | ||||||
| Technology‐19.00% | ||||||
| 52,060 | ACCO Brands Corp.* | 606,499 | ||||
| 10,550 | Advanced Energy Industries, Inc.* | 682,479 | ||||
| 42,175 | Amaya, Inc.* | 754,932 | ||||
| 62,180 | Amkor Technology, Inc.* | 607,499 | ||||
| 16,143 | Deluxe Corp. | 1,117,418 | ||||
| 151,070 | Extreme Networks, Inc.* | 1,392,865 | ||||
| 8,470 | InterDigital, Inc. | 654,731 | ||||
| 92,190 | Iridium Communications, Inc.* | 1,018,700 | ||||
| 35,880 | Kulicke & Soffa Industries, Inc.* | 682,438 | ||||
| 68,660 | NCI, Inc., Class A* | 1,448,726 | ||||
| 37,180 | Orbotech, Ltd.* | 1,212,812 | ||||
| 35,140 | PC Connection, Inc. | 950,888 | ||||
| 31,880 | Tower Semiconductor, Ltd.* | 760,338 | ||||
| 43,880 | TTM Technologies, Inc.* | 761,757 | ||||
| 14,560 | Unisys Corp.* | 186,368 | ||||
| 12,838,450 | ||||||
| Utilities‐2.16% | ||||||
| 115,650 | Just Energy Group, Inc. | 606,006 | ||||
| Annual Report | June 30, 2017 | 25 |
| Schedule of Investments | James Small Cap Fund |
June 30, 2017
| Shares | Value | |||||
| Utilities (continued) | ||||||
| 130,728 | Vonage Holdings Corp.* | $ | 854,961 | |||
| 1,460,967 | ||||||
TOTAL COMMON STOCKS (Cost $51,940,416) | 65,056,777 | |||||
| Shares | Value | |||||
| SHORT TERM INVESTMENTS‐3.84% | ||||||
| Mutual Fund‐3.84% | ||||||
| 2,594,858 | First American Treasury Obligations Fund, Class Z, 7‐Day Yield 0.839% | 2,594,858 | ||||
TOTAL SHORT TERM INVESTMENTS (Cost $2,594,858) | 2,594,858 | |||||
TOTAL INVESTMENT SECURITIES‐100.07% (Cost $54,535,274) | 67,651,635 | |||||
| OTHER LIABILITIES IN EXCESS OF OTHER ASSETS‐(0.07)% | (48,749 | ) | ||||
| NET ASSETS‐100.00% | $ | 67,602,886 | ||||
| * | Non-income producing security. |
| 26 | www.jamesfunds.com |
| James Mid Cap Fund | Schedule of Investments |
June 30, 2017
| Shares | Value | |||||
| COMMON STOCKS‐94.95% | ||||||
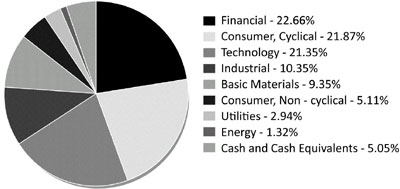
| Basic Materials‐9.35% | ||||||
| 17,325 | AK Steel Holding Corp.* | $ | 113,825 | |||
| 5,125 | Chemours Co. | 194,340 | ||||
| 4,425 | Goodyear Tire & Rubber Co. | 154,698 | ||||
| 6,975 | Huntsman Corp. | 180,234 | ||||
| 8,105 | Kronos Worldwide, Inc. | 147,673 | ||||
| 6,285 | Louisiana‐Pacific Corp.* | 151,531 | ||||
| 12,210 | Platform Specialty Products Corp.* | 154,823 | ||||
| 4,175 | Steel Dynamics, Inc. | 149,507 | ||||
| 2,075 | Trinseo SA | 142,553 | ||||
| 1,389,184 | ||||||
| Consumer, Cyclical‐21.87% | ||||||
| 2,850 | Big Lots, Inc. | 137,655 | ||||
| 2,375 | Brunswick Corp. | 148,984 | ||||
| 1,325 | Copa Holdings SA, Class A | 155,025 | ||||
| 2,165 | Deckers Outdoor Corp.* | 147,783 | ||||
| 6,540 | Gap, Inc. | 143,815 | ||||
| 2,830 | Hawaiian Holdings, Inc.* | 132,868 | ||||
| 2,685 | Hyatt Hotels Corp., Class A* | 150,924 | ||||
| 7,525 | ILG, Inc. | 206,862 | ||||
| 7,275 | JetBlue Airways Corp.* | 166,088 | ||||
| 3,600 | Kohl's Corp. | 139,212 | ||||
| 3,275 | Liberty Ventures, Series A* | 171,250 | ||||
| 2,300 | Meredith Corp. | 136,735 | ||||
| 2,175 | Nexstar Media Group, Inc., Class A | 130,065 | ||||
| 3,255 | Nordstrom, Inc. | 155,687 | ||||
| 75 | NVR, Inc.* | 180,796 | ||||
| 33,025 | Office Depot, Inc. | 186,261 | ||||
| 6,675 | PulteGroup, Inc. | 163,738 | ||||
| 1,875 | Scripps Networks Interactive, Inc., Class A | 128,081 | ||||
| 15,900 | Staples, Inc. | 160,113 | ||||
| 3,065 | Tempur Sealy International, Inc.* | 163,640 | ||||
| 1,375 | Thor Industries, Inc. | 143,715 | ||||
| 3,249,297 | ||||||
| Consumer, Non‐cyclical‐5.11% | ||||||
| 4,300 | Adtalem Global Education, Inc. | 163,185 | ||||
| 2,425 | Fresh Del Monte Produce, Inc. | 123,457 | ||||
| 1,525 | Helen of Troy, Ltd.* | 143,503 | ||||
| 1,595 | Sanderson Farms, Inc. | 184,462 | ||||
| 36 | Seaboard Corp. | 143,820 | ||||
| 758,427 | ||||||
| Energy‐1.32% | ||||||
| 22,150 | Chesapeake Energy Corp.* | 110,085 | ||||
| 10,450 | Transocean, Ltd.* | 86,004 | ||||
| 196,089 | ||||||
| Financial‐22.66% | ||||||
| 4,800 | Aaron's, Inc. | 186,720 | ||||
| 3,175 | AerCap Holdings NV* | 147,415 | ||||
| 7,425 | AGNC Investment Corp., REIT | 158,078 | ||||
| Annual Report | June 30, 2017 | 27 |
| Schedule of Investments | James Mid Cap Fund |
June 30, 2017
| Shares | Value | |||||
| Financial (continued) | ||||||
| 3,850 | Air Lease Corp. | $ | 143,836 | |||
| 3,525 | Assured Guaranty, Ltd. | 147,134 | ||||
| 7,910 | Chimera Investment Corp., REIT | 147,363 | ||||
| 4,825 | CoreCivic, Inc., REIT | 133,073 | ||||
| 3,975 | Essent Group, Ltd.* | 147,632 | ||||
| 1,750 | Evercore Partners, Inc., Class A | 123,375 | ||||
| 650 | Everest Re Group, Ltd. | 165,484 | ||||
| 5,100 | GEO Group, Inc., REIT | 150,807 | ||||
| 4,380 | Houlihan Lokey, Inc. | 152,862 | ||||
| 4,750 | LaSalle Hotel Properties, REIT | 141,550 | ||||
| 3,575 | LPL Financial Holdings, Inc. | 151,794 | ||||
| 12,850 | MGIC Investment Corp.* | 143,920 | ||||
| 9,000 | New Residential Investment Corp., REIT | 140,040 | ||||
| 6,575 | Piedmont Office Realty Trust, Inc., Class A, REIT | 138,601 | ||||
| 7,400 | Radian Group, Inc. | 120,990 | ||||
| 6,125 | RLJ Lodging Trust, REIT | 121,704 | ||||
| 2,275 | Ryman Hospitality Properties, Inc., REIT | 145,623 | ||||
| 9,475 | Sunstone Hotel Investors, Inc., REIT | 152,737 | ||||
| 16,075 | Two Harbors Investment Corp., REIT | 159,303 | ||||
| 7,775 | Xenia Hotels & Res., REIT | 150,602 | ||||
| 3,370,643 | ||||||
| Industrial‐10.35% | ||||||
| 1,875 | Belden, Inc. | 141,431 | ||||
| 7,175 | Dana, Inc. | 160,218 | ||||
| 2,450 | GATX Corp. | 157,461 | ||||
| 1,000 | Lear Corp. | 142,080 | ||||
| 3,750 | MasTec, Inc.* | 169,312 | ||||
| 7,325 | Owens‐Illinois, Inc.* | 175,214 | ||||
| 2,100 | Tenneco, Inc. | 121,443 | ||||
| 3,175 | Timken Co. | 146,844 | ||||
| 1,600 | Visteon Corp.* | 163,296 | ||||
| 2,470 | XPO Logistics, Inc.* | 159,636 | ||||
| 1,536,935 | ||||||
| Technology‐21.35% | ||||||
| 10,050 | Amaya, Inc.* | 179,895 | ||||
| 14,400 | Amkor Technology, Inc.* | 140,688 | ||||
| 1,925 | Arrow Electronics, Inc.* | 150,958 | ||||
| 1,100 | CACI International, Inc., Class A* | 137,555 | ||||
| 2,650 | CDW Corp. | 165,704 | ||||
| 2,325 | Cirrus Logic, Inc.* | 145,824 | ||||
| 3,725 | CommScope Holding Co., Inc.* | 141,662 | ||||
| 2,550 | EchoStar Corp., Class A* | 154,785 | ||||
| 4,150 | First Solar, Inc.* | 165,502 | ||||
| 2,825 | Garmin, Ltd. | 144,160 | ||||
| 1,805 | InterDigital, Inc. | 139,526 | ||||
| 4,925 | Logitech International SA | 180,551 | ||||
| 9,050 | Marvell Technology Group, Ltd. | 149,506 | ||||
| 3,325 | NCR Corp.* | 135,793 | ||||
| 2,525 | Spirit AeroSystems Holdings, Inc., Class A | 146,298 | ||||
| 1,200 | SYNNEX Corp. | 143,952 | ||||
| 1,650 | Tech Data Corp.* | 166,650 | ||||
| 5,000 | Teradyne, Inc. | 150,150 | ||||
| 28 | www.jamesfunds.com |
| James Mid Cap Fund | Schedule of Investments |
June 30, 2017
| Shares | Value | |||||
| Technology (continued) | ||||||
| 7,650 | TiVo Corp. | $ | 142,673 | |||
| 8,925 | Vishay Intertechnology, Inc. | 148,155 | ||||
| 6,075 | West Corp. | 141,669 | ||||
| 3,171,656 | ||||||
| Utilities‐2.94% | ||||||
| 2,400 | National Fuel Gas Co. | 134,016 | ||||
| 8,550 | NRG Energy, Inc. | 147,231 | ||||
| 2,225 | ONE Gas, Inc. | 155,327 | ||||
| 436,574 | ||||||
| TOTAL COMMON STOCKS (Cost $13,182,408) | 14,108,805 | |||||
| Shares | Value | |||||
| SHORT TERM INVESTMENTS‐4.94% | ||||||
| Mutual Fund‐4.94% | ||||||
| 734,615 | First American Treasury Obligations Fund, Class Z, 7‐Day Yield 0.839% | 734,615 | ||||
TOTAL SHORT TERM INVESTMENTS (Cost $734,615) | 734,615 | |||||
TOTAL INVESTMENT SECURITIES‐99.89% (Cost $13,917,023) | 14,843,420 | |||||
| OTHER ASSETS IN EXCESS OF LIABILITIES‐0.11% | 15,928 | |||||
| NET ASSETS‐100.00% | $ | 14,859,348 | ||||
| * | Non-income producing security. |
| Annual Report | June 30, 2017 | 29 |
| Schedule of Investments | James Micro Cap Fund |
| June 30, 2017 |
| Shares | Value | |||||
| COMMON STOCKS-98.41% | ||||||
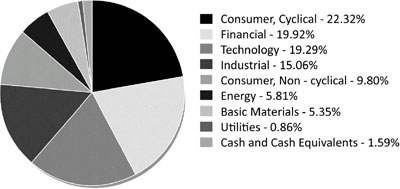
| Basic Materials-5.35% | ||||||
| 100,570 | Cloud Peak Energy, Inc.* | $ | 355,012 | |||
| 5,910 | KMG Chemicals, Inc. | 287,640 | ||||
| 9,290 | Koppers Holdings, Inc.* | 335,833 | ||||
| 23,350 | Rayonier Advanced Materials, Inc. | 367,062 | ||||
| 36,030 | Ryerson Holding Corp.* | 356,697 | ||||
| 1,702,244 | ||||||
| Consumer, Cyclical-22.32% | ||||||
| 25,790 | AV Homes, Inc.* | 517,089 | ||||
| 58,390 | Avianca Holdings SA, Sponsored ADR | 379,535 | ||||
| 24,870 | Big 5 Sporting Goods Corp. | 324,553 | ||||
| 19,230 | Century Communities, Inc.* | 476,904 | ||||
| 18,510 | China Yuchai International, Ltd. | 337,067 | ||||
| 39,380 | Commercial Vehicle Group, Inc.* | 332,761 | ||||
| 60,980 | Container Store Group, Inc.* | 361,002 | ||||
| 13,461 | Flexsteel Industries, Inc. | 728,375 | ||||
| 17,690 | FTD Cos., Inc.* | 353,800 | ||||
| 13,850 | Haverty Furniture Cos., Inc. | 347,635 | ||||
| 19,640 | Kimball International, Inc., Class B | 327,792 | ||||
| 16,390 | M/I Homes, Inc.* | 467,934 | ||||
| 14,151 | Patrick Industries, Inc.* | 1,030,900 | ||||
| 14,600 | PCM, Inc.* | 273,750 | ||||
| 36,550 | Tilly’s, Inc., Class A | 370,983 | ||||
| 21,240 | Wabash National Corp. | 466,855 | ||||
| 7,096,935 | ||||||
| Consumer, Non-cyclical-9.80% | ||||||
| 11,362 | John B Sanfilippo & Son, Inc. | 717,056 | ||||
| 14,300 | Kelly Services, Inc., Class A | 321,035 | ||||
| 20,360 | Lantheus Holdings, Inc.* | 359,354 | ||||
| 5,200 | Medifast, Inc. | 215,644 | ||||
| 34,678 | Natural Health Trends Corp. | 965,782 | ||||
| 30,015 | Omega Protein Corp. | 537,269 | ||||
| 3,116,140 | ||||||
| Energy-5.81% | ||||||
| 29,380 | FutureFuel Corp. | 443,344 | ||||
| 3,460 | REX American Resources Corp.* | 334,098 | ||||
| 98,941 | Star Gas Partners LP | 1,072,520 | ||||
| 1,849,962 | ||||||
| Financial-19.92% | �� | |||||
| 57,710 | Ashford Hospitality Trust, Inc., REIT | 350,877 | ||||
| 22,240 | B. Riley Financial, Inc. | 412,552 | ||||
| 11,480 | CorEnergy Infrastructure Trust, Inc., REIT | 385,613 | ||||
| 25,150 | Enova International, Inc.* | 373,477 | ||||
| 20,436 | ePlus, Inc.* | 1,514,308 | ||||
| 38,010 | EZCORP, Inc., Class A* | 292,677 | ||||
| 30,600 | Forestar Group, Inc.* | 524,790 | ||||
| 15,080 | Jernigan Capital, Inc., REIT | 331,760 | ||||
| 20,860 | LGI Homes, Inc.* | 838,155 | ||||
| 18,210 | Maui Land & Pineapple Co., Inc.* | 369,663 | ||||
| See Notes to Financial Statements. |
| 30 | www.jamesfunds.com |
| James Micro Cap Fund | Schedule of Investments |
| June 30, 2017 |
| Shares | Value | |||||
| Financial (continued) | ||||||
| 3,675 | MutualFirst Financial, Inc. | $ | 131,197 | |||
| 14,730 | People’s Utah Bancorp | 394,764 | ||||
| 5,600 | Piper Jaffray Cos. | 335,720 | ||||
| 1,088 | World Acceptance Corp.* | 81,502 | ||||
| 6,337,055 | ||||||
| Industrial-15.06% | ||||||
| 35,100 | Advanced Emissions Solutions, Inc. | 321,516 | ||||
| 16,770 | CAI International, Inc.* | 395,772 | ||||
| 22,230 | Casella Waste Systems, Inc., Class A* | 364,794 | ||||
| 17,440 | Ceco Environmental Corp. | 160,099 | ||||
| 35,710 | Costamare, Inc. | 261,040 | ||||
| 74,090 | DHT Holdings, Inc. | 307,474 | ||||
| 23,335 | Global Brass & Copper Holdings, Inc. | 712,884 | ||||
| 4,630 | NACCO Industries, Inc., Class A | 328,036 | ||||
| 11,350 | NN, Inc. | 311,558 | ||||
| 9,110 | Park-Ohio Holdings Corp. | 347,091 | ||||
| 20,350 | Stoneridge, Inc.* | 313,594 | ||||
| 18,040 | Tower International, Inc. | 404,998 | ||||
| 17,430 | Vectrus, Inc.* | 563,338 | ||||
| 4,792,194 | ||||||
| Technology-19.29% | ||||||
| 17,030 | Alpha & Omega Semiconductor, Ltd.* | 283,890 | ||||
| 14,050 | Ducommun, Inc.* | 443,699 | ||||
| 26,510 | Eastman Kodak Co.* | 241,241 | ||||
| 7,540 | Engility Holdings, Inc.* | 214,136 | ||||
| 62,000 | Extreme Networks, Inc.* | 571,640 | ||||
| 43,520 | Iridium Communications, Inc.* | 480,896 | ||||
| 22,230 | KEMET Corp.* | 284,544 | ||||
| 8,420 | Nanometrics, Inc.* | 212,942 | ||||
| 63,855 | NCI, Inc., Class A | 1,347,340 | ||||
| 16,806 | Orbotech, Ltd.* | 548,212 | ||||
| 46,858 | PC Connection, Inc. | 1,267,977 | ||||
| 18,600 | Unisys Corp.* | 238,080 | ||||
| 6,134,597 | ||||||
| Utilities-0.86% | ||||||
| 19,080 | IDT Corp., Class B | 274,180 | ||||
| 274,180 | ||||||
TOTAL COMMON STOCKS (Cost $26,225,413) | 31,303,307 | |||||
| See Notes to Financial Statements. |
| Annual Report | June 30, 2017 | 31 |
| Schedule of Investments | James Micro Cap Fund |
| June 30, 2017 |
| Shares | Value | |||||
| SHORT TERM INVESTMENTS-1.64% | ||||||
| Mutual Fund-1.64% | ||||||
| 521,211 | First American Treasury Obligations Fund, Class Z, 7-Day Yield 0.839% | $ | 521,211 | |||
TOTAL SHORT TERM INVESTMENTS (Cost $521,211) | 521,211 | |||||
TOTAL INVESTMENT SECURITIES-100.05% (Cost $26,746,624) | 31,824,518 | |||||
| OTHER LIABILITIES IN EXCESS OF OTHER ASSETS-(0.05)% | (15,787 | ) | ||||
| NET ASSETS-100.00% | $ | 31,808,731 | ||||
| * | Non-income producing security. |
| See Notes to Financial Statements. |
| 32 | www.jamesfunds.com |
| James Aggressive Allocation Fund | Schedule of Investments |
| June 30, 2017 |
| Shares or Principal Amount | Value | |||||
| COMMON STOCKS-70.72% | ||||||
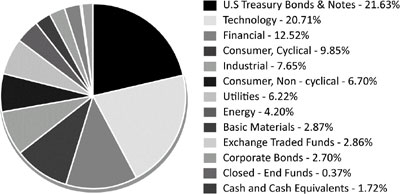
| Basic Materials-2.87% | ||||||
| 1,000 | Celanese Corp., Series A | $ | 94,940 | |||
| 5,000 | Ferro Corp.* | 91,450 | ||||
| 1,500 | Westlake Chemical Corp. | 99,315 | ||||
| 285,705 | ||||||
| Consumer, Cyclical-9.85% | ||||||
| 2,000 | Best Buy Co., Inc. | 114,660 | ||||
| 1,550 | Foot Locker, Inc. | 76,384 | ||||
| 2,000 | Genesco, Inc.* | 67,800 | ||||
| 2,500 | Hawaiian Holdings, Inc.* | 117,375 | ||||
| 800 | Home Depot, Inc. | 122,720 | ||||
| 2,500 | Insight Enterprises, Inc.* | 99,975 | ||||
| 3,000 | SkyWest, Inc. | 105,300 | ||||
| 2,000 | Wal-Mart Stores, Inc. | 151,360 | ||||
| 1,250 | Wyndham Worldwide Corp. | 125,513 | ||||
| 981,087 | ||||||
| Consumer, Non-cyclical-6.70% | ||||||
| 1,000 | Aetna, Inc. | 151,830 | ||||
| 1,400 | ManpowerGroup, Inc. | 156,310 | ||||
| 2,500 | Toro Co. | 173,225 | ||||
| 1,000 | UnitedHealth Group, Inc. | 185,420 | ||||
| 666,785 | ||||||
| Energy-4.20% | ||||||
| 25,000 | Chesapeake Energy Corp.* | 124,250 | ||||
| 24,000 | McDermott International, Inc.* | 172,080 | ||||
| 1,300 | Tesoro Corp. | 121,680 | ||||
| 418,010 | ||||||
| Financial-12.52% | ||||||
| 1,900 | American Financial Group, Inc. | 188,803 | ||||
| 1,000 | Chubb, Ltd. | 145,380 | ||||
| 500 | Goldman Sachs Group, Inc. | 110,950 | ||||
| 1,800 | JPMorgan Chase & Co. | 164,520 | ||||
| 3,000 | KB Financial Group, Inc., ADR | 151,470 | ||||
| 1,250 | PNC Financial Services Group, Inc. | 156,087 | ||||
| 12,000 | Regions Financial Corp. | 175,680 | ||||
| 2,000 | Torchmark Corp. | 153,000 | ||||
| 1,245,890 | ||||||
| Industrial-7.65% | ||||||
| 2,500 | AGCO Corp. | 168,475 | ||||
| 1,500 | Deere & Co. | 185,385 | ||||
| 2,000 | Eaton Corp. PLC | 155,660 | ||||
| 5,000 | Trinity Industries, Inc. | 140,150 | ||||
| 1,000 | United Rentals, Inc.* | 112,710 | ||||
| 762,380 | ||||||
| Technology-20.71% | ||||||
| 1,000 | Advanced Energy Industries, Inc.* | 64,690 | ||||
| 1,000 | Amgen, Inc. | 172,230 | ||||
| See Notes to Financial Statements. |
| Annual Report | June 30, 2017 | 33 |
| Schedule of Investments | James Aggressive Allocation Fund |
| June 30, 2017 |
| Shares or Principal Amount | Value | |||||
| Technology (continued) | ||||||
| 1,100 | Apple, Inc. | $ | 158,422 | |||
| 700 | Broadcom, Ltd. | 163,135 | ||||
| 2,000 | Cabot Microelectronics Corp. | 147,660 | ||||
| 4,500 | Cisco Systems, Inc. | 140,850 | ||||
| 5,500 | Corning, Inc. | 165,275 | ||||
| 850 | General Dynamics Corp. | 168,385 | ||||
| 3,000 | Intel Corp. | 101,220 | ||||
| 500 | Lockheed Martin Corp. | 138,805 | ||||
| 650 | Northrop Grumman Corp. | 166,861 | ||||
| 1,700 | TE Connectivity, Ltd. | 133,756 | ||||
| 6,000 | Tower Semiconductor, Ltd.* | 143,100 | ||||
| 2,000 | Triumph Group, Inc. | 63,200 | ||||
| 1,500 | Western Digital Corp. | 132,900 | ||||
| 2,060,489 | ||||||
| Utilities-6.22% | ||||||
| 4,000 | CenterPoint Energy, Inc. | 109,520 | ||||
| 5,000 | Cia de Saneamento Basico do Estado de Sao Paulo, ADR | 47,600 | ||||
| 1,000 | DTE Energy Co. | 105,790 | ||||
| 6,000 | NRG Energy, Inc. | 103,320 | ||||
| 1,250 | Pinnacle West Capital Corp. | 106,450 | ||||
| 2,500 | Vectren Corp. | 146,100 | ||||
| 618,780 | ||||||
TOTAL COMMON STOCKS (Cost $6,274,611) | 7,039,126 | |||||
| EXCHANGE TRADED FUNDS-2.86% | ||||||
| 1,200 | Global X MSCI Argentina ETF | 35,148 | ||||
| 1,500 | iShares® MSCI France ETF | 43,140 | ||||
| 1,500 | iShares® MSCI Poland Capped ETF | 36,420 | ||||
| 4,000 | iShares® Silver Trust ETF* | 62,840 | ||||
| 1,700 | VanEck Vectors Indonesia Index ETF | 40,902 | ||||
| 2,000 | VanEck Vectors Junior Gold Miners ETF | 66,760 | ||||
TOTAL EXCHANGE TRADED FUNDS (Cost $279,392) | 285,210 | |||||
| Shares or Principal Amount | Value | |||||
| CORPORATE BONDS-2.70% | ||||||
| Communications-0.66% | ||||||
| $ 67,000 | Walt Disney Co., 0.875%, 7/12/19 | 66,007 | ||||
| Financial-0.50% | ||||||
| 50,000 | PNC Bank NA, 1.950%, 3/4/19 | 50,092 | ||||
| Industrial-0.51% | ||||||
| 50,000 | General Electric Co., 2.700%, 10/9/22 | 50,851 | ||||
| Technology-0.51% | ||||||
| 50,000 | Microsoft Corp., 1.850%, 2/6/20 | 50,124 | ||||
| See Notes to Financial Statements. |
| 34 | www.jamesfunds.com |
| James Aggressive Allocation Fund | Schedule of Investments |
| June 30, 2017 |
| Shares or Principal Amount | Value | ||||||
| Utilities-0.52% | |||||||
| $ | 50,000 | Georgia Power Co., 5.400%, 6/1/18 | $ | 51,657 | |||
| TOTAL CORPORATE BONDS (Cost $268,430) | 268,731 | ||||||
| Shares or Principal Amount | Value | |||||
| CLOSED-END FUNDS-0.37% | ||||||
| 5,250 | Aberdeen Chile Fund, Inc. | 37,170 | ||||
TOTAL CLOSED-END FUNDS (Cost $29,390) | 37,170 | |||||
| Shares or Principal Amount | Value | ||||||
| U.S. TREASURY BONDS & NOTES-21.63% | |||||||
| U.S. Treasury Bonds-4.67% | |||||||
| $ | 450,000 | 3.000%, 2/15/47 | 465,011 | ||||
| U.S. Treasury Notes-13.05% | |||||||
| 200,000 | 0.750%, 2/28/18 | 199,375 | |||||
| 500,000 | 1.143%, 1/31/19(a) | 500,674 | |||||
| 600,000 | 1.500%, 5/15/20 | 599,297 | |||||
| 1,299,346 | |||||||
| United States Treasury Inflation Indexed Bonds-3.91% | |||||||
| 379,687 | 0.625%, 7/15/21 | 389,094 | |||||
| TOTAL U.S. TREASURY BONDS & NOTES (Cost $2,149,152) | 2,153,451 | ||||||
| Shares or Principal Amount | Value | |||||
| SHORT TERM INVESTMENTS-1.89% | ||||||
| Mutual Funds-1.89% | ||||||
| 187,826 | First American Government Obligations Fund , Class Z, 7-Day Yield 0.837% | 187,826 | ||||
TOTAL SHORT TERM INVESTMENTS (Cost $187,826) | 187,826 | |||||
TOTAL INVESTMENT SECURITIES-100.17% (Cost $9,188,801) | 9,971,514 | |||||
| OTHER LIABILITIES IN EXCESS OF OTHER ASSETS-(0.17)% | (17,395 | ) | ||||
| NET ASSETS-100.00% | $ | 9,954,119 | ||||
| * | Non-income producing security. |
(a) | Floating or variable rate security. Interest rate disclosed is that which is in effect at June 30, 2017. |
| See Notes to Financial Statements. |
| Annual Report | June 30, 2017 | 35 |
| Schedule of Investments | James Long-Short Fund |
June 30, 2017
| Shares | Value | |||||
| COMMON STOCKS‐86.18% | ||||||
| Basic Materials‐13.46% | ||||||
| 6,330 | Avery Dennison Corp. | $ | 559,382 | |||
| 7,800 | Celanese Corp., Series A(a) | 740,532 | ||||
| 6,550 | Cooper Tire & Rubber Co.(a) | 236,455 | ||||
| 3,960 | Dow Chemical Co. | 249,757 | ||||
| 17,790 | Goodyear Tire & Rubber Co.(a) | 621,938 | ||||
| 7,330 | Innospec, Inc.(a) | 480,481 | ||||
| 2,888,545 | ||||||
| Consumer, Cyclical‐11.20% | ||||||
| 2,870 | Alaska Air Group, Inc.(a) | 257,611 | ||||
| 10,540 | Best Buy Co., Inc. | 604,258 | ||||
| 8,700 | Big Lots, Inc. | 420,210 | ||||
| 10,290 | Meritage Homes Corp.*(a) | 434,238 | ||||
| 6,930 | Southwest Airlines Co.(a) | 430,630 | ||||
| 3,380 | Wal‐Mart Stores, Inc. | 255,798 | ||||
| 2,402,745 | ||||||
| Consumer, Non‐cyclical‐14.21% | ||||||
| 2,130 | Aetna, Inc.(a) | 323,398 | ||||
| 3,890 | Grand Canyon Education, Inc.* | 305,015 | ||||
| 5,040 | ManpowerGroup, Inc. | 562,716 | ||||
| 13,545 | Pfizer, Inc.(a) | 454,977 | ||||
| 3,060 | Sanderson Farms, Inc. | 353,889 | ||||
| 10,520 | Toro Co. | 728,931 | ||||
| 1,720 | UnitedHealth Group, Inc.(a) | 318,922 | ||||
| 3,047,848 | ||||||
| Energy‐2.10% | ||||||
| 62,840 | McDermott International, Inc.* | 450,563 | ||||
| 450,563 | ||||||
| Financial‐14.24% | ||||||
| 8,240 | Aaron's, Inc. | 320,536 | ||||
| 3,450 | Aflac, Inc. | 267,996 | ||||
| 14,790 | Chimera Investment Corp., REIT | 275,538 | ||||
| 9,750 | Fifth Third Bancorp | 253,110 | ||||
| 8,140 | JPMorgan Chase & Co.(a) | 743,996 | ||||
| 15,690 | Regions Financial Corp. | 229,702 | ||||
| 5,750 | Travelers Cos., Inc.(a) | 727,548 | ||||
| 5,120 | Unum Group | 238,746 | ||||
| 3,057,172 | ||||||
| Industrial‐10.13% | ||||||
| 10,590 | American Outdoor Brands Corp.*(a) | 234,674 | ||||
| 4,500 | Deere & Co. | 556,155 | ||||
| 9,560 | Owens‐Illinois, Inc.* | 228,675 | ||||
| 5,160 | Republic Services, Inc. | 328,847 | ||||
| 6,720 | Sonoco Products Co.(a) | 345,542 | ||||
| 4,260 | United Rentals, Inc.* | 480,145 | ||||
| 2,174,038 | ||||||
| 36 | www.jamesfunds.com |
| James Long-Short Fund | Schedule of Investments |
June 30, 2017
| Shares | Value | |||||
| Technology‐14.80% | ||||||
| 1,760 | Apple, Inc. | $ | 253,475 | |||
| 9,870 | Cisco Systems, Inc. | 308,931 | ||||
| 7,360 | Corning, Inc. | 221,168 | ||||
| 6,625 | Deluxe Corp.(a) | 458,582 | ||||
| 1,680 | International Business Machines Corp. | 258,434 | ||||
| 9,830 | Kulicke & Soffa Industries, Inc.* | 186,967 | ||||
| 985 | Lockheed Martin Corp.(a) | 273,446 | ||||
| 2,850 | Northrop Grumman Corp.(a) | 731,624 | ||||
| 5,480 | Western Digital Corp. | 485,528 | ||||
| 3,178,155 | ||||||
| Utilities‐6.04% | ||||||
| 2,590 | American Electric Power Co., Inc.(a) | 179,927 | ||||
| 7,040 | Edison International(a) | 550,458 | ||||
| 14,745 | PNM Resources, Inc.(a) | 563,996 | ||||
| 1,294,381 | ||||||
| TOTAL COMMON STOCKS (Cost $13,119,715) | 18,493,447 | |||||
| Shares | Value | |||||
| SHORT TERM INVESTMENTS‐13.50% | ||||||
| Mutual Fund‐13.50% | ||||||
| 2,896,802 | First American Treasury Obligations Fund, Class Z, 7‐Day Yield 0.839% | 2,896,802 | ||||
TOTAL SHORT TERM INVESTMENTS (Cost $2,896,802) | 2,896,802 | |||||
TOTAL INVESTMENT SECURITIES‐99.68% (Cost $16,016,517) | 21,390,249 | |||||
SECURITIES SOLD SHORT‐(13.00)% (Proceeds $2,845,415) | (2,790,371 | ) | ||||
| OTHER ASSETS IN EXCESS OF LIABILITIES‐13.32% | 2,859,245 | (b) | ||||
NET ASSETS-100.00% | $ | 21,459,123 | ||||
| Shares | Value | |||||
| SCHEDULE OF SECURITIES SOLD SHORT | ||||||
| COMMON STOCKS‐(13.00)% | ||||||
| Basic Materials‐(0.82)% | ||||||
| (8,890 | ) | Wheaton Precious Metals Corp. | $ | (176,822 | ) | |
| Consumer, Cyclical‐(0.72)% | ||||||
| (1,320 | ) | Advance Auto Parts, Inc. | (153,899 | ) | ||
| Energy‐(3.12)% | ||||||
| (3,660 | ) | Anadarko Petroleum Corp. | (165,945 | ) | ||
| (5,300 | ) | Continental Resources, Inc. | (171,349 | ) | ||
| (3,890 | ) | Halliburton Co. | (166,142 | ) | ||
| (2,510 | ) | Schlumberger, Ltd. | (165,258 | ) | ||
| (668,694 | ) | |||||
| Exchange Traded Funds‐(2.14)% | ||||||
| (1,770 | ) | iShares® Russell 1000 Growth ETF | (210,665 | ) | ||
| Annual Report | June 30, 2017 | 37 |
| Schedule of Investments | James Long-Short Fund |
| Shares | Value | |||||
| Exchange Traded Funds (continued) | ||||||
| (1,800) | PowerShares® QQQ Trust | $ | (247,752 | ) | ||
| (458,417 | ) | |||||
| Financial‐(0.82)% | ||||||
| (180) | Markel Corp. | (175,655 | ) | |||
| Industrial‐(0.77)% | ||||||
| (460) | Tesla Motors, Inc. | (166,341 | ) | |||
| Technology‐(4.61)% | ||||||
| (2,970) | Alkermes PLC | (172,171 | ) | |||
| (1,610) | Autodesk, Inc. | (162,320 | ) | |||
| (1,400) | Incyte Corp., Ltd. | (176,274 | ) | |||
| (1,960) | salesforce.com, Inc. | (169,736 | ) | |||
| (2,760) | Seattle Genetics, Inc. | (142,802 | ) | |||
| (5,920) | Symantec Corp. | (167,240 | ) | |||
| (990,543 | ) | |||||
TOTAL COMMON STOCKS SOLD SHORT (Proceeds $2,845,415) | (2,790,371 | ) | ||||
TOTAL SECURITIES SOLD SHORT‐(13.00)% (Proceeds $2,845,415) | $ | (2,790,371 | ) | |||
| * | Non-income producing security. |
(a) | Security position is either entirely or partially held in a segregated account as collateral for securities sold short, aggregating a total security position market value of $6,473,580. |
(b) | Includes cash which is being held as collateral for securities sold short in the amount of $2,858,754. |
| 38 | www.jamesfunds.com |
| Statements of Assets and Liabilities | James Advantage Funds |
| James Balanced: Golden Rainbow Fund | James Small Cap Fund | James Mid Cap Fund | James Micro Cap Fund | James Aggressive Allocation Fund | James Long-Short Fund | |||||||||||||||||||
| ASSETS: | ||||||||||||||||||||||||
Investment securities: | ||||||||||||||||||||||||
At cost | $ | 3,046,364,262 | $ | 54,535,274 | $ | 13,917,023 | $ | 26,746,624 | $ | 9,188,801 | $ | 16,016,517 | ||||||||||||
At value | $ | 3,448,496,980 | $ | 67,651,635 | $ | 14,843,420 | $ | 31,824,518 | $ | 9,971,514 | $ | 21,390,249 | ||||||||||||
| Cash | 47,328 | 15,023 | 1,441 | – | 714 | – | ||||||||||||||||||
Deposits with brokers for securities sold short | – | – | – | – | – | 2,858,369 | ||||||||||||||||||
Dividends and interest receivable | 12,102,513 | 21,700 | 32,704 | 27,364 | 15,635 | 29,009 | ||||||||||||||||||
Receivable for securities sold | – | – | – | – | 88,338 | – | ||||||||||||||||||
Receivable for capital shares sold | 982,273 | 2,849 | 100 | 478 | – | 100 | ||||||||||||||||||
Other assets | 56,661 | – | – | – | – | – | ||||||||||||||||||
Total Assets | 3,461,685,755 | 67,691,207 | 14,877,665 | 31,852,360 | 10,076,201 | 24,277,727 | ||||||||||||||||||
| LIABILITIES: | ||||||||||||||||||||||||
Payable for interest expense | – | – | – | – | – | 115 | ||||||||||||||||||
Payable for securities sold short (proceeds $–, $–, $–, $–, $– and $2,845,415, respectively) | – | – | – | – | – | 2,790,371 | ||||||||||||||||||
Payable for capital shares redeemed | 4,943,393 | 3,906 | – | 3,910 | – | 1,779 | ||||||||||||||||||
Payable for securities purchased | 70,135,542 | – | – | – | 114,069 | – | ||||||||||||||||||
Accrued expenses: | ||||||||||||||||||||||||
Management fees | 1,839,885 | 70,302 | 15,254 | 39,719 | 8,013 | 21,935 | ||||||||||||||||||
12b‐1 distribution and service fees | 451,462 | 14,113 | 3,063 | – | – | 4,404 | ||||||||||||||||||
Other payables | 435,282 | – | – | – | – | – | ||||||||||||||||||
Total Liabilities | 77,805,564 | 88,321 | 18,317 | 43,629 | 122,082 | 2,818,604 | ||||||||||||||||||
Net Assets | $ | 3,383,880,191 | $ | 67,602,886 | $ | 14,859,348 | $ | 31,808,731 | $ | 9,954,119 | $ | 21,459,123 | ||||||||||||
NET ASSETS CONSIST OF: | ||||||||||||||||||||||||
Paid‐in capital | $ | 2,894,077,517 | $ | 46,295,183 | $ | 10,483,356 | $ | 24,540,615 | $ | 9,620,419 | $ | 16,928,267 | ||||||||||||
Accumulated net investment income | 1,147,937 | 407,486 | 37,273 | 97,622 | 22,955 | – | ||||||||||||||||||
Accumulated net realized gain/(loss) | 86,513,348 | 7,783,791 | 3,412,322 | 2,092,600 | (471,968 | ) | (897,920 | ) | ||||||||||||||||
Net unrealized appreciation/ (depreciation) | 402,141,389 | 13,116,426 | 926,397 | 5,077,894 | 782,713 | 5,428,776 | ||||||||||||||||||
Net Assets | $ | 3,383,880,191 | $ | 67,602,886 | $ | 14,859,348 | $ | 31,808,731 | $ | 9,954,119 | $ | 21,459,123 | ||||||||||||
| 40 | www.jamesfunds.com |
| James Advantage Funds | Statements of Assets and Liabilities |
| James Balanced: Golden Rainbow Fund | James Small Cap Fund | James Mid Cap Fund | James Micro Cap Fund | James Aggressive Allocation Fund | James Long-Short Fund | |||||||||||||||||||
PRICING OF RETAIL CLASS SHARES: | ||||||||||||||||||||||||
Net assets | $ | 2,163,785,600 | N/A | N/A | N/A | N/A | N/A | |||||||||||||||||
Shares of beneficial interest outstanding (unlimited number of shares authorized, no par) | 87,610,186 | N/A | N/A | N/A | N/A | N/A | ||||||||||||||||||
Net assets value, offering price and redemption price per share | $ | 24.70 | N/A | N/A | N/A | N/A | N/A | |||||||||||||||||
PRICING OF INSTITUTIONAL CLASS SHARES: | ||||||||||||||||||||||||
Net assets | $ | 1,220,094,591 | N/A | N/A | N/A | N/A | N/A | |||||||||||||||||
Shares of beneficial interest outstanding(unlimited number of shares authorized, no par) | 49,914,158 | N/A | N/A | N/A | N/A | N/A | ||||||||||||||||||
Net assets value, offering price and redemption price per share | $ | 24.44 | N/A | N/A | N/A | N/A | N/A | |||||||||||||||||
PRICING OF SHARES | ||||||||||||||||||||||||
Net assets | N/A | $ | 67,602,886 | $ | 14,859,348 | $ | 31,808,731 | $ | 9,954,119 | $ | 21,459,123 | |||||||||||||
Shares of beneficial interest outstanding (unlimited number of shares authorized, no par) | N/A | 1,990,584 | 1,125,794 | 1,841,949 | 995,795 | 1,498,122 | ||||||||||||||||||
Net assets value, offering price and redemption price per share | N/A | $ | 33.96 | $ | 13.20 | $ | 17.27 | $ | 10.00 | $ | 14.32 | |||||||||||||
| Annual Report | June 30, 2017 | 41 |
| Statements of Operations | James Advantage Funds |
| James Balanced: Golden Rainbow Fund | James Small Cap Fund | James Mid Cap Fund | James Micro Cap Fund | James Aggressive Allocation Fund | James Long-Short Fund | |||||||||||||||||||
INVESTMENT INCOME: | ||||||||||||||||||||||||
Dividends (Net of withholding taxes of $242,253,$5,505,$150,$977,$212 and $676, respectively) | $ | 41,659,541 | $ | 1,667,775 | $ | 270,634 | $ | 547,316 | $ | 148,438 | $ | 442,903 | ||||||||||||
| Interest | 37,453,517 | – | – | 2,975 | 24,436 | – | ||||||||||||||||||
Total Investment Income | 79,113,058 | 1,667,775 | 270,634 | 550,291 | 172,874 | 442,903 | ||||||||||||||||||
| EXPENSES: | ||||||||||||||||||||||||
Management fees | 25,623,138 | 977,078 | 182,316 | 474,399 | 87,165 | 281,026 | ||||||||||||||||||
12b‐1 distribution and service fees ‐ Retail Class | 6,429,295 | – | – | – | – | – | ||||||||||||||||||
12b‐1 distribution and service fees | – | 196,214 | 36,606 | – | – | 56,469 | ||||||||||||||||||
Dividend expense on securities sold short | – | – | – | – | – | 2,973 | ||||||||||||||||||
Broker fees and charges on securities sold short | – | – | – | – | – | 11,627 | ||||||||||||||||||
Administration fee | 1,149,468 | – | – | – | – | – | ||||||||||||||||||
Transfer agent fee | 353,595 | – | – | – | – | – | ||||||||||||||||||
Interest expense | – | 461 | – | – | 34 | – | ||||||||||||||||||
Custodian fees | 315,715 | – | – | – | – | – | ||||||||||||||||||
Professional fees | 240,402 | – | – | – | – | – | ||||||||||||||||||
Trustee fees | 204,645 | 3,952 | 714 | 1,541 | 425 | 1,134 | ||||||||||||||||||
Registration fees | 128,392 | – | – | – | – | – | ||||||||||||||||||
Shareholder report printing and mailing | 247,519 | – | – | – | – | – | ||||||||||||||||||
Other expenses | 113,707 | – | – | – | – | – | ||||||||||||||||||
Total Expenses | 34,805,876 | 1,177,705 | 219,636 | 475,940 | 87,624 | 353,229 | ||||||||||||||||||
Net Investment Income | 44,307,182 | 490,070 | 50,998 | 74,351 | 85,250 | 89,674 | ||||||||||||||||||
REALIZED AND UNREALIZED GAIN/(LOSS) ON INVESTMENTS: | ||||||||||||||||||||||||
Net realized gain/(loss) from: | ||||||||||||||||||||||||
| Investments | 182,211,166 | 16,037,788 | 4,757,419 | 4,773,673 | 62,289 | 1,893,564 | ||||||||||||||||||
Securities sold short | – | – | – | – | – | (561,348 | ) | |||||||||||||||||
Foreign currency transactions | (2,168,659 | ) | 342 | – | – | – | – | |||||||||||||||||
Total realized gain/(loss) | 180,042,507 | 16,038,130 | 4,757,419 | 4,773,673 | 62,289 | 1,332,216 | ||||||||||||||||||
Net change in unrealized appreciation/(depreciation) on investments | (67,169,650 | ) | (7,510,002 | ) | (3,363,332 | ) | (895,775 | ) | 415,138 | 695,395 | ||||||||||||||
Net change in unrealized appreciation on securities sold short | – | – | – | – | – | 55,765 | ||||||||||||||||||
Net change in unrealized appreciation on foreign currency translation | 3,243 | 65 | – | – | – | – | ||||||||||||||||||
Total change in unrealized appreciation/(depreciation) | (67,166,407 | ) | (7,509,937 | ) | (3,363,332 | ) | (895,775 | ) | 415,138 | 751,160 | ||||||||||||||
Net Realized and Unrealized Gain on Investments | 112,876,100 | 8,528,193 | 1,394,087 | 3,877,898 | 477,427 | 2,083,376 | ||||||||||||||||||
Net Increase in Net Assets Resulting from Operations | $ | 157,183,282 | $ | 9,018,263 | $ | 1,445,085 | $ | 3,952,249 | $ | 562,677 | $ | 2,173,050 | ||||||||||||
| 42 | www.jamesfunds.com |
| James Balanced: Golden Rainbow Fund | Statements of Changes in Net Assets |
For the Year Ended June 30, 2017 | For the Year Ended June 30, 2016 | |||||||
| FROM OPERATIONS: | ||||||||
| Net investment income/(loss) | $ | 44,307,182 | $ | 48,586,299 | ||||
| Net realized gain/(loss) | 180,042,507 | (69,325,551 | ) | |||||
| Net change in unrealized appreciation/(depreciation) | (67,166,407 | ) | (5,611,358 | ) | ||||
| Net Increase/(Decrease) in net assets resulting from operations | 157,183,282 | (26,350,610 | ) | |||||
| DISTRIBUTIONS TO SHAREHOLDERS: | ||||||||
| Retail Class Shares: | ||||||||
| From net investment income | (29,725,195 | ) | (28,056,929 | ) | ||||
| From net realized gain on investments | (10,139,227 | ) | (52,436,229 | ) | ||||
| Institutional Class Shares: | ||||||||
| From net investment income | (20,087,654 | ) | (17,468,629 | ) | ||||
| From net realized gain on investments | (5,583,143 | ) | (24,906,312 | ) | ||||
| Decrease in net assets from distributions to shareholders | (65,535,219 | ) | (122,868,099 | ) | ||||
| CAPITAL SHARE TRANSACTIONS: | ||||||||
| Retail Class Shares: | ||||||||
| Proceeds from shares sold | 307,631,275 | 798,326,471 | ||||||
| Net asset value of shares issued in reinvestment of distributions to shareholders | 38,471,828 | 78,274,626 | ||||||
| Payments for shares redeemed, net of redemption fees | (1,134,659,577 | ) | (853,387,658 | ) | ||||
| Net Increase/(Decrease) in net assets from Retail Class capital share transactions | (788,556,474 | ) | 23,213,439 | |||||
| Institutional Class Shares: | ||||||||
| Proceeds from shares sold | 274,252,442 | 624,996,786 | ||||||
| Net asset value of shares issued in reinvestment of distributions to shareholders | 19,458,265 | 31,613,669 | ||||||
| Payments for shares redeemed | (618,481,705 | ) | (376,036,136 | ) | ||||
| Net Increase/(Decrease) in net assets from Institutional Class capital share transactions | (324,770,998 | ) | 280,574,319 | |||||
| Total Increase/(Decrease) in Net Assets | (1,021,679,409 | ) | 154,569,049 | |||||
| NET ASSETS: | ||||||||
| Beginning of year | 4,405,559,600 | 4,250,990,551 | ||||||
| End of year | $ | 3,383,880,191 | $ | 4,405,559,600 | ||||
| Accumulated Net Investment Income | $ | 1,147,937 | $ | 8,370,344 | ||||
| Annual Report | June 30, 2017 | 43 |
| Statements of Changes in Net Assets | James Balanced: Golden Rainbow Fund |
For the Year Ended June 30, 2017 | For the Year Ended June 30, 2016 | |||||||
| SUMMARY OF CAPITAL SHARE ACTIVITY: | ||||||||
| Retail Class Shares: | ||||||||
| Shares sold | 12,579,499 | 32,952,333 | ||||||
| Shares issued in reinvestment of distributions to shareholders | 1,576,194 | 3,249,232 | ||||||
| Shares redeemed | (46,397,523 | ) | (35,477,042 | ) | ||||
| Net Increase/(Decrease) in shares outstanding | (32,241,830 | ) | 724,523 | |||||
| Shares outstanding, beginning of period | 119,852,016 | 119,127,493 | ||||||
| Shares outstanding, end of period | 87,610,186 | 119,852,016 | ||||||
| Institutional Class Shares: | ||||||||
| Shares sold | 11,324,733 | 26,103,085 | ||||||
| Shares issued in reinvestment of distributions to shareholders | 804,853 | 1,325,565 | ||||||
| Shares redeemed | (25,523,675 | ) | (15,812,122 | ) | ||||
| Net Increase/(Decrease) in shares outstanding | (13,394,089 | ) | 11,616,528 | |||||
| Shares outstanding, beginning of period | 63,308,247 | 51,691,719 | ||||||
| Shares outstanding, end of period | 49,914,158 | 63,308,247 | ||||||
| 44 | www.jamesfunds.com |
| James Small Cap Fund | Statements of Changes in Net Assets |
For the Year Ended June 30, 2017 | For the Year Ended June 30, 2016 | |||||||
| FROM OPERATIONS: | ||||||||
| Net investment income/(loss) | $ | 490,070 | $ | 580,155 | ||||
| Net realized gain/(loss) | 16,038,130 | (7,871,318 | ) | |||||
| Net change in unrealized appreciation/(depreciation) | (7,509,937 | ) | (3,461,143 | ) | ||||
| Net Increase/(Decrease) in net assets resulting from operations | 9,018,263 | (10,752,306 | ) | |||||
| DISTRIBUTIONS TO SHAREHOLDERS: | ||||||||
| From net investment income | (400,002 | ) | (517,833 | ) | ||||
| From net realized gain on investments | – | (4,796,245 | ) | |||||
| Decrease in net assets from distributions to shareholders | (400,002 | ) | (5,314,078 | ) | ||||
| CAPITAL SHARE TRANSACTIONS: | ||||||||
| Proceeds from shares sold | 4,446,345 | 49,359,102 | ||||||
| Net asset value of shares issued in reinvestment of distributions to shareholders | 366,727 | 4,858,141 | ||||||
| Payments for shares redeemed | (30,054,112 | ) | (79,070,682 | ) | ||||
| Net Decrease in net assets from capital share transactions | (25,241,040 | ) | (24,853,439 | ) | ||||
| Total Decrease in Net Assets | (16,622,779 | ) | (40,919,823 | ) | ||||
| NET ASSETS: | ||||||||
| Beginning of year | 84,225,665 | 125,145,488 | ||||||
| End of year | $ | 67,602,886 | $ | 84,225,665 | ||||
| Accumulated Net Investment Income/(Loss) | $ | 407,486 | $ | (92,043 | ) | |||
| SUMMARY OF CAPITAL SHARE ACTIVITY: | ||||||||
| Shares sold | 131,508 | 1,499,756 | ||||||
| Shares issued in reinvestment of distributions to shareholders | 10,227 | 148,790 | ||||||
| Shares redeemed | (900,250 | ) | (2,638,285 | ) | ||||
| Net Decrease in shares outstanding | (758,515 | ) | (989,739 | ) | ||||
| Shares outstanding, beginning of period | 2,749,099 | 3,738,838 | ||||||
| Shares outstanding, end of period | 1,990,584 | 2,749,099 | ||||||
| Annual Report | June 30, 2017 | 45 |
| Statements of Changes in Net Assets | James Mid Cap Fund |
For the Year Ended June 30, 2017 | For the Year Ended June 30, 2016 | |||||||
| FROM OPERATIONS: | ||||||||
| Net investment income/(loss) | $ | 50,998 | $ | 96,126 | ||||
| Net realized gain/(loss) | 4,757,419 | 328,256 | ||||||
| Net change in unrealized appreciation/(depreciation) | (3,363,332 | ) | (929,328 | ) | ||||
| Net Increase/(Decrease) in net assets resulting from operations | 1,445,085 | (504,946 | ) | |||||
| DISTRIBUTIONS TO SHAREHOLDERS: | ||||||||
| From net investment income | (19,996 | ) | (67,006 | ) | ||||
| From net realized gain on investments | (1,674,446 | ) | (1,140,548 | ) | ||||
| Decrease in net assets from distributions to shareholders | (1,694,442 | ) | (1,207,554 | ) | ||||
| CAPITAL SHARE TRANSACTIONS: | ||||||||
| Proceeds from shares sold | 1,418,143 | 2,250,018 | ||||||
| Net asset value of shares issued in reinvestment of distributions to shareholders | 1,664,429 | 1,167,652 | ||||||
| Payments for shares redeemed | (2,299,515 | ) | (8,569,249 | ) | ||||
| Net Increase/(Decrease) in net assets from capital share transactions | 783,057 | (5,151,579 | ) | |||||
| Total Increase/(Decrease) in Net Assets | 533,700 | (6,864,079 | ) | |||||
| NET ASSETS: | ||||||||
| Beginning of year | 14,325,648 | 21,189,727 | ||||||
| End of year | $ | 14,859,348 | $ | 14,325,648 | ||||
| Accumulated Net Investment Income | $ | 37,273 | $ | 6,897 | ||||
| SUMMARY OF CAPITAL SHARE ACTIVITY: | ||||||||
| Shares sold | 108,509 | 155,737 | ||||||
| Shares issued in reinvestment of distributions to shareholders | 132,072 | 83,563 | ||||||
| Shares redeemed | (170,964 | ) | (608,877 | ) | ||||
| Net Increase/(Decrease) in shares outstanding | 69,617 | (369,577 | ) | |||||
| Shares outstanding, beginning of period | 1,056,177 | 1,425,754 | ||||||
| Shares outstanding, end of period | 1,125,794 | 1,056,177 | ||||||
| 46 | www.jamesfunds.com |
| James Micro Cap Fund | Statements of Changes in Net Assets |
For the Year Ended June 30, 2017 | For the Year Ended June 30, 2016 | |||||||
| FROM OPERATIONS: | ||||||||
| Net investment income/(loss) | $ | 74,351 | $ | (63,407 | ) | |||
| Net realized gain/(loss) | 4,773,673 | (1,835,186 | ) | |||||
| Net change in unrealized appreciation/(depreciation) | (895,775 | ) | 1,258,293 | |||||
| Net Increase/(Decrease) in net assets resulting from operations | 3,952,249 | (640,300 | ) | |||||
| DISTRIBUTIONS TO SHAREHOLDERS: | ||||||||
| From net investment income | – | (27,110 | ) | |||||
| Decrease in net assets from distributions to shareholders | – | (27,110 | ) | |||||
| CAPITAL SHARE TRANSACTIONS: | ||||||||
| Proceeds from shares sold | 7,818,009 | 11,917,246 | ||||||
| Net asset value of shares issued in reinvestment of distributions to shareholders | – | 26,268 | ||||||
| Payments for shares redeemed, net of redemption fees | (6,476,089 | ) | (8,787,422 | ) | ||||
| Net Increase in net assets from capital share transactions | 1,341,920 | 3,156,092 | ||||||
| Total Increase in Net Assets | 5,294,169 | 2,488,682 | ||||||
| NET ASSETS: | ||||||||
| Beginning of year | 26,514,562 | 24,025,880 | ||||||
| End of year | $ | 31,808,731 | $ | 26,514,562 | ||||
| Accumulated Net Investment Income/(Loss) | $ | 97,622 | $ | (97,981 | ) | |||
| SUMMARY OF CAPITAL SHARE ACTIVITY: | ||||||||
| Shares sold | 464,020 | 785,068 | ||||||
| Shares issued in reinvestment of distributions to shareholders | – | 1,718 | ||||||
| Shares redeemed | (386,257 | ) | (612,860 | ) | ||||
| Net Increase in shares outstanding | 77,763 | 173,926 | ||||||
| Shares outstanding, beginning of period | 1,764,186 | 1,590,260 | ||||||
| Shares outstanding, end of period | 1,841,949 | 1,764,186 | ||||||
| Annual Report | June 30, 2017 | 47 |
| Statements of Changes in Net Assets | James Aggressive Allocation Fund |
For the Year Ended June 30, 2017 | For the Year Ended June 30, 2016 (a) | |||||||
| FROM OPERATIONS: | ||||||||
| Net investment income/(loss) | $ | 85,250 | $ | 41,027 | ||||
| Net realized gain/(loss) | 62,289 | (534,583 | ) | |||||
| Net change in unrealized appreciation/(depreciation) | 415,138 | 367,575 | ||||||
| Net Increase/(Decrease) in net assets resulting from operations | 562,677 | (125,981 | ) | |||||
| DISTRIBUTIONS TO SHAREHOLDERS: | ||||||||
| From net investment income | (84,996 | ) | (18,000 | ) | ||||
| Decrease in net assets from distributions to shareholders | (84,996 | ) | (18,000 | ) | ||||
| CAPITAL SHARE TRANSACTIONS: | ||||||||
| Proceeds from shares sold | 2,828,998 | 7,734,959 | ||||||
| Net asset value of shares issued in reinvestment of distributions to shareholders | 84,996 | 17,190 | ||||||
| Payments for shares redeemed | (609,188 | ) | (436,536 | ) | ||||
| Net Increase in net assets from capital share transactions | 2,304,806 | 7,315,613 | ||||||
| Total Increase in Net Assets | 2,782,487 | 7,171,632 | ||||||
| NET ASSETS: | ||||||||
| Beginning of year | 7,171,632 | – | ||||||
| End of year | $ | 9,954,119 | $ | 7,171,632 | ||||
| Accumulated Net Investment Income | $ | 22,955 | $ | 22,902 | ||||
| SUMMARY OF CAPITAL SHARE ACTIVITY: | ||||||||
| Shares sold | 291,401 | 805,029 | ||||||
| Shares issued in reinvestment of distributions to shareholders | 8,577 | 1,873 | ||||||
| Shares redeemed | (61,509 | ) | (49,576 | ) | ||||
| Net Increase in shares outstanding | 238,469 | 757,326 | ||||||
| Shares outstanding, beginning of period | 757,326 | – | ||||||
| Shares outstanding, end of period | 995,795 | 757,326 | ||||||
(a) | Fund commenced operations on July 1, 2015. |
| 48 | www.jamesfunds.com |
| James Long-Short Fund | Statements of Changes in Net Assets |
For the Year Ended June 30, 2017 | For the Year Ended June 30, 2016 | |||||||
| FROM OPERATIONS: | ||||||||
| Net investment income/(loss) | $ | 89,674 | $ | (193,501 | ) | |||
| Net realized gain/(loss) | 1,332,216 | 228,312 | ||||||
| Net change in unrealized appreciation/(depreciation) | 751,160 | (625,514 | ) | |||||
| Net Increase/(Decrease) in net assets resulting from operations | 2,173,050 | (590,703 | ) | |||||
| CAPITAL SHARE TRANSACTIONS: | ||||||||
| Proceeds from shares sold | 503,629 | 2,810,646 | ||||||
| Payments for shares redeemed | (5,922,071 | ) | (11,405,872 | ) | ||||
| Net Decrease in net assets from capital share transactions | (5,418,442 | ) | (8,595,226 | ) | ||||
| Total Decrease in Net Assets | (3,245,392 | ) | (9,185,929 | ) | ||||
| NET ASSETS: | ||||||||
| Beginning of year | 24,704,515 | 33,890,444 | ||||||
| End of year | $ | 21,459,123 | $ | 24,704,515 | ||||
| Accumulated Net Investment Loss | $ | – | $ | (128,890 | ) | |||
| SUMMARY OF CAPITAL SHARE ACTIVITY: | ||||||||
| Shares sold | 37,695 | 211,922 | ||||||
| Shares redeemed | (442,700 | ) | (869,329 | ) | ||||
| Net Decrease in shares outstanding | (405,005 | ) | (657,407 | ) | ||||
| Shares outstanding, beginning of period | 1,903,127 | 2,560,534 | ||||||
| Shares outstanding, end of period | 1,498,122 | 1,903,127 | ||||||
| Annual Report | June 30, 2017 | 49 |
| Financial Highlights | James Balanced: Golden Rainbow Fund – Retail Class |
| For a share outstanding throughout the years indicated. |
For the Year Ended June 30, 2017 | For the Year Ended June 30, 2016 | For the Year Ended June 30, 2015 | For the Year Ended June 30, 2014 | For the Year Ended June 30, 2013 | ||||||||||||||||
| Net asset value ‐ beginning of year | $ | 24.14 | $ | 24.96 | $ | 25.28 | $ | 22.55 | $ | 20.93 | ||||||||||
| Income/(Loss) from investment operations: | ||||||||||||||||||||
Net investment income(a) | 0.25 | 0.25 | 0.22 | 0.24 | 0.32 | |||||||||||||||
| Net realized and unrealized gain/(loss) | 0.68 | (0.41 | ) | 0.49 | 2.96 | 1.75 | ||||||||||||||
| Total from investment operations | 0.93 | (0.16 | ) | 0.71 | 3.20 | 2.07 | ||||||||||||||
| Less distributions: | ||||||||||||||||||||
| From net investment income | (0.28 | ) | (0.23 | ) | (0.18 | ) | (0.24 | ) | (0.30 | ) | ||||||||||
| From net realized gain on investments | (0.09 | ) | (0.43 | ) | (0.85 | ) | (0.23 | ) | (0.15 | ) | ||||||||||
| Total distributions | (0.37 | ) | (0.66 | ) | (1.03 | ) | (0.47 | ) | (0.45 | ) | ||||||||||
| Paid‐in capital from redemption fees | 0.00 | (b) | – | – | – | – | ||||||||||||||
| Net asset value at end of year | $ | 24.70 | $ | 24.14 | $ | 24.96 | $ | 25.28 | $ | 22.55 | ||||||||||
| Total return | 3.92 | % | (0.64 | )% | 2.90 | % | 14.32 | % | 9.98 | % | ||||||||||
| Net assets, end of year (in thousands) | $ | 2,163,786 | $ | 2,892,809 | $ | 2,973,350 | $ | 2,493,030 | $ | 1,735,736 | ||||||||||
| Ratios/Supplemental Data: | ||||||||||||||||||||
| Ratio of net expenses to average net assets | 0.96 | % | 0.96 | % | 0.97 | % | 1.00 | % | 1.04 | % | ||||||||||
| Ratio of net investment income to average net assets | 1.02 | % | 1.03 | % | 0.87 | % | 0.99 | % | 1.45 | % | ||||||||||
| Portfolio turnover rate | 46 | % | 46 | % | 43 | % | 32 | % | 58 | % | ||||||||||
(a) | Calculated using the average shares method. |
(b) | Amount rounds to less than $0.005 per share. |
| See Notes to Financial Statements. |
| 50 | www.jamesfunds.com |
| James Balanced: Golden Rainbow Fund – Institutional Class | Financial Highlights |
| For a share outstanding throughout the years indicated. |
For the Year Ended June 30, 2017 | For the Year Ended June 30, 2016 | For the Year Ended June 30, 2015 | For the Year Ended June 30, 2014 | For the Year Ended June 30, 2013 | ||||||||||||||||
| Net asset value ‐ beginning of year | $ | 23.89 | $ | 24.72 | $ | 25.05 | $ | 22.35 | $ | 20.81 | ||||||||||
| Income/(Loss) from investment operations: | ||||||||||||||||||||
Net investment income(a) | 0.31 | 0.31 | 0.28 | 0.29 | 0.38 | |||||||||||||||
| Net realized and unrealized gain/(loss) | 0.68 | (0.42 | ) | 0.50 | 2.94 | 1.73 | ||||||||||||||
| Total from investment operations | 0.99 | (0.11 | ) | 0.78 | 3.23 | 2.11 | ||||||||||||||
| Less distributions: | ||||||||||||||||||||
| From net investment income | (0.35 | ) | (0.29 | ) | (0.26 | ) | (0.30 | ) | (0.42 | ) | ||||||||||
| From net realized gain on investments | (0.09 | ) | (0.43 | ) | (0.85 | ) | (0.23 | ) | (0.15 | ) | ||||||||||
| Total distributions | (0.44 | ) | (0.72 | ) | (1.11 | ) | (0.53 | ) | (0.57 | ) | ||||||||||
| Paid‐in capital from redemption fees | 0.00 | (b) | – | – | – | 0.00 | (b) | |||||||||||||
| Net asset value at end of year | $ | 24.44 | $ | 23.89 | $ | 24.72 | $ | 25.05 | $ | 22.35 | ||||||||||
| Total return | 4.19 | % | (0.43 | )% | 3.20 | % | 14.59 | % | 10.26 | % | ||||||||||
| Net assets, end of year (in thousands) | $ | 1,220,095 | $ | 1,512,751 | $ | 1,277,641 | $ | 805,973 | $ | 555,766 | ||||||||||
| Ratios/Supplemental Data: | ||||||||||||||||||||
| Ratio of net expenses to average net assets | 0.71 | % | 0.71 | % | 0.73 | % | 0.75 | % | 0.79 | % | ||||||||||
| Ratio of net investment income to average net assets | 1.27 | % | 1.28 | % | 1.11 | % | 1.24 | % | 1.71 | % | ||||||||||
| Portfolio turnover rate | 46 | % | 46 | % | 43 | % | 32 | % | 58 | % | ||||||||||
(a) | Calculated using the average shares method. |
(b) | Amount rounds to less than $0.005 per share. |
| See Notes to Financial Statements. |
| Annual Report | June 30, 2017 | 51 |
| Financial Highlights | James Small Cap Fund |
| For a share outstanding throughout the years indicated. |
For the Year Ended June 30, 2017 | For the Year Ended June 30, 2016 | For the Year Ended June 30, 2015 | For the Year Ended June 30, 2014 | For the Year Ended June 30, 2013 | ||||||||||||||||
| Net asset value ‐ beginning of year | $ | 30.64 | $ | 33.47 | $ | 33.88 | $ | 28.66 | $ | 23.89 | ||||||||||
| Income/(Loss) from investment operations: | ||||||||||||||||||||
Net investment income/(loss)(a) | 0.21 | 0.17 | 0.01 | (0.00 | )(b) | 0.36 | ||||||||||||||
| Net realized and unrealized gain/(loss) | 3.28 | (1.64 | ) | (0.42 | ) | 6.12 | 4.92 | |||||||||||||
| Total from investment operations | 3.49 | (1.47 | ) | (0.41 | ) | 6.12 | 5.28 | |||||||||||||
| Less distributions: | ||||||||||||||||||||
| From net investment income | (0.17 | ) | (0.12 | ) | – | (0.90 | ) | (0.51 | ) | |||||||||||
| From net realized gain on investments | – | (1.24 | ) | – | – | – | ||||||||||||||
| Total distributions | (0.17 | ) | (1.36 | ) | – | (0.90 | ) | (0.51 | ) | |||||||||||
| Net asset value at end of year | $ | 33.96 | $ | 30.64 | $ | 33.47 | $ | 33.88 | $ | 28.66 | ||||||||||
| Total return | 11.36 | % | (4.62 | )% | (1.21 | )% | 21.46 | % | 22.51 | % | ||||||||||
| Net assets, end of year (in thousands) | $ | 67,603 | $ | 84,226 | $ | 125,145 | $ | 163,537 | $ | 161,271 | ||||||||||
| Ratios/Supplemental Data: | ||||||||||||||||||||
| Ratio of net expenses to average net assets | 1.50 | % | 1.50 | % | 1.50 | % | 1.50 | % | 1.50 | % | ||||||||||
| Ratio of net investment income/(loss) to average net assets | 0.62 | % | 0.55 | % | 0.04 | % | (0.00 | )%(c) | 1.39 | % | ||||||||||
| Portfolio turnover rate | 129 | % | 57 | % | 76 | % | 62 | % | 41 | % | ||||||||||
(a) | Calculated using the average shares method. |
(b) | Amount rounds to less than ($0.005) per share. |
(c) | Amount rounds to less than (0.005%). |
| See Notes to Financial Statements. |
| 52 | www.jamesfunds.com |
| James Mid Cap Fund | Financial Highlights |
| For a share outstanding throughout the years indicated. |
For the Year Ended June 30, 2017 | For the Year Ended June 30, 2016 | For the Year Ended June 30, 2015 | For the Year Ended June 30, 2014 | For the Year Ended June 30, 2013 | ||||||||||||||||
| Net asset value ‐ beginning of year | $ | 13.56 | $ | 14.86 | $ | 16.42 | $ | 12.97 | $ | 10.69 | ||||||||||
| Income/(Loss) from investment operations: | ||||||||||||||||||||
Net investment income/(loss)(a) | 0.05 | 0.08 | (0.02 | ) | 0.01 | 0.08 | ||||||||||||||
| Net realized and unrealized gain/(loss) | 1.29 | (0.42 | ) | (0.15 | ) | 3.87 | 2.23 | |||||||||||||
| Total from investment operations | 1.34 | (0.34 | ) | (0.17 | ) | 3.88 | 2.31 | |||||||||||||
| Less distributions: | ||||||||||||||||||||
| From net investment income | (0.02 | ) | (0.05 | ) | (0.01 | ) | (0.04 | ) | (0.03 | ) | ||||||||||
| From net realized gain on investments | (1.68 | ) | (0.91 | ) | (1.38 | ) | (0.39 | ) | – | |||||||||||
| Total distributions | (1.70 | ) | (0.96 | ) | (1.39 | ) | (0.43 | ) | (0.03 | ) | ||||||||||
| Net asset value at end of year | $ | 13.20 | $ | 13.56 | $ | 14.86 | $ | 16.42 | $ | 12.97 | ||||||||||
| Total return | 10.50 | % | (2.46 | )% | (0.86 | )% | 30.34 | % | 21.68 | % | ||||||||||
| Net assets, end of year (in thousands) | $ | 14,859 | $ | 14,326 | $ | 21,190 | $ | 18,631 | $ | 14,643 | ||||||||||
| Ratios/Supplemental Data: | ||||||||||||||||||||
| Ratio of net expenses to average net assets | 1.50 | % | 1.50 | % | 1.50 | % | 1.50 | % | 1.50 | % | ||||||||||
| Ratio of net investment income/(loss) to average net assets | 0.35 | % | 0.54 | % | (0.13 | )% | 0.05 | % | 0.64 | % | ||||||||||
| Portfolio turnover rate | 150 | % | 47 | % | 50 | % | 31 | % | 26 | % | ||||||||||
(a) | Calculated using the average shares method. |
| See Notes to Financial Statements. |
| Annual Report | June 30, 2017 | 53 |
| Financial Highlights | James Micro Cap Fund |
For a share outstanding throughout the years indicated.
For the Year Ended June 30, 2017 | For the Year Ended June 30, 2016 | For the Year Ended June 30, 2015 | For the Year Ended June 30, 2014 | For the Year Ended June 30, 2013 | ||||||||||||||||
| Net asset value ‐ beginning of year | $ | 15.03 | $ | 15.11 | $ | 17.40 | $ | 13.96 | $ | 11.71 | ||||||||||
| Income/(Loss) from investment operations: | ||||||||||||||||||||
Net investment income/(loss)(a) | 0.04 | (0.04 | ) | 0.06 | (0.05 | ) | 0.14 | |||||||||||||
| Net realized and unrealized gain/(loss) | 2.20 | (0.06 | ) | 1.12 | 3.50 | 2.25 | ||||||||||||||
| Total from investment operations | 2.24 | (0.10 | ) | 1.18 | 3.45 | 2.39 | ||||||||||||||
| Less distributions: | ||||||||||||||||||||
| From net investment income | – | (0.01 | ) | (0.02 | ) | (0.01 | ) | (0.14 | ) | |||||||||||
| From net realized gain on investments | – | – | (3.45 | ) | – | – | ||||||||||||||
| Total distributions | – | (0.01 | ) | (3.47 | ) | (0.01 | ) | (0.14 | ) | |||||||||||
| Paid‐in capital from redemption fees | 0.00 | (b) | 0.03 | 0.00 | (b) | 0.00 | (b) | 0.00 | (b) | |||||||||||
| Net asset value at end of year | $ | 17.27 | $ | 15.03 | $ | 15.11 | $ | 17.40 | $ | 13.96 | ||||||||||
| Total return | 14.90 | % | (0.44 | )% | 7.95 | % | 24.75 | % | 20.64 | % | ||||||||||
| Net assets, end of year (in thousands) | $ | 31,809 | $ | 26,515 | $ | 24,026 | $ | 16,256 | $ | 11,817 | ||||||||||
| Ratios/Supplemental Data: | ||||||||||||||||||||
| Ratio of net expenses to average net assets | 1.50 | % | 1.50 | % | 1.50 | % | 1.50 | % | 1.50 | % | ||||||||||
| Ratio of net investment income/(loss) to average net assets | 0.23 | % | (0.24 | )% | 0.38 | % | (0.31 | )% | 1.12 | % | ||||||||||
| Portfolio turnover rate | 97 | % | 44 | % | 52 | % | 96 | % | 46 | % | ||||||||||
(a) | Calculated using the average shares method. |
(b) | Amount rounds to less than $0.005 per share. |
| 54 | www.jamesfunds.com |
| James Aggressive Allocation Fund | Financial Highlights |
For a share outstanding throughout the years indicated.
For the Year Ended June 30, 2017 | For the Year Ended June 30, 2016(a) | |||||||
| Net asset value ‐ beginning of year | $ | 9.47 | $ | 10.00 | ||||
| Income/(Loss) from investment operations: | ||||||||
Net investment income(b) | 0.09 | 0.07 | ||||||
| Net realized and unrealized gain/(loss) | 0.53 | (0.57 | ) | |||||
| Total from investment operations | 0.62 | (0.50 | ) | |||||
| Less distributions: | ||||||||
| From net investment income | (0.09 | ) | (0.03 | ) | ||||
| Total distributions | (0.09 | ) | (0.03 | ) | ||||
| Net asset value at end of year | $ | 10.00 | $ | 9.47 | ||||
| Total return | 6.54 | % | (4.98 | )% | ||||
| Net assets, end of year (in thousands) | $ | 9,954 | $ | 7,172 | ||||
| Ratios/Supplemental Data: | ||||||||
| Ratio of net expenses to average net assets | 0.98 | % | 0.98 | % | ||||
| Ratio of net investment income to average net assets | 0.95 | % | 0.81 | % | ||||
| Portfolio turnover rate | 198 | % | 218 | % | ||||
(a) | Fund commenced operations on July 1, 2015. |
(b) | Calculated using the average shares method. |
| Annual Report | June 30, 2017 | 55 |
| Financial Highlights | James Long-Short Fund |
For a share outstanding throughout the years indicated.
For the Year Ended June 30, 2017 | For the Year Ended June 30, 2016 | For the Year Ended June 30, 2015 | For the Year Ended June 30, 2014 | For the Year Ended June 30, 2013 | ||||||||||||||||
| Net asset value ‐ beginning of year | $ | 12.98 | $ | 13.24 | $ | 13.80 | $ | 11.70 | $ | 9.99 | ||||||||||
| Income/(Loss) from investment operations: | ||||||||||||||||||||
Net investment income/(loss)(a) | 0.05 | (0.09 | ) | (0.13 | ) | (0.06 | ) | 0.04 | ||||||||||||
| Net realized and unrealized gain/(loss) | 1.29 | (0.17 | ) | (0.43 | ) | 2.16 | 1.71 | |||||||||||||
| Total from investment operations | 1.34 | (0.26 | ) | (0.56 | ) | 2.10 | 1.75 | |||||||||||||
| Less distributions: | ||||||||||||||||||||
| From net investment income | – | – | – | – | (0.04 | ) | ||||||||||||||
| Total distributions | – | – | – | – | (0.04 | ) | ||||||||||||||
| Net asset value at end of year | $ | 14.32 | $ | 12.98 | $ | 13.24 | $ | 13.80 | $ | 11.70 | ||||||||||
| Total return | 10.32 | % | (1.96 | )% | (4.06 | )% | 17.95 | % | 17.57 | % | ||||||||||
| Net assets, end of year (in thousands) | $ | 21,459 | $ | 24,705 | $ | 33,890 | $ | 23,446 | $ | 15,694 | ||||||||||
| Ratios/Supplemental Data: | ||||||||||||||||||||
Ratio of net expenses to average net assets(b) | 1.56 | % | 2.50 | % | 2.70 | % | 2.57 | % | 2.70 | % | ||||||||||
| Ratio of net investment income/(loss) to average net assets | 0.40 | % | (0.70 | )% | (0.92 | )% | (0.44 | )% | 0.35 | % | ||||||||||
| Portfolio turnover rate | 38 | % | 49 | % | 117 | % | 171 | % | 58 | % | ||||||||||
(a) | Calculated using the average shares method. |
(b) | Dividend and interest expense on securities sold short and interest expense totaled 0.06%, 1.00%, 1.20%, 1.07% and 1.20% of average net assets for the years ended June 30, 2017, June 30, 2016, June 30, 2015, June 30, 2014 and June 30, 2013, respectively. |
| 56 | www.jamesfunds.com |
| James Advantage Funds | Notes to Financial Statements |
| Annual Report | June 30, 2017 | 57 |
| Notes to Financial Statements | James Advantage Funds |
| Level 1 - | Unadjusted quoted prices in active markets for identical, unrestricted assets or liabilities that a Fund has the ability to access at the measurement date; |
| Level 2 - | Quoted prices which are not active, quoted prices for similar assets or liabilities in active markets or inputs other than quoted prices that are observable (either directly or indirectly) for substantially the full term of the asset or liability; or |
| Level 3 - | Significant unobservable prices or inputs (including a Fund’s own assumptions in determining the fair value of investments) where there is little or no market activity for the asset or liability at the measurement date. |
| James Balanced: Golden Rainbow Fund | |||||||||||||
| Valuation Inputs | |||||||||||||
Investments in Securities at Value* | Level 1 | Level 2 | Level 3 | Total | |||||||||
| Common Stocks | $ | 1,575,638,415 | $ | – | $ | – | $ | 1,575,638,415 | |||||
| Exchange Traded Funds | 24,802,187 | – | – | 24,802,187 | |||||||||
| Corporate Bonds | – | 359,192,487 | – | 359,192,487 | |||||||||
| Mortgage Backed Securities | – | 15,696,402 | – | 15,696,402 | |||||||||
| U.S. Government Agencies | – | 218,414,758 | – | 218,414,758 | |||||||||
| U.S. Treasury Bonds & Notes | 848,293,414 | – | – | 848,293,414 | |||||||||
| Foreign Bonds | – | 27,122,800 | – | 27,122,800 | |||||||||
| Municipal Bonds | – | 203,458,898 | – | 203,458,898 | |||||||||
| Short Term Investments | 175,877,619 | – | – | 175,877,619 | |||||||||
| Total | $ | 2,624,611,635 | $ | 823,885,345 | $ | – | $3,448,496,980 | ||||||
| 58 | www.jamesfunds.com |
| James Advantage Funds | Notes to Financial Statements |
June 30, 2017
| James Small Cap Fund | ||||||||||||||||
| Valuation Inputs | ||||||||||||||||
Investments in Securities at Value* | Level 1 | Level 2 | Level 3 | Total | ||||||||||||
| Common Stocks | $ | 65,056,777 | $ | – | $ | – | $ | 65,056,777 | ||||||||
| Short Term Investments | 2,594,858 | – | – | 2,594,858 | ||||||||||||
| Total | $ | 67,651,635 | $ | – | $ | – | $ | 67,651,635 | ||||||||
| James Mid Cap Fund | ||||||||||||||||
| Valuation Inputs | ||||||||||||||||
Investments in Securities at Value* | Level 1 | Level 2 | Level 3 | Total | ||||||||||||
| Common Stocks | $ | 14,108,805 | $ | – | $ | – | $ | 14,108,805 | ||||||||
| Short Term Investments | 734,615 | – | – | 734,615 | ||||||||||||
| Total | $ | 14,843,420 | $ | – | $ | – | $ | 14,843,420 | ||||||||
| James Micro Cap Fund | ||||||||||||||||
| Valuation Inputs | ||||||||||||||||
Investments in Securities at Value* | Level 1 | Level 2 | Level 3 | Total | ||||||||||||
| Common Stocks | $ | 31,303,307 | $ | – | $ | – | $ | 31,303,307 | ||||||||
| Short Term Investments | 521,211 | – | – | 521,211 | ||||||||||||
| Total | $ | 31,824,518 | $ | – | $ | – | $ | 31,824,518 | ||||||||
| James Aggressive Allocation Fund | ||||||||||||||||
| Valuation Inputs | ||||||||||||||||
Investments in Securities at Value* | Level 1 | Level 2 | Level 3 | Total | ||||||||||||
| Common Stocks | $ | 7,039,126 | $ | – | $ | – | $ | 7,039,126 | ||||||||
| Closed-End Funds | 37,170 | – | – | 37,170 | ||||||||||||
| Exchange Traded Funds | 285,210 | – | – | 285,210 | ||||||||||||
| Corporate Bonds | – | 268,731 | – | 268,731 | ||||||||||||
| U.S. Treasury Bonds & Notes | 2,153,451 | – | – | 2,153,451 | ||||||||||||
| Short Term Investments | 187,826 | – | – | 187,826 | ||||||||||||
| Total | $ | 9,702,783 | $ | 268,731 | $ | – | $ | 9,971,514 | ||||||||
| James Long-Short Fund | ||||||||||||||||
| Valuation Inputs | ||||||||||||||||
Investments in Securities at Value* | Level 1 | Level 2 | Level 3 | Total | ||||||||||||
| Common Stocks | $ | 18,493,447 | $ | – | $ | – | $ | 18,493,447 | ||||||||
| Short Term Investments | 2,896,802 | – | – | 2,896,802 | ||||||||||||
| Total | $ | 21,390,249 | $ | – | $ | – | $ | 21,390,249 | ||||||||
| Valuation Inputs | ||||||||||||||||
Other Financial Instruments* | Level 1 | Level 2 | Level 3 | Total | ||||||||||||
| Liabilities | ||||||||||||||||
| Securities Sold Short | ||||||||||||||||
| Common Stocks | $ | (2,790,371 | ) | $ | – | $ | – | $ | (2,790,371 | ) | ||||||
| TOTAL | $ | (2,790,371 | ) | $ | – | $ | – | $ | (2,790,371 | ) | ||||||
| * | For detailed descriptions of sector and industry, see the accompanying Schedule of Investments. |
| Annual Report | June 30, 2017 | 59 |
| Notes to Financial Statements | James Advantage Funds |
June 30, 2017
| 60 | www.jamesfunds.com |
| James Advantage Funds | Notes to Financial Statements |
June 30, 2017
| James Balanced: Golden Rainbow Fund | James Small Cap Fund | James Mid Cap Fund | James Micro Cap Fund | James Aggressive Allocation Fund | James Long- Short Fund | |||||||||||||||||||
| Paid-in capital | $ | (156 | ) | $ | (37 | ) | $ | – | $ | (36 | ) | $ | – | $ | (39,302 | ) | ||||||||
| Accumulated net investment income/(loss) | (1,716,740 | ) | 409,461 | (626 | ) | 121,252 | (201 | ) | 39,216 | |||||||||||||||
| Accumulated net realized gain/(loss) | 1,716,896 | (409,424 | ) | 626 | (121,216 | ) | 201 | 86 | ||||||||||||||||
| Included in the amounts reclassified above were net operating losses offset to Paid-in capital, were as follows | $ | – | $ | – | $ | – | $ | – | $ | – | $ | 39,302 | ||||||||||||
| James Balanced: Golden Rainbow Fund | James Small Cap Fund | James Mid Cap Fund | James Micro Cap Fund | James Aggressive Allocation Fund | James Long- Short Fund | |||||||||||||||||||
| Tax cost of portfolio investments | $ | 3,047,958,417 | $ | 54,597,554 | $ | 13,917,023 | $ | 26,756,753 | $ | 9,197,641 | $ | 16,063,215 | ||||||||||||
| Gross unrealized appreciation | $ | 427,387,736 | $ | 14,247,756 | $ | 1,261,549 | $ | 6,634,233 | $ | 879,550 | $ | 19,265,774 | ||||||||||||
| Gross unrealized depreciation | (26,849,173 | ) | (1,193,675 | ) | (335,152 | ) | (1,566,468 | ) | (105,677 | ) | (13,938,740 | ) | ||||||||||||
| Net appreciation of foreign currency and derivatives | 8,671 | 65 | – | – | – | 55,044 | ||||||||||||||||||
| Net unrealized appreciation | 400,547,234 | 13,054,146 | 926,397 | 5,067,765 | 773,873 | 5,382,078 | ||||||||||||||||||
| Accumulated capital gains/(losses) | 88,107,503 | 7,846,071 | 3,054,678 | 2,102,729 | (463,128 | ) | (851,222 | ) | ||||||||||||||||
| Undistributed ordinary income | 1,147,937 | 407,486 | 394,917 | 97,622 | 22,955 | – | ||||||||||||||||||
| Total | $ | 489,802,674 | $ | 21,307,703 | $ | 4,375,992 | $ | 7,268,116 | $ | 333,700 | $ | 4,530,856 | ||||||||||||
| Annual Report | June 30, 2017 | 61 |
| Notes to Financial Statements | James Advantage Funds |
June 30, 2017
| James Balanced: Golden Rainbow Fund | James Small Cap Fund | James Mid Cap Fund | James Micro Cap Fund | James Aggressive Allocation Fund | James Long- Short Fund | |||||||||||||||||||
| Ordinary Income | $ | 49,812,849 | $ | 400,002 | $ | 131,210 | $ | – | $ | 84,996 | $ | – | ||||||||||||
| Long‐Term Capital Gains | 15,722,370 | – | 1,563,232 | – | – | – | ||||||||||||||||||
| Total | $ | 65,535,219 | $ | 400,002 | $ | 1,694,442 | $ | – | $ | 84,996 | $ | – | ||||||||||||
| James Balanced: Golden Rainbow Fund | James Small Cap Fund | James Mid Cap Fund | James Micro Cap Fund | James Aggressive Allocation Fund | James Long- Short Fund | |||||||||||||||||||
| Ordinary Income | $ | 45,525,513 | $ | 517,857 | $ | 67,006 | $ | 27,110 | $ | 18,000 | $ | – | ||||||||||||
| Long‐Term Capital Gains | 77,342,586 | 4,796,221 | 1,140,548 | – | – | – | ||||||||||||||||||
| Total | $ | 122,868,099 | $ | 5,314,078 | $ | 1,207,554 | $ | 27,110 | $ | 18,000 | $ | – | ||||||||||||
| Amount | ||||
| James Balanced: Golden Rainbow Fund | $ | 28,247,484 | ||
| James Small Cap Fund | 2,405,338 | |||
| James Micro Cap Fund | 1,472,084 | |||
| James Long‐Short Fund | 1,030,845 | |||
| Short Term | Long Term | |||||||
| James Aggressive Allocation Fund | $ | 346,134 | $ | – | ||||
| James Long‐Short Fund | 488,779 | – | ||||||
| Amount | ||||
| James Aggressive Allocation Fund | $ | 116,994 | ||
| James Long‐Short Fund | 362,443 | |||
| Purchases | Sales | |||||||
| James Balanced: Golden Rainbow Fund | $ | 492,700,410 | $ | 953,124,375 | ||||
| James Aggressive Allocation Fund | 4,052,146 | 3,439,146 | ||||||
| Purchases | Sales | |||||||
| James Balanced: Golden Rainbow Fund | $ | 1,271,717,724 | $ | 1,976,463,464 | ||||
| James Small Cap Fund | 97,554,343 | 123,869,188 | ||||||
| James Mid Cap Fund | 20,655,866 | 21,571,227 | ||||||
| James Micro Cap Fund | 30,997,565 | 28,108,398 | ||||||
| James Aggressive Allocation Fund | 15,287,928 | 13,601,848 | ||||||
| James Long‐Short Fund | 7,919,222 | 16,570,021 | ||||||
| 4. | MANAGEMENT FEE AND OTHER TRANSACTIONS WITH AFFILIATES |
| 62 | www.jamesfunds.com |
| James Advantage Funds | Notes to Financial Statements |
June 30, 2017
| Average Total Net Assets | Contractual Fee |
| Up to and including $500 million | 0.74% |
| Over $500 million and including $1 billion | 0.70% |
| Over $1 billion and including $2 billion | 0.65% |
| Over $2 billion | 0.60% |
| Average Total Net Assets | Contractual Fee |
| Up to and including $500 million | 1.25% |
| Over $500 million and including $1 billion | 1.20% |
| Over $1 billion and including $2 billion | 1.15% |
| Over $2 billion | 1.10% |
| Average Total Net Assets | Contractual Fee |
| Up to and including $500 million | 1.25% |
| Over $500 million and including $1 billion | 1.20% |
| Over $1 billion and including $2 billion | 1.15% |
| Over $2 billion | 1.10% |
| Average Total Net Assets | Contractual Fee |
| Up to and including $500 million | 1.50% |
| Over $500 million | 1.45% |
| Average Total Net Assets | Contractual Fee |
| Up to and including $500 million | 0.98% |
| Over $500 million and including $1 billion | 0.95% |
| Over $1 billion and including $2 billion | 0.90% |
| Over $2 billion | 0.85% |
| Average Total Net Assets | Contractual Fee |
| Up to and including $500 million | 1.25% |
| Over $500 million and including $1 billion | 1.20% |
| Over $1 billion and including $2 billion | 1.15% |
| Over $2 billion | 1.10% |
| Annual Report | June 30, 2017 | 63 |
| Notes to Financial Statements | James Advantage Funds |
June 30, 2017
| Fund | Maximum Balance Available | Interest Rate | Expiration Date | |||
| James Balanced: Golden Rainbow Fund | $ | 50,000,000 | Prime Rate* | July 10, 2018 | ||
| James Small Cap Fund | $ | 3,500,000 | Prime Rate* | July 10, 2018 | ||
| James Mid Cap Fund | $ | 750,000 | Prime Rate* | July 10, 2018 | ||
| James Micro Cap Fund | $ | 1,500,00 | Prime Rate* | July 10, 2018 | ||
| James Aggressive Allocation Fund | $ | 500,000 | Prime Rate* | July 10, 2018 | ||
| James Long‐Short Fund | $ | 3,000,000 | Prime Rate* | July 10, 2018 | ||
| * | The rate at which the Bank announces as its prime lending rate. |
| 64 | www.jamesfunds.com |
| Annual Report | June 30, 2017 | 65 |
| Additional Information | James Advantage Funds |
| Amount | |
| James Balanced: Golden Rainbow Fund | 88.71% |
| James Small Cap Fund | 100.00% |
| James Mid Cap Fund | 38.86% |
| James Micro Cap Fund | 0% |
| James Long-Short Fund | 0% |
| James Aggressive Allocation Fund | 100.00% |
| Amount | |
| James Balanced: Golden Rainbow Fund | 82.42% |
| James Small Cap Fund | 100.00% |
| James Mid Cap Fund | 38.86% |
| James Micro Cap Fund | 0% |
| James Long-Short Fund | 0% |
| James Aggressive Allocation Fund | 100.00% |
| 66 | www.jamesfunds.com |
| James Advantage Funds | Disclosure Regarding Approval of Fund Advisory Agreements |
| Annual Report | June 30, 2017 | 67 |
| Disclosure Regarding Approval of Fund Advisory Agreements | James Advantage Funds |
| 68 | www.jamesfunds.com |
| James Advantage Funds | Disclosure Regarding Approval of Fund Advisory Agreements |
| Annual Report | June 30, 2017 | 69 |
| Trustees & Officers | James Advantage Funds |
| INTERESTED TRUSTEES | ||||
| Name/Address*/Age | Position(s) With Fund/Time Served/During Past 5 years1 | Principal Occupation by Trustee | Number of Portfolios in Fund Complex Overseen | Other Directorships Held by Trustee Outside During the Past Five Years |
Barry R. James2, CFA James Investment Research, Inc. 1349 Fairground Road Beavercreek, OH 45385 Year of Birth: 1956 | President & Trustee since 1997 | President and CEO, James Investment Research (2005 - present); CEO and Director, James Capital Alliance (1992 - present) | 6 | Director, Heart to Honduras (2006 – present); Director, FAIR Foundation (2010 - present) |
INDEPENDENT TRUSTEES | ||||
Name/Address*/Age | Position(s) With Funds/Time Served/During Past 5 years1 | Principal Occupation(s) by Trustee | Number of Portfolios in Fund Complex Overseen | Other Directorships Held by Trustee Outside During the Past Five Years |
Anthony P. D’Angelo Year of Birth: 1930 | Trustee since 1997 | Retired, Professor Emeritus, Graduate School of Logistics and Acquisitions Management, Air Force Institute of Technology, Wright-Patterson AFB, Ohio (Retired since 1999) | 6 | None |
Leslie L. Brandon Year of Birth: 1942 | Trustee since 2003 | Retired Partner, Ernst & Young LLP, Columbus, Ohio (1966 -2000) | 6 | None |
Ronald D. Brown Year of Birth: 1953 | Trustee Since 2014 | Chief Operating Officer, The Armor Group (2013-Present); Chief Financial Officer, Makino Inc. (2010 - 2013); Managing Director, Taft Business Consulting LLC. (2009 - 2013) | 6 | Director, Currently Lead Director, of AO Smith Corporation (2001 - present); Board Trustee of University of Cincinnati (2013 - present); Director, Zep, Inc. (2010 – 2015)Director of Makino Inc. (2010 - 2013) |
Robert F. Chelle Year of Birth: 1948 | Trustee since 2014 | Retired Founding Director of the L. William Crotty Center for Entrepreneurial Leadership at the University of Dayton (1999 – 2015); President/CEO, High Voltage Maintenance Corp, Dayton, OH (1974-1999) | 6 | Director of DRT Mfg. Co.(2007 –present), School Outfitters (2010 – present), Harlamert-HRG Food Brokerage, Prime Controls (2008 – present), The Siebenthaler Company (1986 – present). |
Richard C. Russell Year of Birth: 1946 | Trustee since 2003 | Consultant, Danis Companies (construction and real estate development firm), (2002 -present); Retired CEO & CFO, Danis Companies (1983-2002) | 6 | Director, Excellence in Motivation (1996 - present); Director, DRT Manufacturing, Co. (1999 - present); Director, Catholic Community Foundation for the Archdiocese of Cincinnati, Inc. (2015 –present); Director, Catholic Education Foundation for the Archdiocese of Cincinnati, Inc. (2015 – present); |
* | All Trustees may be contacted at c/o The James Advantage Funds, Attn: Secretary, 1349 Fairground Road, Xenia, OH 45385 |
1 | Each Trustee is elected to serve in accordance with the Declaration of Trust and Bylaws of the Trust until his or her successor is duly elected and qualified. |
2 | Mr. James is an “interested person” of the Trust as defined in the 1940 Act because of his relationship to James Investment Research, Inc., which serves as the investment adviser to the Trust. |
| 70 | www.jamesfunds.com |
| James Advantage Funds | Trustees & Officers |
| OFFICERS | ||
| Name/Address/Age | Positions Held With Fund/ Date Service Began | Principal Occupation by Officer |
Thomas L. Mangan James Investment Research, Inc. 1349 Fairground Road Xenia, OH 45385 Year of Birth: 1949 | Vice President, Secretary and Chief Financial Officer since 1997 | Senior Vice President, James Investment Research, Inc., Chief Compliance Officer, James Investment Research, Inc. (1997-2011) |
Lesley Ott James Investment Research, Inc. 1349 Fairground Road Xenia, OH 45385 Year of Birth: 1983 | Chief Compliance Officer since 2012 | Chief Compliance Officer, James Investment Research, Inc. and James Capital Alliance, Inc. (since 2012), Deputy Operating Officer, James Investment Research, Inc. (since 2017), Deputy Chief Compliance Officer, James Investment Research, Inc. and James Capital Alliance, Inc. (2010-2011) |
Richard Brian Culpepper James Investment Research, Inc. 1349 Fairground Road Xenia, OH 45385 Year of Birth: 1972 | Assistant Secretary since 2011 | Vice President, James Investment Research, Inc. (since 2014), First Vice President of James Investment Research, Inc. (2009-2014) |
Andrea E. Kuchli, c/o ALPS Fund Services, Inc. 1290 Broadway, Ste. 1100 Denver, CO 80203 Year of Birth: 1985 | Assistant Secretary since 2015 | Vice President and Senior Counsel of ALPS Fund Services, Inc. (2015 – present), Secretary of the ALPS Variable Investment Trust (2016 – present), Secretary of the Elevation ETF Trust (2015 –present), Secretary of the Principal Real Estate Income Fund (2015 – present), Assistant Secretary of the ALPS ETF Trust (2015 – present), Associate Attorney, Davis Graham & Stubbs LLP (2014 –2015), Associate Attorney, Dechert LLP (2011 – 2014) |
Amy Broerman James Investment Research, Inc. 1349 Fairground Road Xenia, OH 45385 Year of Birth: 1972 | Treasurer since 2012 | Assistant Vice President of Operations, James Investment Research, Inc. (since 2008), Assistant Treasurer of James Advantage Funds (2002-2012) |
Jennell Panella c/o ALPS Fund Services, Inc. 1290 Broadway, Ste. 1100 Denver, CO 80203 Year of Birth: 1974 | Assistant Treasurer since 2013 | Fund Controller of ALPS Fund Services, Inc. (since June 2012), Financial Reporting Manager, Parker Global Strategies, LLC (2009-2012) |
Brian P. Shepardson James Investment Research, Inc. 1349 Fairground Road Xenia, OH 45385 Year of Birth: 1973 | Assistant Treasurer since 2015 | First Vice President, James Investment Research, Inc. (since 2014), Assistant Vice President of James Investment Research, Inc. (2009-2014). |
| Annual Report | June 30, 2017 | 71 |
| Privacy Policy | James Advantage Funds |
June 30, 2017 (Unaudited)
| • | Social Security number and wire transfer instructions |
| • | account transactions and transaction history |
| • | investment experience and purchase history |
| Reasons we can share your personal information: | Does James Advantage Funds share information? | Can you limit this sharing? |
| For our everyday business purposes ‐ such as to process your transactions, maintain your account(s), respond to court orders and legal investigations, or report to credit bureaus. | YES | NO |
| For our marketing purposes ‐ to offer our products and services to you. | YES | NO |
| For joint marketing with other financial companies. | NO | We don’t share |
| For our affiliates’ everyday business purposes ‐ information about your transactions and records. | NO | We don’t share |
| For our affiliates’ everyday business purposes ‐ information about your credit worthiness. | NO | We don’t share |
| For our affiliates to market to you | NO | We don’t share |
| For non‐affiliates to market to you | NO | We don’t share |
| What we do: | |||
| How does James Advantage Funds protect my personal information? | To protect your personal information from unauthorized access and use, we use security measures that comply with federal law. These measures include computer safeguards and secured files and buildings. Our service providers are held accountable for adhering to strict policies and procedures to prevent any misuse of your nonpublic personal information. | ||
| How does James Advantage Funds collect my personal information? | We collect your personal information, for example, when you | ||
| ● | open an account or deposit money | ||
| ● | direct us to buy securities or direct us to sell your securities | ||
| ● | seek advice about your investments | ||
| We also collect your personal information from others, such as credit bureaus, affiliates, or other companies. | |||
| Why can’t I limit all sharing? | Federal law gives you the right to limit only: | ||
| ● | sharing for affiliates’ everyday business purposes – information about your creditworthiness. | ||
| ● | affiliates from using your information to market to you. | ||
| ● | sharing for nonaffiliates to market to you. | ||
| State laws and individual companies may give you additional rights to limit sharing. | |||
| Definitions | |||
| Affiliates | Companies related by common ownership or control. They can be financial and non‐financial companies. | ||
| ● | Our affiliates include financial companies, such as James Investment Research, Inc. and James Capital Alliance. | ||
| Non‐affiliates | Companies not related by common ownership or control. They can be financial and non‐financial companies. | ||
| ● | James Advantage Funds does not share with nonaffiliates so they can market to you. | ||
| Joint marketing | A formal agreement between nonaffiliated financial companies that together market financial products or services to you. | ||
| ● | James Advantage Funds does not jointly market. | ||
| 72 | www.jamesfunds.com |

| (a) | As of the end of the period covered by this report, the registrant has adopted a code of ethics that applies to the registrant's principal executive officer, principal financial officer, principal accounting officer or controller, or persons performing similar functions, regardless of whether these individuals are employed by the registrant or a third party. |
| (b) | For purposes of this item, “code of ethics” means written standards that are reasonably designed to deter wrongdoing and to promote: |
| (1) | Honest and ethical conduct, including the ethical handling of actual or apparent conflicts of interest between personal and professional relationships; |
| (2) | Full, fair, accurate, timely, and understandable disclosure in reports and documents that a registrant files with, or submits to, the Commission and in other public communications made by the registrant; |
| (3) | Compliance with applicable governmental laws, rules, and regulations; |
| (4) | The prompt internal reporting of violations of the code to an appropriate person or persons identified in the code; and |
| (5) | Accountability for adherence to the code. |
| (c) | Amendments: During the period covered by this report, there were no amendments to the provisions of the code of ethics. |
| (d) | Waivers: During the period covered by this report, the registrant has not granted any express or implicit waivers from the provisions of the code of ethics. |
| (e) | Not applicable to this report. |
| (f) | The Registrant’s Code of Ethics is attached as an Exhibit hereto. |
| (a) | The registrant’s board of trustees has determined that Leslie L. Brandon is an audit committee financial expert. Mr. Brandon is independent for purposes of this Item 3. |
| (b) | For purposes of this Item, an “audit committee financial expert” means a person who has the following attributes: |
| (1) | An understanding of generally accepted accounting principles and financial statements; |
| (2) | The ability to assess the general application of such principles in connection with the accounting for estimates, accruals, and reserves; |
| (3) | Experience preparing, auditing, analyzing, or evaluating financial statements that present a breadth and level of complexity of accounting issues that are generally comparable to the breadth and complexity of issues that can reasonably be expected to be raised by the registrant’s financial statements, or experience actively supervising one or more persons engaged in such activities; |
| (4) | An understanding of internal control over financial reporting; and |
| (5) | An understanding of audit committee functions. |
| (c) | A person shall have acquired such attributes through: |
| (1) | Education and experience as a principal financial officer, principal accounting officer, controller, public accountant, or auditor or experience in one or more positions that involve the performance of similar functions; |
| (2) | Experience actively supervising a principal financial officer, principal accounting officer, controller, public accountant, auditor, or person performing similar functions; |
| (3) | Experience overseeing or assessing the performance of companies or public accountants with respect to the preparation, auditing, or evaluation of financial statements; or |
| (4) | Other relevant experience. |
| (1) | A person who is determined to be an audit committee financial expert will not be deemed an “expert” for any purpose, including without limitation for purposes of Section 11 of the Securities Act of 1933 (15 U.S.C. 77k), as a result of being designated or identified as an audit committee financial expert pursuant to this Item. |
| (2) | The designation or identification of a person as an audit committee financial expert pursuant to this Item does not impose on such person any duties, obligations, or liability that are greater than the duties, obligations, and liability imposed on such person as a member of the audit committee and board of directors in the absence of such designation or identification. |
| (3) | The designation or identification of a person as an audit committee financial expert pursuant to this Item does not affect the duties, obligations, or liability of any other member of the audit committee or board of directors. |
| (a) | Audit Fees. |
| June 30, 2017 | June 30, 2016 |
| $110,000 | $106,800 |
| (b) | Audit-Related Fees. |
| Registrant | Adviser | |
| June 30, 2017 | $0 | $0 |
| June 30, 2016 | $0 | $0 |
| (c) | Tax Fees. |
| Registrant | Adviser | |
| June 30, 2017 | $15,760 | $0 |
| June 30, 2016 | $15,300 | $0 |
| (d) | All Other Fees. |
| Registrant | Adviser | |
| June 30, 2017 | $7,500 | $0 |
| June 30, 2016 | $0 | $0 |
| (e) | Pre-Approval Policies and Procedures. |
| (1) | Pursuant to the registrant’s Audit Committee Charter (the “Charter”), the Audit Committee is directly responsible for the appointment, termination, compensation, and oversight of the work of any registered public accounting firm employed by the registrant. In addition, the Charter provides that the Audit Committee is responsible for reviewing and approving in advance any and all proposals under which the independent auditor would provide “permissible non-audit services” (as defined in the Charter) to the registrant or to the investment adviser to the registrant (not including any sub-adviser whose role is primarily portfolio management and that is sub-contracted or overseen by the investment adviser to the registrant) or any entity controlling, controlled by, or under common control with the investment adviser that provides ongoing services to the registrant if those permissible non-audit services relate directly to the operations and financial reporting of the registrant. In determining whether to pre-approve non-audit services, the Audit Committee considers whether such services are consistent with the independent auditor’s independence. |
| Registrant | Adviser | |
| Audit Related | n/a | n/a |
| Tax Fees | 100% | n/a |
| Other Fees | 100% | n/a |
| (f) | Not applicable to the registrant. |
| (g) | Aggregate non-audit fees billed by the registrant’s accountant: |
| Registrant | Adviser | |
| June 30, 2017 | $12,071 | $0 |
| June 30, 2016 | $11,930 | $0 |
| (h) | The registrant’s audit committee of the board of trustees has considered that the provision of non-audit services that were rendered to an entity controlling, controlled by, or under common control with the registrant’s investment adviser that provides ongoing services to the registrant for the fiscal years ended June 30, 2017 and June 30, 2016, as identified above, that were not pre-approved pursuant to paragraph (c)(7)(ii) of Rule 2-01 of Regulation S-X, are compatible with maintaining Deloitte & Touche LLP’s independence. |
| (a) | The Schedule of Investments is included as part of the report to shareholders filed under Item 1 of this Form. |
| (b) | Not applicable to the registrant. |
| (a) | Based on an evaluation of the registrant's disclosure controls and procedures (as defined in Rule 30a-3(c) under the Investment Company Act of 1940, as amended), the registrant's principal executive officer and principal financial officer have concluded that the registrant's disclosure controls and procedures are effective as of a date within 90 days of the filing date of this report. |
| (b) | There were no significant changes in the registrant’s internal control over financial reporting (as defined in Rule 30a-3(d) under the Investment Company Act of 1940, as amended) that occurred during the second fiscal quarter of the period covered by this Report that have materially affected, or are reasonably likely to materially affect, the registrant’s internal control over financial reporting. |
| (a)(1) | Registrant’s Code of Ethics for Principal Executive and Principal Financial Officers, which is the subject of the disclosure required by Item 2 of Form N-CSR, is attached hereto as Exhibit 12(a)(1). |
| (a)(2) | Certifications required by Item 12(a)(2) of Form N-CSR are filed herewith as Exhibit 99.CERT. |
| (a)(3) | Not applicable. |
| (b) | Certifications required by Item 12(b) of Form N-CSR are filed herewith as Exhibit 99.906CERT. |
(Registrant) | The James Advantage Funds | |
By (Signature and Title) | ||
/s/ Barry R. James | ||
Barry R. James | ||
| President | ||
| Date: September 8, 2017 | ||
By (Signature and Title) | |
/s/ Barry R. James | |
Barry R. James | |
President | |
Date: September 8, 2017 | |
| By (Signature and Title) | |
| /s/ Thomas L. Mangan | |
| Thomas L. Mangan | |
| Chief Financial Officer | |
| Date: September 8, 2017 |