UNITED STATES
SECURITIES AND EXCHANGE COMMISSION
WASHINGTON, D.C. 20549
FORM N-CSR
CERTIFIED SHAREHOLDER REPORT OF REGISTERED
MANAGEMENT INVESTMENT COMPANIES
811-08411
(Investment Company Act file number)
The James Advantage Funds
(Exact name of registrant as specified in charter)
1349 Fairground Road
Xenia, Ohio 45385
(Address of principal executive offices) (Zip code)
Barry R. James
P.O. Box 8
Alpha, Ohio 45301
(Name and address of agent for service)
Registrant’s telephone number, including area code: (937) 426-7640
Date of fiscal year end: June 30
Date of reporting period: July 1, 2016 – December 31, 2016
Item 1. Reports to Stockholders.

James Balanced: Golden Rainbow Fund
James Small Cap Fund
James Mid Cap Fund
James Micro Cap Fund
James Aggressive Allocation Fund
James Long-Short Fund
TABLE OF CONTENTS
| Shareholder Letter | 1 |
| Growth of $10,000 Charts | 4 |
| Representation of Schedules of Investments | 8 |
| Disclosure of Fund Expenses | 9 |
| Schedule of Investments | |
| James Balanced: Golden Rainbow Fund | 10 |
| James Small Cap Fund | 21 |
| James Mid Cap Fund | 24 |
| James Micro Cap Fund | 26 |
| James Aggressive Allocation Fund | 29 |
| James Long-Short Fund | 32 |
| Statements of Assets and Liabilities | 36 |
| Statements of Operations | 38 |
| Statements of Changes in Net Assets | 39 |
| Financial Highlights | |
| James Balanced: Golden Rainbow Fund - Retail Class | 46 |
| James Balanced: Golden Rainbow Fund - Institutional Class | 47 |
| James Small Cap Fund | 48 |
| James Mid Cap Fund | 49 |
| James Micro Cap Fund | 50 |
| James Aggressive Allocation Fund | 51 |
| James Long-Short Fund | 52 |
| Notes to Financial Statements | 53 |
| Additional Information | 61 |
| Privacy Policy | 62 |
December 31, 2016 (Unaudited)
LETTER TO THE SHAREHOLDERS
OF THE JAMES ADVANTAGE FUND
Worries about China, the Brexit, and then the presidential election – wow, what a year for stock volatility! Of course, the Federal Reserve’s cautious tightening of rates also was a factor. Given all the headline disruptions, it is incredible that stocks closed the year with decent gains. But they did, and all of the James Advantage Funds ended the year in positive territory, as well.
The Markets Over the Past Six Months
The S&P 500, a good gauge of the stock market, returned 7.82% over the last six months of 2016, but it returned 5.75% of that in the last two months of the year, following the presidential election. Small capitalization companies fared better, with the Russell 2000 Index returning 18.68% for the last six months and 14.24% since the election. Over the six month period, Financial Services, Technology and Industrial stocks led the advance (using the Russell 3000 Index), while Consumer Staples and Utilities lagged with negative returns. Since October 31st, Financial Services, Energy and Industrials led the way with Consumer Staples in last place, showing a negative return. The bond markets generally retreated, especially after the election. Fears of rising deficits and a more aggressive tightening agenda by the Federal Reserve helped push bond prices lower.
Investment Goals and Objectives
The Balanced: Golden Rainbow Fund seeks to provide total return through a combination of growth and income and preservation of capital in declining markets. The Fund will generally hold positions in common stocks that in the aggregate constitute between 35 percent and 55 percent of the net assets. Bonds held in the portfolio must be rated Baa2 by Mooody’s/ BBB by S&P or higher at the time of purchase.
The Aggressive Allocation Fund seeks to provide total return through a combination of growth and income, but preservation of capital in declining markets is a secondary objective. Potential investors should be aware that this Fund will likely have a higher level of volatility than the Balanced: Golden Rainbow Fund. The Balanced: Golden Rainbow Fund’s benchmark that we follow most closely is a blend of 25% S&P 500, 25% Russell 2000 Index and 50% Barclays Capital U.S. Intermediate Government /Credit Bond Index. The benchmark is the same for all share classes of the Balanced: Golden Rainbow Fund. The Aggressive Allocation Fund’s benchmark that we follow most closely is a blend of 65% Russell 3000 Index and 35% Barclays U.S. Aggregate Government/Credit Bond Index.
The Small Cap Fund, Mid Cap Fund, Long-Short Fund and Micro Cap Fund seek to provide long-term capital appreciation. These Funds hold only equity securities and cash/cash equivalents under most circumstances. The prospectus identifies the following benchmarks: the Russell 2000 Index for the Small Cap Fund, the S&P Mid Cap 400 Value Index for the Mid Cap Fund, the Russell Microcap Index for the Micro Cap Fund and the S&P 500 for the Long-Short Fund.
Investment Philosophy
James Investment Research, Inc., the Funds’ Adviser, adheres to a strategy of value investing. The Adviser’s research, along with much academic research, supports the view that value investing outperforms growth investing over the longer-run. While some growth stocks may have astronomical returns, many eventually succumb to too much optimism and speculative investing and produce sharply inferior results. The dot-com stocks in 2000 and real estate stocks in 2008 bear this out. James Investment Research, Inc. ranks stocks based on their value characteristics and chooses those ranked highly for inclusion in the James Advantage Funds’ portfolios. The short selection works in reverse manner, seeking to short securities that are expensive and show relatively poor earnings.
The Adviser to the Funds has no soft-dollar arrangements, and therefore does not purchase research from any broker/dealers.
An investor’s risk tolerance is a very personal characteristic. Risk tolerances change as a person’s life and circumstances change. Therefore we have additional styles. The Aggressive Allocation Fund generally takes on greater risk than the Balanced: Golden Rainbow Fund, but still has the ability to reduce that risk in anticipation of a major decline in stock prices. There is never a guarantee that the Adviser can make such calls correctly, so investors in the Aggressive Allocation Fund should have higher risk appetites than those in the Balanced: Golden Rainbow Fund.
A slightly different interpretation of preservation of capital is the Long-Short Fund. It may use bonds to diversify the portfolio, but it primarily uses short positions in stocks the Adviser believes to be over-valued. To that extent, it may hold short positions even though the Adviser is positive on the stock market.
The Micro Cap Fund and the Small Cap Fund invest in smaller capitalization companies, which have greater volatility and are generally believed to be riskier (which the September returns proved to be true). The Mid Cap, Small Cap, and Micro Cap Funds are niche products designed to meet the objectives of investors who want to establish diversified positions in these areas. As all-equity products, they are intrinsically riskier than the other products that hold bonds. Still, these portfolios will hold stocks that are ranked highly by the James models and pass a thorough review by its researchers and portfolio managers.
| Semi-Annual Report | December 31, 2016 | 1 |
| Shareholder Letter | James Advantage Funds |
December 31, 2016 (Unaudited)Strategy for Meeting Fund Objectives
The Funds’ Adviser believes that preservation of capital in down markets is the key to long-term success. The great economist, Peter Bernstein, may have summarized this idea best when he said “At the extremes, the market is not random walk. At the extremes the market is more likely to destroy fortunes than to create them. The stock market is a risky place.” Hence, the Balanced: Golden Rainbow Fund seeks to preserve capital by constructing a portfolio of both bonds and stocks. My experience as Associate Adjunct Professor at Wright State University leads me to the conclusion that most academic textbooks note that bonds are uncorrelated with stocks, thus providing income as well as diversification. Of course, Bernstein was correct when he noted that the wisdom of this approach is most obvious when the market is at extremes, such as in 2008 and 2000.
The Small Cap Fund, the Mid Cap Fund, the Long-Short Fund, and the Micro Cap Fund look for stocks the Adviser believes to be undervalued, using its proprietary research to screen a database of over 8,500 stocks. A deterioration in a stock’s fundamental value characteristics can lead the Adviser to trim or sell that position.
One change that is in process is to increase the performance of the Mid Cap Fund by adding more securities to the portfolio and also allowing the sector weights to vary according to the number of highly ranked securities in that sector. This will increase the amount of turnover in the Fund and also increase the potential for a capital gain distribution during the year in which these changes are initiated.
Fund Performance
The Balanced: Golden Rainbow Fund strived to meet its objectives of income and preservation of capital in this volatile environment by running a moderate allocation to stocks and replacing lower yielding U.S. Treasury securities with some corporate bonds with higher yields. The Fund’s portfolio managers also reduced holdings of longer-term bonds as inflation expectations embedded in Treasury Inflation-Protected securities increased over the period. Rising bond yields mean falling bond prices, so this move was also consistent with the Fund’s objective of preservation of capital. Over the six month period ended December 31, 2016, the retail shares of the Balanced: Golden Rainbow Fund returned 2.52% and the institutional share class returned 2.68%. The Fund’s benchmark that we follow most closely returned 5.53%. The Fund trailed its benchmark as its positions in Real Estate Investment Trusts (REITs) hurt performance: Annaly Capital* (0.1% of portfolio), Brandywine Realty Trust (0.2% of portfolio), Chimera Investment Corp (0.2% of portfolio), Government Properties Income (0.1% of portfolio) and LTC Properties Inc. (0.1% of portfolio). Performance was also hurt by holdings in Barrick Gold (0.3% of portfolio), Newmont Mining (1.0% of portfolio) and the Gold Trust SPDR (0.6% of portfolio).
The Balanced: Golden Rainbow Fund paid out a regular dividend every quarter. The Fund’s retail class shares paid 11.288 cents/share in September and 6.791 cents/share in December. The institutional class shares paid 12.854 cents/share in September and 8.372 cents/share in December. In addition, the Fund paid all shareholders a long-term capital gains distribution of 9.475 cents/share in December.
Over the six months ended December 31, 2016, the Small Cap Fund returned 16.80% while its benchmark, the Russell 2000 Index, returned 18.68%. The Fund’s return was pulled down by its investment in First Majestic Silver (0.8% of portfolio), Smith & Wesson (1.9% of portfolio) and Helen of Troy (3.7% of portfolio). The Fund also had about 3% of the portfolio in cash, which weighed down the return.
The Small Cap Fund paid an ordinary dividend of 16.988 cents/share in December. The Mid Cap Fund paid an ordinary dividend of 1.774 cents/share, a short-term capital gain of 11.181 cents per share and a long-term capital gain of $1.5716/share in December. These Funds do not seek to pay dividends as they do not have income as a primary objective, but will distribute income (and capital gains) when earned.
The Mid Cap Fund returned 6.57% for the period versus the S&P Mid Cap 400 Value Index, which returned 14.75%. The Fund carried about 5.5% of its assets in cash, which weighed on the performance. It also had losses in RR Donnelly (0.77% of portfolio) and Agnico Eagle Mines (1.10% of portfolio).
The Micro Cap Fund returned 20.09% for the six months ended December 31, 2016. Its benchmark, the Russell Microcap Index returned 22.43%. The Fund underperformed the benchmark in part as holdings fell in Richmont Mines (3.4% of portfolio) and Natural Health Trend (2.62% of portfolio).
The Long-Short Fund may employ a short-selling strategy. Over the six month period, the Fund’s portfolio managers established short positions on various occasions and ended the year with short positions totaling approximately 9% of net assets (long positions and cash less the short positions). Short positions are established according to the Adviser’s proprietary research and may vary from none at all to all short positions. Over this six month period, the Fund was generally net long, meaning the short positions were less than the long positions. The Fund returned 4.31% over the six months ended December 31, 2016 compared to 7.82% on the S&P 500 Index. The Fund held positions in Smith & Wesson (2.4% of net assets) and RR Donnelly (1.0% of net assets) that were a drag on performance, and also held high levels of cash (14.81% of net assets) which hurt performance.
December 31, 2016 (Unaudited)
The Aggressive Allocation Fund commenced operations on July 1, 2015. It is similar to the Balanced: Golden Rainbow Fund in that its strategy requires it to hold both stocks and bonds. However, it is a much more aggressive Fund and generally will hold a higher allocation to stocks than the Balanced: Golden Rainbow Fund. Its benchmark that we follow most closely is 65% Russell 3000 Index and 35% Barclays U.S. Aggregate Government/Credit Bond Index. The Aggressive Allocation Fund paid an ordinary dividend of 8.861 cents per share in December. For the six months ended December 31, 2016, the Fund earned 4.94% while its benchmark blend earned 4.59%. The Funds outperformance was due, in part, to holdings in United Rentals (2.30% of assets), McDermott Intl (2.13% of assets) and Treasury Inflation Protected bonds (5.61% of assets).
Expectations for the Future
Some pundits have called the post-election rally a Hope Rally, as it is premised on the promise of a more favorable business climate in Washington and promises of lower taxes and less regulation. However, the Adviser believes it seems highly likely that tax rates, both individual and corporate, will be coming down. That should increase after tax earnings and lower Price/Earnings ratios. If these changes are substantial, the economy could benefit and additional increases in corporate earnings would result. While an expanding national debt will bother some, especially holders of debt, the markets may shrug that off as interest rates are still very low relative to a pre-2008 average. In that environment, the Adviser believes stocks should continue to perform well and may add to stock positions on corrections in that market. Conversely, sustained rallies in bonds will be difficult to achieve and a defensive strategy of shorter-term bonds will likely be best. If the President is not able to get his ideas concerning taxes and regulations passed into law, the Adviser believes current valuations will be much too high and a painful correction would probably occur. At this point, the markets are still embracing hope. Fund managers hope they are correct.
Thomas L. Mangan
Chief Financial Officer
Thomas Mangan is a registered representative of ALPS Distributors, Inc.
The statements and opinions expressed are those of the author, are as of the date of this report, are subject to change, and may not reflect the writer’s current views. All information is historical and not indicative of future results and subject to change. It should not be assumed that an investment in the securities mentioned will be profitable in the future. This information is not a recommendation to buy or sell.
You should carefully consider the investment objectives, potential risks, management fees, and charges and expenses of the Fund before investing. The Fund’s prospectus contains this and other information about the Fund, and should be read carefully before investing. You may obtain a current copy of the Fund’s prospectus by calling 1-800-995-2637.
Past performance is no guarantee of future results. The investment return and principal value of an investment in the Fund will fluctuate so that an investor’s shares, when redeemed, may be worth more or less than their original cost.
Price/Earnings ratio is a valuation of a company’s current share price compared to its per-share earnings.
Credit ratings apply the underlying holdings of the Fund, and not to the Fund itself. Moody's studies the financial condition of an entity to ascertain its creditworthiness. The credit ratings reflect the rating agency's opinion of the holdings financial condition and histories. The ratings shown are all considered investment grade and are listed by highest to lowest in percentage of what the Fund holds.
Soft dollar arrangements involve using client brokerage commissions to purchase research intended to help managers make investment decisions.
| * | Percentage of portfolio shown for each Fund consists of the average percentage held for the Fund during the six months ended December 31,2016. Holdings, as a percent of the portfolio, for each Fund as of December 31, 2016 are as follows: Balanced Golden Rainbow Fund: Annaly Capital (0.2%), Brandywine Realty Trust (0.2%), Chimera Investment Corp (0.3%), Government Properties Income (0.2%), LTC Properties Inc. (0.2%), Barrick Gold (0.1%), Newmont Mining (0.5%) and the Gold Trust SPDR (0.3%). Small Cap Fund: First Majestic Silver (0.1%), Smith & Wesson (0.7%) and Helen of Troy (2.4%). Mid Cap Fund: RR Donnelly (0.0%) and Agnico Eagle Mines (0.0%). Micro Cap Fund: Richmont Mines (0.0%) and Natural Health Trend (2.4%). Long-Short Fund: Smith & Wesson (1.0%) and RR Donnelly (0.0%). Aggressive Allocation Fund: United Rentals (2.8%0), McDermott Intl (2.5%) and Treasury Inflation Protected bonds (4.1%). Holdings are subject to change. |
| Semi-Annual Report | December 31, 2016 | 3 |
December 31, 2016 (Unaudited)
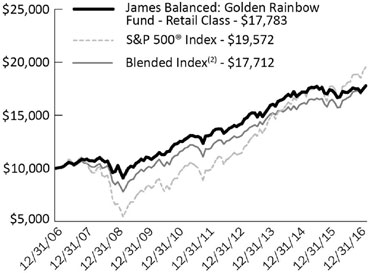
Comparison of the Change in Value of a $10,000 Investment in the James Balanced: Golden Rainbow Fund – Retail Class
James Balanced: Golden Rainbow Fund – Retail Class
Average Annual Total Returns
| | 1 Year | 5 Years | 10 Years | Since Inception(1) |
| James Balanced: Golden Rainbow – Retail Class | 4.17% | 6.25% | 5.93% | 7.85% |
S&P 500® Index | 11.96% | 14.66% | 6.95% | 9.45% |
Blended Index(2) | 9.45% | 8.28% | 5.88% | 8.01% |
Russell 2000® Index | 21.31% | 14.46% | 7.07% | 10.05% |
| Barclays Capital U.S. Intermediate Government/Credit Bond Index | 2.08% | 1.85% | 3.84% | 5.44% |
| (1) | Inception was July 1, 1991. |
| (2) | The Blended Index is comprised of a 25% weighting in the S&P 500® Index, a 25% weighting in the Russell 2000® Index and a 50% weighting in the Barclays Capital U.S. Intermediate Government/Credit Bond Index. |
| The total annual operating expense ratio as stated in the fee table of the most recent prospectus, dated November 1, 2016, was 0.97%. |
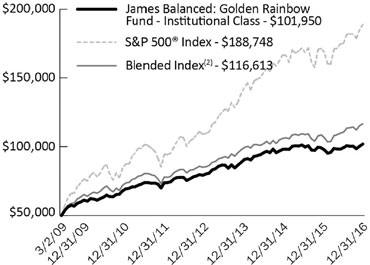
Comparison of the Change in Value of a $50,000 Investment in the James Balanced: Golden Rainbow Fund – Institutional Class
James Balanced: Golden Rainbow Fund – Institutional Class
Average Annual Total Returns
| | 1 Year | 5 Years | Since Inception(1) |
| James Balanced: Golden Rainbow – Institutional Class | 4.43% | 6.51% | 9.52% |
S&P 500® Index | 11.96% | 14.66% | 18.48% |
Blended Index(2) | 9.45% | 8.28% | 11.42% |
Russell 2000® Index | 21.31% | 14.46% | 19.79% |
| Barclays Capital U.S. Intermediate Government/ Credit Bond Index | 2.08% | 1.85% | 3.40% |
| (1) | Inception was March 2, 2009. |
(2) | The Blended Index is comprised of a 25% weighting in the S&P 500® Index, a 25% weighting in the Russell 2000® Index and a 50% weighting in the Barclays Capital U.S. Intermediate Government/Credit Bond Index. |
| The total annual operating expense ratio as stated in the fee table of the most recent prospectus, dated November 1, 2016, was 0.72%. |
Past performance does not guarantee future results. The performance data quoted represents past performance and current returns may be lower or higher. The investment return and principal value will fluctuate so that an investor’s shares, when redeemed, may be worth more or less than the original cost. These performance figures do not reflect the deduction of taxes that a shareholder would pay on Fund distributions or the redemption of Fund shares. Please call 1-800-995-2637 for most recent month-end performance information.
The S&P 500® Index is an unmanaged index of 500 common stocks chosen for market size, liquidity and industry group representation.
The Russell 2000® Index is a widely recognized, unmanaged index comprised of the 2,000 smallest U.S. domiciled publicly-traded common stocks of the Russell 3000® Index, which represents approximately 8% of the total market capitalization of the Russell 3000® Index, an unmanaged index of the 3,000 largest U.S. domiciled publicly-traded common stocks by market capitalization.
The Barclays Capital U.S. Intermediate Government/Credit Bond Index measures the performance of U.S. Dollar denominated U.S. Treasuries, government-related and investment grade U.S. corporate securities that have a remaining maturity of greater than one year and less than ten years.
The S&P 500® Index, Russell 2000® Index, Barclays Capital U.S. Intermediate Government/Credit Bond Index and Blended Index are widely recognized unmanaged indices of security prices and are representative of a broader market and range of securities than is found in the Fund’s portfolio. The Index returns do not reflect the deduction of expenses, which have been deducted from a Fund’s returns. The Index returns assume reinvestment of all distributions and do not reflect the deduction of taxes and fees. Individuals cannot invest directly in any Index; however, an individual can invest in exchange traded funds or other investment vehicles that attempt to track the performance of a benchmark index.
| Growth of $10,000 or $50,000 Charts |
December 31, 2016 (Unaudited)
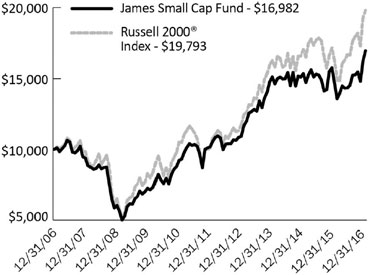
Comparison of the Change in Value of a $10,000 Investment in the James Small Cap Fund
James Small Cap Fund
Average Annual Total Returns
| | 1 Year | 5 Years | 10 Years | Since Inception(1) |
| James Small Cap Fund | 15.63% | 10.78% | 5.44% | 8.40% |
Russell 2000® Index | 21.31% | 14.46% | 7.07% | 9.15% |
(1) | Fund inception was October 2, 1998. |
| The total annual operating expense ratio as stated in the fee table of the most recent prospectus, dated November 1, 2016, was 1.51%. |
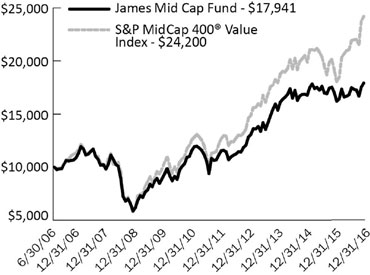
Comparison of the Change in Value of a $10,000 Investment in the James Mid Cap Fund
James Mid Cap Fund
Average Annual Total Returns
| | 1 Year | 5 Years | 10 Years | Since Inception(1) |
| James Mid Cap Fund | 5.33% | 10.89% | 5.43% | 5.72% |
S&P MidCap 400® Value Index | 26.53% | 16.07% | 8.48% | 8.78% |
| (1) | Fund inception was June 30, 2006. |
| The total annual operating expense ratio as stated in the fee table of the most recent prospectus, dated November 1, 2016, was 1.51%. |
Past performance does not guarantee future results. The performance data quoted represents past performance and current returns may be lower or higher. The investment return and principal value will fluctuate so that an investor’s shares, when redeemed, may be worth more or less than the original cost. These performance figures do not reflect the deduction of taxes that a shareholder would pay on Fund distributions or the redemption of Fund shares. Please call 1-800-995-2637 for most recent month-end performance information.
Mid, Small and Micro Cap investing involve greater risk not associated with investing in more established companies, such as greater price volatility, business risk, less liquidity and increased competitive threat.
The Mid Cap Fund invests in stocks of mid-cap companies which tend to be more volatile and can be less liquid than stocks of large-cap companies. Diversification does not guarantee a profit or protect against loss. Current and future portfolio holdings are subject to risk.
The Russell 2000® Index is a widely recognized, unmanaged index comprised of the 2,000 smallest U.S. domiciled publicly-traded common stocks of the Russell 3000® Index, which represents approximately 8% of the total market capitalization of the Russell 3000® Index, an unmanaged index of the 3,000 largest U.S. domiciled publicly-traded common stocks by market capitalization.
The S&P MidCap 400® Value Index is a recognized, unmanaged index of mid cap stocks considered to be value stocks using Standard and
Poor’s methodology.
The Russell 2000® Index and S&P MidCap Value 400® Index are widely recognized unmanaged indices of security prices and are representative of a broader market and range of securities than is found in the Fund’s portfolio. The Index returns do not reflect the deduction of expenses, which have been deducted from a Fund’s returns. The Index returns assume reinvestment of all distributions and do not reflect the deduction of taxes and fees. Individuals cannot invest directly in any Index; however, an individual can invest in exchange traded funds or other investment vehicles that attempt to track the performance of a benchmark index.
| Semi-Annual Report | December 31, 2016 | 5 |
December 31, 2016 (Unaudited)
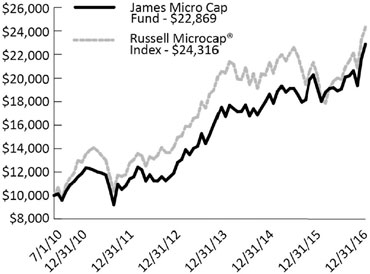
Comparison of the Change in Value of a $10,000 Investment in the James Micro Cap Fund
James Micro Cap Fund
Average Annual Total Returns
| | 1 Year | 5 Year | Since
Inception(1) |
| James Micro Cap Fund | 19.62% | 16.13% | 13.57% |
Russell Microcap® Index | 20.37% | 15.59% | 14.65% |
| (1) | Fund inception was July 1, 2010. |
| The total annual operating expense ratio as stated in the fee table of the most recent prospectus, dated November 1, 2016, was 1.51%. |
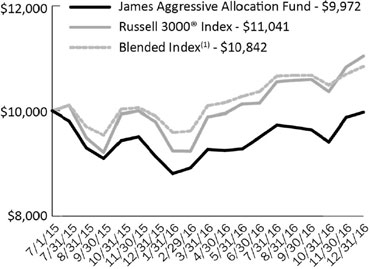
Comparison of the Change in Value of a $10,000 Investment in the James Aggressive Allocation Fund
James Aggressive Allocation Fund
Cumulative Annual Total Returns
| | 1 Year | Since Inception(1) |
| James Aggressive Allocation Fund | 9.09% | -0.19% |
Russell 3000® Index | 12.74% | 6.82% |
Blended Index(2) | 9.44% | 5.53% |
| (1) | Fund inception was July 1, 2015. |
| (2) | The Blended Index is comprised of a 35% weighting in the Barclays U.S. Aggregate Government/Credit Bond Index and a 65% weighting in the Russell 3000® Index. |
| The total annual operating expense ratio as stated in the fee table of the most recent prospectus, dated November 1, 2016, was 1.01%. |
Past performance does not guarantee future results. The performance data quoted represents past performance and current returns may be lower or higher. The investment return and principal value will fluctuate so that an investor’s shares, when redeemed, may be worth more or less than the original cost. These performance figures do not reflect the deduction of taxes that a shareholder would pay on Fund distributions or the redemption of Fund shares. Please call 1-800-995-2637 for most recent month-end performance information.
Mid, Small and Micro Cap investing involve greater risk not associated with investing in more established companies, such as greater price volatility, business risk, less liquidity and increased competitive threat.
The Russell Microcap® Index measures the performance of the microcap segment of the U.S. equity market. It makes up less than 3% of the U.S. equity market. It includes 1,000 of the smallest securities in the small cap Russell 2000® Index, plus the next smallest eligible securities by market cap.
The Russell 3000® Index is a stock market index of U.S. stocks. The index measures the performance of 3,000 publicly held U.S. companies based on total market capitalization, which represents approximately 98% of the investable U.S. equity market.
The Barclays U.S. Aggregate Government/Credit Bond Index (an unmanaged index generally representative of dollar denominated U.S. Treasuries, government related and investment grade U.S. corporate securities that have a remaining maturity greater than one year).
The Russell Microcap® Index and the Blended Index are widely recognized unmanaged indices of security prices and are representative of a broader market and range of securities than is found in the Fund’s portfolio. The Index returns do not reflect the deduction of expenses, which have been deducted from a Fund’s returns. The Index returns assume reinvestment of all distributions and do not reflect the deduction of taxes and fees. Individuals cannot invest directly in any Index; however, an individual can invest in exchange traded funds or other investment vehicles that attempt to track the performance of a benchmark index.
| Growth of $10,000 or $50,000 Charts |
December 31, 2016 (Unaudited)
Comparison of the Change in Value of a $10,000 Investment in the James Long-Short Fund
James Long-Short Fund
Average Annual Total Returns
| | 1 Year | 5 Years | Since Inception(1) |
| James Long-Short Fund | 2.19% | 7.18% | 5.66% |
S&P 500® Index | 11.96% | 14.66% | 12.31% |
| (1) | Fund inception was May 23, 2011. |
| The total annual operating expense ratio as stated in the fee table of the most recent prospectus, dated November 1, 2016, was 2.53%. |
Past performance does not guarantee future results. The performance data quoted represents past performance and current returns may be lower or higher. The investment return and principal value will fluctuate so that an investor’s shares, when redeemed, may be worth more or less than the original cost. These performance figures do not reflect the deduction of taxes that a shareholder would pay on Fund distributions or the redemption of Fund shares. Please call 1-800-995-2637 for most recent month-end performance information.
Short selling incurs significant additional risk; theoretically, stocks sold short have unlimited upside risk potential. In addition, this strategy depends on the Adviser’s ability to correctly identify undervalued and overvalued stocks, and that the stock markets are reasonable and efficient. Periods of extreme volatility may harm the performance of this product. The Long-Short Fund may have a high portfolio turnover rate. A high portfolio turnover rate can result in increased brokerage commission costs and may expose taxable shareholders to potentially larger current tax liability.
The S&P 500® Index is an unmanaged index of 500 common stocks chosen for market size, liquidity and industry group representation.
The S&P 500® Index is a widely recognized unmanaged index of security prices and are representative of a broader market and range of securities than is found in the Fund’s portfolio. The Index return does not reflect the deduction of expenses, which have been deducted from a Fund’s returns. The Index return assumes reinvestment of all distributions and does not reflect the deduction of taxes and fees. Individuals cannot invest directly in any Index; however, an individual can invest in exchange traded funds or other investment vehicles that attempt to track the performance of a benchmark index.
| Semi-Annual Report | December 31, 2016 | 7 |
December 31, 2016 (Unaudited)
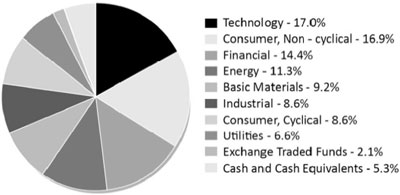
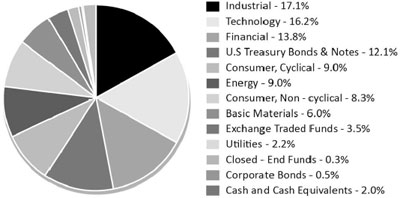
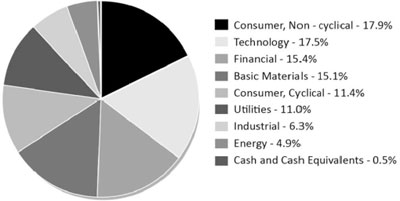
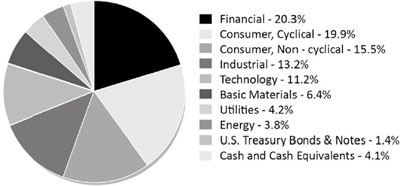
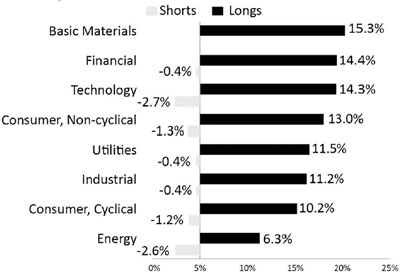
The illustrations below provide the industry sectors for the James Balanced: Golden Rainbow Fund, James Small Cap Fund, James Mid Cap Fund, James Micro Cap Fund, James Aggressive Allocation Fund and James Long-Short Fund.
James Balanced: Golden Rainbow Fund - Industry Sector Allocation
(% of Net Assets)*
James Mid Cap Fund - Industry Sector Allocation
(% of Net Assets)*
James Aggressive Allocation Fund - Industry Sector Allocation
(% of Net Assets)*
James Small Cap Fund - Industry Sector Allocation
(% of Net Assets)*
James Micro Cap Fund - Industry Sector Allocation
(% of Net Assets)*
James Long-Short Fund - Industry Sector Allocation
(% of Net Assets)*
(Cash and Cash Equivalents and Other Assets in Excess of Liabilities
not included)
| * | Holdings are subject to change, and may not reflect the current or future position of the portfolio. |
| Disclosure of Fund Expenses |
December 31, 2016 (Unaudited)
Example. As a shareholder of a Fund, you incur two types of costs: (1) transaction costs, including reinvested dividends or other distributions, and redemption fees; and (2) ongoing costs, including management fees, distribution (12b-1) fees and other Fund expenses. This example is intended to help you understand your ongoing costs (in dollars) of investing in the Funds and to compare these costs with the ongoing costs of investing in other mutual funds.
The example is based on an investment of $1,000 invested at the beginning of the period and held for the entire period July 1, 2016 through December 31, 2016.
Actual Expenses. The first line of the table below provides information about actual account values and actual expenses. You may use the information in this line, together with the amount you invested, to estimate the expenses that you paid over the period. Simply divide your account value by $1,000 (for example, an $8,600 account value divided by $1,000 = 8.6), then multiply the result by the number in the first line under the heading “Expense Paid During Period” to estimate the expenses you paid on your account during this period.
Hypothetical Example for Comparison Purposes. The second line of the table below provides information about hypothetical account values and hypothetical expenses based on a Fund’s actual expense ratio and an assumed rate of return of 5% per year before expenses, which is not the Fund’s actual returns. The hypothetical account values and expenses may not be used to estimate the actual ending account balance or expenses you paid for the period. You may use this information to compare the ongoing costs of investing in a Fund and other mutual funds. To do so, compare this 5% hypothetical example with the 5% hypothetical examples that appear in the shareholder reports of the other funds.
Please note that expenses shown in the table are meant to highlight and help you compare ongoing costs only. The calculations assume no shares were bought or sold during the period. Your actual costs may have been higher or lower, depending on the amount of your investment and the timing of any purchases or redemptions.
| | Net Expense Ratio Annualized December 31, 2016(a) | Beginning Account Value July 1, 2016 | Ending Account Value December 31, 2016 | Expense Paid During Period(b) |
| James Balanced: Golden Rainbow Fund | | | | |
| Retail Class Actual | 0.96% | $1,000.00 | $1,025.20 | $4.90 |
| Retail Class Hypothetical (5% return before expenses) | 0.96% | $1,000.00 | $1,020.37 | $4.89 |
| | | | | |
| Institutional Class Actual | 0.71% | $1,000.00 | $1,026.80 | $3.63 |
| Institutional Class Hypothetical (5% return before expenses) | 0.71% | $1,000.00 | $1,021.63 | $3.62 |
| | | | | |
| James Small Cap Fund | | | | |
| Actual | 1.50% | $1,000.00 | $1,168.00 | $8.20 |
| Hypothetical (5% return before expenses) | 1.50% | $1,000.00 | $1,017.64 | $7.63 |
| | | | | |
| James Mid Cap Fund | | | | |
| Actual | 1.50% | $1,000.00 | $1,065.70 | $7.81 |
| Hypothetical (5% return before expenses) | 1.50% | $1,000.00 | $1,017.64 | $7.63 |
| | | | | |
| James Micro Cap Fund | | | | |
| Actual | 1.50% | $1,000.00 | $1,200.90 | $8.32 |
| Hypothetical (5% return before expenses) | 1.50% | $1,000.00 | $1,017.64 | $7.63 |
| | | | | |
| James Aggressive Allocation Fund | | | | |
| Actual | 0.98% | $1,000.00 | $1,049.40 | $5.06 |
| Hypothetical (5% return before expenses) | 0.98% | $1,000.00 | $1,020.27 | $4.99 |
| | | | | |
| James Long‐Short Fund | | | | |
| Actual | 1.56%(c) | $1,000.00 | $1,043.10 | $8.03 |
| Hypothetical (5% return before expenses) | 1.56%(c) | $1,000.00 | $1,017.34 | $7.93 |
| (a) | Annualized, based on the Fund's most recent fiscal half year expenses. |
| (b) | Expenses are equal to the Fund's annualized expense ratio multiplied by the average account value over the period, multiplied by the number of days in the most recent fiscal half year (184), divided by 365. |
| (c) | Dividend and interest expense on securities sold short and interest expense totaled 0.06% (annualized) of average net assets for the six months ended December 31, 2016. Total annual operating expense of 1.56% includes the 0.06% of dividend and interest expense. |
| Schedule of Investments | James Balanced: Golden Rainbow Fund |
| December 31, 2016 (Unaudited) | |
| Shares or Principal Amount | | Value | |
| COMMON STOCKS-52.1% | |
| | | | Basic Materials-5.7% | | | |
| | 12,188 | | AEP Industries, Inc. | | $ | 1,415,027 | |
| | 323,670 | | Avery Dennison Corp. | | | 22,728,107 | |
| | 314,370 | | Barrick Gold Corp. | | | 5,023,633 | |
| | 553,420 | | Celanese Corp., Series A | | | 43,576,291 | |
| | 98,720 | | Ciner Resources LP | | | 2,870,778 | |
| | 447,690 | | Cooper Tire & Rubber Co. | | | 17,392,756 | |
| | 76,830 | | Dow Chemical Co. | | | 4,396,213 | |
| | 75,330 | | Enviva Partners LP | | | 2,018,844 | |
| | 22,670 | | First Majestic Silver Corp.* | | | 172,972 | |
| | 1,150,260 | | Goodyear Tire & Rubber Co. | | | 35,508,526 | |
| | 58,910 | | Hecla Mining Co. | | | 308,688 | |
| | 329,655 | | Innospec, Inc. | | | 22,581,367 | |
| | 21,500 | | International Paper Co. | | | 1,140,790 | |
| | 172,610 | | Lydall, Inc.* | | | 10,675,928 | |
| | 192,445 | | Neenah Paper, Inc. | | | 16,396,314 | |
| | 637,820 | | Newmont Mining Corp. | | | 21,730,527 | |
| | 16,610 | | Pan American Silver Corp. | | | 250,313 | |
| | 170,990 | | Universal Forest Products, Inc. | | | 17,471,758 | |
| | 86,000 | | Westlake Chemical Corp. | | | 4,815,140 | |
| | | | | 230,473,972 | |
| | | | | | |
| | | | Consumer, Cyclical-6.6% | | | | |
| | 642,220 | | Alaska Air Group, Inc. | | | 56,984,181 | |
| | 7,910 | | Asbury Automotive Group, Inc.* | | | 488,047 | |
| | 165,260 | | Avianca Holdings SA, Sponsored ADR | | | 1,593,106 | |
| | 590,000 | | Best Buy Co., Inc. | | | 25,175,300 | |
| | 371,875 | | Big Lots, Inc. | | | 18,671,844 | |
| | 456,765 | | Cato Corp., Class A | | | 13,739,491 | |
| | 112,210 | | Century Communities, Inc.* | | | 2,356,410 | |
| | 115,610 | | Flexsteel Industries, Inc. | | | 7,129,669 | |
| | 448,050 | | Foot Locker, Inc. | | | 31,762,264 | |
| | 707,670 | | Ford Motor Co. | | | 8,584,037 | |
| | 314,125 | | Hawaiian Holdings, Inc.* | | | 17,905,125 | |
| | 25,110 | | Hibbett Sports, Inc.* | | | 936,603 | |
| | 14,850 | | Insight Enterprises, Inc.* | | | 600,534 | |
| | 120,350 | | Lennar Corp., Class A | | | 5,166,625 | |
| | 95,080 | | M/I Homes, Inc.* | | | 2,394,114 | |
| | 102,690 | | Meritage Homes Corp.* | | | 3,573,612 | |
| | 89,740 | | Modine Manufacturing Co.* | | | 1,337,126 | |
| | 122,770 | | Patrick Industries, Inc.* | | | 9,367,351 | |
| | 86,720 | | PetMed Express, Inc. | | | 2,000,630 | |
| | 746,725 | | Southwest Airlines Co. | | | 37,216,774 | |
| | 32,000 | | Tata Motors, Ltd., Sponsored ADR | | | 1,100,480 | |
| | 43,890 | | Tower International, Inc. | | | 1,244,282 | |
| | 66,405 | | Wabash National Corp.* | | | 1,050,527 | |
| | 234,005 | | Wal-Mart Stores, Inc. | | | 16,174,426 | |
| | 32,200 | | Wesco Aircraft Holdings, Inc.* | | | 481,390 | |
| | | | | 267,033,948 | |
| | | | | | |
| | | | Consumer, Non-cyclical-8.1% | | | | |
| | 71,030 | | Aetna, Inc. | | | 8,808,430 | |
| | 71,935 | | Anthem, Inc. | | | 10,342,095 | |
| | 24,530 | | Barrett Business Services, Inc. | | | 1,572,373 | |
| See Notes to Financial Statements. | |
| James Balanced: Golden Rainbow Fund | Schedule of Investments |
December 31, 2016 (Unaudited)
| Shares or Principal Amount | | Value | |
| | | | Consumer, Non-cyclical (continued) | | | | |
| | 56,260 | | Cardtronics PLC, Class A* | | $ | 3,070,108 | |
| | 307,039 | | Convergys Corp. | | | 7,540,878 | |
| | 200,000 | | Dr Pepper Snapple Group, Inc. | | | 18,134,000 | |
| | 272,022 | | DST Systems, Inc. | | | 29,147,157 | |
| | 20,590 | | Farmer Brothers Co.* | | | 755,653 | |
| | 129,650 | | Grand Canyon Education, Inc.* | | | 7,578,042 | |
| | 116,531 | | Helen of Troy, Ltd.* | | | 9,841,043 | |
| | 338,830 | | Ingles Markets, Inc., Class A | | | 16,297,723 | |
| | 76,500 | | Ingredion, Inc. | | | 9,559,440 | |
| | 142,055 | | John B Sanfilippo & Son, Inc. | | | 9,999,251 | |
| | 773,480 | | Kroger Co. | | | 26,692,795 | |
| | 145,358 | | ManpowerGroup, Inc. | | | 12,917,965 | |
| | 31,620 | | Medifast, Inc. | | | 1,316,341 | |
| | 674,260 | | Merck & Co., Inc. | | | 39,693,686 | |
| | 68,431 | | National HealthCare Corp. | | | 5,186,385 | |
| | 218,710 | | Natural Health Trends Corp. | | | 5,434,944 | |
| | 600,000 | | Newell Brands, Inc. | | | 26,790,000 | |
| | 181,465 | | Nutrisystem, Inc. | | | 6,287,762 | |
| | 454,550 | | Omega Protein Corp.* | | | 11,386,478 | |
| | 777,530 | | Pfizer, Inc. | | | 25,254,174 | |
| | 104,514 | | Sanderson Farms, Inc. | | | 9,849,399 | |
| | 69,960 | | Superior Uniform Group, Inc. | | | 1,372,615 | |
| | 366,992 | | Toro Co. | | | 20,533,202 | |
| | | | | 325,361,939 | |
| | | | | | |
| | | | Energy-2.5% | | | | |
| | 187,500 | | BP PLC, Sponsored ADR | | | 7,008,750 | |
| | 33,430 | | Canadian Solar, Inc.* | | | 407,177 | |
| | 355,020 | | Diamond Offshore Drilling, Inc.* | | | 6,283,854 | |
| | 30,018 | | Matrix Service Co.* | | | 681,409 | |
| | 1,985,900 | | McDermott International, Inc.* | | | 14,675,801 | |
| | 9,670 | | Rowan Cos., PLC, Class A* | | | 182,666 | |
| | 34,770 | | SolarEdge Technologies, Inc.* | | | 431,148 | |
| | 136,580 | | Star Gas Partners LP | | | 1,469,601 | |
| | 374,950 | | Tesoro Corp. | | | 32,789,378 | |
| | 444,710 | | Valero Energy Corp. | | | 30,382,587 | |
| | 104,435 | | World Fuel Services Corp. | | | 4,794,611 | |
| | | | | 99,106,982 | |
| | | | | | |
| | | | Financial-9.4% | | | | |
| | 48,300 | | Aaron's, Inc. | | | 1,545,117 | |
| | 116,293 | | American Financial Group, Inc. | | | 10,247,739 | |
| | 1,039,470 | | AmTrust Financial Services, Inc. | | | 28,460,689 | |
| | 809,372 | | Annaly Capital Management, Inc., REIT | | | 8,069,439 | |
| | 67,100 | | Ares Commercial Real Estate Corp., REIT | | | 921,283 | |
| | 281,736 | | Argo Group International Holdings, Ltd. | | | 18,566,402 | |
| | 185,630 | | Ashford Hospitality Trust, Inc., REIT | | | 1,440,489 | |
| | 100,000 | | Bank of Montreal | | | 7,192,000 | |
| | 449,972 | | Brandywine Realty Trust, REIT | | | 7,429,038 | |
| | 77,000 | | Capital One Financial Corp. | | | 6,717,480 | |
| | 752,426 | | Chimera Investment Corp., REIT | | | 12,806,291 | |
| | 60,300 | | CorEnergy Infrastructure Trust, Inc., REIT | | | 2,103,264 | |
| | 143,615 | | Dynex Capital, Inc., REIT | | | 979,454 | |
| | 94,990 | | ePlus, Inc.* | | | 10,942,848 | |
| See Notes to Financial Statements. | |
| Semi-Annual Report | December 31, 2016 | 11 |
| Schedule of Investments | James Balanced: Golden Rainbow Fund |
| December 31, 2016 (Unaudited) |
| Shares or Principal Amount | | Value | |
| | | | Financial (continued) | | | | |
| | 813,010 | | Fifth Third Bancorp | | $ | 21,926,880 | |
| | 13,500 | | First Interstate BancSystem, Inc., Class A | | | 574,425 | |
| | 30,320 | | Franklin Financial Network, Inc.* | | | 1,268,892 | |
| | 60,000 | | Franklin Resources, Inc. | | | 2,374,800 | |
| | 47,225 | | Getty Realty Corp., REIT | | | 1,203,765 | |
| | 466,046 | | Government Properties Income Trust, REIT | | | 8,885,167 | |
| | 45,420 | | Hanmi Financial Corp. | | | 1,585,158 | |
| | 13,465 | | Hanover Insurance Group, Inc. | | | 1,225,450 | |
| | 504,470 | | JPMorgan Chase & Co. | | | 43,530,716 | |
| | 1,032,600 | | KeyCorp | | | 18,865,602 | |
| | 37,385 | | LendingTree, Inc.* | | | 3,788,970 | |
| | 147,696 | | LTC Properties, Inc., REIT | | | 6,938,758 | |
| | 133,150 | | MainSource Financial Group, Inc. | | | 4,580,360 | |
| | 27,210 | | Meta Financial Group, Inc. | | | 2,799,909 | |
| | 31,250 | | MutualFirst Financial, Inc. | | | 1,034,375 | |
| | 46,120 | | National Storage Affiliates Trust, REIT | | | 1,017,868 | |
| | 377,630 | | Nelnet, Inc., Class A | | | 19,164,723 | |
| | 105,180 | | Old National Bancorp | | | 1,909,017 | |
| | 85,930 | | People's Utah Bancorp | | | 2,307,221 | |
| | 125,000 | | Principal Financial Group, Inc. | | | 7,232,500 | |
| | 141,710 | | Prospect Capital Corp. | | | 1,183,279 | |
| | 210,000 | | Regions Financial Corp. | | | 3,015,600 | |
| | 29,970 | | Sunstone Hotel Investors, Inc., REIT | | | 457,043 | |
| | 78,850 | | TCF Financial Corp. | | | 1,544,672 | |
| | 233,270 | | Torchmark Corp. | | | 17,205,995 | |
| | 505,424 | | Travelers Cos., Inc. | | | 61,874,006 | |
| | 15,000 | | United Overseas Bank, Ltd., Sponsored ADR | | | 422,100 | |
| | 475,000 | | Unum Group | | | 20,866,750 | |
| | 30,320 | | Whitestone, REIT | | | 436,002 | |
| | | | | 376,641,536 | |
| | | | | | |
| | | | Industrial-6.1% | | | | |
| | 75,593 | | Aegion Corp.* | | | 1,791,554 | |
| | 80,000 | | AGCO Corp. | | | 4,628,800 | |
| | 64,760 | | Air Transport Services Group, Inc.* | | | 1,033,570 | |
| | 17,733 | | Alamo Group, Inc. | | | 1,349,481 | |
| | 315,210 | | American Axle & Manufacturing Holdings, Inc.* | | | 6,083,553 | |
| | 185,075 | | American Outdoor Brands Corp.* | | | 3,901,381 | |
| | 201,330 | | American Railcar Industries, Inc. | | | 9,118,236 | |
| | 115,390 | | American Woodmark Corp.* | | | 8,683,097 | |
| | 37,350 | | Argan, Inc. | | | 2,635,042 | |
| | 106,090 | | Ceco Environmental Corp. | | | 1,479,955 | |
| | 224,430 | | Costamare, Inc. | | | 1,256,808 | |
| | 200,740 | | Covenant Transportation Group, Inc., Class A* | | | 3,882,312 | |
| | 138,922 | | Crown Holdings, Inc.* | | | 7,303,130 | |
| | 214,755 | | Culp, Inc. | | | 7,978,148 | |
| | 177,500 | | Deere & Co. | | | 18,289,600 | |
| | 173,425 | | DHT Holdings, Inc. | | | 717,980 | |
| | 77,400 | | FedEx Corp. | | | 14,411,880 | |
| | 632,700 | | Frontline, Ltd. | | | 4,498,497 | |
| | 265,005 | | Gener8 Maritime, Inc.* | | | 1,187,222 | |
| | 5,800 | | Gibraltar Industries, Inc.* | | | 241,570 | |
| | 271,920 | | Global Brass & Copper Holdings, Inc. | | | 9,326,856 | |
| | 118,700 | | Hollysys Automation Technologies, Ltd. | | | 2,174,584 | |
| See Notes to Financial Statements. | |
| James Balanced: Golden Rainbow Fund | Schedule of Investments |
| | December 31, 2016 (Unaudited) |
| Shares or Principal Amount | | Value | |
| | | | Industrial (continued) | | | | |
| | 51,230 | | Huntington Ingalls Industries, Inc. | | $ | 9,436,054 | |
| | 35,110 | | Insteel Industries, Inc. | | | 1,251,320 | |
| | 1,092,890 | | Magna International, Inc. | | | 47,431,426 | |
| | 38,830 | | NACCO Industries, Inc., Class A | | | 3,516,057 | |
| | 54,080 | | Republic Services, Inc. | | | 3,085,264 | |
| | 32,400 | | Ryder System, Inc. | | | 2,411,856 | |
| | 488,550 | | Ship Finance International, Ltd. | | | 7,254,968 | |
| | 266,910 | | Sonoco Products Co. | | | 14,066,157 | |
| | 43,029 | | Sturm Ruger & Co., Inc. | | | 2,267,628 | |
| | 35,635 | | Superior Industries International, Inc. | | | 938,982 | |
| | 267,430 | | Teekay Tankers, Ltd., Class A | | | 604,392 | |
| | 12,380 | | Tenneco, Inc.* | | | 773,379 | |
| | 25,000 | | Trinity Industries, Inc. | | | 694,000 | |
| | 84,320 | | Unifi, Inc.* | | | 2,751,362 | |
| | 347,680 | | United Rentals, Inc.* | | | 36,708,054 | |
| | | | | 245,164,155 | |
| | | | | | |
| | | | Technology-8.3% | | | | |
| | 652,527 | | ACCO Brands Corp.* | | | 8,515,477 | |
| | 306,400 | | Arrow Electronics, Inc.* | | | 21,846,320 | |
| | 255,210 | | Avnet, Inc. | | | 12,150,548 | |
| | 31,000 | | Broadcom, Ltd. | | | 5,479,870 | |
| | 47,940 | | Cabot Microelectronics Corp. | | | 3,028,370 | |
| | 363,070 | | Cisco Systems, Inc. | | | 10,971,975 | |
| | 437,810 | | Corning, Inc. | | | 10,625,649 | |
| | 28,995 | | CSG Systems International, Inc. | | | 1,403,358 | |
| | 986,375 | | Deluxe Corp. | | | 70,634,314 | |
| | 74,880 | | Digi International, Inc.* | | | 1,029,600 | |
| | 54,670 | | Eastman Kodak Co.* | | | 847,385 | |
| | 366,269 | | Ebix, Inc. | | | 20,895,646 | |
| | 29,500 | | Engility Holdings, Inc.* | | | 994,150 | |
| | 20,000 | | General Dynamics Corp. | | | 3,453,200 | |
| | 257,740 | | Hackett Group, Inc. | | | 4,551,688 | |
| | 461,500 | | Intel Corp. | | | 16,738,605 | |
| | 22,120 | | International Business Machines Corp. | | | 3,671,699 | |
| | 68,460 | | Leidos Holdings, Inc. | | | 3,501,044 | |
| | 109,930 | | Lockheed Martin Corp. | | | 27,475,904 | |
| | 34,880 | | Nanometrics, Inc.* | | | 874,093 | |
| | 51,240 | | NeuStar, Inc., Class A* | | | 1,711,416 | |
| | 171,220 | | Northrop Grumman Corp. | | | 39,822,348 | |
| | 321,655 | | Orbotech, Ltd.* | | | 10,746,494 | |
| | 131,710 | | PC Connection, Inc. | | | 3,699,734 | |
| | 249,650 | | SYNNEX Corp. | | | 30,212,643 | |
| | 31,030 | | Triumph Group, Inc. | | | 822,295 | |
| | 107,760 | | Unisys Corp.* | | | 1,611,012 | |
| | 228,330 | | WESCO International, Inc.* | | | 15,195,362 | |
| | | | | 332,510,199 | |
| | | | | | |
| | | | Utilities-5.4% | | | | |
| | 225,520 | | American Electric Power Co., Inc. | | | 14,198,739 | |
| | 1,637,700 | | AT&T, Inc. | | | 69,651,381 | |
| | 93,965 | | Avista Corp. | | | 3,757,660 | |
| | 418,554 | | BT Group PLC, Sponsored ADR | | | 9,639,299 | |
| | 339,850 | | CenterPoint Energy, Inc. | | | 8,373,904 | |
| See Notes to Financial Statements. | |
| Semi-Annual Report | December 31, 2016 | 13 |
| Schedule of Investments | James Balanced: Golden Rainbow Fund |
December 31, 2016 (Unaudited)
| Shares or Principal Amount | | Value | |
| | | | Utilities (continued) | | | | |
| | 89,620 | | DTE Energy Co. | | $ | 8,828,466 | |
| | 65,000 | | Edison International | | | 4,679,350 | |
| | 107,480 | | IDACORP, Inc. | | | 8,657,514 | |
| | 26,080 | | Otter Tail Corp. | | | 1,064,064 | |
| | 97,210 | | Pinnacle West Capital Corp. | | | 7,585,296 | |
| | 176,175 | | PNM Resources, Inc. | | | 6,042,803 | |
| | 365,620 | | Portland General Electric Co. | | | 15,842,315 | |
| | 317,120 | | Public Service Enterprise Group, Inc. | | | 13,915,226 | |
| | 44,670 | | SJW Group | | | 2,500,627 | |
| | 73,067 | | Spark Energy, Inc., Class A | | | 2,213,930 | |
| | 14,650 | | Spire, Inc. | | | 945,658 | |
| | 265,510 | | UGI Corp. | | | 12,234,701 | |
| | 300,720 | | Verizon Communications, Inc. | | | 16,052,434 | |
| | 883,480 | | Vonage Holdings Corp.* | | | 6,051,838 | |
| | 75,170 | | Westar Energy, Inc. | | | 4,235,830 | |
| | | | | 216,471,035 | |
| | | | | | |
| TOTAL COMMON STOCKS (Cost $1,619,622,462) | | | 2,092,763,766 | |
| | | | | | |
| CLOSED-END FUNDS-0.0%(a) | |
| | 131,000 | | BlackRock Resources & Commodities Strategy Trust | | | 1,083,370 | |
| | | | | | | | |
| TOTAL CLOSED-END FUNDS (Cost $929,275) | | | 1,083,370 | |
| | | | | | |
| EXCHANGE TRADED FUNDS-1.0% | |
| | 107,910 | | iShares® MSCI All Peru Capped ETF | | | 3,539,448 | |
| | 109,760 | | iShares® MSCI Canada ETF | | | 2,870,224 | |
| | 94,410 | | iShares® MSCI Chile Capped ETF | | | 3,532,822 | |
| | 55,590 | | iShares® MSCI Philippines ETF | | | 1,802,228 | |
| | 7,000 | | iShares® National AMT-Free Municipal Bond ETF | | | 757,260 | |
| | 704,760 | | iShares® Silver Trust ETF* | | | 10,648,924 | |
| | 119,610 | | SPDR® Gold Shares ETF* | | | 13,110,452 | |
| | 106,112 | | VanEck Vectors Indonesia Index ETF | | | 2,252,758 | |
| | | | | | | | |
| TOTAL EXCHANGE TRADED FUNDS (Cost $37,960,825) | | | 38,514,116 | |
| | | | | | |
| CORPORATE BONDS-7.0% | |
| | | | Basic Materials-0.0%(a) | | | | |
| $ | 1,500,000 | | E.I. du Pont de Nemours & Co., 5.750%, 3/15/19 | | | 1,625,242 | |
| | | | | | | | |
| | | | Communications-0.2% | | | | |
| | 8,000,000 | | Alphabet, Inc., 3.625%, 5/19/21 | | | 8,476,440 | |
| | | | | | | | |
| | | | Consumer, Cyclical-0.5% | | | | |
| | 5,000,000 | | eBay, Inc., 2.600%, 7/15/22 | | | 4,841,080 | |
| | 5,000,000 | | Home Depot, Inc., 2.700%, 4/1/23 | | | 4,984,255 | |
| | 5,000,000 | | Home Depot, Inc., 5.950%, 4/1/41 | | | 6,345,350 | |
| | 785,000 | | McDonald's Corp., 5.700%, 2/1/39 | | | 903,326 | |
| | 2,000,000 | | Wal-Mart Stores, Inc., 5.250%, 9/1/35 | | | 2,388,348 | |
| | | | | | | 19,462,359 | |
See Notes to Financial Statements.
| James Balanced: Golden Rainbow Fund | Schedule of Investments |
December 31, 2016 (Unaudited)
| Shares or Principal Amount | | Value | |
| | | | Consumer, Non-cyclical-1.2% | | | | |
| $ | 10,000,000 | | Coca-Cola Co., 3.200%, 11/1/23 | | $ | 10,315,010 | |
| | 3,000,000 | | Hershey Co., 4.125%, 12/1/20 | | | 3,217,926 | |
| | 5,475,000 | | Johnson & Johnson, 4.500%, 9/1/40 | | | 6,106,804 | |
| | 5,000,000 | | Merck & Co., Inc., 2.800%, 5/18/23 | | | 5,013,760 | |
| | 10,000,000 | | Merck & Co., Inc., 4.150%, 5/18/43 | | | 10,251,260 | |
| | 10,000,000 | | PepsiCo, Inc., 5.000%, 6/1/18 | | | 10,500,190 | |
| | | | | | | 45,404,950 | |
| | | | Energy-1.4% | | | | |
| | 5,000,000 | | Apache Corp., 3.250%, 4/15/22 | | | 5,073,530 | |
| | 5,000,000 | | BP Capital Markets PLC, 3.245%, 5/6/22 | | | 5,100,335 | |
| | 8,271,000 | | Chevron Corp., 3.326%, 11/17/25 | | | 8,417,992 | |
| | 10,000,000 | | Diamond Offshore Drilling, Inc., 5.875%, 5/1/19 | | | 10,372,500 | |
| | 2,000,000 | | Phillips 66, 4.300%, 4/1/22 | | | 2,145,274 | |
| | 5,050,000 | | Shell International Finance BV, 2.375%, 8/21/22 | | | 4,954,080 | |
| | 5,000,000 | | Shell International Finance BV, 6.375%, 12/15/38 | | | 6,437,510 | |
| | 2,625,000 | | Shell International Finance BV, 4.375%, 5/11/45 | | | 2,653,712 | |
| | 10,000,000 | | Statoil ASA, 2.250%, 11/8/19 | | | 10,078,100 | |
| | | | | | | 55,233,033 | |
| | | | Financial-1.8% | | | | |
| | 5,000,000 | | Aflac, Inc., 2.650%, 2/15/17 | | | 5,007,500 | |
| | 8,000,000 | | Aflac, Inc., 3.625%, 11/15/24 | | | 8,223,344 | |
| | 14,733,000 | | American Express Credit Corp., 1.125%, 6/5/17 | | | 14,730,436 | |
| | 5,000,000 | | Berkshire Hathaway, Inc., 3.750%, 8/15/21 | | | 5,290,360 | |
| | 5,000,000 | | Citigroup, Inc., 4.450%, 1/10/17 | | | 5,002,140 | |
| | 11,000,000 | | JPMorgan Chase & Co., 4.250%, 10/15/20 | | | 11,631,895 | |
| | 5,000,000 | | Morgan Stanley & Co., 4.750%, 3/22/17 | | | 5,037,645 | |
| | 6,000,000 | | PNC Bank Na, 2.950%, 2/23/25 | | | 5,883,882 | |
| | 1,775,000 | | PNC Bank NA, 1.950%, 3/4/19 | | | 1,776,228 | |
| | 5,000,000 | | UBS AG, 5.875%, 12/20/17 | | | 5,204,355 | |
| | 5,000,000 | | Wells Fargo & Co., 2.500%, 3/4/21 | | | 4,958,780 | |
| | | | | | | 72,746,565 | |
| | | | Industrial-0.5% | | | | |
| | 1,000,000 | | Caterpillar, Inc., 7.900%, 12/15/18 | | | 1,115,948 | |
| | 1,000,000 | | Caterpillar, Inc., 8.250%, 12/15/38 | | | 1,577,543 | |
| | 10,000,000 | | General Electric Capital Corp., 1.680%, 4/15/20(b) | | | 10,154,810 | |
| | 2,000,000 | | General Electric Capital Corp., 6.875%, 1/10/39 | | | 2,815,328 | |
| | 5,000,000 | | United Technologies Corp., 3.100%, 6/1/22 | | | 5,133,755 | |
| | | | | | | 20,797,384 | |
| | | | Technology-1.2% | | | | |
| | 3,419,000 | | Apple, Inc., 1.550%, 2/7/20 | | | 3,375,404 | |
| | 5,000,000 | | Intel Corp., 3.300%, 10/1/21 | | | 5,190,960 | |
| | 7,000,000 | | International Business Machines Corp., 1.875%, 8/1/22 | | | 6,702,955 | |
| | 3,700,000 | | Microsoft Corp., 5.200%, 6/1/39 | | | 4,330,643 | |
| | 10,000,000 | | Microsoft Corp., 3.500%, 11/15/42 | | | 9,111,190 | |
| | 7,266,000 | | Oracle Corp., 2.500%, 10/15/22 | | | 7,180,021 | |
| | 10,000,000 | | QUALCOMM, Inc., 4.650%, 5/20/35 | | | 10,555,160 | |
| | | | | | | 46,446,333 | |
| | | | Utilities-0.2% | | | | |
| | 5,000,000 | | Duke Energy Florida LLC, Series A, 5.800%, 9/15/17 | | | 5,156,115 | |
See Notes to Financial Statements.
Semi-Annual Report | December 31, 2016 | 15 |
| Schedule of Investments | James Balanced: Golden Rainbow Fund |
December 31, 2016 (Unaudited)
| Shares or Principal Amount | | Value | |
| | | | Utilities (continued) | | | | |
| | $4,600,000 | | San Diego Gas & Electric Co., 3.000%, 8/15/21 | | $ | 4,728,280 | |
| | | | | | | 9,884,395 | |
| TOTAL CORPORATE BONDS (Cost $279,355,729) | | | 280,076,701 | |
| | | | | | |
| MORTGAGE BACKED SECURITIES-0.4% | |
| | | | Federal National Mortgage Association-0.3% | | | | |
| $ | 11,654,519 | | 3.500%, 9/1/33 | | | 12,121,447 | |
| | 1,478,764 | | 4.500%, 9/1/40 | | | 1,554,495 | |
| | | | | | | 13,675,942 | |
| | | | Government National Mortgage Association-0.1% | | | | |
| | 3,230,472 | | 4.000%, 12/20/40 | | | 3,463,018 | |
| | | | | | | | |
| TOTAL MORTGAGE BACKED SECURITIES (Cost $16,739,655) | | | 17,138,960 | |
| | | | | | |
| U.S. GOVERNMENT AGENCIES-5.1% | |
| | | | Federal Farm Credit Banks-1.1% | | | | |
| | 10,000,000 | | 1.170%, 5/16/19 | | | 9,942,770 | |
| | 10,000,000 | | 2.350%, 5/2/24 | | | 9,641,920 | |
| | 5,725,000 | | 2.750%, 11/6/26 | | | 5,664,178 | |
| | 10,000,000 | | 2.800%, 6/2/28 | | | 9,730,170 | |
| | 10,000,000 | | 3.220%, 3/26/31 | | | 10,020,060 | |
| | | | | | | 44,999,098 | |
| | | | Federal Home Loan Banks-3.6% | | | | |
| | 25,000,000 | | 0.700%, 6/5/17 | | | 24,997,900 | |
| | 50,000,000 | | 1.000%, 8/28/18 | | | 49,698,300 | |
| | 11,250,000 | | 1.200%, 5/23/19 | | | 11,169,191 | |
| | 5,000,000 | | 1.600%, 10/22/20 | | | 4,822,295 | |
| | 10,000,000 | | 1.500%, 12/28/21(c) | | | 9,987,100 | |
| | 10,000,000 | | 2.050%, 6/9/23 | | | 9,778,940 | |
| | 10,000,000 | | 2.620%, 4/28/26 | | | 9,646,890 | |
| | 5,981,481 | | 3.000%, 4/18/31 | | | 5,890,862 | |
| | 19,000,000 | | 2.000%, 6/30/31(c) | | | 18,122,371 | |
| | | | | | | 144,113,849 | |
| | | | Federal Home Loan Mortgage Corporation-0.3% | | | | |
| | 5,000,000 | | 1.000%, 8/26/19(c) | | | 4,971,825 | |
| | 5,000,000 | | 1.000%, 12/30/21 | | | 4,999,325 | |
| | | | | | | 9,971,150 | |
| | | | United States Department of Housing and Urban Development-0.1% | | | | |
| | 5,000,000 | | 2.050%, 8/1/19 | | | 5,052,060 | |
| | | | | | | | |
| TOTAL U.S. GOVERNMENT AGENCIES (Cost $207,087,011) | | | 204,136,157 | |
| | | | | | |
| U.S. TREASURY BONDS & NOTES-25.7% | |
| | | | U.S. Treasury Bonds-2.8% | | | | |
| $ | 45,000,000 | | 1.625%, 5/15/26 | | | 41,896,575 | |
| | 40,000,000 | | 5.375%, 2/15/31 | | | 53,182,920 | |
| | 20,000,000 | | 2.500%, 2/15/46 | | | 17,728,300 | |
| | | | | | | 112,807,795 | |
See Notes to Financial Statements.
| James Balanced: Golden Rainbow Fund | Schedule of Investments |
December 31, 2016 (Unaudited)
| Shares or Principal Amount | | Value | |
| | | | U.S. Treasury Inflation Indexed Bonds-0.8% | | | | |
| $ | 30,000,000 | | 0.625%, 7/15/21 | | $ | 33,197,932 | |
| | | | | | | | |
| | | | U.S. Treasury Inflation Indexed Notes-1.7% | | | | |
| | 26,500,000 | | 1.625%, 1/15/18 | | | 31,374,395 | |
| | 35,000,000 | | 0.125%, 1/15/22 | | | 37,438,794 | |
| | | | | | | 68,813,189 | |
| | | | U.S. Treasury Notes-20.4% | | | | |
| | 40,000,000 | | 0.500%, 1/31/17 | | | 40,004,560 | |
| | 40,000,000 | | 0.500%, 2/28/17 | | | 40,003,680 | |
| | 105,000,000 | | 0.875%, 11/15/17 | | | 105,000,525 | |
| | 10,000,000 | | 0.750%, 2/28/18 | | | 9,975,780 | |
| | 155,000,000 | | 1.500%, 8/31/18 | | | 155,946,275 | |
| | 180,000,000 | | 2.750%, 2/15/19 | | | 185,605,920 | |
| | 50,000,000 | | 1.375%, 9/30/20 | | | 49,396,700 | |
| | 97,500,000 | | 2.625%, 11/15/20 | | | 100,697,707 | |
| | 15,000,000 | | 1.125%, 2/28/21 | | | 14,582,520 | |
| | 58,000,000 | | 2.125%, 5/15/25 | | | 56,778,404 | |
| | 60,000,000 | | 2.000%, 8/15/25 | | | 58,036,440 | |
| | | | | | | 816,028,511 | |
| TOTAL U.S. TREASURY BONDS & NOTES (Cost $1,033,012,319) | | | 1,030,847,427 | |
| | | | | | |
| FOREIGN BONDS-0.8% | |
| | | | Australia Government-0.2% | | | | |
| | AUD 10,000,000 | | 5.250%, 3/15/19 | | | 7,734,365 | |
| | | | | | | | |
| | | | Canadian Government-0.2% | | | | |
| | CAD 5,000,000 | | 3.750%, 6/1/19 | | | 3,985,141 | |
| | CAD 5,000,000 | | 3.500%, 6/1/20 | | | 4,039,884 | |
| | | | | | | 8,025,025 | |
| | | | New Zealand Government-0.2% | | | | |
| | NZD 15,000,000 | | 5.000%, 3/15/19 | | | 11,037,004 | |
| | | | | | | | |
| | | | Singapore Government-0.2% | | | | |
| | SGD 10,000,000 | | 2.250%, 6/1/21 | | | 7,033,746 | |
| | | | | | | | |
| TOTAL FOREIGN BONDS (Cost $37,771,528) | | | 33,830,140 | |
| | | | | | |
| MUNICIPAL BONDS-5.1% | |
| | | | California-0.0%(a) | | | | |
| | 1,000,000 | | Citrus Community College District General Obligation Unlimited Bonds, Series B, Prefunded 6/01/17 @ 100, 4.750%, 6/1/31(d) | | | 1,015,540 | |
| | | | | | | | |
| | | | Connecticut-0.2% | | | | |
| | 5,350,000 | | State of Connecticut, Series D, 5.000%, 11/1/25 | | | 5,969,316 | |
| | | | | | | | |
| | | | Florida-0.4% | | | | |
| | 10,775,000 | | Florida State Board of Education Capital Outlay General Obligation Bonds, Series C, 5.000%, 6/1/23 | | | 12,624,313 | |
| | 1,000,000 | | Florida State Board of Education Capital Outlay General Obligation Bonds, Series D, 5.000%, 6/1/38 | | | 1,056,830 | |
| | | | | | | 13,681,143 | |
See Notes to Financial Statements.
Semi-Annual Report | December 31, 2016 | 17 |
| Schedule of Investments | James Balanced: Golden Rainbow Fund |
December 31, 2016 (Unaudited)
| Shares or Principal Amount | | Value | |
| | | | Georgia-0.2% | | | | |
| $ | 3,000,000 | | State of Georgia General Obligation Unlimited Bonds, Series B, 4.500%, 1/1/29 | | $ | 3,140,130 | |
| | 5,000,000 | | State of Georgia General Obligation Unlimited Bonds, Series D, 5.000%, 2/1/25 | | | 5,863,000 | |
| | | | | | | 9,003,130 | |
| | | | Hawaii-0.3% | | | | |
| | 9,000,000 | | City and County of Honolulu General Obligation Unlimited Bonds, Series B, 5.000%, 11/1/25 | | | 10,428,480 | |
| | | | | | | | |
| | | | Illinois-0.0%(a) | | | | |
| | 1,000,000 | | Village of Bolingbrook General Obligation Unlimited Bonds, 5.000%, 1/1/37 | | | 1,023,380 | |
| | | | | | | | |
| | | | Maryland-0.1% | | | | |
| | 5,000,000 | | County of Montgomery General Obligation Unlimited Bonds, Series A, 3.000%, 11/1/29 | | | 4,989,300 | |
| | | | | | | | |
| | | | Massachusetts-0.0%(a) | | | | |
| | 1,000,000 | | Commonwealth of Massachusetts General Obligation Limited Bonds, Series C, Prefunded 8/1/17 @ 100, 5.250%, 8/1/22(d) | | | 1,024,360 | |
| | | | | | | | |
| | | | Michigan-0.0%(a) | | | | |
| | 1,000,000 | | Marysville Public School District General Obligation Unlimited Bonds (School Building & Site), Prefunded 5/1/17 @ 100, 5.000%, 5/1/32(d) | | | 1,013,110 | |
| | | | | | | | |
| | | | Ohio-1.6% | | | | |
| | 7,450,000 | | Beavercreek City School District General Obligation Unlimited Bonds, 3.250%, 12/1/36 | | | 7,205,193 | |
| | 6,395,000 | | City of Cincinnati General Obligation Unlimited Bonds, Series A, 3.000%, 12/1/27 | | | 6,468,287 | |
| | 5,450,000 | | City of Columbus General Obligation Various Purpose Limited Tax Bonds, Series B, 3.250%, 8/15/24 | | | 5,728,168 | |
| | 1,500,000 | | City of Newark General Obligation Limited Bonds, 1.750%, 5/16/17 | | | 1,502,520 | |
| | 5,000,000 | | County of Cuyahoga General Obligation Limited (Capital Improvement), Series A, 4.000%, 12/1/37 | | | 5,116,100 | |
| | 2,580,000 | | County of Trumbull OH General Obligation Limited Notes, Series B, 2.000%, 8/31/17 | | | 2,591,481 | |
| | | | Greenville City School District General Obligation Unlimited Bonds (School Improvement): | | | | |
| | 5,000,000 | | 5.000%, 1/1/46 | | | 5,540,750 | |
| | 11,000,000 | | 5.500%, 1/1/51 | | | 12,126,070 | |
| | 1,100,000 | | Miamisburg City School District General Obligation Unlimited Bonds (School Facilities Construction & Improvement), Prerefunded 12/1/18 @ 100, 5.000%, 12/1/33(d) | | | 1,176,560 | |
| | 500,000 | | Mount Healthy City School District General Obligation Unlimited Bonds (School Improvement), Prefunded 6/1/18 @ 100, 5.000%, 12/1/26(d) | | | 526,180 | |
| | 1,000,000 | | Ohio State University General Recipients Revenue Bonds, Series C, 4.910%, 6/1/40 | | | 1,140,510 | |
| | 105,000 | | Ohio State University Revenue Bonds, Series A, Prefunded 12/1/18 @ 100, 5.000%, 12/1/28(d) | | | 112,308 | |
| | 895,000 | | Ohio State University Revenue Bonds, Series A, Unrefunded Portion, 5.000%, 12/1/28 | | | 954,670 | |
| | 500,000 | | Springboro Community City School District General Obligation Unlimited Bonds, 5.250%, 12/1/23 | | | 579,185 | |
| | | | State of Ohio General Obligation Unlimited Bonds, Series A, Prefunded 3/1/18 @ 100: | | | | |
| | 365,000 | | 5.375%, 9/1/28(d) | | | 382,604 | |
| | 635,000 | | 5.375%, 9/1/28(d) | | | 666,001 | |
| | 3,475,000 | | State of Ohio General Obligation Unlimited Bonds, Series C, 5.000%, 9/1/19 | | | 3,787,541 | |
| | 6,900,000 | | State of Ohio General Obligation Unlimited Bonds, Series S, 5.000%, 5/1/28 | | | 8,262,819 | |
| | 1,000,000 | | Wright State University Revenue Bonds, 4.000%, 5/1/18 | | | 1,035,400 | |
| | | | | | | 64,902,347 | |
| | | | Pennsylvania-1.1% | | | | |
| | | | Commonwealth of Pennsylvania General Obligation Unlimited Bonds, First Series: | | | | |
| | 20,000,000 | | 5.000%, 6/1/24 | | | 22,534,600 | |
| | 12,005,000 | | 5.000%, 3/15/25 | | | 13,936,004 | |
| | 7,050,000 | | 5.000%, 9/15/26 | | | 8,260,556 | |
| | | | | | | 44,731,160 | |
See Notes to Financial Statements.
| James Balanced: Golden Rainbow Fund | Schedule of Investments |
December 31, 2016 (Unaudited)
| Shares or Principal Amount | | Value | |
| | | | Tennessee-0.1% | | | | |
| $ | 5,000,000 | | Metropolitan Government of Nashville & Davidson County TN General Obligation Unlimited Bonds, Series C, 4.000%, 7/1/24 | | $ | 5,585,350 | |
| | | | | | | | |
| | | | Texas-0.6% | | | | |
| | 1,000,000 | | Friendswood Independent School District General Obligation Unlimited Bonds (Schoolhouse), Prefunded 2/15/18 @ 100, 5.000%, 2/15/37(d) | | | 1,043,050 | |
| | 5,000,000 | | Houston Texas Independent School District General Obligation Limited Bonds, Series A, 5.000%, 2/15/28 | | | 5,967,800 | |
| | 1,000,000 | | Judson Independent School District General Obligation Unlimited Bonds (School Building), Prefunded 2/1/17 @ 100, 5.000%, 2/1/37(d) | | | 1,003,000 | |
| | 500,000 | | Lamar Consolidated Independent School District General Obligation Unlimited Bonds (Schoolhouse), Prefunded 2/15/17 @ 100, 5.000%, 2/15/38(d) | | | 502,335 | |
| | 5,335,000 | | Port of Houston Authority General Obligation Unlimited Bonds, Series D-1, 5.000%, 10/1/35 | | | 5,922,970 | |
| | 7,620,000 | | Referendum Transportation Community Mobility General Obligation Unlimited Bonds, Series A, 5.000%, 10/1/25 | | | 9,199,854 | |
| | 475,000 | | Tyler Independent School District General Obligation Unlimited Bonds, Prefunded 2/15/18 @ 100, 5.000%, 2/15/34(d) | | | 495,183 | |
| | 525,000 | | Tyler Independent School District General Obligation Unlimited Bonds, Unrefunded Portion, 5.000%, 2/15/34 | | | 546,919 | |
| | | | | | | 24,681,111 | |
| | | | Washington-0.3% | | | | |
| | 5,000,000 | | State of Washington General Obligation Unlimited Bonds, Series D, 4.000%, 2/1/37 | | | 5,192,950 | |
| | 5,845,000 | | State of Washington General Obligation Various Purpose Unlimited Bonds, Series D, 5.000%, 2/1/20 | | | 6,432,832 | |
| | | | | | | 11,625,782 | |
| | | | Wisconsin-0.2% | | | | |
| | 5,000,000 | | State of Wisconsin General Obligation Unlimited Bonds, Series C, Prefunded 5/1/21 @ 100, 5.000%, 5/1/25(d) | | | 5,660,100 | |
| | | | | | | | |
| TOTAL MUNICIPAL BONDS (Cost $205,387,212) | | | 205,333,609 | |
| | | | | | |
| SHORT TERM INVESTMENTS-2.2% | |
| | | | Mutual Funds-2.2% | | | | |
| | 89,441,746 | | First American Government Obligations Fund, Class Y, 7-Day Yield 0.156% | | | 89,441,746 | |
| | | | | | | | |
| TOTAL SHORT TERM INVESTMENTS (Cost $89,441,746) | | | 89,441,746 | |
| | | | | | |
| TOTAL INVESTMENT SECURITIES-99.4% (Cost $3,527,307,762) | | | 3,993,165,992 | |
| OTHER ASSETS IN EXCESS OF LIABILITIES-0.6% | | | 20,812,603 | |
| NET ASSETS-100.0% | | $ | 4,013,978,595 | |
For Fund compliance purposes, the Fund's industry classifications refer to any one or more of the industry sub-classifications used by one or more widely recognized market indexes or ratings group indexes, and/or as defined by Fund management. Those definitions may not apply for purposes of this report, which may combine industry sub-classifications for reporting ease. Industries are shown as a percentage of net assets.
| * | Non-income producing security. |
| (a) | Less than 0.05% of Net Assets. |
| (b) | Floating or variable rate security. Interest rate disclosed is that which is in effect at December 31, 2016. |
| (c) | Step coupon. Coupon increases periodically based upon a predetermined schedule. Interest rate disclosed is that which is in effect as of December 31, 2016. |
See Notes to Financial Statements.
Semi-Annual Report | December 31, 2016 | 19 |
| Schedule of Investments | James Balanced: Golden Rainbow Fund |
December 31, 2016 (Unaudited)
| (d) | Prefunded Issues are bonds which are prerefunded and collateralized by U.S. Treasury securities held in escrow and used to pay principal and interest on tax exempt issues and to retire the bonds in full at the earliest refunding date. |
| AUD - Australian Dollar |
| CAD - Canadian Dollar |
| NZD - New Zealand Dollar |
| SGD - Singapore Dollar |
December 31, 2016 (Unaudited)
| Shares | | Value | |
| COMMON STOCKS-99.5% | |
| | | | Basic Materials-15.1% | | | |
| | 1,723 | | AEP Industries, Inc. | | $ | 200,040 | |
| | 13,875 | | Ciner Resources LP | | | 403,485 | |
| | 12,670 | | Cooper Tire & Rubber Co. | | | 492,229 | |
| | 11,880 | | Enviva Partners LP | | | 318,384 | |
| | 14,990 | | First Majestic Silver Corp.* | | | 114,374 | |
| | 34,230 | | Hecla Mining Co. | | | 179,365 | |
| | 34,860 | | Innospec, Inc. | | | 2,387,910 | |
| | 79,720 | | Lydall, Inc.* | | | 4,930,682 | |
| | 33,600 | | Neenah Paper, Inc. | | | 2,862,720 | |
| | 9,640 | | Pan American Silver Corp. | | | 145,275 | |
| | 5,940 | | Universal Forest Products, Inc. | | | 606,949 | |
| | | | | 12,641,413 | |
| | | | | | |
| | | | Consumer, Cyclical-11.4% | | | | |
| | 4,970 | | Asbury Automotive Group, Inc.* | | | 306,649 | |
| | 20,960 | | Avianca Holdings SA, Sponsored ADR | | | 202,054 | |
| | 15,430 | | Big Lots, Inc. | | | 774,740 | |
| | 20,340 | | Cato Corp., Class A | | | 611,827 | |
| | 15,160 | | Century Communities, Inc.* | | | 318,360 | |
| | 35,174 | | Flexsteel Industries, Inc. | | | 2,169,181 | |
| | 26,605 | | Hawaiian Holdings, Inc.* | | | 1,516,485 | |
| | 3,500 | | Hibbett Sports, Inc.* | | | 130,550 | |
| | 9,340 | | Insight Enterprises, Inc.* | | | 377,710 | |
| | 12,020 | | M/I Homes, Inc.* | | | 302,664 | |
| | 4,430 | | Meritage Homes Corp.* | | | 154,164 | |
| | 12,490 | | Modine Manufacturing Co.* | | | 186,101 | |
| | 23,020 | | Patrick Industries, Inc.* | | | 1,756,426 | |
| | 14,620 | | PetMed Express, Inc. | | | 337,283 | |
| | 6,110 | | Tower International, Inc. | | | 173,219 | |
| | 18,250 | | Wesco Aircraft Holdings, Inc.* | | | 272,838 | |
| | | | | 9,590,251 | |
| | | | | | |
| | | | Consumer, Non-cyclical-17.9% | | | | |
| | 3,110 | | Barrett Business Services, Inc. | | | 199,351 | |
| | 41,455 | | Cardtronics PLC, Class A* | | | 2,262,199 | |
| | 48,355 | | Convergys Corp. | | | 1,187,599 | |
| | 4,230 | | Farmer Brothers Co.* | | | 155,241 | |
| | 13,970 | | Grand Canyon Education, Inc.* | | | 816,546 | |
| | 23,630 | | Helen of Troy, Ltd.* | | | 1,995,554 | |
| | 13,565 | | Ingles Markets, Inc., Class A | | | 652,476 | |
| | 23,509 | | John B Sanfilippo & Son, Inc. | | | 1,654,799 | |
| | 4,000 | | Medifast, Inc. | | | 166,520 | |
| | 34,792 | | National HealthCare Corp. | | | 2,636,886 | |
| | 34,053 | | Natural Health Trends Corp. | | | 846,217 | |
| | 28,690 | | Omega Protein Corp.* | | | 718,684 | |
| | 11,055 | | Sanderson Farms, Inc. | | | 1,041,823 | |
| | 33,370 | | Superior Uniform Group, Inc. | | | 654,719 | |
| | | | | 14,988,614 | |
| | | | | | |
| | | | Energy-4.9% | | | | |
| | 4,660 | | Canadian Solar, Inc.* | | | 56,759 | |
| | 28,350 | | Diamond Offshore Drilling, Inc.* | | | 501,795 | |
See Notes to Financial Statements.
Semi-Annual Report | December 31, 2016 | 21 |
| Schedule of Investments | James Small Cap Fund |
December 31, 2016 (Unaudited)
| Shares | | Value | |
| | | | Energy (continued) | | | | |
| | 7,045 | | Matrix Service Co.* | | $ | 159,921 | |
| | 192,310 | | McDermott International, Inc.* | | | 1,421,171 | |
| | 6,130 | | Rowan Cos., PLC, Class A* | | | 115,796 | |
| | 4,850 | | SolarEdge Technologies, Inc.* | | | 60,140 | |
| | 136,433 | | Star Gas Partners LP | | | 1,468,019 | |
| | 7,905 | | World Fuel Services Corp. | | | 362,919 | |
| | | | | 4,146,520 | |
| | | | | | |
| | | | Financial-15.4% | | | | |
| | 27,380 | | Aaron's, Inc. | | | 875,886 | |
| | 42,831 | | Argo Group International Holdings, Ltd. | | | 2,822,563 | |
| | 14,180 | | Brandywine Realty Trust, REIT | | | 234,112 | |
| | 17,420 | | Chimera Investment Corp., REIT | | | 296,488 | |
| | 9,510 | | CorEnergy Infrastructure Trust, Inc., REIT | | | 331,709 | |
| | 16,296 | | ePlus, Inc.* | | | 1,877,299 | |
| | 6,300 | | Franklin Financial Network, Inc.* | | | 263,655 | |
| | 8,560 | | Government Properties Income Trust, REIT | | | 163,196 | |
| | 8,100 | | Hanmi Financial Corp. | | | 282,690 | |
| | 7,630 | | Hanover Insurance Group, Inc. | | | 694,406 | |
| | 8,820 | | LTC Properties, Inc., REIT | | | 414,364 | |
| | 32,501 | | MainSource Financial Group, Inc. | | | 1,118,034 | |
| | 3,910 | | Meta Financial Group, Inc. | | | 402,339 | |
| | 3,460 | | MutualFirst Financial, Inc. | | | 114,526 | |
| | 31,280 | | Old National Bancorp | | | 567,732 | |
| | 11,700 | | People's Utah Bancorp | | | 314,145 | |
| | 50,758 | | Premier Financial Bancorp, Inc. | | | 1,020,226 | |
| | 23,280 | | Prospect Capital Corp. | | | 194,388 | |
| | 19,000 | | Sunstone Hotel Investors, Inc., REIT | | | 289,750 | |
| | 30,240 | | TCF Financial Corp. | | | 592,402 | |
| | 4,920 | | Whitestone, REIT | | | 70,750 | |
| | | | | 12,940,660 | |
| | | | | | |
| | | | Industrial-6.3% | | | | |
| | 8,503 | | Aegion Corp.* | | | 201,521 | |
| | 9,450 | | Air Transport Services Group, Inc.* | | | 150,822 | |
| | 2,687 | | Alamo Group, Inc. | | | 204,481 | |
| | 25,980 | | American Outdoor Brands Corp.* | | | 547,658 | |
| | 7,040 | | American Railcar Industries, Inc. | | | 318,842 | |
| | 4,160 | | Argan, Inc. | | | 293,488 | |
| | 13,450 | | Ceco Environmental Corp. | | | 187,627 | |
| | 30,070 | | Costamare, Inc. | | | 168,392 | |
| | 30,010 | | Covenant Transportation Group, Inc., Class A* | | | 580,393 | |
| | 20,590 | | Frontline, Ltd. | | | 146,395 | |
| | 48,690 | | Gener8 Maritime, Inc.* | | | 218,131 | |
| | 19,600 | | Global Brass & Copper Holdings, Inc. | | | 672,280 | |
| | 13,390 | | Hollysys Automation Technologies, Ltd. | | | 245,305 | |
| | 4,450 | | Insteel Industries, Inc. | | | 158,598 | |
| | 11,840 | | Ship Finance International, Ltd. | | | 175,824 | |
| | 7,830 | | Tenneco, Inc.* | | | 489,140 | |
| | 17,200 | | Unifi, Inc.* | | | 561,236 | |
| | | | | 5,320,133 | |
| | | | | | |
| | | | Technology-17.5% | | | | |
| | 29,560 | | ACCO Brands Corp.* | | | 385,758 | |
See Notes to Financial Statements.
| James Small Cap Fund | Schedule of Investments |
December 31, 2016 (Unaudited)
| Shares | | Value | |
| | | | Technology (continued) | | | | |
| | 4,500 | | Cabot Microelectronics Corp. | | $ | 284,265 | |
| | 16,435 | | CSG Systems International, Inc. | | | 795,454 | |
| | 36,583 | | Deluxe Corp. | | | 2,619,709 | |
| | 12,580 | | Digi International, Inc.* | | | 172,975 | |
| | 5,310 | | Eastman Kodak Co.* | | | 82,305 | |
| | 5,210 | | Ebix, Inc. | | | 297,230 | |
| | 3,720 | | Engility Holdings, Inc.* | | | 125,364 | |
| | 38,800 | | Leidos Holdings, Inc. | | | 1,984,232 | |
| | 4,160 | | Nanometrics, Inc.* | | | 104,250 | |
| | 68,660 | | NCI, Inc., Class A | | | 957,807 | |
| | 29,040 | | NeuStar, Inc., Class A* | | | 969,936 | |
| | 87,570 | | Orbotech, Ltd.* | | | 2,925,714 | |
| | 56,450 | | PC Connection, Inc. | | | 1,585,681 | |
| | 5,170 | | SYNNEX Corp. | | | 625,673 | |
| | 9,650 | | Triumph Group, Inc. | | | 255,725 | |
| | 14,560 | | Unisys Corp.* | | | 217,672 | |
| | 4,870 | | WESCO International, Inc.* | | | 324,099 | |
| | | | | 14,713,849 | |
| | | | | | |
| | | | Utilities-11.0% | | | | |
| | 28,790 | | Avista Corp. | | | 1,151,312 | |
| | 17,620 | | Otter Tail Corp. | | | 718,896 | |
| | 41,355 | | PNM Resources, Inc. | | | 1,418,477 | |
| | 44,870 | | Portland General Electric Co. | | | 1,944,217 | |
| | 7,050 | | SJW Group | | | 394,659 | |
| | 5,398 | | Spark Energy, Inc., Class A | | | 163,559 | |
| | 8,700 | | Spire, Inc. | | | 561,585 | |
| | 415,018 | | Vonage Holdings Corp.* | | | 2,842,873 | |
| | | | | 9,195,578 | |
| | | | | | |
| TOTAL COMMON STOCKS (Cost $55,318,680) | | | 83,537,018 | |
| | | | | | |
| SHORT TERM INVESTMENTS-0.5% | |
| | | | Mutual Funds-0.5% | | | | |
| | 448,863 | | First American Government Obligations Fund, Class Y, 7-Day Yield 0.156% | | | 448,863 | |
| | | | | | | | |
| TOTAL SHORT TERM INVESTMENTS (Cost $448,863) | | | 448,863 | |
| | | | | | |
| TOTAL INVESTMENT SECURITIES-100.0% (Cost $55,767,543) | | | 83,985,881 | |
| OTHER LIABILITIES IN EXCESS OF OTHER ASSETS-0.0%(a) | | | (12,937 | ) |
| NET ASSETS-100.0% | | $ | 83,972,944 | |
For Fund compliance purposes, the Fund's industry classifications refer to any one or more of the industry sub-classifications used by one or more widely recognized market indexes or ratings group indexes, and/or as defined by Fund management. Those definitions may not apply for purposes of this report, which may combine industry sub-classifications for reporting ease. Industries are shown as a percentage of net assets.
| * | Non-income producing security. |
| (a) | Less than 0.05% of Net Assets. |
See Notes to Financial Statements.
Semi-Annual Report | December 31, 2016 | 23 |
Schedule of Investments | James Mid Cap Fund |
December 31, 2016 (Unaudited)
| Shares | | Value | |
| COMMON STOCKS-92.6% | |
| | | | Basic Materials-9.2% | | | |
| | 3,925 | | Avery Dennison Corp. | | $ | 275,613 | |
| | 3,545 | | Celanese Corp., Series A | | | 279,133 | |
| | 3,650 | | Cooper Tire & Rubber Co. | | | 141,803 | |
| | 12,000 | | Goodyear Tire & Rubber Co. | | | 370,440 | |
| | 3,000 | | Neenah Paper, Inc. | | | 255,600 | |
| | | | | 1,322,589 | |
| | | | | | |
| | | | Consumer, Cyclical-8.6% | | | | |
| | 4,000 | | Alaska Air Group, Inc. | | | 354,920 | |
| | 5,500 | | Big Lots, Inc. | | | 276,155 | |
| | 5,330 | | Hawaiian Holdings, Inc.* | | | 303,810 | |
| | 7,500 | | Insight Enterprises, Inc.* | | | 303,300 | |
| | | | | 1,238,185 | |
| | | | | | |
| | | | Consumer, Non-cyclical-16.9% | | | | |
| | 20,000 | | Convergys Corp. | | | 491,200 | |
| | 6,000 | | Helen of Troy, Ltd.* | | | 506,700 | |
| | 2,300 | | Ingredion, Inc. | | | 287,408 | |
| | 4,800 | | ManpowerGroup, Inc. | | | 426,576 | |
| | 4,745 | | Sanderson Farms, Inc. | | | 447,169 | |
| | 4,800 | | Toro Co. | | | 268,560 | |
| | | | | 2,427,613 | |
| | | | | | |
| | | | Energy-11.3% | | | | |
| | 22,635 | | Diamond Offshore Drilling, Inc.* | | | 400,640 | |
| | 60,000 | | McDermott International, Inc.* | | | 443,400 | |
| | 6,500 | | Newfield Exploration Co.* | | | 263,250 | |
| | 3,250 | | Tesoro Corp. | | | 284,213 | |
| | 5,000 | | World Fuel Services Corp. | | | 229,550 | |
| | | | | 1,621,053 | |
| | | | | | |
| | | | Financial-14.4% | | | | |
| | 2,000 | | American Financial Group, Inc. | | | 176,240 | |
| | 42,560 | | Annaly Capital Management, Inc., REIT | | | 424,323 | |
| | 3,850 | | Argo Group International Holdings, Ltd. | | | 253,715 | |
| | 25,535 | | Chimera Investment Corp., REIT | | | 434,606 | |
| | 25,000 | | Prospect Capital Corp. | | | 208,750 | |
| | 6,600 | | Unum Group | | | 289,938 | |
| | 5,000 | | Validus Holdings, Ltd. | | | 275,050 | |
| | | | | 2,062,622 | |
| | | | | | |
| | | | Industrial-8.6% | | | | |
| | 14,905 | | American Axle & Manufacturing Holdings, Inc.* | | | 287,666 | |
| | 11,500 | | American Outdoor Brands Corp.* | | | 242,420 | |
| | 4,200 | | Crown Holdings, Inc.* | | | 220,794 | |
| | 1,000 | | Huntington Ingalls Industries, Inc. | | | 184,190 | |
| | 3,388 | | NACCO Industries, Inc., Class A | | | 306,783 | |
| | | | | 1,241,853 | |
| | | | | | |
| | | | Technology-17.0% | | | | |
| | 7,750 | | Arrow Electronics, Inc.* | | | 552,575 | |
| | 7,000 | | Avnet, Inc. | | | 333,270 | |
| See Notes to Financial Statements. | |
James Mid Cap Fund | Schedule of Investments |
December 31, 2016 (Unaudited)
| Shares | | Value | |
| | | | Technology (continued) | | | | |
| | 2,500 | | Cabot Microelectronics Corp. | | $ | 157,925 | |
| | 8,525 | | Deluxe Corp. | | | 610,475 | |
| | 8,000 | | NeuStar, Inc., Class A* | | | 267,200 | |
| | 2,500 | | Orbital ATK, Inc. | | | 219,325 | |
| | 2,500 | | SYNNEX Corp. | | | 302,550 | |
| | | | | 2,443,320 | |
| | | | | | |
| | | | Utilities-6.6% | | | | |
| | 8,000 | | CenterPoint Energy, Inc. | | | 197,120 | |
| | 3,520 | | CMS Energy Corp. | | | 146,502 | |
| | 1,490 | | DTE Energy Co. | | | 146,780 | |
| | 4,500 | | UGI Corp. | | | 207,360 | |
| | 4,800 | | Vectren Corp. | | | 250,320 | |
| | | | | 948,082 | |
| | | | | | |
| TOTAL COMMON STOCKS (Cost $10,366,525) | | | 13,305,317 | |
| | | | | | |
| EXCHANGE TRADED FUNDS-2.1% | |
| | 14,000 | | iShares® Gold Trust ETF* | | | 155,120 | |
| | 9,000 | | iShares® Silver Trust ETF* | | | 135,990 | |
| | | | | | | | |
| TOTAL EXCHANGE TRADED FUNDS (Cost $279,385) | | | 291,110 | |
| | | | | | |
| SHORT TERM INVESTMENTS-5.2% | |
| | | | Mutual Funds-5.2% | | | | |
| | 753,501 | | First American Government Obligations Fund, Class Y, 7-Day Yield 0.156% | | | 753,501 | |
| | | | | | | | |
| TOTAL SHORT TERM INVESTMENTS (Cost $753,501) | | | 753,501 | |
| | | | | | |
| TOTAL INVESTMENT SECURITIES-99.9% (Cost $11,399,411) | | | 14,349,928 | |
| OTHER ASSETS IN EXCESS OF LIABILITIES-0.1% | | | 15,267 | |
| NET ASSETS-100.0% | | $ | 14,365,195 | |
| See Notes to Financial Statements. | |
| Semi-Annual Report | December 31, 2016 | 35 |
| Statements of Assets and Liabilities | James Advantage Funds |
December 31, 2016 (Unaudited)
| | | James Balanced: Golden Rainbow Fund | | | James Small Cap Fund | | | James Mid Cap Fund | | | James Micro Cap Fund | | | James Aggressive Allocation Fund | | | James Long-Short Fund | |
| ASSETS: | | | | | | | | | | | | | | | | | | |
| | | | | | | | | | | | | | | | | | | |
| Investment securities: | | | | | | | | | | | | | | | | | | |
| At cost | | $ | 3,527,307,762 | | | $ | 55,767,543 | | | $ | 11,399,411 | | | $ | 26,453,283 | | | $ | 8,817,942 | | | $ | 17,834,635 | |
| At value | | $ | 3,993,165,992 | | | $ | 83,985,881 | | | $ | 14,349,928 | | | $ | 36,015,508 | | | $ | 9,671,256 | | | $ | 22,444,951 | |
| Cash | | | 26,055 | | | | – | | | | 1,750 | | | | – | | | | 816 | | | | 202 | |
| Deposits with brokers for securities sold short | | | – | | | | – | | | | – | | | | – | | | | – | | | | 2,027,155 | |
| Dividends and interest receivable | | | 13,492,337 | | | | 101,874 | | | | 34,553 | | | | 53,711 | | | | 13,942 | | | | 33,935 | |
| Receivable for securities sold | | | 34,073,217 | | | | 31,889 | | | | 290,004 | | | | – | | | | 222,350 | | | | 60,082 | |
| Receivable for capital shares sold | | | 2,852,324 | | | | 2,888 | | | | 100 | | | | 39,507 | | | | – | | | | 100 | |
| Other assets | | | 79,496 | | | | – | | | | – | | | | – | | | | – | | | | – | |
| Total Assets | | | 4,043,689,421 | | | | 84,122,532 | | | | 14,676,335 | | | | 36,108,726 | | | | 9,908,364 | | | | 24,566,425 | |
| | | | | | | | | | | | | | | | | | | | | | | | | |
| LIABILITIES: | | | | | | | | | | | | | | | | | | | | | | | | |
| | | | | | | | | | | | | | | | | | | | | | | | | |
| Payable for securities sold short (proceeds –, –, –, –, – and 2,036,020, respectively) | | | – | | | | – | | | | – | | | | – | | | | – | | | | 2,021,897 | |
| Payable for dividends on securities sold short | | | – | | | | – | | | | – | | | | – | | | | – | | | | 70 | |
| Payable for capital shares redeemed | | | 5,664,844 | | | | 42,473 | | | | 3,194 | | | | 2,548 | | | | – | | | | 62,338 | |
| Payable for securities purchased | | | 20,813,855 | | | | – | | | | 289,729 | | | | 41,237 | | | | 368,920 | | | | 222 | |
| Accrued expenses: | | | | | | | | | | | | | | | | | | | | | | | | |
| Management fees | | | 2,209,439 | | | | 89,219 | | | | 15,171 | | | | 44,232 | | | | 7,819 | | | | 23,971 | |
| 12b-1 distribution and service fees | | | 556,818 | | | | 17,896 | | | | 3,046 | | | | – | | | | – | | | | 4,808 | |
| Other payables | | | 465,870 | | | | – | | | | – | | | | – | | | | – | | | | – | |
| Total Liabilities | | | 29,710,826 | | | | 149,588 | | | | 311,140 | | | | 88,017 | | | | 376,739 | | | | 2,113,306 | |
| Net Assets | | $ | 4,013,978,595 | | | $ | 83,972,944 | | | $ | 14,365,195 | | | $ | 36,020,709 | | | $ | 9,531,625 | | | $ | 22,453,119 | |
| | | | | | | | | | | | | | | | | | | | | | | | | |
| NET ASSETS CONSIST OF: | |
| | | | | | | | | | | | | | | | | | | | | | | | | |
| Paid-in capital | | $ | 3,559,874,071 | | | $ | 58,889,320 | | | $ | 10,527,996 | | | $ | 27,110,075 | | | $ | 9,343,953 | | | $ | 19,196,868 | |
| Accumulated net investment income/(loss) | | | 695,056 | | | | 118,044 | | | | 23,414 | | | | 29,135 | | | | (231 | ) | | | (66,717 | ) |
| Accumulated net realized gain/(loss) | | | (12,439,891 | ) | | | (3,252,758 | ) | | | 863,268 | | | | (680,726 | ) | | | (665,411 | ) | | | (1,301,471 | ) |
| Net unrealized appreciation/(depreciation) | | | 465,849,359 | | | | 28,218,338 | | | | 2,950,517 | | | | 9,562,225 | | | | 853,314 | | | | 4,624,439 | |
| Net Assets | | $ | 4,013,978,595 | | | $ | 83,972,944 | | | $ | 14,365,195 | | | $ | 36,020,709 | | | $ | 9,531,625 | | | $ | 22,453,119 | |
See Notes to Financial Statements.
| James Advantage Funds | Statements of Assets and Liabilities |
December 31, 2016 (Unaudited)
See Notes to Financial Statements.
| Semi-Annual Report | December 31, 2016 | 37 |
| Statements of Operations | James Advantage Funds |
For the Six Months Ended December 31, 2016 (Unaudited)
| | | James Balanced: Golden Rainbow Fund | | | James Small Cap Fund | | | James Mid Cap Fund | | | James Micro Cap Fund | | | James Aggressive Allocation Fund | | | James Long-Short Fund | |
| INVESTMENT INCOME: | |
| Dividends (Net of withholding taxes of $116,510, $838, $150, $789, $212 and $421, respectively) | | $ | 23,711,655 | | | $ | 1,235,206 | | | $ | 145,214 | | | $ | 348,229 | | | $ | 90,316 | | | $ | 243,575 | |
| Interest | | | 19,867,500 | | | | – | | | | – | | | | 19 | | | | 10,746 | | | | – | |
| Total Investment Income | | | 43,579,155 | | | | 1,235,206 | | | | 145,214 | | | | 348,248 | | | | 101,062 | | | | 243,575 | |
| EXPENSES: | |
| Management fees | | | 13,594,992 | | | | 518,893 | | | | 90,248 | | | | 220,495 | | | | 38,999 | | | | 144,777 | |
| 12b-1 distribution and service fees - Retail Class | | | 3,435,506 | | | | – | | | | – | | | | – | | | | – | | | | – | |
| 12b-1 distribution and service fees | | | – | | | | 104,186 | | | | 18,117 | | | | – | | | | – | | | | 29,072 | |
| Dividend expense on securities sold short | | | – | | | | – | | | | – | | | | – | | | | – | | | | 140 | |
| Broker fees and charges on securities sold short | | | – | | | | – | | | | – | | | | – | | | | – | | | | 6,829 | |
| Administration fee | | | 589,009 | | | | – | | | | – | | | | – | | | | – | | | | – | |
| Transfer agent fee | | | 185,223 | | | | – | | | | – | | | | – | | | | – | | | | – | |
| Interest expense | | | – | | | | – | | | | – | | | | – | | | | 34 | | | | – | |
| Custodian fees | | | 188,886 | | | | – | | | | – | | | | – | | | | – | | | | – | |
| Professional fees | | | 108,401 | | | | – | | | | – | | | | – | | | | – | | | | – | |
| Trustee fees | | | 104,452 | | | | 2,038 | | | | 336 | | | | 637 | | | | 166 | | | | 584 | |
| Registration fees | | | 88,937 | | | | – | | | | – | | | | – | | | | – | | | | – | |
| Shareholder report printing and mailing | | | 132,214 | | | | – | | | | – | | | | – | | | | – | | | | – | |
| Other expenses | | | 55,628 | | | | – | | | | – | | | | – | | | | – | | | | – | |
| Total Expenses | | | 18,483,248 | | | | 625,117 | | | | 108,701 | | | | 221,132 | | | | 39,199 | | | | 181,402 | |
| Net Investment Income | | | 25,095,907 | | | | 610,089 | | | | 36,513 | | | | 127,116 | | | | 61,863 | | | | 62,173 | |
| REALIZED AND UNREALIZED GAIN/(LOSS) ON INVESTMENTS: | |
| Net realized gain/(loss) from: | | | | | | | | | | | | | | | | | | | | | | | | |
| Investments | | | 82,800,792 | | | | 4,592,157 | | | | 2,208,990 | | | | 1,879,131 | | | | (130,953 | ) | | | 1,269,650 | |
| Securities sold short | | | – | | | | – | | | | – | | | | – | | | | – | | | | (340,899 | ) |
| Foreign currency transactions | | | 5,372 | | | | – | | | | – | | | | – | | | | – | | | | – | |
| Long-term capital gain distributions from other investment companies | | | – | | | | – | | | | – | | | | – | | | | – | | | | – | |
| Total realized gain/(loss) | | | 82,806,164 | | | | 4,592,157 | | | | 2,208,990 | | | | 1,879,131 | | | | (130,953 | ) | | | 928,751 | |
| Net change in unrealized appreciation/(depreciation) on investments | | | (3,444,138 | ) | | | 7,591,975 | | | | (1,339,212 | ) | | | 3,588,556 | | | | 485,739 | | | | (68,021 | ) |
| Net change in unrealized appreciation on securities sold short | | | – | | | | – | | | | – | | | | – | | | | – | | | | 14,844 | |
| Net change in unrealized depreciation on foreign currency translation | | | (14,299 | ) | | | – | | | | – | | | | – | | | | – | | | | – | |
| Total change in unrealized appreciation/(depreciation) | | | (3,458,437 | ) | | | 7,591,975 | | | | (1,339,212 | ) | | | 3,588,556 | | | | 485,739 | | | | (53,177 | ) |
| Net Realized and Unrealized Gain on Investments | | | 79,347,727 | | | | 12,184,132 | | | | 869,778 | | | | 5,467,687 | | | | 354,786 | | | | 875,574 | |
| Net Increase in Net Assets Resulting from Operations | | $ | 104,443,634 | | | $ | 12,794,221 | | | $ | 906,291 | | | $ | 5,594,803 | | | $ | 416,649 | | | $ | 937,747 | |
See Notes to Financial Statements.
| James Balanced: Golden Rainbow Fund | Statements of Changes in Net Assets |
| | | For the Six Months Ended December 31, 2016 (Unaudited) | | | For the Year Ended June 30, 2016 | |
| FROM OPERATIONS: | | | | | | |
| | | | | | | |
| Net investment income/(loss) | | $ | 25,095,907 | | | $ | 48,586,299 | |
| Net realized gain/(loss) | | | 82,806,164 | | | | (69,325,551 | ) |
| Net change in unrealized appreciation/(depreciation) | | | (3,458,437 | ) | | | (5,611,358 | ) |
| Net Increase/(Decrease) in net assets resulting from operations | | | 104,443,634 | | | | (26,350,610 | ) |
| | | | | | | | | |
| DISTRIBUTIONS TO SHAREHOLDERS: | | | | | | | | |
| | | | | | | | | |
| Retail Class Shares: | | | | | | | | |
| From net investment income | | | (19,876,949 | ) | | | (28,056,929 | ) |
| From net realized gain on investments | | | (10,139,227 | ) | | | (52,436,229 | ) |
| Institutional Class Shares: | | | | | | | | |
| From net investment income | | | (12,894,246 | ) | | | (17,468,629 | ) |
| From net realized gain on investments | | | (5,583,143 | ) | | | (24,906,312 | ) |
| Decrease in net assets from distributions to shareholders | | | (48,493,565 | ) | | | (122,868,099 | ) |
| | | | | | | | | |
| CAPITAL SHARE TRANSACTIONS: | | | | | | | | |
| | | | | | | | | |
| Retail Class Shares: | | | | | | | | |
| Proceeds from shares sold | | | 185,286,450 | | | | 798,326,471 | |
| Net asset value of shares issued in reinvestment of distributions to shareholders | | | 29,006,196 | | | | 78,274,626 | |
| Payments for shares redeemed | | | (545,119,281 | ) | | | (853,387,658 | ) |
| Net Increase/(Decrease) in net assets from Retail Class capital share transactions | | | (330,826,635 | ) | | | 23,213,439 | |
| | | | | | | | | |
| Institutional Class Shares: | | | | | | | | |
| Proceeds from shares sold | | | 161,157,848 | | | | 624,996,786 | |
| Net asset value of shares issued in reinvestment of distributions to shareholders | | | 14,010,392 | | | | 31,613,669 | |
| Payments for shares redeemed | | | (291,872,679 | ) | | | (376,036,136 | ) |
| Net Increase/(Decrease) in net assets from Institutional Class capital share transactions | | | (116,704,439 | ) | | | 280,574,319 | |
| Total Increase/(Decrease) in Net Assets | | | (391,581,005 | ) | | | 154,569,049 | |
| | | | | | | | | |
| NET ASSETS: | | | | | | | | |
| | | | | | | | | |
| Beginning of period | | | 4,405,559,600 | | | | 4,250,990,551 | |
| End of period | | $ | 4,013,978,595 | | | $ | 4,405,559,600 | |
| Accumulated Net Investment Income | | $ | 695,056 | | | $ | 8,370,344 | |
See Notes to Financial Statements.
| Semi-Annual Report | December 31, 2016 | 39 |
| Statements of Changes in Net Assets | James Balanced: Golden Rainbow Fund |
| | | For the Six Months Ended December 31, 2016 (Unaudited) | | | For the Year Ended June 30, 2016 | |
| SUMMARY OF CAPITAL SHARE ACTIVITY: | | | | | | |
| | | | | | | |
| Retail Class Shares: | | | | | | |
| Shares sold | | | 7,624,075 | | | | 32,952,333 | |
| Shares issued in reinvestment of distributions to shareholders | | | 1,192,617 | | | | 3,249,232 | |
| Shares redeemed | | | (22,473,884 | ) | | | (35,477,042 | ) |
| Net Increase/(Decrease) in shares outstanding | | | (13,657,192 | ) | | | 724,523 | |
| Shares outstanding, beginning of period | | | 119,852,016 | | | | 119,127,493 | |
| Shares outstanding, end of period | | | 106,194,824 | | | | 119,852,016 | |
| | | | | | | | | |
| Institutional Class Shares: | | | | | | | | |
| Shares sold | | | 6,695,306 | | | | 26,103,085 | |
| Shares issued in reinvestment of distributions to shareholders | | | 581,831 | | | | 1,325,565 | |
| Shares redeemed | | | (12,151,235 | ) | | | (15,812,122 | ) |
| Net Increase/(Decrease) in shares outstanding | | | (4,874,098 | ) | | | 11,616,528 | |
| Shares outstanding, beginning of period | | | 63,308,247 | | | | 51,691,719 | |
| Shares outstanding, end of period | | | 58,434,149 | | | | 63,308,247 | |
See Notes to Financial Statements.
| James Small Cap Fund | Statements of Changes in Net Assets |
| | | For the Six Months Ended December 31, 2016 (Unaudited) | | | For the Year Ended June 30, 2016 | |
| FROM OPERATIONS: | | | | | | |
| | | | | | | |
| Net investment income/(loss) | | $ | 610,089 | | | $ | 580,155 | |
| Net realized gain/(loss) | | | 4,592,157 | | | | (7,871,318 | ) |
| Net change in unrealized appreciation/(depreciation) | | | 7,591,975 | | | | (3,461,143 | ) |
| Net Increase/(Decrease) in net assets resulting from operations | | | 12,794,221 | | | | (10,752,306 | ) |
| | | | | | | | | |
| DISTRIBUTIONS TO SHAREHOLDERS: | | | | | | | | |
| | | | | | | | | |
| From net investment income | | | (400,002 | ) | | | (517,833 | ) |
| From net realized gain on investments | | | – | | | | (4,796,245 | ) |
| Decrease in net assets from distributions to shareholders | | | (400,002 | ) | | | (5,314,078 | ) |
| | | | | | | | | |
| CAPITAL SHARE TRANSACTIONS: | | | | | | | | |
| | | | | | | | | |
| Proceeds from shares sold | | | 2,017,937 | | | | 49,359,102 | |
| Net asset value of shares issued in reinvestment of distributions to shareholders | | | 366,727 | | | | 4,858,141 | |
| Payments for shares redeemed | | | (15,031,604 | ) | | | (79,070,682 | ) |
| Net Decrease in net assets from capital share transactions | | | (12,646,940 | ) | | | (24,853,439 | ) |
| Total Decrease in Net Assets | | | (252,721 | ) | | | (40,919,823 | ) |
| | | | | | | | | |
| NET ASSETS: | | | | | | | | |
| | | | | | | | | |
| Beginning of period | | | 84,225,665 | | | | 125,145,488 | |
| End of period | | $ | 83,972,944 | | | $ | 84,225,665 | |
| Accumulated Net Investment Income/(Loss) | | $ | 118,044 | | | $ | (92,043 | ) |
| | | | | | | | | |
| SUMMARY OF CAPITAL SHARE ACTIVITY: | | | | | | | | |
| | | | | | | | | |
| Shares sold | | | 61,504 | | | | 1,499,756 | |
| Shares issued in reinvestment of distributions to shareholders | | | 10,227 | | | | 148,790 | |
| Shares redeemed | | | (463,151 | ) | | | (2,638,285 | ) |
| Net Decrease in shares outstanding | | | (391,420 | ) | | | (989,739 | ) |
| Shares outstanding, beginning of period | | | 2,749,099 | | | | 3,738,838 | |
| Shares outstanding, end of period | | | 2,357,679 | | | | 2,749,099 | |
See Notes to Financial Statements.
| Semi-Annual Report | December 31, 2016 | 41 |
| Statements of Changes in Net Assets | James Mid Cap Fund |
| | | For the Six Months Ended December 31, 2016 (Unaudited) | | | For the Year Ended June 30, 2016 | |
| FROM OPERATIONS: | | | | | | |
| | | | | | | |
| Net investment income/(loss) | | $ | 36,513 | | | $ | 96,126 | |
| Net realized gain/(loss) | | | 2,208,990 | | | | 328,256 | |
| Net change in unrealized appreciation/(depreciation) | | | (1,339,212 | ) | | | (929,328 | ) |
| Net Increase/(Decrease) in net assets resulting from operations | | | 906,291 | | | | (504,946 | ) |
| | | | | | | | | |
| DISTRIBUTIONS TO SHAREHOLDERS: | | | | | | | | |
| | | | | | | | | |
| From net investment income | | | (19,996 | ) | | | (67,006 | ) |
| From net realized gain on investments | | | (1,674,445 | ) | | | (1,140,548 | ) |
| Decrease in net assets from distributions to shareholders | | | (1,694,441 | ) | | | (1,207,554 | ) |
| | | | | | | | | |
| CAPITAL SHARE TRANSACTIONS: | | | | | | | | |
| | | | | | | | | |
| Proceeds from shares sold | | | 206,781 | | | | 2,250,018 | |
| Net asset value of shares issued in reinvestment of distributions to shareholders | | | 1,664,429 | | | | 1,167,652 | |
| Payments for shares redeemed | | | (1,043,513 | ) | | | (8,569,249 | ) |
| Net Increase/(Decrease) in net assets from capital share transactions | | | 827,697 | | | | (5,151,579 | ) |
| Total Increase/(Decrease) in Net Assets | | | 39,547 | | | | (6,864,079 | ) |
| | | | | | | | | |
| NET ASSETS: | | | | | | | | |
| | | | | | | | | |
| Beginning of period | | | 14,325,648 | | | | 21,189,727 | |
| End of period | | $ | 14,365,195 | | | $ | 14,325,648 | |
| Accumulated Net Investment Income | | $ | 23,414 | | | $ | 6,897 | |
| | | | | | | | | |
| SUMMARY OF CAPITAL SHARE ACTIVITY: | | | | | | | | |
| | | | | | | | | |
| Shares sold | | | 15,183 | | | | 155,737 | |
| Shares issued in reinvestment of distributions to shareholders | | | 132,072 | | | | 83,563 | |
| Shares redeemed | | | (74,867 | ) | | | (608,877 | ) |
| Net Increase/(Decrease) in shares outstanding | | | 72,388 | | | | (369,577 | ) |
| Shares outstanding, beginning of period | | | 1,056,177 | | | | 1,425,754 | |
| Shares outstanding, end of period | | | 1,128,565 | | | | 1,056,177 | |
See Notes to Financial Statements.
| James Micro Cap Fund | Statements of Changes in Net Assets |
| | | For the Six Months Ended December 31, 2016 (Unaudited) | | | For the Year Ended June 30, 2016 | |
| FROM OPERATIONS: | | | | | | |
| | | | | | | |
| Net investment income/(loss) | | $ | 127,116 | | | $ | (63,407 | ) |
| Net realized gain/(loss) | | | 1,879,131 | | | | (1,835,186 | ) |
| Net change in unrealized appreciation/(depreciation) | | | 3,588,556 | | | | 1,258,293 | |
| Net Increase/(Decrease) in net assets resulting from operations | | | 5,594,803 | | | | (640,300 | ) |
| | | | | | | | | |
| DISTRIBUTIONS TO SHAREHOLDERS: | | | | | | | | |
| | | | | | | | | |
| From net investment income | | | – | | | | (27,110 | ) |
| Decrease in net assets from distributions to shareholders | | | – | | | | (27,110 | ) |
| | | | | | | | | |
| CAPITAL SHARE TRANSACTIONS: | | | | | | | | |
| | | | | | | | | |
| Proceeds from shares sold | | | 5,665,182 | | | | 11,917,246 | |
| Net asset value of shares issued in reinvestment of distributions to shareholders | | | – | | | | 26,268 | |
| Payments for shares redeemed, net of redemption fees | | | (1,753,838 | ) | | | (8,787,422 | ) |
| Net Increase in net assets from capital share transactions | | | 3,911,344 | | | | 3,156,092 | |
| Total Increase in Net Assets | | | 9,506,147 | | | | 2,488,682 | |
| | | | | | | | | |
| NET ASSETS: | | | | | | | | |
| | | | | | | | | |
| Beginning of period | | | 26,514,562 | | | | 24,025,880 | |
| End of period | | $ | 36,020,709 | | | $ | 26,514,562 | |
| Accumulated Net Investment Income/(Loss) | | $ | 29,135 | | | $ | (97,981 | ) |
| | | | | | | | | |
| SUMMARY OF CAPITAL SHARE ACTIVITY: | | | | | | | | |
| | | | | | | | | |
| Shares sold | | | 341,406 | | | | 785,068 | |
| Shares issued in reinvestment of distributions to shareholders | | | – | | | | 1,718 | |
| Shares redeemed | | | (110,145 | ) | | | (612,860 | ) |
| Net Increase in shares outstanding | | | 231,261 | | | | 173,926 | |
| Shares outstanding, beginning of period | | | 1,764,186 | | | | 1,590,260 | |
| Shares outstanding, end of period | | | 1,995,447 | | | | 1,764,186 | |
See Notes to Financial Statements.
| Semi-Annual Report | December 31, 2016 | 43 |
| Statements of Changes in Net Assets | James Aggressive Allocation Fund |
| | | For the Six Months Ended December 31, 2016 (Unaudited) | | | For the Year Ended June 30, 2016 (a) | |
| FROM OPERATIONS: | | | | | | |
| | | | | | | |
| Net investment income/(loss) | | $ | 61,863 | | | $ | 41,027 | |
| Net realized gain/(loss) | | | (130,953 | ) | | | (534,583 | ) |
| Net change in unrealized appreciation/(depreciation) | | | 485,739 | | | | 367,575 | |
| Net Increase/(Decrease) in net assets resulting from operations | | | 416,649 | | | | (125,981 | ) |
| | | | | | | | | |
| DISTRIBUTIONS TO SHAREHOLDERS: | | | | | | | | |
| | | | | | | | | |
| From net investment income | | | (84,996 | ) | | | (18,000 | ) |
| Decrease in net assets from distributions to shareholders | | | (84,996 | ) | | | (18,000 | ) |
| | | | | | | | | |
| CAPITAL SHARE TRANSACTIONS: | | | | | | | | |
| | | | | | | | | |
| Proceeds from shares sold | | | 2,145,371 | | | | 7,734,959 | |
| Net asset value of shares issued in reinvestment of distributions to shareholders | | | 84,996 | | | | 17,190 | |
| Payments for shares redeemed | | | (202,027 | ) | | | (436,536 | ) |
| Net Increase in net assets from capital share transactions | | | 2,028,340 | | | | 7,315,613 | |
| Total Increase in Net Assets | | | 2,359,993 | | | | 7,171,632 | |
| | | | | | | | | |
| NET ASSETS: | | | | | | | | |
| | | | | | | | | |
| Beginning of period | | | 7,171,632 | | | | – | |
| End of period | | $ | 9,531,625 | | | $ | 7,171,632 | |
| Accumulated Net Investment Income/(Loss) | | $ | (231 | ) | | $ | 22,902 | |
| | | | | | | | | |
| SUMMARY OF CAPITAL SHARE ACTIVITY: | | | | | | | | |
| | | | | | | | | |
| Shares sold | | | 222,861 | | | | 805,029 | |
| Shares issued in reinvestment of distributions to shareholders | | | 8,576 | | | | 1,873 | |
| Shares redeemed | | | (20,971 | ) | | | (49,576 | ) |
| Net Increase in shares outstanding | | | 210,466 | | | | 757,326 | |
| Shares outstanding, beginning of period | | | 757,326 | | | | – | |
| Shares outstanding, end of period | | | 967,792 | | | | 757,326 | |
(a) | Fund commenced operations on July 1, 2015. |
See Notes to Financial Statements.
| James Long-Short Fund | Statements of Changes in Net Assets |
| | | For the Six Months Ended December 31, 2016 (Unaudited) | | | For the Year Ended June 30, 2016 | |
| FROM OPERATIONS: | | | | | | |
| | | | | | | |
| Net investment income/(loss) | | $ | 62,173 | | | $ | (193,501 | ) |
| Net realized gain/(loss) | | | 928,751 | | | | 228,312 | |
| Net change in unrealized appreciation/(depreciation) | | | (53,177 | ) | | | (625,514 | ) |
| Net Increase/(Decrease) in net assets resulting from operations | | | 937,747 | | | | (590,703 | ) |
| | | | | | | | | |
| CAPITAL SHARE TRANSACTIONS: | | | | | | | | |
| | | | | | | | | |
| Proceeds from shares sold | | | 425,258 | | | | 2,810,646 | |
| Payments for shares redeemed | | | (3,614,401 | ) | | | (11,405,872 | ) |
| Net Decrease in net assets from capital share transactions | | | (3,189,143 | ) | | | (8,595,226 | ) |
| Total Decrease in Net Assets | | | (2,251,396 | ) | | | (9,185,929 | ) |
| | | | | | | | | |
| NET ASSETS: | | | | | | | | |
| | | | | | | | | |
| Beginning of period | | | 24,704,515 | | | | 33,890,444 | |
| End of period | | $ | 22,453,119 | | | $ | 24,704,515 | |
| Accumulated Net Investment Loss | | $ | (66,717 | ) | | $ | (128,890 | ) |
| | | | | | | | | |
| SUMMARY OF CAPITAL SHARE ACTIVITY: | | | | | | | | |
| | | | | | | | | |
| Shares sold | | | 32,055 | | | | 211,922 | |
| Shares redeemed | | | (277,183 | ) | | | (869,329 | ) |
| Net Decrease in shares outstanding | | | (245,128 | ) | | | (657,407 | ) |
| Shares outstanding, beginning of period | | | 1,903,127 | | | | 2,560,534 | |
| Shares outstanding, end of period | | | 1,657,999 | | | | 1,903,127 | |
See Notes to Financial Statements.
| Semi-Annual Report | December 31, 2016 | 45 |
| Financial Highlights | James Balanced: Golden Rainbow Fund – Retail Class |
For a share outstanding throughout the years indicated.
| | | For the Six Months Ended December 31, 2016 (Unaudited) | | | For the Year Ended June 30, 2016 | | | For the Year Ended June 30, 2015 | | | For the Year Ended June 30, 2014 | | | For the Year Ended June 30, 2013 | | | For the Year Ended June 30, 2012 | |
| Net asset value - beginning of year | | $ | 24.14 | | | $ | 24.96 | | | $ | 25.28 | | | $ | 22.55 | | | $ | 20.93 | | | $ | 20.66 | |
| Income/(Loss) from investment operations: | |
| Net investment income | | | 0.13 | (a) | | | 0.25 | (a) | | | 0.22 | (a) | | | 0.24 | (a) | | | 0.32 | (a) | | | 0.25 | |
| Net realized and unrealized gain/(loss) | | | 0.47 | | | | (0.41 | ) | | | 0.49 | | | | 2.96 | | | | 1.75 | | | | 0.55 | |
| Total from investment operations | | | 0.60 | | | | (0.16 | ) | | | 0.71 | | | | 3.20 | | | | 2.07 | | | | 0.80 | |
| | | | | | | | | | | | | | | | | | | | | | | | | |
| Less distributions: | | | | | | | | | | | | | | | | | | | | | | | | |
| From net investment income | | | (0.18 | ) | | | (0.23 | ) | | | (0.18 | ) | | | (0.24 | ) | | | (0.30 | ) | | | (0.23 | ) |
| From net realized gain on investments | | | (0.09 | ) | | | (0.43 | ) | | | (0.85 | ) | | | (0.23 | ) | | | (0.15 | ) | | | (0.30 | ) |
| Total distributions | | | (0.27 | ) | | | (0.66 | ) | | | (1.03 | ) | | | (0.47 | ) | | | (0.45 | ) | | | (0.53 | ) |
| Net asset value at end of year | | $ | 24.47 | | | $ | 24.14 | | | $ | 24.96 | | | $ | 25.28 | | | $ | 22.55 | | | $ | 20.93 | |
| | | | | | | | | | | | | | | | | | | | | | | | | |
| Total return | | | 2.52 | %(b) | | | (0.64 | )% | | | 2.90 | % | | | 14.32 | % | | | 9.98 | % | | | 3.98 | % |
| | | | | | | | | | | | | | | | | | | | | | | | | |
| Net assets, end of year (in thousands) | | $ | 2,598,614 | | | $ | 2,892,809 | | | $ | 2,973,350 | | | $ | 2,493,030 | | | $ | 1,735,736 | | | $ | 1,249,228 | |
| | | | | | | | | | | | | | | | | | | | | | | | | |
| Ratios/Supplemental Data: | |
| Ratio of net expenses to average net assets | | | 0.96 | %(c) | | | 0.96 | % | | | 0.97 | % | | | 1.00 | % | | | 1.04 | % | | | 1.07 | % |
| Ratio of net investment income to average net assets | | | 1.09 | %(c) | | | 1.03 | % | | | 0.87 | % | | | 0.99 | % | | | 1.45 | % | | | 1.26 | % |
| Portfolio turnover rate | | | 21 | %(b) | | | 46 | % | | | 43 | % | | | 32 | % | | | 58 | % | | | 36 | % |
| (a) | Calculated using the average shares method. |
See Notes to Financial Statements.
| James Balanced: Golden Rainbow Fund – Institutional Class | Financial Highlights |
For a share outstanding throughout the years indicated.
| | | For the Six Months Ended December 31, 2016 (Unaudited) | | | For the Year Ended June 30, 2016 | | | For the Year Ended June 30, 2015 | | | For the Year Ended June 30, 2014 | | | For the Year Ended June 30, 2013 | | | For the Year Ended June 30, 2012 | |
| Net asset value - beginning of year | | $ | 23.89 | | | $ | 24.72 | | | $ | 25.05 | | | $ | 22.35 | | | $ | 20.81 | | | $ | 20.61 | |
| Income/(Loss) from investment operations: | |
| Net investment income | | | 0.16 | (a) | | | 0.31 | (a) | | | 0.28 | (a) | | | 0.29 | (a) | | | 0.38 | (a) | | | 0.33 | |
| Net realized and unrealized gain/(loss) | | | 0.47 | | | | (0.42 | ) | | | 0.50 | | | | 2.94 | | | | 1.73 | | | | 0.52 | |
| Total from investment operations | | | 0.63 | | | | (0.11 | ) | | | 0.78 | | | | 3.23 | | | | 2.11 | | | | 0.85 | |
| | | | | | | | | | | | | | | | | | | | | | | | | |
| Less distributions: | | | | | | | | | | | | | | | | | | | | | | | | |
| From net investment income | | | (0.21 | ) | | | (0.29 | ) | | | (0.26 | ) | | | (0.30 | ) | | | (0.42 | ) | | | (0.35 | ) |
| From net realized gain on investments | | | (0.09 | ) | | | (0.43 | ) | | | (0.85 | ) | | | (0.23 | ) | | | (0.15 | ) | | | (0.30 | ) |
| Total distributions | | | (0.30 | ) | | | (0.72 | ) | | | (1.11 | ) | | | (0.53 | ) | | | (0.57 | ) | | | (0.65 | ) |
| Paid-in capital from redemption fees | | | – | | | | – | | | | – | | | | – | | | | 0.00 | (b) | | | – | |
| Net asset value at end of year | | $ | 24.22 | | | $ | 23.89 | | | $ | 24.72 | | | $ | 25.05 | | | $ | 22.35 | | | $ | 20.81 | |
| | | | | | | | | | | | | | | | | | | | | | | | | |
| Total return | | | 2.68 | %(c) | | | (0.43 | )% | | | 3.20 | % | | | 14.59 | % | | | 10.26 | % | | | 4.22 | % |
| | | | | | | | | | | | | | | | | | | | | | | | | |
| Net assets, end of year (in thousands) | | $ | 1,415,365 | | | $ | 1,512,751 | | | $ | 1,277,641 | | | $ | 805,973 | | | $ | 555,766 | | | $ | 304,731 | |
| | | | | | | | | | | | | | | | | | | | | | | | | |
| Ratios/Supplemental Data: | |
| Ratio of net expenses to average net assets | | | 0.71 | %(d) | | | 0.71 | % | | | 0.73 | % | | | 0.75 | % | | | 0.79 | % | | | 0.82 | % |
| Ratio of net investment income to average net assets | | | 1.34 | %(d) | | | 1.28 | % | | | 1.11 | % | | | 1.24 | % | | | 1.71 | % | | | 1.52 | % |
| Portfolio turnover rate | | | 21 | %(c) | | | 46 | % | | | 43 | % | | | 32 | % | | | 58 | % | | | 36 | % |
| (a) | Calculated using the average shares method. |
| (b) | Amount rounds to less than $0.005 per share. |
See Notes to Financial Statements.
| Semi-Annual Report | December 31, 2016 | 47 |
| Financial Highlights | James Small Cap Fund |
For a share outstanding throughout the years indicated.
| | | For the Six Months Ended December 31, 2016 (Unaudited) | | | For the Year Ended June 30, 2016 | | | For the Year Ended June 30, 2015 | | | For the Year Ended June 30, 2014 | | | For the Year Ended June 30, 2013 | | | For the Year Ended June 30, 2012 | |
| Net asset value - beginning of year | | $ | 30.64 | | | $ | 33.47 | | | $ | 33.88 | | | $ | 28.66 | | | $ | 23.89 | | | $ | 23.88 | |
| Income/(Loss) from investment operations: | |
| Net investment income/(loss) | | | 0.24 | (a) | | | 0.17 | (a) | | | 0.01 | (a) | | | (0.00 | )(a)(b) | | | 0.36 | (a) | | | 0.15 | |
| Net realized and unrealized gain/(loss) | | | 4.91 | | | | (1.64 | ) | | | (0.42 | ) | | | 6.12 | | | | 4.92 | | | | (0.11 | ) |
| Total from investment operations | | | 5.15 | | | | (1.47 | ) | | | (0.41 | ) | | | 6.12 | | | | 5.28 | | | | 0.04 | |
| | | | | | | | | | | | | | | | | | | | | | | | | |
| Less distributions: | | | | | | | | | | | | | | | | | | | | | | | | |
| From net investment income | | | (0.17 | ) | | | (0.12 | ) | | | – | | | | (0.90 | ) | | | (0.51 | ) | | | (0.03 | ) |
| From net realized gain on investments | | | – | | | | (1.24 | ) | | | – | | | | – | | | | – | | | | – | |
| Total distributions | | | (0.17 | ) | | | (1.36 | ) | | | – | | | | (0.90 | ) | | | (0.51 | ) | | | (0.03 | ) |
| Net asset value at end of year | | $ | 35.62 | | | $ | 30.64 | | | $ | 33.47 | | | $ | 33.88 | | | $ | 28.66 | | | $ | 23.89 | |
| | | | | | | | | | | | | | | | | | | | | | | | | |
| Total return | | | 16.80 | %(c) | | | (4.62 | )% | | | (1.21 | )% | | | 21.46 | % | | | 22.51 | % | | | 0.16 | % |
| | | | | | | | | | | | | | | | | | | | | | | | | |
| Net assets, end of year (in thousands) | | $ | 83,973 | | | $ | 84,226 | | | $ | 125,145 | | | $ | 163,537 | | | $ | 161,271 | | | $ | 134,727 | |
| | | | | | | | | | | | | | | | | | | | | | | | | |
| Ratios/Supplemental Data: | |
| Ratio of net expenses to average net assets | | | 1.50 | %(d) | | | 1.50 | % | | | 1.50 | % | | | 1.50 | % | | | 1.50 | % | | | 1.50 | % |
| Ratio of net investment income/(loss) to average net assets | | | 1.46 | %(d) | | | 0.55 | % | | | 0.04 | % | | | (0.00 | )%(e) | | | 1.39 | % | | | 0.58 | % |
| Portfolio turnover rate | | | 22 | %(c) | | | 57 | % | | | 76 | % | | | 62 | % | | | 41 | % | | | 89 | % |
| (a) | Calculated using the average shares method. |
| (b) | Amount rounds to less than ($0.005) per share. |
| (e) | Amount rounds to less than (0.005%). |
See Notes to Financial Statements.
| James Mid Cap Fund | Financial Highlights |
For a share outstanding throughout the years indicated.
| | | For the Six Months Ended December 31, 2016 (Unaudited) | | | For the Year Ended June 30, 2016 | | | For the Year Ended June 30, 2015 | | | For the Year Ended June 30, 2014 | | | For the Year Ended June 30, 2013 | | | For the Year Ended June 30, 2012 | |
| Net asset value - beginning of year | | $ | 13.56 | | | $ | 14.86 | | | $ | 16.42 | | | $ | 12.97 | | | $ | 10.69 | | | $ | 11.38 | |
| Income/(Loss) from investment operations: | |
| Net investment income/(loss) | | | 0.03 | (a) | | | 0.08 | (a) | | | (0.02 | )(a) | | | 0.01 | (a) | | | 0.08 | (a) | | | 0.04 | |
| Net realized and unrealized gain/(loss) | | | 0.84 | | | | (0.42 | ) | | | (0.15 | ) | | | 3.87 | | | | 2.23 | | | | (0.64 | ) |
| Total from investment operations | | | 0.87 | | | | (0.34 | ) | | | (0.17 | ) | | | 3.88 | | | | 2.31 | | | | (0.60 | ) |
| | | | | | | | | | | | | | | | | | | | | | | | | |
| Less distributions: | | | | | | | | | | | | | | | | | | | | | | | | |
| From net investment income | | | (0.02 | ) | | | (0.05 | ) | | | (0.01 | ) | | | (0.04 | ) | | | (0.03 | ) | | | (0.09 | ) |
| From net realized gain on investments | | | (1.68 | ) | | | (0.91 | ) | | | (1.38 | ) | | | (0.39 | ) | | | – | | | | – | |
| Total distributions | | | (1.70 | ) | | | (0.96 | ) | | | (1.39 | ) | | | (0.43 | ) | | | (0.03 | ) | | | (0.09 | ) |
| Net asset value at end of year | | $ | 12.73 | | | $ | 13.56 | | | $ | 14.86 | | | $ | 16.42 | | | $ | 12.97 | | | $ | 10.69 | |
| | | | | | | | | | | | | | | | | | | | | | | | | |
| Total return | | | 6.57 | %(b) | | | (2.46 | )% | | | (0.86 | )% | | | 30.34 | % | | | 21.68 | % | | | (5.26 | )% |
| | | | | | | | | | | | | | | | | | | | | | | | | |
| Net assets, end of year (in thousands) | | $ | 14,365 | | | $ | 14,326 | | | $ | 21,190 | | | $ | 18,631 | | | $ | 14,643 | | | $ | 12,657 | |
| | | | | | | | | | | | | | | | | | | | | | | | | |
| Ratios/Supplemental Data: | |
| Ratio of net expenses to average net assets | | | 1.50 | %(c) | | | 1.50 | % | | | 1.50 | % | | | 1.50 | % | | | 1.50 | % | | | 1.50 | % |
| Ratio of net investment income/(loss) to average net assets | | | 0.50 | %(c) | | | 0.54 | % | | | (0.13 | )% | | | 0.05 | % | | | 0.64 | % | | | 0.32 | % |
| Portfolio turnover rate | | | 41 | %(b) | | | 47 | % | | | 50 | % | | | 31 | % | | | 26 | % | | | 36 | % |
| (a) | Calculated using the average shares method. |
See Notes to Financial Statements.
| Semi-Annual Report | December 31, 2016 | 49 |
| Financial Highlights | James Micro Cap Fund |
For a share outstanding throughout the years indicated.
| | | For the Six Months Ended December 31, 2016 (Unaudited) | | | For the Year Ended June 30, 2016 | | | For the Year Ended June 30, 2015 | | | For the Year Ended June 30, 2014 | | | For the Year Ended June 30, 2013 | | | For the Year Ended June 30, 2012 | |
| Net asset value ‐ beginning of year | | $ | 15.03 | | | $ | 15.11 | | | $ | 17.40 | | | $ | 13.96 | | | $ | 11.71 | | | $ | 11.91 | |
| Income/(Loss) from investment operations: | | | | | | | | | | | | | | | | | | | | | |
| Net investment income/(loss) | | | 0.07 | (a) | | | (0.04 | )(a) | | | 0.06 | (a) | | | (0.05 | )(a) | | | 0.14 | (a) | | | (0.01 | ) |
| Net realized and unrealized gain/(loss) | | | 2.95 | | | | (0.06 | ) | | | 1.12 | | | | 3.50 | | | | 2.25 | | | | (0.13 | ) |
| Total from investment operations | | | 3.02 | | | | (0.10 | ) | | | 1.18 | | | | 3.45 | | | | 2.39 | | | | (0.14 | ) |
| | | | | | | | | | | | | | | | | | | | | | | | | |
| Less distributions: | | | | | | | | | | | | | | | | | | | | | | | | |
| From net investment income | | | – | | | | (0.01 | ) | | | (0.02 | ) | | | (0.01 | ) | | | (0.14 | ) | | | – | |
| From net realized gain on investments | | | – | | | | – | | | | (3.45 | ) | | | – | | | | – | | | | (0.06 | ) |
| Total distributions | | | – | | | | (0.01 | ) | | | (3.47 | ) | | | (0.01 | ) | | | (0.14 | ) | | | (0.06 | ) |
| Paid‐in capital from redemption fees | | | 0.00 | (b) | | | 0.03 | | | | 0.00 | (b) | | | 0.00 | (b) | | | 0.00 | (b) | | | 0.00 | (b) |
| Net asset value at end of year | | $ | 18.05 | | | $ | 15.03 | | | $ | 15.11 | | | $ | 17.40 | | | $ | 13.96 | | | $ | 11.71 | |
| | | | | | | | | | | | | | | | | | | | | | | | | |
| Total return | | | 20.09 | %(c) | | | (0.44 | )% | | | 7.95 | % | | | 24.75 | % | | | 20.64 | % | | | (1.15 | )% |
| | | | | | | | | | | | | | | | | | | | | | | | | |
| Net assets, end of year (in thousands) | | $ | 36,021 | | | $ | 26,515 | | | $ | 24,026 | | | $ | 16,256 | | | $ | 11,817 | | | $ | 10,173 | |
| | | | | | | | | | | | | | | | | | | | | | | | | |
| Ratios/Supplemental Data: | | | | | | | | | | | | | | | | | | | | | | | | |
| Ratio of net expenses to average net assets | | | 1.50 | %(d) | | | 1.50 | % | | | 1.50 | % | | | 1.50 | % | | | 1.50 | % | | | 1.50 | % |
| Ratio of net investment income/(loss) to average net assets | | | 0.86 | %(d) | | | (0.24 | )% | | | 0.38 | % | | | (0.31 | )% | | | 1.12 | % | | | (0.14 | )% |
| Portfolio turnover rate | | | 28 | %(c) | | | 44 | % | | | 52 | % | | | 96 | % | | | 46 | % | | | 85 | % |
(a) | Calculated using the average shares method. |
(b) | Amount rounds to less than $0.005 per share. |
See Notes to Financial Statements.
| James Aggressive Allocation Fund | Financial Highlights |
For a share outstanding throughout the periods indicated.
| | | For the Six Months Ended December 31, 2016 (Unaudited) | | | For the Year Ended June 30, 2016(a) | |
| Net asset value ‐ beginning of year | | $ | 9.47 | | | $ | 10.00 | |
| Income/(Loss) from investment operations: | | | | | | | | |
Net investment income(b) | | | 0.08 | | | | 0.07 | |
| Net realized and unrealized gain/(loss) | | | 0.39 | | | | (0.57 | ) |
| Total from investment operations | | | 0.47 | | | | (0.50 | ) |
| | | | | | | | | |
| Less distributions: | | | | | | | | |
| From net investment income | | | (0.09 | ) | | | (0.03 | ) |
| Total distributions | | | (0.09 | ) | | | (0.03 | ) |
| Net asset value at end of year | | $ | 9.85 | | | $ | 9.47 | |
| | | | | | | | | |
| Total return | | | 4.94 | %(c) | | | (4.98 | )% |
| | | | | | | | | |
| Net assets, end of year (in thousands) | | $ | 9,532 | | | $ | 7,172 | |
| | | | | | | | | |
| Ratios/Supplemental Data: | | | | | | | | |
| Ratio of net expenses to average net assets | | | 0.98 | %(d) | | | 0.98 | % |
| Ratio of net investment income to average net assets | | | 1.55 | %(d) | | | 0.81 | % |
| Portfolio turnover rate | | | 107 | %(c) | | | 218 | % |
(a) | Fund commenced operations on July 1, 2015. |
(b) | Calculated using the average shares method. |
See Notes to Financial Statements.
| Semi-Annual Report | December 31, 2016 | 51 |
| Financial Highlights | James Long-Short Fund |
For a share outstanding throughout the years indicated.
| | | For the Six Months Ended December 31, 2016 (Unaudited) | | | For the Year Ended June 30, 2016 | | | For the Year Ended June 30, 2015 | | | For the Year Ended June 30, 2014 | | | For the Year Ended June 30, 2013 | | | For the Year Ended June 30, 2012 | |
| Net asset value ‐ beginning of year | | $ | 12.98 | | | $ | 13.24 | | | $ | 13.80 | | | $ | 11.70 | | | $ | 9.99 | | | $ | 10.10 | |
| Income/(Loss) from investment operations: | | | | | | | | | | | | | | | | | | | | | |
| Net investment income/(loss) | | | 0.04 | (a) | | | (0.09 | )(a) | | | (0.13 | )(a) | | | (0.06 | )(a) | | | 0.04 | (a) | | | (0.04 | ) |
| Net realized and unrealized gain/(loss) | | | 0.52 | | | | (0.17 | ) | | | (0.43 | ) | | | 2.16 | | | | 1.71 | | | | (0.05 | ) |
| Total from investment operations | | | 0.56 | | | | (0.26 | ) | | | (0.56 | ) | | | 2.10 | | | | 1.75 | | | | (0.09 | ) |
| | | | | | | | | | | | | | | | | | | | | | | | | |
| Less distributions: | | | | | | | | | | | | | | | | | | | | | | | | |
| From net investment income | | | – | | | | – | | | | – | | | | – | | | | (0.04 | ) | | | (0.02 | ) |
| Total distributions | | | – | | | | – | | | | – | | | | – | | | | (0.04 | ) | | | (0.02 | ) |
| Net asset value at end of year | | $ | 13.54 | | | $ | 12.98 | | | $ | 13.24 | | | $ | 13.80 | | | $ | 11.70 | | | $ | 9.99 | |
| | | | | | | | | | | | | | | | | | | | | | | | | |
| Total return | | | 4.31 | %(b) | | | (1.96 | )% | | | (4.06 | )% | | | 17.95 | % | | | 17.57 | % | | | (0.93 | )% |
| | | | | | | | | | | | | | | | | | | | | | | | | |
| Net assets, end of year (in thousands) | | $ | 22,453 | | | $ | 24,705 | | | $ | 33,890 | | | $ | 23,446 | | | $ | 15,694 | | | $ | 9,160 | |
| | | | | | | | | | | | | | | | | | | | | | | | | |
| Ratios/Supplemental Data: | | | | | | | | | | | | | | | | | | | | | | | | |
Ratio of net expenses to average net assets(c) | | | 1.56 | %(d) | | | 2.50 | % | | | 2.70 | % | | | 2.57 | % | | | 2.70 | % | | | 2.66 | % |
| Ratio of net investment income/(loss) to average net assets | | | 0.53 | %(d) | | | (0.70 | )% | | | (0.92 | )% | | | (0.44 | )% | | | 0.35 | % | | | (0.44 | )% |
| Portfolio turnover rate | | | 31 | %(b) | | | 49 | % | | | 117 | % | | | 171 | % | | | 58 | % | | | 159 | % |
(a) | Calculated using the average shares method. |
(c) | Dividend and interest expense on securities sold short and interest expense totaled 0.06%, 1.00%, 1.20%, 1.07%, 1.20% and 1.15% (annualized) of average net assets for six months ended December 31, 2016, the years ended June 30, 2016, June 30, 2015, June 30, 2014, June 30, 2013 and June 30, 2012, respectively. |
See Notes to Financial Statements.
| James Advantage Funds | Notes to Financial Statements |
December 31, 2016 (Unaudited)James Advantage Funds (the “Trust”) is an open-end management investment company that was organized as an Ohio business trust on August 29, 1997. The Trust is registered under the Investment Company Act of 1940, as amended (the “1940 Act”). James Balanced: Golden Rainbow Fund, James Small Cap Fund, James Mid Cap Fund, James Micro Cap Fund, James Aggressive Allocation Fund, and James Long-Short Fund are each a diversified series of the Trust (individually a “Fund,” collectively the “Funds”). Each class of James Balanced: Golden Rainbow Fund represents an interest in the same portfolio of investments and has the same rights, but differs primarily in distribution fees and shareholder features. The Retail Class shares are subject to distribution (12b-1) fees but have a lower minimum investment requirement and offer certain shareholder services not available to Institutional Class shareholders. The Institutional Class shares are not subject to distribution (12b-1) fees and are available only through investment advisers and bank trust departments that have made arrangements for shares of all of their clients investing in the Fund to be held in an omnibus account (as well as other investors that are approved by management of the Trust).
James Balanced: Golden Rainbow Fund seeks to provide total return through a combination of growth and income and preservation of capital in declining markets. The Fund seeks to achieve its objective by investing primarily in common stocks and/or debt securities that the Fund’s adviser, James Investment Research, Inc. (“James” or the “Adviser”), believes are undervalued.
James Small Cap Fund seeks to provide long-term capital appreciation. The Fund seeks to achieve its objective by investing primarily in common stocks of small capitalization companies. The Adviser defines small capitalization as those companies with market capitalizations at the time of purchase no larger than the stocks in the Fund’s benchmark, the Russell 2000® Index. As of December 31, 2016, the stock with the maximum capitalization in the Russell 2000® Index had a capitalization of $10.51 billion.
James Mid Cap Fund seeks to provide long-term capital appreciation. The Fund seeks to achieve its objective by investing primarily in common stocks of mid capitalization companies. The Adviser defines mid capitalization companies as those with market capitalizations at the time of purchase that fall within the range of the S&P MidCap 400® Value Index. As of December 31, 2016, the stock with the maximum capitalization in the S&P MidCap 400® Value Index had a capitalization of $10.51 billion.
James Micro Cap Fund seeks to provide long-term capital appreciation. The Fund seeks to achieve its objective by investing primarily in common stocks of micro capitalization companies. Micro capitalization companies are defined as those companies with market capitalizations at the time of purchase no larger than the stocks in the Russell Microcap® Index, including exchange traded funds (“ETFs”) that invest primarily in such securities. As of December 31, 2016, the stock with the maximum capitalization in the Russell Microcap® Index had a capitalization of $3.61 billion.
James Aggressive Allocation Fund seeks to provide total return through a combination of growth and income. Preservation of capital in declining markets is a secondary objective. This Fund will generally run equity allocations of 60% or higher and, therefore, could be more volatile than a more conservative fund that holds a smaller percentage of its assets in stocks.
James Long-Short Fund seeks to provide long-term capital appreciation. The Fund seeks to achieve its objective by investing primarily in foreign and domestic equity securities that the Adviser believes are undervalued and more likely to appreciate, and by selling short equity securities that the Adviser believes are overvalued and more likely to depreciate. The Fund also may take long positions in domestic and foreign fixed income securities that the Adviser believes are more likely to appreciate in the interest rate and spread environment anticipated by the Adviser, and short positions in fixed income securities that the Adviser believes are more likely to depreciate in the interest rate and spread environment anticipated by the Adviser. The Fund seeks to achieve positive returns on both the long positions and short positions that it takes in various securities.
2. SIGNIFICANT ACCOUNTING POLICIES
The following is a summary of significant accounting policies followed by the Funds in preparation of their financial statements, in accordance with accounting principles generally accepted in the United States of America (“GAAP”). The Funds are considered an investment company for financial reporting purposes under GAAP.
Share Valuation
The net asset value per share of each Fund, other than the James Balanced: Golden Rainbow Fund, is calculated daily by dividing the total value of the Fund’s assets, less liabilities, by the number of shares outstanding. The net asset value per share of each class of shares of the James Balanced: Golden Rainbow Fund is calculated daily by dividing the total value of the Fund’s assets attributable to that class, less liabilities attributable to that class, by the number of outstanding shares of that class. The offering price and redemption price per share is equal to the net asset value per share, except that shares of the James Micro Cap Fund are subject to a redemption fee of 2% if redeemed within 180 days of purchase. Redemption fees received by the James Micro Cap Fund were $3,582 and $45,020 for the six months ended December 31, 2016 and for the year ended June 30, 2016, respectively. The redemption fee is reflected in the “Payment for shares redeemed, net of redemption fees” in the Statements of Changes in Net Assets.
Securities Valuation
Securities are valued at fair value. The Funds' portfolio securities, including short positions, are valued as of the close of the New York Stock Exchange (“NYSE”) (generally, 4:00 p.m., Eastern time) on each day that the NYSE is open for business. Equity securities that are traded on any exchange, including closed-end funds and exchange-traded funds, are valued at the last quoted sale price on the exchange or market in which such securities are principally traded. Lacking a last sale price, a security is valued at its last bid price except when, in James’s opinion, the last bid price does not accurately reflect the current value of the security. Securities that are traded on the NASDAQ® over-the-counter market are valued at their NASDAQ® Official Closing Price (“NOCP”) for all NASDAQ® National Market (“NNM”) and NASDAQ® Capital Market® securities. When market quotations are not readily available, if an event occurs after the close of the trading market (but before the time as of which a Fund calculates its net asset value) that materially affects a security’s value, when James determines that the market quotation does not accurately reflect the current value or when a non-144A restricted security is being valued, that security will be valued at its fair value as determined in good faith in conformity with guidelines adopted by and subject to review of the Board of Trustees (the “Board”). Corporate bonds, U.S. government agencies, U.S. Treasury bonds & notes, foreign, and municipal bonds are generally valued at the mean between the closing bid and asked prices provided by an independent pricing service. The pricing services generally use market models that consider trade data, yields, spreads, quotations from dealers and active market makers, credit worthiness, market information of comparable securities, and other relevant security specific information. Asset backed/commercial mortgage backed securities are generally valued at the mean between the closing bid and asked prices provided by an independent pricing service. The pricing service generally uses models that consider trade data, prepayment, and default projections, benchmark yield and spread data and estimated cash flows of each tranche of the issuer. If the Adviser decides that a price provided by the pricing service does not accurately reflect the fair market value of the securities or when prices are not readily available from a pricing service, those securities will be priced at fair value as determined in good faith by the Adviser. Shares of open-end investment companies are valued at net asset value.
| Semi-Annual Report | Semi-Annual Report | 53 |
| Notes to Financial Statements | James Advantage Funds |
December 31, 2016 (Unaudited)
For valuation purposes, quotations of foreign securities in a foreign currency are converted to U.S. dollar equivalents at the time of pricing the Funds. The values of foreign portfolio securities are generally based upon market quotations which, depending upon the exchange or market, may be last sale price, last bid price or the average of the last bid and asked prices as of, in each case, the close of the appropriate exchange or another designated time.
In accordance with the Trust’s good faith pricing guidelines, James is required to consider all appropriate factors relevant to the value of securities for which it has determined other pricing sources are not available or reliable as described above. There is no single standard for determining fair value, since fair value depends upon the circumstances of each individual case. As a general principle, the current fair value of an issue of securities being valued by the Adviser would appear to be the amount that the owner might reasonably expect to receive for them upon their current sale. Methods which are in accordance with this principle may, for example, be based on (i) a multiple of earnings, (ii) a discount from market of a similar freely traded security (including a derivative security or a basket of securities traded on other markets, exchanges or among dealers), or (iii) yield to maturity with respect to debt issues, or a combination of these and other methods.
Various inputs are used in determining the value of the Funds’ investments. These inputs are summarized in the three broad levels listed below:
| Level 1 - | Unadjusted quoted prices in active markets for identical, unrestricted assets or liabilities that a Fund has the ability to access at the measurement date; |
| Level 2 - | Quoted prices which are not active, quoted prices for similar assets or liabilities in active markets or inputs other than quoted prices that are observable (either directly or indirectly) for substantially the full term of the asset or liability; or |
| Level 3 - | Significant unobservable prices or inputs (including a Fund’s own assumptions in determining the fair value of investments) where there is little or no market activity for the asset or liability at the measurement date. |
The inputs or methodologies used for valuing securities are not necessarily an indication of the risk associated with investing in those securities. Generally, amortized cost approximates the current fair value of a security, but since the value is not obtained from a quoted price in an active market, such securities are reflected as Level 2.
The following is a summary of the inputs used to value the Funds’ investments as of December 31, 2016:
| James Balanced: Golden Rainbow Fund | | | | | | | | | | | | |
| | | Valuation Inputs | | | | |
Investments in Securities at Value* | | Level 1 | | | Level 2 | | | Level 3 | | | Total | |
| Common Stocks | | $ | 2,092,763,766 | | | $ | – | | | $ | – | | | $ | 2,092,763,766 | |
| Closed-End Funds | | | 1,083,370 | | | | – | | | | – | | | | 1,083,370 | |
| Exchange Traded Funds | | | 38,514,116 | | | | – | | | | – | | | | 38,514,116 | |
| Corporate Bonds | | | – | | | | 280,076,701 | | | | – | | | | 280,076,701 | |
| Mortgage Backed Securities | | | – | | | | 17,138,960 | | | | – | | | | 17,138,960 | |
| U.S. Government Agencies | | | – | | | | 204,136,157 | | | | – | | | | 204,136,157 | |
| U.S. Treasury Bonds & Notes | | | 1,030,847,427 | | | | – | | | | – | | | | 1,030,847,427 | |
| Foreign Bonds | | | – | | | | 33,830,140 | | | | – | | | | 33,830,140 | |
| Municipal Bonds | | | – | | | | 205,333,609 | | | | – | | | | 205,333,609 | |
| Short Term Investments | | | 89,441,746 | | | | – | | | | – | | | | 89,441,746 | |
| Total | | $ | 3,252,650,425 | | | $ | 740,515,567 | | | $ | – | | | $ | 3,993,165,992 | |
| James Advantage Funds | Notes to Financial Statements |
December 31, 2016 (Unaudited)
| James Small Cap Fund | |
| | | Valuation Inputs | | | | |
| Investments in Securities at Value* | | Level 1 | | | Level 2 | | | Level 3 | | | Total | |
| Common Stocks | | $ | 83,537,018 | | | $ | – | | | $ | – | | | $ | 83,537,018 | |
| Short Term Investments | | | 448,863 | | | | – | | | | – | | | | 448,863 | |
| Total | | $ | 83,985,881 | | | $ | – | | | $ | – | | | $ | 83,985,881 | |
| James Mid Cap Fund | |
| | | Valuation Inputs | | | | |
| Investments in Securities at Value* | | Level 1 | | | Level 2 | | | Level 3 | | | Total | |
| Common Stocks | | $ | 13,305,317 | | | $ | – | | | $ | – | | | $ | 13,305,317 | |
| Exchange Traded Funds | | | 291,110 | | | | – | | | | – | | | | 291,110 | |
| Short Term Investments | | | 753,501 | | | | – | | | | – | | | | 753,501 | |
| Total | | $ | 14,349,928 | | | $ | – | | | $ | – | | | $ | 14,349,928 | |
| James Micro Cap Fund | |
| | | Valuation Inputs | | | | |
| Investments in Securities at Value* | | Level 1 | | | Level 2 | | | Level 3 | | | Total | |
| Common Stocks | | $ | 34,054,787 | | | $ | – | | | $ | – | | | $ | 34,054,787 | |
| U.S. Treasury Bonds & Notes | | | 497,510 | | | | – | | | | – | | | | 497,510 | |
| Short Term Investments | | | 1,463,211 | | | | – | | | | – | | | | 1,463,211 | |
| Total | | $ | 36,015,508 | | | $ | – | | | $ | – | | | $ | 36,015,508 | |
| James Aggressive Allocation Fund | |
| | | Valuation Inputs | | | | |
| Investments in Securities at Value* | | Level 1 | | | Level 2 | | | Level 3 | | | Total | |
| Common Stocks | | $ | 7,780,955 | | | $ | – | | | $ | – | | | $ | 7,780,955 | |
| Closed-End Funds | | | 26,820 | | | | – | | | | – | | | | 26,820 | |
| Exchange Traded Funds | | | 331,431 | | | | – | | | | – | | | | 331,431 | |
| Corporate Bonds | | | – | | | | 50,035 | | | | – | | | | 50,035 | |
| U.S. Treasury Bonds & Notes | | | 1,149,128 | | | | – | | | | – | | | | 1,149,128 | |
| Short Term Investments | | | 332,887 | | | | – | | | | – | | | | 332,887 | |
| Total | | $ | 9,621,221 | | | $ | 50,035 | | | $ | – | | | $ | 9,671,256 | |
| James Long-Short Fund | |
| | | Valuation Inputs | | | | |
| Investments in Securities at Value* | | Level 1 | | | Level 2 | | | Level 3 | | | Total | |
| Common Stocks | | $ | 21,586,594 | | | $ | – | | | $ | – | | | $ | 21,586,594 | |
| Short Term Investments | | | 858,357 | | | | – | | | | – | | | | 858,357 | |
| Total | | $ | 22,444,951 | | | $ | – | | | $ | – | | | $ | 22,444,951 | |
| | | Valuation Inputs | | | | |
| Other Financial Instruments* | | Level 1 | | | Level 2 | | | Level 3 | | | Total | |
| Liabilities | |
| Securities Sold Short | |
| Common Stocks | | $ | (2,021,897 | ) | | $ | – | | | $ | – | | | $ | (2,021,897 | ) |
| TOTAL | | $ | (2,021,897 | ) | | $ | – | | | $ | – | | | $ | (2,021,897 | ) |
* | For detailed descriptions of sector and industry, see the accompanying Schedule of Investments. |
| Semi-Annual Report | Semi-Annual Report | 55 |
| Notes to Financial Statements | James Advantage Funds |
December 31, 2016 (Unaudited)
The Funds recognize transfer between levels as of the end of period. For the six months ended December 31, 2016, the Funds did not have any transfer between Level 1 and Level 2 securities.
Investment Transactions
Investment transactions are recorded on a trade date basis. Gains and losses are determined using the specific identification method, which liquidates all losses first, before any gains. Securities purchased or sold on a when-issued or delayed delivery basis may have extended settlement periods. Any securities so purchased are subject to market fluctuation during this period. The Funds will instruct its custodian to segregate assets in a separate account with a current value at least equal to the amount of its when-issued and delayed delivery purchase commitments. As of December 31, 2016, the Funds did not hold when-issued securities or delayed delivery purchase commitments.
Withholding taxes on foreign dividends have been provided for in accordance with the Trust’s understanding of the applicable country’s tax rules and rates.
Foreign Currency Translation
The market value of investment securities and other assets and liabilities denominated in foreign currencies are translated into U.S. dollars at the current exchange rate, provided by WM Reuters, at the close of each business day. Purchases and sales of securities, income receipts and expense payments are translated into U.S. dollars based at the exchange rate on the date of the transaction.
Reported net realized foreign exchange gains or losses arise from sales and maturities of short-term securities, sales of foreign currencies, currency gains or losses realized and between the trade and settlement dates on securities transactions, and the difference between the amounts of dividends, interest, and foreign withholding taxes recorded on the Funds’ books and the U.S. dollar equivalent of the amounts actually received or paid. Net unrealized foreign exchange gains and losses arise from the changes in the value of assets and liabilities including investments in securities at the reporting period, resulting from changes in the exchange rate. The portion of realized and unrealized gains or losses on investments due fluctuations in foreign currency exchange rates is not separately disclosed and is included in realized and unrealized gains or losses on investments, when applicable.
Short Sales and Segregated Cash
The James Long-Short Fund may actively sell short equity and fixed income securities. Short sales are transactions in which the Fund sells a security it does not own in anticipation of a decline in the market value of that security. To complete such a transaction, the Fund must borrow the security to deliver to the buyer upon the short sale; the Fund is then obligated to replace the security borrowed by purchasing it in the open market at some later date.
The Fund will incur a loss if the market price of the security increases between the date of the short sale and the date on which the Fund replaces the borrowed security. The Fund will realize a gain if the security declines in value between those dates. The Fund is required to pay any dividend or interest due on securities sold short. Such dividends and interest are recorded as an expense. The Fund may pay fees or charges on the assets borrowed for securities sold short.
All short sales are collateralized, as required by the Fund’s prime broker. The Fund maintains the collateral in segregated accounts consisting of cash and/or equity securities sufficient to collateralize the market value of the Fund’s short positions.
Investment Income
Dividend income and dividend expense on long securities and securities sold short are recorded on the ex-dividend date. Interest income is determined on the basis of interest accrued, adjusted for amortization of premiums and accretion of discounts on all debt securities. Amortization and accretion is calculated using the effective yield method.
Dividend income includes dividends earned on Real Estate Investment Trusts (“REITs”), which may include a return of capital. As such, important taxation issues may arise, which the Funds account for when information is provided by the issuing REIT.
Due to the actual character of dividends paid by REITs not being available until the end of the calendar year, the net investment income and long-term capital gains of the Funds can be different on the tax return compared to this annual report. Substantial unanticipated levels of return of capital may affect the Funds’ earnings and profits from which distributions are made.
Distributions received from Limited Partnership investments of a Fund are usually recorded as a return of capital and are excluded from available income in the calculation of distributions paid by the Funds. Return of capital is recorded as a reduction to the cost of investments in the Statements of Assets and Liabilities and in the Schedule of Investments.
Dividends and Distributions to Shareholders
Net investment income, if any, is generally declared and distributed to shareholders of each Fund on at least an annual basis. Net realized capital gains from security transactions, if any, are distributed to shareholders not less frequently than annually. Furthermore, capital gains are distributed only to the extent they exceed available capital loss carryforwards. Distributions to shareholders of net investment income and net realized capital gains are recorded on the ex-dividend date. The amount and timing of distributions are determined in accordance with federal income tax regulations, which may differ from GAAP.
Allocation of Income and Expense
Investment income earned, realized capital gains and losses, and unrealized appreciation and depreciation for the James Balanced: Golden Rainbow Fund is allocated daily to each class of shares based upon its proportionate share of total net assets of the Fund. Class-specific expenses are charged directly to the class incurring the expense. Common expenses, which are not attributable to a specific class, are allocated daily to each class of shares based upon its proportionate share of total net assets of the Fund. Expenses not directly billed to a particular Fund are allocated proportionally among all Funds daily in relation to net assets of each Fund or another reasonable measure.
| James Advantage Funds | Notes to Financial Statements |
December 31, 2016 (Unaudited)
Use of Estimates
The preparation of financial statements in conformity with GAAP requires management to make estimates and assumptions that affect the reported amounts of assets and liabilities and disclosure of contingent assets and liabilities at the date of the financial statements and the reported amounts of increases and decreases in net assets from operations during the reporting period. Actual results could differ from those estimates.
Federal Income Taxes
The Funds generally intend to distribute all taxable income and capital gains to shareholders, if any, and to otherwise continue to comply with the requirements of Subchapter M of the Internal Revenue Code of 1986, as amended, applicable to regulated investment companies. Therefore, no federal tax provision is required.
As of and during the six months ended December 31, 2016, the Funds did not have a liability for any unrecognized tax benefits. The Funds file U.S. federal, state, and local tax returns as required. The Funds’ tax returns are subject to examination by the relevant tax authorities until expiration of the applicable statute of limitations, which is generally three years after the filing of the tax return for federal purposes and four years for most state returns. Tax returns for open years have incorporated no uncertain tax positions that require a provision for income taxes.
| As of December 31, 2016, the components of distributable earnings on a tax basis were as follows: | |
| | | | |
| | | James Balanced: Golden Rainbow Fund | | | James Small Cap Fund | | | James Mid Cap Fund | | | James Micro Cap Fund | | | James Aggressive Allocation Fund | | | James Long-Short Fund | |
| Tax cost of portfolio investments | | $ | 3,529,618,252 | | | $ | 55,825,389 | | | $ | 11,398,789 | | | $ | 26,377,352 | | | $ | 8,846,138 | | | $ | 17,911,338 | |
| Gross unrealized appreciation | | $ | 519,142,544 | | | $ | 28,975,896 | | | $ | 3,047,896 | | | $ | 10,350,934 | | | $ | 962,084 | | | $ | 4,766,461 | |
| Gross unrealized depreciation | | | (55,594,804 | ) | | | (815,404 | ) | | | (96,757 | ) | | | (712,778 | ) | | | (136,966 | ) | | | (232,848 | ) |
| Net unrealized appreciation | | | 463,547,740 | | | | 28,160,492 | | | | 2,951,139 | | | | 9,638,156 | | | | 825,118 | | | | 4,533,613 | |
The difference between the cost of portfolio investments on a tax basis and financial statement cost for the Funds is due primarily to the deferral of wash sale losses and to the differing treatment of certain investments under income tax regulations and GAAP.
The tax character of distributions paid for the year ended June 30, 2016 was as follows:
| | | James Balanced: Golden Rainbow Fund | | | James Small Cap Fund | | | James Mid Cap Fund | | | James Micro Cap Fund | | | James Aggressive Allocation Fund | | | James Long-Short Fund | |
| Ordinary Income | | $ | 45,525,513 | | | $ | 517,857 | | | $ | 67,006 | | | $ | 27,110 | | | $ | 18,000 | | | $ | – | |
| Long-Term Capital Gains | | | 77,342,586 | | | | 4,796,221 | | | | 1,140,548 | | | | – | | | | – | | | | – | |
| Total | | $ | 122,868,099 | | | $ | 5,314,078 | | | $ | 1,207,554 | | | $ | 27,110 | | | $ | 18,000 | | | $ | – | |
The tax character of distributions paid for the year ended June 30, 2015 was as follows:
| | | James Balanced: Golden Rainbow Fund | | | James Small Cap Fund | | | James Mid Cap Fund | | | James Micro Cap Fund | | | James Long-Short Fund | |
| Ordinary Income | | $ | 36,104,504 | | | $ | – | | | $ | 50,911 | | | $ | 29,482 | | | $ | – | |
| Long-Term Capital Gains | | | 120,104,128 | | | | – | | | | 1,480,680 | | | | 3,160,094 | | | | – | |
| Total | | $ | 156,208,632 | | | $ | – | | | $ | 1,531,591 | | | $ | 3,189,576 | | | $ | – | |
| Semi-Annual Report | Semi-Annual Report | 57 |
| Notes to Financial Statements | James Advantage Funds |
December 31, 2016 (Unaudited)
Capital Losses
Under the tax code, Capital Losses are carried over to future tax years and will retain their character as either short-term or long-term capital losses. These losses do not include any late year capital losses (losses arising in the period from November 1st through June 30th) that the funds have elected to defer for the current fiscal year. The Funds’ ability to utilize capital loss carryforwards in the future may be limited under the Internal Revenue Code and related regulations based on the results of future transactions.
Capital losses carried forward to the next tax year were as follows:
| | | Short Term | | | Long Term | |
| James Balanced: Golden Rainbow Fund | | $ | 28,247,484 | | | $ | – | |
| James Small Cap Fund | | | 2,405,338 | | | | – | |
| James Micro Cap Fund | | | 1,465,490 | | | | 6,594 | |
| James Aggressive Allocation Fund | | | 243,759 | | | | – | |
| James Long-Short Fund | | | 1,519,624 | | | | – | |
The Funds elect to defer to the year ending June 30, 2017 capital losses recognized during the period November 1, 2015 through June 30, 2016 in the amount of:
| | | Amount | |
| James Balanced: Golden Rainbow Fund | | $ | 48,334,458 | |
| James Small Cap Fund | | | 5,082,015 | |
| James Micro Cap Fund | | | 1,123,955 | |
| James Aggressive Allocation Fund | | | 277,002 | |
| James Long-Short Fund | | | 626,475 | |
The Funds elect to defer to the year ended June 30, 2017 late year ordinary losses in the amount of:
| | | Amount | |
| James Balanced: Golden Rainbow Fund | | $ | 424,092 | |
| James Small Cap Fund | | | 90,436 | |
| James Micro Cap Fund | | | 97,212 | |
| James Long-Short Fund | | | 128,890 | |
3. INVESTMENT TRANSACTIONS
Purchases and sales (including maturities) of investments in other long-term U.S. Government obligations for the six months ended December 31, 2016 were as follows:
| | | Purchases | | | Sales | |
| James Balanced: Golden Rainbow Fund | | $ | 28,816,035 | | | $ | – | |
| James Aggressive Allocation Fund | | | 2,112,257 | | | | 2,484,853 | |
Purchases and sales (including maturities) of investments in other long-term securities for the six months ended December 31, 2016 were as follows:
| | | Purchases | | | Sales | |
| James Balanced: Golden Rainbow Fund | | $ | 814,700,850 | | | $ | 1,347,856,152 | |
| James Small Cap Fund | | | 17,397,002 | | | | 29,030,312 | |
| James Mid Cap Fund | | | 5,575,266 | | | | 6,494,791 | |
| James Micro Cap Fund | | | 11,725,527 | | | | 7,630,616 | |
| James Aggressive Allocation Fund | | | 8,220,053 | | | | 5,871,896 | |
| James Long-Short Fund | | | 6,753,754 | | | | 10,935,343 | |
For the six months ended December 31, 2016, the cost of securities purchased to cover short sales and the proceeds from securities sold short were $11,654,668 and $9,970,534, respectively, for the Long-Short Fund.
4. MANAGEMENT FEE AND OTHER TRANSACTIONS WITH AFFILIATES
Investment Management Agreement
The Funds retain James Investment Research, Inc. (“James”) to manage the Funds’ investments. The investment decisions for the Funds are made by a committee of James’ personnel, which is primarily responsible for the day‐to‐day management of each Fund’s portfolio. The Funds pay James on a monthly basis at the annual rate set forth below of the Funds’ average daily net assets.
James Balanced: Golden Rainbow Fund
| Average Total Net Assets | Contractual Fee |
| Up to and including $500 million | 0.74% |
| Over $500 million and including $1 billion | 0.70% |
| Over $1 billion and including $2 billion | 0.65% |
| Over $2 billion | 0.60% |
| Average Total Net Assets | Contractual Fee |
| Up to and including $500 million | 1.25% |
| Over $500 million and including $1 billion | 1.20% |
| Over $1 billion and including $2 billion | 1.15% |
| Over $2 billion | 1.10% |
| Average Total Net Assets | Contractual Fee |
| Up to and including $500 million | 1.25% |
| Over $500 million and including $1 billion | 1.20% |
| Over $1 billion and including $2 billion | 1.15% |
| Over $2 billion | 1.10% |
| James Advantage Funds | Notes to Financial Statements |
December 31, 2016 (Unaudited)
James Micro Cap Fund
| Average Total Net Assets | Contractual Fee |
| Up to and including $500 million | 1.50% |
| Over $500 million | 1.45% |
James Aggressive Allocation Fund
| Average Total Net Assets | Contractual Fee |
| Up to and including $500 million | 0.98% |
| Over $500 million and including $1 billion | 0.95% |
| Over $1 billion and including $2 billion | 0.90% |
| Over $2 billion | 0.85% |
James Long-Short Fund
| Average Total Net Assets | Contractual Fee |
| Up to and including $500 million | 1.25% |
| Over $500 million and including $1 billion | 1.20% |
| Over $1 billion and including $2 billion | 1.15% |
| Over $2 billion | 1.10% |
Advisory fees for the James Small Cap Fund, James Mid Cap Fund, James Micro Cap Fund, James Aggressive Allocation Fund and James Long-Short Fund are reduced by the fees and expenses of the non-interested trustees incurred by the applicable Fund. Under the investment management agreement, James is responsible for the payment of all operating expenses of the James Small Cap Fund, James Mid Cap Fund, James Micro Cap Fund, James Aggressive Allocation Fund and James Long-Short Fund, except for brokerage fees and commissions, taxes, interest (including dividend expense on securities sold short), fees and expenses of non-interested person trustees, 12b-1 expenses and extraordinary expenses.
Administrative Services Agreement
ALPS Fund Services, Inc. (“ALPS” or the “Administrator”) serves as administrator to the Funds. ALPS receives a monthly fee paid by James Balanced: Golden Rainbow Fund, for itself, and paid by James for the remaining Funds, subject to a minimum monthly fee. Pursuant to an administrative agreement, ALPS will provide operational services to the Funds including, but not limited to fund accounting and fund administration and generally assist in each Fund’s operations. Administration fees paid by the Funds for the six months ended December 31, 2016 are disclosed in the Statements of Operations.
Transfer Agency and Services Agreement
ALPS, pursuant to a Transfer Agency and Services Agreement with the Trust, serves as transfer agent for the Funds. Under the Transfer Agency and Services Agreement, ALPS receives an annual minimum fee, a fee based upon the number of shareholder accounts and is also reimbursed for out-of-pocket expenses. These fees and reimbursements for out-of-pocket expenses are paid and reimbursed by James Balanced: Golden Rainbow Fund, for itself, and by James for the remaining Funds. Transfer agent fees paid by the Funds for the six months ended December 31, 2016 are disclosed in the Statements of Operations.
Plans of Distribution
The James Balanced: Golden Rainbow Fund (Retail Class), James Small Cap Fund, James Mid Cap Fund and James Long-Short Fund have adopted a plan pursuant to Rule 12b-1 under the 1940 Act (collectively, the “Plans”) under which each Fund may incur expenses related to distribution of its shares and for services provided to shareholders. Payments under a Plan are made to James, which uses them to pay distribution and shareholder service expenses on behalf of and as agent of the Fund. The amount payable by each Fund (the Retail Class of the James Balanced: Golden Rainbow Fund), with a Plan, under its Plan is 0.25% of its average daily net assets for the year. The Plans are compensation plans, which means that payments are made to James regardless of 12b-1 expenses actually incurred. Therefore, payments under a Plan may exceed distribution and shareholder service expenses incurred pursuant to the Plan, and James is permitted to retain the excess. It is also possible that 12b-1 expenses paid by James for a period will exceed the payments received by James, in which case James may pay such excess expenses out of its own resources. Payments received by James under the Plans are in addition to the fees paid to James pursuant to the Management Agreements. The Plans require that James act in the Funds’ best interests in expending the payments it receives from the Funds and use payments solely for the purpose of paying distribution and shareholder services expenses on behalf of the Funds. The Funds’ distributor, ALPS Distributors, Inc., validates all payment amounts to be made to brokers that have properly executed dealer agreements with the Funds before James will make such payments. The expenses of the Funds’ Plans are reflected as 12b-1 distribution and service fees – Retail Class on the Statements of Operations.
| 5. | COMMITMENTS AND CONTINGENCIES |
The Funds indemnify the Trust’s officers and trustees for certain liabilities that might arise from their performance of their duties to the Funds. Additionally, in the normal course of business, the Funds enter into contracts that contain a variety of representations and warranties and that provide general indemnifications. The Funds’ maximum exposure under these arrangements is unknown, as this would involve future claims that may be made against the Funds that have not yet occurred. However, based on experience, the Funds expect the risk of loss to be remote.
Each Fund has a revolving line of credit agreement with U.S. Bank, N.A. (the “Bank”). Borrowings under these arrangements are secured by investments held in the Funds’ portfolios as notated on the Schedules of Investments and bear interest at the Bank’s prime rate. For the six months ended December 31, 2016, James Aggressive Allocation Fund utilized its line of credit. The average amount of borrowings was $69,000 over 5 days with a weighted-average interest rate of 3.50%. During the six months ended December 31, 2016, the James Balanced: Golden Rainbow Fund, James Small Cap Fund, James Mid Cap Fund, James Micro Cap Fund, and James Long-Short Fund did not utilize their line of credit. Interest on funded and unfunded loans can be found under interest expense on the Statements of Operations. Each Fund’s line of credit agreement expired on July 12, 2016 and was renewed for one year. The terms of the agreements can be characterized as follows:
| Semi-Annual Report | December 31, 2016 | 59 |
| Notes to Financial Statements | James Advantage Funds |
December 31, 2016 (Unaudited)
Fund
| | Maximum Balance Available | Interest Rate | Expiration Date |
| James Balanced: Golden Rainbow Fund | | $ | 50,000,000 | Prime Rate* | July 11, 2017 |
| James Small Cap Fund | | $ | 6,500,000 | Prime Rate* | July 11, 2017 |
| James Mid Cap Fund | | $ | 715,000 | Prime Rate* | July 11, 2017 |
| James Micro Cap Fund | | $ | 540,000 | Prime Rate* | July 11, 2017 |
| James Aggressive Allocation Fund | | $ | 100,000 | Prime Rate* | July 11, 2017 |
| James Long-Short Fund | | $ | 3,000,000 | Prime Rate* | July 11, 2017 |
| * | The rate at which the Bank announces as its prime lending rate. |
| James Advantage Funds | Additional Information |
December 31, 2016 (Unaudited)
PROXY VOTING GUIDELINES
James is responsible for exercising the voting rights associated with the securities purchased and held by the Funds. A description of the policies and procedures that James uses in fulfilling this responsibility and information regarding how those proxies were voted during the most recent 12-month period ended June 30 are available without charge upon request by calling toll free 1-800-995-2637. These items are also available on the Securities and Exchange Commission’s (the “Commission”) website at http://www.sec.gov.
QUARTERLY PORTFOLIO DISCLOSURE
James files a complete listing of portfolio holdings for each Fund as of the end of the first and third quarters of each fiscal year on Form N-Q. The complete listing (i) is available on the Commission’s website; (ii) may be reviewed and copied at the Commission’s Public Reference Room in Washington, DC; and (iii) will be made available to shareholders upon request by calling 1-800-995-2637. Information on the operation of the Public Reference Room may be obtained by calling 1-800-SEC-0330.
| Semi-Annual Report | December 31, 2016 | 61 |
| Privacy Policy | James Advantage Funds |
December 31, 2016 (Unaudited)
Facts
What does James Advantage Funds do with your personal information?
Why?
Financial companies choose how they share your personal information. Federal law gives consumers the right to limit some, but not all sharing. Federal law also requires us to tell you how we collect, share, and protect your personal information. Please read this notice carefully to understand what we do.
What?
The types of personal information we collect and share depends on the product or service that you have with us. This information can include:
| • | Social Security number and wire transfer instructions |
| • | account transactions and transaction history |
| • | investment experience and purchase history |
When you are no longer our customer, we continue to share your information as described in this notice.
How?
All financial companies need to share customers’ personal information to run their everyday business. In the section below, we list the reasons financial companies can share their customers’ personal information; the reasons James Advantage Funds chooses to share; and whether you can limit this sharing.
| Reasons we can share your personal information: | Does James Advantage Funds share information? | Can you limit this sharing? |
| For our everyday business purposes - such as to process your transactions, maintain your account(s), respond to court orders and legal investigations, or report to credit bureaus. | YES | NO |
| For our marketing purposes - to offer our products and services to you. | YES | NO |
| For joint marketing with other financial companies. | NO | We don’t share |
| For our affiliates’ everyday business purposes - information about your transactions and records. | NO | We don’t share |
| For our affiliates’ everyday business purposes - information about your credit worthiness. | NO | We don’t share |
| For our affiliates to market to you | NO | We don’t share |
| For non-affiliates to market to you | NO | We don’t share |
Questions? Call 1-800-99 James
| What we do: |
| How does James Advantage Funds protect my personal information? | To protect your personal information from unauthorized access and use, we use security measures that comply with federal law. These measures include computer safeguards and secured files and buildings. Our service providers are held accountable for adhering to strict policies and procedures to prevent any misuse of your nonpublic personal information. |
How does James Advantage Funds
collect my personal information? | We collect your personal information, for example, when you ● open an account or deposit money ● direct us to buy securities or direct us to sell your securities ● seek advice about your investments We also collect your personal information from others, such as credit bureaus, affiliates, or other companies. |
| Why can’t I limit all sharing? | Federal law gives you the right to limit only: ● sharing for affiliates’ everyday business purposes – information about your creditworthiness. ● affiliates from using your information to market to you. ● sharing for nonaffiliates to market to you. State laws and individual companies may give you additional rights to limit sharing. |
| Definitions |
| Affiliates | Companies related by common ownership or control. They can be financial and non-financial companies. ● Our affiliates include financial companies, such as James Investment Research, Inc. and James Capital Alliance. |
| Non-affiliates | Companies not related by common ownership or control. They can be financial and non-financial companies. ● James Advantage Funds does not share with nonaffiliates so they can market to you. |
| Joint marketing | A formal agreement between nonaffiliated financial companies that together market financial products or services to you. ● James Advantage Funds does not jointly market. |
Item 2. Code of Ethics.
Not applicable to this Report.
Item 3. Audit Committee Financial Expert.
Not applicable to this Report.
Item 4. Principal Accountant Fees and Services.
Not applicable to this Report.
Item 5. Audit Committee of Listed Registrants.
Not applicable to the registrant.
Item 6. Investments.
| (a) | The Schedule of Investments is included as part of the report to shareholders filed under Item 1 of this Form. |
| (b) | Not applicable to the registrant. |
Item 7. Disclosure of Proxy Voting Policies and Procedures for Closed-End Management Investment Companies.
Not applicable to the registrant.
Item 8. Portfolio Managers of Closed-End Management Investment Companies.
Not applicable to the registrant.
Item 9. Purchases of Equity Securities by Closed-End Management Investment Company and Affiliated Purchasers.
Not applicable to the registrant.
Item 10. Submission of Matters to a Vote of Security Holders.
The registrant has not adopted procedures by which shareholders may recommend nominees to the registrant’s board of trustees.
Item 11. Controls and Procedures.
| (a) | Based on an evaluation of the registrant’s disclosure controls and procedures (as defined in Rule 30a-3(c) under the Investment Company Act of 1940, as amended), the registrant’s principal executive officer and principal financial officer have concluded that the registrant’s disclosure controls and procedures are effective as of a date within 90 days of the filing date of this report. |
| (b) | There were no significant changes in the registrant’s internal control over financial reporting (as defined in Rule 30a-3(d) under the Investment Company Act of 1940, as amended) that occurred during the second fiscal quarter of the period covered by this Report that have materially affected, or are reasonably likely to materially affect, the registrant’s internal control over financial reporting. |
Item 12. Exhibits.
| (a)(1) | Not applicable to this Report. |
| (a)(2) | Certifications required by Item 12(a)(2) of Form N-CSR are filed herewith as Exhibit 99.CERT. |
| (b) | Certifications required by Item 12(b) of Form N-CSR are filed herewith as Exhibit 99.906CERT. |
SIGNATURES
Pursuant to the requirements of the Securities Exchange Act of 1934 and the Investment Company Act of 1940, the Registrant has duly caused this Report to be signed on its behalf by the undersigned, thereunto duly authorized.
(Registrant) The James Advantage Funds
| By (Signature and Title) | |
| | |
| /s/ Barry R. James | |
| Barry R. James | |
| President | |
| | |
Date: March 6, 2017
Pursuant to the requirements of the Securities Exchange Act of 1934 and the Investment Company Act of 1940, this report has been signed below by the following persons on behalf of the registrant and in the capacities and on the dates indicated.
| By (Signature and Title) | |
| | |
| /s/ Barry R. James | |
| Barry R. James | |
| President | |
| | |
Date: March 6, 2017
| By (Signature and Title) | |
| | |
| /s/ Thomas L. Mangan | |
| Thomas L. Mangan | |
| Chief Financial Officer | |
| | |
Date: March 6, 2017