UNITED STATES
SECURITIES AND EXCHANGE COMMISSION
WASHINGTON, D.C. 20549
FORM N-CSR
CERTIFIED SHAREHOLDER REPORT OF REGISTERED
MANAGEMENT INVESTMENT COMPANIES
811-08411
(Investment Company Act file number)
The James Advantage Funds
(Exact name of registrant as specified in charter)
1349 Fairground Road
Xenia, Ohio 45385
(Address of principal executive offices) (Zip code)
Barry R. James
P.O. Box 8
Alpha, Ohio 45301
(Name and address of agent for service)
Registrant’s telephone number, including area code:(937) 426-7640
Date of fiscal year end:June 30
Date of reporting period:July 1, 2019 – December 31, 2019
Item 1. Reports to Stockholders.

TABLE OF CONTENTS
| Shareholder Letter | 1 |
| Growth of $10,000 or $50,000 Charts | 4 |
| Representation of Schedules of Investments | 7 |
| Disclosure of Fund Expenses | 8 |
| Schedule of Investments | |
| James Balanced: Golden Rainbow Fund | 9 |
| James Small Cap Fund | 15 |
| James Micro Cap Fund | 17 |
| James Aggressive Allocation Fund | 19 |
| Statements of Assets and Liabilities | 22 |
| Statements of Operations | 23 |
| Statements of Changes in Net Assets | 24 |
| Financial Highlights | |
| James Balanced: Golden Rainbow Fund - Retail Class | 29 |
| James Balanced: Golden Rainbow Fund - Institutional Class | 30 |
| James Small Cap Fund | 31 |
| James Micro Cap Fund | 32 |
| James Aggressive Allocation Fund | 33 |
| Notes to Financial Statements | 34 |
| Additional Information | 41 |
| Privacy Policy | 42 |
Beginning on January 1, 2021, as permitted by regulations adopted by the U.S. Securities and Exchange Commission, paper copies of the Funds’ annual and semi-annual shareholder reports will no longer be sent by mail, unless you specifically request paper copies of the reports. Instead, the reports will be made available on the Funds’ website at www.jamesfunds.com and you will be notified by mail each time a report is posted and provided with a website link to access the report.
You may, notwithstanding the availability of shareholder reports online, elect to receive all future shareholder reports in paper free of charge. If you invest through a financial intermediary, you can contact your financial intermediary to request that you continue to receive paper copies of your shareholder reports. If you invest directly with the Funds, you can call 1-800-995-2637 to let the Funds know you wish to continue receiving paper copies of your shareholder reports.
If you already elected to receive shareholder reports electronically, you will not be affected by this change and you need not take any action. You may elect to receive shareholder reports and other communications from the Funds electronically anytime by contacting your financial intermediary (such as a broker-dealer or bank) or, if you are a direct investor, by enrolling at www.jamesfunds.com.
| James Advantage Funds | Shareholder Letter |
December 31, 2019 (Unaudited)
LETTER TO THE SHAREHOLDERS
OF THE JAMES ADVANTAGE FUNDS
It was a good year to be an investor, no matter what asset class you were invested in. Thanks to the Federal Reserve, who decided to cut rates three times in 2019, stocks advanced and many of the major indices closed the year at all time highs. At the same time interest rates declined, pushing bond prices higher. It has been 21 years since we last saw these two major asset classes advance so much in the same year.
The Markets Over the Past Six Months
In hindsight, the second half of 2019 looks like two separate and distinct time periods for the markets. The late summer months of July, August and September, saw the major market indices move sideways, with very little advance. Tariffs between the United States and China had buyers questioning how much further stocks could advance. This all changed in early October as news of a “very substantial phase one deal” led to optimism and a year end rally. In the second half of calendar year 2019, the Russell 1000® Index increased 10.59% and the NASDAQ advanced by 12.70%. The Russell 2000® Index, which is comprised of small capitalization stocks, increased as well; however, it only advanced by 7.30%.
While stocks were advancing, fixed income investments (bonds) made money too, just not as much as the stock market. Case in point, the Barclays Intermediate U.S. Gov’t/Credit Index posted a positive return of 1.75% over the same timeframe.
Investment Goals and Objectives
The James Balanced: Golden Rainbow Fund (the “Golden Rainbow Fund”) seeks to provide total return through a combination of growth and income and preservation of capital in declining markets. The Golden Rainbow Fund will generally hold positions in common stocks that in aggregate constitute between 35 percent and 55 percent of the net assets. Bonds held in the fund must be rated Baa2 by Moody’s/BBB by S&P or higher at the time of purchase. The Golden Rainbow Fund may hold municipal bonds, but generally buys them when they are attractively priced compared with taxable bonds.
The Golden Rainbow Fund’s benchmark is a blend of 25% Russell 1000® Index, 25% Russell 2000® Index and 50% Barclays Capital U.S. Intermediate Government/Credit Bond Index. The benchmark is the same for all share classes of the Golden Rainbow Fund. We believe this index to be an appropriate benchmark for the Fund as it provides a true representation from both large, mid and small capitalization stocks as well as a fixed income component.
The James Aggressive Allocation Fund (the “Aggressive Allocation Fund”) seeks to provide total return through a combination of growth and income, but preservation of capital in declining markets is a secondary objective. Shareholders should be aware this Fund will likely have a higher level of volatility than the Golden Rainbow Fund. The Aggressive Allocation Fund’s benchmark is a blend of 65% Russell 3000® Index and 35% Barclays U.S. Aggregate Government/Credit Bond Index.
The James Small Cap Fund (the “Small Cap Fund”) and the James Micro Cap Fund (the “Micro Cap Fund”) each seek to provide long-term capital appreciation. These Funds hold only equity securities and cash/cash equivalents, under most circumstances. The Small Cap Fund’s benchmark is the Russell 2000® Index, and the Micro Cap Fund’s benchmark is the Russell Microcap® Index.
Investment Philosophy
James Investment Research, Inc., the James Advantage Funds’ adviser (the “Adviser” or “JIR”), commenced operations in 1972 and became known as a value manager, identifying stocks with good relative valuations, profitability and price momentum. The Adviser’s research, along with much academic research, supports the view that value investing tends to outperform growth investing over the longer-run. While some growth stocks may have astronomical returns, many eventually succumb to too much optimism and speculative investing and produce sharply inferior long-term results. Many dot-com stocks in 2000 and real estate stocks in 2008 bear this out. JIR ranks stocks based on their value characteristics and includes those ranked highly in the James Advantage Funds’ portfolios.
The Adviser has no soft-dollar arrangements, and does not purchase research from any broker/dealers.
The James Advantage Funds offer several different styles, but they all use the Adviser’s “bargain” or value approach to stock selection. The Aggressive Allocation Fund generally takes on greater risk than the Golden Rainbow Fund in terms of its higher allocation to stocks, but still seeks to reduce that risk in anticipation of a major decline in stock prices. Due to potentially higher equity levels, Aggressive Allocation Fund shareholders should generally have higher risk appetites for their mutual fund investments than those in the Golden Rainbow Fund.
| Semi-Annual Report | December 31, 2019 | 1 |
| Shareholder Letter | James Advantage Funds |
December 31, 2019 (Unaudited)
The Micro Cap Fund and the Small Cap Fund invest in smaller capitalization companies. The Small Cap and Micro Cap Funds are niche products designed to meet the objectives of investors who want to establish diversified positions in these areas. As these Funds are all-equity products, they are intrinsically riskier than other products holding bonds and the shareholder should expect relatively greater volatility in Net Asset Value (“NAV”) prices and a higher standard deviation of returns. Still, these portfolios hold stocks that are ranked highly by the Adviser’s models and pass a thorough review by the Adviser’s researchers and portfolio managers.
Strategy for Seeking to Meet Fund Objectives
While the main objective is to provide total return through growth and income, the Adviser has always held to the belief preservation of capital in down markets is the key to long-term investment success. Hence, the Golden Rainbow Fund seeks to preserve capital by constructing a portfolio of both bonds and stocks. In the past, stocks have often provided capital appreciation when the economy has proven to be strong. Bonds, in general, are uncorrelated with stocks, and can provide asset class diversification as well as an income stream. In times when the stock market is strong, some investors may forget these positive characteristics of bonds, but the Golden Rainbow Fund has always held a significant position in bonds.
The Small Cap Fund and the Micro Cap Fund look for stocks the Adviser believes to be undervalued, using its proprietary research to screen a database of over 8,000 stocks. Deterioration in a stock’s fundamental value characteristics can lead the Adviser to trim or sell the position.
Fund Performance
The Golden Rainbow Fund and the Aggressive Allocation Fund both hold significant bond positions. The expectation is that in periods of strong stock market returns, the Funds will participate, however not to the full extent, in the all stock indices. The same can be said of the expectations should stocks fall. These balanced styles strive to lessen the volatility many pure stock funds experience. Over the six-month period ended December 31, 2019, the Retail Class shares of the Golden Rainbow Fund advanced 4.31% and the Institutional Class shares advanced 4.40%. The Fund’s benchmark was up 5.37%. The Golden Rainbow Fund paid out a regular dividend every quarter. The Retail Class shares paid 5.6 cents per share in September and 5.0 cents per share in December. The Institutional Class shares paid 6.9 cents per share in September and 6.4 cents per share in December. In addition, in December the Golden Rainbow Fund paid all shareholders a long-term capital gains distribution of 15.2 cents per share.
Over the six months ended December 31, 2019, the Small Cap Fund increased 5.90% while its benchmark, the Russell 2000® Index, advanced 7.30%. The Small Cap Fund did not pay an ordinary dividend or a capital gain for the year.
The Micro Cap Fund increased 7.34% for the six months ended December 31, 2019. Its benchmark, the Russell Microcap® Index increased 7.26%. The Fund paid a long-term capital gain in December of 50.6 cents per share as well as paying out 3.9 cents per share of dividend income.
The Aggressive Allocation Fund is like the Golden Rainbow Fund in the sense that its strategy requires the Fund to hold both stocks and bonds. However, it is a more aggressive fund and generally will hold a higher allocation to stocks than the Golden Rainbow Fund. The Aggressive Allocation Fund paid an ordinary dividend of 10.7 cents per share in December. No capital gain distribution was paid. For the six months ended December 31, 2019, the Aggressive Allocation Fund increased by 4.77% while its benchmark, a blend of 65% Russell 3000® Index and 35% Barclays U.S. Aggregate Government/Credit Bond Index, advanced 7.67%.
Expectations for the Future
The James Advantage Funds are happy to report that all of the Funds earned in excess of 12% for calendar year 2019. Much like riding a bicycle, the view behind us may be nice, but the truly important perspective is what lies ahead. With that being said, we believe momentum continues to be a favorable factor as markets advance and set new highs.
The Adviser’s research points to the economy continuing to advance, albeit at a measured pace. The U.S. consumer continues to spend while at the same time being in a healthy financial position for this trend to potentially continue. This spending is in stark contrast to the slow down in manufacturing. With the U.S. economy now being so dependent on the service sector, manufacturing may not play as important of a role as it has in the past.
| James Advantage Funds | Shareholder Letter |
December 31, 2019 (Unaudited)
While the stock market appears to be on firm footing, there are areas we continue to keep an eye on. Geopolitical risks such as Impeachment, issues in the Middle East and the upcoming 2020 Presidential election could impact markets world wide. Should any one of these issues flare up, action will be taken by the Adviser to seek to preserve capital. Until then, the Adviser will continue to refine its stock and bond picks and be cautiously optimistic.
Thank you for your continued support in 2019. The James Advantage Funds will remain hard at work in 2020 managing your investments.
Brian P. Shepardson
Secretary
Brian Shepardson is a registered representative of ALPS Distributors, Inc.
The statements and opinions expressed are those of the author, are as of the date of this report, are subject to change, and may not reflect the writer’s current views. All information is historical and not indicative of future results and subject to change. It should not be assumed that an investment in the securities mentioned will be profitable in the future. This information is not a recommendation to buy or sell.
You should carefully consider the investment objectives, potential risks, management fees, and charges and expenses of the Fund before investing. The Fund’s prospectus contains this and other information about the Fund and should be read carefully before investing. You may obtain a current copy of the Fund’s prospectus by calling 1-800-995-2637.
Past performance is no guarantee of future results. The investment return and principal value of an investment in the Fund will fluctuate so that an investor’s shares, when redeemed, may be worth more or less than their original cost. Investors may obtain performance information current to the last month-end at www.jamesfunds.com.
NASDAQ is a global electronic marketplace for buying and selling securities, as well as the benchmark index for U.S. technology stocks.
Standard deviation is a measure of the dispersion of a set of data from its mean and is one of the key fundamental risk measures used in the financial services industry.
Credit ratings apply the underlying holdings of the Fund, and not to the Fund itself. Moody’s and S&P study the financial condition of an entity to ascertain its creditworthiness. The credit ratings reflect the rating agency's opinion of the holdings financial condition and histories. The ratings shown (Baa2 by Moody’s/BBB by S&P) are all considered investment grade and are listed by highest to lowest in percentage of what the Fund holds.
Diversification does not eliminate the risk of experiencing investment loss.
ALPS Distributors, Inc. 1290 Broadway, Ste. 1000, Denver, CO 80203 (Member FINRA). ALPS is not affiliated with James Investment Research, Inc.
| Semi-Annual Report | December 31, 2019 | 3 |
| Growth of $10,000 or $50,000 Charts | James Advantage Funds |
December 31, 2019 (Unaudited)
Comparison of the Change in Value of a $10, 000 Investment in the James Balanced: Golden Rainbow Fund – Retail Class
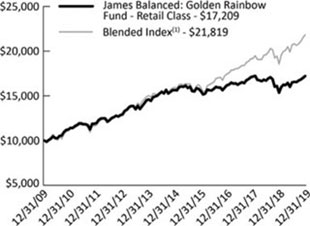
James Balanced: Golden Rainbow Fund – Retail Class Average Annual Total Returns
| | 1 Year | 5 Years | 10 Years | Since Inception(2) |
| James Balanced: Golden Rainbow – Retail Class | 12.10% | 1.93% | 5.58% | 7.23% |
| Blended Index(1) | 17.55% | 6.47% | 8.11% | 8.03% |
| Russell 1000® Index | 31.43% | 11.48% | 13.54% | 10.21% |
| Russell 2000® Index | 25.53% | 8.23% | 11.83% | 9.89% |
| Bloomberg Barclays U.S. Intermediate Government/Credit Bond Index | 6.80% | 2.57% | 3.05% | 5.21% |
| (1) | The Blended Index is comprised of a 25% weighting in the Russell 1000®Index, a 25% weighting in the Russell 2000®Index and a 50% weighting in the Bloomberg Barclays U.S. Intermediate Government/Credit Bond Index. |
| (2) | Fund inception was July 1, 1991. |
| The total annual operating expense ratio as stated in the fee table of the most recent prospectus, dated November 1, 2019, was 1.08%. |
Comparison of the Change in Value of a $50,000 Investment in the James Balanced: Golden Rainbow Fund – Institutional Class
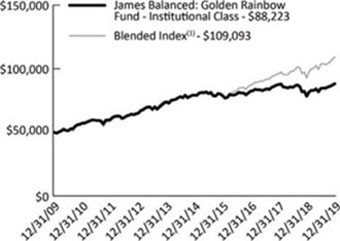
James Balanced: Golden Rainbow Fund – Institutional Class Average Annual Total Returns
| | 1 Year | 5 Years | 10 Years | Since
Inception(2) |
| James Balanced: Golden Rainbow – Institutional Class | 12.40% | 2.18% | 5.84% | 7.48% |
| Blended Index(1) | 17.55% | 6.47% | 8.11% | 10.43% |
| Russell 1000® Index | 31.43% | 11.48% | 13.54% | 17.68% |
| Russell 2000® Index | 25.53% | 8.23% | 11.83% | 16.58% |
| Bloomberg Barclays U.S. Intermediate Government/Credit Bond Index | 6.80% | 2.57% | 3.05% | 3.36% |
| (1) | The Blended Index is comprised of a 25% weighting in the Russell 1000®Index, a 25% weighting in the Russell 2000®Index and a 50% weighting in the Bloomberg Barclays U.S. Intermediate Government/Credit Bond Index. |
| (2) | Fund inception was March 2, 2009. |
| The total annual operating expense ratio as stated in the fee table of the most recent prospectus, dated November 1, 2019, was 0.83%. |
Past performance does not guarantee future results. The performance data quoted represents past performance and current returns may be lower or higher. The investment return and principal value will fluctuate so that an investor’s shares, when redeemed, may be worth more or less than the original cost. These performance figures do not reflect the deduction of taxes that a shareholder would pay on Fund distributions or the redemption of Fund shares. Please call 1-800-995-2637 for most recent month-end performance information.
The Russell 1000® Index is an index of approximately 1,000 of the largest companies in the U.S. equity market. The Russell 1000® Index is a subset of the Russell 3000® Index. It represents the top companies by market capitalization.
The Russell 2000® Index is a widely recognized, unmanaged index comprised of the 2,000 smallest U.S. domiciled publicly-traded common stocks of the Russell 3000® Index, which represents approximately 8% of the total market capitalization of the Russell 3000® Index, an unmanaged index of the 3,000 largest U.S. domiciled publicly-traded common stocks by market capitalization.
The Bloomberg Barclays U.S. Intermediate Government/Credit Bond Index measures the performance of U.S. Dollar denominated U.S. Treasuries, government-related and investment grade U.S. corporate securities that have a remaining maturity of greater than one year and less than ten years.
The Russell 1000® Index, Russell 2000® Index, Bloomberg Barclays U.S. Intermediate Government/Credit Bond Index and Blended Index are widely recognized unmanaged indices of security prices and are representative of a broader market and range of securities than is found in the Fund’s portfolio. The Index returns do not reflect the deduction of expenses, which have been deducted from a Fund’s returns. The Index returns assume reinvestment of all distributions and do not reflect the deduction of taxes and fees. Individuals cannot invest directly in any Index; however, an individual can invest in exchange traded funds or other investment vehicles that attempt to track the performance of a benchmark index.
| James Advantage Funds | Growth of $10,000 or $50,000 Charts |
December 31, 2019 (Unaudited)
Comparison of the Change in Value of a $10,000 Investment in the James Small Cap Fund
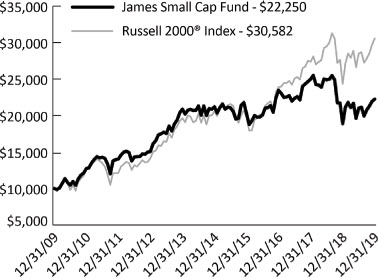
James Small Cap Fund
Average Annual Total Returns
| | 1 Year | 5 Years | 10 Years | Since Inception(1) |
| James Small Cap Fund | 17.82% | 0.98% | 8.33% | 6.91% |
| Russell 2000® Index | 25.53% | 8.23% | 11.83% | 9.07% |
| (1) | Fund inception was October 2, 1998. |
| The total annual operating expense ratio as stated in the fee table of the most recent prospectus, dated November 1, 2019, was 1.54%. |
Comparison of the Change in Value of a $10,000 Investment in the James Micro Cap Fund
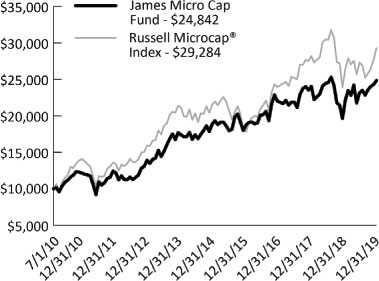
James Micro Cap Fund
Average Annual Total Returns
| | 1 Year | 5 Years | Since Inception(1) |
| James Micro Cap Fund | 26.49% | 5.92% | 10.05% |
| Russell Microcap® Index | 22.43% | 6.57% | 11.97% |
| (1) | Fund inception was July 1, 2010. |
| The total annual operating expense ratio as stated in the fee table of the most recent prospectus, dated November 1, 2019, was 1.57%. |
Past performance does not guarantee future results. The performance data quoted represents past performance and current returns may be lower or higher. The investment return and principal value will fluctuate so that an investor’s shares, when redeemed, may be worth more or less than the original cost. These performance figures do not reflect the deduction of taxes that a shareholder would pay on Fund distributions or the redemption of Fund shares. Please call 1-800-995-2637 for most recent month-end performance information.
Small and Micro Cap investing involve greater risk not associated with investing in more established companies, such as greater price volatility, business risk, less liquidity and increased competitive threat.
The Russell Microcap®Index measures the performance of the microcap segment of the U.S. equity market. It makes up less than 3% of the U.S. equity market. It includes 1,000 of the smallest securities in the small cap Russell 2000® Index, plus the next smallest eligible securities by market cap.
The Russell 2000® Index is a widely recognized, unmanaged index comprised of the 2,000 smallest U.S. domiciled publicly-traded common stocks of the Russell 3000® Index, which represents approximately 8% of the total market capitalization of the Russell 3000® Index, an unmanaged index of the 3,000 largest U.S. domiciled publicly-traded common stocks by market capitalization.
The Russell 2000® Index and Russell Microcap® Index are widely recognized unmanaged indices of security prices and are representative of a broader market and range of securities than is found in the Fund’s portfolio. The Index returns do not reflect the deduction of expenses, which have been deducted from a Fund’s returns. The Index returns assume reinvestment of all distributions and do not reflect the deduction of taxes and fees. Individuals cannot invest directly in any Index; however, an individual can invest in exchange traded funds or other investment vehicles that attempt to track the performance of a benchmark index.
| Semi-Annual Report | December 31, 2019 | 5 |
| Growth of $10,000 or $50,000 Charts | James Advantage Funds |
December 31, 2019 (Unaudited)
Comparison of the Change in Value of a $10,000 Investment in the James Aggressive Allocation Fund

James Aggressive Allocation Fund
Average Annual Total Returns
| | 1 Year | Since
Inception(2) |
| James Aggressive Allocation Fund | 14.18% | 2.14% |
| Blended Index(1) | 23.47% | 9.22% |
| Russell 3000® Index | 31.02% | 11.92% |
Bloomberg Barclays U.S. Aggregate Government/Credit Bond Index | 9.71% | 3.76% |
| (1) | The Blended Index is comprised of a 65% weighting in the Russell 3000®Index and a 35% weighting in the Bloomberg Barclays U.S. Aggregate Government/Credit Bond Index. |
| (2) | Fund inception was July 1, 2015. |
| The total annual operating expense ratio as stated in the fee table of the most recent prospectus, dated November 1, 2019, was 1.03%. |
Past performance does not guarantee future results. The performance data quoted represents past performance and current returns may be lower or higher. The investment return and principal value will fluctuate so that an investor’s shares, when redeemed, may be worth more or less than the original cost. These performance figures do not reflect the deduction of taxes that a shareholder would pay on Fund distributions or the redemption of Fund shares. Please call 1-800-995-2637 for most recent month-end performance information.
The Russell 3000®Index is a stock market index of U.S. stocks. The Index measures the performance of 3,000 publicly held U.S. companies based on total market capitalization, which represents approximately 98% of the investable U.S. equity market.
The Bloomberg Barclays U.S. Aggregate Government/Credit Bond Index is an unmanaged index generally representative of U.S. Dollar denominated U.S. Treasuries, government related and investment grade U.S. corporate securities, that have a remaining maturity greater than one year.
The Russell 3000® Index, Bloomberg Barclays U.S. Aggregate Government/Credit Bond Index and the Blended Index are widely recognized unmanaged indices of security prices and are representative of a broader market and range of securities than is found in the Fund’s portfolio. The Index returns do not reflect the deduction of expenses, which have been deducted from a Fund’s returns. The Index returns assume reinvestment of all distributions and do not reflect the deduction of taxes and fees. Individuals cannot invest directly in any Index; however, an individual can invest in exchange traded funds or other investment vehicles that attempt to track the performance of a benchmark index.
| James Advantage Funds | Representation of Schedules of Investments |
December 31, 2019 (Unaudited)
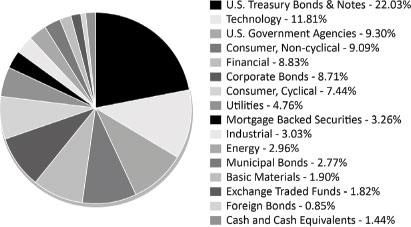
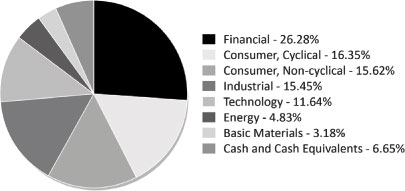
The illustrations below provide the industry sectors for the James Balanced: Golden Rainbow Fund, James Small Cap Fund, James Micro Cap Fund and James Aggressive Allocation Fund.
James Balanced: Golden Rainbow Fund - Industry Sector Allocation
(% of Net Assets)*
James Micro Cap Fund - Industry Sector Allocation
(% of Net Assets)*
James Small Cap Fund - Industry Sector Allocation
(% of Net Assets)*

James Aggressive Allocation Fund - Industry Sector Allocation
(% of Net Assets)*
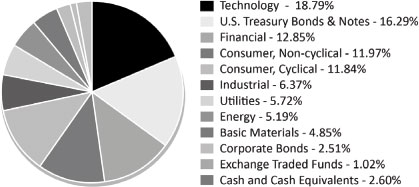
| * | Holdings are subject to change, and may not reflect the current or future position of the portfolio. |
| Semi-Annual Report | December 31, 2019 | 7 |
| Disclosure of Fund Expenses | James Advantage Funds |
December 31, 2019 (Unaudited)
Example.As a shareholder of a Fund, you incur two types of costs: (1) transaction costs, including reinvested dividends or other distributions, and redemption fees; and (2) ongoing costs, including management fees, distribution (12b-1) fees and other Fund expenses. This example is intended to help you understand your ongoing costs (in dollars) of investing in the Funds and to compare these costs with the ongoing costs of investing in other mutual funds.
The example is based on an investment of $1,000 invested at the beginning of the period and held for the entire period July 1, 2019 through December 31, 2019.
Actual Expenses. The first line of the table below provides information about actual account values and actual expenses. You may use the information in this line, together with the amount you invested, to estimate the expenses that you paid over the period. Simply divide your account value by $1,000 (for example, an $8,600 account value divided by $1,000 = 8.6), then multiply the result by the number in the first line under the heading “Expense Paid During Period” to estimate the expenses you paid on your account during this period.
Hypothetical Example for Comparison Purposes. The second line of the table below provides information about hypothetical account values and hypothetical expenses based on a Fund’s actual expense ratio and an assumed rate of return of 5% per year before expenses, which is not the Fund’s actual returns. The hypothetical account values and expenses may not be used to estimate the actual ending account balance or expenses you paid for the period. You may use this information to compare the ongoing costs of investing in a Fund and other mutual funds. To do so, compare this 5% hypothetical example with the 5% hypothetical examples that appear in the shareholder reports of the other funds.
Please note that expenses shown in the table are meant to highlight and help you compare ongoing costs only. The calculations assume no shares were bought or sold during the period. Your actual costs may have been higher or lower, depending on the amount of your investment and the timing of any purchases or redemptions.
| | Net Expense Ratio Annualized
December 31, 2019(a) | Beginning Account Value July 1, 2019 | Ending Account Value December 31, 2019 | Expense Paid During Period(b) |
| James Balanced: Golden Rainbow Fund | | | | |
| Retail Class Actual | 1.12% | $1,000.00 | $1,043.10 | $5.75 |
| Retail Class Hypothetical (5% return before expenses) | 1.12% | $1,000.00 | $1,019.51 | $5.69 |
| Institutional Class Actual | 0.87% | $1,000.00 | $1,044.00 | $4.47 |
| Institutional Class Hypothetical (5% return before expenses) | 0.87% | $1,000.00 | $1,020.76 | $4.42 |
| James Small Cap Fund | | | | |
| Actual | 1.50% | $1,000.00 | $1,059.00 | $7.76 |
| Hypothetical (5% return before expenses) | 1.50% | $1,000.00 | $1,017.60 | $7.61 |
| James Micro Cap Fund | | | | |
| Actual | 1.50% | $1,000.00 | $1,073.40 | $7.82 |
| Hypothetical (5% return before expenses) | 1.50% | $1,000.00 | $1,017.60 | $7.61 |
| James Aggressive Allocation Fund | | | | |
| Actual | 0.98% | $1,000.00 | $1,047.70 | $5.04 |
| Hypothetical (5% return before expenses) | 0.98% | $1,000.00 | $1,020.21 | $4.98 |
| (a) | Annualized, based on the Fund's most recent fiscal half year expenses. |
| (b) | Expenses are equal to the Fund's annualized expense ratio multiplied by the average account value over the period, multiplied by the number of days in the most recent fiscal half year (184), divided by 366. |
| James Balanced: Golden Rainbow Fund | Schedule of Investments |
December 31, 2019 (Unaudited)
| Shares or Principal Amount | | Value | |
| COMMON STOCKS-49.82% | | | |
| | | | Basic Materials-1.90% | | | |
| | 36,770 | | | Avery Dennison Corp. | | $ | 4,810,251 | |
| | 56,145 | | | Celanese Corp. | | | 6,912,572 | |
| | 33,060 | | | Innospec, Inc. | | | 3,419,726 | |
| | 37,160 | | | International Paper Co. | | | 1,711,218 | |
| | | | | | | | 16,853,767 | |
| | | | | | | | | |
| | | | | Consumer, Cyclical-7.44% | | | | |
| | 30,295 | | | Asbury Automotive Group, Inc.* | | | 3,386,678 | |
| | 111,320 | | | Best Buy Co., Inc. | | | 9,773,896 | |
| | 73,100 | | | Bloomin’ Brands, Inc. | | | 1,613,317 | |
| | 67,710 | | | Delta Air Lines, Inc. | | | 3,959,681 | |
| | 16,930 | | | Home Depot, Inc. | | | 3,697,173 | |
| | 72,445 | | | Insight Enterprises, Inc.* | | | 5,092,159 | |
| | 10,870 | | | Knoll, Inc. | | | 274,576 | |
| | 45,000 | | | McDonald’s Corp. | | | 8,892,450 | |
| | 37,632 | | | PulteGroup, Inc. | | | 1,460,122 | |
| | 32,000 | | | SkyWest, Inc. | | | 2,068,160 | |
| | 37,540 | | | Target Corp. | | | 4,813,003 | |
| | 142,785 | | | Walmart, Inc. | | | 16,968,569 | |
| | 26,135 | | | Walt Disney Co. | | | 3,779,905 | |
| | 6,920 | | | Winnebago Industries, Inc. | | | 366,622 | |
| | | | | | | | 66,146,311 | |
| | | | | | | | | |
| | | | | Consumer, Non-cyclical-9.09% | | | | |
| | 27,145 | | | Anthem, Inc. | | | 8,198,604 | |
| | 9,575 | | | Cardinal Health, Inc. | | | 484,304 | |
| | 33,955 | | | Eli Lilly & Co. | | | 4,462,706 | |
| | 29,250 | | | FTI Consulting, Inc.* | | | 3,236,805 | |
| | 22,900 | | | Helen of Troy, Ltd.* | | | 4,117,191 | |
| | 58,170 | | | Johnson & Johnson | | | 8,485,258 | |
| | 90,000 | | | Kraft Heinz Co. | | | 2,891,700 | |
| | 122,105 | | | Kroger Co. | | | 3,539,824 | |
| | 52,700 | | | Medtronic PLC | | | 5,978,815 | |
| | 56,520 | | | National HealthCare Corp. | | | 4,885,024 | |
| | 317,000 | | | Pfizer, Inc. | | | 12,420,060 | |
| | 61,000 | | | Procter & Gamble Co. | | | 7,618,900 | |
| | 101,975 | | | Tyson Foods, Inc., Class A | | | 9,283,804 | |
| | 11,280 | | | UnitedHealth Group, Inc. | | | 3,316,094 | |
| | 13,177 | | | Zoetis, Inc. | | | 1,743,976 | |
| | | | | | | | 80,663,065 | |
| | | | | | | | | |
| | | | | Energy-2.96% | | | | |
| | 74,185 | | | Chevron Corp. | | | 8,940,034 | |
| | 61,725 | | | ConocoPhillips | | | 4,013,977 | |
| | 51,210 | | | Exxon Mobil Corp. | | | 3,573,434 | |
| | 11,985 | | | HollyFrontier Corp. | | | 607,759 | |
| | 47,845 | | | Phillips 66 | | | 5,330,411 | |
| | 40,780 | | | Valero Energy Corp. | | | 3,819,047 | |
| | | | | | | | 26,284,662 | |
| | | | | | | | | |
| | | | | Financial-8.83% | | | | |
| | 78,010 | | | Aaron’s, Inc. | | | 4,455,151 | |
See Notes to Financial Statements.
| Semi-Annual Report | December 31, 2019 | 9 |
| Schedule of Investments | James Balanced: Golden Rainbow Fund |
December 31, 2019 (Unaudited)
| Shares or Principal Amount | | Value | |
| | | | | Financial (continued) | | | | |
| | 129,135 | | | Aflac, Inc. | | $ | 6,831,241 | |
| | 17,175 | | | Air Lease Corp. | | | 816,156 | |
| | 11,355 | | | Aircastle, Ltd. | | | 363,474 | |
| | 60,295 | | | Allstate Corp. | | | 6,780,173 | |
| | 8,430 | | | Ally Financial, Inc. | | | 257,621 | |
| | 48,812 | | | American Financial Group, Inc. | | | 5,352,236 | |
| | 50,605 | | | Capital One Financial Corp. | | | 5,207,761 | |
| | 26,350 | | | CBRE Group, Inc., Class A* | | | 1,614,991 | |
| | 117,445 | | | Fifth Third Bancorp | | | 3,610,259 | |
| | 6,095 | | | Goldman Sachs Group, Inc. | | | 1,401,423 | |
| | 4,550 | | | Hartford Financial Services Group, Inc. | | | 276,504 | |
| | 118,070 | | | JPMorgan Chase & Co. | | | 16,458,958 | |
| | 42,630 | | | Nelnet, Inc., Class A | | | 2,482,771 | |
| | 38,105 | | | PNC Financial Services Group, Inc. | | | 6,082,701 | |
| | 17,000 | | | Public Storage, REIT | | | 3,620,320 | |
| | 24,298 | | | Radian Group, Inc. | | | 611,338 | |
| | 105,867 | | | Real Estate Select Sector SPDR Fund | | | 4,093,877 | |
| | 9,085 | | | Stifel Financial Corp. | | | 551,005 | |
| | 20,700 | | | Travelers Cos., Inc. | | | 2,834,865 | |
| | 160,065 | | | Unum Group | | | 4,667,495 | |
| | | | | | | | 78,370,320 | |
| | | | | | | | | |
| | | | | Industrial-3.03% | | | | |
| | 24,852 | | | Caterpillar, Inc. | | | 3,670,143 | |
| | 42,300 | | | Eaton Corp. PLC | | | 4,006,656 | |
| | 36,811 | | | Generac Holdings, Inc.* | | | 3,702,818 | |
| | 5,570 | | | Gibraltar Industries, Inc.* | | | 280,951 | |
| | 58,020 | | | Magna International, Inc. | | | 3,181,817 | |
| | 62,173 | | | MasTec, Inc.* | | | 3,989,020 | |
| | 47,334 | | | Republic Services, Inc. | | | 4,242,546 | |
| | 22,710 | | | United Rentals, Inc.* | | | 3,787,347 | |
| | | | | | | | 26,861,298 | |
| | | | | | | | | |
| | | | | Technology-11.81% | | | | |
| | 21,160 | | | Amgen, Inc. | | | 5,101,041 | |
| | 60,000 | | | Apple, Inc. | | | 17,619,000 | |
| | 68,115 | | | Arrow Electronics, Inc.* | | | 5,772,065 | |
| | 24,450 | | | Cabot Microelectronics Corp. | | | 3,528,624 | |
| | 179,310 | | | Cisco Systems, Inc. | | | 8,599,708 | |
| | 26,400 | | | Crown Castle International Corp., REIT | | | 3,752,760 | |
| | 77,750 | | | Deluxe Corp. | | | 3,881,280 | |
| | 19,786 | | | Incyte Corp.* | | | 1,727,714 | |
| | 29,728 | | | Integer Holdings Corp.* | | | 2,391,023 | |
| | 169,220 | | | Intel Corp. | | | 10,127,817 | |
| | 20,119 | | | International Business Machines Corp. | | | 2,696,751 | |
| | 28,610 | | | KEMET Corp. | | | 773,901 | |
| | 22,152 | | | Leidos Holdings, Inc. | | | 2,168,459 | |
| | 13,800 | | | Lockheed Martin Corp. | | | 5,373,444 | |
| | 28,544 | | | Micron Technology, Inc.* | | | 1,535,096 | |
| | 118,325 | | | Microsoft Corp. | | | 18,659,853 | |
| | 22,890 | | | Motorola Solutions, Inc. | | | 3,688,495 | |
| | 11,965 | | | Northrop Grumman Corp. | | | 4,115,601 | |
| | 16,555 | | | SYNNEX Corp. | | | 2,132,284 | |
See Notes to Financial Statements.
| James Balanced: Golden Rainbow Fund | Schedule of Investments |
December 31, 2019 (Unaudited)
| Shares or Principal Amount | | Value | |
| | | | | Technology (continued) | | | | |
| | 16,380 | | | Western Digital Corp. | | $ | 1,039,639 | |
| | | | | | | | 104,684,555 | |
| | | | | | | | | |
| | | | | Utilities-4.76% | | | | |
| | 165,450 | | | AES Corp. | | | 3,292,455 | |
| | 68,003 | | | American Electric Power Co., Inc. | | | 6,426,964 | |
| | 95,163 | | | AT&T, Inc. | | | 3,718,970 | |
| | 43,710 | | | Entergy Corp. | | | 5,236,458 | |
| | 75,233 | | | FirstEnergy Corp. | | | 3,656,324 | |
| | 82,523 | | | NRG Energy, Inc. | | | 3,280,289 | |
| | 37,616 | | | PNM Resources, Inc. | | | 1,907,507 | |
| | 240,055 | | | Verizon Communications, Inc. | | | 14,739,377 | |
| | | | | | | | 42,258,344 | |
| TOTAL COMMON STOCKS | | | | |
| (Cost $338,208,121) | | | 442,122,322 | |
| Shares or Principal Amount | | | Value | |
| EXCHANGE TRADED FUNDS-1.82% | | | | |
| | 300,686 | | | iShares®Gold Trust* | | | 4,359,947 | |
| | 37,230 | | | iShares®Russell 2000 ETF | | | 6,167,894 | |
| | 43,574 | | | iShares®Russell 2000 Value ETF | | | 5,602,745 | |
| | | | | | | | | |
| TOTAL EXCHANGE TRADED FUNDS | | | | |
| (Cost $14,941,120) | | | 16,130,586 | |
| Shares or Principal Amount | | | Value | |
| CORPORATE BONDS -8.71% | | | | |
| | | | | Consumer, Cyclical-1.55% | | | | |
| $ | 5,000,000 | | | eBay, Inc., 2.600%, 7/15/22 | | | 5,026,921 | |
| | 5,000,000 | | | Home Depot, Inc., 2.700%, 4/1/23 | | | 5,118,240 | |
| | 785,000 | | | McDonald's Corp., 5.700%, 2/1/39 | | | 991,772 | |
| | 2,000,000 | | | Walmart, Inc., 5.250%, 9/1/35 | | | 2,588,430 | |
| | | | | | | | 13,725,363 | |
| | | | | Consumer, Non-cyclical-0.56% | | | | |
| | 3,000,000 | | | Hershey Co., 4.125%, 12/1/20 | | | 3,061,509 | |
| | 1,950,000 | | | Keurig Dr Pepper, Inc., 2.530%, 11/15/21 | | | 1,962,340 | |
| | | | | | | | 5,023,849 | |
| | | | | Financial-2.20% | | | | |
| | 8,100,000 | | | Berkshire Hathaway, Inc., 3.750%, 8/15/21 | | | 8,361,743 | |
| | 2,000,000 | | | Citigroup, Inc., 3.875%, 3/26/25 | | | 2,113,846 | |
| | 4,000,000 | | | JPMorgan Chase & Co., 2.750%, 6/23/20 | | | 4,011,512 | |
| | 5,000,000 | | | Wells Fargo & Co., 2.500%, 3/4/21 | | | 5,034,984 | |
| | | | | | | | 19,522,085 | |
| | | | | Industrial-0.59% | | | | |
| | 1,000,000 | | | Caterpillar, Inc., 8.250%, 12/15/38 | | | 1,604,101 | |
| | 1,000,000 | | | General Electric Co., 2.700%, 10/9/22 | | | 1,013,285 | |
| | 2,000,000 | | | General Electric Co., 6.875%, 1/10/39 | | | 2,660,588 | |
| | | | | | | | 5,277,974 | |
| | | | | Technology-3.81% | | | | |
| | 3,419,000 | | | Apple, Inc., 1.550%, 2/7/20 | | | 3,417,673 | |
| | 10,000,000 | | | Apple, Inc., 3M US L + 0.20%, 2/7/20(a) | | | 10,003,158 | |
| | 5,000,000 | | | Intel Corp., 3.300%, 10/1/21 | | | 5,137,023 | |
See Notes to Financial Statements.
| Semi-Annual Report | December 31, 2019 | 11 |
| Schedule of Investments | James Balanced: Golden Rainbow Fund |
December 31, 2019 (Unaudited)
| Shares or Principal Amount | | Value | |
| | | | | Technology (continued) | | | | |
| $ | 5,000,000 | | | Intel Corp., 2.875%, 5/11/24 | | $ | 5,189,442 | |
| | 3,700,000 | | | Microsoft Corp., 5.200%, 6/1/39 | | | 4,946,873 | |
| | 5,000,000 | | | Oracle Corp., 2.500%, 5/15/22 | | | 5,063,469 | |
| | | | | | | | 33,757,638 | |
| TOTAL CORPORATE BONDS | | | | |
| (Cost $73,348,818) | | | 77,306,909 | |
| Shares or Principal Amount | | | Value | |
| MUNICIPAL BONDS -2.77% | | | | |
| | | | | Hawaii-1.12% | | | | |
| | 9,000,000 | | | City and County of Honolulu General Obligation Unlimited Bonds, Series B, 5.000%, 11/1/25 | | | 9,950,130 | |
| | | | | | | | | |
| | | | | Ohio-1.62% | | | | |
| | 7,450,000 | | | Beavercreek City School District General Obligation Unlimited Bonds, 3.250%, 12/1/36 | | | 7,723,713 | |
| | 5,000,000 | | | Greenville City School District General Obligation Unlimited Bonds (School Improvement), 5.500%, 1/1/51 | | | 5,432,800 | |
| | 1,000,000 | | | Ohio State University General Recipients Revenue Bonds, Series C, 4.910%, 6/1/40 | | | 1,274,430 | |
| | | | | | | | 14,430,943 | |
| | | | | Texas-0.03% | | | | |
| | 235,000 | | | Tyler Independent School District General Obligation Unlimited Bonds, Unrefunded 2016, 5.000%, 2/15/34 | | | 236,072 | |
| | | | | | | | | |
| TOTAL MUNICIPAL BONDS | | | | |
| (Cost $23,301,446) | | | 24,617,145 | |
| Shares or Principal Amount | | | Value | |
| U.S. GOVERNMENT AGENCIES-9.30% | | | | |
| | | | | Federal Agricultural Mortgage Corp.-1.13% | | | | |
| $ | 10,000,000 | | | 3M US L + 0.08%, 1/3/22(a) | | | 9,987,889 | |
| | | | | | | | | |
| | | | | Federal Farm Credit Banks-0.79% | | | | |
| | 1,000,000 | | | 2.400%, 6/19/23 | | | 1,001,251 | |
| | 5,725,000 | | | 2.750%, 11/6/26 | | | 6,001,485 | |
| | | | | | | | 7,002,736 | |
| | | | | Federal Home Loan Banks-4.71% | | | | |
| | 5,000,000 | | | 1.600%, 10/22/20 | | | 4,994,271 | |
| | 10,000,000 | | | 2.875%, 6/13/25 | | | 10,541,480 | |
| | 1,071,429 | | | 2.620%, 4/28/26 | | | 1,064,209 | |
| | 5,000,000 | | | 2.420%, 9/17/27 | | | 4,935,540 | |
| | 1,000,000 | | | 2.500%, 9/11/29 | | | 986,596 | |
| | 14,000,000 | | | 2.000%, 6/30/31(b) | | | 13,987,410 | |
| | 5,000,000 | | | 4.080%, 5/25/33 | | | 5,311,840 | |
| | | | | | | | 41,821,346 | |
| | | | | Federal Home Loan Mortgage Corp.-1.13% | | | | |
| | 10,000,000 | | | 1.800%, 4/13/20 | | | 10,000,390 | |
See Notes to Financial Statements.
| James Balanced: Golden Rainbow Fund | Schedule of Investments |
December 31, 2019 (Unaudited)
| Shares or Principal Amount | | Value | |
| | | | | Tennessee Valley Authority-1.54% | | | | |
| $ | 10,000,000 | | | 5.250%, 9/15/39 | | $ | 13,710,790 | |
| | | | | | | | | |
| TOTAL U.S. GOVERNMENT AGENCIES | | | | |
| (Cost $81,018,743) | | | 82,523,151 | |
| Shares or Principal Amount | | | Value | |
| MORTGAGE BACKED SECURITIES-3.26% | | | | |
| | | | | Fannie Mae Pool-2.79% | | | | |
| | 7,560,297 | | | 3.500%, 9/1/33 | | | 7,917,596 | |
| | 17,173,726 | | | 2.500%, 1/1/57 | | | 16,820,179 | |
| | | | | | | | 24,737,775 | |
| | | | | Fannie Mae REMICS-0.47% | | | | |
| | 4,047,527 | | | 3.500%, 5/25/47 | | | 4,179,654 | |
| | | | | | | | | |
| TOTAL MORTGAGE BACKED SECURITIES | | | | |
| (Cost $28,323,611) | | | 28,917,429 | |
| Shares or Principal Amount | | | Value | |
| U.S. TREASURY BONDS & NOTES-22.03% | | | | |
| | | | | U.S. Treasury Bonds-13.71% | | | | |
| $ | 25,000,000 | | | 2.625%, 11/15/20 | | | 25,208,499 | |
| | 30,000,000 | | | 2.000%, 8/15/25 | | | 30,379,223 | |
| | 35,000,000 | | | 2.750%, 2/15/28 | | | 37,266,434 | |
| | 15,000,000 | | | 2.625%, 2/15/29 | | | 15,885,463 | |
| | 5,000,000 | | | 1.625%, 8/15/29 | | | 4,867,106 | |
| | 2,000,000 | | | 3.000%, 8/15/48 | | | 2,249,777 | |
| | 6,000,000 | | | 2.250%, 8/15/49 | | | 5,813,437 | |
| | | | | | | | 121,669,939 | |
| | | | | U.S. Treasury Notes-6.25% | | | | |
| | 15,000,000 | | | 3.500%, 5/15/20 | | | 15,100,196 | |
| | 40,000,000 | | | 2.375%, 4/15/21 | | | 40,380,267 | |
| | | | | | | | 55,480,463 | |
| | | | | United States Treasury Inflation Indexed Bonds-2.07% | | | | |
| | 18,129,475 | | | 0.625%, 4/15/23 | | | 18,409,221 | |
| | | | | | | | | |
| TOTAL U.S. TREASURY BONDS & NOTES | | | | |
| (Cost $191,681,218) | | | 195,559,623 | |
| Shares or Principal Amount | | | Value | |
| FOREIGN BONDS-0.85% | | | | |
| | | | | Singapore Government Bond-0.85% | | | | |
| SGD | 10,000,000 | | | 2.250%, 6/1/21 | | | 7,509,305 | |
| | | | | | | | | |
| TOTAL FOREIGN BONDS | | | | |
| (Cost $7,473,120) | | | 7,509,305 | |
See Notes to Financial Statements.
| Semi-Annual Report | December 31, 2019 | 13 |
| Schedule of Investments | James Balanced: Golden Rainbow Fund |
December 31, 2019 (Unaudited)
| Shares or Principal Amount | | Value | |
| SHORT TERM INVESTMENTS-0.79% | | | | |
| | | | | Mutual Fund-0.79% | | | | |
| | 7,025,012 | | | First American Treasury Obligations Fund, Class X, 7-Day Yield 1.527% | | $ | 7,025,012 | |
| | | | | | | | | |
| TOTAL SHORT TERM INVESTMENTS | | | | |
| (Cost $7,025,012) | | | 7,025,012 | |
| | | | | | | | | |
| TOTAL INVESTMENT SECURITIES-99.35% | | | | |
| (Cost $765,321,209) | | | 881,711,482 | |
| OTHER ASSETS IN EXCESS OF LIABILITIES-0.65% | | | 5,812,365 | |
| NET ASSETS-100.00% | | $ | 887,523,847 | |
For Fund compliance purposes, the Fund's industry classifications refer to any one or more of the industry sub-classifications used by one or more widely recognized market indexes or ratings group indexes, and/or as defined by Fund management. Those definitions may not apply for purposes of this report, which may combine industry sub-classifications for reporting ease. Industries are shown as a percentage of net assets.
| * | Non-income producing security. |
| (a) | Floating or variable rate security. The reference rate is described below. The rate in effect as of December 31, 2019 is based on the reference rate plus the displayed spread as of the security’s last reset date. |
| (b) | Step coupon. Coupon increases periodically based upon a predetermined schedule. Interest rate disclosed is that which is in effect as of December 31, 2019. |
Investment Abbreviations:
LIBOR - London Interbank Offered Rate
Libor Rates:
3M US L - 3 Month LIBOR as of December 31, 2019 was 1.91%
SGD - Singapore Dollar
See Notes to Financial Statements.
| James Small Cap Fund | Schedule of Investments |
December 31, 2019 (Unaudited)
| Shares | | Value | |
| COMMON STOCKS-95.70% | | | |
| | | | Basic Materials-5.80% | | | |
| | 18,605 | | | Boise Cascade Co. | | $ | 679,641 | |
| | 111,515 | | | Cleveland-Cliffs, Inc. | | | 936,726 | |
| | 37,790 | | | Mercer International, Inc. | | | 464,817 | |
| | 17,820 | | | Schnitzer Steel Industries, Inc., Class A | | | 386,338 | |
| | | | | | | | 2,467,522 | |
| | | | | | | | | |
| | | | | Consumer, Cyclical-18.83% | | | | |
| | 38,160 | | | Bloomin' Brands, Inc. | | | 842,191 | |
| | 26,220 | | | Brinker International, Inc. | | | 1,101,240 | |
| | 7,120 | | | Deckers Outdoor Corp.* | | | 1,202,283 | |
| | 32,300 | | | Gray Television, Inc.* | | | 692,512 | |
| | 19,890 | | | Insight Enterprises, Inc.* | | | 1,398,068 | |
| | 33,203 | | | MDC Holdings, Inc. | | | 1,267,026 | |
| | 9,680 | | | Patrick Industries, Inc. | | | 507,522 | |
| | 15,400 | | | SkyWest, Inc. | | | 995,302 | |
| | | | | | | | 8,006,144 | |
| | | | | | | | | |
| | | | | Consumer, Non-cyclical-14.83% | | | | |
| | 3,850 | | | FTI Consulting, Inc.* | | | 426,041 | |
| | 13,198 | | | Hillenbrand, Inc. | | | 439,625 | |
| | 21,275 | | | Ingles Markets, Inc., Class A | | | 1,010,775 | |
| | 13,050 | | | National HealthCare Corp. | | | 1,127,912 | |
| | 47,805 | | | Tivity Health, Inc.* | | | 972,593 | |
| | 11,640 | | | TriNet Group, Inc.* | | | 658,940 | |
| | 17,800 | | | TrueBlue, Inc.* | | | 428,268 | |
| | 27,620 | | | Village Super Market, Inc., Class A | | | 640,784 | |
| | 14,790 | | | Weis Markets, Inc. | | | 598,847 | |
| | | | | | | | 6,303,785 | |
| | | | | | | | | |
| | | | | Energy-0.75% | | | | |
| | 61,530 | | | Denbury Resources, Inc.* | | | 86,757 | |
| | 18,000 | | | Frontline, Ltd. | | | 231,480 | |
| | | | | | | | 318,237 | |
| | | | | | | | | |
| | | | | Financial-22.85% | | | | |
| | 23,480 | | | Aaron's, Inc. | | | 1,340,943 | |
| | 33,780 | | | American Equity Investment Life Holding Co. | | | 1,011,035 | |
| | 77,700 | | | First BanCorp | | | 822,843 | |
| | 241,000 | | | Genworth Financial, Inc., Class A* | | | 1,060,400 | |
| | 43,000 | | | Ladder Capital Corp., REIT | | | 775,720 | |
| | 7,395 | | | LGI Homes, Inc.* | | | 522,457 | |
| | 16,875 | | | Piper Jaffray Cos. | | | 1,348,988 | |
| | 16,880 | | | Stifel Financial Corp. | | | 1,023,772 | |
| | 33,790 | | | TPG Specialty Lending, Inc. | | | 725,471 | |
| | 49,600 | | | Xenia Hotels & Resorts, Inc., REIT | | | 1,071,856 | |
| | | | | | | | 9,703,485 | |
| | | | | | | | | |
| | | | | Industrial-5.36% | | | | |
| | 18,955 | | | Encore Wire Corp. | | | 1,088,017 | |
| | 9,000 | | | Generac Holdings, Inc. | | | 905,310 | |
��
See Notes to Financial Statements.
| Semi-Annual Report | December 31, 2019 | 15 |
| Schedule of Investments | James Small Cap Fund |
December 31, 2019 (Unaudited)
| Shares | | Value | |
| | | | | Industrial (continued) | | | | |
| | 36,910 | | | Modine Manufacturing Co.* | | $ | 284,207 | |
| | | | | | | | 2,277,534 | |
| | | | | | | | | |
| | | | | Technology-24.75% | | | | |
| | 32,445 | | | Blucora, Inc.* | | | 848,112 | |
| | 4,100 | | | Cabot Microelectronics Corp. | | | 591,712 | |
| | 27,683 | | | Deluxe Corp. | | | 1,381,935 | |
| | 87,060 | | | Innoviva, Inc.* | | | 1,232,770 | |
| | 14,190 | | | Integer Holdings Corp.* | | | 1,141,302 | |
| | 42,090 | | | KEMET Corp. | | | 1,138,535 | |
| | 32,945 | | | Nova Measuring Instruments, Ltd.* | | | 1,246,309 | |
| | 19,000 | | | Sykes Enterprises, Inc.* | | | 702,810 | |
| | 9,550 | | | SYNNEX Corp. | | | 1,230,040 | |
| | 47,010 | | | Vishay Intertechnology, Inc. | | | 1,000,843 | |
| | | | | | | | 10,514,368 | |
| | | | | | | | | |
| | | | | Utilities-2.53% | | | | |
| | 11,160 | | | PNM Resources, Inc. | | | 565,924 | |
| | 9,140 | | | Portland General Electric Co. | | | 509,921 | |
| | | | | | | | 1,075,845 | |
| | | | | | | | | |
| TOTAL COMMON STOCKS | | | | |
| (Cost $33,927,222) | | | 40,666,920 | |
| Shares | | | Value | |
| SHORT TERM INVESTMENTS-4.33% | | | | |
| | | | | Mutual Fund-4.33% | | | | |
| | 1,840,588 | | | First American Treasury Obligations Fund, Class X, 7-Day Yield 1.527% | | | 1,840,588 | |
| | | | | | | | | |
| TOTAL SHORT TERM INVESTMENTS | | | | |
| (Cost $1,840,588) | | | 1,840,588 | |
| | | | | | | | | |
| TOTAL INVESTMENT SECURITIES-100.03% | | | | |
| (Cost $35,767,810) | | | 42,507,508 | |
| OTHER LIABILITIES IN EXCESS OF OTHER ASSETS-(0.03)% | | | (14,059 | ) |
| NET ASSETS-100.00% | | $ | 42,493,449 | |
For Fund compliance purposes, the Fund's industry classifications refer to any one or more of the industry sub-classifications used by one or more widely recognized market indexes or ratings group indexes, and/or as defined by Fund management. Those definitions may not apply for purposes of this report, which may combine industry sub-classifications for reporting ease. Industries are shown as a percentage of net assets.
| * | Non-income producing security. |
See Notes to Financial Statements.
| James Micro Cap Fund | Schedule of Investments |
December 31, 2019 (Unaudited)
| Shares | | Value | |
| COMMON STOCKS-93.35% | | | |
| | | | Basic Materials-3.18% | | | |
| | 41,440 | | | Mercer International, Inc. | | $ | 509,712 | |
| | 16,645 | | | Schnitzer Steel Industries, Inc., Class A | | | 360,864 | |
| | | | | | | | 870,576 | |
| | | | | | | | | |
| | | | | Consumer, Cyclical-16.35% | | | | |
| | 34,280 | | | Century Communities, Inc.* | | | 937,558 | |
| | 22,875 | | | Haverty Furniture Cos., Inc. | | | 461,160 | |
| | 29,210 | | | M/I Homes, Inc.* | | | 1,149,413 | |
| | 22,811 | | | Patrick Industries, Inc. | | | 1,195,981 | |
| | 60,375 | | | Tilly's, Inc., Class A | | | 739,594 | |
| | | | | | | | 4,483,706 | |
| | | | | | | | | |
| | | | | Consumer, Non-cyclical-15.62% | | | | |
| | 23,615 | | | Heidrick & Struggles International, Inc. | | | 767,487 | |
| | 12,740 | | | Ingles Markets, Inc., Class A | | | 605,277 | |
| | 10,017 | | | John B Sanfilippo & Son, Inc. | | | 914,352 | |
| | 30,635 | | | Lantheus Holdings, Inc.* | | | 628,324 | |
| | 18,450 | | | PetIQ, Inc.* | | | 462,173 | |
| | 25,325 | | | TrueBlue, Inc.* | | | 609,320 | |
| | 12,940 | | | Village Super Market, Inc., Class A | | | 300,208 | |
| | | | | | | | 4,287,141 | |
| | | | | | | | | |
| | | | | Energy-4.83% | | | | |
| | 223,430 | | | Denbury Resources, Inc.* | | | 315,036 | |
| | 181,515 | | | W&T Offshore, Inc.* | | | 1,009,223 | |
| | | | | | | | 1,324,259 | |
| | | | | | | | | |
| | | | | Financial-26.28% | | | | |
| | 52,800 | | | Ares Commercial Real Estate Corp., REIT | | | 836,352 | |
| | 44,835 | | | Enova International, Inc.* | | | 1,078,730 | |
| | 8,595 | | | Federal Agricultural Mortgage Corp., Class C | | | 717,682 | |
| | 14,305 | | | LGI Homes, Inc.* | | | 1,010,648 | |
| | 56,010 | | | OFG Bancorp | | | 1,322,396 | |
| | 9,990 | | | Piper Jaffray Cos. | | | 798,601 | |
| | 17,865 | | | SP Plus Corp.* | | | 758,012 | |
| | 24,615 | | | Universal Insurance Holdings, Inc. | | | 688,974 | |
| | | | | | | | 7,211,395 | |
| | | | | | | | | |
| | | | | Industrial-15.45% | | | | |
| | 12,020 | | | ArcBest Corp. | | | 331,752 | |
| | 25,740 | | | CAI International, Inc.* | | | 745,945 | |
| | 9,410 | | | Encore Wire Corp. | | | 540,134 | |
| | 7,105 | | | NACCO Industries, Inc., Class A | | | 332,727 | |
| | 31,220 | | | Stoneridge, Inc.* | | | 915,370 | |
| | 26,745 | | | Vectrus, Inc.* | | | 1,370,949 | |
| | | | | | | | 4,236,877 | |
| | | | | | | | | |
| | | | | Technology-11.64% | | | | |
| | 94,290 | | | ACCO Brands Corp. | | | 882,554 | |
| | 21,405 | | | Nova Measuring Instruments, Ltd.* | | | 809,751 | |
See Notes to Financial Statements.
| Semi-Annual Report | December 31, 2019 | 17 |
| Schedule of Investments | James Micro Cap Fund |
December 31, 2019 (Unaudited)
| Shares | | Value | |
| | | | Technology (continued) | | | | |
| | 30,213 | | | PC Connection, Inc. | | $ | 1,500,378 | |
| | | | | | | 3,192,683 | |
| | | | | | | | |
| TOTAL COMMON STOCKS | | | | |
| (Cost $19,393,758) | | | 25,606,637 | |
| Shares | | | Value | |
| SHORT TERM INVESTMENTS-6.65% | | | | |
| | | | Mutual Fund-6.65% | | | | |
| | 1,822,903 | | | First American Treasury Obligations Fund, Class X, 7-Day Yield 1.527% | | | 1,822,903 | |
| | | | | | | | |
| TOTAL SHORT TERM INVESTMENTS | | | | |
| (Cost $1,822,903) | | | 1,822,903 | |
| | | | | | | | |
| TOTAL INVESTMENT SECURITIES-100.00% | | | | |
| (Cost $21,216,661) | | | 27,429,540 | |
| OTHER LIABILITIES IN EXCESS OF OTHER ASSETS-0.00%(a) | | | (255 | ) |
| NET ASSETS-100.00% | | $ | 27,429,285 | |
For Fund compliance purposes, the Fund's industry classifications refer to any one or more of the industry sub-classifications used by one or more widely recognized market indexes or ratings group indexes, and/or as defined by Fund management. Those definitions may not apply for purposes of this report, which may combine industry sub-classifications for reporting ease. Industries are shown as a percentage of net assets.
| * | Non-income producing security. |
| (a) | Less than 0.05% of Net Assets. |
See Notes to Financial Statements.
| James Aggressive Allocation Fund | Schedule of Investments |
December 31, 2019 (Unaudited)
| Shares or Principal Amount | | Value | |
| COMMON STOCKS-77.58% | | | |
| | | | Basic Materials-4.85% | | | |
| | 2,675 | | | Celanese Corp. | | $ | 329,346 | |
| | 2,975 | | | Eastman Chemical Co. | | | 235,799 | |
| | 14,200 | | | Goodyear Tire & Rubber Co. | | | 220,881 | |
| | 2,375 | | | International Paper Co. | | | 109,369 | |
| | 5,225 | | | Nucor Corp. | | | 294,063 | |
| | | | | | | | 1,189,458 | |
| | | | | | | | | |
| | | | | Consumer, Cyclical-11.84% | | | | |
| | 3,950 | | | Asbury Automotive Group, Inc.* | | | 441,570 | |
| | 3,300 | | | Best Buy Co., Inc. | | | 289,740 | |
| | 4,925 | | | CVS Health Corp. | | | 365,878 | |
| | 1,625 | | | Deckers Outdoor Corp.* | | | 274,398 | |
| | 3,650 | | | Delta Air Lines, Inc. | | | 213,452 | |
| | 7,425 | | | General Motors Co. | | | 271,755 | |
| | 1,000 | | | Home Depot, Inc. | | | 218,380 | |
| | 2,700 | | | Insight Enterprises, Inc.* | | | 189,783 | |
| | 2,250 | | | Target Corp. | | | 288,473 | |
| | 2,950 | | | Walmart, Inc. | | | 350,578 | |
| | | | | | | | 2,904,007 | |
| | | | | | | | | |
| | | | | Consumer, Non-cyclical-11.97% | | | | |
| | 775 | | | Anthem, Inc. | | | 234,073 | |
| | 2,700 | | | FTI Consulting, Inc.* | | | 298,782 | |
| | 1,475 | | | Helen of Troy, Ltd.* | | | 265,190 | |
| | 9,300 | | | Kroger Co. | | | 269,607 | |
| | 3,125 | | | Medtronic PLC | | | 354,531 | |
| | 2,675 | | | Merck & Co., Inc. | | | 243,291 | |
| | 2,750 | | | National HealthCare Corp. | | | 237,683 | |
| | 3,000 | | | Procter & Gamble Co. | | | 374,700 | |
| | 7,750 | | | TrueBlue, Inc.* | | | 186,465 | |
| | 2,550 | | | Tyson Foods, Inc., Class A | | | 232,152 | |
| | 1,825 | | | Zoetis, Inc. | | | 241,539 | |
| | | | | | | | 2,938,013 | |
| | | | | | | | | |
| | | | | Energy-5.19% | | | | |
| | 1,850 | | | Chevron Corp. | | | 222,943 | |
| | 6,075 | | | ConocoPhillips | | | 395,057 | |
| | 2,525 | | | Phillips 66 | | | 281,310 | |
| | 1,725 | | | Royal Dutch Shell PLC, Class A, Sponsored ADR | | | 101,741 | |
| | 2,900 | | | Valero Energy Corp. | | | 271,585 | |
| | | | | | | | 1,272,636 | |
| | | | | | | | | |
| | | | | Financial-12.85% | | | | |
| | 6,625 | | | Aflac, Inc. | | | 350,462 | |
| | 5,375 | | | Air Lease Corp. | | | 255,420 | |
| | 3,200 | | | Allstate Corp. | | | 359,840 | |
| | 2,200 | | | American Financial Group, Inc. | | | 241,230 | |
| | 4,350 | | | CBRE Group, Inc., Class A* | | | 266,611 | |
| | 17,125 | | | Chimera Investment Corp., REIT | | | 352,090 | |
| | 1,700 | | | Globe Life, Inc. | | | 178,925 | |
| | 1,150 | | | Goldman Sachs Group, Inc. | | | 264,420 | |
| | 2,800 | | | JPMorgan Chase & Co. | | | 390,320 | |
See Notes to Financial Statements.
| Semi-Annual Report | December 31, 2019 | 19 |
| Schedule of Investments | James Aggressive Allocation Fund |
December 31, 2019 (Unaudited)
| Shares or Principal Amount | | Value | |
| | | | | Financial (continued) | | | | |
| | 6,150 | | | Ladder Capital Corp., REIT | | $ | 110,946 | |
| | 2,400 | | | PNC Financial Services Group, Inc. | | | 383,112 | |
| | | | | | | | 3,153,376 | |
| | | | | | | | | |
| | | | | Industrial-6.37% | | | | |
| | 4,475 | | | AGCO Corp. | | | 345,694 | |
| | 1,650 | | | Lear Corp. | | | 226,380 | |
| | 4,650 | | | Magna International, Inc. | | | 255,006 | |
| | 3,500 | | | MasTec, Inc.* | | | 224,560 | |
| | 4,500 | | | TriMas Corp.* | | | 141,345 | |
| | 2,225 | | | United Rentals, Inc.* | | | 371,063 | |
| | | | | | | | 1,564,048 | |
| | | | | | | | | |
| | | | | Technology-18.79% | | | | |
| | 1,575 | | | Amgen, Inc. | | | 379,685 | |
| | 1,500 | | | Apple, Inc. | | | 440,475 | |
| | 1,550 | | | Arrow Electronics, Inc.* | | | 131,347 | |
| | 1,925 | | | Cabot Microelectronics Corp. | | | 277,816 | |
| | 5,000 | | | Cisco Systems, Inc. | | | 239,800 | |
| | 1,375 | | | Incyte Corp.* | | | 120,065 | |
| | 18,200 | | | Innoviva, Inc.* | | | 257,712 | |
| | 5,875 | | | Intel Corp. | | | 351,619 | |
| | 1,425 | | | KLA Corp. | | | 253,892 | |
| | 950 | | | Lockheed Martin Corp. | | | 369,911 | |
| | 2,525 | | | Microsoft Corp. | | | 398,193 | |
| | 1,675 | | | Motorola Solutions, Inc. | | | 269,910 | |
| | 725 | | | Northrop Grumman Corp. | | | 249,378 | |
| | 8,300 | | | Sykes Enterprises, Inc.* | | | 307,017 | |
| | 2,000 | | | SYNNEX Corp. | | | 257,600 | |
| | 1,650 | | | Visa, Inc., Class A | | | 310,035 | |
| | | | | | | | 4,614,455 | |
| | | | | | | | | |
| | | | | Utilities-5.72% | | | | |
| | 8,475 | | | AES Corp. | | | 168,652 | |
| | 2,700 | | | American Electric Power Co., Inc. | | | 255,177 | |
| | 6,875 | | | AT&T, Inc. | | | 268,675 | |
| | 2,250 | | | Entergy Corp. | | | 269,550 | |
| | 4,200 | | | FirstEnergy Corp. | | | 204,120 | |
| | 3,875 | | | Verizon Communications, Inc. | | | 237,925 | |
| | | | | | | | 1,404,099 | |
| | | | | | | | | |
| TOTAL COMMON STOCKS | | | | |
| (Cost $16,652,865) | | | 19,040,092 | |
| Shares or Principal Amount | | | Value | |
| EXCHANGE TRADED FUNDS-1.02% | | | | |
| | 5,600 | | | iShares MSCI Emerging Markets ETF | | | 251,272 | |
| | | | | | | | | |
| TOTAL EXCHANGE TRADED FUNDS | | | | |
| (Cost $242,816) | | | 251,272 | |
See Notes to Financial Statements.
| James Aggressive Allocation Fund | Schedule of Investments |
December 31, 2019 (Unaudited)
| Shares or Principal Amount | | Value | |
| CORPORATE BONDS-2.51% | | | |
| | | | | Financial-1.08% | | | | |
| $ | 250,000 | | | Citigroup, Inc., 3.875%, 3/26/25 | | $ | 264,231 | |
| | | | | | | | | |
| | | | | Industrial-0.21% | | | | |
| | 50,000 | | | General Electric Co., 2.700%, 10/9/22 | | | 50,664 | |
| | | | | | | | | |
| | | | | Technology-1.22% | | | | |
| | 250,000 | | | International Business Machines Corp., 1.625%, 5/15/20 | | | 249,918 | |
| | 50,000 | | | Microsoft Corp., 1.850%, 2/6/20 | | | 49,998 | |
| | | | | | | | 299,916 | |
| TOTAL CORPORATE BONDS | | | | |
| (Cost $613,672) | | | 614,811 | |
| Shares or Principal Amount | | | Value | |
| U.S. TREASURY BONDS & NOTES-16.29% | | | | |
| | | | | U.S. Treasury Bonds-9.11% | | | | |
| $ | 500,000 | | | 2.625%, 11/15/20 | | | 504,170 | |
| | 1,250,000 | | | 2.625%, 2/15/29 | | | 1,323,788 | |
| | 200,000 | | | 2.750%, 11/15/47 | | | 214,218 | |
| | 200,000 | | | 2.250%, 8/15/49 | | | 193,781 | |
| | | | | | | | 2,235,957 | |
| | | | | U.S. Treasury Notes-6.12% | | | | |
| | 500,000 | | | 3.500%, 5/15/20 | | | 503,340 | |
| | 1,000,000 | | | 1.375%, 9/15/20 | | | 998,138 | |
| | | | | | | | 1,501,478 | |
| | | | | United States Treasury Inflation Indexed Bonds-1.06% | | | | |
| | 256,889 | | | 0.625%, 7/15/21 | | | 259,765 | |
| | | | | | | | | |
| TOTAL U.S. TREASURY BONDS & NOTES | | | | |
| (Cost $3,954,709) | | | 3,997,200 | |
| Shares or Principal Amount | | | Value | |
| SHORT TERM INVESTMENTS-2.46% | | | | |
| | | | | Mutual Fund-2.46% | | | | |
| | 603,640 | | | First American Treasury Obligations Fund, Class X, 7-Day Yield 1.527% | | | 603,640 | |
| | | | | | | | | |
| TOTAL SHORT TERM INVESTMENTS | | | | |
| (Cost $603,640) | | | 603,640 | |
| | | | | | | | | |
| TOTAL INVESTMENT SECURITIES-99.86% | | | | |
| (Cost $22,067,702) | | | 24,507,015 | |
| OTHER ASSETS IN EXCESS OF LIABILITIES-0.14% | | | 34,883 | |
| NET ASSETS-100.00% | | $ | 24,541,898 | |
For Fund compliance purposes, the Fund's industry classifications refer to any one or more of the industry sub-classifications used by one or more widely recognized market indexes or ratings group indexes, and/or as defined by Fund management. Those definitions may not apply for purposes of this report, which may combine industry sub-classifications for reporting ease. Industries are shown as a percentage of net assets.
| * | Non-income producing security. |
See Notes to Financial Statements.
| Semi-Annual Report | December 31, 2019 | 21 |
| Statements of Assets and Liabilities | James Advantage Funds |
December 31, 2019 (Unaudited)
| | | James Balanced: Golden Rainbow Fund | | | James Small Cap Fund | | | James Micro Cap Fund | | | James Aggressive Allocation Fund | |
| ASSETS: | | | | | | | | | | | | |
| | | | | | | | | | | | | |
| Investment securities: | | | | | | | | | | | | | | | | |
| At cost | | $ | 765,321,209 | | | $ | 35,767,810 | | | $ | 21,216,661 | | | $ | 22,067,702 | |
| At value | | $ | 881,711,482 | | | $ | 42,507,508 | | | $ | 27,429,540 | | | $ | 24,507,015 | |
| Dividends and interest receivable | | | 2,955,546 | | | | 63,235 | | | | 33,933 | | | | 54,359 | |
| Receivable for securities sold | | | 5,376,950 | | | | – | | | | – | | | | – | |
| Receivable for capital shares sold | | | 156,500 | | | | 99 | | | | – | | | | – | |
| Other assets | | | 50,678 | | | | – | | | | – | | | | 88 | |
| Total Assets | | | 890,251,156 | | | | 42,570,842 | | | | 27,463,473 | | | | 24,561,462 | |
| | | | | | | | | | | | | | | | | |
| LIABILITIES: | | | | | | | | | | | | | | | | |
| | | | | | | | | | | | | | | | | |
| Payable for capital shares redeemed | | | 1,809,590 | | | | 24,406 | | | | – | | | | – | |
| Accrued expenses: | | | | | | | | | | | | | | | | |
| Management fees | | | 551,589 | | | | 44,032 | | | | 34,188 | | | | 19,564 | |
| 12b-1 distribution and service fees | | | 143,050 | | | | 8,955 | | | | – | | | | – | |
| Trustee fees | | | 1,951 | | | | – | | | | – | | | | – | |
| Other payables | | | 221,129 | | | | – | | | | – | | | | – | |
| Total Liabilities | | | 2,727,309 | | | | 77,393 | | | | 34,188 | | | | 19,564 | |
| Net Assets | | $ | 887,523,847 | | | $ | 42,493,449 | | | $ | 27,429,285 | | | $ | 24,541,898 | |
| | | | | | | | | | | | | | | | | |
| NET ASSETS CONSIST OF: | | | | | | | | | | | | | | | | |
| | | | | | | | | | | | | | | | | |
| Paid-in capital | | $ | 766,978,653 | | | $ | 39,235,846 | | | $ | 21,231,907 | | | $ | 23,058,043 | |
| Total Distributable Earnings | | | 120,545,194 | | | | 3,257,603 | | | | 6,197,378 | | | | 1,483,855 | |
| Net Assets | | $ | 887,523,847 | | | $ | 42,493,449 | | | $ | 27,429,285 | | | $ | 24,541,898 | |
| | | | | | | | | | | | | | | | | |
| PRICING OF RETAIL CLASS SHARES: | | | | | | | | | | | | | | | | |
| | | | | | | | | | | | | | | | | |
| Net assets | | $ | 667,023,168 | | | | N/A | | | | N/A | | | | N/A | |
| Shares of beneficial interest outstanding (unlimited number of shares authorized, no par) | | | 31,292,202 | | | | N/A | | | | N/A | | | | N/A | |
| Net assets value, offering price and redemption price per share | | $ | 21.32 | | | | N/A | | | | N/A | | | | N/A | |
| | | | | | | | | | | | | | | | | |
| PRICING OF INSTITUTIONAL CLASS SHARES: | | | | | | | | | | | | | | | | |
| | | | | | | | | | | | | | | | | |
| Net assets | | $ | 220,500,679 | | | | N/A | | | | N/A | | | | N/A | |
| Shares of beneficial interest outstanding (unlimited number of shares authorized, no par) | | | 10,479,438 | | | | N/A | | | | N/A | | | | N/A | |
| Net assets value, offering price and redemption price per share | | $ | 21.04 | | | | N/A | | | | N/A | | | | N/A | |
| | | | | | | | | | | | | | | | | |
| PRICING OF SHARES | | | | | | | | | | | | | | | | |
| | | | | | | | | | | | | | | | | |
| Net assets | | | N/A | | | $ | 42,493,449 | | | $ | 27,429,285 | | | $ | 24,541,898 | |
| Shares of beneficial interest outstanding (unlimited number of shares authorized, no par) | | | N/A | | | | 1,728,294 | | | | 1,657,965 | | | | 2,318,947 | |
| Net assets value, offering price and redemption price per share | | | N/A | | | $ | 24.59 | | | $ | 16.54 | | | $ | 10.58 | |
See Notes to Financial Statements.
| James Advantage Funds | Statements of Operations |
For the Six Months Ended December 31, 2019 (Unaudited)
| | | James Balanced: Golden Rainbow Fund | | | James Small Cap Fund | | | James Micro Cap Fund | | | James Aggressive
Allocation Fund | |
| INVESTMENT INCOME: | | | | | | | | | | | | |
| Dividends (Net of withholding taxes of $6,079, $622, $826 and $996, respectively) | | $ | 5,541,377 | | | $ | 358,439 | | | $ | 241,806 | | | $ | 212,066 | |
| Interest | | | 6,616,727 | | | | – | | | | 5,175 | | | | 63,483 | |
| Total Investment Income | | | 12,158,104 | | | | 358,439 | | | | 246,981 | | | | 275,549 | |
| EXPENSES: | | | | | | | | | | | | | | | | |
| Management fees | | | 3,487,498 | | | | 252,534 | | | | 194,827 | | | | 113,328 | |
| 12b-1 distribution and service fees - Retail Class | | | 897,621 | | | | – | | | | – | | | | – | |
| 12b-1 distribution and service fees | | | – | | | | 51,259 | | | | – | | | | – | |
| Administration fee | | | 281,715 | | | | – | | | | – | | | | – | |
| Transfer agent fee | | | 89,485 | | | | – | | | | – | | | | – | |
| Custodian fees | | | 51,542 | | | | – | | | | – | | | | – | |
| Professional fees | | | 89,495 | | | | – | | | | – | | | | – | |
| Trustee fees | | | 101,090 | | | | 3,760 | | | | 2,429 | | | | 1,774 | |
| Registration fees | | | 23,563 | | | | – | | | | – | | | | – | |
| Shareholder report printing and mailing | | | 54,409 | | | | – | | | | – | | | | – | |
| Other expenses | | | 50,899 | | | | – | | | | – | | | | – | |
| Total Expenses | | | 5,127,317 | | | | 307,553 | | | | 197,256 | | | | 115,102 | |
| Net Investment Income | | | 7,030,787 | | | | 50,886 | | | | 49,725 | | | | 160,447 | |
| REALIZED AND UNREALIZED GAIN/(LOSS) ON INVESTMENTS: | | | | | | | | | | | | | | | | |
| Net realized gain/(loss) from: | | | | | | | | | | | | | | | | |
| Investments | | | 11,563,488 | | | | (975,525 | ) | | | 228,163 | | | | (504,126 | ) |
| Foreign currency transactions | | | (14 | ) | | | (40 | ) | | | – | | | | – | |
| Total realized gain/(loss) | | | 11,563,474 | | | | (975,565 | ) | | | 228,163 | | | | (504,126 | ) |
| Net change in unrealized appreciation on investments | | | 20,826,812 | | | | 3,220,915 | | | | 1,613,391 | | | | 1,486,019 | |
| Net change in unrealized appreciation on foreign currency translation | | | 31 | | | | – | | | | – | | | | – | |
| Total change in unrealized appreciation | | | 20,826,843 | | | | 3,220,915 | | | | 1,613,391 | | | | 1,486,019 | |
| Net Realized and Unrealized Gain on Investments | | | 32,390,317 | | | | 2,245,350 | | | | 1,841,554 | | | | 981,893 | |
| Net Increase in Net Assets Resulting from Operations | | $ | 39,421,104 | | | $ | 2,296,236 | | | $ | 1,891,279 | | | $ | 1,142,340 | |
See Notes to Financial Statements.
| Semi-Annual Report | December 31, 2019 | 23 |
| Statements of Changes in Net Assets | James Balanced: Golden Rainbow Fund |
| | | For the Six Months Ended December 31, 2019 (Unaudited) | | | For the Year Ended June 30, 2019 | |
| FROM OPERATIONS: | | | | | | | | |
| | | | | | | | | |
| Net investment income | | $ | 7,030,787 | | | $ | 19,251,822 | |
| Net realized gain | | | 11,563,474 | | | | 63,697,199 | |
| Net change in unrealized appreciation/(depreciation) | | | 20,826,843 | | | | (127,714,218 | ) |
| Net increase/(decrease) in net assets resulting from operations | | | 39,421,104 | | | | (44,765,197 | ) |
| | | | | | | | | |
| DISTRIBUTIONS TO SHAREHOLDERS: | | | | | | | | |
| | | | | | | | | |
| Retail Class Shares: | | | | | | | | |
| From distributable earnings | | | (8,329,221 | ) | | | (103,981,188 | ) |
| Institutional Class Shares: | | | | | | | | |
| From distributable earnings | | | (3,142,883 | ) | | | (52,506,234 | ) |
| Decrease in net assets from distributions to shareholders | | | (11,472,104 | ) | | | (156,487,422 | ) |
| | | | | | | | | |
| CAPITAL SHARE TRANSACTIONS: | | | | | | | | |
| | | | | | | | | |
| Retail Class Shares: | | | | | | | | |
| Proceeds from shares sold | | | 19,560,145 | | | | 40,903,491 | |
| Net asset value of shares issued in reinvestment of distributions to shareholders | | | 8,115,044 | | | | 100,963,978 | |
| Payments for shares redeemed, net of redemption fees | | | (153,196,877 | ) | | | (755,368,263 | ) |
| Net Decrease in net assets from Retail Class capital share transactions | | | (125,521,688 | ) | | | (613,500,794 | ) |
| | | | | | | | | |
| Institutional Class Shares: | | | | | | | | |
| Proceeds from shares sold | | | 12,175,881 | | | | 61,904,385 | |
| Net asset value of shares issued in reinvestment of distributions to shareholders | | | 2,715,342 | | | | 43,120,244 | |
| Payments for shares redeemed | | | (105,817,277 | ) | | | (564,933,978 | ) |
| Net Decrease in net assets from Institutional Class capital share transactions | | | (90,926,054 | ) | | | (459,909,349 | ) |
| Total Decrease in Net Assets | | | (188,498,742 | ) | | | (1,274,662,762 | ) |
| | | | | | | | | |
| NET ASSETS: | | | | | | | | |
| | | | | | | | | |
| Beginning of period | | | 1,076,022,589 | | | | 2,350,685,351 | |
| End of period | | $ | 887,523,847 | | | $ | 1,076,022,589 | |
See Notes to Financial Statements.
| James Balanced: Golden Rainbow Fund | Statements of Changes in Net Assets |
| | | For the Six Months Ended December 31, 2019 (Unaudited) | | | For the Year Ended June 30, 2019 | |
| SUMMARY OF CAPITAL SHARE ACTIVITY: | | | | | | | | |
| | | | | | | | | |
| Retail Class Shares: | | | | | | | | |
| Shares sold | | | 935,948 | | | | 1,894,552 | |
| Shares issued in reinvestment of distributions to shareholders | | | 384,946 | | | | 5,033,571 | |
| Shares redeemed | | | (7,321,831 | ) | | | (34,580,038 | ) |
| Net Decrease in shares outstanding | | | (6,000,937 | ) | | | (27,651,915 | ) |
| Shares outstanding, beginning of year | | | 37,293,139 | | | | 64,945,054 | |
| Shares outstanding, end of year | | | 31,292,202 | | | | 37,293,139 | |
| | | | | | | | | |
| Institutional Class Shares: | | | | | | | | |
| Shares sold | | | 590,706 | | | | 2,902,339 | |
| Shares issued in reinvestment of distributions to shareholders | | | 130,459 | | | | 2,171,321 | |
| Shares redeemed | | | (5,135,203 | ) | | | (26,447,927 | ) |
| Net Decrease in shares outstanding | | | (4,414,038 | ) | | | (21,374,267 | ) |
| Shares outstanding, beginning of year | | | 14,893,476 | | | | 36,267,743 | |
| Shares outstanding, end of year | | | 10,479,438 | | | | 14,893,476 | |
See Notes to Financial Statements.
| Semi-Annual Report | December 31, 2019 | 25 |
| Statements of Changes in Net Assets | James Small Cap Fund |
| | | For the Six Months Ended December 31, 2019 (Unaudited) | | | For the Year Ended June 30, 2019 | |
| FROM OPERATIONS: | | | | | | | | |
| | | | | | | | | |
| Net investment income/(loss) | | $ | 50,886 | | | $ | (11,285 | ) |
| Net realized loss | | | (975,565 | ) | | | (2,557,416 | ) |
| Net change in unrealized appreciation/(depreciation) | | | 3,220,915 | | | | (6,045,303 | ) |
| Net increase/(decrease) in net assets resulting from operations | | | 2,296,236 | | | | (8,614,004 | ) |
| | | | | | | | | |
| DISTRIBUTIONS TO SHAREHOLDERS: | | | | | | | | |
| | | | | | | | | |
| From distributable earnings | | | – | | | | (3,818,168 | ) |
| Decrease in net assets from distributions to shareholders | | | – | | | | (3,818,168 | ) |
| | | | | | | | | |
| CAPITAL SHARE TRANSACTIONS: | | | | | | | | |
| | | | | | | | | |
| Proceeds from shares sold | | | 1,763,230 | | | | 6,554,991 | |
| Net asset value of shares issued in reinvestment of distributions to shareholders | | | – | | | | 3,744,085 | |
| Payments for shares redeemed | | | (3,831,840 | ) | | | (13,868,162 | ) |
| Net Decrease in net assets from capital share transactions | | | (2,068,610 | ) | | | (3,569,086 | ) |
| Total Increase/(Decrease) in Net Assets | | | 227,626 | | | | (16,001,258 | ) |
| | | | | | | | | |
| NET ASSETS: | | | | | | | | |
| | | | | | | | | |
| Beginning of period | | | 42,265,823 | | | | 58,267,081 | |
| End of period | | $ | 42,493,449 | | | $ | 42,265,823 | |
| | | | | | | | | |
| SUMMARY OF CAPITAL SHARE ACTIVITY: | | | | | | | | |
| | | | | | | | | |
| Shares sold | | | 75,713 | | | | 275,583 | |
| Shares issued in reinvestment of distributions to shareholders | | | – | | | | 166,182 | |
| Shares redeemed | | | (167,692 | ) | | | (555,154 | ) |
| Net Decrease in shares outstanding | | | (91,979 | ) | | | (113,389 | ) |
| Shares outstanding, beginning of year | | | 1,820,273 | | | | 1,933,662 | |
| Shares outstanding, end of year | | | 1,728,294 | | | | 1,820,273 | |
See Notes to Financial Statements.
| James Micro Cap Fund | Statements of Changes in Net Assets |
| | | For the Six Months Ended December 31, 2019 (Unaudited) | | | For the Year Ended June 30, 2019 | |
| FROM OPERATIONS: | | | | | | | | |
| | | | | | | | | |
| Net investment income | | $ | 49,725 | | | $ | 14,147 | |
| Net realized gain | | | 228,163 | | | | 875,333 | |
| Net change in unrealized appreciation/(depreciation) | | | 1,613,391 | | | | (2,463,301 | ) |
| Net increase/(decrease) in net assets resulting from operations | | | 1,891,279 | | | | (1,573,821 | ) |
| | | | | | | | | |
| DISTRIBUTIONS TO SHAREHOLDERS: | | | | | | | | |
| | | | | | | | | |
| From distributable earnings | | | (880,619 | ) | | | (1,453,635 | ) |
| Decrease in net assets from distributions to shareholders | | | (880,619 | ) | | | (1,453,635 | ) |
| | | | | | | | | |
| CAPITAL SHARE TRANSACTIONS: | | | | | | | | |
| | | | | | | | | |
| Proceeds from shares sold | | | 749,203 | | | | 3,717,034 | |
| Net asset value of shares issued in reinvestment of distributions to shareholders | | | 877,987 | | | | 1,446,514 | |
| Payments for shares redeemed, net of redemption fees | | | (1,808,797 | ) | | | (4,340,557 | ) |
| Net Increase/(Decrease) in net assets from capital share transactions | | | (181,607 | ) | | | 822,991 | |
| Total Increase/(Decrease) in Net Assets | | | 829,053 | | | | (2,204,465 | ) |
| | | | | | | | | |
| NET ASSETS: | | | | | | | | |
| | | | | | | | | |
| Beginning of period | | | 26,600,232 | | | | 28,804,697 | |
| End of period | | $ | 27,429,285 | | | $ | 26,600,232 | |
| | | | | | | | | |
| SUMMARY OF CAPITAL SHARE ACTIVITY: | | | | | | | | |
| | | | | | | | | |
| Shares sold | | | 46,487 | | | | 230,976 | |
| Shares issued in reinvestment of distributions to shareholders | | | 53,384 | | | | 102,372 | |
| Shares redeemed | | | (112,744 | ) | | | (273,883 | ) |
| Net Increase/(Decrease) in shares outstanding | | | (12,873 | ) | | | 59,465 | |
| Shares outstanding, beginning of year | | | 1,670,838 | | | | 1,611,373 | |
| Shares outstanding, end of year | | | 1,657,965 | | | | 1,670,838 | |
See Notes to Financial Statements.
| Semi-Annual Report | December 31, 2019 | 27 |
| Statements of Changes in Net Assets | James Aggressive Allocation Fund |
| | | For the Six Months Ended December 31, 2019 (Unaudited) | | | For the Year Ended June 30, 2019 | |
| FROM OPERATIONS: | | | | | | | | |
| | | | | | | | | |
| Net investment income | | $ | 160,447 | | | $ | 151,662 | |
| Net realized loss | | | (504,126 | ) | | | (384,977 | ) |
| Net change in unrealized appreciation/(depreciation) | | | 1,486,019 | | | | (46,603 | ) |
| Net increase/(decrease) in net assets resulting from operations | | | 1,142,340 | | | | (279,918 | ) |
| | | | | | | | | |
| DISTRIBUTIONS TO SHAREHOLDERS: | | | | | | | | |
| | | | | | | | | |
| From distributable earnings | | | (245,700 | ) | | | (96,369 | ) |
| Decrease in net assets from distributions to shareholders | | | (245,700 | ) | | | (96,369 | ) |
| | | | | | | | | |
| CAPITAL SHARE TRANSACTIONS: | | | | | | | | |
| | | | | | | | | |
| Proceeds from shares sold | | | 2,109,127 | | | | 13,046,174 | |
| Net asset value of shares issued in reinvestment of distributions to shareholders | | | 244,861 | | | | 96,255 | |
| Payments for shares redeemed | | | (1,644,512 | ) | | | (819,632 | ) |
| Net Increase in net assets from capital share transactions | | | 709,476 | | | | 12,322,797 | |
| Total Increase in Net Assets | | | 1,606,116 | | | | 11,946,510 | |
| | | | | | | | | |
| NET ASSETS: | | | | | | | | |
| | | | | | | | | |
| Beginning of period | | | 22,935,782 | | | | 10,989,272 | |
| End of period | | $ | 24,541,898 | | | $ | 22,935,782 | |
| | | | | | | | | |
| SUMMARY OF CAPITAL SHARE ACTIVITY: | | | | | | | | |
| | | | | | | | | |
| Shares sold | | | 202,949 | | | | 1,288,855 | |
| Shares issued in reinvestment of distributions to shareholders | | | 23,100 | | | | 10,350 | |
| Shares redeemed | | | (156,604 | ) | | | (80,353 | ) |
| Net Increase in shares outstanding | | | 69,445 | | | | 1,218,852 | |
| Shares outstanding, beginning of year | | | 2,249,502 | | | | 1,030,650 | |
| Shares outstanding, end of year | | | 2,318,947 | | | | 2,249,502 | |
See Notes to Financial Statements.
| James Balanced: Golden Rainbow Fund – Retail Class | Financial Highlights |
For a share outstanding throughout the years or period indicated.
| | | For the Six Months Ended December 31, 2019 (Unaudited) | | | For the Year Ended June 30, 2019 | | | For the Year Ended June 30, 2018 | | | For the Year Ended June 30, 2017 | | | For the Year Ended June 30, 2016 | | | For the Year Ended June 30, 2015 | |
| Net asset value - beginning of year | | $ | 20.69 | | | $ | 23.32 | | | $ | 24.70 | | | $ | 24.14 | | | $ | 24.96 | | | $ | 25.28 | |
| Income/(Loss) from investment operations: | | | | | | | | | | | | | | | | | | | | | | | | |
| Net investment income(a) | | | 0.15 | | | | 0.25 | | | | 0.26 | | | | 0.25 | | | | 0.25 | | | | 0.22 | |
| Net realized and unrealized gain/(loss) | | | 0.74 | | | | (0.64 | ) | | | 0.24 | | | | 0.68 | | | | (0.41 | ) | | | 0.49 | |
| Total from investment operations | | | 0.89 | | | | (0.39 | ) | | | 0.50 | | | | 0.93 | | | | (0.16 | ) | | | 0.71 | |
| | | | | | | | | | | | | | | | | | | | | | | | | |
| Less distributions: | | | | | | | | | | | | | | | | | | | | | | | | |
| From net investment income | | | (0.11 | ) | | | (0.29 | ) | | | (0.27 | ) | | | (0.28 | ) | | | (0.23 | ) | | | (0.18 | ) |
| From net realized gain on investments | | | (0.15 | ) | | | (1.95 | ) | | | (1.61 | ) | | | (0.09 | ) | | | (0.43 | ) | | | (0.85 | ) |
| Total distributions | | | (0.26 | ) | | | (2.24 | ) | | | (1.88 | ) | | | (0.37 | ) | | | (0.66 | ) | | | (1.03 | ) |
| Paid-in capital from redemption fees | | | – | | | | – | | | | – | | | | 0.00 | (b) | | | – | | | | – | |
| Net asset value at end of year | | $ | 21.32 | | | $ | 20.69 | | | $ | 23.32 | | | $ | 24.70 | | | $ | 24.14 | | | $ | 24.96 | |
| | | | | | | | | | | | | | | | | | | | | | | | | |
| Total return | | | 4.31 | %(c) | | | (1.24 | )% | | | 1.87 | % | | | 3.92 | % | | | (0.64 | )% | | | 2.90 | % |
| | | | | | | | | | | | | | | | | | | | | | | | | |
| Net assets, end of year (in thousands) | | $ | 667,023 | | | $ | 771,733 | | | $ | 1,514,451 | | | $ | 2,163,786 | | | $ | 2,892,809 | | | $ | 2,973,350 | |
| | | | | | | | | | | | | | | | | | | | | | | | | |
| Ratios/Supplemental Data: | | | | | | | | | | | | | | | | | | | | | | | | |
| Ratio of net expenses to average net assets | | | 1.12 | %(d) | | | 1.06 | % | | | 0.99 | % | | | 0.96 | % | | | 0.96 | % | | | 0.97 | % |
| Ratio of net investment income to average net assets | | | 1.39 | %(d) | | | 1.14 | % | | | 1.05 | % | | | 1.02 | % | | | 1.03 | % | | | 0.87 | % |
| Portfolio turnover rate | | | 18 | %(c) | | | 71 | % | | | 75 | % | | | 46 | % | | | 46 | % | | | 43 | % |
| (a) | Calculated using the average shares method. |
| (b) | Amount rounds to less than $0.005 per share. |
See Notes to Financial Statements.
| Semi-Annual Report | December 31, 2019 | 29 |
| Financial Highlights | James Balanced: Golden Rainbow Fund – Institutional Class |
For a share outstanding throughout the years or period indicated.
| | | For the Six Months Ended December 31, 2019 (Unaudited) | | | For the Year Ended June 30, 2019 | | | For the Year Ended June 30, 2018 | | | For the Year Ended June 30, 2017 | | | For the Year Ended June 30, 2016 | | | For the Year Ended June 30, 2015 | |
| Net asset value - beginning of year | | $ | 20.43 | | | $ | 23.06 | | | $ | 24.44 | | | $ | 23.89 | | | $ | 24.72 | | | $ | 25.05 | |
| Income/(Loss) from investment operations: | | | | | | | | | | | | | | | | | | | | | | | | |
| Net investment income(a) | | | 0.17 | | | | 0.30 | | | | 0.31 | | | | 0.31 | | | | 0.31 | | | | 0.28 | |
| Net realized and unrealized gain/(loss) | | | 0.72 | | | | (0.63 | ) | | | 0.25 | | | | 0.68 | | | | (0.42 | ) | | | 0.50 | |
| Total from investment operations | | | 0.89 | | | | (0.33 | ) | | | 0.56 | | | | 0.99 | | | | (0.11 | ) | | | 0.78 | |
| | | | | | | | | | | | | | | | | | | | | | | | | |
| Less distributions: | | | | | | | | | | | | | | | | | | | | | | | | |
| From net investment income | | | (0.13 | ) | | | (0.35 | ) | | | (0.33 | ) | | | (0.35 | ) | | | (0.29 | ) | | | (0.26 | ) |
| From net realized gain on investments | | | (0.15 | ) | | | (1.95 | ) | | | (1.61 | ) | | | (0.09 | ) | | | (0.43 | ) | | | (0.85 | ) |
| Total distributions | | | (0.28 | ) | | | (2.30 | ) | | | (1.94 | ) | | | (0.44 | ) | | | (0.72 | ) | | | (1.11 | ) |
| Paid-in capital from redemption fees | | | – | | | | – | | | | – | | | | 0.00 | (b) | | | – | | | | – | |
| Net asset value at end of year | | $ | 21.04 | | | $ | 20.43 | | | $ | 23.06 | | | $ | 24.44 | | | $ | 23.89 | | | $ | 24.72 | |
| | | | | | | | | | | | | | | | | | | | | | | | | |
| Total return | | | 4.40 | %(c) | | | (0.99 | )% | | | 2.16 | % | | | 4.19 | % | | | (0.43 | )% | | | 3.20 | % |
| | | | | | | | | | | | | | | | | | | | | | | | | |
| Net assets, end of year (in thousands) | | $ | 220,501 | | | $ | 304,290 | | | $ | 836,234 | | | $ | 1,220,095 | | | $ | 1,512,751 | | | $ | 1,277,641 | |
| | | | | | | | | | | | | | | | | | | | | | | | | |
| Ratios/Supplemental Data: | | | | | | | | | | | | | | | | | | | | | | | | |
| Ratio of net expenses to average net assets | | | 0.87 | %(d) | | | 0.80 | % | | | 0.74 | % | | | 0.71 | % | | | 0.71 | % | | | 0.73 | % |
| Ratio of net investment income to average net assets | | | 1.64 | %(d) | | | 1.38 | % | | | 1.30 | % | | | 1.27 | % | | | 1.28 | % | | | 1.11 | % |
| Portfolio turnover rate | | | 18 | %(c) | | | 71 | % | | | 75 | % | | | 46 | % | | | 46 | % | | | 43 | % |
| (a) | Calculated using the average shares method. |
| (b) | Amount rounds to less than $0.005 per share. |
See Notes to Financial Statements.
| James Small Cap Fund | Financial Highlights |
For a share outstanding throughout the years or period indicated.
| | | For the Six Months Ended December 31, 2019 (Unaudited) | | | For the Year Ended June 30, 2019 | | | For the Year Ended June 30, 2018 | | | For the Year Ended June 30, 2017 | | | For the Year Ended June 30, 2016 | | | For the Year Ended June 30, 2015 | |
| Net asset value - beginning of year | | $ | 23.22 | | | $ | 30.13 | | | $ | 33.96 | | | $ | 30.64 | | | $ | 33.47 | | | $ | 33.88 | |
| Income/(Loss) from investment operations: | | | | | | | | | | | | | | | | | | | | | | | | |
| Net investment income/(loss)(a) | | | 0.03 | | | | (0.01 | ) | | | (0.10 | ) | | | 0.21 | | | | 0.17 | | | | 0.01 | |
| Net realized and unrealized gain/(loss) | | | 1.34 | | | | (4.76 | ) | | | 3.82 | | | | 3.28 | | | | (1.64 | ) | | | (0.42 | ) |
| Total from investment operations | | | 1.37 | | | | (4.77 | ) | | | 3.72 | | | | 3.49 | | | | (1.47 | ) | | | (0.41 | ) |
| | | | | | | | | | | | | | | | | | | | | | | | | |
| Less distributions: | | | | | | | | | | | | | | | | | | | | | | | | |
| From net investment income | | | – | | | | – | | | | (0.19 | ) | | | (0.17 | ) | | | (0.12 | ) | | | – | |
| From net realized gain on investments | | | – | | | | (2.14 | ) | | | (7.36 | ) | | | – | | | | (1.24 | ) | | | – | |
| Total distributions | | | – | | | | (2.14 | ) | | | (7.55 | ) | | | (0.17 | ) | | | (1.36 | ) | | | – | |
| Net asset value at end of year | | $ | 24.59 | | | $ | 23.22 | | | $ | 30.13 | | | $ | 33.96 | | | $ | 30.64 | | | $ | 33.47 | |
| | | | | | | | | | | | | | | | | | | | | | | | | |
| Total return | | | 5.90 | %(b) | | | (15.63 | )% | | | 11.41 | % | | | 11.36 | % | | | (4.62 | )% | | | (1.21 | )% |
| | | | | | | | | | | | | | | | | | | | | | | | | |
| Net assets, end of year (in thousands) | | $ | 42,493 | | | $ | 42,266 | | | $ | 58,267 | | | $ | 67,603 | | | $ | 84,226 | | | $ | 125,145 | |
| | | | | | | | | | | | | | | | | | | | | | | | | |
| Ratios/Supplemental Data: | | | | | | | | | | | | | | | | | | | | | | | | |
| Ratio of net expenses to average net assets | | | 1.50 | %(c) | | | 1.50 | % | | | 1.50 | % | | | 1.50 | % | | | 1.50 | % | | | 1.50 | % |
| Ratio of net investment income/(loss) to average net assets | | | 0.25 | %(c) | | | (0.02 | )% | | | (0.32 | )% | | | 0.62 | % | | | 0.55 | % | | | 0.04 | % |
| Portfolio turnover rate | | | 14 | %(b) | | | 75 | % | | | 124 | % | | | 129 | % | | | 57 | % | | | 76 | % |
| (a) | Calculated using the average shares method. |
See Notes to Financial Statements.
| Semi-Annual Report | December 31, 2019 | 31 |
| Financial Highlights | James Micro Cap Fund |
For a share outstanding throughout the years or period indicated.
| | | For the Six Months Ended December 31,
2019 (Unaudited) | | | For the Year Ended June 30, 2019 | | | For the Year Ended June 30, 2018 | | | For the Year Ended June 30, 2017 | | | For the Year Ended June 30, 2016 | | | For the Year Ended June 30, 2015 | |
| Net asset value - beginning of year | | $ | 15.92 | | | $ | 17.88 | | | $ | 17.27 | | | $ | 15.03 | | | $ | 15.11 | | | $ | 17.40 | |
| Income/(Loss) from investment operations: | | | | | | | | | | | | | | | | | | | | | | | | |
| Net investment income/(loss)(a) | | | 0.03 | | | | 0.01 | | | | (0.04 | ) | | | 0.04 | | | | (0.04 | ) | | | 0.06 | |
| Net realized and unrealized gain/(loss) | | | 1.14 | | | | (1.06 | ) | | | 1.99 | | | | 2.20 | | | | (0.06 | ) | | | 1.12 | |
| Total from investment operations | | | 1.17 | | | | (1.05 | ) | | | 1.95 | | | | 2.24 | | | | (0.10 | ) | | | 1.18 | |
| | | | | | | | | | | | | | | | | | | | | | | | | |
| Less distributions: | | | | | | | | | | | | | | | | | | | | | | | | |
| From net investment income | | | (0.04 | ) | | | – | | | | (0.06 | ) | | | – | | | | (0.01 | ) | | | (0.02 | ) |
| From net realized gain on investments | | | (0.51 | ) | | | (0.91 | ) | | | (1.29 | ) | | | – | | | | – | | | | (3.45 | ) |
| Total distributions | | | (0.55 | ) | | | (0.91 | ) | | | (1.35 | ) | | | – | | | | (0.01 | ) | | | (3.47 | ) |
| Paid-in capital from redemption fees | | | 0.00 | (b) | | | 0.00 | (b) | | | 0.01 | | | | 0.00 | (b) | | | 0.03 | | | | 0.00 | (b) |
| Net asset value at end of year | | $ | 16.54 | | | $ | 15.92 | | | $ | 17.88 | | | $ | 17.27 | | | $ | 15.03 | | | $ | 15.11 | |
| | | | | | | | | | | | | | | | | | | | | | | | | |
| Total return | | | 7.34 | %(c) | | | (5.25 | )% | | | 11.62 | % | | | 14.90 | % | | | (0.44 | )% | | | 7.95 | % |
| | | | | | | | | | | | | | | | | | | | | | | | | |
| Net assets, end of year (in thousands) | | $ | 27,429 | | | $ | 26,600 | | | $ | 28,805 | | | $ | 31,809 | | | $ | 26,515 | | | $ | 24,026 | |
| | | | | | | | | | | | | | | | | | | | | | | | | |
| Ratios/Supplemental Data: | | | | | | | | | | | | | | | | | | | | | | | | |
| Ratio of net expenses to average net assets | | | 1.50 | %(d) | | | 1.50 | % | | | 1.50 | % | | | 1.50 | % | | | 1.50 | % | | | 1.50 | % |
| Ratio of net investment income/(loss) to average net assets | | | 0.38 | %(d) | | | 0.05 | % | | | (0.22 | )% | | | 0.23 | % | | | (0.24 | )% | | | 0.38 | % |
| Portfolio turnover rate | | | 12 | %(c) | | | 65 | % | | | 37 | % | | | 97 | % | | | 44 | % | | | 52 | % |
| (a) | Calculated using the average shares method. |
| (b) | Amount rounds to less than $0.005 per share. |
See Notes to Financial Statements.
| James Aggressive Allocation Fund | Financial Highlights |
For a share outstanding throughout the years or period indicated.
| | | For the Six Months Ended December 31, 2019 (Unaudited) | | | For the Year Ended June 30, 2019 | | | For the Year Ended June 30, 2018 | | | For the Year Ended June 30, 2017 | | | For the Year Ended June 30, 2016(a) | |
| Net asset value - beginning of year | | $ | 10.20 | | | $ | 10.66 | | | $ | 10.00 | | | $ | 9.47 | | | $ | 10.00 | |
| Income/(Loss) from investment operations: | | | | | | | | | | | | | | | | | | | | |
| Net investment income(b) | | | 0.07 | | | | 0.13 | | | | 0.10 | | | | 0.09 | | | | 0.07 | |
| Net realized and unrealized gain/(loss) | | | 0.42 | | | | (0.50 | ) | | | 0.64 | | | | 0.53 | | | | (0.57 | ) |
| Total from investment operations | | | 0.49 | | | | (0.37 | ) | | | 0.74 | | | | 0.62 | | | | (0.50 | ) |
| | | | | | | | | | | | | | | | | | | | | |
| Less distributions: | | | | | | | | | | | | | | | | | | | | |
| From net investment income | | | (0.11 | ) | | | (0.09 | ) | | | (0.08 | ) | | | (0.09 | ) | | | (0.03 | ) |
| Total distributions | | | (0.11 | ) | | | (0.09 | ) | | | (0.08 | ) | | | (0.09 | ) | | | (0.03 | ) |
| Net asset value at end of year | | $ | 10.58 | | | $ | 10.20 | | | $ | 10.66 | | | $ | 10.00 | | | $ | 9.47 | |
| | | | | | | | | | | | | | | | | | | | | |
| Total return | | | 4.77 | %(c) | | | (3.40 | )% | | | 7.36 | % | | | 6.54 | % | | | (4.98 | )% |
| | | | | | | | | | | | | | | | | | | | | |
| Net assets, end of year (in thousands) | | $ | 24,542 | | | $ | 22,936 | | | $ | 10,989 | | | $ | 9,954 | | | $ | 7,172 | |
| | | | | | | | | | | | | | | | | | | | | |
| Ratios/Supplemental Data: | | | | | | | | | | | | | | | | | | | | |
| Ratio of net expenses to average net assets | | | 0.98 | %(d) | | | 0.98 | % | | | 0.98 | % | | | 0.98 | % | | | 0.98 | % |
| Ratio of net investment income to average net assets | | | 1.37 | %(d) | | | 1.29 | % | | | 0.90 | % | | | 0.95 | % | | | 0.81 | % |
| Portfolio turnover rate | | | 37 | %(c) | | | 69 | % | | | 219 | % | | | 198 | % | | | 218 | % |
| (a) | Fund commenced operations on July 1, 2015. |
| (b) | Calculated using the average shares method. |
See Notes to Financial Statements.
| Semi-Annual Report | December 31, 2019 | 33 |
| Notes to Financial Statements | James Advantage Funds |
December 31, 2019 (Unaudited)
1. ORGANIZATION
James Advantage Funds (the “Trust”) is an open-end management investment company that was organized as an Ohio business trust on August 29, 1997. The Trust is registered under the Investment Company Act of 1940, as amended (the “1940 Act”). James Balanced: Golden Rainbow Fund, James Small Cap Fund, James Micro Cap Fund, and James Aggressive Allocation Fund are each a diversified series of the Trust (individually a “Fund,” collectively the “Funds”). Each class of James Balanced: Golden Rainbow Fund represents an interest in the same portfolio of investments and has the same rights, but differs primarily in distribution fees and shareholder features. The Retail Class shares are subject to distribution (12b-1) fees but have a lower minimum investment requirement and offer certain shareholder services not available to Institutional Class shareholders. The Institutional Class shares are not subject to distribution (12b-1) fees and are available only through investment advisers and bank trust departments that have made arrangements for shares of all of their clients investing in the Fund to be held in an omnibus account (as well as other investors that are approved by management of the Trust).
James Balanced: Golden Rainbow Fund seeks to provide total return through a combination of growth and income and preservation of capital in declining markets. The James Balanced: Golden Rainbow Fund seeks to achieve its objective by investing primarily in common stocks and/or debt securities that the Fund’s adviser, James Investment Research, Inc. (“James” or the “Adviser”), believes are undervalued.
James Small Cap Fund seeks to provide long-term capital appreciation. The James Small Cap Fund seeks to achieve its objective by investing primarily in common stocks of small capitalization companies. The Adviser defines small capitalization as those companies with market capitalizations at the time of purchase no larger than the stocks in the James Small Cap Fund’s benchmark, the Russell 2000® Index. As of December 31, 2019, the stock with the maximum capitalization in the Russell 2000® Index had a capitalization of $8.2 billion.
James Micro Cap Fund seeks to provide long-term capital appreciation. The James Micro Cap Fund seeks to achieve its objective by investing primarily in common stocks of micro capitalization companies. Micro capitalization companies are defined as those companies with market capitalizations at the time of purchase no larger than the stocks in the Russell Microcap® Index, including exchange traded funds (“ETFs”) that invest primarily in such securities. As of December 31, 2019, the stock with the maximum capitalization in the Russell Microcap® Index had a capitalization of $3.80 billion.
James Aggressive Allocation Fund seeks to provide total return through a combination of growth and income. Preservation of capital in declining markets is a secondary objective. The James Aggressive Allocation Fund will generally run equity allocations of 60% or higher and, therefore, could be more volatile than a more conservative fund that holds a smaller percentage of its assets in stocks. Due to its aggressive nature, the James Aggressive Allocation Fund will generally have a turnover ratio much higher than the James Balanced: Golden Rainbow Fund.
2. SIGNIFICANT ACCOUNTING POLICIES
The following is a summary of significant accounting policies followed by the Funds in preparation of their financial statements, in accordance with accounting principles generally accepted in the United States of America (“U.S. GAAP”). The Funds are considered an investment company for financial reporting purposes under U.S. GAAP and follow the accounting and reporting guidance applicable to investment companies in the Financial Accounting Standards Board Accounting Standards Codification Topic 946. The following is a summary of significant accounting policies consistently followed by the Funds in preparation of their financial statements.
Share Valuation
The net asset value per share of each Fund, other than the James Balanced: Golden Rainbow Fund, is calculated daily by dividing the total value of the Fund’s assets, less liabilities, by the number of shares outstanding. The net asset value per share of each class of shares of the James Balanced: Golden Rainbow Fund is calculated daily by dividing the total value of the Fund’s assets attributable to that class, less liabilities attributable to that class, by the number of outstanding shares of that class. The offering price and redemption price per share is equal to the net asset value per share, except that shares of the James Micro Cap Fund are subject to a redemption fee of 2% if redeemed within 180 days of purchase. Redemption fees received by the James Micro Cap Fund were $1,083 and $1,591 for the six months ended December 31, 2019 and the year ended June 30, 2019, respectively. The redemption fee is reflected in the “Payment for shares redeemed, net of redemption fees” in the Statements of Changes in Net Assets.
Securities Valuation
Securities are valued at fair value. The Funds' portfolio securities are valued as of the close of the New York Stock Exchange (“NYSE”) (generally, 4:00 p.m., Eastern Time) on each day that the NYSE is open for business. Equity securities that are traded on any exchange, including closed-end funds and exchange-traded funds, are valued at the last quoted sale price on the exchange or market in which such securities are principally traded. Lacking a last sale price, a security is valued at its last bid price except when, in James’ opinion, the last bid price does not accurately reflect the current value of the security. Securities that are traded on the NASDAQ® over-the-counter market are valued at their NASDAQ® Official Closing Price (“NOCP”) for all NASDAQ® National Market (“NNM”) and NASDAQ® Capital Market® securities. When market quotations are not readily available, if an event occurs after the close of the trading market (but before the time as of which a Fund calculates its net asset value) that materially affects a security’s value, when James determines that the market quotation does not accurately reflect the current value or when a non-144A restricted security is being valued, that security will be valued at its fair value as determined in good faith in conformity with guidelines adopted by and subject to review of the Board of Trustees (the “Board”). Corporate bonds, U.S. government agencies, U.S. Treasury bonds & notes, foreign, and municipal bonds are generally valued at the mean between the closing bid and asked prices provided by an independent pricing service. The pricing services generally use market models that consider trade data, yields, spreads, quotations from dealers and active market makers, credit worthiness, market information of comparable securities, and other relevant security specific information. Asset backed/commercial mortgage backed securities are generally valued at the mean between the closing bid and asked prices provided by an independent pricing service. The pricing service generally uses models that consider trade data, prepayment, and default projections, benchmark yield and spread data and estimated cash flows of each tranche of the issuer. If the Adviser decides that a price provided by the pricing service does not accurately reflect the fair market value of the securities or when prices are not readily available from a pricing service, those securities will be priced at fair value as determined in good faith by the Adviser. Shares of open-end investment companies are valued at net asset value.
| James Advantage Funds | Notes to Financial Statements |
December 31, 2019 (Unaudited)
For valuation purposes, quotations of foreign securities in a foreign currency are converted to U.S. dollar equivalents at the time of pricing the Funds. The values of foreign portfolio securities are generally based upon market quotations which, depending upon the exchange or market, may be last sale price, last bid price or the average of the last bid and asked prices as of, in each case, the close of the appropriate exchange or another designated time.
In accordance with the Trust’s good faith pricing guidelines, James is required to consider all appropriate factors relevant to the value of securities for which it has determined other pricing sources are not available or reliable as described above. There is no single standard for determining fair value, since fair value depends upon the circumstances of each individual case. As a general principle, the current fair value of an issue of securities being valued by the Adviser would appear to be the amount that the owner might reasonably expect to receive for them upon their current sale. Methods which are in accordance with this principle may, for example, be based on (i) a multiple of earnings, (ii) a discount from market of a similar freely traded security (including a derivative security or a basket of securities traded on other markets, exchanges or among dealers), or (iii) yield to maturity with respect to debt issues, or a combination of these and other methods.
Various inputs are used in determining the value of the Funds’ investments. These inputs are summarized in the three broad levels listed below:
| Level 1 - | Unadjusted quoted prices in active markets for identical, unrestricted assets or liabilities that a Fund has the ability to access at the measurement date; |
| | |
| Level 2 - | Quoted prices which are not active, quoted prices for similar assets or liabilities in active markets or inputs other than quoted prices that are observable (either directly or indirectly) for substantially the full term of the asset or liability; or |
| | |
| Level 3 - | Significant unobservable prices or inputs (including a Fund’s own assumptions in determining the fair value of investments) where there is little or no market activity for the asset or liability at the measurement date. |
The inputs or methodologies used for valuing securities are not necessarily an indication of the risk associated with investing in those securities.
| Semi-Annual Report | December 31, 2019 | 35 |
| Notes to Financial Statements | James Advantage Funds |
December 31, 2019 (Unaudited)
The following is a summary of the inputs used to value the Funds’ investments as of December 31, 2019:
James Balanced: Golden Rainbow Fund
| | | Valuation Inputs | | | | |
| Investments in Securities at Value* | | Level 1 | | | Level 2 | | | Level 3 | | | Total | |
| Common Stocks | | $ | 442,122,322 | | | $ | – | | | $ | – | | | $ | 442,122,322 | |
| Exchange Traded Funds | | | 16,130,586 | | | | – | | | | – | | | | 16,130,586 | |
| Corporate Bonds | | | – | | | | 77,306,909 | | | | – | | | | 77,306,909 | |
| Municipal Bonds | | | – | | | | 24,617,145 | | | | – | | | | 24,617,145 | |
| U.S. Government Agencies | | | – | | | | 82,523,151 | | | | – | | | | 82,523,151 | |
| Mortgage Backed Securities | | | – | | | | 28,917,429 | | | | – | | | | 28,917,429 | |
| U.S. Treasury Bonds & Notes | | | 195,559,623 | | | | – | | | | – | | | | 195,559,623 | |
| Foreign Bonds | | | – | | | | 7,509,305 | | | | – | | | | 7,509,305 | |
| Short Term Investments | | | 7,025,012 | | | | – | | | | – | | | | 7,025,012 | |
| Total | | $ | 660,837,543 | | | $ | 220,873,939 | | | $ | – | | | $ | 881,711,482 | |
James Small Cap Fund
| | | Valuation Inputs | | | | |
| Investments in Securities at Value* | | Level 1 | | | Level 2 | | | Level 3 | | | Total | |
| Common Stocks | | $ | 40,666,920 | | | $ | – | | | $ | – | | | $ | 40,666,920 | |
| Short Term Investments | | | 1,840,588 | | | | – | | | | – | | | | 1,840,588 | |
| Total | | $ | 42,507,508 | | | $ | – | | | $ | – | | | $ | 42,507,508 | |
James Micro Cap Fund
| | | Valuation Inputs | | | | |
| Investments in Securities at Value* | | Level 1 | | | Level 2 | | | Level 3 | | | Total | |
| Common Stocks | | $ | 25,606,637 | | | $ | – | | | $ | – | | | $ | 25,606,637 | |
| Short Term Investments | | | 1,822,903 | | | | – | | | | – | | | | 1,822,903 | |
| Total | | $ | 27,429,540 | | | $ | – | | | $ | – | | | $ | 27,429,540 | |
James Aggressive Allocation Fund
| | | Valuation Inputs | | | | |
| Investments in Securities at Value* | | Level 1 | | | Level 2 | | | Level 3 | | | Total | |
| Common Stocks | | $ | 19,040,092 | | | $ | – | | | $ | – | | | $ | 19,040,092 | |
| Exchange Traded Funds | | | 251,272 | | | | – | | | | – | | | | 251,272 | |
| Corporate Bonds | | | – | | | | 614,811 | | | | – | | | | 614,811 | |
| U.S. Treasury Bonds & Notes | | | 3,997,200 | | | | – | | | | – | | | | 3,997,200 | |
| Short Term Investments | | | 603,640 | | | | – | | | | – | | | | 603,640 | |
| Total | | $ | 23,892,204 | | | $ | 614,811 | | | $ | – | | | $ | 24,507,015 | |
| * | For detailed descriptions of sector and industry, see the accompanying Schedule of Investments. |
| James Advantage Funds | Notes to Financial Statements |
December 31, 2019 (Unaudited)
Investment Transactions
Investment transactions are recorded on a trade date basis. Gains and losses are determined using the specific identification method, which liquidates all losses first, before any gains. Securities purchased or sold on a when-issued or delayed delivery basis may have extended settlement periods. Any securities so purchased are subject to market fluctuation during this period. The Funds will instruct its custodian to segregate assets in a separate account with a current value at least equal to the amount of its when-issued and delayed delivery purchase commitments. As of December 31, 2019, the Funds did not hold when-issued securities or delayed delivery purchase commitments.
Withholding taxes on foreign dividends have been provided for in accordance with the Trust’s understanding of the applicable country’s tax rules and rates.
Foreign Currency Translation
The market value of investment securities and other assets and liabilities denominated in foreign currencies are translated into U.S. dollars at the current exchange rate, provided by WM Reuters, at the close of each business day. Purchases and sales of securities, income receipts and expense payments are translated into U.S. dollars based at the exchange rate on the date of the transaction.
Reported net realized foreign exchange gains or losses arise from sales and maturities of short-term securities, sales of foreign currencies, currency gains or losses realized and between the trade and settlement dates on securities transactions, and the difference between the amounts of dividends, interest, and foreign withholding taxes recorded on the Funds’ books and the U.S. dollar equivalent of the amounts actually received or paid. Net unrealized foreign exchange gains and losses arise from the changes in the value of assets and liabilities including investments in securities at the reporting period, resulting from changes in the exchange rate. The portion of realized and unrealized gains or losses on investments due fluctuations in foreign currency exchange rates is not separately disclosed and is included in realized and unrealized gains or losses on investments, when applicable.
Investment Income
Dividend income is recorded on the ex-dividend date. Interest income is determined on the basis of interest accrued, adjusted for amortization of premiums and accretion of discounts on all debt securities. Amortization and accretion is calculated using the effective yield method.
Dividend income includes dividends earned on Real Estate Investment Trusts (“REITs”), which may include a return of capital. As such, important taxation issues may arise, which the Funds account for when information is provided by the issuing REIT. Due to the actual character of dividends paid by REITs not being available until the end of the calendar year, the net investment income and long-term capital gains of the Funds can be different on the tax return compared to this annual report. Substantial unanticipated levels of return of capital may affect the Funds’ earnings and profits from which distributions are made.
Distributions received from Limited Partnership investments of a Fund are usually recorded as a return of capital and are excluded from available income in the calculation of distributions paid by the Funds. Return of capital is recorded as a reduction to the cost of investments in the Statements of Assets and Liabilities and in the Schedule of Investments.
Dividends and Distributions to Shareholders
Net investment income, if any, is generally declared and distributed to shareholders of each Fund on at least an annual basis. Net realized capital gains from security transactions, if any, are distributed to shareholders not less frequently than annually. Furthermore, capital gains are distributed only to the extent they exceed available capital loss carryforwards. Distributions to shareholders of net investment income and net realized capital gains are recorded on the ex-dividend date. The amount and timing of distributions are determined in accordance with federal income tax regulations, which may differ from U.S. GAAP.
Allocation of Income and Expense
Investment income earned, realized capital gains and losses, and unrealized appreciation and depreciation for the James Balanced: Golden Rainbow Fund is allocated daily to each class of shares based upon its proportionate share of total net assets of the Fund. Class-specific expenses are charged directly to the class incurring the expense. Common expenses, which are not attributable to a specific class, are allocated daily to each class of shares based upon its proportionate share of total net assets of the Fund. The Adviser pays the expenses of each Fund, except for the James Balanced: Golden Rainbow Fund. These expenses exclude the management fees, detailed in Note 4, brokerage fees and commissions, taxes, interest, fees and expenses of the non-interested person trustees, 12b-1 fees and extraordinary expenses. Expenses not directly billed to a particular Fund are allocated proportionally among all Funds daily in relation to net assets of each Fund or another reasonable measure.
Use of Estimates
The preparation of financial statements in conformity with U.S. GAAP requires management to make estimates and assumptions that affect the reported amounts of assets and liabilities and disclosure of contingent assets and liabilities at the date of the financial statements and the reported amounts of increases and decreases in net assets from operations during the reporting period. Actual results could differ from those estimates.
Federal Income Taxes
The Funds generally intend to distribute all taxable income and capital gains to shareholders, if any, and to otherwise continue to comply with the requirements of Subchapter M of the Internal Revenue Code of 1986, as amended, (the “Code”) applicable to regulated investment companies. Therefore, no federal tax provision is required.
| Semi-Annual Report | December 31, 2019 | 37 |
| Notes to Financial Statements | James Advantage Funds |
December 31, 2019 (Unaudited)
As of and during the six months ended December 31, 2019, the Funds did not have a liability for any unrecognized tax benefits. The Funds file U.S. federal, state, and local tax returns as required. The Funds’ tax returns are subject to examination by the relevant tax authorities until expiration of the applicable statute of limitations, which is generally three years after the filing of the tax return for federal purposes and four years for most state returns. Tax returns for open years have incorporated no uncertain tax positions that require a provision for income taxes.
As of December 31, 2019, the components of distributable earnings on a tax basis were as follows:
| | | James Balanced: Golden Rainbow Fund | | | James Small Cap Fund | | | James Micro Cap Fund | | | James Aggressive Allocation Fund | |
| Tax cost of portfolio investments | | $ | 765,718,082 | | | $ | 35,767,810 | | | $ | 21,217,635 | | | $ | 22,069,775 | |
| Gross unrealized appreciation | | $ | 119,853,769 | | | $ | 7,662,417 | | | $ | 6,962,515 | | | $ | 2,582,787 | |
| Gross unrealized depreciation | | | (3,860,369 | ) | | | (922,719 | ) | | | (750,610 | ) | | | (145,547 | ) |
| Net unrealized appreciation | | | 115,993,400 | | | | 6,739,698 | | | | 6,211,905 | | | | 2,437,240 | |
| Total | | $ | 115,993,400 | | | $ | 6,739,698 | | | $ | 6,211,905 | | | $ | 2,437,240 | |
The difference between the cost of portfolio investments on a tax basis and financial statement cost for the Funds is due primarily to the deferral of wash sale losses and to the differing treatment of certain investments under income tax regulations and U.S. GAAP.
The tax character of distributions paid for the year ended June 30, 2019 was as follows:
| | | James Balanced: Golden Rainbow Fund | | | James Small Cap Fund | | | James Micro Cap Fund | | | James Aggressive Allocation Fund | |
| Ordinary Income | | $ | 20,313,773 | | | $ | 749,518 | | | $ | – | | | $ | 96,369 | |
| Long-Term Capital Gains | | | 136,173,649 | | | | 3,068,650 | | | | 1,453,635 | | | | – | |
| Total | | $ | 156,487,422 | | | $ | 3,818,168 | | | $ | 1,453,635 | | | $ | 96,369 | |
The tax character of distributions paid for the year ended June 30, 2018 was as follows:
| | | James Balanced: Golden Rainbow Fund | | | James Small Cap Fund | | | James Micro Cap Fund | | | James Aggressive Allocation Fund | |
| Ordinary Income | | $ | 33,606,863 | | | $ | 1,959,939 | | | $ | 97,622 | | | $ | 75,908 | |
| Long-Term Capital Gains | | | 190,064,621 | | | | 11,632,222 | | | | 2,102,728 | | | | – | |
| Total | | $ | 223,671,484 | | | $ | 13,592,161 | | | $ | 2,200,350 | | | $ | 75,908 | |
Capital Losses
Under the Code, Capital Losses are carried over to future tax years and will retain their character as either short-term or long-term capital losses. These losses do not include any late year capital losses (losses arising in the period from November 1st through June 30th) that the Funds have elected to defer for the current fiscal year. The Funds’ ability to utilize capital loss carryforwards in the future may be limited under the Code and related regulations based on the results of future transactions.
Capital losses carried forward to the next tax year were as follows:
| | | Short Term | | | Long Term | |
| James Small Cap Fund | | $ | 370,555 | | | $ | – | |
| James Aggressive Allocation Fund | | | 290,907 | | | | – | |
The Funds elect to defer to the year ending June 30, 2020 capital losses recognized during the period November 1, 2018 through December 31, 2019 in the amount of:
| | | Amount | |
| James Small Cap Fund | | $ | 2,186,775 | |
| James Aggressive Allocation Fund | | | 168,966 | |
The Funds elect to defer to the year ending June 30, 2020 late year ordinary losses in the amount of:
| | | Amount | |
| James Balanced: Golden Rainbow Fund | | $ | 2,117,828 | |
| James Small Cap Fund | | | 86 | |
| James Advantage Funds | Notes to Financial Statements |
December 31, 2019 (Unaudited)
3. INVESTMENT TRANSACTIONS
Purchases and sales (including maturities) of investments in long-term U.S. Government obligations for the six months ended December 31, 2019 were as follows:
| | | Purchases | | | Sales | |
| James Balanced: Golden Rainbow Fund | | $ | 53,567,891 | | | $ | 192,818,107 | |
| James Aggressive Allocation Fund | | | 2,130,048 | | | | 2,594,535 | |
Purchases and sales (including maturities) of investments in long-term securities other than U.S. Government Obligations for the six months ended December 31, 2019 were as follows:
| | | Purchases | | | Sales | |
| James Balanced: Golden Rainbow Fund | | $ | 118,714,429 | | | $ | 144,615,008 | |
| James Small Cap Fund | | | 5,593,928 | | | | 7,944,100 | |
| James Micro Cap Fund | | | 2,867,420 | | | | 4,455,175 | |
| James Aggressive Allocation Fund | | | 8,494,017 | | | | 5,578,278 | |
4.MANAGEMENT FEE AND OTHER TRANSACTIONS WITH AFFILIATES
Investment Management Agreement
The Funds retain James to manage the Funds’ investments. The investment decisions for the Funds are made by a committee of James’ personnel, which is primarily responsible for the day-to-day management of each Fund’s portfolio and pursuant to separate management agreements between the Trust, on behalf of each Fund and the Adviser (the “Investment Management Agreements”).
The Funds pay James on a monthly basis at the annual rate set forth below of the Funds’ average daily net assets.
James Balanced: Golden Rainbow Fund
| Average Total Net Assets | Contractual Fee |
| Up to and including $500 million | 0.74% |
| Over $500 million and including $1 billion | 0.70% |
| Over $1 billion and including $2 billion | 0.65% |
| Over $2 billion | 0.60% |
James Small Cap Fund
| Average Total Net Assets | Contractual Fee |
| Up to and including $500 million | 1.25% |
| Over $500 million and including $1 billion | 1.20% |
| Over $1 billion and including $2 billion | 1.15% |
| Over $2 billion | 1.10% |
James Micro Cap Fund
| Average Total Net Assets | Contractual Fee |
| Up to and including $500 million | 1.50% |
| Over $500 million | 1.45% |
James Aggressive Allocation Fund
| Average Total Net Assets | Contractual Fee |
| Up to and including $500 million | 0.98% |
| Over $500 million and including $1 billion | 0.95% |
| Over $1 billion and including $2 billion | 0.90% |
| Over $2 billion | 0.85% |
Advisory fees for the James Small Cap Fund and the James Micro Cap Fund are reduced by the fees and expenses of the non-interested trustees incurred by the applicable Fund. Under the Investment Management Agreement, the Adviser is responsible for the payment of all operating expenses of the James Small Cap Fund, James Micro Cap Fund, and James Aggressive Allocation Fund, except for brokerage fees and commissions, taxes, interest, fees and expenses of non-interested person trustees, 12b-1 expenses and extraordinary expenses.
Administrative Services Agreement
ALPS Fund Services, Inc. (“ALPS” or the “Administrator”) serves as administrator to the Funds. ALPS receives a monthly fee paid by James Balanced: Golden Rainbow Fund, for itself, and paid by James for the remaining Funds, subject to a minimum monthly fee. Pursuant to an administrative agreement, ALPS will provide operational services to the Funds including, but not limited to fund accounting and fund administration and generally assist in each Fund’s operations. Administration fees paid by the Funds for the six months ended December 31, 2019 are disclosed in the Statements of Operations.
| Semi-Annual Report | December 31, 2019 | 39 |
| Notes to Financial Statements | James Advantage Funds |
December 31, 2019 (Unaudited)
Transfer Agency and Services Agreement
ALPS, pursuant to a Transfer Agency and Services Agreement with the Trust, serves as transfer agent for the Funds. Under the Transfer Agency and Services Agreement, ALPS receives an annual minimum fee, a fee based upon the number of shareholder accounts and is also reimbursed for out-of-pocket expenses. These fees and reimbursements for out-of-pocket expenses are paid by James Balanced: Golden Rainbow Fund, for itself, and by James for the remaining Funds. Transfer agent fees paid by the Funds for the six months ended December 31, 2019 are disclosed in the Statements of Operations.
Plans of Distribution
The James Balanced: Golden Rainbow Fund (Retail Class) and James Small Cap Fund have adopted a plan pursuant to Rule 12b-1 under the 1940 Act (collectively, the “Plans”) under which each Fund may incur expenses related to distribution of its shares and for services provided to shareholders. These expenses are reflected as 12b-1 distribution and service fees on the Statements of Operations. Payments under a Plan are made to the Adviser, which uses them to pay distribution and shareholder service expenses on behalf of and as agent of the Fund. The amount payable by the James Small Cap Fund and the Retail Class of the James Balanced: Golden Rainbow Fund, under its Plan is 0.25% of its average daily net assets for the year. The Plans are compensation plans, which means that payments are made to the Adviser regardless of 12b-1 expenses actually incurred. Therefore, payments under a Plan may exceed distribution and shareholder service expenses incurred pursuant to the Plan, and the Adviser is permitted to retain the excess. It is also possible that 12b-1 expenses paid by the Adviser for a period will exceed the payments received by the Adviser, in which case the Adviser may pay such excess expenses out of its own resources. Payments received by the Adviser under the Plans are in addition to the fees paid to the Adviser pursuant to the Management Agreements. The Plans require that the Adviser act in the Funds’ best interests in expending the payments it receives from the Funds and use payments solely for the purpose of paying distribution and shareholder services expenses on behalf of the Funds. The Funds’ distributor, ALPS Distributors, Inc., validates all payment amounts to be made to brokers that have properly executed dealer agreements with the Funds before the Adviser will make such payments.
Trustee Fees
Each Trustee who is not an officer or employee of the Adviser, or any of their affiliates (“Independent Trustees”) receives (1) a quarterly retainer of $7,900, (2) a per meeting fee for regularly scheduled meetings of $2,100, (3) an audit committee fee of $1,000 paid to the audit committee chair and $500 to the other Independent Trustees, (4) $210 for any special meeting held outside of a regularly scheduled board meeting, and (5) reimbursement for all reasonable out-of-pocket expenses relating to attendance at meetings. Such fees are presented on the Statements of Operations as Trustee Fees.
5. COMMITMENTS AND CONTINGENCIES
The Funds indemnify the Trust’s officers and trustees for certain liabilities that might arise from their performance of their duties to the Funds. Additionally, in the normal course of business, the Funds enter into contracts that contain a variety of representations and warranties and that provide general indemnifications. The Funds’ maximum exposure under these arrangements is unknown, as this would involve future claims that may be made against the Funds that have not yet occurred. However, based on experience, the Funds expect the risk of loss to be remote.
6. LINE OF CREDIT
Each Fund has a revolving line of credit agreement with U.S. Bank, N.A. (the “Bank”). Borrowings under these arrangements are secured by investments held in the Funds’ portfolios as notated on the Schedules of Investments and bear interest at the Bank’s prime rate. During the six months ended December 31, 2019, the Funds did not utilize their line of credit. Each Fund’s line of credit agreement expired on July 9, 2019 and was renewed for one year.
The terms of the agreements can be characterized as follows:
| Fund | | Maximum Balance Available | | | Interest Rate | | Expiration Date |
| James Balanced: Golden Rainbow Fund | | $ | 40,000,000 | | | Prime Rate* | | July 8, 2020 |
| James Small Cap Fund | | $ | 2,000,000 | | | Prime Rate* | | July 8, 2020 |
| James Micro Cap Fund | | $ | 1,250,000 | | | Prime Rate* | | July 8, 2020 |
| James Aggressive Allocation Fund | | $ | 500,000 | | | Prime Rate* | | July 8, 2020 |
| * | The rate at which the Bank announces as its prime lending rate. |
7. SUBSEQUENT EVENTS
Effective January 1, 2020, each Trustee will be compensated $2,100 for any special meeting held outside of a regularly scheduled board meeting that the Trustee is required to attend in person. Trustee compensation for special telephonic meetings held outside of a regularly scheduled board meeting will remain at $210 for each Trustee.
| James Advantage Funds | Additional Information |
December 31, 2019 (Unaudited)
PROXY VOTING GUIDELINES
James is responsible for exercising the voting rights associated with the securities purchased and held by the Funds. A description of the policies and procedures that James uses in fulfilling this responsibility and information regarding how those proxies were voted during the most recent 12-month period ended June 30 are available without charge upon request by calling toll free 1-800-995-2637. These items are also available on the Securities and Exchange Commission’s (the “Commission”) website at http://www.sec.gov.
QUARTERLY PORTFOLIO DISCLOSURE
The Funds’ portfolio holdings are made available semi-annually in shareholder reports within 60 days after the close of the period for which the report is being made, as required by federal securities laws. The Funds also file monthly portfolio holdings on Form N-PORT on a quarterly basis, with the schedule of portfolio holdings filed on Form N-PORT for the third month of each Fund’s fiscal quarter made publicly available 60 days after the end of the Funds’ fiscal quarter. The Fund's Form N-PORT are available without charge upon request by calling toll free 1-800-995-2637. These items are also available on the Commission's website at http://www.sec.gov.
| Semi-Annual Report | December 31, 2019 | 41 |
| Privacy Policy | James Advantage Funds |
December 31, 2019 (Unaudited)
Facts
What does James Advantage Funds do with your personal information?
Why?
Financial companies choose how they share your personal information. Federal law gives consumers the right to limit some, but not all sharing. Federal law also requires us to tell you how we collect, share, and protect your personal information. Please read this notice carefully to understand what we do.
What?
The types of personal information we collect and share depends on the product or service that you have with us. This information can include:
| ● | Social Security number and wire transfer instructions |
| ● | account transactions and transaction history |
| ● | investment experience and purchase history |
When you areno longer our customer, we continue to share your information as described in this notice.
How?
All financial companies need to share customers’ personal information to run their everyday business. In the section below, we list the reasons financial companies can share their customers’ personal information; the reasons James Advantage Funds chooses to share; and whether you can limit this sharing.
| Reasons we can share your personal information: | Does James Advantage Funds share information? | Can you limit this sharing? |
| For our everyday business purposes - such as to process your transactions, maintain youraccount(s), respond to court orders and legal investigations, or report to credit bureaus. | YES | NO |
| For our marketing purposes - to offer our products and services to you. | YES | NO |
| For joint marketing with other financial companies. | NO | We don’t share |
| For our affiliates’ everyday business purposes -information about your transactions and records. | NO | We don’t share |
| For our affiliates’ everyday business purposes - information about your credit worthiness. | NO | We don’t share |
| For our affiliates to market to you | NO | We don’t share |
| For non-affiliates to market to you | NO | We don’t share |
Questions?Call 1-800-99 James
| What we do: | |
| How does James Advantage Funds protect my personal information? | To protect your personal information from unauthorized access and use, we use security measures that comply with federal law. These measures include computer safeguards and secured files and buildings. Our service providers are held accountable for adhering to strict policies and procedures to prevent any misuse of your nonpublic personal information. |
| How does James Advantage Funds collect my personal information? | We collect your personal information, for example, when you ● open an account or deposit money ● direct us to buy securities or direct us to sell your securities ● seek advice about your investments We also collect your personal information from others, such as credit bureaus, affiliates, or other companies. |
| Why can’t I limit all sharing? | Federal law gives you the right to limit only: ● sharing for affiliates’ everyday business purposes – information about your creditworthiness. ● affiliates from using your information to market to you. ● sharing for nonaffiliates to market to you. State laws and individual companies may give you additional rights to limit sharing. |
| Definitions | |
| Affiliates | Companies related by common ownership or control. They can be financial and non-financial companies. ● Our affiliates include financial companies, such as James Investment Research, Inc. and James Capital Alliance. |
| Non-affiliates | Companies not related by common ownership or control. They can be financial and non-financial companies. ● James Advantage Funds does not share with nonaffiliates so they can market to you. |
| Joint marketing | A formal agreement between nonaffiliated financial companies that together market financial products or services to you. ● James Advantage Funds does not jointly market. |
Page Intentionally Left Blank

Item 2. Code of Ethics.
Not applicable to this Report.
Item 3. Audit Committee Financial Expert.
Not applicable to this Report.
Item 4. Principal Accountant Fees and Services.
Not applicable to this Report.
Item 5. Audit Committee of Listed Registrants.
Not applicable to the registrant.
Item 6. Investments.
| (a) | The Schedule of Investments is included as part of the report to shareholders filed under Item 1 of this Form. |
| (b) | Not applicable to the registrant. |
Item 7. Disclosure of Proxy Voting Policies and Procedures for Closed-End Management Investment Companies.
Not applicable to the registrant.
Item 8. Portfolio Managers of Closed-End Management Investment Companies.
Not applicable to the registrant.
Item 9. Purchases of Equity Securities by Closed-End Management Investment Company and Affiliated Purchasers.
Not applicable to the registrant.
Item 10. Submission of Matters to a Vote of Security Holders.
The registrant has not adopted procedures by which shareholders may recommend nominees to the registrant’s board of trustees.
Item 11. Controls and Procedures.
| (a) | Based on an evaluation of the registrant’s disclosure controls and procedures (as defined in Rule 30a-3(c) under the Investment Company Act of 1940, as amended), the registrant’s principal executive officer and principal financial officer have concluded that the registrant’s disclosure controls and procedures are effective as of a date within 90 days of the filing date of this report. |
| (b) | There were no significant changes in the registrant’s internal control over financial reporting (as defined in Rule 30a-3(d) under the Investment Company Act of 1940, as amended) that occurred during the second fiscal quarter of the period covered by this Report that have materially affected, or are reasonably likely to materially affect, the registrant’s internal control over financial reporting. |
Item 12. Disclosure of Securities Lending Activities for Closed-End Management Investment Companies.
Not applicable.
Item 13. Exhibits.
| (a)(1) | Not applicable to this Report. |
| (a)(2) | Certifications required by Item 13(a)(2) of Form N-CSR are filed herewith as Exhibit 99.CERT. |
| (b) | Certifications required by Item 13(b) of Form N-CSR are filed herewith as Exhibit 99.906CERT. |
SIGNATURES
Pursuant to the requirements of the Securities Exchange Act of 1934 and the Investment Company Act of 1940, the Registrant has duly caused this Report to be signed on its behalf by the undersigned, thereunto duly authorized.
The James Advantage Funds
| By: | /s/ Barry R. James | |
| | Barry R. James | |
| | President | |
Date: February 27, 2020
Pursuant to the requirements of the Securities Exchange Act of 1934 and the Investment Company Act of 1940, this report has been signed below by the following persons on behalf of the registrant and in the capacities and on the dates indicated.
| By: | /s/ Barry R. James | |
| | Barry R. James | |
| | President | |
Date: February 27, 2020
| By: | /s/ Amy K. Broerman | |
| | Amy K. Broerman | |
| | Chief Financial Officer | |
Date: February 27, 2020