UNITED STATES
SECURITIES AND EXCHANGE COMMISSION
WASHINGTON, D.C. 20549
FORM N-CSR
CERTIFIED SHAREHOLDER REPORT OF REGISTERED
MANAGEMENT INVESTMENT COMPANIES
811-08411
(Investment Company Act file number)
The James Advantage Funds
(Exact name of registrant as specified in charter)
1349 Fairground Road
Xenia, Ohio 45385
(Address of principal executive offices) (Zip code)
Barry R. James
P.O. Box 8
Alpha, Ohio 45301
(Name and address of agent for service)
Registrant’s telephone number, including area code: (937) 426-7640
Date of fiscal year end: June 30
Date of reporting period: July 1, 2019 – June 30, 2020
Item 1. Reports to Stockholders.

TABLE OF CONTENTS
| Shareholder Letter | 1 |
| Growth of $10,000 or $50,000 Charts | 4 |
| Representation of Schedules of Investments | 7 |
| Disclosure of Fund Expenses | 8 |
| Schedule of Investments | |
| James Balanced: Golden Rainbow Fund | 9 |
| James Small Cap Fund | 14 |
| James Micro Cap Fund | 16 |
| James Aggressive Allocation Fund | 18 |
| Statements of Assets and Liabilities | 21 |
| Statements of Operations | 22 |
| Statements of Changes in Net Assets | 23 |
| Financial Highlights | |
| James Balanced: Golden Rainbow Fund - Retail Class | 28 |
| James Balanced: Golden Rainbow Fund - Institutional Class | 29 |
| James Small Cap Fund | 30 |
| James Micro Cap Fund | 31 |
| James Aggressive Allocation Fund | 32 |
| Notes to Financial Statements | 33 |
| Report of Independent Registered Public Accounting Firm | 40 |
| Additional Information | 41 |
| Liquidity Risk Management Program | 42 |
| Trustees & Officers | 43 |
| Privacy Policy | 45 |
Beginning on January 1, 2021, as permitted by regulations adopted by the U.S. Securities and Exchange Commission, paper copies of the Funds’ annual and semi-annual shareholder reports will no longer be sent by mail, unless you specifically request paper copies of the reports. Instead, the reports will be made available on the Funds’ website at www.jamesinvestment.com and you will be notified by mail each time a report is posted and provided with a website link to access the report.
You may, notwithstanding the availability of shareholder reports online, elect to receive all future shareholder reports in paper free of charge. If you invest through a financial intermediary, you can contact your financial intermediary to request that you continue to receive paper copies of your shareholder reports. If you invest directly with the Funds, you can call 1-800-995-2637 to let the Funds know you wish to continue receiving paper copies of your shareholder reports.
If you already elected to receive shareholder reports electronically, you will not be affected by this change and you need not take any action. You may elect to receive shareholder reports and other communications from the Funds electronically anytime by contacting your financial intermediary (such as a broker-dealer or bank) or, if you are a direct investor, by enrolling at www.jamesinvestment.com.
| James Advantage Funds | Shareholder Letter |
June 30, 2020 (Unaudited)
LETTER TO THE SHAREHOLDERS
OF THE JAMES ADVANTAGE FUNDS
In 1966 Robert Kennedy delivered a speech in which he said “Like it or not, we live in interesting times. They are times of danger and uncertainty; but they are also the most creative of any time in the history of mankind.” It has been 54 years since he spoke those words, yet they are just as true now as they have ever been. Every part of life has been touched by the Coronavirus, COVID-19. With that being said, we sincerely hope you, your family and friends are in good health during these challenging times.
Both the stock and bond market saw wild price swings in February, March and April as the United States went into a lockdown phase. Almost as quickly as stocks declined, we saw a reversal in fortune, causing high levels of volatility. The markets seem to have traded less on fundamentals and more on whether consumers are staying at home or are back out spending in restaurants and department stores.
In our experience, when stocks decline, oftentimes large companies hold up better than smaller ones, as was the case during the recent downturn. As stocks have recovered, the advance has remained concentrated. Large cap stocks have led the way in 2020, significantly outperforming small cap stocks. The largest cap stocks did the best, with the Russell 1000® Index earning 7.48% for the fiscal year ended June 30, 2020, while the smaller stocks in the Russell 2000® Index were down by 6.62%. This spread of over 14% speaks to the issues that smaller stocks had during the period. Yet, the bigger dilemma may be how the large cap market indices are being driven by as few as 5 stocks. To be sure, the largest 5 companies now make up over 20% of the market value of the S&P 500® Index and are what have been driving those index returns. We do in fact own several of these names in some of our mutual funds, however owning such a concentrated position may increase the risk associated with investing. While we seek to continually improve results, we nonetheless remain committed to our time-tested risk management philosophy.
The Market Over the Past Year
The stock market was doing quite well in the later stages of 2019 and even into January of 2020. Consumer spending was high, unemployment was low, and the U.S. economy was making a steady advance. However, as we all know, the Coronavirus made its way from China to our shores only to push the market into turmoil. The Russell 1000® Index, a commonly used barometer of the stock market, rose 7.48% over the twelve months ended June 30, 2020. During that same period, the Russell 2000® Index declined by 6.62% and the Bloomberg Barclays U.S. Intermediate Government/Credit Bond Index rose 7.12%.
Investment Goals and Objectives
Our research team uses our proprietary approach to try to identify securities we believe are undervalued. In our experience, these stocks typically hold up better in difficult markets and have the potential to trade higher as the market rallies. We do not drift from our style simply because the markets are embracing a current, but temporary, fad. We believe, supported by much academic research, value investing will outperform growth investing over the long run. Investors should realize, however, value investing does not always outperform growth and there are no assurances that value’s past outperformance will be repeated.
Investment Philosophy
James Investment Research, Inc. (“JIR” or the “Adviser”) does its own research using quantitative databases, statistical expertise and other elements to help measure risk levels and the potential impact on future stock and bond price movements. The Adviser employs a proprietary investment approach to select equity securities it believes are undervalued and more likely to appreciate. The Adviser focuses on company characteristics such as being overlooked by Wall Street, management commitment and value. The Adviser also assesses a number of fundamental factors such as earnings, earnings trends, price to earnings multiples, return on assets, other financial statement data as well as its own proprietary calculations. The Adviser evaluates over 3,500 companies of all capitalization ranges. For the James Micro Cap Fund and the James Small Cap Fund, the Adviser refines its approach by using a capitalization screen and evaluates thousands of companies within the appropriate capitalization range. For all funds, the Adviser normally will sell a security when the investment no longer meets the Adviser’s investment criteria. The Adviser’s Investment Committee has a great deal of investment experience, exceeding over 150 years in total with James. We believe our combination of quantitative modeling and hands-on management makes us unique and supports the James Advantage Funds. The James Aggressive Allocation Fund and the James Balanced: Golden Rainbow Fund invest not only in equities, but also in highly rated investment grade fixed income securities.
Fund Performance
It goes without saying, the major news story that has affected the markets has been the Coronavirus and the quarantine that followed. The shuttering of restaurants, malls, movie theaters and many other businesses caused millions of layoffs and furloughs. Since March of this year, over 20 million Americans have filed for unemployment insurance.
To combat these issues the Federal Government went on a spending spree issuing Paycheck Protection Program (PPP) loans, increasing payouts for unemployment and even sending stimulus checks to a good percentage of the population. As another backstop, the Federal Reserve Bank (the “Fed”) began buying corporate bonds, municipal bonds and exchange traded funds (“ETFs”) that hold those same types of securities. While these actions surpassed even what the Fed did back in the Financial Crisis of 2008, it looks as if these actions quelled fear in the markets and provided much needed liquidity to the bond market.
| Annual Report | June 30, 2020 | 1 |
| Shareholder Letter | James Advantage Funds |
June 30, 2020 (Unaudited)
Our flagship fund, the James Balanced: Golden Rainbow Fund, seeks to provide total return through a combination of growth and income and preservation of capital in declining markets. The Fund’s Retail Class shares fell 1.18% over the twelve months ended June 30, 2020.
The largest contributors to the James Balanced: Golden Rainbow Fund’s performance were the 10-year U.S. Treasury and our equity positions in Apple, Inc. and Microsoft Corp. High quality U.S. Treasury notes and bonds rallied as the Federal Reserve took drastic measures to push interest rates lower, by cutting the Fed Funds rate 50 basis points (one half of one percent) in early March, and again by an additional 100 basis points just one week later. The two stocks that added the most to the fund, Apple and Microsoft, are the two largest stocks in the market in terms of market capitalization. This once again reinforces the point that in this specific period, bigger was in fact better.
The largest detractors to the James Balanced: Golden Rainbow Fund’s performance were iShares® Russell 2000® ETF, United Rentals, Inc. and Pfizer, Inc. The iShares® Russell 2000® ETF represents an assortment of small cap stocks, meant to provide diversification while staying in smaller stocks. The shutdown in March had a strong effect on smaller stocks as fears of declining revenues caused some to sell. United Rentals, a construction equipment rental company, suffered when the quarantine went into effect. Builders and constructions companies simply stopped renting equipment as their businesses stopped as well. Pfizer, a large pharmaceutical corporation, lagged the market as well as many other health care stocks. The bulk of the damage to Pfizer’s stock price was in response to discussions in Washington centered on how to reduce drug costs for consumers.
The James Small Cap Fund fell 19.04% over the fiscal year. The top contributors to the James Small Cap Fund’s performance were Nova Measuring Instruments and Generac Holdings Inc. Nova manufactures and sells measurement equipment key to the production of semiconductors. Semiconductor sales increased as China and the United States came to an agreement on trade talks, which lead to higher sales for Nova. Generac makes commercial and residential generators. As more people began working from home, the need for backup power increased to prevent work stoppage. Generac was in a unique space to provide this product for homes and new office space.
Detractors to the performance of the James Small Cap Fund were Xenia Hotels & Resorts, Inc. and Skywest, Inc., a North American regional airline. The price of both of these stocks fell in response to the Coronavirus outbreak, as the travel and hotel industries were among those hardest hit during the virus pullback.
The James Micro Cap Fund declined 17.45% over the fiscal year. The James Micro Cap Fund focuses on companies with market capitalizations, at the time of purchase, no larger than the stocks in the Russell Microcap® Index, as well as exchange traded funds that invest primarily in such securities.
Due to the nature of micro cap stocks, many of the companies held by the fund are not household names. Companies like Nova Measuring Instruments, PC Connection, Inc. and Patrick Industries all contributed to the fund at a high level. PC Connection sells computers and related products. Once again, as more individuals began working from home, they purchased new computers or webcams allowing them to work remotely. Patrick Industries, who manufactures recreational vehicles, saw improved sales. Sales may have improved as fewer people flew or took traditional vacations, but rather took RVs to parks and remote destinations.
The largest detractors to the James Micro Cap Fund’s performance were OFG Bancorp and W&T Offshore, Inc. Small banks and oil drillers were two sectors that were negatively impacted by the Coronavirus shutdown. With such high levels of unemployment, mortgage and credit card payments are now in doubt. In an amazing reaction to so few people traveling and driving, the price of oil actually went negative for a period of 2 hours in April.
Finally, the James Aggressive Allocation Fund declined 8.60% over the fiscal year. The fund seeks to provide total return through a combination of growth and income. Preservation of capital in declining markets is a secondary objective. It is expected the fund will usually run higher equity levels than the James Balanced: Golden Rainbow Fund.
Much like the James Balanced: Golden Rainbow Fund, the James Aggressive Allocation Fund’s holdings in Apple, Inc., Microsoft Corp. and U.S. Treasury issues were the fund’s top performers during the period, for the same reasons noted above.
The primary detractors to the performance of the James Aggressive Allocation Fund were Chimera Investment Corp. and AFLAC, Inc. Once again both stocks were hit in the wave of declining prices during the quarantine shutdown. Chimera, which deals heavily with mortgages was impacted on fears of defaulting loans. The price of the stock of AFLAC, the insurance company with the duck in its commercials, fell as fewer people were working, causing fewer workers to need workers compensation type insurance plans.
Please see the following charts throughout the remainder of the Annual Report for longer term comparisons for all our funds.
| James Advantage Funds | Shareholder Letter |
June 30, 2020 (Unaudited)
Expectations for the Future
There has been a massive disconnect between the recent movement of the stock market and the U.S. economy. Unemployment is running at some of the highest levels we have ever seen and Gross Domestic Product (GDP) appears to be falling, all the while stock prices have been advancing since late March 2020.
Much of this rally is due to the massive actions taken by the Fed. Initially, the Fed announced it would be purchasing Municipal Bonds and Corporate Bonds, which shortly after turned into the Fed purchasing ETFs that hold municipals and corporates. Since the Fed’s announcement, stocks and riskier bonds have made a steady advance.
How much further can this advance go? This has yet to be seen. As of the date of this letter, many recent unemployment benefits are set to expire at the end of July, which could hinder the consumer. At the same time, there is a general belief that such employment benefits may be extended or that there may even be another round of stimulus payments. At this point it is all speculation. Any help the government can give may be viewed as a positive for stocks.
The bond market has settled down since the beginning of the period of market volatility seen in response to the COVID-19 outbreak and appears to be in what some have dubbed as a ‘trading range’. The 10-year Treasury note and 30-year Treasury bonds provided diversification to portfolios in the period of market downturn following the COVID-19 outbreak and have managed to hold most of their gains. A slight pullback in prices might be expected in response to the increased level of government spending following the COVID-19 outbreak, which could be viewed as inflationary. While many states have opened and we look to be in the early phases of recovery, it is very possible a second wave of the virus could occur. If so, this would lead JIR to increase our investments in the bond market. There is speculation that defaults may be on the rise, and if accurate, higher quality issues should escape such a fate.
Barry R. James, CFA, CIC
President
James Investment Research, Inc.
The views of the author and information discussed in this commentary are as of the date of publication, are subject to change, and may not reflect the writer’s current views. The views expressed represent an assessment of market conditions at a specific point in time, are opinions only, and should not be relied upon as investment advice regarding a particular investment or markets in general. Such information does not constitute a recommendation to buy or sell specific securities or investment vehicles. It should not be assumed that any investment will be profitable or will equal the performance of the Funds or any securities or any sectors mentioned in this letter. The subject matter contained in this letter has been derived from several sources believed to be reliable and accurate at the time of compilation. Neither James Investment Research, Inc. nor the Funds accept any liability for losses either direct or consequential caused by the use of this information. Diversification cannot guarantee gain or prevent loss.
You should carefully consider the investment objectives, potential risks, management fees, and charges and expenses of a Fund before investing. The Funds’ prospectuses contain this and other information. You may obtain a current copy of a Fund’s prospectus by calling 1-800-995-2637. Investors may obtain performance information current to the last month-end at wwwjamesinvestment.com.
Past performance is no guarantee of future results. The investment return and principal value of an investment in any Fund will fluctuate so that an investor’s shares, when redeemed, may be worth more or less than their original cost.
Barry R. James is a registered representative of ALPS Distributors, Inc.
CFA® is a trademark owned by the CFA Institute.
Price to earnings multiple is a measure of how expensive a stock is.
Return on assets is an indicator of how profitable a company is relative to its total assets.
Indices are not actively managed and do not reflect any deduction for fees, expenses or taxes. An investor may not invest directly in an index.
Diversification does not eliminate the risk of experiencing investment loss.
| Annual Report | June 30, 2020 | 3 |
| Growth of $10,000 or $50,000 Charts | James Advantage Funds |
June 30, 2020 (Unaudited)
Comparison of the Change in Value of a $10, 000 Investment in the James Balanced: Golden Rainbow Fund – Retail Class
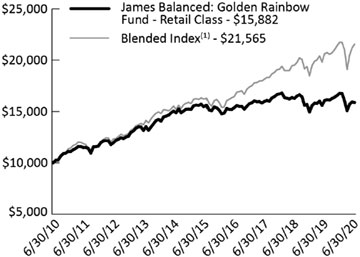
James Balanced: Golden Rainbow Fund – Retail Class Average Annual Total Returns
| | 1 Year | 5 Years | 10 Years | Since Inception(2) |
| James Balanced: Golden Rainbow – Retail Class | -1.18% | 0.52% | 4.73% | 6.90% |
| Blended Index(1) | 4.56% | 5.86% | 7.99% | 7.86% |
| Russell 1000® Index | 7.48% | 10.47% | 13.97% | 9.92% |
| Russell 2000® Index | -6.62% | 4.29% | 10.50% | 9.19% |
| Bloomberg Barclays U.S. Intermediate Government/Credit Bond Index | 7.12% | 3.46% | 3.13% | 5.30% |
| (1) | The Blended Index is comprised of a 25% weighting in the Russell 1000® Index, a 25% weighting in the Russell 2000® Index and a 50% weighting in the Bloomberg Barclays U.S. Intermediate Government/Credit Bond Index. |
| (2) | Fund and Class inception was July 1, 1991. |
| The total annual operating expense ratio as stated in the fee table of the most recent prospectus, dated November 1, 2019, was 1.08%. |
Comparison of the Change in Value of a $50,000 Investment in the James Balanced: Golden Rainbow Fund – Institutional Class
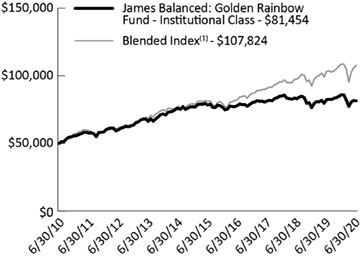
James Balanced: Golden Rainbow Fund – Institutional Class Average Annual Total Returns
| | 1 Year | 5 Years | 10 Years | Since Inception(2) |
| James Balanced: Golden Rainbow – Institutional Class | -0.93% | 0.78% | 5.00% | 6.65% |
| Blended Index(1) | 4.56% | 5.86% | 7.99% | 9.87% |
| Russell 1000® Index | 7.48% | 10.47% | 13.97% | 16.55% |
| Russell 2000® Index | -6.62% | 4.29% | 10.50% | 14.39% |
| Bloomberg Barclays U.S. Intermediate Government/Credit Bond Index | 7.12% | 3.46% | 3.13% | 3.68% |
| (1) | The Blended Index is comprised of a 25% weighting in the Russell 1000® Index, a 25% weighting in the Russell 2000® Index and a 50% weighting in the Bloomberg Barclays U.S. Intermediate Government/Credit Bond Index. |
| (2) | Class inception was March 2, 2009. |
| The total annual operating expense ratio as stated in the fee table of the most recent prospectus, dated November 1, 2019, was 0.83%. |
Past performance does not guarantee future results. The performance data quoted represents past performance and current returns may be lower or higher. The investment return and principal value will fluctuate so that an investor’s shares, when redeemed, may be worth more or less than the original cost. These performance figures do not reflect the deduction of taxes that a shareholder would pay on Fund distributions or the redemption of Fund shares. Please call 1-800-995-2637 for most recent month-end performance information.
The Russell 1000® Index is an index of approximately 1,000 of the largest companies in the U.S. equity market. The Russell 1000® Index is a subset of the Russell 3000® Index. It represents the top companies by market capitalization.
The Russell 2000® Index is a widely recognized, unmanaged index comprised of the 2,000 smallest U.S. domiciled publicly-traded common stocks of the Russell 3000® Index, which represents approximately 8% of the total market capitalization of the Russell 3000® Index, an unmanaged index of the 3,000 largest U.S. domiciled publicly-traded common stocks by market capitalization.
The Bloomberg Barclays U.S. Intermediate Government/Credit Bond Index measures the performance of U.S. Dollar denominated U.S. Treasuries, government-related and investment grade U.S. corporate securities that have a remaining maturity of greater than one year and less than ten years.
The Russell 1000® Index, Russell 2000® Index, Bloomberg Barclays U.S. Intermediate Government/Credit Bond Index and Blended Index are widely recognized unmanaged indices of security prices and are representative of a broader market and range of securities than is found in the Fund’s portfolio. The Index returns do not reflect the deduction of expenses, which have been deducted from a Fund’s returns. The Index returns assume reinvestment of all distributions and do not reflect the deduction of taxes and fees. Individuals cannot invest directly in any Index; however, an individual can invest in exchange traded funds or other investment vehicles that attempt to track the performance of a benchmark index.
| James Advantage Funds | Growth of $10,000 or $50,000 Charts |
June 30, 2020 (Unaudited)
Comparison of the Change in Value of a $10,000 Investment in the James Small Cap Fund
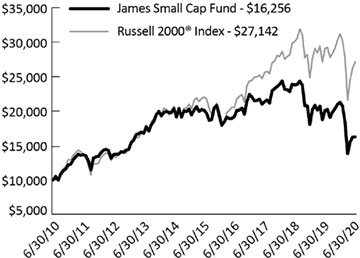
James Small Cap Fund
Average Annual Total Returns
| | 1 Year | 5 Years | 10 Years | Since Inception(1) |
| James Small Cap Fund | -19.04% | -4.17% | 4.98% | 5.44% |
| Russell 2000® Index | -6.62% | 4.29% | 10.50% | 8.16% |
| (1) | Fund inception was October 2, 1998. |
| The total annual operating expense ratio as stated in the fee table of the most recent prospectus, dated November 1, 2019, was 1.54%. |
Comparison of the Change in Value of a $10,000 Investment in the James Micro Cap Fund

James Micro Cap Fund
Average Annual Total Returns
| | 1 Year | 5 Years | Since Inception(1) |
| James Micro Cap Fund | -17.45%* | -0.02% | 6.69% |
| Russell Microcap® Index | -4.77% | 2.86% | 10.03% |
| (1) | Fund inception was July 1, 2010. |
| The total annual operating expense ratio as stated in the fee table of the most recent prospectus, dated November 1, 2019, was 1.57%. |
| * | Excludes adjustments in accordance with accounting principles generally accepted in the United States of America and as such, the net asset value and total return for shareholder transactions reported to the market may differ from the net asset value for financial reporting purposes. |
Past performance does not guarantee future results. The performance data quoted represents past performance and current returns may be lower or higher. The investment return and principal value will fluctuate so that an investor’s shares, when redeemed, may be worth more or less than the original cost. These performance figures do not reflect the deduction of taxes that a shareholder would pay on Fund distributions or the redemption of Fund shares. Please call 1-800-995-2637 for most recent month-end performance information.
Small and Micro Cap investing involve greater risk not associated with investing in more established companies, such as greater price volatility, business risk, less liquidity and increased competitive threat.
The Russell Microcap® Index measures the performance of the microcap segment of the U.S. equity market. It makes up less than 3% of the U.S. equity market. It includes 1,000 of the smallest securities in the small cap Russell 2000® Index, plus the next smallest eligible securities by market cap.
The Russell 2000® Index is a widely recognized, unmanaged index comprised of the 2,000 smallest U.S. domiciled publicly-traded common stocks of the Russell 3000® Index, which represents approximately 8% of the total market capitalization of the Russell 3000® Index, an unmanaged index of the 3,000 largest U.S. domiciled publicly-traded common stocks by market capitalization.
The Russell 2000® Index and Russell Microcap® Index are widely recognized unmanaged indices of security prices and are representative of a broader market and range of securities than is found in the Fund’s portfolio. The Index returns do not reflect the deduction of expenses, which have been deducted from a Fund’s returns. The Index returns assume reinvestment of all distributions and do not reflect the deduction of taxes and fees. Individuals cannot invest directly in any Index; however, an individual can invest in exchange traded funds or other investment vehicles that attempt to track the performance of a benchmark index.
| Annual Report | June 30, 2020 | 5 |
| Growth of $10,000 or $50,000 Charts | James Advantage Funds |
June 30, 2020 (Unaudited)
Comparison of the Change in Value of a $10,000 Investment in the James Aggressive Allocation Fund
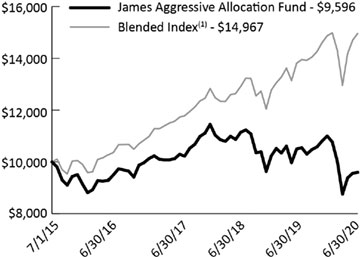
James Aggressive Allocation Fund
Average Annual Total Returns
| | 1 Year | Since Inception(2) |
| James Aggressive Allocation Fund | -8.60% | -0.82% |
| Blended Index(1) | 8.35% | 8.40% |
| Russell 3000® Index | 6.53% | 9.89% |
| Bloomberg Barclays U.S. Aggregate Government/Credit Bond Index | 10.02% | 4.83% |
| (1) | The Blended Index is comprised of a 65% weighting in the Russell 3000® Index and a 35% weighting in the Bloomberg Barclays U.S. Aggregate Government/Credit Bond Index. |
| (2) | Fund inception was July 1, 2015. |
| The total annual operating expense ratio as stated in the fee table of the most recent prospectus, dated November 1, 2019, was 1.03%. |
Past performance does not guarantee future results. The performance data quoted represents past performance and current returns may be lower or higher. The investment return and principal value will fluctuate so that an investor’s shares, when redeemed, may be worth more or less than the original cost. These performance figures do not reflect the deduction of taxes that a shareholder would pay on Fund distributions or the redemption of Fund shares. Please call 1-800-995-2637 for most recent month-end performance information.
The Russell 3000® Index is a stock market index of U.S. stocks. The Index measures the performance of 3,000 publicly held U.S. companies based on total market capitalization, which represents approximately 98% of the investable U.S. equity market.
The Bloomberg Barclays U.S. Aggregate Government/Credit Bond Index is an unmanaged index generally representative of U.S. Dollar denominated U.S. Treasuries, government related and investment grade U.S. corporate securities, that have a remaining maturity greater than one year.
The Russell 3000® Index, Bloomberg Barclays U.S. Aggregate Government/Credit Bond Index and the Blended Index are widely recognized unmanaged indices of security prices and are representative of a broader market and range of securities than is found in the Fund’s portfolio. The Index returns do not reflect the deduction of expenses, which have been deducted from a Fund’s returns. The Index returns assume reinvestment of all distributions and do not reflect the deduction of taxes and fees. Individuals cannot invest directly in any Index; however, an individual can invest in exchange traded funds or other investment vehicles that attempt to track the performance of a benchmark index.
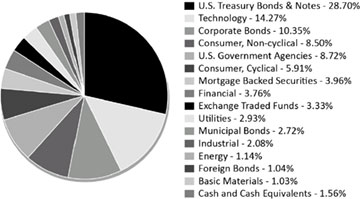
| James Advantage Funds | Representation of Schedules of Investments |
June 30, 2020 (Unaudited)
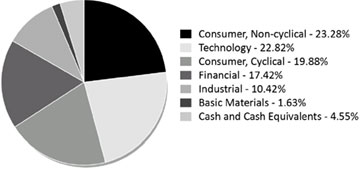
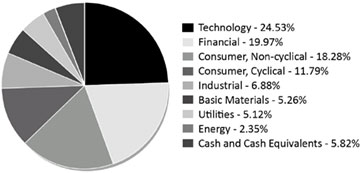
The illustrations below provide the industry sectors for the James Balanced: Golden Rainbow Fund, James Small Cap Fund, James Micro Cap Fund and James Aggressive Allocation Fund.
James Balanced: Golden Rainbow Fund - Industry Sector Allocation
(% of Net Assets)*
James Micro Cap Fund - Industry Sector Allocation
(% of Net Assets)*
James Small Cap Fund -Industry Sector Allocation
(% of Net Assets)*
James Aggressive Allocation Fund - Industry Sector Allocation
(% of Net Assets)*
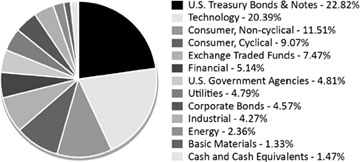
| * | Holdings are subject to change, and may not reflect the current or future position of the portfolio. |
| Annual Report | June 30, 2020 | 7 |
| Disclosure of Fund Expenses | James Advantage Funds |
June 30, 2020 (Unaudited)
Example. As a shareholder of a Fund, you incur two types of costs: (1) transaction costs, including reinvested dividends or other distributions, and redemption fees; and (2) ongoing costs, including management fees, distribution (12b-1) fees and other Fund expenses. This example is intended to help you understand your ongoing costs (in dollars) of investing in the Funds and to compare these costs with the ongoing costs of investing in other mutual funds.
The example is based on an investment of $1,000 invested at the beginning of the period and held for the entire period January 1, 2020 through June 30, 2020.
Actual Expenses. The first line of the table below provides information about actual account values and actual expenses. You may use the information in this line, together with the amount you invested, to estimate the expenses that you paid over the period. Simply divide your account value by $1,000 (for example, an $8,600 account value divided by $1,000 = 8.6), then multiply the result by the number in the first line under the heading “Expense Paid During Period” to estimate the expenses you paid on your account during this period.
Hypothetical Example for Comparison Purposes. The second line of the table below provides information about hypothetical account values and hypothetical expenses based on a Fund’s actual expense ratio and an assumed rate of return of 5% per year before expenses, which is not the Fund’s actual returns. The hypothetical account values and expenses may not be used to estimate the actual ending account balance or expenses you paid for the period. You may use this information to compare the ongoing costs of investing in a Fund and other mutual funds. To do so, compare this 5% hypothetical example with the 5% hypothetical examples that appear in the shareholder reports of the other funds.
Please note that expenses shown in the table are meant to highlight and help you compare ongoing costs only. The calculations assume no shares were bought or sold during the period. Your actual costs may have been higher or lower, depending on the amount of your investment and the timing of any purchases or redemptions.
| | Net Expense
Ratio
Annualized
June 30, 2020(a) | Beginning
Account Value
January 1, 2020 | Ending
Account Value
June 30, 2020 | Expense
Paid During
Period(b) |
| James Balanced: Golden Rainbow Fund | | | | |
| Retail Class Actual | 1.13% | $ 1,000.00 | $947.30 | $5.47 |
| Retail Class Hypothetical (5% return before expenses) | 1.13% | $ 1,000.00 | $1,019.24 | $5.67 |
| Institutional Class Actual | 0.88% | $ 1,000.00 | $948.90 | $4.26 |
| Institutional Class Hypothetical (5% return before expenses) | 0.88% | $ 1,000.00 | $1,020.49 | $4.42 |
| James Small Cap Fund | | | | |
| Actual | 1.50% | $ 1,000.00 | $764.50 | $6.58 |
| Hypothetical (5% return before expenses) | 1.50% | $ 1,000.00 | $1,017.40 | $7.52 |
| James Micro Cap Fund | | | | |
| Actual | 1.50% | $ 1,000.00 | $769.60 | $6.60 |
| Hypothetical (5% return before expenses) | 1.50% | $ 1,000.00 | $1,017.40 | $7.52 |
| James Aggressive Allocation Fund | | | | |
| Actual | 0.98% | $ 1,000.00 | $872.40 | $4.56 |
| Hypothetical (5% return before expenses) | 0.98% | $ 1,000.00 | $1,019.99 | $4.92 |
| (a) | Annualized, based on the Fund's most recent fiscal half year expenses. |
| (b) | Expenses are equal to the Fund's annualized expense ratio multiplied by the average account value over the period, multiplied by the number of days in the most recent fiscal half year (182), divided by 366. |
| James Balanced: Golden Rainbow Fund | Schedule of Investments |
June 30, 2020
| Shares or Principal Amount | | Value |
| COMMON STOCKS-39.62% | | |
| | | Basic Materials-1.03% | | |
| | 21,770 | | | Avery Dennison Corp. | | $ | 2,483,739 | |
| | 26,145 | | | Celanese Corp. | | | 2,257,359 | |
| | 33,060 | | | Innospec, Inc. | | | 2,553,885 | |
| | | | | | | | 7,294,983 | |
| | | | | | | | | |
| | | | | Consumer, Cyclical-5.91% | | | | |
| | 11,610 | | | Alibaba Group Holding, Ltd., Sponsored ADR* | | | 2,504,277 | |
| | 51,320 | | | Best Buy Co., Inc. | | | 4,478,696 | |
| | 59,940 | | | CVS Health Corp. | | | 3,894,302 | |
| | 16,930 | | | Home Depot, Inc. | | | 4,241,134 | |
| | 72,445 | | | Insight Enterprises, Inc.* | | | 3,564,294 | |
| | 40,000 | | | McDonald's Corp. | | | 7,378,800 | |
| | 37,540 | | | Target Corp. | | | 4,502,172 | |
| | 77,785 | | | Walmart, Inc. | | | 9,317,087 | |
| | 16,135 | | | Walt Disney Co. | | | 1,799,214 | |
| | | | | | | | 41,679,976 | |
| | | | | | | | | |
| | | | | Consumer, Non-cyclical-8.50% | | | | |
| | 17,145 | | | Anthem, Inc. | | | 4,508,792 | |
| | 85,000 | | | AstraZeneca PLC, ADR | | | 4,495,650 | |
| | 6,220 | | | Costco Wholesale Corp. | | | 1,885,966 | |
| | 33,955 | | | Eli Lilly & Co. | | | 5,574,732 | |
| | 21,750 | | | FTI Consulting, Inc.* | | | 2,491,463 | |
| | 25,400 | | | Helen of Troy, Ltd.* | | | 4,789,424 | |
| | 43,170 | | | Johnson & Johnson | | | 6,070,997 | |
| | 7,059 | | | Kimberly-Clark Corp. | | | 997,790 | |
| | 122,105 | | | Kroger Co. | | | 4,133,254 | |
| | 62,700 | | | Medtronic PLC | | | 5,749,590 | |
| | 26,520 | | | National HealthCare Corp. | | | 1,682,429 | |
| | 212,000 | | | Pfizer, Inc. | | | 6,932,400 | |
| | 61,000 | | | Procter & Gamble Co. | | | 7,293,770 | |
| | 11,280 | | | UnitedHealth Group, Inc. | | | 3,327,036 | |
| | | | | | | | 59,933,293 | |
| | | | | | | | | |
| | | | | Energy-1.14% | | | | |
| | 34,185 | | | Chevron Corp. | | | 3,050,328 | |
| | 15,000 | | | Pioneer Natural Resources Co. | | | 1,465,500 | |
| | 53,000 | | | TOTAL SA, ADR | | | 2,038,380 | |
| | 25,780 | | | Valero Energy Corp. | | | 1,516,380 | |
| | | | | | | | 8,070,588 | |
| | | | | | | | | |
| | | | | Financial-3.76% | | | | |
| | 57,795 | | | Allstate Corp. | | | 5,605,537 | |
| | 6,095 | | | Goldman Sachs Group, Inc. | | | 1,204,494 | |
| | 93,070 | | | JPMorgan Chase & Co. | | | 8,754,164 | |
| | 29,534 | | | LPL Financial Holdings, Inc. | | | 2,315,466 | |
| | 32,630 | | | Nelnet, Inc., Class A | | | 1,557,756 | |
| | 41,605 | | | PNC Financial Services Group, Inc. | | | 4,377,262 | |
| | 14,000 | | | Public Storage, REIT | | | 2,686,460 | |
| | | | | | | | 26,501,139 | |
See Notes to Financial Statements.
| Annual Report | June 30, 2020 | 9 |
| Schedule of Investments | James Balanced: Golden Rainbow Fund |
June 30, 2020
| Shares or Principal Amount | | Value |
| | | | | Industrial-2.08% | | | | |
| | 14,852 | | | Caterpillar, Inc. | | $ | 1,878,778 | |
| | 27,300 | | | Eaton Corp. PLC | | | 2,388,204 | |
| | 36,811 | | | Generac Holdings, Inc.* | | | 4,488,365 | |
| | 25,000 | | | Raytheon Technologies Corp. | | | 1,540,500 | |
| | 39,834 | | | Republic Services, Inc. | | | 3,268,380 | |
| | 6,500 | | | Union Pacific Corp. | | | 1,098,955 | |
| | | | | | | | 14,663,182 | |
| | | | | | | | | |
| | | | | Technology-14.27% | | | | |
| | 7,411 | | | Alphabet, Inc., Class A* | | | 10,509,169 | |
| | 26,160 | | | Amgen, Inc. | | | 6,170,098 | |
| | 45,000 | | | Apple, Inc. | | | 16,416,000 | |
| | 24,450 | | | Cabot Microelectronics Corp. | | | 3,411,753 | |
| | 30,000 | | | Ciena Corp.* | | | 1,624,800 | |
| | 164,310 | | | Cisco Systems, Inc. | | | 7,663,418 | |
| | 26,400 | | | Crown Castle International Corp., REIT | | | 4,418,040 | |
| | 29,728 | | | Integer Holdings Corp.* | | | 2,171,630 | |
| | 149,220 | | | Intel Corp. | | | 8,927,833 | |
| | 22,152 | | | Leidos Holdings, Inc. | | | 2,074,978 | |
| | 17,300 | | | Lockheed Martin Corp. | | | 6,313,116 | |
| | 28,544 | | | Micron Technology, Inc.* | | | 1,470,587 | |
| | 89,325 | | | Microsoft Corp. | | | 18,178,531 | |
| | 12,890 | | | Motorola Solutions, Inc. | | | 1,806,276 | |
| | 3,930 | | | NetEase, Inc., ADR | | | 1,687,463 | |
| | 7,040 | | | Northrop Grumman Corp. | | | 2,164,378 | |
| | 16,555 | | | SYNNEX Corp. | | | 1,982,792 | |
| | 19,225 | | | Visa, Inc., Class A | | | 3,713,693 | |
| | | | | | | | 100,704,555 | |
| | | | | | | | | |
| | | | | Utilities-2.93% | | | | |
| | 70,783 | | | American Electric Power Co., Inc. | | | 5,637,158 | |
| | 45,163 | | | AT&T, Inc. | | | 1,365,277 | |
| | 28,710 | | | Entergy Corp. | | | 2,693,285 | |
| | 55,233 | | | FirstEnergy Corp. | | | 2,141,936 | |
| | 160,055 | | | Verizon Communications, Inc. | | | 8,823,832 | |
| | | | | | | | 20,661,488 | |
| | | | | | | | | |
| TOTAL COMMON STOCKS | | | | |
| (Cost $230,759,943) | | | 279,509,204 | |
| Shares or Principal Amount | | | Value | |
| EXCHANGE TRADED FUNDS-3.33% | | | | |
| | 457,836 | | | iShares® Gold Trust* | | | 7,778,634 | |
| | 5,000 | | | iShares® Intermediate-Term Credit Bond ETF | | | 301,900 | |
| | 45,830 | | | iShares® Russell 2000® ETF | | | 6,561,939 | |
| | 50,710 | | | iShares® Russell 2000 Value ETF | | | 4,942,197 | |
| | 30,469 | | | iShares® Silver Trust ETF* | | | 518,278 | |
| | 20,000 | | | SPDR® Bloomberg Barclays Convertible Securities ETF | | | 1,210,000 | |
| | 12,974 | | | SPDR® Gold Shares ETF* | | | 2,171,458 | |
| | | | | | | | | |
| TOTAL EXCHANGE TRADED FUNDS | | | | |
| (Cost $22,518,574) | | | 23,484,406 | |
See Notes to Financial Statements.
| 10 | www.jamesinvestment.com |
| James Balanced: Golden Rainbow Fund | Schedule of Investments |
June 30, 2020
| Shares or Principal Amount | | Value |
| CORPORATE BONDS-10.35% | | |
| | | Consumer, Cyclical-2.35% | | |
| $ | 5,000,000 | | | eBay, Inc., 2.600%, 7/15/22 | | $ | 5,169,617 | |
| | 5,000,000 | | | Home Depot, Inc., 2.700%, 4/1/23 | | | 5,280,256 | |
| | 785,000 | | | McDonald's Corp., 5.700%, 2/1/39 | | | 1,088,681 | |
| | 2,000,000 | | | Starbucks Corp., 2.550%, 11/15/30 | | | 2,097,358 | |
| | 2,000,000 | | | Walmart, Inc., 5.250%, 9/1/35 | | | 2,915,685 | |
| | | | | | | | 16,551,597 | |
| | | | | Consumer, Non-cyclical-0.71% | | | | |
| | 3,000,000 | | | Hershey Co., 4.125%, 12/1/20 | | | 3,045,272 | |
| | 1,950,000 | | | Keurig Dr Pepper, Inc., 2.530%, 11/15/21 | | | 1,996,939 | |
| | | | | | | | 5,042,211 | |
| | | | | Financial-2.50% | | | | |
| | 8,100,000 | | | Berkshire Hathaway, Inc., 3.750%, 8/15/21 | | | 8,401,884 | |
| | 1,000,000 | | | Citigroup, Inc., 2.650%, 10/26/20 | | | 1,006,979 | |
| | 2,000,000 | | | Citigroup, Inc., 3.875%, 3/26/25 | | | 2,178,426 | |
| | 5,000,000 | | | Wells Fargo & Co., 2.500%, 3/4/21 | | | 5,069,858 | |
| | 1,000,000 | | | Wells Fargo & Co., 2.000%, 5/15/25 | | | 1,007,729 | |
| | | | | | | | 17,664,876 | |
| | | | | Industrial-0.75% | | | | |
| | 1,000,000 | | | Caterpillar, Inc., 8.250%, 12/15/38 | | | 1,785,985 | |
| | 1,000,000 | | | General Electric Co., 2.700%, 10/9/22 | | | 1,039,090 | |
| | 2,000,000 | | | General Electric Co., 6.875%, 1/10/39 | | | 2,458,127 | |
| | | | | | | | 5,283,202 | |
| | | | | Technology-4.04% | | | | |
| | 2,500,000 | | | Activision Blizzard, Inc., 2.300%, 9/15/21 | | | 2,548,143 | |
| | 2,500,000 | | | Apple, Inc., 2.050%, 9/11/26 | | | 2,671,129 | |
| | 5,000,000 | | | Intel Corp., 3.300%, 10/1/21 | | | 5,187,375 | |
| | 5,000,000 | | | Intel Corp., 2.875%, 5/11/24 | | | 5,416,542 | |
| | 3,700,000 | | | Microsoft Corp., 5.200%, 6/1/39 | | | 5,426,344 | |
| | 1,000,000 | | | Oracle Corp., 3.875%, 7/15/20 | | | 1,001,293 | |
| | 5,000,000 | | | Oracle Corp., 2.500%, 5/15/22 | | | 5,170,063 | |
| | 1,000,000 | | | PayPal Holdings, Inc., 2.650%, 10/1/26 | | | 1,086,731 | |
| | | | | | | | 28,507,620 | |
| TOTAL CORPORATE BONDS | | | | |
| (Cost $66,837,831) | | | 73,049,506 | |
| | | | | | | | | |
| Shares or Principal Amount | | | Value | |
| MUNICIPAL BONDS - 2.72% | | | | |
| | | | | Hawaii-1.41% | | | | |
| | 9,000,000 | | | City and County of Honolulu General Obligation Unlimited Bonds, Series B, 5.000%, 11/1/25 | | | 9,929,070 | |
| | | | | | | | | |
| | | | | Ohio-1.31% | | | | |
| | 7,450,000 | | | Beavercreek City School District General Obligation Unlimited Bonds, 3.250%, 12/1/36 | | | 7,839,262 | |
| | 1,000,000 | | | Ohio State University General Recipients Revenue Bonds, Series C, 4.910%, 6/1/40 | | | 1,425,000 | |
| | | | | | | | 9,264,262 | |
| TOTAL MUNICIPAL BONDS | | | | |
| (Cost $17,890,970) | | | 19,193,332 | |
See Notes to Financial Statements.
| Annual Report | June 30, 2020 | 11 |
| Schedule of Investments | James Balanced: Golden Rainbow Fund |
June 30, 2020
| Shares or Principal Amount | | Value |
| U.S. GOVERNMENT AGENCIES-8.72% | | | | |
| | | | | Federal Agricultural Mortgage Corp.-1.42% | | | | |
| $ | 10,000,000 | | | 3M US L + 0.08%, 1/3/22(a) | | $ | 10,005,505 | |
| | | | | | | | | |
| | | | | Federal Farm Credit Banks Funding Corp.-1.63% | | | | |
| | 5,000,000 | | | 0.930%, 11/26/25 | | | 5,000,881 | |
| | 5,725,000 | | | 2.750%, 11/6/26 | | | 6,491,979 | |
| | | | | | | | 11,492,860 | |
| | | | | Federal Home Loan Banks-3.49% | | | | |
| | 10,000,000 | | | 2.875%, 6/13/25 | | | 11,145,861 | |
| | 5,000,000 | | | 2.420%, 9/17/27 | | | 5,014,459 | |
| | 1,000,000 | | | 2.500%, 9/11/29 | | | 1,002,804 | |
| | 5,000,000 | | | 4.080%, 5/25/33 | | | 5,470,105 | |
| | 2,000,000 | | | 2.200%, 4/23/35 | | | 1,984,086 | |
| | | | | | | | 24,617,315 | |
| | | | | Tennessee Valley Authority-2.18% | | | | |
| | 10,000,000 | | | 5.250%, 9/15/39 | | | 15,425,876 | |
| | | | | | | | | |
| TOTAL U.S. GOVERNMENT AGENCIES | | | | |
| (Cost $56,909,925) | | | 61,541,556 | |
| Shares or Principal Amount | | | Value | |
| MORTGAGE BACKED SECURITIES-3.96% | | | | |
| | | | | Fannie Mae Pool-3.54% | | | | |
| | 6,930,923 | | | 3.500%, 9/1/33 | | | 7,416,194 | |
| | 16,689,418 | | | 2.500%, 1/1/57 | | | 17,521,743 | |
| | | | | | | | 24,937,937 | |
| | | | | Fannie Mae REMICS-0.42% | | | | |
| | 2,874,035 | | | 3.500%, 5/25/47 | | | 2,989,606 | |
| | | | | | | | | |
| TOTAL MORTGAGE BACKED SECURITIES | | | | |
| (Cost $26,018,837) | | | 27,927,543 | |
| Shares or Principal Amount | | | Value | |
| U.S. TREASURY BONDS & NOTES-28.70% | | | | |
| | | | | U.S. Treasury Bonds-20.27% | | | | |
| $ | 20,000,000 | | | 2.625%, 11/15/20 | | | 20,182,031 | |
| | 30,000,000 | | | 2.000%, 8/15/25 | | | 32,571,094 | |
| | 35,000,000 | | | 2.750%, 2/15/28 | | | 40,825,586 | |
| | 20,000,000 | | | 2.625%, 2/15/29 | | | 23,434,375 | |
| | 15,000,000 | | | 1.625%, 8/15/29 | | | 16,364,062 | |
| | 8,000,000 | | | 2.250%, 8/15/49 | | | 9,616,250 | |
| | | | | | | | 142,993,398 | |
| | | | | U.S. Treasury Notes-5.77% | | | | |
| | 40,000,000 | | | 2.375%, 4/15/21 | | | 40,696,875 | |
| | | | | | | | | |
| | | | | United States Treasury Inflation Indexed Bonds-2.66% | | | | |
| | 18,067,525 | | | 0.625%, 4/15/23 | | | 18,804,531 | |
| | | | | | | | | |
| TOTAL U.S. TREASURY BONDS & NOTES | | | | |
| (Cost $188,478,032) | | | 202,494,804 | |
See Notes to Financial Statements.
| 12 | www.jamesinvestment.com |
| James Balanced: Golden Rainbow Fund | Schedule of Investments |
June 30, 2020
| Shares or Principal Amount | | Value |
| FOREIGN BONDS-1.04% | | |
| | | Singapore Government Bond-1.04% | | | | |
| SGD 10,000,000 | | 2.250%, 6/1/21 | | $ | 7,303,380 | |
| | | | | | | |
| TOTAL FOREIGN BONDS | | | | |
| (Cost $7,447,905) | | | 7,303,380 | |
| Shares or Principal Amount | | | Value | |
| SHORT TERM INVESTMENTS-0.74% | | | | |
| | | Mutual Fund-0.74% | | | | |
| 5,198,872 | | First American Treasury Obligations Fund, Class X, 7-Day Yield 0.086% | | | 5,198,872 | |
| | | | | | | |
| TOTAL SHORT TERM INVESTMENTS | | | | |
| (Cost $5,198,872) | | | 5,198,872 | |
| | | | | | | |
| TOTAL INVESTMENT SECURITIES-99.18% | | | | |
| (Cost $622,060,889) | | | 699,702,603 | |
| OTHER ASSETS IN EXCESS OF LIABILITIES-0.82% | | | 5,785,058 | |
| NET ASSETS-100.00% | | $ | 705,487,661 | |
For Fund compliance purposes, the Fund's industry classifications refer to any one or more of the industry sub-classifications used by one or more widely recognized market indexes or ratings group indexes, and/or as defined by Fund management. Those definitions may not apply for purposes of this report, which may combine industry sub-classifications for reporting ease. Industries are shown as a percentage of net assets.
| * | Non-income producing security. |
| (a) | Floating or variable rate security. The reference rate is described below. The rate in effect as of June 30, 2020 is based on the reference rate plus the displayed spread as of the security’s last reset date. |
Investment Abbreviations:
LIBOR - London Interbank Offered Rate
Reference Rates:
3M US L - 3 Month LIBOR as of June 30, 2020 was 0.30%
SGD - Singapore Dollar
See Notes to Financial Statements.
| Annual Report | June 30, 2020 | 13 |
| Schedule of Investments | James Small Cap Fund |
June 30, 2020
| Shares | | | | Value |
| COMMON STOCKS-94.18% | | |
| | | Basic Materials-5.26% | | |
| | 24,030 | | | Boise Cascade Co. | | $ | 903,768 | |
| | 16,000 | | | Cleveland-Cliffs, Inc. | | | 88,320 | |
| | 3,900 | | | Innospec, Inc. | | | 301,275 | |
| | 13,120 | | | Schnitzer Steel Industries, Inc., Class A | | | 231,437 | |
| | | | | | | | 1,524,800 | |
| | | | | | | | | |
| | | | | Consumer, Cyclical-11.79% | | | | |
| | 2,770 | | | Deckers Outdoor Corp.* | | | 544,000 | |
| | 21,650 | | | Gray Television, Inc.* | | | 302,018 | |
| | 19,890 | | | Insight Enterprises, Inc.* | | | 978,588 | |
| | 20,000 | | | MDC Holdings, Inc. | | | 714,000 | |
| | 3,800 | | | Meritage Homes Corp.* | | | 289,256 | |
| | 9,680 | | | Patrick Industries, Inc. | | | 592,900 | |
| | | | | | | | 3,420,762 | |
| | | | | | | | | |
| | | | | Consumer, Non-cyclical-18.28% | | | | |
| | 4,570 | | | FTI Consulting, Inc.* | | | 523,494 | |
| | 2,545 | | | Helen of Troy, Ltd.* | | | 479,885 | |
| | 24,198 | | | Hillenbrand, Inc. | | | 655,040 | |
| | 21,275 | | | Ingles Markets, Inc., Class A | | | 916,314 | |
| | 13,050 | | | National HealthCare Corp. | | | 827,892 | |
| | 29,440 | | | Tivity Health, Inc.* | | | 333,555 | |
| | 5,000 | | | TriNet Group, Inc.* | | | 304,700 | |
| | 15,000 | | | TrueBlue, Inc.* | | | 229,050 | |
| | 19,470 | | | Village Super Market, Inc., Class A | | | 539,708 | |
| | 9,855 | | | Weis Markets, Inc. | | | 493,933 | |
| | | | | | | | 5,303,571 | |
| | | | | | | | | |
| | | | | Energy-2.35% | | | | |
| | 51,100 | | | Frontline, Ltd. | | | 356,678 | |
| | 2,500 | | | HollyFrontier Corp. | | | 73,000 | |
| | 39,365 | | | WPX Energy, Inc.* | | | 251,149 | |
| | | | | | | | 680,827 | |
| | | | | | | | | |
| | | | | Financial-19.97% | | | | |
| | 36,580 | | | American Equity Investment Life Holding Co. | | | 903,892 | |
| | 3,870 | | | American Financial Group, Inc. | | | 245,590 | |
| | 8,300 | | | Assured Guaranty, Ltd. | | | 202,603 | |
| | 32,325 | | | Chimera Investment Corp., REIT | | | 310,643 | |
| | 3,720 | | | Evercore, Inc., Class A | | | 219,182 | |
| | 77,700 | | | First BanCorp | | | 434,343 | |
| | 165,655 | | | Genworth Financial, Inc., Class A* | | | 382,663 | |
| | 55,410 | | | Ladder Capital Corp., REIT | | | 448,821 | |
| | 2,400 | | | LGI Homes, Inc.* | | | 211,272 | |
| | 16,875 | | | Piper Sandler Cos. | | | 998,325 | |
| | 31,700 | | | Radian Group, Inc. | | | 491,667 | |
| | 40,575 | | | TPG Specialty Lending, Inc. | | | 669,082 | |
| | 29,280 | | | Xenia Hotels & Resorts, Inc., REIT | | | 273,182 | |
| | | | | | | | 5,791,265 | |
| | | | | | | | | |
| | | | | Industrial-6.88% | | | | |
| | 18,955 | | | Encore Wire Corp. | | | 925,383 | |
See Notes to Financial Statements.
| 14 | www.jamesinvestment.com |
| James Small Cap Fund | Schedule of Investments |
June 30, 2020
| Shares | Value | |
| | | | | Industrial (continued) | | | | |
| | 6,580 | | | Generac Holdings, Inc.* | | $ | 802,299 | |
| | 6,000 | | | MasTec, Inc.* | | | 269,220 | |
| | | | | | | | 1,996,902 | |
| | | | | | | | | |
| | | | | Technology-24.53% | | | | |
| | 13,200 | | | Avnet, Inc. | | | 368,082 | |
| | 4,465 | | | Cabot Microelectronics Corp. | | | 623,046 | |
| | 9,683 | | | Deluxe Corp. | | | 227,938 | |
| | 92,560 | | | Innoviva, Inc.* | | | 1,293,989 | |
| | 15,190 | | | Integer Holdings Corp.* | | | 1,109,630 | |
| | 32,945 | | | Nova Measuring Instruments, Ltd.* | | | 1,587,620 | |
| | 21,060 | | | Sykes Enterprises, Inc.* | | | 582,520 | |
| | 5,035 | | | SYNNEX Corp. | | | 603,042 | |
| | 47,010 | | | Vishay Intertechnology, Inc. | | | 717,843 | |
| | | | | | | | 7,113,710 | |
| | | | | | | | | |
| | | | | Utilities-5.12% | | | | |
| | 5,085 | | | IDACORP, Inc. | | | 444,276 | |
| | 13,875 | | | PNM Resources, Inc. | | | 533,355 | |
| | 12,135 | | | Portland General Electric Co. | | | 507,364 | |
| | | | | | | | 1,484,995 | |
| | | | | | | | | |
| TOTAL COMMON STOCKS | | | | |
| (Cost $27,024,708) | | | 27,316,832 | |
| Shares | | | Value | |
| SHORT TERM INVESTMENTS-5.77% | | | | |
| | | | | Mutual Fund-5.77% | | | | |
| | 1,674,913 | | | First American Treasury Obligations Fund, Class X, 7-Day Yield 0.086% | | | 1,674,913 | |
| | | | | | | | | |
| TOTAL SHORT TERM INVESTMENTS | | | | |
| (Cost $1,674,913) | | | 1,674,913 | |
| | | | | | | | | |
| TOTAL INVESTMENT SECURITIES-99.95% | | | | |
| (Cost $28,699,621) | | | 28,991,745 | |
| OTHER ASSETS IN EXCESS OF LIABILITIES-0.05% | | | 14,239 | |
| NET ASSETS-100.00% | | $ | 29,005,984 | |
For Fund compliance purposes, the Fund's industry classifications refer to any one or more of the industry sub-classifications used by one or more widely recognized market indexes or ratings group indexes, and/or as defined by Fund management. Those definitions may not apply for purposes of this report, which may combine industry sub-classifications for reporting ease. Industries are shown as a percentage of net assets.
| * | Non-income producing security. |
See Notes to Financial Statements.
| Annual Report | June 30, 2020 | 15 |
| Schedule of Investments | James Micro Cap Fund |
June 30, 2020
| Shares | | | | Value |
| COMMON STOCKS-95.45% | | |
| | | Basic Materials-1.63% | | |
| | 18,045 | | | Schnitzer Steel Industries, Inc., Class A | | $ | 318,314 | |
| | | | | | | | 318,314 | |
| | | | | | | | | |
| | | | | Consumer, Cyclical-19.88% | | | | |
| | 16,230 | | | Century Communities, Inc.* | | | 497,612 | |
| | 30,210 | | | Haverty Furniture Cos., Inc. | | | 483,360 | |
| | 6,240 | | | Insight Enterprises, Inc.* | | | 307,008 | |
| | 31,660 | | | M/I Homes, Inc.* | | | 1,090,370 | |
| | 24,726 | | | Patrick Industries, Inc. | | | 1,514,468 | |
| | | | | | | | 3,892,818 | |
| | | | | | | | | |
| | | | | Consumer, Non-cyclical-23.28% | | | | |
| | 6,405 | | | BioSpecifics Technologies Corp.* | | | 392,498 | |
| | 19,230 | | | Ingles Markets, Inc., Class A | | | 828,236 | |
| | 6,557 | | | John B Sanfilippo & Son, Inc. | | | 559,509 | |
| | 48,010 | | | Kamada, Ltd.* | | | 372,558 | |
| | 33,200 | | | Lantheus Holdings, Inc.* | | | 474,760 | |
| | 7,050 | | | National HealthCare Corp. | | | 447,252 | |
| | 11,475 | | | PetIQ, Inc.* | | | 399,789 | |
| | 6,030 | | | Semler Scientific, Inc.* | | | 277,380 | |
| | 27,445 | | | TrueBlue, Inc.* | | | 419,085 | |
| | 14,030 | | | Village Super Market, Inc., Class A | | | 388,912 | |
| | | | | | | | 4,559,979 | |
| | | | | | | | | |
| | | | | Financial-17.42% | | | | |
| | 57,215 | | | Ares Commercial Real Estate Corp., REIT | | | 521,801 | |
| | 48,590 | | | Enova International, Inc.* | | | 722,533 | |
| | 9,320 | | | Federal Agricultural Mortgage Corp., Class C | | | 596,573 | |
| | 34,030 | | | OFG Bancorp | | | 454,981 | |
| | 10,830 | | | Piper Sandler Cos. | | | 640,703 | |
| | 26,675 | | | Universal Insurance Holdings, Inc. | | | 473,481 | |
| | | | | | | | 3,410,072 | |
| | | | | | | | | |
| | | | | Industrial-10.42% | | | | |
| | 13,035 | | | ArcBest Corp. | | | 345,558 | |
| | 27,900 | | | CAI International, Inc.* | | | 464,814 | |
| | 7,145 | | | NACCO Industries, Inc., Class A | | | 166,479 | |
| | 21,680 | | | Vectrus, Inc.* | | | 1,065,138 | |
| | | | | | | | 2,041,989 | |
| | | | | | | | | |
| | | | | Technology-22.82% | | | | |
| | 102,175 | | | ACCO Brands Corp. | | | 725,442 | |
| | 24,730 | | | Innoviva, Inc.* | | | 345,725 | |
| | 5,270 | | | Integer Holdings Corp.* | | | 384,974 | |
| | 28,615 | | | Nova Measuring Instruments, Ltd.* | | | 1,378,957 | |
| | 30,368 | | | PC Connection, Inc. | | | 1,407,860 | |
| | 19,495 | | | Vanda Pharmaceuticals, Inc.* | | | 223,023 | |
| | | | | | | | 4,465,981 | |
| | | | | | | | | |
| TOTAL COMMON STOCKS | | | | |
| (Cost $16,682,162) | | | 18,689,153 | |
See Notes to Financial Statements.
| 16 | www.jamesinvestment.com |
| James Micro Cap Fund | Schedule of Investments |
June 30, 2020
| Shares | | | | Value |
| SHORT TERM INVESTMENTS-15.23% | | | | |
| | | Mutual Fund-15.23% | | | | |
| 2,982,224 | | First American Treasury Obligations Fund, Class X, 7-Day Yield 0.086% | | $ | 2,982,224 | |
| | | | | | | |
| TOTAL SHORT TERM INVESTMENTS | | | | |
| (Cost $2,982,224) | | | 2,982,224 | |
| | | | | | | |
| TOTAL INVESTMENT SECURITIES-110.68% | | | | |
| (Cost $19,664,386) | | | 21,671,377 | |
| OTHER LIABILITIES IN EXCESS OF OTHER ASSETS-(10.68)% | | | (2,090,913 | ) |
| NET ASSETS-100.00% | | $ | 19,580,464 | |
For Fund compliance purposes, the Fund's industry classifications refer to any one or more of the industry sub-classifications used by one or more widely recognized market indexes or ratings group indexes, and/or as defined by Fund management. Those definitions may not apply for purposes of this report, which may combine industry sub-classifications for reporting ease. Industries are shown as a percentage of net assets.
| * | Non-income producing security. |
See Notes to Financial Statements.
| Annual Report | June 30, 2020 | 17 |
| Schedule of Investments | James Aggressive Allocation Fund |
June 30, 2020
| Shares or Principal Amount | | Value |
| COMMON STOCKS-58.86% | | |
| | | Basic Materials-1.33% | | |
| | 4,475 | | | Newmont Mining Corp. | | $ | 276,287 | |
| | | | | | | | 276,287 | |
| | | | | | | | | |
| | | | | Consumer, Cyclical-9.07% | | | | |
| | 980 | | | Alibaba Group Holding, Ltd., Sponsored ADR* | | | 211,386 | |
| | 2,095 | | | Best Buy Co., Inc. | | | 182,831 | |
| | 3,220 | | | CVS Health Corp. | | | 209,203 | |
| | 16,550 | | | Gray Television, Inc.* | | | 230,873 | |
| | 1,000 | | | Home Depot, Inc. | | | 250,510 | |
| | 2,250 | | | Target Corp. | | | 269,843 | |
| | 2,950 | | | Walmart, Inc. | | | 353,351 | |
| | 1,600 | | | Walt Disney Co. | | | 178,416 | |
| | | | | | | | 1,886,413 | |
| | | | | | | | | |
| | | | | Consumer, Non-cyclical-11.51% | | | | |
| | 775 | | | Anthem, Inc. | | | 203,809 | |
| | 2,700 | | | FTI Consulting, Inc.* | | | 309,285 | |
| | 1,475 | | | Helen of Troy, Ltd.* | | | 278,126 | |
| | 1,295 | | | Johnson & Johnson | | | 182,116 | |
| | 9,300 | | | Kroger Co. | | | 314,805 | |
| | 3,125 | | | Medtronic PLC | | | 286,563 | |
| | 2,750 | | | National HealthCare Corp. | | | 174,460 | |
| | 3,220 | | | Pfizer, Inc. | | | 105,294 | |
| | 1,690 | | | Procter & Gamble Co. | | | 202,073 | |
| | 7,750 | | | TrueBlue, Inc.* | | | 118,343 | |
| | 1,595 | | | Zoetis, Inc. | | | 218,579 | |
| | | | | | | | 2,393,453 | |
| | | | | | | | | |
| | | | | Energy-2.36% | | | | |
| | 2,350 | | | Chevron Corp. | | | 209,690 | |
| | 5,550 | | | EOG Resources, Inc. | | | 281,163 | |
| | | | | | | | 490,853 | |
| | | | | | | | | |
| | | | | Financial-5.14% | | | | |
| | 2,155 | | | Allstate Corp. | | | 209,013 | |
| | 23,000 | | | Annaly Capital Management, Inc., REIT | | | 150,880 | |
| | 4,350 | | | CBRE Group, Inc., Class A* | | | 196,707 | |
| | 1,150 | | | Goldman Sachs Group, Inc. | | | 227,263 | |
| | 2,000 | | | JPMorgan Chase & Co. | | | 188,120 | |
| | 1,250 | | | LPL Financial Holdings, Inc. | | | 98,000 | |
| | | | | | | | 1,069,983 | |
| | | | | | | | | |
| | | | | Industrial-4.27% | | | | |
| | 3,475 | | | AGCO Corp. | | | 192,723 | |
| | 4,650 | | | Magna International, Inc. | | | 207,065 | |
| | 3,500 | | | MasTec, Inc.* | | | 157,045 | |
| | 2,225 | | | United Rentals, Inc.* | | | 331,614 | |
| | | | | | | | 888,447 | |
| | | | | | | | | |
| | | | | Technology-20.39% | | | | |
| | 75 | | | Alphabet, Inc., Class A* | | | 106,354 | |
| | 1,575 | | | Amgen, Inc. | | | 371,479 | |
See Notes to Financial Statements.
| 18 | www.jamesinvestment.com |
| James Aggressive Allocation Fund | Schedule of Investments |
June 30, 2020
| Shares or Principal Amount | | Value |
| | | | | Technology (continued) | | | | |
| | 1,500 | | | Apple, Inc. | | $ | 547,200 | |
| | 1,550 | | | Arrow Electronics, Inc.* | | | 106,469 | |
| | 1,925 | | | Cabot Microelectronics Corp. | | | 268,614 | |
| | 5,000 | | | Cisco Systems, Inc. | | | 233,200 | |
| | 5,875 | | | Intel Corp. | | | 351,501 | |
| | 1,610 | | | International Business Machines Corp. | | | 194,440 | |
| | 1,425 | | | KLA Corp. | | | 277,134 | |
| | 950 | | | Lockheed Martin Corp. | | | 346,674 | |
| | 3,650 | | | Logitech International SA | | | 238,053 | |
| | 2,525 | | | Microsoft Corp. | | | 513,863 | |
| | 1,675 | | | Motorola Solutions, Inc. | | | 234,718 | |
| | 725 | | | Northrop Grumman Corp. | | | 222,894 | |
| | 1,175 | | | Visa, Inc., Class A | | | 226,975 | |
| | | | | | | | 4,239,568 | |
| | | | | | | | | |
| | | | | Utilities-4.79% | | | | |
| | 6,875 | | | AT&T, Inc. | | | 207,831 | |
| | 2,250 | | | Entergy Corp. | | | 211,072 | |
| | 4,200 | | | FirstEnergy Corp. | | | 162,876 | |
| | 6,155 | | | NRG Energy, Inc. | | | 200,407 | |
| | 3,875 | | | Verizon Communications, Inc. | | | 213,629 | |
| | | | | | | | 995,815 | |
| | | | | | | | | |
| TOTAL COMMON STOCKS | | | | |
| (Cost $11,417,158) | | | 12,240,819 | |
| Shares or Principal Amount | | | Value | |
| EXCHANGE TRADED FUNDS-7.47% | | | | |
| | 4,310 | | | ARK Genomic Revolution ETF* | | | 224,809 | |
| | 2,500 | | | Communication Services Select Sector SPDR® Fund | | | 135,100 | |
| | 16,125 | | | iShares® Gold Trust* | | | 273,964 | |
| | 5,600 | | | iShares® MSCI Emerging Markets ETF | | | 223,944 | |
| | 7,170 | | | SPDR® Bloomberg Barclays Convertible Securities ETF | | | 433,785 | |
| | 2,500 | | | Technology Select Sector SPDR® Fund | | | 261,225 | |
| | | | | | | | | |
| TOTAL EXCHANGE TRADED FUNDS | | | | |
| (Cost $1,493,024) | | | 1,552,827 | |
| Shares or Principal Amount | | | Value | |
| CORPORATE BONDS-4.57% | | | | |
| | | | | Consumer, Cyclical-2.52% | | | | |
| $ | 500,000 | | | Starbucks Corp., 2.550%, 11/15/30 | | | 524,340 | |
| | | | | | | | | |
| | | | | Financial-1.80% | | | | |
| | 250,000 | | | Citigroup, Inc., 3.875%, 3/26/25 | | | 272,303 | |
| | 100,000 | | | Wells Fargo & Co., 2.000%, 5/15/25 | | | 100,773 | |
| | | | | | | | 373,076 | |
| | | | | Industrial-0.25% | | | | |
| | 50,000 | | | General Electric Co., 2.700%, 10/9/22 | | | 51,954 | |
| | | | | | | | | |
| TOTAL CORPORATE BONDS | | | | |
| (Cost $913,631) | | | 949,370 | |
See Notes to Financial Statements.
| Annual Report | June 30, 2020 | 19 |
| Schedule of Investments | James Aggressive Allocation Fund |
June 30, 2020
| Shares or Principal Amount | | Value |
| U.S. GOVERNMENT AGENCIES-4.81% | | | | |
| | | Federal Farm Credit Banks Funding Corp.-4.81% | | | | |
| $ | 500,000 | | 0.950%, 11/5/25 | | $ | 500,018 | |
| 500,000 | | 0.930%, 11/26/25 | | | 500,088 | |
| | | | | | 1,000,106 | |
| TOTAL U.S. GOVERNMENT AGENCIES | | | | |
| (Cost $1,000,000) | | | 1,000,106 | |
| Shares or Principal Amount | | | Value | |
| U.S. TREASURY BONDS & NOTES-22.82% | | | | |
| | | U.S. Treasury Bonds-13.93% | | | | |
| $ | 1,000,000 | | 2.625%, 11/15/20 | | | 1,009,102 | |
| 1,200,000 | | 2.625%, 2/15/29 | | | 1,406,063 | |
| 400,000 | | 2.250%, 8/15/49 | | | 480,812 | |
| | | | | | 2,895,977 | |
| | | U.S. Treasury Notes-7.08% | | | | |
| 950,000 | | 1.375%, 9/15/20 | | | 952,342 | |
| 500,000 | | 1.125%, 2/28/25 | | | 520,039 | |
| | | | | | 1,472,381 | |
| | | United States Treasury Inflation Indexed Bonds-1.81% | | | | |
| 369,792 | | 0.625%, 7/15/21 | | | 376,588 | |
| | | | | | | |
| TOTAL U.S. TREASURY BONDS & NOTES | | | | |
| (Cost $4,514,458) | | | 4,744,946 | |
| Shares or Principal Amount | | | Value | |
| SHORT TERM INVESTMENTS-1.34% | | | | |
| | | Mutual Fund-1.34% | | | | |
| | 279,417 | | First American Treasury Obligations Fund, Class X, 7-Day Yield 0.086% | | | 279,417 | |
| | | | | | | |
| TOTAL SHORT TERM INVESTMENTS | | | | |
| (Cost $279,417) | | | 279,417 | |
| | | | | | | |
| TOTAL INVESTMENT SECURITIES-99.87% | | | | |
| (Cost $19,617,688) | | | 20,767,485 | |
| OTHER ASSETS IN EXCESS OF LIABILITIES-0.13% | | | 27,533 | |
| NET ASSETS-100.00% | | $ | 20,795,018 | |
For Fund compliance purposes, the Fund's industry classifications refer to any one or more of the industry sub-classifications used by one or more widely recognized market indexes or ratings group indexes, and/or as defined by Fund management. Those definitions may not apply for purposes of this report, which may combine industry sub-classifications for reporting ease. Industries are shown as a percentage of net assets.
| * | Non-income producing security. |
See Notes to Financial Statements.
| 20 | www.jamesinvestment.com |
| James Advantage Funds | Statements of Assets and Liabilities |
June 30, 2020
| | | James Balanced: Golden Rainbow Fund | | | James Small Cap Fund | | | James Micro Cap Fund | | | James Aggressive Allocation Fund | |
| ASSETS: | | | | | | | | | | | | |
| | | | | | | | | | | | | |
| Investment securities: | | | | | | | | | | | | | | | | |
| At cost | | $ | 622,060,889 | | | $ | 28,699,621 | | | $ | 19,664,386 | | | $ | 19,617,688 | |
| At value | | $ | 699,702,603 | | | $ | 28,991,745 | | | $ | 21,671,377 | | | $ | 20,767,485 | |
| Dividends and interest receivable | | | 2,506,002 | | | | 51,000 | | | | 23,009 | | | | 43,988 | |
| Receivable for securities sold | | | 6,135,385 | | | | – | | | | – | | | | – | |
| Receivable for capital shares sold | | | 27,729 | | | | 228 | | | | 481 | | | | – | |
| Other assets | | | 34,079 | | | | – | | | | – | | | | – | |
| Total Assets | | | 708,405,798 | | | | 29,042,973 | | | | 21,694,867 | | | | 20,811,473 | |
| | | | | | | | | | | | | | | | | |
| LIABILITIES: | | | | | | | | | | | | | | | | |
| | | | | | | | | | | | | | | | | |
| Payable for capital shares redeemed | | | 1,159,717 | | | | 1,509 | | | | – | | | | 402 | |
| Payable for securities purchased | | | 1,073,605 | | | | – | | | | 2,090,721 | | | | – | |
| Accrued expenses: | | | | | | | | | | | | | | | | |
| Management fees | | | 425,562 | | | | 29,487 | | | | 23,682 | | | | 16,053 | |
| 12b-1 distribution and service fees | | | 110,684 | | | | 5,993 | | | | – | | | | – | |
| Trustee fees | | | 1,211 | | | | – | | | | – | | | | – | |
| Other payables | | | 147,358 | | | | – | | | | – | | | | – | |
| Total Liabilities | | | 2,918,137 | | | | 36,989 | | | | 2,114,403 | | | | 16,455 | |
| Net Assets | | $ | 705,487,661 | | | $ | 29,005,984 | | | $ | 19,580,464 | | | $ | 20,795,018 | |
| | | | | | | | | | | | | | | | | |
| NET ASSETS CONSIST OF: | | | | | | | | | | | | | | | | |
| | | | | | | | | | | | | | | | | |
| Paid-in capital | | $ | 635,543,624 | | | $ | 35,601,554 | | | $ | 19,899,515 | | | $ | 22,401,874 | |
| Total Distributable Earnings | | | 69,944,037 | | | | (6,595,570 | ) | | | (319,051 | ) | | | (1,606,856 | ) |
| Net Assets | | $ | 705,487,661 | | | $ | 29,005,984 | | | $ | 19,580,464 | | | $ | 20,795,018 | |
| | | | | | | | | | | | | | | | | |
| PRICING OF RETAIL CLASS SHARES: | | | | | | | | | | | | | | | | |
| | | | | | | | | | | | | | | | | |
| Net assets | | $ | 534,314,353 | | | | N/A | | | | N/A | | | | N/A | |
| Shares of beneficial interest outstanding (unlimited number of shares authorized, no par) | | | 26,602,787 | | | | N/A | | | | N/A | | | | N/A | |
| Net assets value, offering price and redemption price per share | | $ | 20.08 | | | | N/A | | | | N/A | | | | N/A | |
| | | | | | | | | | | | | | | | | |
| PRICING OF INSTITUTIONAL CLASS SHARES: | | | | | | | | | | | | | | | | |
| | | | | | | | | | | | | | | | | |
| Net assets | | $ | 171,173,308 | | | | N/A | | | | N/A | | | | N/A | |
| Shares of beneficial interest outstanding (unlimited number of shares authorized, no par) | | | 8,635,350 | | | | N/A | | | | N/A | | | | N/A | |
| Net assets value, offering price and redemption price per share | | $ | 19.82 | | | | N/A | | | | N/A | | | | N/A | |
| | | | | | | | | | | | | | | | | |
| PRICING OF SHARES | | | | | | | | | | | | | | | | |
| | | | | | | | | | | | | | | | | |
| Net assets | | | N/A | | | $ | 29,005,984 | | | $ | 19,580,464 | | | $ | 20,795,018 | |
| Shares of beneficial interest outstanding (unlimited number of shares authorized, no par) | | | N/A | | | | 1,543,120 | | | | 1,538,589 | | | | 2,253,054 | |
| Net assets value, offering price and redemption price per share | | | N/A | | | $ | 18.80 | | | $ | 12.73 | | | $ | 9.23 | |
See Notes to Financial Statements.
| Annual Report | June 30, 2020 | 21 |
| Statements of Operations | James Advantage Funds |
For the Year Ended June 30, 2020
| | | James Balanced: Golden Rainbow Fund | | | James Small Cap Fund | | | James Micro Cap Fund | | | James Aggressive Allocation Fund | |
| INVESTMENT INCOME: | | | | | | | | | | | | |
| Dividends (Net of withholding taxes of $29,611, $1,399, $1,266 and $1,797, respectively) | | $ | 9,371,679 | | | $ | 716,970 | | | $ | 443,972 | | | $ | 366,809 | |
| Interest | | | 11,264,004 | | | | – | | | | 5,176 | | | | 116,864 | |
| Total Investment Income | | | 20,635,683 | | | | 716,970 | | | | 449,148 | | | | 483,673 | |
| EXPENSES: | | | | | | | | | | | | | | | | |
| Management fees | | | 6,275,780 | | | | 449,755 | | | | 347,568 | | | | 215,446 | |
| 12b-1 distribution and service fees - Retail Class | | | 1,621,883 | | | | – | | | | – | | | | – | |
| 12b-1 distribution and service fees | | | – | | | | 91,531 | | | | – | | | | – | |
| Administration fee | | | 513,707 | | | | – | | | | – | | | | – | |
| Transfer agent fee | | | 163,341 | | | | – | | | | – | | | | – | |
| Custodian fees | | | 68,509 | | | | – | | | | – | | | | – | |
| Professional fees | | | 179,989 | | | | – | | | | – | | | | – | |
| Trustee fees | | | 197,002 | | | | 7,899 | | | | 5,098 | | | | 4,541 | |
| Registration fees | | | 46,623 | | | | – | | | | – | | | | – | |
| Shareholder report printing and mailing | | | 82,787 | | | | – | | | | – | | | | – | |
| Other expenses | | | 92,876 | | | | – | | | | – | | | | – | |
| Total Expenses | | | 9,242,497 | | | | 549,185 | | | | 352,666 | | | | 219,987 | |
| Net Investment Income | | | 11,393,186 | | | | 167,785 | | | | 96,482 | | | | 263,686 | |
| REALIZED AND UNREALIZED GAIN/(LOSS) ON INVESTMENTS: | | | | | | | | | | | | | | | | |
| Net realized gain/(loss) from: | | | | | | | | | | | | | | | | |
| Investments | | | 108,227 | | | | (4,498,039 | ) | | | (2,129,133 | ) | | | (2,408,560 | ) |
| Foreign currency transactions | | | (1,142 | ) | | | (24 | ) | | | – | | | | – | |
| Total realized gain/(loss) | | | 107,085 | | | | (4,498,063 | ) | | | (2,129,133 | ) | | | (2,408,560 | ) |
| Net change in unrealized appreciation/(depreciation) on investments | | | (17,921,747 | ) | | | (3,226,659 | ) | | | (2,592,497 | ) | | | 196,503 | |
| Net change in unrealized depreciation on foreign currency translation | | | (93 | ) | | | – | | | | – | | | | – | |
| Total change in unrealized appreciation/(depreciation) | | | (17,921,840 | ) | | | (3,226,659 | ) | | | (2,592,497 | ) | | | 196,503 | |
| Net Realized and Unrealized Loss on Investments | | | (17,814,755 | ) | | | (7,724,722 | ) | | | (4,721,630 | ) | | | (2,212,057 | ) |
| Net Decrease in Net Assets Resulting from Operations | | $ | (6,421,569 | ) | | $ | (7,556,937 | ) | | $ | (4,625,148 | ) | | $ | (1,948,371 | ) |
See Notes to Financial Statements.
| 22 | www.jamesinvestment.com |
| James Balanced: Golden Rainbow Fund | Statements of Changes in Net Assets |
| | | For the Year Ended June 30, 2020 | | | For the Year Ended June 30, 2019 | |
| FROM OPERATIONS: | | | | | | | | |
| | | | | | | | | |
| Net investment income | | $ | 11,393,186 | | | $ | 19,251,822 | |
| Net realized gain | | | 107,085 | | | | 63,697,199 | |
| Net change in unrealized depreciation | | | (17,921,840 | ) | | | (127,714,218 | ) |
| Net decrease in net assets resulting from operations | | | (6,421,569 | ) | | | (44,765,197 | ) |
| | | | | | | | | |
| DISTRIBUTIONS TO SHAREHOLDERS: | | | | | | | | |
| | | | | | | | | |
| Retail Class Shares: | | | | | | | | |
| From distributable earnings | | | (11,438,111 | ) | | | (103,981,188 | ) |
| Institutional Class Shares: | | | | | | | | |
| From distributable earnings | | | (4,402,203 | ) | | | (52,506,234 | ) |
| Decrease in net assets from distributions to shareholders | | | (15,840,314 | ) | | | (156,487,422 | ) |
| | | | | | | | | |
| CAPITAL SHARE TRANSACTIONS: | | | | | | | | |
| | | | | | | | | |
| Retail Class Shares: | | | | | | | | |
| Proceeds from shares sold | | | 27,111,849 | | | | 40,903,491 | |
| Net asset value of shares issued in reinvestment of distributions to shareholders | | | 11,140,768 | | | | 100,963,978 | |
| Payments for shares redeemed | | | (258,653,190 | ) | | | (755,368,263 | ) |
| Net Decrease in net assets from Retail Class capital share transactions | | | (220,400,573 | ) | | | (613,500,794 | ) |
| | | | | | | | | |
| Institutional Class Shares: | | | | | | | | |
| Proceeds from shares sold | | | 20,785,892 | | | | 61,904,385 | |
| Net asset value of shares issued in reinvestment of distributions to shareholders | | | 3,792,084 | | | | 43,120,244 | |
| Payments for shares redeemed | | | (152,450,448 | ) | | | (564,933,978 | ) |
| Net Decrease in net assets from Institutional Class capital share transactions | | | (127,872,472 | ) | | | (459,909,349 | ) |
| Total Decrease in Net Assets | | | (370,534,928 | ) | | | (1,274,662,762 | ) |
| | | | | | | | | |
| NET ASSETS: | | | | | | | | |
| | | | | | | | | |
| Beginning of year | | | 1,076,022,589 | | | | 2,350,685,351 | |
| End of year | | $ | 705,487,661 | | | $ | 1,076,022,589 | |
See Notes to Financial Statements.
| Annual Report | June 30, 2020 | 23 |
| Statements of Changes in Net Assets | James Balanced: Golden Rainbow Fund |
| | | For the Year Ended June 30, 2020 | | | For the Year Ended June 30, 2019 | |
| SUMMARY OF CAPITAL SHARE ACTIVITY: | | | | | | |
| | | | | | | |
| Retail Class Shares: | | | | | | | | |
| Shares sold | | | 1,306,726 | | | | 1,894,552 | |
| Shares issued in reinvestment of distributions to shareholders | | | 540,113 | | | | 5,033,571 | |
| Shares redeemed | | | (12,537,191 | ) | | | (34,580,038 | ) |
| Net Decrease in shares outstanding | | | (10,690,352 | ) | | | (27,651,915 | ) |
| Shares outstanding, beginning of year | | | 37,293,139 | | | | 64,945,054 | |
| Shares outstanding, end of year | | | 26,602,787 | | | | 37,293,139 | |
| | | | | | | | | |
| Institutional Class Shares: | | | | | | | | |
| Shares sold | | | 1,024,302 | | | | 2,902,339 | |
| Shares issued in reinvestment of distributions to shareholders | | | 186,405 | | | | 2,171,321 | |
| Shares redeemed | | | (7,468,833 | ) | | | (26,447,927 | ) |
| Net Decrease in shares outstanding | | | (6,258,126 | ) | | | (21,374,267 | ) |
| Shares outstanding, beginning of year | | | 14,893,476 | | | | 36,267,743 | |
| Shares outstanding, end of year | | | 8,635,350 | | | | 14,893,476 | |
See Notes to Financial Statements.
| 24 | www.jamesinvestment.com |
| James Small Cap Fund | Statements of Changes in Net Assets |
| | | For the Year Ended June 30, 2020 | | | For the Year Ended June 30, 2019 | |
| FROM OPERATIONS: | | | | | | | | |
| | | | | | | | | |
| Net investment income/(loss) | | $ | 167,785 | | | $ | (11,285 | ) |
| Net realized loss | | | (4,498,063 | ) | | | (2,557,416 | ) |
| Net change in unrealized depreciation | | | (3,226,659 | ) | | | (6,045,303 | ) |
| Net decrease in net assets resulting from operations | | | (7,556,937 | ) | | | (8,614,004 | ) |
| | | | | | | | | |
| DISTRIBUTIONS TO SHAREHOLDERS: | | | | | | | | |
| | | | | | | | | |
| From distributable earnings | | | – | | | | (3,818,168 | ) |
| Decrease in net assets from distributions to shareholders | | | – | | | | (3,818,168 | ) |
| | | | | | | | | |
| CAPITAL SHARE TRANSACTIONS: | | | | | | | | |
| | | | | | | | | |
| Proceeds from shares sold | | | 2,570,677 | | | | 6,554,991 | |
| Net asset value of shares issued in reinvestment of distributions to shareholders | | | – | | | | 3,744,085 | |
| Payments for shares redeemed | | | (8,273,579 | ) | | | (13,868,162 | ) |
| Net Decrease in net assets from capital share transactions | | | (5,702,902 | ) | | | (3,569,086 | ) |
| Total Decrease in Net Assets | | | (13,259,839 | ) | | | (16,001,258 | ) |
| | | | | | | | | |
| NET ASSETS: | | | | | | | | |
| | | | | | | | | |
| Beginning of year | | | 42,265,823 | | | | 58,267,081 | |
| End of year | | $ | 29,005,984 | | | $ | 42,265,823 | |
| | | | | | | | | |
| SUMMARY OF CAPITAL SHARE ACTIVITY: | | | | | | | | |
| | | | | | | | | |
| Shares sold | | | 119,537 | | | | 275,583 | |
| Shares issued in reinvestment of distributions to shareholders | | | – | | | | 166,182 | |
| Shares redeemed | | | (396,690 | ) | | | (555,154 | ) |
| Net Decrease in shares outstanding | | | (277,153 | ) | | | (113,389 | ) |
| Shares outstanding, beginning of year | | | 1,820,273 | | | | 1,933,662 | |
| Shares outstanding, end of year | | | 1,543,120 | | | | 1,820,273 | |
See Notes to Financial Statements.
| Annual Report | June 30, 2020 | 25 |
| Statements of Changes in Net Assets | James Micro Cap Fund |
| | | For the Year Ended June 30, 2020 | | | For the Year Ended June 30, 2019 | |
| FROM OPERATIONS: | | | | | | | | |
| | | | | | | | | |
| Net investment income | | $ | 96,482 | | | $ | 14,147 | |
| Net realized gain/(loss) | | | (2,129,133 | ) | | | 875,333 | |
| Net change in unrealized depreciation | | | (2,592,497 | ) | | | (2,463,301 | ) |
| Net decrease in net assets resulting from operations | | | (4,625,148 | ) | | | (1,573,821 | ) |
| | | | | | | | | |
| DISTRIBUTIONS TO SHAREHOLDERS: | | | | | | | | |
| | | | | | | | | |
| From distributable earnings | | | (880,621 | ) | | | (1,453,635 | ) |
| Decrease in net assets from distributions to shareholders | | | (880,621 | ) | | | (1,453,635 | ) |
| | | | | | | | | |
| CAPITAL SHARE TRANSACTIONS: | | | | | | | | |
| | | | | | | | | |
| Proceeds from shares sold | | | 1,113,550 | | | | 3,717,034 | |
| Net asset value of shares issued in reinvestment of distributions to shareholders | | | 877,987 | | | | 1,446,514 | |
| Payments for shares redeemed, net of redemption fee | | | (3,505,536 | ) | | | (4,340,557 | ) |
| Net Increase/(Decrease) in net assets from capital share transactions | | | (1,513,999 | ) | | | 822,991 | |
| Total Decrease in Net Assets | | | (7,019,768 | ) | | | (2,204,465 | ) |
| | | | | | | | | |
| NET ASSETS: | | | | | | | | |
| | | | | | | | | |
| Beginning of year | | | 26,600,232 | | | | 28,804,697 | |
| End of year | | $ | 19,580,464 | | | $ | 26,600,232 | |
| | | | | | | | | |
| SUMMARY OF CAPITAL SHARE ACTIVITY: | | | | | | | | |
| | | | | | | | | |
| Shares sold | | | 76,686 | | | | 230,976 | |
| Shares issued in reinvestment of distributions to shareholders | | | 53,384 | | | | 102,372 | |
| Shares redeemed | | | (262,319 | ) | | | (273,883 | ) |
| Net Increase/(Decrease) in shares outstanding | | | (132,249 | ) | | | 59,465 | |
| Shares outstanding, beginning of year | | | 1,670,838 | | | | 1,611,373 | |
| Shares outstanding, end of year | | | 1,538,589 | | | | 1,670,838 | |
See Notes to Financial Statements.
| 26 | www.jamesinvestment.com |
| James Aggressive Allocation Fund | Statements of Changes in Net Assets |
| | | For the Year Ended June 30, 2020 | | | For the Year Ended June 30, 2019 | |
| FROM OPERATIONS: | | | | | | | | |
| | | | | | | | | |
| Net investment income | | $ | 263,686 | | | $ | 151,662 | |
| Net realized loss | | | (2,408,560 | ) | | | (384,977 | ) |
| Net change in unrealized appreciation/(depreciation) | | | 196,503 | | | | (46,603 | ) |
| Net decrease in net assets resulting from operations | | | (1,948,371 | ) | | | (279,918 | ) |
| | | | | | | | | |
| DISTRIBUTIONS TO SHAREHOLDERS: | | | | | | | | |
| | | | | | | | | |
| From distributable earnings | | | (245,700 | ) | | | (96,369 | ) |
| Decrease in net assets from distributions to shareholders | | | (245,700 | ) | | | (96,369 | ) |
| | | | | | | | | |
| CAPITAL SHARE TRANSACTIONS: | | | | | | | | |
| | | | | | | | | |
| Proceeds from shares sold | | | 2,170,346 | | | | 13,046,174 | |
| Net asset value of shares issued in reinvestment of distributions to shareholders | | | 244,861 | | | | 96,255 | |
| Payments for shares redeemed | | | (2,361,900 | ) | | | (819,632 | ) |
| Net Increase in net assets from capital share transactions | | | 53,307 | | | | 12,322,797 | |
| Total Increase/(Decrease) in Net Assets | | | (2,140,764 | ) | | | 11,946,510 | |
| | | | | | | | | |
| NET ASSETS: | | | | | | | | |
| | | | | | | | | |
| Beginning of year | | | 22,935,782 | | | | 10,989,272 | |
| End of year | | $ | 20,795,018 | | | $ | 22,935,782 | |
| | | | | | | | | |
| SUMMARY OF CAPITAL SHARE ACTIVITY: | | | | | | | | |
| | | | | | | | | |
| Shares sold | | | 209,430 | | | | 1,288,855 | |
| Shares issued in reinvestment of distributions to shareholders | | | 23,100 | | | | 10,350 | |
| Shares redeemed | | | (228,978 | ) | | | (80,353 | ) |
| Net Increase in shares outstanding | | | 3,552 | | | | 1,218,852 | |
| Shares outstanding, beginning of year | | | 2,249,502 | | | | 1,030,650 | |
| Shares outstanding, end of year | | | 2,253,054 | | | | 2,249,502 | |
See Notes to Financial Statements.
| Annual Report | June 30, 2020 | 27 |
| Financial Highlights | James Balanced: Golden Rainbow Fund – Retail Class |
For a share outstanding throughout the years indicated.
| | | For the
Year Ended
June 30, 2020 | | | For the
Year Ended
June 30, 2019 | | | For the
Year Ended
June 30, 2018 | | | For the
Year Ended
June 30, 2017 | | | For the
Year Ended
June 30, 2016 | |
| Net asset value - beginning of year | | $ | 20.69 | | | $ | 23.32 | | | $ | 24.70 | | | $ | 24.14 | | | $ | 24.96 | |
| Income/(Loss) from investment operations: | | | | | | | | | | | | | | | | | | | | |
| Net investment income(a) | | | 0.26 | | | | 0.25 | | | | 0.26 | | | | 0.25 | | | | 0.25 | |
| Net realized and unrealized gain/(loss) | | | (0.50 | ) | | | (0.64 | ) | | | 0.24 | | | | 0.68 | | | | (0.41 | ) |
| Total from investment operations | | | (0.24 | ) | | | (0.39 | ) | | | 0.50 | | | | 0.93 | | | | (0.16 | ) |
| | | | | | | | | | | | | | | | | | | | | |
| Less distributions: | | | | | | | | | | | | | | | | | | | | |
| From net investment income | | | (0.22 | ) | | | (0.29 | ) | | | (0.27 | ) | | | (0.28 | ) | | | (0.23 | ) |
| From net realized gain on investments | | | (0.15 | ) | | | (1.95 | ) | | | (1.61 | ) | | | (0.09 | ) | | | (0.43 | ) |
| Total distributions | | | (0.37 | ) | | | (2.24 | ) | | | (1.88 | ) | | | (0.37 | ) | | | (0.66 | ) |
| Paid-in capital from redemption fees | | | – | | | | – | | | | – | | | | 0.00 | (b) | | | – | |
| Net asset value at end of year | | $ | 20.08 | | | $ | 20.69 | | | $ | 23.32 | | | $ | 24.70 | | | $ | 24.14 | |
| | | | | | | | | | | | | | | | | | | | | |
| Total return | | | (1.18 | )% | | | (1.24 | )% | | | 1.87 | % | | | 3.92 | % | | | (0.64 | )% |
| | | | | | | | | | | | | | | | | | | | | |
| Net assets, end of year (in thousands) | | $ | 534,314 | | | $ | 771,733 | | | $ | 1,514,451 | | | $ | 2,163,786 | | | $ | 2,892,809 | |
| | | | | | | | | | | | | | | | | | | | | |
| Ratios/Supplemental Data: | | | | | | | | | | | | | | | | | | | | |
| Ratio of net expenses to average net assets | | | 1.13 | % | | | 1.06 | % | | | 0.99 | % | | | 0.96 | % | | | 0.96 | % |
| Ratio of net investment income to average net assets | | | 1.25 | % | | | 1.14 | % | | | 1.05 | % | | | 1.02 | % | | | 1.03 | % |
| Portfolio turnover rate | | | 36 | % | | | 71 | % | | | 75 | % | | | 46 | % | | | 46 | % |
| (a) | Calculated using the average shares method. |
| (b) | Amount rounds to less than $0.005 per share. |
See Notes to Financial Statements.
| 28 | www.jamesinvestment.com |
| James Balanced: Golden Rainbow Fund – Institutional Class | Financial Highlights |
For a share outstanding throughout the years indicated.
| | | For the
Year Ended
June 30, 2020 | | | For the
Year Ended
June 30, 2019 | | | For the
Year Ended
June 30, 2018 | | | For the
Year Ended
June 30, 2017 | | | For the
Year Ended
June 30, 2016 | |
| Net asset value - beginning of year | | $ | 20.43 | | | $ | 23.06 | | | $ | 24.44 | | | $ | 23.89 | | | $ | 24.72 | |
| Income/(Loss) from investment operations: | | | | | | | | | | | | | | | | | | | | |
| Net investment income(a) | | | 0.31 | | | | 0.30 | | | | 0.31 | | | | 0.31 | | | | 0.31 | |
| Net realized and unrealized gain/(loss) | | | (0.50 | ) | | | (0.63 | ) | | | 0.25 | | | | 0.68 | | | | (0.42 | ) |
| Total from investment operations | | | (0.19 | ) | | | (0.33 | ) | | | 0.56 | | | | 0.99 | | | | (0.11 | ) |
| | | | | | | | | | | | | | | | | | | | | |
| Less distributions: | | | | | | | | | | | | | | | | | | | | |
| From net investment income | | | (0.27 | ) | | | (0.35 | ) | | | (0.33 | ) | | | (0.35 | ) | | | (0.29 | ) |
| From net realized gain on investments | | | (0.15 | ) | | | (1.95 | ) | | | (1.61 | ) | | | (0.09 | ) | | | (0.43 | ) |
| Total distributions | | | (0.42 | ) | | | (2.30 | ) | | | (1.94 | ) | | | (0.44 | ) | | | (0.72 | ) |
| Paid-in capital from redemption fees | | | – | | | | – | | | | – | | | | 0.00 | (b) | | | – | |
| Net asset value at end of year | | $ | 19.82 | | | $ | 20.43 | | | $ | 23.06 | | | $ | 24.44 | | | $ | 23.89 | |
| | | | | | | | | | | | | | | | | | | | | |
| Total return | | | (0.93 | )% | | | (0.99 | )% | | | 2.16 | % | | | 4.19 | % | | | (0.43 | )% |
| | | | | | | | | | | | | | | | | | | | | |
| Net assets, end of year (in thousands) | | $ | 171,173 | | | $ | 304,290 | | | $ | 836,234 | | | $ | 1,220,095 | | | $ | 1,512,751 | |
| | | | | | | | | | | | | | | | | | | | | |
| Ratios/Supplemental Data: | | | | | | | | | | | | | | | | | | | | |
| Ratio of net expenses to average net assets | | | 0.88 | % | | | 0.80 | % | | | 0.74 | % | | | 0.71 | % | | | 0.71 | % |
| Ratio of net investment income to average net assets | | | 1.51 | % | | | 1.38 | % | | | 1.30 | % | | | 1.27 | % | | | 1.28 | % |
| Portfolio turnover rate | | | 36 | % | | | 71 | % | | | 75 | % | | | 46 | % | | | 46 | % |
| (a) | Calculated using the average shares method. |
| (b) | Amount rounds to less than $0.005 per share. |
See Notes to Financial Statements.
| Annual Report | June 30, 2020 | 29 |
| Financial Highlights | James Small Cap Fund |
For a share outstanding throughout the years indicated.
| | | For the
Year Ended
June 30, 2020 | | | For the
Year Ended
June 30, 2019 | | | For the
Year Ended
June 30, 2018 | | | For the
Year Ended
June 30, 2017 | | | For the
Year Ended
June 30, 2016 | |
| Net asset value - beginning of year | | $ | 23.22 | | | $ | 30.13 | | | $ | 33.96 | | | $ | 30.64 | | | $ | 33.47 | |
| Income/(Loss) from investment operations: | | | | | | | | | | | | | | | | | | | | |
| Net investment income/(loss)(a) | | | 0.10 | | | | (0.01 | ) | | | (0.10 | ) | | | 0.21 | | | | 0.17 | |
| Net realized and unrealized gain/(loss) | | | (4.52 | ) | | | (4.76 | ) | | | 3.82 | | | | 3.28 | | | | (1.64 | ) |
| Total from investment operations | | | (4.42 | ) | | | (4.77 | ) | | | 3.72 | | | | 3.49 | | | | (1.47 | ) |
| | | | | | | | | | | | | | | | | | | | | |
| Less distributions: | | | | | | | | | | | | | | | | | | | | |
| From net investment income | | | – | | | | – | | | | (0.19 | ) | | | (0.17 | ) | | | (0.12 | ) |
| From net realized gain on investments | | | – | | | | (2.14 | ) | | | (7.36 | ) | | | – | | | | (1.24 | ) |
| Total distributions | | | – | | | | (2.14 | ) | | | (7.55 | ) | | | (0.17 | ) | | | (1.36 | ) |
| Net asset value at end of year | | $ | 18.80 | | | $ | 23.22 | | | $ | 30.13 | | | $ | 33.96 | | | $ | 30.64 | |
| | | | | | | | | | | | | | | | | | | | | |
| Total return | | | (19.04 | )% | | | (15.63 | )% | | | 11.41 | % | | | 11.36 | % | | | (4.62 | )% |
| | | | | | | | | | | | | | | | | | | | | |
| Net assets, end of year (in thousands) | | $ | 29,006 | | | $ | 42,266 | | | $ | 58,267 | | | $ | 67,603 | | | $ | 84,226 | |
| | | | | | | | | | | | | | | | | | | | | |
| Ratios/Supplemental Data: | | | | | | | | | | | | | | | | | | | | |
| Ratio of net expenses to average net assets | | | 1.50 | % | | | 1.50 | % | | | 1.50 | % | | | 1.50 | % | | | 1.50 | % |
| Ratio of net investment income/(loss) to average net assets | | | 0.46 | % | | | (0.02 | )% | | | (0.32 | )% | | | 0.62 | % | | | 0.55 | % |
| Portfolio turnover rate | | | 35 | % | | | 75 | % | | | 124 | % | | | 129 | % | | | 57 | % |
| (a) | Calculated using the average shares method. |
See Notes to Financial Statements.
| 30 | www.jamesinvestment.com |
| James Micro Cap Fund | Financial Highlights |
For a share outstanding throughout the years indicated.
| | | For the
Year Ended
June 30, 2020 | | | For the
Year Ended
June 30, 2019 | | | For the
Year Ended
June 30, 2018 | | | For the
Year Ended
June 30, 2017 | | | For the
Year Ended
June 30, 2016 | |
| Net asset value - beginning of year | | $ | 15.92 | | | $ | 17.88 | | | $ | 17.27 | | | $ | 15.03 | | | $ | 15.11 | |
| Income/(Loss) from investment operations: | | | | | | | | | | | | | | | | | | | | |
| Net investment income/(loss)(a) | | | 0.06 | | | | 0.01 | | | | (0.04 | ) | | | 0.04 | | | | (0.04 | ) |
| Net realized and unrealized gain/(loss) | | | (2.70 | ) | | | (1.06 | ) | | | 1.99 | | | | 2.20 | | | | (0.06 | ) |
| Total from investment operations | | | (2.64 | ) | | | (1.05 | ) | | | 1.95 | | | | 2.24 | | | | (0.10 | ) |
| | | | | | | | | | | | | | | | | | | | | |
| Less distributions: | | | | | | | | | | | | | | | | | | | | |
| From net investment income | | | (0.04 | ) | | | – | | | | (0.06 | ) | | | – | | | | (0.01 | ) |
| From net realized gain on investments | | | (0.51 | ) | | | (0.91 | ) | | | (1.29 | ) | | | – | | | | – | |
| Total distributions | | | (0.55 | ) | | | (0.91 | ) | | | (1.35 | ) | | | – | | | | (0.01 | ) |
| Paid-in capital from redemption fees | | | 0.00 | (b) | | | 0.00 | (b) | | | 0.01 | | | | 0.00 | (b) | | | 0.03 | |
| Net asset value at end of year | | $ | 12.73 | | | $ | 15.92 | | | $ | 17.88 | | | $ | 17.27 | | | $ | 15.03 | |
| | | | | | | | | | | | | | | | | | | | | |
| Total return | | | (17.38 | )% | | | (5.25 | )% | | | 11.62 | % | | | 14.90 | % | | | (0.44 | )% |
| | | | | | | | | | | | | | | | | | | | | |
| Net assets, end of year (in thousands) | | $ | 19,580 | | | $ | 26,600 | | | $ | 28,805 | | | $ | 31,809 | | | $ | 26,515 | |
| | | | | | | | | | | | | | | | | | | | | |
| Ratios/Supplemental Data: | | | | | | | | | | | | | | | | | | | | |
| Ratio of net expenses to average net assets | | | 1.50 | % | | | 1.50 | % | | | 1.50 | % | | | 1.50 | % | | | 1.50 | % |
| Ratio of net investment income/(loss) to average net assets | | | 0.41 | % | | | 0.05 | % | | | (0.22 | )% | | | 0.23 | % | | | (0.24 | )% |
| Portfolio turnover rate | | | 35 | % | | | 65 | % | | | 37 | % | | | 97 | % | | | 44 | % |
| (a) | Calculated using the average shares method. |
| (b) | Amount rounds to less than $0.005 per share. |
See Notes to Financial Statements.
| Annual Report | June 30, 2020 | 31 |
| Financial Highlights | James Aggressive Allocation Fund |
For a share outstanding throughout the years indicated.
| | | For the
Year Ended
June 30, 2020 | | | For the
Year Ended
June 30, 2019 | | | For the
Year Ended
June 30, 2018 | | | For the
Year Ended
June 30, 2017 | | | For the
Year Ended
June 30, 2016(a) | |
| Net asset value - beginning of year | | $ | 10.20 | | | $ | 10.66 | | | $ | 10.00 | | | $ | 9.47 | | | $ | 10.00 | |
| Income/(Loss) from investment operations: | | | | | | | | | | | | | | | | | | | | |
| Net investment income(b) | | | 0.12 | | | | 0.13 | | | | 0.10 | | | | 0.09 | | | | 0.07 | |
| Net realized and unrealized gain/(loss) | | | (0.98 | ) | | | (0.50 | ) | | | 0.64 | | | | 0.53 | | | | (0.57 | ) |
| Total from investment operations | | | (0.86 | ) | | | (0.37 | ) | | | 0.74 | | | | 0.62 | | | | (0.50 | ) |
| | | | | | | | | | | | | | | | | | | | | |
| Less distributions: | | | | | | | | | | | | | | | | | | | | |
| From net investment income | | | (0.11 | ) | | | (0.09 | ) | | | (0.08 | ) | | | (0.09 | ) | | | (0.03 | ) |
| Total distributions | | | (0.11 | ) | | | (0.09 | ) | | | (0.08 | ) | | | (0.09 | ) | | | (0.03 | ) |
| Net asset value at end of year | | $ | 9.23 | | | $ | 10.20 | | | $ | 10.66 | | | $ | 10.00 | | | $ | 9.47 | |
| | | | | | | | | | | | | | | | | | | | | |
| Total return | | | (8.60 | )% | | | (3.40 | )% | | | 7.36 | % | | | 6.54 | % | | | (4.98 | )% |
| | | | | | | | | | | | | | | | | | | | | |
| Net assets, end of year (in thousands) | | $ | 20,795 | | | $ | 22,936 | | | $ | 10,989 | | | $ | 9,954 | | | $ | 7,172 | |
| | | | | | | | | | | | | | | | | | | | | |
| Ratios/Supplemental Data: | | | | | | | | | | | | | | | | | | | | |
| Ratio of net expenses to average net assets | | | 0.98 | % | | | 0.98 | % | | | 0.98 | % | | | 0.98 | % | | | 0.98 | % |
| Ratio of net investment income to average net assets | | | 1.17 | % | | | 1.29 | % | | | 0.90 | % | | | 0.95 | % | | | 0.81 | % |
| Portfolio turnover rate | | | 80 | % | | | 69 | % | | | 219 | % | | | 198 | % | | | 218 | % |
| (a) | Fund commenced operations on July 1, 2015. |
| (b) | Calculated using the average shares method. |
See Notes to Financial Statements.
| 32 | www.jamesinvestment.com |
| James Advantage Funds | Notes to Financial Statements |
June 30, 2020
1. ORGANIZATION
James Advantage Funds (the “Trust”) is an open-end management investment company that was organized as an Ohio business trust on August 29, 1997. The Trust is registered under the Investment Company Act of 1940, as amended (the “1940 Act”). James Balanced: Golden Rainbow Fund, James Small Cap Fund, James Micro Cap Fund, and James Aggressive Allocation Fund are each a diversified series of the Trust (individually a “Fund,” collectively the “Funds”). Each class of James Balanced: Golden Rainbow Fund represents an interest in the same portfolio of investments and has the same rights, but differs primarily in distribution fees and shareholder features. The Retail Class shares are subject to distribution (12b-1) fees but have a lower minimum investment requirement and offer certain shareholder services not available to Institutional Class shareholders. The Institutional Class shares are not subject to distribution (12b-1) fees and are available only through investment advisers and bank trust departments that have made arrangements for shares of all of their clients investing in the Fund to be held in an omnibus account (as well as other investors that are approved by management of the Trust).
James Balanced: Golden Rainbow Fund seeks to provide total return through a combination of growth and income and preservation of capital in declining markets. The James Balanced: Golden Rainbow Fund seeks to achieve its objective by investing primarily in common stocks and/or debt securities that the Fund’s adviser, James Investment Research, Inc. (“James” or the “Adviser”), believes are undervalued.
James Small Cap Fund seeks to provide long-term capital appreciation. The James Small Cap Fund seeks to achieve its objective by investing primarily in common stocks of small capitalization companies. The Adviser defines small capitalization as those companies with market capitalizations at the time of purchase no larger than the stocks in the James Small Cap Fund’s benchmark, the Russell 2000® Index. As of June 30, 2020, the stock with the maximum capitalization in the Russell 2000® Index had a capitalization of $5.94 billion.
James Micro Cap Fund seeks to provide long-term capital appreciation. The James Micro Cap Fund seeks to achieve its objective by investing primarily in common stocks of micro capitalization companies. Micro capitalization companies are defined as those companies with market capitalizations at the time of purchase no larger than the stocks in the Russell Microcap® Index, including exchange traded funds (“ETFs”) that invest primarily in such securities. As of June 30, 2020, the stock with the maximum capitalization in the Russell Microcap® Index had a capitalization of $1.59 billion.
James Aggressive Allocation Fund seeks to provide total return through a combination of growth and income. Preservation of capital in declining markets is a secondary objective. The James Aggressive Allocation Fund will generally run equity allocations of 60% or higher and, therefore, could be more volatile than a more conservative fund that holds a smaller percentage of its assets in stocks. Due to its aggressive nature, the James Aggressive Allocation Fund will generally have a turnover ratio much higher than the James Balanced: Golden Rainbow Fund.
2. SIGNIFICANT ACCOUNTING POLICIES
The following is a summary of significant accounting policies followed by the Funds in preparation of their financial statements, in accordance with accounting principles generally accepted in the United States of America (“U.S. GAAP”). The Funds are considered an investment company for financial reporting purposes under U.S. GAAP.
Share Valuation
The net asset value per share of each Fund, other than the James Balanced: Golden Rainbow Fund, is calculated daily by dividing the total value of the Fund’s assets, less liabilities, by the number of shares outstanding. The net asset value per share of each class of shares of the James Balanced: Golden Rainbow Fund is calculated daily by dividing the total value of the Fund’s assets attributable to that class, less liabilities attributable to that class, by the number of outstanding shares of that class. The offering price and redemption price per share is equal to the net asset value per share, except that shares of the James Micro Cap Fund are subject to a redemption fee of 2% if redeemed within 180 days of purchase. Redemption fees received by the James Micro Cap Fund were $1,201 and $1,591 for the year ended June 30, 2020 and the year ended June 30, 2019, respectively. The redemption fee is reflected in the “Payment for shares redeemed, net of redemption fees” in the Statements of Changes in Net Assets.
Securities Valuation
Securities are valued at fair value. The Funds' portfolio securities are valued as of the close of the New York Stock Exchange (“NYSE”) (generally, 4:00 p.m., Eastern Time) on each day that the NYSE is open for business. Equity securities that are traded on any exchange, including closed-end funds and exchange-traded funds, are valued at the last quoted sale price on the exchange or market in which such securities are principally traded. Lacking a last sale price, a security is valued at its last bid price except when, in James’ opinion, the last bid price does not accurately reflect the current value of the security. Securities that are traded on the NASDAQ® over-the-counter market are valued at their NASDAQ® Official Closing Price (“NOCP”) for all NASDAQ® National Market (“NNM”) and NASDAQ® Capital Market® securities. When market quotations are not readily available, if an event occurs after the close of the trading market (but before the time as of which a Fund calculates its net asset value) that materially affects a security’s value, when James determines that the market quotation does not accurately reflect the current value or when a non-144A restricted security is being valued, that security will be valued at its fair value as determined in good faith in conformity with guidelines adopted by and subject to review of the Board of Trustees (the “Board”). Corporate bonds, U.S. government agencies, U.S. Treasury bonds & notes, foreign, and municipal bonds are generally valued at the mean between the closing bid and asked prices provided by an independent pricing service. The pricing services generally use market models that consider trade data, yields, spreads, quotations from dealers and active market makers, credit worthiness, market information of comparable securities, and other relevant security specific information. Asset backed/commercial mortgage backed securities are generally valued at the mean between the closing bid and asked prices provided by an independent pricing service. The pricing service generally uses models that consider trade data, prepayment, and default projections, benchmark yield and spread data and estimated cash flows of each tranche of the issuer. If the Adviser decides that a price provided by the pricing service does not accurately reflect the fair market value of the securities or when prices are not readily available from a pricing service, those securities will be priced at fair value as determined in good faith by the Adviser. Shares of open-end investment companies are valued at net asset value.
| Annual Report | June 30, 2020 | 33 |
| Notes to Financial Statements | James Advantage Funds |
June 30, 2020
For valuation purposes, quotations of foreign securities in a foreign currency are converted to U.S. dollar equivalents at the time of pricing the Funds. The values of foreign portfolio securities are generally based upon market quotations which, depending upon the exchange or market, may be last sale price, last bid price or the average of the last bid and asked prices as of, in each case, the close of the appropriate exchange or another designated time.
In accordance with the Trust’s good faith pricing guidelines, James is required to consider all appropriate factors relevant to the value of securities for which it has determined other pricing sources are not available or reliable as described above. There is no single standard for determining fair value, since fair value depends upon the circumstances of each individual case. As a general principle, the current fair value of an issue of securities being valued by the Adviser would appear to be the amount that the owner might reasonably expect to receive for them upon their current sale. Methods which are in accordance with this principle may, for example, be based on (i) a multiple of earnings, (ii) a discount from market of a similar freely traded security (including a derivative security or a basket of securities traded on other markets, exchanges or among dealers), or (iii) yield to maturity with respect to debt issues, or a combination of these and other methods.
Various inputs are used in determining the value of the Funds’ investments. These inputs are summarized in the three broad levels listed below:
| Level 1 - | Unadjusted quoted prices in active markets for identical, unrestricted assets or liabilities that a Fund has the ability to access at the measurement date; |
| Level 2 - | Quoted prices which are not active, quoted prices for similar assets or liabilities in active markets or inputs other than quoted prices that are observable (either directly or indirectly) for substantially the full term of the asset or liability; or |
| Level 3 - | Significant unobservable prices or inputs (including a Fund’s own assumptions in determining the fair value of investments) where there is little or no market activity for the asset or liability at the measurement date. |
The inputs or methodologies used for valuing securities are not necessarily an indication of the risk associated with investing in those securities.
| 34 | www.jamesinvestment.com |
| James Advantage Funds | Notes to Financial Statements |
June 30, 2020
The following is a summary of the inputs used to value the Funds’ investments as of June 30, 2020:
James Balanced: Golden Rainbow Fund
| | | Valuation Inputs | | | | |
| Investments in Securities at Value* | | Level 1 | | | Level 2 | | | Level 3 | | | Total | |
| Common Stocks | | $ | 279,509,204 | | | $ | – | | | $ | – | | | $ | 279,509,204 | |
| Exchange Traded Funds | | | 23,484,406 | | | | – | | | | – | | | | 23,484,406 | |
| Corporate Bonds | | | – | | | | 73,049,506 | | | | – | | | | 73,049,506 | |
| Municipal Bonds | | | – | | | | 19,193,332 | | | | – | | | | 19,193,332 | |
| U.S. Government Agencies | | | – | | | | 61,541,556 | | | | – | | | | 61,541,556 | |
| Mortgage Backed Securities | | | – | | | | 27,927,543 | | | | – | | | | 27,927,543 | |
| U.S. Treasury Bonds & Notes | | | 202,494,804 | | | | – | | | | – | | | | 202,494,804 | |
| Foreign Bonds | | | – | | | | 7,303,380 | | | | – | | | | 7,303,380 | |
| Short Term Investments | | | 5,198,872 | | | | – | | | | – | | | | 5,198,872 | |
| Total | | $ | 510,687,286 | | | $ | 189,015,317 | | | $ | – | | | $ | 699,702,603 | |
James Small Cap Fund
| | | Valuation Inputs | | | | |
| Investments in Securities at Value* | | Level 1 | | | Level 2 | | | Level 3 | | | Total | |
| Common Stocks | | $ | 27,316,832 | | | $ | – | | | $ | – | | | $ | 27,316,832 | |
| Short Term Investments | | | 1,674,913 | | | | – | | | | – | | | | 1,674,913 | |
| Total | | $ | 28,991,745 | | | $ | – | | | $ | – | | | $ | 28,991,745 | |
James Micro Cap Fund
| | | Valuation Inputs | | | | |
| Investments in Securities at Value* | | Level 1 | | | Level 2 | | | Level 3 | | | Total | |
| Common Stocks | | $ | 18,689,153 | | | $ | – | | | $ | – | | | $ | 18,689,153 | |
| Short Term Investments | | | 2,982,224 | | | | – | | | | – | | | | 2,982,224 | |
| Total | | $ | 21,671,377 | | | $ | – | | | $ | – | | | $ | 21,671,377 | |
James Aggressive Allocation Fund
| | | Valuation Inputs | | | | |
| Investments in Securities at Value* | | Level 1 | | | Level 2 | | | Level 3 | | | Total | |
| Common Stocks | | $ | 12,240,819 | | | $ | – | | | $ | – | | | $ | 12,240,819 | |
| Exchange Traded Funds | | | 1,552,827 | | | | – | | | | – | | | | 1,552,827 | |
| Corporate Bonds | | | – | | | | 949,370 | | | | – | | | | 949,370 | |
| U.S. Government Agencies | | | – | | | | 1,000,106 | | | | – | | | | 1,000,106 | |
| U.S. Treasury Bonds & Notes | | | 4,744,946 | | | | – | | | | – | | | | 4,744,946 | |
| Short Term Investments | | | 279,417 | | | | – | | | | – | | | | 279,417 | |
| Total | | $ | 18,818,009 | | | $ | 1,949,476 | | | $ | – | | | $ | 20,767,485 | |
| * | For detailed descriptions of sector and industry, see the accompanying Schedule of Investments. |
| Annual Report | June 30, 2020 | 35 |
| Notes to Financial Statements | James Advantage Funds |
June 30, 2020
Investment Transactions
Investment transactions are recorded on a trade date basis. Gains and losses are determined using the specific identification method, which liquidates all losses first, before any gains. Securities purchased or sold on a when-issued or delayed delivery basis may have extended settlement periods. Any securities so purchased are subject to market fluctuation during this period. The Funds will instruct its custodian to segregate assets in a separate account with a current value at least equal to the amount of its when-issued and delayed delivery purchase commitments. As of June 30, 2020, the Funds did not hold when-issued securities or delayed delivery purchase commitments.
Withholding taxes on foreign dividends have been provided for in accordance with the Trust’s understanding of the applicable country’s tax rules and rates.
Foreign Currency Translation
The market value of investment securities and other assets and liabilities denominated in foreign currencies are translated into U.S. dollars at the current exchange rate, provided by WM Reuters, at the close of each business day. Purchases and sales of securities, income receipts and expense payments are translated into U.S. dollars based at the exchange rate on the date of the transaction.
Reported net realized foreign exchange gains or losses arise from sales and maturities of short-term securities, sales of foreign currencies, currency gains or losses realized and between the trade and settlement dates on securities transactions, and the difference between the amounts of dividends, interest, and foreign withholding taxes recorded on the Funds’ books and the U.S. dollar equivalent of the amounts actually received or paid. Net unrealized foreign exchange gains and losses arise from the changes in the value of assets and liabilities including investments in securities at the reporting period, resulting from changes in the exchange rate. The portion of realized and unrealized gains or losses on investments due fluctuations in foreign currency exchange rates is not separately disclosed and is included in realized and unrealized gains or losses on investments, when applicable.
Investment Income
Dividend income is recorded on the ex-dividend date. Interest income is determined on the basis of interest accrued, adjusted for amortization of premiums and accretion of discounts on all debt securities. Amortization and accretion is calculated using the effective yield method.
Dividend income includes dividends earned on Real Estate Investment Trusts (“REITs”), which may include a return of capital. As such, important taxation issues may arise, which the Funds account for when information is provided by the issuing REIT.
Due to the actual character of dividends paid by REITs not being available until the end of the calendar year, the net investment income and long-term capital gains of the Funds can be different on the tax return compared to this Annual report. Substantial unanticipated levels of return of capital may affect the Funds’ earnings and profits from which distributions are made.
Distributions received from Limited Partnership investments of a Fund are usually recorded as a return of capital and are excluded from available income in the calculation of distributions paid by the Funds. Return of capital is recorded as a reduction to the cost of investments in the Statements of Assets and Liabilities and in the Schedule of Investments.
Dividends and Distributions to Shareholders
Net investment income, if any, is generally declared and distributed to shareholders of each Fund on at least an annual basis. Net realized capital gains from security transactions, if any, are distributed to shareholders not less frequently than annually. Furthermore, capital gains are distributed only to the extent they exceed available capital loss carryforwards. Distributions to shareholders of net investment income and net realized capital gains are recorded on the ex-dividend date. The amount and timing of distributions are determined in accordance with federal income tax regulations, which may differ from U.S. GAAP.
Allocation of Income and Expense
Investment income earned, realized capital gains and losses, and unrealized appreciation and depreciation for the James Balanced: Golden Rainbow Fund is allocated daily to each class of shares based upon its proportionate share of total net assets of the Fund. Class-specific expenses are charged directly to the class incurring the expense. Common expenses, which are not attributable to a specific class, are allocated daily to each class of shares based upon its proportionate share of total net assets of the Fund. The Adviser pays the expenses of each Fund, except for the James Balanced: Golden Rainbow Fund, and such expenses are not subject to recoupment by the Adviser. These expenses exclude the management fees, detailed in Note 4, brokerage fees and commissions, taxes, interest, fees and expenses of the non-interested person trustees, 12b-1 fees and extraordinary expenses. Expenses not directly billed to a particular Fund are allocated proportionally among all Funds daily in relation to net assets of each Fund or another reasonable measure.
Use of Estimates
The preparation of financial statements in conformity with U.S. GAAP requires management to make estimates and assumptions that affect the reported amounts of assets and liabilities and disclosure of contingent assets and liabilities at the date of the financial statements and the reported amounts of increases and decreases in net assets from operations during the reporting period. Actual results could differ from those estimates.
Epidemic and Pandemic Risk: Certain countries have been susceptible to epidemics, most recently COVID-19, which has been designated as a pandemic by world health authorities. The outbreak of such epidemics, together with any resulting restrictions on travel or quarantines imposed, could have a negative impact on the economy and business activity globally (including in the countries in which we invest), and thereby could adversely affect the performance of our investments. Furthermore, the rapid development of epidemics could preclude prediction as to their ultimate adverse impact on economic and market conditions, and, as a result, present material uncertainty and risk with respect to us and the performance of our investments.
Federal Income Taxes
The Funds generally intend to distribute all taxable income and capital gains to shareholders, if any, and to otherwise continue to comply with the requirements of Subchapter M of the Internal Revenue Code of 1986, as amended, (the “Code”) applicable to regulated investment companies. Therefore, no federal tax provision is required.
| 36 | www.jamesinvestment.com |
| James Advantage Funds | Notes to Financial Statements |
June 30, 2020
As of and during the year ended June 30, 2020, the Funds did not have a liability for any unrecognized tax benefits. The Funds file U.S. federal, state, and local tax returns as required. The Funds’ tax returns are subject to examination by the relevant tax authorities until expiration of the applicable statute of limitations, which is generally three years after the filing of the tax return for federal purposes and four years for most state returns. Tax returns for open years have incorporated no uncertain tax positions that require a provision for income taxes.
Reclassifications, which are determined in accordance with federal income tax regulations, result primarily from earnings and profits being distributed to shareholders on redemptions in the current year.
| | | James Balanced: Golden Rainbow Fund | | | James Small Cap Fund | | | James Micro Cap Fund | | | James Aggressive Allocation Fund | |
| Paid-in capital | | $ | 390,274 | | | $ | – | | | $ | – | | | $ | – | |
| Total Distributable Earnings | | | (390,274 | ) | | | – | | | | – | | | | – | |
As of June 30, 2020, the components of distributable earnings on a tax basis were as follows:
| | | James Balanced: Golden Rainbow Fund | | | James Small Cap Fund | | | James Micro Cap Fund | | | James Aggressive Allocation Fund | |
| Tax cost of portfolio investments | | $ | 622,535,056 | | | $ | 28,699,621 | | | $ | 19,665,360 | | | $ | 19,619,463 | |
| Gross unrealized appreciation | | $ | 87,485,095 | | | $ | 3,730,214 | | | $ | 4,084,099 | | | $ | 1,900,311 | |
| Gross unrealized depreciation | | | (10,317,548 | ) | | | (3,438,090 | ) | | | (2,078,082 | ) | | | (752,289 | ) |
| Net depreciation of foreign currency | | | (3 | ) | | | – | | | | – | | | | – | |
| Net unrealized appreciation | | | 77,167,544 | | | | 292,124 | | | | 2,006,017 | | | | 1,148,022 | |
| Accumulated capital losses | | | (7,223,507 | ) | | | (7,055,369 | ) | | | (2,357,000 | ) | | | (2,868,466 | ) |
| Undistributed ordinary income | | | – | | | | 167,675 | | | | 31,932 | | | | 113,588 | |
| Total | | $ | 69,944,037 | | | $ | (6,595,570 | ) | | $ | (319,051 | ) | | $ | (1,606,856 | ) |
The difference between the cost of portfolio investments on a tax basis and financial statement cost for the Funds is due primarily to the deferral of wash sale losses and to the differing treatment of certain investments under income tax regulations and U.S. GAAP.
The tax character of distributions paid for the year ended June 30, 2020 was as follows:
| | | James Balanced: Golden Rainbow Fund | | | James Small Cap Fund | | | James Micro Cap Fund | | | James Aggressive Allocation Fund | |
| Ordinary Income | | $ | 9,343,727 | | | $ | – | | | $ | 64,550 | | | $ | 245,700 | |
| Long-Term Capital Gains | | | 6,496,587 | | | | – | | | | 816,071 | | | | – | |
| Total | | $ | 15,840,314 | | | $ | – | | | $ | 880,621 | | | $ | 245,700 | |
The tax character of distributions paid for the year ended June 30, 2019 was as follows:
| | | James Balanced: Golden Rainbow Fund | | | James Small Cap Fund | | | James Micro Cap Fund | | | James Aggressive Allocation Fund | |
| Ordinary Income | | $ | 20,313,773 | | | $ | 749,518 | | | $ | – | | | $ | 96,369 | |
| Long-Term Capital Gains | | | 136,173,649 | | | | 3,068,650 | | | | 1,453,635 | | | | – | |
| Total | | $ | 156,487,422 | | | $ | 3,818,168 | | | $ | 1,453,635 | | | $ | 96,369 | |
| Annual Report | June 30, 2020 | 37 |
| Notes to Financial Statements | James Advantage Funds |
June 30, 2020
Capital Losses
Under the Code, Capital Losses are carried over to future tax years and will retain their character as either short-term or long-term capital losses. These losses do not include any late year capital losses (losses arising in the period from November 1st through June 30th) that the Funds have elected to defer for the current fiscal year. The Funds’ ability to utilize capital loss carryforwards in the future may be limited under the Code and related regulations based on the results of future transactions.
Capital losses carried forward to the next tax year were as follows:
| | | Short Term | | | Long Term | |
| James Small Cap Fund | | $ | 3,345,554 | | | $ | – | |
| James Aggressive Allocation Fund | | | 958,355 | | | | 5,070 | |
The Funds elect to defer to the year ending June 30, 2021 capital losses recognized during the period November 1, 2019 through June 30, 2020 in the amount of:
| | | Amount | |
| James Balanced: Golden Rainbow Fund | | $ | 7,223,507 | |
| James Small Cap Fund | | | 3,709,815 | |
| James Micro Cap Fund | | | 2,357,000 | |
| James Aggressive Allocation Fund | | | 1,905,041 | |
3. INVESTMENT TRANSACTIONS
Purchases and sales (including maturities) of investments in long-term U.S. Government obligations for the year ended June 30, 2020 were as follows:
| | | Purchases | | | Sales | |
| James Balanced: Golden Rainbow Fund | | $ | 90,028,398 | | | $ | 262,446,715 | |
| James Micro Cap Fund | | | 0 | | | | 997,754 | |
| James Aggressive Allocation Fund | | | 5,598,794 | | | | 4,642,259 | |
Purchases and sales (including maturities) of investments in long-term securities other than U.S. Government Obligations for the year ended June 30, 2020 were as follows:
| | | Purchases | | | Sales | |
| James Balanced: Golden Rainbow Fund | | $ | 209,276,397 | | | $ | 331,322,146 | |
| James Small Cap Fund | | | 12,449,358 | | | | 18,175,778 | |
| James Micro Cap Fund | | | 7,519,664 | | | | 9,462,017 | |
| James Aggressive Allocation Fund | | | 13,765,886 | | | | 12,474,276 | |
4. MANAGEMENT FEE AND OTHER TRANSACTIONS WITH AFFILIATES
Investment Management Agreement
The Funds retain James to manage the Funds’ investments. The investment decisions for the Funds are made by a committee of James’ personnel, which is primarily responsible for the day-to-day management of each Fund’s portfolio and pursuant to separate management agreements between the Trust, on behalf of each Fund and the Adviser (the “Investment Management Agreements”).
The Funds pay James on a monthly basis at the annual rate set forth below of the Funds’ average daily net assets.
James Balanced: Golden Rainbow Fund
| Average Total Net Assets | Contractual Fee |
| Up to and including $500 million | 0.74% |
| Over $500 million and including $1 billion | 0.70% |
| Over $1 billion and including $2 billion | 0.65% |
| Over $2 billion | 0.60% |
James Small Cap Fund
| Average Total Net Assets | Contractual Fee |
| Up to and including $500 million | 1.25% |
| Over $500 million and including $1 billion | 1.20% |
| Over $1 billion and including $2 billion | 1.15% |
| Over $2 billion | 1.10% |
James Micro Cap Fund
| Average Total Net Assets | Contractual Fee |
| Up to and including $500 million | 1.50% |
| Over $500 million | 1.45% |
James Aggressive Allocation Fund
| Average Total Net Assets | Contractual Fee |
| Up to and including $500 million | 0.98% |
| Over $500 million and including $1 billion | 0.95% |
| Over $1 billion and including $2 billion | 0.90% |
| Over $2 billion | 0.85% |
Advisory fees for the James Small Cap Fund and James Micro Cap Fund are reduced by the fees and expenses of the non-interested trustees incurred by the applicable Fund. Under the Investment Management Agreement, the Adviser is responsible for the payment of all operating expenses of the James Small Cap Fund, James Micro Cap Fund, and James Aggressive Allocation Fund, except for brokerage fees and commissions, taxes, interest, fees and expenses of non-interested person trustees, 12b-1 expenses and extraordinary expenses. Adviser is not entitled to recoupment of such expenses.
| 38 | www.jamesinvestment.com |
| James Advantage Funds | Notes to Financial Statements |
June 30, 2020
Administrative Services Agreement
ALPS Fund Services, Inc. (“ALPS” or the “Administrator”) serves as administrator to the Funds. ALPS receives a monthly fee paid by James Balanced: Golden Rainbow Fund, for itself, and paid by James for the remaining Funds, subject to a minimum monthly fee. Pursuant to an administrative agreement, ALPS will provide operational services to the Funds including, but not limited to fund accounting and fund administration and generally assist in each Fund’s operations. Administration fees paid by the Funds for the year ended June 30, 2020 are disclosed in the Statements of Operations.
Transfer Agency and Services Agreement
ALPS, pursuant to a Transfer Agency and Services Agreement with the Trust, serves as transfer agent for the Funds. Under the Transfer Agency and Services Agreement, ALPS receives an annual minimum fee, a fee based upon the number of shareholder accounts and is also reimbursed for out-of-pocket expenses. These fees and reimbursements for out-of-pocket expenses are paid by James Balanced: Golden Rainbow Fund, for itself, and by James for the remaining Funds. Transfer agent fees paid by the Funds for the year ended June 30, 2020 are disclosed in the Statements of Operations.
Plans of Distribution
The James Balanced: Golden Rainbow Fund (Retail Class) and James Small Cap Fund have adopted a plan pursuant to Rule 12b-1 under the 1940 Act (collectively, the “Plans”) under which each Fund may incur expenses related to distribution of its shares and for services provided to shareholders. These expenses are reflected as 12b-1 distribution and service fees on the Statements of Operations. Payments under a Plan are made to the Adviser, which uses them to pay distribution and shareholder service expenses on behalf of and as agent of the Fund. The amount payable by the James Small Cap Fund and the Retail Class of the James Balanced: Golden Rainbow Fund, under its Plan is 0.25% of its average daily net assets for the year. The Plans are compensation plans, which means that payments are made to the Adviser regardless of 12b-1 expenses actually incurred. Therefore, payments under a Plan may exceed distribution and shareholder service expenses incurred pursuant to the Plan, and the Adviser is permitted to retain the excess. It is also possible that 12b-1 expenses paid by the Adviser for a period will exceed the payments received by the Adviser, in which case the Adviser may pay such excess expenses out of its own resources. Payments received by the Adviser under the Plans are in addition to the fees paid to the Adviser pursuant to the Management Agreements. The Plans require that the Adviser act in the Funds’ best interests in expending the payments it receives from the Funds and use payments solely for the purpose of paying distribution and shareholder services expenses on behalf of the Funds. The Funds’ distributor, ALPS Distributors, Inc., validates all payment amounts to be made to brokers that have properly executed dealer agreements with the Funds before the Adviser will make such payments.
Trustee Fees
Each Trustee who is not an officer or employee of the Adviser, or any of their affiliates (“Independent Trustees”) receives (1) a quarterly retainer of $7,900, (2) a per meeting fee for regularly scheduled meetings of $2,100, (3) an audit committee fee of $1,000 paid to the audit committee chair and $500 to the other Independent Trustees, (4) $2,100 for any special meeting held outside of a regularly scheduled board meeting that the Trustee is required to attend in person, (5) $210 for any special telephonic meetings held outside of a regularly scheduled board meeting, and (6) reimbursement for all reasonable out-of-pocket expenses relating to attendance at meetings. Such fees are presented on the Statements of Operations as Trustee Fees.
5. COMMITMENTS AND CONTINGENCIES
The Funds indemnify the Trust’s officers and trustees for certain liabilities that might arise from their performance of their duties to the Funds. Additionally, in the normal course of business, the Funds enter into contracts that contain a variety of representations and warranties and that provide general indemnifications. The Funds’ maximum exposure under these arrangements is unknown, as this would involve future claims that may be made against the Funds that have not yet occurred. However, based on experience, the Funds expect the risk of loss to be remote.
6. LINE OF CREDIT
Each Fund has a revolving line of credit agreement with U.S. Bank, N.A. (the “Bank”). Borrowings under these arrangements are secured by investments held in the Funds’ portfolios as notated on the Schedules of Investments and bear interest at the Bank’s prime rate. During the year ended June 30, 2020, the Funds did not utilize their line of credit. Each Fund’s line of credit agreement expired on July 8, 2020 and was renewed for one year.
The terms of the agreements can be characterized as follows:
| Fund | | Maximum Balance Available | | | Interest Rate | | Expiration Date |
| James Balanced: Golden Rainbow Fund | | $ | 35,000,000 | | | Prime Rate* | | July 7, 2021 |
| James Small Cap Fund | | $ | 1,250,000 | | | Prime Rate* | | July 7, 2021 |
| James Micro Cap Fund | | $ | 750,000 | | | Prime Rate* | | July 7, 2021 |
| James Aggressive Allocation Fund | | $ | 500,000 | | | Prime Rate* | | July 7, 2021 |
| * | The rate at which the Bank announces as its prime lending rate. |
| Annual Report | June 30, 2020 | 39 |
| Report of Independent Registered Public Accounting Firm | James Advantage Funds |
To the shareholders and the Board of Trustees of James Advantage Funds
Opinion on the Financial Statements and Financial Highlights
We have audited the accompanying statements of assets and liabilities of James Advantage Funds comprising the James Balanced: Golden Rainbow Fund, James Small Cap Fund, James Micro Cap Fund, and James Aggressive Allocation Fund (the "Funds"), including the schedules of investments, as of June 30, 2020, the related statements of operations for the year then ended, the statements of changes in net assets for each of the two years in the period then ended, and the financial highlights for each of the five years in the period then ended for the Funds, and the related notes.
In our opinion, the financial statements present fairly, in all material respects, the financial position of the Funds as of June 30, 2020, and the results of their operations for the year then ended, the changes in their net assets for each of the two years in the period then ended, and the financial highlights for each of the five years in the period then ended in conformity with accounting principles generally accepted in the United States of America.
Basis for Opinion
These financial statements and financial highlights are the responsibility of the Funds’ management. Our responsibility is to express an opinion on the Funds’ financial statements and financial highlights based on our audits. We are a public accounting firm registered with the Public Company Accounting Oversight Board (United States) (PCAOB) and are required to be independent with respect to the Funds in accordance with the U.S. federal securities laws and the applicable rules and regulations of the Securities and Exchange Commission and the PCAOB.
We conducted our audits in accordance with the standards of the PCAOB. Those standards require that we plan and perform the audit to obtain reasonable assurance about whether the financial statements and financial highlights are free of material misstatement, whether due to error or fraud. The Funds are not required to have, nor were we engaged to perform, an audit of their internal control over financial reporting. As part of our audits, we are required to obtain an understanding of internal control over financial reporting but not for the purpose of expressing an opinion on the effectiveness of the Funds’ internal control over financial reporting. Accordingly, we express no such opinion.
Our audits included performing procedures to assess the risks of material misstatement of the financial statements and financial highlights, whether due to error or fraud, and performing procedures that respond to those risks. Such procedures included examining, on a test basis, evidence regarding the amounts and disclosures in the financial statements and financial highlights. Our audits also included evaluating the accounting principles used and significant estimates made by management, as well as evaluating the overall presentation of the financial statements and financial highlights. Our procedures included confirmation of securities owned as of June 30, 2020, by correspondence with the custodian and brokers; when replies were not received from brokers, we performed other auditing procedures. We believe that our audits provide a reasonable basis for our opinion.
DELOITTE & TOUCHE LLP
Denver, Colorado
August 25, 2020
We have served as the auditor of one or more James Advantage Funds investment companies since 1998.
| 40 | www.jamesinvestment.com |
| James Advantage Funds | Additional Information |
June 30, 2020 (Unaudited)
PROXY VOTING GUIDELINES
James is responsible for exercising the voting rights associated with the securities purchased and held by the Funds. A description of the policies and procedures that James uses in fulfilling this responsibility and information regarding how those proxies were voted during the most recent 12-month period ended June 30 are available without charge upon request by calling toll free 1-800-995-2637. These items are also available on the Securities and Exchange Commission’s (the “Commission”) website at http://www.sec.gov.
QUARTERLY PORTFOLIO DISCLOSURE
The Funds’ portfolio holdings are made available semi-annually in shareholder reports within 60 days after the close of the period for which the report is being made, as required by federal securities laws. The Funds file their complete schedule of portfolio holdings with the Commission for the first and third quarters of each fiscal year as an exhibit to its reports on Form N-PORT. The Funds’ Form N-PORT reports are available on the Commission’s website at http://www.sec.gov. The Funds’ Form N-PORT is also available upon request by calling toll-free 1-800-995-2637.
TAX DESIGNATIONS
Qualified Dividend Income
The percentage of ordinary income dividends distributed during the calendar year ended December 31, 2019 are designated as qualified dividend income (QDI) as defined in Section 1(h)(11) of the Internal Revenue Code in the following percentages:
| | Amount |
| James Balanced: Golden Rainbow Fund | 78.44% |
| James Small Cap Fund | N/A |
| James Micro Cap Fund | 100.00% |
| James Aggressive Allocation Fund | 100.00% |
Dividends Received Deduction
For corporate shareholders, the following ordinary dividends paid during the calendar year ended December 31, 2019 qualify for the corporate dividends received deduction:
| | Amount |
| James Balanced: Golden Rainbow Fund | 77.62% |
| James Small Cap Fund | N/A |
| James Micro Cap Fund | 100.00% |
| James Aggressive Allocation Fund | 100.00% |
Pursuant to Section 852(b)(3) of the Internal Revenue Code, James Balanced: Golden Rainbow Fund designated $6,691,344 and James Advantage Micro Cap Fund designated $816,071 as long-term capital gains dividend.
The amount above for James Balanced Golden Rainbow Fund includes $194,757 of earnings and profits distributed to shareholders on redemptions. The James Advantage Micro Cap Fund did not include redemptions to shareholders as distributions of earnings and profit against long term capital gains.
| Annual Report | June 30, 2020 | 41 |
| Liquidity Risk Management Program | James Advantage Funds |
June 30, 2020 (Unaudited)
James Advantage Funds (the “Trust”) has adopted and implemented a liquidity risk management program (the “Program”), as consistent with Rule 22e-4 to govern the Trust’s approach to managing liquidity risk for each Fund. The Program is overseen by the Liquidity Committee (the “Committee”), which is comprised of representatives of the Trust’s investment adviser and Officers of the Trust. The Trust’s Board of Trustees (the “Board”) has approved the designation of the Committee to oversee the Program.
The Program’s principal objectives include supporting each Fund’s compliance with limits on investments in illiquid assets and mitigating the risk that a Fund will be unable to meet its redemption obligations in a timely manner. The Program also includes a number of elements that support the management and assessment of liquidity risk, including an annual assessment of factors that influence a Fund’s liquidity and the periodic classification and re-classification of the Fund’s investments into groupings that reflect the Committee’s assessment of their relative liquidity under current market conditions.
At a meeting of the Board held on May 20, 2020, the Committee provided a report (the “Report”) to the Board addressing the operation, adequacy, and effectiveness of the Program, including any material changes to the Program for the period from the inception of the Program on December 1, 2018 through May 20, 2020 (“Reporting Period”). The Report concluded that the Program was reasonably designed to assess and manage each Fund’s liquidity risk and was adequately and effectively implemented during the Reporting Period. There were no material changes to the Program during the Reporting Period. The Report further concluded that each Fund’s investment strategy continues to be appropriate given such Fund’s status as an open-end fund.
There can be no assurance that the Program will achieve its objectives in the future. Additional information regarding risks of investing in each Fund, including liquidity risk presented by such Fund’s investment portfolio, is found in such Fund’s Prospectus and Statement of Additional Information.
| 42 | www.jamesinvestment.com |
| James Advantage Funds | Trustees & Officers |
June 30, 2020 (Unaudited)
The Board of Trustees has overall responsibility for management of the Trust under the laws of Ohio governing the responsibilities of trustees of business trusts. Following are the Trustees and executive officers of the Trust, their present occupation with the Trust or Funds, age and principal occupation during the past 5 years for the fiscal year ended June 30, 2020.
Additional information regarding the Fund’s Trustees is included in the Statement of Additional Information, which can be obtained without charge by calling 1-800-995-2637.
| INTERESTED TRUSTEE | | | |
| Name/Address*/Age | Position(s) With Fund/Time Served/ During Past 5 years | Principal Occupation by Trustee | Number of Portfolios in Fund Complex Overseen | Other Directorships Held by Trustee Outside During the Past Five Years |
Barry R. James1, CFA James Investment Research, Inc. 1349 Fairground Road Xenia, OH 45385 Year of Birth: 1956 | President & Trustee since 1997 | President and CEO, James Investment Research (2005 - present); CEO and Director, James Capital Alliance (1992 - present) | 4 | Director, Heart to Honduras (2006 – present) Director, FAIR Foundation (2010 - present) |
INDEPENDENT TRUSTEES | | | |
| Name/Address*/Age | Position(s) With Funds/Time Served/ During Past 5 years | Principal Occupation(s) by Trustee | Number of Portfolios in Fund Complex Overseen | Other Directorships Held by Trustee Outside During the Past Five Years |
Anthony P. D’Angelo Year of Birth: 1930 | Trustee since 1997 | Retired, Professor Emeritus, Graduate School of Logistics and Acquisitions Management, Air Force Institute of Technology, Wright-Patterson AFB, Ohio (Retired since 1999) | 4 | None |
Leslie L. Brandon Year of Birth: 1942 | Trustee since 2003 | Retired Partner, Ernst & Young LLP, Columbus, Ohio (1966 - 2000) | 4 | None |
Ronald D. Brown Year of Birth: 1953 | Trustee Since 2014 | Interim Chief Executive Officer, LSI Industries Inc. (2018); Vice Chairman, The Armor Group (2017 – 2018); Chief Operating Officer, The Armor Group (2013 – 2017); Chief Financial Officer, Makino Inc. (2010 – 2013); Managing Director, Taft Business Consulting LLC. (2009 – 2013) | 4 | Director, LSI Industries, Inc. (2018-present); Director of AO Smith Corporation (2001 - present); Board Trustee of University of Cincinnati (2013 - present); Director, Zep, Inc. (2010 – 2015) Director of Makino Inc. (2010 - 2013) |
Robert F. Chelle Year of Birth: 1948 | Trustee since 2014 | Retired Founding Director of the L. William Crotty Center for Entrepreneurial Leadership at the University of Dayton (1999 – 2015); President/CEO, High Voltage Maintenance Corp, Dayton, OH (1974-1999) | 4 | Director of DRT Mfg. Co. (2007 – present), School Outfitters (2010 – present), Harlamert- HRG Food Brokerage, Prime Controls (2008 – present), The Siebenthaler Company (1986 – present). |
Richard C. Russell Year of Birth: 1946 | Trustee since 2003 | Consultant, Danis Companies (construction and real estate development firm), (2002 - present); Retired CEO & CFO, Danis Companies (1983-2002) | 4 | Director, Excellence in Motivation (1996 - present); Director, DRT Manufacturing, Co. (1999 - present); Director, Catholic Community Foundation for the Archdiocese of Cincinnati, Inc. (2015 – present); Director, Catholic Education Foundation for the Archdiocese of Cincinnati, Inc. (2015 – present); |
| * | All Trustees may be contacted at c/o The James Advantage Funds, Attn: Secretary, 1349 Fairground Road, Xenia, OH 45385. |
| 1 | Mr. James is an “interested person” of the Trust as defined in the 1940 Act because of his relationship to James Investment Research, Inc., which serves as the investment adviser to the Trust. |
| Annual Report | June 30, 2020 | 43 |
| Trustees & Officers | James Advantage Funds |
June 30, 2020 (Unaudited)
| OFFICERS | | |
Name/Address/Age | Positions Held With Fund/Date Service Began | Principal Occupation by Officer |
Amy Broerman James Investment Research, Inc. 1349 Fairground Road Xenia, OH 45385 Year of Birth: 1972 | Chief Financial Officer since 2018 Treasurer since 2012 | Assistant Vice President of Operations, James Investment Research, Inc. (since 2008), Assistant Treasurer of James Advantage Funds (2002-2012) |
Lesley Ott James Investment Research, Inc. 1349 Fairground Road Xenia, OH 45385 Year of Birth: 1983 | Chief Compliance Officer since 2012 | Chief Compliance Officer, James Investment Research, Inc. and James Capital Alliance, Inc. (since 2012), Chief Operating Officer, James Investment Research, Inc. (since 2020), Deputy Chief Operating Officer, James Investment Research, Inc. (2017-2019); Deputy Chief Compliance Officer, James Investment Research, Inc. and James Capital Alliance, Inc. (2010-2011) |
Brian P. Shepardson James Investment Research, Inc. 1349 Fairground Road Xenia, OH 45385 Year of Birth: 1973 | Secretary since 2018 Assistant Treasurer since 2015 | First Vice President, James Investment Research, Inc. (since 2014), Assistant Vice President of James Investment Research, Inc. (2009-2014) |
Richard Brian Culpepper James Investment Research, Inc. 1349 Fairground Road Xenia, OH 45385 Year of Birth: 1972 | Assistant Secretary since 2011 | Senior Vice President, James Investment Research, Inc. (since 2018),Vice President, James Investment Research, Inc. (2014-2018), First Vice President of James Investment Research, Inc. (2009-2014) |
Cara Owen, c/o ALPS Fund Services, Inc. 1290 Broadway, Suite 1000 Denver, CO 80203 Year of Birth: 1981 | Assistant Secretary since 2019 | Vice President and Principal Legal Counsel, ALPS Fund Services, Inc. (since August, 2019); Vice President and Secretary, Boulder Income & Growth Fund, Inc. (since June 2020); and Assistant Secretary, ALPS ETF Trust (since March 2020). Prior to Joining ALPS, Ms. Owen was Senior Counsel, Corporate & Investments, Great-West Life & Annuity Insurance Company; Senior Counsel & Assistant Secretary, Great-West Funds, Inc., Great-West Capital Management, LLC, Great-West Trust Company, LLC, and Advised Assets Group, LLC (2014-2019) |
Jennell Panella c/o ALPS Fund Services, Inc. 1290 Broadway, Suite 1000 Denver, CO 80203 Year of Birth: 1974 | Assistant Treasurer since 2013 | Fund Controller of ALPS Fund Services, Inc. (since June 2012), Financial Reporting Manager, Parker Global Strategies, LLC (2009-2012) |
| 44 | www.jamesinvestment.com |
| James Advantage Funds | Privacy Policy |
June 30, 2020 (Unaudited)
Facts
What does James Advantage Funds do with your personal information?
Why?
Financial companies choose how they share your personal information. Federal law gives consumers the right to limit some, but not all sharing. Federal law also requires us to tell you how we collect, share, and protect your personal information. Please read this notice carefully to understand what we do.
What?
The types of personal information we collect and share depends on the product or service that you have with us. This information can include:
| ● | Social Security number and wire transfer instructions |
| ● | account transactions and transaction history |
| ● | investment experience and purchase history |
When you are no longer our customer, we continue to share your information as described in this notice.
How?
All financial companies need to share customers’ personal information to run their everyday business. In the section below, we list the reasons financial companies can share their customers’ personal information; the reasons James Advantage Funds chooses to share; and whether you can limit this sharing.
| Reasons we can share your personal information: | Does James Advantage Funds share information? | Can you limit this sharing? |
| For our everyday business purposes - such as to process your transactions, maintain your account(s), respond to court orders and legal investigations, or report to credit bureaus. | YES | NO |
| For our marketing purposes - to offer our products and services to you. | YES | NO |
| For joint marketing with other financial companies. | NO | We don’t share |
| For our affiliates’ everyday business purposes - information about your transactions and records. | NO | We don’t share |
| For our affiliates’ everyday business purposes - information about your credit worthiness. | NO | We don’t share |
| For our affiliates to market to you | NO | We don’t share |
| For non-affiliates to market to you | NO | We don’t share |
Questions? Call 1-800-99 James
| What we do: | | |
How does James Advantage Funds protect my personal information? | To protect your personal information from unauthorized access and use, we use security measures that comply with federal law. These measures include computer safeguards and secured files and buildings. Our service providers are held accountable for adhering to strict policies and procedures to prevent any misuse of your nonpublic personal information. |
How does James Advantage Funds collect my personal information? | We collect your personal information, for example, when you ● open an account or deposit money ● direct us to buy securities or direct us to sell your securities ● seek advice about your investments We also collect your personal information from others, such as credit bureaus, affiliates, or other companies. |
| Why can’t I limit all sharing? | Federal law gives you the right to limit only: ● sharing for affiliates’ everyday business purposes – information about your creditworthiness. ● affiliates from using your information to market to you. ● sharing for nonaffiliates to market to you. State laws and individual companies may give you additional rights to limit sharing. |
| Definitions | | |
| Affiliates | Companies related by common ownership or control. They can be financial and non-financial companies. ● Our affiliates include financial companies, such as James Investment Research, Inc. and James Capital Alliance. |
| Non-affiliates | Companies not related by common ownership or control. They can be financial and non-financial companies. ● James Advantage Funds does not share with nonaffiliates so they can market to you. |
| Joint marketing | A formal agreement between nonaffiliated financial companies that together market financial products or services to you. ● James Advantage Funds does not jointly market. |
| Annual Report | June 30, 2020 | 45 |

Item 2. Code of Ethics.
| (a) | As of the end of the period covered by this report, the registrant has adopted a code of ethics that applies to the registrant’s principal executive officer, principal financial officer, principal accounting officer or controller, or persons performing similar functions, regardless of whether these individuals are employed by the registrant or a third party. |
| (c) | Amendments: During the period covered by this report, there were no amendments to the provisions of the code of ethics. |
| (d) | Waivers: During the period covered by this report, the registrant has not granted any express or implicit waivers from the provisions of the code of ethics. |
| (e) | Not applicable to this report. |
Item 3. Audit Committee Financial Expert.
The registrant’s board of trustees has determined that Leslie L. Brandon is an audit committee financial expert. Mr. Brandon is “independent,” pursuant to general instructions on Form N-CSR, Item 3.
An “audit committee financial expert” is not an “expert” for any purpose, including for purposes of Section 11 of the Securities Act of 1933, as a result of being designated as an “audit committee financial expert.” Further, the designation of a person as an “audit committee financial expert” does not mean that the person has any greater duties, obligations, or liability than those imposed on the person without the “audit committee financial expert” designation. Similarly, the designation of a person as an “audit committee financial expert” does not affect the duties, obligations, or liability of any other member of the audit committee or board of directors.
Item 4. Principal Accountant Fees and Services.
| June 30, 2020 | June 30, 2019 |
| $90,000 | $90,000 |
Such audit fees represent the aggregate fees billed for the fiscal years ended June 30, 2020 and June 30, 2019 for professional services rendered by Deloitte & Touche LLP for the audit of the registrant’s annual financial statements or services that are normally provided by the accountant in connection with statutory and regulatory filings or engagements.
| | Registrant | Adviser |
| June 30, 2020 | $0 | $0 |
| June 30, 2019 | $0 | $0 |
Neither the registrant nor the adviser was billed any fees by Deloitte & Touche LLP for the fiscal years ended June 30, 2020 and June 30, 2019 for assurance and related services that were reasonably related to the performance of the audit of the registrant’s financial statement and not otherwise included under “Audit Fees” above.
| | Registrant | Adviser |
| June 30, 2020 | $11,980 | $0 |
| June 30, 2019 | $16,710 | $0 |
“Tax fees” shown in the table above were for professional services rendered by Deloitte & Touche LLP for tax compliance, tax advice, and tax planning. The natures of the services comprising the fees disclosed under this category involve the preparation of excise filings and income tax returns for the registrant.
| | Registrant | Adviser |
| June 30, 2020 | $0 | $0 |
| June 30, 2019 | $0 | $0 |
The registrant was not billed any fees by Deloitte & Touche LLP for products and services provided by Deloitte & Touche LLP, other than the services reported above in items (a) - (c), for the fiscal years ended June 30, 2020 and June 30, 2019.
| (e) | Pre-Approval Policies and Procedures. |
| (1) | Pursuant to the registrant’s audit committee charter (the “Charter”), the audit committee is directly responsible for the appointment, termination, compensation, and oversight of the work of any registered public accounting firm employed by the registrant. In addition, the Charter provides that the audit committee is responsible for reviewing and approving in advance any and all proposals under which the independent auditor would provide “permissible non-audit services” (as defined in the Charter) to the registrant or to the investment adviser to the registrant (not including any sub-adviser whose role is primarily portfolio management and that is sub-contracted or overseen by the investment adviser to the registrant) or any entity controlling, controlled by, or under common control with the investment adviser that provides ongoing services to the registrant if those permissible non-audit services relate directly to the operations and financial reporting of the registrant. In determining whether to pre-approve non-audit services, the audit committee considers whether such services are consistent with the independent auditor’s independence. |
| (2) | 100% of the services described pursuant to paragraphs (b) through (d) of this Item 4 of Form N-CSR were approved by the audit committee, and no such services were approved by the audit committee pursuant to paragraph (c)(7)(i)(C) of Rule 2-01 of Regulation S-X. |
| (f) | Not applicable to the registrant. |
| (g) | The aggregate non-audit fees billed by the registrant’s accountant for services rendered to the registrant, and rendered to the registrant’s investment adviser (not including any sub-adviser whose role is primarily portfolio management and is subcontracted with or overseen by another investment adviser), and any entity controlling, controlled by, or under common control with the adviser that provides ongoing services to the registrant is as follows: |
| | Registrant | Adviser |
| June 30, 2020 | $0 | $0 |
| June 30, 2019 | $6,866 | $0 |
| (h) | The registrant’s audit committee of the board of trustees has considered that the provision of non-audit services that were rendered to an entity controlling, controlled by, or under common control with the registrant’s investment adviser that provides ongoing services to the registrant for the fiscal years ended June 30, 2020 and June 30, 2019, as identified above, that were not pre-approved pursuant to paragraph (c)(7)(ii) of Rule 2-01 of Regulation S-X, are compatible with maintaining Deloitte & Touche LLP’s independence. |
Item 5. Audit Committee of Listed Registrants.
Not applicable to the registrant.
Item 6. Investments.
| (a) | The Schedule of Investments is included as part of the report to shareholders filed under Item 1 of this Form. |
| (b) | Not applicable to the registrant. |
Item 7. Disclosure of Proxy Voting Policies and Procedures for Closed-End Management Investment Companies.
Not applicable to the registrant.
Item 8. Portfolio Managers of Closed-End Management Investment Companies.
Not applicable to the registrant.
Item 9. Purchases of Equity Securities by Closed-End Management Investment Company and Affiliates Purchasers.
Not applicable to the registrant.
Item 10. Submission of Matters to a Vote of Security Holders.
The Governance and Compensation Committee (the "Committee") of the Board of Trustees of the registrant will consider trustee candidates submitted by shareholders or from other sources it deems appropriate that are submitted timely and with adequate information about the candidate in the Committee’s view in order for them to make an assessment.
The Committee shall assess shareholder nominees in the same manner as the Committee reviews its own nominees. Any recommendation must be submitted in writing to the Committee in care of the Trust’s Secretary at James Investment Research, Inc. 1349 Fairground Rd., Xenia, OH 45385, and should include at a minimum the following information as to each individual proposed for nomination as trustee: such individual’s written consent to be named in the proxy statement as a nominee (if nominated) and to serve as a trustee (if elected), and all information relating to such individual that is required to be disclosed in the solicitation of proxies for election of such proposed nominee under the 1940 Act. The Committee, in its discretion, may request additional information concerning the recommended candidate in order to evaluate the candidate’s qualifications.
Item 11. Controls and Procedures.
| (a) | Based on an evaluation of the registrant’s disclosure controls and procedures (as defined in Rule 30a-3(c) under the Investment Company Act of 1940, as amended), the registrant’s principal executive officer and principal financial officer have concluded that the registrant’s disclosure controls and procedures as conducted within 90 days of the filing date of this report provide reasonable assurance that material information required to be disclosed by the registrant in the report it files or submits on Form N-CSR is recorded, processed, summarized and reported, within the time periods specified in the commission’s rules and forms and that such material information is accumulated and communicated to the registrant’s management, including its principal executive officer and principal financial officer, as appropriate, in order to allow timely decisions regarding required disclosure. |
| (b) | The registrant’s principal executive officer and principal financial officer are aware of no changes in the registrant’s internal control over financial reporting (as defined in Rule 30a-3(d) under the Investment Company Act of 1940, as amended) that occurred during the period covered by this report that have materially affected, or are reasonably likely to materially affect, the registrant’s internal control over financial reporting. |
Item 12. Disclosure of Securities Lending Activities for Closed-End Management Investment Companies.
Not applicable.
Item 13. Exhibits.
| (a)(3) | Not applicable. |
| | |
| (a)(4) | Not applicable. |
SIGNATURES
Pursuant to the requirements of the Securities Exchange Act of 1934 and the Investment Company Act of 1940, the Registrant has duly caused this report to be signed on its behalf by the undersigned, thereunto duly authorized.
| The James Advantage Funds | |
| | | |
| By | /s/ Barry R. James | |
| | Barry R. James | |
| | President & CEO | |
| | | |
| Date: | September 3, 2020 | |
Pursuant to the requirements of the Securities Exchange Act of 1934 and the Investment Company Act of 1940, this report has been signed below by the following persons on behalf of the registrant and in the capacities and on the dates indicated.
| By | /s/ Barry R. James | |
| | Barry R. James | |
| | President & CEO | |
| | | |
| Date: | September 3, 2020 | |
| By | /s/ Amy K. Broerman | |
| | Amy K. Broerman | |
| | Chief Financial Officer | |
| | | |
| Date: | September 3, 2020 | |