Exhibit B.3(c): Management’s discussion and analysis excerpted from pages 31-103 of CIBC’s 2010 Annual Report
Management’s Discussion and Analysis
Management’s discussion and analysis (MD&A) is provided to enable readers to assess CIBC’s results of operations and financial condition for the year ended October 31, 2010, compared with prior years. The MD&A should be read in conjunction with the audited consolidated financial statements, which have been prepared in accordance with Canadian generally accepted accounting principles (GAAP). Unless otherwise indicated, all amounts in the MD&A are expressed in Canadian dollars. Certain comparative amounts have been reclassified to conform with the presentation adopted in the current year. This MD&A is current as of December 1, 2010. Additional information relating to CIBC is available on SEDAR at www.sedar.com and on the U.S. Securities and Exchange Commission’s (SEC) website at www.sec.gov. No information on our website (www.cibc.com) should be considered incorporated herein by reference. A glossary of terms used in the MD&A and the consolidated financial statements is provided on pages 184 to 187 of this Annual Report.
External reporting changes
The following is a summary of the external reporting changes adopted during the year:
| • | | The global repurchase agreement (repo) business that was previously part of Treasury in Corporate and Other was retroactively transferred to capital markets within Wholesale Banking. The results of the repo business were previously allocated substantially to other within CIBC Retail Markets. |
| |
| • | | Large corporate cash management revenue, previously reported in business banking within CIBC Retail Markets, was retroactively transferred to corporate and investment banking within Wholesale Banking. |
| | | | | |
|
| | | 32 | | Overview |
| | | 32 | | Vision, Mission and Values |
| | | 32 | | Our Strategic Imperative and Priorities |
| | | 32 | | Performance Against Objectives |
| | | 34 | | Economic and Market Environment |
| | | | | |
| | | 35 | | Financial Performance Overview |
| | | 35 | | Financial Highlights 2010 |
| | | 36 | | 2010 Financial Performance |
| | | 36 | | Net Interest Income and Margin |
| | | 36 | | Non-interest Income |
| | | 37 | | Trading Activities |
| | | 37 | | Provision for Credit Losses |
| | | 37 | | Non-interest Expenses |
| | | 37 | | Taxes |
| | | 38 | | Foreign Exchange |
| | | 38 | | Significant Events |
| | | 39 | | Outlook for 2011 |
| | | | | |
| | | 39 | | Fourth Quarter Review |
| | | 40 | | Quarterly Trend Analysis |
| | | 41 | | Review of 2009 Financial Performance |
| | | 42 | | Non-GAAP Measures |
| | | 43 | | Business Unit Allocations |
| | | | | |
| | | 44 | | Business Line Overview |
| | | 44 | | CIBC Retail Markets |
| | | 47 | | Wholesale Banking |
| | | 49 | | Corporate and Other |
| | | | | |
| | | 50 | | Run-off Businesses and Other Selected Activities |
| | | 50 | | Run-off Businesses |
| | | 56 | | Other Selected Activities |
| |
| | | 58 | | Financial Condition |
| | | 58 | | Review of Consolidated Balance Sheet |
| | | 59 | | Capital Resources |
| | | 63 | | Off-balance Sheet Arrangements |
| | | | | |
|
| | | 66 | | Management of Risk |
| | | 66 | | Risk Overview |
| | | 68 | | Credit Risk |
| | | 77 | | Market Risk |
| | | 81 | | Liquidity Risk |
| | | 84 | | Strategic Risk |
| | | 84 | | Operational Risk |
| | | 85 | | Reputation and Legal Risk |
| | | 85 | | Regulatory Risk |
| | | 85 | | Environmental Risk |
| | | | | |
| | | 86 | | Accounting and Control Matters |
| | | 86 | | Critical Accounting Policies and Estimates |
| | | 91 | | Financial Instruments |
| | | 92 | | Accounting Developments |
| | | 93 | | Transition to International Financial Reporting Standards (IFRS) |
| | | 95 | | Related-party Transactions |
| | | 95 | | Controls and Procedures |
| | | | | |
| | | 96 | | Supplementary Annual Financial Information |
A NOTE ABOUT FORWARD-LOOKING STATEMENTS: From time to time, we make written or oral forward-looking statements within the meaning of certain securities laws, including in this Annual Report, in other filings with Canadian securities regulators or the U.S. Securities and Exchange Commission and in other communications. These statements include, but are not limited to, statements made in the “Chief Executive Officer’s Letter”, “Performance Against Objectives”, “Overview”, “Financial Performance Overview — Taxes”, “Financial Performance Overview — Significant Events”, “Business Line Overview — CIBC Retail Markets”, “Business Line Overview — Wholesale Banking”, “Run-off Businesses and Other Selected Activities”, “Financial Condition — Capital Resources”, “Management of Risk - Liquidity Risk”, “Accounting and Control Matters — Risk Factors Related to Fair Value Adjustments” and “Accounting and Control Matters — Contingent Liabilities” sections of this report and other statements about our operations, business lines, financial condition, risk management, priorities, targets, ongoing objectives, strategies and outlook for 2011 and subsequent periods. Forward-looking statements are typically identified by the words “believe”, “expect”, “anticipate”, “intend”, “estimate” and other similar expressions or future or conditional verbs such as “will”, “should”, “would” and “could”. By their nature, these statements require us to make assumptions, including the economic assumptions set out in the “Financial Performance Overview — Outlook for 2011” section of this report, and are subject to inherent risks and uncertainties that may be general or specific. A variety of factors, many of which are beyond our control, affect our operations, performance and results, and could cause actual results to differ materially from the expectations expressed in any of our forward-looking statements. These factors include: credit, market, liquidity, strategic, operational, reputation and legal, regulatory and environmental risk discussed in the “Management of Risk” section of this report; legislative or regulatory developments in the jurisdictions where we operate, amendments to, and interpretations of, risk-based capital guidelines and reporting instructions; the resolution of legal proceedings and related matters; the effect of changes to accounting standards, rules and interpretations; changes in our estimates of reserves and allowances; changes in tax laws; changes to our credit ratings; political conditions and developments; the possible effect on our business of international conflicts and the war on terror; natural disasters, public health emergencies, disruptions to public infrastructure and other catastrophic events; reliance on third parties to provide components of our business infrastructure; the accuracy and completeness of information provided to us by clients and counterparties; the failure of third parties to comply with their obligations to us and our affiliates; intensifying competition from established competitors and new entrants in the financial services industry; technological change; global capital market activity; changes in monetary and economic policy; currency value fluctuations; general business and economic conditions worldwide, as well as in Canada, the U.S. and other countries where we have operations; changes in market rates and prices which may adversely affect the value of financial products; our success in developing and introducing new products and services, expanding existing distribution channels, developing new distribution channels and realizing increased revenue from these channels; changes in client spending and saving habits; our ability to attract and retain key employees and executives; and our ability to anticipate and manage the risks associated with these factors. This list is not exhaustive of the factors that may affect any of our forward-looking statements. These and other factors should be considered carefully and readers should not place undue reliance on our forward-looking statements. We do not undertake to update any forward-looking statement that is contained in this report or in other communications except as required by law.
31
Management’s Discussion and Analysis
Overview
CIBC is a leading Canadian-based global financial institution with a market capitalization of $30.7 billion and a Tier 1 capital ratio of 13.9%. Through our two major operating groups, CIBC Retail Markets and Wholesale Banking, CIBC provides a full range of financial products and services to 11 million individual, small business, commercial, corporate and institutional clients in Canada and around the world. We have more than 42,000 employees dedicated to helping our clients achieve what matters to them, delivering consistent and sustainable performance for our shareholders and giving back to our communities.
Vision, Mission and Values
CIBC’s vision is to be the leader in client relationships.
Our mission is to fulfill the commitments we have made to each of our stakeholders:
| 1. | | Help our clients achieve what matters to them |
| |
| 2. | | Create an environment where all employees can excel |
| |
| 3. | | Make a real difference in our communities |
| |
| 4. | | Generate strong total returns for our shareholders |
Our vision and mission are driven by an organizational culture based on core values of Trust, Teamwork and Accountability.
Our Strategic Imperative and Priorities
CIBC’s strategic imperative is to deliver consistent and sustainable performance over the long term.
In support of this imperative, we are focused on three priorities:
| 1. | | Market leadership in core businesses |
| | - | | Achieve and maintain no less than a #3 position, and target #1 or #2, in our core Canadian-based retail and wholesale businesses |
| 2. | | Balanced and actively managed business mix |
| | - | | Grow in certain areas where we have competitive capabilities and market opportunities that can generate sustainable earnings |
| 3. | | Industry-leading fundamentals |
| | - | | Underpin our core businesses with strong capital and funding, competitive productivity measures and sound risk management |
Performance Against Objectives
For many years, CIBC has reported a scorecard of financial measures that we use to measure and report on our progress to external stakeholders. These measures can be categorized into four key areas of shareholder value – earnings growth, return on equity, total shareholder return and balance sheet strength.
Earnings growth
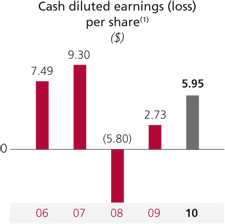
As the primary driver of shareholder value, CIBC has regularly reported an earnings per share (EPS) growth target as one of our medium-term financial objectives. Our current target, which we set at the end of 2007, is to deliver average annual EPS growth of 5 to 10%.
In 2010, we reported cash EPS(1)on a fully diluted basis of $5.95, up from $2.73 in 2009 and $(5.80) in 2008, but below the $9.30 we achieved in 2007. As a result of the unanticipated global credit crisis that developed in 2008 and the difficult economic conditions that followed, we did not achieve our 5 to 10% target over the prior three-year period.
We are maintaining our 5 to 10% average annual EPS growth target.
In support of our EPS target, we have objectives to maintain a loan loss ratio between 50 and 65 basis points through the cycle and to maintain our cash efficiency ratio(1)at the median position among our industry peers.
Our loan loss ratio is defined as specific provision for credit losses as a percentage of loans and bankers’ acceptances, measured on a managed basis(1). Supported primarily by lower write-offs in our cards and personal lending businesses, our loan loss ratio improved to 56 basis points in 2010, below the 70 basis points we reported in 2009 and within our target range.
32
Management’s Discussion and Analysis
Our efficiency ratio is defined as non-interest expenses as a percentage of revenue, measured on a cash and taxable equivalent basis (TEB)(1). Based on the most recent publicly reported results of our industry peer group, CIBC has maintained its efficiency ratio at the industry median in 2010. Our 2010 efficiency ratio of 57.6% improved from 66.4% in 2009, supported by revenue growth that exceeded expense growth.
We are maintaining our industry median target.
Return on equity
Return on equity (ROE) is another key measure of shareholder value.
CIBC’s target is to achieve ROE of 20% through the cycle. In 2010, ROE of 19.4% was slightly below this target. ROE was up from 9.4% in 2009, driven by strong earnings growth that more than offset higher average common shareholders’ equity.
We are maintaining our minimum ROE target of 20%, which continues to be at the higher end of industry objectives.
Total shareholder return
CIBC’s mission is to fulfill the commitments we have made to each of our stakeholders, which includes generating a strong level of total shareholder return (TSR).
We have two targets that support our shareholder mission:
| 1. | | We have had a consistent objective for many years of paying out between 40% and 50% of our earnings in the form of dividends to our common shareholders. In 2010, and for the past three years, our dividend payout has exceeded this target range. |
| |
| | | Our key criteria for considering dividend increases is our current level of payout relative to our target and our view on the sustainability of our current earnings level through the cycle. |
| |
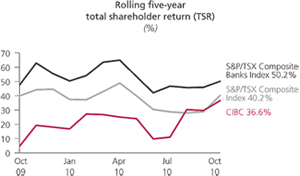
| 2. | | We also have an objective to deliver a TSR that exceeds the industry average, which we have defined as the S&P/TSX Composite Banks Index, over a rolling five-year period. For the five years ended October 31, 2010, CIBC delivered a TSR of 36.6%, below the Index return of 50.2%. However, supported by a strong TSR of 32.4% in 2010 that was the highest among the major Canadian banks, CIBC has closed the gap to the Index over the past year. |
33
Management’s Discussion and Analysis
Balance sheet strength
A strong balance sheet is a necessary foundation for our strategic imperative of consistent and sustainable performance.
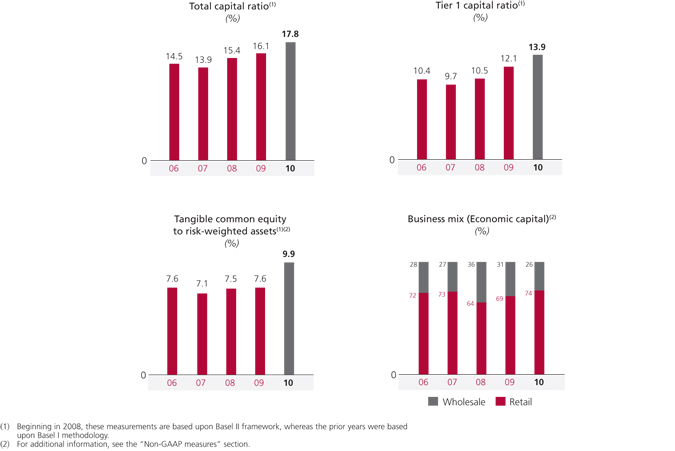
Capital levels are a key component of balance sheet strength. In this area, we have set targets for our Tier 1 and Total capital ratios, which have been 8.5% and 11.5% for many years. We expect to define new medium-term capital ratio targets in 2011 when we have final guidance from the Office of the Superintendent of Financial Institutions Canada (OSFI) on how the new global capital standards will apply to Canadian banks. With our strong capital ratios at the end of 2010, we expect to be well positioned for the new standards.
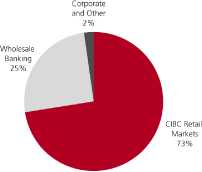
How we deploy our capital is also important. In this area, we have defined a target retail/wholesale business mix, as measured by the allocation of economic capital, that is consistent with the type of earnings and risk profile we desire for CIBC. For the past few years, our target has been to allocate at least 75% of our economic capital to retail. At the end of 2010, our retail allocation was 74%, up from 69% at the end of 2009.
We are maintaining our business mix target.
In addition to our capital and business mix objectives, we remain focused on asset quality and a strong funding profile as key underpinnings of a strong balance sheet.
Economic and Market Environment
CIBC benefited from an improving business climate as the economy continued to recover at a moderate pace from the prior year’s recession. Helped by a rebound in the U.S. and in the broader global economy, Canada’s manufacturing and resource sectors recouped some of their prior declines, and the domestic economy responded to low interest rates and government stimulus. Improved confidence and a period of record low borrowing costs led to a pickup in home buying, and supported volume growth in retail banking activities.
Following three quarter-point rate increases by the Bank of Canada, and a tightening in mortgage insurance rules, mortgage and other household credit growth slowed in Canada in the latter half of the fiscal year. A lower unemployment rate improved household credit quality as the lagged impacts of the earlier recession faded.
The Wholesale Banking business benefited from the improvement in credit quality and a healthier overall tone to financial markets. Government deficit financing kept wholesale debt markets active, but strong corporate balance sheets with ample cash and still-tempered capital spending plans held down activity in equity issuance.
34
Management’s Discussion and Analysis
Financial Performance Overview
Financial Highlights 2010
| | | | | | | | | | | | | | | | | | | | | |
| As at or for the year ended October 31 | | 2010 | | | 2009 | | | 2008 | | | 2007 | | | 2006 | |
| |
Common share information | | | | | | | | | | | | | | | | | | | | |
| Per share — basic earnings (loss) | | $ | 5.89 | | | $ | 2.65 | | | $ | (5.89 | ) | | $ | 9.30 | | | $ | 7.50 | |
— diluted earnings (loss)(1) | | | 5.87 | | | | 2.65 | | | | (5.89 | ) | | | 9.21 | | | | 7.43 | |
— cash diluted earnings (loss)(2) | | | 5.95 | | | | 2.73 | | | | (5.80 | ) | | | 9.30 | | | | 7.49 | |
| — dividends | | | 3.48 | | | | 3.48 | | | | 3.48 | | | | 3.11 | | | | 2.76 | |
| Share price — closing | | | 78.23 | | | | 62.00 | | | | 54.66 | | | | 102.00 | | | | 87.60 | |
| Shares outstanding (thousands) — end of period | | | 392,739 | | | | 383,982 | | | | 380,805 | | | | 334,989 | | | | 335,977 | |
| Market capitalization ($ millions) | | $ | 30,724 | | | $ | 23,807 | | | $ | 20,815 | | | $ | 34,169 | | | $ | 29,432 | |
| |
Value measures | | | | | | | | | | | | | | | | | | | | |
| Dividend yield (based on closing share price) | | | 4.4 | % | | | 5.6 | % | | | 6.4 | % | | | 3.0 | % | | | 3.2 | % |
| Dividend payout ratio | | | 59.1 | % | | | >100 | % | | | n/m | | | | 33.4 | % | | | 36.8 | % |
| |
Financial results($ millions) | | | | | | | | | | | | | | | | | | | | |
| Total revenue | | $ | 12,085 | | | $ | 9,928 | | | $ | 3,714 | | | $ | 12,066 | | | $ | 11,351 | |
Total revenue (TEB)(2) | | | 12,138 | | | | 9,970 | | | | 3,902 | | | | 12,363 | | | | 11,575 | |
| Provision for credit losses | | | 1,046 | | | | 1,649 | | | | 773 | | | | 603 | | | | 548 | |
| Non-interest expenses | | | 7,027 | | | | 6,660 | | | | 7,201 | | | | 7,612 | | | | 7,488 | |
| Net income (loss) | | | 2,452 | | | | 1,174 | | | | (2,060 | ) | | | 3,296 | | | | 2,646 | |
| |
Financial measures | | | | | | | | | | | | | | | | | | | | |
| Efficiency ratio | | | 58.1 | % | | | 67.1 | % | | | n/m | | | | 63.1 | % | | | 66.0 | % |
Cash efficiency ratio (TEB)(2) | | | 57.6 | % | | | 66.4 | % | | | n/m | | | | 61.3 | % | | | 64.4 | % |
| Return on equity | | | 19.4 | % | | | 9.4 | % | | | (19.4 | )% | | | 28.7 | % | | | 27.9 | % |
| Net interest margin | | | 1.79 | % | | | 1.54 | % | | | 1.51 | % | | | 1.39 | % | | | 1.52 | % |
| Total shareholder return | | | 32.4 | % | | | 21.1 | % | | | (43.5 | )% | | | 20.2 | % | | | 25.6 | % |
| |
Balance sheet information($ millions) | | | | | | | | | | | | | | | | | | | | |
| Loans and acceptances, net of allowance | | $ | 184,576 | | | $ | 175,609 | | | $ | 180,323 | | | $ | 170,678 | | | $ | 151,916 | |
| Total assets | | | 352,040 | | | | 335,944 | | | | 353,930 | | | | 342,178 | | | | 303,984 | |
| Deposits | | | 246,671 | | | | 223,117 | | | | 232,952 | | | | 231,672 | | | | 202,891 | |
| Common shareholders’ equity | | | 12,634 | | | | 11,119 | | | | 11,200 | | | | 11,158 | | | | 9,941 | |
| |
Balance sheet quality measures | | | | | | | | | | | | | | | | | | | | |
Risk-weighted assets ($ billions)(3) | | $ | 106.7 | | | $ | 117.3 | | | $ | 117.9 | | | $ | 127.4 | | | $ | 114.8 | |
Tangible common equity ratio(2) | | | 9.9 | % | | | 7.6 | % | | | 7.5 | % | | | 7.1 | % | | | 7.6 | % |
Tier 1 capital ratio(3) | | | 13.9 | % | | | 12.1 | % | | | 10.5 | % | | | 9.7 | % | | | 10.4 | % |
Total capital ratio(3) | | | 17.8 | % | | | 16.1 | % | | | 15.4 | % | | | 13.9 | % | | | 14.5 | % |
| |
Other information | | | | | | | | | | | | | | | | | | | | |
Retail/wholesale ratio(4)(5) | | | 74%/26 | % | | | 69%/31 | % | | | 64%/36 | % | | | 73%/27 | % | | | 72%/28 | % |
Full-time equivalent employees(6) | | | 42,354 | | | | 41,941 | | | | 43,293 | | | | 44,906 | | | | 40,774 | |
| |
| | |
| (1) | | In case of a loss, the effect of stock options potentially exercisable on diluted EPS is anti-dilutive; therefore, basic and diluted EPS will be the same. |
| |
| (2) | | For additional information, see the “Non-GAAP measures” section. |
| |
| (3) | | Beginning in 2008, these measures are based upon Basel II framework, whereas the prior years were based upon Basel I methodology. |
| |
| (4) | | Ratio represents the amount of economic capital attributed to CIBC Retail Markets and Wholesale Banking as of the end of the year. |
| |
| (5) | | Certain prior year information has been restated to conform to the presentation of the current year. |
| |
| (6) | | Full-time equivalent headcount is a measure that normalizes the number of full-time and part-time employees, base plus commissioned employees, and 100% commissioned employees into equivalent full-time units based on actual hours of paid work during a given period. n/m Not meaningful. |
35
Management’s Discussion and Analysis
2010 Financial Performance
Net income for the year was $2,452 million, compared to $1,174 million in 2009. The results for the current and prior years were affected by certain significant items reported during the years as follows:
2010
| • | | $232 million ($161 million after-tax) loss on the structured credit run-off business; |
| |
| • | | $411 million ($117 million loss after-tax) of foreign exchange gains on capital repatriation activities; |
| |
| • | | $141 million ($98 million after-tax) reversal of provision for credit losses in the general allowance; |
| |
| • | | $25 million future tax asset write-down resulting from the enactment of lower Ontario corporate tax rates; |
| |
| • | | $30 million ($17 million after-tax) reversal of interest expense related to the favourable conclusion of prior years’ tax audits; and |
| |
| • | | $17 million ($12 million after-tax) negative impact of changes in credit spreads on the mark-to-market (MTM) of credit derivatives in our corporate loan hedging program. |
2009
| • | | $1,003 million ($684 million after-tax) loss on the structured credit run-off business; |
| |
| • | | $265 million ($182 million after-tax) negative impact of changes in credit spreads on the MTM of credit derivatives in our corporate loan hedging program; |
| |
| • | | $164 million ($106 million after-tax) of valuation charges related to certain trading and available-for-sale (AFS) positions in exited and other run-off businesses; |
| |
| • | | $136 million ($81 million after-tax) of higher than normal losses and write-downs on our legacy merchant banking portfolios; |
| |
| • | | $107 million ($73 million after-tax) provision for credit losses in the general allowance; |
| |
| • | | $92 million ($51 million after-tax) MTM loss relating to interest-rate hedges for the leveraged lease portfolio that did not qualify for hedge accounting; |
| |
| • | | $83 million ($56 million after-tax) loan loss in our leveraged loan and other run-off portfolios; |
| |
| • | | $27 million ($18 million after-tax) of a higher litigation provision and other operational costs; |
| |
| • | | $26 million ($18 million after-tax) decrease in credit valuation adjustments (CVAs) against credit exposures to derivative counterparties, other than financial guarantors, on non-structured credit contracts; |
| |
| • | | $25 million ($17 million after-tax) interest income on income tax reassessments; and |
| |
| • | | $111 million ($7 million after-tax) of foreign exchange gains on capital repatriation activities. |
Net Interest Income and Margin
| | | | | | | | | | | | | |
| $ millions, for the year ended October 31 | | 2010 | | | 2009 | | | 2008 | |
| |
| Average assets | | $ | 345,943 | | | $ | 350,706 | | | $ | 344,865 | |
| Net interest income | | | 6,204 | | | | 5,394 | | | | 5,207 | |
| Net interest margin | | | 1.79 | % | | | 1.54 | % | | | 1.51 | % |
| |
Net interest income was up $810 million or 15% from 2009, with increases primarily due to higher treasury interest income, volume growth in most retail products, wider spreads in lending products, and interest income in the structured credit run-off business compared to interest expense in the prior year. These factors were partially offset by narrower spreads in deposits, volume driven decreases in corporate lending, and lower income from U.S. real estate finance. The prior year included losses relating to interest-rate hedges for the leveraged lease portfolio that did not qualify for hedge accounting.
Additional information on net interest income and margin is provided in the “Supplementary annual financial information” section.
Non-interest Income
| | | | | | | | | | | | | |
| $ millions, for the year ended October 31 | | 2010 | | | 2009 | | | 2008 | |
| |
| Underwriting and advisory fees | | $ | 426 | | | $ | 478 | | | $ | 411 | |
| Deposit and payment fees | | | 756 | | | | 773 | | | | 776 | |
| Credit fees | | | 341 | | | | 304 | | | | 237 | |
| Card fees | | | 304 | | | | 328 | | | | 306 | |
| Investment management and custodial fees | | | 459 | | | | 419 | | | | 525 | |
| Mutual fund fees | | | 751 | | | | 658 | | | | 814 | |
| Insurance fees, net of claims | | | 277 | | | | 258 | | | | 248 | |
| Commissions on securities transactions | | | 474 | | | | 472 | | | | 565 | |
| Trading income (loss) | | | 603 | | | | (531 | ) | | | (6,821 | ) |
| AFS gains (losses), net | | | 400 | | | | 275 | | | | (40 | ) |
| FVO income (loss) | | | (623 | ) | | | (33 | ) | | | (249 | ) |
| Income from securitized assets | | | 631 | | | | 518 | | | | 585 | |
| Foreign exchange other than trading | | | 683 | | | | 496 | | | | 437 | |
| Other | | | 399 | | | | 119 | | | | 713 | |
| |
| | | $ | 5,881 | | | $ | 4,534 | | | $ | (1,493 | ) |
| |
Non-interest income was up $1,347 million or 30% from 2009.
Underwriting and advisory feeswere down $52 million or 11%, primarily due to lower equity new issuances.
Credit feeswere up $37 million or 12%, primarily due to higher committed corporate lending facilities.
Card feeswere down $24 million or 7%, primarily due to higher securitization activity.
Investment management and custodial feeswere up $40 million or 10% andmutual fund feeswere up $93 million or 14%, primarily due to market-driven increases in asset values.
Trading income (loss)was up $1,134 million, driven largely by lower losses in the structured credit run-off business. See the “Trading activities” section which follows for further details.
AFS gains (losses), netincludes realized gains and losses on disposals, net of write-downs to reflect other-than-temporary impairments (OTTI) in the value of the securities and limited partnerships. Gains were up $125 million or 45%, primarily due to lower write-downs during the year, partially offset by lower net realized gains on sale of securities.
FVO income (loss)represents revenue from financial instruments designated at fair value and related hedges. FVO loss was up $590 million, primarily due to higher losses in the structured credit run-off business, resulting from the Cerberus Capital Management LP (Cerberus) note. Largely offsetting these losses were gains on the underlying securities included in trading income noted below. Gains from U.S. real estate finance were also lower during the year. Further details on the composition of our FVO income (loss) are provided in Note 13 to the consolidated financial statements.
36
Management’s Discussion and Analysis
Income from securitized assetswas higher by $113 million or 22%, primarily due to a higher level of securitized assets.
Foreign exchange other than tradingwas up $187 million or 38%, largely due to higher foreign exchange gains on capital repatriation activities.
Otherincludes realized gains and losses on sales and write-downs of equity-accounted investments, and other commissions and fees. Other revenue was up $280 million, mainly due to lower MTM losses associated with our corporate loan hedging program and gain on sale of a U.S. investment, partially offset by lower other commissions and fees.
Trading Activities
| | | | | | | | | | | | | |
| $ millions, for the year ended October 31 | | 2010 | | | 2009 | | | 2008 | |
| |
| Trading income (loss) consists of: | | | | | | | | | | | | |
| Net interest income | | $ | 218 | | | $ | 237 | | | $ | (418 | ) |
| Non-interest income | | | 603 | | | | (531 | ) | | | (6,821 | ) |
| |
| | | $ | 821 | | | $ | (294 | ) | | $ | (7,239 | ) |
| |
Trading income was higher by $1,115 million, primarily due to lower losses in the structured credit run-off business. Offsetting this increase was higher losses in the FVO income (loss) noted above. For a more detailed discussion of the structured credit losses, refer to the “Run-off businesses and other selected activities” section.
Further details on the composition of our trading income by product type are provided in Note 12 to the consolidated financial statements.
Provision for Credit Losses
| | | | | | | | | | | | | |
| $ millions, for the year ended October 31 | | 2010 | | | 2009 | | | 2008 | |
| |
| Specific | | | | | | | | | | | | |
| Consumer | | $ | 943 | | | $ | 1,020 | | | $ | 595 | |
| Business and government | | | 258 | | | | 392 | | | | 105 | |
| |
| | | | 1,201 | | | | 1,412 | | | | 700 | |
| General | | | (155 | ) | | | 237 | | | | 73 | |
| |
| | | $ | 1,046 | | | $ | 1,649 | | | $ | 773 | |
| |
The provision for credit losses was down $603 million or 37% from 2009.
The specific provision in consumer portfolios was down $77 million driven by lower write-offs in the cards portfolio, as well as improvements in delinquencies and lower write-offs in the personal lending portfolio.
The specific provision in business and government lending decreased by $134 million across all portfolios, mainly attributable to lower losses in the run-off portfolios in the U.S. and Europe, and the U.S. real estate finance portfolio.
The decrease in the general provision for credit losses was primarily related to the cards and business and government lending portfolios, reflecting improved economic conditions. This was offset in part by the general allowance established for the MasterCard portfolio acquired from Citi Cards Canada Inc. (the MasterCard portfolio).
Non-interest Expenses
| | | | | | | | | | | | | |
| $ millions, for the year ended October 31 | | 2010 | | | 2009 | | | 2008 | |
| |
| Employee compensation and benefits | | | | | | | | | | | | |
| Salaries | | $ | 2,202 | | | $ | 2,180 | | | $ | 2,435 | |
| Performance-based compensation | | | 1,103 | | | | 995 | | | | 942 | |
| Benefits | | | 566 | | | | 435 | | | | 540 | |
| |
| | | | 3,871 | | | | 3,610 | | | | 3,917 | |
| Occupancy costs | | | 648 | | | | 597 | | | | 610 | |
| Computer, software and office equipment | | | 1,003 | | | | 1,010 | | | | 1,095 | |
| Communications | | | 290 | | | | 288 | | | | 284 | |
| Advertising and business development | | | 197 | | | | 173 | | | | 217 | |
| Professional fees | | | 210 | | | | 189 | | | | 230 | |
| Business and capital taxes | | | 88 | | | | 117 | | | | 118 | |
| Other | | | 720 | | | | 676 | | | | 730 | |
| |
| | | $ | 7,027 | | | $ | 6,660 | | | $ | 7,201 | |
| |
Non-interest expenses increased by $367 million or 6% from 2009.
Employee compensation and benefitsincreased by $261 million or 7%, primarily due to higher performance-based compensation, and higher pension expenses resulting from changes in certain assumptions and the market value of our plan assets.
Occupancy costsincreased by $51 million or 9%, mainly due to higher rental expenses during the year.
Advertising and business developmentincreased by $24 million or 14%, mainly due to higher spending during the year.
Professional feesincreased by $21 million or 11%, mainly due to higher consulting and legal expenses.
Business and capital taxesdecreased by $29 million or 25%, mainly as a result of lower tax rates, as discussed in the “Taxes” section.
Other, mainly comprising operational losses, outside services, and other variable expenses increased by $44 million or 7%, mainly due to the settlement with the Ontario Securities Commission (OSC) relating to our participation in the asset-backed commercial paper (ABCP) market and the servicing fees in relation to the acquisition of the MasterCard portfolio.
Taxes
| | | | | | | | | | | | | |
| $ millions, for the year ended October 31 | | 2010 | | | 2009 | | | 2008 | |
| |
| Income tax expense (benefit) | | $ | 1,533 | | | $ | 424 | | | $ | (2,218 | ) |
| |
Indirect taxes(1) | | | | | | | | | | | | |
| GST, HST and sales taxes | | | 211 | | | | 208 | | | | 200 | |
| Payroll taxes | | | 180 | | | | 155 | | | | 180 | |
| Capital taxes | | | 73 | | | | 106 | | | | 107 | |
| Property and business taxes | | | 52 | | | | 51 | | | | 45 | |
| |
| Total indirect taxes | | | 516 | | | | 520 | | | | 532 | |
| |
| Total taxes | | $ | 2,049 | | | $ | 944 | | | $ | (1,686 | ) |
| |
| Income taxes as a percentage of net income before income taxes and non-controlling interests | | | 38.2 | % | | | 26.2 | % | | | 52.1 | % |
| Total taxes as a percentage of net income before deduction of total taxes and non-controlling interests | | | 45.3 | % | | | 44.1 | % | | | 45.2 | % |
| |
| | |
| (1) | | Certain amounts in this table are based on a paid or payable basis and do not factor in capitalization and subsequent amortization. |
37
Management’s Discussion and Analysis
Income taxes include those imposed on CIBC as a Canadian legal entity, as well as on our domestic and foreign subsidiaries. Indirect taxes comprise goods and services tax (GST), harmonized sales tax (HST), and sales, payroll, capital, property and business taxes. Indirect taxes are included in non-interest expenses.
Total income and indirect taxes were up $1,105 million from 2009.
Income tax expense was $1,533 million, compared to $424 million in 2009. This change was primarily due to higher income in the year. The current year included increased taxes related to foreign exchange gains on capital repatriation activities.
Indirect taxes were down $4 million, or 1%. A decrease in capital taxes was largely offset by an increase in payroll taxes. Capital taxes were down due to the reduction of capital tax rates in certain provinces. Payroll taxes were up as the prior year included a favourable resolution of a payroll tax audit. On July 1, 2010, Ontario and British Columbia enacted HST to replace provincial sales tax.
At October 31, 2010, our future income tax asset was $767 million, net of a $66 million (US$65 million) valuation allowance. Included in the future income tax asset were $385 million related to Canadian non-capital loss carryforwards that expire in 18 years, $54 million related to Canadian capital loss carryforwards that have no expiry date, and $267 million related to our U.S. operations. Accounting standards require a valuation allowance when it is more likely than not that all or a portion of a future income tax asset will not be realized prior to its expiration. Although realization is not assured, we believe that based on all available evidence, it is more likely than not that all of the future income tax asset, net of the valuation allowance, will be realized.
On October 2, 2009 and March 17, 2010, the Canada Revenue Agency (CRA) issued reassessments disallowing the deduction of approximately $3.0 billion of the 2005 Enron settlement payments and related legal expenses. In May 2010, CRA also proposed to disallow legal expenses related to 2006. On April 30, May 19 and September 9, 2010, we filed Notices of Appeal with the Tax Court of Canada. On September 30 and November 12, 2010, we received Replies from the Department of Justice which confirmed CRA’s reassessments. The matter is proceeding to litigation. We believe that we will be successful in sustaining at least the amount of the accounting tax benefit recognized to date. Should we successfully defend our tax filing position in its entirety, we would be able to recognize an additional accounting tax benefit of $214 million and taxable refund interest of approximately $167 million. Should we fail to defend our position in its entirety, additional tax expense of approximately $865 million and non-deductible interest of approximately $128 million would be incurred.
The Ontario Government will reduce Ontario corporate tax rates to 10% by 2013. These reductions were substantively enacted for accounting purposes as at November 16, 2009. As a result, we wrote down our future tax assets by approximately $25 million. The statutory income tax rate applicable to CIBC as a legal entity was 30.6% in 2010. The rate will be reduced to 28.2% in 2011 and further reduced to 25.3% by 2014.
Final closing agreements for leveraged leases were executed with the Internal Revenue Service (IRS) in 2009. In 2010, final taxable amounts and interest charges were agreed with the IRS and payments were applied to the various affected tax years.
For a reconciliation of our income taxes in the consolidated statement of operations with the combined Canadian federal and provincial income tax rate, see Note 23 to the consolidated financial statements.
Foreign Exchange
In 2010, the Canadian dollar appreciated 11% on average relative to the U.S. dollar from the prior year. The estimated impact of U.S. dollar translation on the consolidated statement of operations was as follows:
| | | | | | | | | | | | | |
| $ millions, for the year ended October 31 | | 2010 | | | 2009 | | | 2008 | |
| |
| Estimated increase (decrease) on: | | | | | | | | | | | | |
| Total revenue | | $ | (205 | ) | | $ | 90 | | | $ | (25 | ) |
| Provision for credit losses | | | (19 | ) | | | 25 | | | | (3 | ) |
| Non-interest expense | | | (79 | ) | | | 90 | | | | (42 | ) |
| Income taxes and non-controlling interest | | | (15 | ) | | | (5 | ) | | | 2 | |
| Net income | | $ | (92 | ) | | $ | (20 | ) | | $ | 18 | |
| |
Significant Events
Sale of CIBC Mellon Trust Company’s Issuer Services business
On July 28, 2010, CIBC Mellon Trust Company (CMT), a 50/50 joint venture between CIBC and The Bank of New York Mellon, announced it had signed an agreement to sell its Issuer Services business (stock transfer and employee share purchase plan). The transaction closed on November 1, 2010. CMT’s Issuer Services business results are reported in CIBC’s Corporate and Other reporting segment and the results of its operations are not considered significant to CIBC’s consolidated results.
Acquisition of Citi Cards Canada Inc.’s Canadian MasterCard portfolio
On September 1, 2010, we completed the acquisition of Citi Cards Canada Inc.’s (Citi) rights and obligations in respect of their Canadian MasterCard portfolio for cash consideration of approximately $1.2 billion. The total portfolio consists of approximately $2.3 billion of directly owned and securitized credit card receivables to Broadway Trust, as well as certain other related assets. Approximately $811 million of credit card receivables were directly owned at the closing date. Broadway Trust had $1.2 billion of sold receivables and approximately $100 million of cash. These assets were funded by $1.1 billion of externally issued senior notes and $201 million of subordinated notes, which we purchased. We have retained Citi as the transitional servicer until we transfer these accounts onto our platforms. See Note 3 of the consolidated financial statements for further details.
Acquisition of CIT Business Credit Canada Inc.
On April 30, 2010, CIBC acquired from CIT Financial Ltd. (CIT) the 50% interest in CIT Business Credit Canada Inc. (CITBCC) that we did not already own. Total cash consideration was $306 million. Additional cash consideration of up to $8 million may be payable to CIT depending on certain circumstances. CITBCC was established in 2000 as a joint venture between CIBC and CIT. Subsequent to the acquisition, CITBCC was renamed CIBC Asset-Based Lending Inc.
38
Management’s Discussion and Analysis
Investment in The Bank of N.T. Butterfield & Son Limited
On March 2, 2010, we invested $155 million (US$150 million) for a direct 22.5% common equity interest in The Bank of N.T. Butterfield & Son Limited (Butterfield), as part of a $570 million (US$550 million) recapitalization of Butterfield. The Carlyle Group and other institutional investors invested the remaining $415 million (US$400 million). We also invested $23 million (US$22 million) or 3.3% on March 2, 2010 indirectly in common shares of Butterfield through a private equity fund sponsored by The Carlyle Group. We had previously committed US$150 million to the fund to invest in financial services transactions.
Pursuant to a US$130 million rights offering, which closed on May 11, 2010, other investors, including Butterfield’s shareholders, participated in the recapitalization by subscribing for additional common shares, which decreased the size of our direct investment to $130 million (US$125 million) or 18.8% and our indirect ownership in Butterfield to $19 million (US$18 million) or 2.7%. Our total ownership in Butterfield may decrease in the future under certain circumstances.
In addition, we provided Butterfield with a senior secured credit facility for up to $306 million (US$300 million) that was reduced from the original $510 million (US$500 million), at Butterfield’s request. We also nominated two out of twelve directors on Butterfield’s Board of Directors.
Outlook for 2011
Both the Canadian and U.S. economies are expected to continue on a moderate recovery path in 2011, with real GDP growth in both countries near 2%, and unemployment rates holding steady. U.S. domestic demand is expected to be dampened by the end of major fiscal stimulus efforts and the absence of a rebound in the troubled housing market. Canada’s export growth is expected to be held back by a strong Canadian dollar and a slow recovery in the U.S. The domestic economy should see a slower pace to home building and government spending. The absence of inflation risks should keep interest rates very low by historic standards, although the Bank of Canada could raise overnight rates slightly in the latter half of the year.
CIBC Retail Markets is expected to face slower demand growth for mortgages and household credit, with a modest recovery in demand for business credit. The lagged impacts of the earlier recession on credit quality will continue to fade, allowing for an improvement in delinquencies and a reduction in personal bankruptcies. Demand for investment products should be supported as confidence gradually improves.
Wholesale Banking should benefit from a healthier pace of issuance of equities and bonds, with governments remaining heavy borrowers and businesses taking advantage of stronger capital markets. Merger and acquisition activity could increase as confidence improves. Corporate credit demand should be supported by growth in capital spending, although the public debt market and internal cash flows will be a competitive source of funding. U.S. real estate finance could remain slow given an overhang of vacant properties. Corporate default rates could remain contained as we move further from the prior recession.
Fourth Quarter Review
| | | | | | | | | | | | | | | | | | | | | | | | | | | | | | | | | |
| $ millions, except per share amounts, | | | | | | | | | | | | | | 2010 | | | | | | | | | | | | | | | 2009(1) | |
| for the three months ended | | Oct. 31 | | | Jul. 31 | | | Apr. 30 | | | Jan. 31 | | | Oct. 31 | | | Jul. 31 | | | Apr. 30 | | | Jan. 31 | |
| |
| Revenue | | | | | | | | | | | | | | | | | | | | | | | | | | | | | | | | |
| CIBC Retail Markets | | $ | 2,480 | | | $ | 2,472 | | | $ | 2,334 | | | $ | 2,402 | | | $ | 2,356 | | | $ | 2,318 | | | $ | 2,223 | | | $ | 2,375 | |
| Wholesale Banking | | | 238 | | | | 315 | | | | 548 | | | | 613 | | | | 503 | | | | 552 | | | | (213 | ) | | | (330 | ) |
| Corporate and Other | | | 536 | | | | 62 | | | | 39 | | | | 46 | | | | 29 | | | | (13 | ) | | | 151 | | | | (23 | ) |
| |
| Total revenue | | $ | 3,254 | | | $ | 2,849 | | | $ | 2,921 | | | $ | 3,061 | | | $ | 2,888 | | | $ | 2,857 | | | $ | 2,161 | | | $ | 2,022 | |
| |
| Net interest income | | $ | 1,645 | | | $ | 1,548 | | | $ | 1,497 | | | $ | 1,514 | | | $ | 1,419 | | | $ | 1,369 | | | $ | 1,273 | | | $ | 1,333 | |
| Non-interest income | | | 1,609 | | | | 1,301 | | | | 1,424 | | | | 1,547 | | | | 1,469 | | | | 1,488 | | | | 888 | | | | 689 | |
| |
| Total revenue | | | 3,254 | | | | 2,849 | | | | 2,921 | | | | 3,061 | | | | 2,888 | | | | 2,857 | | | | 2,161 | | | | 2,022 | |
| Provision for credit losses | | | 150 | | | | 221 | | | | 316 | | | | 359 | | | | 424 | | | | 547 | | | | 394 | | | | 284 | |
| Non-interest expenses | | | 1,860 | | | | 1,741 | | | | 1,678 | | | | 1,748 | | | | 1,669 | | | | 1,699 | | | | 1,639 | | | | 1,653 | |
| |
| Income before taxes and non-controlling interests | | | 1,244 | | | | 887 | | | | 927 | | | | 954 | | | | 795 | | | | 611 | | | | 128 | | | | 85 | |
| Income taxes | | | 742 | | | | 244 | | | | 261 | | | | 286 | | | | 145 | | | | 172 | | | | 174 | | | | (67 | ) |
| Non-controlling interests | | | 2 | | | | 3 | | | | 6 | | | | 16 | | | | 6 | | | | 5 | | | | 5 | | | | 5 | |
| |
| Net income (loss) | | $ | 500 | | | $ | 640 | | | $ | 660 | | | $ | 652 | | | $ | 644 | | | $ | 434 | | | $ | (51 | ) | | $ | 147 | |
| |
| Per share – basic EPS | | $ | 1.17 | | | $ | 1.54 | | | $ | 1.60 | | | $ | 1.59 | | | $ | 1.57 | | | $ | 1.02 | | | $ | (0.24 | ) | | $ | 0.29 | |
| – diluted EPS | | $ | 1.17 | | | $ | 1.53 | | | $ | 1.59 | | | $ | 1.58 | | | $ | 1.56 | | | $ | 1.02 | | | $ | (0.24 | ) | | $ | 0.29 | |
| |
| | |
| (1) | | Certain prior period information has been restated to conform to the presentation of the current year. |
39
Management’s Discussion and Analysis
Compared with Q4/09
Net income was down $144 million or 22% from the fourth quarter of 2009.
Net interest income was up $226 million or 16%, primarily due to higher treasury revenue, volume growth in most retail products including the impact of the MasterCard portfolio, and higher trading-related net interest income, partially offset by lower spreads in retail products.
Non-interest income was up $140 million or 10%, primarily due to foreign exchange gains of $411 million on capital repatriation activities, higher net realized gains on sale of AFS securities and lower write-downs, higher income from securitization activities, and higher mutual fund fees. These factors were partially offset by higher losses in the structured credit run-off business and lower underwriting and advisory fees.
Provision for credit losses was down $274 million or 65%. The specific provision for credit losses was down $193 million, attributable to lower provisions in the consumer and business and government portfolios. The general provision for credit losses was down $81 million, driven by improvements in cards and personal lending, as well as a refinement in how we calculate our general allowance for small business, partially offset by changes in the provision for large corporate loans and the establishment of an allowance for the MasterCard portfolio.
Non-interest expenses were up $191 million or 11%, primarily due to higher performance-related compensation, pension expenses, computer-related costs, advertising and business development expenses, and the impact of HST on these and other items.
Income tax expense was up by $597 million, primarily due to the tax expense of $528 million on capital repatriation activities during the quarter.
Compared with Q3/10
Net income was down $140 million or 22% from the prior quarter.
Net interest income was up $97 million or 6%, primarily due to volume growth in most retail products, including the impact of the MasterCard portfolio, and higher trading-related net interest income.
Non-interest income was up $308 million or 24%, primarily due to foreign exchange gains on the capital repatriation activities, higher income from securitization activities, and higher commissions on securities transactions. These factors were partially offset by higher losses in the structured credit run-off business and lower underwriting and advisory fees.
Provision for credit losses was down $71 million or 32%. The specific provision for credit losses was down $82 million, attributable to lower provisions in the consumer and business and government portfolios. The general provision for credit losses was up $11 million, driven by the establishment of an allowance for the MasterCard portfolio and changes in the provision for large corporate loans, largely offset by a refinement in how we calculate our general allowance for small business.
Non-interest expenses were up $119 million or 7%, primarily due to higher computer-related costs, advertising and business development expenses, professional fees, occupancy costs, and the impact of HST on these and other items.
Income tax expense was higher by $498 million, primarily due to the tax expense on the capital repatriation activities during the quarter.
Quarterly Trend Analysis
Our quarterly results are modestly affected by seasonal factors. The first quarter is normally characterized by increased credit card purchases over the holiday period. The second quarter has fewer days as compared with the other quarters, generally leading to lower earnings. The summer months (July – third quarter and August – fourth quarter) typically experience lower levels of capital markets activity, which affects our brokerage, investment management, and wholesale banking activities.
Revenue
CIBC Retail Markets revenue was up over the period reflecting growth in volumes and improved credit spreads, partially offset by lower treasury allocations.
Wholesale Banking revenue is influenced to a large extent by capital markets conditions. In the first half of 2009 and the second half of 2010, Wholesale Banking was adversely affected by the losses in the structured credit run-off business.
Corporate and Other revenue is affected by the impact of significant items not included in the other business lines. The fourth quarter of 2010 and the second quarter of 2009 included foreign exchange gains on capital repatriation activities. Foreign exchange losses on capital repatriation activities were included in the first quarter of 2009.
Provision for credit losses
The provision for credit losses is dependent upon the credit cycle in general and on the credit performance of the loan portfolio. CIBC Retail Markets provisions trended higher through the third quarter of 2009 largely due to higher losses in the cards and personal lending portfolios. This was the result of both volume growth as well as economic deterioration in the consumer sector. The cards and personal lending portfolios showed some improvements in 2010. Wholesale Banking provisions stabilized in 2010, reflecting improvement in economic conditions in both the U.S. and Europe.
Non-interest expenses
Non-interest expenses were fairly constant throughout the period with higher employee compensation and benefit expenses and occupancy costs during 2010.
Income taxes
Income taxes vary with changes in income subject to tax and the jurisdictions in which the income is earned. It can also be affected by the impact of significant items. The fourth quarter of 2010 and the second quarter of 2009 included income tax expense on capital repatriation activities. Income tax benefits on the foreign exchange losses on capital repatriation activities were included in the first quarter of 2009. The first quarter of 2010 and the second quarter of 2009 included write-downs of future tax assets. The fourth quarter of 2009 included a tax benefit, primarily from a positive revaluation of future tax assets.
Non-controlling interests
Non controlling interests were down in 2010 due to lower net income from FirstCaribbean International Bank (FirstCaribbean). The first quarter of 2010 included the minority interest related to the gain on the sale of a U.S. investment.
40
Management’s Discussion and Analysis
Review of 2009 Financial Performance
| | | | | | | | | | | | | | | | | | | |
| | | | | CIBC | | | | | | | | | | |
| | | | | Retail | | | Wholesale | | | Corporate | | | CIBC | |
| $ millions, for the year ended October 31 | | Markets | | | Banking | | | and Other | | | Total | |
| |
2009(1) | | Net interest income | | $ | 5,404 | | | $ | 430 | | | $ | (440 | ) | | $ | 5,394 | |
| | | Non-interest income | | | 3,866 | | | | 82 | | | | 586 | | | | 4,534 | |
| | | Intersegment revenue | | | 2 | | | | — | | | | (2 | ) | | | — | |
| |
| | | Total revenue | | | 9,272 | | | | 512 | | | | 144 | | | | 9,928 | |
| | | Provision for credit losses | | | 1,382 | | | | 218 | | | | 49 | | | | 1,649 | |
| | | Non-interest expenses | | | 5,228 | | | | 1,060 | | | | 372 | | | | 6,660 | |
| |
| | | Income (loss) before taxes and non-controlling interests | | | 2,662 | | | | (766 | ) | | | (277 | ) | | | 1,619 | |
| | | Income taxes | | | 746 | | | | (294 | ) | | | (28 | ) | | | 424 | |
| | | Non-controlling interests | | | 21 | | | | — | | | | — | | | | 21 | |
| |
| | | Net income (loss) | | $ | 1,895 | | | $ | (472 | ) | | $ | (249 | ) | | $ | 1,174 | |
| |
2008(1) | | Net interest income | | $ | 5,475 | | | $ | (183 | ) | | $ | (85 | ) | | $ | 5,207 | |
| | | Non-interest income | | | 3,857 | | | | (5,774 | ) | | | 424 | | | | (1,493 | ) |
| | | Intersegment revenue | | | 5 | | | | — | | | | (5 | ) | | | — | |
| |
| | | Total revenue | | | 9,337 | | | | (5,957 | ) | | | 334 | | | | 3,714 | |
| | | Provision for (reversal of) credit losses | | | 833 | | | | 12 | | | | (72 | ) | | | 773 | |
| | | Non-interest expenses | | | 5,418 | | | | 1,318 | | | | 465 | | | | 7,201 | |
| |
| | | Income (loss) before taxes and non-controlling interests | | | 3,086 | | | | (7,287 | ) | | | (59 | ) | | | (4,260 | ) |
| | | Income taxes | | | 763 | | | | (3,104 | ) | | | 123 | | | | (2,218 | ) |
| | | Non-controlling interests | | | 19 | | | | (1 | ) | | | — | | | | 18 | |
| |
| | | Net income (loss) | | $ | 2,304 | | | $ | (4,182 | ) | | $ | (182 | ) | | $ | (2,060 | ) |
| |
| | |
| (1) | | Certain prior year information has been restated to conform to the presentation of the current year. |
The following discussion provides a comparison of our results of operations for the years ended October 31, 2009 and 2008.
Overview
Net income for 2009 was $1,174 million, compared to a net loss of $2,060 million in 2008. This was due to higher revenue driven mainly by lower structured credit run-off business losses and lower non-interest expenses, offset in part by higher provision for credit losses and income taxes.
Revenue by segments
CIBC Retail Markets
Revenue was in line with 2008 with narrower spreads and lower wealth management revenue largely offset by volume growth across most products.
Wholesale Banking
Revenue was up $6,469 million from 2008, primarily due to lower losses from the structured credit run-off business and higher revenue in capital markets and corporate and investment banking, partially offset by MTM losses on corporate loan hedges in 2009 compared to MTM gains in 2008.
Corporate and Other
Revenue was down $190 million or 57% from 2008, mainly due to lower unallocated treasury revenue which includes securitization activities, partially offset by higher foreign exchange gains on capital repatriation activities. Losses from the hedging of stock appreciation rights (SARs) were included in 2008.
Consolidated CIBC
Net interest income
Net interest income was up $187 million or 4% from 2008, primarily due to volume growth in most retail products, lower trading-related interest expense, higher interest income from FirstCaribbean mainly due to the weaker Canadian dollar, and interest income on tax reassessments. These increases were partially offset by spread compression in retail products and lower revenue from trading securities.
Non-interest income
Non-interest income was up $6,027 million from 2008, largely due to lower losses from the structured credit run-off business. In addition, realized gains on AFS securities net of write-downs, revenue from U.S. real estate finance, foreign exchange gains on capital repatriation activities, underwriting and advisory fees, and credit fees were higher during 2009. These increases were partially offset by MTM losses associated with corporate loan hedging programs in 2009 compared to MTM gains in 2008, higher MTM losses on our inventory of mortgage-backed securities (MBS) net of seller swaps, lower investment management and custodial fees, and lower income from securitized assets.
Provision for credit losses
The provision for credit losses was up $876 million from 2008. Specific provision increased $712 million, primarily due to higher write-offs and delinquencies in the cards and unsecured personal lending portfolios, and higher impaired loans in the run-off and U.S. real estate finance businesses.
The general provision increased by $164 million, primarily related to cards due to the difficult economic environment.
Non-interest expenses
Non-interest expenses decreased by $541 million or 8% from 2008, primarily due to lower employee compensation and benefits, lower computer and software related expenses, lower spending on advertising and business development, lower legal and consulting expenses, and lower litigation reserves and indirect taxes.
Income taxes
Income taxes were up $2,642 million from 2008, primarily due to higher income in 2009 and a $486 million income tax reduction in 2008 attributable to an increase in our expected tax benefit relating to Enron-related litigation settlements.
41
Management’s Discussion and Analysis
Non-GAAP Measures
We use a number of financial measures to assess the performance of our business lines. Some measures are calculated in accordance with GAAP, while other measures do not have a standardized meaning under GAAP and, accordingly, these measures, described below, may not be comparable to similar measures used by other companies. Investors may find these non-GAAP financial measures useful in analyzing financial performance.
Net interest income (TEB)
We evaluate net interest income on an equivalent before-tax basis. In order to arrive at the TEB amount, we gross up tax-exempt income on certain securities to the equivalent level that would have incurred tax at the statutory rate. Meanwhile the corresponding entry is made in the income tax expense. This measure enables comparability of net interest income arising from both taxable and tax-exempt sources. Net interest income (TEB) is used to calculate the efficiency ratio (TEB) and trading income (TEB). We believe these measures permit uniform measurement, which may enable users of our financial information to make comparisons more readily.
Economic capital
Economic capital provides the financial framework to evaluate the returns of each business line, commensurate with the risk taken. See the “Capital resources” section for details on the definition and calculation of economic capital. Economic capital is a non-GAAP measure and there is no comparable GAAP measure.
Economic profit
Net income, adjusted for a charge on capital, determines economic profit. This measures the return generated by each business line in excess of our cost of capital, thus enabling users of our financial information to identify relative contributions to shareholder value.
Segmented return on equity
We use ROE on a segmented basis as one of the measures for performance evaluation and resource allocation decisions. While ROE for total CIBC provides a measure of return on common equity, ROE on a segmented basis provides a similar metric related to the capital allocated to the segments. We use economic capital to calculate ROE on a segmented basis. As a result, segmented ROE is a non-GAAP measure.
Cash basis measures
Cash basis measures are calculated by adjusting the amortization of other intangible assets to net income and non-interest expenses. Management believes these measures permit uniform measurement, which may enable users of our financial information to make comparisons more readily.
Managed loans
We securitize loans and sell resulting securities or loans to variable interest entities (VIEs), that in turn issue securities to investors. These loans and securities are removed from the consolidated balance sheet upon sale. Loans on a managed basis include securitization inventory as well as loans and securities sold. We use this measure to evaluate the credit performance and the overall financial performance of the underlying loans.
Tangible common equity
Tangible common equity (TCE) comprises the sum of common share capital, excluding short trading positions in our own shares, retained earnings, contributed surplus, non-controlling interests, and accumulated other comprehensive income, less goodwill and intangible assets other than software. The TCE ratio is calculated by dividing TCE by risk-weighted assets (RWAs).
42
Management’s Discussion and Analysis
The following table provides a reconciliation of non-GAAP to GAAP measures related to consolidated CIBC. The reconciliations of non-GAAP measures of our strategic business units (SBUs) are provided in their respective sections.
Statement of operations measures
| | | | | | | | | | | | | | | | | | | | | | | |
| $ millions, for the year ended October 31 | | | | 2010 | | | 2009 | | | 2008 | | | 2007 | | | 2006 | |
| |
| Net interest income | | | | $ | 6,204 | | | $ | 5,394 | | | $ | 5,207 | | | $ | 4,558 | | | $ | 4,435 | |
| Non-interest income | | | | | 5,881 | | | | 4,534 | | | | (1,493 | ) | | | 7,508 | | | | 6,916 | |
| |
| Total revenue per financial statements | | | | | 12,085 | | | | 9,928 | | | | 3,714 | | | | 12,066 | | | | 11,351 | |
| TEB adjustment | | | | | 53 | | | | 42 | | | | 188 | | | | 297 | | | | 224 | |
| |
Total revenue (TEB)(1) | | A | | $ | 12,138 | | | $ | 9,970 | | | $ | 3,902 | | | $ | 12,363 | | | $ | 11,575 | |
| |
| Trading income (loss) | | | | $ | 821 | | | $ | (294 | ) | | $ | (7,239 | ) | | $ | (310 | ) | | $ | 685 | |
| TEB adjustment | | | | | 49 | | | | 38 | | | | 183 | | | | 292 | | | | 221 | |
| |
Trading income (loss) (TEB)(1) | | | | $ | 870 | | | $ | (256 | ) | | $ | (7,056 | ) | | $ | (18 | ) | | $ | 906 | |
| |
| Non-interest expenses per financial statements | | | | $ | 7,027 | | | $ | 6,660 | | | $ | 7,201 | | | $ | 7,612 | | | $ | 7,488 | |
| Less: amortization of other intangible assets | | | | | 39 | | | | 43 | | | | 42 | | | | 39 | | | | 29 | |
| |
Cash non-interest expenses(1) | | B | | $ | 6,988 | | | $ | 6,617 | | | $ | 7,159 | | | $ | 7,573 | | | $ | 7,459 | |
| |
| Net income (loss) applicable to common shares | | | | $ | 2,283 | | | $ | 1,012 | | | $ | (2,179 | ) | | $ | 3,125 | | | $ | 2,514 | |
| Add: after-tax effect of amortization of other intangible assets | | | | | 30 | | | | 33 | | | | 32 | | | | 29 | | | | 20 | |
| |
Cash net income (loss) applicable to common shares(1) | | C | | $ | 2,313 | | | $ | 1,045 | | | $ | (2,147 | ) | | $ | 3,154 | | | $ | 2,534 | |
| |
| Loans and acceptances (after allowance for credit losses) | | | | $ | 184,576 | | | $ | 175,609 | | | $ | 180,323 | | | $ | 170,678 | | | $ | 151,916 | |
| Add: loans securitized | | | | | 53,669 | | | | 51,826 | | | | 43,409 | | | | 29,983 | | | | 24,740 | |
| |
Managed loans and acceptances(1) | | D | | $ | 238,245 | | | $ | 227,435 | | | $ | 223,732 | | | $ | 200,661 | | | $ | 176,656 | |
| |
| Specific provision for credit losses | | | | $ | 1,201 | | | $ | 1,412 | | | $ | 700 | | | $ | 614 | | | $ | 612 | |
| Add: losses on securitized portfolio | | | | | 132 | | | | 189 | | | | 139 | | | | 151 | | | | 149 | |
| |
Specific provision for credit losses on a managed basis(1) | | E | | $ | 1,333 | | | $ | 1,601 | | | $ | 839 | | | $ | 765 | | | $ | 761 | |
| |
| Basic weighted average of common shares (thousands) | | F | | | 387,802 | | | | 381,677 | | | | 370,229 | | | | 336,092 | | | | 335,135 | |
| Diluted weighted average of common shares (thousands) | | G | | | 388,807 | | | | 382,442 | | | | 371,763 | | | | 339,316 | | | | 338,360 | |
| |
Cash efficiency ratio (TEB)(1) | | B/A | | | 57.6 | % | | | 66.4 | % | | | n/m | | | | 61.3 | % | | | 64.4 | % |
Cash basic EPS(1) | | C/F | | $ | 5.96 | | | $ | 2.74 | | | $ | (5.80 | ) | | $ | 9.38 | | | $ | 7.56 | |
Cash diluted EPS(1)(2) | | C/G | | $ | 5.95 | | | $ | 2.73 | | | $ | (5.80 | ) | | $ | 9.30 | | | $ | 7.49 | |
Loan loss ratio (on managed basis)(1) | | E/D | | | 0.56 | % | | | 0.70 | % | | | 0.38 | % | | | 0.38 | % | | | 0.43 | % |
| |
| | |
| (1) | | Non-GAAP measure. |
| |
| (2) | | In case of a loss, the effect of stock options potentially exercisable on diluted EPS is anti-dilutive; therefore cash basic and cash diluted EPS are the same. n/m Not meaningful. |
Business Unit Allocations
Treasury activities impact the reported financial results of our SBUs – CIBC Retail Markets and Wholesale Banking.
Each line of business within our SBUs is charged or credited with a market-based cost of funds on assets and liabilities, respectively, which impacts the revenue performance of the SBUs. Once the interest and liquidity risk inherent in our customer-driven assets and liabilities is transfer priced into Treasury, it is managed within CIBC’s risk framework and limits. The majority of the revenue from these Treasury activities is then allocated to the “Other” line of business within CIBC Retail Markets and Wholesale Banking.
Treasury also allocates capital to the SBUs in a manner that is intended to consistently measure and align economic costs with the underlying benefits and risks associated with SBU activities. Earnings on unallocated capital and the impact of securitization activities remain in Corporate and Other. Revenue, expenses, and balance sheet resources relating to certain activities are fully allocated to the lines of business.
Non-interest expenses are attributed to the SBUs to which they relate based on appropriate criteria.
We review our transfer pricing and treasury allocations methodologies on an ongoing basis to ensure they reflect changing market environments and industry practices.
To measure and report the results of operations of the lines of business within our CIBC Retail Markets SBU, we use a Manufacturer/ Customer Segment/Distributor Management Model. The model uses certain estimates and allocation methodologies in the preparation of segmented financial information. Under this model, internal payments for sales and trailer commissions and distribution service fees are made among the lines of business. Periodically, the sales and trailer commission rates paid to customer segments for certain products are revised and applied prospectively.
43
Management’s Discussion and Analysis
Business Line Overview
CIBC Retail Markets
CIBC Retail Markets comprises CIBC’s personal banking, business banking and wealth management businesses. We provide a full range of financial products, services and advice to nearly 11 million personal, business and wealth management clients in Canada and the Caribbean, as well as investment management services globally to retail and institutional clients in Hong Kong, Singapore and the Caribbean.
Our objective is to be the primary financial institution for our clients, consolidating their business with us by delivering what matters most – excellent service, strong financial advice and competitive products.
In 2010, we invested in delivering greater access and choice to our clients in how they do their everyday banking:
| • | | Became the first major bank in Canada to launch a mobile banking App for iPhone, and now offer mobile banking for BlackBerry and other smartphone users |
| |
| • | | Opened an additional 35 new or expanded branches, completing our plans to build, relocate or expand 70 branches across Canada a year ahead of schedule |
| |
| • | | CIBC Aerogold Visacredit cards recognized as the top airline travel cards by rewardscanada.ca for the second year in a row |
| |
| • | | Became Canada’s largest dual issuer of credit cards offering a broad range of both Visa and MasterCard credit cards in the premium and mass market categories |
| |
| • | | Delivered debit card innovation with theCIBC Advantage Card, the first debit card in Canada to offer Visa Debit, which provides expanded acceptance for online purchases and international debit transactions |
| |
| • | | NamedBest Consumer Internet Bankin Canada for the past three years byGlobal Finance Magazine |
| |
| • | | Continued our national brand advertising campaign to demonstrate that what matters to our clients, matters to all of us at CIBC |
Priorities
| • | | Provide strong advisory solutions |
| |
| • | | Deliver an excellent client experience |
| |
| • | | Offer competitive products |
| | | | | |
| | | 2010 in Review | | |
Personal banking | | - 5% growth in funds managed
- Largest dual issuer of credit cards in Canada with the acquisition of a MasterCard portfolio
- Key product innovations yielded strong results –CIBC eAdvantage Savings Account, CIBC EverydayPlus Chequing Account, equity-linked GICslinked to stocks and mutual funds
- LaunchedCIBC Advantage Card,the first debit card in Canada with Visa Debit | | Fund managed
($ billions)
 |
44
Management’s Discussion and Analysis
| | | | | |
| | | 2010 in Review | | |
Business banking | | - 6% growth in funds managed
- New leadership and renewed focus on business banking segment
- OfferedCIBC Unlimited Business Operating Account,providing unlimited day-to-day transactions for small business owners | | Fund manged
($ billions)
 |
| | | | | |
Wealth management | | - A leader in managed solutions
- Record long-term net sales growth
- Solid fund performance – 62% of funds with one-year returns above the median
- Growth in high net worth client base | | CIBC Wood Gundy
Assets under administration
($ billions)
 |
| | | | | |
FirstCaribbean | | - Launched mobile banking region-wide, upgraded ABMs, and enhanced the client website
- LaunchedCIBC Axiom Portfoliosmutual fund family, Visa Debit cards, a suite of small business products and commodity derivatives | | Assets
(US $ billions)
 |
45
Management’s Discussion and Analysis
Results(1)
| | | | | | | | | | | | | |
| $ millions, for the year ended October 31 | | 2010 | | | 2009(2) | | | 2008(2) | |
| |
| Revenue | | | | | | | | | | | | |
| Personal banking | | $ | 6,413 | | | $ | 5,932 | | | $ | 5,719 | |
| Business banking | | | 1,360 | | | | 1,282 | | | | 1,308 | |
| Wealth management | | | 1,382 | | | | 1,275 | | | | 1,532 | |
| FirstCaribbean | | | 590 | | | | 713 | | | | 574 | |
| Other | | | (57 | ) | | | 70 | | | | 204 | |
| |
| Total revenue (a) | | | 9,688 | | | | 9,272 | | | | 9,337 | |
| Provision for credit losses | | | 1,252 | | | | 1,382 | | | | 833 | |
| Non-interest expenses (b) | | | 5,421 | | | | 5,228 | | | | 5,418 | |
| |
| Income before taxes and non-controlling interests | | | 3,015 | | | | 2,662 | | | | 3,086 | |
| Income tax expense | | | 809 | | | | 746 | | | | 763 | |
| Non-controlling interests | | | 15 | | | | 21 | | | | 19 | |
| |
| Net income (c) | | $ | 2,191 | | | $ | 1,895 | | | $ | 2,304 | |
| |
| |
| |
| Efficiency ratio (b/a) | | | 56.0 | % | | | 56.4 | % | | | 58.0 | % |
| Amortization of other intangible assets (d) | | $ | 29 | | | $ | 32 | | | $ | 31 | |
Cash efficiency ratio(3)((b-d)/a) | | | 55.7 | % | | | 56.0 | % | | | 57.7 | % |
Return on equity(3) | | | 42.7 | % | | | 38.2 | % | | | 46.8 | % |
Charge for economic capital(3)(e) | | $ | (704 | ) | | $ | (673 | ) | | $ | (634 | ) |
Economic profit(3)(c+e) | | $ | 1,487 | | | $ | 1,222 | | | $ | 1,670 | |
| Average assets ($ billions) | | $ | 268.1 | | | $ | 265.0 | | | $ | 238.5 | |
| Full-time equivalent employees | | | 29,106 | | | | 28,921 | | | | 29,368 | |
| |
| | |
| (1) | | For additional segmented information, see Note 28 to the consolidated financial statements. |
| |
| (2) | | Certain prior year information has been restated to conform to the presentation of the current year. |
| |
| (3) | | For additional information, see the “Non-GAAP measures” section. |
Financial overview
Net income was up $296 million or 16% from 2009. Revenue increased as a result of volume growth across most lines of business, higher fees, and wider spreads, partially offset by lower treasury revenue allocations. Lower provision for credit losses due to the improved economic environment was partially offset by higher non-interest expenses.
Revenue
Revenue was up $416 million or 4% from 2009.
Personal bankingrevenue was up $481 million or 8%. Volume growth across most products, wider spreads in lending products, and the impact of the acquisition of the MasterCard portfolio were partially offset by narrower spreads in deposits.
Business bankingrevenue was up $78 million or 6%, primarily due to volume growth in deposits, higher commercial banking fees, and wider spreads.
Wealth managementrevenue was up $107 million or 8%. Fee income was higher as a result of market-driven increases in asset values.
FirstCaribbeanrevenue was down $123 million or 17% as a result of a stronger Canadian dollar, lower treasury allocations and volumes, and narrower spreads, partially offset by higher securities gains.
Otherwas down $127 million, primarily due to lower treasury revenue allocations.
Provision for credit losses
Provision for credit losses was down $130 million or 9% from 2009. Lower losses were mainly driven by lower delinquencies, bankruptcies and write-offs in the cards and personal lending portfolios.
Non-interest expenses
Non-interest expenses were up $193 million or 4% from 2009, primarily as a result of higher performance-related compensation and pension expense, partially offset by the impact of the stronger Canadian dollar on FirstCaribbean expenses.
Income taxes
Income taxes were up $63 million or 8% from 2009, mainly due to an increase in income, partially offset by a lower effective tax rate.
Average assets
Average assets were marginally higher by $3.1 billion or 1% from 2009.
46
Management’s Discussion and Analysis
Wholesale Banking
Wholesale Banking provides a wide range of credit, capital markets, investment banking, merchant banking and research products and services to government, institutional, corporate and retail clients in Canada and in key markets around the world.
Our objective is to be the premier client-focused wholesale bank based in Canada by bringing Canadian capital markets products to Canada and the rest of the world, and bringing the world to Canada.
In 2010, we focused on market leadership in our core businesses by delivering excellent service and value to our clients. We were:
| • | | Lead coordinator on a $6.0 billion, five-year bond offering, for Canada Housing Trust No. 1 |
| |
| • | | Co-lead arranger and joint bookrunner on a $2.3 billion corporate revolver for Penn West Energy Trust |
| |
| • | | Joint lead and joint bookrunner on a 10-year, $1.0 billion bond offering for TELUS Corporation |
| |
| • | | Sole lead arranger and sole bookrunner on a $1.0 billion corporate revolver for Enerplus |
| |
| • | | Joint bookrunner for Cameco Corporation‘s $908 million bought secondary offering of Centerra Gold Inc. common shares |
| |
| • | | Joint lead agent and joint bookrunner for a $700 million offering of senior notes of Husky Energy Inc. |
| |
| • | | Joint bookrunner on a $287 million bought deal secondary offering for Dollarama Inc. – the second secondary offering since Dollarama’s IPO in October 2009 |
| |
| • | | Finance advisor to the Encana Board of Directors on a $21.0 billion transaction |
Priorities
| • | | Client-focused strategy |
| |
| • | | Market leadership in core businesses |
| |
| • | | Grow with CIBC |
| | | | | |
| | | 2010 in Review | | |
Capital
markets | | - Maintained leadership positions in equity trading, debt capital markets and structured products | | Revenue ($ millions)
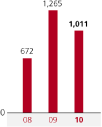
Revenue ($ millions)
 |
| | | | |
| | | - Expanded equity research coverage, with a focus on the energy, mining and materials, and financial services sectors | |
| | | | |
| | | - Improved competitive position with large asset managers and expanded the equity trading client base | |
| | | | |
| | | - Broadened client-focused product capabilities | |
| | | | | |
| | | - Improved foreign exchange market share | |
| | | | |
Corporate and investment banking | | - Maintained strong position in mergers and acquisitions (M&A), equity and debt underwriting, and improved market position in syndicated lending | |
| | | |
| | - Authorized loan commitments up 14.6% | |
| | | |
| | - Strong client-focus | |
47
Management’s Discussion and Analysis
Results(1)
| | | | | | | | | | | | | |
| $ millions, for the year ended October 31 | | 2010 | | | 2009(2) | | | 2008(2) | |
| |
Revenue (TEB)(3) | | | | | | | | | | | | |
| Capital markets | | $ | 1,011 | | | $ | 1,265 | | | $ | 672 | |
| Corporate and investment banking | | | 626 | | | | 775 | | | | 563 | |
| Other | | | 130 | | | | (1,486 | ) | | | (7,004 | ) |
| |
Total revenue (TEB) (3)(a) | | | 1,767 | | | | 554 | | | | (5,769 | ) |
| TEB adjustment | | | 53 | | | | 42 | | | | 188 | |
| |
| Total revenue (b) | | | 1,714 | | | | 512 | | | | (5,957 | ) |
| Provision for credit losses | | | 88 | | | | 218 | | | | 12 | |
| Non-interest expenses (c) | | | 1,147 | | | | 1,060 | | | | 1,318 | |
| |
| Income (loss) before taxes and non-controlling interests | | | 479 | | | | (766 | ) | | | (7,287 | ) |
| Income tax expense (benefit) | | | 125 | | | | (294 | ) | | | (3,104 | ) |
| Non-controlling interests | | | 12 | | | | — | | | | (1 | ) |
| |
| Net income (loss) (d) | | $ | 342 | | | $ | (472 | ) | | $ | (4,182 | ) |
| |
| |
| |
| Efficiency ratio (c/b) | | | 66.9 | % | | | n/m | | | | n/m | |
| Amortization of other intangible assets (e) | | $ | 1 | | | $ | 2 | | | $ | 1 | |
Cash efficiency ratio (TEB)(3)((c-e)/a) | | | 64.9 | % | | | n/m | | | | n/m | |
Return on equity(3) | | | 17.6 | % | | | (20.6 | )% | | | (185.1 | )% |
Charge for economic capital(3)(f) | | $ | (254 | ) | | $ | (347 | ) | | $ | (300 | ) |
Economic profit (loss)(3)(d+f) | | $ | 88 | | | $ | (819 | ) | | $ | (4,482 | ) |
| Average asssets ($ billions) | | $ | 105.1 | | | $ | 110.8 | | | $ | 123.8 | |
| Full-time equivalent employees | | | 1,159 | | | | 1,077 | | | | 1,139 | |
| |
| | |
| (1) | | For additional segmented information, see Note 28 to the consolidated financial statements. |
| |
| (2) | | Certain prior year information has been restated to conform to the presentation of the current year. |
| |
| (3) | | For additional information, see the “Non-GAAP measures” section. |
| |
| n/m | | Not meaningful. |
Financial overview
Net income was $342 million, compared to a net loss of $472 million in 2009. This was primarily due to lower losses in the structured credit run-off business, lower MTM losses on corporate loan hedges, and gains in legacy merchant banking and other run-off businesses compared to losses in the prior year. The current year also benefited from a lower provision for credit losses.
Revenue (TEB)(3)
Revenue was up $1,213 million from 2009.
Capital marketsrevenue was down $254 million, driven by lower revenue from fixed income trading, global derivatives, strategic risk, foreign exchange revenue, and equity new issuances.
Corporate and investment bankingrevenue was down $149 million, primarily due to lower revenue from U.S. real estate finance and equity new issuances.
Otherrevenue was up $1,616 million, primarily due to lower losses in the structured credit run-off business, lower MTM losses on corporate loan hedges, and gains in legacy merchant banking and other run-off businesses, compared to losses in the prior year.
Provision for credit losses
Provision for credit losses was down $130 million from 2009, mainly due to lower losses in the European leveraged finance run-off and U.S. real estate finance portfolios.
Non-interest expenses
Non-interest expenses were up $87 million or 8%, primarily due to higher employee salaries and benefits, expenses related to the ABCP settlement with the OSC, and higher performance-related compensation.
Income taxes
Income tax expense was $125 million, compared to a benefit of $294 million in 2009, largely due to lower losses in the structured credit run-off business.
Average assets
Average assets were down $5.7 billion or 5% from 2009, primarily due to reduced trading activity in our exited and run-off businesses.
48
Management’s Discussion and Analysis
Corporate and Other
Corporate and Other comprises the five functional groups — Technology and Operations; Corporate Development; Finance (including Treasury); Administration; and Risk Management — that support CIBC’s SBUs. It also includes the CIBC Mellon joint ventures, and other income statement and balance sheet items, including the general allowance, not directly attributable to the business lines. The general allowance applicable to FirstCaribbean is determined locally and is included in CIBC Retail Markets. The impact of securitization is retained within Corporate and Other. The remaining revenue and expenses are generally allocated to the SBUs.
Results(1)
| | | | | | | | | | | | | |
| $ millions, for the year ended October 31 | | 2010 | | | 2009 | | | 2008 | |
| |
| Total revenue | | $ | 683 | | | $ | 144 | | | $ | 334 | |
| (Reversal of) provision for credit losses | | | (294 | ) | | | 49 | | | | (72 | ) |
| Non-interest expenses | | | 459 | | | | 372 | | | | 465 | |
| |
| Income (loss) before taxes | | | 518 | | | | (277 | ) | | | (59 | ) |
| Income tax expense (benefit) | | | 599 | | | | (28 | ) | | | 123 | |
| |
| Net loss | | $ | (81 | ) | | $ | (249 | ) | | $ | (182 | ) |
| |
| | | | | | | | | | | | | |
| |
Full-time equivalent employees(2) | | | 12,089 | | | | 11,943 | | | | 12,786 | |
| |
| | |
| (1) | | For additional segmented information, see Note 28 to the consolidated financial statements. |
| |
| (2) | | Prior year information has been restated to conform to the presentation of the current year. |
Financial overview
Net loss was lower by $168 million from 2009, primarily due to a reversal of provision for credit losses in the general allowance and higher unallocated treasury revenue, partially offset by the after-tax impact on capital repatriation activities noted below, higher unallocated corporate support costs, and lower interest income from income tax reassessments.
During the year, capital repatriation activities resulted in accumulated foreign exchange gains, net of hedges, of $416 million, previously recorded in the accumulated other comprehensive income (AOCI), being transferred to non-interest income in the consolidated statement of operations. The after-tax impact of these capital repatriations resulted in a loss of $120 million in the consolidated net income. Our capital repatriation activities in 2009 had resulted in non-interest income of $111 million and an after-tax gain of $7 million. These capital repatriations had no impact on our shareholders’ equity or on our Tier 1 capital ratio.
Revenue
Revenue was up $539 million from 2009, mainly due to higher foreign exchange gains on capital repatriation activities and higher unallocated treasury revenue, partially offset by lower interest income from income tax reassessments.
(Reversal of) provision for credit losses
Reversal of credit losses was $294 million, compared to a provision for credit losses of $49 million in 2009. This was primarily due to a reversal of provision for credit losses in the general allowance for the cards and business and government portfolios, reflective of improved economic conditions, partially offset by lower recoveries on securitized card balances.
Non-interest expenses
Non-interest expenses were up $87 million or 23% from 2009, primarily due to higher unallocated corporate support costs.
Income taxes
Income tax expense was $599 million, compared to an income tax benefit of $28 million in 2009, primarily due to the tax impact of foreign exchange gains on the repatriation activities noted above and higher income.
49
Management’s Discussion and Analysis
Run-off Businesses and Other Selected Activities
Run-off Businesses
Given the uncertain market conditions and to focus on our core businesses in Wholesale Banking, we curtailed activity in our structured credit and non-Canadian leveraged finance businesses and have established a focused team with the mandate to manage and reduce the residual exposures.
Structured credit run-off business
Overview and results
Our structured credit business, within Wholesale Banking, comprised our previous activities as principal and for client facilitation. These activities included warehousing of assets and structuring of special purpose entities (SPEs), which resulted in the holding of unhedged positions. Other activities included intermediation, correlation and flow trading, which earned a spread on matching positions.
Exposures
Our exposures largely consist of the following categories:
Unhedged
| • | | U.S. residential mortgage market (USRMM) |
| |
| • | | Non-USRMM |
Hedged by
| • | | Financial guarantors (non-USRMM) including unmatched positions where we have purchased protection but do not have exposure to the underlying |
| |
| • | | Other counterparties (USRMM and non-USRMM) |
Results
The net loss, before taxes, for the year was $232 million, compared with $1,003 million for the prior year.
The net loss for the year was the result of a reduction in receivables related to purchased protection from financial guarantors on loan assets that are carried at amortized cost due to an improvement of the underlying position MTM, negative impact of the revaluations of the Cerberus note, losses from the transactions to reduce our exposures, and lower MTM of unmatched purchased protection. These losses were partially offset by decreases in CVA relating to financial guarantors driven by MTM recoveries for certain underlying assets and tightening credit spreads, and gains on unhedged positions.
Change in exposures
The following table summarizes our positions within our structured credit run-off business:
| | | | | | | | | |
| US$ millions, as at October 31 | | 2010 | | | 2009 | |
| |
| Notional | | | | | | | | |
| Investments and loans | | $ | 12,006 | | | $ | 10,442 | |
| Written credit derivatives, liquidity and credit facilities | | | 15,163 | | | | 22,710 | |
| |
| Total gross exposures | | $ | 27,169 | | | $ | 33,152 | |
| |
| Purchased credit derivatives | | $ | 21,571 | | | $ | 32,257 | |
| |
We undertook a number of transactions during the year to reduce our exposures, as noted below:
USRMM
| • | | Terminated $610 million (US$582 million) of contracts with financial guarantors (counterparties “I” and “II”), resulting in a pre-tax loss of $48 million (US$46 million); |
| |
| • | | Terminated $60 million (US$59 million) of written credit derivatives and assumed the related securities of the same amount with no significant pre-tax impact as a result; and |
| |
| • | | Assumed the underlying reference securities of written credit derivatives with notional of $883 million (US$829 million). The written credit derivatives were subsequently terminated with no significant pre-tax impact as a result of these transactions. |
Non-USRMM
Collateralized loan obligations (CLOs)
| • | | Terminated $3.7 billion (US$3.5 billion) of written credit derivatives and assumed the related securities of the same amount, some of which were classified as loans, resulting in a pre-tax loss of $5 million (US$5 million); |
| |
| • | | Subsequently sold certain of these and other CLO securities with notional of $1.9 billion (US$1.8 billion), resulting in a pre-tax loss of $35 million (US$34 million); and |
| • | | Terminated $2.9 billion (US$2.8 billion) of hedging contracts with financial guarantors (counterparties “I”, “II”, “III”, “IV” and “VII”), resulting in a pre-tax loss of $50 million (US$48 million). |
Corporate debt
| • | | Terminated $1.9 billion (US$1.8 billion) of written credit derivatives resulting in a pre-tax loss of $3 million (US$3 million); and |
| |
| • | | Terminated $1.8 billion (US$1.8 billion) of related hedging and $3.0 billion (US$2.8 billion) of other unmatched purchased protection contracts with financial guarantors (counterparties “VI” and “IX”), resulting in a pre-tax loss of $25 million (US$24 million). |
50
Management’s Discussion and Analysis
Collateralized debt obligations (CDOs) of trust preferred securities (TruPs)
| • | | Sold TruPs with notional of $243 million (US$240 million), resulting in a pre-tax gain of $57 million (US$56 million); and |
| |
| • | | Terminated $244 million (US$240 million) of related hedging contracts with a financial guarantor (counterparty “II”), resulting in a pre-tax loss of $38 million (US$37 million). |
Commercial mortgage-backed securities (CMBS)
| • | | Terminated $793 million (US$777 million) of unmatched purchased protection contracts with a financial guarantor (previously referred to as counterparty “I”), resulting in a pre-tax loss of $152 million (US$149 million). |
Other non-USRMM
| • | | Terminated $812 million (US$788 million) of hedging contracts on Other non-USRMM exposures with financial guarantors (counterparties “I”, “II” and “IV”) and a non-financial guarantor, resulting in a pre-tax loss of $9 million (US$9 million); |
| |
| • | | The underlying on a $138 million (US$134 million) written credit derivative was redeemed without any loss and therefore our written credit derivative as well as the related hedging contract with a financial guarantor (counterparty “II”) matured. The transactions resulted in a pre-tax gain of $51 million (US$50 million) primarily from reversal of the CVA; |
| |
| • | | Terminated a $231 million (US$225 million) written credit derivative and assumed the related loan of the same amount. We subsequently delivered the loan under the terms of the related hedging contract with a financial guarantor (counterparty “VII”). As a result, related purchased protection became unmatched. There was no significant pre-tax income as a result of the transaction; and |
| |
| • | | Sold security classified as a loan with notional of $77 million (US$75 million), resulting in a pre-tax gain of $8 million (US$8 million). |
Normal amortization reduced the notional of our purchased credit derivatives with financial guarantors by $611 million (US$589 million).
Gain on reduction of unfunded commitment on a variable funding note (VFN)
In the fourth quarter of 2008, we recognized a gain of $895 million (US$841 million), resulting from the reduction to zero of our unfunded commitment on a VFN issued by a CDO. This reduction followed certain actions of the indenture trustee for the CDO following the September 15, 2008 bankruptcy filing of Lehman Brothers Holdings, Inc. (Lehman), the guarantor of a related credit default swap agreement with the CDO.
In September 2010, just prior to the expiration of a statute of limitations, the Lehman Estate instituted an adversary proceeding against numerous financial institutions, indenture trustees and note holders, including CIBC, related to this and more than 40 other CDOs. The Lehman Estate seeks a declaration that the indenture trustee’s actions were improper and that CIBC remains obligated to fund the VFN. In October 2010, the bankruptcy court issued an order, at the request of the Lehman Estate, staying all proceedings in the action for a period of nine months.
Of note, in September 2010, the U.S. District Court for the Southern District of New York agreed to hear Bank of New York’s appeal of the U.S. bankruptcy court ruling in the first quarter of 2010, inLehman Brothers Special Financing, Inc. v. BNY Corporate Trustee Services, Ltd., finding unenforceable a customary provision in a CDO transaction that reversed the priority of the payment waterfall upon the bankruptcy of Lehman, the credit support provider under a related swap agreement. On November 17, 2010, the Lehman Estate advised the U.S. District Court that it has settled this dispute in principle with the sole note holder. At the request of the Lehman Estate, the Court granted a 90-day stay of Bank of New York’s appeal to allow time for the settlement documents to be finalized.
Although there can be no certainty regarding any eventual outcome, we continue to believe that the CDO indenture trustee’s actions in reducing the unfunded commitment on our VFN to zero, were fully supported by the terms of the governing contracts and the relevant legal standards and CIBC intends to vigorously contest the adversary proceeding.
51
Management’s Discussion and Analysis
Total exposures
The exposures held within our structured credit run-off business within Wholesale Banking are summarized in the table below. Only our direct investments and exposures through written credit derivatives to consolidated CDOs are included in this table. The table excludes the protection from Cerberus on our USRMM exposures.
| | | | | | | | | | | | | | | | | | | | | | | | | | | | | | | | | | | | | |
| US$ millions, as at October 31, 2010 | |
| | | Exposures(1) | | | Hedged by | |
| | | | | | Written credit derivatives, | | | | |
| | | | | | | | | | | | | | | liquidity and | | | | | | | | | | | | | | | |
| | | Investments and loans(2) | | | credit facilities(3) | | | Purchased credit derivatives and index hedges | |
| | | | | | | | | | | | | | | | | | | | | | | Financial guarantors | | | Others | |
| | | | | | | | | | | Carrying | | | | | | | | | | | | | | | Fair value | | | | | | | Fair value | |
| | | Notional | | | Fair value | | | value | | | Notional | | | Fair value(4)(5) | | | Notional | | | before CVA(4) | | | Notional | | | before CVA(4) | |
Hedged | | | | | | | | | | | | | | | | | | | | | | | | | | | | | | | | | | | | |
| USRMM – CDOs | | $ | — | | | $ | — | | | $ | — | | | $ | 402 | | | $ | 349 | | | $ | — | | | $ | — | | | $ | 402 | | | $ | 349 | |
| | |
Total USRMM hedged | | $ | — | | | $ | — | | | $ | — | | | $ | 402 | | | $ | 349 | | | $ | — | | | $ | — | | | $ | 402 | | | $ | 349 | |
| | |
| Non-USRMM | | | | | | | | | | | | | | | | | | | | | | | | | | | | | | | | | | | | |
| CLO | | $ | — | | | $ | — | | | $ | — | | | $ | 3,916 | | | $ | 199 | | | $ | 3,668 | | | $ | 189 | | | $ | 249 | | | $ | 15 | |
CLO classified as loans(6) | | | 6,420 | | | | 5,933 | | | | 5,992 | | | | — | | | | — | | | | 6,215 | | | | 331 | | | | 223 | | | | 13 | |
| Corporate debt | | | — | | | | — | | | | — | | | | 8,238 | | | | 217 | | | | 800 | | | | 26 | | | | 7,442 | | | | 199 | |
| Corporate debt (Unmatched) | | | — | | | | — | | | | — | | | | — | | | | — | | | | 1,600 | | | | 11 | | | | — | | | | — | |
Other securities classified as loans(7) | | | 429 | | | | 265 | | | | 343 | | | | — | | | | — | | | | 429 | | | | 165 | | | | — | | | | — | |
| Others | | | 77 | | | | 50 | | | | 50 | | | | 220 | | | | 44 | | | | 165 | | | | 57 | | | | 153 | | | | 7 | |
| Others (Unmatched) | | | — | | | | — | | | | — | | | | — | | | | — | | | | 225 | | | | 225 | | | | — | | | | — | |
| | |
Total non-USRMM hedged | | $ | 6,926 | | | $ | 6,248 | | | $ | 6,385 | | | $ | 12,374 | | | $ | 460 | | | $ | 13,102 | | | $ | 1,004 | | | $ | 8,067 | | | $ | 234 | |
| | |
Total hedged | | $ | 6,926 | | | $ | 6,248 | | | $ | 6,385 | | | $ | 12,776 | | | $ | 809 | | | $ | 13,102 | | | $ | 1,004 | | | $ | 8,469 | | | $ | 583 | |
| | |
Unhedged | | | | | | | | | | | | | | | | | | | | | | | | | | | | | | | | | | | | |
| USRMM – CDOs | | $ | 3,007 | | | $ | 249 | | | $ | 249 | | | $ | 1,430 | | | $ | 1,146 | | | $ | — | | | $ | — | | | $ | — | | | $ | — | |
| | |
Total USRMM unhedged | | $ | 3,007 | | | $ | 249 | | | $ | 249 | | | $ | 1,430 | | | $ | 1,146 | | | $ | — | | | $ | — | | | $ | — | | | $ | — | |
| | |
| Non-USRMM | | | | | | | | | | | | | | | | | | | | | | | | | | | | | | | | | | | | |
| CLO | | $ | 156 | | | $ | 109 | | | $ | 109 | | | $ | 130 | | | $ | 2 | | | $ | — | | | $ | — | | | $ | — | | | $ | — | |
CLO classified as loans(6) | | | 853 | | | | 780 | | | | 786 | | | | — | | | | — | | | | — | | | | — | | | | — | | | | — | |
| Corporate debt | | | 172 | | | | 124 | | | | 124 | | | | — | | | | — | | | | — | | | | — | | | | — | | | | — | |
Montreal Accord related notes(3)(8) | | | 368 | | | | 197 | | | | 197 | | | | 294 | | | | n/a | | | | — | | | | — | | | | — | | | | — | |
Third-party sponsored ABCP conduits(3) | | | 60 | | | | 60 | | | | 60 | | | | 97 | | | | n/a | | | | — | | | | — | | | | — | | | | — | |
| Other securities classified as loans | | | 193 | | | | 172 | | | | 173 | | | | — | | | | — | | | | — | | | | — | | | | — | | | | — | |
Others(3)(9) | | | 271 | | | | 200 | | | | 200 | | | | 436 | | | | 40 | | | | — | | | | — | | | | — | | | | — | |
| | |
Total non-USRMM unhedged | | $ | 2,073 | | | $ | 1,642 | | | $ | 1,649 | | | $ | 957 | | | $ | 42 | | | $ | — | | | $ | — | | | $ | — | | | $ | — | |
| | |
Total unhedged | | $ | 5,080 | | | $ | 1,891 | | | $ | 1,898 | | | $ | 2,387 | | | $ | 1,188 | | | $ | — | | | $ | — | | | $ | — | | | $ | — | |
| | |
Total hedged and unhedged | | $ | 12,006 | | | $ | 8,139 | | | $ | 8,283 | | | $ | 15,163 | | | $ | 1,997 | | | $ | 13,102 | | | $ | 1,004 | | | $ | 8,469 | | | $ | 583 | |
| | |
| October 31, 2009 | | $ | 10,442 | | | $ | 6,721 | | | $ | 7,024 | | | $ | 22,710 | | | $ | 4,152 | | | $ | 23,748 | | | $ | 3,413 | | | $ | 8,509 | | | $ | 681 | |
| | |
| | |
| (1) | | We have excluded our total holdings, including holdings related to our treasury activities, of notional US$792 million (2009: US$868 million) with fair value of US$796 million (2009: US$865 million) in debt securities issued by Federal National Mortgage Association (Fannie Mae) (notional US$42 million, fair value US$42 million), and Government National Mortgage Association (Ginnie Mae) (notional US$750 million, fair value US$754 million). Trading equity securities with a fair value of US$1 million (2009: US$1 million), issued by Student Loan Marketing Association (Sallie Mae), were also excluded. |
| |
| (2) | | Excludes equity and surplus notes that we obtained in consideration for commutation of our USRMM contracts with financial guarantors with notional US$249 million and carrying value US$18 million, as at October 31, 2010 (2009: notional US$261 million and fair value US$39 million). |
| |
| (3) | | Undrawn notional of the liquidity and credit facilities relating to Montreal Accord related notes amounted to US$294 million (2009: US$277 million), relating to third-party non-bank sponsored ABCP conduits amounted to US$97 million (2009: US$61 million), and relating to unhedged Other non-USRMM amounted to nil (2009: US$15 million). |
| |
| (4) | | This is the gross fair value of the contracts, which was typically zero, or close to zero, at the time they were entered into. |
| |
| (5) | | This represents the fair value of written credit derivatives only. |
| |
| (6) | | Investments and loans include unfunded investment commitments with a notional of US$182 million as at October 31, 2010 (2009: US$247 million). |
| |
| (7) | | Represents CDOs with TruPs collateral. |
| |
| (8) | | Includes estimated notional USRMM exposure of US$83 million as at October 31, 2010 (2009: US$104 million). |
| |
| (9) | | Includes warehouse non-residential mortgage-backed securities (RMBS) with notional US$10 million and fair value of nil. |
| |
| n/a | | Not applicable. |
52
Management’s Discussion and Analysis
Cerberus transaction
In 2008, we transacted with Cerberus to obtain downside protection on our hedged and unhedged USRMM CDO exposures while retaining upside participation if the underlying securities recover. As at October 31, 2010, the outstanding principal and fair value of the limited recourse note issued as part of the Cerberus transaction was $535 million (US$525 million) and $526 million (US$516 million), respectively. The underlying USRMM CDO exposures, none of which are now hedged by financial guarantors, consist of securities with fair value of $250 million (US$245 million) and derivative liabilities with notional of $1,445 million (US$1,417 million) and fair value of $1,155 million (US$1,132 million), as at October 31, 2010. During the year, we had a loss of $362 million (US$347 million) on the limited recourse note, including interest expense thereon, which was partially offset by gains of $234 million (US$225 million) on the underlying exposures.
Purchased protection from financial guarantors
The following table presents the notional amounts and fair values of non-USRMM related protection purchased from financial guarantors, and the underlying referenced assets, by counterparty. The fair value net of CVA is included in derivative instruments in other assets on the consolidated balance sheet. We no longer have USRMM related protection purchased from financial guarantors as at October 31, 2010 (2009: notional $588 million; fair value, net of CVA $115 million). Also, we no longer have any purchased protection with counterparty “I” (2009: notional $1,567 million; fair value, net of CVA $206 million).
| | | | | | | | | | | | | | | | | | | | | | | | | | | | | | | | | | | | | | | | | |
| US$ millions, as at October 31, 2010 | | | | | | | | | | | | | |
| | | | | | | | | | | Notional amounts of referenced | | | | | | | Protection purchased from | |
| | | | | | | | | | | non-USRMM assets | | | | | | | financial guarantors | |
| | | | | | | Moody’s | | | | | | | | | | | | | | | | | | | | | | | Fair value | | | | | | | Fair value | |
| | | Standard | | | Investors | | | | | | | Corporate | | | | | | | | | | | Total | | | before | | | | | | | less | |
| Counterparty | | & Poor’s | | | Service | | | CLO | | | debt | | | CMBS | | | Other | | | notional | | | CVA | | | CVA | | | CVA | |
| |
| II | | | R | (6) | | Caa2 | (3) | | | 522 | | | | — | | | | — | | | | — | | | | 522 | | | | 21 | | | | (14 | ) | | | 7 | |
| III | | | — | (4) | | | — | (4) | | | 691 | | | | — | | | | — | | | | 106 | | | | 797 | | | | 79 | | | | (56 | ) | | | 23 | |
IV(5) | | | — | (4) | | | — | (4) | | | 550 | | | | — | | | | — | | | | — | | | | 550 | | | | 31 | | | | (31 | ) | | | — | |
| V | | | — | (4) | | | — | (4) | | | 2,554 | | | | — | | | | — | | | | — | | | | 2,554 | | | | 127 | | | | (31 | ) | | | 96 | |
| VI | | BB | | | Ba1 | | | | — | | | | 2,400 | (2) | | | — | | | | — | | | | 2,400 | | | | 37 | | | | (7 | ) | | | 30 | |
| VII | | AA | + | | Aa3 | (1) | | | 4,203 | | | | — | | | | — | | | | 225 | (2) | | | 4,428 | | | | 462 | | | | (74 | ) | | | 388 | |
| VIII | | AA | + | | Aa3 | (1) | | | 1,288 | | | | — | | | | — | | | | 123 | | | | 1,411 | | | | 109 | | | | (22 | ) | | | 87 | |
| IX | | BB | -(1) | | Ba1 | | | | 75 | | | | — | | | | — | | | | 365 | | | | 440 | | | | 138 | | | | (50 | ) | | | 88 | |
| |
Total financial guarantors | | | | | | | | | | $ | 9,883 | | | $ | 2,400 | | | $ | — | | | $ | 819 | | | $ | 13,102 | | | $ | 1,004 | | | $ | (285 | ) | | $ | 719 | |
| |
| October 31, 2009 | | | | | | | | | | $ | 13,292 | | | $ | 6,959 | | | $ | 777 | | | $ | 2,132 | | | $ | 23,160 | | | $ | 2,880 | | | $ | (1,591 | ) | | $ | 1,289 | |
| |
| | |
| (1) | | Credit watch/outlook with negative implication. |
| |
| (2) | | Includes US$1.6 billion and US$225 million of unmatched purchased protection related to corporate debt and Other non-USRMM, respectively. |
| |
| (3) | | Under review. |
| |
| (4) | | Rating withdrawn or not rated. |
| |
| (5) | | Subsequent to October 31, 2010, we terminated the remaining contacts with this counterparty with no impact on our results. |
| |
| (6) | | Subsequent to October 31, 2010, the rating has been withdrawn. |
The total CVA gain for financial guarantors was $703 million (US$678 million) for the year. Separately, we recorded a net loss of $341 million (US$332 million) on terminations and maturity of contracts with financial guarantors during the year.
As at October 31, 2010, the CVA on credit derivative contracts with financial guarantors was $291 million (US$285 million) (2009: $2.2 billion (US$2.0 billion)), and the fair value of credit derivative contracts with financial guarantors net of CVA was $732 million (US$719 million) (2009: $1.5 billion (US$1.4 billion)). Further significant losses could result depending on the performance of both the underlying assets and the financial guarantors.
In addition, in our other run-off portfolios, we have loans and tranched securities positions that are partly secured by direct guarantees from financial guarantors or by bonds guaranteed by financial guarantors. As at October 31, 2010, these positions were performing and the total amount guaranteed by financial guarantors was approximately $70 million (US$69 million) (2009: $75 million (US$69 million)).
53
Management’s Discussion and Analysis
The following table provides further data and description of the non-USRMM referenced assets underlying the protection purchased from financial guarantors:
| | | | | | | | | | | | | | | | | | | | | | | | | | | | | | | | | | | | | | | | | | | | | | | | | | | | | |
| US$ millions, as at October 31, 2010 | |
| | | | | | | Fair | | | | | | | | | | | | | | | | | | | | | | | | |
| | | | | | | value | | | | | | | | | | | | | | | | | Investment | | | Subordination/ | | | | |
| | | | | | | purchased | | | Total | | | Notional/tranche | | | Fair value/tranche | | | WAL | | | grade | | | attachment(4) | | | Detachment(5) | |
| | | Notional | | | protection | | | tranches(1) | | | High | | | Low | | | High | | | Low | | | in years(2)(3) | | | underlyings | | | Average | | | Range | | | Average | | | Range | |
| |
Hedged | | | | | | | | | | | | | | | | | | | | | | | | | | | | | | | | | | | | | | | | | | | | | | | | | | | | |
| CLO (includes loans) | | $ | 9,883 | | | $ | 520 | | | | 67 | | | $ | 353 | | | $ | 3 | | | $ | 21 | | | $ | — | | | | 3.4 | | | | 2 | % | | | 32 | % | | | 24-67 | % | | | 98 | % | | | 50-100 | % |
| Corporate debt | | | 800 | | | | 26 | | | | 1 | | | | 800 | | | | 800 | | | | 26 | | | | 26 | | | | 3.1 | | | | 51 | % | | | 15 | % | | | 15 | % | | | 30 | % | | | 30 | % |
| Others | | | | | | | | | | | | | | | | | | | | | | | | | | | | | | | | | | | | | | | | | | | | | | | | | | | | |
| TruPs | | | | | | | | | | | | | | | | | | | | | | | | | | | | | | | | | | | | | | | | | | | | | | | | | | | | |
| (includes loans) | | | 519 | | | | 203 | | | | 9 | | | | 89 | | | | 32 | | | | 38 | | | | 8 | | | | 11.7 | | | | n/a | | | | 50 | % | | | 45-57 | % | | | 100 | % | | | 100 | % |
| Other | | | 75 | | | | 19 | | | | 1 | | | | 75 | | | | 75 | | | | 19 | | | | 19 | | | | 3.4 | | | | n/a | | | | 29 | % | | | 29 | % | | | 100 | % | | | 100 | % |
Unmatched | | | | | | | | | | | | | | | | | | | | | | | | | | | | | | | | | | | | | | | | | | | | | | | | | | | | |
| Corporate debt | | | 1,600 | | | | 11 | | | | 2 | | | | 800 | | | | 800 | | | | 7 | | | | 4 | | | | 2.6 | | | | 66 | % | | | 17 | % | | | 15-18 | % | | | 32 | % | | | 30-33 | % |
| Other | | | 225 | | | | 225 | | | | 1 | | | | 225 | | | | 225 | | | | 225 | | | | 225 | | | | 5.1 | | | | n/a | | | | — | | | | — | | | | 100 | % | | | 100 | % |
| | | | | | | | | | | | | | | | | | | | | | | | | |
| | | $ | 13,102 | | | $ | 1,004 | | | | 81 | | | $ | 2,342 | | | $ | 1,935 | | | $ | 336 | | | $ | 282 | | | | | | | | | | | | | | | | | | | | | | | | | |
| |
| | |
| (1) | | A tranche is a portion of a security offered as part of the same transaction where the underlying may be an asset, pool of assets, index or another tranche. The value of the tranche depends on the value of the underlying, subordination and deal specific structures such as tests/triggers. |
| |
| (2) | | The weighted average life (WAL) of the positions is impacted by assumptions on collateral, interest deferrals and defaults, and prepayments, and for TruPs CDOs, also the potential for successful future auctions. These assumptions and the resulting WAL, especially for TruPs CDOs, may change significantly from period to period. |
| |
| (3) | | The WAL of a tranche will typically be shorter than the WAL for the underlying collateral for one or more reasons relating to how cash flows from repayment and default recoveries are directed to pay down the tranche. |
| |
| (4) | | Subordination/attachment points are the level of losses which can be sustained on the collateral underlying the reference assets without those losses impacting the tranches shown above. |
| |
| (5) | | The detachment points are the level of losses on the collateral underlying the reference assets at which point any further losses cease to impact the tranches shown above. |
| |
| n/a | | Not available. |
Hedged positions
CLO
The hedged CLO underlyings consist of 67 tranches. Approximately 11% of the total notional amount of the CLO tranches was rated equivalent to AAA, 69% rated between the equivalent of AA+ and AA-, and the remainder rated between the equivalent of A+ and A-, as at October 31, 2010. Approximately 16% of the underlying collateral was rated equivalent to BB- or higher, 55% was rated between the equivalent of B+ and B-, 13% rated equivalent to CCC+ or lower, with the remainder unrated as at October 31, 2010. The collateral comprises assets in a wide range of industries with the highest concentration in the services (personal and food) industry (21%); the broadcasting, publishing and telecommunication sector (18%); and the manufacturing sector (12%). Only 3% is in the real estate sector. Approximately 69% and 25% of the underlyings represent U.S. and European exposures, respectively.
Corporate debt
The hedged corporate debt underlyings consist of one super senior synthetic CDO tranche that references portfolios of primarily U.S. (63%) and European (20%) corporate debt in various industries (manufacturing – 28%, financial institutions – 16%, cable and telecommunications – 11%, retail and wholesale – 3%). Approximately 9% of the total notional of US$800 million of the corporate debt underlyings were rated equivalent to A- or higher, 42% were rated between the equivalent of BBB+ and BBB-, 35% were rated equivalent to BB+ or lower, with the remainder unrated as at October 31, 2010.
Others
Other hedged positions include CDOs with TruPs collateral, which are Tier I Innovative Capital Instruments issued by U.S. regional banks and insurers, and tranches of CDOs.
Unmatched positions
Corporate debt
The unmatched corporate debt underlyings consist of two super senior synthetic CDO tranches that reference portfolios of primarily U.S. (55%) and European (33%) corporate debt in various industries (manufacturing – 30%, financial institutions – 7%, cable and telecommunications – 14%, retail and wholesale – 9%). Approximately 21% of the total notional amount of US$1.6 billion of the unmatched corporate debt underlyings were rated equivalent to A- or higher, 45% were rated between the equivalent of BBB+ and BBB-, 23% were rated equivalent to BB+ or lower, with the remainder unrated as at October 31, 2010.
Other
The underlying in our other unmatched position is a loan backed by film receivables.
54
Management’s Discussion and Analysis
Purchased protection from other counterparties
The following table provides the notional amounts and fair values, before CVA of US$9 million (2009: US$8 million) of purchased credit derivatives from non-financial guarantor counterparties, excluding unmatched purchased credit derivatives:
| | | | | | | | | | | | | | | | | | | | | | | | | | | | | | | | | |
| | | | | | | | | Total | |
| | | USRMM related | | | Non-USRMM related | | | Notional | | | Fair value | |
| US$ millions, as at October 31 | | Notional | | | Fair value | | | Notional | | | Fair value | | | 2010 | | | 2009 | | | 2010 | | | 2009 | |
| |
| Non-bank financial institutions | | $ | 402 | | | $ | 349 | | | $ | 53 | | | $ | 3 | | | $ | 455 | | | $ | 437 | | | $ | 352 | | | $ | 350 | |
| Banks | | | — | | | | — | | | | 570 | | | | 32 | | | | 570 | | | | 862 | | | | 32 | | | | 86 | |
| Canadian conduits | | | — | | | | — | | | | 7,442 | | | | 199 | | | | 7,442 | | | | 7,166 | | | | 199 | | | | 245 | |
| Others | | | — | | | | — | | | | 2 | | | | — | | | | 2 | | | | 2 | | | | — | | | | — | |
| |
| | | $ | 402 | | | $ | 349 | | | $ | 8,067 | | | $ | 234 | | | $ | 8,469 | | | $ | 8,467 | | | $ | 583 | | | $ | 681 | |
| |
The non-financial guarantor counterparty hedging our USRMM exposures is a large U.S.-based diversified multinational insurance and financial services company with which CIBC has market-standard collateral arrangements. Approximately 99% of other counterparties hedging our non-USRMM exposures have internal credit ratings equivalent to investment grade.
The assets underlying the exposure hedged by counterparties other than financial guarantors are as below:
| | | | | | | | | | | | | | | | | | | | | |
| | | USRMM | | | | |
| | | related | | | Non-USRMM related | |
| | | Notional | | | Notional | |
| | | | | | | | | | | Corporate | | | | | | | |
| US$ millions, as at October 31, 2010 | | CDO(1) | | | CLO(2) | | | debt | | | Other(3) | | | Total | |
| |
| Non-bank financial institutions | | $ | 402 | | | $ | — | | | $ | — | | | $ | 53 | | | $ | 53 | |
| Banks | | | — | | | | 472 | | | | — | | | | 98 | | | | 570 | |
| Canadian conduits | | | — | | | | — | | | | 7,442 | | | | — | | | | 7,442 | |
| Others | | | — | | | | — | | | | — | | | | 2 | | | | 2 | |
| |
| | | $ | 402 | | | $ | 472 | | | $ | 7,442 | | | $ | 153 | | | $ | 8,067 | |
| |
| | |
| (1) | | The US$402 million represents super senior CDO with approximately 68% sub-prime RMBS, 2% Alt-A RMBS, 14% asset-backed securities (ABS) CDO, and 16% non-USRMM. Sub-prime and Alt-A are all pre-2006 vintage. |
| |
| (2) | | All underlyings are non-investment grade. 5% is U.S. exposure and 95% is European exposure. Major industry concentration is in the services industry (32%), the manufacturing sector (14%), the broadcasting and communication industries (12%), and only 5% is in the real estate sector. |
| |
| (3) | | Approximately 91% of the underlyings are investment grade or equivalent based on internal ratings with the majority of the exposure located in the U.S. and Europe. The industry concentration is primarily banking and financial institutions, manufacturing, broadcasting, publishing and telecommunication, with approximately 2% in the real estate sector. |
Canadian conduits
We purchased credit derivative protection from Canadian conduits and generated revenue by selling the same protection to third parties. The reference portfolios consist of diversified indices of corporate loans and bonds. These conduits are in compliance with their collateral posting arrangements and have posted collateral exceeding current market exposure. Great North Trust is sponsored by CIBC and MAV I was party to the Montreal Accord.
| | | | | | | | | | | | | | | |
| | | | | | | | | | | | | Collateral | |
| | | | | | | | | MTM | | | and | |
| | | | | | | | | (before | | | guarantee | |
| US$ millions, as at October 31, 2010 | | Underlying | | Notional(1) | | | CVA) | | | notionals(2) | |
| |
| Great North Trust | | Investment grade corporate credit index(3) | | $ | 4,844 | | | $ | 188 | | | $ | 294 | |
| MAV I | | 160 Investment grade corporates(4) | | | 2,598 | | | | 11 | | | | 339 | |
| |
| | | | | $ | 7,442 | | | $ | 199 | | | $ | 633 | |
| |
| October 31, 2009 | | | | $ | 7,166 | | | $ | 245 | | | $ | 602 | |
| |
| | |
| (1) | | These exposures mature within 2 to 6 years. |
| |
| (2) | | Comprises investment grade notes issued by third-party sponsored conduits, corporate floating rate notes, bankers’ acceptances (BAs), and funding commitments. The fair value of the collateral as at October 31, 2010 was US$652 million (2009: US$566 million). |
| |
| (3) | | Consists of a static portfolio of 126 North American corporate reference entities that were investment grade rated when the index was created. 79% of the entities are rated BBB- or higher. 100% of the entities are U.S. entities. Financial guarantors represent approximately 2% of the portfolio. 4% of the entities have experienced credit events. Original attachment point is 30% and there is no direct exposure to USRMM or the U.S. commercial real estate market. |
| |
| (4) | | The underlying portfolio consists of a static portfolio of 160 corporate reference entities of which 91% were investment grade on the trade date. 82% of the entities are currently rated BBB-or higher (investment grade). 58% of the entities are U.S. entities. Financial guarantors represent approximately 3% of the portfolio. 3% of the entities have experienced credit events. Original attachment point is 20% and there is no direct exposure to USRMM or the U.S. commercial real estate market. |
55
Management’s Discussion and Analysis
Unhedged USRMM exposures
Our remaining net unhedged exposure (excluding the Cerberus protection noted above) to the USRMM, after write-downs, was $544 million (US$533 million) as at October 31, 2010. $469 million (US$460 million) of the net unhedged exposure relates to super senior CDOs of mezzanine RMBS.
Unhedged non-USRMM exposures
Our unhedged exposures to non-USRMM primarily relate to the following categories: CLO, corporate debt, Montreal Accord related notes, third-party non-bank sponsored ABCP conduits and other.
CLO
Our unhedged CLO exposures, including those classified as loans, with notional of $1.2 billion (US$1.1 billion) are mostly tranches rated equivalent to AA or higher as at October 31, 2010, and are primarily backed by diversified pools of U.S. and European-based senior secured leveraged loans.
Corporate debt
Approximately 64%, 11% and 25% of the unhedged corporate debt exposures with notional of $175 million (US$172 million) are related to positions in Canada, Europe, and other countries, respectively.
Montreal Accord related notes
As at October 31, 2010, we held variable rate Class A-1 and Class A-2 notes and various tracking notes with a combined fair value of $201 million, and remaining notional value of $375 million that were originally received in exchange for our non-bank sponsored ABCP in January 2009, upon the ratification of the Montreal Accord restructuring. The notes are expected to mature in December 2016 and are backed by fixed income, traditional securitization and CDO assets as well as super senior credit default swaps on investment grade corporates. The underlying assets that have U.S. subprime mortgage exposures have been isolated and are specifically linked to tracking notes with a notional value of $83 million and a fair value of $8 million as at October 31, 2010.
We have provided $300 million of undrawn Margin Funding Facility to be used if the amended collateral triggers of the related credit derivatives are breached and the new trusts created under the restructuring plan do not have sufficient assets to meet any collateral calls. If the loan facility was fully drawn and subsequently more collateral was required due to breaching further collateral triggers, we would not be obligated to fund any additional collateral, although the consequence would likely be the loss of that $300 million loan.
During the first quarter of 2010, we reached a settlement with the OSC relating to our participation in the ABCP market. Our net loss for the year from the settlement, MTM, and dispositions was $29 million.
Third-party non-bank sponsored ABCP conduits
We provided liquidity and credit related facilities to third-party non-bank sponsored ABCP conduits. As at October 31, 2010, $160 million (US$157 million) of the facilities remained committed, which mostly relate to U.S. CDOs. As at October 31, 2010, $61 million (US$60 million) of the committed facilities were drawn. Of the undrawn facilities, $7 million (US$7 million) were subject to liquidity agreements under which the conduits maintain the right to put their assets back to CIBC at par. The underlying assets of the U.S. CDOs have maturities ranging from less than one year to eight years.
Other
Other unhedged exposures with notional of $918 million (US$900 million) include $75 million (US$74 million) of credit facilities (drawn US$74 million and undrawn nil) provided to SPEs with lottery receivables (36%) and U.S. mortgage defeasance loans (64%).
Included in the above are $646 million (US$633 million) of securities and written protection on tranches of high yield corporate debt portfolios, inflation linked notes, and non-US RMBS with 61% rated the equivalent of AA- or higher, 4% rated between the equivalent of A+ and A-, with the remaining rated equivalent to BB+ or lower.
Other unhedged exposures classified as loans with notional of $197 million (US$193 million) represent primarily investment grade ABS.
European leveraged finance (ELF)
We provided leveraged finance to non-investment grade customers to facilitate their buyout, acquisition and restructuring activities. We generally underwrote leveraged financial loans and syndicated the majority of the loans, earning a fee during the process. We stopped transacting new ELF business in 2008.
Exposures of ELF loans (net of write-downs and allowance for credit losses) by industry are as below:
| | | | | | | | | |
| $ millions, as at October 31, 2010 | | Drawn | | | Undrawn | |
| |
| Manufacturing | | $ | 223 | | | $ | 71 | |
| Hardware and software | | | 219 | | | | 21 | |
| Wholesale trade | | | 198 | | | | 9 | |
| Publishing and printing | | | 36 | | | | 8 | |
| Business services | | | 14 | | | | 16 | |
| Telecommunications | | | 11 | | | | 5 | |
| Transportation | | | 10 | | | | 10 | |
| Utilities | | | 10 | | | | — | |
| |
| Total exposure | | $ | 721 | | | $ | 140 | |
| |
| October 31, 2009 | | $ | 834 | | | $ | 162 | |
| |
As at October 31, 2010, we had drawn leveraged loans of $746 million (2009: $894 million) and unfunded letters of credit and commitments of $140 million (2009: $162 million). The drawn and undrawn amounts include performing notional of $555 million and $65 million, respectively, in respect of certain restructured facilities. Of the drawn loans, $76 million (2009: $99 million) relating to restructured facilities were considered impaired, for which an allowance of $25 million as at October 31, 2010 (2009: $60 million) has been applied. As a result of restructuring, drawn loans of $32 million and undrawn commitments of $29 million were cancelled during the year. In addition, of the total performing loans and commitments, $379 million were on the credit watch list as at October 31, 2010 (2009: $485 million).
Other Selected Activities
In response to the recommendations of the Financial Stability Forum, this section provides additional details on other selected activities.
Securitization business
Our securitization business provides clients access to funding in the debt capital markets. We sponsor several multi-seller conduits in Canada that purchase pools of financial assets from our clients, and finance the purchases by issuing ABCP to investors. We generally provide the conduits with commercial paper backstop liquidity facilities, securities distribution, accounting, cash management, and other financial services.
56
Management’s Discussion and Analysis
As at October 31, 2010, our holdings of ABCP issued by our non-consolidated sponsored multi-seller conduits that offer ABCP to external investors were $110 million (2009: $487 million) and our committed backstop liquidity facilities to these conduits were $2.6 billion (2009: $4.0 billion). We also provided credit facilities of $40 million (2009: $50 million) to these conduits as at October 31, 2010.
The following table shows the underlying collateral and the average maturity for each asset type in these multi-seller conduits:
| | | | | | | | | |
| | | | | | | Estimated | |
| | | | | | | weighted avg. | |
| $ millions, as at October 31, 2010 | | Amount(1) | | | life (years) | |
| |
Asset class | | | | | | | | |
| Credit cards | | $ | 975 | | | | 2.3 | (2) |
| Canadian residential mortgages | | | 489 | | | | 1.2 | |
| Franchise loans | | | 469 | | | | 0.4 | |
| Auto leases | | | 141 | | | | 1.0 | |
| Equipment leases/loans | | | 40 | | | | 0.9 | |
| Other | | | 28 | | | | 1.0 | |
| |
| | | $ | 2,142 | | | | 1.5 | |
| |
| October 31, 2009 | | $ | 3,612 | | | | 1.7 | |
| |
| | |
| (1) | | The committed backstop liquidity facility of these assets was the same as the amounts noted in the table, other than for franchise loans, auto leases and other, for which the facility was $750 million, $197 million, and $187 million, respectively. |
| |
| (2) | | Based on the revolving period and amortization period contemplated in the transaction. |
The short-term notes issued by the conduits are backed by the above assets. The performance of the above assets has met the criteria required to retain the credit ratings of the notes issued by the multi-seller conduits.
We also participated in a syndicated facility for a 364-day commitment of $475 million to a CIBC-sponsored single-seller conduit that provides funding to franchisees of a major Canadian retailer. Our portion of the commitment is $95 million. At October 31, 2010 we funded $72 million (2009: $69 million) by the issuance of bankers’ acceptances.
We also securitize our mortgages and credit card receivables. Details of our consolidated VIEs and securitization transactions during the year are provided in Note 6 to the consolidated financial statements.
U.S. real estate finance
In our U.S. real estate finance business, we operate a full-service platform which originates commercial mortgages to mid-market clients under four programs.
The construction program offers floating-rate financing to properties under construction. The interim program offers fixed and floating-rate financing, typically with an average term of one to three years for properties that are fully leased or with some leasing or renovation yet to be done. In addition the interim program provides operating lines to select borrowers. These programs provide feeder product for the group’s permanent fixed-rate loan program. Once the construction and interim phases are complete and the properties are income producing, borrowers are offered fixed-rate financing within the permanent program (typically with average terms of 10 years). On September 27, 2010, CIBC signed a joint venture agreement with a private equity firm to set up an entity with US$125 million in equity. The entity will originate a pool of US$750 million of newly advanced fixed-rate first mortgages secured by commercial real estate in the U.S. Under the terms of the agreement, we will invest up to US$20 million of equity and provide a US$625 million in senior-ranking credit to the entity. The credit facility is structured with a three-year initial term. Each advance under the facility to fund a loan will be subject to CIBC’s credit approval. We will also provide a US$92 million contingent swap line relating to the entity’s interest rate hedging activity.
The business also maintains CMBS trading and distribution capabilities. As at October 31, 2010, we had CMBS inventory with a notional amount of $9 million (US$9 million) and a fair value of less than $1 million (US$1 million) (2009: less than $1 million (US$1 million)).
The following table provides a summary of our positions in this business:
| | | | | | | | | |
| US$ millions, as at October 31, 2010 | | Drawn | | | Undrawn | |
| |
| Construction program | | $ | 125 | | | $ | 24 | |
| Interim program | | | 1,684 | | | | 218 | |
| Joint venture | | | — | | | | 625 | |
| |
| Total exposure | | $ | 1,809 | | | $ | 867 | |
| |
| October 31, 2009 | | $ | 2,209 | | | $ | 236 | |
| |
As at October 31, 2010, $225 million (US$221 million) (2009: $279 million (US$257 million)) of funded loans were considered impaired and $276 million (US$271 million) of loans and $4 million (US$4 million) of undrawn commitments were included in the credit watch list. As at October 31, 2010, the allowance for credit losses for this portfolio was $76 million (US$75 million). During the year, we recorded a provision for credit losses of $81 million (US$78 million).
U.S. leveraged finance
We sold our U.S. leveraged finance business as part of our sale of some of our U.S. businesses to Oppenheimer Holdings Inc. (Oppenheimer) in fiscal 2008. Under the transaction, the leveraged loans in existence at the time of the sale remained with us. These loans are being managed to maturity. In addition, under the current terms of our agreement with Oppenheimer, we agreed to provide a loan warehouse facility of up to $2.0 billion (US$2.0 billion) to finance and hold syndicated loans originated for U.S. middle market companies by Oppenheimer. Underwriting of any loan for inclusion in this facility is subject to joint credit approval by Oppenheimer and CIBC. Exposures of our U.S. leveraged loans, including loans originated through Oppenheimer (net of allowance for credit losses of $16 million (US$15 million) as at October 31, 2010) are summarized in the table below.
| | | | | | | | | |
| US$ millions, as at October 31, 2010 | | Drawn | | | Undrawn(1) | |
| |
| Transportation | | $ | 114 | | | $ | 43 | |
| Gaming and lodging | | | 17 | | | | 32 | |
| Healthcare | | | 30 | | | | 93 | |
| Media and advertising | | | 24 | | | | 21 | |
| Manufacturing | | | 20 | | | | 82 | |
| Other | | | 22 | | | | 44 | |
| |
| Total exposure | | $ | 227 | | | $ | 315 | |
| |
| October 31, 2009 | | $ | 370 | | | $ | 575 | |
| |
| | |
| (1) | | Includes unfunded letters of credit of US$23 million (2009: US$36 million). |
As at October 31, 2010, we had $13 million (US$13 million) of net impaired loans, and $127 million (US$125 million) of loans and $31 million (US$31 million) of undrawn commitments included in the credit watch list. No provision for credit losses was recognized during the year.
57
Management’s Discussion and Analysis
Financial Condition
Review of Consolidated Balance Sheet
| | | | | | | | | |
| $ millions, as at October 31 | | 2010 | | | 2009 | |
| |
Assets | | | | | | | | |
| Cash and deposits with banks | | $ | 12,052 | | | $ | 7,007 | |
| |
| Securities | | | | | | | | |
| Trading | | | 28,557 | | | | 15,110 | |
| AFS | | | 26,621 | | | | 40,160 | |
| FVO | | | 22,430 | | | | 22,306 | |
| |
| | | | 77,608 | | | | 77,576 | |
| |
| Securities borrowed or purchased under resale agreements | | | 37,342 | | | | 32,751 | |
| |
| Loans | | | | | | | | |
| Residential mortgages | | | 93,568 | | | | 86,152 | |
| Personal | | | 34,335 | | | | 33,869 | |
| Credit card | | | 12,127 | | | | 11,808 | |
| Business and government | | | 38,582 | | | | 37,343 | |
| Allowance for credit losses | | | (1,720 | ) | | | (1,960 | ) |
| |
| | | | 176,892 | | | | 167,212 | |
| |
| Derivative instruments | | | 24,682 | | | | 24,696 | |
| Other assets | | | 23,464 | | | | 26,702 | |
| |
| | | $ | 352,040 | | | $ | 335,944 | |
| |
Liabilities and shareholders’ equity | | | | | | | | |
| Deposits | | | | | | | | |
| Personal | | $ | 113,294 | | | $ | 108,324 | |
| Business and government | | | 127,759 | | | | 107,209 | |
| Bank | | | 5,618 | | | | 7,584 | |
| |
| | | | 246,671 | | | | 223,117 | |
| |
| Derivative instruments | | | 26,489 | | | | 27,162 | |
| Obligations related to securities lent or sold short or under repurchase agreements | | | 37,893 | | | | 43,369 | |
| Other liabilities | | | 20,256 | | | | 22,090 | |
| Subordinated indebtedness | | | 4,773 | | | | 5,157 | |
| Preferred share liabilities | | | — | | | | 600 | |
| Non-controlling interests | | | 168 | | | | 174 | |
| Shareholders’ equity | | | 15,790 | | | | 14,275 | |
| |
| | | $ | 352,040 | | | $ | 335,944 | |
| |
Assets
As at October 31, 2010, total assets increased by $16.1 billion or 5% from 2009.
Cash and deposits with banks were up $5.0 billion or 72%, mainly due to higher treasury deposit placements.
Securities overall were at the same levels as at October 31, 2009. Trading securities increased mainly in the equity portfolio whereas AFS securities decreased mainly in government issued bonds. Further details on the composition of securities are provided in Note 4 to the consolidated financial statements and in the “Supplementary annual financial information” section.
Securities borrowed or purchased under resale agreements increased by $4.6 billion or 14% primarily due to client demand.
Loans increased by $9.7 billion or 6% mainly due to an increase in residential mortgages resulting from volume growth, net of new securitizations and repayments. The acquisition of the MasterCard portfolio during the year also contributed to the growth in loans. A detailed discussion of the loan portfolios is included in the “Management of risk” section. Further details on the composition of loans are provided in Note 5 to the consolidated financial statements and in the “Supplementary annual financial information” section.
Other assets were down $3.2 billion or 12%, mainly due to lower collateral pledged, future income tax assets, and bankers’ acceptances.
58
Management’s Discussion and Analysis
Liabilities
Total liabilities as at October 31, 2010 were up by $14.6 billion or 5% from 2009. Deposits were up $23.6 billion or 11%, primarily due to the issuance of medium term notes and covered bonds, retail volume growth, and reclassification of certain payables from other liabilities during the year. Further details on the composition of deposits are provided in Note 10 to the consolidated financial statements and in the “Supplementary annual financial information” section.
Obligations related to securities lent or sold short or under repurchase agreements decreased by $5.5 billion or 13%, primarily due to funding requirements.
Other liabilities decreased by $1.8 billion or 8%, primarily due to reclassification of certain payables to deposits noted above, partially offset by a payable outstanding relating to the redemption of preferred share liabilities on October 31, 2010 noted below.
Subordinated indebtedness decreased by $0.4 billion or 7% as the issuance of debentures was more than offset with the redemption of debentures during the year. See the “Capital resources” section for more details.
The preferred share liabilities were redeemed on October 31, 2010. See Note 17 to the consolidated financial statements for more details.
Shareholders’ equity
Shareholders’ equity as at October 31, 2010 was up by $1.5 billion or 11%, mainly due to a net increase in retained earnings and the issuance of common shares pursuant to the stock option, shareholder investment, and employee share purchase plans.
Capital Resources
Our capital strength protects our depositors and creditors from risks inherent in our businesses, allows us to absorb unexpected losses, and enables us to take advantage of attractive business opportunities. It also enables us to maintain a favourable credit standing and to raise additional capital or other funding on attractive terms. Our objective is to maintain a strong and efficient capital base. We manage and monitor our capital to maximize risk-adjusted return to shareholders and to meet regulatory requirements.
Basel II Capital Accord and recent revisions to regulatory capital requirements
On November 1, 2007, we adopted the Basel II capital management framework, which enhances the risk sensitivity of minimum regulatory capital requirements.
In July 2009, the Basel Committee on Banking Supervision (BCBS) issued a series of guidelines to enhance the Basel II capital management framework. The guidelines include revisions to the Basel II market risk framework, enhancements to the Basel II credit risk framework, and the introduction of capital requirements for incremental risk in the trading book. These guidelines strengthen the rules governing trading book capital as well as increase the capital requirements for securitization and re-securitization activities. In addition, the amendment prescribes expanded supervisory review of internal risk management activities surrounding securitization and re-securitization activities, as well as increased disclosure for such activities. We are working on a series of enhancements to our market Value-at-Risk (VaR) models in order to meet the new regulatory requirements and ensure a comprehensive assessment of risk, which will increase our VaR measure and regulatory capital requirements. These enhancements are required to be implemented by the first quarter of fiscal 2012.
In December 2009, the BCBS issued a consultative document which proposed increases to the quality, quantity, and consistency of capital, with the goal of strengthening the resilience of the banking sector. In July 2010, amendments to the original proposals were released, followed in September 2010 by details on phase-in arrangements and minimum requirements. While the proposed new capital rules are expected to be finalized by the BCBS by the end of 2010, the BCBS may continue to refine certain aspects of reforms after 2010. We have analyzed the impact that the guidelines could have on our capital position, and are confident that we will be able to meet the new requirements.
Regulatory capital and ratios
Our minimum regulatory capital requirements are determined in accordance with guidelines issued by OSFI. The OSFI guidelines evolved from the framework of risk-based capital standards developed by the Bank for International Settlements (BIS). The BIS framework allows some domestic regulatory discretion in determining capital. Capital ratios of banks in different countries are, therefore, not strictly comparable unless adjusted for discretionary differences.
Current BIS standards require that banks maintain minimum Tier 1 and Total capital ratios of 4% and 8%, respectively. OSFI has established that Canadian deposit-taking financial institutions maintain Tier 1 and Total capital ratios of at least 7% and 10%, respectively.
Total regulatory capital consists of Tier 1 and Tier 2 capital. The components of our regulatory capital are shown in the table below.
Capital adequacy requirements are applied on a consolidated basis. The consolidation basis applied to CIBC’s financial statements is described in Note 1 to the consolidated financial statements. All subsidiaries, except certain investments and holdings which are not subject to risk assessment under Basel II and are instead deducted from regulatory capital, are included for regulatory capital calculation purposes. A deduction approach applies to investments in insurance subsidiaries, substantial investments, and applicable securitization-related activities. Our Canadian insurance subsidiary, CIBC Life Insurance Company Limited, is subject to OSFI’s Minimum Continuing Capital Surplus Requirements for life insurance companies.
As a result of our holdings of subordinated enhancement notes issued by Cards II Trust, commencing the fourth quarter of 2009, we are required to hold regulatory capital for the underlying securitized credit card receivables as if they had remained on our balance sheet. We apply the same capital treatment to the securitized credit card receivables relating to Broadway Trust; these assets resulted from our acquisition of the MasterCard portfolio on September 1, 2010, which included the acquisition of all subordinated enhancement notes issued by Broadway Trust (see “Significant events” section for additional details). In aggregate, applying this treatment to Cards II Trust and Broadway Trust resulted in a reduction of our Tier 1 and Total capital ratios by approximately 0.34% and 0.42%, respectively.
59
Management’s Discussion and Analysis
| | | | | | | | | |
| $ millions, as at October 31 | | 2010 | | | 2009 | |
| |
Tier 1 capital | | | | | | | | |
| Common shares | | $ | 6,804 | | | $ | 6,241 | |
| Contributed surplus | | | 96 | | | | 92 | |
| Retained earnings | | | 6,095 | | | | 5,156 | |
| Net after-tax fair value losses arising from changes in institution’s own credit risk | | | 1 | | | | 4 | |
| Foreign currency translation adjustments | | | (575 | ) | | | (495 | ) |
| Net after-tax unrealized holding losses on AFS equity securities | | | — | | | | (14 | ) |
Non-cumulative preferred shares(1) | | | 3,156 | | | | 3,756 | |
| Innovative instruments | | | 1,599 | | | | 1,599 | |
| Certain non-controlling interests in subsidiaries | | | 168 | | | | 174 | |
| Goodwill | | | (1,913 | ) | | | (1,997 | ) |
| Gains on sale of applicable securitized assets | | | (58 | ) | | | (59 | ) |
50/50 deductions from each of Tier 1 and Tier 2(2) | | | (522 | ) | | | (303 | ) |
| |
| | | | 14,851 | | | | 14,154 | |
| |
Tier 2 capital | | | | | | | | |
| Perpetual subordinated indebtedness | | | 270 | | | | 286 | |
| Other subordinated indebtedness (net of amortization) | | | 4,404 | | | | 4,736 | |
| Net after-tax unrealized holding gains on AFS equity securities | | | 4 | | | | — | |
| Eligible general allowance (standardized approach) | | | 126 | | | | 119 | |
50/50 deductions from each of Tier 1 and Tier 2(2) | | | (522 | ) | | | (303 | ) |
Investment in insurance activities(3) | | | (167 | ) | | | (165 | ) |
| |
| | | | 4,115 | | | | 4,673 | |
| |
| Total capital available for regulatory purposes | | $ | 18,966 | | | $ | 18,827 | |
| |
Regulatory capital ratios | | | | | | | | |
| Tier 1 capital | | | 13.9 | % | | | 12.1 | % |
| Total capital | | | 17.8 | % | | | 16.1 | % |
| |
| Assets-to-capital multiple | | | 17.0x | | | | 16.3x | |
| |
| | |
| (1) | | Non-cumulative preferred share liabilities included in Tier 1 capital were redeemed as at October 31, 2010 (2009: $600 million). |
| |
| (2) | | Items which are deducted 50% from each of Tier 1 capital and Tier 2 capital include allowance shortfall calculated under AIRB approach, securitization exposures (other than gain on sale of applicable securitized assets), and substantial investments in unconsolidated entities. |
| |
| (3) | | Investment in insurance activities continues to be deducted 100% from Tier 2 capital in accordance with OSFI’s transition rules. |
The Tier 1 ratio was up 1.8% and the Total capital ratio was up 1.7% from October 31, 2009. The capital ratios benefited from lower RWAs and an increase in both Tier 1 and Total regulatory capital.
The $10.6 billion decrease in RWAs was largely attributable to a decrease in structured credit exposure to financial guarantors, the effect of a strengthening Canadian dollar on foreign currency denominated assets, updates to advanced internal ratings based (AIRB) model parameters, and a reduction in our future tax asset, partially offset by the acquisition of the MasterCard portfolio.
Tier 1 and Total regulatory capital increased mainly due to internal capital generation and the issuance of common shares, offset in part by the redemption of preferred shares noted below. The Total regulatory capital as at October 31, 2010 also reflected the issuance and redemption of subordinated debt noted below.
Capital management
Our capital management policies, established by the Board, relate to capital strength, capital mix, dividends and return of capital, and the unconsolidated capital adequacy of regulated entities. Each year a capital plan and three-year outlook are established, which encompass all the associated elements of capital: forecasts of sources and uses, maturities, redemptions, new issuances, corporate initiatives and business growth. The capital plan is stress-tested in various ways to ensure that it is sufficiently robust under all reasonable scenarios. We maintain a process which determines plausible but stressed economic scenarios, and then apply these stresses to the vast majority of our exposures to determine the impact on the consolidated statement of operations, RWA requirements, and consequently, key capital ratios. This helps us analyze the potential risks within our portfolios and establish prudent capital levels in excess of the regulatory minimum requirements. All of the elements of capital are monitored throughout the year and the capital plan is adjusted as appropriate.
The following were the main capital initiatives undertaken in 2010:
Subordinated debt
On April 30, 2010, we issued $1,100 million principal amount of 4.11% Debentures (subordinated indebtedness) due April 30, 2020. The Debentures qualify as Tier 2 regulatory capital.
On September 9, 2010, we redeemed all $1,300 million of our 3.75% Debentures (subordinated indebtedness) due September 9, 2015. The Debentures were redeemed at 100% of the principal amount, plus accrued interest thereon.
Subsequent to the year-end, on November 2, 2010, we issued $1,500 million principal amount of 3.15% Debentures (subordinated indebtedness) due November 2, 2020. The Debentures qualify as Tier 2 capital.
60
Management’s Discussion and Analysis
Preferred shares
On October 31, 2010, we redeemed the following non-cumulative Class A Preferred Shares:
| • | | 8 million of Series 19 with a par value of $25 each for a redemption price of $25.45 each; and |
| |
| • | | 16 million of Series 23 with a par value of $25 each for a redemption price of $25.00 each. |
Common shares
During the year, we issued 1.9 million (2009: 1.0 million) new common shares for a total consideration of $88 million (2009: $41 million), pursuant to stock option plans.
Under CIBC’s Shareholder Investment Plan (Plan), shareholders may elect to reinvest dividends received on common or preferred shares into additional common shares, and purchase additional common shares through optional cash contributions. Under the Plan, we may elect to have shares issued from Treasury or purchased in the open market. If the shares are issued from Treasury, we may offer a discount on reinvested dividends. In 2010, we issued shares from Treasury at a 3% discount from the average market price (as defined in the Plan) for reinvested dividends. During 2010, we issued 6.0 million (2009: 2.2 million) new common shares for a total consideration of $419 million (2009: $137 million), pursuant to the Plan.
Effective February 2010, employee contributions to CIBC’s Canadian Employee Share Purchase Plan (ESPP) have been used to purchase common shares issued from Treasury. For additional details about the ESPP, see Note 21 to the consolidated financial statements. During 2010, we issued 0.8 million new common shares for a total consideration of $56 million, pursuant to the ESPP.
Dividends
During the year, we paid quarterly dividends of 87 cents per common share. Common and preferred share dividends are declared quarterly at the discretion of the Board. The declaration and payment of dividends is governed by Section 79 of the Bank Act (Canada), the terms of the preferred shares, and the terms of the Notes issued by CIBC Capital Trust, as explained in Notes 17 and 18 to the consolidated financial statements.
Economic capital
Economic capital provides the financial framework to evaluate the returns of each business line, commensurate with the risk taken. It comprises the capital required to protect against unexpected losses, in periods of near catastrophic “worst case” loss scenarios, while remaining an independent going concern. Economic capital is therefore an estimate of the amount of equity capital required by the businesses to absorb losses consistent with our targeted risk rating over a one-year horizon. The economic capital methodologies that we employ quantify the level of inherent risk within our products, clients and business lines, as required. This enables us to measure and compare risk-adjusted returns across products and business lines, and contributes to the analysis of where to direct the allocation of balance sheet resources.
Our economic capital methodology comprises a number of key risk types including credit, strategic, operational, investment, and market.
Total economic capital by risk type
Total economic capital by segment
61
Management’s Discussion and Analysis
Risk-weighted assets
Under the Basel II AIRB approach, credit RWAs are calculated according to the mathematical formula utilizing probability of default (PD), loss given default (LGD), and exposure at default (EAD), and in some cases, maturity adjustments.
Under the Basel II standardized approach, credit RWAs are calculated by applying the weighting factors specified in the OSFI guidelines to on- and off-balance sheet exposures. RWAs for market risk in the trading portfolio are statistically estimated based on models approved by OSFI. RWAs for operational risk related to losses from inadequate or failed processes, people, and systems are estimated under a model-based approach approved by OSFI.
| | | | | | | | | |
| | | Risk-weighted amounts | |
| $ millions, as at October 31 | | 2010 | | | 2009 | |
| |
Credit risk | | | | | | | | |
| Standardized approach | | | | | | | | |
| Corporate | | $ | 4,729 | | | $ | 5,554 | |
| Sovereign | | | 178 | | | | 202 | |
| Banks | | | 394 | | | | 405 | |
| Real estate secured personal lending | | | 1,653 | | | | 1,716 | |
| Other retail | | | 2,288 | | | | 875 | |
| |
| | | | 9,242 | | | | 8,752 | |
| AIRB approach | | | | | | | | |
| Corporate | | | 31,236 | | | | 34,388 | |
| Sovereign | | | 1,595 | | | | 1,670 | |
| Banks | | | 3,902 | | | | 3,552 | |
| Real estate secured personal lending | | | 4,213 | | | | 4,894 | |
| Qualifying revolving retail | | | 14,281 | | | | 14,801 | |
| Other retail | | | 5,302 | | | | 5,650 | |
Equity(1) | | | 695 | | | | 896 | |
| Trading book | | | 3,516 | | | | 7,588 | |
| Securitizations | | | 1,761 | | | | 2,522 | |
| Adjustment for scaling factor | | | 3,990 | | | | 4,558 | |
| |
| | | | 70,491 | | | | 80,519 | |
| Other credit risk-weighted assets | | | 7,049 | | | | 7,919 | |
| |
| Total credit risk | | | 86,782 | | | | 97,190 | |
Market risk (Internal Models Approach) | | | 1,625 | | | | 1,321 | |
Operational risk
(Advanced Measurement Approach) | | | 18,256 | | | | 18,787 | |
| |
| Total risk-weighted assets | | $ | 106,663 | | | $ | 117,298 | |
| |
Outstanding share data
| | | | | | | | | | | | | | | | | |
| | | Conversion for common shares | |
| | | Shares outstanding | | | CIBC’s | | | Shareholders’ | |
| As at November 26, 2010 | | No. of shares | | | $ millions | | | conversion date | | | conversion date | |
| |
Common shares(1) | | | 392,953,553 | | | $ | 6,817 | | | | | | | | | |
Class A Preferred Shares | | | | | | | | | | | | | | | | |
Classified as equity | | | | | | | | | | | | | | | | |
| Series 18 | | | 12,000,000 | | | $ | 300 | | | not convertible | | not convertible |
| Series 26 | | | 10,000,000 | | | | 250 | | | April 30, 2008 | | not convertible |
| Series 27 | | | 12,000,000 | | | | 300 | | | October 31, 2008 | | not convertible |
| Series 28 | | | 2,000 | | | | — | (2) | | not convertible | | not convertible |
| Series 29 | | | 13,232,342 | | | | 331 | | | May 1, 2010 | | not convertible |
| Series 30 | | | 16,000,000 | | | | 400 | | | not convertible | | not convertible |
| Series 31 | | | 18,000,000 | | | | 450 | | | not convertible | | not convertible |
| Series 32 | | | 12,000,000 | | | | 300 | | | not convertible | | not convertible |
| Series 33 | | | 12,000,000 | | | | 300 | | | not convertible | | not convertible |
| Series 35 | | | 13,000,000 | | | | 325 | | | not convertible | | not convertible |
| Series 37 | | | 8,000,000 | | | | 200 | | | not convertible | | not convertible |
| |
| Total | | | | | | $ | 3,156 | | | | | | | | | |
| |
Stock options outstanding | | | 5,484,153 | | | | | | | | | | | | | |
| |
| | |
| (1) | | Net of treasury shares. |
| |
| (2) | | Due to rounding. |
As noted in the table above, Class A Preferred Shares Series 26, 27, and 29 provide CIBC with the right to convert the shares to common shares on or after a specified conversion date. Each such share is convertible into a number of common shares, determined by dividing the then applicable cash redemption price by 95% of the average common share price (as defined in the relevant short form prospectus or prospectus supplement), subject to a minimum price of $2.00 per share.
Non-cumulative Rate Reset Class A Preferred Shares, Series 33 (Series 33 shares) may be converted on a one-for-one basis into non-cumulative Floating Rate Class A Preferred Shares Series 34 (Series 34 shares) at the holder’s option on July 31, 2014. Thereafter, Series 33 shares and Series 34 shares are convertible, one to the other, at every fifth anniversary of July 31, 2014.
62
Management’s Discussion and Analysis
Non-cumulative Rate Reset Class A Preferred Shares Series 35 (Series 35 shares) may be converted on a one-for-one basis into non-cumulative Floating Rate Class A Preferred Shares Series 36 (Series 36 shares) at the holder’s option on April 30, 2014. Thereafter, Series 35 shares and Series 36 shares are convertible, one to the other, at every fifth anniversary of April 30, 2014.
Non-cumulative Rate Reset Class A Preferred Shares Series 37 (Series 37 shares) may be converted on a one-for-one basis into non-cumulative Floating Rate Class A Preferred Shares Series 38 (Series 38 shares) at the holder’s option on July 31, 2014. Thereafter, Series 37 shares and Series 38 shares are convertible, one to the other, at every fifth anniversary of July 31, 2014.
Off-balance Sheet Arrangements
Off-balance sheet arrangements include securitizations, derivatives, credit-related arrangements, and guarantees. These off-balance sheet arrangements are either not recorded on the consolidated balance sheet or are recorded in amounts that differ from the full contract or notional amounts. They could have a current or future effect on our financial condition as they involve, among other risks, varying elements of market, credit, and liquidity risk, as discussed in the “Management of risk” section. Off-balance sheet arrangements are generally undertaken both as a revenue-generating business activity and for risk management, capital management, and/or funding management purposes.
Securitizations
Off-balance sheet arrangements may involve the use of VIEs. VIEs may be formed as corporations, partnerships, limited liability companies or trusts. They are an important part of the financial markets, providing market liquidity by facilitating investors’ access to specific portfolios of assets and risks.
VIEs are often used for securitizing our own assets or third-party assets. In a securitization, an entity transfers assets to a VIE in exchange for cash. The VIE will fund these purchases by issuing ownership interests and debt securities to third-party investors.
VIEs are also used to create investment products by aggregating pools of assets and issuing ABCP or longer-term multi-tiered debt instruments which may include super senior, senior, mezzanine, and equity tranches. Often these VIEs are referred to by reference to the types of assets that are aggregated within the VIE, such as RMBS which aggregate residential mortgage loans, or CLOs which aggregate corporate loans. In addition, VIEs can also aggregate debt securities issued by other VIEs, such as RMBS, in which case they are referred to as CDOs. In more complex structures, VIEs aggregate securities issued by other CDOs and then issue a further tranche of debt securities.
VIEs are generally structured to be bankruptcy remote, thereby insulating investors from creditors of other entities, including the asset seller. Investors can benefit from and may have recourse to, the VIE assets, including a cash collateral account and over-collateralization in the form of excess assets, a liquidity facility or a guarantee or other forms of credit enhancements. Accordingly, the debt securities issued by the VIE may obtain a more favourable credit rating from rating agencies than the transferor could obtain for its own debt issuance, resulting in lower financing costs.
We engage one or more of the four major rating agencies, Moody’s Investors Service (Moody’s), DBRS, Standard & Poor’s (S&P) and Fitch Ratings Limited (Fitch), to opine on the credit ratings of ABS issued by our sponsored securitization vehicles. In the event that ratings differ between rating agencies, we use the more conservative rating.
Securitization of our own assets
Securitization of our own assets provides us with an additional source of liquidity. It may also reduce our risk exposure and provide regulatory capital relief. Securitizations are accounted for as asset sales only when we surrender control of the transferred assets and receive consideration other than beneficial interests in the transferred assets. Accounting standards require a determination to be made as to whether the VIE that purchases these assets should be consolidated into our financial statements. We record the transaction as a sale of assets when the aforementioned criteria are met and when we are not required to consolidate the VIE. When such asset sales occur, we may retain residual components of the securitized assets, such as interest-only strips, one or more senior or subordinated tranches of debt, and cash reserve accounts, all of which are considered retained interests in the securitized assets. We continue to service all securitized assets after transfer.
The following table provides details on our securitized assets. Further details on our securitization transactions are provided in Note 6 to the consolidated financial statements.
| | | | | | | | | | | | | | | |
| $ millions, as at or for the year ended | | Residential | | | Credit | | | Commercial | |
| October 31 | | | | mortgages | | | cards | | | mortgages | |
| |
2010 | | Outstanding securitized assets | | $ | 49,435 | | | $ | 3,797 | | | $ | 437 | |
| | | Retained interests insecuritized assets | | | 1,105 | | | | 467 | | | | — | |
| | | Liquidity facilities(1) | | | 772 | | | | — | | | | — | |
| | | Securitization revenue(2) | | | 277 | | | | 354 | | | | — | |
| |
| 2009 | | Outstanding securitized assets | | $ | 49,038 | | | $ | 2,239 | | | $ | 549 | |
| | | Retained interests in securitized assets | | | 1,178 | | | | 279 | | | | — | |
| | | Liquidity facilities(1) | | | 443 | | | | — | | | | — | |
| | | Securitization revenue(2) | | | 210 | | | | 308 | | | | — | |
| |
| | |
| (1) | | Net of investments in our securitization vehicles. |
| |
| (2) | | Includes net gain on sale of securitized assets of $259 million (2009: $144 million). |
Residential mortgage loans
We securitize insured fixed- and variable-rate residential mortgages through the creation of MBS under the Canada Mortgage Bond (CMB) program, sponsored by Canada Mortgage and Housing Corporation (CMHC), and the Government of Canada National Housing Act MBS Auction process. Under both programs, the MBS are sold to a trust that issues securities to investors. During the year, we sold approximately $12.1 billion (2009: $20.3 billion) of MBS under these programs. We maintain the client account relationships and continue to service the securitized loans. We also enter into swap arrangements with CMHC to receive interest cash flows from the securitized MBS assets in return for paying interest on the bond issued by CMHC. In addition to interest on the MBS assets, the swap arrangement entitles us to any interest earned on CMHC’s principal reinvestment account resulting from principal repaid on those MBS assets.
63
Management’s Discussion and Analysis
We also securitize Canadian insured prime mortgages and uninsured Near-Prime/Alt-A mortgages to a qualifying special purpose entity (QSPE), which we are not required to consolidate. During the year, we sold $0.4 billion (2009: $0.5 billion) of these mortgages into the QSPE. We have retained interest in those mortgages through the retention of an excess spread and cash reserve accounts that are subordinate to the funding obligations to investors of the ABS. We are also counterparty to interest rate swap agreements and provide a liquidity facility to the QSPE.
Credit card receivables
Prior to September 1, 2010, credit card receivables were securitized through our Cards II Trust, which was established to purchase a proportionate share of designated portfolios, with the proceeds of securities issued by the trust. Effective September 1, 2010, we also securitize credit card receivables associated with explicitly identified individual accounts through Broadway Trust as a result of the MasterCard portfolio acquisition (see Note 3 to the consolidated financial statements for additional details). We are one of several underwriters that distribute securities issued by the trusts. We continue to maintain the credit card client account relationships and provide servicing for receivables sold to the trusts. Our credit card securitizations are revolving securitizations, with new credit card receivables sold to the trusts each period to replenish receivable amounts as clients repay their balances. The trusts meet the criteria for a QSPE pursuant to the Canadian Institute of Chartered Accountants (CICA) Accounting Guideline (AcG) 12, “Transfers of Receivables”, and, accordingly, we do not consolidate either of the trusts.
We retain some risk of loss with respect to the receivables held by the trusts to the extent of our retained interest. Our interests in the excess spread from the trusts are subordinate to the trusts’ obligation to the holders of their ABS. The excess spread represents our participation in the residual income after all the interests and administrative expenses have been paid. As a result, excess spread absorbs losses with respect to credit card receivables before payments to the note-holders are affected. Subordinated notes, which we may retain, also absorb losses before payments to senior note-holders are affected.
Commercial mortgage loans
We securitize certain commercial mortgages through a pass-through QSPE structure that results in ownership certificates held by various investors. As at October 31, 2010, we held ownership certificates of $5 million (2009: $26 million). We continue to service the mortgages.
Securitization of third-party assets
CIBC sponsored conduits
We sponsor several multi- and single-seller conduits in Canada that purchase pools of financial assets from our clients, and finance the purchases by issuing commercial paper to investors. These conduits provide our clients with access to liquidity in the debt capital markets by allowing them to sell assets to the conduits. The sellers to the conduits may continue to service the assets and may be exposed to credit losses realized on these assets, typically through the provision of over-collateralization or another form of credit enhancement. The conduits may obtain credit enhancements from third-party providers.
We generally provide the conduits with commercial paper backstop liquidity facilities, securities distribution, accounting, cash management, and operations services. The liquidity facilities for our sponsored ABCP programs in Macro Trust, Safe Trust, Smart Trust, and Sound Trust require us to provide funding, subject to the satisfaction of certain limited conditions with respect to the conduits, to fund non-defaulted assets.
We are required to maintain certain short- and/or long-term debt ratings with respect to the liquidity facilities provided to our own sponsored ABCP programs. If we are downgraded below the specified level, and we fail to make alternative arrangements that meet the requirements of the rating agencies that rate the ABCP issued by the conduits, we could be required to provide funding into an escrow account in respect of our liquidity commitments.
We may also act as the counterparty to derivative contracts entered into by a conduit in order to convert the yield of the underlying assets to match the needs of the conduit’s investors or to mitigate the interest rate risk within the conduit. All fees earned in respect of these activities are on a market basis.
Revenue from the above activities amounted to approximately $12 million (2009: approximately $11 million).
CIBC structured CDO vehicles
As discussed in the “Run-off businesses and other selected activities” section, we curtailed our business activity in structuring CDO vehicles. We have a focused team with the mandate to manage and reduce the residual exposures from legacy activities. These exposures mainly arose through our previous involvement in acting as structuring and placement agent for CDOs. We lent to, or invested in, the debt or equity tranches of these vehicles, and acted as a counterparty to derivative contracts. In some transactions structured on behalf of clients, we first purchased the assets at their request with the original intention to sell them into CDOs.
Third-party structured vehicles — run-off
Similar to our structured CDO activities, we also curtailed our business activities in third-party structured vehicles. Our activities were mainly intermediation, correlation and flow trading which earned us a spread on matching positions. These activities are now being managed by the focused team discussed above. The table below excludes our investments (fair value – 2010: $188 million; 2009: $69 million) in, and written credit derivatives (2010: notional $0.9 billion, negative fair value $0.7 billion; 2009: notional $1.9 billion, negative fair value $1.7 billion) on, the notes of consolidated CDOs.
Third-party structured vehicles — continuing
We have investments in third-party structured vehicles through our treasury and trading activities.
64
Management’s Discussion and Analysis
| Our exposures to non-consolidated entities involved in the securitization of third-party assets (both CIBC sponsored/structured and third-party structured) are summarized in the table below. Investments and loans are stated at carrying value. Undrawn liquidity and credit facilities and written credit derivatives are stated at notional amounts. |
| | | | | | | | | | | | | | | | | | | | | | | | | |
| $ millions, as at October 31 | | | | | | | | | | 2010 | | | | | | | | | | | 2009 | |
| | | | | | | Undrawn | | | Written | | | | | | | Undrawn | | | Written | |
| | | | | | | liquidity | | | credit | | | | | | | liquidity | | | credit | |
| | | Investment | | | and credit | | | derivatives | | | Investment | | | and credit | | | derivatives | |
| | | and loans(1) | | | facilities | | | (notional)(2) | | | and loans(1) | | | facilities | | | (notional)(2) | |
| |
| CIBC sponsored conduits | | $ | 182 | | | $ | 2,182 | (3) | | $ | — | | | $ | 556 | | | $ | 3,108 | (3) | | $ | — | |
| CIBC structured CDO vehicles | | | 448 | | | | 50 | | | | 389 | | | | 737 | | | | 66 | | | | 652 | |
Third-party structured vehicles —
run-off | | | 7,696 | | | | 585 | | | | 5,128 | | | | 6,676 | | | | 650 | | | | 11,110 | |
Third-party structured vehicles —
continuing | | | 1,778 | | | | — | | | | — | | | | 1,695 | | | | — | | | | — | |
| |
| | |
| (1) | | Excludes securities issued by, retained interest in, and derivatives with, entities established by CMHC, Fannie Mae, Freddie Mac, Ginnie Mae, Federal Home Loan Bank, Federal Farm Credit Bank, and Sallie Mae. Exposure related to CIBC structured CDO and third-party structured vehicles hedged by credit derivatives amounted to $6.4 billion (2009: $6.1 billion). |
| |
| (2) | | Comprises credit derivatives written options and total return swaps under which we assume exposures. The negative fair value recorded on the consolidated balance sheet was $1.1 billion (2009: $4.1 billion). Notional amounts of $4.7 billion (2009: $10.7 billion) were hedged with credit derivatives protection from third parties, the fair value of these hedges net of CVA was $0.5 billion (2009: $0.6 billion). Accumulated fair value losses amount to $0.5 billion (2009: $0.5 billion) on unhedged written credit derivatives. |
| |
| (3) | | Net of $182 million (2009: $556 million) of investments and loans in CIBC sponsored conduits. |
Other financial transactions
We are the sponsor of several mutual and pooled funds, in the form of trusts. We are the administrator of these funds. In addition, we may act in other capacities, including custodian, trustee, and broker. We earn fees at market rates from these trusts. We do not guarantee either principal or returns to investors in these funds, except in very limited circumstances. We act as a trustee of a number of personal trusts and have a fiduciary responsibility to act in the best interests of the beneficiaries of the trusts. We earn a fee for acting as a trustee. We also participate in transactions to modify the cash flows of trusts managed by third-party asset managers to create investments with specific risk profiles, or to assist clients in the efficient management of other risks. Typically, these involve the use of derivative products, which transfer the risks and returns to or from a trust.
Derivatives
We participate in derivatives transactions, as a market maker facilitating the needs of our clients or as a principal to manage the risks associated with our funding, investing and trading strategies. Since 2008, we have ceased activities in the following areas:
| • | | Credit derivative contracts with clients to enable them to create synthetic exposures to meet their needs. |
| |
| • | | Intermediation trades that assume credit risks of clients through credit derivatives, and in turn offset these risks by entering into credit derivative contracts with third-party financial institutions. |
All derivatives are recorded at fair value on our consolidated balance sheet. See Notes 2 and 14 to the consolidated financial statements for details on derivative contracts and the risks associated with them.
Credit-related arrangements
We enter into various commitments to meet the financing needs of clients, which are summarized in the table below. For a detailed description of these arrangements, see Note 25 to the consolidated financial statements.
| | | | | | | | | | | | | | | | | | | | | | | | | |
| | | Contract amounts expiration per period | | | | | | | |
| | | Less than | | | 1 – 3 | | | 3 – 5 | | | Over | | | 2010 | | | 2009 | |
| $ millions, as at October 31 | | 1 year | | | years | | | years | | | 5 years | | | Total | | | Total | |
| |
Securities lending(1)(2) | | $ | 57,325 | | | $ | — | | | $ | — | | | $ | — | | | $ | 57,325 | | | $ | 43,907 | |
Unutilized credit commitments(3) | | | 23,998 | | | | 17,610 | | | | 2,401 | | | | 521 | | | | 44,530 | | | | 39,747 | |
| Backstop liquidity facilities | | | 4,403 | | | | — | | | | — | | | | — | | | | 4,403 | | | | 4,869 | |
| Standby and performance letters of credit | | | 4,656 | | | | 767 | | | | 146 | | | | 152 | | | | 5,721 | | | | 5,123 | |
| ALM credit derivatives written options | | | — | | | | — | | | | — | | | | — | | | | — | | | | 27 | |
| Documentary and commercial letters of credit | | | 290 | | | | — | | | | — | | | | — | | | | 290 | | | | 234 | |
| Other | | | 381 | | | | — | | | | — | | | | — | | | | 381 | | | | 371 | |
| |
| | | $ | 91,053 | | | $ | 18,377 | | | $ | 2,547 | | | $ | 673 | | | $ | 112,650 | | | $ | 94,278 | |
| |
| | |
| (1) | | Includes the full contract amount of custodial client securities totalling $45.0 billion (2009: $33.3 billion) lent by CIBC Mellon Global Securities Services Company, which is a 50/50 joint venture between CIBC and The Bank of New York Mellon. |
| |
| (2) | | Securities lending of $4.3 billion (2009: $5.3 billion) for cash is excluded from the table above as it is reported on the consolidated balance sheet as obligations related to securities lent or sold under repurchase agreements. |
| |
| (3) | | Includes irrevocable lines of credit totalling $34.9 billion (2009: $30.7 billion), of which $14.3 billion (2009: $18.7 billion) will expire in one year or less, and excludes personal lines of credit, home equity lines of credit, and credit card lines. |
Guarantees
Guarantees include contracts that contingently require the guarantor to make payments to a guaranteed party based on (a) changes in an underlying economic characteristic that is related to an asset, liability or an equity security of the guaranteed party; (b) failure of another party to perform under an obligating agreement; or (c) failure of a third party to pay its indebtedness when due. For a detailed description of our guarantees, maximum potential future payments, and the liability recorded on the consolidated balance sheet, see Note 25 to the consolidated financial statements.
65
Management’s Discussion and Analysis
Management of Risk
We have provided, in the MD&A, certain disclosures required under the CICA handbook section 3862, “Financial Instruments – Disclosures” related to the nature and extent of risks arising from financial instruments, as permitted by that handbook section. These disclosures are included in the sections “Risk overview”, “Credit risk”, “Market risk”, “Liquidity risk”, “Operational risk”, “Reputation and legal risk”, and “Regulatory risk”. These disclosures have been shaded and form an integral part of the consolidated financial statements.
Risk Overview
Most of CIBC’s business activities involve, to a varying degree, a variety of risks, including credit, market, liquidity, and operational risks.
Our objective is to balance the level of risk with our business objectives for growth and profitability, in order to achieve consistent and sustainable performance over the long term, while remaining within our risk appetite.
Our risk appetite defines tolerance levels for various risks. This is the foundation for our risk management culture, and is supported by limits, policies, procedures and other controls.
Managing risk is a shared responsibility at CIBC. Business units and risk management professionals work in collaboration to ensure that business strategies and activities are consistent with our risk appetite.
Our risk management framework includes:
| • | | Risk policies, procedures and limits to align activities with risk appetite; |
| |
| • | | Regular risk reports to identify and communicate risk levels; |
| |
| • | | An independent control framework to identify and test compliance with key controls; |
| |
| • | | Stress testing to consider potential impacts of changes in the business environment on capital, liquidity and earnings; and |
| |
| • | | Oversight through our risk-focused committees and governance structures. |
We continuously monitor our risk profile against our defined risk appetite and related limits, taking actions as needed to maintain an appropriate balance of risk and return. Monitoring our risk profile includes forward-looking analysis of sensitivity to local and global market factors, economic conditions, and political and regulatory environments that influence our overall risk profile.
Regular and transparent risk reporting and discussion at senior management committees facilitate communication of risks and risk strategies across the organization, with oversight provided by the Board of Directors.
Risk governance
Our risk governance and management structure is illustrated below:
Risk governance and management structure
66
Management’s Discussion and Analysis
Board of Directors (the Board): The Board oversees the enterprise-wide risk management program through approval of our risk appetite and supporting risk management policies and limits. The Board accomplishes its mandate through its Risk Management and Audit committees, described below.
Risk Management Committee (RMC): This committee assists the Board in fulfilling its responsibilities for approving CIBC’s risk appetite and overseeing CIBC’s risk profile and performance against the defined risk appetite. This includes oversight of policies, procedures and limits related to the identification, measurement, monitoring and controlling of CIBC’s principal business risks.
Audit Committee: The Audit Committee reviews the overall adequacy and the effectiveness of internal controls and the control environment, including controls over the risk management process.
Senior Executive Team (SET): The SET, led by the CEO, and including the executives reporting directly to the CEO, is responsible for setting business strategy and for monitoring, evaluating and managing risks across CIBC. The SET is supported by the following committees:
| • | | Asset Liability Committee (ALCO):This committee, which is comprised of the SET, senior Business and Risk Management executives, reviews CIBC’s key risks and implications for balance sheet and liquidity management. |
| |
| • | | Capital and Risk Committee (CRC):This committee, which is comprised of the SET, senior leaders from the lines of business, Risk Management and other infrastructure groups, provides a forum for the strategic assessment of risks and risk-mitigation strategies. Key activities include reviewing, evaluating and recommending CIBC’s risk-appetite statement and risk strategies; reviewing and evaluating business strategies in the context of our risk-appetite; and identifying, reviewing and advising on current and emerging risk issues and associated mitigation plans. |
| |
| • | | Governance and Control Committee (GCC):This committee acts as the senior point of management review with respect to the design and effectiveness of CIBC’s governance and internal control structure, within the parameters and strategic objectives established by the CEO and direction provided by the Board. |
| |
| • | | Reputation and Legal Risks (RLR) Committee:This committee reviews transactions for potential material reputation and/or legal impacts and provides oversight of our policies and procedures relative to the management of reputation and legal risks. |
Risk management
The Risk Management group is responsible for setting risk strategy and for providing independent oversight of risk measurement, monitoring and control. Our Risk Management group works in partnership with our businesses to identify, assess, mitigate and monitor the risks associated with business activities and strategies.
The Risk Management group performs several important activities including the following:
| • | | Developing CIBC’s risk appetite; |
| |
| • | | Setting risk strategy to manage risks in alignment with our risk appetite and business strategy; |
| |
| • | | Establishing and communicating policies, procedures and limits to control risks in alignment with risk strategy; |
| |
| • | | Measuring, monitoring and reporting on risk levels; |
| |
| • | | Identifying and assessing emerging and potential strategic risks; and |
| |
| • | | Deciding on transactions that fall outside of risk limits delegated to underlying business lines. |
The five key groups within Risk Management, independent of the originating businesses, contribute to our management of risk:
| • | | Capital Markets Risk Management— This unit provides independent oversight of the measurement, monitoring and control of market risks (both trading and non-trading), trading credit risk and trading operational risk across CIBC’s portfolios. |
| |
| • | | Card Products Risk Management— This unit oversees the management of credit risk in the card products portfolio, including the optimization of lending profitability. |
| |
| • | | Retail Lending and Wealth Risk Management— This unit primarily oversees the management of credit and fraud risk in the retail lines of credit and loans, residential mortgage, and small business loan portfolios, including the optimization of lending profitability. This unit is also responsible for overall risk management oversight of wealth management activities. |
| • | | Wholesale Credit and Investment Risk Management — This unit is responsible for the adjudication and oversight of credit risks associated with our commercial and wholesale lending activities globally, management of the risks of our investment portfolios, as well as management of the special loans portfolios. |
| |
| • | | Risk Services— This unit is responsible for regulatory and economic capital analysis and reporting, operational risk management, and enterprise-wide risk and stress analysis and reporting. Risk Services is also responsible for policies associated with credit and operational risks, including reputation and legal risks. |
Liquidity and funding risks are managed by Treasury. The measurement, monitoring and control of liquidity and funding risk is addressed in collaboration with Risk Management, with oversight provided by the ALCO.
Risk identification and measurement
Risk identification and measurement are important elements of our risk management framework. Risk identification is a continuous process, generally achieved through:
| • | | Ongoing monitoring of trading and non-trading portfolios; |
| |
| • | | Regular assessment of risks associated with lending and trading credit exposures; |
| |
| • | | Assessment of risks in new business activities and processes; |
| |
| • | | Assessment of risks in restructurings and re-organizations; |
| |
| • | | Assessment of risks in complex and unusual business transactions; and |
| |
| • | | Regular monitoring of the overall risk profile considering market developments and trends and external and internal events. |
We have enterprise-wide methodologies, models and techniques in place to measure both the quantitative and qualitative aspects of risks, appropriate for the various types of risks we face. These methodologies, models and techniques are subject to independent assessment and review to ensure that the underlying logic remains sound, that model risks have been identified and managed, that use of the models continue to be appropriate and outputs are valid.
Risk is usually measured in terms of expected loss, unexpected loss, and economic capital.
67
Management’s Discussion and Analysis
Expected loss
Expected loss represents the loss that is statistically expected to occur in the normal course of business in a given period of time.
In respect of credit risk, the parameters used to measure expected loss are PD, LGD, and EAD. These parameters are updated regularly and are based on our historical experience and benchmarking of credit exposures.
For trading market risks, VaR is the statistical technique used to measure risk. VaR is the estimate of the maximum loss in market value that we would expect to incur in our trading portfolio due to an adverse one-day movement in market rates and prices, within a given level of confidence.
For trading credit risks associated with market value based products, we use models to estimate exposure relative to the value of the portfolio of trades with each counterparty, giving consideration to market rates and prices.
Unexpected loss and economic capital
Unexpected loss is the statistical estimate of the amount by which actual losses might exceed expected losses over a specified time horizon, computed at a given confidence level. We use economic capital to estimate the level of capital needed to protect us against unexpected losses. Economic capital allows us to assess performance on a risk-adjusted basis. Refer to the “Financial condition” section for additional details.
We also use techniques such as sensitivity analysis and stress testing to help ensure that the risks remain within our risk appetite and that our capital is adequate to cover those risks. Our stress testing program includes evaluation of the potential effects of various economic and market scenarios on our risk profile.
Risk controls
Our risk management framework includes a comprehensive set of risk controls, designed to ensure that risks are being appropriately identified and managed.
Our risk controls are part of CIBC’s overall Control Framework, developed based on the Committee of Sponsoring Organizations of the Treadway Commission’s (COSO) widely accepted “Internal Control – Integrated Framework”. The Control Framework also draws on elements of the OSFI Supervisory Framework and Corporate Governance Guidelines.
The Board, primarily through the RMC, approves certain risk limits and delegates specific transactional approval authorities to the CEO. The RMC must approve transactions that exceed delegated authorities. Onward delegation of authority by the CEO to business units is controlled to ensure decision-making authorities are restricted to those individuals with the necessary experience levels.
In addition, CIBC has rigorous processes to identify, evaluate and remediate risk control deficiencies in a timely manner.
Regular reporting is provided to the RMC to evidence compliance with risk limits. Risk limits are reviewed annually by the RMC, and the delegation of authority to the CEO is reviewed and approved annually by the Board.
Credit Risk
Credit risk primarily arises from our direct lending activities, and from our trading, investment, and hedging activities. Credit risk is defined as the risk of financial loss due to a borrower or counterparty failing to meet its obligations in accordance with contractual terms.
To control credit risk in alignment with CIBC’s risk appetite, CIBC has implemented policies and standards as well as limits to control credit concentrations. Key policies and limits are subject to annual review and approval by the RMC.
Senior management reports to the RMC at least quarterly on material credit risk matters, including material credit transactions, compliance with limits, portfolio trends, impaired loans and credit loss provisioning levels. Impaired loan balances, allowances, and credit losses are reviewed by the RMC and the Audit Committee quarterly.
The Risk Management group provides enterprise-wide adjudication and oversight of the management of credit risk in our credit portfolios. Adjudication and portfolio management decisions are based on our risk appetite, as reflected in our policies, standards and limits. Credit approval authorities are controlled to ensure decisions are made by qualified and experienced personnel.
Process and control
The credit approval process is centrally controlled, with all significant credit requests submitted to a credit adjudication group within Risk Management that is independent of the originating businesses. Approval authorities are a function of the risk and amount of credit requested. In certain cases, credit requests must be referred to the Credit Committee, a sub-committee of the CRC, or to the RMC for approval.
After initial approval, individual credit exposures continue to be monitored, with a formal risk assessment, including review of assigned ratings, documented at least annually. Higher risk-rated accounts are subject to closer monitoring and are reviewed at least quarterly. Collections and specialized loan workout groups handle the day-to-day management of assigned high risk loans to maximize recoveries.
Credit concentration limits
Credit concentration limits are established for business and government loans to control against adverse concentrations within portfolios. These include limits for individual borrowers, groups of related borrowers, industry sectors, country and geographic regions, and products or portfolios. Direct loan sales, credit derivative hedges, or structured transactions may also be used to reduce concentrations.
68
Management’s Discussion and Analysis
Credit risk mitigation
We may mitigate credit risk by obtaining a pledge of collateral in support of loans. Our credit risk management policies include requirements relating to collateral including requirements to verify the collateral and its value and to ensure we have legal certainty with respect to the assets pledged. Valuations are updated periodically depending on the nature of the collateral. The main types of collateral include: (i) cash or marketable securities for securities lending and repurchase transactions; (ii) charges over operating assets such as inventory, receivables and real estate properties for lending to small business and commercial borrowers; and (iii) mortgages over residential properties for retail lending. We have policies in place to monitor the existence of undesirable concentrations in the collateral supporting our mortgage exposure.
We also obtain third-party guarantees and insurance to reduce the risk in our lending portfolios, the most material of which relate to our residential mortgage portfolio that is insured by CMHC or other investment grade counterparties.
We use credit derivatives to reduce industry sector concentrations and single-name exposures, or as part of portfolio diversification techniques.
We limit the credit risk of over-the-counter (OTC) derivatives through the use of multi-product derivative master netting agreements and collateral.
Exposure to credit risk
The following table presents the exposure to credit risk, which is measured as EAD for on- and off-balance sheet financial instruments. EAD represents the estimate of the amount which will be drawn at the time of default.
Total exposure increased by $13.6 billion in 2010, primarily due to increases in our corporate portfolio, as well as our real estate secured personal lending portfolio. Overall repo-style transaction exposure is down from October 31, 2009, though exposure levels can fluctuate significantly, due to the very short-term nature of the activity. The increase in other off-balance sheet exposure is largely due to increases in indemnities related to our securities lending exposure.
As a result of our holdings of subordinated enhancement notes issued by Cards II Trust, commencing in the fourth quarter of 2009, we are required to hold regulatory capital for the underlying securitized credit card receivables as if they had remained on our balance sheet. We apply the same capital treatment to the securitized credit card receivables relating to Broadway Trust; these assets resulted from our acquisition of the MasterCard portfolio (see the “Significant events” section for additional details) on September 1, 2010.
69
Management’s Discussion and Analysis
| | | | | | | | | | | | | | | | | | | | | | | | | |
| $ millions, as at October 31 | |
| | | AIRB | | | Standardized | | | 2010 | | | AIRB | | | Standardized | | | 2009 | |
| | | approach | | | approach | | | Total | | | approach | | | approach | | | Total | |
| |
Business and government portfolios | | | | | | | | | | | | | | | | | | | | | | | | |
Corporate | | | | | | | | | | | | | | | | | | | | | | | | |
| Drawn | | $ | 31,522 | | | $ | 4,495 | | | $ | 36,017 | | | $ | 32,035 | | | $ | 5,286 | | | $ | 37,321 | |
| Undrawn commitments | | | 21,853 | | | | 167 | | | | 22,020 | | | | 17,341 | | | | 211 | | | | 17,552 | |
| Repo-style transactions | | | 28,614 | | | | — | | | | 28,614 | | | | 22,207 | | | | — | | | | 22,207 | |
| Other off-balance sheet | | | 4,765 | | | | 188 | | | | 4,953 | | | | 3,755 | | | | 216 | | | | 3,971 | |
| OTC derivatives | | | 5,316 | | | | 29 | | | | 5,345 | | | | 7,594 | | | | 47 | | | | 7,641 | |
| |
| | | | 92,070 | | | | 4,879 | | | | 96,949 | | | | 82,932 | | | | 5,760 | | | | 88,692 | |
| |
Sovereign | | | | | | | | | | | | | | | | | | | | | | | | |
| Drawn | | | 45,055 | | | | 2,518 | | | | 47,573 | | | | 55,398 | | | | 2,078 | | | | 57,476 | |
| Undrawn commitments | | | 4,513 | | | | — | | | | 4,513 | | | | 4,216 | | | | — | | | | 4,216 | |
| Repo-style transactions | | | 1,056 | | | | — | | | | 1,056 | | | | 1,815 | | | | — | | | | 1,815 | |
| Other off-balance sheet | | | 184 | | | | — | | | | 184 | | | | 150 | | | | — | | | | 150 | |
| OTC derivatives | | | 1,778 | | | | — | | | | 1,778 | | | | 1,314 | | | | — | | | | 1,314 | |
| |
| | | | 52,586 | | | | 2,518 | | | | 55,104 | | | | 62,893 | | | | 2,078 | | | | 64,971 | |
| |
Banks | | | | | | | | | | | | | | | | | | | | | | | | |
| Drawn | | | 15,613 | | | | 1,723 | | | | 17,336 | | | | 15,016 | | | | 1,483 | | | | 16,499 | |
| Undrawn commitments | | | 890 | | | | — | | | | 890 | | | | 811 | | | | — | | | | 811 | |
| Repo-style transactions | | | 51,395 | | | | 219 | | | | 51,614 | | | | 59,783 | | | | 148 | | | | 59,931 | |
| Other off-balance sheet | | | 42,082 | | | | — | | | | 42,082 | | | | 30,936 | | | | — | | | | 30,936 | |
| OTC derivatives | | | 7,486 | | | | 5 | | | | 7,491 | | | | 6,349 | | | | 13 | | | | 6,362 | |
| |
| | | | 117,466 | | | | 1,947 | | | | 119,413 | | | | 112,895 | | | | 1,644 | | | | 114,539 | |
| |
Total business and government portfolios | | | 262,122 | | | | 9,344 | | | | 271,466 | | | | 258,720 | | | | 9,482 | | | | 268,202 | |
| Less: repo collateral | | | (76,273 | ) | | | — | | | | (76,273 | ) | | | (77,291 | ) | | | — | | | | (77,291 | ) |
| |
Total business and government portfolios (net) | | | 185,849 | | | | 9,344 | | | | 195,193 | | | | 181,429 | | | | 9,482 | | | | 190,911 | |
| |
Retail portfolios | | | | | | | | | | | | | | | | | | | | | | | | |
Real estate secured personal lending | | | | | | | | | | | | | | | | | | | | | | | | |
| Drawn | | | 108,818 | | | | 2,216 | | | | 111,034 | | | | 100,939 | | | | 2,307 | | | | 103,246 | |
| Undrawn commitments | | | 25,983 | | | | — | | | | 25,983 | | | | 24,728 | | | | — | | | | 24,728 | |
| |
| | | | 134,801 | | | | 2,216 | | | | 137,017 | | | | 125,667 | | | | 2,307 | | | | 127,974 | |
| |
Qualifying revolving retail | | | | | | | | | | | | | | | | | | | | | | | | |
| Drawn | | | 20,743 | | | | — | | | | 20,743 | | | | 20,940 | | | | — | | | | 20,940 | |
| Undrawn commitments | | | 40,095 | | | | — | | | | 40,095 | | | | 40,351 | | | | — | | | | 40,351 | |
| Other off-balance sheet | | | 381 | | | | — | | | | 381 | | | | 370 | | | | — | | | | 370 | |
| |
| | | | 61,219 | | | | — | | | | 61,219 | | | | 61,661 | | | | — | | | | 61,661 | |
| |
Other retail | | | | | | | | | | | | | | | | | | | | | | | | |
| Drawn | | | 8,001 | | | | 2,991 | | | | 10,992 | | | | 8,149 | | | | 1,106 | | | | 9,255 | |
| Undrawn commitments | | | 2,110 | | | | 20 | | | | 2,130 | | | | 2,244 | | | | 21 | | | | 2,265 | |
| Other off-balance sheet | | | 18 | | | | — | | | | 18 | | | | 42 | | | | — | | | | 42 | |
| |
| | | | 10,129 | | | | 3,011 | | | | 13,140 | | | | 10,435 | | | | 1,127 | | | | 11,562 | |
| |
Total retail portfolios | | | 206,149 | | | | 5,227 | | | | 211,376 | | | | 197,763 | | | | 3,434 | | | | 201,197 | |
| |
Securitization exposures | | | 17,592 | (1) | | | — | | | | 17,592 | | | | 17,446 | (1) | | | — | | | | 17,446 | |
| |
Gross credit exposure | | $ | 485,863 | | | $ | 14,571 | | | $ | 500,434 | | | $ | 473,929 | | | $ | 12,916 | | | $ | 486,845 | |
| |
| | |
| (1) | | Under the internal ratings based (IRB) approach. |
The portfolios are categorized based upon how we manage the business and the associated risks. Amounts provided are after CVA related to financial guarantors, and before allowance for credit losses and risk mitigation. Non-trading equity exposures are not included in the table above as they have been deemed immaterial under the OSFI guidelines, and hence, are subject to 100% risk-weighting.
70
Management’s Discussion and Analysis
Exposures subject to advanced internal rating based (AIRB) approach
Business and government portfolios (excluding scored small business) — risk-rating method
This section describes the portfolio rating categories. The portfolio is comprised of exposures to corporate, sovereign, and bank obligors. These exposures are individually assessed and assigned an obligor rating that reflects our estimate of the financial strength of the borrower, and a facility rating that reflects the security applicable to the exposure.
The obligor rating takes into consideration our financial assessment of the obligor, the industry, and the economic environment of the region in which the obligor operates. Where a guarantee from a third party exists, both the obligor and the guarantor will be assessed. While our obligor rating is arrived at independently of external ratings for the obligor, our risk-rating methodology includes a review of those external ratings.
A mapping between our internal ratings and the ratings used by external ratings agencies is shown in the table below.
| | | | | | | | | | | | | |
| | | CIBC | | | S&P | | | Moody’s | |
| Grade | | rating | | | equivalent | | | equivalent | |
| |
| Investment grade | | | 00-47 | | | AAA to BBB- | | | Aaa to Baa3 | |
| |
| Non-investment grade | | | 51-67 | | | BB+ to B- | | | Ba1 to B3 | |
| |
| Watchlist | | | 70-80 | | | CCC+ to CC | | | Caa1 to Ca | |
| |
| Default | | | 90 | | | | D | | | | C | |
| |
We use quantitative modelling techniques to assist in the development of internal risk-rating systems. The risk-rating systems have been developed through analysis of internal and external credit risk data. The risk ratings are used for portfolio management, risk limit setting, product pricing, and in the determination of economic capital.
We assess risk exposure using the following three dimensions. Parameter estimates for each of these dimensions are long-term averages with adjustments for the impact of any potential change in the credit cycle.
| • | | PD – the probability that the obligor will default within the next 12 months. |
| |
| • | | EAD – the estimate of the amount which will be drawn at the time of default. |
| |
| • | | LGD – the expected severity of loss as the result of the default, expressed as a percentage of the EAD. |
The effectiveness of the risk rating systems and the parameters associated with the risk ratings are monitored within Risk Management and are subject to an annual review. The models used in the estimation of the risk parameters are also subject to independent validation by the Risk Management validation group, which is independent of both the origination business and the model development process.
A simplified risk-rating process (slotting approach) is used for uninsured Canadian commercial mortgages, which comprise non-residential mortgages and multi-family residential mortgages. These exposures are individually rated on our rating scale using a risk-rating methodology that considers the property’s key attributes, which include its loan-to-value and debt service ratios, the quality of the property, and the financial strength of the owner/sponsor. All exposures are secured by a lien over the property. Additionally, we have insured multi-family residential mortgages, which are not treated under the slotting approach, but are instead treated as sovereign exposures in the table below.
71
Management’s Discussion and Analysis
Credit quality of the risk-rated portfolios
The following table provides the credit quality of the risk-rated portfolios. Amounts provided are before allowance for credit losses, and after credit risk mitigation, CVA related to financial guarantors, and collateral on repurchase agreement activities.
| | | | | | | | | | | | | | | | | | | |
| $ millions, as at October 31 | |
| | | | | EAD | | | | |
| | | Grade | | Corporate | | | Sovereign | | | Banks | | | Total | |
| |
| 2010 | | Investment grade | | $ | 33,217 | | | $ | 51,036 | | | $ | 67,501 | | | $ | 151,754 | |
| | | Non-investment grade | | | 22,761 | | | | 517 | | | | 2,347 | | | | 25,625 | |
| | | Watchlist | | | 603 | | | | 1 | | | | 3 | | | | 607 | |
| | | Default | | | 1,061 | | | | 1 | | | | — | | | | 1,062 | |
| |
| | | | | $ | 57,642 | | | $ | 51,555 | | | $ | 69,851 | | | $ | 179,048 | |
| |
| | | Strong | | | | | | | | | | | | | | $ | 6,612 | |
| | | Good | | | | | | | | | | | | | | | 111 | |
| | | Satisfactory | | | | | | | | | | | | | | | 57 | |
| | | Weak | | | | | | | | | | | | | | | 13 | |
| | | Default | | | | | | | | | | | | | | | 8 | |
| |
| | | Total slotted exposure | | | | | | | | | | | | | | $ | 6,801 | |
| |
| | | Total business and government portfolios | | | | | | | | | | | | | | $ | 185,849 | |
| |
| 2009 | | Investment grade | | $ | 31,516 | | | $ | 60,966 | | | $ | 55,554 | | | $ | 148,036 | |
| | | Non-investment grade | | | 21,777 | | | | 362 | | | | 2,112 | | | | 24,251 | |
| | | Watchlist | | | 1,865 | | | | 3 | | | | 4 | | | | 1,872 | |
| | | Default | | | 1,041 | | | | 2 | | | | — | | | | 1,043 | |
| |
| | | | | $ | 56,199 | | | $ | 61,333 | | | $ | 57,670 | | | $ | 175,202 | |
| |
| | | Strong | | | | | | | | | | | | | | $ | 5,999 | |
| | | Good | | | | | | | | | | | | | | | 159 | |
| | | Satisfactory | | | | | | | | | | | | | | | 52 | |
| | | Weak | | | | | | | | | | | | | | | 9 | |
| | | Default | | | | | | | | | | | | | | | 8 | |
| |
| | | Total slotted exposure | | | | | | | | | | | | | | $ | 6,227 | |
| |
| | | Total business and government portfolios | | | | | | | | | | | | | | $ | 181,429 | |
| |
The decrease in watchlist exposures was largely attributable to reductions in our structured credit portfolio. Default exposures were up marginally from October 31, 2009, with the majority of the exposure in the European leveraged finance run-off portfolio, as well as the U.S. real estate finance portfolio.
Retail portfolios
Retail portfolios are characterized by a large number of relatively small exposures. They comprise: real estate secured personal lending (residential mortgages and personal loans and lines secured by residential property); qualifying revolving retail exposures (credit cards and unsecured lines of credit); and other retail exposures (loans secured by non-residential assets, unsecured loans including student loans, and scored small business loans). These portfolios are managed as pools of homogenous risk exposures, using external credit bureau scores and/or other behavioural assessment to group exposures according to similar credit risk profiles. These pools are assessed through statistical techniques, such as credit scoring and computer-based models. Characteristics used to group individual exposures vary by asset category; as a result, the number of pools, their size, and the statistical techniques applied to their management differ accordingly.
The following table maps the PD bands to various risk levels:
| | | | | |
| Risk level | | PD bands | |
| |
| Exceptionally low | | | 0.01% – 0.20 | % |
| Very low | | | 0.21% – 0.50 | % |
| Low | | | 0.51% – 2.00 | % |
| Medium | | | 2.01% – 10.00 | % |
| High | | | 10.01% – 99.99 | % |
| Default | | | 100.00 | % |
| |
72
Management’s Discussion and Analysis
Credit quality of the retail portfolios
The following table presents the credit quality of the retail portfolios. Amounts provided are before allowance for credit losses and after credit risk mitigation. Retail portfolios include $3.5 billion (2009: $3.7 billion) of small business scored exposures.
| | | | | | | | | | | | | | | | | | | | | |
| $ millions, as at October 31 | |
| | | | | | | EAD | | | | |
| | | | | | | Real estate | | | | | | | | | | |
| | | | | | | secured | | | Qualifying | | | | | | | |
| | | | | | | personal | | | revolving | | | Other | | | | |
| Risk level | | | lending | | | retail | | | retail | | | Total | |
| |
| 2010 | | | Exceptionally low | | $ | 115,235 | | | $ | 32,252 | | | $ | 825 | | | $ | 148,312 | |
| | | | | Very low | | | 10,991 | | | | 9,230 | | | | 2,244 | | | | 22,465 | |
| | | | | Low | | | 7,705 | | | | 12,556 | | | | 4,885 | | | | 25,146 | |
| | | | | Medium | | | 593 | | | | 5,484 | | | | 2,045 | | | | 8,122 | |
| | | | | High | | | 112 | | | | 1,523 | | | | 61 | | | | 1,696 | |
| | | | | Default | | | 165 | | | | 174 | | | | 69 | | | | 408 | |
| |
| | | | | | | $ | 134,801 | | | $ | 61,219 | | | $ | 10,129 | | | $ | 206,149 | |
| |
| 2009 | | | Exceptionally low | | $ | 98,402 | | | $ | 31,569 | | | $ | 2,423 | | | $ | 132,394 | |
| | | | | Very low | | | 12,058 | | | | 9,650 | | | | 2,399 | | | | 24,107 | |
| | | | | Low | | | 14,438 | | | | 13,080 | | | | 4,197 | | | | 31,715 | |
| | | | | Medium | | | 205 | | | | 5,556 | | | | 1,289 | | | | 7,050 | |
| | | | | High | | | 402 | | | | 1,622 | | | | 44 | | | | 2,068 | |
| | | | | Default | | | 162 | | | | 184 | | | | 83 | | | | 429 | |
| |
| | | | | | | $ | 125,667 | | | $ | 61,661 | | | $ | 10,435 | | | $ | 197,763 | |
| |
Retail portfolios include $59.5 billion (2009: $59.1 billion) of insured residential mortgages, and government guaranteed student loans and small business loans.
Exposures subject to the standardized approach
Exposures within FirstCaribbean, obligations of certain exposures of individuals for non-business purposes, and certain exposures in the CIBC Mellon joint ventures have been deemed immaterial, and are subject to the standardized approach. In addition, credit card receivables, which resulted from our acquisition of the MasterCard portfolio on September 1, 2010 (see the “Significant events” section for additional details) are subject to the standardized approach. A detailed breakdown of our standardized exposures before allowance for credit losses by risk-weight category is provided below.
| | | | | | | | | | | | | | | | | | | | | | | | | | | | | |
| $ millions, as at October 31 | |
| | | Risk-weight category | | | 2010 | | | 2009 | |
| | | 0% | | | 20% | | | 50% | | | 75% | | | 100% | | | Total | | | Total | |
| |
| Corporate | | $ | — | | | $ | — | | | $ | 40 | | | $ | — | | | $ | 4,839 | | | $ | 4,879 | | | $ | 5,760 | |
| Sovereign | | | 2,241 | | | | 81 | | | | 69 | | | | — | | | | 127 | | | | 2,518 | | | | 2,077 | |
| Bank | | | — | | | | 1,808 | | | | 125 | | | | — | | | | 14 | | | | 1,947 | | | | 1,645 | |
| Real estate secured personal lending | | | — | | | | — | | | | — | | | | 2,215 | | | | 1 | | | | 2,216 | | | | 2,307 | |
| Other retail | | | — | | | | — | | | | — | | | | 2,801 | | | | 210 | | | | 3,011 | | | | 1,127 | |
| |
| | | $ | 2,241 | | | $ | 1,889 | | | $ | 234 | | | $ | 5,016 | | | $ | 5,191 | | | $ | 14,571 | | | $ | 12,916 | |
| |
Securitization exposures
The following table provides details on our securitization exposures by credit ratings under the IRB approach. Accumulated gain of $58 million (2009: $59 million) is not included in the table below as it is deducted from Tier 1 capital.
| | | | | | | | | |
| $ millions, as at October 31 | | 2010 | | | 2009 | |
| | | EAD(1) | |
| |
| S&P rating equivalent | | | | | | | | |
| AAA to BBB- | | $ | 16,255 | | | $ | 16,367 | |
| BB+ to BB- | | | 9 | | | | 116 | |
| Below BB- | | | 484 | | | | 120 | |
| Unrated | | | 308 | | | | 565 | |
| |
| | | $ | 17,056 | | | $ | 17,168 | |
| |
| | |
| (1) | | EAD under IRB approach is net of financial collateral of $478 million (2009: $219 million). |
Counterparty credit exposures
We have counterparty credit exposure that arises from our interest rate, foreign exchange, equity, commodity, and credit derivatives trading, hedging, and portfolio management activities, as explained in Note 14 to the consolidated financial statements. The PD of our counterparties is measured in the same manner as our direct lending activity.
We are exposed to wrong-way risk when the exposure to a particular counterparty is adversely correlated with the credit quality of that counterparty. When we are exposed to wrong-way risk with a derivative counterparty, our procedures subject those transactions to a more rigorous approval process. The exposure may be hedged with other derivatives to further mitigate the risk that can arise from these transactions.
73
Management’s Discussion and Analysis
We establish a CVA for expected future credit losses from each of our derivative counterparties. The expected future credit loss is a function of our estimates of the PD, the expected loss/exposure in the event of default, and other factors such as risk mitigants.
Rating profile of derivative MTM receivables
| | | | | | | | | | | | | | | | | |
| $ billions, as at October 31 | | 2010 | | | 2009 | |
| | | Exposure(1) | |
| |
| S&P rating equivalent | | | | | | | | | | | | | | | | |
| AAA to BBB- | | $ | 6.45 | | | | 86.7 | % | | $ | 6.12 | | | | 75.5 | % |
| BB+ to B- | | | 0.82 | | | | 11.0 | | | | 1.42 | | | | 17.5 | |
| CCC+ to CCC- | | | 0.01 | | | | 0.1 | | | | 0.42 | | | | 5.1 | |
| Below CCC- | | | 0.02 | | | | 0.3 | | | | 0.08 | | | | 1.0 | |
| Unrated | | | 0.14 | | | | 1.9 | | | | 0.07 | | | | 0.9 | |
| |
| | | $ | 7.44 | | | | 100.0 | % | | $ | 8.11 | | | | 100.0 | % |
| |
| | |
| (1) | | MTM value of the derivative contracts is after CVA and derivative master netting agreements, and before any collateral. |
Concentration of exposures
Concentration of credit risk exists when a number of obligors are engaged in similar activities, or operate in the same geographical areas or industry sectors, and have similar economic characteristics so that their ability to meet contractual obligations is similarly affected by changes in economic, political, or other conditions.
Geographic distribution
The following table provides a geographic distribution of our business and government exposures under the AIRB approach. The classification of geography is based upon the country of ultimate risk. Amounts are before allowance for credit losses and risk mitigation, and after CVA related to financial guarantors and $76.3 billion (2009: $77.3 billion) of collateral held for our repurchase agreement activities.
| | | | | | | | | | | | | | | | | | | | | | | | | |
| $ millions, as at October 31 | | | | | | | | | | | | | | | | | | 2010 | | | 2009 | |
| |
| | | Canada | | | U.S. | | | Europe | | | Other | | | Total | | | Total | |
| |
| Drawn | | $ | 72,141 | | | $ | 10,967 | | | $ | 6,012 | | | $ | 3,070 | | | $ | 92,190 | | | $ | 102,449 | |
| Undrawn commitments | | | 22,652 | | | | 2,749 | | | | 458 | | | | 1,397 | | | | 27,256 | | | | 22,368 | |
| Repo-style transactions | | | 1,763 | | | | 2,347 | | | | 466 | | | | 216 | | | | 4,792 | | | | 6,514 | |
| Other off-balance sheet | | | 35,956 | | | | 4,737 | | | | 5,730 | | | | 608 | | | | 47,031 | | | | 34,841 | |
| OTC derivatives | | | 6,350 | | | | 3,058 | | | | 4,635 | | | | 537 | | | | 14,580 | | | | 15,257 | |
| |
| | | $ | 138,862 | | | $ | 23,858 | | | $ | 17,301 | | | $ | 5,828 | | | $ | 185,849 | | | $ | 181,429 | |
| |
For retail portfolios, substantially all of the exposures under the AIRB approach are based in Canada.
Business and government exposures by industry groups
The following table provides an industry-wide breakdown of our business and government exposures under the AIRB approach. Amounts are before allowance for credit losses and risk mitigation, and after CVA related to financial guarantors and $76.3 billion (2009: $77.3 billion) of collateral held for our repurchase agreement activities.
| | | | | | | | | | | | | | | | | | | | | | | | | | | | | |
| $ millions, as at October 31 | | | | | | | | | | | | | | | | | | | | | | 2010 | | | 2009 | |
| |
| | | | | | | Undrawn | | | Repo-style | | | Other off- | | | OTC | | | | | | | |
| | | Drawn | | | commitment | | | transactions | | | balance sheet | | | derivatives | | | Total | | | Total | |
| |
| Commercial mortgages | | $ | 6,638 | | | $ | 163 | | | $ | — | | | $ | — | | | $ | — | | | $ | 6,801 | | | $ | 6,228 | |
| Financial institutions | | | 24,210 | | | | 2,927 | | | | 4,711 | | | | 43,741 | | | | 11,453 | (1) | | | 87,042 | | | | 71,314 | (1) |
| Retail | | | 2,390 | | | | 1,917 | | | | — | | | | 263 | | | | 42 | | | | 4,612 | | | | 3,903 | |
| Business services | | | 3,506 | | | | 1,274 | | | | 29 | | | | 331 | | | | 100 | | | | 5,240 | | | | 5,065 | |
| Manufacturing – capital goods | | | 1,056 | | | | 1,066 | | | | — | | | | 101 | | | | 42 | | | | 2,265 | | | | 2,062 | |
| Manufacturing – consumer goods | | | 1,288 | | | | 820 | | | | — | | | | 45 | | | | 35 | | | | 2,188 | | | | 1,960 | |
| Real estate and construction | | | 5,717 | | | | 2,690 | | | | — | | | | 618 | | | | 71 | | | | 9,096 | | | | 8,183 | |
| Agriculture | | | 2,968 | | | | 999 | | | | — | | | | 31 | | | | 23 | | | | 4,021 | | | | 3,486 | |
| Oil and gas | | | 2,791 | | | | 4,742 | | | | — | | | | 352 | | | | 419 | | | | 8,304 | | | | 8,128 | |
| Mining | | | 264 | | | | 1,955 | | | | — | | | | 284 | | | | 63 | | | | 2,566 | | | | 1,795 | |
| Forest products | | | 353 | | | | 344 | | | | 9 | | | | 102 | | | | 42 | | | | 850 | | | | 761 | |
| Hardware and software | | | 496 | | | | 349 | | | | 1 | | | | 31 | | | | 4 | | | | 881 | | | | 888 | |
| Telecommunications and cable | | | 418 | | | | 982 | | | | — | | | | 185 | | | | 172 | | | | 1,757 | | | | 1,711 | |
| Broadcasting, publishing, and printing | | | 424 | | | | 487 | | | | — | | | | 73 | | | | 12 | | | | 996 | | | | 990 | |
| Transportation | | | 1,114 | | | | 723 | | | | — | | | | 422 | | | | 44 | | | | 2,303 | | | | 2,390 | |
| Utilities | | | 875 | | | | 1,901 | | | | — | | | | 332 | | | | 404 | | | | 3,512 | | | | 3,185 | |
| Education, health, and social services | | | 1,211 | | | | 874 | | | | 17 | | | | 66 | | | | 80 | | | | 2,248 | | | | 2,135 | |
| Governments | | | 36,471 | | | | 3,043 | | | | 25 | | | | 54 | | | | 1,574 | | | | 41,167 | | | | 57,245 | |
| |
| | | $ | 92,190 | | | $ | 27,256 | | | $ | 4,792 | | | $ | 47,031 | | | $ | 14,580 | | | $ | 185,849 | | | $ | 181,429 | |
| |
| | |
| (1) | | Includes $1.2 billion (2009: $2.8 billion) of EAD with financial guarantors hedging our derivative contracts. The fair value of these derivative contracts net of CVA was $732 million (2009: $1.5 billion). |
74
Management’s Discussion and Analysis
As at October 31, 2010, the notional amount of credit protection purchased against our business and government loans was $1.2 billion (2009: $2.5 billion). The decrease during the year was due to unwinding of a number of hedge positions. The largest sector concentrations hedged through these programs were oil and gas of $767 million (2009: $1.2 billion) and financial intermediaries of $332 million (2009: $776 million). All counterparties from whom we have purchased credit protection for the loan portfolio are financial institutions with investment grade ratings from major rating agencies.
Total loans and acceptances
As at October 31, 2010, total loans and acceptances after allowance for credit losses were $184.6 billion (2009: $175.6 billion). Consumer loans (comprising residential mortgages, credit cards and personal loans, including student loans) constitute 75% (2009: 74%) of the portfolio, and business and government loans (including acceptances) constitute the remaining.
Consumer loans increased $8.3 billion or 6% from the prior year, resulting mainly from volume growth in residential mortgages and the acquisition of the MasterCard portfolio (which closed in September 2010). Residential mortgages increased by $7.4 billion or 9% and constitute 67% (2009: 66%) of the total consumer loan portfolio and exhibit very low levels of credit risk. The acquisition of the MasterCard portfolio accounted for $0.8 billion of the increase in credit cards.
Business and government loans (including acceptances) were up slightly by $0.7 billion or 1% from the prior year.
Impaired loans, allowance and provision for credit losses
| | | | | | | | | | | | | | | | | | | | | | | | | |
| | | Business | | | | | | | | | | | Business | | | | | | | |
| | | and | | | | | | | | | | | and | | | | | | | |
| | | government | | | Consumer | | | 2010 | | | government | | | Consumer | | | 2009 | |
| $ millions, as at or for the year ended October 31 | | loans | | | loans | | | Total | | | loans | | | loans | | | Total | |
| |
Gross impaired loans | | | | | | | | | | | | | | | | | | | | | | | | |
| Balance at beginning of year | | $ | 1,184 | | | $ | 727 | | | $ | 1,911 | | | $ | 399 | | | $ | 584 | | | $ | 983 | |
| New additions | | | 626 | | | | 1,636 | | | | 2,262 | | | | 1,142 | | | | 1,646 | | | | 2,788 | |
| Returned to performing status, repaid or sold | | | (404 | ) | | | (515 | ) | | | (919 | ) | | | (201 | ) | | | (436 | ) | | | (637 | ) |
| |
| Gross impaired loans prior to write-offs | | | 1,406 | | | | 1,848 | | | | 3,254 | | | | 1,340 | | | | 1,794 | | | | 3,134 | |
| Write-offs | | | (326 | ) | | | (1,092 | ) | | | (1,418 | ) | | | (156 | ) | | | (1,067 | ) | | | (1,223 | ) |
| |
| Balance at end of year | | $ | 1,080 | | | $ | 756 | | | $ | 1,836 | | | $ | 1,184 | | | $ | 727 | | | $ | 1,911 | |
| |
Specific allowance(1) | | | | | | | | | | | | | | | | | | | | | | | | |
| Balance at beginning of year | | $ | 442 | | | $ | 293 | | | $ | 735 | | | $ | 200 | | | $ | 243 | | | $ | 443 | |
| Write-offs | | | (326 | ) | | | (1,092 | ) | | | (1,418 | ) | | | (156 | ) | | | (1,067 | ) | | | (1,223 | ) |
| Provisions | | | 258 | | | | 943 | | | | 1,201 | | | | 392 | | | | 1,020 | | | | 1,412 | |
| Recoveries | | | 12 | | | | 111 | | | | 123 | | | | 28 | | | | 93 | | | | 121 | |
| Others | | | (9 | ) | | | (1 | ) | | | (10 | ) | | | (22 | ) | | | 4 | | | | (18 | ) |
| |
| Balance at end of year | | $ | 377 | | | $ | 254 | | | $ | 631 | | | $ | 442 | | | $ | 293 | | | $ | 735 | |
| |
Net impaired loans | | | | | | | | | | | | | | | | | | | | | | | | |
| Balance at beginning of year | | $ | 742 | | | $ | 434 | | | $ | 1,176 | | | $ | 199 | | | $ | 341 | | | $ | 540 | |
| Net change in gross impaired | | | (104 | ) | | | 29 | | | | (75 | ) | | | 785 | | | | 143 | | | | 928 | |
| Net change in allowance | | | 65 | | | | 39 | | | | 104 | | | | (242 | ) | | | (50 | ) | | | (292 | ) |
| |
| Balance at end of year | | $ | 703 | | | $ | 502 | | | $ | 1,205 | | | $ | 742 | | | $ | 434 | | | $ | 1,176 | |
| |
Gross impaired loans less specific allowance as a percentage of related assets(2) | | | | | | | | | | | 0.54 | % | | | | | | | | | | | 0.56 | % |
| |
| | |
| (1) | | Excludes allowance on letters of credit (2010: nil; 2009: $1 million). |
| |
| (2) | | The related assets include loans, securities borrowed or purchased under resale agreements, and acceptances. |
Impaired loans
During the year, $2.3 billion of loans were newly classified as impaired, down $0.5 billion from 2009. The decrease was driven by a decrease of $516 million in business and government loans and $10 million in consumer loans.
Reductions in gross impaired loans (GIL) through remediation, repayment or sale were $919 million, up $282 million from 2009. The increase comprised $79 million in consumer loans and $203 million in business and government loans. For the year, write-offs totalled $1.4 billion, up $195 million from the prior year. Consumer loan write-offs increased by $25 million, while business and government loan write-offs increased by $170 million.
Canadian consumer GIL trended higher beginning in 2007 due to both historical growth of the portfolio and economic deterioration but showed some signs of improvement in 2010. The majority of impaired residential mortgages in 2010 were in the Canadian insured portfolio where losses are expected to be minimal. The decrease in the business and government portfolio in 2010 was attributable to an improvement in credit quality of the Canadian and U.S. portfolios and increased write-offs, partially offset by deterioration in FirstCaribbean.
Additional details on the geographic distribution and industry classification of impaired loans are provided in the “Supplementary annual financial information” section.
75
Management’s Discussion and Analysis
Allowance for credit losses
The total allowance for credit losses consists of specific and general allowance components carried on the consolidated balance sheet.
The allowance for credit losses is the means by which we reduce the book value of our loan portfolio to the value of future cash flows that we expect to receive from those loans, discounted at the effective interest rate of the loan. Our loss estimate on impaired loans, and therefore, the level of specific allowance for such loans is a function of the security and collateral held against each of the impaired loans in the portfolio. The nature of the security and collateral varies by loan, and may include cash, guarantees, real property, inventory, accounts receivable, or other assets. Larger loans are assessed individually, while smaller retail loans may be assessed on a pooled basis, using historical loss data. The general allowance provides for credit losses that are expected to have already occurred in the current portfolio, but that have not yet been specifically identified or provided for through the specific allowance.
For a discussion on the methodologies used in establishing our allowance for credit losses, see the “Critical accounting policies and estimates” section. A breakdown of the allowance by geographic region and industry classification is provided in the “Supplementary annual financial information” section.
The total allowance for credit losses was $1,784 million, down $259 million or 13% from 2009.
Specific allowance for credit losses, excluding the allowance for letters of credit, was $631 million, down $104 million or 14% from 2009. The decrease was in both consumer and business and government loans. The specific allowance for consumer loans decreased by $39 million or 13%, mainly due to improvements in personal lending. The specific allowance for business and government loans decreased by $65 million or 15%, related to financial institutions, and the publishing, printing and broadcasting sector. The specific allowance was down in 2010 as a result of the improving economic conditions.
Consumer GIL increased to $756 million from $727 million a year ago. The increase was mainly attributable to residential mortgages driven by volume growth, partially offset by an improvement in personal lending. Despite the increase in residential mortgages, no material increases in allowance and losses are expected in this portfolio due to protection provided by mortgage insurance. Personal lending GIL decreased from a year ago, consistent with the downward movement in specific allowances for this portfolio, as a result of economic improvements in Canada.
The specific allowance for business and government loans decreased to $377 million from $442 million a year ago as the Canadian economy continued to recover and the U.S. economy began to improve. Business and government GIL decreased from $1,184 million to $1,080 million. The decrease was primarily in the U.S. and Canada. Business and government GIL decreased $211 million in the U.S. where specific allowances decreased $45 million (or approximately 21% of the decrease in GIL). In Canada, GIL decreased $41 million while the specific allowance decreased $14 million (or approximately 34% of the decrease in GIL). The decrease in GIL in Canada and the U.S. was partially offset by an increase of $148 million in the other regions, while allowances in the other regions decreased by $6 million. The increase in GIL in the other regions was attributable to our FirstCaribbean subsidiary, partially offset by a decrease in GIL in Europe. The allowance coverage in FirstCaribbean is generally lower than other regions, reflecting lower expected losses from the portfolio, given the higher level of security in place in the region.
Additional information on specific allowance for credit losses as a percentage of GIL is provided in the “Supplementary annual financial information” section.
The general allowance was $1,153 million, down $154 million from 2009. The decrease in consumer loans was $59 million or 7%, mainly driven by an improvement in the credit quality of our Visa card portfolio, partially offset by the general allowance established for the recently acquired MasterCard portfolio.
The decrease in business and government loans was $77 million or 20%, driven by a decrease in the Canadian portfolio of $37 million resulting mainly from a refinement in how we calculate our general allowance for small business, other countries (mainly Europe and the Caribbean) portfolio of $31 million, and the U.S. portfolio of $9 million. Additional information on the general allowance as a percentage of total net loans is provided in the “Supplementary annual financial information” section.
The general allowance related to undrawn credit facilities was down $18 million, primarily attributed to an improvement in the credit risk profile due to improving economic conditions.
Management believes the total allowance for credit losses as at October 31, 2010 was appropriate in light of the composition of the credit portfolio. Future additions to, or reductions of, the allowance will be influenced by the continuing evaluation of risks in the loan portfolio as well as changing economic conditions.
Settlement risk
Settlement risk is the risk that one party fails to deliver at the time of settlement on the terms of a contract between two parties. This risk can arise in general trading activities and from payment and settlement system participation.
Many global settlement systems offer significant risk reduction benefits through complex risk mitigation frameworks. We participate in several North American payment and settlement systems, including a global foreign exchange multilateral netting system. We also use financial intermediaries to access some payment and settlement systems.
Transactions settled outside of payment and settlement systems require approval of credit facilities for counterparties, either as pre-approved settlement risk limits or payment-versus-payment arrangements. Bilateral payment netting agreements may be put in place to mitigate risk by reducing the aggregate settlement amount between counterparties.
76
Management’s Discussion and Analysis
Market Risk
Market risk arises from positions in currencies, securities and derivatives held in our trading portfolios, and from our retail banking business, investment portfolios and other non-trading activities. Market risk is defined as the potential for financial loss from adverse changes in underlying market factors, including interest and foreign exchange rates, credit spreads, and equity and commodity prices.
Market risk is managed through an integrated internal control framework. Each business has a dedicated market risk manager, supplemented by regional risk managers located in all of our major trading centres, facilitating comprehensive risk coverage.
We have comprehensive policies for market risk management related to identification and measurement of the various types of market risk, the eligibility of certain of those risks for inclusion in the trading and non-trading books, and to the establishment of limits within which we manage our overall exposures.
Our policies also outline requirements for valuation model construction, and align with accounting policies with respect to MTM and model valuation methodologies, the independent checking of the valuation of positions, and the establishment of valuation adjustments.
In June 2010, the BCBS announced the delay of the implementation of revisions to the Basel II market risk framework until December 2011. We are working on a series of enhancements to our VaR models in order to meet the new regulatory requirements and ensure more complete risk capture, which will increase our VaR measure. We expect implementation of these enhancements to begin in fiscal 2011 with the inclusion of additional risk factors (which will lead to higher VaR results in the first quarter of 2011), and be completed within the revised timeline for revisions to the Basel II market risk framework in the first quarter of 2012.
Process and control
Market risk exposures are monitored daily against approved risk limits, and control processes are in place to monitor that only authorized activities are undertaken. We generate daily risk and limit-monitoring reports, based on the previous day’s positions. Summary market risk and limit compliance reports are produced and reviewed weekly with the SET, and quarterly with the RMC.
We have risk tolerance levels, expressed in terms of both statistically based VaR measures and potential worst-case stress losses. We use a three-tiered approach to set market risk and stress limits on the amounts of risk that we can assume in our trading and non-trading activities, as follows:
| • | | Tier 1 limits are our overall market risk and worst-case scenario limits; |
| |
| • | | Tier 2 limits are designed to control the risk profile in each business; and |
| |
| • | | Tier 3 limits are at the desk level and designed to monitor risk concentration and the impact of book-specific stress events. |
Tier 1 limits are established by the CEO, consistent with the risk tolerance policies approved by the RMC; Tier 2 and Tier 3 limits are approved at levels of management commensurate with the risk taken.
Trading activities
We hold positions in traded financial instruments to meet client investment and risk management needs, and for proprietary trading purposes. Trading revenue (net interest income or non-interest income) is generated from these transactions. Trading instruments are recorded at fair value and include debt and equity securities, as well as interest rate, foreign exchange, equity, commodity, and credit derivative products.
Risk measurement
We use the following measures for market risk:
| • | | VaR, which enables the meaningful comparison of the risks in different businesses and asset classes; |
| |
| • | | Stress testing and scenario analyses, which provide insight into portfolio behaviour under extreme circumstances; and |
| |
| • | | Backtesting, which validates the effectiveness of risk quantification through analysis of actual and theoretical profit and loss outcomes. |
The VaR measures disclosed in the table and backtesting chart on the next pages exclude exposures in our run-off businesses as described on pages 50 to 56 of the MD&A. These positions are being managed down independent of our trading businesses and our processes include frequent comprehensive measurement and reporting of the main risks to both management and the RMC.
Value-at-Risk
Our VaR methodology is a statistical technique that measures the potential overnight loss within a 99% confidence level. VaR uses numerous risk factors as inputs and is computed through the use of historical volatility of each risk factor and the associated historical correlations among them, evaluated over a one-year period.
Total market risk VaR is determined by the combined modelling of VaR for each of interest rate, credit spread, equity, foreign exchange, commodity, and debt specific risks, along with the reduction due to the portfolio effect arising from the interrelationship of the different risks.
Actual market loss experience may differ from that implied by the VaR measure for a variety of reasons. Fluctuations in market rates and prices may differ from those in the past that are used to compute the VaR measure. Additionally, the VaR measure does not account for any losses that may occur beyond the 99% confidence level.
To determine the reliability of the VaR models, actual outcomes are monitored regularly to test the validity of the assumptions and the parameters used in the VaR calculation. Market risk positions are also subject to regular stress tests against defined limits to ensure CIBC would withstand an extreme market event.
Stress testing and scenario analysis
Stress testing and scenario analyses are designed to add insight to possible outcomes of abnormal market conditions, and to highlight possible risk concentrations.
77
Management’s Discussion and Analysis
Our stress testing measures the effect on portfolio values of a wide range of extreme moves in market prices. The methodology assumes that no actions are taken during the stress event to mitigate risk, reflecting the decreased liquidity that frequently accompanies market shocks.
Our scenario analysis approach simulates the impact on earnings of extreme market events up to a period of one quarter. Scenarios are developed using actual historical market data during periods of market disruption, or are based on the hypothetical occurrence of economic events, political events and natural disasters suggested and designed by economists, business leaders and risk managers.
Among the historical scenarios used were the 1987 equity market crash, the 1994 period of U.S. Federal Reserve tightening, the 1998 Russian-led crisis, the market events following September 11, 2001, and the 2008 market crisis. The hypothetical scenarios used include potential market crises originating in North America and Asia.
Our core stress testing and scenario analyses are run daily, and further ad hoc analysis is carried out as required. Scenarios are reviewed and amended as necessary to ensure they remain relevant. Limits are placed on the maximum acceptable loss to the aggregate portfolio under any worst-case scenario and on the impact of stress testing at the detailed portfolio level and by asset class.
Backtesting
For each of our trading portfolios, and in aggregate, the backtesting process measures that actual profit and loss outcomes are consistent with the statistical assumptions of the VaR model. This process also includes the calculation of a hypothetical or static profit and loss. This represents the theoretical change in value of the prior day’s closing portfolio due to each day’s price movements, on the assumption that the contents of the portfolio remained unchanged.
The table below shows the mix of market risks by type of risk and in aggregate. The risks are interrelated and the diversification effect reflects the reduction of risk due to portfolio effects among the trading positions. Our trading risk exposures to interest rates and credit spreads arise from activities in the global debt and derivative markets, particularly from transactions in the Canadian, U.S. and European markets. The primary instruments are government and corporate debt, interest rate derivatives and other. The bulk of the trading exposure to foreign exchange risk arises from transactions involving the U.S. dollar, Euro, British pound and Japanese yen, whereas the primary risks of losses in equities are in the U.S., Canadian and European markets. Trading exposure to commodities arises primarily from transactions involving North American natural gas and oil product indices.
Total average risk for the trading portfolio was down 33% from the previous year, primarily due to proactive managing down of the market risk exposure and general improvement in the capital markets.
VaR by risk type — trading portfolio(1)
| | | | | | | | | | | | | | | | | | | | | | | | | | | | | | | | | |
| | | 2010 | | | 2009 | |
| $ millions, as at or for the year ended October 31 | | Year-end | | | Average | | | High | | | Low | | | Year-end | | | Average | | | High | | | Low | |
| |
| Interest rate risk | | $ | 3.2 | | | $ | 3.2 | | | $ | 6.2 | | | $ | 1.3 | | | $ | 3.3 | | | $ | 4.1 | | | $ | 7.7 | | | $ | 1.7 | |
| Credit spread risk | | | 0.9 | | | | 0.6 | | | | 1.4 | | | | 0.3 | | | | 0.5 | | | | 1.2 | | | | 7.9 | | | | 0.4 | |
| Equity risk | | | 0.8 | | | | 1.1 | | | | 2.5 | | | | 0.6 | | | | 1.2 | | | | 2.8 | | | | 6.1 | | | | 1.0 | |
| Foreign exchange risk | | | 0.7 | | | | 1.0 | | | | 2.7 | | | | 0.3 | | | | 1.1 | | | | 0.9 | | | | 7.3 | | | | 0.1 | |
| Commodity risk | | | 0.3 | | | | 0.5 | | | | 3.1 | | | | 0.2 | | | | 0.5 | | | | 0.7 | | | | 2.7 | | | | 0.3 | |
| Debt specific risk | | | 2.2 | | | | 1.7 | | | | 2.8 | | | | 1.0 | | | | 1.2 | | | | 2.5 | | | | 6.1 | | | | 0.9 | |
Diversification effect(2) | | | (4.0 | ) | | | (3.9 | ) | | | n/m | | | | n/m | | | | (3.4 | ) | | | (5.9 | ) | | | n/m | | | | n/m | |
| |
| Total risk | | $ | 4.1 | | | $ | 4.2 | | | $ | 6.8 | | | $ | 2.6 | | | $ | 4.4 | | | $ | 6.3 | | | $ | 14.6 | | | $ | 3.0 | |
| |
| | |
| (1) | | The table excludes exposures in our run-off businesses which are described on pages 50 to 56 of the MD&A. |
| |
| (2) | | Aggregate VaR is less than the sum of the VaR of the different market risk types due to risk offsets resulting from portfolio diversification effect. |
| |
| n/m | | Not meaningful. It is not meaningful to compute a diversification effect because the high and low may occur on different days for different risk types. |
Trading revenue
Trading revenue was $821 million (2009: $(294) million; 2008: $(7,239) million) and trading revenue (TEB)(1)was $870 million (2009: $(256) million; 2008: $(7,056) million). The trading revenue and trading revenue (TEB)(1)for 2010 in the daily trading revenue histogram and trading revenue (TEB)(1)and VaR backtesting graph below exclude $134 million from run-off positions related primarily to structured credit, which cannot be meaningfully allocated to specific days. The histogram below presents the frequency distribution of daily trading revenue (TEB)(1)for 2010. Trading revenue (TEB)(1)was positive for 93% of the days (2009: 91%; 2008: 55%). Daily trading losses did not exceed VaR during the year. Average daily trading revenue (TEB)(1)was $2.9 million (2009: $3.3 million; 2008: $0.4 million). The trading revenue (TEB)(1)below and VaR backtesting graph which follows compares the 2010 actual daily trading revenue (TEB)(1)with the previous day’s VaR measures.
78
Management’s Discussion and Analysis
Frequency distribution of daily 2010 trading revenue (TEB)(1)(2)
| | |
| (1) | | For additional information, see the “Non-GAAP measures” section. Trading revenue comprises both trading net interest income and non-interest income. |
| |
| (2) | | The graph excludes revenue from run-off positions related primarily to reductions in fair value of structured credit assets and CVA, which cannot be allocated meaningfully to specific days. |
Backtesting of trading revenue (TEB)(1)(2)vs. VaR
| | |
| (1) | | For additional information, see the “Non-GAAP measures” section. |
| |
| (2) | | The graph excludes revenue from run-off positions related primarily to reductions in fair value of structured credit assets and CVA, which cannot be allocated meaningfully to specific days. |
79
Management’s Discussion and Analysis
Non-exchange traded commodity derivatives
In the normal course of business, we trade non-exchange traded commodity derivative contracts. We control and manage our non-exchange traded commodity derivatives risk through the VaR and stress testing methodologies described above. We use modelling techniques or other valuation methodologies to determine the fair value of these contracts.
The following table provides the fair value, based upon maturity of non-exchange traded commodity contracts:
| | | | | | | | | | | | | |
| $ millions, as at October 31, 2010 | | Positive | | | Negative | | | Net | |
| |
| Maturity less than 1 year | | $ | 216 | | | $ | 171 | | | $ | 45 | |
| Maturity 1 — 3 years | | | 178 | | | | 205 | | | | (27 | ) |
| Maturity 4 — 5 years | | | 29 | | | | 13 | | | | 16 | |
| Maturity in excess of 5 years | | | 62 | | | | 4 | | | | 58 | |
| |
| Fair value of contracts | | $ | 485 | | | $ | 393 | | | $ | 92 | |
| |
Non-trading activities
Market risks also arise from our retail banking business, equity investments and other non-trading activities. We originate many retail products with market risk characteristics. Changes in market conditions, customer behaviour and competitive market pressures can have an impact on the market risk exposure and retail margins earned from these products. Foreign exchange exposures arising from net earnings from, and investments in, foreign operations are also included in non-trading activities.
Interest rate risk
Non-trading interest rate risk consists primarily of risk inherent in ALM activities and the activities of domestic and foreign subsidiaries. Interest rate risk results from differences in the maturities or repricing dates of assets and liabilities, both on- and off-balance sheet, as well as from embedded optionality in retail products. This optionality arises predominantly from the prepayment exposures of mortgage products, mortgage commitments and some GIC products with early redemption features; this optionality is measured consistent with our actual experience. A variety of cash instruments and derivatives, principally interest rate swaps, futures and options, are used to manage and control these risks.
ALM activities are conducted by Treasury under the supervision of the SET, within the overall risk appetite established by the Board. Compliance with trading and non-trading market risk policy, as well as market risk limits is monitored daily by market risk management.
Our principal interest rate risk measures are VaR, earnings risk, and future risk. Earnings risk is the impact to net income after-tax, over a one-year term of an immediate 1% and 2% increase in market interest rates. Future risk is the impact to common shareholders’ equity (on a present value basis) of an immediate 1% and 2% increase in market interest rates.
Our total non-trading interest rate risk exposure, as at October 31, 2010, is included in Note 20 to the consolidated financial statements. On- and off-balance sheet assets and liabilities are generally reported based on the earlier of their contractual repricing or maturity date; however, our disclosure includes the assumed interest rate sensitivity of certain assets and liabilities (including core deposits and credit card balances), reflecting how we manage interest rate risk; the assumed duration of core balances is approximately 1.9 years. The interest rate position reported in Note 20 presents our risk exposure only at a point in time. The exposure can change depending on client preference for products and terms, including mortgage prepayment or other options exercised, and the nature of our management of the various and diverse portfolios that comprise the consolidated interest rate risk position.
The following table shows the potential impact over the next 12 months, adjusted for estimated prepayments, of an immediate 100 and 200 basis point increase or decrease in interest rates. In addition, we have a floor in place in the downward shock to accommodate for the current low interest rate environment.
Interest rate sensitivity — non-trading (after-tax)
| | | | | | | | | | | | | | | | | | | | | | | | | |
| $ millions, as at October 31 | | 2010 | | | 2009 | |
| | | C$ | | | US$ | | | Other | | | C$ | | | US$ | | | Other | |
| |
100 basis points increase in interest rates | | | | | | | | | | | | | | | | | | | | | | | | |
| Net income | | $ | 110 | | | $ | 12 | | | $ | 3 | | | $ | 134 | | | $ | (21 | ) | | $ | 2 | |
Change in present value of shareholders’ equity(1) | | | (39 | ) | | | (17 | ) | | | (12 | ) | | | 322 | | | | (89 | ) | | | (6 | ) |
100 basis points decrease in interest rates | | | | | | | | | | | | | | | | | | | | | | | | |
| Net income | | $ | (173 | ) | | $ | (2 | ) | | $ | (3 | ) | | $ | (30 | ) | | $ | 21 | | | $ | (2 | ) |
Change in present value of shareholders’ equity(1) | | | (68 | ) | | | 9 | | | | 9 | | | | (257 | ) | | | 75 | | | | 5 | |
| |
200 basis points increase in interest rates | | | | | | | | | | | | | | | | | | | | | | | | |
| Net income | | $ | 196 | | | $ | 25 | | | $ | 5 | | | $ | 218 | | | $ | (42 | ) | | $ | 3 | |
Change in present value of shareholders’ equity(1) | | | (117 | ) | | | (33 | ) | | | (25 | ) | | | 643 | | | | (178 | ) | | | (11 | ) |
200 basis points decrease in interest rates | | | | | | | | | | | | | | | | | | | | | | | | |
| Net income | | $ | (250 | ) | | $ | (2 | ) | | $ | (3 | ) | | $ | (22 | ) | | $ | 19 | | | $ | (1 | ) |
Change in present value of shareholders’ equity(1) | | | (161 | ) | | | 13 | | | | 17 | | | | (536 | ) | | | 126 | | | | 12 | |
| |
| | |
| (1) | | Commencing 2010, amounts reported exclude the impact of structural assumptions relating to shareholders’ equity. |
80
Management’s Discussion and Analysis
Foreign exchange risk
Non-trading foreign exchange risk, also referred to as structural foreign exchange risk, arises primarily from our investments in foreign operations. This risk, predominantly in U.S. dollars, is managed using derivative hedges and by funding the investments in foreign currencies. We actively manage this risk to ensure that the potential impact to earnings is minimized and that the potential impact on our capital ratios is within tolerances set by the RMC.
Structural foreign exchange risk is managed by Treasury under the supervision of the SET, with the overall risk appetite established by the Board. Compliance with trading and non-trading market risk policy, as well as market risk limits is monitored daily by market risk management.
A 1% appreciation of the Canadian dollar would reduce our shareholders’ equity as at October 31, 2010 by approximately $39 million (2009: $40 million) on a pre-tax basis.
Our non-functional currency denominated earnings are converted into the functional currencies through spot or forward foreign exchange transactions. Thus, there is no significant impact of exchange rate fluctuations on our consolidated statement of operations, except for foreign functional currency earnings, which are translated at average monthly exchange rates as they arise.
We hedge certain foreign currency contractual expenses using derivatives which are accounted for as cash flow hedges. The net change in fair value of these hedging derivatives included in AOCI amounted to a loss of $24 million as at October 31, 2010 (2009: loss of $38 million). This amount will be released from AOCI to offset the hedged currency fluctuations as the expenses are incurred.
Derivatives held for ALM purposes
Where derivatives are held for ALM purposes, and when transactions meet the criteria specified in the CICA handbook section 3865, we apply hedge accounting for the risks being hedged, as discussed in Notes 1, 2 and 15 to the consolidated financial statements. Derivative hedges that do not qualify for hedge accounting treatment are referred to as economic hedges and are recorded at fair value on the consolidated balance sheet with changes in fair value recognized in the consolidated statement of operations.
Economic hedges for other than FVO financial instruments may lead to income volatility because the hedged items are either recorded on a cost or amortized cost basis; this income volatility may not be representative of the overall risk.
Equity risk
Non-trading equity risk arises primarily in our merchant banking activities. Our merchant banking investments comprise public and private equities, investments in limited partnerships, and equity-accounted investments.
The following table provides the amortized cost and fair values of our non-trading equities, including merchant banking portfolios:
| | | | | | | | | | | |
| $ millions, as at October 31 | | Amortized cost | | | Fair value | |
| |
| 2010 | | AFS securities | | $ | 696 | | | $ | 1,023 | |
| | | Equity-accounted investments | | | 298 | | | | 324 | |
| |
| | | | | $ | 994 | | | $ | 1,347 | |
| |
| 2009 | | AFS securities | | $ | 948 | | | $ | 1,206 | |
| | | Equity-accounted investments | | | 190 | | | | 209 | |
| |
| | | | | $ | 1,138 | | | $ | 1,415 | |
| |
Liquidity Risk
Liquidity risk arises from our general funding activities and in the course of managing our assets and liabilities. It is the risk of having insufficient cash resources to meet current financial obligations without raising funds at unfavourable rates or selling assets on a forced basis.
Our liquidity risk management strategies seek to maintain sufficient liquid financial resources to continually fund our balance sheet under both normal and stressed market environments.
In its oversight capacity, the Board establishes the liquidity risk framework that recognizes the credit-sensitive nature of our business activities and the importance of depositor confidence. The established management framework consists of policies, limits and independent monitoring structures governing major regional funding centres and operating subsidiaries in North America, Europe and Asia.
The Treasurer oversees and governs our liquidity risk management framework and is responsible for recommending and maintaining the liquidity policies as well as monitoring compliance to the policies.
Policies and standards defining our liquidity risk management, measurement and reporting requirements are reviewed and approved annually by the RMC. Our liquidity policies require maintenance of sufficient unencumbered liquid assets or unused funding capacity to meet anticipated funding needs (as measured by a selected benchmark stress scenario) for a minimum period of time as determined by the RMC. Guidelines are set to ensure adequate diversification of funds and to manage individual depositor concentration.
As part of the liquidity risk management framework, our enterprise-wide pledging policy sets out consolidated aggregate net maximum pledge limits for financial and non-financial assets. Pledged assets are considered encumbered for liquidity purposes.
We maintain and periodically update a liquidity contingency plan for responding to stress event impacts. The plan is presented annually to the RMC.
81
Management’s Discussion and Analysis
Process and control
Actual and anticipated inflows and outflows of funds generated from on- and off-balance sheet exposure are monitored on a daily basis to ensure compliance with the limits. Potential cash flows under various stress scenarios are modelled using balance sheet positions. Short-term asset/liability mismatch limits are set by geographic location and consolidated for overall global exposure. On a consolidated basis, prescribed liquidity levels under a selected benchmark stress scenario are maintained for a minimum time horizon.
The RMC is regularly informed of current and prospective liquidity conditions, ongoing monitoring measures and the implementation of enhanced measurement tools.
Risk measurement
Our liquidity measurement system provides daily liquidity risk exposure reports for review by senior management. ALCO monitors CIBC’s current and prospective liquidity position in relation to risk appetite and limits. Stress event impacts are measured through scenario analyses, designed to measure potential impact of abnormal market conditions on the liquidity risk profile. Treatment of cash flows under varying conditions is reviewed periodically to determine whether changes to customer behaviour assumptions are warranted.
The primary liquidity risk metric to measure and monitor our liquidity positions is liquidity horizon, the future point in time when projected cumulative cash outflows exceed cash inflows. Our on- and off-balance sheet positions are projected forward using parameters to reflect response expectations by category under given stress environments.
Collateral, which consists mainly of cash and high-quality government bonds that are generally acceptable by central banks, is primarily used to minimize exposure to counterparty credit risk. In the normal course of business, we are exposed to the risk of counterparties being unable to provide required collateral to cover their exposure with us. In addition, we are exposed to impacts of downgrades of our own credit ratings on the requirements to collateralize counterparties’ credit exposures. As part of our liquidity framework, we make prudential assumptions on intraday and other collateral requirements that may arise under hypothetical CIBC defined liquidity stress events. These requirements are pre-funded by holding appropriate liquid asset buffers in the form of unencumbered high-quality securities.
Term funding sources and strategies
We manage liquidity to meet both short- and long-term cash requirements. Reliance on short-term wholesale funding is maintained at prudent levels.
We obtain funding through both wholesale and retail sources. Consistent with our liquidity risk mitigation strategies, we continue to source term funding in the wholesale markets from a variety of clients and geographic locations, borrowing across a range of maturities, using a mix of funding instruments.
Core personal deposits remain a primary source of retail funding and totalled $108.6 billion as at October 31, 2010 (2009: $104.3 billion).
Strategies for managing liquidity risk include maintaining diversified sources of wholesale term funding, asset securitization initiatives, and maintenance of segregated pools of high-quality liquid assets that can be sold or pledged as security to provide a ready source of cash. Collectively, these strategies result in lower dependency on short-term wholesale funding.
New facilities introduced in 2008 by various governments and global central banks including the Bank of Canada and the U.S. Federal Reserve Bank provide liquidity to financial systems. These liquidity initiatives include expansion of eligible types of collateral, provision of term liquidity through Purchase and Resale Agreement facilities, and the pooling and sale to CMHC of NHA MBS, which are composed of insured residential mortgage pools. From time to time, we utilize these term funding facilities, pledging a combination of private and public sector assets against these obligations. These facilities have largely been withdrawn, but term funding raised will continue to be outstanding.
We were an active issuer of term debt during the year, raising US$4,250 million, CHF 1,175 million, and AUD 750 million through covered bond issuances, and over $14 billion through the issuance of Canadian and U.S. deposit notes.
We have historically securitized various financial assets, including credit card receivables and residential and commercial mortgages. For further discussion of our off-balance sheet arrangements affecting liquidity and funding, see the “Off-balance sheet arrangements” section.
Balance sheet liquid assets are summarized in the following table:
| | | | | | | | | |
| $ billions, as at October 31 | | 2010 | | | 2009 | |
| |
| Cash | | $ | 1.3 | | | $ | 1.2 | |
| Deposits with banks | | | 10.7 | | | | 5.8 | |
Securities issued by Canadian governments(1) | | | 5.4 | | | | 16.8 | |
Mortgage-backed securities(1) | | | 20.1 | | | | 19.4 | |
Other securities(2) | | | 40.9 | | | | 31.0 | |
| Securities borrowed or purchased under resale agreements | | | 37.3 | | | | 32.8 | |
| |
| | | $ | 115.7 | | | $ | 107.0 | |
| |
| | |
| (1) | | These represent securities with residual term to contractual maturity of more than one year. |
| |
| (2) | | Comprises AFS securities and FVO securities with residual term to contractual maturity within one year and trading securities. |
In the course of our regular business activities, certain assets are pledged as part of collateral management, including those necessary for day-to-day clearing and settlement of payments and securities. Pledged assets, including those for covered bonds, securities borrowed or financed through repurchase agreements as at October 31, 2010 totalled $33.5 billion (2009: $36.7 billion). For additional details, see Note 25 to the consolidated financial statements.
82
Management’s Discussion and Analysis
Credit ratings
Access to wholesale funding sources and the cost of funds are dependent on various factors including credit ratings. During the course of the year, DBRS changed CIBC’s outlook from negative to stable and Moody’s lowered its ratings on Canadian bank preferred shares. The change to our preferred share ratings as a result of Moody’s decision is reflected in the table below. There have been no other changes to our credit ratings and outlook during the year at major credit rating agencies.
Our funding and liquidity levels remained stable and sound over the year and we do not anticipate any events, commitments or demands that will materially impact our liquidity risk position.
Our credit ratings are summarized in the table below:
| | | | | | | | | | | | | | | | | | | | | | | | | | | | | | | | | |
| | | Short-term debt | | | Senior debt | | | Subordinated debt | | | Preferred shares | |
| As at October 31 | | 2010 | | | 2009 | | | 2010 | | | 2009 | | | 2010 | | | 2009 | | | 2010 | | | 2009 | |
| |
| DBRS | | | R-1(H) | | | | R-1(H) | | | | AA | | | | AA | | | | AA(L) | | | | AA(L) | | | | Pfd-1(L) | | | | Pfd-1(L) |
| Fitch | | | F1+ | | | | F1+ | | | | AA- | | | | AA- | | | | A+ | | | | A+ | | | | A | | | | A | |
| Moody’s | | | P-1 | | | | P-1 | | | | Aa2 | | | | Aa2 | | | | Aa3 | | | | Aa3 | | | | Baa1 | | | | A1 | |
| S&P | | | A-1 | | | | A-1 | | | | A+ | | | | A+ | | | | A | | | | A | | | | P-1(L) | | | | P-1(L) | |
| |
Impact on collateral if there is a downgrade of CIBC’s credit rating
We are required to deliver collateral to certain derivative counterparties in case of a downgrade to our current credit risk rating. The collateral requirement is based on MTM exposure, collateral valuations, and collateral arrangement thresholds as applicable.
Restrictions on the flow of funds
We have certain subsidiaries that have separate regulatory capital, liquidity and funding requirements, as set by banking and securities regulators. Requirements of these entities are subject to regulatory change and can fluctuate depending on activity.
We monitor and manage our capital and liquidity requirements across these entities to ensure that capital is used efficiently and that each entity is in continuous compliance with local regulations.
Contractual obligations
Contractual obligations give rise to commitments of future payments affecting our short- and long-term liquidity and capital resource needs. These obligations include financial liabilities, credit and liquidity commitments, and other contractual obligations.
Financial liabilities
The following table provides the maturity profile of financial liabilities based upon contractual repayment obligations, and excludes contractual cash flows related to derivative liabilities. Contractual maturity information related to derivatives is provided in Note 14 to the consolidated financial statements. Although contractual repayments of many deposit accounts are on demand or at short notice, in practice, short-term deposit balances remain stable. Our deposit retention history indicates that many customers do not request repayment on the earliest redemption date and the table therefore does not reflect the anticipated cash flows.
| | | | | | | | | | | | | | | | | | | | | | | | | | | | | |
| | | Less than | | | 1-3 | | | 3-5 | | | Over | | | No specified | | | 2010 | | | 2009 | |
| $ millions, as at October 31 | | 1 year | | | years | | | years | | | 5 years | | | maturity | | | Total | | | Total | |
| |
Liabilities | | | | | | | | | | | | | | | | | | | | | | | | | | | | |
| Deposits | | $ | 76,428 | | | $ | 39,264 | | | $ | 8,885 | | | $ | 9,515 | | | $ | 112,579 | | | $ | 246,671 | | | $ | 223,117 | |
| Acceptances | | | 7,684 | | | | — | | | | — | | | | — | | | | — | | | | 7,684 | | | | 8,397 | |
| Obligations related to securities sold short | | | 9,673 | | | | — | | | | — | | | | — | | | | — | | | | 9,673 | | | | 5,916 | |
| Obligations related to securities lent or sold under repurchase agreements | | | 26,121 | | | | 1,478 | | | | — | | | | 621 | | | | — | | | | 28,220 | | | | 37,453 | |
| Other liabilities | | | — | | | | — | | | | — | | | | — | | | | 12,740 | | | | 12,740 | | | | 13,867 | |
| Subordinated indebtedness | | | — | | | | — | | | | 250 | | | | 4,366 | | | | — | | | | 4,616 | | | | 4,969 | |
| Preferred share liabilities | | | — | | | | — | | | | — | | | | — | | | | — | | | | — | | | | 600 | |
| |
| | | $ | 119,906 | | | $ | 40,742 | | | $ | 9,135 | | | $ | 14,502 | | | $ | 125,319 | | | $ | 309,604 | | | $ | 294,319 | |
| |
83
Management’s Discussion and Analysis
Credit and liquidity commitments
The following table provides the contractual maturity of notional amounts of credit, guarantee, and liquidity commitments should contracts be fully drawn upon and clients default. Since a significant portion of guarantees and commitments are expected to expire without being drawn upon, the total of the contractual amounts is not representative of future liquidity requirements.
| | | | | | | | | | | | | | | | | | | | | | | | | |
| | | Contract amounts expiration per period | | | | | | | |
| | | Less than | | | 1-3 | | | 3-5 | | | Over | | | 2010 | | | 2009 | |
| $ millions, as at October 31 | | 1 year | | | years | | | years | | | 5 years | | | Total | | | Total | |
| |
Unutilized credit commitments(1) | | $ | 23,998 | | | $ | 17,610 | | | $ | 2,401 | | | $ | 521 | | | $ | 44,530 | | | $ | 39,747 | |
| Backstop liquidity facilities | | | 4,403 | | | | — | | | | — | | | | — | | | | 4,403 | | | | 4,869 | |
| Standby and performance letters of credit | | | 4,656 | | | | 767 | | | | 146 | | | | 152 | | | | 5,721 | | | | 5,123 | |
| Documentary and commercial letters of credit | | | 290 | | | | — | | | | — | | | | — | | | | 290 | | | | 234 | |
| |
| | | $ | 33,347 | | | $ | 18,377 | | | $ | 2,547 | | | $ | 673 | | | $ | 54,944 | | | $ | 49,973 | |
| |
| | |
| (1) | | Excludes personal lines of credit, home equity lines of credit, and credit card lines. |
Other contractual obligations
The following table provides the contractual maturities of other contractual obligations affecting our short- and long-term and capital resource needs:
| | | | | | | | | | | | | | | | | | | | | | | | | |
| | | Less than | | | 1-3 | | | 3-5 | | | Over | | | 2010 | | | 2009 | |
| $ millions, as at October 31 | | 1 year | | | years | | | years | | | 5 years | | | Total | | | Total | |
| |
| Operating leases | | $ | 332 | | | $ | 596 | | | $ | 495 | | | $ | 1,482 | | | $ | 2,905 | | | $ | 2,871 | |
Purchase obligations(1) | | | 581 | | | | 801 | | | | 219 | | | | 151 | | | | 1,752 | | | | 1,438 | |
Investment commitments(2) | | | 294 | | | | — | | | | — | | | | — | | | | 294 | | | | 372 | |
Pension contributions(3) | | | 216 | | | | — | | | | — | | | | — | | | | 216 | | | | 199 | |
| Underwriting commitments | | | 183 | | | | — | | | | — | | | | — | | | | 183 | | | | 358 | |
| |
| | | $ | 1,606 | | | $ | 1,397 | | | $ | 714 | | | $ | 1,633 | | | $ | 5,350 | | | $ | 5,238 | |
| |
| | |
| (1) | | Obligations that are legally binding agreements whereby we agree to purchase products or services with specific minimum or baseline quantities defined at fixed, minimum or variable prices over a specified period of time are defined as purchase obligations. Purchase obligations are included through to the termination date specified in the respective agreements, even if the contract is renewable. Many of the purchase agreements for goods and services include clauses that would allow us to cancel the agreement prior to expiration of the contract within a specific notice period. However, the amount above includes our obligations without regard to such termination clauses (unless actual notice of our intention to terminate the agreement has been communicated to the counterparty). The table excludes purchases of debt and equity instruments that settle within standard market timeframes. |
| |
| (2) | | As an investor in merchant banking activities, we enter into commitments to fund external private equity funds and investments in equity and debt securities at market value at the time the commitments are drawn. As the timing of future investment commitments is non-specific and callable by the counterparty, obligations have been included as less than one year. |
| |
| (3) | | Subject to change as contribution decisions are affected by various factors, such as market performance, regulatory requirements, and management’s ability to change funding policy. Also, funding requirements after 2011 are excluded due to the significant variability in the assumptions required to project the timing of future cash flows. |
Strategic Risk
Strategic risk arises from ineffective business strategies or the failure to effectively execute strategies. It includes, but is not limited to, potential financial loss due to the failure of acquisitions or organic growth initiatives.
Oversight of strategic risk is the responsibility of the SET and the Board. At least annually, the CEO presents CIBC’s strategic planning process and CIBC’s annual strategic business plan to the Board for review and approval. The Board reviews the plan in light of management’s assessment of emerging market trends, the competitive environment, potential risks and other key issues.
One of the tools for measuring, monitoring and controlling strategic risk is attribution of economic capital against this risk. Our economic capital models include a strategic risk component for those businesses utilizing capital to fund an acquisition or a significant organic growth strategy.
Operational Risk
Operational risk is the risk of loss resulting from inadequate or failed internal processes, systems, human error or external events.
Operational risks driven by people and processes are mitigated through human resources policies and practices, and operational procedural controls, respectively. Operational risks driven by systems are managed through controls over technology development and change management.
The GCC oversees the effectiveness of our internal control framework within the parameters and strategic objectives established by the SET. The SET is accountable to the Board and its Audit Committee and the RMC for maintaining a strong internal control environment.
Process and control
Each line of business has responsibility for the day-to-day management of operational risk. Infrastructure and governance groups maintain risk and control self-assessment processes. We maintain a corporate insurance program to provide additional protection from loss and a global business continuity management program to mitigate business continuity risks in the event of a disaster.
Risk measurement
We use the Advanced Measurement Approach (AMA) under Basel II to calculate operational risk regulatory capital. Our operational risk measurement methodology attributes operational risk capital to expected and unexpected losses arising from the following loss event types:
| • | | Legal liability (with respect to third parties, clients and employees); |
| |
| • | | Client restitution; |
| |
| • | | Regulatory compliance and taxation violations; |
| |
| • | | Loss or damage to assets; |
| |
| • | | Transaction processing errors; and |
| |
| • | | Theft, fraud and unauthorized activities. |
84
Management’s Discussion and Analysis
Operational risk capital is calculated using a loss distribution approach with the input parameters based on either actual internal loss experience where a statistically significant amount of internal historical data is available, or applying a loss scenario approach based on the available internal/external loss data and management expertise.
In addition to the capital attributed as described above, adjustments are made for internal control issues and risks that are not included in the original operational risk profile. These adjustments are based on the results of the quarterly risk and control self-assessment processes, which involve input from the business and infrastructure groups as well as from the governance areas such as the Operational Risk Department, Control Division, Internal Audit, Legal, and Compliance.
Under AMA, we are allowed to recognize the risk mitigating impact of insurance in the measures of operational risk used for regulatory minimum capital requirements. Although our current insurance policies are tailored to provide earnings protection from potential high-severity losses, we currently do not take any capital relief as a result of our insurance program.
We attribute operational risk capital at the line of business level. Capital represents the worst-case loss and is determined for each loss event type and production/infrastructure/corporate governance line of business. The aggregate risk of CIBC is less than the sum of the individual parts, as the likelihood that all business groups across all regions will experience a worst-case loss in every loss category in the same year is extremely small. To adjust for the fact that all risks are not 100% correlated, we incorporate a portfolio effect to ensure that the aggregated risk is representative of the total bank-wide risk. The process for determining correlations considers both internal and external historical correlations and takes into account the uncertainty surrounding correlation estimates.
The results of the capital calculations are internally backtested each quarter, and the overall methodology is independently validated by the Risk Management Validation group to ensure that the assumptions applied are reasonable and conservative.
Reputation and Legal Risk
Our reputation and financial soundness are of fundamental importance to us and to our customers, shareholders and employees.
Reputation risk is the potential for negative publicity regarding our business conduct or practices which, whether true or not, could significantly harm our reputation as a leading financial institution, or could materially and adversely affect our business, operations or financial condition.
Legal risk is the potential for civil litigation or criminal or regulatory proceedings being commenced against CIBC that, once decided, could materially and adversely affect our business, operations or financial condition.
The RMC provides oversight of the management of reputation and legal risk. The identification, consideration and prudent, proactive management of potential reputation and legal risk is a key responsibility of CIBC and all of our employees.
Our Global Reputation and Legal Risks Policy sets standards for safeguarding our reputation and minimizing exposure to our reputation and legal risk. The policy is supplemented by business procedures for identifying and escalating transactions that could pose material reputation risk and/or legal risk to the RLR Committee.
Regulatory Risk
Regulatory risk is the risk of non-compliance with regulatory requirements. Non-compliance with these requirements may lead to regulatory sanctions and harm to our reputation.
Our regulatory compliance philosophy is to manage regulatory risk through the promotion of a strong compliance culture, and the integration of sound controls within the business and infrastructure groups. The foundation of this approach is a comprehensive Legislative Compliance Management (LCM) framework. The LCM framework maps regulatory requirements to internal policies, procedures and controls that govern regulatory compliance.
Our Compliance department is responsible for the development and maintenance of a comprehensive regulatory compliance program, including oversight of the LCM framework. The department is independent of business management and reports regularly to the Audit Committee.
Primary responsibility for compliance with all applicable regulatory requirements rests with senior management of the business and infrastructure groups, and extends to all employees. The Compliance department’s activities support those groups, with particular emphasis on those regulatory requirements that govern the relationship between CIBC and its clients and those requirements that help protect the integrity of the capital markets.
Environmental Risk
Environmental risk is the risk of financial loss or damage to reputation associated with environmental issues, whether arising from our credit and investment activities or related to our own operations. Our corporate environmental policy, originally approved by the Board in 1993 and most recently updated and approved by the RMC in 2010, commits CIBC to responsible conduct in all activities to protect and conserve the environment; safeguard the interests of all stakeholders from unacceptable levels of environmental risk; and support the principles of sustainable development.
The policy is addressed by an integrated Corporate Environmental Management Program which is under the overall management of the Environmental Risk Management (ERM) group in Risk Management. Environmental evaluations are integrated into our credit and investment risk assessment processes, with environmental risk management standards and procedures in place for all sectors. In addition, environmental and social risk assessments in project finance are required in accordance with our commitment to the Equator Principles, a voluntary set of guidelines for financial institutions based on the screening criteria of the International Finance Corporation, which we adopted in 2003. We also conduct ongoing research and benchmarking on environmental issues such as climate change and biodiversity protection as they may pertain to responsible lending practices. We are also a signatory to and participant in the Carbon Disclosure Project, which promotes corporate disclosure to the investment community on greenhouse gas emissions and climate change management.
The ERM group works closely with Corporate Services, Marketing, Communications and Public Affairs, and other business and functional groups in ensuring that high standards of environmental due diligence and responsibility are applied in our facilities management, purchasing and other operations. An Environmental Management Committee is in place to provide oversight and to support these activities.
85
Management’s Discussion and Analysis
Accounting and Control Matters
Critical Accounting Policies and Estimates
A summary of significant accounting policies is presented in Note 1 to the consolidated financial statements. Certain accounting policies require us to make judgments and estimates, some of which may relate to matters that are uncertain. Changes in the judgments and estimates required in the critical accounting policies discussed below could have a material impact on our financial results. We have established control procedures to ensure accounting policies are applied consistently and processes for changing methodologies are well controlled.
Valuation of financial instruments
Debt and equity trading securities, obligations related to securities sold short, all derivative contracts, AFS securities other than private equities, and FVO financial instruments are carried at fair value. FVO financial instruments include debt securities, business and government loans, and business and government deposits.
The determination of fair value requires judgment and is based on market information, where available and appropriate. Fair value is defined as the amount at which a financial instrument could be exchanged between knowledgeable and willing parties in an orderly arm’s length transaction motivated by normal business considerations. Fair value measurements are categorized into levels within a fair value hierarchy based on the nature of the valuation inputs (Level 1, 2 or 3) as outlined below. Fair value is best evidenced by an independent quoted market price for the same instrument in an active market (Level 1).
If a market price in an active market is not available, the fair value is estimated on the basis of valuation models. Observable market inputs are utilized for valuation purposes to the extent possible and appropriate.
Valuation models may utilize predominantly observable market inputs (Level 2), including: interest rates, foreign currency rates, equity and equivalent synthetic instrument prices, index levels, credit spreads, counterparty credit quality, corresponding market volatility levels, and other market-based pricing factors, as well as any appropriate, highly correlated proxy market valuation data. Valuation models may also utilize predominantly non-observable market inputs (Level 3).
If the fair value of a financial instrument is not determinable based upon quoted market prices in an active market, and a suitable market proxy is not available, the transaction price would be considered to be the best indicator of market value on the transaction date. When the fair value of a financial instrument is determined using a valuation technique that incorporates significant non-observable market inputs, no inception profit or loss (difference between the determined fair value and the transaction price) is recognized at the time the financial instrument is first recorded. Any gains or losses at inception would be recognized only in future periods over the term of the instruments, or when market quotes or data become observable.
In inactive markets, quotes obtained from brokers are indicative quotes, meaning that they are not binding, and are mainly derived from the brokers’ internal valuation models. Due to the inherent limitations of the indicative broker quotes in estimating fair value, we also consider the values provided by our internal models, where appropriate, utilizing observable market inputs to the extent possible.
To ensure that valuations are appropriate, a number of policies and controls are put in place. Independent validation of fair value is performed at least on a monthly basis. Valuations are verified to external sources such as exchange quotes, broker quotes or other management-approved independent pricing sources. Key model inputs, such as yield curves and volatilities, are independently verified. Valuation models used, including analytics for the construction of yield curves and volatility surfaces, are vetted and approved, consistent with our model risk policy.
The table below presents amounts in each category of financial instruments, which are fair valued using valuation techniques based on non-observable market inputs (Level 3), for the structured credit run-off business and consolidated CIBC.
| | | | | | | | | | | | | | | | | | | | | | | | | |
| $ millions, as at October 31 | | 2010 | | | 2009 | |
| | | Structured | | | | | | | | | | | Structured | | | | | | | |
| | | credit | | | | | | | | | | | credit | | | | | | | |
| | | run-off | | | Total | | | Total | | | run-off | | | Total | | | Total | |
| | | business | | | CIBC | | | CIBC(1) | | | business | | | CIBC | | | CIBC(1) | |
| |
Assets | | | | | | | | | | | | | | | | | | | | | | | | |
| Trading securities | | $ | 1,647 | | | $ | 1,647 | | | | 5.8 | % | | $ | 1,221 | | | $ | 1,360 | | | | 9.0 | % |
| AFS securities | | | 20 | | | | 2,849 | | | | 10.7 | | | | 20 | | | | 1,297 | | | | 3.2 | |
| FVO securities and loans | | | 9 | | | | 20 | | | | 0.1 | | | | 203 | | | | 210 | | | | 0.9 | |
| Derivative instruments | | | 1,340 | | | | 1,461 | | | | 5.9 | | | | 2,068 | | | | 2,453 | | | | 9.9 | |
| |
Liabilities | | | | | | | | | | | | | | | | | | | | | | | | |
Deposits(2) | | $ | 1,063 | | | $ | 1,428 | | | | 37.3 | % | | $ | 689 | | | $ | 689 | | | | 15.4 | % |
| Derivative instruments | | | 2,052 | | | | 3,076 | | | | 11.6 | | | | 4,317 | | | | 5,131 | | | | 18.9 | |
| |
| | |
| (1) | | Represents percentage of Level 3 assets and liabilities in each reported category on the consolidated balance sheet. |
| |
| (2) | | Includes FVO deposits and bifurcated embedded derivatives. |
86
Management’s Discussion and Analysis
Sensitivity of Level 3 financial assets and liabilities
Much of our structured credit run-off business requires the application of valuation techniques using non-observable market inputs. In an inactive market, indicative broker quotes, proxy valuation from comparable financial instruments, and other internal models using our own assumptions of how market participants would price a market transaction on the measurement date (all of which we consider to be non-observable market inputs), are predominantly used for the valuation of these positions. We also consider whether a CVA is required to recognize the risk that any given counterparty to which we are exposed, may not ultimately be able to fulfill its obligations.
For credit derivatives purchased from financial guarantors, our CVA is generally driven off market-observed credit spreads, where available. For financial guarantors that do not have observable credit spreads or where observable credit spreads are available but do not reflect an orderly market (i.e., not representative of fair value), a proxy market spread is used. The proxy market credit spread is based on our internal credit rating for the particular financial guarantor. Credit spreads contain information on market (or proxy market) expectations of PD as well as LGD. The credit spreads are applied in relation to the weighted-average life of our exposure to the counterparties. For financial guarantor counterparties where a proxy market credit spread is used, we also make an adjustment to reflect additional financial guarantor risk over an equivalently rated non-financial guarantor counterparty. The amount of the adjustment is dependent on all available internal and external market information for financial guarantors. The final CVA takes into account the expected correlation between the future performance of the underlying reference assets and that of the counterparties, except for high quality reference assets where we expect no future credit degradation.
Where appropriate, on certain financial guarantors, we determined the CVA based on estimated recoverable amounts.
Interest-only strips from the sale of securitized assets are valued using prepayment rates, which we consider to be a non-observable market input.
Swap arrangements related to the sale of securitized assets are valued using liquidity rates, which we consider to be a non-observable market input.
ABS are sensitive to credit spreads, which we consider to be a non-observable market input.
FVO deposits that are not managed as part of our structured credit run-off business are sensitive to non-observable credit spreads, which are derived using extrapolation and correlation assumptions.
Certain bifurcated embedded derivatives, due to the complexity and unique structure of the instruments, require significant assumptions and judgment to be applied to both the inputs and valuation techniques, which we consider to be non-observable.
The effect of changing one or more of the assumptions to fair value these instruments to reasonably possible alternatives would impact net income or OCI as described below.
Our unhedged structured credit exposures (USRMM and non-USRMM) are sensitive to changes in MTM, generally as derived from indicative broker quotes and internal models as described above.
A 10% adverse change in MTM of the underlyings would result in losses of approximately $54 million in our unhedged USRMM portfolio and $108 million in our non-USRMM portfolio, excluding unhedged non-USRMM positions classified as loans which are carried at amortized cost, and before the impact of the Cerberus transaction. The fair value of the Cerberus protection against USRMM positions is expected to reasonably offset any changes in the fair value of USRMM positions.
For our hedged positions, there are two categories of sensitivities, the first relates to our hedged loan portfolio and the second relates to our hedged fair valued exposures. Since on-balance sheet hedged loans are carried at amortized cost whereas the related credit derivatives are fair valued, a 10% increase in the MTM of credit derivatives in our hedged structured credit positions would result in a net gain of approximately $35 million, assuming current CVA ratios remain unchanged. A 10% reduction in the MTM of our on-balance sheet fair valued exposures and a 10% increase in the MTM of all credit derivatives in our hedged structured credit positions would result in a net loss of approximately $8 million, assuming current CVA ratios remain unchanged.
The impact of a 10% increase in the MTM of unmatched credit derivatives, where we have purchased protection but do not have exposure to the underlying, would result in a net gain of approximately $1 million, assuming current CVA ratios remain unchanged.
The impact of a 10% reduction in receivables, net of CVA from financial guarantors, would result in a net loss of approximately $75 million.
A 10% increase in prepayment rates pertaining to our retained interests related to the interest-only strip, resulting from the sale of securitized assets, would result in a net loss of approximately $24 million.
A 20 basis point decrease in liquidity rates used to fair value our derivatives related to the sale of securitized assets would result in a loss of approximately $94 million.
A 10% reduction in the MTM of our on-balance sheet ABS that are valued using non-observable credit and liquidity spreads would result in a decrease in OCI of approximately $177 million.
A 10% reduction in the MTM of certain FVO deposits which are not managed as part of our structured credit run-off business and are valued using non-observable inputs, including correlation and extrapolated credit spreads, would result in a gain of approximately $13 million.
A 10% reduction in the MTM of certain bifurcated embedded derivatives, valued using internally vetted valuation techniques, would result in a gain of approximately $24 million.
The net loss recognized in the consolidated statement of operations, on the financial instruments, for which fair value was estimated using valuation techniques requiring non-observable market parameters, was $732 million (2009: net loss of $419 million).
87
Management’s Discussion and Analysis
We apply judgment in establishing valuation adjustments that take into account various factors that may have an impact on the valuation. Such factors include, but are not limited to, the bid-offer spread, illiquidity due to lack of market depth, parameter uncertainty and other market risk, model risk, credit risk, and future administration costs. During 2010, we reassessed our estimate of valuation adjustments for administration (servicing) costs relating to our derivatives portfolio. These valuation adjustments are based on our estimates of what a market participant would require from a fair value perspective to compensate for future servicing costs on our portfolio. This reassessment led to a release of $25 million of valuation adjustments.
The following table summarizes our valuation adjustments:
| | | | | | | | | |
| $ millions, as at October 31 | | 2010 | | | 2009 | |
| |
Trading securities | | | | | | | | |
| Market risk | | $ | 2 | | | $ | 7 | |
Derivatives | | | | | | | | |
| Market risk | | | 64 | | | | 81 | |
| Credit risk | | | 325 | | | | 2,241 | |
| Administrative costs | | | 6 | | | | 33 | |
| Other | | | — | | | | 2 | |
| |
| | | $ | 397 | | | $ | 2,364 | |
| |
Note 2 to the consolidated financial statements presents the valuation methods used to determine fair value showing separately those that are carried at fair value on the consolidated balance sheet and those that are not.
Risk factors related to fair value adjustments
We believe that we have made appropriate fair value adjustments and have taken appropriate write-downs to date. The establishment of fair value adjustments and the determination of the amount of write-downs involve estimates that are based on accounting processes and judgments by management. We evaluate the adequacy of the fair value adjustments and the amount of write-downs on an ongoing basis. The levels of fair value adjustments and the amount of the write-downs could be changed as events warrant and may not reflect ultimate realizable amounts.
Impairment of AFS securities
AFS securities include debt and equity securities and retained interests in securitized assets.
AFS securities, other than equities that do not have a quoted market value in an active market, are stated at fair value, whereby the difference between the fair value and the amortized cost is included in AOCI. Equities that do not have a quoted market value in an active market are carried at cost. AFS securities are subject to impairment reviews to assess whether or not there is an OTTI. The assessment of OTTI depends on whether the instrument is debt or equity in nature.
AFS debt securities are identified as impaired when there is objective observable evidence concerning the inability to collect the contractual principal or interest. Factors that are reviewed for impairment assessment include, but are not limited to, operating performance and future expectations, liquidity and capital adequacy, external credit ratings, underlying asset quality deterioration, industry valuation levels for comparable entities, and any changes in market and economic outlook.
For AFS equity instruments, objective evidence of impairment exists if there has been a significant or prolonged decline in the fair value of the investment below its cost. In making the OTTI assessment we also consider significant adverse changes in the technological, market, economic, or legal environments in which the issuer operates, or if the issuer is experiencing significant financial difficulty, as well as our intent to hold the investment for a period of time sufficient to allow for any anticipated recovery.
Realized gains and losses on disposal and write-downs to reflect OTTI in the value of AFS are recorded in the consolidated statement of operations. Previously recognized impairment losses for debt securities (but not equity securities) are reversed if subsequent increase in fair value can be objectively identified and is related to an event occurring after the impairment loss was recognized.
Allowance for credit losses
We establish and maintain an allowance for credit losses that is considered the best estimate of probable credit-related losses existing in our portfolio of on- and off-balance sheet financial instruments, giving due regard to current conditions. The allowance for credit losses consists of specific and general components.
Specific allowance
Consumer loans
A specific allowance is established for residential mortgages, personal loans, and certain small business loan portfolios, which consist of large numbers of homogeneous balances of relatively small amounts. We take a portfolio approach and establish the specific allowance utilizing a formula basis, since it is not practical to review each individual loan. We evaluate these portfolios for specific allowances by reference to historical ratios of write-offs to balances in arrears and to balances outstanding. Further analysis and evaluation of the allowance is performed to account for the aging of the portfolios and the impact of economic trends and conditions.
A specific allowance is not established for credit card loans and they are not classified as impaired. Instead, they are fully written off when payments are contractually 180 days in arrears, or upon customer bankruptcy. Commencing the fourth quarter of 2009, interest on credit card loans is accrued only to the extent that there is an expectation of receipt. Prior to that, interest was accrued until the loans were written off. See Note 5 to the consolidated financial statements for additional details.
Business and government loans
Business and government loan portfolios are assessed on an individual loan basis. Specific allowances are established when impaired loans are identified. A loan is classified as impaired when we are of the opinion that there is no longer a reasonable assurance of the full and timely collection of principal and interest. The specific allowance is the amount required to reduce the carrying value of an impaired loan to its estimated realizable amount. This is determined by discounting the expected future cash flows at the effective interest rate inherent in the loan before impairment.
General allowance
The general allowance provides for credit losses that are present in the credit portfolios, but which have not yet been specifically identified or provided for through specific allowances. The general allowance applies to on- and off-balance sheet credit exposures that are not carried at fair value. The methodology for determining the appropriate level of the general allowance incorporates a
88
Management’s Discussion and Analysis
number of factors, including the size of the portfolios, expected loss rates, and relative risk profiles. We also consider estimates of the time periods over which losses that are present would be specifically identified and a specific provision taken, our view of current economic and portfolio trends, and evidence of credit quality improvements or deterioration. On a regular basis, the parameters that affect the general allowance calculation are updated, based on our experience and the economic environment.
Expected loss rates for business loan portfolios are based on the risk rating of each credit facility and on the PD factors associated with each risk rating, as well as estimates of LGD. The PD factors reflect our historical experience over an economic cycle, and is supplemented by data derived from defaults in the public debt markets. LGD estimates are based on our historical experience. For consumer loan portfolios, expected losses are based on our historical loss rates and aggregate balances. As at October 31, 2010, our model indicated a range of outcomes for the general allowance between $621 million and $1,699 million. The general allowance of $1,153 million (2009: $1,307 million), which represents our best estimate of losses inherent but not specifically provided for in our loan portfolios, was selected from within the range based on a qualitative analysis of the economic environment and credit trends, as well as the risk profile of the loan portfolios. A uniform 10% increase in the PDs or loss severity across all portfolios would cause the general allowance to increase by approximately $115 million.
Securitizations and VIEs
Securitization of our own assets
We have determined that substantially all of our securitizations are accounted for as sales because we surrender control of the transferred assets and receive consideration other than beneficial interests in the transferred assets. We have also determined that the entities to which we have transferred the assets should not be consolidated because they are either QSPEs or we are not the primary beneficiary of the entities.
Gains or losses on transfers accounted for as sales depend, in part, upon the allocation of previous carrying amounts to assets sold and retained interests. These carrying amounts are allocated in proportion to the relative fair value of the assets sold and the retained interest. As market prices are generally not available for retained interests, we estimate fair value based on the present value of expected future cash flows. This requires us to estimate expected future cash flows, which incorporate expected credit losses, scheduled payments and unscheduled prepayment rates, discount rates, and other factors that influence the value of retained interests. Actual cash flows may differ significantly from our estimations. These estimates directly affect our calculation of gain on sale from securitizations and the rate at which retained interests are taken into income.
For additional information on our securitizations, including key economic assumptions used in measuring the fair value of retained interests and the sensitivity of the changes to those assumptions, see the “Off-balance sheet arrangements” section, Note 6 to the consolidated financial statements, and the “Valuation of financial instruments” section above.
Securitization of third-party assets
We also sponsor several VIEs that purchase pools of third-party financial assets. Our derivative and administrative transactions with these entities are generally not considered variable interests. We monitor the extent to which we support these VIEs through direct investment in the debt issued by the VIEs and through the provision of liquidity protection to the other debt holders, to assess whether we are the primary beneficiary and consolidator of these entities.
AcG-15, “Consolidation of Variable Interest Entities” provides guidance on applying consolidation principles to certain entities that are subject to control on a basis other than ownership of voting interests. To determine which VIEs require consolidation under AcG-15, we exercise judgment by identifying our variable interests and comparing them with other variable interests held by unrelated parties to determine if we are exposed to a majority of each of these entities’ expected losses or expected residual returns. We have consolidated certain other VIEs as we determined that we were exposed to a majority of the expected losses or residual returns.
Where we consider that CIBC is the primary beneficiary of any VIEs, AcG-15 requires that we reconsider this assessment in the following circumstances: (i) when there is a significant change to the design of the VIE or the ownership of variable interests that significantly changes the manner in which expected losses and expected residual returns are allocated; (ii) when we sell or dispose of a part or all of our variable interest to unrelated parties; or (iii) when the VIE issues new variable interest to unrelated parties. Where CIBC is not the primary beneficiary, AcG-15 requires that we reconsider whether we are the primary beneficiary when we acquire additional variable interests.
Specifically, in relation to ABCP conduits (the conduits), we reconsider our primary beneficiary assessment whenever our level of interest in the ABCP issued by the conduits changes significantly, or in the less frequent event that the liquidity protection we provide to the conduits is drawn or amended. To the extent that our ABCP holdings in a particular conduit exceeds 45%, it is likely that we will consider ourselves to be the primary beneficiary, as a result of the relatively small amount of variability stemming from the other variable interests in the conduit. A significant increase in our holdings of ABCP issued by the conduits would become more likely in a scenario in which the market for bank-sponsored ABCP suffered a significant deterioration such that the conduits were unable to roll their ABCP.
Securitizations and VIEs affect all our reporting segments.
Asset impairment
Goodwill, other intangible assets and long-lived assets
As at October 31, 2010, we had goodwill of $1.9 billion (2009: $2.0 billion) and other intangible assets with an indefinite life amounting to $136 million (2009: $137 million). Under Canadian GAAP, goodwill is not amortized, but is instead subject to, at least annually, an assessment for impairment by applying a two-step fair value-based test. In the first test, the fair value of the reporting unit is compared to its book value including goodwill. If the book value of the reporting unit exceeds the fair value, an impairment loss is then recognized pursuant to the second test to the extent that, at the reporting unit level, the carrying amount of goodwill exceeds the implied fair value of goodwill. Where appropriate, the carrying values of our reporting units are based on economic capital models and are designed to approximate the net book value a reporting unit would have if it was a stand-alone entity.
Acquired intangible assets are separately recognized if the benefits of the intangible assets are obtained through contractual or other legal rights, or if the intangible assets can be sold, transferred,
89
Management’s Discussion and Analysis
licensed, rented, or exchanged. Determining the useful lives of intangible assets requires judgment and fact-based analysis. Intangibles with an indefinite life are not amortized but are assessed for impairment by comparing the fair value to the carrying value.
Long-lived assets and other identifiable intangibles with a definite life are amortized over their estimated useful lives. These assets are tested for impairment whenever events or changes in circumstances indicate that the carrying amount of the asset may not be recoverable. In performing the review for recoverability, we estimate the future cash flows expected to result from the use of the asset and its eventual disposition. If the sum of the expected future undiscounted cash flows is less than the carrying amount of the asset, an impairment loss is recognized to the extent that fair value is less than the carrying value.
We use judgment to estimate the fair value of the reporting units and other intangible assets with an indefinite life. The fair value of the reporting units and other intangible assets with an indefinite life are derived from internally developed valuation models, using market or discounted cash flow approaches. Under a market approach, the models consider various factors, including normalized earnings, projected forward earnings, and price earnings multiples. Under a discounted cash flow approach, the models consider various factors, including projected cash flows, terminal growth rates and discount rates.
Our goodwill impairment tests conducted using these models during both the current and prior years indicate that the fair value of all of the reporting units subject to testing exceeded the carrying value. The valuations determined by these models are sensitive to the underlying business conditions in the markets in which the reporting units operate. The largest components of our goodwill relate to our Wealth Management reporting unit in Canada and our FirstCaribbean reporting unit in the Caribbean. Changes in estimated fair values could result in the future depending on various factors including changes in expected economic conditions in these markets.
Our indefinite life intangible asset impairment tests during both the current and prior years indicate that the fair value of the indefinite life intangible assets subject to testing exceeded their carrying values.
These assets are held in all our reporting segments. For additional details, see Note 8 to the consolidated financial statements.
Income taxes
We use judgment in the estimation of income taxes and future income tax assets and liabilities. As part of the process of preparing our consolidated financial statements, we are required to estimate income taxes in each of the jurisdictions where we operate.
This process involves estimating actual current tax exposure, together with assessing temporary differences that result from the different treatments of items for tax and accounting purposes, and any tax loss carryforwards.
We are also required to establish a future income tax asset in respect of expenses recorded currently for which a tax deduction will be available in a future period, such as the general allowance for credit losses and loss carryforwards.
As at October 31, 2010, we had available future income tax assets in excess of future income tax liabilities of $833 million (2009: $1,730 million), before a valuation allowance of $66 million (2009: $95 million). We are required to assess whether it is more likely than not that our future income tax assets will be realized prior to their expiration and, based on all the available evidence, determine if a valuation allowance is required on all or a portion of our future income tax assets. The factors used to assess the likelihood of realization are our past experience of income and capital gains, forecast of future net income before taxes, available tax planning strategies that could be implemented to realize the future income tax assets, and the remaining expiration period of tax loss carryforwards. Although realization is not assured, we believe, based on all the available evidence, it is more likely than not that the remaining future income tax assets, net of the valuation allowance, will be realized prior to their expiration.
Income tax accounting impacts all our reporting segments. For further details of our income taxes, see Note 23 to the consolidated financial statements.
Contingent liabilities
In the ordinary course of its business, CIBC is a party to a number of legal proceedings, including regulatory investigations. In certain of these matters, claims for substantial monetary damages are asserted against CIBC and its subsidiaries. In accordance with Canadian GAAP, amounts are accrued for the financial resolution of claims if, in the opinion of management, it is both likely that a future event will confirm that a liability had been incurred at the date of the financial statements and the amount of the loss can be reasonably estimated. In some cases, however, it is either not possible to determine whether such a liability has been incurred or to reasonably estimate the amount of loss until the case is closer to resolution, in which case no accrual can be made until that time. If the reasonable estimate of loss involves a range within which a particular amount appears to be a better estimate, that amount would be accrued. If no such better estimate within a range is indicated, the minimum amount in the range is required to be accrued. We regularly assess the adequacy of CIBC’s contingent liability accrual and make the necessary adjustments to incorporate new information as it becomes available. Adjustments to the accrual in any quarter may be material in situations where significant new information becomes available. While there is inherent difficulty in predicting the outcome of such matters, based on current knowledge and consultation with legal counsel, we do not expect that the outcome of any of these matters, individually or in aggregate, would have a material adverse effect on our consolidated financial position. However, the outcome of any such matters, individually or in aggregate, may be material to our operating results for a particular year.
Contingent liabilities impact all our reporting segments. For further details of our contingent liabilities, see Note 25 to the consolidated financial statements.
90
Management’s Discussion and Analysis
Employee future benefit assumptions
We are the sponsor of defined benefit pension and other post-employment (including post-retirement) benefit plans for eligible employees. The pension and other post-employment benefit expense and obligations, which impact all of our reporting segments, are dependent upon assumptions used in calculating such amounts. These assumptions include discount rates, projected salary increases, expected returns on assets, health care cost trend rates, turnover of employees, retirement age, and mortality rates. These assumptions are reviewed annually in accordance with accepted actuarial practice and approved by management.
The discount rate assumption used in determining pension and other post-employment benefit obligations and net benefit expense reflects the market yields, as of the measurement date, on high-quality debt instruments with cash flows that match expected benefit payments. The expected rate of return on plan assets assumption is based on expected returns for the various asset classes, weighted by portfolio allocation. Anticipated future long-term performance of individual asset categories is considered, reflecting expected future inflation and expected real yields on fixed-income securities and equities. Other assumptions are based on actual plan experience and our best estimates.
Actual results that differ from the assumptions are accumulated and amortized over future periods and, therefore, generally affect recognized expense and the recorded obligation in future periods. As at October 31, 2010, the net amount of unamortized actuarial losses was $1,423 million (2009: $1,171 million) in respect of pension plans and $151 million (2009: $100 million) in respect of other post-employment benefit plans.
Our benefit plans are funded to or above the amounts required by relevant legislation or plan term. During the year, we contributed $369 million (2009: $233 million) to the defined benefit pension plans, which included $175 million (2009: $84 million) above the minimum required. Our 2010 funding contributions to our principal Canadian pension plan was the maximum amount allowed by the Income Tax Act (Canada).
Our principal post-employment benefit plans are unfunded. We fund benefit payments for these plans as incurred. During the year, these benefit payments totalled $33 million (2009: $32 million).
We continue to administer a funded trust in respect of long-term disability benefits. This plan was closed to new claims effective June 1, 2004. During the year, we contributed $15 million (2009: $5 million) to the trust.
For further details of our annual pension and other post-employment expense and liability, see Note 22 to the consolidated financial statements.
For our Canadian plans, which represent more than 90% of our pension and other post-employment benefit plans, management has approved changes to the assumptions to be used for the 2011 expense calculation. Management has approved a weighted-average discount rate of approximately 5.5% for pension and other post-employment benefit plans, which is a decrease of 90 basis points over the similar rate for 2010. The approved weighted-average expected long-term rate of return on plan assets is 6.3% for the funded defined benefit plans, which are primarily pension plans. This is unchanged from 2010. The aggregate impact of these changes in assumptions together with the impact of changes in market value of the plan assets in the year is expected to be an increase of $82 million in expense recognition for 2011.
Actual experience different from that anticipated or future changes in assumptions may affect our pension and other post-employment benefit obligations, expense and funding contributions. The following table outlines the potential impact of changes in certain key assumptions used in measuring the accrued benefit obligations and related expenses:
| | | | | | | | | | | | | | | | | |
| $ millions, as at October 31, 2010 | | Pension benefit plans | | | Other benefit plans | |
| | | Obligation | | | Expense | | | Obligation | | | Expense | |
| |
| Impact of a change of 100 basis points in key assumptions: | | | | | | | | | | | | | | | | |
| Discount rate | | | | | | | | | | | | | | | | |
| Decrease in assumption | | $ | 617 | | | $ | 62 | | | $ | 94 | | | $ | 5 | |
| Increase in assumption | | | (520 | ) | | | (69 | ) | | | (77 | ) | | | (2 | ) |
| Expected long-term rate of return on plan assets | | | | | | | | | | | | | | | | |
| Decrease in assumption | | | n/a | | | | 37 | | | | n/a | | | | — | |
| Increase in assumption | | | n/a | | | | (37 | ) | | | n/a | | | | — | |
| Rate of compensation increase | | | | | | | | | | | | | | | | |
| Decrease in assumption | | | (110 | ) | | | (27 | ) | | | (2 | ) | | | — | |
| Increase in assumption | | | 119 | | | | 29 | | | | 2 | | | | — | |
| |
n/a Not applicable
The sensitivity analysis contained in this table should be used with caution, as the changes are hypothetical and the impact of changes in each key assumption may not be linear.
Financial Instruments
As a financial institution, our assets and liabilities primarily comprise financial instruments, which include deposits, securities, loans, derivatives, acceptances, repurchase agreements, subordinated debt, and preferred shares.
We use these financial instruments for both trading and non-trading activities. Trading activities include the purchase and sale of securities, transacting in foreign exchange and derivative instruments in the course of facilitating client trades, and taking proprietary trading positions with the objective of income generation. Non-trading activities generally include the business of lending, investing, funding, and ALM.
The use of financial instruments may either introduce or mitigate exposures to market, credit and/or liquidity risks. See the “Management of risk” section for details on how these risks are managed.
91
Management’s Discussion and Analysis
Financial instruments are accounted for according to their classification. For details on the accounting for these instruments, see Note 1 to the consolidated financial statements.
For significant assumptions made in determining the valuation of financial and other instruments, see the “Valuation of financial instruments” section above.
Accounting Developments
Changes in accounting policies
2010
There were no changes to significant accounting policies during 2010.
2009
Financial instruments — recognition and measurement
Effective November 1, 2008, we adopted the revised CICA handbook section 3855 “Financial Instruments — Recognition and Measurement”.
The revised standard defines loans and receivables as non-derivative financial assets with fixed or determinable payments that are not quoted in an active market. As a result of this change in definition, the following transitional provisions were applied effective November 1, 2008:
| • | | HTM debt instruments that met the revised definition of loans and receivables were required to be reclassified from HTM to loans and receivables; |
| |
| • | | Loans and receivables that an entity intended to sell immediately or in the near term were required to be classified as trading financial instruments; and |
| |
| • | | AFS debt instruments were eligible for reclassification to loans and receivables if they met the revised definition of loans and receivables. AFS debt instruments were eligible for reclassification to HTM if they had fixed and determinable payments and were quoted in an active market and the entity had the positive intention and ability to hold to maturity. The reclassification from AFS to loans and receivables or to HTM was optional and could be made on an instrument-by-instrument basis. We did not elect to reclassify any AFS securities. |
Following adoption of the revised standard:
| • | | Debt securities that meet the definition of loans and receivables at initial recognition may be classified as loans and receivables or designated as AFS or held for trading, but are precluded from being classified as HTM; |
| |
| • | | Impairment charges through income for HTM financial instruments are to be recognized for credit losses only, rather than on the basis of a full write down to fair value; and |
| |
| • | | Previously recognized OTTI losses on AFS debt securities are to be reversed through income if the increase in their fair value is related to improvement in credit that occurred subsequent to the recognition of the OTTI. |
The adoption of the revised standard resulted in financial instruments previously classified as HTM being reclassified to loans and receivables with no impact to retained earnings or AOCI.
We adopted the CICA handbook sections 3855 “Financial Instruments — Recognition and Measurement” and 3862 “Financial Instruments — Disclosures” as amended and reclassified certain trading securities to HTM and AFS, from August 1, 2008. See Note 4 to the consolidated financial statements for additional details.
Financial instruments — disclosures and presentation
For the year ended October 31, 2009, we adopted the amended CICA 3862 handbook section “Financial Instruments — Disclosures”, which expands financial instrument fair value measurement and liquidity risk management disclosures. The disclosures are provided in Notes 2, 14 and 29 to the consolidated financial statements.
Intangible assets
Effective November 1, 2008, we adopted the CICA handbook section 3064, “Goodwill and Intangible Assets”, which replaced CICA handbook sections 3062, “Goodwill and Other Intangible Assets”, and 3450, “Research and Development Costs”. The new section establishes standards for recognition, measurement, presentation and disclosure of goodwill and intangible assets.
The adoption of this guidance did not result in a change in the recognition of our goodwill and intangible assets. However, we retroactively reclassified intangible assets relating to application software with net book value of $385 million as at October 31, 2008, from Land, buildings and equipment to Software and other intangible assets on our consolidated balance sheet.
2008
Leveraged leases
Effective November 1, 2007, we adopted the amended CICA Emerging Issues Committee Abstract (EIC) 46, “Leveraged Leases”, which was based upon the Financial Accounting Standards Board Staff Position FAS 13-2, “Accounting for a Change or Projected Change in the Timing of Cash Flows Relating to Income Taxes Generated by a Leveraged Lease Transaction”. The EIC required that a change in the estimated timing of cash flows relating to income taxes results in a recalculation of the timing of income recognition from the leveraged lease.
The adoption of this guidance resulted in a $66 million charge to opening retained earnings as at November 1, 2007. An amount approximating this non-cash charge is being recognized into income over the remaining lease terms using the effective interest rate method.
Capital disclosures
Effective November 1, 2007, we adopted the CICA handbook section 1535, “Capital Disclosures”, which requires an entity to disclose its objective, policies and processes for managing capital. In addition, the section requires disclosure of summary quantitative information about capital components. See Note 17 to the consolidated financial statements for additional details.
Financial instruments
Effective November 1, 2007, we adopted the CICA handbook sections 3862 “Financial Instruments – Disclosures” and 3863 “Financial Instruments — Presentation”.
These sections replace CICA handbook section 3861 “Financial Instruments — Disclosure and Presentation” and enhance disclosure requirements on the nature and extent of risks arising from financial instruments and how the entity manages those risks. See Note 29 to the consolidated financial statements for additional details.
We adopted the amendments to the CICA handbook sections 3855 “Financial Instruments — Recognition and Measurement” and 3862 “Financial Instruments — Disclosures” and reclassified certain trading securities to HTM and AFS, from August 1, 2008. See Note 4 to the consolidated financial statements for additional details.
92
Management’s Discussion and Analysis
Future accounting policy changes
Business combinations, consolidated financial statements and non-controlling interests
In January 2009, the CICA issued three new handbook sections: 1582, “Business Combinations”, 1601, “Consolidated Financial Statements”, and 1602, “Non-controlling Interests”.
CICA handbook section 1582 provides guidance on the application of the purchase method of accounting for business combinations. In particular, this section addresses the determination of the carrying amount of the assets and liabilities of a subsidiary company, goodwill, and accounting for a non-controlling interest at the time of the business combination. Under this standard, most acquisition-related costs must now be accounted for as expenses in the periods they are incurred. This new section is applicable for acquisitions completed on or after November 1, 2011, although early adoption is permitted to facilitate the transition to IFRS in 2011.
CICA handbook section 1601 establishes standards for the preparation of consolidated financial statements after the acquisition date. CICA handbook section 1602 addresses the accounting and presentation of non-controlling interests in the consolidated financial statements subsequent to a business combination. CICA handbook sections 1601 and 1602 must be adopted concurrently with CICA handbook section 1582.
Transition to International Financial Reporting Standards (IFRS)
Canadian publicly accountable enterprises must transition to IFRS for fiscal years beginning on or after January 1, 2011. As a result, we will adopt IFRS commencing November 1, 2011 and will publish our first consolidated financial statements, prepared in accordance with IFRS, for the quarter ending January 31, 2012. Upon adoption, we will provide fiscal 2011 comparative financial information also prepared in accordance with IFRS, including an opening IFRS consolidated balance sheet as at November 1, 2010.
The transition to IFRS represents a significant initiative for CIBC and is supported by a formal governance structure with an enterprise view and a dedicated project team. Our IFRS transition program has been divided into three phases: (i) discovery; (ii) execution; and (iii) conversion. The discovery phase included an accounting diagnostic which identified the accounting standards that are relevant to CIBC, and the identification and planning for the execution phase. The execution phase which we are currently in, commenced with a detailed analysis of the IFRS standards and continues through to the preparation of the policies, processes, technologies, strategies, and reporting for the upcoming transition. The final conversion phase will report on the new IFRS standards in 2012 and reconcile Canadian GAAP to IFRS with fiscal 2011 comparative information under IFRS.
Our IFRS transition project continues to progress on track with our transition plan. We have appropriately engaged our external and internal auditors to review key milestones and activities as we progress through the transition.
Process, financial reporting controls and technology
Pursuant to our plans, an initial assessment was previously completed to identify the IFRS standards that represent key accounting differences from Canadian GAAP. More detailed assessment work was completed in the first two quarters of fiscal 2010, including execution work with respect to the underlying financial reporting and business processes and controls. During the last two quarters of fiscal 2010, we completed a significant amount of the development of the business processes and internal controls over financial reporting that will enable us to restate our comparative opening November 1, 2010 consolidated balance sheet and comparative fiscal 2011 consolidated financial statements to IFRS, while at the same time preparing normal course fiscal 2011 Canadian GAAP financial information. This included the development of a technology-based comparative year reporting tool to track IFRS financial information during our fiscal 2011 comparative year, which was tested in the last two quarters of fiscal 2010 and is now operational. Implementation of the developed business processes and internal controls over comparative year financial reporting is expected to commence in the first quarter of the fiscal 2011 comparative year.
We will continue to develop the business processes and controls related to transaction level accounting, including those related to the greater use of on-balance sheet accounting as a result of IFRS differences concerning the derecognition of financial assets. While we have identified additional resource and process requirements as part of our assessment and execution work, we have not identified any significant modifications for our supporting information technology systems, nor do we expect any significant changes to our business activities. Identified technology impacts include the realignment of system feeds to more efficiently report our securitized mortgages on the consolidated balance sheet.
During fiscal 2010, we refreshed our assessment for many of the incremental disclosures required under IFRS. We will complete our assessment work in the first half of fiscal 2011, including the disclosures and associated controls required in respect of the transition to IFRS in fiscal 2012.
Concurrent with preparing for the impact of IFRS on our financial reporting, we have also focused on preparing CIBC for impacts that IFRS will have on the financial statements of our clients and counterparties, including impacts to our loan management processes, controls and risk rating systems.
Communications and training
Information regarding the progress of the project continued to be communicated to internal stakeholders during fiscal 2010, including our Audit Committee, senior executives and the Program Steering Committee, and to external stakeholders including OSFI and our external auditor. Communications to external stakeholders will continue through the quarterly and annual reports. In addition, we are currently preparing for additional external communications with the investor community in fiscal 2011.
We believe we have the financial reporting expertise to support our transition to IFRS. We have accounting policy staff dedicated to assessing the impact of IFRS and consulting with external advisors as necessary. In 2009, we launched an enterprise-wide training program to raise the level of awareness of IFRS throughout CIBC, and to prepare staff to perform in an IFRS environment. We completed the delivery of our training program during fiscal 2010, which included separate learning paths for: (i) groups that need to understand and execute on the impact of IFRS on CIBC and its subsidiaries; and (ii) groups, such as Risk Management and the businesses, that need to understand the impact of transitioning away from Canadian GAAP on our Canadian clients and counterparties. While the training was completed during fiscal 2010, additional training will be provided in 2011 as required.
93
Management’s Discussion and Analysis
Financial impacts
The requirements concerning the transition to IFRS are set out in IFRS 1, “First-Time Adoption of International Financial Reporting Standards“, which generally requires that changes from Canadian GAAP be applied retroactively and reflected in our opening November 1, 2010 comparative IFRS consolidated balance sheet. However, there are a number of transitional elections, some of which entail an exemption from full restatement, available under the transitional rules that we continue to evaluate. The most significant election is in the area of accounting for post-employment benefits in which we have the choice to either restate our existing unamortized net actuarial losses to what they would have been had we always followed IFRS or to charge them to retained earnings at transition. Other significant elections include: (i) whether we should restate prior business combinations to reflect IFRS differences concerning business acquisition accounting or to only apply IFRS differences to business acquisitions that may arise subsequent to transition; (ii) whether to charge our cumulative foreign currency translation account to retained earnings at transition; and (iii) whether to reclassify certain of our financial instruments in or out of the “fair value option” at transition. During the third quarter of 2010, the International Accounting Standards Board (IASB) issued a pronouncement proposing an additional transitional election with respect to changing the grandfathering date for determining which securitizations are derecognized from the consolidated balance sheet under IFRS from January 1, 2004 to any date up to the transition date of November 1, 2010. The proposal is expected to be ratified in December 2010.
IFRS is expected to result in accounting policy differences in many areas. Based on existing IFRS and the assessment of our transitional elections to date, the areas that have the potential for the most significant impact to our financial and capital reporting include derecognition of financial instruments and the accounting for post-employment benefits. Other areas include, but are not limited to consolidations, accounting for share-based compensation, measurement and impairment of equity instruments, accounting for foreign exchange, accounting for joint ventures, and measurement of loss contingencies.
OSFI has issued guidance allowing banks to phase-in over five quarters most of the negative impacts that IFRS will have on their Tier 1 capital. In addition, OSFI has indicated that mortgages that come back on the consolidated balance sheet with respect to securitizations completed prior to March 31, 2010 under the CMB program will not negatively impact the capital leverage ratio.
Derecognition of financial instruments
There are differences between Canadian GAAP and existing IFRS concerning the determination of whether financial instruments should be derecognized from the consolidated balance sheet. Under IFRS, the determination of whether a financial asset should be derecognized is based to a greater extent on the transfer of risks and rewards rather than on whether the assets have been legally isolated from the transferor.
As a result, securitization transactions are much more likely to be accounted for as secured borrowings rather than as sales, which will result in an increase to total assets recorded on our consolidated balance sheet, and a charge to retained earnings at transition in respect of gains previously recorded from off-balance sheet accounting, particularly in respect of residential mortgages securitized through the creation of MBS under the CMB program and Government of Canada National Housing Act MBS Auction process. The on-balance sheet treatment for securitized mortgages may also impact our hedging strategies.
The proposed change to IFRS 1 permitting transfers that occured before November 1, 2010 to be exempted from these requirements could reduce the initial impact of these accounting rules, although we may elect to still apply the rules retroactively, which would result in a gross-up to our opening IFRS balance sheet of approximately $29 billion in respect to the securitized residential mortgages.
Post-employment benefits
The IFRS 1 accounting election for post-employment benefits may also negatively impact our capital ratios through charging unamortized actuarial losses to retained earnings at transition, however this “fresh-start” election would also reduce post-transition compensation expense through the elimination of amortization expense that would otherwise occur. Based on our October 31, 2010 actuarial valuation, the net impact of the “fresh-start” election combined with a number of other less significant IFRS differences relating to post-employment benefits, would be a reduction of Tier 1 capital of approximately $1.1 billion after-tax.
Other elections related to the accounting for actuarial gains and losses that may arise after transition also have the potential to impact our capital and earnings in subsequent years. Regardless of the alternative we choose, we will record in expense the cost of benefits incurred during the year, plus the interest cost on the obligation net of the expected returns on plan assets. However, the IASB has issued an exposure draft proposing significant changes to the accounting for employee future benefits which are likely to become mandatory in a fiscal period sometime after our transition to IFRS.
Consolidation
The IFRS requirements for consolidation are based on a control model as set out in the criteria in IAS 27 – “Consolidated and Separate Financial Statements”, whereas under Canadian GAAP, the determination is either based on a control model or beneficial interest model depending on whether the entity is considered a VIE. Furthermore, IFRS does not embody the concept of a QSPE, which is exempted from consolidation under Canadian GAAP. As a result, certain entities are likely to be consolidated by CIBC under IFRS that are currently not consolidated under Canadian GAAP, which could impact CIBC in a similar manner to the derecognition rules noted above.
Share-based payments
Under IFRS, the cost of share-based payments is generally recognized over the vesting period of the award and may include the fiscal year preceding the grant date. The impact of forfeitures is estimated over the life of the award. Under Canadian GAAP, we recognize the cost
94
Management’s Discussion and Analysis
of the awards in the year preceding the grant date if the award is for past service, and over the vesting period after the grant date if the award is for retention; we recognize forfeitures on an as incurred basis.
Business combinations
Under IFRS, there is a greater use of fair value measurement in the accounting for business combinations, including the measurement of non-controlling interests and contingent consideration and the use of the closing date, rather than the announcement date, to value share consideration. In addition, transaction costs and certain restructuring costs that were able to be capitalized in the purchase equation under Canadian GAAP must be expensed under IFRS. These differences will impact purchase price allocations and the amount of goodwill recorded on the consolidated balance sheet. However, IFRS 1 allows entities to only apply these changes to business acquisitions that occur after transition.
Cumulative foreign currency translation differences
IFRS 1 allows entities to elect to charge the cumulative translation account for all foreign operations to retained earnings at transition. Based on the balance in the foreign currency translation account as at October 31, 2010, this “fresh-start” election would result in a reclassification of $575 million from AOCI to retained earnings. This adjustment would not impact our Tier 1 capital.
Future changes
Proposed changes to the IFRS accounting standards, including the changes related to employee future benefits noted above and proposed changes to the standards addressing loan loss provisioning and the classification and measurement of financial instruments, may introduce additional significant accounting differences, although we expect that the changes arising from the proposed standards will not be effective for us until the years following our IFRS transition in fiscal 2012. During fiscal 2010, we continued to monitor these proposed changes to IFRS, as well as potential changes in the interpretation of existing IFRS on our assessment of the financial, capital, and business implications of the transition to IFRS.
The impact of IFRS to us at transition will ultimately depend on the IFRS standards and capital reporting rules in effect at the time, transition elections that have not yet been finalized, and the prevailing business and economic facts and circumstances. The evolving nature of IFRS will likely also result in additional accounting changes, some of which may be significant, in the years following our initial transition. We continue to monitor changes in the standards and to adjust our transition plans accordingly.
Related-party Transactions
We have various processes in place to ensure that the relevant related-party information is identified and reported to the Corporate Governance Committee (CGC) of the Board on a quarterly basis, as required by the Bank Act. The CGC has the responsibility for reviewing our policies and practices in identifying transactions with our related parties that may materially affect us, and reviewing the associated procedures for promoting compliance with the Bank Act.
For further details, see Note 27 to the consolidated financial statements.
Controls and Procedures
Disclosure controls and procedures
CIBC’s management, with the participation of the President and Chief Executive Officer and the Chief Financial Officer, has evaluated the effectiveness of CIBC’s disclosure controls and procedures (as defined in the rules of the SEC and the Canadian Securities Administrators) as at October 31, 2010, and has concluded that such disclosure controls and procedures were effective.
Management’s annual report on internal control over financial reporting
CIBC’s management is responsible for establishing and maintaining adequate internal control over financial reporting for CIBC.
Internal control over financial reporting is a process designed by, or under the supervision of, the President and Chief Executive Officer and the Chief Financial Officer and effected by the Board, management and other personnel to provide reasonable assurance regarding the reliability of financial reporting and the preparation of financial statements for external purposes in accordance with generally accepted accounting principles. CIBC’s internal control over financial reporting includes those policies and procedures that (i) pertain to the maintenance of records, that, in reasonable detail, accurately and fairly reflect the transactions and dispositions of the assets of CIBC; (ii) provide reasonable assurance that transactions are recorded as necessary to permit preparation of financial statements in accordance with generally accepted accounting principles, and that receipts and expenditures of CIBC are being made only in accordance with authorizations of CIBC’s management and directors; and (iii) provide reasonable assurance regarding prevention or timely detection of unauthorized acquisition, use or disposition of CIBC’s assets that could have a material effect on the financial statements.
All internal control systems, no matter how well designed, have inherent limitations. Therefore, even those systems determined to be effective can provide only reasonable assurance with respect to financial statement preparation and presentation.
CIBC’s management has used the COSO framework to evaluate the effectiveness of CIBC’s internal control over financial reporting.
As at October 31, 2010, management assessed the effectiveness of CIBC’s internal control over financial reporting and concluded that such internal control over financial reporting was effective and that there were no material weaknesses in CIBC’s internal control over financial reporting that have been identified by management.
Ernst & Young LLP, who has audited the consolidated financial statements of CIBC for the year ended October 31, 2010, has also issued a report on internal control over financial reporting under Auditing Standard No. 5 of the Public Company Accounting Oversight Board (United States). This report is located on page 107 of this Annual Report.
Changes in internal control over financial reporting
There have been no changes in CIBC’s internal control over financial reporting during the year ended October 31, 2010, that have materially affected, or are reasonably likely to materially affect, its internal control over financial reporting.
95
Management’s Discussion and Analysis
Supplementary Annual Financial Information
Average Balance Sheet, Net Interest Income and Margin
| | | | | | | | | | | | | | | | | | | | | | | | | | | | | | | | | | | | | | | |
| | | | | Average balance | | | Interest | | | Average rate | |
| $ millions, for the year ended October 31 | | 2010 | | | 2009 | | | 2008 | | | 2010 | | | 2009 | | | 2008 | | | 2010 | | | 2009 | | | 2008 | |
| |
| Domestic assets(1) | | | | | | | | | | | | | | | | | | | | | | | | | | | | | | | | | | | | |
| Cash and deposits with banks | | $ | 3,359 | | | $ | 2,370 | | | $ | 2,708 | | | $ | 16 | | | $ | 26 | | | $ | 174 | | | | 0.48 | % | | | 1.10 | % | | | 6.43 | % |
| Securities | | Trading | | | 14,895 | | | | 10,423 | | | | 26,664 | | | | 368 | | | | 269 | | | | 692 | | | | 2.47 | | | | 2.58 | | | | 2.60 | |
| | | AFS | | | 19,969 | | | | 21,661 | | | | 6,321 | | | | 598 | | | | 589 | | | | 269 | | | | 2.99 | | | | 2.72 | | | | 4.26 | |
| | | FVO | | | 19,713 | | | | 23,602 | | | | 16,780 | | | | 282 | | | | 435 | | | | 615 | | | | 1.43 | | | | 1.84 | | | | 3.67 | |
| Securities borrowed or purchased under resale agreements | | | 18,910 | | | | 19,575 | | | | 21,999 | | | | 90 | | | | 190 | | | | 727 | | | | 0.48 | | | | 0.97 | | | | 3.30 | |
| |
| Loans | | Residential mortgages | | | 89,714 | | | | 80,551 | | | | 88,667 | | | | 2,566 | | | | 2,284 | | | | 3,957 | | | | 2.86 | | | | 2.84 | | | | 4.46 | |
| | | Personal and credit card | | | 43,851 | | | | 41,823 | | | | 38,587 | | | | 2,786 | | | | 2,612 | | | | 2,871 | | | | 6.35 | | | | 6.25 | | | | 7.44 | |
| | | Business and government | | | 20,041 | | | | 21,413 | | | | 21,668 | | | | 927 | | | | 1,023 | | | | 1,308 | | | | 4.63 | | | | 4.78 | | | | 6.04 | |
| |
| Total loans | | | 153,606 | | | | 143,787 | | | | 148,922 | | | | 6,279 | | | | 5,919 | | | | 8,136 | | | | 4.09 | | | | 4.12 | | | | 5.46 | |
| |
| Other interest-bearing assets | | | 419 | | | | 429 | | | | 758 | | | | 55 | | | | 110 | | | | 111 | | | | 13.13 | | | | 25.64 | | | | 14.64 | |
| Derivative instruments | | | 9,459 | | | | 12,120 | | | | 9,141 | | | | — | | | | — | | | | — | | | | — | | | | — | | | | — | |
| Customers’ liability under acceptances | | | 7,774 | | | | 9,490 | | | | 8,607 | | | | — | | | | — | | | | — | | | | — | | | | — | | | | — | |
| Other non-interest-bearing assets | | | 13,761 | | | | 17,977 | | | | 14,645 | | | | — | | | | — | | | | — | | | | — | | | | — | | | | — | |
| |
| Total domestic assets | | | 261,865 | | | | 261,434 | | | | 256,545 | | | | 7,688 | | | | 7,538 | | | | 10,724 | | | | 2.94 | | | | 2.88 | | | | 4.18 | |
| |
| Foreign assets(1) | | | | | | | | | | | | | | | | | | | | | | | | | | | | | | | | | | | | |
| Cash and deposits with banks | | | 7,694 | | | | 5,973 | | | | 12,514 | | | | 36 | | | | 59 | | | | 464 | | | | 0.47 | | | | 0.99 | | | | 3.71 | |
| Securities | | Trading | | | 5,647 | | | | 6,481 | | | | 24,504 | | | | 89 | | | | 149 | | | | 825 | | | | 1.58 | | | | 2.30 | | | | 3.37 | |
| | | AFS | | | 14,649 | | | | 15,382 | | | | 3,972 | | | | 198 | | | | 225 | | | | 148 | | | | 1.35 | | | | 1.46 | | | | 3.73 | |
| | | FVO | | | 416 | | | | 634 | | | | 658 | | | | 27 | | | | 38 | | | | 40 | | | | 6.49 | | | | 5.99 | | | | 6.08 | |
| | | HTM | | | — | | | | — | | | | 1,719 | | | | — | | | | — | | | | 93 | | | | — | | | | — | | | | 5.41 | |
| Securities borrowed or purchased under resale agreements | | | 16,933 | | | | 14,995 | | | | 10,985 | | | | 103 | | | | 134 | | | | 808 | | | | 0.61 | | | | 0.89 | | | | 7.36 | |
| |
| Loans | | Residential mortgages | | | 2,210 | | | | 2,428 | | | | 2,076 | | | | 177 | | | | 140 | | | | 154 | | | | 8.01 | | | | 5.77 | | | | 7.42 | |
| | | Personal and credit card | | | 1,058 | | | | 1,260 | | | | 1,212 | | | | 79 | | | | 100 | | | | 98 | | | | 7.47 | | | | 7.94 | | | | 8.09 | |
| | | Business and government | | | 17,582 | | | | 18,584 | | | | 12,254 | | | | 685 | | | | 911 | | | | 802 | | | | 3.90 | | | | 4.90 | | | | 6.54 | |
| |
| Total loans | | | 20,850 | | | | 22,272 | | | | 15,542 | | | | 941 | | | | 1,151 | | | | 1,054 | | | | 4.51 | | | | 5.17 | | | | 6.78 | �� |
| |
| Other interest-bearing assets | | | 166 | | | | 140 | | | | 432 | | | | 13 | | | | 3 | | | | 7 | | | | 7.83 | | | | 2.14 | | | | 1.62 | |
| Derivative instruments | | | 14,487 | | | | 19,199 | | | | 13,595 | | | | — | | | | — | | | | — | | | | — | | | | — | | | | — | |
| Customers’ liability under acceptances | | | — | | | | 1 | | | | 2 | | | | — | | | | — | | | | — | | | | — | | | | — | | | | — | |
| Other non-interest-bearing assets | | | 3,236 | | | | 4,195 | | | | 4,397 | | | | — | | | | — | | | | — | | | | — | | | | — | | | | — | |
| |
| Total foreign assets | | | 84,078 | | | | 89,272 | | | | 88,320 | | | | 1,407 | | | | 1,759 | | | | 3,439 | | | | 1.67 | | | | 1.97 | | | | 3.89 | |
| |
| Total assets | | $ | 345,943 | | | $ | 350,706 | | | $ | 344,865 | | | $ | 9,095 | | | $ | 9,297 | | | $ | 14,163 | | | | 2.63 | % | | | 2.65 | % | | | 4.11 | % |
| |
| Domestic liabilities(1) | | | | | | | | | | | | | | | | | | | | | | | | | | | | | | | | | | | | |
| Deposits | | Personal | | $ | 104,862 | | | $ | 96,292 | | | $ | 89,378 | | | $ | 1,398 | | | $ | 1,739 | | | $ | 2,334 | | | | 1.33 | % | | | 1.81 | % | | | 2.61 | % |
| | | Business and government | | | 82,697 | | | | 76,029 | | | | 82,590 | | | | 571 | | | | 657 | | | | 2,571 | | | | 0.69 | | | | 0.86 | | | | 3.11 | |
| | | Bank | | | 1,156 | | | | 1,881 | | | | 1,652 | | | | 4 | | | | 7 | | | | 27 | | | | 0.35 | | | | 0.37 | | | | 1.63 | |
| |
| Total deposits | | | 188,715 | | | | 174,202 | | | | 173,620 | | | | 1,973 | | | | 2,403 | | | | 4,932 | | | | 1.05 | | | | 1.38 | | | | 2.84 | |
| Derivative instruments | | | 10,357 | | | | 13,751 | | | | 9,679 | | | | — | | | | — | | | | — | | | | — | | | | — | | | | — | |
| Acceptances | | | 7,774 | | | | 9,499 | | | | 8,609 | | | | — | | | | — | | | | — | | | | — | | | | — | | | | — | |
| Obligations related to securities sold short | | | 8,492 | | | | 6,054 | | | | 7,740 | | | | 209 | | | | 156 | | | | 252 | | | | 2.46 | | | | 2.58 | | | | 3.26 | |
| Obligations related to securities lent or sold under repurchase agreements | | | 25,885 | | | | 32,158 | | | | 18,459 | | | | 186 | | | | 252 | | | | 444 | | | | 0.72 | | | | 0.78 | | | | 2.41 | |
| Other liabilities | | | 10,183 | | | | 11,574 | | | | 10,121 | | | | (5 | ) | | | 18 | | | | 26 | | | | (0.05 | ) | | | 0.16 | | | | 0.26 | |
| Subordinated indebtedness | | | 4,767 | | | | 5,387 | | | | 5,042 | | | | 180 | | | | 183 | | | | 227 | | | | 3.78 | | | | 3.40 | | | | 4.50 | |
| Preferred share liabilities | | | 598 | | | | 600 | | | | 600 | | | | 35 | | | | 31 | | | | 31 | | | | 5.85 | | | | 5.17 | | | | 5.17 | |
| |
| Total domestic liabilities | | | 256,771 | | | | 253,225 | | | | 233,870 | | | | 2,578 | | | | 3,043 | | | | 5,912 | | | | 1.00 | | | | 1.20 | | | | 2.53 | |
| |
| Foreign liabilities(1) | | | | | | | | | | | | | | | | | | | | | | | | | | | | | | | | | | | | |
| Deposits | | Personal | | | 6,217 | | | | 6,766 | | | | 6,294 | | | | 85 | | | | 119 | | | | 183 | | | | 1.37 | | | | 1.76 | | | | 2.91 | |
| | | Business and government | | | 30,437 | | | | 32,176 | | | | 42,708 | | | | 111 | | | | 263 | | | | 1,241 | | | | 0.36 | | | | 0.82 | | | | 2.91 | |
| | | Bank | | | 5,678 | | | | 7,839 | | | | 14,344 | | | | 23 | | | | 94 | | | | 497 | | | | 0.41 | | | | 1.20 | | | | 3.46 | |
| |
| Total deposits | | | 42,332 | | | | 46,781 | | | | 63,346 | | | | 219 | | | | 476 | | | | 1,921 | | | | 0.52 | | | | 1.02 | | | | 3.03 | |
| Derivative instruments | | | 15,863 | | | | 21,783 | | | | 14,395 | | | | — | | | | — | | | | — | | | | — | | | | — | | | | — | |
| Acceptances | | | — | | | | 1 | | | | 2 | | | | — | | | | — | | | | — | | | | — | | | | — | | | | — | |
| Obligations related to securities sold short | | | 128 | | | | 407 | | | | 2,161 | | | | 2 | | | | 2 | | | | 36 | | | | 1.56 | | | | 0.49 | | | | 1.67 | |
| Obligations related to securities lent or sold under repurchase agreements | | | 13,494 | | | | 11,214 | | | | 12,115 | | | | 109 | | | | 269 | | | | 981 | | | | 0.81 | | | | 2.40 | | | | 8.10 | |
| Other liabilities | | | 1,637 | | | | 2,516 | | | | 4,323 | | | | (25 | ) | | | 88 | | | | 62 | | | | (1.53 | ) | | | 3.50 | | | | 1.43 | |
| Subordinated indebtedness | | | 622 | | | | 866 | | | | 856 | | | | 8 | | | | 25 | | | | 44 | | | | 1.29 | | | | 2.89 | | | | 5.14 | |
| Non-controlling interests | | | 168 | | | | 179 | | | | 162 | | | | — | | | | — | | | | — | | | | — | | | | — | | | | — | |
| |
| Total foreign liabilities | | | 74,244 | | | | 83,747 | | | | 97,360 | | | | 313 | | | | 860 | | | | 3,044 | | | | 0.42 | | | | 1.03 | | | | 3.13 | |
| |
| Total liabilities | | | 331,015 | | | | 336,972 | | | | 331,230 | | | | 2,891 | | | | 3,903 | | | | 8,956 | | | | 0.87 | | | | 1.16 | | | | 2.70 | |
| Shareholders’ equity | | | 14,928 | | | | 13,734 | | | | 13,635 | | | | — | | | | — | | | | — | | | | — | | | | — | | | | — | |
| |
| Total liabilities and shareholders’ equity | | $ | 345,943 | | | $ | 350,706 | | | $ | 344,865 | | | $ | 2,891 | | | $ | 3,903 | | | $ | 8,956 | | | | 0.84 | % | | | 1.11 | % | | | 2.60 | % |
| |
| Net interest income and margin | | | | | | | | | | | | | | $ | 6,204 | | | $ | 5,394 | | | $ | 5,207 | | | | 1.79 | % | | | 1.54 | % | | | 1.51 | % |
| |
| Additional disclosures: | | | | | | | | | | | | | | | | | | | | | | | | | | | | | | | | | | | | |
| Non-interest-bearing deposit liabilities | | | | | | | | | | | | | | | | | | | | | | | | | | | | | | | | | | | | |
| | | Domestic | | $ | 26,125 | | | $ | 22,977 | | | $ | 21,795 | | | | | | | | | | | | | | | | | | | | | | | | | |
| | | Foreign | | $ | 2,234 | | | $ | 3,405 | | | $ | 2,832 | | | | | | | | | | | | | | | | | | | | | | | | | |
| |
| (1) | | Classification as domestic or foreign is based on domicile of debtor or customer. |
96
Management’s Discussion and Analysis
Volume/Rate Analysis of Changes in Net Interest Income
| | | | | | | | | | | | | | | | | | | | | | | | | | | |
| $ millions | | 2010/2009 | | | 2009/2008 | |
| | | | | Increase (decrease) due to change in: | | | Increase (decrease) due to change in: | |
| | | | | Average | | | Average | | | | | | | Average | | | Average | | | | |
| | | | | balance | | | rate | | | Total | | | balance | | | rate | | | Total | |
| |
| Domestic assets(1) | | | | | | | | | | | | | | | | | | | | | | | | |
| Cash and deposits with banks | | $ | 11 | | | $ | (21 | ) | | $ | (10 | ) | | $ | (22 | ) | | $ | (126 | ) | | $ | (148 | ) |
| Securities | | Trading | | | 115 | | | | (16 | ) | | | 99 | | | | (421 | ) | | | (2 | ) | | | (423 | ) |
| | | AFS | | | (46 | ) | | | 55 | | | | 9 | | | | 653 | | | | (333 | ) | | | 320 | |
| | | FVO | | | (72 | ) | | | (81 | ) | | | (153 | ) | | | 250 | | | | (430 | ) | | | (180 | ) |
| Securities borrowed or purchased under resale agreements | | | (6 | ) | | | (94 | ) | | | (100 | ) | | | (80 | ) | | | (457 | ) | | | (537 | ) |
| |
| Loans | | Residential mortgages | | | 260 | | | | 22 | | | | 282 | | | | (362 | ) | | | (1,311 | ) | | | (1,673 | ) |
| | | Personal and credit card | | | 127 | | | | 47 | | | | 174 | | | | 241 | | | | (500 | ) | | | (259 | ) |
| | | Business and government | | | (66 | ) | | | (30 | ) | | | (96 | ) | | | (15 | ) | | | (270 | ) | | | (285 | ) |
| |
| Total loans | | | 321 | | | | 39 | | | | 360 | | | | (136 | ) | | | (2,081 | ) | | | (2,217 | ) |
| Other interest-bearing assets | | | (3 | ) | | | (52 | ) | | | (55 | ) | | | (48 | ) | | | 47 | | | | (1 | ) |
| |
| Change in domestic interest income | | | 320 | | | | (170 | ) | | | 150 | | | | 196 | | | | (3,382 | ) | | | (3,186 | ) |
| |
| Foreign assets(1) | | | | | | | | | | | | | | | | | | | | | | | | |
| Cash and deposits with banks | | | 17 | | | | (40 | ) | | | (23 | ) | | | (243 | ) | | | (162 | ) | | | (405 | ) |
| Securities | | Trading | | | (19 | ) | | | (41 | ) | | | (60 | ) | | | (607 | ) | | | (69 | ) | | | (676 | ) |
| | | AFS | | | (11 | ) | | | (16 | ) | | | (27 | ) | | | 425 | | | | (348 | ) | | | 77 | |
| | | FVO | | | (13 | ) | | | 2 | | | | (11 | ) | | | (1 | ) | | | (1 | ) | | | (2 | ) |
| | | HTM | | | — | | | | — | | | | — | | | | (93 | ) | | | — | | | | (93 | ) |
| Securities borrowed or purchased under resale agreements | | | 17 | | | | (48 | ) | | | (31 | ) | | | 295 | | | | (969 | ) | | | (674 | ) |
| |
| Loans | | Residential mortgages | | | (13 | ) | | | 50 | | | | 37 | | | | 26 | | | | (40 | ) | | | (14 | ) |
| | | Personal and credit card | | | (16 | ) | | | (5 | ) | | | (21 | ) | | | 4 | | | | (2 | ) | | | 2 | |
| | | Business and government | | | (49 | ) | | | (177 | ) | | | (226 | ) | | | 414 | | | | (305 | ) | | | 109 | |
| |
| Total loans | | | (78 | ) | | | (132 | ) | | | (210 | ) | | | 444 | | | | (347 | ) | | | 97 | |
| Other interest-bearing assets | | | 1 | | | | 9 | | | | 10 | | | | (5 | ) | | | 1 | | | | (4 | ) |
| |
| Change in foreign interest income | | | (86 | ) | | | (266 | ) | | | (352 | ) | | | 215 | | | | (1,895 | ) | | | (1,680 | ) |
| |
| Total change in interest income | | $ | 234 | | | $ | (436 | ) | | $ | (202 | ) | | $ | 411 | | | $ | (5,277 | ) | | $ | (4,866 | ) |
| |
| Domestic liabilities(1) | | | | | | | | | | | | | | | | | | | | | | | | |
| Deposits | | Personal | | $ | 155 | | | $ | (496 | ) | | $ | (341 | ) | | $ | 181 | | | $ | (776 | ) | | $ | (595 | ) |
| | | Business and government | | | 58 | | | | (144 | ) | | | (86 | ) | | | (204 | ) | | | (1,710 | ) | | | (1,914 | ) |
| | | Bank | | | (3 | ) | | | — | | | | (3 | ) | | | 4 | | | | (24 | ) | | | (20 | ) |
| |
| Total deposits | | | 210 | | | | (640 | ) | | | (430 | ) | | | (19 | ) | | | (2,510 | ) | | | (2,529 | ) |
| Obligations related to securities sold short | | | 63 | | | | (10 | ) | | | 53 | | | | (55 | ) | | | (41 | ) | | | (96 | ) |
| Obligations related to securities lent or sold under repurchase agreements | | | (49 | ) | | | (17 | ) | | | (66 | ) | | | 330 | | | | (522 | ) | | | (192 | ) |
| Other liabilities | | | (2 | ) | | | (21 | ) | | | (23 | ) | | | 4 | | | | (12 | ) | | | (8 | ) |
| Subordinated indebtedness | | | (21 | ) | | | 18 | | | | (3 | ) | | | 16 | | | | (60 | ) | | | (44 | ) |
| Preferred share liabilities | | | — | | | | 4 | | | | 4 | | | | — | | | | — | | | | — | |
| |
| Change in domestic interest expense | | | 201 | | | | (666 | ) | | | (465 | ) | | | 276 | | | | (3,145 | ) | | | (2,869 | ) |
| |
| Foreign liabilities(1) | | | | | | | | | | | | | | | | | | | | | | | | |
| Deposits | | Personal | | | (10 | ) | | | (24 | ) | | | (34 | ) | | | 14 | | | | (78 | ) | | | (64 | ) |
| | | Business and government | | | (14 | ) | | | (138 | ) | | | (152 | ) | | | (306 | ) | | | (672 | ) | | | (978 | ) |
| | | Bank | | | (26 | ) | | | (45 | ) | | | (71 | ) | | | (225 | ) | | | (178 | ) | | | (403 | ) |
| |
| Total deposits | | | (50 | ) | | | (207 | ) | | | (257 | ) | | | (517 | ) | | | (928 | ) | | | (1,445 | ) |
| Obligations related to securities sold short | | | (1 | ) | | | 1 | | | | — | | | | (29 | ) | | | (5 | ) | | | (34 | ) |
| Obligations related to securities lent or sold under repurchase agreements | | | 55 | | | | (215 | ) | | | (160 | ) | | | (73 | ) | | | (639 | ) | | | (712 | ) |
| Other liabilities | | | (31 | ) | | | (82 | ) | | | (113 | ) | | | (26 | ) | | | 52 | | | | 26 | |
| Subordinated indebtedness | | | (7 | ) | | | (10 | ) | | | (17 | ) | | | 1 | | | | (20 | ) | | | (19 | ) |
| |
| Change in foreign interest expense | | | (34 | ) | | | (513 | ) | | | (547 | ) | | | (644 | ) | | | (1,540 | ) | | | (2,184 | ) |
| |
| Total change in interest expense | | $ | 167 | | | $ | (1,179 | ) | | $ | (1,012 | ) | | $ | (368 | ) | | $ | (4,685 | ) | | $ | (5,053 | ) |
| |
| Change in total net interest income | | $ | 67 | | | $ | 743 | | | $ | 810 | | | $ | 779 | | | $ | (592 | ) | | $ | 187 | |
| |
| (1) | | Classification as domestic or foreign is based on domicile of debtor or customer. |
97
Management’s Discussion and Analysis
Analysis of Net Loans and Acceptances
| | | | | | | | | | | | | | | | | | | | | | | | | | | | | | | | | | | | | | | | | |
| | | Canada(1) | | | U.S.(1) | |
| $ millions, as at October 31 | | 2010 | | | 2009 | | | 2008 | | | 2007 | | | 2006 | | | 2010 | | | 2009 | | | 2008 | | | 2007 | | | 2006 | |
| |
| Residential mortgages | | $ | 91,338 | | | $ | 83,837 | | | $ | 88,185 | | | $ | 89,772 | | | $ | 81,326 | | | $ | 1 | | | $ | 1 | | | $ | 1 | | | $ | 3 | | | $ | 4 | |
| Student | | | 523 | | | | 677 | | | | 858 | | | | 1,060 | | | | 1,284 | | | | — | | | | — | | | | — | | | | — | | | | — | |
| Personal | | | 32,365 | | | | 31,729 | | | | 29,648 | | | | 26,640 | | | | 25,731 | | | | 241 | | | | 162 | | | | 215 | | | | 155 | | | | 252 | |
| Credit card | | | 11,508 | | | | 11,121 | | | | 10,329 | | | | 8,737 | | | | 7,027 | | | | 30 | | | | 28 | | | | 25 | | | | 23 | | | | 19 | |
| |
| Total net consumer loans | | | 135,734 | | | | 127,364 | | | | 129,020 | | | | 126,209 | | | | 115,368 | | | | 272 | | | | 191 | | | | 241 | | | | 181 | | | | 275 | |
| |
| Non-residential mortgages | | | 6,339 | | | | 5,789 | | | | 5,790 | | | | 4,892 | | | | 5,018 | | | | 2 | | | | 3 | | | | 77 | | | | 531 | | | | 1,822 | |
| Financial institutions | | | 1,852 | | | | 2,422 | | | | 4,107 | | | | 2,757 | | | | 1,901 | | | | 352 | | | | 644 | | | | 1,045 | | | | 310 | | | | 307 | |
| Retail | | | 2,487 | | | | 1,926 | | | | 2,261 | | | | 2,088 | | | | 2,044 | | | | 52 | | | | 115 | | | | 193 | | | | 266 | | | | 121 | |
| Business services | | | 2,773 | | | | 2,701 | | | | 2,951 | | | | 3,106 | | | | 3,277 | | | | 403 | | | | 455 | | | | 558 | | | | 365 | | | | 263 | |
| Manufacturing – capital goods | | | 970 | | | | 709 | | | | 860 | | | | 829 | | | | 957 | | | | 12 | | | | 26 | | | | 296 | | | | 250 | | | | 142 | |
| Manufacturing – consumer goods | | | 1,016 | | | | 787 | | | | 951 | | | | 1,123 | | | | 1,102 | | | | 18 | | | | 17 | | | | 90 | | | | 195 | | | | 143 | |
| Real estate and construction | | | 3,123 | | | | 2,903 | | | | 2,975 | | | | 2,602 | | | | 2,494 | | | | 1,563 | | | | 2,054 | | | | 2,138 | | | | 999 | | | | 906 | |
| Agriculture | | | 3,240 | | | | 2,897 | | | | 3,058 | | | | 2,890 | | | | 2,911 | | | | (1 | ) | | | (1 | ) | | | — | | | | 10 | | | | 6 | |
| Oil and gas | | | 2,418 | | | | 3,091 | | | | 3,605 | | | | 3,851 | | | | 3,100 | | | | 145 | | | | 12 | | | | 58 | | | | 114 | | | | 103 | |
| Mining | | | 123 | | | | 501 | | | | 1,763 | | | | 513 | | | | 215 | | | | 32 | | | | — | | | | 39 | | | | 11 | | | | 5 | |
| Forest products | | | 376 | | | | 299 | | | | 340 | | | | 474 | | | | 476 | | | | — | | | | 61 | | | | 93 | | | | 94 | | | | 58 | |
| Hardware and software | | | 223 | | | | 172 | | | | 190 | | | | 238 | | | | 257 | | | | 33 | | | | 43 | | | | 140 | | | | 169 | | | | 57 | |
| Telecommunications and cable | | | 264 | | | | 148 | | | | 565 | | | | 507 | | | | 419 | | | | 13 | | | | 34 | | | | 107 | | | | 112 | | | | 119 | |
| Publishing, printing, and broadcasting | | | 386 | | | | 505 | | | | 580 | | | | 523 | | | | 703 | | | | — | | | | — | | | | 59 | | | | 100 | | | | 12 | |
| Transportation | | | 750 | | | | 800 | | | | 627 | | | | 616 | | | | 633 | | | | 359 | | | | 294 | | | | 460 | | | | 623 | | | | 489 | |
| Utilities | | | 795 | | | | 667 | | | | 862 | | | | 258 | | | | 277 | | | | 99 | | | | 57 | | | | 162 | | | | 179 | | | | 79 | |
| Education, health and social services | | | 1,301 | | | | 1,240 | | | | 1,296 | | | | 1,222 | | | | 1,214 | | | | 46 | | | | 47 | | | | 119 | | | | 83 | | | | 70 | |
| Governments | | | 759 | | | | 685 | | | | 856 | | | | 824 | | | | 901 | | | | — | | | | — | | | | — | | | | — | | | | — | |
| Others | | | 358 | | | | 96 | | | | — | | | | — | | | | — | | | | 1,031 | | | | 1,128 | | | | — | | | | — | | | | — | |
| General allowance allocated to business and government loans | | | (217 | ) | | | (254 | ) | | | (282 | ) | | | (279 | ) | | | (260 | ) | | | (67 | ) | | | (76 | ) | | | (42 | ) | | | (54 | ) | | | (101 | ) |
| |
Total net business and government loans including acceptances(2) | | | 29,336 | | | | 28,084 | | | | 33,355 | | | | 29,034 | | | | 27,639 | | | | 4,092 | | | | 4,913 | | | | 5,592 | | | | 4,357 | | | | 4,601 | |
| |
| Total net loans and acceptances | | $ | 165,070 | | | $ | 155,448 | | | $ | 162,375 | | | $ | 155,243 | | | $ | 143,007 | | | $ | 4,364 | | | $ | 5,104 | | | $ | 5,833 | | | $ | 4,538 | | | $ | 4,876 | |
| |
| (1) | | Classification by country is based on domicile of debtor or customer. |
| |
| (2) | | Commencing 2010, business and government net loans and acceptances related to FirstCaribbean have been retroactively categorized by industry groups consistent with CIBC’s practice. Previously, they were included within business services, other than non-residential mortgages, which was reported separately. Prior year information was restated. |
Analysis of Net Loans and Acceptances (continued)
| | | | | | | | | | | | | | | | | | | | | | | | | | | | | | | | | | | | | | | | | |
| | | Other(1) | | | Total | |
| $ millions, as at October 31 | | 2010 | | | 2009 | | | 2008 | | | 2007 | | | 2006 | | | 2010 | | | 2009 | | | 2008 | | | 2007 | | | 2006 | |
| |
| Residential mortgages | | $ | 2,190 | | | $ | 2,272 | | | $ | 2,463 | | | $ | 1,848 | | | $ | 3 | | | $ | 93,529 | | | $ | 86,110 | | | $ | 90,649 | | | $ | 91,623 | | | $ | 81,333 | |
| Student | | | 1 | | | | 1 | | | | 1 | | | | 1 | | | | — | | | | 524 | | | | 678 | | | | 859 | | | | 1,061 | | | | 1,284 | |
| Personal | | | 688 | | | | 759 | | | | 909 | | | | 782 | | | | 160 | | | | 33,294 | | | | 32,650 | | | | 30,772 | | | | 27,577 | | | | 26,143 | |
| Credit card | | | 111 | | | | 110 | | | | 126 | | | | 102 | | | | — | | | | 11,649 | | | | 11,259 | | | | 10,480 | | | | 8,862 | | | | 7,046 | |
| |
| Total net consumer loans | | | 2,990 | | | | 3,142 | | | | 3,499 | | | | 2,733 | | | | 163 | | | | 138,996 | | | | 130,697 | | | | 132,760 | | | | 129,123 | | | | 115,806 | |
| |
| Non-residential mortgages | | | 392 | | | | 495 | | | | 519 | | | | 343 | | | | — | | | | 6,733 | | | | 6,287 | | | | 6,386 | | | | 5,766 | | | | 6,840 | |
| Financial institutions | | | 1,032 | | | | 971 | | | | 1,245 | | | | 1,498 | | | | 1,570 | | | | 3,236 | | | | 4,037 | | | | 6,397 | | | | 4,565 | | | | 3,778 | |
| Retail | | | 582 | | | | 691 | | | | 775 | | | | 726 | | | | 164 | | | | 3,121 | | | | 2,732 | | | | 3,229 | | | | 3,080 | | | | 2,329 | |
| Business services | | | 1,053 | | | | 1,361 | | | | 1,837 | | | | 1,468 | | | | 281 | | | | 4,229 | | | | 4,517 | | | | 5,346 | | | | 4,939 | | | | 3,821 | |
| Manufacturing – capital goods | | | 78 | | | | 100 | | | | 73 | | | | 105 | | | | 177 | | | | 1,060 | | | | 835 | | | | 1,229 | | | | 1,184 | | | | 1,276 | |
| Manufacturing – consumer goods | | | 253 | | | | 296 | | | | 365 | | | | 373 | | | | 110 | | | | 1,287 | | | | 1,100 | | | | 1,406 | | | | 1,691 | | | | 1,355 | |
| Real estate and construction | | | 681 | | | | 755 | | | | 613 | | | | 231 | | | | 23 | | | | 5,367 | | | | 5,712 | | | | 5,726 | | | | 3,832 | | | | 3,423 | |
| Agriculture | | | 104 | | | | 114 | | | | 142 | | | | 116 | | | | — | | | | 3,343 | | | | 3,010 | | | | 3,200 | | | | 3,016 | | | | 2,917 | |
| Oil and gas | | | — | | | | — | | | | — | | | | — | | | | 12 | | | | 2,563 | | | | 3,103 | | | | 3,663 | | | | 3,965 | | | | 3,215 | |
| Mining | | | 129 | | | | 348 | | | | 1,149 | | | | 1,319 | | | | 39 | | | | 284 | | | | 849 | | | | 2,951 | | | | 1,843 | | | | 259 | |
| Forest products | | | 31 | | | | 21 | | | | 28 | | | | 73 | | | | 98 | | | | 407 | | | | 381 | | | | 461 | | | | 641 | | | | 632 | |
| Hardware and software | | | 242 | | | | 271 | | | | 243 | | | | 169 | | | | 41 | | | | 498 | | | | 486 | | | | 573 | | | | 576 | | | | 355 | |
| Telecommunications and cable | | | 33 | | | | 44 | | | | 213 | | | | 465 | | | | 383 | | | | 310 | | | | 226 | | | | 885 | | | | 1,084 | | | | 921 | |
| Publishing, printing and broadcasting | | | 36 | | | | 39 | | | | 10 | | | | 133 | | | | 336 | | | | 422 | | | | 544 | | | | 649 | | | | 756 | | | | 1,051 | |
| Transportation | | | 249 | | | | 273 | | | | 369 | | | | 397 | | | | 469 | | | | 1,358 | | | | 1,367 | | | | 1,456 | | | | 1,636 | | | | 1,591 | |
| Utilities | | | 310 | | | | 351 | | | | 247 | | | | 264 | | | | 152 | | | | 1,204 | | | | 1,075 | | | | 1,271 | | | | 701 | | | | 508 | |
| Education, health and social services | | | 27 | | | | 19 | | | | — | | | | 52 | | | | 60 | | | | 1,374 | | | | 1,306 | | | | 1,415 | | | | 1,357 | | | | 1,344 | |
| Governments | | | 633 | | | | 567 | | | | 822 | | | | 473 | | | | — | | | | 1,392 | | | | 1,252 | | | | 1,678 | | | | 1,297 | | | | 901 | |
| Others | | | 6,312 | | | | 5,255 | | | | — | | | | — | | | | — | | | | 7,701 | | | | 6,479 | | | | — | | | | — | | | | — | |
| General allowance allocated to business and government loans | | | (25 | ) | | | (56 | ) | | | (34 | ) | | | (41 | ) | | | (45 | ) | | | (309 | ) | | | (386 | ) | | | (358 | ) | | | (374 | ) | | | (406 | ) |
| |
Total net business and government loans including acceptances(2) | | | 12,152 | | | | 11,915 | | | | 8,616 | | | | 8,164 | | | | 3,870 | | | | 45,580 | | | | 44,912 | | | | 47,563 | | | | 41,555 | | | | 36,110 | |
| |
| Total net loans and acceptances | | $ | 15,142 | | | $ | 15,057 | | | $ | 12,115 | | | $ | 10,897 | | | $ | 4,033 | | | $ | 184,576 | | | $ | 175,609 | | | $ | 180,323 | | | $ | 170,678 | | | $ | 151,916 | |
| |
| (1) | | Classification by country is based on domicile of debtor or customer. |
| |
| (2) | | Commencing 2010, business and government net loans and acceptances related to FirstCaribbean have been retroactively categorized by industry groups consistent with CIBC’s practice. Previously, they were included within business services, other than non-residential mortgages, which was reported separately. Prior year information was restated. |
98
Management’s Discussion and Analysis
Summary of Allowance for Credit Losses
| | | | | | | | | | | | | | | | | | | | | |
| $ millions, as at or for the year ended October 31 | | 2010 | | | 2009 | | | 2008 | | | 2007 | | | 2006 | |
| |
| Balance at beginning of year | | $ | 2,043 | | | $ | 1,523 | | | $ | 1,443 | | | $ | 1,444 | | | $ | 1,638 | |
| Provision for credit losses | | | 1,046 | | | | 1,649 | | | | 773 | | | | 603 | | | | 548 | |
| Write-offs | | | | | | | | | | | | | | | | | | | | |
| Domestic | | | | | | | | | | | | | | | | | | | | |
| Residential mortgages | | | 9 | | | | 7 | | | | 4 | | | | 5 | | | | 12 | |
| Student | | | 9 | | | | 11 | | | | 11 | | | | 13 | | | | 27 | |
| Personal and credit card | | | 1,054 | | | | 1,034 | | | | 681 | | | | 673 | | | | 648 | |
| Other business and government | | | 150 | | | | 115 | | | | 113 | | | | 131 | | | | 156 | |
| Foreign | | | | | | | | | | | | | | | | | | | | |
| Residential mortgages | | | 3 | | | | 2 | | | | — | | | | 2 | | | | — | |
| Personal and credit card | | | 17 | | | | 13 | | | | 6 | | | | 22 | | | | — | |
| Other business and government | | | 176 | | | | 41 | | | | 35 | | | | 15 | | | | 23 | |
| |
| Total write-offs | | | 1,418 | | | | 1,223 | | | | 850 | | | | 861 | | | | 866 | |
| |
| Recoveries | | | | | | | | | | | | | | | | | | | | |
| Domestic | | | | | | | | | | | | | | | | | | | | |
| Student | | | — | | | | 1 | | | | 1 | | | | 2 | | | | 3 | |
| Personal and credit card | | | 109 | | | | 89 | | | | 87 | | | | 77 | | | | 65 | |
| Other business and government | | | 8 | | | | 8 | | | | 13 | | | | 19 | | | | 14 | |
| Foreign | | | | | | | | | | | | | | | | | | | | |
| Personal and credit card | | | 2 | | | | 3 | | | | 5 | | | | 2 | | | | — | |
| Other business and government | | | 4 | | | | 20 | | | | 8 | | | | 47 | | | | 36 | |
| |
| Total recoveries | | | 123 | | | | 121 | | | | 114 | | | | 147 | | | | 118 | |
| |
| Net write-offs | | | 1,295 | | | | 1,102 | | | | 736 | | | | 714 | | | | 748 | |
| |
| Foreign exchange and other adjustments | | | (10 | ) | | | (27 | ) | | | 43 | | | | 110 | | | | 6 | |
| |
| Balance at end of year | | $ | 1,784 | | | $ | 2,043 | | | $ | 1,523 | | | $ | 1,443 | | | $ | 1,444 | |
| |
| Comprised of: | | | | | | | | | | | | | | | | | | | | |
| Loans | | $ | 1,720 | | | $ | 1,960 | | | $ | 1,446 | | | $ | 1,443 | | | $ | 1,442 | |
| Letters of credit | | | — | | | | 1 | | | | — | | | | — | | | | 2 | |
| Undrawn credit facilities | | | 64 | | | | 82 | | | | 77 | | | | — | | | | — | |
| |
| Ratio of net write-offs during year to average loans outstanding during year | | | 0.74 | % | | | 0.66 | % | | | 0.45 | % | | | 0.46 | % | | | 0.53 | % |
| |
Specific Allowances for Credit Losses as a Percentage of Gross Impaired Loans
| | | | | | | | | | | | | | | | | | | | | | | | | | | | | | | | | | | | | | | | | |
| | | Specific allowance for credit losses | | | Specific allowance as a % of gross impaired loans | |
| $ millions, as at October 31 | | 2010 | | | 2009 | | | 2008 | | | 2007 | | | 2006 | | | 2010 | | | 2009 | | | 2008 | | | 2007 | | | 2006 | |
| |
Domestic(1) | | | | | | | | | | | | | | | | | | | | | | | | | | | | | | | | | | | | | | | | |
| Residential mortgages | | $ | 19 | | | $ | 14 | | | $ | 9 | | | $ | 11 | | | $ | 13 | | | | 7.3 | % | | | 6.1 | % | | | 6.3 | % | | | 9.2 | % | | | 11.0 | % |
| Personal loans | | | 193 | | | | 226 | | | | 169 | | | | 183 | | | | 245 | | | | 88.9 | | | | 94.2 | | | | 79.0 | | | | 83.9 | | | | 91.4 | |
| Credit cards | | | — | | | | — | | | | — | | | | — | | | | 105 | | | | — | | | | — | | | | — | | | | — | | | | n/m | |
| Business and government | | | 120 | | | | 134 | | | | 121 | | | | 133 | | | | 172 | | | | 55.3 | | | | 51.9 | | | | 71.2 | | | | 66.2 | | | | 75.8 | |
| |
| Total domestic | | $ | 332 | | | $ | 374 | | | $ | 299 | | | $ | 327 | | | $ | 535 | | | | 47.9 | % | | | 51.4 | % | | | 56.7 | % | | | 60.8 | % | | | 87.3 | % |
| |
Foreign(1) | | | | | | | | | | | | | | | | | | | | | | | | | | | | | | | | | | | | | | | | |
| Residential mortgages | | $ | 11 | | | $ | 21 | | | $ | 27 | | | $ | 19 | | | $ | — | | | | 5.7 | % | | | 12.2 | % | | | 18.8 | % | | | 19.0 | % | | | — | % |
| Personal loans | | | 31 | | | | 32 | | | | 38 | | | | 24 | | | | — | | | | 35.6 | | | | 37.6 | | | | 45.8 | | | | 42.9 | | | | — | |
| Credit cards | | | — | | | | — | | | | — | | | | — | | | | — | | | | — | | | | — | | | | — | | | | — | | | | — | |
| Business and government | | | 257 | | | | 308 | | | | 79 | | | | 61 | | | | 7 | | | | 29.8 | | | | 33.3 | | | | 34.5 | | | | 36.1 | | | | 41.2 | |
| |
| Total foreign | | $ | 299 | | | $ | 361 | | | $ | 144 | | | $ | 104 | | | $ | 7 | | | | 26.2 | % | | | 30.5 | % | | | 31.6 | % | | | 32.0 | % | | | 41.2 | % |
| |
| Total specific allowance | | $ | 631 | | | $ | 735 | | | $ | 443 | | | $ | 431 | | | $ | 542 | | | | 34.4 | % | | | 38.5 | % | | | 45.1 | % | | | 49.9 | % | | | 86.0 | % |
| |
| (1) | | Classification as domestic is based on domicile of debtor or customer. |
| |
| | | n/m Not meaningful. |
99
Management’s Discussion and Analysis
General Allowance as a Percentage of Total Net Loans
| | | | | | | | | | | | | | | | | | | | | | | | | | | | | | | | | | | | | | | | | |
| | | General allowance for credit losses | | | General allowance as a % of total net loans | |
| $ millions, as at October 31 | | 2010 | | | 2009 | | | 2008 | | | 2007 | | | 2006 | | | 2010 | | | 2009 | | | 2008 | | | 2007 | | | 2006 | |
| |
Domestic(1) | | | | | | | | | | | | | | | | | | | | | | | | | | | | | | | | | | | | | | | | |
| Residential mortgages | | $ | 5 | | | $ | 4 | | | $ | 6 | | | $ | 8 | | | $ | 12 | | | | — | % | | | — | % | | | — | % | | | — | % | | | — | % |
| Personal loans | | | 287 | | | | 279 | | | | 280 | | | | 354 | | | | 375 | | | | 0.9 | | | | 0.9 | | | | 0.9 | | | | 1.3 | | | | 1.4 | |
| Credit cards | | | 477 | | | | 548 | | | | 348 | | | | 258 | | | | 102 | | | | 4.1 | | | | 4.9 | | | | 3.4 | | | | 3.0 | | | | 1.5 | |
| Business and government | | | 217 | | | | 254 | | | | 282 | | | | 279 | | | | 260 | | | | 0.7 | | | | 0.9 | | | | 0.8 | | | | 1.0 | | | | 0.9 | |
| |
| Total domestic | | $ | 986 | | | $ | 1,085 | | | $ | 916 | | | $ | 899 | | | $ | 749 | | | | 0.6 | % | | | 0.7 | % | | | 0.6 | % | | | 0.6 | % | | | 0.5 | % |
| |
Foreign(1) | | | | | | | | | | | | | | | | | | | | | | | | | | | | | | | | | | | | | | | | |
| Residential mortgages | | $ | 4 | | | $ | 3 | | | $ | 4 | | | $ | 3 | | | $ | — | | | | 0.2 | % | | | 0.1 | % | | | 0.2 | % | | | 0.2 | % | | | — | % |
| Personal loans | | | 6 | | | | 4 | | | | 6 | | | | 14 | | | | 5 | | | | 0.6 | | | | 0.4 | | | | 0.5 | | | | 1.5 | | | | 1.2 | |
| Credit cards | | | 1 | | | | 1 | | | | 1 | | | | 1 | | | | — | | | | 0.7 | | | | 0.7 | | | | 0.7 | | | | 0.8 | | | | — | |
| Business and government | | | 92 | | | | 132 | | | | 76 | | | | 95 | | | | 146 | | | | 0.6 | | | | 0.8 | | | | 0.5 | | | | 0.8 | | | | 1.7 | |
| |
| Total foreign | | $ | 103 | | | $ | 140 | | | $ | 87 | | | $ | 113 | | | $ | 151 | | | | 0.5 | % | | | 0.7 | % | | | 0.5 | % | | | 0.7 | % | | | 1.7 | % |
| |
| Total general allowance | | $ | 1,089 | | | $ | 1,225 | | | $ | 1,003 | | | $ | 1,012 | | | $ | 900 | | | | 0.6 | % | | | 0.7 | % | | | 0.6 | % | | | 0.6 | % | | | 0.6 | % |
| |
| (1) | | Classification as domestic or foreign is based on domicile of debtor or customer. |
Net Loans and Acceptances by Geographic Location(1)
| | | | | | | | | | | | | | | | | | | | | |
| $ millions, as at October 31 | | 2010 | | | 2009 | | | 2008 | | | 2007 | | | 2006 | |
| |
| Canada | | | | | | | | | | | | | | | | | | | | |
| Atlantic provinces | | $ | 9,446 | | | $ | 8,903 | | | $ | 8,977 | | | $ | 8,848 | | | $ | 8,213 | |
| Quebec | | | 13,779 | | | | 12,435 | | | | 12,693 | | | | 12,052 | | | | 11,376 | |
| Ontario | | | 77,791 | | | | 72,527 | | | | 76,065 | | | | 74,362 | | | | 70,441 | |
| Prairie provinces | | | 7,934 | | | | 7,348 | | | | 7,152 | | | | 6,281 | | | | 5,897 | |
| Alberta, Northwest Territories and Nunavut | | | 27,667 | | | | 27,336 | | | | 28,145 | | | | 26,654 | | | | 22,813 | |
| British Columbia and Yukon | | | 29,439 | | | | 27,984 | | | | 30,259 | | | | 27,945 | | | | 25,016 | |
| General allowance allocated to Canada | | | (986 | ) | | | (1,085 | ) | | | (916 | ) | | | (899 | ) | | | (749 | ) |
| |
| Total Canada | | $ | 165,070 | | | $ | 155,448 | | | $ | 162,375 | | | $ | 155,243 | | | $ | 143,007 | |
| |
| U.S. | | $ | 4,364 | | | $ | 5,104 | | | $ | 5,833 | | | $ | 4,538 | | | $ | 4,876 | |
| |
| Other countries | | $ | 15,142 | | | $ | 15,057 | | | $ | 12,115 | | | $ | 10,897 | | | $ | 4,033 | |
| |
| Total net loans and acceptances | | $ | 184,576 | | | $ | 175,609 | | | $ | 180,323 | | | $ | 170,678 | | | $ | 151,916 | |
| |
| (1) | | Classification by country is based on domicile of debtor or customer. |
100
Management’s Discussion and Analysis
Impaired Loans before General Allowance
| | | | | | | | | | | | | | | | | | | | | | | | | | | | | | | | | | | | | | | | | |
| | | Canada(1) | | | U.S.(1) | |
| $ millions, as at October 31 | | 2010 | | | 2009 | | | 2008 | | | 2007 | | | 2006 | | | 2010 | | | 2009 | | | 2008 | | | 2007 | | | 2006 | |
| |
Gross impaired loans | | | | | | | | | | | | | | | | | | | | | | | | | | | | | | | | | | | | | | | | |
| Residential mortgages | | $ | 259 | | | $ | 230 | | | $ | 143 | | | $ | 119 | | | $ | 118 | | | $ | — | | | $ | — | | | $ | — | | | $ | — | | | $ | — | |
| Student | | | 23 | | | | 29 | | | | 33 | | | | 41 | | | | 49 | | | | — | | | | — | | | | — | | | | — | | | | — | |
| Personal | | | 194 | | | | 211 | | | | 181 | | | | 177 | | | | 219 | | | | — | | | | — | | | | — | | | | — | | | | — | |
| |
| Total gross impaired consumer loans | | | 476 | | | | 470 | | | | 357 | | | | 337 | | | | 386 | | | | — | | | | — | | | | — | | | | — | | | | — | |
| |
| Non-residential mortgages | | | 8 | | | | 8 | | | | 4 | | | | 3 | | | | 4 | | | | — | | | | — | | | | — | | | | — | | | | — | |
| Financial institutions | | | 1 | | | | 1 | | | | 4 | | | | 6 | | | | 2 | | | | — | | | | 135 | | | | — | | | | — | | | | — | |
| Retail and business services | | | 57 | | | | 97 | | | | 89 | | | | 95 | | | | 90 | | | | 51 | | | | 45 | | | | — | | | | 20 | | | | 8 | |
| Manufacturing — consumer and capital goods | | | 46 | | | | 49 | | | | 17 | | | | 26 | | | | 37 | | | | 16 | | | | 31 | | | | 2 | | | | 3 | | | | 2 | |
| Real estate and construction | | | 54 | | | | 16 | | | | 8 | | | | 19 | | | | 14 | | | | 183 | | | | 244 | | | | 2 | | | | — | | | | — | |
| Agriculture | | | 6 | | | | 9 | | | | 20 | | | | 33 | | | | 60 | | | | — | | | | — | | | | — | | | | — | | | | — | |
| Resource-based industries | | | 26 | | | | 26 | | | | 20 | | | | 4 | | | | 2 | | | | — | | | | — | | | | — | | | | — | | | | — | |
| Telecommunications, media and technology | | | 10 | | | | 44 | | | | 3 | | | | 6 | | | | 7 | | | | — | | | | — | | | | 2 | | | | 1 | | | | 2 | |
| Transportation | | | 7 | | | | 5 | | | | 3 | | | | 5 | | | | 5 | | | | 13 | | | | 19 | | | | — | | | | — | | | | — | |
| Utilities | | | — | | | | — | | | | — | | | | — | | | | — | | | | — | | | | — | | | | — | | | | — | | | | — | |
| Other | | | 2 | | | | 3 | | | | 2 | | | | 4 | | | | 6 | | | | — | | | | — | | | | — | | | | — | | | | — | |
| |
Total gross impaired — business and government loans(2) | | | 217 | | | | 258 | | | | 170 | | | | 201 | | | | 227 | | | | 263 | | | | 474 | | | | 6 | | | | 24 | | | | 12 | |
| |
| Total gross impaired loans | | | 693 | | | | 728 | | | | 527 | | | | 538 | | | | 613 | | | | 263 | | | | 474 | | | | 6 | | | | 24 | | | | 12 | |
Other past due loans(3) | | | 376 | | | | 472 | | | | 366 | | | | 60 | | | | 45 | | | | — | | | | — | | | | 5 | | | | — | | | | — | |
| |
| Total gross impaired and other past due loans | | $ | 1,069 | | | $ | 1,200 | | | $ | 893 | | | $ | 598 | | | $ | 658 | | | $ | 263 | | | $ | 474 | | | $ | 11 | | | $ | 24 | | | $ | 12 | |
| |
Allowance for credit losses | | | | | | | | | | | | | | | | | | | | | | | | | | | | | | | | | | | | | | | | |
| Residential mortgages | | $ | 19 | | | $ | 14 | | | $ | 9 | | | $ | 11 | | | $ | 13 | | | $ | — | | | $ | — | | | $ | — | | | $ | — | | | $ | — | |
| Student | | | 7 | | | | 12 | | | | 11 | | | | 16 | | | | 22 | | | | — | | | | — | | | | — | | | | — | | | | — | |
| Credit card | | | — | | | | — | | | | — | | | | — | | | | 105 | | | | — | | | | — | | | | — | | | | — | | | | — | |
| Personal | | | 186 | | | | 214 | | | | 158 | | | | 167 | | | | 223 | | | | — | | | | — | | | | — | | | | — | | | | — | |
| |
| Total allowance — consumer loans | | | 212 | | | | 240 | | | | 178 | | | | 194 | | | | 363 | | | | — | | | | — | | | | — | | | | — | | | | — | |
| |
| Non-residential mortgages | | | 2 | | | | 2 | | | | 1 | | | | 1 | | | | 1 | | | | — | | | | — | | | | — | | | | — | | | | — | |
| Financial institutions | | | 1 | | | | 1 | | | | 1 | | | | 1 | | | | 2 | | | | — | | | | 17 | | | | — | | | | — | | | | — | |
| Retail and business services | | | 36 | | | | 59 | | | | 74 | | | | 66 | | | | 74 | | | | 22 | | | | 10 | | | | — | | | | 14 | | | | 3 | |
| Manufacturing — consumer and capital goods | | | 23 | | | | 27 | | | | 11 | | | | 17 | | | | 33 | | | | 7 | | | | 17 | | | | 1 | | | | 3 | | | | 1 | |
| Real estate and construction | | | 18 | | | | 8 | | | | 8 | | | | 13 | | | | 9 | | | | 63 | | | | 89 | | | | 2 | | | | — | | | | — | |
| Agriculture | | | 4 | | | | 6 | | | | 10 | | | | 18 | | | | 36 | | | | 1 | | | | 1 | | | | — | | | | — | | | | — | |
| Resource-based industries | | | 19 | | | | 12 | | | | 7 | | | | 3 | | | | 2 | | | | — | | | | — | | | | — | | | | — | | | | — | |
| Telecommunications, media and technology | | | 9 | | | | 13 | | | | 3 | | | | 6 | | | | 6 | | | | — | | | | — | | | | 1 | | | | — | | | | — | |
| Transportation | | | 7 | | | | 5 | | | | 4 | | | | 5 | | | | 5 | | | | 9 | | | | 13 | | | | — | | | | — | | | | — | |
| Utilities | | | — | | | | — | | | | — | | | | — | | | | — | | | | — | | | | — | | | | — | | | | — | | | | — | |
| Other | | | 1 | | | | 1 | | | | 2 | | | | 3 | | | | 4 | | | | — | | | | — | | | | — | | | | — | | | | — | |
| |
Total allowance — business and government loans(2) | | | 120 | | | | 134 | | | | 121 | | | | 133 | | | | 172 | | | | 102 | | | | 147 | | | | 4 | | | | 17 | | | | 4 | |
| |
| Total allowance | | $ | 332 | | | $ | 374 | | | $ | 299 | | | $ | 327 | | | $ | 535 | | | $ | 102 | | | $ | 147 | | | $ | 4 | | | $ | 17 | | | $ | 4 | |
| |
Net impaired loans | | | | | | | | | | | | | | | | | | | | | | | | | | | | | | | | | | | | | | | | |
| Residential mortgages | | $ | 240 | | | $ | 216 | | | $ | 134 | | | $ | 108 | | | $ | 105 | | | $ | — | | | $ | — | | | $ | — | | | $ | — | | | $ | — | |
| Student | | | 16 | | | | 17 | | | | 22 | | | | 25 | | | | 27 | | | | — | | | | — | | | | — | | | | — | | | | — | |
| Credit card | | | — | | | | — | | | | — | | | | — | | | | (105 | ) | | | — | | | | — | | | | — | | | | — | | | | — | |
| Personal | | | 8 | | | | (3 | ) | | | 23 | | | | 10 | | | | (4 | ) | | | — | | | | — | | | | — | | | | — | | | | — | |
| |
| Total net impaired consumer loans | | | 264 | | | | 230 | | | | 179 | | | | 143 | | | | 23 | | | | — | | | | — | | | | — | | | | — | | | | — | |
| |
| Non-residential mortgages | | | 6 | | | | 6 | | | | 3 | | | | 2 | | | | 3 | | | | — | | | | — | | | | — | | | | — | | | | — | |
| Financial institutions | | | — | | | | — | | | | 3 | | | | 5 | | | | — | | | | — | | | | 118 | | | | — | | | | — | | | | — | |
| Retail and business services | | | 21 | | | | 38 | | | | 15 | | | | 29 | | | | 16 | | | | 29 | | | | 35 | | | | — | | | | 6 | | | | 5 | |
| Manufacturing — consumer and capital goods | | | 23 | | | | 22 | | | | 6 | | | | 9 | | | | 4 | | | | 9 | | | | 14 | | | | 1 | | | | — | | | | 1 | |
| Real estate and construction | | | 36 | | | | 8 | | | | — | | | | 6 | | | | 5 | | | | 120 | | | | 155 | | | | — | | | | — | | | | — | |
| Agriculture | | | 2 | | | | 3 | | | | 10 | | | | 15 | | | | 24 | | | | (1 | ) | | | (1 | ) | | | — | | | | — | | | | — | |
| Resource-based industries | | | 7 | | | | 14 | | | | 13 | | | | 1 | | | | — | | | | — | | | | — | | | | — | | | | — | | | | — | |
| Telecommunications, media and technology | | | 1 | | | | 31 | | | | — | | | | — | | | | 1 | | | | — | | | | — | | | | 1 | | | | 1 | | | | 2 | |
| Transportation | | | — | | | | — | | | | (1 | ) | | | — | | | | — | | | | 4 | | | | 6 | | | | — | | | | — | | | | — | |
| Utilities | | | — | | | | — | | | | — | | | | — | | | | — | | | | — | | | | — | | | | — | | | | — | | | | — | |
| Other | | | 1 | | | | 2 | | | | — | | | | 1 | | | | 2 | | | | — | | | | — | | | | — | | | | — | | | | — | |
| |
Total net impaired — business and government loans(2) | | | 97 | | | | 124 | | | | 49 | | | | 68 | | | | 55 | | | | 161 | | | | 327 | | | | 2 | | | | 7 | | | | 8 | |
| |
| Total net impaired loans | | $ | 361 | | | $ | 354 | | | $ | 228 | | | $ | 211 | | | $ | 78 | | | $ | 161 | | | $ | 327 | | | $ | 2 | | | $ | 7 | | | $ | 8 | |
| |
| (1) | | Classification by country is based on domicile of debtor or customer. |
| |
| (2) | | Commencing 2010, business and government gross impaired loans and specific allowance for credit losses related to FirstCaribbean have been retroactively categorized by industry groups consistent with CIBC’s practice. Previously, they were included within retail and business services, other than non-residential mortgages, which was reported separately. Prior year information was restated. |
| |
| (3) | | Represents loans where repayment of principal or payment of interest is contractually in arrears between 90 and 180 days. Commencing 2008, other past due loans also include government-guaranteed loans. |
101
Management’s Discussion and Analysis
Impaired Loans before General Allowance (continued)
| | | | | | | | | | | | | | | | | | | | | | | | | | | | | | | | | | | | | | | | | |
| | | Other(1) | | | Total | |
| $ millions, as at October 31 | | 2010 | | | 2009 | | | 2008 | | | 2007 | | | 2006 | | | 2010 | | | 2009 | | | 2008 | | | 2007 | | | 2006 | |
| |
Gross impaired loans | | | | | | | | | | | | | | | | | | | | | | | | | | | | | | | | | | | | | | | | |
| Residential mortgages | | $ | 193 | | | $ | 172 | | | $ | 144 | | | $ | 100 | | | $ | — | | | $ | 452 | | | $ | 402 | | | $ | 287 | | | $ | 219 | | | $ | 118 | |
| Student | | | — | | | | — | | | | — | | | | — | | | | — | | | | 23 | | | | 29 | | | | 33 | | | | 41 | | | | 49 | |
| Personal | | | 87 | | | | 85 | | | | 83 | | | | 56 | | | | — | | | | 281 | | | | 296 | | | | 264 | | | | 233 | | | | 219 | |
| |
| Total gross impaired consumer loans | | | 280 | | | | 257 | | | | 227 | | | | 156 | | | | — | | | | 756 | | | | 727 | | | | 584 | | | | 493 | | | | 386 | |
| |
| Non-residential mortgages | | | 67 | | | | 57 | | | | 28 | | | | 34 | | | | — | | | | 75 | | | | 65 | | | | 32 | | | | 37 | | | | 4 | |
| Financial institutions | | | 4 | | | | 3 | | | | 1 | | | | — | | | | — | | | | 5 | | | | 139 | | | | 5 | | | | 6 | | | | 2 | |
| Retail and business services | | | 208 | | | | 132 | | | | 70 | | | | 28 | | | | 3 | | | | 316 | | | | 274 | | | | 159 | | | | 143 | | | | 101 | |
| Manufacturing — consumer and capital goods | | | 15 | | | | 16 | | | | 7 | | | | 4 | | | | 2 | | | | 77 | | | | 96 | | | | 26 | | | | 33 | | | | 41 | |
| Real estate and construction | | | 228 | | | | 115 | | | | 76 | | | | 59 | | | | — | | | | 465 | | | | 375 | | | | 86 | | | | 78 | | | | 14 | |
| Agriculture | | | 20 | | | | 14 | | | | 15 | | | | 10 | | | | — | | | | 26 | | | | 23 | | | | 35 | | | | 43 | | | | 60 | |
| Resource-based industries | | | — | | | | — | | | | 1 | | | | — | | | | — | | | | 26 | | | | 26 | | | | 21 | | | | 4 | | | | 2 | |
| Telecommunications, media and technology | | | 32 | | | | 90 | | | | — | | | | — | | | | — | | | | 42 | | | | 134 | | | | 5 | | | | 7 | | | | 9 | |
| Transportation | | | 25 | | | | 24 | | | | 23 | | | | 10 | | | | — | | | | 45 | | | | 48 | | | | 26 | | | | 15 | | | | 5 | |
| Utilities | | | 1 | | | | 1 | | | | 1 | | | | — | | | | — | | | | 1 | | | | 1 | | | | 1 | | | | — | | | | — | |
| Other | | | — | | | | — | | | | 1 | | | | — | | | | — | | | | 2 | | | | 3 | | | | 3 | | | | 4 | | | | 6 | |
| |
Total gross impaired — business and government loans(2) | | | 600 | | | | 452 | | | | 223 | | | | 145 | | | | 5 | | | | 1,080 | | | | 1,184 | | | | 399 | | | | 370 | | | | 244 | |
| |
| Total gross impaired loans | | | 880 | | | | 709 | | | | 450 | | | | 301 | | | | 5 | | | | 1,836 | | | | 1,911 | | | | 983 | | | | 863 | | | | 630 | |
Other past due loans(3) | | | 5 | | | | 6 | | | | 3 | | | | — | | | | — | | | | 381 | | | | 478 | | | | 374 | | | | 60 | | | | 45 | |
| |
| Total gross impaired and other past due loans | | $ | 885 | | | $ | 715 | | | $ | 453 | | | $ | 301 | | | $ | 5 | | | $ | 2,217 | | | $ | 2,389 | | | $ | 1,357 | | | $ | 923 | | | $ | 675 | |
| |
Allowance for credit losses | | | | | | | | | | | | | | | | | | | | | | | | | | | | | | | | | | | | | | | | |
| Residential mortgages | | $ | 11 | | | $ | 21 | | | $ | 27 | | | $ | 19 | | | $ | — | | | $ | 30 | | | $ | 35 | | | $ | 36 | | | $ | 30 | | | $ | 13 | |
| Student | | | — | | | | — | | | | — | | | | — | | | | — | | | | 7 | | | | 12 | | | | 11 | | | | 16 | | | | 22 | |
| Credit card | | | — | | | | — | | | | — | | | | — | | | | — | | | | — | | | | — | | | | — | | | | — | | | | 105 | |
| Personal | | | 31 | | | | 32 | | | | 38 | | | | 24 | | | | — | | | | 217 | | | | 246 | | | | 196 | | | | 191 | | | | 223 | |
| |
| Total allowance — consumer loans | | | 42 | | | | 53 | | | | 65 | | | | 43 | | | | — | | | | 254 | | | | 293 | | | | 243 | | | | 237 | | | | 363 | |
| |
| Non-residential mortgages | | | 14 | | | | 9 | | | | 4 | | | | 3 | | | | — | | | | 16 | | | | 11 | | | | 5 | | | | 4 | | | | 1 | |
| Financial institutions | | | 1 | | | | 1 | | | | — | | | | — | | | | — | | | | 2 | | | | 19 | | | | 1 | | | | 1 | | | | 2 | |
| Retail and business services | | | 63 | | | | 46 | | | | 30 | | | | 13 | | | | 3 | | | | 121 | | | | 115 | | | | 104 | | | | 93 | | | | 80 | |
| Manufacturing — consumer and capital goods | | | 4 | | | | 5 | | | | 3 | | | | 2 | | | | — | | | | 34 | | | | 49 | | | | 15 | | | | 22 | | | | 34 | |
| Real estate and construction | | | 46 | | | | 27 | | | | 27 | | | | 19 | | | | — | | | | 127 | | | | 124 | | | | 37 | | | | 32 | | | | 9 | |
| Agriculture | | | 9 | | | | 6 | | | | 4 | | | | 2 | | | | — | | | | 14 | | | | 13 | | | | 14 | | | | 20 | | | | 36 | |
| Resource-based industries | | | — | | | | — | | | | — | | | | — | | | | — | | | | 19 | | | | 12 | | | | 7 | | | | 3 | | | | 2 | |
| Telecommunications, media and technology | | | 11 | | | | 59 | | | | — | | | | — | | | | — | | | | 20 | | | | 72 | | | | 4 | | | | 6 | | | | 6 | |
| Transportation | | | 7 | | | | 7 | | | | 6 | | | | 5 | | | | — | | | | 23 | | | | 25 | | | | 10 | | | | 10 | | | | 5 | |
| Utilities | | | — | | | | 1 | | | | 1 | | | | — | | | | — | | | | — | | | | 1 | | | | 1 | | | | — | | | | — | |
| Other | | | — | | | | — | | | | — | | | | — | | | | — | | | | 1 | | | | 1 | | | | 2 | | | | 3 | | | | 4 | |
| |
Total allowance — business and government loans(2) | | | 155 | | | | 161 | | | | 75 | | | | 44 | | | | 3 | | | | 377 | | | | 442 | | | | 200 | | | | 194 | | | | 179 | |
| |
| Total allowance | | $ | 197 | | | $ | 214 | | | $ | 140 | | | $ | 87 | | | $ | 3 | | | $ | 631 | | | $ | 735 | | | $ | 443 | | | $ | 431 | | | $ | 542 | |
| |
Net impaired loans | | | | | | | | | | | | | | | | | | | | | | | | | | | | | | | | | | | | | | | | |
| Residential mortgages | | $ | 182 | | | $ | 151 | | | $ | 117 | | | $ | 81 | | | $ | — | | | $ | 422 | | | $ | 367 | | | $ | 251 | | | $ | 189 | | | $ | 105 | |
| Student | | | — | | | | — | | | | — | | | | — | | | | — | | | | 16 | | | | 17 | | | | 22 | | | | 25 | | | | 27 | |
| Credit card | | | — | | | | — | | | | — | | | | — | | | | — | | | | — | | | | — | | | | — | | | | — | | | | (105 | ) |
| Personal | | | 56 | | | | 53 | | | | 45 | | | | 32 | | | | — | | | | 64 | | | | 50 | | | | 68 | | | | 42 | | | | (4 | ) |
| |
| Total net impaired consumer loans | | | 238 | | | | 204 | | | | 162 | | | | 113 | | | | — | | | | 502 | | | | 434 | | | | 341 | | | | 256 | | | | 23 | |
| |
| Non-residential mortgages | | | 53 | | | | 48 | | | | 24 | | | | 31 | | | | — | | | | 59 | | | | 54 | | | | 27 | | | | 33 | | | | 3 | |
| Financial institutions | | | 3 | | | | 2 | | | | 1 | | | | — | | | | — | | | | 3 | | | | 120 | | | | 4 | | | | 5 | | | | — | |
| Retail and business services | | | 145 | | | | 86 | | | | 40 | | | | 15 | | | | — | | | | 195 | | | | 159 | | | | 55 | | | | 50 | | | | 21 | |
| Manufacturing — consumer and capital goods | | | 11 | | | | 11 | | | | 4 | | | | 2 | | | | 2 | | | | 43 | | | | 47 | | | | 11 | | | | 11 | | | | 7 | |
| Real estate and construction | | | 182 | | | | 88 | | | | 49 | | | | 40 | | | | — | | | | 338 | | | | 251 | | | | 49 | | | | 46 | | | | 5 | |
| Agriculture | | | 11 | | | | 8 | | | | 11 | | | | 8 | | | | — | | | | 12 | | | | 10 | | | | 21 | | | | 23 | | | | 24 | |
| Resource-based industries | | | — | | | | — | | | | 1 | | | | — | | | | — | | | | 7 | | | | 14 | | | | 14 | | | | 1 | | | | — | |
| Telecommunications, media and technology | | | 21 | | | | 31 | | | | — | | | | — | | | | — | | | | 22 | | | | 62 | | | | 1 | | | | 1 | | | | 3 | |
| Transportation | | | 18 | | | | 17 | | | | 17 | | | | 5 | | | | — | | | | 22 | | | | 23 | | | | 16 | | | | 5 | | | | — | |
| Utilities | | | 1 | | | | — | | | | — | | | | — | | | | — | | | | 1 | | | | — | | | | — | | | | — | | | | — | |
| Other | | | — | | | | — | | | | 1 | | | | — | | | | — | | | | 1 | | | | 2 | | | | 1 | | | | 1 | | | | 2 | |
| |
Total net impaired — business and government loans(2) | | | 445 | | | | 291 | | | | 148 | | | | 101 | | | | 2 | | | | 703 | | | | 742 | | | | 199 | | | | 176 | | | | 65 | |
| |
| Total net impaired loans | | $ | 683 | | | $ | 495 | | | $ | 310 | | | $ | 214 | | | $ | 2 | | | $ | 1,205 | | | $ | 1,176 | | | $ | 540 | | | $ | 432 | | | $ | 88 | |
| |
| (1) | | Classification by country is based on domicile of debtor or customer. |
| |
| (2) | | Commencing 2010, business and government gross impaired loans and specific allowance for credit losses related to FirstCaribbean have been retroactively categorized by industry groups consistent with CIBC’s practice. Previously, they were included within retail and business services, other than non-residential mortgages, which was reported separately. Prior year information was restated. |
| |
| (3) | | Represents loans where repayment of principal or payment of interest is contractually in arrears between 90 and 180 days. Commencing 2008, other past due loans also include government-guaranteed loans. |
102
Management’s Discussion and Analysis
Deposits
| | | | | | | | | | | | | | | | | | | | | | | | | | | | | | | | | | | | | |
| | | Average balance | | | Interest | | | Rate | |
| $ millions, for the year ended October 31 | | 2010 | | | 2009 | | | 2008 | | | 2010 | | | 2009 | | | 2008 | | | 2010 | | | 2009 | | | 2008 | |
| |
Deposits in domestic bank offices(1) | | | | | | | | | | | | | | | | | | | | | | | | | | | | | | | | | | | | |
| Payable on demand | | | | | | | | | | | | | | | | | | | | | | | | | | | | | | | | | | | | |
| Personal | | $ | 7,026 | | | $ | 5,967 | | | $ | 5,783 | | | $ | 3 | | | $ | 5 | | | $ | 6 | | | | 0.04 | % | | | 0.08 | % | | | 0.10 | % |
| Business and government | | | 25,632 | | | | 23,539 | | | | 22,337 | | | | 46 | | | | 59 | | | | 358 | | | | 0.18 | | | | 0.25 | | | | 1.60 | |
| Bank | | | 1,299 | | | | 1,193 | | | | 1,140 | | | | 2 | | | | 4 | | | | 14 | | | | 0.15 | | | | 0.34 | | | | 1.23 | |
| Payable after notice | | | | | | | | | | | | | | | | | | | | | | | | | | | | | | | | | | | | |
| Personal | | | 56,735 | | | | 45,135 | | | | 37,568 | | | | 286 | | | | 329 | | | | 506 | | | | 0.50 | | | | 0.73 | | | | 1.35 | |
| Business and government | | | 11,812 | | | | 8,622 | | | | 6,825 | | | | 62 | | | | 48 | | | | 182 | | | | 0.52 | | | | 0.56 | | | | 2.67 | |
| Bank | | | 4 | | | | 1 | | | | 4 | | | | — | | | | — | | | | — | | | | — | | | | — | | | | — | |
| Payable on a fixed date | | | | | | | | | | | | | | | | | | | | | | | | | | | | | | | | | | | | |
| Personal | | | 42,749 | | | | 46,932 | | | | 47,659 | | | | 1,143 | | | | 1,438 | | | | 1,867 | | | | 2.67 | | | | 3.06 | | | | 3.92 | |
| Business and government | | | 46,073 | | | | 45,192 | | | | 54,189 | | | | 493 | | | | 448 | | | | 1,815 | | | | 1.07 | | | | 0.99 | | | | 3.35 | |
| Bank | | | 560 | | | | 1,062 | | | | 641 | | | | 2 | | | | 4 | | | | 22 | | | | 0.36 | | | | 0.38 | | | | 3.43 | |
| |
| Total domestic | | | 191,890 | | | | 177,643 | | | | 176,146 | | | | 2,037 | | | | 2,335 | | | | 4,770 | | | | 1.06 | | | | 1.31 | | | | 2.71 | |
| |
Deposits in foreign bank offices | | | | | | | | | | | | | | | | | | | | | | | | | | | | | | | | | | | | |
| Payable on demand | | | | | | | | | | | | | | | | | | | | | | | | | | | | | | | | | | | | |
| Personal | | | 439 | | | | 482 | | | | 508 | | | | 3 | | | | 5 | | | | 13 | | | | 0.68 | | | | 1.04 | | | | 2.56 | |
| Business and government | | | 2,320 | | | | 2,912 | | | | 2,611 | | | | 6 | | | | 5 | | | | 9 | | | | 0.26 | | | | 0.17 | | | | 0.34 | |
| Bank | | | 80 | | | | 272 | | | | 347 | | | | 4 | | | | 4 | | | | 3 | | | | 5.00 | | | | 1.47 | | | | 0.86 | |
| Payable after notice | | | | | | | | | | | | | | | | | | | | | | | | | | | | | | | | | | | | |
| Personal | | | 1,916 | | | | 2,055 | | | | 1,764 | | | | 39 | | | | 49 | | | | 53 | | | | 2.04 | | | | 2.38 | | | | 3.00 | |
| Business and government | | | 647 | | | | 662 | | | | 410 | | | | 1 | | | | 1 | | | | 3 | | | | 0.15 | | | | 0.15 | | | | 0.73 | |
| Payable on a fixed date | | | | | | | | | | | | | | | | | | | | | | | | | | | | | | | | | | | | |
| Personal | | | 2,214 | | | | 2,487 | | | | 2,390 | | | | 9 | | | | 32 | | | | 72 | | | | 0.41 | | | | 1.29 | | | | 3.01 | |
| Business and government | | | 26,650 | | | | 27,278 | | | | 38,926 | | | | 74 | | | | 359 | | | | 1,445 | | | | 0.28 | | | | 1.32 | | | | 3.71 | |
| Bank | | | 4,891 | | | | 7,192 | | | | 13,864 | | | | 19 | | | | 89 | | | | 485 | | | | 0.39 | | | | 1.24 | | | | 3.50 | |
| |
| Total foreign | | | 39,157 | | | | 43,340 | | | | 60,820 | | | | 155 | | | | 544 | | | | 2,083 | | | | 0.40 | | | | 1.26 | | | | 3.42 | |
| |
| Total deposits | | $ | 231,047 | | | $ | 220,983 | | | $ | 236,966 | | | $ | 2,192 | | | $ | 2,879 | | | $ | 6,853 | | | | 0.95 | % | | | 1.30 | % | | | 2.89 | % |
| |
| (1) | | Deposits by foreign depositors in our domestic bank offices amounted to $3.6 billion (2009: $4.2 billion; 2008: $3.6 billion). |
Short-term Borrowings
| | | | | | | | | | | | | |
| $ millions, as at or for the year ended October 31 | | 2010 | | | 2009 | | | 2008 | |
| |
Amounts outstanding at end of year | | | | | | | | | | | | |
| Obligations related to securities sold short | | $ | 9,673 | | | $ | 5,916 | | | $ | 6,924 | |
| Obligations related to securities lent or sold under repurchase agreements | | | 28,220 | | | | 37,453 | | | | 38,023 | |
| |
| Total short-term borrowings | | $ | 37,893 | | | $ | 43,369 | | | $ | 44,947 | |
| |
Obligations related to securities sold short | | | | | | | | | | | | |
| Average balance | | $ | 8,620 | | | $ | 6,461 | | | $ | 9,901 | |
| Maximum month-end balance | | | 10,554 | | | | 7,368 | | | | 11,984 | |
| Average interest rate | | | 2.45 | % | | | 2.45 | % | | | 2.91 | % |
Obligations related to securities lent or sold under repurchase agreements | | | | | | | | | | | | |
| Average balance | | | 39,379 | | | | 43,372 | | | | 30,574 | |
| Maximum month-end balance | | | 45,886 | | | | 49,211 | | | | 38,023 | |
| Average interest rate | | | 0.75 | % | | | 1.20 | % | | | 4.66 | % |
| |
Fees Paid to the Shareholders’ Auditors
| | | | | | | | | | | | | |
| $ millions, for the year ended October 31 | | 2010 | | | 2009 | | | 2008 | |
| |
Audit fees(1) | | $ | 16.3 | | | $ | 19.0 | | | $ | 18.0 | |
Audit related fees(2) | | | 2.8 | | | | 2.2 | | | | 2.3 | |
Tax fees(3) | | | 0.4 | | | | 0.4 | | | | 0.4 | |
| Other | | | — | | | | — | | | | 1.3 | |
| |
| Total | | $ | 19.5 | | | $ | 21.6 | | | $ | 22.0 | |
| |
| (1) | | For the audit of CIBC’s annual financial statements and services normally provided by the principal auditor in connection with CIBC’s statutory and regulatory filings. Audit fees also include the audit of internal control over financial reporting under standards of the Public Company Accounting Oversight Board (United States). |
| |
| (2) | | For the assurance and related services that are reasonably related to the performance of the audit or review of CIBC’s financial statements, including accounting consultation, various agreed upon procedures and translation of financial reports. |
| |
| (3) | | For tax compliance services. |
103