LETTER FROM THE PRESIDENT (Unaudited)
Dear Fellow Shareholders:
2008 by all accounts was the worst year for equity markets since the 1930’s. Unfortunately, all asset classes were effected without much shelter from the suffering market ride. After a year of extreme turmoil, domestically and worldwide, things appear to be stabilizing and looking up for the market. The turnaround is welcomed after a 46.20% decline in the S&P 500 from September 1, 2008 to the bottom on March 9, 2009.
We have seen historic moves by Congress to restore public confidence and boost the inter-locking economic trends. The U.S. Treasury and Federal Reserve have taken extraordinary actions to spur consumer spending in response to the unprecedented volatility in the Nation’s housing, corporate, mortgage and credit markets. While this may prove to be a painful process, it will ultimately result in greater financial stability and economic environment. Throughout these changes, we have worked hard to keep your interest paramount.
Amid this financial trouble, the portfolio managers of the Monteagle Funds have endeavored to capitalize on the opportunities created by investing in bargain investment grade bonds (in our fixed income fund) and high quality issues (in our equity funds). We believe that long-term investors will be rewarded for their faith in professional management and trusting patience.
I look forward to serving you as the new President. I encourage you to carefully review the information presented in this annual report and thank you for your continued confidence and support of the Monteagle Funds.
Sincerely,
Paul B. Ordonio, JD
President
Monteagle Funds
MONTEAGLE FIXED INCOME FUND
A DISCUSSION OF FUND PERFORMANCE (Unaudited)
How did the Fund perform?
For the year ended August 31, 2009, the Monteagle Fixed Income Fund (the “Fund”) had a total return of 6.80%. For the quarter ended August 31, 2009, the Fund had a total return of 2.26%; and for the six months ended August 31, 2009, the Fund had a total return of 4.35%. The Fund’s benchmark index (The Barclay’s Capital Intermediate Government/Credit Index) had relative returns of 6.81%, 2.86%, and 5.08% for the twelve, three, and six month periods, respectively. For the full year, the Fund equally performed with the benchmark index, but has underperformed over the second half of the year.
What is the fund’s investment approach?
The investment objective of the Monteagle Fixed Income Fund is total return. The Fund seeks to achieve its objective of total return through price appreciation, and interest income on the bonds and other securities held.
The Fund invests in investment grade intermediate term fixed income securities maintaining an average maturity of bonds and notes (on a dollar weighted basis) generally between 3 and 8 years. Securities purchased for the benefit of the fund are high quality; specifically at least rated Aa3 or higher by Moody’s Investors Service, Inc. or AA- or higher by Standard and Poor’s Ratings Group for municipal bonds and A3 or higher by Moody’s Investors Service, Inc. or A- or higher by Standard and Poor’s Ratings Group for corporate bonds. Under normal circumstances, the Fund will invest at least 80% of its assets in fixed income securities, including U.S. government securities, securities issued by agencies of the U.S government, mortgage-backed (and similar securities), taxable municipal bonds and corporate debt securities but no more than 70% in any one category.
The Fund’s portfolio is actively managed and based on an assessment of market conditions; the average maturity of the portfolio may be lengthened or shortened in an effort to maximize total return. Furthermore, the Fund’s portfolio holdings may vary across market sectors in order to maximize total return within the scope of permitted investments defined by the Fund’s prospectus. The Fund may achieve capital appreciation by owning bonds of longer duration (maturity) when interest rates are declining, and by owning bonds of shorter duration (maturity) when interest rates are rising; protecting against large capital depreciation. For this purpose, the Fund uses a proprietary “Bond Market Watch” model to evaluate macroeconomic indicators and, based on this evaluation, attempt to anticipate interest rate changes.
In addition, the Fund may achieve capital (price) appreciation if the credit quality of corporate and municipal bonds improves; making the associated scheduled interest payments more certain, thereby creating greater demand for such bonds. The Fund may also achieve increased interest income by purchasing bonds that have associated call options that are exercisable by the issuer of these securities. In exchange for issuing securities that gives the issuer the right to refund the par value prior to the stated maturity, the issuer must compensate potential buyers of these securities with higher interest payments. Based on management’s assessment of the value of the associated option inherent with these securities, the Fund may overweight its holdings of these securities, namely callable Government Agency bonds or mortgage-backed securities. These securities may be less sensitive to moderate increases or decreases in the general level of interest
MONTEAGLE FIXED INCOME FUND
A DISCUSSION OF FUND PERFORMANCE (Unaudited) (Continued)
rates. Therefore, the associated capital appreciation or depreciation of these securities may also be limited; helping to preserve capital.
What influenced the Fund’s performance?
During the 12 months ended August 31, 2009, the Fund improved on the 4.94% return realized the previous year. Over the past year the major factors contributing to fund performance and lower interest rates were:
| | • | The virtual collapse of global financial markets in September of 2008 caused a crisis of historic proportions that froze the credit markets, increased the need for liquidity, and created a near panic not seen since the depression era of the 1930’s. |
| | • | Easing of monetary policy from 2.00% on September 1, 2008 to a target of 0 to 0.5% as of August 31, 2009 (significant decreases in Fed Funds rate by the Federal Reserve Bank as). |
| | • | The direct injection of liquidity by the Federal Reserve Bank through various government guarantee programs designed to keep the Capital markets and the banking system functioning. |
| | • | The eventual stabilization of the banking system and the improved liquidity of the capital markets, which provided the much needed credit market, a source of funding without government guarantees. |
The events of September and October of 2008 will remain some of the most memorable for generations to come. During a span of time of less than two weeks, our financial markets had to deal with the de-facto nationalization of Fannie Mae and Freddie Mac, the failure of Lehman Brothers, the acquisition of Merrill Lynch by Bank of America on the same weekend that Lehman filed for bankruptcy, and an emergency line of credit ($85 billion) extended to American Insurance Group (AIG) in an effort to prevent more failures within the banking system.
Another contributing factor to the disruption of the credit and cash markets was the closing of the oldest Money Market fund; the Prime Reserve Money Market fund after its Net Asset Value fell below $1.00. This event led to the largest ever withdrawal of capital from the once thought safest and most liquid investments – Money Markets (the unintended event of the Lehman Brothers failure). This is an example of the “systemic” risks present in our capital markets. As a result of these events and the continued lack of confidence and trust within our financial markets, the extension of credit between banks, companies, municipalities, and consumers, … etc, had come to a virtual standstill.
In October 2008 the Federal Reserve lowered the Federal funds rate by a full percentage point from 2% to 1% in two incremental monetary policy actions (one emergency action in conjunction with the banks of Canada, England, the European Central Bank, Sweden, and the Swiss National Bank and the other at their scheduled meeting on October). The Fund’s performance in the 1st quarter was positive in spite of the crisis at hand. The Fund outperformed the benchmark index primarily due to being underweight in the financial sector of the corporate bond market. Performance was also positively influenced by the fund’s positions in government agency guaranteed Mortgage-backed securities (“MBS”).
MONTEAGLE FIXED INCOME FUND
A DISCUSSION OF FUND PERFORMANCE (Unaudited) (Continued)
By the end of December the Federal Reserve had lowered the Fed funds rate by another 0.75% and virtually maintained a target rate of 0 to 0.25% to continue injecting liquidity into the banking system. In the 2nd quarter, with short-term rates at close to zero, most bonds appreciated in value and the Fund’s performance was strong and outperformed the benchmark index once again. The Fund’s relative outperformance was partly attributable to slightly increasing the portfolio’s allocation to corporate bonds (that benefitted from a more stable environment for corporate credit) as well as agency guaranteed MBS, to provide both superior yield and credit quality in an increasingly challenging environment.
After two quarters of outperformance, the second half of the year was characterized by the “reawakening” of credit issuance and the increased demand for higher yielding corporate bonds of lesser investment grade quality. For the six months ending 8/31/2009 the benchmark index returns for the lowest quality investment grade bonds (BBB/Baa) were 18.05%1; almost 5% more than the next highest credit sector rated single A. The Fund’s higher quality portfolio was negatively affected by not having any significant exposure to the lowest investment grade category of intermediate bonds.
What is the Fund’s Strategy?
The Fund will continue to invest in high quality intermediate term fixed income securities generally between 2 and 10 years in maturity. The Fund will continue to monitor economic conditions through the use of a proprietary model in an attempt to anticipate interest rate changes and lengthen or shorten the duration of the Fund’s portfolio of securities to maximize total return with minimal risk. The Fund will also actively manage portfolio holdings across market sectors in order to maximize total return within the scope of permitted investments defined by the Fund’s prospectus. While we have taken prudent steps to diversify the Fund’s assets by limiting exposure to the credit risk associated with any one specific issuer or market sector, those risks cannot be completely eliminated without affecting long-term fund performance. We remain vigilant and will act in your best interest to preserve the fund’s asset values.
Past performance is not predictive of future performance. Investment results and principal value will fluctuate so that shares, when redeemed, may be worth more or less than their original cost. Current performance may be higher or lower than the performance data quoted. Performance data current to the most recent month-end, are available by calling 1-888-263-5593.
An investor should consider the investment objectives, risks, charges and expenses of the Fund carefully before investing. The Fund’s prospectus contains this and other important information. To obtain a copy of the Fund’s prospectus please call 1-888-263-5593 and a copy will be sent to you free of charge. Please read the prospectus carefully before you invest. The Fund is distributed by Matrix Capital Group, LLC.
The Discussion of Fund Performance seeks to describe some of the Sub-Adviser’s current opinions and views of the financial markets. Although the Sub-Adviser believes it has a reasonable basis for any opinions or views expressed, actual results may differ, sometimes significantly so, from those expected or expressed.
| 1 | Barclay’s Capital – U.S. Credit Index Group (U.S. Intermediate credit - Baa) total return from 2/27/2009 to 8/31/2009 |
MONTEAGLE FIXED INCOME FUND
PERFORMANCE — August 31, 2009 (Unaudited)
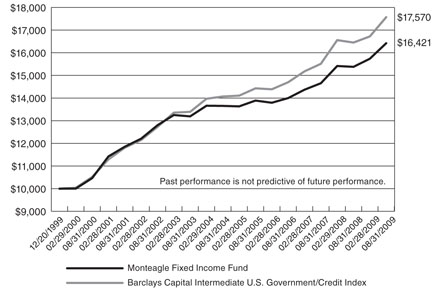
Comparison of the Change in Value of a $10,000 Investment in Monteagle Fixed Income and the Barclays Capital Intermediate U.S. Government/Credit Index
Average Annual Total Returns (for periods ended August 31, 2009) |
| | | | |
| | | | |
| Monteagle Fixed Income Fund | 6.80% | 3.76% | 5.25% |
| Barclays Capital Intermediate U.S. Government/Credit Index | 6.81% | 4.54% | 5.98% |
| | | | |
| (a) | Represents the period from the commencement of operations (December 20, 1999) through August 31, 2009. |
The performance information quoted in this annual report assumes the reinvestment of all dividend and capital gain distributions, if any, and represents past performance, which is not a guarantee of future results. The returns shown do not reflect taxes that a shareholder would pay on Fund distributions or on the redemption of Fund shares. The investment return and principal value of an investment will fluctuate and, therefore, an investor’s shares, when redeemed, may be worth more or less than their original cost.
The above graph depicts the performance of the Monteagle Fixed Income Fund versus the Barclays Capital Intermediate U.S. Government/Credit Bond Index (formerly Lehman Brothers U.S. Intermediate Government/Credit Index). The Barclays Capital Intermediate U.S. Government/Credit Bond Index measures the performance of dollar denominated U.S. Treasuries, government-related (i.e. U.S. and foreign agencies, sovereign, supranational and local authority debt), and investment grade credit structures that have a remaining maturity of greater than or equal to one year and less than ten years. Please note that indices do not take into account any fees and expenses of investing in the individual securities that they track, and individuals cannot invest directly in any index.
As with any fund, save an index fund, that commonly compares its performance to the Barclays Capital Intermediate U.S. Government/Credit Bond Index, such a comparison may be said to be inappropriate because of the dissimilarity between the Fund’s investments and the securities comprising the index; so too with the Monteagle Fixed Income Fund, which will not invest in certain securities comprising this index.
MONTEAGLE QUALITY GROWTH FUND
A DISCUSSION OF FUND PERFORMANCE (Unaudited)
How did the Fund perform?
For the twelve months ended August 31, 2009, the Fund reported a total return of -18.92 percent. The S&P 500 Index and the Russell 1000 Growth Index, the Fund’s two benchmarks, had total returns of -18.25 percent and -16.76 percent, respectively, for the same period. The Fund’s net asset value as of August 31, 2009 was $6.85 versus $8.46 as of August 31, 2008.
What is the Fund’s investment approach?
The Fund utilizes a growth style, investing in primarily domestic, high quality companies believed to have above-average sustainable and/or accelerating growth with an ability to exceed earnings expectations over time. The underlying belief is that high quality companies outperform over time with less risk. Various quality rankings and other metrics which demonstrate quality, including earnings consistency, are evaluated carefully before a stock is added to the portfolio. The Fund employs a proprietary screening process and bottom-up work to construct portfolios. However, portfolio constraints are established to ensure sufficient diversification by sector as well as by market capitalization. The underlying belief is that diversification provides for greater control of risk in the portfolio, while allowing freedom in individual stock selection. The screening process is designed to identify stocks with rising expectations, as the Fund looks to invest in securities whose growth potential is generally underestimated by the market. Holdings generally have a market capitalization of at least $2 billion, with about 65% to 75% of the portfolio in stocks of over $15 billion.
Compared to the S & P 500 Index, the portfolio will typically have a lower dividend yield, a higher price/earnings ratio and a higher expected earnings growth rate.
What influenced the Fund’s performance?
Over the course of the twelve months ending August 31, 2009, the equity market experienced a roller coaster ride that saw the period divided into two halves in stark contrast to each other. Negative pressures that had been weighing on equities since the latter half of 2007 intensified in late 2008 and culminated in a market drop of a magnitude not witnessed since the 1930s, during the dark days of the Great Depression. This current drop was triggered by a combination of failures within the U.S. financial system and the continued decline in economic activity, most notably related to employment and manufacturing. During this downturn, the U.S. government, along with governments around the world, acted aggressively to restore confidence in the financial system and to provide stimulus to the ailing economy. As investors gained renewed hope that the worst of the economic downturn was in the rearview mirror, there was a marked rotation back into risky assets. Stocks began a rally that has continued for six consecutive months through the end of August and has seen the S&P 500 advance by nearly 53% since marking a low on March 9, 2009.
Though the Fund held up relatively well compared to the benchmarks during the market downturn, this was unfortunately more than offset by the lag in relative performance during the market’s subsequent upswing. Consistent with past recoveries following major prolonged declines, leadership during the initial advance was decisively in favor of lower quality stocks, particularly those that had been the worst performing stocks during the market’s downturn. This presented a significant headwind given the Fund’s focus on high quality securities. Following the significant,
MONTEAGLE QUALITY GROWTH FUND
A DISCUSSION OF FUND PERFORMANCE (Unaudited) (Continued)
uninterrupted advance over the past several months, we expect more volatility in the market moving forward. This should play favorably for the high quality holdings in the Monteagle Quality Growth Fund, as the stocks of large, high quality companies tend to perform better than the broader market during periods of greater volatility, especially following periods where they have lagged relative to lower quality peers.
Over the course of the fiscal year, portfolio holdings continued to exhibit greater success at meeting or exceeding consensus earnings expectations relative to both the style benchmark and the broad market. Though portfolio holdings that exceeded expectations performed well on an absolute basis, current earnings delivery was not a dominant factor in the broader market and did not benefit portfolio relative performance during the market’s recovery. Given the magnitude of the rebound to date, we are confident that investors will soon turn more discriminating and the market’s focus will return to companies exhibiting strong fundamentals, particularly superior earnings delivery.
During the first six months of the fiscal year just ended, the stock market experienced a dramatic market sell-off triggered by a combination of financial systems crisis and continued deterioration in both economic indicators and corporate earnings outlooks. Most notable among these negative factors was the bankruptcy of Lehman Brothers and the government rescue of insurance giant American International Group. As the credit markets deteriorated and equity markets plunged, governments around the world stepped in aggressively in an effort to restore confidence in the financial systems as well as in an effort to breathe life into the flagging global economy. Despite these efforts, the market as measured by either the S&P 500 or Russell 1000 Growth indices declined nearly 40% for the six months ending February 28, 2009. This was the most dramatic equity market decline in over seventy years. All ten economic sectors experienced significant declines during this six month period. Consumer Staples and Health Care, two traditionally defensive sectors, held up the best while the largest declines were delivered by stocks within the economically sensitive Financials, Energy, and Industrials sectors.
For the six months ending February 28, 2009, the Fund’s portfolio outperformed when compared to both the Russell 1000 Growth and the S&P 500. During this period of economic deceleration, historic market volatility, and heightened investor fear, the high quality bias of the portfolio factored favorably into relative performance. However, relative to our expectations the positive impact was somewhat muted by the rather broad-based nature of the sell-off in equities, as the primary goal of investors appeared to be getting out of stocks completely rather than a more typical rotation from riskier to less-risky stock exposure. Strong earnings delivery relative to expectations from holdings across the portfolio was also a positive factor during this period though again somewhat muted due to the “sink all ships” impact resulting from the mass exodus of investors from the equity markets. Stock selection was a positive factor in seven of the nine economic sectors represented in the portfolio. Relative contribution was particularly favorable in the Energy, Industrials, Consumer Discretionary, Materials, and Consumer Staples sectors. The positive impact of stock selection in these sectors was somewhat offset by the underperformance of holdings within the Financials sector of the portfolio.
During this period, stocks that contributed most positively to relative returns were Burger King (fast food restaurants, down 13%), C R Bard (medical products, down 14%), and Alberto Culver
MONTEAGLE QUALITY GROWTH FUND
A DISCUSSION OF FUND PERFORMANCE (Unaudited) (Continued)
(beauty products, down 15%). Significant detractors from relative performance included financial holdings Bank of America (banking, down 87%), Prologis (industrial real estate, down 85%), and Janus Capital (asset management, down 84%).
The second half of the fiscal year started with a whimper as the stock market traded off meaningfully over the first nine days of March. However, initial hints of economic stabilization then triggered a sharp rebound in stock prices that not only carried throughout the month of March but also continued virtually uninterrupted over the following five month period. This steady advance was fueled not only by “less negative” economic readings but also by a return of confidence in the financial system and the favorable impact of aggressive cost-cutting on the part of corporations. Despite disappointing revenue trends, 1st and 2nd Quarter 2009 earnings reports came in broadly better than the street’s very pessimistic expectations. All told, the S&P 500 and Russell 1000 Growth indices advanced 53% and 48% respectively from the March 9th low to the end of August. Financials, by far the most beaten down sector during the previous six months, led stocks to the upside in the second half of the fiscal year. Information Technology and Industrials were the two next best performing sectors. Telecommunications, Health Care, and Consumer Staples, the defensive sectors that held up best during the downturn, lagged meaningfully during the market’s recovery.
For the six month period ending August 31, 2009, the Fund’s portfolio underperformed both the Russell 1000 Growth and the S&P 500. Historically, the Fund’s philosophy and investment process have not been favorable during periods punctuated by an increased appetite for risk, typically driven by macro factors and without regard to individual company fundamentals. Such an environment typically sees meaningful appreciation in lower quality stocks relative to high quality. During such periods, it has also been the case that positive estimate revision trends have been less likely to be a primary determinant of short term stock performance. This was exactly the case during the second half market rally as low quality stocks significantly outperformed high quality stocks such as those held in the Fund’s portfolio. Additionally, though portfolio holdings continued to exceed analysts’ expectations at a rate much higher than that of the broader market, the superior earnings delivery was not rewarded with superior relative performance. Due to these dynamics, stock selection was the primary factor behind relative underperformance. Though portfolio holdings within the Financials, Energy, and Materials sectors of the portfolio performed very well on a relative basis, this was more than offset by the underperformance of holdings in other sectors of the portfolio, particularly Consumer Discretionary and Health Care.
During this period, stocks that significantly contributed positively to returns were Bank of America (banking, up 350%), Janus Capital (asset management, up 190%), and Freeport McMoran (copper mining, up 107%). Significant negative contributors included Burger King (fast food restaurants, down 23%), GameStop (video game retailer, down 12%), and C R Bard (medical products, up 1%).
MONTEAGLE QUALITY GROWTH FUND
A DISCUSSION OF FUND PERFORMANCE (Unaudited) (Continued)
What is the Fund’s Strategy?
The Fund will continue to focus on maintaining a diversified portfolio of high quality companies delivering sustainable above-market earnings growth as well as companies poised to experience meaningful acceleration in earnings growth relative to expectations. The Fund’s adviser believes the companies that can exceed expectations in the form of positive earnings surprises will be well rewarded over coming quarters.
Past performance is not predictive of future performance. Investment results and principal value will fluctuate so that shares, when redeemed, may be worth more or less than their original cost. Current performance may be higher or lower than the performance data quoted. Performance data current to the most recent month-end, are available by calling 1-888-263-5593.
An investor should consider the investment objectives, risks, charges and expenses of the Fund carefully before investing. The Fund’s prospectus contains this and other important information. To obtain a copy of the Fund’s prospectus please call 1-888-263-5593 and a copy will be sent to you free of charge. Please read the prospectus carefully before you invest. The Fund is distributed by Matrix Capital Group, LLC.
The Discussion of Fund Performance seeks to describe some of the Sub-Adviser’s current opinions and views of the financial markets. Although the Sub-Adviser believes it has a reasonable basis for any opinions or views expressed, actual results may differ, sometimes significantly so, from those expected or expressed.
MONTEAGLE QUALITY GROWTH FUND
PERFORMANCE — August 31, 2009 (Unaudited)
Comparison of the Change in Value of a $10,000 Investment in Monteagle Quality Growth Fund, the S&P 500 Index and the Russell 1000 Growth Index
Average Annual Total Returns (for periods ended August 31, 2009) |
| | | | |
| | | | |
| Monteagle Quality Growth Fund | (18.92)% | (0.22)% | (2.07)% |
| S&P 500 Index | (18.25)% | 0.49% | (0.79)% |
| Russell 1000 Growth Index | (16.76)% | 1.21% | (3.17)% |
| | | | |
The performance information quoted in this annual report assumes the reinvestment of all dividend and capital gain distributions, if any, and represents past performance, which is not a guarantee of future results. The returns shown do not reflect taxes that a shareholder would pay on Fund distributions or on the redemption of Fund shares. The investment return and principal value of an investment will fluctuate and, therefore, an investor’s shares, when redeemed, may be worth more or less than their original cost.
The above graph depicts the performance of the Monteagle Quality Growth Fund versus the S&P 500 Index and the Russell 1000 Growth Index. The S&P 500 Index by Standard and Poor’s Corp. is a capitalization-weighted index comprising 500 issues listed on various exchanges, representing the performance of the stock market generally. The Russell 1000 Growth Index measures the performance of the large-cap growth segment of the U.S. equity universe. It includes those Russell 1000 companies with higher price-to-book ratios and higher forecasted growth values. Please note that indices do not take into account any fees and expenses of investing in the individual securities that they track, and individuals cannot invest directly in any index.
As with any fund, save an index fund, that commonly compares its performance to the S&P 500 Index and the Russell 1000 Growth Index, such a comparison may be said to be inappropriate because of the dissimilarity between the Fund’s investments and the securities comprising the indices; so too with the Monteagle Quality Growth Fund, which will not invest in certain securities comprising these indices.
MONTEAGLE LARGE CAP GROWTH FUND
A DISCUSSION OF FUND PERFORMANCE (Unaudited)
How did the Fund perform?
For the year ending August 31, 2009, the Fund reported a total return of -27.87%. The S&P 500 index reported a return of -18.25%, and the Russell 1000 Growth index reported a return of -16.76% during the same time frame.
What is the Fund’s investment approach?
The Fund’s investment philosophy is that high quality, growing companies outperform broad market indices over full market cycles. Companies are identified using a strict application of a combined quantitative and qualitative strategy. The quantitative strategy screens the universe of larger capitalization companies (over $5 billion market capitalization) for stable, above market earnings growth, above market return on equity and attractive relative valuation. Companies meeting the quantitative criteria are then further analyzed for the characteristics of high quality companies, including superiority in management, products, distribution, access to markets and business plan implementation. The Fund holds between 25 and 35 securities and holdings are diversified to include no more than 2 times the S&P 500’s weighting for any particular sector. Holdings are generally equally weighted, and are trimmed back when a position size exceeds 6% of the total portfolio.
What influenced the Fund’s performance?
The calendar year that encompassed August 2008 to August 2009 was a story of two entirely different markets. The first part, lasting from September 2008 until late February 2009 was one of the worst periods in stock market history. The period was characterized by a massive deleveraging of all financial assets that in turn led to a selling panic from which no stocks were immune. The S&P 500 fell 41.8% during this six month time span, and the Fund was down 39.4%.
However starting in March the market staged a remarkable rally. Unfortunately the rally has been characterized by strong returns in companies with negative earnings and dismal financial outlooks. A perfect example is government bailout recipient AIG who has lost a record $88.7 billion in the trailing 12 month period, yet has risen an astounding 440% since the beginning of March 2009.
On a year-to-date basis (1/1/09 to 9/15/09) the companies with the worst earnings in the S&P 500 have performed the best from a stock price standpoint, while the companies with the strongest earnings have performed the worst.
This divergence between stock price and earnings performance is displayed in the following chart
| | Net Inc Reported T4Q ($M) | | | |
| Top 100* | $4,003 | 15.3x | 18.3x | 19.0% |
| Next 100 | $795 | 15.1x | 18.9x | 26.2% |
| Next 100 | $356 | 17.6x | 19.6x | 27.3% |
| Next 100 | $122 | 23.1x | 24.2x | 41.5% |
| Bottom 100 | $(3,198) | 26.1x | 22.5x | 59.0% |
MONTEAGLE LARGE CAP GROWTH FUND
A DISCUSSION OF FUND PERFORMANCE (Unaudited) (Continued)
The 100 best companies in the S&P 500 by reported income, with an average income of $4 billion, are up 19% on average year-to-date. The 100 worst companies, with an average net loss of $3.2 billion, have gained nearly 60% year-to-date, or 40% ahead of the companies with the best reported income.
What is the Fund’s Strategy?
The Fund’s primary strategy has always been to focus on quality companies with the best long term growth prospects. This strategy has been successful in outperforming the stock market since our firm’s inception (1992), although there have been periods of underperformance.
Despite the poor relative performance of high quality companies in the past 2 years we continue to believe that their time is near. Simply put, a market that greatly rewards companies that are losing vast sums of money is not a market that has any long term sustainability. For example Ford Motor Company has seen its revenues decline by 33.5% over the previous 4 quarters, and has posted a loss of $5.3 billion over the same period. Yet in the recent rally Ford stock has gained 273% (since March 1st). On the other hand, a high quality firm like the biotechnology company Gilead (maker of antiviral drugs) has grown its revenues 27.5% on a reported income of $2.2 billion over the past 4 quarters, but during the recent rally the company’s stock is essentially flat. While we own Gilead, we would never own a company with a profitability profile as dismal as Ford’s, and we believe that the divergence in performance cannot persist.
While we are disappointed by the relative underperformance of quality stocks, we are not entirely discouraged. In the past, similar periods of strong performance by lower quality stocks have signaled the beginning of a new bull market. In the most recent example of 2003, our investment style lagged the S&P 500 and Russell Growth by more than 10% for that calendar year, not unlike this year. However as the rally matured our style outperformed the indices strongly in 2004 and 2005, outperforming the Russell Growth by a cumulative 17% those years, and the S&P 500 by 13%.
Another reason we believe the best times for quality companies lies ahead is current valuations. As can be seen in Chart 1 above, companies with the best net incomes are among the most reasonably priced at 15.3 times earnings, while the companies with the worst net income are highly priced at 26.1 times earnings. Moreover, when compared to their ten-year P/E averages, the high quality companies look relatively cheap, while the companies with net income losses look historically pricey. As stated before, we don’t think this can persist.
As always we will continue focus on investing in high quality companies with solid revenues and above market earnings growth. We are confident that, given the strong business positions of these companies and compelling historical valuations, strong stock price performance will follow.
Past performance is not predictive of future performance. Investment results and principal value will fluctuate so that shares, when redeemed, may be worth more or less than their original cost. Current performance may be higher or lower than the performance data quoted. Performance data current to the most recent month-end, are available by calling 1-888-263-5593.
MONTEAGLE LARGE CAP GROWTH FUND
A DISCUSSION OF FUND PERFORMANCE (Unaudited) (Continued)
An investor should consider the investment objectives, risks, charges and expenses of the Fund carefully before investing. The Fund’s prospectus contains this and other important information. To obtain a copy of the Fund’s prospectus please call 1-888-263-5593 and a copy will be sent to you free of charge. Please read the prospectus carefully before you invest. The Fund is distributed by Matrix Capital Group, LLC.
The Discussion of Fund Performance seeks to describe some of the Sub-Adviser’s current opinions and views of the financial markets. Although the Sub-Adviser believes it has a reasonable basis for any opinions or views expressed, actual results may differ, sometimes significantly so, from those expected or expressed.
MONTEAGLE LARGE CAP GROWTH FUND
PERFORMANCE — August 31, 2009 (Unaudited)
Comparison of the Change in Value of a $10,000 Investment in Monteagle Large Cap Growth Fund and the S&P 500 Index
Average Annual Total Returns (for periods ended August 31, 2009) |
| | | | |
| | | | |
| Monteagle Large Cap Growth Fund | (27.87)% | (3.56)% | (7.89)% |
| S&P 500 Index | (18.25)% | 0.49% | (1.87)% |
| | | | |
| (a) | Represents the period from the commencement of operations (January 18, 2000) through August 31, 2009. |
The performance information quoted in this annual report assumes the reinvestment of all dividend and capital gain distributions, if any, and represents past performance, which is not a guarantee of future results. The returns shown do not reflect taxes that a shareholder would pay on Fund distributions or on the redemption of Fund shares. The investment return and principal value of an investment will fluctuate and, therefore, an investor’s shares, when redeemed, may be worth more or less than their original cost.
The above graph depicts the performance of the Monteagle Large Cap Growth Fund versus the S&P 500 Index. The S&P 500 Index by Standard and Poor’s Corp. is a capitalization-weighted index comprising 500 issues listed on various exchanges, representing the performance of the stock market generally. Please note that indices do not take into account any fees and expenses of investing in the individual securities that they track, and individuals cannot invest directly in any index.
As with any fund, save an index fund, that commonly compares its performance to the S&P 500 Index, such a comparison may be said to be inappropriate because of the dissimilarity between the Fund’s investments and the securities comprising the index; so too with the Monteagle Large Cap Growth Fund, which will not invest in certain securities comprising this index.
MONTEAGLE SELECT VALUE FUND
A DISCUSSION OF FUND PERFORMANCE (Unaudited)
How did the Fund perform?
For the year ended August 31, 2009, the Monteagle Select Value Fund (“the Fund”) had a total return of -27.76%. The S&P 500 Index (“Index”) had a total return of -18.25% for the same period. The Fund’s net asset value per share as of August 31, 2009 is $8.30 versus $11.63 at August 31, 2008.
What is the Fund’s investment approach?
The Fund’s investment goal is long-term capital appreciation. The Fund uses a “value investing” style by investing under normal circumstances at least 80 percent of its assets in common stock of domestic companies believed to be under-priced relative to comparable securities determined by price-to-earnings ratios, cash flows or other measures. The Fund’s adviser predominately utilizes a reversion-to-the-mean strategy on stock selection in order to achieve its results rather than trying to time market fluctuations. The adviser limits the pool of stocks to consider for purchase to only those equities in the S&P 500 Index. In selecting stocks, the Fund’s adviser establishes valuation parameters by using relative ratios or target prices to evaluate companies on several levels. Additionally, the adviser will generally have the Fund hold between 40 and 60 equities and diversify its holdings across numerous industries, generally limiting issues in any one industry to five securities or unless more securities are needed for limiting specific dollar amounts per security or to over-weight a particular sector. The Fund seeks to maintain a minimum average weighted market capitalization of $5 billion.
Value stocks are broadly defined as equities which have a price-to-earnings ratio and a price-to-book ratio less than the relative market average with dividends tending to be higher than the relative market average. Also, value stocks tend to have a beta (a measure of the stocks price volatility relative to the overall market, i.e. the S&P 500) less than 1.0.
What influenced the Fund’s performance?
During the twelve months ended August 31, 2009, the Fund’s performance was affected by a global economic decline. The fear of an economic recession in the United States weighed on the markets as various domestic issues remained. The issues affecting the markets throughout the year are the domestic housing market decline, the uncertain stabilization of the financial markets, the lack of credit available for businesses and consumers and most significantly the continued increase in unemployment. During the period, the equity markets reached market lows that have not been seen for over twelve years basically removing a decades worth of growth from the markets. The Dow Jones Industrial Average began the year at its high point of 11,543.55 on August 29, 2008 declining to its low point of 6,547.05 on March 9, 2009 and recovering to the 9,496.20 level at August 31, 2009. The S&P 500 began the year at its high point of 1,282.83 on August 29, 2008 declining to its low point of 676.53 on March 9, 2009 and recovering to the 1020.62 level at August 31, 2009. During this period the Federal Open Markets Committee of the Federal Reserve continued lowering the Fed Funds rate to protect against a slowing economy and to generate liquidity for financial institutions dropping the target rate from 2.0% to 0.25%. These factors contributed to a market environment that proved difficult for the Fund given its focus of a “value style, reversion-to-the-mean” strategy which typically thrives in a growing economic
MONTEAGLE SELECT VALUE FUND
A DISCUSSION OF FUND PERFORMANCE (Unaudited) (Continued)
environment. The Fund compares its performance to the S&P 500 Index. The Fund is affected by its asset allocation weighting to the ten sectors of the Index.
For the quarter ended November 30, 2008, the Monteagle Select Value Fund (“Fund”) under-performed the S&P 500 Index (“Index”). The Fund experienced a -35.74% return versus a -29.64% return for the Index. The Fund continued to be heavily invested in equities which represent 86.1% of the assets with cash and money funds representing 13.9% of the assets. The large cash/money fund position was maintained as a type of defensive positions in expectation of further market declines, anticipated dividend distributions and the potential for liquidations by investors.
Many serious economic issues remained within the markets and economy. The financial sector continued to face significant challenges within the credit markets and the effects were beginning to spill over into the other sectors of the economy. The economic sectors of the S&P 500 that declined the most during the quarter were the Financial (-37.22%), Material (-30.91%), Information Technology (-27.21%), Consumer Discretion (-27.17%) and the Industrial (-25.09%) sectors. The Fund’s performance was negatively impacted by its holdings in these sectors during this quarter. The major indices were expected to remain volatile for the balance of 2008 and into 2009 as expectations of continued write-down of assets take place in the financial sector. Negative pressure on corporate earnings will increase as the individual consumer becomes more defensive in their spending habits. These challenges generated opportunities to average-into the holdings of the Fund under the Fund’s investment strategy.
As of the end of the quarter, the portfolio holdings were invested in all sectors of the Index except the Utility sector, with the largest allocations in the Information Technology (16.4%), Consumer Discretionary (15.8%), Cash and Money Markets (13.9%) and the Industrial (11.7%) sectors. The Fund’s portfolio performance was least negatively affected by stock picks in the Material sector (Bemis Co. down 3.09%), the Telecommunication sector (AT&T Corporation down 8.68%) and the Health Care sector (Schering-Plough down 13.35%). The Fund’s portfolio performance was most negatively affected by its stock picks in the Energy sector (Ashland Inc. down 74.89%), the Telecommunication sector (Sprint Nextel down 68.00%) and the Financial sector (CIT Group Inc. down 67.60%). During the quarter, five of the portfolio holdings were sold and a portion of the proceeds were reinvested in three new positions and eighteen existing securities. Additionally, as mentioned above, a short-term fixed income agency discount note matured during the quarter. The Fund continued to be allocated across all sectors of the Index, with the exception of the Utility sector. The Fund remained overweight in the Information Technology, Consumer Discretionary, Material, Energy and Industrial sectors as compared to the Index.
For the quarter ended February 28, 2009, the Monteagle Select Value Fund (“Fund”) out-performed the S&P 500 Index (“Index”). The Fund experienced a -16.55% return versus a -17.28% return for the Index. The Fund continued to be heavily invested in equities which represent 83.0% of the assets with cash and money funds representing 17.0% of the assets. The primary contributing factor increasing the percentage of cash and cash equivalents was the continued decline in the market value of the equity positions in the portfolio. Hence, in anticipation of further market declines, dividend distributions and potential liquidations by investors, a large cash/money fund position was maintained.
MONTEAGLE SELECT VALUE FUND
A DISCUSSION OF FUND PERFORMANCE (Unaudited) (Continued)
Many serious economic issues remained within the markets and economy. The financial sector continued to face significant challenges within the credit markets and the US Government involvement. The negative economic outlook concerns spilled over into the other sectors of the economy. The economic sectors of the S&P 500 that declined the most during the quarter were the Financial (-39.78%), Industrial (-26.84%), Energy (-18.20%) and Materials (-15.33%) sectors. The Fund’s performance was negatively impacted by its holdings in these sectors during this quarter. The major indices were expected to remain volatile throughout 2009 as expectations of continued write-downs of assets take place in the financial sector takes place. Quarterly earnings reports by companies were expected to be indicative of a recession and generate negative pressure on corporate equity prices in the stock market. These challenges continued to generate opportunities to average-into the holdings of the Fund under the Fund’s investment strategy.
As of the end of the quarter, the portfolio holdings were invested in all sectors of the Index except the Utility sector, with the largest allocations in Information Technology (18.0%), the Cash and Money Markets (17.0%), Consumer Discretionary (15.5%), and the Health Care (11.7%) sectors. The Fund’s negative portfolio performance was reduced by its stock picks in the Financial sector (Morgan Stanley up 32.47%), the Consumer Direction sector (Kohl’s Corp up 7.59%), the Telecommunications sector (Sprint Nextel up 17.92%), and the Consumer Staples sector (Whole Food Markets up 14.84%). The Fund’s portfolio performance was most negatively affected by its stock picks in the Financial sector (Bank of America down 75.69%), the Consumer Discretionary sector (Newell Rubbermaid down 56.82%), the Materials sector (Dow Chemical down 61.40%), and the Industrial sector (General Electric. down 50.44%). During the quarter, none of the portfolio holdings were sold nor were there any new purchases. The Fund continued to be allocated across all sectors of the Index, with the exception of the Utility sector.
For the third quarter ended May 31, 2009, the Monteagle Select Value Fund (“Fund”) under-performed the S&P 500 Index (“Index”). The Fund experienced a 22.55% return versus a 25.80% return for the Index. The Fund continued to be heavily invested in equities which represent 93.9% of the assets with cash and money funds representing 6.1% of the assets. The primary contributing factor for the decrease in the percentage of cash and cash equivalents was the investment in new equity positions in the portfolio at five different times during the quarter in anticipation of the beginning of a market recovery during the second half of 2009.
Continued fear and concern of a recession remain within the markets and economy. The financial sector continued to face significant challenges within the credit markets and the US Government involvement. The negative economic outlook concerns were continuing to weigh heavily on all sectors of the economy as the markets seem to be waiting for improving signs in housing starts and improvements in employment. Inflation fears were beginning to rise due to the economic stimulus added by the Fed and Treasury. Even though these concerns were evident, the markets improved during the quarter as valuations of companies were deemed very low and offered good opportunity for stock picking. The economic sectors of the S&P 500 that improved the most during the quarter were the Financial (38.17%), Material (21.48%), Industrial (20.85%) and Consumer Discretion (17.28%) sectors. The Fund’s performance was positively impacted by its holdings in these sectors during this quarter. The major indices were expected to remain volatile throughout
MONTEAGLE SELECT VALUE FUND
A DISCUSSION OF FUND PERFORMANCE (Unaudited) (Continued)
2009 as expectations of inflation and lower corporate earnings appear. The quarterly earnings reports by companies were expected to be indicative of a recession and generate negative pressure on corporate equity prices in the stock market. Again, these challenges generated opportunities to continue averaging-into the holdings of the Fund under the Fund’s investment strategy.
As of the end of the quarter, the portfolio holdings were invested in all sectors of the Index, with the largest allocations in Energy (19.4%), Information Technology (14.5%), Health Care (14.0%), and the Consumer Discretion (11.0%) sectors. The Fund’s positive portfolio performance was assisted by its stock picks in the Financial sector (CME Group up 76.3% and Morgan Stanley up 57.0%), the Consumer Direction sector (Starbucks Corp. up 57.3%), and the Consumer Staples sector (Whole Food Markets up 55.3%). The Fund’s portfolio performance was most negatively affected by its stock picks in the Financial sector (Bank of America down 18.7%) and the Materials sector (Alcoa Inc. down 11.4% and Allegheny Technology down 5.8%). During the quarter, many of the portfolio holdings were sold and many new equities were purchased to realign the portfolio in anticipation of a market recovery. The Fund continued to be allocated across all sectors of the Index.
For the fourth quarter ended August 31, 2009, the Monteagle Select Value Fund (“Fund”) under-performed the S&P 500 Index (“Index”) even though achieving a positive return. The Fund experienced a 9.93% return versus an 11.65% return for the Index. The portfolio continued to be heavily invested in equities which represent 95.2% of the assets with cash, money funds and accrued income representing 4.8% of the assets.
Uncertainty remained within the markets and economy as the financial crisis improved as the specter of inflation became ever more mindful. The financial sector continued with its challenges in the credit markets dealing with the US Government involvement through the Toxic Asset Relief Program (TARP) and the expectation of an unwinding of the government’s involvement of support. The economic outlook concerns were beginning to show signs of easing but the outlook continued to weigh on all sectors of the economy. The markets continued to wait for improved signs in housing starts and improvements in employment. Inflation became the focus of the markets as the monetary system seeks to deal with the huge amounts of economic stimulus added by the Fed and Treasury. Even though these concerns were evident, the equity markets continued their improvement during the quarter as reports of company earnings were showing signs of general improvement; however, top-line revenue growth will be the focus in coming quarters. Positive signs of revenue growth will be a positive barometer for signaling an economic recovery. The economic sectors of the S&P 500 that improved the most during the quarter were the Financials (up over 19%), Information Technology (up over 15%) and Consumer Discretionary (up over 13%) sectors. The Fund’s performance was positively impacted by its holdings in these sectors during this quarter; however, the Fund’s performance was negatively impacted by an overweight position in the Energy sector which performed basically flat during the period. The major indices are expected to remain volatile throughout 2009 as concern over unemployment continues and the expectation of inflation remains. These challenges generated opportunities for continued averaging-into the holdings of the Fund under the Fund’s investment strategy.
MONTEAGLE SELECT VALUE FUND
A DISCUSSION OF FUND PERFORMANCE (Unaudited) (Continued)
As of the end of the quarter, the portfolio holdings continued to be invested in all sectors of the Index, with the largest allocations in Energy (20.9%), Industrials (14.9%), Health Care (13.2%), and Materials (10.9%) sectors. The Fund’s positive portfolio performance was assisted by its stock picks in the Financial sector (Bank of America up 40.6%), the Consumer Staples sector (Whole Food Markets up 37.9%), the Information Technology sector (Cognizant Technology up 28.9%) and the Materials sector (Ashland Inc. up 28.7%). The Fund’s portfolio performance was most negatively affected by certain stock picks in the Energy sector (Hess Corporation down 20.1%, Tesoro Petroleum down 12.2% and Baker Hughes down 11.9%) and the Information Technology sector (MEMC Electronic down 14.5%). During the quarter, several of the portfolio holdings were reduced decreasing exposure to the Information Technology and Consumer Discretionary sectors while increasing exposure to the Industrials sector to realign the portfolio in anticipation of a market recovery. Also, investment was made in the majority of the holdings to dollar-cost-average into existing positions. The Fund continues to be allocated across all sectors of the Index.
What is the Fund’s strategy?
The Fund will continue to concentrate on equities contained in the S&P 500 Index which generally consist of large name brand corporations with good fundamentals and broad product diversification. The Fund’s adviser will continue to be disciplined in the use of its predominate strategy of reversion-to-the-mean by applying its “value investing” approach valuation model; thereby, allowing the market’s volatility to identify those securities that become under-valued and are poised to be the next performers in the market. Sector allocation in the Fund’s portfolio will primarily be determined by which companies are available for purchase under the reversion-to-the-mean selection criteria. It is anticipated that the Fund may hold higher levels of cash during extended periods of market uncertainty and will selectively invest the cash into equities identified by the primary investment strategy as opportunities present themselves or for dollar-cost-averaging into currently held positions. This strategy is executed with a long-term outlook and will have periods of under-performance and out-performance versus its Index. Therefore, the Fund’s daily performance can and will vary dependant upon current market conditions.
Past performance is not predictive of future performance. Investment results and principal value will fluctuate so that shares, when redeemed, may be worth more or less than their original cost. Current performance may be higher or lower than the performance data quoted. Performance data current to the most recent month-end, are available by calling 1-888-263-5593.
An investor should consider the investment objectives, risks, charges and expenses of the Fund carefully before investing. The Fund’s prospectus contains this and other important information. To obtain a copy of the Fund’s prospectus please call 1-888-263-5593 and a copy will be sent to you free of charge. Please read the prospectus carefully before you invest. The Fund is distributed by Matrix Capital Group, LLC.
The Discussion of Fund Performance seeks to describe some of the Sub-Adviser’s current opinions and views of the financial markets. Although the Sub-Adviser believes it has a reasonable basis for any opinions or views expressed, actual results may differ, sometimes significantly so, from those expected or expressed.
MONTEAGLE SELECT VALUE FUND
PERFORMANCE — August 31, 2009 (Unaudited)
Comparison of the Change in Value of a $10,000 Investment in Monteagle Select Value Fund and the S&P 500 Index
Average Annual Total Returns (for periods ended August 31, 2009) |
| | | | |
| | | | |
| Monteagle Select Value Fund | (27.76)% | (3.43)% | 1.90% |
| S&P 500 Index | (18.25)% | 0.49% | (0.79)% |
| | | | |
The performance information quoted in this annual report assumes the reinvestment of all dividend and capital gain distributions, if any, and represents past performance, which is not a guarantee of future results. The returns shown do not reflect taxes that a shareholder would pay on Fund distributions or on the redemption of Fund shares. The investment return and principal value of an investment will fluctuate and, therefore, an investor’s shares, when redeemed, may be worth more or less than their original cost.
The above graph depicts the performance of the Monteagle Select Value Fund versus the S&P 500 Index. The S&P 500 Index by Standard and Poor’s Corp. is a capitalization-weighted index comprising 500 issues listed on various exchanges, representing the performance of the stock market generally. Please note that indices do not take into account any fees and expenses of investing in the individual securities that they track, and individuals cannot invest directly in any index.
As with any fund, save an index fund, that commonly compares its performance to the S&P 500 Index, such a comparison may be said to be inappropriate because of the dissimilarity between the Fund’s investments and the securities comprising the index; so too with the Monteagle Select Value Fund, which will not invest in certain securities comprising this index.
MONTEAGLE VALUE FUND
A DISCUSSION OF FUND PERFORMANCE (Unaudited)
How did the Fund Perform?
For the year ended August 31, 2009, the Fund reported a total return of -25.19%. The S&P 500 Index and the Russell 2000 Value Index had returns of – 18.25% and -20.68%, respectively, for the same time period. The Fund’s net asset value per share as of August 31, 2009 was $12.34 versus $16.67 at August 31, 2008.
What is the Fund’s investment approach?
The Fund’s investment goal is to achieve long term growth of capital through investing in undervalued companies. The Fund determines value usually based on price-to-earnings ratios, but also reviews historical price to book value ratios, dividend yield and balance sheet quality in determining whether prospective investments are truly undervalued. The Fund’s advisor also makes industry determinations based on interest rate cycles. The Fund typically holds 30 to 40 equities. The Fund seeks to maintain a minimum average market capitalization of $5 billion. The current average market capitalization exceeds $39 billion. The current price to earnings ratio is 12.6 times 2010 earnings and currently yields 2.2 percent. The S&P 500 currently trades at 14.9 times 2010 earnings and yields 2.5%.
What influenced the Fund’s performance?
During the year ending August 31, 2009, the Fund underperformed the market due to falling commodity prices as a result of deflationary pressures brought upon the economy from weakness in housing prices and the related financial crisis caused by the failure of five large financial companies. Emergency measures by the U.S. Federal Reserve and the U.S. Treasury Department providing significant monetary growth and government stimulus funding has stemmed the deflationary forces caused by the worst housing recession the U.S. has ever experienced. Recessionary forces have affected all asset classes including energy and other raw materials. The quick response by the world central bankers has for the time being resulted in a significant market rebound since the March 9, 2009 lows.
Commercial lending has resumed as a result of these measures and normal interest rate relationships have been resumed. The U.S. housing market and labor markets remain very weak but recent data suggest the declines have lessened and that stabilization is being forecasted over the next twelve to eighteen months. Short-term interest rates remain low and Fed policy statements suggest interest rates to remain low for the next six months.
Subsequently, the stock market has rebounded well over 50% since March 9, 2009. History suggests the market is due for a respite and that investors who have record levels of cash on the sidelines are waiting for a correction before investing. Patient investors who chose to ride the financial storm out have been rewarded.
With significantly low short-term interest rates, the Fund remains in the economically sensitive issues. Prior to the market’s sell-off over the past twelve months, many of the Fund’s holdings had been repurchasing shares or reducing debt. More recently some of the Fund’s holdings have been active in issuing long term financing taking advantage of the lower interest rates.
MONTEAGLE VALUE FUND
A DISCUSSION OF FUND PERFORMANCE (Unaudited) (Continued)
What is the Fund’s current strategy?
The Fund continues to have significant exposure to the energy sector and has avoided many of the companies that obtained financing through the Government TARP plan. Under more normal economic conditions the Fund believes the long-term prospects for its holdings should benefit as the overall economy improves. The Fund believes the current monetary and fiscal policy should continue to weaken all major currencies and that inflationary forces will be predominant for the overall market. Interest rates will ultimately rise as a result.
Past performance is not predictive of future performance. Investment results and principal value will fluctuate so that shares, when redeemed, may be worth more or less than their original cost. Current performance may be higher or lower than the performance data quoted. Performance data current to the most recent month-end, are available by calling 1-888-263-5593.
An investor should consider the investment objectives, risks, charges and expenses of the Fund carefully before investing. The Fund’s prospectus contains this and other important information. To obtain a copy of the Fund’s prospectus please call 1-888-263-5593 and a copy will be sent to you free of charge. Please read the prospectus carefully before you invest. The Fund is distributed by Matrix Capital Group, LLC.
The Discussion of Fund Performance seeks to describe some of the Sub-Adviser’s current opinions and views of the financial markets. Although the Sub-Adviser believes it has a reasonable basis for any opinions or views expressed, actual results may differ, sometimes significantly so, from those expected or expressed.
MONTEAGLE VALUE FUND
PERFORMANCE — August 31, 2009 (Unaudited)
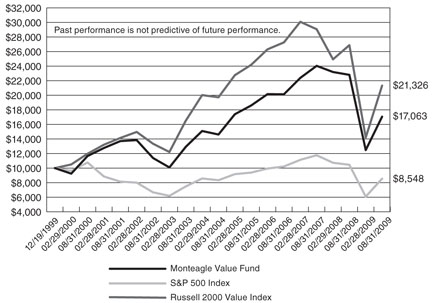
Comparison of the Change in Value of a $10,000 Investment in Monteagle Value Fund, the S&P 500 Index and the Russell 2000 Value Index
Average Annual Total Returns (for periods ended August 31, 2009) |
| | | | |
| | | | |
| Monteagle Value Fund | (25.19)% | 3.15% | 5.66% |
| S&P 500 Index | (18.25)% | 0.49% | (1.60)% |
| Russell 2000 Value Index | (20.68)% | 1.57% | 8.12% |
| | | | |
| (a) | Represents the period from the commencement of operations (December 19, 1999) through August 31, 2009. |
The performance information quoted in this annual report assumes the reinvestment of all dividend and capital gain distributions, if any, and represents past performance, which is not a guarantee of future results. The returns shown do not reflect taxes that a shareholder would pay on Fund distributions or on the redemption of Fund shares. The investment return and principal value of an investment will fluctuate and, therefore, an investor’s shares, when redeemed, may be worth more or less than their original cost.
The above graph depicts the performance of the Monteagle Value Fund versus the S&P 500 Index and the Russell 2000 Value Index. The S&P 500 Index by Standard and Poor’s Corp. is a capitalization-weighted index comprising 500 issues listed on various exchanges, representing the performance of the stock market generally. The Russell 2000 Value Index measures the performance of small-cap value segment of the U.S. equity universe. It includes those Russell 2000 companies with lower price-to-book ratios and lower forecasted growth values. Please note that indices do not take into account any fees and expenses of investing in the individual securities that they track, and individuals cannot invest directly in any index.
As with any fund, save an index fund, that commonly compares its performance to the S&P 500 Index and the Russell 2000 Value Index, such a comparison may be said to be inappropriate because of the dissimilarity between the Fund’s investments and the securities comprising the indices; so too with the Monteagle Value Fund, which will not invest in certain securities comprising these indices.
MONTEAGLE INFORMED INVESTOR GROWTH FUND
A DISCUSSION OF FUND PERFORMANCE (Unaudited)
How did the Fund perform?
For the twelve months ending August 31, 2009, the Fund reported a total return of +46.15% vs. -18.25% for the S&P 500 with dividends and -16.76% for the Russell 1000 Growth Index. Since inception from April 3, 2008 to August 31, 2009, the Fund had an annualized total return of +19.75% vs. -16.72% for the S&P 500 with dividends and - -13.77% for the Russell 1000 Growth Index.
What is the Fund’s Investment Approach?
The Fund’s primary investment approach is best characterized as growth equity-based, in which senior corporate management, or large outside investors are significant common stock owners or buyers, and/or, where the company itself is repurchasing its own shares on the open market. The Fund’s goal is to invest in these common stocks with demonstrated informed investor interest and ownership, as well as, solid earnings fundamentals. The Fund’s investment strategy begins with a careful detailed identification of Informed Investor ownership or buying interest. No stock is considered for research analysis unless it first meets this inviolable first-screen requirement. Stocks that do qualify are then analyzed for the quality and magnitude of past earnings growth, and more importantly, for the projected future stability of that past growth rate. Finally, the Fund’s strategy is to minimize losses within the broader framework of this basic philosophy.
What influenced the Fund’s performance?
In an effort to moderate the Fund’s volatility during the market turbulence of this past year, cash was used as a strategic asset. It had been determined, over the course of this year, that only a limited number of companies met the Informed Investors criteria for investment purposes. This, coupled with chaotic market conditions and a rapid decline in major indexes, led to a decision to utilize a portion of the Fund’s assets in ETFs (Exchange-Traded Funds) for an extended period of time. It was this asset allocation decision that enhanced the Fund’s performance during this past year ending August 31, 2009.
What is the Fund’s Strategy?
As of August 31, 2009, the portfolio manager sees some stability returning to the market and some companies to meet the investment criteria described above. In light of some uncertainty in the marketplace, the portfolio manager continues to utilize cash and ETFs to protect the Fund. The number of equity securities in the portfolio is expected to increase over time.
Past performance is not predictive of future performance. Investment results and principal value will fluctuate so that shares, when redeemed, may be worth more or less than their original cost. Current performance may be higher or lower than the performance data quoted. Performance data current to the most recent month-end, are available by calling 1-888-263-5593.
An investor should consider the investment objectives, risks, charges and expenses of the Fund carefully before investing. The Fund’s prospectus contains this and other important information. To obtain a copy of the Fund’s prospectus please call 1-888-263-5593 and a copy will be sent to you free of charge. Please read the prospectus carefully before you invest. The Fund is distributed by Matrix Capital Group, LLC.
MONTEAGLE INFORMED INVESTOR GROWTH FUND
A DISCUSSION OF FUND PERFORMANCE (Unaudited) (Continued)
The Discussion of Fund Performance seeks to describe some of the Sub-Adviser’s current opinions and views of the financial markets. Although the Sub-Adviser believes it has a reasonable basis for any opinions or views expressed, actual results may differ, sometimes significantly so, from those expected or expressed.
MONTEAGLE INFORMED INVESTOR GROWTH FUND
PERFORMANCE — August 31, 2009 (Unaudited)
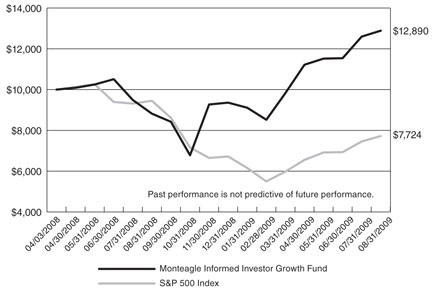
Comparison of the Change in Value of a $10,000 Investment in Monteagle Informed Investor Growth Fund and the S&P 500 Index
Average Annual Total Returns (for periods ended August 31, 2009) |
| | | |
| Monteagle Informed Investor Growth Fund | 46.15% | 19.75% |
| S&P 500 Index | (18.25)% | (16.72)% |
| | | |
| (a) | Represents the period from the commencement of operations (April 3, 2008) through August 31, 2009. |
The performance information quoted in this annual report assumes the reinvestment of all dividend and capital gain distributions, if any, and represents past performance, which is not a guarantee of future results. The returns shown do not reflect taxes that a shareholder would pay on Fund distributions or on the redemption of Fund shares. The investment return and principal value of an investment will fluctuate and, therefore, an investor’s shares, when redeemed, may be worth more or less than their original cost.
The above graph depicts the performance of the Monteagle Informed Investor Growth Fund versus the S&P 500 Index. The S&P 500 Index by Standard and Poor’s Corp. is a capitalization-weighted index comprising 500 issues listed on various exchanges, representing the performance of the stock market generally. Please note that indices do not take into account any fees and expenses of investing in the individual securities that they track, and individuals cannot invest directly in any index.
As with any fund, save an index fund, that commonly compares its performance to the S&P 500 Index, such a comparison may be said to be inappropriate because of the dissimilarity between the Fund’s investments and the securities comprising the index; so too with the Monteagle Informed Investor Growth Fund, which will not invest in certain securities comprising this index.
MONTEAGLE FIXED INCOME FUND
SUPPLEMENTARY PORTFOLIO INFORMATION — August 31, 2009 (Unaudited)
FUND PROFILE:
| Top Ten Long-Term Portfolio Holdings | (% of Net Assets) |
| FNMA, Pool 386008, 4.52%, due 04/01/2013 | 3.59% |
| GNMA, Series 2003-81 PB, 6.00%, due 03/20/2029 | 3.22% |
| U.S. Treasury Note, 3.625%, due 08/15/2019 | 3.17% |
| FHLMC, Series 3290 PD, 5.50%, due 03/15/2035 | 2.48% |
| U.S. Treasury Note, 3.75%, due 11/15/2018 | 2.40% |
| FHLMC, Series 2841 BY, 5.00%, due 08/15/2019 | 2.06% |
| Johnson & Johnson, 5.15%, due 07/15/2018 | 2.03% |
| General Dynamics Corp., 5.25%, due 02/01/2014 | 1.95% |
| FNMA, 5.55%, due 02/16/2017 | 1.90% |
| Estee Lauder Cos., 7.75%, due 11/01/13 | 1.76% |
| Sector Allocation | (% of Net Assets) |
| Corporate Bonds | 42.02% |
| U.S. Government and Agency Obligations | 30.30% |
| Mortgage-Backed Securities | 23.57% |
| Money Market Funds | 2.51% |
| Municipal Obligations | 0.72% |
| Other Assets in Excess of Liabilities | |
| | |
MONTEAGLE QUALITY GROWTH FUND
SUPPLEMENTARY PORTFOLIO INFORMATION — August 31, 2009 (Unaudited)
FUND PROFILE:
| Top Ten Long-Term Portfolio Holdings | (% of Net Assets) |
| Microsoft Corp. | 3.81% |
| International Business Machines Corp. | 3.07% |
| Wal-Mart Stores, Inc. | 2.72% |
| Apple, Inc. | 2.70% |
| Danaher Corp. | 2.53% |
| Cisco Systems, Inc. | 2.48% |
| QUALCOMM, Inc. | 2.47% |
| Hewlett-Packard Co. | 2.18% |
| Apache Corp. | 2.16% |
| CR Bard, Inc. | 2.12% |
| Top Ten Portfolio Industries | (% of Net Assets) |
| Computers | 9.47% |
| Retail | 8.30% |
| Software | 7.17% |
| Healthcare - Products | 7.07% |
| Telecommunications | 6.58% |
| Cosmetics & Personal Care | 4.02% |
| Miscellaneous Manufacturing | 4.01% |
| Pharmaceuticals | 3.99% |
| Oil & Gas | 3.88% |
| Diversified Financial Services | |
| | |
| Economic Sectors with Cash and Other Assets | (% of Net Assets) |
| Consumer, Non-cyclical | 27.06% |
| Technology | 19.84% |
| Industrials | 12.72% |
| Communications | 11.64% |
| Consumer, Cyclical | 9.40% |
| Financials | 6.30% |
| Energy | 6.13% |
| Basic Materials | 3.76% |
| Money Market Funds | 2.61% |
| Other Assets in Excess of Liabilities | |
| | |
MONTEAGLE LARGE CAP GROWTH FUND
SUPPLEMENTARY PORTFOLIO INFORMATION — August 31, 2009 (Unaudited)
FUND PROFILE:
| Top Ten Long-Term Portfolio Holdings | (% of Net Assets) |
| Apple, Inc. | 5.29% |
| Cognizant Technology Solutions Corp. | 4.35% |
| Google, Inc. | 4.29% |
| Oracle Corp. | 4.21% |
| Fluor Corp. | 4.17% |
| Visa, Inc. Class A | 4.11% |
| Gilead Sciences, Inc. | 3.99% |
| International Business Machines Corp. | 3.94% |
| Wal-Mart Stores, Inc. | 3.62% |
| Hewlett-Packard Co. | 3.51% |
| Top Ten Portfolio Industries | (% of Net Assets) |
| Computers | 17.09% |
| Retail | 9.67% |
| Internet | 9.22% |
| Banks | 7.42% |
| Biotechnology | 7.36% |
| Software | 7.14% |
| Pharmaceuticals | 6.95% |
| Engineering & Construction | 5.97% |
| Oil & Gas | 5.96% |
| Chemicals | |
| | |
| Economic Sectors with Cash and Other Assets | (% of Net Assets) |
| Technology | 24.24% |
| Consumer, Non-cyclical | 18.42% |
| Consumer, Cyclical | 12.65% |
| Financials | 12.63% |
| Industrials | 9.45% |
| Communications | 9.22% |
| Energy | 7.13% |
| Basic Materials | 4.37% |
| Other Assets in Excess of Liabilities | |
| | |
MONTEAGLE SELECT VALUE FUND
SUPPLEMENTARY PORTFOLIO INFORMATION — August 31, 2009 (Unaudited)
FUND PROFILE:
| Top Ten Long-Term Portfolio Holdings | (% of Net Assets) |
| Applied Materials, Inc. | 3.56% |
| Target Corp. | 3.46% |
| WellPoint, Inc. | 3.19% |
| UnitedHealth Group, Inc. | 2.75% |
| Pfizer, Inc. | 2.71% |
| PACCAR, Inc. | 2.59% |
| Transocean Ltd. | 2.20% |
| Morgan Stanley | 2.06% |
| United States Steel Corp. | 1.58% |
| Bank of America Corp. | 1.57% |
| Top Ten Portfolio Industries | (% of Net Assets) |
| Oil & Gas | 13.26% |
| Semiconductors | 7.22% |
| Banks | 6.35% |
| Retail | 6.07% |
| Healthcare - Services | 5.94% |
| Pharmaceuticals | 5.44% |
| Oil & Gas - Services | 4.96% |
| Mining | 4.06% |
| Chemicals | 3.06% |
| Diversified Financial Services | |
| | |
| Economic Sectors with Cash and Other Assets | (% of Net Assets) |
| Energy | 19.40% |
| Consumer, Non-cyclical | 15.96% |
| Industrials | 14.99% |
| Financials | 11.98% |
| Consumer, Cyclical | 10.12% |
| Basic Materials | 9.76% |
| Technology | 8.77% |
| Money Market Funds | 4.76% |
| Communications | 2.82% |
| Utilities | 1.36% |
| Other Assets in Excess of Liabilities | |
| | |
MONTEAGLE VALUE FUND
SUPPLEMENTARY PORTFOLIO INFORMATION — August 31, 2009 (Unaudited)
FUND PROFILE:
| Top Ten Long-Term Portfolio Holdings | (% of Net Assets) |
| Tidewater, Inc. | 6.64% |
| Barrick Gold Corp. | 6.36% |
| Goodrich Corp. | 6.06% |
| Halliburton Co. | 5.91% |
| Transocean Ltd. | 5.83% |
| Schering-Plough Corp. | 5.78% |
| Newmont Mining Corp. | 5.30% |
| Gap, Inc. | 4.90% |
| Eastman Chemical Co. | 3.82% |
| AT&T, Inc. | 3.82% |
| Top Ten Portfolio Industries | (% of Net Assets) |
| Mining | 13.60% |
| Pharmaceuticals | 11.08% |
| Transportation | 9.76% |
| Oil & Gas | 9.45% |
| Chemicals | 7.28% |
| Retail | 7.22% |
| Telecommunications | 6.55% |
| Aerospace & Defense | 6.06% |
| Oil & Gas - Services | 5.91% |
| Semiconductors | |
| | |
| Economic Sectors with Cash and Other Assets | (% of Net Assets) |
| Basic Materials | 20.88% |
| Industrials | 19.49% |
| Energy | 15.36% |
| Consumer, Non-cyclical | 11.08% |
| Communications | 8.34% |
| Technology | 7.42% |
| Consumer, Cyclical | 7.22% |
| Money Market Funds | 7.18% |
| Utilities | 2.90% |
| Other Assets in Excess of Liabilities | |
| | |
MONTEAGLE INFORMED INVESTOR GROWTH FUNDSUPPLEMENTARY PORTFOLIO INFORMATION — August 31, 2009 (Unaudited)
FUND PROFILE:
| Top Ten Long-Term Portfolio Holdings | (% of Net Assets) |
| ProShares Ultra QQQ | 9.87% |
| ProShares Ultra Russell 200 | 8.63% |
| ProShares Ultra S&P 500 | 6.79% |
| International Paper Co. | 5.08% |
| Sepracor, Inc. | 4.98% |
| Atwood Oceanics, Inc. | 4.88% |
| Priceline.com, Inc. | 4.73% |
| Western Digital Corp. | 4.64% |
| Eastman Chemical Co. | 4.52% |
| NGR Energy, Inc. | 4.27% |
| Top Ten Portfolio Industries | (% of Net Assets) |
| Internet | 9.75% |
| Computers | 9.48% |
| Forest Products & Paper | 7.05% |
| Packaging & Containers | 6.42% |
| Pharmaceuticals | 6.21% |
| Oil & Gas | 4.88% |
| Chemicals | 4.52% |
| Electric | 4.27% |
| Beverages | 3.08% |
| Telecommunications | |
| | |
| Economic Sectors with Cash and Other Assets | (% of Net Assets) |
| Exchange-Traded Funds | 25.30% |
| Money Market Funds | 12.87% |
| Communications | 12.79% |
| Technology | 11.22% |
| Consumer, Non-cyclical | 10.22% |
| Basic Materials | 9.60% |
| Industrials | 8.38% |
| Energy | 4.88% |
| Utilities | 4.27% |
| Consumer, Cyclical | 3.89% |
| Liabilities in Excess of Other Assets | |
| | |
MONTEAGLE FIXED INCOME FUND
SCHEDULE OF INVESTMENTS — August 31, 2009
| | | | | | |
| Par Value | | U.S. GOVERNMENT AND AGENCY OBLIGATIONS - 30.30% | | Value | |
| | | U.S. Treasury Notes - 5.57% | | | |
| $ | 1,000,000 | | 3.625%, due 08/15/2019 | | $ | 1,019,063 | |
| | 750,000 | | 3.75%, due 11/15/2018 | | | 770,391 | |
| | | | | | | 1,789,454 | |
| | | | Federal Farm Credit Bank - 2.48% | | | | |
| | 530,000 | | 3.23%, due 07/14/2014 | | | 527,008 | |
| | 250,000 | | 5.375%, due 07/18/2011 | | | 269,494 | |
| | | | | | | 796,502 | |
| | | | Federal Home Loan Bank - 11.54% | | | | |
| | 250,000 | | 5.00%, due 09/03/2015 | | | 256,888 | |
| | 500,000 | | 5.05%, due 01/03/2018 | | | 527,612 | |
| | 250,000 | | 5.125%, due 08/14/2013 | | | 276,719 | |
| | 500,000 | | 5.25%, due 06/18/2014 | | | 558,619 | |
| | 500,000 | | 5.25%, due 11/08/2017 | | | 521,803 | |
| | 250,000 | | 5.50%, due 08/25/2014 | | | 261,322 | |
| | 500,000 | | 5.50%, due 10/19/2016 | | | 503,224 | |
| | 250,000 | | 5.75%, due 05/15/2012 | | | 277,227 | |
| | 500,000 | | 6.00%, due 07/27/2017 | | | 521,883 | |
| | | | | | | 3,705,297 | |
| | | | Federal Home Loan Mortgage Corporation - 2.96% | | | | |
| | 500,000 | | 5.625%, due 03/15/2011 | | | 536,228 | |
| | 400,000 | | 7.00%, due 03/15/2010 | | | 414,289 | |
| | | | | | | 950,517 | |
| | | | Federal National Mortgage Association - 7.75% | | | | |
| | 500,000 | | 5.00%, due 03/02/2015 | | | 547,851 | |
| | 250,000 | | 5.00%, due 08/02/2012 | | | 272,862 | |
| | 500,000 | | 5.00%, due 08/02/2012 | | | 545,725 | |
| | 600,000 | | 5.55%, due 02/16/2017 | | | 610,904 | |
| | 500,000 | | 7.25%, due 01/15/2010 | | | 513,291 | |
| | | | | | | 2,490,633 | |
| | | | Total U.S. Government and Agency Obligations (Cost $9,365,434) | | | 9,732,403 | |
| | | | | | |
| Par Value | | CORPORATE BONDS - 42.02% | | Value | |
| | | Aerospace & Defense - 3.65% | | | |
| $ | 575,000 | | General Dynamics Corp., 5.25%, due 02/01/2014 | | $ | 626,949 | |
| | 500,000 | | United Technologies Corp., 5.375%, due 12/15/2017 | | | 545,383 | |
| | | | | | | 1,172,332 | |
The accompanying notes are an integral part of the financial statements.
MONTEAGLE FIXED INCOME FUNDSCHEDULE OF INVESTMENTS — August 31, 2009 (Continued)
| | | | | | |
| Par Value | | CORPORATE BONDS - 42.02% (Continued) | | Value | |
| | | Banks - 8.80% | | | |
| $ | 500,000 | | Bank of America Corp., 4.875%, due 01/15/13 | | $ | 505,609 | |
| | 500,000 | | Goldman Sachs Group, Inc., 5.95%, due 01/18/2018 | | | 521,361 | |
| | 500,000 | | JPMorgan Chase & Co., 6.00%, due 01/15/2018 | | | 538,235 | |
| | 200,000 | | Morgan Stanley, 6.60% due 04/01/2012 | | | 217,447 | |
| | 250,000 | | State Street Corp., 4.30%, due 05/30/2014 | | | 262,391 | |
| | 500,000 | | SunTrust Bank, 6.375%, due 04/01/2011 | | | 517,381 | |
| | 250,000 | | Wells Fargo & Co., 5.25%, due 10/23/2012 | | | 265,808 | |
| | | | | | | 2,828,232 | |
| | | | Beverages - 4.33% | | | | |
| | 300,000 | | Anheuser-Busch Cos., Inc., 6.00%, due 04/15/2011 | | | 315,806 | |
| | 500,000 | | Bottling Group, LLC, 4.625%, due 11/15/2012 | | | 539,395 | |
| | 500,000 | | Coca-Cola Co., 5.75%, due 03/15/2011 | | | 534,543 | |
| | | | | | | 1,389,744 | |
| | | | Biotechnology - 0.84% | | | | |
| | 250,000 | | Amgen, Inc., 4.85%, due 11/18/2014 | | | 270,207 | |
| | | | | | | | |
| | | | Computers - 1.23% | | | | |
| | 350,000 | | Hewlett-Packard Co., 6.125%, due 03/01/2014 | | | 393,866 | |
| | | | | | | | |
| | | | Cosmetics & Personal Products - 1.76% | | | | |
| | 500,000 | | Estee Lauder Cos., Inc., 7.75%, due 11/01/2013(b) | | | 566,773 | |
| | | | | | | | |
| | | | Diversified Financial Services - 2.52% | | | | |
| | 250,000 | | BP Capital Markets, PLC, 4.75%, due 03/10/2019 | | | 261,577 | |
| | 500,000 | | CME Group, Inc., 5.75%, due 02/15/2014 | | | 547,016 | |
| | | | | | | 808,593 | |
| | | | Electrical Components - 0.83% | | | | |
| | 250,000 | | Emerson Electric Co., 5.125%, due 12/01/2016(b) | | | 265,208 | |
| | | | | | | | |
| | | | Food - 2.17% | | | | |
| | 250,000 | | Campbell Soup Co., 6.75%, due 02/15/2011 | | | 269,803 | |
| | 400,000 | | McCormick & Co., Inc., 5.25%, due 09/01/2013(b) | | | 428,114 | |
| | | | | | | 697,917 | |
| | | | Healthcare - Products - 2.03% | | | | |
| | 600,000 | | Johnson & Johnson, 5.15%, due 07/15/2018 | | | 652,220 | |
| | | | | | | | |
| | | | Healthcare - Services - 0.80% | | | | |
| | 250,000 | | UnitedHealth Group, Inc., 5.00%, due 08/15/2014 | | | 256,657 | |
The accompanying notes are an integral part of the financial statements.
MONTEAGLE FIXED INCOME FUNDSCHEDULE OF INVESTMENTS — August 31, 2009 (Continued)
| | | | | | |
| Par Value | | CORPORATE BONDS - 42.02% (Continued) | | Value | |
| | | Household Products - 0.83% | | | |
| $ | 250,000 | | Kimberly-Clark Corp., 5.00%, due 08/15/2013 | | $ | 265,804 | |
| | | | | | | | |
| | | | Mining - 1.58% | | | | |
| | 500,000 | | Alcoa, Inc., 5.375%, due 01/15/2013 | | | 507,717 | |
| | | | | | | | |
| | | | Miscellaneous Manufacturing - 1.59% | | | | |
| | 500,000 | | General Electric Co., 5.25%, due 12/06/2017 | | | 511,341 | |
| | | | | | | | |
| | | | Office & Business Equipment - 0.83% | | | | |
| | 250,000 | | Pitney Bowes, Inc., 5.75%, due 09/15/17(b) | | | 266,960 | |
| | | | | | | | |
| | | | Oil & Gas - 2.52% | | | | |
| | 250,000 | | ConocoPhillips Australia Funding Co., 5.50%, due 04/15/2013 | | | 269,873 | |
| | 500,000 | | Shell International Finance, 5.625%, due 06/27/2011(b) | | | 540,905 | |
| | | | | | | 810,778 | |
| | | | Pharmaceuticals - 2.55% | | | | |
| | 250,000 | | Abbott Laboratories, 5.15%, due 11/30/2012 | | | 273,973 | |
| | 500,000 | | GlaxoSmithKline Capital, Inc., 5.65%, due 05/15/2018 | | | 546,438 | |
| | | | | | | 820,411 | |
| | | | Retail - 0.85% | | | | |
| | 250,000 | | Lowe's Cos., Inc., 5.60%, due 09/15/2012 | | | 274,158 | |
| | | | | | | | |
| | | | Software - 1.64% | | | | |
| | 500,000 | | Oracle Corp., 5.00%, due 01/15/2011 | | | 525,123 | |
| | | | | | | | |
| | | | Telecommunications - 0.67% | | | | |
| | 200,000 | | SBC Communications, Inc., 5.625%, due 06/15/2016 | | | 216,339 | |
| | | | | | | | |
| | | | Total Corporate Bonds (Cost $12,783,544) | | | 13,500,380 | |
| | | | | | |
| Par Value | | MORTGAGE-BACKED SECURITIES - 23.57% | | Value | |
| | | Federal Home Loan Mortgage Corporation - 7.49% | | | |
| $ | 181,110 | | Series 15L, 7.00%, due 07/25/2023 | | $ | 195,462 | |
| | 284,022 | | Series 2743 CA, 5.00%, due 02/15/2034 | | | 287,163 | |
| | 305,843 | | Series 2840 VC, 5.00%, due 08/15/2015 | | | 324,881 | |
| | 629,686 | | Series 2841 BY, 5.00%, due 08/15/2019 | | | 662,845 | |
| | 134,799 | | Series 3058 WV, 5.50%, due 10/15/2035 | | | 139,548 | |
| | 750,000 | | Series 3290 PD, 5.50%, due 3/15/2035 | | | 797,555 | |
| | | | | | | 2,407,454 | |
The accompanying notes are an integral part of the financial statements.
MONTEAGLE FIXED INCOME FUND
SCHEDULE OF INVESTMENTS — August 31, 2009 (Continued)
| | | | | | |
| Par Value | | MORTGAGE-BACKED SECURITIES - 23.57% (Continued) | | Value | |
| | | Federal National Mortgage Association - 10.02% | | | |
| $ | 1,100,000 | | Pool 386008, 4.52%, due 04/01/2013 | | $ | 1,152,334 | |
| | 347,517 | | Pool 545759, 6.50%, due 07/01/2032 | | | 375,122 | |
| | 186,787 | | Pool 725421, 7.00%, due 09/01/2017 | | | 201,947 | |
| | 143,961 | | Pool 754289, 6.00%, due 11/01/2033 | | | 152,838 | |
| | 509,875 | | Pool 882684, 6.00%, due 06/01/2036 | | | 538,446 | |
| | 300,000 | | Series 2003-54-PG, 5.50%, due 09/25/2032 | | | 316,216 | |
| | 453,273 | | Series 2007-40-PT, 5.50%, due 05/25/2037 | | | 481,947 | |
| | | | | | | 3,218,850 | |
| | | | Government National Mortgage Association - 6.06% | | | | |
| | 154,656 | | Pool 476998, 6.50%, due 07/15/2029 | | | 167,403 | |
| | 235,173 | | Pool 648337, 5.00%, due 10/15/2020 | | | 248,960 | |
| | 468,339 | | Pool 676516, 6.00%, due 02/15/2038 | | | 494,693 | |
| | 1,000,000 | | Series 2003-81 PB, 6.00%, due 03/20/2029 | | | 1,034,873 | |
| | | | | | | 1,945,929 | |
| | | | | | | | |
| | | | Total Mortgage-Backed Securities (Cost $7,324,486) | | | 7,572,233 | |
| | | | | | |
| Par Value | | MUNICIPAL OBLIGATIONS - 0.72% | | Value | |
| $ | 230,000 | | Atlanta & Fulton County Recreation Authority Revenue, 6.625%, due 12/01/2011 (Cost $230,107) | | $ | 232,109 | |
| | | | | | |
| Shares | | MONEY MARKET FUND - 2.51% | | Value | |
| | 806,833 | | Fidelity Institutional Money Market Fund Class I, 0.51%(a) (Cost $806,833) | | $ | 806,833 | |
| | | | | | | | |
| | | | Total Investments at Value - 99.12% (Cost $30,510,404) | | | 31,843,958 | |
| | | | | | | | |
| | | | Other Assets in Excess of Liabilities - 0.88% | | | 281,248 | |
| | | | | | | | |
| | | | Net Assets - 100.00% | | $ | 32,125,206 | |
| (a) | Rate shown represents the rate at August 31, 2009, is subject to change and resets daily. |
| (b) | This security is categorized as a level 2 security; for additional information and description of the levels, refer to the table included in Note 2 in the accompanying notes to the financial statements. |
The accompanying notes are an integral part of the financial statements.
MONTEAGLE QUALITY GROWTH FUND
SCHEDULE OF INVESTMENTS — August 31, 2009
| | | | | | |
| Shares | | COMMON STOCKS - 96.85% | | Value | |
| | | Aerospace & Defense - 0.96% | | | |
| | 1,815 | | United Technologies Corp. | | $ | 107,738 | |
| | | | | | | | |
| | | | Apparel - 1.10% | | | | |
| | 2,225 | | NIKE, Inc. - Class B | | | 123,243 | |
| | | | | | | | |
| | | | Banks - 1.80% | | | | |
| | 5,910 | | Bank of America Corp. | | | 103,957 | |
| | 2,235 | | JPMorgan Chase & Co. | | | 97,133 | |
| | | | | | | 201,090 | |
| | | | Beverages - 3.74% | | | | |
| | 3,995 | | Coca-Cola Co. | | | 194,836 | |
| | 3,945 | | PepsiCo, Inc. | | | 223,563 | |
| | | | | | | 418,399 | |
| | | | Biotechnology - 2.87% | | | | |
| | 2,345 | | Amgen, Inc.(a) | | | 140,090 | |
| | 4,029 | | Gilead Sciences, Inc.(a) | | | 181,547 | |
| | | | | | | 321,637 | |
| | | | Chemicals - 3.13% | | | | |
| | 2,080 | | Air Products & Chemicals, Inc. | | | 156,062 | |
| | 2,320 | | Monsanto Co. | | | 194,602 | |
| | | | | | | 350,664 | |
| | | | Coal - 0.97% | | | | |
| | 3,320 | | Peabody Energy Corp. | | | 108,498 | |
| | | | | | | | |
| | | | Commercial Services - 3.39% | | | | |
| | 8,320 | | H&R Block, Inc. | | | 143,770 | |
| | 1,700 | | Visa, Inc. Class A | | | 120,870 | |
| | 6,360 | | Western Union Co. | | | 114,734 | |
| | | | | | | 379,374 | |
| | | | Computers - 9.47% | | | | |
| | 1,800 | | Apple, Inc.(a) | | | 302,778 | |
| | 3,050 | | Cognizant Technology Solutions Corp. - Class A(a) | | | 106,384 | |
| | 4,030 | | Dell, Inc.(a) | | | 63,795 | |
| | 5,425 | | Hewlett-Packard Co. | | | 243,528 | |
| | 2,915 | | International Business Machines Corp. | | | 344,116 | |
| | | | | | | 1,060,601 | |
The accompanying notes are an integral part of the financial statements.
MONTEAGLE QUALITY GROWTH FUND
SCHEDULE OF INVESTMENTS — August 31, 2009 (Continued)
| | | | | | |
| Shares | | COMMON STOCKS - 96.85% (Continued) | | Value | |
| | | Cosmetics & Personal Care - 4.02% | | | |
| | 4,115 | | Alberto-Culver Co. | | $ | 108,595 | |
| | 1,525 | | Colgate-Palmolive Co. | | | 110,867 | |
| | 4,265 | | Procter & Gamble Co. | | | 230,779 | |
| | | | | | | 450,241 | |
| | | | Diversified Financial Services - 3.85% | | | | |
| | 6,150 | | Charles Schwab Corp. | | | 111,069 | |
| | 1,730 | | Intercontinental Exchange, Inc.(a) | | | 162,274 | |
| | 12,425 | | Janus Capital Group, Inc. | | | 158,046 | |
| | | | | | | 431,389 | |
| | | | Electronics - 1.35% | | | | |
| | 4,335 | | Amphenol Corp. - Class A | | | 151,552 | |
| | | | | | | | |
| | | | Engineering & Construction - 0.44% | | | | |
| | 1,810 | | Aecom Technology Corp.(a) | | | 49,612 | |
| | | | | | | | |
| | | | Environmental Control - 0.69% | | | | |
| | 1,550 | | Stericycle, Inc.(a) | | | 76,756 | |
| | | | | | | | |
| | | | Food - 1.99% | | | | |
| | 3,425 | | McCormick & Co., Inc. | | | 111,552 | |
| | 4,360 | | Sysco Corp. | | | 111,136 | |
| | | | | | | 222,688 | |
| | | | Healthcare - Products - 7.07% | | | | |
| | 1,875 | | Baxter International, Inc. | | | 106,725 | |
| | 2,950 | | CR Bard, Inc. | | | 237,711 | |
| | 3,200 | | Johnson & Johnson | | | 193,408 | |
| | 2,600 | | Medtronic, Inc. | | | 99,580 | |
| | 1,900 | | St. Jude Medical, Inc.(a) | | | 73,226 | |
| | 1,305 | | Techne Corp. | | | 80,479 | |
| | | | | | | 791,129 | |
| | | | Internet - 2.08% | | | | |
| | 505 | | Google, Inc. - Class A(a) | | | 233,143 | |
| | | | | | | | |
| | | | Machinery - Diversified - 2.45% | | | | |
| | 2,510 | | Deere & Co. | | | 109,436 | |
| | 3,480 | | Roper Industries, Inc. | | | 164,882 | |
| | | | | | | 274,318 | |
The accompanying notes are an integral part of the financial statements.
MONTEAGLE QUALITY GROWTH FUND
SCHEDULE OF INVESTMENTS — August 31, 2009 (Continued)
| | | | | | |
| Shares | | COMMON STOCKS - 96.85% (Continued) | | Value | |
| | | Media - 2.98% | | | |
| | 6,080 | | DIRECTV Group, Inc.(a) | | $ | 150,541 | |
| | 7,020 | | Walt Disney Co. | | | 182,801 | |
| | | | | | | 333,342 | |
| | | | Metal Fabricate & Hardware - 1.57% | | | | |
| | 1,925 | | Precision Castparts Corp. | | | 175,714 | |
| | | | | | | | |
| | | | Mining - 0.63% | | | | |
| | 1,120 | | Freeport-McMoRan Copper & Gold, Inc. | | | 70,538 | |
| | | | | | | | |
| | | | Miscellaneous Manufacturing - 4.01% | | | | |
| | 4,660 | | Danaher Corp. | | | 282,909 | |
| | 2,910 | | Harsco Corp. | | | 90,763 | |
| | 2,035 | | Honeywell International, Inc. | | | 74,807 | |
| | | | | | | 448,479 | |
| | | | Oil & Gas - 3.88% | | | | |
| | 2,845 | | Apache Corp. | | | 241,683 | |
| | 2,785 | | Exxon Mobil Corp. | | | 192,583 | |
| | | | | | | 434,266 | |
| | | | Oil & Gas Services - 1.28% | | | | |
| | 4,010 | | Cameron International Corp.(a) | | | 143,197 | |
| | | | | | | | |
| | | | Pharmaceuticals - 3.99% | | | | |
| | 4,000 | | Abbott Laboratories | | | 180,920 | |
| | 1,985 | | Express Scripts, Inc.(a) | | | 143,357 | |
| | 4,330 | | Schering-Plough Corp. | | | 122,019 | |
| | | | | | | 446,296 | |
| | | | Real Estate Investment Trust - 0.65% | | | | |
| | 6,525 | | ProLogis | | | 72,558 | |
| | | | | | | | |
| | | | Retail - 8.30% | | | | |
| | 3,500 | | CVS Caremark Corp. | | | 131,320 | |
| | 2,665 | | GameStop Corp. Class A(a) | | | 63,427 | |
| | 1,255 | | Kohl's Corp.(a) | | | 64,745 | |
| | 3,750 | | Lowe's Cos., Inc. | | | 80,625 | |
| | 2,870 | | McDonald's Corp. | | | 161,409 | |
| | 2,615 | | Target Corp. | | | 122,905 | |
| | 5,985 | | Wal-Mart Stores, Inc. | | | 304,457 | |
| | | | | | | 928,888 | |
The accompanying notes are an integral part of the financial statements.
MONTEAGLE QUALITY GROWTH FUND
SCHEDULE OF INVESTMENTS — August 31, 2009 (Continued)
| | | | | | |
| Shares | | COMMON STOCKS - 96.85% (Continued) | | Value | |
| | | Semiconductors - 3.19% | | | |
| | 10,550 | | Intel Corp. | | $ | 214,376 | |
| | 5,400 | | Microchip Technology, Inc. | | | 143,370 | |
| | | | | | | 357,746 | |
| | | | Software - 7.17% | | | | |
| | 7,675 | | Activision Blizzard, Inc.(a) | | | 89,107 | |
| | 1,675 | | Adobe Systems, Inc.(a) | | | 52,628 | |
| | 17,300 | | Microsoft Corp. | | | 426,445 | |
| | 10,750 | | Oracle Corp. | | | 235,103 | |
| | | | | | | 803,283 | |
| | | | Telecommunications - 6.58% | | | | |
| | 5,745 | | American Tower Corp. - Class A(a) | | | 181,829 | |
| | 12,880 | | Cisco Systems, Inc.(a) | | | 278,208 | |
| | 5,955 | | QUALCOMM, Inc. | | | 276,431 | |
| | | | | | | 736,468 | |
| | | | Transportation - 1.25% | | | | |
| | 4,300 | | Expeditors International of Washington, Inc. | | | 140,438 | |
| | | | | | | | |
| | | | Total Common Stocks (Cost $10,638,319) | | | 10,843,285 | |
| | | | | | |
| Shares | | MONEY MARKET FUND - 2.61% | | Value | |
| | 292,544 | | Fidelity Institutional Money Market Fund Class I, 0.51%(b) (Cost $292,544) | | $ | 292,544 | |
| | | | | | | | |
| | | | Total Investments at Value - 99.46% (Cost $10,930,863) | | | 11,135,829 | |
| | | | | | | | |
| | | | Other Assets in Excess of Liabilities - 0.54% | | | 60,127 | |
| | | | | | | | |
| | | | Net Assets - 100.00% | | $ | 11,195,956 | |
| (a) | Non-income producing security. |
| (b) | Rate shown represents the rate at August 31, 2009, is subject to change and resets daily. |
The accompanying notes are an integral part of the financial statements.
MONTEAGLE LARGE CAP GROWTH FUND
SCHEDULE OF INVESTMENTS — August 31, 2009
| | | | | | |
| Shares | | COMMON STOCKS - 98.11% | | Value | |
| | | Apparel - 2.98% | | | |
| | 8,400 | | NIKE, Inc. - Class B | | $ | 465,276 | |
| | | | | | | | |
| | | | Banks - 7.42% | | | | |
| | 2,000 | | Goldman Sachs Group, Inc. | | | 330,920 | |
| | 11,400 | | JPMorgan Chase & Co. | | | 495,444 | |
| | 5,650 | | Northern Trust Corp. | | | 330,299 | |
| | | | | | | 1,156,663 | |
| | | | Biotechnology - 7.37% | | | | |
| | 4,400 | | Amgen, Inc.(a) | | | 262,856 | |
| | 5,050 | | Celgene Corp.(a) | | | 263,459 | |
| | 13,800 | | Gilead Sciences, Inc.(a) | | | 621,828 | |
| | | | | | | 1,148,143 | |
| | | | Chemicals - 4.37% | | | | |
| | 5,650 | | Mosaic Co. | | | 273,855 | |
| | 11,700 | | Sociedad Quimica Y Minera de Chile SA - ADR | | | 407,511 | |
| | | | | | | 681,366 | |
| | | | Commercial Services - 4.10% | | | | |
| | 9,000 | | Visa, Inc. Class A | | | 639,900 | |
| | | | | | | | |
| | | | Computers - 17.09% | | | | |
| | 4,900 | | Apple, Inc.(a) | | | 824,229 | |
| | 19,450 | | Cognizant Technology Solutions Corp. - Class A(a) | | | 678,416 | |
| | 12,200 | | Hewlett-Packard Co. | | | 547,658 | |
| | 5,200 | | International Business Machines Corp. | | | 613,860 | |
| | | | | | | 2,664,163 | |
| | | | Diversified Financial Services - 1.87% | | | | |
| | 1,000 | | CME Group, Inc. | | | 291,040 | |
| | | | | | | | |
| | | | Energy - Alternative Sources - 1.17% | | | | |
| | 1,500 | | First Solar, Inc.(a) | | | 182,370 | |
| | | | | | | | |
| | | | Engineering & Construction - 5.97% | | | | |
| | 12,300 | | Fluor Corp. | | | 650,670 | |
| | 6,350 | | Jacobs Engineering Group, Inc.(a) | | | 279,273 | |
| | | | | | | 929,943 | |
The accompanying notes are an integral part of the financial statements.
MONTEAGLE LARGE CAP GROWTH FUND
SCHEDULE OF INVESTMENTS — August 31, 2009 (Continued)
| | | | | | |
| Shares | | COMMON STOCKS - 98.11% (Continued) | | Value | |
| | | Internet - 9.22% | | | |
| | 24,400 | | eBay, Inc.(a) | | $ | 540,216 | |
| | 1,450 | | Google, Inc. - Class A(a) | | | 669,422 | |
| | 5,700 | | McAfee, Inc.(a) | | | 226,746 | |
| | | | | | | 1,436,384 | |
| | | | Machinery - Diversified - 3.49% | | | | |
| | 6,300 | | Flowserve Corp. | | | 543,375 | |
| | | | | | | | |
| | | | Oil & Gas - 5.96% | | | | |
| | 11,800 | | Petroleo Brasileiro SA - ADR | | | 467,752 | |
| | 12,500 | | Southwestern Energy Co.(a) | | | 460,750 | |
| | | | | | | 928,502 | |
| | | | Pharmaceuticals - 6.95% | | | | |
| | 11,700 | | Bristol-Myers Squibb Co. | | | 258,921 | |
| | 6,200 | | Medco Health Solutions, Inc.(a) | | | 342,364 | |
| | 9,350 | | Teva Pharmaceutical Industries Ltd. - ADR | | | 481,525 | |
| | | | | | | 1,082,810 | |
| | | | Retail - 9.67% | | | | |
| | 7,800 | | Family Dollar Stores, Inc. | | | 236,184 | |
| | 8,600 | | McDonald's Corp. | | | 483,664 | |
| | 11,100 | | Wal-Mart Stores, Inc. | | | 564,657 | |
| | 6,500 | | Yum! Brands, Inc. | | | 222,625 | |
| | | | | | | 1,507,130 | |
| | | | Savings & Loans - 3.34% | | | | |
| | 39,700 | | Hudson City Bancorp, Inc. | | | 520,864 | |
| | | | | | | | |
| | | | Software - 7.14% | | | | |
| | 12,825 | | BMC Software, Inc.(a) | | | 457,211 | |
| | 30,000 | | Oracle Corp. | | | 656,100 | |
| | | | | | | 1,113,311 | |
| | | | | | | | |
| | | | Total Common Stocks (Cost $13,203,219) | | | 15,291,240 | |
| | | | | | | | |
| | | | Total Investments at Value - 98.11% (Cost $13,203,219) | | | 15,291,240 | |
| | | | | | | | |
| | | | Other Assets in Excess of Liabilities - 1.89% | | | 294,856 | |
| | | | | | | | |
| | | | Net Assets - 100.00% | | $ | 15,586,096 | |
| (a) | Non-income producing security. |
ADR - American Depository Receipt.
The accompanying notes are an integral part of the financial statements.
MONTEAGLE SELECT VALUE FUND
SCHEDULE OF INVESTMENTS — August 31, 2009
| | | | | | |
| Shares | | COMMON STOCKS - 95.16% | | Value | |
| | | Aerospace & Defense - 2.28% | | | |
| | 2,300 | | Boeing Co. | | $ | 114,241 | |
| | 1,000 | | Lockheed Martin Corp. | | | 74,980 | |
| | | | | | | 189,221 | |
| | | | Auto Manufacturers - 2.59% | | | | |
| | 5,957 | | PACCAR, Inc. | | | 215,465 | |
| | | | | | | | |
| | | | Banks - 6.35% | | | | |
| | 7,400 | | Bank of America Corp. | | | 130,166 | |
| | 3,900 | | Bank of New York Mellon Corp. | | | 115,479 | |
| | 5,900 | | Morgan Stanley | | | 170,864 | |
| | 1,900 | | Northern Trust Corp. | | | 111,074 | |
| | | | | | | 527,583 | |
| | | | Biotechnology - 0.94% | | | | |
| | 1,400 | | Genzyme Corp.(a) | | | 77,994 | |
| | | | | | | | |
| | | | Chemicals - 3.06% | | | | |
| | 3,500 | | Ashland, Inc. | | | 128,380 | |
| | 5,900 | | Dow Chemical Co. | | | 125,611 | |
| | | | | | | 253,991 | |
| | | | Coal - 1.18% | | | | |
| | 3,000 | | Peabody Energy Corp. | | | 98,040 | |
| | | | | | | | |
| | | | Commercial Services - 1.38% | | | | |
| | 7,500 | | Total System Services, Inc. | | | 114,450 | |
| | | | | | | | |
| | | | Computers - 1.55% | | | | |
| | 3,700 | | Cognizant Technology Solutions Corp. - Class A(a) | | | 129,056 | |
| | | | | | | | |
| | | | Diversified Financial Services - 2.86% | | | | |
| | 436 | | CME Group, Inc. | | | 126,893 | |
| | 3,900 | | NYSE Euronext | | | 110,526 | |
| | | | | | | 237,419 | |
| | | | Electric - 1.36% | | | | |
| | 2,500 | | FirstEnergy Corp. | | | 112,825 | |
| | | | | | | | |
| | | | Engineering & Construction - 1.40% | | | | |
| | 2,200 | | Fluor Corp. | | | 116,380 | |
The accompanying notes are an integral part of the financial statements.
MONTEAGLE SELECT VALUE FUNDSCHEDULE OF INVESTMENTS — August 31, 2009 (Continued)
| | | | | | |
| Shares | | COMMON STOCKS - 95.16% (Continued) | | Value | |
| | | Food - 1.36% | | | |
| | 3,900 | | Whole Foods Market, Inc.(a) | | $ | 113,412 | |
| | | | | | | | |
| | | | Hand & Machine Tools - 0.90% | | | | |
| | 2,000 | | Snap-On, Inc. | | | 74,640 | |
| | | | | | | | |
| | | | Healthcare - Products - 0.90% | | | | |
| | 1,800 | | Stryker Corp. | | | 74,628 | |
| | | | | | | | |
| | | | Healthcare - Services - 5.94% | | | | |
| | 8,167 | | UnitedHealth Group, Inc. | | | 228,676 | |
| | 5,016 | | WellPoint, Inc.(a) | | | 265,095 | |
| | | | | | | 493,771 | |
| | | | Housewares - 1.46% | | | | |
| | 8,700 | | Newell Rubbermaid, Inc. | | | 121,104 | |
| | | | | | | | |
| | | | Insurance - 2.77% | | | | |
| | 2,800 | | Aflac, Inc. | | | 113,736 | |
| | 3,900 | | Assurant, Inc. | | | 116,805 | |
| | | | | | | 230,541 | |
| | | | Iron & Steel - 2.64% | | | | |
| | 2,900 | | Allegheny Technologies, Inc. | | | 88,073 | |
| | 3,000 | | United States Steel Corp. | | | 131,340 | |
| | | | | | | 219,413 | |
| | | | Machinery - Construction - 1.47% | | | | |
| | 2,700 | | Caterpillar, Inc. | | | 122,337 | |
| | | | | | | | |
| | | | Machinery - Diversified - 2.84% | | | | |
| | 2,800 | | Cummins, Inc. | | | 126,896 | |
| | 2,500 | | Deere & Co. | | | 109,000 | |
| | | | | | | 235,896 | |
| | | | Mining - 4.06% | | | | |
| | 9,400 | | Alcoa, Inc. | | | 113,270 | |
| | 2,000 | | Freeport-McMoRan Copper & Gold, Inc. | | | 125,960 | |
| | 12,000 | | Titanium Metals Corp. | | | 98,640 | |
| | | | | | | 337,870 | |
| | | | Miscellaneous Manufacturing - 2.50% | | | | |
| | 7,300 | | General Electric Co. | | | 101,470 | |
| | 2,900 | | Honeywell International, Inc. | | | 106,604 | |
| | | | | | | 208,074 | |
The accompanying notes are an integral part of the financial statements.
MONTEAGLE SELECT VALUE FUND
SCHEDULE OF INVESTMENTS — August 31, 2009 (Continued)
| | | | | | |
| Shares | | COMMON STOCKS - 95.16% (Continued) | | Value | |
| | | Oil & Gas - 13.26% | | | |
| | 4,900 | | Chesapeake Energy Corp. | | $ | 111,916 | |
| | 2,200 | | ConocoPhillips | | | 99,066 | |
| | 6,000 | | Denbury Resources, Inc.(a) | | | 91,320 | |
| | 1,600 | | Devon Energy Corp. | | | 98,208 | |
| | 3,100 | | ENSCO International, Inc. | | | 114,390 | |
| | 1,900 | | Hess Corp. | | | 96,121 | |
| | 3,100 | | Noble Corp. | | | 108,593 | |
| | 5,200 | | Rowan Cos., Inc. | | | 107,692 | |
| | 6,500 | | Tesoro Corp. | | | 91,520 | |
| | 2,415 | | Transocean Ltd.(a) | | | 183,154 | |
| | | | | | | 1,101,980 | |
| | | | Oil & Gas Services - 4.96% | | | | |
| | 2,500 | | Baker Hughes, Inc. | | | 86,125 | |
| | 5,200 | | Halliburton Co. | | | 123,292 | |
| | 1,800 | | Schlumberger Ltd. | | | 101,160 | |
| | 3,700 | | Smith International, Inc. | | | 102,009 | |
| | | | | | | 412,586 | |
| | | | Packaging & Containers - 1.18% | | | | |
| | 3,700 | | Bemis Co., Inc. | | | 98,383 | |
| | | | | | | | |
| | | | Pharmaceuticals - 5.44% | | | | |
| | 5,400 | | Bristol-Myers Squibb Co. | | | 119,502 | |
| | 13,500 | | Pfizer, Inc. | | | 225,450 | |
| | 3,800 | | Schering-Plough Corp. | | | 107,084 | |
| | | | | | | 452,036 | |
| | | | Retail - 6.07% | | | | |
| | 2,000 | | Kohl's Corp.(a) | | | 103,180 | |
| | 6,000 | | Starbucks Corp.(a) | | | 113,940 | |
| | 6,121 | | Target Corp. | | | 287,687 | |
| | | | | | | 504,807 | |
| | | | Semiconductors - 7.22% | | | | |
| | 22,477 | | Applied Materials, Inc. | | | 296,247 | |
| | 5,300 | | Intel Corp. | | | 107,696 | |
| | 6,000 | | MEMC Electronic Materials, Inc.(a) | | | 95,700 | |
| | 4,100 | | Texas Instruments, Inc. | | | 100,819 | |
| | | | | | | 600,462 | |
The accompanying notes are an integral part of the financial statements.
MONTEAGLE SELECT VALUE FUND
SCHEDULE OF INVESTMENTS — August 31, 2009 (Continued)
| | | | | | |
| Shares | | COMMON STOCKS - 95.16% (Continued) | | Value | |
| | | Telecommunications - 2.82% | | | |
| | 4,000 | | AT&T, Inc. | | $ | 104,200 | |
| | 2,800 | | QUALCOMM, Inc. | | | 129,976 | |
| | | | | | | 234,176 | |
| | | | Transportation - 2.42% | | | | |
| | 3,000 | | CSX Corp. | | | 127,500 | |
| | 1,600 | | Norfolk Southern Corp. | | | 73,392 | |
| | | | | | | 200,892 | |
| | | | | | | | |
| | | | Total Common Stocks (Cost $7,980,854) | | | 7,909,432 | |
| | | | | | |
| Shares | | MONEY MARKET FUND - 4.76% | | Value | |
| | 396,039 | | Fidelity Institutional Money Market Fund Class I, 0.51%(b) (Cost $396,039) | | $ | 396,039 | |
| | | | | | | | |
| | | | Total Investments at Value - 99.92% (Cost $8,376,893) | | | 8,305,471 | |
| | | | | | | | |
| | | | Other Assets in Excess of Liabilities - 0.08% | | | 6,589 | |
| | | | | | | | |
| | | | Net Assets - 100.00% | | $ | 8,312,060 | |
| (a) | Non-income producing security. |
| (b) | Rate shown represents the rate at August 31, 2009, is subject to change and resets daily. |
The accompanying notes are an integral part of the financial statements.
MONTEAGLE VALUE FUND
SCHEDULE OF INVESTMENTS — August 31, 2009
| | | | | | |
| Shares | | COMMON STOCKS - 92.69% | | Value | |
| | | Aerospace & Defense - 6.06% | | | |
| | 15,000 | | Goodrich Corp. | | $ | 827,400 | |
| | | | | | | | |
| | | | Chemicals - 7.28% | | | | |
| | 10,000 | | Eastman Chemical Co. | | | 521,600 | |
| | 14,750 | | E.I. du Pont de Nemours & Co. | | | 470,968 | |
| | | | | | | 992,568 | |
| | | | Electric - 2.90% | | | | |
| | 25,550 | | Duke Energy Corp. | | | 395,769 | |
| | | | | | | | |
| | | | Electronics - 0.77% | | | | |
| | 16,666 | | Sanmina-SCI Corp.(a) | | | 105,329 | |
| | | | | | | | |
| | | | Internet - 1.79% | | | | |
| | 15,000 | | Avocent Corp.(a) | | | 244,800 | |
| | | | | | | | |
| | | | Mining - 13.60% | | | | |
| | 22,000 | | Alcoa, Inc. | | | 265,100 | |
| | 25,000 | | Barrick Gold Corp. | | | 867,500 | |
| | 18,000 | | Newmont Mining Corp. | | | 723,420 | |
| | | | | | | 1,856,020 | |
| | | | Miscellaneous Manufacturing - 2.90% | | | | |
| | 25,000 | | Trinity Industries, Inc. | | | 395,000 | |
| | | | | | | | |
| | | | Oil & Gas - 9.45% | | | | |
| | 16,000 | | Marathon Oil Corp. | | | 493,920 | |
| | 10,494 | | Transocean Ltd.(a) | | | 795,865 | |
| | | | | | | 1,289,785 | |
| | | | Oil & Gas Services - 5.91% | | | | |
| | 34,000 | | Halliburton Co. | | | 806,140 | |
| | | | | | | | |
| | | | Pharmaceuticals - 11.08% | | | | |
| | 10,000 | | Bristol-Myers Squibb Co. | | | 221,300 | |
| | 30,000 | | Pfizer, Inc. | | | 501,000 | |
| | 28,000 | | Schering-Plough Corp. | | | 789,040 | |
| | | | | | | 1,511,340 | |
| | | | Retail - 7.22% | | | | |
| | 34,000 | | Gap, Inc. | | | 668,100 | |
| | 5,000 | | Sears Holdings Corp.(a) | | | 317,250 | |
| | | | | | | 985,350 | |
The accompanying notes are an integral part of the financial statements.
MONTEAGLE VALUE FUND
SCHEDULE OF INVESTMENTS — August 31, 2009 (Continued)
| | | | | | |
| Shares | | COMMON STOCKS - 92.69% (Continued) | | Value | |
| | | Semiconductors - 4.17% | | | |
| | 17,000 | | Applied Materials, Inc. | | $ | 224,060 | |
| | 17,000 | | Intel Corp. | | | 345,440 | |
| | | | | | | 569,500 | |
| | | | Software - 3.25% | | | | |
| | 18,000 | | Microsoft Corp. | | | 443,700 | |
| | | | | | | | |
| | | | Telecommunications - 6.55% | | | | |
| | 20,000 | | AT&T, Inc. | | | 521,000 | |
| | 226 | | Fairpoint Communications, Inc. | | | 183 | |
| | 12,000 | | Verizon Communications, Inc. | | | 372,480 | |
| | | | | | | 893,663 | |
| | | | Transportation - 9.76% | | | | |
| | 10,000 | | CSX Corp. | | | 425,000 | |
| | 21,000 | | Tidewater, Inc. | | | 906,570 | |
| | | | | | | 1,331,570 | |
| | | | | | | | |
| | | | Total Common Stocks (Cost $10,704,939) | | | 12,647,934 | |
| | | | | | |
| Shares | | MONEY MARKET FUND - 7.18% | | Value | |
| | 979,995 | | Fidelity Institutional Money Market Fund Class I, 0.51%(b) (Cost $979,995) | | $ | 979,995 | |
| | | | | | | | |
| | | | Total Investments at Value - 99.87% (Cost $11,684,934) | | | 13,627,929 | |
| | | | | | | | |
| | | | Other Assets in Excess of Liabilities - 0.13% | | | 17,570 | |
| | | | | | | | |
| | | | Net Assets - 100.00% | | $ | 13,645,499 | |
| (a) | Non-income producing security. |
| (b) | Rate shown represents the rate at August 31, 2009, is subject to change and resets daily. |
ADR - American Depository Receipt.
The accompanying notes are an integral part of the financial statements.
MONTEAGLE INFORMED INVESTOR GROWTH FUND
SCHEDULE OF INVESTMENTS — August 31, 2009
| | | | | | |
| Shares | | COMMON STOCKS - 65.25% | | Value | |
| | | Beverages - 3.08% | | | |
| | 14,150 | | Green Mountain Coffee Roasters, Inc.(a) | | $ | 851,688 | |
| | | | | | | | |
| | | | Chemicals - 4.52% | | | | |
| | 24,000 | | Eastman Chemical Co. | | | 1,251,840 | |
| | | | | | | | |
| | | | Commercial Services - 0.93% | | | | |
| | 6,200 | | VistaPrint Ltd.(a) | | | 256,928 | |
| | | | | | | | |
| | | | Computers - 9.48% | | | | |
| | 26,100 | | STEC, Inc.(a) | | | 1,057,833 | |
| | 10,450 | | Teradata Corp.(a) | | | 281,419 | |
| | 37,500 | | Western Digital Corp.(a) | | | 1,285,500 | |
| | | | | | | 2,624,752 | |
| | | | Distribution & Wholesale - 1.05% | | | | |
| | 7,600 | | Tech Data Corp.(a) | | | 289,560 | |
| | | | | | | | |
| | | | Electric - 4.27% | | | | |
| | 44,000 | | NRG Energy, Inc.(a) | | | 1,181,400 | |
| | | | | | | | |
| | | | Forest Products & Paper - 7.05% | | | | |
| | 61,300 | | International Paper Co. | | | 1,406,835 | |
| | 10,600 | | Rock-Tenn Co. - Class A | | | 543,674 | |
| | | | | | | 1,950,509 | |
| | | | Internet - 9.75% | | | | |
| | 2,000 | | Baidu, Inc. - ADR(a) | | | 660,120 | |
| | 17,400 | | NetEase.com ADR(a) | | | 730,626 | |
| | 8,500 | | Priceline.com, Inc.(a) | | | 1,308,830 | |
| | | | | | | 2,699,576 | |
| | | | Leisure Time - 2.84% | | | | |
| | 18,600 | | WMS Industries, Inc.(a) | | | 787,338 | |
| | | | | | | | |
| | | | Oil & Gas - 4.88% | | | | |
| | 47,400 | | Atwood Oceanics, Inc.(a) | | | 1,349,952 | |
| | | | | | | | |
| | | | Packaging & Containers - 6.42% | | | | |
| | 36,100 | | Packaging Corporation of America | | | 734,996 | |
| | 61,600 | | Temple-Inland, Inc. | | | 1,041,656 | |
| | | | | | | 1,776,652 | |
The accompanying notes are an integral part of the financial statements.
MONTEAGLE INFORMED INVESTOR GROWTH FUND
SCHEDULE OF INVESTMENTS — August 31, 2009 (Continued)
| | | | | | |
| Shares | | COMMON STOCKS - 65.25% (Continued) | | Value | |
| | | Pharmaceuticals - 6.21% | | | |
| | 75,900 | | Sepracor, Inc.(a) | | $ | 1,377,585 | |
| | 13,200 | | Valeant Pharmaceuticals Intl.(a) | | | 341,748 | |
| | | | | | | 1,719,333 | |
| | | | Semiconductors - 1.73% | | | | |
| | 15,400 | | KLA-Tencor Corp. | | | 480,480 | |
| | | | | | | | |
| | | | Telecommunications - 3.04% | | | | |
| | 30,500 | | Atheros Communications, Inc.(a) | | | 843,020 | |
| | | | | | | | |
| | | | Total Common Stocks (Cost $16,670,825) | | | 18,063,028 | |
| | | | | | |
| Shares | | EXCHANGE-TRADED FUNDS - 25.30% | | Value | |
| | 59,700 | | ProShares Ultra QQQ(a) | | $ | 2,732,469 | |
| | 99,500 | | ProShares Ultra Russell 2000 | | | 2,389,990 | |
| | 58,400 | | ProShares Ultra S&P 500 | | | 1,879,896 | |
| | | | | | | | |
| | | | Total Exchange-Traded Funds (Cost $6,088,293) | | | 7,002,355 | |
| | | | | | |
| Shares | | MONEY MARKET FUND - 12.87% | | Value | |
| | 3,562,343 | | Fidelity Institutional Money Market Fund Class I, 0.51%(b) (Cost $3,562,343) | | $ | 3,562,343 | |
| | | | | | | | |
| | | | Total Investments at Value - 103.42% (Cost $26,321,461) | | | 28,627,726 | |
| | | | | | | | |
| | | | Liabilities in Excess of Other Assets, Net - (3.42)% | | | (947,570 | ) |
| | | | | | | | |
| | | | Net Assets - 100.00% | | $ | 27,680,156 | |
| (a) | Non-income producing security. |
| (b) | Rate shown represents the rate at August 31, 2009, is subject to change and resets daily. |
ADR - American Depository Receipt.
The accompanying notes are an integral part of the financial statements.
MONTEAGLE FUNDS
STATEMENTS OF ASSETS AND LIABILITIES — August 31, 2009
| | | Fixed Income Fund | | | Quality Growth Fund | | | Large Cap Growth Fund | |
| ASSETS | | | | | | | | | |
Investment securities | | | | | | | | | |
At cost | | $ | 30,510,404 | | | $ | 10,930,863 | | | $ | 13,203,219 | |
At fair value (Note 2) | | $ | 31,843,958 | | | $ | 11,135,829 | | | $ | 15,291,240 | |
Receivables: | | | | | | | | | | | | |
Dividends and interest | | | 316,083 | | | | 16,870 | | | | 14,972 | |
Capital shares sold | | | — | | | | 1,370 | | | | — | |
Investment securities sold | | | — | | | | 53,967 | | | | 301,053 | |
Other assets | | | 317 | | | | 147 | | | | 262 | |
Total assets | | | 32,160,358 | | | | 11,208,183 | | | | 15,607,527 | |
| | | | | | | | | | | | | |
| LIABILITIES | | | | | | | | | | | | |
Payables: | | | | | | | | | | | | |
Distributions | | | 6,516 | | | | — | | | | — | |
Due to custodian | | | — | | | | — | | | | 4,121 | |
Due to Adviser (Note 3) | | | 26,613 | | | | 11,260 | | | | 16,109 | |
Accrued compliance service fees (Note 3) | | | 1,578 | | | | 817 | | | | 986 | |
Accrued Trustee fees | | | 445 | | | | 150 | | | | 215 | |
Total liabilities | | | 35,152 | | | | 12,227 | | | | 21,431 | |
| | | | | | | | | | | | | |
| NET ASSETS | | $ | 32,125,206 | | | $ | 11,195,956 | | | $ | 15,586,096 | |
| | | | | | | | | | | | | |
| NET ASSETS CONSIST OF: | | | | | | | | | | | | |
Paid-in capital | | $ | 32,200,209 | | | $ | 15,573,734 | | | $ | 24,702,895 | |
Accumulated undistributed net investment income | | | — | | | | 17,358 | | | | 6,201 | |
Accumulated net realized loss on investments | | | (1,408,557 | ) | | | (4,600,102 | ) | | | (11,211,021 | ) |
Net unrealized appreciation on investments | | | 1,333,554 | | | | 204,966 | | | | 2,088,021 | |
NET ASSETS | | $ | 32,125,206 | | | $ | 11,195,956 | | | $ | 15,586,096 | |
| | | | | | | | | | | | | |
Shares of beneficial interest outstanding(1) | | | 3,106,443 | | | | 1,634,974 | | | | 3,441,517 | |
Net asset value, offering and redemption price per share (Note 2) | | $ | 10.34 | | | $ | 6.85 | | | $ | 4.53 | |
| (1) | Unlimited number of shares of beneficial interest with no par value, authorized. |
The accompanying notes are an integral part of the financial statements.
MONTEAGLE FUNDS
STATEMENTS OF ASSETS AND LIABILITIES — August 31, 2009
| | | Select Value Fund | | | Value Fund | | | Informed Investor Growth Fund | |
| ASSETS | | | | | | | | | |
Investment securities | | | | | | | | | |
At cost | | $ | 8,376,893 | | | $ | 11,684,934 | | | $ | 26,321,461 | |
At fair value (Note 2) | | $ | 8,305,471 | | | $ | 13,627,929 | | | $ | 28,627,726 | |
Receivables: | | | | | | | | | | | | |
Dividends and interest | | | 15,710 | | | | 35,998 | | | | 11,338 | |
Capital shares sold | | | — | | | | — | | | | 132,992 | |
Other assets | | | 119 | | | | 204 | | | | — | |
Total assets | | | 8,321,300 | | | | 13,664,131 | | | | 28,772,056 | |
| | | | | | | | | | | | | |
| LIABILITIES | | | | | | | | | | | | |
Payables: | | | | | | | | | | | | |
Capital shares redeemed | | | — | | | | 3,761 | | | | 20,000 | |
Investment securities purchased | | | — | | | | — | | | | 1,043,232 | |
Due to Adviser (Note 3) | | | 8,411 | | | | 13,783 | | | | 26,907 | |
Accrued compliance service fees (Note 3) | | | 718 | | | | 905 | | | | 1,366 | |
Accrued Trustee fees | | | 111 | | | | 183 | | | | 395 | |
Total liabilities | | | 9,240 | | | | 18,632 | | | | 1,091,900 | |
| | | | | | | | | | | | | |
| NET ASSETS | | $ | 8,312,060 | | | $ | 13,645,499 | | | $ | 27,680,156 | |
| | | | | | | | | | | | | |
| NET ASSETS CONSIST OF: | | | | | | | | | | | | |
Paid-in capital | | $ | 12,368,173 | | | $ | 13,088,354 | | | $ | 22,222,551 | |
Accumulated undistributed net investment income | | | 7,004 | | | | 43,812 | | | | — | |
Accumulated net realized gain (loss) on investments | | | (3,991,695 | ) | | | (1,429,662 | ) | | | 3,151,340 | |
Net unrealized appreciation (depreciation) on investments | | | (71,422 | ) | | | 1,942,995 | | | | 2,306,265 | |
NET ASSETS | | $ | 8,312,060 | | | $ | 13,645,499 | | | $ | 27,680,156 | |
| | | | | | | | | | | | | |
Shares of beneficial interest outstanding (1) | | | 1,001,720 | | | | 1,106,147 | | | | 2,147,491 | |
Net asset value, offering and redemption price per share (Note 2) | | $ | 8.30 | | | $ | 12.34 | | | $ | 12.89 | |
| (1) | Unlimited number of shares of beneficial interest with no par value, authorized. |
The accompanying notes are an integral part of the financial statements.
MONTEAGLE FUNDS
STATEMENTS OF OPERATIONS — For the Fiscal Year Ended August 31, 2009
| | | Fixed Income Fund | | | Quality Growth Fund | | | Large Cap Growth Fund | |
| INVESTMENT INCOME | | | | | | | | | |
| | | | | | | | | | |
| Income: | | | | | | | | | |
Interest | | $ | 1,551,442 | | | $ | — | | | $ | — | |
Dividends | | | 5,916 | | | | 164,842 | | | | 207,587 | |
| | | | | | | | | | | | | |
Total Investment Income | | | 1,557,358 | | | | 164,842 | | | | 207,587 | |
| | | | | | | | | | | | | |
| Expenses: | | | | | | | | | | | | |
Investment advisory fees (Note 3) | | | 314,379 | | | | 121,451 | | | | 185,995 | |
Compliance service fees (Note 3) | | | 10,018 | | | | 6,589 | | | | 7,304 | |
Trustees’ fees | | | 11,602 | | | | 4,170 | | | | 6,459 | |
ICI membership fees | | | 1,996 | | | | 908 | | | | 1,628 | |
Miscellaenous expenses | | | 209 | | | | — | | | | — | |
| | | | | | | | | | | | | |
Total expenses | | | 338,204 | | | | 133,118 | | | | 201,386 | |
| | | | | | | | | | | | | |
Net investment income | | | 1,219,154 | | | | 31,724 | | | | 6,201 | |
| | | | | | | | | | | | | |
| REALIZED AND UNREALIZED GAIN (LOSS) ON INVESTMENTS | | | | | | | | | | | | |
| | | | | | | | | | | | | |
Net realized loss from investments | | | (293,506 | ) | | | (1,860,081 | ) | | | (6,136,787 | ) |
Net unrealized appreciation (depreciation) on investments | | | 1,237,910 | | | | (935,884 | ) | | | (285,805 | ) |
| | | | | | | | | | | | | |
Net realized and unrealized gain (loss) on investments | | | 944,404 | | | | (2,795,965 | ) | | | (6,422,592 | ) |
| | | | | | | | | | | | | |
Net increase (decrease) in net assets resulting from operations | | $ | 2,163,558 | | | $ | (2,764,241 | ) | | $ | (6,416,391 | ) |
The accompanying notes are an integral part of the financial statements.
MONTEAGLE FUNDS
STATEMENTS OF OPERATIONS — For the Fiscal Year Ended August 31, 2009
| | | Select Value Fund | | | Value Fund | | | Informed Investor Growth Fund | |
| INVESTMENT INCOME | | | | | | | | | |
| | | | | | | | | | |
| Income: | | | | | | | | | |
Interest | | $ | 773 | | | $ | — | | | $ | — | |
Dividends | | | 175,128 | | | | 310,906 | | | | 68,080 | |
Foreign withholding tax | | | — | | | | (1,500 | ) | | | — | |
| | | | | | | | | | | | | |
Total Investment Income | | | 175,901 | | | | 309,406 | | | | 68,080 | |
| | | | | | | | | | | | | |
| Expenses: | | | | | | | | | | | | |
Investment advisory fees (Note 3) | | | 92,033 | | | | 149,743 | | | | 162,423 | |
Compliance service fees (Note 3) | | | 6,168 | | | | 6,960 | | | | 8,106 | |
Trustees’ fees | | | 3,291 | | | | 5,207 | | | | 2,513 | |
ICI membership fees | | | 754 | | | | 1,265 | | | | — | |
| | | | | | | | | | | | | |
Total expenses | | | 102,246 | | | | 163,175 | | | | 173,042 | |
| | | | | | | | | | | | | |
Net investment income (loss) | | | 73,655 | | | | 146,231 | | | | (104,962 | ) |
| | | | | | | | | | | | | |
| REALIZED AND UNREALIZED GAIN (LOSS) ON INVESTMENTS | | | | | | | | | | | | |
| | | | | | | | | | | | | |
Net realized gain (loss) from investments | | | (3,783,452 | ) | | | (773,972 | ) | | | 4,576,804 | |
Net unrealized appreciation (depreciation) on investments | | | 511,210 | | | | (4,410,696 | ) | | | 2,261,415 | |
| | | | | | | | | | | | | |
| Net realized and unrealized gain (loss) on investments | | | (3,272,242 | ) | | | (5,184,668 | ) | | | 6,838,219 | |
| | | | | | | | | | | | | |
Net increase (decrease) in net assets resulting from operations | | $ | (3,198,587 | ) | | $ | (5,038,437 | ) | | $ | 6,733,257 | |
The accompanying notes are an integral part of the financial statements.
MONTEAGLE FIXED INCOME FUND
STATEMENTS OF CHANGES IN NET ASSETS
| | | Year Ended August 31, 2009 | | | Year Ended August 31, 2008 | |
| INCREASE IN NET ASSETSFROM OPERATIONS | | | | | | |
Net investment income | | $ | 1,219,154 | | | $ | 1,296,394 | |
Net realized gain (loss) from investment transactions | | | (293,506 | ) | | | 47,540 | |
Net unrealized appreciation on investments | | | 1,237,910 | | | | 281,937 | |
Net increase in net assets resulting from operations | | $ | 2,163,558 | | | $ | 1,625,871 | |
| | | | | | | | | |
| FROM DISTRIBUTIONS TO SHAREHOLDERS | | | | | | | | |
From net investment income | | | (1,219,154 | ) | | | (1,296,394 | ) |
| | | | | | | | | |
| FROM CAPITAL SHARE TRANSACTIONS | | | | | | | | |
Proceeds from shares sold | | | 571,086 | | | | 1,487,622 | |
Reinvestment of distributions to shareholders | | | 1,138,687 | | | | 1,200,696 | |
Payments for shares redeemed | | | (2,850,392 | ) | | | (3,569,831 | ) |
| Net decrease in net assets from capital share transactions | | | (1,140,619 | ) | | | (881,513 | ) |
| | | | | | | | | |
Total decrease in net assets | | | (196,215 | ) | | | (552,036 | ) |
| | | | | | | | | |
| NET ASSETS | | | | | | | | |
Beginning of year | | | 32,321,421 | | | | 32,873,457 | |
End of year | | $ | 32,125,206 | | | $ | 32,321,421 | |
| ACCUMULATED UNDISTRIBUTED NET INVESTMENT INCOME | | $ | — | | | $ | — | |
| | | | | | | | | |
| SUMMARY OF CAPITAL SHARE ACTIVITY | | | | | | | | |
Shares sold | | | 56,103 | | | | 146,181 | |
Shares issued in reinvestment of distribution to shareholders | | | 112,680 | | | | 118,803 | |
Shares redeemed | | | (279,424 | ) | | | (349,432 | ) |
Net decrease in shares outstanding | | | (110,641 | ) | | | (84,448 | ) |
Shares outstanding, beginning of year | | | 3,217,084 | | | | 3,301,532 | |
Shares outstanding, end of year | | | 3,106,443 | | | | 3,217,084 | |
The accompanying notes are an integral part of the financial statements.
MONTEAGLE QUALITY GROWTH FUND
STATEMENTS OF CHANGES IN NET ASSETS
| | | Year Ended August 31, 2009 | | | Year Ended August 31, 2008 | |
| DECREASE IN NET ASSETS FROM OPERATIONS | | | | | | |
Net investment income (loss) | | $ | 31,724 | | | $ | (8,062 | ) |
Net realized loss from investment transactions | | | (1,860,081 | ) | | | (255,405 | ) |
Net unrealized depreciation on investments | | | (935,884 | ) | | | (377,494 | ) |
Net decrease in net assets resulting from operations | | $ | (2,764,241 | ) | | $ | (640,961 | ) |
| | | | | | | | | |
| FROM DISTRIBUTIONS TO SHAREHOLDERS | | | | | | | | |
From net investment income | | | (14,366 | ) | | | — | |
| | | | | | | | | |
| FROM CAPITAL SHARE TRANSACTIONS | | | | | | | | |
Proceeds from shares sold | | | 1,115,591 | | | | 1,597,287 | |
Reinvestment of distributions to shareholders | | | 12,210 | | | | — | |
Payments for shares redeemed | | | (1,355,993 | ) | | | (1,624,942 | ) |
| Net decrease in net assets from capital share transactions | | | (228,192 | ) | | | (27,655 | ) |
| | | | | | | | | |
Total decrease in net assets | | | (3,006,799 | ) | | | (668,616 | ) |
| | | | | | | | | |
| NET ASSETS | | | | | | | | |
Beginning of year | | | 14,202,755 | | | | 14,871,371 | |
End of year | | $ | 11,195,956 | | | $ | 14,202,755 | |
| ACCUMULATED UNDISTRIBUTED NET INVESTMENT INCOME | | $ | 17,358 | | | $ | — | |
| | | | | | | | | |
| SUMMARY OF CAPITAL SHARE ACTIVITY | | | | | | | | |
Shares sold | | | 183,431 | | | | 183,296 | |
Shares issued in reinvestment of distribution to shareholders | | | 1,920 | | | | — | |
Shares redeemed | | | (229,444 | ) | | | (186,641 | ) |
Net decrease in shares outstanding | | | (44,093 | ) | | | (3,345 | ) |
Shares outstanding, beginning of year | | | 1,679,067 | | | | 1,682,412 | |
Shares outstanding, end of year | | | 1,634,974 | | | | 1,679,067 | |
The accompanying notes are an integral part of the financial statements.
MONTEAGLE LARGE CAP GROWTH FUND
STATEMENTS OF CHANGES IN NET ASSETS
| | | Year Ended August 31, 2009 | | | Year Ended August 31, 2008 | |
| DECREASE IN NET ASSETS FROM OPERATIONS | | | | | | |
Net investment income (loss) | | $ | 6,201 | | | $ | (62,258 | ) |
Net realized loss from investment transactions | | | (6,136,787 | ) | | | (112,406 | ) |
Net unrealized depreciation on investments | | | (285,805 | ) | | | (3,453,136 | ) |
Net decrease in net assets resulting from operations | | $ | (6,416,391 | ) | | $ | (3,627,800 | ) |
| | | | | | | | | |
| FROM CAPITAL SHARE TRANSACTIONS | | | | | | | | |
Proceeds from shares sold | | | 18,149 | | | | 432,054 | |
Payments for shares redeemed | | | (763,105 | ) | | | (3,026,980 | ) |
| Net decrease in net assets from capital share transactions | | | (744,956 | ) | | | (2,594,926 | ) |
| | | | | | | | | |
Total decrease in net assets | | | (7,161,347 | ) | | | (6,222,726 | ) |
| | | | | | | | | |
| NET ASSETS | | | | | | | | |
Beginning of year | | | 22,747,443 | | | | 28,970,169 | |
End of year | | $ | 15,586,096 | | | $ | 22,747,443 | |
| ACCUMULATED UNDISTRIBUTED NET INVESTMENT INCOME | | $ | 6,201 | | | $ | — | |
| | | | | | | | | |
| SUMMARY OF CAPITAL SHARE ACTIVITY | | | | | | | | |
Shares sold | | | 4,050 | | | | 63,364 | |
Shares redeemed | | | (183,394 | ) | | | (466,124 | ) |
Net decrease in shares outstanding | | | (179,344 | ) | | | (402,760 | ) |
Shares outstanding, beginning of year | | | 3,620,861 | | | | 4,023,621 | |
Shares outstanding, end of year | | | 3,441,517 | | | | 3,620,861 | |
The accompanying notes are an integral part of the financial statements.
MONTEAGLE SELECT VALUE FUND
STATEMENTS OF CHANGES IN NET ASSETS
| | | Year Ended August 31, 2009 | | | Year Ended August 31, 2008 | |
| DECREASE IN NET ASSETS FROM OPERATIONS | | | | | | |
Net investment income | | $ | 73,655 | | | $ | 122,501 | |
Net realized loss from investment transactions | | | (3,783,452 | ) | | | (196,168 | ) |
Net unrealized appreciation (depreciation) on investments | | | 511,210 | | | | (1,821,329 | ) |
Net decrease in net assets resulting from operations | | $ | (3,198,587 | ) | | $ | (1,894,996 | ) |
| | | | | | | | | |
| FROM DISTRIBUTIONS TO SHAREHOLDERS | | | | | | | | |
From net investment income | | | (95,261 | ) | | | (113,679 | ) |
From net realized gains on investments | | | — | | | | (1,690,778 | ) |
| Decrease in net assets from distributions to shareholders | | | (95,261 | ) | | | (1,804,457 | ) |
| | | | | | | | | |
| FROM CAPITAL SHARE TRANSACTIONS | | | | | | | | |
Proceeds from shares sold | | | 127,770 | | | | 309,853 | |
Reinvestment of distributions to shareholders | | | 85,530 | | | | 1,624,984 | |
Payments for shares redeemed | | | (109,326 | ) | | | (361,021 | ) |
| Net increase in net assets from capital share transactions | | | 103,974 | | | | 1,573,816 | |
| | | | | | | | | |
Total decrease in net assets | | | (3,189,874 | ) | | | (2,125,637 | ) |
| | | | | | | | | |
| NET ASSETS | | | | | | | | |
Beginning of year | | | 11,501,934 | | | | 13,627,571 | |
End of year | | $ | 8,312,060 | | | $ | 11,501,934 | |
| ACCUMULATED UNDISTRIBUTED NET INVESTMENT INCOME | | $ | 7,004 | | | $ | 28,610 | |
| | | | | | | | | |
| SUMMARY OF CAPITAL SHARE ACTIVITY | | | | | | | | |
Shares sold | | | 15,985 | | | | 24,033 | |
Shares issued in reinvestment of distribution to shareholders | | | 10,844 | | | | 124,478 | |
Shares redeemed | | | (14,175 | ) | | | (29,164 | ) |
Net increase in shares outstanding | | | 12,654 | | | | 119,347 | |
Shares outstanding, beginning of year | | | 989,066 | | | | 869,719 | |
Shares outstanding, end of year | | | 1,001,720 | | | | 989,066 | |
The accompanying notes are an integral part of the financial statements.
MONTEAGLE VALUE FUND
STATEMENTS OF CHANGES IN NET ASSETS
| | | Year Ended August 31, 2009 | | | Year Ended August 31, 2008 | |
| DECREASE IN NET ASSETS FROM OPERATIONS | | | | | | |
Net investment income | | $ | 146,231 | | | $ | 84,531 | |
Net realized loss from investment transactions | | | (773,972 | ) | | | (651,422 | ) |
Net unrealized depreciation on investments | | | (4,410,696 | ) | | | (471,978 | ) |
Net decrease in net assets resulting from operations | | $ | (5,038,437 | ) | | $ | (1,038,869 | ) |
| | | | | | | | | |
| FROM DISTRIBUTIONS TO SHAREHOLDERS | | | | | | | | |
From net investment income | | | (124,619 | ) | | | (133,912 | ) |
From net realized gains on investments | | | — | | | | (2,073,545 | ) |
| Decrease in net assets from distributions to shareholders | | | (124,619 | ) | | | (2,207,457 | ) |
| | | | | | | | | |
| FROM CAPITAL SHARE TRANSACTIONS | | | | | | | | |
Proceeds from shares sold | | | 805,758 | | | | 1,587,809 | |
Reinvestment of distributions to shareholders | | | 5,827 | | | | 13,713 | |
Payments for shares redeemed | | | (1,420,417 | ) | | | (2,032,009 | ) |
| Net decrease in net assets from capital share transactions | | | (608,832 | ) | | | (430,487 | ) |
| | | | | | | | | |
Total decrease in net assets | | | (5,771,888 | ) | | | (3,676,813 | ) |
| | | | | | | | | |
| NET ASSETS | | | | | | | | |
Beginning of year | | | 19,417,387 | | | | 23,094,200 | |
End of year | | $ | 13,645,499 | | | $ | 19,417,387 | |
| ACCUMULATED UNDISTRIBUTED NET INVESTMENT INCOME | | $ | 43,812 | | | $ | 22,200 | |
| | | | | | | | | |
| SUMMARY OF CAPITAL SHARE ACTIVITY | | | | | | | | |
Shares sold | | | 75,170 | | | | 91,414 | |
Shares issued in reinvestment of distribution to shareholders | | | 562 | | | | 774 | |
Shares redeemed | | | (134,177 | ) | | | (115,569 | ) |
Net decrease in shares outstanding | | | (58,445 | ) | | | (23,381 | ) |
Shares outstanding, beginning of year | | | 1,164,592 | | | | 1,187,973 | |
Shares outstanding, end of year | | | 1,106,147 | | | | 1,164,592 | |
The accompanying notes are an integral part of the financial statements.
MONTEAGLE INFORMED INVESTOR GROWTH FUND
STATEMENTS OF CHANGES IN NET ASSETS
| | | Year Ended August 31, 2009 | | | Period Ended August 31, 2008(a) | |
| INCREASE (DECREASE) IN NET ASSETS FROM OPERATIONS | | | | | | |
Net investment loss | | $ | (104,962 | ) | | $ | (21,187 | ) |
Net realized gain (loss) from investment transactions | | | 4,576,804 | | | | (1,320,502 | ) |
Net unrealized appreciation on investments | | | 2,261,415 | | | | 44,850 | |
| Net increase (decrease) in net assets resulting from operations | | $ | 6,733,257 | | | $ | (1,296,839 | ) |
| | | | | | | | | |
| FROM CAPITAL SHARE TRANSACTIONS | | | | | | | | |
Proceeds from shares sold | | | 14,986,806 | | | | 10,500,545 | |
Payments for shares redeemed | | | (3,217,107 | ) | | | (26,506 | ) |
| Net increase in net assets from capital share transactions | | | 11,769,699 | | | | 10,474,039 | |
| | | | | | | | | |
Total increase in net assets | | | 18,502,956 | | | | 9,177,200 | |
| | | | | | | | | |
| NET ASSETS | | | | | | | | |
Beginning of period | | | 9,177,200 | | | | — | |
End of period | | $ | 27,680,156 | | | $ | 9,177,200 | |
| ACCUMULATED UNDISTRIBUTED NET INVESTMENT INCOME | | $ | — | | | $ | — | |
| | | | | | | | | |
| SUMMARY OF CAPITAL SHARE ACTIVITY | | | | | | | | |
Shares sold | | | 1,469,914 | | | | 1,043,027 | |
Shares redeemed | | | (362,849 | ) | | | (2,601 | ) |
Net increase in shares outstanding | | | 1,107,065 | | | | 1,040,426 | |
Shares outstanding, beginning of period | | | 1,040,426 | | | | — | |
Shares outstanding, end of period | | | 2,147,491 | | | | 1,040,426 | |
| (a) | Represents the period from the commencement of operations (April 3, 2008) through August 31, 2008. |
The accompanying notes are an integral part of the financial statements.
MONTEAGLE FIXED INCOME FUND
FINANCIAL HIGHLIGHTS
| For a Share Outstanding Throughout the Year | |
| | | Year Ended August 31, 2009 | | | Year Ended August 31, 2008 | | | Year Ended August 31, 2007 | | | Year Ended August 31, 2006 | | | Year Ended August 31, 2005 | |
| Net asset value, beginning of year | | $ | 10.05 | | | $ | 9.96 | | | $ | 9.91 | | | $ | 10.38 | | | $ | 10.77 | |
| Income from investment operations: | | | | | | | | | | | | | | | | | | | | |
| Net investment income | | | 0.38 | | | | 0.40 | | | | 0.40 | | | | 0.38 | (a) | | | 0.38 | |
| Net realized and unrealized gain (loss) on investments | | | 0.29 | | | | 0.09 | | | | 0.05 | | | | (0.31 | ) | | | (0.20 | ) |
| Total from investment operations | | | 0.67 | | | | 0.49 | | | | 0.45 | | | | 0.07 | | | | 0.18 | |
| | | | | | | | | | | | | | | | | | | | | |
| Less distributions: | | | | | | | | | | | | | | | | | | | | |
| From net investment income | | | (0.38 | ) | | | (0.40 | ) | | | (0.40 | ) | | | (0.38 | ) | | | (0.38 | ) |
| From net realized gains on investments | | | — | | | | — | | | | — | | | | (0.16 | ) | | | (0.19 | ) |
| Total distributions | | | (0.38 | ) | | | (0.40 | ) | | | (0.40 | ) | | | (0.54 | ) | | | (0.57 | ) |
| | | | | | | | | | | | | | | | | | | | | |
| Net asset value, end of year | | $ | 10.34 | | | $ | 10.05 | | | $ | 9.96 | | | $ | 9.91 | | | $ | 10.38 | |
| | | | | | | | | | | | | | | | | | | | | |
Total Return(b) | | | 6.80 | % | | | 4.94 | % | | | 4.68 | % | | | 0.78 | % | | | 1.72 | % |
| | | | | | | | | | | | | | | | | | | | | |
| Net assets, end of year (000’s omitted) | | $ | 32,125 | | | $ | 32,321 | | | $ | 32,873 | | | $ | 42,447 | | | $ | 24,087 | |
| | | | | | | | | | | | | | | | | | | | | |
| Ratio of expenses to average net assets: | | | | | | | | | | | | | | | | | | | | |
| After reimbursement/waiver of fees | | | 1.04 | % | | | 1.01 | % | | | 1.00 | % | | | 1.00 | % | | | 1.17 | % |
| Before reimbursement/waiver of fees | | | 1.04 | % | | | 1.01 | % | | | 1.00 | % | | | 1.13 | % | | | 1.17 | % |
| | | | | | | | | | | | | | | | | | | | | |
| Ratio of net investment income to average net assets: | | | | | | | | | | | | | | | | | | | | |
| After reimbursement/waiver of fees | | | 3.74 | % | | | 3.93 | % | | | 4.12 | % | | | 3.75 | % | | | 3.63 | % |
| | | | | | | | | | | | | | | | | | | | | |
| Portfolio turnover rate | | | 39 | % | | | 55 | % | | | 19 | % | | | 17 | % | | | 58 | % |
| (a) | Net investment income per share is based on average shares outstanding during the period. |
| (b) | Total return is a measure of the change in value of an investment in the Fund over the periods covered, which assumes any dividends or capital gains distributions are reinvested in shares of the Fund. Returns do not reflect the deduction of taxes a shareholder would pay on Fund distributions or the redemption of Fund shares. |
The accompanying notes are an integral part of the financial statements.
MONTEAGLE QUALITY GROWTH FUND
FINANCIAL HIGHLIGHTS
| For a Share Outstanding Throughout the Period | | | | |
| | | Year Ended August 31, 2009 | | | Year Ended August 31, 2008 | | | Year Ended August 31, 2007 | | | Eight Months Ended August 31, 2006(a) | | | Year Ended December 31, 2005 | | | Year Ended December 31, 2004 | |
| Net asset value, beginning of period | | $ | 8.46 | | | $ | 8.84 | | | $ | 7.75 | | | $ | 7.90 | | | $ | 7.69 | | | $ | 7.40 | |
| Income from investment operations: | | | | | | | | | | | | | | | | | | | | | | | | |
| Net investment income (loss) | | | 0.02 | | | | — | (c) | | | (0.01 | ) | | | — | (b)(c) | | | — | (b)(c) | | | 0.01 | (b) |
| Net realized and unrealized gain (loss) on investments | | | (1.62 | ) | | | (0.38 | ) | | | 1.10 | | | | (0.15 | ) | | | 0.21 | | | | 0.29 | |
| Total from investment operations | | | (1.60 | ) | | | (0.38 | ) | | | 1.09 | | | | (0.15 | ) | | | 0.21 | | | | 0.30 | |
| Less distributions: | | | | | | | | | | | | | | | | | | | | | | | | |
| From net investment income | | | (0.01 | ) | | | — | | | | — | | | | — | | | | — | (d) | | | (0.01 | ) |
| Net asset value, end of period | | $ | 6.85 | | | $ | 8.46 | | | $ | 8.84 | | | $ | 7.75 | | | $ | 7.90 | | | $ | 7.69 | |
Total Return(e) | | | (18.92 | %) | | | (4.30 | %) | | | 14.06 | % | | | (1.90 | %)(f) | | | 2.77 | % | | | 4.11 | % |
| Net assets, end of period (000’s omitted) | | $ | 11,196 | | | $ | 14,203 | | | $ | 14,871 | | | $ | 19,070 | | | $ | 19,278 | | | $ | 15,841 | |
| Ratio of expenses to average net assets: | | | | | | | | | | | | | | | | | | | | | | | | |
| After reimbursement/waiver of fees | | | 1.32 | % | | | 1.25 | % | | | 1.23 | % | | | 1.26 | %(g) | | | 1.26 | % | | | 1.25 | % |
| Before reimbursement/waiver of fees | | | 1.32 | % | | | 1.25 | % | | | 1.23 | % | | | 1.48 | %(g) | | | 1.54 | % | | | 1.69 | % |
| Ratio of net investment income (loss) to average net assets: | | | | | | | | | | | | | | | | | | | | | | | | |
| After reimbursement/waiver of fees | | | 0.31 | % | | | (0.05 | %) | | | (0.08 | %) | | | (0.08 | %)(g) | | | (0.04 | %) | | | 0.19 | % |
| Portfolio turnover rate | | | 39 | % | | | 26 | % | | | 72 | % | | | 63 | %(f) | | | 92 | % | | | 94 | % |
| (a) | Fund changed fiscal year end to August 31st. |
| (b) | Net investment income (loss) per share is based on average shares outstanding during the period. |
| (c) | Net investment loss per share resulted in less than $0.01 per share. |
| (d) | Distribution per share was $(0.0032). |
| (e) | Total return is a measure of the change in value of an investment in the Fund over the periods covered, which assumes any dividends or capital gains distributions are reinvested in shares of the Fund. Returns do not reflect the deduction of taxes a shareholder would pay on Fund distributions or the redemption of Fund shares. |
The accompanying notes are an integral part of the financial statements.
MONTEAGLE LARGE CAP GROWTH FUND
FINANCIAL HIGHLIGHTS
| For a Share Outstanding Throughout the Year | |
| | | Year Ended August 31, 2009 | | | Year Ended August 31, 2008 | | | Year Ended August 31, 2007 | | | Year Ended August 31, 2006 | | | Year Ended August 31, 2005 | |
| Net asset value, beginning of year | | $ | 6.28 | | | $ | 7.20 | | | $ | 6.02 | | | $ | 6.27 | | | $ | 5.43 | |
| Income from investment operations: | | | | | | | | | | | | | | | | | | | | |
| Net investment income (loss) | | | — | (a) | | | (0.02 | ) | | | (0.03 | ) | | | (0.04 | )(b) | | | (0.03 | ) |
| Net realized and unrealized gain (loss) on investments | | | (1.75 | ) | | | (0.90 | ) | | | 1.21 | | | | (0.21 | ) | | | 0.87 | |
| Total from investment operations | | | (1.75 | ) | | | (0.92 | ) | | | 1.18 | | | | (0.25 | ) | | | 0.84 | |
| | | | | | | | | | | | | | | | | | | | | |
| Net asset value, end of year | | $ | 4.53 | | | $ | 6.28 | | | $ | 7.20 | | | $ | 6.02 | | | $ | 6.27 | |
| | | | | | | | | | | | | | | | | | | | | |
Total Return(c) | | | (27.87 | %) | | | (12.87 | %) | | | 19.60 | % | | | (3.99 | %) | | | 15.47 | % |
| | | | | | | | | | | | | | | | | | | | | |
Net assets, end of year (000's omitted) | | $ | 15,586 | | | $ | 22,747 | | | $ | 28,970 | | | $ | 28,773 | | | $ | 31,361 | |
| | | | | | | | | | | | | | | | | | | | | |
Ratio of expenses to average net assets: | | | | | | | | | | | | | | | | | | | | |
| After reimbursement/waiver of fees | | | 1.30 | % | | | 1.24 | % | | | 1.21 | % | | | 1.21 | % | | | 1.36 | % |
| Before reimbursement/waiver of fees | | | 1.30 | % | | | 1.24 | % | | | 1.21 | % | | | 1.32 | % | | | 1.36 | % |
| | | | | | | | | | | | | | | | | | | | | |
Ratio of net investment income (loss) to average net assets: | | | | | | | | | | | | | | | | | | | | |
| After reimbursement/waiver of fees | | | 0.04 | % | | | (0.23 | %) | | | (0.48 | %) | | | (0.62 | %) | | | (0.56 | %) |
| | | | | | | | | | | | | | | | | | | | | |
| Portfolio turnover rate | | | 89 | % | | | 64 | % | | | 49 | % | | | 76 | % | | | 60 | % |
| (a) | Net investment income per share resulted in less than $0.01 per share. |
| (b) | Net investment loss per share is based on average shares outstanding during the period. |
| (c) | Total return is a measure of the change in value of an investment in the Fund over the periods covered, which assumes any dividends or capital gains distributions are reinvested in shares of the Fund. Returns do not reflect the deduction of taxes a shareholder would pay on Fund distributions or the redemption of Fund shares. |
The accompanying notes are an integral part of the financial statements.
MONTEAGLE SELECT VALUE FUND
FINANCIAL HIGHLIGHTS
| For a Share Outstanding Throughout the Period | | | | |
| | | Year Ended August 31, 2009 | | | Year Ended August 31, 2008 | | | Year Ended August 31, 2007 | | | Eight Months Ended August 31, 2006(a) | | | Year Ended December 31, 2005 | | | Year Ended December 31, 2004 | |
| Net asset value, beginning of period | | $ | 11.63 | | | $ | 15.67 | | | $ | 14.02 | | | $ | 13.48 | | | $ | 13.51 | | | $ | 11.84 | |
| Income from investment operations: | | | | | | | | | | | | | | | | | | | | | | | | |
| Net investment income | | | 0.07 | | | | 0.13 | | | | 0.13 | | | | 0.12 | (b) | | | 0.11 | (b) | | | 0.12 | (b) |
| Net realized and unrealized gain (loss) on investments | | | (3.30 | ) | | | (2.11 | ) | | | 1.98 | | | | 0.50 | | | | 0.08 | | | | 1.67 | |
| Total from investment operations | | | (3.23 | ) | | | (1.98 | ) | | | 2.11 | | | | 0.62 | | | | 0.19 | | | | 1.79 | |
| Less distributions: | | | | | | | | | | | | | | | | | | | | | | | | |
| From net investment income | | | (0.10 | ) | | | (0.12 | ) | | | (0.15 | ) | | | (0.08 | ) | | | (0.11 | ) | | | (0.12 | ) |
| From net realized gains on investments | | | — | | | | (1.94 | ) | | | (0.31 | ) | | | — | | | | (0.11 | ) | | | — | |
| Total distributions | | | (0.10 | ) | | | (2.06 | ) | | | (0.46 | ) | | | (0.08 | ) | | | (0.22 | ) | | | (0.12 | ) |
| Net asset value, end of period | | $ | 8.30 | | | $ | 11.63 | | | $ | 15.67 | | | $ | 14.02 | | | $ | 13.48 | | | $ | 13.51 | |
Total Return(c) | | | (27.76 | %) | | | (14.01 | %) | | | 15.21 | % | | | 4.60 | %(d) | | | 1.45 | % | | | 15.18 | % |
| Net assets, end of period (000’s omitted) | | $ | 8,312 | | | $ | 11,502 | | | $ | 13,628 | | | $ | 16,065 | | | $ | 16,120 | | | $ | 7,763 | |
| Ratio of expenses to average net assets: | | | | | | | | | | | | | | | | | | | | | | | | |
| After reimbursement/waiver of fees | | | 1.33 | % | | | 1.26 | % | | | 1.22 | % | | | 1.26 | %(e) | | | 1.26 | % | | | 1.17 | % |
| Before reimbursement/waiver of fees | | | 1.33 | % | | | 1.26 | % | | | 1.22 | % | | | 1.49 | %(e) | | | 1.66 | % | | | 1.78 | % |
| Ratio of net investment income to average net assets: | | | | | | | | | | | | | | | | | | | | | | | | |
| After reimbursement/waiver of fees | | | 0.96 | % | | | 1.00 | % | | | 0.82 | % | | | 1.25 | %(e) | | | 0.93 | % | | | 0.98 | % |
| Portfolio turnover rate | | | 108 | % | | | 71 | % | | | 88 | % | | | 31 | %(d) | | | 71 | % | | | 69 | % |
| (a) | Fund changed fiscal year end to August 31st. |
| (b) | Net investment income (loss) per share is based on average shares outstanding during the period. |
| (c) | Total return is a measure of the change in value of an investment in the Fund over the periods covered, which assumes any dividends or capital gains distributions are reinvested in shares of the Fund. Returns do not reflect the deduction of taxes a shareholder would pay on Fund distributions or the redemption of Fund shares. |
The accompanying notes are an integral part of the financial statements.
MONTEAGLE VALUE FUND
FINANCIAL HIGHLIGHTS
| For a Share Outstanding Throughout the Year | |
| | | Year Ended August 31, 2009 | | | Year Ended August 31, 2008 | | | Year Ended August 31, 2007 | | | Year Ended August 31, 2006 | | | Year Ended August 31, 2005 | |
| Net asset value, beginning of year | | $ | 16.67 | | | $ | 19.44 | | | $ | 16.55 | | | $ | 15.43 | | | $ | 12.16 | |
| Income (loss) from investment operations: | | | | | | | | | | | | | | | | | | | | |
| Net investment income | | | 0.13 | | | | 0.07 | | | | 0.20 | | | | 0.19 | (a) | | | 0.15 | |
| Net realized and unrealized gain (loss) on investments | | | (4.35 | ) | | | (0.97 | ) | | | 2.98 | | | | 1.07 | | | | 3.16 | |
| Total from investment operations | | | (4.22 | ) | | | (0.90 | ) | | | 3.18 | | | | 1.26 | | | | 3.31 | |
| | | | | | | | | | | | | | | | | | | | | |
| Less distributions: | | | | | | | | | | | | | | | | | | | | |
| From net investment income | | | (0.11 | ) | | | (0.11 | ) | | | (0.29 | ) | | | (0.14 | ) | | | (0.04 | ) |
| From net realized gains on investments | | | — | | | | (1.76 | ) | | | — | | | | — | | | | — | |
| Total distributions | | | (0.11 | ) | | | (1.87 | ) | | | (0.29 | ) | | | (0.14 | ) | | | (0.04 | ) |
| | | | | | | | | | | | | | | | | | | | | |
| Net asset value, end of year | | $ | 12.34 | | | $ | 16.67 | | | $ | 19.44 | | | $ | 16.55 | | | $ | 15.43 | |
| | | | | | | | | | | | | | | | | | | | | |
Total Return(b) | | | (25.19 | %) | | | (5.14 | %) | | | 19.40 | % | | | 8.25 | % | | | 27.30 | % |
| | | | | | | | | | | | | | | | | | | | | |
Net assets, end of year (000's omitted) | | $ | 13,645 | | | $ | 19,417 | | | $ | 23,094 | | | $ | 20,893 | | | $ | 20,123 | |
| | | | | | | | | | | | | | | | | | | | | |
| Ratio of operating expenses to average net assets: | | | | | | | | | | | | | | | | | | | | |
| After reimbursement/waiver of fees | | | 1.31 | % | | | 1.25 | % | | | 1.22 | % | | | 1.23 | % | | | 1.37 | % |
| Before reimbursement/waiver of fees | | | 1.31 | % | | | 1.25 | % | | | 1.22 | % | | | 1.35 | % | | | 1.37 | % |
| | | | | | | | | | | | | | | | | | | | | |
| Ratio of net investment income to average net assets: | | | | | | | | | | | | | | | | | | | | |
| After reimbursement/waiver of fees | | | 1.17 | % | | | 0.40 | % | | | 1.07 | % | | | 1.14 | % | | | 1.07 | % |
| | | | | | | | | | | | | | | | | | | | | |
| Portfolio turnover rate | | | 6 | % | | | 0 | % | | | 31 | % | | | 28 | % | | | 25 | % |
| (a) | Net investment income per share is based on average shares outstanding during the period. |
| (b) | Total return is a measure of the change in value of an investment in the Fund over the periods covered, which assumes any dividends or capital gains distributions are reinvested in shares of the Fund. Returns do not reflect the deduction of taxes a shareholder would pay on Fund distributions or the redemption of Fund shares. |
The accompanying notes are an integral part of the financial statements.
MONTEAGLE INFORMED INVESTOR GROWTH FUND
FINANCIAL HIGHLIGHTS
| For a Share Outstanding Throughout the Period | |
| | | Year Ended August 31, 2009 | | | Year Ended August 31, 2008(a) | |
| Net asset value, beginning of period | | $ | 8.82 | | | $ | 10.00 | |
| Income from investment operations: | | | | | | | | |
Net investment loss(f) | | | (0.05 | ) | | | (0.02 | ) |
| Net realized and unrealized gain (loss) on investments | | | 4.12 | | | | (1.16 | ) |
| Total from investment operations | | | 4.07 | | | | (1.18 | ) |
| | | | | | | | | |
| Net asset value, end of period | | $ | 12.89 | | | $ | 8.82 | |
| | | | | | | | | |
Total Return(b) | | | 46.15 | % | | | (11.80 | %)(c) |
| | | | | | | | | |
| Net assets, end of period (000's omitted) | | $ | 27,680 | | | $ | 9,177 | |
| | | | | | | | | |
Ratio of operating expenses to average net assets:(e) | | | 1.27 | % | | | 1.27 | %(d) |
| | | | | | | | | |
Ratio of net investment loss to average net assets:(f) | | | (0.77 | %) | | | (0.60 | %)(d) |
| | | | | | | | | |
| Portfolio turnover rate | | | 1592 | % | | | 157 | %(c) |
| (a) | Represents the period from the initial public offering (April 3, 2008) through August 31, 2008. |
| (b) | Total return is a measure of the change in value of an investment in the Fund over the periods covered, which assumes any dividends or capital gains distributions are reinvested in shares of the Fund. Returns do not reflect the deduction of taxes a shareholder would pay on Fund distributions or the redemption of Fund shares. |
| (e) | The ratios of expenses to average net assets do not reflect the Fund’s proportionate share of income and expenses of underlying investment companies in which the Fund invests. |
| (f) | Recognition of net investment income (loss) by the Fund is affected by the declaration of dividends by the underlying investment companies in which the Fund invests. |
The accompanying notes are an integral part of the financial statements.
MONTEAGLE FUNDS
NOTES TO FINANCIAL STATEMENTS — August 31, 2009
1. ORGANIZATION
Monteagle Funds (“the Trust”) was organized as a business trust under the laws of the State of Delaware on November 26, 1997 as Memorial Funds. The Trust changed its name to Monteagle Funds in July, 2006.
The Trust is registered with the Securities and Exchange Commission (“SEC”) as an open-end, management investment company under the Investment Company Act of 1940. The Trust is authorized by its Declaration of Trust to issue an unlimited number of shares of beneficial interest in each series. The Trust currently consists of the following series (each a “Fund” and collectively the “Funds”):
Monteagle Fixed Income Fund
Monteagle Quality Growth Fund
Monteagle Large Cap Growth Fund
Monteagle Select Value Fund
Monteagle Value Fund
Monteagle Informed Investor Growth Fund
Each Fund is a diversified series of Monteagle Funds. The principal investment objective of Monteagle Fixed Income Fund (“Fixed Income Fund”) is total return. The principal investment objective of each of Monteagle Quality Growth Fund (“Quality Growth Fund”), Monteagle Large Cap Growth Fund (“Large Cap Growth Fund”), Monteagle Select Value Fund (“Select Value Fund”), Monteagle Value Fund (“Value Fund”) and Monteagle Informed Investor Growth Fund (“Informed Investor Growth Fund”) (collectively the “Equity Funds”) is long-term capital appreciation.
2. SIGNIFICANT ACCOUNTING POLICIES
The following is a summary of the Funds’ significant accounting policies:
Securities Valuation — Equity securities, including common stocks and exchange-traded funds, held by the Funds for which market quotations are readily available are valued using the last reported sales price or the official closing price provided by independent pricing services as of the close of trading on the New York Stock Exchange (normally 4:00 p.m. Eastern time) on each Fund’s business day. If no sales are reported, the average of the last bid and ask price is used. If no average price is available, the last bid price is used. To the extent these securities are actively traded and valuation adjustments are not applied, they are categorized in level 1 of the fair value hierarchy described below. When an equity security is valued by the independent pricing service using factors other than market quotations or the market is considered inactive, they will be categorized in level 2.
Fixed income securities such as corporate bonds, municipal bonds, and U.S. government and agency obligations, when valued using market quotations in an active market, are categorized as level 1 securities. However, fair value may be determined using an independent pricing service that considers market observable data such as reported sales of similar securities, broker quotes, yields, bids, offers, and other reference data. These securities would be categorized as level 2 securities. The fair value of mortgage-backed securities is estimated by an independent pricing service which uses models that consider interest rate movements, new issue information and other security pertinent data. Evaluations of tranches (non-volatile, volatile, or credit sensitive) are based on interpretations of accepted Wall Street modeling and pricing conventions. Mortgage-backed securities are categorized
MONTEAGLE FUNDS
NOTES TO FINANCIAL STATEMENTS (Continued)
in level 2 of the fair value hierarchy described below to the extent the inputs are observable and timely. In the absence of readily available market quotations, or other observable inputs, securities are valued at fair value pursuant to procedures adopted by the Board of Trustees and would be categorized as level 3.
Money market funds are valued at their net asset value of $1.00 per share and are categorized as level 1. Securities with maturities of 60 days or less may be valued at amortized cost, which approximates fair value and would be categorized as level 2. The ability of issuers of debt securities held by the Funds to meet their obligations may be affected by economic and political developments in a specific country or region.
Various inputs are used in determining the value of each of the Fund’s investments. These inputs are summarized in the three broad levels listed below:
| | • | Level 1 – quoted prices in active markets for identical securities |
| | • | Level 2 – other significant observable inputs |
| | • | Level 3 – significant unobservable inputs |
The inputs or methodology used for valuing securities are not necessarily an indication of the risk associated with investing in those securities.
The following is a summary of the inputs used to value the Funds’ investments at fair value as of August 31, 2009:
| Fixed Income Fund | | | | | | | | | |
Security Classification(a) | | Level 1 (Quoted Prices) | | | Level 2 (Other Significant Observable Inputs) | | | Totals | |
| U.S. Government and Agency Obligations | | $ | — | | | $ | 9,732,403 | | | $ | 9,732,403 | |
| Corporate Bonds | | | 11,432,420 | | | | 2,067,960 | | | | 13,500,380 | |
| Mortgage-Backed Securities | | | — | | | | 7,572,233 | | | | 7,572,233 | |
| Municipal Obligations | | | — | | | | 232,109 | | | | 232,109 | |
| Money Market Funds | | | 806,833 | | | | — | | | | 806,833 | |
| Totals | | $ | 12,239,253 | | | $ | 19,604,705 | | | $ | 31,843,958 | |
| Quality Growth Fund | | | | | | | | | |
Security Classification(a) | | Level 1 (Quoted Prices) | | | Level 2 (Other Significant Observable Inputs) | | | Totals | |
Common Stocks(b) | | $ | 10,843,285 | | | $ | — | | | $ | 10,843,285 | |
| Money Market Funds | | | 292,544 | | | | — | | | | 292,544 | |
| Totals | | $ | 11,135,829 | | | $ | — | | | $ | 11,135,829 | |
MONTEAGLE FUNDS
NOTES TO FINANCIAL STATEMENTS (Continued)
| Large Cap Growth Fund | | | | | | | | | |
Security Classification(a) | | Level 1 (Quoted Prices) | | | Level 2 (Other Significant Observable Inputs) | | | Totals | |
Common Stocks(b) | | $ | 15,291,240 | | | $ | — | | | $ | 15,291,240 | |
| Totals | | $ | 15,291,240 | | | $ | — | | | $ | 15,291,240 | |
| Select Value Fund | | | | | | | | | |
Security Classification(a) | | Level 1 (Quoted Prices) | | | Level 2 (Other Significant Observable Inputs) | | | Totals | |
Common Stocks(b) | | $ | 7,909,432 | | | $ | — | | | $ | 7,909,432 | |
| Money Market Funds | | | 396,039 | | | | — | | | | 396,039 | |
| Totals | | $ | 8,305,471 | | | $ | — | | | $ | 8,305,471 | |
| Value Fund | | | | | | | | | |
Security Classification(a) | | Level 1 (Quoted Prices) | | | Level 2 (Other Significant Observable Inputs) | | | Totals | |
Common Stocks(b) | | $ | 12,647,934 | | | $ | — | | | $ | 12,647,934 | |
| Money Market Funds | | | 979,995 | | | | — | | | | 979,995 | |
| Totals | | $ | 13,627,929 | | | $ | — | | | $ | 13,627,929 | |
| Informed Investor Growth Fund | | | | | | | | | |
Security Classification(a) | | Level 1 (Quoted Prices) | | | Level 2 (Other Significant Observable Inputs) | | | Totals | |
Common Stocks(b) | | $ | 18,063,028 | | | $ | — | | | $ | 18,063,028 | |
| Exchange-Traded Funds | | | 7,002,355 | | | | — | | | | 7,002,355 | |
| Money Market Funds | | | 3,562,343 | | | | — | | | | 3,562,343 | |
| Totals | | $ | 28,627,726 | | | $ | — | | | $ | 28,627,726 | |
| (a) | As of and during the year ended August 31, 2009, the Funds held no securities that were considered to be “Level 3” securities (those valued using significant unobservable inputs). Therefore, a reconciliation of assets in which significant unobservable inputs (Level 3) were used in determining fair value is not applicable. |
| (b) | All common stocks held in the Funds are Level 1 securities. For a detailed break-out of common stocks by major industry classification, please refer to the Schedules of Investments. |
MONTEAGLE FUNDS
NOTES TO FINANCIAL STATEMENTS (Continued)
Share Valuation — To calculate the net asset value, each Fund’s assets are valued and totaled, liabilities are subtracted, and the balance is divided by the number of shares outstanding. The offering price and redemption price per share are equal to the net asset value per share for each Fund.
Security Transactions — Security transactions are accounted for on trade date and realized gains and losses on investments sold are determined on a specific identification basis.
Interest and Dividend Income — Interest income is accrued as earned. Dividends on securities held by the Funds are recorded on the ex-dividend date. Discounts and premiums on securities purchased are amortized over the lives of the respective securities. Withholding taxes on foreign dividends have been provided for in accordance with the Funds’ understanding of the applicable country’s tax rules and rates.
Dividends and Distributions to Shareholders — Distributions of net investment income to shareholders are declared daily and paid monthly by Fixed Income Fund. Net investment income distributions, if any, for Quality Growth Fund, Large Cap Growth Fund, Select Value Fund, Value Fund and Informed Investor Growth Fund are declared and paid quarterly at the discretion of each Fund’s adviser. Net capital gains for the Funds, if any, are distributed to shareholders at least annually. Distributions to shareholders, which are determined in accordance with income tax regulations, are recorded on the ex-dividend date.
The tax character of distributions paid during the years ended August 31, 2009 and August 31, 2008 was as follows:
| Fund | | Ordinary Income | | | Long-Term Capital Gain | |
| | | 2009 | | | 2008 | | | 2009 | | | 2008 | |
| Fixed Income Fund | | $ | 1,219,154 | | | $ | 1,296,394 | | | $ | — | | | $ | — | |
| Quality Growth Fund | | | 14,366 | | | | — | | | | — | | | | — | |
| Select Value Fund | | | 95,261 | | | | 571,431 | | | | — | | | | 1,233,026 | |
| Value Fund | | | 124,619 | | | | 909,651 | | | | — | | | | 1,297,806 | |
Quality Growth Fund paid no distributions during the year ended August 31, 2008. Large Cap Growth Fund and Informed Investor Growth Fund paid no distributions during the years ended August 31, 2009 and August 31, 2008.
Estimates — These financial statements are prepared in accordance with accounting principles generally accepted in the United States of America, which require management to make certain estimates and assumptions that affect the reported amounts of assets and liabilities, disclosure of contingent assets and liabilities at the date of the financial statements and the reported amounts of increases and decreases in net assets from operations during the reporting period. Actual results could differ from those estimates.
MONTEAGLE FUNDS
NOTES TO FINANCIAL STATEMENTS (Continued)
Common expenses — Common expenses of the Trust are allocated among the Funds within the Trust based on relative net assets of each Fund or the nature of the services performed and the relative applicability to each Fund.
3. ADVISORY, SERVICING FEES AND OTHER TRANSACTIONS WITH AFFILIATES
Investment Advisory Agreement
Nashville Capital Corporation (“Nashville Capital” or the “Adviser”) serves as the investment adviser to the Funds. Prior to May 1, 2009, Parkway Advisors, L.P. (“Parkway”) served as the investment adviser for the Quality Growth Fund and Select Value Fund. Pursuant to the change of service providers, the Trustees approved Nashville Capital as the investment adviser for the Quality Growth Fund and Select Value Fund effective May 1, 2009. Subject to the general oversight of the Board of Trustees, the Adviser is responsible for, among other things, developing a continuing investment program for the Funds in accordance with their investment objectives, reviewing the investment strategies and policies of the Funds and advising the Board of Trustees on the selection of sub-advisers. Each Fund is authorized to pay the Adviser a fee based on average daily net assets at the following annual rates:
| Assets | | Fixed Income Fund | | | Quality Growth Fund | | | Large Cap Growth Fund | | | Select Value Fund | | | Value Fund | | | Informed Investor Growth Fund | |
| Up to and including $25 millon | | | 0.965 | % | | | 1.200 | % | | | 1.200 | % | | | 1.200 | % | | | 1.200 | % | | | 1.200 | % |
| From $25 up to and including $50 million | | | 0.965 | % | | | 1.115 | % | | | 1.115 | % | | | 1.115 | % | | | 1.115 | % | | | 1.115 | % |
| From $50 up to and including $100 million | | | 0.845 | % | | | 0.975 | % | | | 0.975 | % | | | 0.975 | % | | | 0.975 | % | | | 0.975 | % |
| Over $100 million | | | 0.775 | % | | | 0.875 | % | | | 0.875 | % | | | 0.875 | % | | | 0.875 | % | | | 0.875 | % |
Under the terms of the Funds’ advisory agreement, the Adviser oversees the management of each Fund’s investments and pays all of the operating expenses of each Fund except: (i) costs of membership in trade associations; (ii) any expenses recouped by the Adviser; (iii) SEC registration fees and related expenses; (iv) any non-interested Trustee fees; (v) costs of travel for non-interested Trustees; (vi) costs associated with seminars, conventions or trade education for non-interested Trustees; (vii) 50% of the compensation amount approved by Trustees specifically for the Chief Compliance Officer’s services for the Trust attributable to the Funds managed by the Adviser; and (viii) any extraordinary Trust expenses.
MONTEAGLE FUNDS
NOTES TO FINANCIAL STATEMENTS (Continued)
For the year ended August 31, 2009, the amounts earned by and payable to the Advisers were as follows:
| | | Advisory Fees Earned | | | Advisory Fees Payable as of August 31, 2009 | |
| Fixed Income Fund | | $ | 314,379 | | | $ | 26,613 | |
| Quality Growth Fund | | | 121,451 | | | | 11,260 | |
| Large Cap Growth Fund | | | 185,995 | | | | 16,109 | |
| Select Value Fund | | | 92,033 | | | | 8,411 | |
| Value Fund | | | 149,743 | | | | 13,783 | |
| Informed Investor Growth Fund | | | 162,423 | | | | 26,907 | |
Fixed Income Fund — Nashville Capital has retained Howe & Rusling Inc. (“H&R”) to serve as the sub-adviser to Fixed Income Fund. Nashville Capital has agreed to pay H&R an annual advisory fee of 0.30% of average daily net assets up to $25 million, 0.25% of such assets from $25 million up to $50 million, and 0.20% of such assets over $50 million.
Quality Growth Fund — Nashville Capital has retained Davis Hamilton Jackson & Associates (“DHJA”) to serve as the sub-adviser to Quality Growth Fund. Nashville Capital has agreed to pay DHJA an annual advisory fee of 0.30% of average daily net assets.
Large Cap Growth Fund — Nashville Capital has retained Northstar Capital Management (“Northstar”) to serve as the sub-adviser to Large Cap Growth Fund. Nashville Capital has agreed to pay Northstar an annual advisory fee of 0.50% of average daily net assets.
Select Value Fund — Nashville Capital has retained Parkway Advisors, L.P. (“Parkway”) to serve as the sub-adviser to Select Value Fund. Nashville Capital has agreed to pay Parkway an annual advisory fee of 0.50% of average daily net assets.
Value Fund — Nashville Capital has retained Robinson Investment Group, Inc. (“Robinson”) to serve as the sub-adviser to Value Fund. Nashville Capital has agreed to pay Robinson an annual advisory fee of 0.60% of average daily net assets up to $25 million, 0.45% of such assets from $25 million up to $50 million, 0.35% of such assets from $50 million up to $100 million, and 0.30% of such assets over $100 million.
Informed Investor Growth Fund — Nashville Capital has retained T.H. Fitzgerald & Co. (“T.H. Fitzgerald”) to serve as the sub-adviser to Informed Investor Growth Fund. Nashville Capital has agreed to pay T.H. Fitzgerald an annual advisory fee of 0.65% of average daily net assets up to $25 million, 0.60% of such assets from $25 million up to $50 million, 0.50% of such assets from $50 million up to $100 million, and 0.40% of such assets over $100 million.
An officer of Parkway and an officer of Nashville Capital are also officers of the Trust; one of them is also an interested Trustee.
MONTEAGLE FUNDS
NOTES TO FINANCIAL STATEMENTS (Continued)
Mutual Fund Services Agreement
Pursuant to a Mutual Fund Services Agreement between the Trust and Ultimus Fund Solutions, LLC (“Ultimus”), Ultimus provided administrative, fund accounting and pricing, and transfer agent and shareholder services to the Funds for the period of September 1, 2008 through April 30, 2009. For these services, Ultimus received an annual base fee of $250,000, plus an asset-based fee at the annual rate of 0.15% of the Funds’ aggregate average daily net assets from $200 million to $300 million; 0.125% of such assets from $300 million to $400 million; and 0.10% of such assets in excess of $400 million. The fees payable to Ultimus were paid by the Adviser (not the Funds). Effective May 1, 2009, Matrix Fund Services (“Matrix”) replaced Ultimus as the Funds’ mutual fund service provider. For these services, Matrix receives the greater of an annual base fee of $30,000 per Fund or 0.075% of the Trust’s Equity Funds’ aggregate average daily net assets to $400 million with lower fees at higher asset levels and 0.04% of the Trust’s Fixed Income Fund aggregate average net assets to $400 million with lower fees at higher assets levels. The fees payable to Matrix are paid by the Adviser (not the Funds). Officers of Matrix are also officers of the Trust.
Distribution Agreement
Pursuant to the terms of a Distribution Agreement with the Trust, Ultimus Fund Distributors, LLC (the “Distributor”) served as the Funds’ principal underwriter for the period of September 1, 2008 through April 30, 2009. The Distributor receives annual compensation of $6,000 for such services from the Adviser. The fees payable to the Distributor were paid by the Adviser (not the Funds). Effective May 1, 2009, Matrix Capital Group replaced Ultimus as the Funds’ Distributor. Matrix Capital Group does not receive compensation for such services.
Compliance Services
For the period of September 1, 2008 through April 30, 2009, an employee of Parkway served as the Chief Compliance Officer (the “CCO”) of the Trust. The CCO provides ongoing regulatory compliance consulting, monitoring and reporting services for the Trust. Each Fund paid $5,000 annually to Parkway for providing CCO services. Effective May 1, 2009, an employee of Nashville Capital serves as the CCO of the Trust. The Funds pay $75,000 annually to Nashville for providing CCO services. Each Fund pays $5,000 with the remaining $45,000 allocated to the Funds based on aggregate average daily net assets.
4. SECURITIES TRANSACTIONS
During the year ended August 31, 2009, cost of purchases and proceeds from sales and maturities of investment securities, excluding short-term investments and U.S. government securities, were as follows:
| Fund | | Purchases | | | Sales | |
| Fixed Income Fund | | $ | 9,044,373 | | | $ | 10,645,131 | |
| Quality Growth Fund | | | 4,031,366 | | | | 4,296,043 | |
| Large Cap Growth Fund | | | 13,662,193 | | | | 14,179,420 | |
| Select Value Fund | | | 8,627,710 | | | | 7,526,485 | |
| Value Fund | | | 724,367 | | | | 1,336,699 | |
| Informed Investor Growth Fund | | | 185,535,239 | | | | 175,541,591 | |
MONTEAGLE FUNDS
NOTES TO FINANCIAL STATEMENTS (Continued)
5. TAX MATTERS
It is each Fund’s policy to comply with the special provisions of Subchapter M of the Internal Revenue Code applicable to regulated investment companies. As provided therein, in any fiscal year in which a Fund so qualifies and distributes at least 90% of its taxable income, such Fund (but not the shareholders) will be relieved of federal income tax on the income distributed. Accordingly, no provision for income taxes has been made.
In order to avoid imposition of the excise tax applicable to regulated investment companies, it is also each Fund’s intention to declare as dividends in each calendar year at least 98% of its net investment income and 98% of its net realized capital gains plus undistributed amounts from prior years.
The tax character of distributable earnings (deficit) at August 31, 2009 was as follows:
| Fund | | Unrealized Appreciation(Depreciation) | | | Undistributed Ordinary Income | | | Capital Loss Carryforward | | | Post-October Capital Loss | | | Total Distributable Earnings | |
| Fixed Income Fund | | $ | 1,333,554 | | | $ | 6,739 | | | $ | (1,335,475 | ) | | $ | (79,821 | ) | | $ | (75,003 | ) |
| Quality Growth Fund | | | 92,676 | | | | 17,358 | | | | (2,947,382 | ) | | | (1,540,430 | ) | | | (4,377,778 | ) |
| Large Cap Growth Fund | | | 2,088,021 | | | | 6,201 | | | | (6,436,466 | ) | | | (4,774,555 | ) | | | (9,116,799 | ) |
| Select Value Fund | | | (79,464 | ) | | | 7,029 | | | | (177,384 | ) | | | (3,806,294 | ) | | | (4,056,113 | ) |
| Value Fund | | | 1,942,995 | | | | 43,812 | | | | (655,690 | ) | | | (773,972 | ) | | | 557,145 | |
| Informed Investor Growth Fund | | | 2,075,674 | | | | 3,381,931 | | | | — | | | | — | | | | 5,457,605 | |
As of August 31, 2009, the following Funds had the following capital loss carryforwards for federal income tax purposes. These capital loss carryforwards may be utilized in future years to offset net realized capital gains, if any, prior to distributing such gains to shareholders.
| | | Capital Loss Carryforwards Expiring | | | Post-October Losses | |
| Fund | | 2010 | | | 2011 | | | 2012 | | | 2013 | | | 2014 | | | 2015 | | | 2016 | | | 2017 | | | Total | | | Deferred | | | Utilized | |
| Fixed Income Fund | | | 100,359 | | | | — | | | | 698,715 | | | | 86,568 | | | | — | | | | 168,181 | | | | 61,228 | | | | 220,424 | | | | 1,335,475 | | | | 79,821 | | | | — | |
| Quality Growth Fund | | | 1,658,403 | | | | 471,453 | | | | 296,216 | | | | — | | | | — | | | | — | | | | 63,079 | | | | 458,231 | | | | 2,947,382 | | | | 1,540,430 | | | | 217,829 | |
| Large Cap Growth Fund | | | — | | | | 2,182,811 | | | | 2,165,647 | | | | 309,209 | | | | 155,209 | | | | — | | | | — | | | | 1,623,590 | | | | 6,436,466 | | | | 4,774,555 | | | | 261,358 | |
| Select Value Fund | | | — | | | | — | | | | — | | | | — | | | | — | | | | — | | | | — | | | | 177,384 | | | | 177,384 | | | | 3,806,294 | | | | 208,268 | |
| Value Fund | | | — | | | | — | | | | — | | | | — | | | | — | | | | — | | | | — | | | | 655,690 | | | | 655,690 | | | | 773,972 | | | | 655,690 | |
| Informed Investor Growth Fund | | | — | | | | — | | | | — | | | | — | | | | — | | | | — | | | | — | | | | — | | | | — | | | | — | | | | 1,282,654 | |
MONTEAGLE FUNDS
NOTES TO FINANCIAL STATEMENTS (Continued)
Under current tax law, net capital losses realized after October 31st may be deferred and treated as occurring on the first day of the following fiscal year. The Funds have elected to defer net capital losses as indicated in the chart above.
The following information is based upon the federal income tax cost of the investment securities as of August 31, 2009:
| Fund | | Cost | | | Gross Unrealized Appreciation | | | Gross Unrealized Depreciation | | | Net Unrealized Appreciation (Depreciation) | |
| Fixed Income Fund | | $ | 30,510,404 | | | $ | 1,385,426 | | | $ | (51,872 | ) | | $ | 1,333,554 | |
| Quality Growth Fund | | | 11,043,153 | | | | 1,041,661 | | | | (948,985 | ) | | | 92,676 | |
| Large Cap Growth Fund | | | 13,203,219 | | | | 2,481,271 | | | | (393,250 | ) | | | 2,088,021 | |
| Select Value Fund | | | 8,384,935 | | | | 688,463 | | | | (767,927 | ) | | | (79,464 | ) |
| Value Fund | | | 11,684,934 | | | | 3,366,951 | | | | (1,423,956 | ) | | | 1,942,995 | |
| Informed Investor Growth Fund | | | 26,552,052 | | | | 2,212,992 | | | | (137,318 | ) | | | 2,075,674 | |
The difference between the federal income tax cost of portfolio investments and the financial statement cost for Quality Growth Fund, Select Value Fund and Informed Investors Growth Fund is due to certain timing differences in the recognition of capital losses under income tax regulations and accounting principles generally accepted in the United States of America. These “book/tax” differences are temporary in nature and are due to the tax deferral of losses on wash sales.
For the year ended August 31, 2009, Informed Investor Growth Fund reclassified $104,962 of net investment loss to accumulated net capital gains on the Statement of Assets and Liabilities. For the year ended August 31, 2009, Fixed Income Fund and Quality Growth Fund reclassified $367,674 and $234,908, respectively, of expired capital loss carryforwards from accumulated net realized loss to paid-in capital on the Statements of Assets and Liabilities. Such reclassifications, the result of permanent differences between the financial statement and income tax reporting requirements, have no effect on the Funds’ net assets or net asset value per share.
The Funds recognize the tax benefits of uncertain tax positions only when the position is “more likely than not” to be sustained assuming examination by tax authorities. Management has reviewed the tax positions in the open tax years of 2006, 2007 and 2008 and during the year ended August 31, 2009 and concluded that no liability for unrecognized tax benefits should be recorded related to uncertain tax positions taken in the above open tax years. The Funds identify their major tax jurisdictions as U.S. Federal and Delaware. The Funds recognize interest and penalties, if any, related to unrecognized tax benefits as income tax expense in the Statements of Operations. During the year ended August 31, 2009, the Funds did not incur any interest or penalties. The Funds are not subject to examination by U.S. Federal tax authorities for tax years before 2006.
MONTEAGLE FUNDS
NOTES TO FINANCIAL STATEMENTS (Continued)
6. CONTROL OWNERSHIP
The beneficial ownership, either directly or indirectly, of more than 25% of the voting securities of a fund creates presumption of control of the fund under Section 2(a)(9) of the Investment Company Act of 1940. As of August 31, 2009, the following shareholders held, for the benefit of their customers, the following percentages of the outstanding shares of each Fund:
| | Shareholder | Percent Owned as of August 31, 2009 |
| Fixed Income Fund | Farmers and Merchant Corp. | 63% |
| | Hubco Regions Financial Corp. | 35% |
| Quality Growth Fund | Charles Schwab & Co., Inc. | 52% |
| | Hubco Regions Financial Corp. | 36% |
| Large Cap Growth Fund | Farmers and Merchant Corp. | 97% |
| Select Value Fund | Hubco Regions Financial Corp. | 86% |
| Value Fund | Farmers and Merchant Corp. | 91% |
| Informed Investors Growth Fund | Farmers and Merchant Corp. | 44% |
| | Louis S. and Alexandra F. Wells | 29% |
7. CONTINGENCIES AND COMMITMENTS
The Funds indemnify the Trust’s officers and Trustees for certain liabilities that might arise from the performance of their duties to the Funds. Additionally, in the normal course of business the Funds enter into contracts that contain a variety of representations and warranties and which provide general indemnifications. Each Fund’s maximum exposure under these arrangements is unknown, as this would involve future claims that may be made against the Funds that have not yet occurred. However, based on experience, the Funds expect the risk of loss to be remote.
8. SECTOR RISK
When the Funds emphasize one or more economic sectors, it may be more susceptible to the financial, market, or economic events affecting the particular issuers and industries in which they invest than funds that do not emphasize particular sectors. The more a fund diversifies, the more it spreads risk and potentially reduces the risks of loss and volatility.
9. NEW ACCOUNTING PRONOUNCEMENT
In June 2009, FASB issued FASB Statement No. 168, “The FASB Accounting Standards Codification™ and the Hierarchy of Generally Accepted Accounting Principles – a replacement of FASB Statement No. 162” (“SFAS 168”). On the effective date of this standard, FASB Accounting Standards Codification™ (“Codification”) will become the source of authoritative U.S. accounting and reporting standards for nongovernmental entities, in addition to guidance issued by the Securities and Exchange Commission. All guidance contained in the Codification carries an equal level of authority. On the effective date of SFAS 168, the Codification will supersede all then-
MONTEAGLE FUNDS
NOTES TO FINANCIAL STATEMENTS (Continued)
existing non-SEC accounting and reporting standards. All other non-grandfathered non-SEC accounting literature not included in the Codification will become nonauthoritative. SFAS 168 is effective for financial statements issued for interim and annual periods ending after September 15, 2009. Management is currently evaluating the impact the adoption of SFAS 168 will have on the reporting of the Funds’ financial statements.
10. SUBSEQUENT EVENTS
Management has evaluated subsequent events through October 29, 2009, the date of the Funds’ financial statement issuance.
The Board of Trustees approved the Plan of Reorganization to merge the Large Cap Growth Fund with the Quality Growth Fund on October 28, 2009. The Trustees directed management to prepare the necessary documents to obtain shareholder approval. The reorganization is expected to become effective in December, 2009, subject to shareholder approval.
MONTEAGLE FUNDS
REPORT OF INDEPENDENT REGISTERED PUBLIC ACCOUNTING FIRM
To The Shareholders and Board of Trustees of
Monteagle Funds
We have audited the accompanying statements of assets and liabilities, including the schedules of investments, of Monteagle Funds (the “Funds”), comprising Monteagle Fixed Income Fund, Monteagle Quality Growth Fund, Monteagle Large Cap Growth Fund, Monteagle Select Value Fund, Monteagle Value Fund, and Monteagle Informed Investor Growth Fund as of August 31, 2009, and the related statements of operations for the year then ended, the statements of changes in net assets for each of the two periods in the period then ended, and the financial highlights for each of the five periods in the period then ended for Monteagle Fixed Income Fund, Monteagle Quality Growth Fund, Monteagle Large Cap Growth Fund, Monteagle Select Value Fund, and Monteagle Value Fund and for each of the two periods in the period then ended for Monteagle Informed Investor Growth Fund. These financial statements and financial highlights are the responsibility of Funds’ management. Our responsibility is to express an opinion on these financial statements and financial highlights based on our audits.
We conducted our audits in accordance with the standards of the Public Company Accounting Oversight Board (United States). Those standards require that we plan and perform the audit to obtain reasonable assurance about whether the financial statements and financial highlights are free of material misstatement. An audit includes examining, on a test basis, evidence supporting the amounts and disclosures in the financial statements. Our procedures included confirmation of securities owned as of August 31, 2009 by correspondence with the Funds’ custodian and brokers or by other appropriate auditing procedures where replies from brokers were not received. An audit also includes assessing the accounting principles used and significant estimates made by management, as well as evaluating the overall financial statement presentation. We believe that our audits provide a reasonable basis for our opinion.
In our opinion, the financial statements and financial highlights referred to above present fairly, in all material respects, the financial position of each of the funds constituting Monteagle Funds, as of August 31, 2009, the results of their operations, the changes in their net assets, and the financial highlights for the periods indicated therein, in conformity with accounting principles generally accepted in the United States of America.
COHEN FUND AUDIT SERVICES, LTD.
Westlake, Ohio
October 29, 2009
MONTEAGLE FUNDS
OTHER INFORMATION (Unaudited)
Proxy Policies — The Trust has adopted Proxy Voting Polices and Procedures under which the Funds vote proxies related to securities held by the Funds. A description of the Funds’ policies and procedures is available without charge, upon request, by calling the Funds toll free at 1-888-263-5593, or on the SEC website at http://www.sec.gov.
In addition, the Funds are required to file Form N-PX, with their complete voting record for the 12 months ended June 30th, no later than August 31st of each year. The Funds’ Form N-PX is available without charge, upon request, by calling the Funds toll free at 1-888-263-5593, or on the SEC’s website at http://www.sec.gov.
N-Q Filing — The SEC has adopted the requirement that all mutual funds file a complete schedule of investments with the SEC for their first and third fiscal quarters on Form N-Q. For the Monteagle Funds, this would be for the fiscal quarters ending November 30 and May 31. The Form N-Q filing must be made within 60 days of the end of the quarter. The Funds’ Forms N-Q are available on the SEC’s website at http://www.sec.gov., or they may be reviewed and copied at the SEC’s Public Reference Room in Washington, DC (call 1-800-732-0330 for information on the operation of the Public Reference Room).
RESULTS OF A SPECIAL MEETING OF SHAREHOLDERS OF MONTEAGLE QUALITY GROWTH FUND HELD ON APRIL 17, 2009 (Unaudited)
On April 17, 2009, a Special Meeting of Shareholders of the Monteagle Quality Growth Fund was held for the purpose of voting on the following proposals:
PROPOSAL 1: To approve or disapprove a new management agreement between Monteagle Funds and Nashville Capital Corporation for the Quality Growth Fund.
PROPOSAL 2: To approve or disapprove a new sub-advisory agreement between Monteagle Funds, Nashville Capital Corporation and Davis Hamilton Jackson & Associates, L.P. for the Quality Growth Fund.
The total number of shares of the Monteagle Quality Growth Fund present in person or by proxy represented approximately 58.88% of the shares entitled to vote at the Special Meeting.
The shareholders of the Monteagle Quality Growth Fund voted to approve the Proposals.
The votes cast with respect to the Proposals were as follows:
RESULTS OF A SPECIAL MEETING OF SHAREHOLDERS OF MONTEAGLE SELECT VALUE FUND HELD ON APRIL 17, 2009 (Unaudited)
On April 17, 2009, a Special Meeting of Shareholders of the Monteagle Select Value Fund was held for the purpose of voting on the following proposals:
PROPOSAL 1: To approve or disapprove a new management agreement between Monteagle Funds and Nashville Capital Corporation for the Select Value Fund.
PROPOSAL 2: To approve or disapprove a new sub-advisory agreement between Monteagle Funds, Nashville Capital Corporation and Parkway Advisors, L.P. for the Select Value Fund.
The total number of shares of the Monteagle Select Value Fund present in person or by proxy represented approximately 83.22% of the shares entitled to vote at the Special Meeting.
The shareholders of the Monteagle Select Value Fund voted to approve the Proposals.
The votes cast with respect to the Proposals were as follows:
FEDERAL TAX INFORMATION (Unaudited)
For the fiscal year ended August 31, 2009, certain dividends paid by Fixed Income Fund, Quality Growth Fund, Select Value Fund and Value Fund may be subject to a maximum tax rate of 15%, as provided for by the Jobs and Growth Tax Relief Reconciliation Act of 2003. The Funds intend to designate up to a maximum amount of $1,219,154, $14,366, $95,261, and $124,619, respectively, as taxed at a maximum rate of 15%. Complete information will be computed and reported in conjunction with your 2009 Form 1099-DIV.
MONTEAGLE FUNDS
ABOUT YOUR FUNDS’ EXPENSES (Unaudited)
We believe it is important for you to understand the impact of costs on your investment. As a shareholder of the Funds, you incur two types of costs: (1) transaction costs and (2) ongoing costs, including management fees and other Fund expenses. The following examples are intended to help you understand your ongoing costs (in dollars) of investing in the Funds and to compare these costs with the ongoing costs of investing in other mutual funds.
A mutual fund’s ongoing costs are expressed as a percentage of its average net assets. This figure is known as the expense ratio. The expenses in the tables below are based on an investment of $1,000 made at the beginning of the most recent semi-annual period (March 1, 2009) and held until the end of the period (August 31, 2009).
The tables that follow illustrate each Fund’s costs in two ways:
Actual fund return – This section helps you to estimate the actual expenses that you paid over the period. The “Ending Account Value” shown is derived from each Fund’s actual return, and the third column shows the dollar amount of operating expenses that would have been paid by an investor who started with $1,000 in the Funds. You may use the information here, together with the amount you invested, to estimate the expenses that you paid over the period.
To do so, simply divide your account value by $1,000 (for example, an $8,600 account value divided by $1,000 = 8.6), then multiply the result by the number given for the Funds under the heading “Expenses Paid During Period.”
Hypothetical 5% return – This section is intended to help you compare the Funds’ costs with those of other mutual funds. It assumes that each Fund had an annual return of 5% before expenses during the period shown, but that the expense ratio is unchanged. In this case, because the return used is not the Funds’ actual returns, the results do not apply to your investment. The example is useful in making comparisons because the Securities and Exchange Commission requires all mutual funds to calculate expenses based on a 5% return. You can assess each Fund’s costs by comparing this hypothetical example with the hypothetical examples that appear in shareholder reports of other funds.
Note that expenses shown in the table are meant to highlight and help you compare ongoing costs only. The Funds do not charge sales loads or redemption fees.
The calculations assume no shares were bought or sold during the period. Your actual costs may have been higher or lower, depending on the amount of your investment and the timing of any purchases or redemptions.
More information about the Funds’ expenses, including historical annual expense ratios, can be found in this report. For additional information on operating expenses and other shareholder costs, please refer to each Fund’s Prospectus.
MONTEAGLE FUNDS
ABOUT YOUR FUNDS’ EXPENSES (Unaudited) (Continued)
| | | Beginning Account Value 03/01/09 | Annualized Expense Ratio For the Period | Ending Account Value 8/31/09 | Expenses Paid During the Period* |
| Fixed Income Fund |
| Actual Return Based on actual return of: |
| | 4.34% | $1,000.00 | 1.06% | $1,043.40 | $5.46 |
| Hypethetical Return Based on assumed 5% return |
| | | $1,000.00 | 1.06% | $1,019.90 | $5.40 |
| Quality Growth Fund |
| Actual Return Based on actual return of: |
| | 33.46% | $1,000.00 | 1.34% | $1,334.60 | $7.89 |
| Hypethetical Return Based on assumed 5% return |
| | | $1,000.00 | 1.34% | $1,018.50 | $6.82 |
| Large Cap Growth Fund |
| Actual Return Based on actual return of: |
| | 19.53% | $1,000.00 | 1.33% | $1,195.30 | $7.36 |
| Hypethetical Return Based on assumed 5% return |
| | | $1,000.00 | 1.33% | $1,018.50 | $6.77 |
| Select Value Fund |
| Actual Return Based on actual return of: |
| | 34.72% | $1,000.00 | 1.36% | $1,347.20 | $8.05 |
| Hypethetical Return Based on assumed 5% return |
| | | $1,000.00 | 1.36% | $1,018.30 | $6.92 |
| Value Fund |
| Actual Return Based on actual return of: |
| | 36.71% | $1,000.00 | 1.33% | $1,367.10 | $7.94 |
| Hypethetical Return Based on assumed 5% return |
| | | $1,000.00 | 1.33% | $1,018.50 | $6.77 |
| Informed Investor Growth Fund |
| Actual Return Based on actual return of: |
| | 51.29% | $1,000.00 | 1.27% | $1,512.90 | $8.04 |
| Hypethetical Return Based on assumed 5% return |
| | | $1,000.00 | 1.27% | $1,018.80 | $6.46 |
| * | Expenses are equal to the Funds’ annualized expense ratio for the period, multiplied by the average account value over the period, multiplied by 184/365 (to reflect the one-half year period). |
MONTEAGLE FUNDS
TRUSTEES AND OFFICERS OF THE TRUST (Unaudited)
The business and affairs of the Funds are managed under the direction of the Board of Trustees in compliance with the laws of the state of Delaware. The names of the Trustees and executive officers of the Trust, their position with the Trust, address, age and principal occupations during the past five years are set forth below. Trustees have no official term of office and generally serve until they resign, or are not reelected.
| |
| INTERESTED TRUSTEES |
NAME, ADDRESS AND AGE | POSITION(S) HELD WITH TRUST | LENGTH OF TIME SERVED | PRINCIPAL OCCUPATION(S) DURING THE PAST 5 YEARS | NUMBER OF TRUST PORTFOLIOS OVERSEEN BY TRUSTEE | OTHER DIRECTORSHIPS OF PUBLIC COMPANIES |
Carl C. Peterson* 6550 Directors Pkwy, Abilene, Texas 79606 Age 49 | Trustee | Since 10-07-02 Since 11-29-02 | Parkway Advisors, L.P. CEO from 04/01 to present; Directors Investment Group, Inc., Director from 04/03 to present; Parkway Advisors Group, Inc. and Parkway Advisors Holdings, Inc. President from 04/01 to present | 6 | None |
| DISINTERESTED TRUSTEES |
Larry J. Anderson 4208 College Avenue Snyder, Texas 79549 Age 61 | Trustee | Since 11-29-02 | Certified Public Accountant, Anderson & West, P.C. January 1985 to present | 6 | None |
Brian J. Green 158 Cypress Abilene, Texas 79601 Age 51 | Trustee | Since 11-29-02 | Restaurateur, Cypress Street Station, February 1993 to present | 6 | None |
Charles M. Kinard 1725 Richland Drive Abilene, Texas 79603 Age 66 | Trustee | Since 11-29-02 | Retired; Senior Vice President and Trust Officer, First National Bank of Abilene until December 1998 | 6 | None |
| * | Mr. Peterson, as an affiliated person of a Sub-adviser of the Trust, is considered an “interested person” of the Trust within the meaning of Section 2(a)(19) of the 1940 Act. |
MONTEAGLE FUNDS
TRUSTEES AND OFFICERS OF THE TRUST (Unaudited) (Continued)
| |
| EXECUTIVE OFFICERS |
| NAME, ADDRESS AND AGE | POSITION(S) HELD WITH THE TRUST | PRINCIPAL OCCUPATION(S) DURING THE PAST 5 YEARS |
Paul B. Ordonio, JD Age 41 | President, CCO | Nashville Capital Corporation, VP of Development, 05/09 to present; Matrix Capital Group, Representative 05/09 to present; Aftermath Consulting, Inc., Director from 05/02 to present; P.O. Properties, Inc., Vice President from 06/99 to present; WordWise Document Services, LLC, President from 08/97 to present; Ordonio & Assoc., President from 11/97 to present; Parkway Advisors, L.P., VP & Counsel from 08/02 to 05/09; Parkway Advisors Group, Inc., VP and Counsel from 08/02 to 05/09. Parkway Holdings, VP from 08/02 to 05/09; Ultimus Fund Distributors, Representative 02/07 to 05/09; Citco Mutual Fund Distributors, Representative from 10/03 to 02/07. |
John Plunkett Age 47 | Vice President - National Sales | Nashville Capital Corporation, VP/National Sales, 8/08 to present; Matrix Capital Group, Representative 5/09 to present; JMP Capital Group LLC, President 5/09 to present; Quasar Fund Distributors, representative 3/06 to 2/08; Citco Mutual Fund Distributors, representative from 2/02 to 3/06 |
David F. Ganley Age 62 | Vice President, Secretary, AML Compliance Officer | Matrix Capital Group, Inc., Senior Vice President, 1/05 to present; Capital Management Investment Trust, Secretary, 5/08 to present; Congressional Effect Fund, Chief Compliance Officer 5/08 to present; Catalyst Funds, Secretary, Treasurer and Chief Compliance Officer 7/06 to present; Epiphany Funds, Chief Compliance Officer and Secretary 12/06 to present; The USX China Fund, Chief Compliance Officer 4/05 to present; The Blue and White Fund, Chief Compliance Officer 10/04 to 1/06; Shipley Raidy Capital Partners, Financial Principal, 1/01 to 1/05; InCap Securities, Inc. President, Treasurer and Director 1/01 to 12/04; Prisol Securities Inc. Financial Principal 1/01 to 12/04; InCap Service Company, Chief Administrative Officer, 1/01 to 12/04. |
Larry E. Beaver, Jr. Age 40 | Treasurer, CFO | Matrix Capital Group, Inc. Director of Accounting and Administration 1/05 to present; Capital Management Investment Trust, Treasurer 5/08 to present; Epiphany Funds, Chief Financial Officer and Treasurer 7/07 to present; Congressional Effect Fund, Treasurer 5/08 to present; AMIDEX Funds, Inc. Chief Accounting Officer 5/03 to present; InCap Service Company, Fund Accounting Supervisor 5/03 to 12/04 |
MONTEAGLE FUNDS
COMPENSATION OF TRUSTEES AND OFFICERS (Unaudited)
Each Trustee receives an annual fee of $7,500 and a fee of $500 for each Board meeting attended, and is also paid $500 for each committee meeting attended on a date when a Board meeting is not held. Trustees and officers are also reimbursed for travel and related expenses incurred in attending meetings of the Board.
Trustees that are affiliated with the Adviser or Sub-adviser receive no compensation from the Funds for their services or reimbursement for their associated expenses. Officers of the Trust receive no compensation from the Funds for their services, except that the Funds pay 50% of the compensation of the Trust’s Chief Compliance Officer.
The following table sets forth the fees paid by the Funds to each Trustee of the Trust for the year ended August 31, 2009:
| Name of Person | | Aggregate Compensation From Funds | | | Pension or Retirement Benefits Accrued as Part of Fund Expenses | | | Estimated Annual Benefits Upon Retirement | | | Total Compensation From Funds and Fund Complex Paid to Trustees | |
| Carl C. Peterson | | $ | 0 | | | $ | 0 | | | $ | 0 | | | $ | 0 | |
| Larry J. Anderson | | $ | 10,000 | | | $ | 0 | | | $ | 0 | | | $ | 10,000 | |
| Brian J. Green | | $ | 10,000 | | | $ | 0 | | | $ | 0 | | | $ | 10,000 | |
| Charles M. Kinard | | $ | 10,000 | | | $ | 0 | | | $ | 0 | | | $ | 10,000 | |
MONTEAGLE FUNDS
BOARD APPROVAL OF INVESTMENT SUB-ADVISORY AGREEMENT FOR
MONTEAGLE LARGE CAP GROWTH FUND (Unaudited)
On April 23, 2009, the Board of Trustees (the “Board”) of the Monteagle Funds (the “Trust”) met and evaluated the Sub-advisory Agreement between the Trust, Nashville Capital Corporation (the “Adviser”) and Northstar Capital Management, Inc. (“Northstar”) with respect to the Monteagle Large Cap Growth Fund (the “Large Cap Growth Fund”). The Independent Trustees requested and evaluated information they deemed reasonably necessary to their review process. The Board received information describing the services to be provided by Northstar, including (i) the nature, extent and quality of services provided by Northstar; (ii) the investment performance of the Fund measured against appropriate benchmarks; and (iii) general information about Northstar. At its meeting, the Board considered:
Nature, Extent and Quality of Services. The Board reviewed the functions performed by Northstar, the portfolio management team and support staff of Northstar. It was noted that Northstar had recently added investment, marketing and support staff to enhance its investment research and operational capabilities. The Board reviewed Northstar’s investment strategy and process for the Large Cap Growth Fund, Northstar’s financial condition and considered the quality of services provided. The Board also revisited information on the performance of the Large Cap Growth Fund and the performance information of a relevant securities index and a group of peer funds discussed earlier in this meeting. The comparison revealed that the Large Cap Growth Fund has been managed with a long-term perspective and has been strictly managed within stated objectives and limitations to maintain the desired style; and, while the performance of the strategy has not lead to performance better than the benchmarks, Northstar’s long-term performance was consistent with the strategy of quality large cap selections. Based on the information provided and the Board’s previous experience with Northstar, the Board concluded that the nature and extent of the services provided and to be provided by Northstar were appropriate and that the quality was acceptable; and the Board concurred with the Adviser’s actions to continue monitoring Northstar’s performance.
Fees. The Board considered the subadvisory fee rates under the Sub-Advisory Agreement and noted that the fee rates have not changed. The Board concluded that the subadvisory fee was reasonable and appropriate in amount given the quality of services provided.
Profitability. The Board considered the profitability information provided by Northstar with respect to its fees received under the Sub-Advisory Agreement. The Board considered that the subadvisory fee rates were negotiated at arm’s length between the Advisers and Northstar, and that Northstar is paid by the Advisers. The Board concluded that the profits realized by Northstar were not unreasonable.
Economies of Scale. The Board considered the extent to which economies of scale would be realized as the Large Cap Growth Fund grows and whether subadvisory fee levels reflect those economies of scale for the benefit of the Fund’s investors. Following further discussion of the Large Cap Growth Fund’s asset levels, expectations for growth, and fee levels, the Board of Trustees determined that the Fund’s fee arrangements, in light of all the facts and circumstances, were fair and reasonable in relation to the nature and quality of the services provided by the Northstar.
MONTEAGLE FUNDS
BOARD APPROVAL OF INVESTMENT SUB-ADVISORY AGREEMENT FOR
MONTEAGLE LARGE CAP GROWTH FUND (Unaudited) (Continued)
Other Benefits to Northstar. The Board noted that Northstar has indicated that Northstar benefits as a result of its relationship with the Large Cap Growth Fund from the use of the Fund’s brokerage under certain soft-dollar arrangements pursuant to which it receives research; and that, based on prior reviews, such arrangements are reasonable in relation to the research provided to Northstar.
Based on all of the information considered, the Board, including all of the Independent Trustees, concluded that the terms of the Sub-Advisory Agreement with Northstar were fair and reasonable and that approval of the Agreement for an additional annual period was in the best interests of the Large Cap Growth Fund and its shareholders; that the services to be performed under the Sub-Advisory Agreement were services required for the operation of the Large Cap Growth Fund; that Northstar has provided satisfactory advisory services to the Large Cap Growth Fund in the past; and that the fees for the advisory services which Northstar will perform were within the range of what would have been negotiated at arm’s length in light of the circumstances.
MONTEAGLE FUNDS
BOARD APPROVAL OF INVESTMENT SUB-ADVISORY AGREEMENT FOR
MONTEAGLE VALUE FUND (Unaudited)
On April 23, 2009, the Board of Trustees (the “Board”) of the Monteagle Funds (the “Trust”) met and evaluated the Sub-advisory Agreement between the Trust, Nashville Capital Corporation (the “Adviser”) and Robinson Investment Group (“Robinson”) with respect to the Monteagle Value Fund (the “Value Fund”). The Independent Trustees requested and evaluated information they deemed reasonably necessary to their review process. The Board received information describing the services to be provided by Robinson, including (i) the nature, extent and quality of services provided by Robinson; (ii) the investment performance of the Fund measured against appropriate benchmarks; and (iii) general information about Robinson. At its meeting, the Board considered:
Nature, Extent and Quality of Services. The Board reviewed the functions performed by Robinson, the portfolio management team and support staff of Robinson, Robinson’s investment strategy and process for the Value Fund, Robinson’s financial condition and considered the quality of services provided. The Board also reviewed information on the performance of the Value Fund, along with the performance information of a relevant securities index and a group of peer funds. The comparison revealed that the Value Fund has been managed with a long-term perspective and has been strictly managed within stated objectives and limitations to maintain the desired style, and that Robinson’s short and long-term performance was better than the benchmarks. Based on the information provided and the Board’s previous experience with Robinson, the Board concluded that the nature and extent of the services provided and to be provided by Robinson were appropriate and that the quality was excellent.
Fees. The Board considered the subadvisory fee rates under the Sub-Advisory Agreement and noted that the fee rates have not changed. The Board concluded that the subadvisory fee was reasonable and appropriate in amount given the quality of services provided.
MONTEAGLE FUNDS
BOARD APPROVAL OF INVESTMENT SUB-ADVISORY AGREEMENT FOR
MONTEAGLE VALUE FUND (Unaudited) (Continued)
Profitability. The Board considered the profitability information provided by Robinson with respect to its fees received under the Sub-Advisory Agreement. The Board considered that the subadvisory fee rates were negotiated at arm’s length between the Advisers and Robinson, and that Robinson is paid by the Advisers. The Board concluded that the profits realized by Robinson were not unreasonable.
Economies of Scale. The Board considered the extent to which economies of scale would be realized as the Value Fund grows and whether subadvisory fee levels reflect those economies of scale for the benefit of the Fund’s investors. Following further discussion of the Value Fund’s asset levels, expectations for growth, and fee levels, the Board of Trustees determined that the Value Fund’s fee arrangements, in light of all the facts and circumstances, were fair and reasonable in relation to the nature and quality of the services provided by the Robinson.
Other Benefits to Robinson. The Board noted that Robinson has indicated that it does not believe it receives any fall-out benefits as a result of its relationship with the Value Fund. The Board also considered that Robinson does do not enter into any soft-dollar arrangements on behalf of the Value Fund.
Based on all of the information considered, the Board, including all of the Independent Trustees, concluded that the terms of the Sub-Advisory Agreement with Robinson were fair and reasonable and that approval of the Agreement for an additional annual period was in the best interests of the Value Fund and its shareholders; that the services to be performed under the Sub-Advisory Agreement were services required for the operation of the Value Fund; that Robinson has provided satisfactory advisory services to the Value Fund in the past; and that the fees for the advisory services which Robinson will perform were within the range of what would have been negotiated at arm’s length in light of the circumstances.
MONTEAGLE FUNDS
BOARD APPROVAL OF INVESTMENT SUB-ADVISORY AGREEMENT FOR
MONTEAGLE FIXED INCOME FUND (Unaudited)
On July 14, 2009, the Board of Trustees (the “Board”) of the Monteagle Funds (the “Trust”) met and evaluated the Sub-advisory Agreement between the Trust, Nashville Capital Corporation (the “Adviser”) and Howe & Rusling, Inc. (“H&R”) with respect to the Monteagle Fixed Income Fund (the “Fixed Income Fund”). The Independent Trustees requested and evaluated information they deemed reasonably necessary to their review process. The Board received information describing the services to be provided by H&R, including (i) the nature, extent and quality of services provided by H&R; (ii) the investment performance of the Fund measured against appropriate benchmarks; and (iii) general information about H&R. At its meeting, the Board considered:
Nature, Extent and Quality of Services. The Board reviewed the functions performed by H&R, the portfolio management team and support staff of H&R, their investment strategy and process for the Fixed Income Fund, H&R’s financial condition and considered the quality of services provided. Based on the information provided and the Board’s previous experience with H&R, the
MONTEAGLE FUNDS
BOARD APPROVAL OF INVESTMENT SUB-ADVISORY AGREEMENT FOR
MONTEAGLE FIXED INCOME FUND (Unaudited) (Continued)
Board concluded that the nature and extent of the services provided and to be provided by H&R were appropriate and that the quality was excellent.
Fees. The Board considered the subadvisory fee rates under the Sub-Advisory Agreement and noted that the fee rates have not changed. The Board concluded that the subadvisory fee was reasonable and appropriate in amount given the quality of services provided.
Profitability. The Board considered the profitability information provided by H&R with respect to its fees received under the Sub-Advisory Agreement. The Board considered that the subadvisory fee rates were negotiated at arm’s length between the Advisers and H&R, and that H&R is paid by the Advisers. The Board concluded that the profits realized by H&R were not unreasonable.
Economies of Scale. The Board considered the extent to which economies of scale would be realized as the Fixed Income Fund grows and whether subadvisory fee levels reflect those economies of scale for the benefit of the Fund’s investors. Following further discussion of the Fixed Income Fund’s asset levels, expectations for growth and fee levels, the Board of Trustees determined that the Fund’s fee arrangements, in light of all the fact and circumstances, were fair and reasonable in relation to the nature and quality of the services provided by H&R.
Other Benefits to H&R. The Board noted that H&R indicated that there are no benefits that will accrue to H&R because of its relationship with the Trust. The Board also considered that H&R does not enter into any soft-dollar arrangements on behalf of the Fixed Income Fund.
Based on all of the information considered, the Board, including all of the Independent Trustees, concluded that the terms of the Sub-Advisory Agreement with H&R were fair and reasonable and that approval of the Agreement for an additional annual period was in the best interests of the Fixed Income Fund and its shareholders; that the services to be performed under the Sub-Advisory Agreement were services required for the operation of the Fixed Income Fund; that H&R has provided satisfactory advisory services to the Fixed Income Fund in the past; and that the fees for the advisory services which H&R will perform were within the range of what would have been negotiated at arm’s length in light of the circumstances.
THE MONTEAGLE FUNDS
Investment Adviser Nashville Capital Corporation 209 10th Ave. South, Suite 332 Nashville, TN 37203
Distributor Matrix Capital Group, Inc. 420 Lexington Ave. Suite 601 New York, NY 10170
Transfer Agent, Administrator & Shareholder Servicing Agent Matrix Capital Group, Inc. 630 Fitzwatertown Rd. Building A, 2nd Floor Willow Grove, PA 19090
(888) 263-5593 www.monteaglefunds.com
This report is submitted for the general information the shareholders of the Funds. It is not authorized for distribution to prospective investors in the Funds unless preceded or accompanied by a current prospectus, which includes information regarding the Fund’s objectives and policies, experience of its management, marketability of shares, and other information. |
| (a) | The registrant has, as of the end of the period covered by this report, adopted a code of ethics that applies to the registrant's principal executive officer, principal financial officer, and principal accounting officer or controller, or persons performing similar functions, regardless of whether these individuals are employed by the registrant or a third party. |
| (b) | During the period covered by this report, there were no amendments to any provision of the code of ethics. |
| (c) | During the period covered by this report, there were no waivers or implicit waivers of a provision of the code of ethics. |
| ITEM 3. | AUDIT COMMITTEE FINANCIAL EXPERT. |
| | The registrant’s Board of Trustees has determined that the registrant has at least one audit committee financial expert serving on its audit committee. The name of the audit committee financial expert is Larry J. Anderson. Mr. Anderson is “independent” for purposes of this item. |
| ITEM 4. | PRINCIPAL ACCOUNTANT FEES AND SERVICES. |
(a) | Audit Fees. The aggregate fees billed for professional services rendered by the principal accountant for the audit of the registrant’s annual financial statements or for services that are normally provided by the accountant in connection with statutory and regulatory filings or engagements were $48,000 and $47,203 with respect to the registrant’s fiscal years ended August 31, 2009 and 2008 respectively. |
| | |
| (b) | Audit-Related Fees. The aggregate fees billed for assurance and related services by the principal accountant that are reasonably related to the performance of the audit of the registrant’s financial statements and are not reported under paragraph (a) of this Item were $1,600 and $4,500 with respect to the registrant’s fiscal years ended August 31, 2009 and 2008, respectively. The services comprising these fees are for consents and review of the registrant’s dividend calculations. |
| (c) | Tax Fees. The aggregate fees billed in each of the last two fiscal years for professional services rendered by the principal accountant for tax compliance, tax advice and tax planning were $15,300 and $10,800 with respect to the registrant’s fiscal years ended August 31, 2009 and 2008, respectively. The services comprising these fees are the preparation of the registrant’s federal income and excise tax returns. |
| (d) | All Other Fees. The aggregate fees billed in each of the last two fiscal years for products and services provided by the registrant’s principal accountant, other than the services reported in paragraphs (a) through (c) of this item were $0 and $0 for the fiscal years ended August 31, 2009 and 2008 respectively. |
| | |
| (e)(1) | The audit committee has not adopted pre-approval policies and procedures described in paragraph (c) (7) of Rule 2-01 of regulation S-X. |
| | |
| (e)(2) | There were no services described in each of paragraphs (b) through (d) of this Item that were approved by the audit committee pursuant to paragraph (c)(7)(i)(C) of Rule 2-01 of Regulation S-X. |
| | |
| (f) | Less than 50% of the hours expended on the principal accountant’s engagement to audit the registrant’s financial statements for the most recent fiscal year were attributed to work performed by persons other than the principal accountant’s full-time permanent employees. |
| (g) | All non-audit fees billed by the registrant's principal accountant for services rendered to the registrant for the fiscal years ended August 31, 2009 and 2008 respectively are disclosed in (b)-(d) above. There were no audit or non-audit services performed by the registrant's principal accountant for the registrant's adviser or sub-advisers. |
| ITEM 5. | AUDIT COMMITTEE OF LISTED REGISTRANTS. |
Not applicable
| ITEM 6. | SCHEDULE OF INVESTMENT |
Included in annual report to shareholders filed under item 1 of this form.
| ITEM 7. | DISCLOSURE OF PROXY VOTING POLICIES AND PROCEDURES FOR CLOSED-END MANAGEMENT INVESTMENT COMPANIES. |
Not applicable Fund is an open-end management investment company
| ITEM 8. | PORTFOLIO MANAGERS OF CLOSED-END MANAGEMENT INVESTMENT COMPANIES |
Not applicable Fund is an open-end management investment company
| ITEM 9. | PURCHASES OF EQUITY SECURITIES BY CLOSED-END MANAGEMENT INVESTMENT COMPANY AND AFFILIATED PURCHASERS. |
Not applicable Fund is an open-end management investment company
| ITEM 10. | SUBMISSION OF MATTERS TO A VOTE OF SECURITY HOLDERS. |
Not applicable at this time.
| ITEM 11. | CONTROLS AND PROCEDURES. |
| | (a) | The registrant's principal executive and principal financial officers, or persons performing similar functions, have concluded that the registrant's disclosure controls and procedures (as defined in Rule 30a-3(c) under the 1940 Act, are effective, as of a date within 90 days of the filing date of this report, based on the evaluation of these controls and procedures required by Rule 30a-3(b) under the 1940 Act and Rule 15d-15(b) under the Securities Exchange Act of 1934, as amended. |
| | (b) | There were no changes in the registrant's internal control over financial reporting (as defined in Rule 30a-3(d) under the 1940 Act) that occurred during the period covered by this report that have materially affected, or are reasonably likely to materially affect, the registrant's internal control over financial reporting. |
(1) Code of Ethics for Principal Executive and Senior Financial Officers is attached hereto.
(2) Certifications pursuant to Section 302 of the Sarbanes-Oxley Act of 2002 are filed herewith.
(3) Certifications pursuant to Section 906 of the Sarbanes-Oxley Act of 2002 are filed herewith.
SIGNATURES
Pursuant to the requirements of the Securities Exchange Act of 1934 and the Investment Company Act of 1940, the registrant has duly caused this report to be signed on its behalf by the undersigned, thereunto duly authorized.
Monteagle Funds
| By Paul B. Ordonio | /s/ Paul B. Ordonio |
| President, |
| Date: November 6, 2009 | |
Pursuant to the requirements of the Securities Exchange Act of 1934 and the Investment Company Act of 1940, this report has been signed below by the following person on behalf of the registrant and in the capacities and on the date indicated.
| By Paul B. Ordonio | /s/ Paul B. Ordonio |
| President |
| Date: November 6, 2009 | |
Pursuant to the requirements of the Securities Exchange Act of 1934 and the Investment Company Act of 1940, this report has been signed below by the following person on behalf of the registrant and in the capacities and on the date indicated.
| By Larry E. Beaver, Jr. | /s/ Larry E. Beaver, Jr. |
| Treasurer |
| Date: November 6, 2009 | |