Letter from the President | 3 |
Management’s Discussion of Fund Performance | 4 |
Supplementary Portfolio Information | 31 |
| Financial Statements of the Monteagle Funds | |
| Schedule of Investments: | |
Fixed Income Fund | 36 |
Informed Investor Growth Fund | 40 |
Quality Growth Fund | 42 |
Select Value Fund | 46 |
Value Fund | 50 |
Statements of Assets and Liabilities | 53 |
Statements of Operations | 55 |
Statements of Changes in Net Assets | 57 |
Financial Highlights | 62 |
Notes to Financial Statements | 67 |
Report of Independent Registered Public Accounting Firm | 85 |
Other Information | 86 |
About Your Funds’ Expenses | 87 |
Trustees and Officers of the Trust | 90 |
LETTER FROM THE PRESIDENT (Unaudited) |
Dear Shareholders:
Enclosed is the Annual Report for the Monteagle Funds. I encourage you to carefully review the information presented in this Annual Report as it contains valuable information about your investment.
As you will notice in reviewing the Annual Report, despite the headwinds and market fluctuations, we continue to uncover opportunities in high quality, solid credit and attractive valuation areas.
As we reflect on this past fiscal year, we continue to see several headlines domestically and around the world during the period, such as slow economic recovery, sovereign debt and austerity moves, civil unrest, natural disasters, and commodity inflation, that had a dramatic effect on the markets in which the Monteagle Funds invest. Despite the volatility that these headlines have created in the day-to-day stock markets, we have often said that we view investing as a marathon, not a sprint. As a result, we remain optimistic as we expect that the effect of some of these events will be short-lived although others may take longer to work their way through the system. We believe that remaining disciplined with a longer-term focus will benefit patient investors.
In closing, we would like to thank you for your continued confidence and support of the Monteagle Funds.
Sincerely,
MONTEAGLE FUNDS
Paul B. Ordonio, JD
President
MONTEAGLE FIXED INCOME FUND A DISCUSSION OF FUND PERFORMANCE (Unaudited) |
How did the Fund Perform?
The Monteagle Fixed Income Fund (the “Fund”) benefitted from another year of positive returns. For the year ended August 31, 2012, the Fund had a total return of 3.48%. For the three and six month periods ended August 31, 2012, the Fund had total returns of 0.97% and 1.90%, respectively. The second half of the year had slightly more positive returns than the first half.
The Fund’s benchmark index, the Barclay’s Capital Intermediate U.S. Government/Credit Index (the “Barclay’s Index”) had relative returns of 4.04%, 1.24%, and 2.29% for the twelve, three, and six month periods, ended August 31, 2012, respectively.
What Influenced Fund Performance?
While we are marking the end of another fiscal year of solid performance, the driving factors influencing performance of the bond markets, and, as a result, the performance of the Fund, are very much the same ones we highlighted last year. The primary factors influencing lower and lower interest rates are reduced expectations of global economic growth and continued easing of monetary policy in most of the major global economies. Both factors contributed to positive performance of the Fund.
The beginning of the fiscal year started with better prospects for growth as measured by GDP (Gross Domestic Product). Economic releases showed improvement on a quarter-by-quarter basis toward the end of 2011 with Annualized GDP improving from approximately 2% in the 3rd quarter of 2011 to 3% in the 1st quarter of 2012. However, markets were disappointed as the balance of the year showed a slowing of growth, with preliminary GDP estimates for the 2nd quarter of 2012 coming in below 2%. Because of the lag in when data is collected and reported, we won’t know how the 2nd half of the year will evolve until the end of 2012 and into early 2013. However, expectations are not improving. With lower expectations for growth, the bond markets and the Fund have seen better second half performance than that displayed in the 1st half of the fiscal year.
Continued weakness and disappointment in the labor market has reinforced these less than optimistic expectations for renewed robust economic growth. This too has positively affected Fund performance. However, the entire year was not without some hope for improvement in the labor market. Beginning in December 2011, the economy added more than 200,000 nonfarm payrolls for three consecutive months. This certainly had a negative effect, at the time, on the bond markets and on the Fund itself, with the biggest declines occurring in March 2012. However, the trend did not continue and new job growth has been disappointing for much of the remainder of the year. Unemployment continues to be above 8% with under-employment (those unemployed, discouraged and not looking for work, and those working part-time out of necessity) closer to 15%.
The problems in Europe continue to have negative effects on the global economy, and undoubtedly have had a negative effect on our U.S. economy. It is well known that the problems in the European Union are not limited to Greece, which has had to restructure their debt and has adopted austerity measures that have kept the recession in that country in full force for approximately 5 years. We now know that the 3rd and 4th largest economies in the European Union are also in full recession.
MONTEAGLE FIXED INCOME FUND A DISCUSSION OF FUND PERFORMANCE (Unaudited) (Continued) |
Both Italy and Spain are struggling with sovereign debt burdens that have led to historically high borrowing rates and forced both governments to implement austerity measures to reduce government deficits and attempt to regain the confidence of the capital markets. The resulting cuts in budgetary spending have contributed to their recessions. All indications are that the entire European Union is currently in recession. These problems have continued to lend support to the United States as a safe haven for investments. Both equities and bonds have benefited from the flow of capital from weaker European markets to our own. As such, this has enhanced the Fund’s performance.
In response to continued global economic weakness, interest rates in the strongest economies have responded accordingly. U.S. Treasury interest rates continue to decline. Over the last twelve months, longer maturity Treasury yields have declined significantly. 7, 10, and 30 year U.S. Treasury Note maturities have declined by 0.57%, 0.68%, and 0.92% respectively. Declining yields have a positive effect on bond prices and on performance. The shorter term maturity Treasury yields have remained approximately the same over the year.
The monetary policy pursued by the Federal Reserve Bank continues to support attempts to stimulate the U.S. economy and job growth by maintaining short-term rates (Fed Funds overnight lending rate) at historically low levels between 0.00% and 0.25%. This “zero interest rate policy” has contributed to a very low yielding environment, which in turn has resulted in an increased demand for higher yielding securities and a greater appetite for riskier asset classes. Additionally, the Quantitative Easing program put in place in September 2011 that was scheduled to end in June 2012, was extended through the end of 2012. The “Maturity Extension Program” (or “Operation Twist”) has had a direct impact on lowering longer term interest rates through purchases of U.S. Treasury Securities with maturities between 6 and 30 years while at the same time selling an equal amount of U.S. Treasury Securities of less than 6 years in maturity. While this program did not increase the money supply, it did succeed in lowering longer term interest rates, as mentioned above, and did stimulate demand for riskier asset classes. The increased demand led to higher asset prices for equities and high yield bonds.
Our responses to these events have primarily been a disciplined approach to a high quality portfolio profile. We remain committed to the Fund’s strategy of holding a well diversified portfolio of high quality bonds. We believe that the markets have rewarded our patience and prudence. However, we have made some changes over the last year.
The principal variables affecting bond portfolio performance are overall duration and maturity structure of the portfolio, as well as, Market Sector allocation and credit quality. The first two charts below illustrate the market sector composition of the Fund’s Portfolio at the beginning and end of this past fiscal year.
MONTEAGLE FIXED INCOME FUND A DISCUSSION OF FUND PERFORMANCE (Unaudited) (Continued) |
Comparative Market Sector Weights
(as a percentage of market values plus accrued interest)
Monteagle Fixed Income Fund
August 31, 2011 | August 31, 2012 |
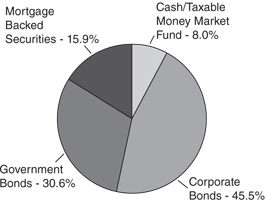 |  |
| | • | During the course of the year we slightly increased the Fund’s market allocation to corporate bonds while decreasing the allocation to Government Agency securities. The decision to increase the allocation to corporate bonds relative to government bonds in general contributed positively to relative performance as the corporate sector outperformed the intermediate government/credit index and government bonds over the last year. |
| |
| U.S. Treasury: Intermediate | 2.78% |
| U.S. Agency Intermediate | 2.02% |
| Intermediate Corporate | 7.42% |
| Invest. Grade: Industrial — Intermediate | 6.43% |
| Invest. Grade: Financial Institutions — Intermediate | 9.09% |
| U.S. MBS: Agency Fixed Rate MBS | 3.71% |
| | • | Duration was slightly increased over last year. As of August 31, 2012 the Fund’s portfolio duration was 4.3 years compared to 4.1 years at 2011 fiscal year end. Maturity was relatively unchanged at 4.8 years versus 4.7 years at 2011 fiscal year end. When compared to the Barclay’s Index’s duration and weighted average maturity of 3.9 and 4.3, the Fund’s portfolio is slightly longer in both measures. This actually had a positive benefit to Fund performance in the 2nd half of the year as longer term rates declined over that period of time. The portfolio’s securities are fairly distributed across maturity ranges. 32.7% of the securities mature in less than 3 years, 31.7% in 3 to 7 years, and 35.6% in 7 to 10 years. |
MONTEAGLE FIXED INCOME FUND A DISCUSSION OF FUND PERFORMANCE (Unaudited) (Continued) |
Comparative Credit Quality
(as a percentage of market values plus accrued interest, excluding cash)
Monteagle Fixed Income Fund
Moody’s Ratings August 31, 2011 | Moody’s Ratings August 31, 2012 |
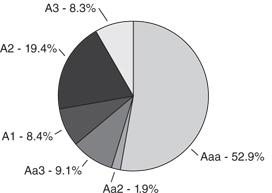 |  |
| | • | The preceding charts represent the credit quality distribution of the Fund’s securities holdings (not including cash or money market securities) at the beginning and end of this past fiscal year. In our distribution comparison above, we have only included the ratings provided by Moody’s (and not S&P which rates U.S. Government obligations AA+) for consistency of the relative analysis. The Barclay’s Index still maintains ratings of AAA on U.S. Government obligations. |
| | • | The overall credit quality of the portfolio marginally decreased over the course of the year. Our overweighting of corporate bonds and underweighting of government bonds has lowered quality slightly, but credit quality remains excellent with overall ratings of AA-/AA or Aa3/Aa2. |
| | • | We would also note that at the end of this fiscal year the fund’s portfolio contained investment grade securities rated below A3/A-. While we are restricted from investing in securities rated below A3/A- at time of purchase, we do have the discretion of holding securities rated Baa/BBB should the rating be the result of a downgrade. It is our opinion that the Fund’s holdings of such securities do not materially affect the overall credit quality of the Fund’s portfolio and do not represent significant credit risk to portfolio value. The following table specifically identifies the securities held by the Fund at the end of the fiscal year that were downgraded below A3/A during the fiscal year ended August 31, 2012. |
MONTEAGLE FIXED INCOME FUND A DISCUSSION OF FUND PERFORMANCE (Unaudited) (Continued) |
| | | |
| Amgen, Inc., 4.85%, due 11/18/14 | Baa1 | A+ | 0.82% |
| Amgen, Inc., 4.50%, due 03/15/20 | Baa1 | A+ | 0.86% |
| Bank of America Corp 4.875%, due 01/15/13 | Baa2 | A- | 1.53% |
| Morgan Stanley, 3.45%, due 11/2/15 | Baa1 | A- | 1.52% |
| Pitney Bowes, Inc., 5.75%, due 09/15/17 | Baa1 | BBB+ | 0.83% |
| Total | | | 5.56% |
| | • | The following table provides a summary illustration of how investment grade bonds of varying credit quality have performed over the past year. These are returns of bonds in the Barclay’s Index. The relative performance of credit is indicative of the risk/reward nature of these bonds. We can see that for the full year lesser quality bonds had a significant performance advantage over higher quality. In this respect, the performance of the Fund did not benefit from the higher returns associated with Baa rated bonds. It is quite clear from the following table that the continued zero rate monetary policy of the Federal Reserve Open Market Committee has increased the demand for higher yielding, lower quality fixed income securities. |
| | | |
| Aaa | 2.68% | 2.30% | 1.24% |
| Aa | 3.81% | 1.66% | 0.55% |
| A | 7.34% | 2.08% | 1.33% |
| Baa | 8.04% | 3.95% | 3.10% |
| Total | 4.04% | 3.96% | 2.82% |
| | • | For the year, trading was primarily driven by the replacement of Agency bonds with the purchase of corporate bonds and slightly longer dated Treasury bonds. The Fund also tactically traded 10 year Treasuries, adding and removing positions at times we felt yields were falling and rising respectively. This strategy resulted in gains and benefited the Fund. |
MONTEAGLE FIXED INCOME FUND A DISCUSSION OF FUND PERFORMANCE (Unaudited) (Continued) |
What is the Fund’s Strategy?
The Fund will continue to invest in high quality, intermediate-term, fixed income securities generally between 2 and 10 years in maturity. The Fund will continue to monitor economic conditions through the use of a proprietary model in an attempt to anticipate interest rate changes and lengthen or shorten the duration of the Fund’s portfolio of securities to maximize total return with minimal risk. The Fund will also actively manage portfolio holdings across market sectors in order to maximize total return within the scope of permitted investments defined by the Fund’s prospectus. While we have taken prudent steps to diversify the Fund’s assets by limiting exposure to the credit and interest rate risk associated with any one specific issuer, market sector, or maturity range, those risks cannot be completely eliminated without affecting long-term Fund performance. We remain vigilant and will act in your best interest to preserve the Fund’s asset values.
Fund performance shown represents the performance of the Fund’s Class I shares. For complete performance information, please refer to the Average Annual Total Return table in the following performance report. Past performance is not predictive of future performance. Investment results and principal value will fluctuate so that shares, when redeemed, may be worth more or less than their original cost. Current performance may be higher or lower than the performance data quoted. Performance data current to the most recent month-end, are available by calling 1-888-263-5593.
An investor should consider the investment objectives, risks, charges and expenses of the Fund carefully before investing. The Fund’s prospectus contains this and other important information. To obtain a copy of the Fund’s prospectus please call 1-888-263-5593 and a copy will be sent to you free of charge. Please read the prospectus carefully before you invest. The Fund is distributed by Matrix Capital Group, Inc.
Management’s Discussion of Fund Performance seeks to describe some of the Sub-Adviser’s current opinions and views of the financial markets. Although the Sub-Adviser believes it has a reasonable basis for any opinions or views expressed, actual results may differ, sometimes significantly so, from those expected or expressed.
MONTEAGLE FIXED INCOME FUND PERFORMANCE — August 31, 2012 (Unaudited) |
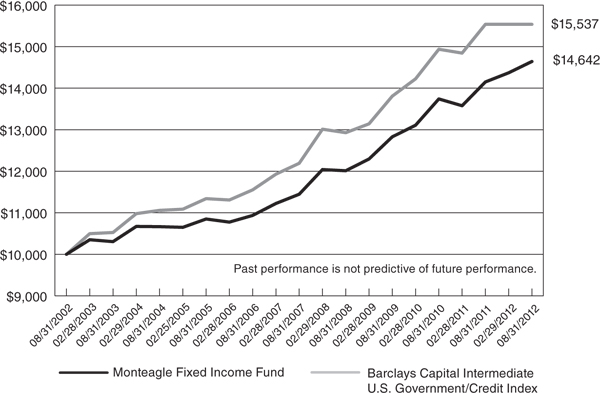
Comparison of the Change in Value of a $10,000 Investment in Monteagle Fixed Income Fund
and the Barclays Capital Intermediate U.S. Government/Credit Index
Average Annual Total Return (for the periods ended August 31, 2012) |
| | | | |
| Monteagle Fixed Income Fund | 3.48% | 5.05% | 3.89% |
| Barclays Capital Intermediate U.S. Government/Credit Index | 4.04% | 5.80% | 4.92% |
The performance information quoted in this annual report assumes the reinvestment of all dividend and capital gain distributions, if any, and represents past performance, which is not a guarantee of future results. The returns shown do not reflect taxes that a shareholder would pay on Fund distributions or on the redemption of Fund shares. The investment return and principal value of an investment will fluctuate and, therefore, an investor’s shares, when redeemed, may be worth more or less than their original cost.
The above graph depicts the performance of the Monteagle Fixed Income Fund versus the Barclays Capital Intermediate U.S. Government/Credit Index (formerly Lehman Brothers U.S. Intermediate Government/Credit Index). The Barclays Capital Intermediate U.S. Government/Credit Index measures the performance of dollar denominated U.S. Treasuries, government-related (i.e. U.S. and foreign agencies, sovereign, supranational and local authority debt), and investment grade credit structures that have a remaining maturity of greater than or equal to one year and less than ten years. Please note that indices do not take into account any fees and expenses of investing in the individual securities that they track, and individuals cannot invest directly in any index.
As with any fund, save an index fund, that commonly compares its performance to the Barclays Capital Intermediate U.S. Government/Credit Bond Index, such a comparison may be said to be inappropriate because of the dissimilarity between the Fund’s investments and the securities comprising the index; so too with the Monteagle Fixed Income Fund, which will not invest in certain securities comprising this index.
MONTEAGLE INFORMED INVESTOR GROWTH FUND A DISCUSSION OF FUND PERFORMANCE (Unaudited) |
The Monteagle Informed Investor Growth Fund (the “Fund”) returned a positive, though disappointing, 14.81% for the fiscal-year ending August 31, 2012. The S&P 500 Index (“S&P 500”), the Fund’s benchmark, rose 18.00%
The Fund’s fiscal-year portfolio performance was negatively affected by the recurring bouts of monetary crisis within the Eurozone. These periodic crisis episodes fell hardest on global financial institutions, which carried a sector weighting of approximately 14% in the S&P 500. But because of the perceived threat it represented to world collapse and the presumed crashing end to life as known on this planet, the drama-packed markets targeted all growth stocks. This exposed the Fund, with its normal growth stock portfolio weighting in excess of 90%, and the S&P 500 and its 30% weighting in growth stocks, to a brutally sharp sell-off. For a time, Jurassic Park loomed large indeed. However, almost on cue, the Euro Band-Aid relief squad periodically was rushed to the rescue, and what was once viewed as the road to ruin magically became the Yellow Brick Road.
But only for a brief period of time; the “remedies” had a shelf-life of seemingly 10 minutes before the outlook reversed as new and, of course, more threatening rumors of disaster surfaced in Euro land — the land-locked Titanic.
In late spring, of this year, the market bungee-jumped. The S&P 500 suffered an ominous 15 losses in 22 trading days. It was one of the weakest months of May in market history, with only five up days for the S&P 500. This happened only once previously in 86 years. For most investors, buying when there was blood in the streets suddenly seemed less compelling when that blood-letting happened to be their own.
The fiscal-year ended with the market shifting to cruise control for much of the month of August. During that month, the S&P 500 formed one of the tightest 8-day closing ranges since 1928, with a high-to-low range of less than 0.35%, and the second-tightest 17-day trading range in 40 years.
FUND MANAGEMENT AND STRATEGY
The Fund invests primarily in medium capitalization stocks of well-managed, financially sound companies, offering under-valued earnings and cash flow growth opportunities. These are companies, in which, management or large outside investors are significant common stock owners or buyers, or where the company itself is repurchasing its own shares on the open market. This investment discipline is now recognized as The Informed Investor Strategy.
Quite simply, these companies qualify for research analysis only if they meet at least one of these four first-screen tests:
| | 1. | The company’s officers and directors are buying its common stock on the open market. |
| | 2. | A major outside investor (minimum 5% shares outstanding owned) has filed a Form 13-D purchase disclosure on the company’s stock. |
| | 3. | The company has announced its intent to repurchase its common stock on the open market. |
| | 4. | A significant percentage of the company’s stock is owned by family/management. |
The buy disciplines are matched by a series of five sell disciplines. They are:
| | 1. | Begin selling if a stock drops a minimum of 8% from an average cost basis. |
MONTEAGLE INFORMED INVESTOR GROWTH FUND A DISCUSSION OF FUND PERFORMANCE (Unaudited) (Continued) |
| | 2. | Begin selling when a holding-high loss-limit is triggered (stock falls a minimum of 14% from its portfolio holding-high price). |
| | 3. | Begin selling on preliminary indications of a stock breakdown in a company’s financials. |
| | 4. | Begin selling when informed investors’ stock transaction signals turn bearish. |
| | 5. | Sell partial positions of a portfolio stock after sharp price run-ups. |
The Fund profited from its two dominating sector allocations: Information Technology and Consumer Discretionary. At year-end, these two sectors accounted for approximately 50% of the Fund’s equity portfolio weightings. Information Technology was led by Apple (AAPL) which returned 38.1% during the year.
Major new securities bought in the first fiscal quarter and their performance during the quarter were Solarwinds (SWI) 32.8% and Ulta Salon Cosmetics and Fragrances (ULTA) 1.4% - - both of which are still held in the portfolio.
In the second quarter, major equity positions added to the Fund along with their performance during the quarter included Apple (AAPL) 60.0%, Continental Resources (CLR) -55.2%, Cummins, Inc. (CMI) -5.7%, Fastenal (FAST) 32.5%, B/E Aerospace (BEAV) -3.8%, Ca, Inc. (CA) 4.6%, McDonalds (MCD) -5.7%, Parametric Technology (PMTC) -3.7%, Qualcom (QCOM) 4.3%, Select Comfort (SCSS) 36.0%, Tractor Supply (TSCO) 14.6% and Valspar (VAL) 19.4%. All except Apple were later sold in response to stop-loss sell triggers occurring in a volatile market.
In the third quarter, positions added and their performance during the quarter were Align Technologies (ALGN) -15.5%, MasterCard (MA) -21.2%, Monster Beverage (MNST) 31.3%, Questcor Pharmaceuticals (QCOR) 8.2%, Seagate Technologies (STX) -63.0% and Ebay (EBAY) -6.2%. Out of these, ALGN, QCOR and EBAY remained in the portfolio at August 31, 2012.
Beginning in the fourth quarter, positions purchased and their performance during the quarter were Mellanox Technologies (MLNX) -20.4%, TJX Company (TJX) 5.7%, Western Digital (WDC) 8.4%, Lumber Liquidators (LL) 33.0% and Michael Kors (KORS) 3.5% All of these positions remained in the portfolio at August 31, 2012.
On a full fiscal-year time basis, the portfolio performance was positively impacted most by these three largest-weighted sectors: Information Technology (+21%), Healthcare (+19%) and Consumer Discretionary (+11%). It was negatively impacted, on a relative performance basis, by the three largest-weighted lagging sectors: Materials (-12%), Energy (+3%) and Utilities (+5%).
Measured on a total return basis, for the full fiscal year, the top-ten portfolio equity holdings contributing most to the Fund’s performance were: HANS (Hanson), LL (Lumber Liquidators), WNR (Western Refining), ESRX (Express Scripts), ROST (Ross Stores), ALXN (Alexion Pharmaceuticals), DLTR (Dollar Tree), EBAY (Ebay), SCSS (Select Comfort) and AAPL (Apple)
The ten portfolio equity holdings contributing the least to the Fund’s performance for the full fiscal-year were: SAVE (Spirit Airlines), CTRX (Catamaran Group), LQDT (Liquidity Services), STX (Seagate), SPRD (Spreadtrum), TKR (Timken), PMTC (Parametric Technology), NTES (Netease), CVI (CVR Energy) and AMZN (Amazon).
MONTEAGLE INFORMED INVESTOR GROWTH FUND A DISCUSSION OF FUND PERFORMANCE (Unaudited) (Continued) |
All of the top-performing portfolio stocks, except Hanson, Dollar Tree and Select Comfort, continued to be held at fiscal year-end. None of the top-ten poor performing stocks were held at fiscal-year end.
Significant sector weightings in the Fund that differed significantly from the sector weightings of the S&P 500:
| First Quarter: | Sector | Fund | S&P 500 |
| | Financials | 24.1% | 14.1% |
| | Consumer Discretionary | 20.0% | 10.8% |
| | Information Technology | 18.5% | 19.0% |
| | | | |
| Second Quarter: | Sector | Fund | S&P 500 |
| | Information Technology | 25.3% | 20.9% |
| | Consumer Discretionary | 24.0% | 11.1% |
| | Industrials | 15.9% | 10.5% |
| | | | |
| Third Quarter: | Sector | Fund | S&P 500 |
| | Consumer Discretionary | 20.9% | 10.8% |
| | Healthcare | 20.1% | 11.9% |
| | | | |
| Fourth Quarter: | Sector | Fund | S&P 500 |
| | Financials | 27.6% | 14.2% |
| | Information Technology | 20.4% | 17.6% |
At fiscal year-end, the Monteagle Informed Investors Growth Fund was 88.5% invested and the remaining 11.5% was in cash. Management believes that the Fund’s portfolio seemed, at that time, best situated relative to the then-current market outlook.
Fund performance shown represents the performance of the Fund’s Class I shares. For complete performance information, please refer to the Average Annual Total Return table in the following performance report. Past performance is not predictive of future performance. Investment results and principal value will fluctuate so that shares, when redeemed, may be worth more or less than their original cost. Current performance may be higher or lower than the performance data quoted. Performance data current to the most recent month-end, are available by calling 1-888-263-5593.
An investor should consider the investment objectives, risks, charges and expenses of the Fund carefully before investing. The Fund’s prospectus contains this and other important information. To obtain a copy of the Fund’s prospectus please call 1-888-263-5593 and a copy will be sent to you free of charge. Please read the prospectus carefully before you invest. The Fund is distributed by Matrix Capital Group, Inc.
Management’s Discussion of Fund Performance seeks to describe some of the Sub-Adviser’s current opinions and views of the financial markets. Although the Sub-Adviser believes it has a reasonable basis for any opinions or views expressed, actual results may differ, sometimes significantly so, from those expected or expressed.
MONTEAGLE INFORMED INVESTOR GROWTH FUND PERFORMANCE — August 31, 2012 (Unaudited) |
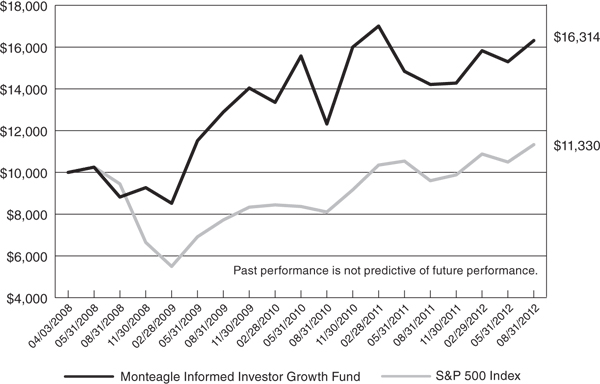
Comparison of the Change in Value of a $10,000 Investment
in Monteagle Informed Investor Growth Fund and the S&P 500 Index
Average Annual Total Return (for the periods ended August 31, 2012) |
| | | |
| Monteagle Informed Investor Growth Fund | 14.81% | 11.74% |
| S&P 500 Index | 18.00% | 2.87% |
| (a) | Represents the period from the commencement of operations (April 3, 2008) through August 31, 2012. |
The performance information quoted in this annual report assumes the reinvestment of all dividend and capital gain distributions, if any, and represents past performance, which is not a guarantee of future results. The returns shown do not reflect taxes that a shareholder would pay on Fund distributions or on the redemption of Fund shares. The investment return and principal value of an investment will fluctuate and, therefore, an investor’s shares, when redeemed, may be worth more or less than their original cost.
The above graph depicts the performance of the Monteagle Informed Investor Growth Fund versus the S&P 500 Index. The S&P 500 Index by Standard and Poor’s Corp. is a capitalization-weighted index comprising 500 issues listed on various exchanges, representing the performance of the stock market generally. Please note that indices do not take into account any fees and expenses of investing in the individual securities that they track, and individuals cannot invest directly in any index.
As with any fund, save an index fund, that commonly compares its performance to the S&P 500 Index, such a comparison may be said to be inappropriate because of the dissimilarity between the Fund’s investments and the securities comprising the index; so too with the Monteagle Informed Investor Growth Fund, which will not invest in certain securities comprising this index.
MONTEAGLE QUALITY GROWTH FUND A DISCUSSION OF FUND PERFORMANCE (Unaudited) |
How did the Fund perform?
For the twelve months ended August 31, 2012, the Monteagle Quality Growth Fund (the “Fund”) reported a total return of 14.26%. The S&P 500 Index (“S&P 500”) and the Russell 1000 Growth Index (“Russell 1000”), the Fund’s two benchmarks, had total returns of 18.00% and 17.37%, respectively, for the same period. The Fund’s net asset value as of August 31, 2012 was $9.95 versus $8.71 as of August 31, 2011.
What is the Fund’s investment approach?
The Fund utilizes a growth style, investing in primarily domestic, high quality companies believed to have above-average sustainable and/or accelerating growth with an ability to exceed earnings expectations over time. The underlying belief is that high quality companies outperform over time with less risk. Various quality rankings and other metrics which demonstrate quality, including earnings consistency, are evaluated carefully before a stock is added to the portfolio. The Fund employs a proprietary screening process and bottom-up work to construct portfolios. However, portfolio constraints are established to ensure sufficient diversification by sector, as well as by market capitalization. The underlying belief is that diversification provides for greater control of risk in the portfolio, while allowing freedom in individual stock selection. The screening process is designed to identify stocks with rising expectations, as the Fund looks to invest in securities whose growth potential is generally underestimated by the market. Holdings generally have a market capitalization of at least $2 billion, with about 65% to 75% of the portfolio in stocks of over $15 billion.
Compared to the S&P 500, the portfolio will typically have a lower dividend yield, a higher price/earnings ratio and a higher expected earnings growth rate.
What influenced the Fund’s performance?
Despite fits and starts along the way, the market once again rewarded equity investors with strong mid-teens returns for the fiscal year ended August 31, 2012. In a repeat of the prior two fiscal years, investors see-sawed between continued concerns regarding the possible deterioration of the European Union with the accompanying potential for renewed global economic deterioration and excitement regarding a growing probability of yet another round of monetary easing on the part of central banks around the globe. At the end of day, the expected liquidity benefits from further monetary actions won out as evident in the solid advance in a broad range of risk assets including domestic equities. While corporate earnings results over the past twelve months did witness the moderation in growth that we expected entering the fiscal year, the overall level of growth was still enough to present an additional factor supporting higher stock prices in the just completed period.
While the Fund delivered respectable performance over the twelve month period, we were disappointed that the strong fundamentals and attractive valuations of portfolio holdings were not more fully rewarded. In particular, portfolio holdings continued to exhibit greater success at meeting or exceeding consensus earnings expectations relative to both the style benchmark and the broad market. While macro-economic headlines have been the primary factor in what has been very much a “risk-on, risk-off” environment over the past several quarters, we remain
MONTEAGLE QUALITY GROWTH FUND A DISCUSSION OF FUND PERFORMANCE (Unaudited) (Continued) |
confident that in the long run underlying fundamentals drive stock prices and that strong earnings surprises and positive estimate revision trends will become more of a differentiating factor in stock performance as the current corporate earnings cycle matures. Earnings growth rates have already begun to decelerate following incredibly strong growth over the course of 2010 and 2011. Growth rates in 2012 have remained respectably in the high-single-digit to low-double-digit range but expectations for the coming quarters call for a continued moderation in corporate earnings growth. Based on history, this slowdown in profits growth suggests high quality stocks should be increasingly well-positioned for outperformance relative to low quality. Because of greater consistency in earnings delivery, strong balance sheets, and diversified business operations, large cap high quality growth companies tend to act particularly well on a relative basis in periods of slowing profit growth. Based on historical valuations, large cap high quality stocks remain substantially undervalued relative to smaller cap and lower quality stocks and we would expect to see this valuation discrepancy close.
During the first six months of the fiscal year just ended, the market rallied off of a calendar year 2011 low set in the first week of October to deliver a low-teens return over the full period ended February 29, 2012. A frequent event since the market rallied off of cycle lows back in early 2009, it was once again easing action on the part of a central bank that served as the catalyst for upside in stock prices. This time around it was the European Central Bank (the ECB) that launched a round of liquidity injection with a program dubbed “LTRO”, which stands for Long Term Refinancing Operation and essentially involved the central bank lending money at a very low interest rate to euro zone banks for a period of three years. This new injection of liquidity had the effect of lowering sovereign bond yields, reducing fears of default, and spurring investors back into risky assets. Against this backdrop, higher beta and lower quality issues outpaced higher quality stocks. While all ten economic sectors delivered positive returns, economically-sensitive or “cyclical” sectors led the way with Information Technology (up 21.0%), Industrials (up 16.1%), and Consumer Discretion (up 13.6%), the top performing sectors in the Russell 1000. Traditionally defensive, the Utilities, Telecommunications, and Consumer Staples sectors were the laggards (up 0.2%, 6.8%, and 7.0%, respectively).
For the period, the Fund’s portfolio delivered a solid double-digit absolute return that came in a bit below the benchmarks on a relative basis. Sector allocation was a neutral factor, as a beneficial underweight in the lagging Health Care sector was offset by an overweight in the also-lagging Energy sector. Overall, stock selection was a negative factor with four sectors contributing positively and six sectors contributing negatively to relative performance. Stock selection was notably favorable within the Consumer Discretionary, Industrials, and Telecommunications sectors of the portfolio. Stock selection was notably negative within the Energy, Health Care, and Information Technology sectors. Of note, the Fund’s preference for high quality stocks was a headwind across sectors in a period meaningfully favoring higher beta, low quality securities.
During this period, stocks that contributed most positively to relative returns were W.W. Grainger (distributor of industrial supplies, up 36%), Cummins (manufacturer of heavy-duty engines, up 31%) and Walt Disney (media & theme parks, up 25%). Significant detractors from relative
MONTEAGLE QUALITY GROWTH FUND A DISCUSSION OF FUND PERFORMANCE (Unaudited) (Continued) |
performance included Carbo Ceramics (supplier of oil & gas drilling consumables, down 42%), Peabody Energy (coal producer, down 27%) and Freeport McMoran (copper & gold mining, down 10%).
While muted compared to the first six months, stock market performance remained positive in the second half of the fiscal year, with both the S&P 500 and Russell 1000 experiencing low single digit advances. Midway through this six month period, the market did experience a bump in the road with the S&P 500 declining nine percent from its spring highs. In a repeat of the prior summer, renewed concerns related to Europe and deterioration in economic data both in the U.S. and abroad led to the market pullback. However, unlike the prior summer, when the sell-off in the S&P 500 reached a much more severe 20% decline at its worst point, this most recent sell-off was rather subdued and orderly. While corporate earnings delivery over this six month period was stronger than many investors feared, economic readings related to employment and manufacturing backslid from the improved levels of early 2012. Thus it was once again indications of forthcoming new monetary easing actions on the part of our U.S. Federal Reserve and central banks abroad, most notably the ECB, aimed at combating the weak global economy that triggered a recovery in stock prices during the months of July and August. For the full six month period, defensive sectors led relative to cyclical, as the extremely low interest rates available in the bond market acted as an additional catalyst behind a rotation into yield-oriented stocks. Consumer Staples (up 9.4%), Health Care (up 9.0%), and Telecommunications (up 7.1%) were the best performing sectors in the Russell 1000. Lingering concerns related to slowing global economic demand was evident in the lagging returns delivered by the Industrials (down 4.4%), Materials (down 1.1%) and Energy (up 0.8%) sectors.
For the six month period ended August 31, 2012, the Fund’s portfolio lagged slightly compared to the Russell 1000 and S&P 500. While the portfolio remained meaningfully overweighted in high quality stocks (stocks with a Standard & Poors Earnings Quality rating of B+ or better), the benefit of this high quality profile was muted by a directional weighting in favor of economic sectors and individual holdings positioned to benefit from continued steady-but-slow global economic improvement. As such, the portfolio did not benefit from this period’s rotation into Consumer Staples and Health Care, two sectors where we have yet to identify meaningfully attractive fundamental earnings growth candidates relative to high quality stocks in other economic sectors and thus have been consistently underweight over the past several quarters. While sector allocation was a negative factor during this period, overall stock selection within the Fund was positive, particularly in the Information Technology and Materials sectors of the portfolio. Strong contributions from holdings in these sectors were partially offset by negative relative contribution from holdings in the Consumer Discretion and Energy sectors of the portfolio.
During this period, stocks that contributed most positively to returns were eBay (online retail and payment solutions, up 33%), Hain Celestial (organic foods, up 68%), and Walt Disney (media & theme parks, up 18%). Significant negative contributors included Tempur Pedic (high-end bedding, down 41%), Cummins (heavy-duty engines, down 19%) and Occidental Petroleum (oil & gas exploration, production, and marketing, down 18%).
MONTEAGLE QUALITY GROWTH FUND A DISCUSSION OF FUND PERFORMANCE (Unaudited) (Continued) |
What is the Fund’s Strategy?
The Fund will continue to focus on maintaining a diversified portfolio of high quality companies delivering sustainable above-market earnings growth as well as companies poised to experience meaningful acceleration in earnings growth relative to expectations. The Fund’s Sub-Adviser believes the companies that can exceed expectations in the form of positive earnings surprises will be well rewarded over coming quarters.
Fund performance shown represents the performance of the Fund’s Class I shares. For complete performance information, please refer to the Average Annual Total Return table in the following performance report. Past performance is not predictive of future performance. Investment results and principal value will fluctuate so that shares, when redeemed, may be worth more or less than their original cost. Current performance may be higher or lower than the performance data quoted. Performance data current to the most recent month-end, are available by calling 1-888-263-5593.
An investor should consider the investment objectives, risks, charges and expenses of the Fund carefully before investing. The Fund’s prospectus contains this and other important information. To obtain a copy of the Fund’s prospectus please call 1-888-263-5593 and a copy will be sent to you free of charge. Please read the prospectus carefully before you invest. The Fund is distributed by Matrix Capital Group, Inc.
Management’s Discussion of Fund Performance seeks to describe some of the Sub-Adviser’s current opinions and views of the financial markets. Although the Sub-Adviser believes it has a reasonable basis for any opinions or views expressed, actual results may differ, sometimes significantly so, from those expected or expressed.
MONTEAGLE QUALITY GROWTH FUND PERFORMANCE — August 31, 2012 (Unaudited) |
Comparison of the Change in Value of a $10,000 Investment in Monteagle Quality Growth Fund,
the S&P 500 Index and the Russell 1000 Growth Index
Average Annual Total Return (for the periods ended August 31, 2012) |
| | | | |
| Monteagle Quality Growth Fund | 14.26% | 2.47% | 4.66% |
| S&P 500 Index | 18.00% | 1.28% | 6.50% |
| Russell 1000 Growth Index | 17.37% | 3.68% | 7.01% |
The performance information quoted in this annual report assumes the reinvestment of all dividend and capital gain distributions, if any, and represents past performance, which is not a guarantee of future results. The returns shown do not reflect taxes that a shareholder would pay on Fund distributions or on the redemption of Fund shares. The investment return and principal value of an investment will fluctuate and, therefore, an investor’s shares, when redeemed, may be worth more or less than their original cost.
The above graph depicts the performance of the Monteagle Quality Growth Fund versus the S&P 500 Index and the Russell 1000 Growth Index. The S&P 500 Index by Standard and Poor’s Corp. is a capitalization-weighted index comprising 500 issues listed on various exchanges, representing the performance of the stock market generally. The Russell 1000 Growth Index measures the performance of the large-cap growth segment of the U.S. equity universe. It includes those Russell 1000 companies with higher price-to-book ratios and higher forecasted growth values. Please note that indices do not take into account any fees and expenses of investing in the individual securities that they track, and individuals cannot invest directly in any index.
As with any fund, save an index fund, that commonly compares its performance to the S&P 500 Index and the Russell 1000 Growth Index, such a comparison may be said to be inappropriate because of the dissimilarity between the Fund’s investments and the securities comprising the indices; so too with the Monteagle Quality Growth Fund, which will not invest in certain securities comprising these indices.
MONTEAGLE SELECT VALUE FUND A DISCUSSION OF FUND PERFORMANCE (Unaudited) |
How did the Fund perform?
For the year ended August 31, 2012, the Monteagle Select Value Fund (the “Fund”) had a total return of 9.01%. The S&P 500 Index (“S&P 500” or “Index”) had a total return of 18.00% for the same period. The Fund’s net asset value per share as of August 31, 2012 was $10.95 versus $10.16 on August 31, 2011.
What is the Fund’s investment approach?
The Fund’s investment goal is long-term capital appreciation. The Fund uses a “value investing” style by investing under normal circumstances at least 80 percent of its assets in common stock of domestic companies believed to be under-priced relative to comparable securities determined by price-to-earnings ratios, cash flows or other measures. The Fund’s adviser predominately utilizes a reversion-to-the-mean strategy on stock selection in order to achieve its results rather than trying to time market fluctuations. The adviser limits the pool of stocks to consider for purchase to only those equities in the S&P 500. In selecting stocks, the Fund’s adviser establishes valuation parameters by using relative ratios or target prices to evaluate companies on several levels. Additionally, the adviser will generally have the Fund hold between 40 and 60 equities and diversify its holdings across numerous industries, generally limiting issues in any one industry to five securities unless more securities are needed for limiting specific dollar amounts per security or to over-weight a particular sector. The Fund seeks to maintain a minimum average weighted market capitalization of $5 billion.
Value stocks are broadly defined as equities which have a price-to-earnings ratio and a price-to-book ratio less than the relative market average with dividends tending to be higher than the relative market average. Also, value stocks tend to have a beta (a measure of the stocks price volatility relative to the overall market, i.e. the S&P 500) less than 1.0.
What influenced the Fund’s performance?
During the twelve months ended August 31, 2012, the Fund’s performance was affected by various economic concerns both domestically and globally. The fear of the fiscal cliff and the presidential election provide considerable uncertainty in the market. The issues that have continued to affect the markets throughout the year are the uncertain stabilization of the domestic financial markets, the fear of the European economies and the prolonged higher level of U.S. unemployment. During the period, the equity markets reached market highs that have not been seen since May 2008 prior to the height of the recession. Following these highs, the U.S. credit rating was lowered which resulted in a significant downturn in the early weeks of August 2011. The S&P 500 yielded attractive returns during the first calendar quarter of the year only to subsequently fall back to this level in early June 2012. The Dow Jones Industrial Average (the “Dow”) began the period at approximately 11,600 on August 31, 2011 briefly falling to the low of 10,655 on October 3, 2011 to then increase to its high of 13,279.32 on May 1, 2012. The Dow concluded on August 31, 2012 near its high for the period at 13,090.84. The S&P 500 trended similarly, beginning the period at just over 1,200 on August 31, 2011, falling just below 1,100 in early October, to then increase to its high point of 1,419.04 on April 2, 2012. The S&P 500 also concluded on August 31, 2012 near its high for the period at 1,406.58. During this period the Federal Open Markets Committee of
MONTEAGLE SELECT VALUE FUND A DISCUSSION OF FUND PERFORMANCE (Unaudited) (Continued) |
the Federal Reserve continued to maintain the Fed Funds rate at the range of 0% to 0.25%, where it has remained since December 2008. These factors contributed to a mixed market environment that proved difficult for the Fund given its focus of a “value style, reversion-to-the-mean” strategy which typically thrives in a growing economic environment. The Fund compares its performance to the S&P 500. The Fund is affected by its asset allocation weighting to the ten sectors of the Index.
For the first quarter ended November 30, 2011, the portfolio holdings of the Fund under-performed the Index. The investments of the Fund experienced a -0.35% return versus a return for the Index of 2.90%. For the trailing 12-month period ended November 30, 2011, the portfolio holdings of the Fund under-performed the Index with the investments of the Fund experiencing a -0.01% return versus a 7.83% return for the Index, a difference of 784 basis points. Please review the Performance Analysis section of this report for additional performance information. The portfolio continued to be heavily invested in equities which represented 94.6% of the assets with cash and money funds representing 5.4% of the assets at November 30, 2011.
The broad sectors of the Index that improved the most on average during the first quarter were Utilities (+3.30%), Information Technology (3.21%), and Consumer Staples (2.94%) sectors while the Financials (-7.48%), Materials (-5.44%) and Telecommunication Services (-0.80%) sectors were the lowest performing within the Index. The portfolio performance was led by its holdings in Consumer Staples, Healthcare and Industrials sectors during this quarter; the lower performing sectors in the portfolio were Telecommunications, Information Technology and Financials. The equity markets still have yet to return to levels prior to the financial crisis, although appreciation from the lows has occurred. The first quarter included significant volatility in the equity market, concluding slightly higher than it began.
As of the end of the first quarter, the portfolio holdings continued to be diversified across many sectors of the Index with less exposure to the Utility, Telecommunication Services and Energy sectors. The largest sector allocations are Financials (19.7%), Healthcare (14.4%) and Information Technology (14.1%). The Fund’s positive portfolio performance was primarily attributed to its top performing stock picks of Intel Corp. (+23.75%), Dean Foods Co. (+17.59%), and Kohl’s Corp. (+16.10%). The Fund’s portfolio performance was most negatively affected by MEMC Electronic Materials (-40.26%), Bank of America Corp. (-33.41%) and Sprint Nextel (-28.19%). During the quarter, no disposals or purchases were made as with the relatively flat trading in the general market there were no securities that achieved their target price. As of the end of the quarter, cash represented 5.4% of the assets.
For the second quarter ended February 29, 2012, the portfolio holdings of the Fund outperformed the Index. The investments of the Fund experienced a 10.47% return versus a return for the Index of 10.11%, a difference of 36 basis points. For the trailing 12-month period ended February 29, 2012, the portfolio holdings of the Fund underperformed the Index with the investments of the Fund experiencing a -4.65% return versus a 5.12% return for the Index. Please review the Performance Analysis section of this report for additional performance information. The portfolio continued to be heavily invested in equities which represented 92.9% of the assets with cash and money funds representing 7.1% of the assets at February 29, 2012.
MONTEAGLE SELECT VALUE FUND A DISCUSSION OF FUND PERFORMANCE (Unaudited) (Continued) |
The broad sectors of the Index that improved the most on average during the second quarter were the Financial (24.45%), Information Technology (20.34%), and Industrial (18.14%) sectors while the Utilities (4.71%), Consumer Staples (8.06%) and Telecommunication Services (9.51%) sectors were the lowest performing within the Index. The portfolio performance was led by its holdings in the Financials, Consumer Staples, and Information Technology sectors during this quarter; the lower performing sectors in the portfolio were Telecommunications, Utilities and Healthcare. The equity markets still have yet to return to levels prior to the financial crisis, although significant appreciation from the lows has occurred. The second quarter witnessed notable improvement in the equity market, with the S&P 500 concluding at its highest level since June 2008.
As of the end of the second quarter, the portfolio holdings continued to be diversified across many sectors of the Index with less exposure to the Utility, Telecommunication Services and Energy sectors. The largest sector allocations were Financials (21.4%), Consumer Discretionary (13.7%) and Healthcare (13.0%). The Fund’s positive portfolio performance was primarily attributed to its top performing stock picks of Whirlpool Corp (+54.04%), Bank of America Corp. (+46.51%), and Genworth Financial, Inc. (+37.94%). The Fund’s portfolio performance was most negatively affected by RadioShack Corp. (-38.24%), Hewlett-Packard Co. (-9.45%) and Best Buy Co. (-8.82%). During the quarter, two disposals were made in order to remove securities that had achieved their target price and leave room for new securities with more appreciation potential. The cash balance continues to remain relatively higher in order to allow cash to average into the equity market and/or find additional securities with positive appreciation potential. As of the end of the quarter, cash represented 7.1% of the assets.
For the third quarter ended May 31, 2012, the portfolio holdings of the Fund underperformed the Index. The investments of the Fund experienced a -9.21% return versus a return for the Index of -3.53%. For the trailing 12-month period ended May 31, 2012, the portfolio holdings of the Fund underperformed the Index with the investments of the Fund experiencing a -13.87% return versus a -0.41% return for the Index. Please review the Performance Analysis section of this report for additional performance information. The portfolio continued to be heavily invested in equities which represented 93.5% of the assets with cash and money funds representing 6.5% of the assets at May 31, 2012.
The broad sectors of the Index that improved the most on average during the third quarter were the Telecommunication Services (9.14%), Consumer Services (3.89%), and Utilities (3.42%) sectors while the Energy (-12.76%), Materials (-7.59%) and Industrials (-5.04%) sectors were the lowest performing within the Index. The portfolio performance was led by its holdings in the Telecommunication Services, Utilities, and Consumer Staples sectors during this quarter; the lower performing sectors in the portfolio were Financials, Information Technology and Materials. The equity markets still have yet to return to levels prior to the financial crisis, although significant appreciation from the lows has occurred. The third quarter experienced volatility in the equity market, with the S&P 500 gaining almost 4% to subsequently fall over 7%, concluding just above 1,300.
MONTEAGLE SELECT VALUE FUND A DISCUSSION OF FUND PERFORMANCE (Unaudited) (Continued) |
As of the end of the third quarter, the portfolio holdings continued to be diversified across many sectors of the Index with less exposure to the Utility, Telecommunication Services and Consumer Staples sectors. The largest sector allocations are Financials (20.1%), Information Technology (14.9%), and Consumer Discretionary (13.6%). The Fund’s positive portfolio performance was primarily attributed to its top performing stock picks of ConocoPhillips (+32.29%), AT&T Corp. (+11.70%), and Wal-Mart Stores (+11.41%). The Fund’s portfolio performance was most negatively affected by MEMC Electronics (-57.51%), Genworth Financial (-42.35%) and First Solar, Inc. (-39.58%). During the quarter, two disposals were made in order to remove securities that had achieved their target price and leave room for new securities with more appreciation potential. Four securities were purchased in order to reinvest the cash. The cash balance continued to remain a little elevated in order to allow cash to average into the equity market and/or find additional securities with positive appreciation potential. As of the end of the quarter, cash represented 6.5% of the assets.
For the fourth quarter ended August 31, 2012, the portfolio holdings of the Fund outperformed the S&P 500. The investments of the Fund experienced a 9.07% return versus a return for the Index of 7.94%. For the trailing 12-month period ended August 31, 2012, the portfolio holdings of the Fund underperformed the Index with the investments of the Fund experiencing a 9.01% return versus an 18.00% return for the Index. Please review the Performance Analysis section of this report for additional performance information. The portfolio continued to be heavily invested in equities which represented 93.7% of the assets with cash and money funds representing 6.3% of the assets at August 31, 2012.
The broad sectors of the Index that improved the most on average during the fourth quarter were the Telecommunication Services (11.88%), Energy (11.13%), and Financials (9.29%) sectors while the Utilities (2.71%), Industrials (5.13%) and Materials (5.87%) sectors were the lowest performing within the Index. The portfolio performance was led by its holdings in the Telecommunication Services and Information Technology sectors during this quarter; the lower performing sectors in the portfolio were Utilities, Materials and Healthcare. The equity markets still have yet to return to levels prior to the financial crisis, although significant appreciation from the lows has occurred. The fourth quarter experienced positive appreciation in the equity market, with the S&P 500 ending just above 1,400, near the high of the year.
As of the end of the fourth quarter, the portfolio holdings continued to be diversified across many sectors of the Index with less exposure to the Utility, Telecommunication Services and Consumer Staples sectors. The largest sector allocations are Financials (18.7%), Information Technology (15.7%), and Consumer Discretionary (13.1%). The Fund’s positive portfolio performance was primarily attributed to its top performing stock picks of Sprint Nextel (+88.72%), MEMC Electronic Materials (+60.48%), and First Solar, Inc. (+59.16%). The Fund’s portfolio performance was most negatively affected by RadioShack (-47.63%), Hewlett Packard (-25.57%) and Cliffs Natural Resources (-13.11%). During the quarter, one disposal was made in order to remove a security that had achieved its target price and make room for new securities with more appreciation potential. One security was purchased in order to reinvest the cash. The cash balance continued to remain marginally in order to allow cash to average into the equity market and/or find additional securities with positive appreciation potential. As of the end of the quarter, cash represented 6.3% of the assets.
MONTEAGLE SELECT VALUE FUND A DISCUSSION OF FUND PERFORMANCE (Unaudited) (Continued) |
For the year ended August 31, 2012, the Fund underperformed the Index. The investments of the Fund experienced a 9.01% return versus an 18.00% return for the Index. The broad sectors of the Fund that contributed the most on average to the performance were the Consumer Staples (+31.71%), Telecommunications Services (+28.84%), and Industrials (+21.56%) sectors while the Materials (-11.37%), Information Technology (-4.88%) and the Consumer Discretionary (-3.10%) sectors were the lowest performing on average within the Fund.
What is the Fund’s strategy?
The Fund will continue to concentrate on equities contained in the S&P 500 which generally consists of large name brand corporations with good fundamentals and broad product diversification. The Fund’s adviser will continue to be disciplined in the use of its predominate strategy of reversion-to-the-mean by applying its “value investing” approach valuation model; thereby, allowing the market’s volatility to identify those securities that become under-valued and are poised to be the next performers in the market. Sector allocation in the Fund’s portfolio will primarily be determined by which companies are available for purchase pursuant to the Fund’s strategy. It is anticipated that the Fund may hold higher levels of cash during extended periods of market uncertainty and will selectively invest the cash into equities identified by the primary investment strategy as opportunities present themselves or for dollar-cost-averaging into currently held positions. This strategy is executed with a long-term outlook and will have periods of under-performance and out-performance versus its Index. Therefore, the Fund’s daily performance can and will vary dependant upon current market conditions.
Fund performance shown represents the performance of the Fund’s Class I shares. For complete performance information, please refer to the Average Annual Total Return table in the following performance report. Past performance is not predictive of future performance. Investment results and principal value will fluctuate so that shares, when redeemed, may be worth more or less than their original cost. Current performance may be higher or lower than the performance data quoted. Performance data current to the most recent month-end, are available by calling 1-888-263-5593.
An investor should consider the investment objectives, risks, charges and expenses of the Fund carefully before investing. The Fund’s prospectus contains this and other important information. To obtain a copy of the Fund’s prospectus please call 1-888-263-5593 and a copy will be sent to you free of charge. Please read the prospectus carefully before you invest. The Fund is distributed by Matrix Capital Group, Inc.
Management’s Discussion of Fund Performance seeks to describe some of the Sub-Adviser’s current opinions and views of the financial markets. Although the Sub-Adviser believes it has a reasonable basis for any opinions or views expressed, actual results may differ, sometimes significantly so, from those expected or expressed.
MONTEAGLE SELECT VALUE FUND PERFORMANCE — August 31, 2012 (Unaudited) |
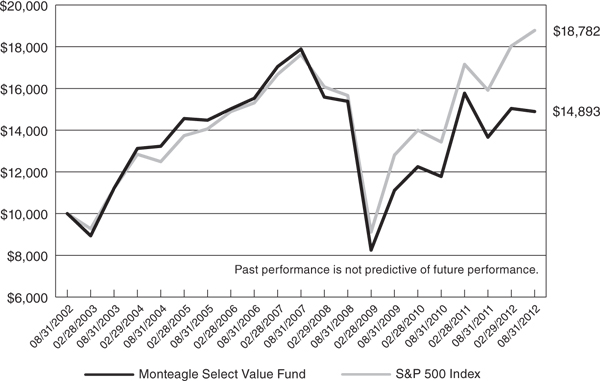
Comparison of the Change in Value of a $10,000 Investment
in Monteagle Select Value Fund and the S&P 500 Index
Average Annual Total Return (for the periods ended August 31, 2012) |
| | | | |
| Monteagle Select Value Fund | 9.01% | (3.60%) | 2.80% |
| S&P 500 Index | 18.00% | 1.28% | 6.50% |
The performance information quoted in this annual report assumes the reinvestment of all dividend and capital gain distributions, if any, and represents past performance, which is not a guarantee of future results. The returns shown do not reflect taxes that a shareholder would pay on Fund distributions or on the redemption of Fund shares. The investment return and principal value of an investment will fluctuate and, therefore, an investor’s shares, when redeemed, may be worth more or less than their original cost.
The above graph depicts the performance of the Monteagle Select Value Fund versus the S&P 500 Index. The S&P 500 Index by Standard and Poor’s Corp. is a capitalization-weighted index comprising 500 issues listed on various exchanges, representing the performance of the stock market generally. Please note that indices do not take into account any fees and expenses of investing in the individual securities that they track, and individuals cannot invest directly in any index.
As with any fund, save an index fund, that commonly compares its performance to the S&P 500 Index, such a comparison may be said to be inappropriate because of the dissimilarity between the Fund’s investments and the securities comprising the index; so too with the Monteagle Select Value Fund, which will not invest in certain securities comprising this index.
MONTEAGLE VALUE FUND A DISCUSSION OF FUND PERFORMANCE (Unaudited) |
How did the Fund Perform?
For the year ended August 31, 2012, the Monteagle Value Fund (the “Fund”) reported a total return of 8.64%. The S&P 500 Index (“S&P 500”) had total returns of 18.00% for the same time period. The Fund’s net asset value per share as of August 31, 2012 was $13.31 versus $15.55 at August 31, 2011. The drop in NAV was due in part to a capital gain distribution of $3.02 per share paid in December 2011.
What is the Fund’s investment approach?
The Fund’s investment goal is to achieve maximum returns through investing in undervalued companies. The Fund determines value usually based on price-to-earnings ratios, but also reviews historical price to book value ratios, dividend yield and balance sheet quality in determining whether prospective investments are truly undervalued. The adviser will hold 35 to 45 equities. The Fund seeks to maintain a minimum average market capitalization of $5 billion. The current average market capitalization exceeds $40 billion. The current price earnings ratio is 12.1 times 2013 earnings and currently yields 2.7 percent. The S&P 500 currently trades at 13.4 times 2013 earnings and yields 1.9 percent.
Fund’s adviser also makes industry determinations based upon interest rate cycles. Historical relationships between short-term and long-term U.S. Treasury securities impact industry weightings as easier money promotes growth in inflation while tight money favors disinflation.
The Fund also makes investments for the long-term, holding the positions for three to five years unless extraordinary events occur such as mergers, acquisitions or deterioration of the industry or company.
What influenced the Fund’s performance?
During the year ended August 31, 2012, the Fund underperformed the S&P 500. We remain committed to our buy and hold investment strategy though many believe long term investment is no longer relevant. Our positions continue to focus on economically sensitive issues that usually benefit from improving economic conditions. Consequently, these positions have been whipsawed by the markets over the past twelve months. With short-term interest rates flat-lining just above zero, we believe that commodity prices will ultimately rise as a result of renewed economic activity. Worldwide financial trade winds have not been favorable to companies tied to international markets over the past twelve months. Budget issues pertaining to European debt woes have presented challenges to financial markets during this period. Waning Chinese economic growth has also been a contributing factor to weakening demand for raw materials reducing prices further contributing to our market underperformance.
During the past twelve months, the Federal Reserve transitioned from QE II to Operation Twist that moved its Federal Open Market Operation activity to swapping short-term Treasury Bills and Notes to longer term bonds. Money supply growth increased during the year approaching 10% which is very accommodative to financial markets. Additionally, the third year of $1.0 trillion budget deficits by the U.S. government has made John Maynard Keynes proud as the Fiscal stimulus theoretically lessens the severity of recessions. With the Fed and Treasury printing money, one would expect more robust economic growth. Yet, the high unemployment and weak
MONTEAGLE VALUE FUND A DISCUSSION OF FUND PERFORMANCE (Unaudited) (Continued) |
housing numbers continue to suggest the economy is far from full recovery. Our positive stance may have been premature in the past but believe conditions continue to be favorable for rising stock prices.
We do believe that the market has been too focused on fiscal cliffs and proverbial cans being kicked down the road as policy makers extend debt terms and refinance bonds. During the year, the S&P downgraded U.S. Treasury bonds and the market responded by higher prices and lower yields. Usually, lower interest rates portends higher stock prices. Interest rates remain conducive to fostering economic growth, both in the U.S. as well as the rest of the world. We believe stock prices have not fully discounted the benefits to the favorable interest rate environment.
During the first six months of the year, the Fund performed in line with the market providing returns of 9.75% versus the S&P 500 of 13.31%. During this period, many of the positions believed to benefit from improving economic conditions performed in line with the market. Federal Reserve policy continued to maintain low short-term interest rates and accommodation at the discount window allowing banks and investment banks the ability to borrow. The financial system remains strong as corporate bond market has been very active as interest rate spreads have narrowed indicating that companies have accessed public markets for borrowing needs. During this period, the Fund’s weighting in chemicals, paper, mining and steel of 35% and healthcare of 12.2% impeded the returns of the Fund. Our 10.4% weighting in telecommunications helped our returns for the Fund during this period.
The Fund disposed of Eastman Kodak, AOL, Alcoa, Tidewater, Cubist Pharmaceuticals, Applied Materials, Shaw Industries, Pfizer, IPG, Marathon Petroleum, and Gap, Inc. The Fund reduced its holdings in Dupont and Newmont Mining. The Fund invested in International Paper, Solutia, Textron, Worthington Industries, Spreadtrum Communications, Chemtura, Kronos Worldwide, Nuvasive, and Sanmina-SCI. Also, ADPT. Co changed its name to Steel Excel, Inc.
During the six months ended August 31, 2012 the Fund experienced underperformance versus the S&P 500 during the quarter ended May 31, 2012. During this period the Fund returned -1.01% versus 4.14% for the S&P 500. Recent Federal Reserve policy continues to maintain low short-term interest rates and money supply is growing at 10% annually. Quantitative Easing I, II and most recent Operation Twist is allowing the rampant growth of the monetary base propping up the banking system. Money market yields continue to be low and the bond market has outperformed all stock indices during this period as money came out of stock mutual funds and into bond funds. The Fund continues to favor economically sensitive issues although the obvious policy changes at the Fed and other world central banks have quelled the commodity markets. Turmoil in the European financial markets has created questions about the Euro being a formidable reserve currency against the dollar. Middle Eastern investors have shifted out of the Euro into the dollar and the Euro has fallen in its exchange value by twenty percent against the dollar. Deflationary pressures have eliminated inflation from being any concern for central banking policy.
During the last six months our weightings in Industrials and Materials combined at nearly 40% has continued to contribute to our underperformance. Recent moves in telecommunications and health stocks actually helped performance for the Fund. During the six months, the Fund made no changes to its holdings.
MONTEAGLE VALUE FUND A DISCUSSION OF FUND PERFORMANCE (Unaudited) (Continued) |
Since November 2011, Federal Reserve policy has been very accommodative maintaining record low short-term interest rates and growing money supply at 10% on an annual basis. Summer time turmoil in Europe pertaining to Credit issues in Greece, Spain and Portugal has presented financial challenges for banks in Europe and New York which has plagued the financial markets here and abroad. Additional weakness in the Chinese and South American markets indicates worldwide economic slow-down.
The Fund maintains its belief that economic conditions are indeed improving as monetary aggregates continue to anticipate economic growth for the foreseeable future. Recent declines in commodity prices should give the Fed ample reason to start another round of stimulus in the form of QE III recently announced after the Fund’s year end. The Fed has indicated it will keep purchasing $40 billion in mortgage backed bonds per month as long as it takes to see meaningful employment improvements.
The current market remains volatile due to the high frequency traders with very little regulatory scrutiny. Since January 2012, equity mutual funds have seen over $400 billion in liquidations, though the market remains resilient with positive returns. We still believe that low money market yields and low bond yields should lead investors back into stocks.
The current U.S. Treasury yield curve supports growing economic activity. The Federal Reserve has reiterated its willingness to do what is necessary to avert further deflationary pressures associated with job and housing weakness.
What is the Fund’s strategy?
The Fund continues to focus on consistency in earnings in its holdings. The Fund remains committed to economically sensitive issues including energy, materials and industrials. The Fund has a modest overweight in materials, telecommunications and industrials as the economic recovery continues to sputter and recent Fed policy statements indicated they were concerned that it would be willing to accept higher inflation as it fends off deflationary forces. The Fund is underweight energy, financials, utilities, health and technology sectors. The Fund believes that worldwide economic recovery has started though unemployment remains high and housing weak.
MONTEAGLE VALUE FUND A DISCUSSION OF FUND PERFORMANCE (Unaudited) (Continued) |
The Fund’s industry weightings as of August 31, 2012 as compared to the S&P 500 were as follows:
| | |
| Industrials | 8.2% | 12.7% |
| Energy | 7.3% | 8.0% |
| Materials | 31.7% | 6.3% |
| Financials | 0.0% | 13.0% |
| Health | 13.5% | 12.3% |
| Technology | 11.2% | 15.8% |
| Telecom | 11.7% | 0.8% |
| Utilities | 5.3% | 4.3% |
| Consumer Discretion | 3.8% | 19.2% |
| Consumer Staples | 2.9% | 7.6% |
| Other Holdings | 4.4% | 0.0% |
Fund performance shown represents the performance of the Fund’s Class I shares. For complete performance information, please refer to the Average Annual Total Return table in the following performance report. Past performance is not predictive of future performance. Investment results and principal value will fluctuate so that shares, when redeemed, may be worth more or less than their original cost. Current performance may be higher or lower than the performance data quoted. Performance data current to the most recent month-end, are available by calling 1-888-263-5593.
An investor should consider the investment objectives, risks, charges and expenses of the Fund carefully before investing. The Fund’s prospectus contains this and other important information. To obtain a copy of the Fund’s prospectus please call 1-888-263-5593 and a copy will be sent to you free of charge. Please read the prospectus carefully before you invest. The Fund is distributed by Matrix Capital Group, Inc.
Management’s Discussion of Fund Performance seeks to describe some of the Sub-Adviser’s current opinions and views of the financial markets. Although the Sub-Adviser believes it has a reasonable basis for any opinions or views expressed, actual results may differ, sometimes significantly so, from those expected or expressed.
MONTEAGLE VALUE FUND PERFORMANCE — August 31, 2012 (Unaudited) |
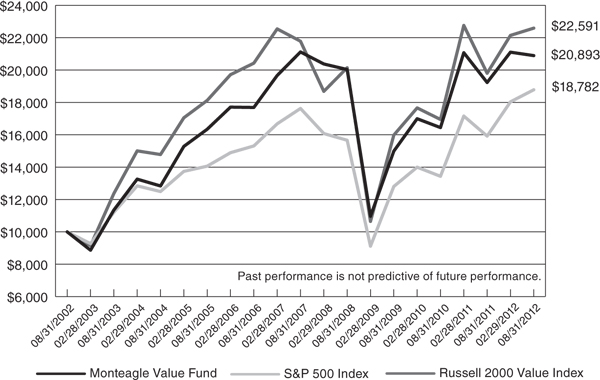
Comparison of the Change in Value of a $10,000 Investment
in Monteagle Value Fund, the S&P 500 Index and the Russell 2000 Value Index
Average Annual Total Return (for the periods ended August 31, 2012) |
| | | | |
| Monteagle Value Fund | 8.64% | (0.22%) | 7.65% |
| S&P 500 Index | 18.00% | 1.28% | 6.50% |
| Russell 2000 Value Index | 14.08% | 0.73% | 8.48% |
The performance information quoted in this annual report assumes the reinvestment of all dividend and capital gain distributions, if any, and represents past performance, which is not a guarantee of future results. The returns shown do not reflect taxes that a shareholder would pay on Fund distributions or on the redemption of Fund shares. The investment return and principal value of an investment will fluctuate and, therefore, an investor’s shares, when redeemed, may be worth more or less than their original cost.
The above graph depicts the performance of the Monteagle Value Fund versus the S&P 500 Index and the Russell 2000 Value Index. The S&P 500 Index by Standard and Poor’s Corp. is a capitalization-weighted index comprising 500 issues listed on various exchanges, representing the performance of the stock market generally. The Russell 2000 Value Index measures the performance of small-cap value segment of the U.S. equity universe. It includes those Russell 2000 companies with lower price-to-book ratios and lower forecasted growth values. Please note that indices do not take into account any fees and expenses of investing in the individual securities that they track, and individuals cannot invest directly in any index.
As with any fund, save an index fund, that commonly compares its performance to the S&P 500 Index and the Russell 2000 Value Index, such a comparison may be said to be inappropriate because of the dissimilarity between the Fund’s investments and the securities comprising the indices; so too with the Monteagle Value Fund, which will not invest in certain securities comprising these indices.
MONTEAGLE FIXED INCOME FUND SUPPLEMENTARY PORTFOLIO INFORMATION — August 31, 2012 (Unaudited) |
Top Ten Long-Term Portfolio Holdings | |
| U.S. Treasury Note, 2.00%, due 11/15/2021 | 5.84% |
| U.S. Treasury Note, 1.75%, due 05/15/2022 | 5.69% |
| U.S. Treasury Note, 1.625%, due 08/15/2022 | 5.60% |
| FNMA, Pool 386008, 4.52%, due 04/01/2013 | 3.08% |
| U.S. Treasury Note, 2.125%, due 08/15/2021 | 2.96% |
| FHLMC, Pool J19285, 2.50%, due 06/01/2027 | 2.18% |
| FHLMC, Series 3290 PD, 5.50%, due 03/15/2035 | 2.16% |
| Johnson & Johnson, 5.15%, due 07/15/2018 | 2.06% |
| FHLMC, Series 2841 BY, 5.00%, due 08/15/2019 | 1.79% |
| GlaxoSmithKline Capital, Inc., 5.65%, due 05/15/2018 | 1.71% |
| |
| Corporate Bonds | 47.33% |
| U.S. Government and Agency Obligations | 29.35% |
| Mortgage-Backed Securities | 15.64% |
| Money Market Funds | 10.72% |
| Liabilities in Excess of Other Assets | |
| | |
MONTEAGLE INFORMED INVESTOR GROWTH FUND SUPPLEMENTARY PORTFOLIO INFORMATION — August 31, 2012 (Unaudited) |
Top Ten Long-Term Portfolio Holdings | |
| ProShares Ultra QQQ | 11.35% |
| ProShares Ultra Russell 2000 | 8.32% |
| ProShares Ultra S&P 500 | 7.92% |
| Alexion Pharmaceuticals, Inc. | 6.79% |
| Apple, Inc. | 5.81% |
| Mellanox Technologies Ltd. | 4.99% |
| TJX Cos., Inc. | 4.93% |
| CF Industries Holdings, Inc. | 4.37% |
| Western Digital Corp. | 3.77% |
| Align Technology, Inc. | 3.68% |
Top Ten Portfolio Industries | |
| Retail | 12.71% |
| Computers | 9.58% |
| Biotechnology | 6.79% |
| Pharmaceuticals | 5.30% |
| Semiconductors | 4.99% |
| Chemicals | 4.37% |
| Healthcare - Products | 3.68% |
| Oil & Gas | 3.13% |
| Software | 3.00% |
| Internet | |
| | |
Economic Sectors with Cash and Other Assets | |
| Exchange-Traded Funds | 27.59% |
| Money Market Funds | 25.30% |
| Technology | 17.57% |
| Consumer, Non-cyclical | 15.77% |
| Consumer, Cyclical | 14.71% |
| Communications | 4.42% |
| Basic Materials | 4.37% |
| Energy | 3.13% |
| Industrial | 1.01% |
| Liabilities in Excess of Other Assets | |
| | |
MONTEAGLE QUALITY GROWTH FUND SUPPLEMENTARY PORTFOLIO INFORMATION — August 31, 2012 (Unaudited) |
Top Ten Long-Term Portfolio Holdings | |
| Apple, Inc. | 8.90% |
| International Business Machines Corp. | 4.27% |
| Microsoft Corp. | 3.87% |
| QUALCOMM, Inc. | 3.38% |
| Coca-Cola Co. | 3.11% |
| Nordstrom, Inc. | 2.59% |
| American Tower Corp. | 2.52% |
| Roper Industries, Inc. | 2.51% |
| Google, Inc. - Class A | 2.45% |
| Walt Disney Co. | 2.43% |
Top Ten Portfolio Industries | |
| Computers | 14.41% |
| Retail | 10.26% |
| Semiconductors | 6.66% |
| Internet | 5.73% |
| Software | 5.57% |
| Healthcare - Products | 3.73% |
| Machinery - Diversified | 3.47% |
| Oil & Gas Services | 3.37% |
| Chemicals | 3.18% |
| Beverages | |
| | |
Economic Sectors with Cash and Other Assets | |
| Technology | 26.64% |
| Consumer, Non-cyclical | 17.94% |
| Consumer, Cyclical | 16.49% |
| Industrial | 14.72% |
| Communications | 9.39% |
| Financial | 5.35% |
| Energy | 5.24% |
| Basic Materials | 3.18% |
| Money Market Funds | 0.48% |
| Utilities | 0.45% |
| Other Assets in Excess of Liabilities | |
| | |
MONTEAGLE SELECT VALUE FUND SUPPLEMENTARY PORTFOLIO INFORMATION — August 31, 2012 (Unaudited) |
Top Ten Long-Term Portfolio Holdings | |
| Pfizer, Inc. | 3.17% |
| First Solar, Inc. | 2.96% |
| WellPoint, Inc. | 2.95% |
| Baker Hughes, Inc. | 2.92% |
| Raytheon Co. | 2.75% |
| Wal-Mart Stores, Inc. | 2.75% |
| Gilead Sciences, Inc. | 2.69% |
| Applied Materials, Inc. | 2.58% |
| Harris Corp. | 2.55% |
| CVS Caremark Corp. | 2.51% |
Top Ten Portfolio Industries | |
| Insurance | 10.99% |
| Retail | 9.03% |
| Telecommunications | 6.96% |
| Semiconductors | 5.87% |
| Oil & Gas | 5.25% |
| Banks | 5.11% |
| Aerospace & Defense | 3.92% |
| Media | 3.45% |
| Iron & Steel | 3.42% |
| Pharmaceuticals | |
| | |
Economic Sectors with Cash and Other Assets | |
| Financial | 18.63% |
| Consumer, Non-cyclical | 12.87% |
| Consumer, Cyclical | 12.85% |
| Money Market Funds | 12.80% |
| Technology | 11.95% |
| Industrial | 10.93% |
| Communications | 10.42% |
| Energy | 8.16% |
| Basic Materials | 6.56% |
| Utilities | 1.07% |
| Liabilities in Excess of Other Assets | |
| | |
MONTEAGLE VALUE FUND SUPPLEMENTARY PORTFOLIO INFORMATION — August 31, 2012 (Unaudited) |
Top Ten Long-Term Portfolio Holdings | |
| AT&T, Inc. | 5.11% |
| Merck & Co., Inc. | 4.85% |
| Textron, Inc. | 4.10% |
| Duke Energy Corp. | 3.85% |
| EI du Pont de Nemours & Co. | 3.73% |
| Verizon Communications, Inc. | 3.59% |
| Worthington Industries, Inc. | 3.50% |
| Eastman Chemical Co. | 3.42% |
| International Paper Co. | 3.37% |
| Intel Corp. | 2.94% |
Top Ten Portfolio Industries | |
| Telecommunications | 11.52% |
| Chemicals | 11.34% |
| Pharmaceuticals | 7.15% |
| Semiconductors | 7.03% |
| Mining | 6.52% |
| Healthcare - Products | 6.07% |
| Electric | 5.48% |
| Oil & Gas | 4.89% |
| Miscellaneous Manufacturing | 4.10% |
| Retail | |
| | |
Economic Sectors with Cash and Other Assets | |
| Basic Materials | 23.19% |
| Consumer, Non-cyclical | 17.38% |
| Industrial | 17.05% |
| Money Market Funds | 11.85% |
| Communications | 11.53% |
| Technology | 8.36% |
| Energy | 7.17% |
| Utilities | 5.48% |
| Consumer, Cyclical | 3.65% |
| Financial | 1.58% |
| Liabilities in Excess of Other Assets | |
| | |
MONTEAGLE FIXED INCOME FUND SCHEDULE OF INVESTMENTS — August 31, 2012 |
| | U.S. GOVERNMENT AND AGENCY OBLIGATIONS (b) - 29.35% | | | |
| | | U.S. Treasury Notes - 23.24% | | | |
| $ | 2,000,000 | | 1.625%, due 08/15/2022 | | $ | 2,011,876 | |
| | 2,000,000 | | 1.75%, due 05/15/2022 | | | 2,040,938 | |
| | 2,000,000 | | 2.00%, due 11/15/2021 | | | 2,097,656 | |
| | 1,000,000 | | 2.125%, due 08/15/2021 | | | 1,062,735 | |
| | 500,000 | | 2.625%, due 08/15/2020 | | | 554,570 | |
| | 500,000 | | 3.125%, due 05/15/2021 | | | 574,414 | |
| | | | | | | 8,342,189 | |
| | | | Federal Home Loan Bank - 2.93% | | | | |
| | 500,000 | | 5.05%, due 01/03/2018 | | | 507,678 | |
| | 500,000 | | 5.25%, due 06/18/2014 | | | 544,983 | |
| | | | | | | 1,052,661 | |
| | | | Federal Home Loan Mortgage Corporation - 1.63% | | | | |
| | 500,000 | | 3.75%, due 03/27/2019 | | | 583,439 | |
| | | | | | | | |
| | | | Federal National Mortgage Association - 1.55% | | | | |
| | 500,000 | | 5.00%, due 03/02/2015 | | | 557,892 | |
| | | | | | | | |
| | | | Total U.S. Government and Agency Obligations (Cost $10,018,958) | | | 10,536,181 | |
| | | | | |
| | | Aerospace & Defense - 3.41% | | | |
| $ | 575,000 | | General Dynamics Corp., 5.25%, due 02/01/2014 (b) | | $ | 613,524 | |
| | 500,000 | | United Technologies Corp., 5.375%, due 12/15/2017 (b) | | | 608,928 | |
| | | | | | | 1,222,452 | |
| | | | Agriculture - 1.40% | | | | |
| | 500,000 | | Philip Morris International, Inc., 2.50%, due 08/22/2022 (b) | | | 502,768 | |
| | | | | | | | |
| | | | Banks - 13.30% | | | | |
| | 500,000 | | Bank of America Corp., 4.875%, due 01/15/2013 | | | 506,853 | |
| | 500,000 | | Goldman Sachs Group, Inc., 5.95%, due 01/18/2018 | | | 563,060 | |
| | 500,000 | | JPMorgan Chase & Co., 2.05%, due 01/24/2014 | | | 508,906 | |
| | 500,000 | | JPMorgan Chase & Co., 6.00%, due 01/15/2018 | | | 598,012 | |
| | 500,000 | | Morgan Stanley, 3.45%, due 11/02/2015 | | | 502,842 | |
| | 500,000 | | Northern Trust Corp., 2.375%, due 08/02/2022 | | | 498,592 | |
| | 500,000 | | PNC Funding Corp., 4.375%, due 08/11/2020 | | | 571,424 | |
| | 250,000 | | State Street Corp., 4.30%, due 05/30/2014 (b) | | | 265,866 | |
The accompanying notes are an integral part of the financial statements.
MONTEAGLE FIXED INCOME FUND SCHEDULE OF INVESTMENTS — August 31, 2012 (Continued) |
| | CORPORATE BONDS - 47.33% (Continued) | | | |
| | | Banks - 13.30% (Continued) | | | |
| $ | 250,000 | | Wells Fargo & Co., 5.25%, due 10/23/2012 | | $ | 251,633 | |
| | 500,000 | | Westpac Banking Corp., 2.00%, due 08/14/2017 (b) | | | 505,863 | |
| | | | | | | 4,773,051 | |
| | | | Beverages - 1.40% | | | | |
| | 500,000 | | Bottling Group, LLC, 4.625%, due 11/15/2012 | | | 504,067 | |
| | | | | | | | |
| | | | Biotechnology - 1.54% | | | | |
| | 250,000 | | Amgen, Inc., 4.50%, due 03/15/2020 (b) | | | 280,692 | |
| | 250,000 | | Amgen, Inc., 4.85%, due 11/18/2014 (b) | | | 271,443 | |
| | | | | | | 552,135 | |
| | | | Chemicals - 0.73% | | | | |
| | 250,000 | | Sherwin-Williams Co., 3.125%, due 12/15/2014 (b) | | | 263,349 | |
| | | | | | | | |
| | | | Computers - 1.04% | | | | |
| | 350,000 | | Hewlett-Packard Co., 6.125%, due 03/01/2014 | | | 374,652 | |
| | | | | | | | |
| | | | Diversified Financial Services - 2.98% | | | | |
| | 500,000 | | CME Group, Inc., 5.75%, due 02/15/2014 | | | 536,056 | |
| | 500,000 | | Toyota Motor Credit Corp., 3.20%, due 06/17/2015 | | | 534,816 | |
| | | | | | | 1,070,872 | |
| | | | Electric - 3.20% | | | | |
| | 500,000 | | Florida Power Corp., 4.55%, due 04/01/2020 (b) | | | 578,228 | |
| | 500,000 | | Georgia Power Co., 4.25%, due 12/01/2019 (b) | | | 570,470 | |
| | | | | | | 1,148,698 | |
| | | | Electrical Components - 0.82% | | | | |
| | 250,000 | | Emerson Electric Co., 5.125%, due 12/01/2016 (b) | | | 293,448 | |
| | | | | | | | |
| | | | Food - 1.16% | | | | |
| | 400,000 | | McCormick & Co., Inc., 5.25%, due 09/01/2013 (b) | | | 417,492 | |
| | | | | | | | |
| | | | Healthcare - Services - 0.05% | | | | |
| | 15,000 | | UnitedHealth Group, Inc., 5.00%, due 08/15/2014 (b) | | | 16,204 | |
| | | | | | | | |
| | | | Household Products & Wares- 0.73% | | | | |
| | 250,000 | | Kimberly-Clark Corp., 5.00%, due 08/15/2013 | | | 261,113 | |
| | | | | | | | |
| | | | Miscellaneous Manufacturing - 3.05% | | | | |
| | 250,000 | | 3M Co., 1.00%, due 06/26/2017 (b) | | | 252,222 | |
| | 250,000 | | 3M Co., 2.00%, due 06/26/2022 (b) | | | 249,842 | |
The accompanying notes are an integral part of the financial statements.
MONTEAGLE FIXED INCOME FUND SCHEDULE OF INVESTMENTS — August 31, 2012 (Continued) |
| | CORPORATE BONDS - 47.33% (Continued) | | | |
| | | Miscellaneous Manufacturing - 3.05% (Continued) | | | |
| $ | 500,000 | | General Electric Co., 5.25%, due 12/06/2017 | | $ | 594,003 | |
| | | | | | | 1,096,067 | |
| | | | Office & Business Equipment - 0.75% | | | | |
| | 250,000 | | Pitney Bowes, Inc., 5.75%, due 09/15/2017 (b) | | | 269,016 | |
| | | | | | | | |
| | | | Oil & Gas - 2.93% | | | | |
| | 250,000 | | BP Capital Markets, PLC, 4.75%, due 03/10/2019 (b) | | | 290,665 | |
| | 250,000 | | ConocoPhillips Australia Funding Co., 5.50%, due 04/15/2013 (b) | | | 257,577 | |
| | 250,000 | | Shell International Finance BV, 1.125%, due 08/21/2017 | | | 251,617 | |
| | 250,000 | | Shell International Finance BV, 2.375%, due 08/21/2022 | | | 253,511 | |
| | | | | | | 1,053,370 | |
| | | | Pharmaceuticals - 4.48% | | | | |
| | 250,000 | | Abbott Laboratories, 5.15%, due 11/30/2012 | | | 252,793 | |
| | 500,000 | | GlaxoSmithKline Capital, Inc., 5.65%, due 05/15/2018 | | | 614,900 | |
| | 600,000 | | Johnson & Johnson, 5.15%, due 07/15/2018 (b) | | | 738,221 | |
| | | | | | | 1,605,914 | |
| | | | Retail - 0.70% | | | | |
| | 250,000 | | Lowe's Cos., Inc., 5.60%, due 09/15/2012 | | | 250,306 | |
| | | | | | | | |
| | | | Telecommunications - 3.66% | | | | |
| | 500,000 | | AT&T, Inc., 2.95%, due 05/15/2016 | | | 538,816 | |
| | 200,000 | | AT&T, Inc., SBC Comm, 5.625%, due 06/15/2016 (b) | | | 234,823 | |
| | 500,000 | | Verizon Communications, Inc., 3.00%, due 04/01/2016 (b) | | | 539,347 | |
| | | | | | | 1,312,986 | |
| | | | | | | | |
| | | | Total Corporate Bonds (Cost $15,688,316) | | | 16,987,960 | |
| | MORTGAGE-BACKED SECURITIES (b) - 15.64% | | | |
| | | Federal Home Loan Mortgage Corporation - 6.93% | | | |
| $ | 751,229 | | Pool J19285, 2.50%, due 06/01/2027 | | $ | 781,311 | |
| | 105,357 | | Series 15L, 7.00%, due 07/25/2023 | | | 120,524 | |
| | 163,851 | | Series 2840 VC, 5.00%, due 08/15/2015 | | | 165,472 | |
| | 593,709 | | Series 2841 BY, 5.00%, due 08/15/2019 | | | 642,779 | |
| | 750,000 | | Series 3290 PD, 5.50%, due 03/15/2035 | | | 776,062 | |
| | | | | | | 2,486,148 | |
The accompanying notes are an integral part of the financial statements.
MONTEAGLE FIXED INCOME FUND SCHEDULE OF INVESTMENTS — August 31, 2012 (Continued) |
| | MORTGAGE-BACKED SECURITIES (b) - 15.64% (Continued) | | | |
| | | Federal National Mortgage Association - 5.95% | | | |
| $ | 1,100,000 | | Pool 386008, 4.52%, due 04/01/2013 | | $ | 1,106,445 | |
| | 159,146 | | Pool 545759, 6.50%, due 07/01/2032 | | | 184,195 | |
| | 66,494 | | Pool 725421, 7.00%, due 09/01/2017 | | | 71,623 | |
| | 81,834 | | Pool 754289, 6.00%, due 11/01/2033 | | | 92,228 | |
| | 171,537 | | Pool 882684, 6.00%, due 06/01/2036 | | | 191,449 | |
| | 188,503 | | Series 2003-54-PG, 5.50%, due 09/25/2032 | | | 196,964 | |
| | 264,270 | | Series 2007-40-PT, 5.50%, due 05/25/2037 | | | 294,904 | |
| | | | | | | 2,137,808 | |
| | | | Government National Mortgage Association - 2.76% | | | | |
| | 133,402 | | Pool 476998, 6.50%, due 07/15/2029 | | | 158,156 | |
| | 125,159 | | Pool 648337, 5.00%, due 10/15/2020 | | | 137,688 | |
| | 135,498 | | Pool 676516, 6.00%, due 02/15/2038 | | | 152,653 | |
| | 133,309 | | Series 2012-52-PM, 3.50%, due 12/20/2039 | | | 144,842 | |
| | 399,936 | | Series 2012-91-HQ, 2.00%, due 09/20/2041 | | | 397,126 | |
| | | | | | | 990,465 | |
| | | | | | | | |
| | | | Total Mortgage-Backed Securities (Cost $5,403,642) | | | 5,614,421 | |
| | MONEY MARKET FUNDS - 10.72% | | | |
| | 3,849,164 | | Fidelity Institutional Money Market Fund Class I, 0.20% (a) (Cost $3,849,164) | | $ | 3,849,164 | |
| | | | | | | | |
| | | | Total Investments at Fair Value - 103.04% (Cost $34,960,080) | | $ | 36,987,726 | |
| | | | | | | | |
| | | | Liabilities in Excess of Other Assets, Net - (3.04)% | | | (1,091,248 | ) |
| | | | | | | | |
| | | | Net Assets - 100.00% | | $ | 35,896,478 | |
| (a) | Rate shown represents the 7-day yield at August 31, 2012, is subject to change and resets daily. |
| (b) | Categorized in level 2 of the fair value hierarchy; for additional information and description of the levels, refer to the table included in Note 2 of the accompanying notes to the financial statements. |
The accompanying notes are an integral part of the financial statements.
MONTEAGLE INFORMED INVESTOR GROWTH FUND SCHEDULE OF INVESTMENTS — August 31, 2012 |
| | | | | |
| | | Aerospace & Defense - 1.01% | | | |
| | 1,000 | | TransDigm Group, Inc. (a) | | $ | 138,620 | |
| | | | | | | | |
| | | | Apparel - 2.00% | | | | |
| | 5,100 | | Michael Kors Holdings Ltd. (a) | | | 275,145 | |
| | | | | | | | |
| | | | Biotechnology - 6.79% | | | | |
| | 8,700 | | Alexion Pharmaceuticals, Inc. (a) | | | 932,727 | |
| | | | | | | | |
| | | | Chemicals - 4.37% | | | | |
| | 2,900 | | CF Industries Holdings, Inc. | | | 600,329 | |
| | | | | | | | |
| | | | Computers - 9.58% | | | | |
| | 1,200 | | Apple, Inc. | | | 798,288 | |
| | 12,400 | | Western Digital Corp. (a) | | | 518,568 | |
| | | | | | | 1,316,856 | |
| | | | Healthcare - Products - 3.68% | | | | |
| | 14,900 | | Align Technology, Inc. (a) | | | 505,855 | |
| | | | | | | | |
| | | | Internet - 2.87% | | | | |
| | 8,300 | | eBay, Inc. (a) | | | 394,001 | |
| | | | | | | | |
| | | | Media - 1.55% | | | | |
| | 3,600 | | Scripps Networks Interactive, Inc. - Class A | | | 212,760 | |
| | | | | | | | |
| | | | Oil & Gas - 3.13% | | | | |
| | 15,400 | | Western Refining, Inc. | | | 430,738 | |
| | | | | | | | |
| | | | Pharmaceuticals - 5.30% | | | | |
| | 6,700 | | Express Scripts Holding Co. (a) | | | 419,554 | |
| | 7,100 | | Questcor Pharmaceuticals, Inc. (a) | | | 308,424 | |
| | | | | | | 727,978 | |
| | | | Retail - 12.71% | | | | |
| | 9,200 | | Lumber Liquidators Holdings, Inc. (a) | | | 429,272 | |
| | 7,200 | | Ross Stores, Inc. | | | 498,168 | |
| | 14,800 | | TJX Cos., Inc. | | | 677,692 | |
| | 1,500 | | Ulta Salon Cosmetics & Fragrance, Inc. | | | 141,000 | |
| | | | | | | 1,746,132 | |
| | | | Semiconductors - 4.99% | | | | |
| | 6,000 | | Mellanox Technologies Ltd. (a) | | | 686,340 | |
The accompanying notes are an integral part of the financial statements.
MONTEAGLE INFORMED INVESTOR GROWTH FUND SCHEDULE OF INVESTMENTS — August 31, 2012 (Continued) |
| | COMMON STOCKS - 60.98% (Continued) | | | |
| | | Software - 3.00% | | | |
| | 7,500 | | SolarWinds, Inc. (a) | | $ | 411,600 | |
| | | | | | | | |
| | | | Total Common Stocks (Cost $7,449,502) | | | 8,379,081 | |
| | EXCHANGE-TRADED FUNDS - 27.59% | | | |
| | 26,100 | | ProShares Ultra QQQ (a) (d) | | $ | 1,560,258 | |
| | 27,500 | | ProShares Ultra Russell2000 (d) | | | 1,143,725 | |
| | 18,600 | | ProShares Ultra S&P500 (d) | | | 1,087,914 | |
| | | | Total Exchange-Traded Funds (Cost $3,496,999) | | | 3,791,897 | |
| | MONEY MARKET FUND - 25.30% | | | |
| | 3,476,565 | | Fidelity Institutional Money Market Fund Class I, 0.20% (b) (c) (Cost $3,476,565) | | $ | 3,476,565 | |
| | | | | | | | |
| | | | Total Investments at Fair Value - 113.87% (Cost $14,423,066) | | $ | 15,647,543 | |
| | | | | | | | |
| | | | Liabilities in Excess of Other Assets, Net - (13.87)% | | | (1,906,538 | ) |
| | | | | | | | |
| | | | Net Assets - 100.00% | | $ | 13,741,005 | |
| (a) | Non-income producing security. |
| (b) | Rate shown represents the 7-day yield at August 31, 2012, is subject to change and resets daily. |
| (c) | A portion of this security is segregated as collateral for securities on loan at August 31, 2012. Total collateral had a fair value of $1,489,380 at August 31, 2012. |
| (d) | Security, or a portion of the security, is out on loan at August 31, 2012. Total loaned securities had a fair value of $1,473,844 at August 31, 2012. |
The accompanying notes are an integral part of the financial statements.
MONTEAGLE QUALITY GROWTH FUND SCHEDULE OF INVESTMENTS — August 31, 2012 |
| | | | | |
| | | Aerospace & Defense - 1.54% | | | |
| | 1,074 | | TransDigm Group, Inc. (a) | | $ | 148,878 | |
| | 3,579 | | United Technologies Corp. | | | 285,783 | |
| | | | | | | 434,661 | |
| | | | Agriculture - 1.93% | | | | |
| | 6,111 | | Philip Morris International, Inc. | | | 545,712 | |
| | | | | | | | |
| | | | Apparel - 2.26% | | | | |
| | 6,555 | | NIKE, Inc. - Class B | | | 638,195 | |
| | | | | | | | |
| | | | Banks - 1.25% | | | | |
| | 16,045 | | East West Bancorp, Inc. | | | 352,027 | |
| | | | | | | | |
| | | | Beverages - 3.11% | | | | |
| | 23,460 | | Coca-Cola Co. | | | 877,404 | |
| | | | | | | | |
| | | | Biotechnology - 1.69% | | | | |
| | 6,627 | | Celgene Corp. (a) | | | 477,409 | |
| | | | | | | | |
| | | | Chemicals - 3.18% | | | | |
| | 3,470 | | Airgas, Inc. | | | 288,253 | |
| | 2,943 | | CF Industries Holdings, Inc. | | | 609,230 | |
| | | | | | | 897,483 | |
| | | | Computers - 14.41% | | | | |
| | 3,775 | | Apple, Inc. | | | 2,511,281 | |
| | 13,310 | | EMC Corp. (a) | | | 349,920 | |
| | 6,191 | | International Business Machines Corp. | | | 1,206,316 | |
| | | | | | | 4,067,517 | |
| | | | Cosmetics & Personal Care - 1.56% | | | | |
| | 7,331 | | Estee Lauder Cos., Inc. | | | 439,493 | |
| | | | | | | | |
| | | | Distribution & Wholesale - 1.59% | | | | |
| | 2,173 | | WW Grainger, Inc. | | | 447,551 | |
| | | | | | | | |
| | | | Diversified Financial Services - 1.58% | | | | |
| | 7,664 | | American Express Co. | | | 446,811 | |
| | | | | | | | |
| | | | Electric - 0.45% | | | | |
| | 3,337 | | Wisconsin Energy Corp. | | | 126,673 | |
The accompanying notes are an integral part of the financial statements.
MONTEAGLE QUALITY GROWTH FUND SCHEDULE OF INVESTMENTS — August 31, 2012 (Continued) |
| | COMMON STOCKS - 99.40% (Continued) | | | |
| | | Electrical Components & Equipment - 1.96% | | | |
| | 16,152 | | AMETEK, Inc. | | $ | 554,175 | |
| | | | | | | | |
| | | | Electronics - 1.50% | | | | |
| | 6,934 | | Amphenol Corp. - Class A | | | 422,073 | |
| | | | | | | | |
| | | | Entertainment - 0.94% | | | | |
| | 11,335 | | Cinemark Holdings, Inc. | | | 265,466 | |
| | | | | | | | |
| | | | Food - 3.01% | | | | |
| | 10,440 | | General Mills, Inc. | | | 410,605 | |
| | 2,470 | | Hain Celestial Group, Inc. (a) | | | 170,405 | |
| | 2,779 | | Whole Foods Market, Inc. | | | 268,868 | |
| | | | | | | 849,878 | |
| | | | Healthcare - Products - 3.73% | | | | |
| | 8,636 | | Baxter International, Inc. | | | 506,760 | |
| | 2,824 | | CR Bard, Inc. | | | 277,063 | |
| | 5,050 | | Stryker Corp. | | | 268,963 | |
| | | | | | | 1,052,786 | |
| | | | Internet - 5.73% | | | | |
| | 1,415 | | Amazon.com, Inc. (a) | | | 351,245 | |
| | 12,120 | | eBay, Inc. (a) | | | 575,336 | |
| | 1,010 | | Google, Inc. - Class A (a) | | | 691,941 | |
| | | | | | | 1,618,522 | |
| | | | Leisure Time - 1.45% | | | | |
| | 2,824 | | Harley-Davidson, Inc. | | | 118,495 | |
| | 3,848 | | Polaris Industries, Inc. | | | 289,331 | |
| | | | | | | 407,826 | |
| | | | Machinery - Diversified - 3.47% | | | | |
| | 2,787 | | Cummins, Inc. | | | 270,646 | |
| | 6,904 | | Roper Industries, Inc. | | | 709,662 | |
| | | | | | | 980,308 | |
| | | | Media - 2.43% | | | | |
| | 13,880 | | Walt Disney Co. | | | 686,644 | |
| | | | | | | | |
| | | | Metal Fabricate & Hardware - 1.04% | | | | |
| | 1,827 | | Precision Castparts Corp. | | | 294,293 | |
| | | | | | | | |
| | | | Miscellaneous Manufacturing - 2.07% | | | | |
| | 10,918 | | Danaher Corp. | | | 584,877 | |
The accompanying notes are an integral part of the financial statements.
MONTEAGLE QUALITY GROWTH FUND SCHEDULE OF INVESTMENTS — August 31, 2012 (Continued) |
| | COMMON STOCKS - 99.40% (Continued) | | | |
| | | Oil & Gas - 1.88% | | | |
| | 2,920 | | Concho Resources, Inc. (a) | | $ | 262,041 | |
| | 3,150 | | Occidental Petroleum Corp. | | | 267,782 | |
| | | | | | | 529,823 | |
| | | | Oil & Gas Services - 3.37% | | | | |
| | 4,525 | | National Oilwell Varco, Inc. | | | 356,570 | |
| | 8,198 | | Schlumberger Ltd. | | | 593,371 | |
| | | | | | | 949,941 | |
| | | | Packaging & Containers - 1.60% | | | | |
| | 10,680 | | Ball Corp. | | | 450,376 | |
| | | | | | | | |
| | | | Pharmaceuticals - 2.90% | | | | |
| | 6,453 | | Abbott Laboratories | | | 422,930 | |
| | 6,335 | | Express Scripts Holding Co. (a) | | | 396,698 | |
| | | | | | | 819,628 | |
| | | | Real Estate Investment Trusts - 2.52% | | | | |
| | 10,097 | | American Tower Corp. | | | 710,829 | |
| | | | | | | | |
| | | | Retail - 10.26% | | | | |
| | 3,615 | | GNC Holdings, Inc. | | | 140,443 | |
| | 7,740 | | Home Depot, Inc. | | | 439,245 | |
| | 9,695 | | Limited Brands, Inc. | | | 471,177 | |
| | 3,195 | | McDonald's Corp. | | | 285,921 | |
| | 12,648 | | Nordstrom, Inc. | | | 731,434 | |
| | 5,885 | | Wal-Mart Stores, Inc. | | | 427,251 | |
| | 6,285 | | Yum! Brands, Inc. | | | 400,480 | |
| | | | | | | 2,895,951 | |
| | | | Semiconductors - 6.66% | | | | |
| | 14,720 | | Intel Corp. | | | 365,498 | |
| | 16,158 | | Microchip Technology, Inc. | | | 561,490 | |
| | 15,500 | | QUALCOMM, Inc. | | | 952,630 | |
| | | | | | | 1,879,618 | |
| | | | Software - 5.57% | | | | |
| | 35,478 | | Microsoft Corp. | | | 1,093,432 | |
| | 15,125 | | Oracle Corp. | | | 478,706 | |
| | | | | | | 1,572,138 | |
| | | | Telecommunications - 1.22% | | | | |
| | 8,010 | | Verizon Communications, Inc. | | | 343,949 | |
The accompanying notes are an integral part of the financial statements.
MONTEAGLE QUALITY GROWTH FUND SCHEDULE OF INVESTMENTS — August 31, 2012 (Continued) |
| | COMMON STOCKS - 99.40% (Continued) | | | |
| | | Transportation - 1.54% | | | |
| | 19,373 | | CSX Corp. | | $ | 435,118 | |
| | | | | | | | |
| | | | Total Common Stocks (Cost $21,679,655) | | | 28,055,155 | |
| | MONEY MARKET FUND - 0.48% | | | |
| | 134,955 | | Fidelity Institutional Money Market Fund Class I, 0.20% (b) (Cost $134,955) | | $ | 134,955 | |
| | | | | | | | |
| | | | Total Investments at Fair Value - 99.88% (Cost $21,814,610) | | $ | 28,190,110 | |
| | | | | | | | |
| | | | Other Assets in Excess of Liabilities, Net - 0.12% | | | 34,943 | |
| | | | | | | | |
| | | | Net Assets - 100.00% | | $ | 28,225,053 | |
| (a) | Non-income producing security. |
| (b) | Rate shown represents the 7-day yield at August 31, 2012, is subject to change and resets daily. |
The accompanying notes are an integral part of the financial statements.
MONTEAGLE SELECT VALUE FUND SCHEDULE OF INVESTMENTS — August 31, 2012 |
| | | | | |
| | | Aerospace & Defense - 3.92% | | | |
| | 1,300 | | Lockheed Martin Corp. | | $ | 118,482 | |
| | 4,953 | | Raytheon Co. | | | 279,943 | |
| | | | | | | 398,425 | |
| | | | Banks - 5.11% | | | | |
| | 7,400 | | Bank of America Corp. | | | 59,126 | |
| | 1,091 | | Goldman Sachs Group, Inc. | | | 115,341 | |
| | 19,947 | | KeyCorp | | | 168,153 | |
| | 11,849 | | Morgan Stanley | | | 177,735 | |
| | | | | | | 520,355 | |
| | | | Biotechnology - 2.69% | | | | |
| | 4,747 | | Gilead Sciences, Inc. (a) | | | 273,854 | |
| | | | | | | | |
| | | | Building Materials - 2.26% | | | | |
| | 16,216 | | Masco Corp. | | | 229,619 | |
| | | | | | | | |
| | | | Chemicals - 1.70% | | | | |
| | 5,900 | | Dow Chemical Co. | | | 172,929 | |
| | | | | | | | |
| | | | Commercial Services - 3.12% | | | | |
| | 12,630 | | H&R Block, Inc. | | | 209,153 | |
| | 9,899 | | RR Donnelley & Sons Co. (d) | | | 108,691 | |
| | | | | | | 317,844 | |
| | | | Computers - 2.95% | | | | |
| | 6,094 | | Computer Sciences Corp. | | | 196,288 | |
| | 6,175 | | Hewlett-Packard Co. | | | 104,234 | |
| | | | | | | 300,522 | |
| | | | Diversified Financial Services - 1.18% | | | | |
| | 2,180 | | CME Group, Inc. | | | 119,682 | |
| | | | | | | | |
| | | | Electric - 1.07% | | | | |
| | 2,500 | | FirstEnergy Corp. | | | 109,250 | |
| | | | | | | | |
| | | | Hand & Machine Tools - 1.77% | | | | |
| | 2,600 | | Snap-on, Inc. | | | 180,492 | |
| | | | | | | | |
| | | | Healthcare - Products - 0.94% | | | | |
| | 1,800 | | Stryker Corp. | | | 95,868 | |
The accompanying notes are an integral part of the financial statements.
MONTEAGLE SELECT VALUE FUND SCHEDULE OF INVESTMENTS — August 31, 2012 (Continued) |
| | COMMON STOCKS - 93.44% (Continued) | | | |
| | | Healthcare - Services - 2.95% | | | |
| | 5,016 | | WellPoint, Inc. | | $ | 300,308 | |
| | | | | | | | |
| | | | Home Furnishings - 2.29% | | | | |
| | 3,087 | | Whirlpool Corp. | | | 232,945 | |
| | | | | | | | |
| | | | Housewares - 1.53% | | | | |
| | 8,700 | | Newell Rubbermaid, Inc. | | | 155,991 | |
| | | | | | | | |
| | | | Insurance - 10.99% | | | | |
| | 3,715 | | Aflac, Inc. | | | 171,559 | |
| | 6,388 | | Allstate Corp. | | | 238,145 | |
| | 4,827 | | Assurant, Inc. | | | 170,152 | |
| | 32,310 | | Genworth Financial, Inc. (a) | | | 170,920 | |
| | 5,495 | | MetLife, Inc. | | | 187,544 | |
| | 3,311 | | Prudential Financial, Inc. | | | 180,482 | |
| | | | | | | 1,118,802 | |
| | | | Iron & Steel - 3.42% | | | | |
| | 3,665 | | Cliffs Natural Resources, Inc. | | | 131,354 | |
| | 4,197 | | Nucor Corp. | | | 158,017 | |
| | 3,000 | | United States Steel Corp. (d) | | | 58,350 | |
| | | | | | | 347,721 | |
| | | | Media - 3.45% | | | | |
| | 12,459 | | Gannett Co., Inc. | | | 190,124 | |
| | 458 | | Washington Post Co. | | | 161,445 | |
| | | | | | | 351,569 | |
| | | | Mining - 1.44% | | | | |
| | 12,000 | | Titanium Metals Corp. | | | 146,880 | |
| | | | | | | | |
| | | | Miscellaneous Manufacturing - 1.49% | | | | |
| | 7,300 | | General Electric Co. | | | 151,183 | |
| | | | | | | | |
| | | | Office & Business Equipment - 1.06% | | | | |
| | 14,634 | | Xerox Corp. | | | 107,853 | |
| | | | | | | | |
| | | | Oil & Gas - 5.25% | | | | |
| | 2,200 | | ConocoPhillips | | | 124,938 | |
| | 2,683 | | Diamond Offshore Drilling, Inc. | | | 179,814 | |
| | 1,100 | | Phillips 66 | | | 46,200 | |
The accompanying notes are an integral part of the financial statements.
MONTEAGLE SELECT VALUE FUND SCHEDULE OF INVESTMENTS — August 31, 2012 (Continued) |
| | COMMON STOCKS - 93.44% (Continued) | | | |
| | | Oil & Gas - 5.25% (Continued) | | | |
| | 5,200 | | Rowan Cos., PLC (a) | | $ | 182,936 | |
| | | | | | | 533,888 | |
| | | | Oil & Gas Services - 2.92% | | | | |
| | 6,513 | | Baker Hughes, Inc. | | | 296,993 | |
| | | | | | | | |
| | | | Pharmaceuticals - 3.17% | | | | |
| | 13,500 | | Pfizer, Inc. | | | 322,110 | |
| | | | | | | | |
| | | | Retail - 9.03% | | | | |
| | 5,305 | | Best Buy Co., Inc. | | | 94,110 | |
| | 5,607 | | CVS Caremark Corp. | | | 255,399 | |
| | 8,423 | | GameStop Corp. - Class A (d) | | | 160,711 | |
| | 2,000 | | Kohl's Corp. | | | 104,400 | |
| | 10,382 | | RadioShack Corp. (d) | | | 25,228 | |
| | 3,848 | | Wal-Mart Stores, Inc. | | | 279,365 | |
| | | | | | | 919,213 | |
| | | | Savings & Loans - 1.35% | | | | |
| | 19,082 | | Hudson City Bancorp, Inc. | | | 137,200 | |
| | | | | | | | |
| | | | Semiconductors - 5.87% | | | | |
| | 22,477 | | Applied Materials, Inc. | | | 262,756 | |
| | 15,094 | | First Solar, Inc. (a) (d) | | | 301,729 | |
| | 12,460 | | MEMC Electronic Materials, Inc. (a) | | | 33,393 | |
| | | | | | | 597,878 | |
| | | | Software - 2.06% | | | | |
| | 6,806 | | Microsoft Corp. | | | 209,761 | |
| | | | | | | | |
| | | | Telecommunications - 6.96% | | | | |
| | 4,000 | | AT&T, Inc. | | | 146,560 | |
| | 9,571 | | Corning, Inc. | | | 114,756 | |
| | 5,509 | | Harris Corp. | | | 259,088 | |
| | 38,760 | | Sprint Nextel Corp. (a) | | | 187,986 | |
| | | | | | | 708,390 | |
| | | | Transportation - 1.50% | | | | |
| | 2,100 | | Norfolk Southern Corp. | | | 152,166 | |
| | | | | | | | |
| | | | Total Common Stocks (Cost $9,772,052) | | | 9,509,691 | |
The accompanying notes are an integral part of the financial statements.
MONTEAGLE SELECT VALUE FUND SCHEDULE OF INVESTMENTS — August 31, 2012 (Continued) |
| | MONEY MARKET FUND - 12.80% | | | |
| | 1,302,583 | | Fidelity Institutional Money Market Fund Class I, 0.20% (b) (c) (Cost $1,302,583) | | $ | 1,302,583 | |
| | | | | | | | |
| | | | Total Investments at Fair Value - 106.24% (Cost $11,074,635) | | $ | 10,812,274 | |
| | | | | | | | |
| | | | Liabilities in Excess of Other Assets, Net - (6.24%) | | | (635,347 | ) |
| | | | | | | | |
| | | | Net Assets - 100.00% | | $ | 10,176,927 | |
| (a) | Non-income producing security. |
| (b) | Rate shown represents the 7-day yield at August 31, 2012, is subject to change and resets daily. |
| (c) | A portion of this security is segregated as collateral for securities on loan at August 31, 2012. Total collateral had a fair value of $658,622 at August 31, 2012. |
| (d) | Security, or a portion of the security, is out on loan at August 31, 2012. Total loaned securities had a fair value of $648,917 at August 31, 2012. |
The accompanying notes are an integral part of the financial statements.
MONTEAGLE VALUE FUND SCHEDULE OF INVESTMENTS — August 31, 2012 |
| | | | | |
| | | Aerospace & Defense - 2.48% | | | |
| | 6,300 | | Raytheon Co. | | $ | 356,076 | |
| | | | | | | | |
| | | | Chemicals - 11.34% | | | | |
| | 23,000 | | Chemtura Corp. (a) | | | 380,190 | |
| | 8,880 | | Eastman Chemical Co. | | | 490,709 | |
| | 10,750 | | EI du Pont de Nemours & Co. | | | 534,812 | |
| | 13,000 | | Kronos Worldwide, Inc. (d) | | | 220,610 | |
| | | | | | | 1,626,321 | |
| | | | Commercial Services - 1.36% | | | | |
| | 16,000 | | SAIC, Inc. | | | 195,360 | |
| | | | | | | | |
| | | | Computers - 1.33% | | | | |
| | 18,000 | | Dell, Inc. (a) | | | 190,620 | |
| | | | | | | | |
| | | | Electric - 5.48% | | | | |
| | 8,516 | | Duke Energy Corp. | | | 551,666 | |
| | 11,000 | | NRG Energy, Inc. | | | 234,740 | |
| | | | | | | 786,406 | |
| | | | Electronics - 1.63% | | | | |
| | 27,000 | | Sanmina-SCI Corp. (a) | | | 233,280 | |
| | | | | | | | |
| | | | Environmental Control - 1.62% | | | | |
| | 17,000 | | Calgon Carbon Corp. (a) | | | 232,050 | |
| | | | | | | | |
| | | | Food - 2.80% | | | | |
| | 10,000 | | Cal-Maine Foods, Inc. | | | 401,800 | |
| | | | | | | | |
| | | | Forest Products & Paper - 3.37% | | | | |
| �� | 14,000 | | International Paper Co. | | | 483,840 | |
| | | | | | | | |
| | | | Healthcare - Products - 6.07% | | | | |
| | 32,000 | | Boston Scientific Corp. (a) | | | 172,800 | |
| | 6,800 | | Medtronic, Inc. | | | 276,488 | |
| | 20,000 | | NuVasive, Inc. (a) | | | 421,600 | |
| | | | | | | 870,888 | |
| | | | Investment Companies - 1.58% | | | | |
| | 9,000 | | Steel Excel, Inc. (a) | | | 226,890 | |
The accompanying notes are an integral part of the financial statements.
MONTEAGLE VALUE FUND SCHEDULE OF INVESTMENTS — August 31, 2012 (Continued) |
| | COMMON STOCKS - 95.39% (Continued) | | | |
| | | Iron & Steel - 1.97% | | | |
| | 7,500 | | Nucor Corp. | | $ | 282,375 | |
| | | | | | | | |
| | | | Metal Fabricate & Hardware - 3.50% | | | | |
| | 24,000 | | Worthington Industries, Inc. | | | 501,600 | |
| | | | | | | | |
| | | | Mining - 6.52% | | | | |
| | 10,000 | | Barrick Gold Corp. | | | 385,200 | |
| | 7,000 | | Newmont Mining Corp. | | | 354,760 | |
| | 5,000 | | Vulcan Materials Co. | | | 194,600 | |
| | | | | | | 934,560 | |
| | | | Miscellaneous Manufacturing - 4.10% | | | | |
| | 22,000 | | Textron, Inc. | | | 587,840 | |
| | | | | | | | |
| | | | Oil & Gas - 4.89% | | | | |
| | 12,000 | | Marathon Oil Corp. | | | 333,840 | |
| | 7,494 | | Transocean Ltd. | | | 367,431 | |
| | | | | | | 701,271 | |
| | | | Oil & Gas Services - 2.28% | | | | |
| | 10,000 | | Halliburton Co. | | | 327,600 | |
| | | | | | | | |
| | | | Packaging & Containers - 2.00% | | | | |
| | 9,400 | | Sonoco Products Co. | | | 287,546 | |
| | | | | | | | |
| | | | Pharmaceuticals - 7.15% | | | | |
| | 10,000 | | Bristol-Myers Squibb Co. | | | 330,100 | |
| | 16,147 | | Merck & Co, Inc. | | | 695,128 | |
| | | | | | | 1,025,228 | |
| | | | Retail - 3.65% | | | | |
| | 225 | | Orchard Supply Hardware Stores Corp. (a) | | | 3,222 | |
| | 5,000 | | Sears Holdings Corp. (a) (d) | | | 263,750 | |
| | 60,000 | | Wendy's Co. - Class A | | | 256,200 | |
| | | | | | | 523,172 | |
| | | | Semiconductors - 7.03% | | | | |
| | 45,000 | | Amkor Technology, Inc. (a) (d) | | | 211,050 | |
| | 17,000 | | Intel Corp. | | | 422,110 | |
| | 19,000 | | Spreadtrum Communications, Inc. - ADR (d) | | | 375,440 | |
| | | | | | | 1,008,600 | |
The accompanying notes are an integral part of the financial statements.
MONTEAGLE VALUE FUND SCHEDULE OF INVESTMENTS — August 31, 2012 (Continued) |
| | COMMON STOCKS - 95.39% (Continued) | | | |
| | | Telecommunications - 11.52% | | | |
| | 20,000 | | AT&T, Inc. | | $ | 732,800 | |
| | 2,880 | | Frontier Communications Corp. (d) | | | 13,306 | |
| | 9,700 | | Rogers Communications, Inc. - Class B | | | 391,783 | |
| | 12,000 | | Verizon Communications, Inc. | | | 515,280 | |
| | | | | | | 1,653,169 | |
| | | | Transportation - 1.72% | | | | |
| | 11,000 | | CSX Corp. | | | 247,060 | |
| | | | | | | | |
| | | | Total Common Stocks (Cost $11,462,265) | | | 13,683,552 | |
| | | | | |
| | | Retail - 0.00% | | | |
| | 225 | | Orchard Supply Hardware Stores Corp. (a) (d) | | $ | 394 | |
| | | | | | | | |
| | | | Total Preferred Stocks (Cost $985) | | | 394 | |
| | MONEY MARKET FUND - 11.85% | | | |
| | 1,700,652 | | Fidelity Institutional Money Market Fund Class I, 0.20% (b) (c) (Cost $1,700,652) | | $ | 1,700,652 | |
| | | | | | | | |
| | | | Total Investments at Fair Value - 107.24% (Cost $13,163,902) | | $ | 15,384,598 | |
| | | | | | | | |
| | | | Liabilities in Excess of Other Assets, Net - (7.24)% | | | (1,038,970 | ) |
| | | | | | | | |
| | | | Net Assets - 100.00% | | $ | 14,345,628 | |
| (a) | Non-income producing security. |
| (b) | Rate shown represents the 7-day yield at August 31, 2012, is subject to change and resets daily. |
| (c) | A portion of this security is segregated as collateral for securities on loan at August 31, 2012. Total collateral had a fair value of $1,054,991 at August 31, 2012. |
| (d) | Security, or a portion of the security is out on loan at August 31, 2012. Total loaned securities had a fair value of $1,037,808 at August 31, 2012. |
The accompanying notes are an integral part of the financial statements.
MONTEAGLE FUNDS STATEMENTS OF ASSETS AND LIABILITIES — August 31, 2012 |
| | | | | Informed Investor Growth Fund | | | | |
| ASSETS | | | | | | | | | |
| Investment securities | | | | | | | | | |
| At cost | | $ | 34,960,080 | | | $ | 14,423,066 | | | $ | 21,814,610 | |
| At fair value (Note 2) | | $ | 36,987,726 | | | $ | 15,647,543 | | | $ | 28,190,110 | |
| Receivables: | | | | | | | | | | | | |
| Dividends and interest | | | 237,544 | | | | 3,817 | | | | 64,733 | |
| Other assets | | | 793 | | | | 793 | | | | 793 | |
| Total assets | | | 37,226,063 | | | | 15,652,153 | | | | 28,255,636 | |
| | | | | | | | | | | | | |
| LIABILITIES | | | | | | | | | | | | |
| Payables: | | | | | | | | | | | | |
| Distributions | | | 12,277 | | | | — | | | | — | |
| Investment securities purchased | | | 1,285,576 | | | | 406,375 | | | | — | |
| Securities Loan Payable (Note 2) | | | — | | | | 1,489,380 | | | | — | |
| Due to Adviser (Note 3) | | | 29,004 | | | | 13,721 | | | | 28,216 | |
| Accrued compliance service fees (Note 3) | | | 2,128 | | | | 1,072 | | | | 1,767 | |
| Other liabilities and accrued expenses | | | 600 | | | | 600 | | | | 600 | |
| Total liabilities | | | 1,329,585 | | | | 1,911,148 | | | | 30,583 | |
| | | | | | | | | | | | | |
| NET ASSETS | | $ | 35,896,478 | | | $ | 13,741,005 | | | $ | 28,225,053 | |
| | | | | | | | | | | | | |
| NET ASSETS CONSIST OF: | | | | | | | | | | | | |
| Paid-in capital | | $ | 34,419,958 | | | $ | 11,703,129 | | | $ | 28,608,349 | |
| Accumulated undistributed net investment income | | | 562 | | | | — | | | | 68,391 | |
| Accumulated net realized gain (loss) on investments | | | (551,688 | ) | | | 813,399 | | | | (6,827,187 | ) |
| Net unrealized appreciation on investments | | | 2,027,646 | | | | 1,224,477 | | | | 6,375,500 | |
| NET ASSETS | | $ | 35,896,478 | | | $ | 13,741,005 | | | $ | 28,225,053 | |
| | | | | | | | | | | | | |
Shares of beneficial interest outstanding (1) | | | 3,322,640 | | | | 1,173,364 | | | | 2,835,527 | |
| Net Asset Value, offering and redemption price per share | | $ | 10.80 | | | $ | 11.71 | | | $ | 9.95 | |
| (1) | Unlimited number of shares of beneficial interest with no par value, authorized. |
The accompanying notes are an integral part of the financial statements.
MONTEAGLE FUNDS STATEMENTS OF ASSETS AND LIABILITIES — August 31, 2012 |
| | | | | | |
| ASSETS | | | | | | |
| Investment securities | | | | | | |
| At cost | | $ | 11,074,635 | | | $ | 13,163,902 | |
| At fair value (Note 2) | | $ | 10,812,274 | | | $ | 15,384,598 | |
| Receivables: | | | | | | | | |
| Dividends and interest | | | 34,270 | | | | 31,633 | |
| Other assets | | | 793 | | | | 793 | |
| Total assets | | | 10,847,337 | | | | 15,417,024 | |
| | | | | | | | | |
| LIABILITIES | | | | | | | | |
| Payables: | | | | | | | | |
| Securities Loan Payable (Note 2) | | | 658,622 | | | | 1,054,991 | |
| Due to Adviser (Note 3) | | | 10,278 | | | | 14,619 | |
| Accrued compliance service fees (Note 3) | | | 910 | | | | 1,114 | |
| Other liabilities and accrued expenses | | | 600 | | | | 672 | |
| Total liabilities | | | 670,410 | | | | 1,071,396 | |
| | | | | | | | | |
| NET ASSETS | | $ | 10,176,927 | | | $ | 14,345,628 | |
| | | | | | | | | |
| NET ASSETS CONSIST OF: | | | | | | | | |
| Paid-in capital | | $ | 11,705,891 | | | $ | 12,055,552 | |
| Accumulated undistributed net investment income | | | 25,882 | | | | 31,804 | |
| Accumulated net realized gain (loss) on investments | | | (1,292,485 | ) | | | 37,576 | |
| Net unrealized appreciation (depreciation) on investments | | | (262,361 | ) | | | 2,220,696 | |
| NET ASSETS | | $ | 10,176,927 | | | $ | 14,345,628 | |
| | | | | | | | | |
Shares of beneficial interest outstanding (1) | | | 929,810 | | | | 1,077,437 | |
| Net Asset Value, offering and redemption price per share | | $ | 10.95 | | | $ | 13.31 | |
| (1) | Unlimited number of shares of beneficial interest with no par value, authorized. |
The accompanying notes are an integral part of the financial statements.
MONTEAGLE FUNDS STATEMENTS OF OPERATIONS — For the Year Ended August 31, 2012 |
| | | | | Informed Investor Growth Fund | | | | |
| INVESTMENT INCOME | | | | | | | | | |
| | | | | | | | | | |
| Income: | | | | | | | | | |
| Interest | | $ | 1,201,348 | | | $ | 3,699 | | | $ | 643 | |
| Securities lending | | | — | | | | 15,564 | | | | 1,590 | |
| Dividends | | | — | | | | 43,777 | | | | 417,352 | |
| | | | | | | | | | | | | |
| Total Investment Income | | | 1,201,348 | | | | 63,040 | | | | 419,585 | |
| | | | | | | | | | | | | |
| Expenses: | | | | | | | | | | | | |
| Investment advisory fees (Note 3) | | | 326,509 | | | | 172,332 | | | | 315,578 | |
| Distribution (12b-1) fees - Class C (Note 3) | | | — | | | | 844 | | | | — | |
| Compliance service fees (Note 3) | | | 31,975 | | | | 18,102 | | | | 26,654 | |
| Trustees' fees | | | 7,528 | | | | 7,528 | | | | 7,528 | |
| ICI membership fees | | | 1,457 | | | | 1,457 | | | | 1,459 | |
| | | | | | | | | | | | | |
| Total expenses | | | 367,469 | | | | 200,263 | | | | 351,219 | |
| | | | | | | | | | | | | |
| Less: | | | | | | | | | | | | |
| Distribution (12b-1) fees - Class A reimbursed (Note 3) | | | (7 | ) | | | (7 | ) | | | (7 | ) |
| Distribution (12b-1) fees - Class C reimbursed (Note 3) | | | (20 | ) | | | — | | | | (20 | ) |
| | | | | | | | | | | | | |
| Net expenses | | | 367,442 | | | | 200,256 | | | | 351,192 | |
| | | | | | | | | | | | | |
| Net investment income (loss) | | | 833,906 | | | | (137,216 | ) | | | 68,393 | |
| | | | | | | | | | | | | |
| REALIZED AND UNREALIZED GAIN (LOSS) ON INVESTMENTS | | | | | | | | | | | | |
| | | | | | | | | | | | | |
| Net realized gain from investments | | | 669,697 | | | | 1,370,176 | | | | 678,424 | |
| Net change in unrealized appreciation (depreciation) on investments | | | (333,153 | ) | | | 652,581 | | | | 2,938,380 | |
| | | | | | | | | | | | | |
| Net realized and unrealized gain on investments | | | 336,544 | | | | 2,022,757 | | | | 3,616,804 | |
| | | | | | | | | | | | | |
| Net increase in net assets resulting from operations | | $ | 1,170,450 | | | $ | 1,885,541 | | | $ | 3,685,197 | |
The accompanying notes are an integral part of the financial statements.
MONTEAGLE FUNDS STATEMENTS OF OPERATIONS — For the Year Ended August 31, 2012 |
| | | | | | |
| INVESTMENT INCOME | | | | | | |
| | | | | | | |
| Income: | | | | | | |
| Interest | | $ | 1,431 | | | $ | 813 | |
| Securities lending | | | 9,116 | | | | 45,485 | |
| Dividends | | | 252,623 | | | | 340,491 | |
| Foreign withholding tax | | | — | | | | (3,383 | ) |
| | | | | | | | | |
| Total Investment Income | | | 263,170 | | | | 383,406 | |
| | | | | | | | | |
| Expenses: | | | | | | | | |
| Investment advisory fees (Note 3) | | | 118,948 | | | | 168,082 | |
| Compliance service fees (Note 3) | | | 13,367 | | | | 16,997 | |
| Legal fees | | | — | | | | 5,981 | |
| Trustees' fees | | | 7,528 | | | | 7,528 | |
| ICI membership fees | | | 1,500 | | | | 1,456 | |
| | | | | | | | | |
| Total expenses | | | 141,343 | | | | 200,044 | |
| | | | | | | | | |
| Less: | | | | | | | | |
| Distribution (12b-1) fees - Class A reimbursed (Note 3) | | | (6 | ) | | | (7 | ) |
| Distribution (12b-1) fees - Class C reimbursed (Note 3) | | | (22 | ) | | | (20 | ) |
| | | | | | | | | |
| Net expenses | | | 141,315 | | | | 200,017 | |
| | | | | | | | | |
| Net investment income | | | 121,855 | | | | 183,389 | |
| | | | | | | | | |
| REALIZED AND UNREALIZED GAIN ON INVESTMENTS | | | | | | | | |
| | | | | | | | | |
| Net realized gain from investments | | | 329,196 | | | | 37,827 | |
| Net change in unrealized appreciation on investments | | | 397,830 | | | | 914,936 | |
| | | | | | | | | |
| Net realized and unrealized gain on investments | | | 727,026 | | | | 952,763 | |
| | | | | | | | | |
| Net increase in net assets resulting from operations | | $ | 848,881 | | | $ | 1,136,152 | |
The accompanying notes are an integral part of the financial statements.
MONTEAGLE FIXED INCOME FUND STATEMENTS OF CHANGES IN NET ASSETS |
| | | | | | |
| INCREASE (DECREASE) IN NET ASSETS | | | | | | |
| FROM OPERATIONS | | | | | | |
| Net investment income | | $ | 833,906 | | | $ | 928,217 | |
| Net realized gain on investment transactions | | | 669,697 | | | | 71,461 | |
| Net change in unrealized depreciation on investments | | | (333,153 | ) | | | (127,646 | ) |
| Net increase in net assets resulting from operations | | $ | 1,170,450 | | | $ | 872,032 | |
| | | | | | | | | |
| FROM DISTRIBUTIONS TO SHAREHOLDERS | | | | | | | | |
| From net investment income - Class I | | | (844,692 | ) | | | (959,653 | ) |
| From net investment income - Class A | | | (31 | ) | | | (28 | ) |
| From net investment income - Class C | | | (44 | ) | | | (21 | ) |
| Net decrease in net assets from distributions to shareholders | | | (844,767 | ) | | | (959,702 | ) |
| | | | | | | | | |
| FROM CAPITAL SHARE TRANSACTIONS | | | | | | | | |
| Net increase (decrease) in net assets from capital share transactions (Note 7) | | | 3,676,210 | | | | (2,930,590 | ) |
| | | | | | | | | |
| Total increase (decrease) in net assets | | | 4,001,893 | | | | (3,018,260 | ) |
| | | | | | | | | |
| NET ASSETS | | | | | | | | |
| Beginning of period | | | 31,894,585 | | | | 34,912,845 | |
| End of period | | $ | 35,896,478 | | | $ | 31,894,585 | |
| ACCUMULATED UNDISTRIBUTED NET INVESTMENT INCOME | | $ | 562 | | | $ | 344 | |
The accompanying notes are an integral part of the financial statements.
MONTEAGLE INFORMED INVESTOR GROWTH FUND STATEMENTS OF CHANGES IN NET ASSETS |
| | | | | | |
| INCREASE (DECREASE) IN NET ASSETS | | | | | | |
| FROM OPERATIONS | | | | | | |
| Net investment loss | | $ | (137,216 | ) | | $ | (110,376 | ) |
| Net realized gain on investment transactions | | | 1,370,176 | | | | 971,216 | |
| Net change in unrealized appreciation on investments | | | 652,581 | | | | 2,288,968 | |
| Net increase in net assets resulting from operations | | $ | 1,885,541 | | | $ | 3,149,808 | |
| | | | | | | | | |
| FROM DISTRIBUTIONS TO SHAREHOLDERS | | | | | | | | |
| From net realized capital gains - Class I | | | (490,854 | ) | | | (2,884,614 | ) |
| From net realized capital gains - Class A | | | (39 | ) | | | (146 | ) |
| From net realized capital gains - Class C | | | (2,847 | ) | | | (36,592 | ) |
| Net decrease in net assets from distributions to shareholders | | | (493,740 | ) | | | (2,921,352 | ) |
| | | | | | | | | |
| FROM CAPITAL SHARE TRANSACTIONS | | | | | | | | |
| Net decrease in net assets from capital share transactions (Note 7) | | | (5,690,689 | ) | | | (129,611 | ) |
| | | | | | | | | |
| Total increase (decrease) in net assets | | | (4,298,888 | ) | | | 98,845 | |
| | | | | | | | | |
| NET ASSETS | | | | | | | | |
| Beginning of period | | | 18,039,893 | | | | 17,941,048 | |
| End of period | | $ | 13,741,005 | | | $ | 18,039,893 | |
| ACCUMULATED UNDISTRIBUTED NET INVESTMENT INCOME | | $ | — | | | $ | — | |
The accompanying notes are an integral part of the financial statements.
MONTEAGLE QUALITY GROWTH FUND STATEMENTS OF CHANGES IN NET ASSETS |
| | | | | | |
| INCREASE (DECREASE) IN NET ASSETS | | | | | | |
| FROM OPERATIONS | | | | | | |
| Net investment income | | $ | 68,393 | | | $ | 4,550 | |
| Net realized gain on investment transactions | | | 678,424 | | | | 2,121,999 | |
| Net change in unrealized appreciation on investments | | | 2,938,380 | | | | 2,519,084 | |
| Net increase in net assets resulting from operations | | $ | 3,685,197 | | | $ | 4,645,633 | |
| | | | | | | | | |
| FROM DISTRIBUTIONS TO SHAREHOLDERS | | | | | | | | |
| From net investment income - Class I | | | (4,552 | ) | | | (7,211 | ) |
| | | | | | | | | |
| FROM CAPITAL SHARE TRANSACTIONS | | | | | | | | |
| Net increase (decrease) in net assets from capital share transactions (Note 7) | | | 1,777,005 | | | | (4,322,451 | ) |
| | | | | | | | | |
| Total increase in net assets | | | 5,457,650 | | | | 315,971 | |
| | | | | | | | | |
| NET ASSETS | | | | | | | | |
| Beginning of period | | | 22,767,403 | | | | 22,451,432 | |
| End of period | | $ | 28,225,053 | | | $ | 22,767,403 | |
| ACCUMULATED UNDISTRIBUTED NET INVESTMENT INCOME | | $ | 68,391 | | | $ | 4,550 | |
The accompanying notes are an integral part of the financial statements.
MONTEAGLE SELECT VALUE FUND STATEMENTS OF CHANGES IN NET ASSETS |
| | | | | | |
| INCREASE (DECREASE) IN NET ASSETS | | | | | | |
| FROM OPERATIONS | | | | | | |
| Net investment income | | $ | 121,855 | | | $ | 34,830 | |
| Net realized gain on investment transactions | | | 329,196 | | | | 2,254,196 | |
| Net change in unrealized appreciation (depreciation) on investments | | | 397,830 | | | | (977,902 | ) |
| Net increase in net assets resulting from operations | | $ | 848,881 | | | $ | 1,311,124 | |
| | | | | | | | | |
| FROM DISTRIBUTIONS TO SHAREHOLDERS | | | | | | | | |
| From net investment income - Class I | | | (111,869 | ) | | | (24,438 | ) |
| From net investment income - Class A | | | (9 | ) | | | (1 | ) |
| From net investment income - Class C | | | (2 | ) | | | — | |
| Net decrease in net assets from distributions to shareholders | | | (111,880 | ) | | | (24,439 | ) |
| | | | | | | | | |
| FROM CAPITAL SHARE TRANSACTIONS | | | | | | | | |
| Net increase (decrease) in net assets from capital share transactions (Note 7) | | | (355,655 | ) | | | 242,276 | |
| | | | | | | | | |
| Total increase in net assets | | | 381,346 | | | | 1,528,961 | |
| | | | | | | | | |
| NET ASSETS | | | | | | | | |
| Beginning of period | | | 9,795,581 | | | | 8,266,620 | |
| End of period | | $ | 10,176,927 | | | $ | 9,795,581 | |
| ACCUMULATED UNDISTRIBUTED NET INVESTMENT INCOME | | $ | 25,882 | | | $ | 15,907 | |
The accompanying notes are an integral part of the financial statements.
MONTEAGLE VALUE FUND STATEMENTS OF CHANGES IN NET ASSETS |
| | | | | | |
| INCREASE (DECREASE) IN NET ASSETS | | | | | | |
| FROM OPERATIONS | | | | | | |
| Net investment income | | $ | 183,389 | | | $ | 131,043 | |
| Net realized gain on investment transactions | | | 37,827 | | | | 2,836,506 | |
| Net change in unrealized appreciation (depreciation) on investments | | | 914,936 | | | | (499,940 | ) |
| Net increase in net assets resulting from operations | | $ | 1,136,152 | | | $ | 2,467,609 | |
| | | | | | | | | |
| FROM DISTRIBUTIONS TO SHAREHOLDERS | | | | | | | | |
| From net investment income - Class I | | | (174,916 | ) | | | (130,701 | ) |
| From net investment income - Class A | | | (11 | ) | | | (6 | ) |
| From net investment income - Class C | | | (4 | ) | | | (1 | ) |
| From net realized capital gains - Class I | | | (2,749,677 | ) | | | — | |
| From net realized capital gains - Class A | | | (226 | ) | | | — | |
| From net realized capital gains - Class C | | | (223 | ) | | | — | |
| Decrease in net assets from distributions to shareholders | | | (2,925,057 | ) | | | (130,708 | ) |
| | | | | | | | | |
| FROM CAPITAL SHARE TRANSACTIONS | | | | | | | | |
| Net increase (decrease) in net assets from capital share transactions (Note 7) | | | 1,915,758 | | | | (2,382,977 | ) |
| | | | | | | �� | | |
| Total increase (decrease) in net assets | | | 126,853 | | | | (46,076 | ) |
| | | | | | | | | |
| NET ASSETS | | | | | | | | |
| Beginning of period | | | 14,218,775 | | | | 14,264,851 | |
| End of period | | $ | 14,345,628 | | | $ | 14,218,775 | |
| ACCUMULATED UNDISTRIBUTED NET INVESTMENT INCOME | | $ | 31,804 | | | $ | 23,346 | |
The accompanying notes are an integral part of the financial statements.
MONTEAGLE FIXED INCOME FUND FINANCIAL HIGHLIGHTS |
| For a Share Outstanding Throughout the Year | |
| | | | | | | | | | | | | | | |
| Net asset value, beginning of period | | $ | 10.70 | | | $ | 10.71 | | | $ | 10.34 | | | $ | 10.05 | | | $ | 9.96 | |
| Income (loss) from investment operations: | | | | | | | | | | | | | | | | | | | | |
| Net investment income | | | 0.27 | | | | 0.32 | | | | 0.35 | | | | 0.38 | | | | 0.40 | |
| Net realized and unrealized gain (loss) on investments | | | 0.10 | | | | (0.01 | ) | | | 0.37 | | | | 0.29 | | | | 0.09 | |
| Total from investment operations | | | 0.37 | | | | 0.31 | | | | 0.72 | | | | 0.67 | | | | 0.49 | |
| | | | | | | | | | | | | | | | | | | | | |
| Less distributions: | | | | | | | | | | | | | | | | | | | | |
| From net investment income | | | (0.27 | ) | | | (0.32 | ) | | | (0.35 | ) | | | (0.38 | ) | | | (0.40 | ) |
| Total distributions | | | (0.27 | ) | | | (0.32 | ) | | | (0.35 | ) | | | (0.38 | ) | | | (0.40 | ) |
| | | | | | | | | | | | | | | | | | | | | |
| Net asset value, end of period | | $ | 10.80 | | | $ | 10.70 | | | $ | 10.71 | | | $ | 10.34 | | | $ | 10.05 | |
| | | | | | | | | | | | | | | | | | | | | |
Total Return (a) | | | 3.48 | % | | | 2.97 | % | | | 7.11 | % | | | 6.80 | % | | | 4.94 | % |
| | | | | | | | | | | | | | | | | | | | | |
| Net assets, end of period (000’s omitted) | | $ | 35,896 | | | $ | 31,892 | | | $ | 34,911 | | | $ | 32,125 | | | $ | 32,321 | |
| | | | | | | | | | | | | | | | | | | | | |
| Ratio of operating expenses to average net assets: | | | 1.09 | % | | | 1.07 | % | | | 1.04 | % | | | 1.04 | % | | | 1.01 | % |
| | | | | | | | | | | | | | | | | | | | | |
| Ratio of net investment income to average net assets: | | | 2.46 | % | | | 2.93 | % | | | 3.37 | % | | | 3.74 | % | | | 3.93 | % |
| | | | | | | | | | | | | | | | | | | | | |
| Portfolio turnover rate | | | 23 | % | | | 14 | % | | | 18 | % | | | 39 | % | | | 55 | % |
| (a) | Total return is a measure of the change in value of an investment in the Fund over the periods covered, which assumes any dividends or capital gains distributions are reinvested in shares of the Fund. Returns do not reflect the deduction of taxes a shareholder would pay on Fund distributions or the redemption of Fund shares. |
The accompanying notes are an integral part of the financial statements.
MONTEAGLE INFORMED INVESTOR GROWTH FUND FINANCIAL HIGHLIGHTS |
| For a Share Outstanding Throughout the Period | |
| | | | | | | | | | | | | | Period Ended August 31, 2008(a) | |
| Net asset value, beginning of period | | $ | 10.62 | | | $ | 10.48 | | | $ | 12.89 | | | $ | 8.82 | | | $ | 10.00 | |
| Income (loss) from investment operations: | | | | | | | | | | | | | | | | | | | | |
Net investment loss (f) | | | (0.06 | ) | | | (0.06 | ) | | | (0.10 | ) | | | (0.05 | ) | | | (0.02 | ) |
| Net realized and unrealized gain (loss) on investments | | 1.55 | | | | 1.90 | | | | (0.18 | ) | | | 4.12 | | | | (1.16 | ) |
| Total from investment operations | | | 1.49 | | | | 1.84 | | | | (0.28 | ) | | | 4.07 | | | | (1.18 | ) |
| | | | | | | | | | | | | | | | | | | | | |
| Distributions to shareholders from: | | | | | | | | | | | | | | | | | | | | |
| Net realized capital gain | | | (0.40 | ) | | | (1.70 | ) | | | (2.13 | ) | | | — | | | | — | |
| | | | | | | | | | | | | | | | | | | | | |
| Net asset value, end of period | | $ | 11.71 | | | $ | 10.62 | | | $ | 10.48 | | | $ | 12.89 | | | $ | 8.82 | |
| | | | | | | | | | | | | | | | | | | | | |
Total Return (b) | | | 14.81 | % | | | 15.35 | % | | | (4.43 | %) | | | 46.15 | % | | | (11.80 | %)(c) |
| | | | | | | | | | | | | | | | | | | | | |
| Net assets, end of period (000's omitted) | | $ | 13,741 | | | $ | 17,784 | | | $ | 17,717 | | | $ | 27,680 | | | $ | 9,177 | |
| | | | | | | | | | | | | | | | | | | | | |
Ratio of operating expenses to average net assets: (e) | | | 1.34 | % | | | 1.33 | % | | | 1.28 | % | | | 1.27 | % | | | 1.27 | %(d) |
| | | | | | | | | | | | | | | | | | | | | |
Ratio of net investment loss to average net assets: (f) | | | (0.94 | %) | | | (0.53 | %) | | | (0.96 | %) | | | (0.77 | %) | | | (0.60 | %)(d) |
| | | | | | | | | | | | | | | | | | | | | |
| Portfolio turnover rate | | | 795 | % | | | 755 | % | | | 819 | % | | | 1592 | % | | | 157 | %(c) |
| (a) | Represents the period from the initial public offering (April 3, 2008) through August 31, 2008. |
| (b) | Total return is a measure of the change in value of an investment in the Fund over the periods covered, which assumes any dividends or capital gains distributions are reinvested in shares of the Fund. Returns do not reflect the deduction of taxes a shareholder would pay on Fund distributions or the redemption of Fund shares. |
| (e) | The ratios of expenses to average net assets do not reflect the Fund’s proportionate share of income and expenses of underlying investment companies in which the Fund invests. |
| (f) | Recognition of net investment income (loss) by the Fund is affected by the declaration of dividends by the underlying investment companies in which the Fund invests. |
The accompanying notes are an integral part of the financial statements.
MONTEAGLE QUALITY GROWTH FUND FINANCIAL HIGHLIGHTS |
| For a Share Outstanding Throughout the Period | |
| | | | | | | | | | | | | | | |
| Net asset value, beginning of period | | $ | 8.71 | | | $ | 7.14 | | | $ | 6.85 | | | $ | 8.46 | | | $ | 8.84 | |
| Income (loss) from investment operations: | | | | | | | | | | | | | | | | | | | | |
| Net investment income (loss) | | | 0.02 | | | | — | (a) | | | — | (a) | | | 0.02 | | | | — | (a) |
| Net realized and unrealized gain (loss) on investments | | | 1.22 | | | | 1.57 | | | | 0.30 | | | | (1.62 | ) | | | (0.38 | ) |
| Total from investment operations | | | 1.24 | | | | 1.57 | | | | 0.30 | | | | (1.60 | ) | | | (0.38 | ) |
| | | | | | | | | | | | | | | | | | | | | |
| Less distributions: | | | | | | | | | | | | | | | | | | | | |
| From net investment income | | | — | (b) | | | — | (b) | | | (0.01 | ) | | | (0.01 | ) | | | — | |
| | | | | | | | | | | | | | | | | | | | | |
| Net asset value, end of period | | $ | 9.95 | | | $ | 8.71 | | | $ | 7.14 | | | $ | 6.85 | | | $ | 8.46 | |
| | | | | | | | | | | | | | | | | | | | | |
Total Return (c) | | | 14.26 | % | | | 22.02 | % | | | 4.41 | % | | | (18.92 | %) | | | (4.30 | %) |
| | | | | | | | | | | | | | | | | | | | | |
| Net assets, end of period (000's omitted) | | $ | 28,225 | | | $ | 22,765 | | | $ | 22,449 | | | $ | 11,196 | | | $ | 14,203 | |
| | | | | | | | | | | | | | | | | | | | | |
| Ratio of operating expenses to average net assets: | | | 1.33 | % | | | 1.32 | % | | | 1.29 | % | | | 1.32 | % | | | 1.25 | % |
| | | | | | | | | | | | | | | | | | | | | |
| Ratio of net investment income (loss) to average net assets: | | | 0.26 | % | | | 0.02 | % | | | 0.05 | % | | | 0.31 | % | | | (0.05 | %) |
| | | | | | | | | | | | | | | | | | | | | |
| Portfolio turnover rate | | | 54 | % | | | 62 | % | | | 69 | % | | | 39 | % | | | 26 | % |
| (a) | Net investment income (loss) per share resulted in less than $0.01 per share. |
| (b) | Distributions per share were $(0.0016) for the year ended August 31, 2012 and $(0.0025) for the year ended August 31, 2011. |
| (c) | Total return is a measure of the change in value of an investment in the Fund over the periods covered, which assumes any dividends or capital gains distributions are reinvested in shares of the Fund. Returns do not reflect the deduction of taxes a shareholder would pay on Fund distributions or the redemption of Fund shares. |
The accompanying notes are an integral part of the financial statements.
MONTEAGLE SELECT VALUE FUND FINANCIAL HIGHLIGHTS |
| For a Share Outstanding Throughout the Period | |
| | | | | | | | | | | | | | | |
| Net asset value, beginning of period | | $ | 10.16 | | | $ | 8.78 | | | $ | 8.30 | | | $ | 11.63 | | | $ | 15.67 | |
| Income (loss) from investment operations: | | | | | | | | | | | | | | | | | | | | |
| Net investment income | | | 0.13 | | | | 0.04 | | | | 0.01 | | | | 0.07 | | | | 0.13 | |
| Net realized and unrealized gain (loss) on investments | | | 0.78 | | | | 1.37 | | | | 0.48 | | | | (3.30 | ) | | | (2.11 | ) |
| Total from investment operations | | | 0.91 | | | | 1.41 | | | | 0.49 | | | | (3.23 | ) | | | (1.98 | ) |
| | | | | | | | | | | | | | | | | | | | | |
| Less distributions: | | | | | | | | | | | | | | | | | | | | |
| From net investment income | | | (0.12 | ) | | | (0.03 | ) | | | (0.01 | ) | | | (0.10 | ) | | | (0.12 | ) |
| From net realized gains on investments | | | — | | | | — | | | | — | | | | — | | | | (1.94 | ) |
| Total distributions | | | (0.12 | ) | | | (0.03 | ) | | | (0.01 | ) | | | (0.10 | ) | | | (2.06 | ) |
| | | | | | | | | | | | | | | | | | | | | |
| Net asset value, end of period | | $ | 10.95 | | | $ | 10.16 | | | $ | 8.78 | | | $ | 8.30 | | | $ | 11.63 | |
| | | | | | | | | | | | | | | | | | | | | |
Total Return (a) | | | 9.01 | % | | | 15.99 | % | | | 5.99 | % | | | (27.76 | %) | | | (14.01 | %) |
| | | | | | | | | | | | | | | | | | | | | |
| Net assets, end of period (000's omitted) | | $ | 10,177 | | | $ | 9,793 | | | $ | 8,265 | | | $ | 8,312 | | | $ | 11,502 | |
| | | | | | | | | | | | | | | | | | | | | |
| Ratio of operating expenses to average net assets: | | | 1.43 | % | | | 1.40 | % | | | 1.37 | % | | | 1.33 | % | | | 1.26 | % |
| | | | | | | | | | | | | | | | | | | | | |
| Ratio of net investment income to average net assets: | | | 1.23 | % | | | 0.35 | % | | | 0.18 | % | | | 0.96 | % | | | 1.00 | % |
| | | | | | | | | | | | | | | | | | | | | |
| Portfolio turnover rate | | | 8 | % | | | 87 | % | | | 2 | % | | | 108 | % | | | 71 | % |
| (a) | Total return is a measure of the change in value of an investment in the Fund over the periods covered, which assumes any dividends or capital gains distributions are reinvested in shares of the Fund. Returns do not reflect the deduction of taxes a shareholder would pay on Fund distributions or the redemption of Fund shares. |
The accompanying notes are an integral part of the financial statements.
MONTEAGLE VALUE FUND FINANCIAL HIGHLIGHTS |
| For a Share Outstanding Throughout the Year | |
| | | | | | | | | | | | | | | |
| Net asset value, beginning of period | | $ | 15.55 | | | $ | 13.41 | | | $ | 12.34 | | | $ | 16.67 | | | $ | 19.44 | |
| Income (loss) from investment operations: | | | | | | | | | | | | | | | | | | | | |
| Net investment income | | | 0.18 | | | | 0.14 | | | | 0.11 | | | | 0.13 | | | | 0.07 | |
| Net realized and unrealized gain (loss) on investments | | | 0.78 | | | | 2.13 | | | | 1.09 | | | | (4.35 | ) | | | (0.97 | ) |
| Total from investment operations | | | 0.96 | | | | 2.27 | | | | 1.20 | | | | (4.22 | ) | | | (0.90 | ) |
| | | | | | | | | | | | | | | | | | | | | |
| Less distributions: | | | | | | | | | | | | | | | | | | | | |
| From net investment income | | | (0.18 | ) | | | (0.13 | ) | | | (0.13 | ) | | | (0.11 | ) | | | (0.11 | ) |
| From net realized gains on investments | | | (3.02 | ) | | | — | | | | — | | | | — | | | | (1.76 | ) |
| Total distributions | | | (3.20 | ) | | | (0.13 | ) | | | (0.13 | ) | | | (0.11 | ) | | | (1.87 | ) |
| | | | | | | | | | | | | | | | | | | | | |
| Net asset value, end of period | | $ | 13.31 | | | $ | 15.55 | | | $ | 13.41 | | | $ | 12.34 | | | $ | 16.67 | |
| | | | | | | | | | | | | | | | | | | | | |
Total Return (a) | | | 8.64 | % | | | 16.95 | % | | | 9.72 | % | | | (25.19 | %) | | | (5.14 | %) |
| | | | | | | | | | | | | | | | | | | | | |
| Net assets, end of period (000's omitted) | | $ | 14,346 | | | $ | 14,216 | | | $ | 14,263 | | | $ | 13,645 | | | $ | 19,417 | |
| | | | | | | | | | | | | | | | | | | | | |
| Ratio of operating expenses to average net assets: | | | 1.43 | % | | | 1.40 | % | | | 1.32 | % | | | 1.31 | % | | | 1.25 | % |
| | | | | | | | | | | | | | | | | | | | | |
| Ratio of net investment income to average net assets: | | | 1.31 | % | | | 0.84 | % | | | 0.83 | % | | | 1.17 | % | | | 0.40 | % |
| | | | | | | | | | | | | | | | | | | | | |
| Portfolio turnover rate | | | 27 | % | | | 18 | % | | | 30 | % | | | 6 | % | | | 0 | % |
| (a) | Total return is a measure of the change in value of an investment in the Fund over the periods covered, which assumes any dividends or capital gains distributions are reinvested in shares of the Fund. Returns do not reflect the deduction of taxes a shareholder would pay on Fund distributions or the redemption of Fund shares. |
The accompanying notes are an integral part of the financial statements.
MONTEAGLE FUNDS NOTES TO FINANCIAL STATEMENTS — August 31, 2012 |
Monteagle Funds (“the Trust”) was organized as a business trust under the laws of the State of Delaware on November 26, 1997 as Memorial Funds. The Trust changed its name to Monteagle Funds in July, 2006.
The Trust is registered with the Securities and Exchange Commission (“SEC”) as an open-end, management investment company under the Investment Company Act of 1940. The Trust is authorized by its Declaration of Trust to issue an unlimited number of shares of beneficial interest in each series. The Trust currently consists of the following series (each a “Fund” and collectively the “Funds”):
| | Monteagle Fixed Income Fund |
| | Monteagle Informed Investor Growth Fund |
| | Monteagle Quality Growth Fund |
| | Monteagle Select Value Fund |
The Monteagle Fixed Income Fund (“Fixed Income Fund”), Monteagle Quality Growth Fund (“Quality Growth Fund”), Monteagle Select Value Fund (“Select Value Fund”) and Monteagle Value Fund (“Value Fund”) are diversified series of Monteagle Funds. The Monteagle Informed Investor Growth Fund (“Informed Investor Growth Fund”) is a non-diversified series of Monteagle Funds. The principal investment objective of the Fixed Income Fund is total return. The principal investment objective of each of Informed Investor Growth Fund, Quality Growth Fund, Select Value Fund and Value Fund (collectively the “Equity Funds”) is long-term capital appreciation.
Prior to July 20, 2012, the Funds were authorized to offer three classes of shares, Class I, Class A and Class C. Each class differed as to sales and redemption charges and ongoing fees. Effective July 20, 2012, all Class A and Class C shares were converted to Class I shares of each respective Fund (see note 13). Only the Class I shares are currently being offered for sale.
| 2. | SIGNIFICANT ACCOUNTING POLICIES |
The following is a summary of the Funds’ significant accounting policies:
Securities Valuation — Equity securities, including common stocks and exchange-traded funds, held by the Funds for which market quotations are readily available are valued using the last reported sales price or the official closing price provided by independent pricing services as of the close of trading on the New York Stock Exchange (normally 4:00 p.m. Eastern time) on each Fund’s business day. If no sales are reported, the average of the last bid and ask price is used. If no average price is available, the last bid price is used. To the extent these securities are actively traded and valuation adjustments are not applied, they are categorized in level 1 of the fair value hierarchy described below. When an equity security is valued by the independent pricing service using factors other than market quotations or the market is considered inactive, they will be categorized in level 2.
Fixed income securities such as corporate bonds, municipal bonds, and U.S. government and agency obligations, when valued using market quotations in an active market, are categorized as level 1 securities. However, fair value may be determined using an independent pricing service that considers market observable data such as reported sales of similar securities, broker quotes, yields, bids, offers,
MONTEAGLE FUNDS NOTES TO FINANCIAL STATEMENTS (Continued) |
and other reference data. These securities would be categorized as level 2 securities. The fair value of mortgage-backed securities is estimated by an independent pricing service which uses models that consider interest rate movements, new issue information and other security pertinent data. Evaluations of tranches (non-volatile, volatile, or credit sensitive) are based on interpretations of accepted Wall Street modeling and pricing conventions. Mortgage-backed securities are categorized in level 2 of the fair value hierarchy described below to the extent the inputs are observable and timely. In the absence of readily available market quotations, or other observable inputs, securities are valued at fair value pursuant to procedures adopted by the Board of Trustees and would be categorized as level 3.
Money market funds are valued at their net asset value of $1.00 per share and are categorized as level 1. Securities with maturities of 60 days or less may be valued at amortized cost, which approximates fair value and would be categorized as level 2.
Various inputs are used in determining the value of each of the Fund’s investments. These inputs are summarized in the three broad levels listed below:
| | • | Level 1 – quoted prices in active markets for identical securities |
| | • | Level 2 – other significant observable inputs |
| | • | Level 3 – significant unobservable inputs |
The inputs or methodology used for valuing securities are not necessarily an indication of the risk associated with investing in those securities.
The following is a summary of the inputs used to value the Funds’ investments at fair value as of August 31, 2012:
| Fixed Income Fund | | | | | | | | | |
Security Classification (a) | | | | | Level 2 (Other Significant Observable Inputs) | | | | |
| U.S. Government and Agency Obligations | | $ | — | | | $ | 10,536,181 | | | $ | 10,536,181 | |
| Corporate Bonds | | | 8,967,972 | | | | 8,019,988 | | | | 16,987,960 | |
| Mortgage-Backed Securities | | | — | | | | 5,614,421 | | | | 5,614,421 | |
| Money Market Funds | | | 3,849,164 | | | | — | | | | 3,849,164 | |
| Totals | | $ | 12,817,136 | | | $ | 24,170,590 | | | $ | 36,987,726 | |
| Informed Investor Growth Fund | | | | | | | | | |
Security Classification (a) | | | | | Level 2 (Other Significant Observable Inputs) | | | | |
Common Stocks (b) | | $ | 8,379,081 | | | $ | — | | | $ | 8,379,081 | |
| Exchange-Traded Funds | | | 3,791,897 | | | | — | | | | 3,791,897 | |
| Money Market Funds | | | 3,476,565 | | | | — | | | | 3,476,565 | |
| Totals | | $ | 15,647,543 | | | $ | — | | | $ | 15,647,543 | |
MONTEAGLE FUNDS NOTES TO FINANCIAL STATEMENTS (Continued) |
| Quality Growth Fund | | | | | | | | | |
Security Classification (a) | | | | | Level 2 (Other Significant Observable Inputs) | | | | |
Common Stocks (b) | | $ | 28,055,155 | | | $ | — | | | $ | 28,055,155 | |
| Money Market Funds | | | 134,955 | | | | — | | | | 134,955 | |
| Totals | | $ | 28,190,110 | | | $ | — | | | $ | 28,190,110 | |
| Select Value Fund | | | | | | | | | |
Security Classification (a) | | | | | Level 2 (Other Significant Observable Inputs) | | | | |
Common Stocks (b) | | $ | 9,509,691 | | | $ | — | | | $ | 9,509,691 | |
| Money Market Funds | | | 1,302,583 | | | | — | | | | 1,302,583 | |
| Totals | | $ | 10,812,274 | | | $ | — | | | $ | 10,812,274 | |
| Value Fund | | | | | | | | | |
Security Classification (a) | | | | | Level 2 (Other Significant Observable Inputs) | | | | |
Common Stocks (b) | | $ | 13,683,552 | | | $ | — | | | $ | 13,683,552 | |
| Preferred Stocks | | | 394 | | | | — | | | | 394 | |
| Money Market Funds | | | 1,700,652 | | | | — | | | | 1,700,652 | |
| Totals | | $ | 15,384,598 | | | $ | — | | | $ | 15,384,598 | |
| (a) | As of and during the year ended August 31, 2012, the Funds held no securities that were considered to be “Level 3” securities (those valued using significant unobservable inputs). Therefore, a reconciliation of assets in which significant unobservable inputs (Level 3) were used in determining fair value is not applicable. It is the Funds’ policy to recognize transfers into and out of Level 1 and Level 2 at the end of the reporting period. |
| (b) | All common stocks held in the Funds are Level 1 securities. For a detailed break-out of common stocks by major industry classification, please refer to the Schedules of Investments. |
The following amounts were transferred in/(out) of Level 2 assets for the Fixed Income Fund:
| | | | | | |
| Transfers into Level 2 from Level 1 | | $ | 3,641,531 | | | $ | 3,641,531 | |
| Transfers into Level 1 from Level 2 | | | (598,012 | ) | | | (598,012 | ) |
| Net Transfers in/(out) of Level 2 | | $ | 3,043,519 | | | $ | 3,043,519 | |
MONTEAGLE FUNDS NOTES TO FINANCIAL STATEMENTS (Continued) |
There were no transfers between Level 1 and Level 2 for the Informed Investor Growth Fund, Quality Growth Fund, Select Value Fund or Value Fund.
Security Loans — The Funds have entered into securities lending agreements with Morgan Stanley & Co., Inc. and MS Securities Services, Inc. The Funds receive compensation in the form of fees, or retain a portion of interest on the investment of any cash received as collateral. The Funds also continue to receive interest or dividends on the securities loaned. The loans are secured by collateral at least equal, at all times, to 102% of the fair value of loaned securities. Gain or loss in the fair value of the securities loaned that may occur during the term of the loan will be for the account of the Funds. The Funds have the right under the lending agreement to recover the securities from the borrower on demand. If the fair value of the collateral falls below 102% plus accrued interest of the loaned securities, the lender’s agent shall request additional collateral from the borrowers to bring the collateralization back to 102%.
Security Transactions — Security transactions are accounted for on trade date and realized gains and losses on investments sold are determined on a specific identification basis.
Interest and Dividend Income — Interest income is accrued as earned. Dividends on securities held by the Funds are recorded on the ex-dividend date. Discounts and premiums on securities purchased are amortized over the lives of the respective securities. Withholding taxes on foreign dividends have been provided for in accordance with the Funds’ understanding of the applicable country’s tax rules and rates. The ability of issuers of debt securities held by the Funds to meet their obligations may be affected by economic and political developments in a specific country or region.
Dividends and Distributions to Shareholders — Distributions of net investment income to shareholders are declared daily and paid monthly by the Fixed Income Fund. Net investment income distributions, if any, for Informed Investor Growth Fund, Quality Growth Fund, Select Value Fund, and Value Fund are declared and paid quarterly at the discretion of each Fund’s adviser. Net capital gains for the Funds, if any, are distributed to shareholders at least annually. Distributions to shareholders, which are determined in accordance with income tax regulations, are recorded on the ex-dividend date.
The tax character of distributions paid during the year ended August 31, 2012 and the year ended August 31, 2011 were as follows:
| | | | | | |
| | | | | | | | | | | | | |
| Fixed Income Fund | | $ | 844,767 | | | $ | 959,702 | | | $ | — | | | $ | — | |
| Informed Investor Growth Fund | | | 493,740 | | | | 2,921,352 | | | | — | | | | — | |
| Quality Growth Fund | | | 4,552 | | | | 7,211 | | | | — | | | | — | |
| Select Value Fund | | | 111,880 | | | | 24,439 | | | | — | | | | — | |
| Value Fund | | | 174,931 | | | | 130,708 | | | | 2,750,126 | | | | — | |
MONTEAGLE FUNDS NOTES TO FINANCIAL STATEMENTS (Continued) |
Common Expenses — Common expenses of the Trust are allocated among the Funds within the Trust based on relative net assets of each Fund or the nature of the services performed and the relative applicability to each Fund. Other allocations may also be approved from time to time by the Trustees.
Multiple Class Allocations — Prior to conversion of Class A and Class C shares to Class I shares on July 20, 2012 (Note 13), income, expenses and realized/unrealized gains or losses were allocated to each class based on relative share balances. Distribution fees were charged to each respective share class in accordance with the distribution plan.
Sales Charges (Loads) — Prior to conversion of Class A and Class C shares to Class I shares on July 20, 2012 (Note 13), a maximum sales charge of 3.00% was imposed on Class A shares of the Fixed Income Fund. A maximum sales charge of 5.00% was imposed on Class A shares of the Informed Investor Growth Fund, Quality Growth Fund, Select Value Fund and Value Fund. A contingent deferred sales charge of 1.00% was imposed on Class C shares in the event of certain redemption transactions within one year following such investments. The respective shareholders paid such redemption fees, which were not an expense of the Funds.
| 3. | ADVISORY, SERVICING FEES AND OTHER TRANSACTIONS WITH AFFILIATES |
Investment Advisory Agreement
Nashville Capital Corporation (“Nashville Capital” or the “Adviser”) serves as the investment adviser to the Funds. Subject to the general oversight of the Board of Trustees, the Adviser is responsible for, among other things, developing a continuing investment program for the Funds in accordance with their investment objectives, reviewing the investment strategies and policies of the Funds and advising the Board of Trustees on the selection of sub-advisers. Each Fund is authorized to pay the Adviser a fee based on average daily net assets at the following annual rates:
| | Informed Investor Growth Fund | | | |
| Up to and including $25 millon | 0.965% | 1.200% | 1.200% | 1.200% | 1.200% |
| From $25 up to and including $50 million | 0.965% | 1.115% | 1.115% | 1.115% | 1.115% |
| From $50 up to and including $100 million | 0.845% | 0.975% | 0.975% | 0.975% | 0.975% |
| Over $100 million | 0.775% | 0.875% | 0.875% | 0.875% | 0.875% |
MONTEAGLE FUNDS NOTES TO FINANCIAL STATEMENTS (Continued) |
For the year ended August 31, 2012, the amounts earned by and payable to the Adviser were as follows:
| | | | | Advisory Fees Payable as of August 31, 2012 | |
| Fixed Income Fund | | $ | 326,509 | | | $ | 29,004 | |
| Informed Investor Growth Fund | | | 172,332 | | | | 13,721 | |
| Quality Growth Fund | | | 315,578 | | | | 28,216 | |
| Select Value Fund | | | 118,948 | | | | 10,278 | |
| Value Fund | | | 168,082 | | | | 14,619 | |
An officer of Nashville Capital is also an officer of the Trust.
Fixed Income Fund — Nashville Capital has retained Howe & Rusling Inc. (“H&R”) to serve as the sub-adviser to Fixed Income Fund. Nashville Capital has agreed to pay H&R an annual advisory fee of 0.30% of average daily net assets up to $25 million, 0.25% of such assets from $25 million up to $50 million, and 0.20% of such assets over $50 million.
Informed Investor Growth Fund — Nashville Capital has retained T.H. Fitzgerald & Co. (“T.H. Fitzgerald”) to serve as the sub-adviser to Informed Investor Growth Fund. Nashville Capital has agreed to pay T.H. Fitzgerald an annual advisory fee of 0.50% of average daily net assets up to $25 million, 0.60% of such assets from $25 million up to $50 million, 0.50% of such assets from $50 million up to $100 million, and 0.40% of such assets over $100 million.
Quality Growth Fund — Nashville Capital has retained Garcia Hamilton & Associates (“GHA”) to serve as the sub-adviser to Quality Growth Fund. Nashville Capital has agreed to pay GHA an annual advisory fee of 0.30% of average daily net assets.
Select Value Fund — Nashville Capital has retained Parkway Advisors, L.P. (“Parkway”) to serve as the sub-adviser to Select Value Fund. Nashville Capital has agreed to pay Parkway an annual advisory fee of 0.50% of average daily net assets.
Value Fund — Nashville Capital has retained Robinson Investment Group, Inc. (“Robinson”) to serve as the sub-adviser to Value Fund. Nashville Capital has agreed to pay Robinson an annual advisory fee of 0.50% of average daily net assets up to $25 million, 0.45% of such assets from $25 million up to $50 million, 0.35% of such assets from $50 million up to $100 million, and 0.30% of such assets over $100 million.
MONTEAGLE FUNDS NOTES TO FINANCIAL STATEMENTS (Continued) |
Pursuant to a Mutual Fund Services Agreement between the Trust and Matrix 360 Administration, LLC (“Matrix”), Matrix provides administrative, fund accounting and pricing, and transfer agent and shareholder services to the Funds. For these services, Matrix receives the greater of an annual base fee of $30,000 per Fund or 0.075% of the Trust’s Equity Funds’ aggregate average daily net assets to $400 million with lower fees at higher asset levels and 0.04% of the Trust’s Fixed Income Fund aggregate average net assets to $400 million with lower fees at higher assets levels. The fees payable to Matrix are paid by the Adviser (not the Funds). Officers of Matrix are also officers of the Trust.
Pursuant to the terms of a Distribution Agreement with the Trust, Matrix Capital Group, Inc. (the “Distributor”) serves as the Funds’ principal underwriter. Matrix Capital Group, Inc. does not receive compensation for such services.
Distribution and Service (12b-1) Plan
The Trust has adopted a plan applicable to each Fund that allows its Class A and Class C shares to pay a distribution and service fee, as defined by the Financial Industry Regulatory Authority (“FINRA”), from its assets for selling and distributing its shares. Each Fund can pay distribution and service fees at an annual rate of up to 0.25% of its Class A Share assets, and up to 1.00% of its Class C Share assets. These fees consist of up to 0.25% for distribution services and expenses of the Class A and Class C assets, and up to 0.75% for services, as defined by FINRA, of Class C assets. The Distribution and Service (12b-1) plan is no longer active due to the conversion of Class A and Class C shares into Class I shares on July 20, 2012 (Note 13). During the year ended August 31, 2012, net distribution fees paid by (reimbursed to) the Funds were as follows:
| | Distribution (12b-1) Fees Earned (Reimbursed) | | | Distribution (12b-1) Fees Payable as of August 31, 2012 | |
| Fixed Income Fund | | $ | (27 | ) | | $ | — | |
| Informed Investor Growth Fund | | | 837 | | | | — | |
| Quality Growth Fund | | | (27 | ) | | | — | |
| Select Value Fund | | | (28 | ) | | | — | |
| Value Fund | | | (27 | ) | | | — | |
An affiliated Contractor (the “Contractor”) serves as the CCO of the Trust. The Funds pay $82,500 annually to the Contractor for providing CCO services. Each Fund pays $5,000 with the remaining $57,500 allocated to the Funds based on aggregate average daily net assets. The Funds also paid a special prepaid retainer of $37,500 to the CCO in April 2011 in order to maintain the Contractor’s services for the period from May 1, 2011 through April 30, 2012. The payment was allocated among the Funds based on their respective net assets on payment date.
MONTEAGLE FUNDS NOTES TO FINANCIAL STATEMENTS (Continued) |
| 4. | SECURITIES TRANSACTIONS |
During the year ended August 31, 2012, cost of purchases and proceeds from sales and maturities of investment securities, excluding short-term investments and U.S. government securities, were as follows:
| | | | | | |
| Fixed Income Fund | | $ | 3,813,637 | | | $ | 3,216,964 | |
| Informed Investor Growth Fund | | | 97,789,633 | | | | 103,383,467 | |
| Quality Growth Fund | | | 15,839,115 | | | | 14,017,820 | |
| Select Value Fund | | | 767,436 | | | | 1,172,555 | |
| Value Fund | | | 3,745,039 | | | | 4,958,384 | |
The cost of purchases and proceeds from sales of U.S. government securities by the Fixed Income Fund were $7,012,188 and $4,083,125, respectively. There were no purchases or sales of U.S. government securities made by the Informed Investor Growth Fund, Quality Growth Fund, Select Value Fund or Value Fund.
It is each Fund’s policy to comply with the special provisions of Subchapter M of the Internal Revenue Code applicable to regulated investment companies. As provided therein, in any fiscal year in which a Fund so qualifies and distributes at least 90% of its taxable income, such Fund (but not the shareholders) will be relieved of federal income tax on the income distributed. Accordingly, no provision for income taxes has been made.
In order to avoid imposition of the excise tax applicable to regulated investment companies, it is also each Fund’s intention to declare as dividends in each calendar year at least 98% of its net investment income and 98.2% of its net realized capital gains plus undistributed amounts from prior years.
The tax character of distributable earnings (deficit) at August 31, 2012 was as follows:
| | Unrealized Appreciation (Depreciation) | | | Undistributed Ordinary Income | | | Undistributed Capital Gains | | | Capital Loss Carryforward | | | Post-December Ordinary Loss | | | | | | Total Distributable Earnings | |
| Fixed Income Fund | | $ | 2,027,646 | | | $ | 562 | | | $ | — | | | $ | (551,688 | ) | | $ | — | | | $ | — | | | $ | 1,476,520 | |
| Informed Investor Growth Fund | | | 1,016,320 | | | | 1,021,556 | | | | — | | | | — | | | | — | | | | — | | | | 2,037,876 | |
| Quality Growth Fund | | | 6,370,998 | | | | 68,391 | | | | — | | | | (6,417,697 | ) | | | — | | | | (404,988 | ) | | | (383,296 | ) |
| Select Value Fund | | | (265,761 | ) | | | 25,908 | | | | — | | | | (1,289,111 | ) | | | — | | | | — | | | | (1,528,964 | ) |
| Value Fund | | | 2,220,696 | | | | 387,362 | | | | — | | | | — | | | | — | | | | (317,982 | ) | | | 2,290,076 | |
MONTEAGLE FUNDS NOTES TO FINANCIAL STATEMENTS (Continued) |
Under current tax law, net capital losses realized after October 31st and net ordinary losses incurred after December 31st may be deferred and treated as occurring on the first day of the following fiscal year. The Funds carryforward losses, post-October losses and post-December losses are determined only at the end of each fiscal year. As of August 31, 2012, The Funds elected to defer net capital losses as indicated in the chart below.
| | | | | | | |
| | | | | | | | | | | | |
| Fixed Income Fund | | $ | — | | | $ | — | | | $ | — | | | $ | — | |
| Informed Investor Growth Fund | | | — | | | | — | | | | — | | | | — | |
| Quality Growth Fund | | | 404,988 | | | | — | | | | — | | | | — | |
| Select Value Fund | | | — | | | | — | | | | — | | | | — | |
| Value Fund | | | 317,982 | | | | — | | | | — | | | | — | |
As of August 31, 2012, the following Funds had the following capital loss carryforwards for federal income tax purposes. These capital loss carryforwards may be utilized in future years to offset net realized capital gains, if any, prior to distributing such gains to shareholders.
| | | |
| | | | | | | |
| | | | | | | | | | | | | | | | | | | | | |
| Fixed Income Fund | | $ | 79,334 | | | $ | 168,181 | | | $ | 61,228 | | | $ | 220,424 | | | $ | 22,521 | | | $ | 551,688 | | | $ | 658,618 | |
| Informed Investor Growth Fund | | | — | | | | — | | | | — | | | | — | | | | — | | | | — | | | | — | |
| Quality Growth Fund | | | — | | | | — | | | | 1,372,538 | | | | 5,045,159 | | | | — | | | | 6,417,697 | | | | 1,074,766 | |
| Select Value Fund | | | — | | | | — | | | | — | | | | — | | | | 1,289,111 | | | | 1,289,111 | | | | 329,074 | |
| Value Fund | | | — | | | | — | | | | — | | | | — | | | | — | | | | — | | | | — | |
Under the Regulated Investment Company Modernization Act of 2010 (the Act), net capital losses recognized after December 31, 2010, may be carried forward indefinitely, and their character is retained as short-term and/or long-term. Under the law in effect prior to the Act, pre-enactment net capital losses were carried forward for eight years and treated as short term losses. As a transition
MONTEAGLE FUNDS NOTES TO FINANCIAL STATEMENTS (Continued) |
rule, the Act requires that post-enactment net capital losses be utilized before pre-enactment net capital losses. There were no post-enactment capital losses incurred by the Funds during the year ended August 31, 2012.
The following information is based upon the federal income tax cost of the investment securities as of August 31, 2012:
| | | | | Gross Unrealized Appreciation | | | Gross Unrealized Depreciation | | | Net Unrealized Appreciation (Depreciation) | |
| Fixed Income Fund | | $ | 34,960,080 | | | $ | 2,031,726 | | | $ | (4,080 | ) | | $ | 2,027,646 | |
| Informed Investor Growth Fund | | | 14,631,223 | | | | 1,055,164 | | | | (38,844 | ) | | | 1,016,320 | |
| Quality Growth Fund | | | 21,819,112 | | | | 6,639,440 | | | | (268,442 | ) | | | 6,370,998 | |
| Select Value Fund | | | 11,078,035 | | | | 1,338,045 | | | | (1,603,806 | ) | | | (265,761 | ) |
| Value Fund | | | 13,163,902 | | | | 3,072,025 | | | | (851,329 | ) | | | 2,220,696 | |
The difference between the federal income tax cost of portfolio investments and the financial statement cost for Informed Investor Growth Fund, Quality Growth Fund and Select Value Fund is due to certain timing differences in the recognition of capital losses under income tax regulations and GAAP. These “book/tax” differences are temporary in nature and are due to the tax deferral of losses on wash sales.
For the year ended August 31, 2012, Fixed Income Fund reclassified $11,079 of capital losses on paydowns of mortgage-backed and asset-backed securities from net investment income to accumulated net realized loss on the Statements of Assets and Liabilities. For the year ended August 31, 2012, Informed Investor Growth Fund reclassified $137,216 of net investment loss to accumulated net capital gains on the Statement of Assets and Liabilities. Such reclassifications, the result of permanent differences between the financial statement and income tax reporting requirements, have no effect on the Funds’ net assets or net asset values per share.
The Funds recognize the tax benefits of uncertain tax positions only when the position is “more likely than not” to be sustained assuming examination by tax authorities. Management has reviewed the tax positions in the open tax years of 2009, 2010, 2011 and 2012 and concluded that no liability for unrecognized tax benefits should be recorded related to uncertain tax positions taken in the above open tax years. The Funds identify their major tax jurisdictions as U.S. Federal and Delaware. The Funds recognize interest and penalties, if any, related to unrecognized tax benefits as income tax expense in the Statements of Operations. During the year ended August 31, 2012, the Funds did not incur any interest or penalties. The Funds are not subject to examination by U.S. Federal tax authorities for tax years before 2009.
The beneficial ownership, either directly or indirectly, of more than 25% of the voting securities of a fund creates a presumption of control of the fund under Section 2(a)(9) of the Investment Company Act of 1940. As of August 31, 2012, the shareholders listed in the table immediately below held, for the benefit of their customers, the following percentages of the outstanding shares
MONTEAGLE FUNDS NOTES TO FINANCIAL STATEMENTS (Continued) |
| | Percent Owned as of August 31, 2012 |
| Fixed Income Fund | Farmers and Merchant Corp. | 84% |
| Informed Investor Growth Fund | Farmers and Merchant Corp. | 88% |
| Quality Growth Fund | Farmers and Merchant Corp. | 63% |
| | Charles Schwab & Co. | 31% |
| Select Value Fund | Stifel Nicolaus & Co. | 90% |
| Value Fund | Farmers and Merchant Corp. | 99% |
| 7. | CAPITAL SHARE TRANSACTIONS |
| | | | |
| | | | | | | | | | | | | |
| For the Fiscal Year ended: | | | | | | | | | | | | |
| August 31, 2012 | | | | | | | | | | | | |
| Class I | | | | | | | | | | | | |
Shares | | | 465,582 | | | | (184,307 | ) | | | 61,246 | | | | 3,322,640 | |
Value | | | 4,990,184 | | | $ | (1,968,113 | ) | | $ | 656,322 | | | | | |
| Class A | | | | | | | | | | | | | | | | |
Shares | | | — | | | | (105 | ) | | | 3 | | | | — | |
Value | | | — | | | $ | (1,129 | ) | | $ | 31 | | | | | |
| Class C | | | | | | | | | | | | | | | | |
Shares | | | — | | | | (104 | ) | | | 4 | | | | — | |
Value | | | — | | | $ | (1,129 | ) | | $ | 44 | | | | | |
| | | | | | | | | | | | | | | | | |
| For the Fiscal Year ended: | | | | | | | | | | | | | | | | |
| August 31, 2011 | | | | | | | | | | | | | | | | |
| Class I | | | | | | | | | | | | | | | | |
Shares | | | 165,591 | | | | (511,699 | ) | | | 66,897 | | | | 2,980,119 | |
Value | | | 1,741,198 | | | $ | (5,377,303 | ) | | $ | 705,466 | | | | | |
| Class A | | | | | | | | | | | | | | | | |
Shares | | | — | | | | — | | | | 3 | | | | 102 | |
Value | | | — | | | $ | — | | | $ | 28 | | | | | |
| Class C | | | | | | | | | | | | | | | | |
Shares | | | — | | | | — | | | | 2 | | | | 100 | |
Value | | | — | | | $ | — | | | $ | 21 | | | | | |
MONTEAGLE FUNDS NOTES TO FINANCIAL STATEMENTS (Continued) |
| | | Informed Investor Growth Fund | |
| | | | | | | | | | | | | |
| For the Fiscal Year ended: | | | | | | | | | | | | |
| August 31, 2012 | | | | | | | | | | | | |
| Class I | | | | | | | | | | | | |
Shares | | | 115,026 | | | | (623,805 | ) | | | 7,110 | | | | 1,173,364 | |
Value | | $ | 1,210,567 | | | $ | (6,704,025 | ) | | $ | 69,748 | | | | | |
| Class A | | | | | | | | | | | | | | | | |
Shares | | | — | | | | (102 | ) | | | 4 | | | | — | |
Value | | $ | — | | | $ | (1,119 | ) | | $ | 39 | | | | | |
| Class C | | | | | | | | | | | | | | | | |
Shares | | | — | | | | (24,783 | ) | | | 297 | | | | — | |
Value | | $ | — | | | $ | (268,746 | ) | | $ | 2,847 | | | | | |
| | | | | | | | | | | | | | | | | |
| For the Fiscal Year ended: | | | | | | | | | | | | | | | | |
| August 31, 2011 | | | | | | | | | | | | | | | | |
| Class I | | | | | | | | | | | | | | | | |
Shares | | | 120,631 | | | | (219,204 | ) | | | 82,513 | | | | 1,675,033 | |
Value | | $ | 1,413,205 | | | $ | (2,596,118 | ) | | $ | 1,016,564 | | | | | |
| Class A | | | | | | | | | | | | | | | | |
Shares | | | — | | | | — | | | | 12 | | | | 98 | |
Value | | $ | — | | | $ | — | | | $ | 146 | | | | | |
| Class C | | | | | | | | | | | | | | | | |
Shares | | | — | | | | — | | | | 3,009 | | | | 24,486 | |
Value | | $ | — | | | $ | — | | | $ | 36,592 | | | | | |
MONTEAGLE FUNDS NOTES TO FINANCIAL STATEMENTS (Continued) |
| | | | |
| | | | | | | | | | | | | |
| For the Fiscal Year ended: | | | | | | | | | | | | |
| August 31, 2012 | | | | | | | | | | | | |
| Class I | | | | | | | | | | | | |
Shares | | | 419,181 | | | | (197,924 | ) | | | 166 | | | | 2,835,527 | |
Value | | $ | 3,585,430 | | | $ | (1,807,206 | ) | | $ | 1,416 | | | | | |
| Class A | | | | | | | | | | | | | | | | |
Shares | | | 196 | | | | (334 | ) | | | — | | | | — | |
Value | | $ | 1,750 | | | $ | (3,071 | ) | | $ | — | | | | | |
| Class C | | | | | | | | | | | | | | | | |
Shares | | | — | | | | (138 | ) | | | — | | | | — | |
Value | | $ | — | | | $ | (1,314 | ) | | $ | — | | | | | |
| | | | | | | | | | | | | | | | | |
| For the Fiscal Year ended: | | | | | | | | | | | | | | | | |
| August 31, 2011 | | | | | | | | | | | | | | | | |
| Class I | | | | | | | | | | | | | | | | |
Shares | | | 421,993 | | | | (952,456 | ) | | | 195 | | | | 2,614,104 | |
Value | | $ | 3,755,414 | | | $ | (8,079,578 | ) | | $ | 1,713 | | | | | |
| Class A | | | | | | | | | | | | | | | | |
Shares | | | — | | | | — | | | | — | | | | 138 | |
Value | | $ | — | | | $ | — | | | $ | — | | | | | |
| Class C | | | | | | | | | | | | | | | | |
Shares | | | — | | | | — | | | | — | | | | 138 | |
Value | | $ | — | | | $ | — | | | $ | — | | | | | |
MONTEAGLE FUNDS NOTES TO FINANCIAL STATEMENTS (Continued) |
| | | | |
| | | | | | | | | | | | | |
| For the Fiscal Year ended: | | | | | | | | | | | | |
| August 31, 2012 | | | | | | | | | | | | |
| Class I | | | | | | | | | | | | |
Shares | | | 1,263 | | | | (35,481 | ) | | | 257 | | | | 929,810 | |
Value | | $ | 12,429 | | | $ | (368,308 | ) | | $ | 2,642 | | | | | |
| Class A | | | | | | | | | | | | | | | | |
Shares | | | — | | | | (116 | ) | | | 1 | | | | — | |
Value | | $ | — | | | $ | (1,215 | ) | | $ | 9 | | | | | |
| Class C | | | | | | | | | | | | | | | | |
Shares | | | — | | | | (115 | ) | | | — | (a) | | | — | |
Value | | $ | — | | | $ | (1,214 | ) | | $ | 2 | | | | | |
| (a) | Class C shares reinvested were 0.232 shares. |
| For the Fiscal Year ended: | | | | | | | | | | | | |
| August 31, 2011 | | | | | | | | | | | | |
| Class I | | | | | | | | | | | | |
Shares | | | 57,036 | | | | (34,854 | ) | | | 57 | | | | 963,771 | |
Value | | $ | 613,754 | | | $ | (372,123 | ) | | $ | 644 | | | | | |
| Class A | | | | | | | | | | | | | | | | |
Shares | | | — | | | | — | | | | — | (b) | | | 115 | |
Value | | $ | — | | | $ | — | | | $ | 1 | | | | | |
| Class C | | | | | | | | | | | | | | | | |
Shares | | | — | | | | — | | | | — | | | | 115 | |
Value | | $ | — | | | $ | — | | | $ | — | | | | | |
| (b) | Class A shares reinvested were 0.124 shares. |
MONTEAGLE FUNDS NOTES TO FINANCIAL STATEMENTS (Continued) |
| | | | |
| | | | | | | | | | | | | |
| For the Fiscal Year ended: | | | | | | | | | | | | |
| August 31, 2012 | | | | | | | | | | | | |
| Class I | | | | | | | | | | | | |
Shares | | | 185,760 | | | | (25,003 | ) | | | 2,293 | | | | 1,077,437 | |
Value | | $ | 2,222,035 | | | $ | (331,716 | ) | | $ | 27,447 | | | | | |
| Class A | | | | | | | | | | | | | | | | |
Shares | | | — | | | | (94 | ) | | | 20 | | | | — | |
Value | | $ | — | | | $ | (1,237 | ) | | $ | 237 | | | | | |
| Class C | | | | | | | | | | | | | | | | |
Shares | | | — | | | | (93 | ) | | | 19 | | | | — | |
Value | | $ | — | | | $ | (1,235 | ) | | $ | 227 | | | | | |
| | | | | | | | | | | | | | | | | |
| For the Fiscal Year ended: | | | | | | | | | | | | | | | | |
| August 31, 2011 | | | | | | | | | | | | | | | | |
| Class I | | | | | | | | | | | | | | | | |
Shares | | | 2,740 | | | | (151,737 | ) | | | 137 | | | | 914,387 | |
Value | | $ | 44,067 | | | $ | (2,429,174 | ) | | $ | 2,124 | | | | | |
| Class A | | | | | | | | | | | | | | | | |
Shares | | | — | | | | — | | | | — | (a) | | | 74 | |
Value | | $ | — | | | $ | — | | | $ | 6 | | | | | |
| Class C | | | | | | | | | | | | | | | | |
Shares | | | — | | | | — | | | | — | (b) | | | 74 | |
Value | | $ | — | | | $ | — | | | $ | — | (c) | | | | |
| (a) | Class A shares reinvested were 0.400 shares. |
| (b) | Class C shares reinvested were 0.020 shares. |
| (c) | Class C value reinvested was $0.32. |
| 8. | CONTINGENCIES AND COMMITMENTS |
The Funds indemnify the Trust’s officers and Trustees for certain liabilities that might arise from the performance of their duties to the Funds. Additionally, in the normal course of business the Funds enter into contracts that contain a variety of representations and warranties and which provide general indemnifications. Each Fund’s maximum exposure under these arrangements is unknown, as this would involve future claims that may be made against the Funds that have not yet occurred. However, based on experience, the Funds expect the risk of loss to be remote.
MONTEAGLE FUNDS NOTES TO FINANCIAL STATEMENTS (Continued) |
When the Funds emphasize one or more economic sectors, it may be more susceptible to the financial, market, or economic events affecting the particular issuers and industries in which they invest than funds that do not emphasize particular sectors. The more a fund diversifies, the more it spreads risk and potentially reduces the risks of loss and volatility.
| 10. | RECENT ACCOUNTING PRONOUNCEMENTS |
In December 2011, FASB issued ASU No. 2011-11 related to disclosures about offsetting assets and liabilities. The amendments in this ASU require an entity to disclose information about offsetting and related arrangements to enable users of its financial statements to understand the effect of those arrangements on its financial position. The ASU is effective for annual reporting periods beginning on or after January 1, 2013, and interim periods within those annual periods. The guidance requires retrospective application for all comparative periods presented. Management is currently evaluating the impact ASU 2011-11 will have on the financial statement disclosures.
On September 15, 2012, the Select Value Fund declared a dividend of $31,620, which was payable on September 15, 2012. On September 15, 2012, the Value Fund declared a dividend of $43,598, which was payable on September 15, 2012. On September 28, 2012, the Fixed Income Fund declared a dividend of $62,169, which was payable on September 28, 2012.
Management has evaluated subsequent events through the issuance of the financial statements and has noted no other such events that would require disclosure.
On December 7, 2010, an amended complaint was filed in the United States Bankruptcy Court for the District of Delaware (Adversary Proceeding No. 10-54010) by The Official Committee of Unsecured Creditors of Tribune Company (“Committee”) on behalf of Tribune Company (“Tribune”), a U.S. news and media organization. Among the thousands of defendants in the Amended Complaint is the Monteagle Funds with respect to holdings by the Monteagle Value Fund (the “Fund”). The Fund, along with numerous other mutual funds, institutional investors and others, owned shares of Tribune in 2007 when it went private in a leveraged buyout transaction (“LBO”). In the LBO, shareholders such as the Fund sold their shares back to Tribune for $34/share. The lawsuit alleges, among other things, that the payment for the shares by Tribune was a fraudulent transfer and seeks to have the cash paid to shareholders returned to the Tribune bankruptcy estate. The Amended Complaint seeks to create a class of Defendants -the former shareholders of Tribune - and seeks return of over $8 billion in proceeds from the LBO. The Committee has not served the Fund with the Amended Complaint, and the Fund was not named as a Defendant in the original complaint. Although the Fund has not yet been served, the Fund is monitoring the litigation.
MONTEAGLE FUNDS NOTES TO FINANCIAL STATEMENTS (Continued) |
On April 5, 2012, the Committee’s lawsuit was transferred by the Judicial Panel on Multidistrict Litigation to the United States District Court for the Southern District of New York for discovery and pretrial motions with numerous other related actions. (In re Tribune Company Fraudulent Conveyance Litigation, 1:12-mc-02296-WHP). It is unclear if the Fund is named as a Defendant, or is a member of any proposed class, in any of these other actions.
On July 23, 2012, the Delaware Bankruptcy Judge confirmed a plan of reorganization that, among other things, replaced the Committee as Plaintiff with a Litigation Trustee.
On September 7, 2012, Judge Pauley of the Southern District of New York entered a Master Case Order. Among other things, the Master Case Order creates liaison counsel and an Executive Committee for the defendants in the Litigation Trustee’s lawsuit, including those defendants, like the Fund, that were only shareholders of Tribune. The Executive Committee Members for mutual funds are Michael S. Doluisio, an attorney with Dechert LLP in Philadelphia, and Steven R. Schoenfeld, an attorney with Dorsey & Whitney LLP in New York. The Executive Committee is directed to take reasonable steps to streamline case management and to eliminate duplication of efforts and redundant filings. However, the Master Case Order does not certify a class of Defendants, and does not prevent any individual Defendant from retaining its own counsel or being heard by the Court. Discovery in the Litigation Trustee’s lawsuit is stayed pending resolution of certain motions to dismiss in the related litigation.
It is not expected that the cases discussed above will have a material adverse impact on the Fund’s financial position, results of operation, or cash flows; however, these litigation matters are subject to inherent uncertainties and the views of these matters with respect to any impact to the Fund may change in the future.
| 13. | CONVERSION OF CLASS A AND C SHARES TO CLASS I SHARES |
On April 26, 2012, the Board of Trustees of the Monteagle Funds (the “Board”) approved the conversion of Class A and Class C shares (each the “Converting Class”; together the “Converting Classes”) of the Funds into Class I shares of the respective Funds. Effective June 15, 2012, the Converting Classes were no longer available for purchase. Effective July 20, 2012, all Class A and Class C shares were converted into Class I shares. Each shareholder owning Converting Classes received Class I shares of their respective Funds with an aggregate net asset value equal to the aggregate net value of their Converting Classes immediately prior to the conversion, with conversion ratios as follows:
MONTEAGLE FUNDS NOTES TO FINANCIAL STATEMENTS (Continued) |
| | Ratio of Class I shares issued per Converting Class share |
| Fixed Income Fund | Class A | 1.000770 : 1 |
| Fixed Income Fund | Class C | 1.000700 : 1 |
| Informed Investor Growth Fund | Class A | 0.998220 : 1 |
| Informed Investor Growth Fund | Class C | 0.975344 : 1 |
| Quality Growth Fund | Class A | 0.999520 : 1 |
| Quality Growth Fund | Class C | 0.997230 : 1 |
| Select Value Fund | Class A | 1.005100 : 1 |
| Select Value Fund | Class C | 1.011200 : 1 |
| Value Fund | Class A | 1.007300 : 1 |
| Value Fund | Class C | 1.020000 : 1 |
MONTEAGLE FUNDS REPORT OF INDEPENDENT REGISTERED PUBLIC ACCOUNTING FIRM |
To the Shareholders and Board of Trustees
Monteagle Funds
We have audited the accompanying statements of assets and liabilities, including the schedules of investments, of Monteagle Funds, comprising of Monteagle Fixed Income Fund, Monteagle Informed Investor Growth Fund, Monteagle Quality Growth Fund, Monteagle Select Value Fund, and Monteagle Value Fund (the “Funds”) as of August 31, 2012, and the related statements of operations for the year then ended, the statements of changes in net assets for each of the two years in the period then ended, and the financial highlights for each of the five periods in the period then ended. These financial statements and financial highlights are the responsibility of Fund management. Our responsibility is to express an opinion on these financial statements and financial highlights based on our audits.
We conducted our audits in accordance with the standards of the Public Company Accounting Oversight Board (United States). Those standards require that we plan and perform the audit to obtain reasonable assurance about whether the financial statements and financial highlights are free of material misstatement. An audit includes examining, on a test basis, evidence supporting the amounts and disclosures in the financial statements. Our procedures included confirmation of securities owned as of August 31, 2012 by correspondence with the custodian and brokers. An audit also includes assessing the accounting principles used and significant estimates made by management, as well as evaluating the overall financial statement presentation. We believe that our audits provide a reasonable basis for our opinion.
In our opinion, the financial statements and financial highlights referred to above present fairly, in all material respects, the financial position of each of the Funds constituting Monteagle Funds as of August 31, 2012, the results of their operations for the year then ended, the changes in their net assets for each of the two years in the period then ended, and the financial highlights for each of the five periods in the period then ended, in conformity with accounting principles generally accepted in the United States of America.
COHEN FUND AUDIT SERVICES, LTD.
Cleveland, Ohio
October 29, 2012
MONTEAGLE FUNDS OTHER INFORMATION (Unaudited) |
Proxy Policies — The Trust has adopted Proxy Voting Policies and Procedures under which the Funds vote proxies related to securities held by the Funds. A description of the Funds’ policies and procedures is available without charge, upon request, by calling the Funds toll free at 1-888-263-5593, or on the SEC website at http://www.sec.gov.
In addition, the Funds are required to file Form N-PX, with their complete voting record for the 12 months ended June 30th, no later than August 31st of each year. The Funds’ Form N-PX is available without charge, upon request, by calling the Funds toll free at 1-888-263-5593, or on the SEC’s website at http://www.sec.gov.
N-Q Filing — The SEC has adopted the requirement that all mutual funds file a complete schedule of investments with the SEC for their first and third fiscal quarters on Form N-Q. For the Monteagle Funds, this would be for the fiscal quarters ending November 30 and May 31. The Form N-Q filing must be made within 60 days of the end of the quarter. The Funds’ Forms N-Q are available on the SEC’s website at http://www.sec.gov., or they may be reviewed and copied at the SEC’s Public Reference Room in Washington, DC (call 1-800-732-0330 for information on the operation of the Public Reference Room).
| FEDERAL TAX INFORMATION (Unaudited) |
For the year ended August 31, 2012, certain dividends paid by Fixed Income Fund, Informed Investor Growth Fund, Quality Growth Fund, Select Value Fund and Value Fund may be subject to a maximum tax rate of 15%, as provided for by the Jobs and Growth Tax Relief Reconciliation Act of 2003. The Funds intend to designate up to a maximum amount of $844,767, $493,738, $4,522, $111,880, and $2,925,057, respectively, as taxed at a maximum rate of 15%. Complete information will be computed and reported in conjunction with your 2012 Form 1099-DIV.
MONTEAGLE FUNDS ABOUT YOUR FUNDS’ EXPENSES (Unaudited) |
We believe it is important for you to understand the impact of costs on your investment. As a shareholder of the Funds, you incur two types of costs: (1) transaction costs, such as the sales load and redemption fees imposed by the Fund and (2) ongoing costs, including management fees and other Fund expenses. The following examples are intended to help you understand your ongoing costs (in dollars) of investing in the Funds and to compare these costs with the ongoing costs of investing in other mutual funds.
A mutual fund’s ongoing costs are expressed as a percentage of its average net assets. This figure is known as the expense ratio. The expenses in the tables below are based on an investment of $1,000 made at the beginning of the most recent semi-annual period (March 1, 2012) and held until the end of the period (August 31, 2012).
The tables that follow illustrate each Fund’s costs in two ways:
Actual fund return – This section helps you to estimate the actual expenses that you paid over the period. The “Ending Account Value” shown is derived from each Fund’s actual return, and the third column shows the dollar amount of operating expenses that would have been paid by an investor who started with $1,000 in the Funds. You may use the information here, together with the amount you invested, to estimate the expenses that you paid over the period.
To do so, simply divide your account value by $1,000 (for example, an $8,600 account value divided by $1,000 = 8.6), then multiply the result by the number given for the Funds under the heading “Expenses Paid During Period.”
Hypothetical 5% return – This section is intended to help you compare the Funds’ costs with those of other mutual funds. It assumes that each Fund had an annual return of 5% before expenses during the period shown, but that the expense ratio is unchanged. In this case, because the return used is not the Funds’ actual returns, the results do not apply to your investment. The example is useful in making comparisons because the Securities and Exchange Commission requires all mutual funds to calculate expenses based on a 5% return. You can assess each Fund’s costs by comparing this hypothetical example with the hypothetical examples that appear in shareholder reports of other funds.
Note that expenses shown in the table are meant to highlight and help you compare ongoing costs only.
The calculations assume no shares were bought or sold during the period. Your actual costs may have been higher or lower, depending on the amount of your investment and the timing of any purchases or redemptions.
More information about the Funds’ expenses, including historical annual expense ratios, can be found in this report. For additional information on operating expenses and other shareholder costs, please refer to each Fund’s Prospectus.
MONTEAGLE FUNDS ABOUT YOUR FUNDS’ EXPENSES (Unaudited) |
| Fixed Income Fund |
| | | Beginning Account Value 3/01/12 | Annualized Expense Ratio For the Period | Ending Account Value 8/31/12 | Expenses Paid During the Period(1) |
| Actual Example Based on actual return of: |
| Class I | 1.90% | $1,000.00 | 1.08% | $1,019.00 | $5.48 |
| Hypethetical Example Based on assumed 5% return |
| Class I | | $1,000.00 | 1.08% | $1,019.70 | $5.48 |
| Informed Investor Growth Fund |
| | | Beginning Account Value 3/01/12 | Annualized Expense Ratio For the Period | Ending Account Value 8/31/12 | Expenses Paid During the Period(1) |
| Actual Example Based on actual return of: |
| Class I | 3.08% | $1,000.00 | 1.39% | $1,030.80 | $7.10 |
| Hypethetical Example Based on assumed 5% return |
| Class I | | $1,000.00 | 1.39% | $1,018.10 | $7.05 |
| Quality Growth Fund |
| | | Beginning Account Value 3/01/12 | Annualized Expense Ratio For the Period | Ending Account Value 8/31/12 | Expenses Paid During the Period(1) |
| Actual Example Based on actual return of: |
| Class I | 2.16% | $1,000.00 | 1.32% | $1,021.60 | $6.71 |
| Hypethetical Example Based on assumed 5% return |
| Class I | | $1,000.00 | 1.32% | $1,018.50 | $6.70 |
MONTEAGLE FUNDS ABOUT YOUR FUNDS’ EXPENSES (Unaudited) (Continued) |
| Select Value Fund |
| | | Beginning Account Value 3/01/12 | Annualized Expense Ratio For the Period | Ending Account Value 8/31/12 | Expenses Paid During the Period(1) |
| Actual Example Based on actual return of: |
| Class I | -0.97% | $1,000.00 | 1.42% | $990.30 | $7.10 |
| Hypethetical Example Based on assumed 5% return |
| Class I | | $1,000.00 | 1.42% | $1,018.00 | $7.20 |
| Value Fund |
| | | Beginning Account Value 3/01/12 | Annualized Expense Ratio For the Period | Ending Account Value 8/31/12 | Expenses Paid During the Period(1) |
| Actual Example Based on actual return of: |
| Class I | -1.01% | $1,000.00 | 1.39% | $989.90 | $6.95 |
| Hypethetical Example Based on assumed 5% return |
| Class I | | $1,000.00 | 1.39% | $1,018.10 | $7.05 |
| (1) | Expenses are equal to the Funds’ annualized expense ratios for the period, multiplied by the average account value over the period, multiplied by 184/366 (to reflect the one-half year period). |
MONTEAGLE FUNDS TRUSTEES AND OFFICERS OF THE TRUST (Unaudited) |
The business and affairs of the Funds are managed under the direction of the Board of Trustees in compliance with the laws of the state of Delaware. The names of the Trustees and executive officers of the Trust, their position with the Trust, address, age and principal occupations during the past five years are set forth below. Trustees have no official term of office and generally serve until they resign, or are not reelected.
| INDEPENDENT TRUSTEES |
NAME, ADDRESS AND AGE | POSITION(S) HELD WITH TRUST | LENGTH OF TIME SERVED | PRINCIPAL OCCUPATION(S) DURING THE PAST 5 YEARS | NUMBER OF TRUST PORTFOLIOS OVERSEEN BY TRUSTEE | OTHER DIRECTORSHIPS OF PUBLIC COMPANIES |
Larry J. Anderson 4208 College Avenue Snyder, Texas 79549 Age 64 | Trustee | Since 11-29-02 | Certified Public Accountant, Anderson & West, P.C. January 1985 to present | 5 | None |
Brian J. Green 158 Cypress Abilene, Texas 79601 Age 54 | Trustee | Since 11-29-02 | Restaurateur, Cypress Street Station, February 1993 to present | 5 | None |
Charles M. Kinard 1725 Richland Drive Abilene, Texas 79603 Age 69 | Trustee | Since 11-29-02 | Retired; Senior Vice President and Trust Officer, First National Bank of Abilene until December 1998 | 5 | None |
MONTEAGLE FUNDS TRUSTEES AND OFFICERS OF THE TRUST (Unaudited) (Continued) |
| EXECUTIVE OFFICERS |
| NAME, ADDRESS AND AGE | POSITION(S) HELD WITH THE TRUST | PRINCIPAL OCCUPATION(S) DURING THE PAST 5 YEARS |
Paul B. Ordonio, JD Age 44 | President, CCO | Nashville Capital Corporation, CCO/VP of Development, 05/09 to present; Matrix Capital Group, Representative 05/09 to present; P.O. Properties, Inc., Vice President from 06/99 to present; WordWise Document Services, LLC, President from 08/97 to present; Ordonio & Assoc., President from 11/97 to present; Parkway Advisors, L.P., VP & Counsel from 08/02 to 05/09; Parkway Advisors Group, Inc., VP and Counsel from 08/02 to 05/09. Parkway Holdings, VP from 08/02 to 05/09; Ultimus Fund Distributors, Representative 02/07 to 05/09; Citco Mutual Fund Distributors, Representative from 10/03 to 02/07. |
David F. Ganley Age 65 | Vice President, Secretary, AML Compliance Officer | Matrix 360 Administration, LLC, Senior Vice President, 1/05 to present; Capital Management Investment Trust, Secretary, 5/08 to present; Congressional Effect Fund, Officer and Chief Compliance Officer 5/08 to present; Catalyst Funds, Secretary, Treasurer and Chief Compliance Officer 7/06 to present; The USX China Fund, Chief Compliance Officer 4/05 to present; The Blue and White Fund, Chief Compliance Officer 10/04 to 1/06; Shipley Raidy Capital Partners, Financial Principal, 1/01 to 1/05. |
Larry E. Beaver, Jr. Age 43 | Treasurer, CFO | Matrix 360 Administration, LLC, Director of Accounting and Administration 1/05 to present; Capital Management Investment Trust, Treasurer 5/08 to present; Congressional Effect Fund, Treasurer 5/08 to present; AMIDEX Funds, Inc. Chief Accounting Officer 5/03 to present. |
MONTEAGLE FUNDS COMPENSATION OF TRUSTEES AND OFFICERS (Unaudited) |
Each Trustee receives an annual fee of $2,500 and a fee of $1,000 per Fund, and is also paid a $1,000 for each quarterly meeting attended and $500 for each special meeting attended. Trustees and officers are also reimbursed for travel and related expenses incurred in attending meetings of the Board.
Trustees that are affiliated with the Adviser or Sub-adviser receive no compensation from the Funds for their services or reimbursement for their associated expenses. Officers of the Trust receive no compensation from the Funds for their services, except that the Funds pay 50% of the compensation of the Trust’s Chief Compliance Officer.
The following table sets forth the fees paid by the Funds to each Trustee of the Trust for the year ended August 31, 2012:
| Aggregate Compensation From Funds | Pension or Retirement Benefits Accrued as Part of Fund Expenses | Estimated Annual Benefits Upon Retirement | Total Compensation From Funds and Fund Complex Paid to Trustees |
| Larry J. Anderson | $12,000 | $0 | $0 | $12,000 |
| Brian J. Green | $12,000 | $0 | $0 | $12,000 |
| Charles M. Kinard | $12,000 | $0 | $0 | $12,000 |
[This page intentionally left blank]
[This page intentionally left blank]
[This page intentionally left blank]
| THE MONTEAGLE FUNDS Investment Adviser Nashville Capital Corporation 2506 Winford Ave. Nashville, TN 37211
Distributor Matrix Capital Group, Inc. 420 Lexington Ave. Suite 601 New York, NY 10170
Transfer Agent, Administrator & Shareholder Servicing Agent Matrix 360 Administration, LLC 630 Fitzwatertown Rd. Building A, 2nd Floor Willow Grove, PA 19090
(888) 263-5593 www.monteaglefunds.com
This report is submitted for the general information of the shareholders of the Funds. It is not authorized for distribution to prospective investors in the Funds unless preceded or accompanied by a current prospectus, which includes information regarding the Fund’s objectives and policies, experience of its management, marketability of shares, and other information. |