UNITED STATES
SECURITIES AND EXCHANGE COMMISSION
Washington, D.C. 20549
FORM N-CSR
CERTIFIED SHAREHOLDER REPORT OF REGISTERED MANAGEMENT INVESTMENT COMPANIES
Investment Company Act File Number 811-08529
(Exact name of registrant as specified in charter)
2506 Winford Avenue, Nashville, Tennessee | 37211 |
| (Address of principal executive offices) | (Zip code) |
The Corporation Trust Company
Corporate Trust Center
1209 Orange Street
Wilmington, DE 19801
(Name and address of agent for service)
| | With a copy to: | |
| | Matthew A. Swendiman, Attorney | |
| | Graydon Head & Ritchey LLP | |
| | 1900 Fifth Third Center | |
| | 511 Walnut Street | |
| | Cincinnati, OH 45202 | |
Registrant's telephone number, including area code: 888.263.5593
Date of fiscal year end: 08/31/2014
Date of reporting period: 08/31/2014
| ITEM 1. | REPORTS TO SHAREHOLDERS |
The Annual report to Shareholders for the period ended August 31, 2014 pursuant to Rule 30e-1 under the Investment Company Act of 1940 (the “1940 Act”), as amended (17 CFR 270.30e-1) is filed herewith.
| Letter from the President | 3 |
| A Discussion of Fund Performance | 4 |
| Supplementary Portfolio Information | 34 |
| Financial Statements of the Monteagle Funds | |
| Schedule of Investments: | |
| Fixed Income Fund | 40 |
| Informed Investor Growth Fund | 44 |
| Quality Growth Fund | 46 |
| Select Value Fund | 49 |
| Value Fund | 52 |
| The Texas Fund | 55 |
| Statements of Assets and Liabilities | 61 |
| Statements of Operations | 63 |
| Statements of Changes in Net Assets | 65 |
| Financial Highlights | 71 |
| Notes to Financial Statements | 78 |
| Report of Independent Registered Public Accounting Firm | 97 |
| Other Information | 98 |
| About Your Funds’ Expenses | 99 |
| Trustees and Officers of the Trust | 102 |
| Board Approval of Investment Management and Sub-Advisory Agreements | 105 |
LETTER FROM THE PRESIDENT (Unaudited)
Dear Shareholders:
Enclosed is the Annual Report for the Monteagle Funds. I encourage you to carefully review the information presented in this Annual Report as it contains valuable information about your investment.
As you will notice in reviewing the Annual Report, we continue to uncover opportunities in high quality, solid credit and attractive valuation areas.
As we reflect on this past fiscal year, we continue to see several headlines during the period, such as continued slow economic recovery, civil unrest, an uncertain domestic political environment, arguments over federal monetary policy, that all had a dramatic effect on the markets in which the Monteagle Funds invest. Despite the volatility that these headlines have created in the day-to-day stock markets, we have often said that we view investing as a marathon, not a sprint. As a result, we remain optimistic as we expect that the effect of some of these events will be short-lived although others may take longer to work their way through the system. We believe that remaining disciplined with a longer-term focus will benefit patient investors.
In closing, we would like to thank you for your continued confidence and support of the Monteagle Funds.
Sincerely,
MONTEAGLE FUNDS
Paul B. Ordonio, JD
President
MONTEAGLE FIXED INCOME FUND
A DISCUSSION OF FUND PERFORMANCE (Unaudited)
How did the Fund Perform?
The Monteagle Fixed Income Fund (the “Fund”) had positive performance during the year. For the year ended August 31, 2014, the Fund had a total return of 3.23%. For the three, and six month periods ending August 31, 2014, the Fund had total returns of 0.31% and 1.21% respectively. The positive returns were primarily driven by market conditions and declining longer term interest rates.
The Fund’s benchmark index (The Barclay’s Capital Intermediate Government/Credit Index) had relative returns of 3.55%, 0.41%, and 1.41% for the twelve, three, and six month periods, ending August 31, 2014, respectively.
What is the Fund’s Investment Approach?
The Fund’s investment objective is total return. The Fund seeks to achieve its objective through capital appreciation on the bonds and other securities held and income on those securities. The Fund invests in investment grade intermediate term fixed income securities maintaining an average maturity of bonds and notes (on a dollar weighted basis) between 3 and 8 years; and rated at least Aa or higher by Moody’s Investors Service, Inc. or AA or higher by S&P’s Rating Group for corporate bonds. Under normal circumstances, at least 80% of the Fund’s net assets will be fixed income securities, including U.S. government securities, securities issued by agencies of the U.S. Government, mortgage-backed securities, taxable municipal bonds and corporate debt securities, with no more than 70% in any one category. The Fund, based on assessment of market conditions, will either lengthen or shorten the average maturity of the portfolio and/or switch between bonds of different sectors, with the view of maximizing the total return for the types of obligations purchased. The securities purchased may have maturities ranging from overnight to 30 years.
What Influenced Fund Performance?
This past fiscal year was somewhat of a reversal of the challenging year experienced by bond investors in 2013. Notwithstanding the much anticipated change in monetary policy actions by the Federal Reserve Bank (U.S. Central Bank – “the Fed”), longer term interest rates decreased while shorter term interest rates increased to reflect those changes to monetary policy. The chart below illustrates how interest rates on U.S. Treasury securities have changed over the fiscal year. The chart shows the progression of rates on a quarterly basis throughout the year.
| | | | | |
| 2 Year | 0.39 | 0.28 | 0.33 | 0.37 | 0.48 |
| 3 Year | 0.79 | 0.56 | 0.69 | 0.79 | 0.94 |
| 5 Year | 1.62 | 1.37 | 1.51 | 1.54 | 1.63 |
| 7 Year | 2.24 | 2.10 | 2.13 | 2.06 | 2.05 |
| 10 Year | 2.78 | 2.75 | 2.66 | 2.48 | 2.35 |
| 30 Year | 3.70 | 3.82 | 3.59 | 3.33 | 3.09 |
MONTEAGLE FIXED INCOME FUND
A DISCUSSION OF FUND PERFORMANCE (Unaudited) (Continued)
The movement in interest rates is usually an indication of the market’s expectation for growth, and with growth, we can also expect a certain amount of inflation. Additionally, since the financial crisis of 2008 and the end of the recession in June of 2009, the Fed has pursued a very easy monetary policy. Actually, the Federal Reserve has been in an easing monetary policy position since August, 2007 when it first lowered the Fed funds rate from 5.25% to 4.75%. So, it stands to reason that interest rates over the past year are responding to any one or more of the variables listed above.
Since the Fall of 2012, the Fed, through the actions of the Federal Open Market Committee (FOMC), had implemented the third in a series of asset purchase programs known as “Quantitative easing” (QE). QE III, as it has been commonly called, was another attempt by the Fed to stimulate economic growth and consequently create demand for labor, thereby reducing the unemployment rate. Under this program the Federal Reserve would purchase $40 billion of Agency obligations (Fannie-Mae and Freddie Mac) and Mortgage-backed securities, as well as $45 billion of longer dated Treasury Notes per month. The program was expected to last until there was substantial improvement in the labor market or increased inflation expectations that could destabilize prices.
While the capital markets, and bond market in particular, had already begun to anticipate a reduction in the amount of assets being purchased monthly by the Fed, the actual announcement of “tapering” these purchases did not occur until December, 2013. Beginning in January 2014, the Fed would reduce the total amount of asset purchases by $10 billion ($5 billion each of Agency and Treasury obligations) per month. The “tapering” has continued on a monthly basis since then and as of August 31, 2014, the monthly amount of asset purchases stood at $25 billion – a reduction of $60 billion from the original amount. It is widely expected that all asset purchases will cease by October 2014 and that a “normalization” (raising the short-term Fed funds rate above the current 0.00% - 0.25% range) of monetary policy should begin in the latter half of 2015.
The above chart illustrates how the bond market has responded to not only the “tapering” of asset purchases, but to the anticipation of higher short-term rates. We can see that interest rates on the shorter end of the Treasury curve have increased slightly over the year, while rates on the longer end of the Treasury curve have declined. These movements in interest rates have had a mixed effect on performance. For those securities within the portfolio that have maturities of less than five years, relative performance has been slightly diminished. For those securities within the portfolio that have maturities greater than five years, the relative performance has been enhanced. Overall, portfolio performance has benefitted from the movement of interest rates over the last fiscal year.
In addition to monetary policy, portfolio performance has also been affected by economic growth, both past, and expected rates of growth. The economic growth rate as measured by the Real Gross Domestic Product (GDP) over the last year has been volatile. The 3rd quarter 2013 annualized rate of growth was 4.10%, and was followed by weaker estimates of growth. For the 4th quarter of 2013 it was 2.60%, 1st quarter of 2014, -2.90%, and the latest estimate of 2nd quarter 2014 growth, 4.20%. The average annual growth rate over the last four quarters has been approximately 2%. This year’s growth rate is approximately the same as last year’s, and the year before last. In other words, real growth has not accelerated. These lagging indicators may explain why longer-term interest rates have been declining since the beginning of 2014. As the market contemplates whether potential economic
MONTEAGLE FIXED INCOME FUND
A DISCUSSION OF FUND PERFORMANCE (Unaudited) (Continued)
growth will accelerate or not, longer term interest rates will adjust higher or lower depending on what impact growth would have on labor markets, consumption, and inflation. As previously mentioned, declining longer interest rates had an overall positive affect on the portfolio’s performance.
Along with economic growth, the market has paid close attention to the health of the labor market. Improvement in labor statistics has positive implications for economic growth and direct implications for Federal Reserve monetary policy. During the course of this past fiscal year the economy created approximately 200,000 jobs per month. The unemployment rate has declined from 7.3% to 6.2% and the under-employment rate1 from 13.7% to 12.1%. However, while improvements in some statistics have provided some impetus for economic growth, there are other measurements that are not necessarily as strong and give an uncertain picture of future economic growth expectations. Average Weekly hours worked remained steady at 34.5. This does not support the case for an expanding economy. Average hourly earnings have only also remained constant at 1.9% year over year. This also does not suggest strong growth for consumer consumption. In an economy that is driven by 70% consumer spending, earnings and disposable income are very important for growth. Lastly, the number of people that are no longer in the labor force (but who could participate) has grown significantly. Over the year, the labor participation rate has declined from 63.4% to 62.8% of the potential pool of workers. So, some of the decrease in the unemployment rates is due to fewer participants. While the employment picture has improved, it has had a modest negative impact on the fund’s performance. We believe it to be a modest impact primarily as it has affected the outlook for future monetary policy and increased short-term interest rates.
Another important variable that has, and would continue to impact portfolio performance, is expected inflation. Inflation measurements for much of the year have been below the Fed’s implicit long-range target for price stability of 2%. For the 12 month period ending August 31, 2014 the CPI did finally increase by 2.0%, while the CPI less food and energy increased 1.7%. While the trend for inflation has increased over the last year, much of the increase to CPI is from volatile increases in energy prices which are seasonal and also affected by geopolitical events surrounding the Middle East and Eastern Europe. The core inflation is relatively stable and below the target of 2.0%. Inflation expectations as measured by the difference in yields between U.S. Treasury Notes and U.S. Inflation Protected Treasury Securities (TIPS) are also in line with the 2% long-range Fed target. For the 5-year Notes the difference is 1.90% and for 10-year Notes, the difference is 2.13%. We don’t believe that inflation had a material impact on fund’s performance over the year.
Our responses to these events have primarily been a disciplined approach to a high quality portfolio profile. We remain committed to the Fund’s strategy of holding a well-diversified portfolio of high quality bonds. We believe that the markets have rewarded our patience and prudence. However, we have made some changes over the last year.
The principal variables affecting bond portfolio performance are overall duration and maturity structure of the portfolio, as well as, Market Sector allocation and credit quality. The first two charts below illustrate the Market Sector composition of the Monteagle Fixed Income Portfolio at the beginning and end of this past fiscal year.
| 1 | (Total unemployed, plus all persons marginally attached to the labor force, plus total employed part time for economic reasons, as a percent of the civilian labor force plus all persons marginally attached to the labor force) |
MONTEAGLE FIXED INCOME FUND
A DISCUSSION OF FUND PERFORMANCE (Unaudited) (Continued)
Comparative Market Sector Weights
Monteagle Fixed Income Fund
| August 31, 2013 | August 31, 2014 |
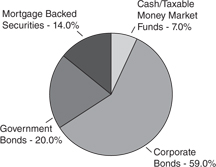 | 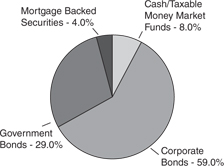 |
| | • | During the course of the year we increased the Fund’s market allocation to Government securities while not reinvesting further in Mortgage-Backed Securities. We also maintained a high allocation to investment grade intermediate corporate bonds at 59% of the portfolio. As can be seen from the following table, the Fund’s decision to increase the allocation to government bonds relative to other sectors did not contribute as much in relative performance as would have been the case had we increased allocation to non-government bonds. However, in keeping with a diversified balanced approach to investing, we felt this was a prudent allocation decision. |
| |
| U.S. Treasury: Intermediate | 2.23% |
| U.S. Agency Intermediate | 2.20% |
| Intermediate Corporate | 6.20% |
| Invest. Grade: Industrial — Intermediate | 6.38% |
| Invest. Grade: Financial Institutions — Intermediate | 5.94% |
| Fixed Rate Mortgage Backed Securities | 5.47% |
| | • | Duration remained constant over last year. As of August 31, 2014 the Fund’s portfolio duration was 4.6 years, identical to the portfolio duration at 2013 fiscal year end. Maturity decreased slightly from 5.1 years at 2013 fiscal year end to 5.02. When compared to the duration and weighted average maturity of 3.9 and 4.2, of the Barclay’s Intermediate Government/Credit Index, the Fund’s portfolio is longer in both measures. This positively influenced the Fund’s performance during the year as longer term rates decreased over that period of time. The following chart illustrates the relative performance of various maturity ranges within the Barclay’s Intermediate Government/Credit Index. As we can see, longer maturity bonds outperformed those |
MONTEAGLE FIXED INCOME FUND
A DISCUSSION OF FUND PERFORMANCE (Unaudited) (Continued)
| | having shorter maturities. The portfolio’s securities mature in less than 10 years with the highest percentage maturing in the 5 to 10 year range. 12.8% of the Fund’s assets mature in less than 3 years, 48.4% in 3 to 7 years, and 30.9% in 7 to 10 years. |
Intermediate U.S. Government/Credit (Returns, Unhedged) Maturity Sectors | | | |
| All Maturities | 3.6% | 1.4% | 0.4% |
| 1 - 3 yrs. | 1.1% | 0.4% | 0.1% |
| 3 - 5 yrs. | 3.1% | 0.9% | 0.1% |
| 5 - 7 yrs. | 5.5% | 2.2% | 0.6% |
| 7 - 10 yrs. | 8.9% | 4.5% | 1.5% |
Comparative Credit Quality
Monteagle Fixed Income Fund
| Moody’s Ratings August 31, 2013 | Moody’s Ratings August 31, 2014 |
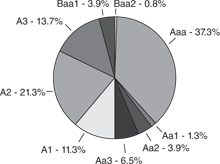 | 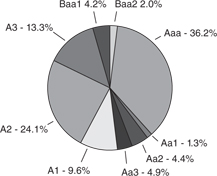 |
| | • | The preceding charts represent the credit quality distribution of the Fund’s securities holdings (not including cash or money market securities) at the beginning and end of this past fiscal year. For consistency of the relative analysis, in our distribution comparison above, we have only included the ratings provided by Moody’s (and not S&P, which rates U.S. Government obligations AA+). The Barclay’s benchmark index still maintains ratings of AAA on U.S. Government obligations. |
| | • | The overall credit quality of the portfolio marginally decreased over the course of the year. Our overweighting of corporate bonds and underweighting of Government bonds has lowered quality slightly, but credit quality remains excellent with overall ratings of AA-/A+ or Aa3/A1. |
MONTEAGLE FIXED INCOME FUND
A DISCUSSION OF FUND PERFORMANCE (Unaudited) (Continued)
| | • | We would also note that at the end of this fiscal year the Fund’s portfolio contained investment grade securities rated below A3/A-. While we are restricted from investing in securities rated below A3/A- at time of purchase, we do have the discretion of holding securities rated Baa/BBB should the rating be the result of a downgrade. It is our opinion that the securities in question do not materially affect the overall credit quality of the Fund’s portfolio and do not represent significant credit risk to portfolio value. The following table specifically identifies the securities in question. |
| | | % of Portfolio Market Value |
| Amgen, Inc., 4.50%, due 03/15/2020 | Baa1 | A | 0.69% |
| Amgen, Inc., 4.85%, due 11/18/2014 | Baa1 | A | 0.63% |
| Goldman Sachs Group Inc., 5.95% 01/18/2018 | Baa1 | A- | 1.40% |
| Verizon Communications, 3.00% 04/01/2016 | Baa1 | BBB+ | 1.29% |
| Morgan Stanley & Co., 3.45% due 11/02/2015 | Baa2 | A- | 1.29% |
Pitney Bowes, Inc., 5.75%, due 09/15/2017 | | | |
| Total | | | 6.01% |
| | • | The following table provides a summary illustration of how investment grade bonds of varying credit quality have performed over the past year. These are returns of bonds in the Barclay’s Intermediate U.S. Government/Credit index. The relative performance of credit is indicative of the risk/reward nature of these bonds. We can see that for the full year lower quality bonds had a performance advantage over those of a higher quality. As such, the performance of the Monteagle Fixed Income Fund did not benefit from the higher returns associated with Baa rated bonds. |
| | | |
| Aaa | 2.25% | 0.88% | 0.24% |
| Aa | 3.76% | 1.45% | 0.41% |
| A | 5.54% | 2.02% | 0.66% |
| | | |
| Total | 3.55% | 1.41% | 0.41% |
| | • | For the year, trading was primarily driven by the replacement of maturing bonds with the purchase of corporate bonds and Government Agency bonds. There were no additional purchases of Mortgage-backed securities nor of U.S. Treasury Notes. |
MONTEAGLE FIXED INCOME FUND
A DISCUSSION OF FUND PERFORMANCE (Unaudited) (Continued)
What is the Fund’s Strategy?
The Fund will continue to invest in high quality intermediate term fixed income securities generally between 2 and 10 years in maturity. The Fund will continue to monitor economic conditions through the use of a proprietary model in an attempt to anticipate interest rate changes and lengthen or shorten the duration of the Fund’s portfolio of securities to maximize total return with minimal risk. The Fund will also actively manage portfolio holdings across market sectors in order to maximize total return within the scope of permitted investments defined by the Fund’s prospectus. While we have taken prudent steps to diversify the Fund’s assets by limiting exposure to the credit and interest rate risk associated with any one specific issuer, market sector, or maturity range, those risks cannot be completely eliminated without affecting long-term Fund performance. We remain vigilant and will act in your best interest to preserve the Fund’s asset values.
Fund performance shown represents the performance of the Fund’s Class I shares. For complete performance information, please refer to the Average Annual Total Return table in the following performance report. Past performance is not predictive of future performance. Investment results and principal value will fluctuate so that shares, when redeemed, may be worth more or less than their original cost. Current performance may be higher or lower than the performance data quoted. Performance data current to the most recent month-end are available by calling 1-888-263-5593.
An investor should consider the investment objectives, risks, charges and expenses of the Fund carefully before investing. The Fund’s prospectus contains this and other important information. To obtain a copy of the Fund’s prospectus please call 1-888-263-5593 and a copy will be sent to you free of charge. Please read the prospectus carefully before you invest. The Fund is distributed by Matrix Capital Group, Inc.
Management’s Discussion of Fund Performance seeks to describe some of the Sub-Adviser’s current opinions and views of the financial markets. Although the Sub-Adviser believes it has a reasonable basis for any opinions or views expressed, actual results may differ, sometimes significantly so, from those expected or expressed.
MONTEAGLE FIXED INCOME FUND
PERFORMANCE — August 31, 2014 (Unaudited)
Comparision of the Change in Value of a $10,000 Investment in Monteagle Fixed Income Fund
and the Barclays Capital Intermediate U.S. Government/Credit Index
Average Annual Total Return (for the periods ended August 31, 2014) |
| | | | |
| Monteagle Fixed Income Fund | 3.23% | 2.62% | 3.19% |
| Barclays Capital Intermediate U.S. Government/Credit Index | 3.55% | 3.70% | 4.12% |
The performance information quoted in this annual report assumes the reinvestment of all dividend and capital gain distributions, if any, and represents past performance, which is not a guarantee of future results. The returns shown do not reflect taxes that a shareholder would pay on Fund distributions or on the redemption of Fund shares. The investment return and principal value of an investment will fluctuate and, therefore, an investor’s shares, when redeemed, may be worth more or less than their original cost.
The above graph depicts the performance of the Monteagle Fixed Income Fund versus the Barclays Capital Intermediate U.S. Government/Credit Index (formerly Lehman Brothers U.S. Intermediate Government/Credit Index). The Barclays Capital Intermediate U.S. Government/Credit Index measures the performance of dollar denominated U.S. Treasuries, government-related (i.e. U.S. and foreign agencies, sovereign, supranational and local authority debt), and investment grade credit structures that have a remaining maturity of greater than or equal to one year and less than ten years. Please note that indices do not take into account any fees and expenses of investing in the individual securities that they track, and indsividuals cannot invest directly in any index.
As with any fund, save an index fund, that commonly compares its performance to the Barclays Capital Intermediate U.S. Government/Credit Bond Index, such a comparison may be said to be inappropriate because of the dissimilarity between the Fund’s investments and the securities comprising the index; so too with the Monteagle Fixed Income Fund, which will not invest in certain securities comprising this index.
MONTEAGLE INFORMED INVESTOR GROWTH FUND
A DISCUSSION OF FUND PERFORMANCE (Unaudited)
How did the Fund Perform?
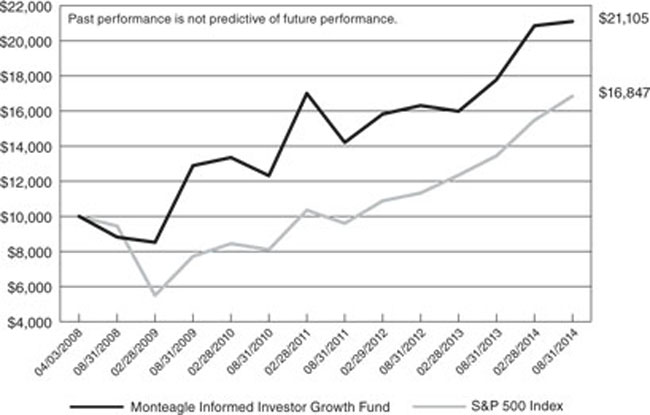
The Monteagle Informed Investor Growth Fund (the “Fund”) returned a positive 18.65% for the fiscal year ending August 31, 2014. The S&P 500 Index® (the “S&P”), the Fund’s benchmark, rose 25.25%.
What is the Fund’s Investment Approach?
The Fund invests primarily in medium capitalization stocks (median, generally around $15 billion) of well-managed, financially sound companies, offering under-valued earnings growth rate, earnings yield and earnings surprise momentum, superior return on investment capital and cash flow growth opportunities. These are companies in which management or large and informed investors — individuals and/or funds — are significant common stock owners or buyers, or where the company itself is repurchasing its own shares on the open market. This investment discipline is widely recognized as The Informed Investor Strategy — now marking its 59th year of institutional portfolio management.
Summarizing, these companies qualify for intensive research analysis only if they meet at least one of these five first-screen qualifying selection tests:
| | 1. | The company’s officers and directors are buying its common stock on the open market. |
| | 2. | A major outside investor (minimum 5% shares outstanding owned) has filed a Form 13-D purchase disclosure on the company’s stock. |
| | 3. | The company has announced its intent to repurchase its common stock on the open market. |
| | 4. | A significant percentage of the company’s stock is owned by family/management. |
| | 5. | The current top performing equity mutual funds and/or equity-orientated hedge funds are accumulating the company’s common stock on the open market. |
The buy disciplines are matched by a series of five sell disciplines. They are:
| | 1. | Begin selling if a stock drops a minimum of 8% from an average-cost basis. |
| | 2. | Begin selling when a holding-high loss-limit is triggered. (Stock falls a minimum of 14% from its portfolio holding-high price.) |
| | 3. | Begin selling on preliminary, but confirmed, indications of a breakdown in a company’s financials. |
| | 4. | Possibly selling when informed investors stock transaction signals turn bearish. |
| | 5. | Sell partial positions of a portfolio stock after an unusual day-to-day sharp price run-up. |
What Influenced the Fund’s Performance?
The Fund’s fiscal-year 2014 investment performance was influenced by the following factors:
First, the portfolio weightings in two major equity investment sectors: Energy and Financials.
MONTEAGLE INFORMED INVESTOR GROWTH FUND
A DISCUSSION OF FUND PERFORMANCE (Unaudited) (Continued)
The Energy sector suffered a loss of 25.8% for the fiscal year. This sector averaged 7.5% of portfolio assets. The three major Energy stocks held in the Fund were: Gaslog (GLOG) -12.3%, Carrizo Oil and Gas (CRZO) -10.2% and Noble Energy (NBL) -8.7%.
Financial Stocks declined 7.8%, on average, with leading losers Nation Star Mortgage Holdings (NSM) -12.5%, Charles Schwab (SCHW) -9.6% and Portfolio Recovery Associates (PRAA), down 7.0%. This sector averaged 5.0% of portfolio assets.
The Fund also profited from its three highest sector allocations during the fiscal year: Health Care, Consumer Discretionary and Industrials. At fiscal year-end these sectors accounted for approximately 65.0 % of the Fund’s equity portfolio weightings.
As of the August 31, 2014 fiscal year-end, the Fund was virtually fully invested, holding a modest 9% in cash. This holding was viewed as a neutral influence on performance during the fiscal year.
The Fund’s fiscal year ended with some continuing economic bright spots: a positive housing outlook, re-surging auto sales, an improving employment picture, low interest rates and non-threatening inflation.
Reflecting these favorably economic developments, general market sentiment turned more growth-orientated in the fiscal fourth quarter, producing a gain of 6.8%, versus a return of 4.7% for the S&P. This performance advantage was highlighted by these portfolio growth stock returns: Gilead (GILD) +32.4%, Salix Pharmaceuticals (SLXP) +39.5% and Southwest Air (LUV) +21.0%, among several others.
The three major new securities bought in the first fiscal quarter were: Soufun Holdings (SFUN), Actavis (ACT) and Qihoo 360 Technology (QIHU).
In the second quarter, major equity positions added to the Fund included: Biogen (BIIB), Las Vegas Sands (LVS) and Salix Pharmaceuticals (SLXP).
In the third quarter, the three largest positions added were: Trinity Industries (TRN), Vipshop Holdings (VIPS) and Alaska Air Group (ALK).
Fourth quarter, major positions purchased were: Skyworks (SWKS), Gaslog (GLOG) and Arris Group (ARRS).
Measured on a total return basis, for the full fiscal year, the top-ten portfolio equity holdings and their performance, which contributed most to the Fund’s performance were: Jazz Pharmaceuticals (JAZZ) +56.5%, Soufun Holdings (SFUN) +43.8%, Salix Pharmaceuticals (SLXP) +43.8%, Actavis (ACT) +42.2%, B/E Aerospace (BEAV) +35.2%, Vipshop Holdings (VIPS) +31.8%, Gilead Sciences (GILD) +30.6%, Keuring Green Mountain, Inc. (GMCR) +30.3%, Spirit Airlines (SAVE) +30.3% and Delphi Automotive (DLPH) +29.1%.
The ten portfolio equity holdings contributing the least to the Fund’s performance for the full fiscal-year were: EQT Corp.(EQT) -8.2%, Noble Energy ( NBL) -8.7%, Flir Systems (FLIR) -9.3%, Charles Schwab (SCHW) -9.6%, Carrizo Oil (CRZO) -10.2%, Mastercard (MA) -11.0%, Alexion Pharmaceuticals (ALXN) -12.0%, GasLog (GLOG) -12.3%, Nation Star Mortgage (NSM) -12.5%, Myriad Genetics (MYGN) -14.8% and Qihoo 360 Technology (QIHU) -20.1%.
MONTEAGLE INFORMED INVESTOR GROWTH FUND
A DISCUSSION OF FUND PERFORMANCE (Unaudited) (Continued)
What is the Fund’s Current Strategy?
The current strategy of the Monteagle Informed Investor Growth Fund continues to remain virtually fully invested in a select list of uniquely attractive growth stocks that fulfill the rigid Informed Investor strategy growth stock criteria. Positions in cash and ETFs remain a secondary consideration, and are quite subordinate to stock selection priorities.
Fund performance shown represents the performance of the Fund’s Class I shares. For complete performance information, please refer to the Average Annual Total Return table in the following performance report. Past performance is not predictive of future performance. Investment results and principal value will fluctuate so that shares, when redeemed, may be worth more or less than their original cost. Current performance may be higher or lower than the performance data quoted. Performance data current to the most recent month-end are available by calling 1-888-263-5593.
An investor should consider the investment objectives, risks, charges and expenses of the Fund carefully before investing. The Fund’s prospectus contains this and other important information. To obtain a copy of the Fund’s prospectus please call 1-888-263-5593 and a copy will be sent to you free of charge. Please read the prospectus carefully before you invest. The Fund is distributed by Matrix Capital Group, Inc.
Management’s Discussion of Fund Performance seeks to describe some of the Sub-Adviser’s current opinions and views of the financial markets. Although the Sub-Adviser believes it has a reasonable basis for any opinions or views expressed, actual results may differ, sometimes significantly so, from those expected or expressed.
MONTEAGLE INFORMED INVESTOR GROWTH FUND
PERFORMANCE — August 31, 2014 (Unaudited)
Comparison of the Change in Value of a $10,000 Investment
in Monteagle Informed Investor Growth Fund and the S&P 500 Index
Average Annual Total Return (for the periods ended August 31, 2014) |
| | | | |
| Monteagle Informed Investor Growth Fund | 18.65% | 10.36% | 12.36% |
| S&P 500 Index | 25.25% | 16.89% | 8.48% |
| (a) | Represents the period from the commencement of operations (April 3, 2008) through August 31, 2014. |
The performance information quoted in this annual report assumes the reinvestment of all dividend and capital gain distributions, if any, and represents past performance, which is not a guarantee of future results. The returns shown do not reflect taxes that a shareholder would pay on Fund distributions or on the redemption of Fund shares. The investment return and principal value of an investment will fluctuate and, therefore, an investor’s shares, when redeemed, may be worth more or less than their original cost.
The above graph depicts the performance of the Monteagle Informed Investor Growth Fund versus the S&P 500 Index. The S&P 500 Index by Standard and Poor’s Corp. is a capitalization-weighted index comprising 500 issues listed on various exchanges, representing the performance of the stock market generally. Please note that indices do not take into account any fees and expenses of investing in the individual securities that they track, and individuals cannot invest directly in any index.
As with any fund, save an index fund, that commonly compares its performance to the S&P 500 Index, such a comparison may be said to be inappropriate because of the dissimilarity between the Fund’s investments and the securities comprising the index; so too with the Monteagle Informed Investor Growth Fund, which will not invest in certain securities comprising this index.
MONTEAGLE QUALITY GROWTH FUND
A DISCUSSION OF FUND PERFORMANCE (Unaudited)
How did the Fund perform?
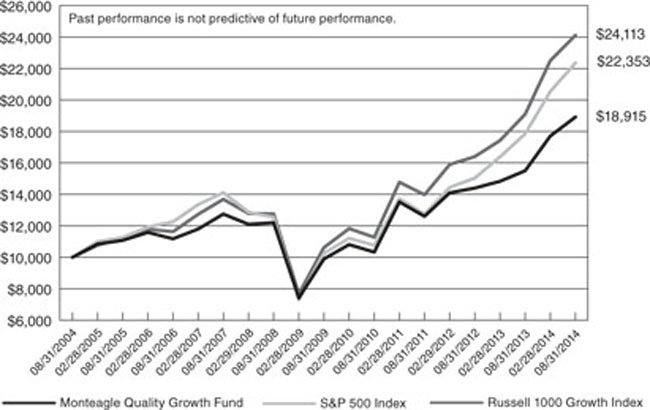
For the twelve months ended August 31, 2014, the Monteagle Quality Growth Fund (the “Fund”) reported a total return of 22.05%. The S&P 500 Index® (“S&P 500”) and the Russell 1000 Growth Index® (“Russell 1000”), the Fund’s two benchmarks, had total returns of 25.25% and 26.29%, respectively, for the same period. The Fund’s net asset value per share as of August 31, 2014 was $12.99 versus $10.65 as of August 31, 2013.
What is the Fund’s investment approach?
The Fund utilizes a growth style, investing in primarily domestic companies believed by the investment manager to be of high quality and to have above-average sustainable and/or accelerating growth with an ability to exceed earnings expectations over time. The underlying belief is that high quality companies outperform over time with less risk. Various quality rankings and other metrics which demonstrate quality, including earnings consistency, are evaluated carefully before a stock is added to the portfolio. The Fund employs a proprietary screening process and bottom-up work to construct portfolios. However, portfolio constraints are established to ensure sufficient diversification by sector as well as by market capitalization. The underlying belief is that diversification provides for greater control of risk in the portfolio, while allowing freedom in individual stock selection. The screening process is designed to identify stocks with rising expectations, as the Fund looks to invest in securities whose growth potential is, in the manager’s eyes, generally underestimated by the market. Holdings generally have a market capitalization of at least $2 billion, with about 65% to 85% of the portfolio in stocks of over $15 billion. Compared to the S&P 500, the portfolio may have a lower dividend yield, a higher price/earnings ratio and a higher expected earnings growth rate.
What influenced the Fund’s performance?
For the fiscal year ended August 31, 2014, domestic equity markets posted exceptional returns, reflecting hopes for an improving global economy. Consistent with trends since the March 2009 market bottom, investors were fixated on central bank actions. In particular, markets rallied on statements or rumors of continued liquidity injections from the United States Federal Reserve. This ongoing program of injections, referred to as “quantitative easing”, now exceeds $4.2 trillion in aggregate. Assured of central bank support, investors generally sought higher-risk securities, placing less value on the safety inherent in higher-quality stocks. The result was an extended period of time with stock returns driven by factors such as beta, while company fundamentals were largely ignored. This period has been a material headwind for the Fund’s strategy of investing in high-quality stocks with rising earnings.
Using the S&P Earning and Dividend Quality Rankings system as a guide to quality, the Fund’s emphasis on high-quality companies detracted just over 150 basis points from performance. Stocks in the Russell 1000 Growth Index rated B+ or better by the S&P Earning and Dividend Quality Rankings (high-quality stocks) rose 24.8% compared with 28.4% for stocks in the index rated B or lower (low-quality stocks).
MONTEAGLE QUALITY GROWTH FUND
A DISCUSSION OF FUND PERFORMANCE (Unaudited) (Continued)
Approximately 90 basis points of underperformance can be attributed to adverse sector allocation. In particular, the Fund’s healthcare weighting of 8.3% was significantly below the Russell 1000 Growth Index weighting of 12.5%. Returns for the Russell 1000 Growth Healthcare sector totaled 38.0% for the year. The Fund’s healthcare holdings returned 25.3%. The difference in weightings and sector performance largely reflects the Fund avoiding low-quality biotechnology stocks which are inconsistent with the conservative approach of the Fund.
Holding a modest 1.4% in cash over the course of the year impacted performance by just over 50 basis points.
During the period, individual stocks that contributed most positively to relative returns were Walt Disney (entertainment industry, up 49.6%), Family Dollar Stores (general merchandise retail, up 40.6%), and American Tower (REIT financial structure, operating in the wireless telecommunications industry, up 44.1%). Individual stocks posting the largest declines in performance included DSW (specialty retail, down 34.2%), Whole Foods Market (food retail, down 25.1%), and Bed Bath & Beyond (hardlines retail, down 8.0%).
Changes to the portfolio during the year reflect a heightened emphasis on quality in the expectation that stock market volatility may increase as the Federal Reserve ends its liquidity injection programs. New holdings added to the Fund over the past year include Amgen (biotechnology), Colgate-Palmolive (personal care), Costco (general merchandise retail), Exxon Mobil (energy), Family Dollar (general merchandise retail), Healthcare REIT (real estate), Hershey (food), Johnson & Johnson (pharmaceuticals), Pfizer (pharmaceuticals), Praxair (specialty chemicals), JM Smucker (food), 3M (materials), WalMart (general merchandise retail), Verizon (telecommunications) and Yum! Brands (restaurants).
Purchases were funded by the elimination of positions in Affiliated Managers Group (investment management), D.R. Horton (homebuilding), Monsanto (agriculture) and Tidewater (energy services).
What is the Fund’s Strategy?
The Fund will continue to focus on maintaining a diversified portfolio of high-quality companies delivering sustainable above-market earnings growth as well as companies poised to experience acceleration in earnings growth relative to expectations. The Fund’s adviser believes the companies that can exceed expectations in the form of positive earnings surprises will be well rewarded over coming quarters.
MONTEAGLE QUALITY GROWTH FUND
A DISCUSSION OF FUND PERFORMANCE (Unaudited) (Continued)
Fund performance shown represents the performance of the Fund’s Class I shares. For complete performance information, please refer to the Average Annual Total Return table in the following performance report. Past performance is not predictive of future performance. Investment results and principal value will fluctuate so that shares, when redeemed, may be worth more or less than their original cost. Current performance may be higher or lower than the performance data quoted. Performance data current to the most recent month-end, are available by calling 1-888-263-5593.
An investor should consider the investment objectives, risks, charges and expenses of the Fund carefully before investing. The Fund’s prospectus contains this and other important information. To obtain a copy of the Fund’s prospectus please call 1-888-263-5593 and a copy will be sent to you free of charge. Please read the prospectus carefully before you invest. The Fund is distributed by Matrix Capital Group, Inc.
Management’s Discussion of Fund Performance seeks to describe some of the Sub-Adviser’s current opinions and views of the financial markets. Although the Sub-Adviser believes it has a reasonable basis for any opinions or views expressed, actual results may differ, sometimes significantly so, from those expected or expressed.
MONTEAGLE QUALITY GROWTH FUND
PERFORMANCE — August 31, 2014 (Unaudited)
Comparison of the Change in Value of a $10,000 Investment in Monteagle Quality Growth Fund,
the S&P 500 Index and the Russell 1000 Growth Index
Average Annual Total Return (for the periods ended August 31, 2014) |
| | | | |
| Monteagle Quality Growth Fund | 22.05% | 13.84% | 6.58% |
| S&P 500 Index | 25.25% | 16.89% | 8.38% |
| Russell 1000 Growth Index | 26.29% | 17.83% | 9.20% |
The performance information quoted in this annual report assumes the reinvestment of all dividend and capital gain distributions, if any, and represents past performance, which is not a guarantee of future results. The returns shown do not reflect taxes that a shareholder would pay on Fund distributions or on the redemption of Fund shares. The investment return and principal value of an investment will fluctuate and, therefore, an investor’s shares, when redeemed, may be worth more or less than their original cost.
The above graph depicts the performance of the Monteagle Quality Growth Fund versus the S&P 500 Index and the Russell 1000 Growth Index. The S&P 500 Index by Standard and Poor’s Corp. is a capitalization-weighted index comprising 500 issues listed on various exchanges, representing the performance of the stock market generally. The Russell 1000 Growth Index measures the performance of the large-cap growth segment of the U.S. equity universe. It includes those Russell 1000 companies with higher price-to-book ratios and higher forecasted growth values. Please note that indices do not take into account any fees and expenses of investing in the individual securities that they track, and individuals cannot invest directly in any index.
As with any fund, save an index fund, that commonly compares its performance to the S&P 500 Index and the Russell 1000 Growth Index, such a comparison may be said to be inappropriate because of the dissimilarity between the Fund’s investments and the securities comprising the indices; so too with the Monteagle Quality Growth Fund, which will not invest in certain securities comprising these indices.
MONTEAGLE SELECT VALUE FUND
A DISCUSSION OF FUND PERFORMANCE (Unaudited)
How did the Fund perform?
For the year ended August 31, 2014, the Monteagle Select Value Fund (the “Fund”) had a total return of 27.29%. The S&P 500 Index® (“S&P 500” or “Index”) had a total return of 25.25% for the same period. Moreover, the Fund ranked in the top 5% of its peers (over 1,200 funds in its category) on a one-year time frame according to Morningstar. Additionally, Morningstar ranked the Fund in the top 1% on both a 3-year and 5-year basis (approximately 1,000 peer funds for each period). The Fund’s net asset value per share as of August 31, 2014 was $18.66 versus $15.07 on August 31, 2013. This represents the highest NAV for the Fund in all of its history.
What is the Fund’s investment approach?
The Fund’s investment goal is long-term capital appreciation. The Fund uses a “value investing” style by investing under normal circumstances at least 80 percent of its assets in common stock of domestic companies believed to be under-priced relative to comparable securities determined by price-to-earnings ratios, cash flows or other measures. The Fund’s adviser predominately utilizes a reversion-to-the-mean strategy on stock selection in order to achieve its results rather than trying to time market fluctuations. The adviser limits the pool of stocks to consider for purchase to only those equities in the S&P 500. In selecting stocks, the Fund’s adviser establishes valuation parameters by using relative ratios or target prices to evaluate companies on several levels. Additionally, the adviser will generally have the Fund hold between 40 and 60 equities and diversify its holdings across numerous industries, generally limiting issues in any one industry to five securities unless more securities are needed for limiting specific dollar amounts per security or to over-weight a particular sector. The Fund seeks to maintain a minimum average weighted market capitalization of $5 billion.
Value stocks are broadly defined as equities which have a price-to-earnings ratio and a price-to-book ratio less than the relative market average with dividends tending to be higher than the relative market average. Also, value stocks tend to have a beta (a measure of the stocks price volatility relative to the overall market, i.e. the S&P 500) less than 1.0.
What influenced the Fund’s performance?
During the twelve months ended August 31, 2014, the Fund’s performance was affected by the volatility in the US equity market resulting from various economic concerns. While the “Fiscal Cliff” issues continue to loom, most seem to have considered it a non-event. The continual kicking of the proverbial can down the road has pushed the concern under the rug, allowing Congress ample time and the Treasury somewhat of an open ceiling. The Treasury was expected to run out of funds to pay the government’s bills by late February. However, another “suspension” of the debt ceiling occurred, pushing the discussion until next year which is conveniently after the midterm elections, appeasing both sides of the aisle. The precedent being established is to suspend the debt ceiling then Congress can later increase the limit to the level of debt outstanding. So with the recent one-year suspension it’s almost as if there is no limit on national debt in the short-term. The Federal Reserve’s new Fed Chair, Janet Yellen, and the unwinding of quantitative easing have been highly watched and scrutinized over the last twelve months. These and other issues continued to affect the markets throughout the year. During the period, the equity markets reached (and closed
MONTEAGLE SELECT VALUE FUND
A DISCUSSION OF FUND PERFORMANCE (Unaudited) (Continued)
at) all-time market highs that exceeded even the pre-financial crisis levels. The S&P 500 trended cyclically with a positive move followed by a correction four times over the period. Most recently, from late July to mid-August, the S&P fell approximately 4%. Subsequently, the Index gained almost 5% from this low to the end of August, which has been a fascinating trend. The Dow Jones Industrial Average (the “Dow”) followed a similar trend, beginning the period at one of its lowest points. The Dow’s largest percentage fall over the last year was over the month of January when it lost approximately 7.26%. The Dow concluded August 31, 2014 at 17,098.45, approximately 18.2% higher than it began a year earlier. During the last twelve months the Federal Open Markets Committee of the Federal Reserve continued to maintain the Fed Funds rate at the range of 0% to 0.25%, where it has remained since December 2008. Quantitative easing continued to be unwound under Yellen. With an improving market, the Fund’s focus on a “value style, reversion-to-the-mean” has led to favorable performance. Overall, the Fund compares its performance to the S&P 500 Index and has performed very attractively. Moreover, the Fund’s performance was affected by its asset allocation weighting to the various sectors of the Index.
For the first fiscal quarter ended November 30, 2013, the portfolio holdings of the Fund outperformed the S&P 500 Index. The investments of the Fund experienced a 13.16% return versus a return for the Index of 11.16%. For the trailing 12-month period ended November 30, 2013, the portfolio holdings of the Fund significantly outperformed the Index with the investments of the Fund experiencing a 49.09% return versus a 30.30% return for the Index.
The broad sectors of the Index that improved the most on average during the first quarter were the Industrials (15.22%), Consumer Discretionary (13.07%) and Information Technology (12.96%) sectors while the Utilities (3.46%), Telecommunication Services (5.32%) and the Energy (7.21%) sectors, although positive, were the lowest performing within the Index. The portfolio performance was led by its holdings in the Information Technology, Consumer Staples and Industrial sectors during this quarter; the lower performing sectors in the portfolio were Utilities, Health Care and Telecommunication Services. The Index reached all-time record high levels during the quarter.
At the end of the first quarter, the portfolio holdings continued to be diversified across many sectors of the Index with less exposure to the Telecommunication Services, Utility and Health Care sectors. The largest sector allocations were Information Technology (21.3%), Financials (19.0%) and Industrials (11.4%). The Fund’s positive portfolio performance was primarily attributed to its top performing stock picks of First Solar, Inc. (62.9%), U.S. Steel Corp. (49.8%), and Safeway Inc. (35.0%). The Fund’s portfolio performance was most negatively affected by Newmont Mining (-17.6%), Teradata Corp. (-17.5%) and FirstEnergy Corp. (-12.9%). During the first quarter, six disposals were made in order to remove securities that achieved their target price and make room for new securities with more appreciation potential. Two new securities were purchased and two securities were averaged into in order to reinvest the cash. The cash balance continues to remain slightly elevated in order to allow cash to average into the equity market and/or find additional securities with positive appreciation potential. Cash represented 9.2% of the assets at the end of the quarter.
MONTEAGLE SELECT VALUE FUND
A DISCUSSION OF FUND PERFORMANCE (Unaudited) (Continued)
For the second fiscal quarter ended February 28, 2014, the portfolio holdings of the Fund underperformed the S&P 500 Index. The investments of the Fund experienced a 1.51% return versus a return for the Index of 3.51%. For the trailing 12-month period ended February 28, 2014, the portfolio holdings of the Fund significantly outperformed the Index with the investments of the Fund experiencing a 36.71% return versus a 25.37% return for the Index.
The broad sectors of the Index that improved the most on average during the second quarter were the Health Care (7.81%), Materials (7.23%), and Information Technology (6.89%) sectors while the Telecommunication Services (-4.67%), Consumer Staples (-1.75%), and the Financials (0.84%) sectors, were the lowest performing within the Index. The portfolio performance was led by its holdings in the Consumer Staples, Information Technology and Financial sectors during this quarter; the lower performing sectors in the portfolio were Telecommunication Services, Utilities and Materials. The Index reached all-time record high levels during the quarter after a 5% correction in January.
At the end of the second quarter, the portfolio holdings continued to be diversified across many sectors of the Index with less exposure to the Telecommunication Services, Utility and Health Care sectors. The largest sector allocations are Financials (20.5%), Information Technology (17.0%) and Industrials (14.4%). The Fund’s positive portfolio performance was primarily attributed to its top performing stock picks of CF Industries (15.42%), Lockheed Martin Corp. (14.56%), and H&R Block, Inc. (13.45%). The Fund’s portfolio performance was most negatively affected by Diamond Offshore Drilling, Inc. (-21.2%), Cliffs Natural Resources, Inc. (-19.9%) and CME Group, Inc. (-9.9%). During the second quarter, three disposals were made in order to remove securities that achieved their target price and make room for new securities with more appreciation potential. Eight purchases were made, four new purchases in January which were averaged into again in February in order to reinvest the cash. The slightly elevated cash balance was reduced in the quarter following the market correction in late January. As of the end of the second quarter, cash represented 4.1% of the assets.
For the third fiscal quarter ended May 31, 2014, the portfolio holdings of the Fund outperformed the S&P 500 Index. The investments of the Fund experienced a 5.06% return versus a return for the Index of 3.97%. For the trailing 12-month period ended May 31, 2014, the portfolio holdings of the Fund outperformed the Index with the investments of the Fund experiencing a 23.37% return versus a 20.45% return for the Index.
The broad sectors of the Index that improved the most on average during the third quarter were the Telecommunication Services (9.86%), Energy (9.55%), and Consumer Staples (7.00%) sectors while the Consumer Discretionary (-1.12%), Health Care (0.74%), and the Financial (3.42%) sectors, were the lowest performing within the Index. The portfolio performance was led by its holdings in the Health Care, Utilities and Telecommunication Services sectors during this quarter; the lower performing sectors in the portfolio were Consumer Discretionary, Industrials and Consumer Staples. The Index again reached all-time record high levels, this time at the end of the third quarter ending May 31, 2014. This followed a 4% correction in early April.
MONTEAGLE SELECT VALUE FUND
A DISCUSSION OF FUND PERFORMANCE (Unaudited) (Continued)
At the end of the third quarter, the portfolio holdings continued to be diversified across many sectors of the Index with less exposure to the Telecommunication Services, Utility and Materials sectors. The largest sector allocations were Financials, Consumer Discretionary and Industrials. The Fund’s positive portfolio performance was primarily attributed to its top performing stock picks of Allegheny Technologies (29.23%), Exelon Corp. (21.11%), and Apple Computer, Inc. (20.29%). The Fund’s portfolio performance was most negatively affected by Cliffs Natural Resources, Inc. (-21.72%), RR Donnelley & Sons Co. (-17.20%) and International Game Technology (-9.36%). During the third quarter, six disposals were made primarily in order to remove securities that achieved their target price and make room for new securities with more appreciation potential. Four purchases of new securities were made in April. While the cash balance was reduced in the previous quarter following the market correction in late January, the elevated cash balance at the end of the quarter ended May 31, 2014 is to allow opportunities to average into the market following a potential correction after new record highs. As of the end of the third quarter, cash represented 12.9% of the assets.
For the fourth quarter ended August 31, 2014, the portfolio holdings of the Fund outperformed the S&P 500 Index. The investments of the Fund experienced a 5.48% return versus a return for the Index of 4.69%. For the trailing 12-month period ended August 31, 2014, the portfolio holdings of the Fund outperformed the Index with the investments of the Fund experiencing a 27.29% return versus a 25.25% return for the Index.
The broad sectors of the Index that improved the most on average during the quarter were the Health Care (8.55%), Information Technology (8.03%) and Consumer Discretionary (6.32%) sectors while the Industrials (0.95%), Telecommunication Services (1.20%) and the Utilities (2.65%) sectors, were the lowest performing within the Index. The portfolio performance was led by its holdings in the Basic Materials, Technology and Consumer Staples sectors during this quarter; the lower performing sectors in the portfolio were Utilities, Energy and Communications. The Index again closed at all-time record high levels, ending the quarter at 2,003.37. This followed another 4% correction over a ten-day period in late July to early August.
At the end of the fourth quarter, the portfolio holdings continued to be diversified across many sectors of the Index with less exposure to the Communications, Utility and Materials sectors. The largest sector allocations are Consumer Discretionary, Consumer Staples and Energy. The Fund’s positive portfolio performance was primarily attributed to its top performing stock picks of U.S. Steel (67.95%), International Game Technology (36.82%), and Edwards Lifesciences Corp. (22.24%). The Fund’s portfolio performance was most negatively affected by Exelon Corp. (-8.41%), Transocean LTD. (-7.33%) and Diamond Offshore Drilling, Inc. (-6.82%). During the fourth quarter, seven disposals were made primarily in order to remove securities that achieved their target price and make room for new securities with more appreciation potential. Eight purchases were made in June, purchasing some new names and averaging into existing securities. The elevated cash balance at August 31, 2014 is to allow for payment of the large capital distribution following the close of the fiscal year. As of August 31, 2014 cash represented 15.1% of the assets.
MONTEAGLE SELECT VALUE FUND
A DISCUSSION OF FUND PERFORMANCE (Unaudited) (Continued)
What is the Fund’s strategy?
The Fund will continue to concentrate on equities contained in the S&P 500 which generally consists of large name brand corporations with good fundamentals and broad product diversification. The Fund’s adviser will continue to be disciplined in the use of its predominate strategy of reversion-to-the-mean by applying its “value investing” approach valuation model; thereby, allowing the market’s volatility to identify those securities that become under-valued and are poised to be the next performers in the market. Sector allocation in the Fund’s portfolio will primarily be determined by which companies are available for purchase pursuant to the Fund’s strategy. It is anticipated that the Fund may hold higher levels of cash during extended periods of market uncertainty and will selectively invest the cash into equities identified by the primary investment strategy as opportunities present themselves or for dollar-cost-averaging into currently held positions. This strategy is executed with a long-term outlook and will have periods of under-performance and out-performance versus its Index. Therefore, the Fund’s daily performance can and will vary dependant upon current market conditions.
Fund performance shown represents the performance of the Fund’s Class I shares. For complete performance information, please refer to the Average Annual Total Return table in the following performance report. Past performance is not predictive of future performance. Investment results and principal value will fluctuate so that shares, when redeemed, may be worth more or less than their original cost. Current performance may be higher or lower than the performance data quoted. Performance data current to the most recent month-end, are available by calling 1-888-263-5593.
An investor should consider the investment objectives, risks, charges and expenses of the Fund carefully before investing. The Fund’s prospectus contains this and other important information. To obtain a copy of the Fund’s prospectus please call 1-888-263-5593 and a copy will be sent to you free of charge. Please read the prospectus carefully before you invest. The Fund is distributed by Matrix Capital Group, Inc.
Management’s Discussion of Fund Performance seeks to describe some of the Sub-Adviser’s current opinions and views of the financial markets. Although the Sub-Adviser believes it has a reasonable basis for any opinions or views expressed, actual results may differ, sometimes significantly so, from those expected or expressed.
MONTEAGLE SELECT VALUE FUND
PERFORMANCE — August 31, 2014 (Unaudited)
Comparison of the Change in Value of a $10,000 Investment
in Monteagle Select Value Fund and the S&P 500 Index

Average Annual Total Return (for the periods ended August 31, 2014) |
| | | | |
| Monteagle Select Value Fund | 27.29% | 18.89% | 7.15% |
| S&P 500 Index | 25.25% | 16.89% | 8.38% |
The performance information quoted in this annual report assumes the reinvestment of all dividend and capital gain distributions, if any, and represents past performance, which is not a guarantee of future results. The returns shown do not reflect taxes that a shareholder would pay on Fund distributions or on the redemption of Fund shares. The investment return and principal value of an investment will fluctuate and, therefore, an investor’s shares, when redeemed, may be worth more or less than their original cost.
The above graph depicts the performance of the Monteagle Select Value Fund versus the S&P 500 Index. The S&P 500 Index by Standard and Poor’s Corp. is a capitalization-weighted index comprising 500 issues listed on various exchanges, representing the performance of the stock market generally. Please note that indices do not take into account any fees and expenses of investing in the individual securities that they track, and individuals cannot invest directly in any index.
As with any fund, save an index fund, that commonly compares its performance to the S&P 500 Index, such a comparison may be said to be inappropriate because of the dissimilarity between the Fund’s investments and the securities comprising the index; so too with the Monteagle Select Value Fund, which will not invest in certain securities comprising this index.
MONTEAGLE VALUE FUND
A DISCUSSION OF FUND PERFORMANCE (Unaudited)
How did the Fund Perform?
For the year ended August 31, 2014, the Fund reported a total return of 23.94%. The S&P 500 Index® had total returns of 25.25% for the same time period. The Fund’s net asset value per share as of August 31, 2014 was $18.60 versus $15.17 at August 31, 2013.
What is the Fund’s investment approach?
The Fund’s investment goal is to achieve maximum returns through investing in undervalued companies. The Fund determines value usually based on price-to-earnings ratios, but also reviews historical price to book value ratios, dividend yield and balance sheet quality in determining whether prospective investments are truly undervalued. The adviser will hold 40 to 50 equities. The Fund seeks to maintain a minimum average market capitalization of $5 billion. The current average market capitalization exceeds $49 billion. The current price earnings ratio is 14.1 times 2015 earnings and currently yields 2.7 percent. The S&P 500 currently trades at 15.8 times 2014 earnings and yields 1.9 percent.
The Fund’s adviser also makes industry determinations based upon interest rate cycles. Historical relationships between short-term and long-term U.S. Treasury securities impact industry weightings as easier money promotes growth in inflation while tight money favors disinflation.
As a general rule, new investments are made based on historical quantitative valuation measures that the Fund deems as undervalued. Conversely, the positions which are sold usually reach quantitative valuation measures that the Fund deems fully or overvalued. Decisions to reduce or sell partial holdings are based on industry overweightings.
The Fund also makes investments for the long-term holding the positions for three to five years unless extraordinary events such as mergers, acquisitions or deterioration of the industry or company.
What influenced the Fund’s performance?
During the year ended August 31, 2014, the Fund achieved its performance as a result of renewed economic activity and the overall strength in the U.S. equity markets. Financial normalcy was a contributing factor to the healthy market returns as basic credit facilities were provided to corporations and risk taking occurred for corporate borrowing. Interest rates have fluctuated in the past twelve months with no clear upward bias. Not until there is robust economic activity, do we anticipate sustained rising interest rates. Deflationary forces have appeared more recently complicating which direction interest rates move.
During the first quarter ending November 30, 2013 the Monteagle Value Fund performed in line with the S&P 500 returning 10.64% versus 11.16% for the S&P 500. The Great Rotation from bonds to stocks began in 2013 as $352 billion went into stock funds and stock ETF’s, while $86 billion left bond funds. The Great Rotation has morphed into Great Return for stocks during the past twenty four months.
MONTEAGLE VALUE FUND
A DISCUSSION OF FUND PERFORMANCE (Unaudited) (Continued)
Economically sensitive issues including energy, commodities, and industrials remained stagnant during the quarter. The Federal Reserve’s QE III was in full swing during the quarter which contributed to the good market performance for overall stock prices.
During the quarter, the Fund sold Dell Computer. The Fund made new investments in Wolseley PLC-ADR, Takeda Pharmaceutical Co-ADR, Exxon Mobil, and Nomura Holdings, Inc.-ADR.
During the second quarter ending February 28, 2014 the Monteagle Value Fund outperformed the S&P 500. During the quarter ended February 28, 2014, the Fund returned 5.37% versus 3.51% for the S&P 500. Federal Reserve policy continued to maintain low short-term interest rates and money is growing at an 8% rate during the quarter. The Fed reduced its purchases to $65 billion in bonds in the open market during this period. The Monteagle Value Fund continues to favor economically sensitive issues and believes that an economic recovery will bid commodity prices higher. The Fund favors industrials, energy and materials industries.
During the quarter the Fund sold Cal-Maine Foods, Chemtura Corp., Barrick Gold, Raytheon Company, Vulcan Materials Co., Nuvasive, Inc., Halliburton Co., and American Railcar Ind. The Fund made investments in Abercrombie & Fitch Co. Cl A, Ford Motor Company, Kulicke & Soffa, Dean Foods, Cooper Tire & Rubber, Freeport McMoran Copper & Gold, Triumph Group, and the Mosaic Company.
During the third quarter ending May 31, 2014 the Monteagle Value Fund slightly outperformed the S&P 500 returning 4.57% versus 3.97%. The market remained resilient with no meaningful correction since 2011. During the quarter, the Federal Reserve announced further tapering through the current QE III reducing purchases to $50 billion per month.
The Monteagle Value Fund continued to favor economically sensitive issues. Economic activity experienced improvement during the quarter and pointed to improving revenue and earnings growth for U.S. corporations.
During the quarter the Fund sold Calgon Carbon Corp., Eastman Chemical, and part of its Merck & Co. position. The Fund made investments in Cirrus Logic, Inc., CVR Energy, D.R. Horton, Republic Services, Inc., and Stepan Co.
During the fourth quarter ending August 31, 2014, the Monteagle Value Fund underperformed versus the S&P 500. During the quarter ended August 31, 2014, the Fund returned 1.66% versus 4.69%. The Fund’s quarterly performance was affected by declines in energy prices impacting the oil positions in the Fund. The Federal Reserve responded to pressure to reduce its purchases in the Open Markets by stating that employment data and inflation targets have not been achieved and that it will remain diligent to continue accommodating liquidity to the financial markets.
During the quarter the Fund reduced positions in Merck & Co. and Textron, Inc. The Fund made investments in Commercial Metals Co., Coach, Inc., and Cliffs Natural Resources.
MONTEAGLE VALUE FUND
A DISCUSSION OF FUND PERFORMANCE (Unaudited) (Continued)
What is the Fund’s current strategy?
The Fund continues to focus on consistency in earnings in its holdings. The Fund remains committed to economically sensitive issues including energy, materials, and industrials. The Fund has a modest overweight in materials, telecommunications, and industrials as the economic recovery continues to sputter and recent Fed policy statements indicated they were concerned that it would be willing to accept higher inflation as it fends off deflationary forces. The Fund is underweight industrials, energy, financials, technology, consumer discretion, and consumer staples. The Fund has increased its holdings into international ADR’s believing the worldwide recovery has begun.
The Fund’s current industry weightings are as follows
| | |
| Industrials | 9.7% | 10.3% |
| Energy | 9.5% | 9.9% |
| Materials | 25.7% | 3.5% |
| Financials | 3.5% | 16.3% |
| Health | 10.0% | 13.9% |
| Technology | 9.3% | 19.4% |
| Telecom | 8.8% | 2.4% |
| Utilities | 6.8% | 3.0% |
| Consumer Discretion | 11.2% | 11.9% |
| Consumer Staples | 2.1% | 9.5% |
| Other Holdings | 3.7% | 0.0% |
Fund performance shown represents the performance of the Fund’s Class I shares. For complete performance information, please refer to the Average Annual Total Return table in the following performance report. Past performance is not predictive of future performance. Investment results and principal value will fluctuate so that shares, when redeemed, may be worth more or less than their original cost. Current performance may be higher or lower than the performance data quoted. Performance data current to the most recent month-end are available by calling 1-888-263-5593.
An investor should consider the investment objectives, risks, charges and expenses of the Fund carefully before investing. The Fund’s prospectus contains this and other important information. To obtain a copy of the Fund’s prospectus please call 1-888-263-5593 and a copy will be sent to you free of charge. Please read the prospectus carefully before you invest. The Fund is distributed by Matrix Capital Group, Inc.
Management’s Discussion of Fund Performance seeks to describe some of the Sub-Adviser’s current opinions and views of the financial markets. Although the Sub-Adviser believes it has a reasonable basis for any opinions or views expressed, actual results may differ, sometimes significantly so, from those expected or expressed.
MONTEAGLE VALUE FUND
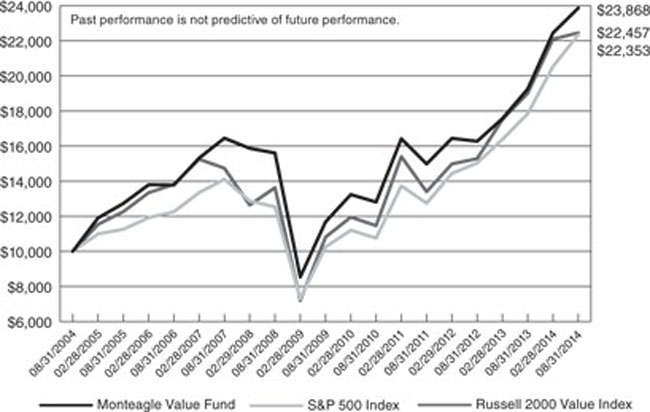
PERFORMANCE — August 31, 2014 (Unaudited)
Comparison of the Change in Value of a $10,000 Investment
in Monteagle Value Fund, the S&P 500 Index and the Russell 2000 Value Index
Average Annual Total Return (for the periods ended August 31, 2014) |
| | | | |
| Monteagle Value Fund | 23.94% | 15.37% | 9.09% |
| S&P 500 Index | 25.25% | 16.89% | 8.38% |
| Russell 2000 Value Index | 18.10% | 15.75% | 8.43% |
The performance information quoted in this annual report assumes the reinvestment of all dividend and capital gain distributions, if any, and represents past performance, which is not a guarantee of future results. The returns shown do not reflect taxes that a shareholder would pay on Fund distributions or on the redemption of Fund shares. The investment return and principal value of an investment will fluctuate and, therefore, an investor’s shares, when redeemed, may be worth more or less than their original cost.
The above graph depicts the performance of the Monteagle Value Fund versus the S&P 500 Index and the Russell 2000 Value Index. The S&P 500 Index by Standard and Poor’s Corp. is a capitalization-weighted index comprising 500 issues listed on various exchanges, representing the performance of the stock market generally. The Russell 2000 Value Index measures the performance of small-cap value segment of the U.S. equity universe. It includes those Russell 2000 companies with lower price-to-book ratios and lower forecasted growth values. Please note that indices do not take into account any fees and expenses of investing in the individual securities that they track, and individuals cannot invest directly in any index.
As with any fund, save an index fund, that commonly compares its performance to the S&P 500 Index and the Russell 2000 Value Index, such a comparison may be said to be inappropriate because of the dissimilarity between the Fund’s investments and the securities comprising the indices; so too with the Monteagle Value Fund, which will not invest in certain securities comprising these indices.
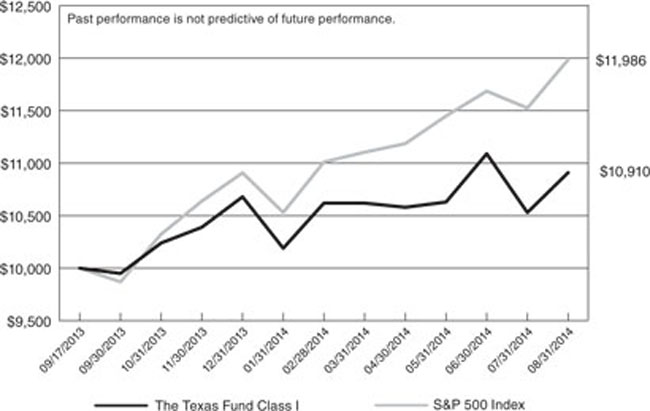
THE TEXAS FUND
A DISCUSSION OF FUND PERFORMANCE (Unaudited)
From inception on September 17, 2013 (Fund Inception) to August 31, 204, The Texas Fund (the “Fund”) had a total return of 9.10%. The S&P 500 Index® (“S&P 500” or “Index”) had a total return of 19.86% for the same period. The Fund’s net asset value per share as of August 31, 2014 was $10.91 versus $10.00 on September 17, 2013.
What is the Fund’s investment approach?
The Fund’s investment goal is long-term capital appreciation. The Fund invests in a broad market capitalization across the various sectors and sizes of the Texas economy keeping 80% or more of the fund invested in companies: 1) headquartered in Texas, 2) organized under Texas state laws, or 3)that derive 50% of revenues or profits or have 50% of their assets in Texas. The adviser limits the pool of stocks considered for purchase to only those equities with market capitalization greater than $1 billion. The adviser also limits the amount in any one sector to less than 25% of the overall portfolio of companies.
In selecting stocks, the Fund’s adviser ranks stocks in each sector. An equal weighting is applied across the rankings for each sector with some weighted more heavily. Company rankings are determined by the Fund after analyzing the financials, valuation, and growth prospects in comparison with their peers in their respective sector. The overall objective is to hold companies for a long term period to allow the capture of their growth within the Texas economy.
Since there are a number of small and mid-cap companies in Texas and the Fund does not give specific preference to large caps, the Fund tends to have an average market capitalization between $4 billion to $6 billion. The Fund also maintains investments across the spectrum of Texas companies from those considered to be value companies to those considered growth companies.
What influenced the Fund’s performance?
During the period from inception to August 31, 2014, the Fund’s performance was affected primarily by a dispersion of large cap returns from small caps. Broad indices such as the S&P 500 that are weighted towards large companies outperformed in the period as small caps became more volatile. This has been considered by some as a “flight to quality”. The Fund’s adviser maintained the investment weighting as is consistent with the strategy of investing across the landscape of Texas based companies.
The first quarter that the Fund was opened, the Texas Fund returned 3.90% compared to the S&P 500 which returned 6.38% while the Russell 3000 Index (“Russell 3000”) was up 6.26%. During the quarter, energy stocks began to pull back in November which negatively affected both small and mid-cap stocks. The downturn was short lived as the small & mid cap stocks recovered from mid- December through the end of the year. When The Texas Fund opened, the Fund steadily invested the cash on hand as the market cycled and were approximately 75% invested in stocks with the remaining 25% in cash as of 9/30/2013. That weighting was held until mid-November and continued to invest more cash and went into the end of the year attempting to maintain 90% or more invested in stocks. The Fund opened small put option positions in the exchange traded funds, MDY and XLE, to provide downside protection.
THE TEXAS FUND
A DISCUSSION OF FUND PERFORMANCE (Unaudited) (Continued)
For the second quarter, The Texas Fund returned 2.21% compared to the S&P 500 which returned 3.51% while the Russell 3000 was up 4.11%. The Fund underperformed the Russell 3000 due to the heaviest weighted sectors; energy, industrials and consumer discretionary. These three sectors underperformed overall markets after having strong performance the prior year. During the quarter, the Fund added weight to companies which the adviser believed would capture more local growth in Texas. The Fund maintained a cash position below 5% during the quarter.
For the third quarter, The Fund returned 0.09% compared to the S&P 500 which returned 3.97% while the Russell 3000 was up 2.85%. Small cap stocks underperformed during the quarter which negatively affected the holdings of the Fund, with the exception being our energy holdings, which performed well despite being weighted to small caps.
For the fourth quarter, the Fund returned 2.63% compared to the S&P 500 which returned 4.69% while the Russell 3000 was up 4.70%. Small cap stocks continued to underperform the broader markets during this quarter which negatively affected the funds position. During this quarter, the adviser graded and rebalanced the portfolio to prepare for the upcoming year. Some positions were eliminated based on the adviser’s grading system which resulted in an increase in average market cap. The reduction in positions was concentrated in the energy sector. The investment team believes with the reduction in energy positions, due to the grading system, the energy portion of the Fund is in a fundamentally stronger position than before. During the fourth quarter the adviser increased put option positions to further hedge energy exposure.
For the entire year the Fund’s adviser maintained exposure to the Texas economy while trying to battle downside pressure from small cap stocks and at times energy. While the Fund underperformed the larger market cap benchmarks, the Fund gave investors at 9.10% return through its first year of existence.
What is the Fund’s strategy?
The Fund will continue to concentrate on Texas based equities in order to take advantage of the Texas business climate and prospects for growth. The Fund’s adviser will continue evaluate and monitor the investment of the Fund to capture the growth in equities in the growing Texas economy. At the current point in time, the Adviser believes the growth of Texas businesses will outpace the overall US and that difference will be passed on to investors. Therefore, the adviser seeks to maintain long term equity positions that grow in market cap with the Texas economy. As Small caps have underperformed over the past year, the adviser is compelled that investors are currently getting a very good value for average future earnings growth estimates when compared the S&P 500 and sees no reason to change the investment approach.
It is anticipated that the Fund may hold higher levels of cash during extended periods of market uncertainty and will selectively increase options positions where the adviser sees a need for additional downside protection.
THE TEXAS FUND
A DISCUSSION OF FUND PERFORMANCE (Unaudited) (Continued)
Fund performance shown represents the performance of the Fund’s Class I shares. For complete performance information, please refer to the Average Annual Total Return table in the following performance report. Past performance is not predictive of future performance. Investment results and principal value will fluctuate so that shares, when redeemed, may be worth more or less than their original cost. Current performance may be higher or lower than the performance data quoted. Performance data current to the most recent month-end, are available by calling 1-888-263-5593.
An investor should consider the investment objectives, risks, charges and expenses of the Fund carefully before investing. The Fund’s prospectus contains this and other important information. To obtain a copy of the Fund’s prospectus please call 1-888-263-5593 and a copy will be sent to you free of charge. Please read the prospectus carefully before you invest. The Fund is distributed by Matrix Capital Group, Inc.
Management’s Discussion of Fund Performance seeks to describe some of the Sub-Adviser’s current opinions and views of the financial markets. Although the Sub-Adviser believes it has a reasonable basis for any opinions or views expressed, actual results may differ, sometimes significantly so, from those expected or expressed.
THE TEXAS FUND
PERFORMANCE — August 31, 2014 (Unaudited)
Comparision of the Change in Value of a $10,000 Investment
in The Texas Fund Class I shares and the S&P 500 Index
Average Annual Total Return (for the periods ended August 31, 2014) |
| | |
| The Texas Fund Class I | 9.10% |
| The Texas Fund Class C with redemption fee | 7.02% |
| The Texas Fund Class C without redemption fee | 8.10% |
| S&P 500 Index | 19.86% |
| (a) | Represents the period from the commencement of operations (September 17, 2013) through August 31, 2014. |
The performance information quoted in this annual report assumes the reinvestment of all dividend and capital gain distributions, if any, and represents past performance, which is not a guarantee of future results. The returns shown do not reflect taxes that a shareholder would pay on Fund distributions or on the redemption of Fund shares. The investment return and principal value of an investment will fluctuate and, therefore, an investor’s shares, when redeemed, may be worth more or less than their original cost.
The above graph depicts the performance of The Texas Fund versus the S&P 500 Index. The S&P 500 Index by Standard and Poor’s Corp. is a capitalization-weighted index comprising 500 issues listed on various exchanges, representing the performance of the stock market generally. Please note that indices do not take into account any fees and expenses of investing in the individual securities that they track, and individuals cannot invest directly in any index.
As with any fund, save an index fund, that commonly compares its performance to the S&P 500 Index, such a comparison may be said to be inappropriate because of the dissimilarity between the Fund’s investments and the securities comprising the index; so too with The Texas Fund, which will not invest in certain securities comprising this index.
MONTEAGLE FIXED INCOME FUND
SUPPLEMENTARY PORTFOLIO INFORMATION — August 31, 2014 (Unaudited)
Top Ten Long-Term Portfolio Holdings | |
| U.S. Treasury Note, 2.00%, due 11/15/2021 | 4.67% |
| U.S. Treasury Note, 1.75%, due 05/15/2022 | 4.57% |
| U.S. Treasury Note, 1.625%, due 08/15/2022 | 4.51% |
| FHLMC, 4.875%, due 06/13/2018 | 2.65% |
| U.S. Treasury Note, 3.125%, due 05/15/2021 | 2.52% |
| U.S. Treasury Note, 2.125%, due 08/15/2021 | 2.36% |
| Federal Farm Credit Banks, 2.64%, due 08/12/2021 | 2.35% |
| AT&T, Inc., 5.800%, due 02/15/2019 | 2.05% |
| Chubb Corp., 5.75%, due 05/15/2018 | 2.01% |
| Cisco Systems, Inc., 4.95%, due 02/15/2019 | 1.98% |
| |
| Corporate Bonds | 58.07% |
| U.S. Government and Agency Obligations | 28.99% |
| Money Market Funds | 7.98% |
| Mortgage-Backed Securities | 4.41% |
| Other Assets in Excess of Liabilities | |
| | |
MONTEAGLE INFORMED INVESTOR GROWTH FUND
SUPPLEMENTARY PORTFOLIO INFORMATION — August 31, 2014 (Unaudited)
Top Ten Long-Term Portfolio Holdings | |
| Powershares QQQ Trust Series 1 | 6.09% |
| Gilead Sciences, Inc. | 5.58% |
| Salix Pharmaceuticals Ltd. | 5.13% |
| Vipshop Holdings Ltd. - ADR | 5.10% |
| Trinity Industries, Inc. | 5.09% |
| Spirit Airlines, Inc. | 4.64% |
| Southwest Airlines Co. | 4.62% |
| Skyworks Solutions, Inc. | 4.61% |
| Universal Health Services, Inc. | 4.57% |
| United Rentals, Inc. | 4.54% |
Top Ten Portfolio Industries | |
| Internet | 11.84% |
| Airlines | 10.56% |
| Pharmaceuticals | 10.23% |
| Commercial Services | 7.96% |
| Biotechnology | 7.60% |
| Auto Parts & Equipment | 5.20% |
| Miscellaneous Manufacturing | 5.09% |
| Semiconductors | 4.61% |
| Healthcare - Services | 4.57% |
| Retail | |
| | |
Economic Sectors with Cash and Other Assets | |
| Consumer, Non-cyclical | 31.48% |
| Consumer, Cyclical | 27.90% |
| Money Market Funds | 12.39% |
| Communications | 11.84% |
| Exchange Traded Funds | 8.06% |
| Industrial | 5.09% |
| Technology | 4.61% |
| Energy | 1.13% |
| Liabilities in Excess of Other Assets | |
| | |
MONTEAGLE QUALITY GROWTH FUND
SUPPLEMENTARY PORTFOLIO INFORMATION — August 31, 2014 (Unaudited)
Top Ten Long-Term Portfolio Holdings | |
| Apple, Inc. | 6.37% |
| Walt Disney Co. | 3.85% |
| Home Depot, Inc. | 2.98% |
| Coca-Cola Co. | 2.93% |
| BlackRock, Inc. | 2.92% |
| QUALCOMM, Inc. | 2.87% |
| Roper Industries, Inc. | 2.82% |
| Goldman Sachs Group, Inc. | 2.74% |
| Baxter International, Inc. | 2.63% |
| Express Scripts Holding Co. | 2.50% |
Top Ten Portfolio Industries | |
| Retail | 12.35% |
| Computers | 8.24% |
| Internet | 6.61% |
| Media | 5.60% |
| Banks | 5.23% |
| Diversified Financial Services | 4.91% |
| Biotechnology | 4.52% |
| Pharmaceuticals | 4.31% |
| Telecommunications | 3.47% |
| Food | |
| | |
Economic Sectors with Cash and Other Assets | |
| Consumer, Non-cyclical | 19.72% |
| Consumer, Cyclical | 19.33% |
| Communications | 15.69% |
| Financial | 12.75% |
| Industrial | 12.42% |
| Technology | 12.26% |
| Energy | 3.34% |
| Basic Materials | 2.69% |
| Money Market Funds | 1.77% |
| Other Assets in Excess of Liabilities | |
| | |
MONTEAGLE SELECT VALUE FUND
SUPPLEMENTARY PORTFOLIO INFORMATION — August 31, 2014 (Unaudited)
Top Ten Long-Term Portfolio Holdings | |
| Humana, Inc. | 4.02% |
| WellPoint, Inc. | 3.58% |
| Applied Materials, Inc. | 3.18% |
| Raytheon Co. | 2.92% |
| Whirlpool Corp. | 2.90% |
| Allegheny Technologies, Inc. | 2.81% |
| Baker Hughes, Inc. | 2.76% |
| CVS Health Corp. | 2.73% |
| Rowan Cos. PLC | 2.65% |
| H&R Block, Inc. | 2.60% |
Top Ten Portfolio Industries | |
| Retail | 13.00% |
| Oil & Gas | 9.55% |
| Healthcare - Services | 7.61% |
| Commercial Services | 4.83% |
| Computers | 4.49% |
| Banks | 4.42% |
| Aerospace & Defense | 4.31% |
| Iron & Steel | 3.52% |
| Transportation | 3.20% |
| Semiconductors | |
| | |
Economic Sectors with Cash and Other Assets | |
| Money Market Funds | 20.52% |
| Consumer, Cyclical | 18.36% |
| Consumer, Non-cyclical | 17.16% |
| Energy | 12.31% |
| Industrial | 11.03% |
| Financial | 10.74% |
| Technology | 8.91% |
| Basic Materials | 3.52% |
| Utilities | 1.86% |
| Communications | 0.86% |
| Liabilities in Excess of Other Assets | |
| | |
MONTEAGLE VALUE FUND
SUPPLEMENTARY PORTFOLIO INFORMATION — August 31, 2014 (Unaudited)
FUND PROFILE:
Top Ten Long-Term Portfolio Holdings | |
| EI du Pont de Nemours & Co. | 3.41% |
| AT&T, Inc. | 3.35% |
| International Paper Co. | 3.25% |
| Duke Energy Corp. | 3.02% |
| Verizon Communications, Inc. | 2.87% |
| Intel Corp. | 2.85% |
| Merck & Co., Inc. | 2.64% |
| Abercrombie & Fitch Co. - Class A | 2.60% |
| Cooper Tire & Rubber Co. | 2.51% |
| Bristol-Myers Squibb Co. | 2.43% |
Top Ten Portfolio Industries | |
| Telecommunications | 9.79% |
| Oil & Gas | 9.42% |
| Chemicals | 9.35% |
| Semiconductors | 7.16% |
| Pharmaceuticals | 6.16% |
| Iron & Steel | 4.73% |
| Electric | 4.64% |
| Retail | 4.10% |
| Healthcare - Products | 4.03% |
| Forest Products & Paper | |
| | |