Washington, D.C. 20549
The Annual report to Shareholders for the period ended August 31, 2015 pursuant to Rule 30e-1 under the Investment Company Act of 1940 (the “1940 Act”), as amended (17 CFR 270.30e-1) is filed herewith.
Letter from the President | 3 |
A Discussion of Fund Performance | 4 |
Supplementary Portfolio Information | 34 |
Financial Statements of the Monteagle Funds | |
Schedules of Investments: | |
Fixed Income Fund | 40 |
Informed Investor Growth Fund | 44 |
Quality Growth Fund | 46 |
Select Value Fund | 50 |
Value Fund | 53 |
The Texas Fund | 56 |
Statements of Assets and Liabilities | 62 |
Statements of Operations | 64 |
Statements of Changes in Net Assets | 66 |
Financial Highlights | 72 |
Notes to Financial Statements | 79 |
Report of Independent Registered Public Accounting Firm | 99 |
Other Information | 100 |
About Your Funds’ Expenses | 101 |
Trustees and Officers of the Trust | 104 |
Compensation of Trustees and Officers | 106 |
LETTER FROM THE PRESIDENT (Unaudited) |

Dear Shareholders:
Enclosed is the Annual Report for the Monteagle Funds. I encourage you to carefully review the information presented in this Annual Report as it contains valuable information about your investment.
As you will notice in reviewing the Annual Report, we continue to uncover opportunities in high quality, solid credit and attractive valuation areas.
As we reflect on this past fiscal year, we continue to see several headlines during the period, such as continued slow economic recovery, civil unrest, an uncertain domestic political environment, arguments over federal monetary policy, that all had a dramatic effect on the markets in which the Monteagle Funds invest. Despite the volatility that these headlines have created in the day-to-day stock markets, we have often said that we view investing as a marathon, not a sprint. As a result, we remain optimistic as we expect that the effect of some of these events will be short-lived although others may take longer to work their way through the system. We believe that remaining disciplined with a longer-term focus will benefit patient investors.
In closing, we would like to thank you for your continued confidence and support of the Monteagle Funds.
Sincerely,
MONTEAGLE FUNDS

Paul B. Ordonio, JD
President
MONTEAGLE FIXED INCOME FUND
A DISCUSSION OF FUND PERFORMANCE (Unaudited) |
How did the Fund Perform?
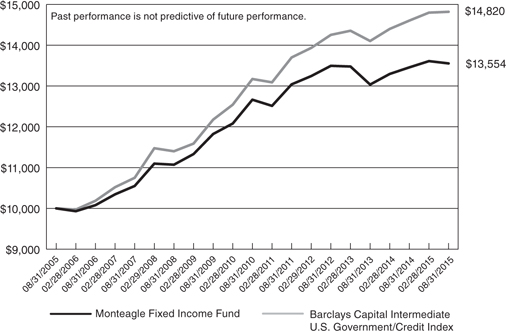
The Monteagle Fixed Income Fund (the “Fund”) had positive performance during the year. For the year ended August 31, 2015, the Fund had a total return of 0.72%. For the three, and six month periods ending August 31, 2015, the Fund had total returns of -0.54% and -0.42% respectively. The returns were primarily driven by deteriorating credit market conditions, rising short-term interest rates and modestly declining longer term interest rates over the fiscal year.
The Fund’s benchmark index (The Barclay’s Capital Intermediate Government/Credit Index) had relative returns of 1.47%, -0.33%, and 0.14% for the twelve, three, and six month periods, ending August 31, 2015, respectively.
What Influenced Fund Performance?
This past fiscal year ending August 2015, can best be described as volatile. Price volatility for fixed income securities is usually negatively correlated to uncertainty. In other words, as uncertainty increases, prices decrease (bond yields increase) and vice versa. However, within the context of uncertainty, various types of risk did impact Fund performance differently. This past year was characterized by increased uncertainty about inflation risk and its impact on real economic growth, as well as, uncertainty surrounding credit conditions for corporations and sovereign nations that also had a direct impact on fund performance.
Notwithstanding the much anticipated change in monetary policy actions by the Federal Reserve Bank (U.S. Central Bank – “the Fed”), longer term interest rates decreased while shorter term interest rates increased to reflect those changes to monetary policy. The chart below illustrates how interest rates on U.S. Treasury securities have changed over the fiscal year. The chart shows the progression of rates on a quarterly basis throughout the year.
U.S.
Treasury
Note | August
2014
Rates | November
2014
Rates | February
2015
Rates | May
2015
Rates | August
2015
Rates |
2 Year | 0.48 | 0.47 | 0.63 | 0.61 | 0.74 |
3 Year | 0.94 | 0.88 | 1.01 | 0.94 | 1.07 |
5 Year | 1.63 | 1.47 | 1.50 | 1.49 | 1.54 |
7 Year | 2.05 | 1.89 | 1.82 | 1.86 | 1.94 |
10 Year | 2.35 | 2.18 | 2.00 | 2.12 | 2.21 |
30 Year | 3.09 | 2.62 | 2.38 | 2.63 | 2.64 |
The movement in interest rates is usually an indication of the market’s expectation for growth, and with growth, we can also expect a certain amount of inflation. Additionally, monetary policy affected by the Federal Reserve Board (through the Fed funds overnight lending rate) does have an impact on the market structure of interest rates. The above chart illustrates how the bond market has responded to the end of asset purchases known as QE (quantitative easing) in October 2014 and the subsequent guidance provided by the Federal Reserve Board throughout the year that the Fed funds rate would most likely move from the 0 – 0.25% range in the 2nd half of 2015.
MONTEAGLE FIXED INCOME FUND
A DISCUSSION OF FUND PERFORMANCE (Unaudited) (Continued) |
We can see that interest rates on the shorter end of the Treasury curve have increased slightly over the year, while rates on the longer end of the Treasury curve have declined. These movements in interest rates have had a mixed effect on performance. For those securities within the portfolio that have maturities of less than five years, relative performance has been slightly diminished. For those securities within the portfolio that have maturities greater than five years, the relative performance has been enhanced. Overall, portfolio performance has benefitted from the movement of interest rates over the last fiscal year.
In addition to monetary policy, portfolio performance has also been affected by economic growth, both, in the United States and globally. The U.S. economic growth rate as measured by the Real Gross Domestic Product (GDP) over the last year has been volatile. The 3rd quarter 2014 annualized rate of growth was 5.00%, but was followed by weaker estimates of growth. For the 4th quarter of 2014 it was 2.20%, 1st quarter of 2015, -0.20%, and the latest estimate of 2nd quarter 2015 growth, 3.70%. Some other major economies have had weaker readings of growth. The Eurozone’s last reading showed GDP year over year growth as of the 2nd quarter of 2015 of just 1.2%. Other Eurozone member nations such as Italy, France, Spain, and Germany had growth rates of 0.5%, 1.0%, 3.1%, and 1.6% respectively. Emerging market economies such as the so called BRICS (Brazil, Russia, India, China, and South Africa) are also struggling overall. Brazil and Russia are in recession with GDP year over year readings (as of 2nd quarter 2015) of -2.6% and -4.6% respectively. South Africa is still exhibiting positive growth at 1.2% year over year. India and China are still showing significant growth both above 7%, but at a slowing pace. As the market contemplates whether potential economic growth will accelerate or not, longer term interest rates will adjust higher or lower depending on what impact growth would have on labor markets, consumption, and inflation. This past year weaker growth rates have favored bonds of longer maturities. As previously mentioned, declining longer term interest rates had an overall positive affect on the portfolio’s performance.
Along with economic growth, the market has paid close attention to the health of the labor market. Improvement in labor statistics has positive implications for economic growth and direct implications for Federal Reserve monetary policy. During the course of this past fiscal year the economy created approximately 240,000 jobs per month. The unemployment rate has declined from 6.2% to 5.3% and the under-employment rate1 from 12.0% to 10.4%. However, while improvements in some statistics have provided some impetus for economic growth, there are other measurements that are not necessarily as strong and give an uncertain picture of future economic growth expectations.
With unemployment at 5.3% and approaching what historically would be considered the natural rate of unemployment, why has our economy failed to produce higher growth rates? The health of our Labor market can no longer be defined by the unemployment rate alone. We need to acknowledge that we still have a sizeable number of people that are working part-time who wish to be working full-time. The underemployment rate is still 10.4%. We also have the lowest labor
1 | (Total unemployed, plus all persons marginally attached to the labor force, plus total employed part time for economic reasons, as a percent of the civilian labor force plus all persons marginally attached to the labor force) |
MONTEAGLE FIXED INCOME FUND
A DISCUSSION OF FUND PERFORMANCE (Unaudited) (Continued) |
participation rate since 1977. Wage growth is less than spectacular at 2.2% year over year. The average number of weekly hours worked is pretty stagnate at 34.6. So, while our economy has added jobs at a fairly decent pace since the recession ended, they are not high paying jobs and wage inflation is benign.
We believe that altogether the labor markets have had a modest negative impact on the Fund’s performance, primarily as it has affected the outlook for future monetary policy and increased short-term interest rates.
Another important variable that has, and will continue to impact portfolio performance, is expected inflation. Inflation measurements for much of the year have been well below the Fed’s implicit long-range target for price stability of 2%. The last reading of the CPI (Consumer Price Index) during the fiscal year, measured only 0.2% year over year, while the core CPI (less food and energy) increased 1.8%. While the trend for inflation has decreased over the last year, much of the decrease to CPI is from volatile decline in energy prices. Furthermore, inflation expectations as measured by the difference in yields between U.S. Treasury Notes and U.S. Inflation Protected Treasury Securities (TIPS) are also well below the 2% long-range Fed target. For the 5-year Notes, the difference is 1.33% and for 10-year Notes, the difference is 1.64%. We don’t believe that inflation had a material impact on Fund’s performance over the year. Actually, declining inflation had more of a positive impact on the Fund’s performance due to marginally longer duration than the benchmark index.
Credit conditions in the corporate bond market have deteriorated over the year. The tables that follow clearly indicate that higher quality bonds outperformed those of lower quality within the investment grade spectrum of fixed income securities. The biggest contributing factor to the underperformance of credit has to do with collapsing commodity prices for the better part of the year. The most widely used commodity that has had an impact on inflation measures, as well as credit, is petroleum or oil. While declining oil prices are a positive contributor to net importers of oil, they are a major problem for net exporters. Energy prices declining can be partially attributable to weaker demand from China, but most of the declines come from increased global supply. So, countries such as Russia, Brazil, and Canada have seen substantial negative impacts from these declines. As mentioned previously, both Russia and Brazil are currently in economic recessions, while Canada’s year over year GDP growth is just 0.5%. All of these countries rely heavily on net energy exports. As a result, this sector of the fixed income and equity markets has seen asset values decline and risk premiums increase, especially for heavily indebted energy exploration companies.
Our responses to these events have primarily been a disciplined approach to a high quality portfolio profile. We remain committed to the fund’s strategy of holding a well-diversified portfolio of high quality bonds. We believe that the markets have rewarded our patience and prudence. However, we have made some changes over the last year.
MONTEAGLE FIXED INCOME FUND
A DISCUSSION OF FUND PERFORMANCE (Unaudited) (Continued) |
| | ● | During the course of the year we increased the Fund’s market allocation to Mortgage-Backed Securities while modestly increasing the Fund’s allocation to Government securities. We decreased the Fund’s allocation to investment grade intermediate corporate bonds to 51% from 59% of the portfolio. As can be seen from the following table, the Fund’s decision to increase the allocation to Mortgage-Backed securities, while decreasing exposure to corporate bonds did contribute positively to relative performance. |
Comparative Market Sector Weights
Monteagle Fixed Income Fund
August 31, 2014 | August 31, 2015 |
| | |
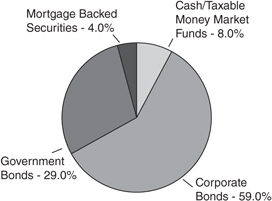 |  |
Index | Return for Period |
U.S. Treasury: Intermediate | 1.90% |
U.S. Agency Intermediate | 1.77% |
Intermediate Corporate | 0.76% |
Invest. Grade: Industrial — Intermediate | 0.25% |
Invest. Grade: Financial Institutions — Intermediate | 1.44% |
Fixed Rate Mortgage Backed Securities | 2.68% |
| | ● | Portfolio duration decreased slightly over last year. As of August 31, 2015 the Fund’s portfolio duration was 4.2 years (including cash) compared to the portfolio duration of 4.6 years at 2014 fiscal year end. Maturity decreased slightly from 5.0 years at 2014 fiscal year end to 4.83. When compared to the duration and weighted average maturity of 3.95 and 4.29, of the Barclay’s Intermediate Government/Credit index, the Fund’s portfolio is longer in both measures. We do not believe that the maturity structure of the Fund’s portfolio, relative to the benchmark index, had either positive or negative effects on relative performance. The following chart illustrates the performance of various maturity ranges within the Barclay’s Intermediate Government/Credit index. As we can see, bonds in the 3-7 year maturity range outperformed those having shorter |
MONTEAGLE FIXED INCOME FUND
A DISCUSSION OF FUND PERFORMANCE (Unaudited) (Continued) |
and/or longer maturities. The portfolio’s securities mature in less than 10 years with the highest percentage maturing in the 3 to 5 year range (33.6%). 22.6% of the Fund’s assets mature in less than 3 years, 66.1%% in 3 to 7 years, and 11.3% in 7 to 10 years.
Intermediate U.S. Government/Credit (Returns, Unhedged) Maturity Sectors | 1 yr.
Total
Return | 6 month
Total
Return | 3 month
Total
Return |
All Maturities | 1.47% | 0.14% | -0.33% |
1 - 3 yrs. | 0.81% | 0.36% | -0.03% |
3 - 5 yrs. | 2.01% | 0.71% | -0.08% |
5 - 7 yrs. | 2.30% | 0.20% | -0.46% |
7 - 10 yrs. | 1.52% | -1.42% | -1.30% |
Comparative Credit Quality
Monteagle Fixed Income Fund
Moody’s Ratings August 29, 2014 | Moody’s Ratings August 31, 2015 |
| |
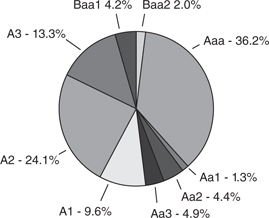 | 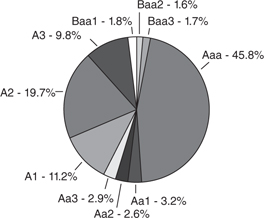 |
| | ● | The preceding charts represent the credit quality distribution of the fund’s securities holdings (not including cash or money market securities) at the beginning and end of this past fiscal year. For consistency of the relative analysis, in our distribution comparison above, we have only included the ratings provided by Moody’s (and not S&P, which rates U.S. Government obligations AA+). The Barclay’s benchmark index still maintains ratings of AAA on U.S. Government obligations. |
| | ● | The overall credit quality of the portfolio marginally increased over the course of the year. Our decreasing of corporate bonds and increasing of Mortgage-Backed securities, as well as Government bonds has increased quality slightly. Overall credit quality remains excellent with ratings of AA-/Aa3. |
MONTEAGLE FIXED INCOME FUND
A DISCUSSION OF FUND PERFORMANCE (Unaudited) (Continued) |
| | ● | We would also note that at the end of this fiscal year, the Fund’s portfolio contained investment grade securities rated below A3/A-. While we are restricted from investing in securities rated below A3/A- at time of purchase, we do have the discretion of holding securities rated Baa/BBB should the rating be the result of a downgrade. It is our opinion that the securities in question do not materially affect the overall credit quality of the Fund’s portfolio and do not represent significant credit risk to portfolio value. The following table specifically identifies the securities in question. |
| MOODY
RTG | S&P
RTG | % of
Portfolio
Market Value |
AT&T, Inc., 5.80%, due 02/15/19 | Baa1 | BBB+ | 1.67% |
Allergan, Inc., 5.75%, due 04/01/16 | Baa3 | BBB-/*+ | 1.58% |
Becton Dickinson & Co, 3.125%, due 11/08/21 | Baa2 | BBB+ | 1.50% |
Total | | | 4.76% |
| | ● | The following table provides a summary illustration of how investment grade bonds of varying credit quality have performed over the past year. These are returns of bonds in the Barclay’s Intermediate U.S. Government/Credit index. The relative performance of credit is indicative of the risk/reward nature of these bonds. We can see that for the full year higher quality bonds had a performance advantage over those of lesser quality. As such, the performance of the Fund did benefit from the higher returns associated with Aaa and Aa rated bonds. |
| 1 yr.
Total Return | 6 month
Total Return | 3 month
Total Return |
Aaa | 1.87% | 0.54% | 0.05% |
Aa | 1.63% | 0.04% | -0.34% |
A | 1.37% | -0.30% | -0.62% |
Baa | -0.19% | -1.11% | -1.65% |
Total | 1.47% | 0.14% | -0.33% |
| | ● | For the year, trading was primarily driven by repositioning the Fund’s portfolio to reduce credit exposure and increase allocations to Mortgage-Backed and Government securities. We did realize on longer term gains by selling some of our more seasoned corporate bonds. In capturing some of the portfolio gains, we did sell bonds having higher coupons with shorter maturities and replaced with Mortgage-Backed and Government bonds having lower coupons. However, overall portfolio’s average coupon was slightly higher than at the end of 2014 fiscal year end; 3.26% versus 3.03%. |
MONTEAGLE FIXED INCOME FUND
A DISCUSSION OF FUND PERFORMANCE (Unaudited) (Continued) |
What is the Fund’s Strategy?
The Fund will continue to invest in high quality intermediate term fixed income securities generally between 2 and 10 years in maturity. The Fund will continue to monitor economic conditions through the use of a proprietary model in an attempt to anticipate interest rate changes and lengthen or shorten the duration of the Fund’s portfolio of securities to maximize total return with minimal risk. The Fund will also actively manage portfolio holdings across market sectors in order to maximize total return within the scope of permitted investments defined by the Fund’s prospectus. While we have taken prudent steps to diversify the Fund’s assets by limiting exposure to the credit and interest rate risk associated with any one specific issuer, market sector, or maturity range, those risks cannot be completely eliminated without affecting long-term Fund performance. We remain vigilant and will act in your best interest to preserve the Fund’s asset values.
Fund performance shown represents the performance of the Fund’s Class I shares. For complete performance information, please refer to the Average Annual Total Return table in the following performance report. Past performance is not predictive of future performance. Investment results and principal value will fluctuate so that shares, when redeemed, may be worth more or less than their original cost. Current performance may be higher or lower than the performance data quoted. Performance data current to the most recent month-end, are available by calling 1-888-263-5593.
An investor should consider the investment objectives, risks, charges and expenses of the Fund carefully before investing. The Fund’s prospectus contains this and other important information. To obtain a copy of the Fund’s prospectus please call 1-888-263-5593 and a copy will be sent to you free of charge. Please read the prospectus carefully before you invest. The Fund is distributed by Matrix Capital Group, Inc.
Management’s Discussion of Fund Performance seeks to describe some of the Sub-Adviser’s current opinions and views of the financial markets. Although the Sub-Adviser believes it has a reasonable basis for any opinions or views expressed, actual results may differ, sometimes significantly so, from those expected or expressed.
MONTEAGLE FIXED INCOME FUND
PERFORMANCE — August 31, 2015 (Unaudited) |
Comparison of the Change in Value of a $10,000 Investment in Monteagle Fixed Income Fund
and the Barclays Capital Intermediate U.S. Government/Credit Index
Average Annual Total Return
(for the periods ended August 31, 2015) |
| | One Year | Five Years | Ten Years | |
Monteagle Fixed Income Fund | 0.72% | 1.37% | 3.09% | |
Barclays Capital Intermediate U.S. Government/Credit Index | 1.47% | 2.38% | 4.01% | |
The performance information quoted in this annual report assumes the reinvestment of all dividend and capital gain distributions, if any, and represents past performance, which is not a guarantee of future results. The returns shown do not reflect taxes that a shareholder would pay on Fund distributions or on the redemption of Fund shares. The investment return and principal value of an investment will fluctuate and, therefore, an investor’s shares, when redeemed, may be worth more or less than their original cost.
The above graph depicts the performance of the Monteagle Fixed Income Fund versus the Barclays Capital Intermediate U.S. Government/Credit Index (formerly Lehman Brothers U.S. Intermediate Government/Credit Index). The Barclays Capital Intermediate U.S. Government/Credit Index measures the performance of dollar denominated U.S. Treasuries, government-related (i.e. U.S. and foreign agencies, sovereign, supranational and local authority debt), and investment grade credit structures that have a remaining maturity of greater than or equal to one year and less than ten years. Please note that indices do not take into account any fees and expenses of investing in the individual securities that they track, and individuals cannot invest directly in any index.
As with any fund, save an index fund, that commonly compares its performance to the Barclays Capital Intermediate U.S. Government/Credit Bond Index, such a comparison may be said to be inappropriate because of the dissimilarity between the Fund’s investments and the securities comprising the index; so too with the Monteagle Fixed Income Fund, which will not invest in certain securities comprising this index.
MONTEAGLE INFORMED INVESTORS GROWTH FUND
A DISCUSSION OF FUND PERFORMANCE (Unaudited) |
How did the Fund Perform?
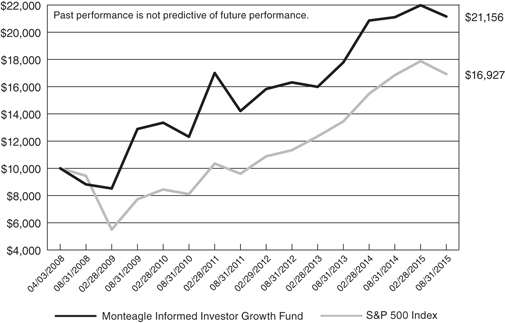
The Monteagle Informed Investor Growth Fund (Fund) returned a slightly positive 0.24% for the fiscal year ending August 31, 2015. The S&P 500 Index (S&P), the Fund’s benchmark, rose 0.48%.
What is the Fund’s Investment Approach?
The Fund invests primarily in medium capitalization stocks (median, generally around $15 billion) of well-managed, financially sound companies, offering under-valued earnings growth rate, earnings yield and earnings surprise momentum, superior return on investment capital and cash flow growth opportunities. These are companies in which management or large and informed investors - - individuals and/or funds - - are significant common stock owners or buyers, or where the company itself is repurchasing its own shares on the open market. This investment discipline is widely recognized as The Informed Investor Strategy - - now marking its 60th year of institutional portfolio management success.
Summarizing, these companies qualify for intensive research analysis only if they meet at least one of these five first-screen qualifying selection tests:
| | 1. | The company’s officers and directors are buying its common stock on the open market. |
| | 2. | A major outside investor (minimum 5% shares outstanding owned) has filed a Form 13-D purchase disclosure on the company’s stock. |
| | 3. | The company has announced its intent to repurchase its common stock on the open market. |
| | 4. | A significant percentage of the company’s stock is owned by family/management. |
| | 5. | The current top performing equity mutual funds and/or equity-orientated hedge funds are accumulating the company’s common stock on the open market. |
The buy disciplines are matched by a series of five sell disciplines. They are:
| | 1. | Begin selling if a stock drops a minimum of 8% from an average-cost basis. |
| | 2. | Begin selling when a holding-high loss-limit is triggered. (Stock falls a minimum of 14% from its portfolio holding-high price.) |
| | 3. | Begin selling on preliminary, but confirmed, indications of a breakdown in a company’s financials. |
| | 4. | Possibly selling when informed investors stock transaction signals turn bearish. |
| | 5. | Sell partial positions of a portfolio stock after an unusually day-to-day sharp price run-up. |
MONTEAGLE INFORMED INVESTORS GROWTH FUND
A DISCUSSION OF FUND PERFORMANCE (Unaudited) (Continued) |
What Influenced the Fund’s Performance?
The Fund returned a negative 2.9% for the first fiscal quarter ending November 30, 2014. The S&P 500 Index, the Fund’s benchmark, posted a return of +3.7%. The Fund’s investment return was influenced during its first fiscal quarter by negative performance in three sectors: Energy, Consumer Discretionary and Industrials.
| | o | Declining stocks in the Consumer Discretionary sector included Harman (HAR) -17.8%, Tesla (TSLA) -10.9% and Netflix (NFLX) -10.2%. |
| | o | The Energy sector held Continental Resource (CLR) which was the major problem stock, losing -15.1%. |
| | o | The Industrial sector was negatively impacted by losses in Spirit Airlines (SAVE) -15.6% and Trinity (TRN) down 18.1%. |
The Fund returned a positive 7.3% for the second fiscal quarter ending February 28, 2015. The S&P 500 Index, the Fund’s benchmark, posted a return of +2.3%. The Fund’s investment return was influenced during this time by positive performance in four sectors: Information Technology, Consumer Staples, Consumer Discretionary and Healthcare.
| | o | The Information Technology sector’s advancing stocks included Avago Technologies (AVGO) +36.6%, Electronic Arts (EA) +30.2%, and Skyworks Solutions (SWKS) +30.1%. |
| | o | The Consumer Staple sector’s advancing stock was Monster Beverage (MNST) +19.1%. |
| | o | The Consumer Discretionary sector included Domino’s Pizza (DPZ) +8.2% and Lowes (LOW) +7.4%. |
| | o | The Healthcare sector’s advancing stocks were Centene (CNC) +24.5% and Valeant Pharmaceutical (VRX) +22.7%. |
The Fund returned a positive 5.8% for the third fiscal quarter ending May 31, 2015. The S&P 500 Index, the Fund’s benchmark, posted a return of +0.6%. The Fund’s investment return was influenced during its third fiscal quarter by positive performance in two sectors: Health Care and Information Technology.
| | o | The Healthcare sector’s advancing stocks were Centene (CNC) +22.6, Biomarin (BMRN) +12.0% and Cigna (CI) +14.8%. |
| | o | The Information Technology sector held NXP Semiconductor (NXPI) +32.5%, Palo Alto (PANW) +19.2% and Avago (AVGO) +16.0%. |
The Fund returned a negative 9.0% for the fourth fiscal quarter ending August 31, 2015. The S&P 500 Index, the Fund’s benchmark, posted a return of – 5.9%. The Fund’s investment return was influenced during its third fiscal quarter by negative performance in two sectors: Health Care and Information Technology.
| | o | The Health Care Sector returned a negative 6.9% for the quarter. Declining stocks in the sector included: Mallinkrodt (MNK) -22.5% and Medivation (MDVN) -14.8% |
MONTEAGLE INFORMED INVESTORS GROWTH FUND
A DISCUSSION OF FUND PERFORMANCE (Unaudited) (Continued) |
| | o | The Information Technology Sector returned a negative 7.5%. Declining stocks in the sector included: Intuit (INTU) -18.0% and Nxp Semiconductor (NXPI) -17.0%. |
The top five holdings that influenced the fund’s performance positively for the fiscal year were Avago Technologies (AVGO) +52.2%, Palo Alto Networks (PANW) +49.2%, Skechers (SKX) +49.2%, Electronic Arts (EA) +45.3 and Skyworks (SWKS) +43.9%. Four of the five stocks are in the Information Technology Sector.
The five equity holdings contributing the least to the Fund’s performance for the full fiscal-year were: Akorn (AKRX) -23.3%, Intuit (INTU) -21.4%, Illumina (ILMN) -21.0%, Old Dominion Freight (ODFL) -20.4% and Universal Health Services (UHS) -18.5. Three of the five stocks are in the Health Care Sector
The total performance return for the portfolio was aided by the results of the two ETF holdings: S&P 500 Trust Index (SPY), up 10.8%, and the Nasdaq Power Shares Trust (QQQ), up 9.9%. ETFs’ are used when we believe stock picks are limited due to market variations.
Also, as of the August 31, 2015 fiscal year-end, the Fund held 32% in cash. This holding was viewed as a neutral influence on performance during the fiscal year.
Finally, the Fund’s fiscal year ended with some continuing economic bright spots: a positive housing outlook, re-surging auto sales and low interest rates.
What is the Fund’s Strategy?
The current strategy of the Monteagle Informed Investors Growth Fund is bullish in outlook and the intention is to remain virtually fully invested in a select list of uniquely attractive growth stocks that fulfill the rigid Informed Investors growth stock criteria. Positions in cash and ETFs remain a secondary consideration, and are quite subordinate to stock selection priorities.
Fund performance shown represents the performance of the Fund’s Class I shares. For complete performance information, please refer to the Average Annual Total Return table in the following performance report. Past performance is not predictive of future performance. Investment results and principal value will fluctuate so that shares, when redeemed, may be worth more or less than their original cost. Current performance may be higher or lower than the performance data quoted. Performance data current to the most recent month-end are available by calling 1-888-263-5593.
An investor should consider the investment objectives, risks, charges and expenses of the Fund carefully before investing. The Fund’s prospectus contains this and other important information. To obtain a copy of the Fund’s prospectus please call 1-888-263-5593 and a copy will be sent to you free of charge. Please read the prospectus carefully before you invest. The Fund is distributed by Matrix Capital Group, Inc.
Management’s Discussion of Fund Performance seeks to describe some of the Sub-Adviser’s current opinions and views of the financial markets. Although the Sub-Adviser believes it has a reasonable basis for any opinions or views expressed, actual results may differ, sometimes significantly so, from those expected or expressed.
MONTEAGLE INFORMED INVESTOR GROWTH FUND
PERFORMANCE — August 31, 2015 (Unaudited) |
Comparison of the Change in Value of a $10,000 Investment
in Monteagle Informed Investor Growth Fund and the S&P 500 Index
Average Annual Total Return
(for the periods ended August 31, 2015) |
| | One Year | Five Years | Since
Inception(a) | |
Monteagle Informed Investor Growth Fund | 0.24% | 11.42% | 10.64% | |
S&P 500 Index | 0.48% | 15.86% | 7.36% | |
(a) | Represents the period from the commencement of operations (April 3, 2008) through August 31, 2015. |
The performance information quoted in this annual report assumes the reinvestment of all dividend and capital gain distributions, if any, and represents past performance, which is not a guarantee of future results. The returns shown do not reflect taxes that a shareholder would pay on Fund distributions or on the redemption of Fund shares. The investment return and principal value of an investment will fluctuate and, therefore, an investor’s shares, when redeemed, may be worth more or less than their original cost.
The above graph depicts the performance of the Monteagle Informed Investor Growth Fund versus the S&P 500 Index. The S&P 500 Index by Standard and Poor’s Corp. is a capitalization-weighted index comprising 500 issues listed on various exchanges, representing the performance of the stock market generally. Please note that indices do not take into account any fees and expenses of investing in the individual securities that they track, and individuals cannot invest directly in any index.
As with any fund, save an index fund, that commonly compares its performance to the S&P 500 Index, such a comparison may be said to be inappropriate because of the dissimilarity between the Fund’s investments and the securities comprising the index; so too with the Monteagle Informed Investor Growth Fund, which will not invest in certain securities comprising this index.
MONTEAGLE QUALITY GROWTH FUND
A DISCUSSION OF FUND PERFORMANCE (Unaudited) |
How did the Fund perform?
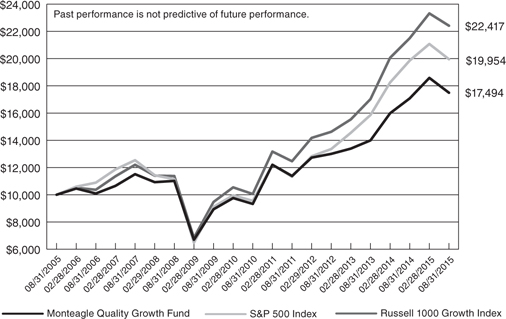
For the year ended August 31, 2015, the Monteagle Quality Growth Fund (the “Fund”) had a total return of 2.43%. The S&P 500 Index (“S&P 500”) and the Russell 1000 Growth Index (“Russell 1000”), the Fund’s two benchmarks, had total returns of 0.48% and 4.26%, respectively, for the same period. The Fund’s net asset value per share as of August 31, 2015 was $13.16 versus $12.99 as of August 31, 2014.
What is the Fund’s investment approach?
The Fund utilizes a growth style, investing in primarily domestic companies believed by the investment manager to be of high quality and to have above-average sustainable and/or accelerating growth with an ability to exceed earnings expectations over time. The underlying belief is that high quality companies outperform over time with less risk. Various quality rankings and other metrics which demonstrate quality, including earnings consistency, are evaluated carefully before a stock is added to the portfolio. The Fund employs a proprietary screening process and bottom-up work to construct portfolios. However, portfolio constraints are established to ensure sufficient diversification by sector as well as by market capitalization. The underlying belief is that diversification provides for greater control of risk in the portfolio, while allowing freedom in individual stock selection. The screening process is designed to identify stocks with rising expectations, as the Fund looks to invest in securities whose growth potential is, in the manager’s eyes, generally underestimated by the market. Holdings generally have a market capitalization of at least $2 billion, with about 65% to 85% of the portfolio in stocks of over $15 billion. Compared to the S&P 500, the portfolio may have a lower dividend yield, a higher price/earnings ratio and a higher expected earnings growth rate.
What influenced the Fund’s performance?
For the fiscal year ended August 31, 2015, domestic equity markets posted modest returns. Yet the year is best viewed as two distinct time periods. For the first eleven months of the fiscal year, stocks moved steadily higher on expectations of a gradually improving global economy and continued liquidity support from central banks. Through July 31, 2015, the S&P 500 gained 6.9%. Volatility rose dramatically in the final fifteen days of the year following an unexpected Chinese currency devaluation, confirming sluggish growth in China and calling into question the global economic recovery. During the month of August, the S&P 500 dropped 6.0%.
The Fund’s strategy to focus on high quality stocks suggests performance might be expected to lag a bit in periods when investors seek riskier, ultra-high growth stocks. Such has been the case in the six-plus years subsequent to the March 2009 market bottom. Investors have been fixated on central bank actions, expecting any market dip would be supported with additional liquidity injections from the U.S. Federal Reserve. Consistent with this trend, the Fund returned 9.6% through the first eleven months of the fiscal year, slightly behind the higher-risk Russell 1000 benchmark return of 11.0% but ahead of broader S&P 500 benchmark returns of 6.9%.
MONTEAGLE QUALITY GROWTH FUND
A DISCUSSION OF FUND PERFORMANCE (Unaudited) (Continued) |
A focus on high quality stocks also suggests the Fund might hold up better during periods of market distress as fearful investors seek the safety of more conservative, blue chip stocks. Unfortunately, investors differentiated little between risk and safety in the August downturn. The higher-risk Russell 1000 benchmark declined 6.1% for the final month of the year, compared with 6.0% for the broader S&P 500 and 6.5% for the Fund.
Viewing the entire fiscal year, the portfolio outperformed the S&P 500 by 1.95%, or 195 basis points. Both sector allocation and stock selection contributed to the relative returns. An underweight position in Energy and overweight position in Consumer Discretionary provided most of the 279 basis points of performance attributable to sector allocation. The underlying reason was a collapse in energy prices, boosting cash available in consumers’ pockets to spend on other items. Stock selection benefits were widespread across the portfolio, contributing 57 basis points of relative performance.
Relative to the Russell 1000 Growth benchmark, the Fund underperformed by 183 basis points for the fiscal year. The portfolio’s high quality focus reduced performance by 24 basis points. Sector allocation contributed 51 basis points of positive performance, attributable to an underweight position in Energy and an overweight position in Consumer Staples. Stock selection against the higher-risk Russell 1000 was negative, reducing performance by 95 basis points. In particular, biotechnology stocks posted very strong returns. The portfolio has relatively few biotechnology holdings as most do not meet the Fund’s screens due to a low profitability.
During the fiscal year, individual stocks contributing most positively to relative returns were CVS Health (drug retail, up 30.6%), Nike (footwear, up 43.5%), Visa (electronic payments, up 35.2%), Home Depot (home improvement retail, up 27.1%), and Walt Disney (entertainment, up 15.4%). Individual stocks reducing performance the most were Stratasys (instruments, down 75.9%), Qualcomm (communications, down 23.6%), and Trimble Navigation (instruments, down 43.2%).
For the first quarter ending November 30, 2014, the portfolio returned 5.2% compared with 3.7% for the S&P 500 and 4.4% for the Russell 1000 Growth. The portfolio’s tilt toward consumer companies, away from Energy companies, was most obvious in the first quarter as crude oil prices fell markedly.
For the second quarter ending February 28, 2015, the portfolio gained 3.4% compared with 2.3% for the S&P 500 and 3.9% for the Russell 1000 Growth. Financial holdings performed well during the quarter as investors began to anticipate rising long term interest rates with the U.S. Federal Reserve backing away from its bond purchasing programs. Typically, financial stocks perform well with a steepening yield curve.
For the third quarter ending May 31, 2015, the portfolio slipped 0.1% while the S&P 500 Index rose 0.6% and the Russell 1000 Growth increased 0.8%. During the latter portion of the quarter, earnings estimate cuts began to spread beyond Energy companies to include areas exposed to the general business cycle or a rising U.S. dollar. Investors responded to negative estimate revisions by seeking ultra-high growth, but often unprofitable, companies. Biotechnology and internet companies fared particularly well. Both areas are underrepresented in the portfolio.
MONTEAGLE QUALITY GROWTH FUND
A DISCUSSION OF FUND PERFORMANCE (Unaudited) (Continued) |
For the fourth quarter ending August 31, 2015, the portfolio declined 5.7% compared with a 5.9% decrease for the S&P 500 and a 4.6% reduction in the Russell 1000 Growth. Modest cash holdings and an underweight position in Energy provided little cushion. Investors made no distinction between conservative blue chip stocks and high-risk unprofitable companies with stretched balance sheets. In general, better performing companies sported higher P/E valuations.
Changes to the portfolio during the year reflect a heightened emphasis on quality in the expectation that stock market volatility may increase in a slowing global economy. New holdings added to the fund over the past year include American Express (payments), Biogen (biotechnology), Caterpillar (machinery), Chevron (integrated energy), Deckers Outdoors (footwear), Facebook (internet), FLIR Systems (instruments), Procter & Gamble (household products), Schlumberger (oil service), Time (publications), Union Pacific (railroad), UnitedHealth Group (managed care), and Wynn Resorts (casino).
Purchases were funded by the elimination of positions in American Express (payments), Baxalta (biotechnology), Danaher (industrial), East West Bancorp (banking), Family Dollar (retail), National Oilwell Varco (oil service), Precision Castparts (industrial), Ross Stores (retail), Schlumberger (oil service), Stratasys (instruments), and Wynn Resorts (casino).
What is the Fund’s Strategy?
The Fund will continue to focus on maintaining a diversified portfolio of high-quality companies delivering sustainable above-market earnings growth as well as companies poised to experience acceleration in earnings growth relative to expectations. The Fund’s adviser believes the companies that can exceed expectations in the form of positive earnings surprises will be well rewarded over coming quarters.
Fund performance shown represents the performance of the Fund’s Class I shares. For complete performance information, please refer to the Average Annual Total Return table in the following performance report. Past performance is not predictive of future performance. Investment results and principal value will fluctuate so that shares, when redeemed, may be worth more or less than their original cost. Current performance may be higher or lower than the performance data quoted. Performance data current to the most recent month-end, are available by calling 1-888-263-5593.
An investor should consider the investment objectives, risks, charges and expenses of the Fund carefully before investing. The Fund’s prospectus contains this and other important information. To obtain a copy of the Fund’s prospectus please call 1-888-263-5593 and a copy will be sent to you free of charge. Please read the prospectus carefully before you invest. The Fund is distributed by Matrix Capital Group, Inc.
Management’s Discussion of Fund Performance seeks to describe some of the Sub-Adviser’s current opinions and views of the financial markets. Although the Sub-Adviser believes it has a reasonable basis for any opinions or views expressed, actual results may differ, sometimes significantly so, from those expected or expressed.
MONTEAGLE QUALITY GROWTH FUND
PERFORMANCE — August 31, 2015 (Unaudited) |
Comparison of the Change in Value of a $10,000 Investment in Monteagle Quality Growth Fund,
the S&P 500 Index and the Russell 1000 Growth Index
Average Annual Total Return
(for the periods ended August 31, 2015) |
| | One Year | Five Years | Ten Years | |
Monteagle Quality Growth Fund | 2.43% | 13.41% | 5.75% | |
S&P 500 Index | 0.48% | 15.86% | 7.15% | |
Russell 1000 Growth Index | 4.26% | 17.39% | 8.40% | |
The performance information quoted in this annual report assumes the reinvestment of all dividend and capital gain distributions, if any, and represents past performance, which is not a guarantee of future results. The returns shown do not reflect taxes that a shareholder would pay on Fund distributions or on the redemption of Fund shares. The investment return and principal value of an investment will fluctuate and, therefore, an investor’s shares, when redeemed, may be worth more or less than their original cost.
The above graph depicts the performance of the Monteagle Quality Growth Fund versus the S&P 500 Index and the Russell 1000 Growth Index. The S&P 500 Index by Standard and Poor’s Corp. is a capitalization-weighted index comprising 500 issues listed on various exchanges, representing the performance of the stock market generally. The Russell 1000 Growth Index measures the performance of the large-cap growth segment of the U.S. equity universe. It includes those Russell 1000 companies with higher price-to-book ratios and higher forecasted growth values. Please note that indices do not take into account any fees and expenses of investing in the individual securities that they track, and individuals cannot invest directly in any index.
As with any fund, save an index fund, that commonly compares its performance to the S&P 500 Index and the Russell 1000 Growth Index, such a comparison may be said to be inappropriate because of the dissimilarity between the Fund’s investments and the securities comprising the indices; so too with the Monteagle Quality Growth Fund, which will not invest in certain securities comprising these indices.
MONTEAGLE SELECT VALUE FUND
A DISCUSSION OF FUND PERFORMANCE (Unaudited) |
How did the Fund perform?
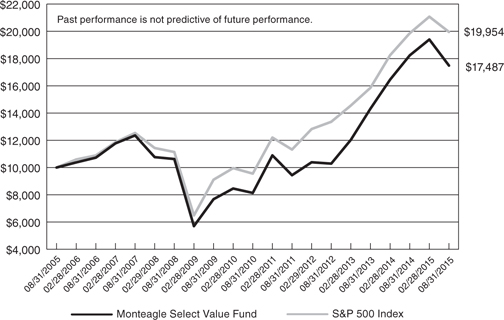
For the year ended August 31, 2015, the Monteagle Select Value Fund (the “Fund”) had a return of -4.10%. The S&P 500 Index (“S&P 500” or “Index”) had a return of 0.48% for the same period. The Fund’s net asset value per share as of August 31, 2015 was $15.86 versus $18.66 on August 31, 2014. Despite the negative return, we still anticipate a large capital gain distribution occurring in December as a result of the high amount of realized gains recognized over the last year.
What is the Fund’s investment approach?
The Fund’s investment goal is long-term capital appreciation. The Fund uses a “value investing” style by investing, under normal circumstances, at least 80 percent of its assets in common stock of domestic companies believed to be under-priced relative to comparable securities determined by price-to-earnings ratios, cash flows or other measures. The Fund’s adviser predominately utilizes a reversion-to-the-mean strategy on stock selection in order to achieve its results rather than trying to time market fluctuations. The adviser limits the pool of stocks to consider for purchase to only those equities in the S&P 500. In selecting stocks, the Fund’s adviser establishes valuation parameters by using relative ratios or target prices to evaluate companies on several levels. Additionally, the adviser will generally have the Fund hold between 40 and 60 equities and diversify its holdings across numerous industries. The Fund seeks to maintain a minimum average weighted market capitalization of $5 billion.
Value stocks are broadly defined as equities which have a price-to-earnings ratio and a price-to-book ratio less than the relative market average with dividends tending to be higher than the relative market average. Also, value stocks tend to have a beta (a measure of the stocks price volatility relative to the overall market, i.e. the S&P 500) less than 1.0.
What influenced the Fund’s performance?
During the twelve months ended August 31, 2015, the Fund’s performance was affected by the incredible volatility in the US equity market and the large concern of rising interest rates and its effect on the markets. Between the economic woes in China, revamping of quantitative easing by the ECB, US presidential candidates duking it out and record intraday equity movements in the US, there has been plenty of reading entertainment. The Federal Reserve continues to manage expectation regarding the timing of rising interest rates. Even major economists have been “head faked” by the timing. In early August, over 80% of economists believed the Fed would raise rates in September with the majority of the remainder believing October would be the first hike. Since that September meeting has already occurred at the time of this writing, it is obvious to report there was no move from the Fed. Despite unemployment falling in August to its lowest level since April of 2008 (5.1%), the FOMC statement stated the belief that “recent global economic and financial developments may restrain economic activity somewhat and are likely to put further downward pressure on inflation in the near term.” The translation is the Fed is keeping their options open and wants to be very sure indicators will continue improving once they begin raising rates. At the time of this writing, traders in the futures market are putting about 30% odds on a December increase and 40% on January with the vast majority of the remainder being further in 2016. Essentially, this means no one knows and even the “professional” economists have differing views. During the
MONTEAGLE SELECT VALUE FUND
A DISCUSSION OF FUND PERFORMANCE (Unaudited) (Continued) |
period, the US equity market saw the largest intraday decline of all time in late August when the Dow Jones Industrial Average fell 1,089 points when the market opened Monday, August 24th. While the market closed at less of a loss that day, this occurrence (hindsight) was in the middle of an almost 11% fall which triggered correction territory. This fall wiped out the gains for the year that the major equity indices had generated. To put this in context, during the last week of August, the S&P 500 completed six consecutive trading sessions with movements of 1% or more. This has happened only 21 other times for the S&P since 1950. With a rough quarter for stocks to end the Fund’s year, the focus on a “value style, reversion-to-the-mean” has led to lagging performance as of late. Moreover, the Fund’s performance was affected by its asset allocation weighting to the various sectors of the Index. However, longer term, the Fund has performed very attractively overall compared to the S&P 500 Index.
For the first quarter ended November 30, 2014, the portfolio holdings of the Fund underperformed the Index. The investments of the Fund experienced a 0.92% return versus a return for the Index of 3.72%. For the trailing 12-month period ended November 30, 2014, the portfolio holdings of the Fund underperformed the Index with the investments of the Fund experiencing a 13.52% return versus a 16.86% return for the Index. The portfolio held a slightly higher cash balance of 13.3% invested in cash and money funds while the equities represented 86.7% of the assets.
The broad sectors of the Index that improved the most on average during the first quarter were the Health Care (9.95%), Consumer Staples (9.30%), and Utilities (8.94%) sectors while the Energy (-10.94%), Materials (1.03%), and Telecommunication Services (3.22%) sectors were the lowest performing within the Index. The portfolio performance was led by its holdings in the Consumer Discretionary, Utilities and Consumer Staple sectors during this quarter. The lower performing sectors in the portfolio were Energy, Basic Materials and Industrial. The Index again closed near record highs, ending the quarter at 2,067.56, just five points off the all-time high close the day before. This followed a run-up of approximately 11.3% in the Index over a month and a half period.
As of the end of the first quarter, the portfolio holdings continued to be diversified across many sectors of the Index with less exposure to the Communications, Utility and Materials sectors. The largest sector allocations were Consumer Discretionary, Financial and Industrial. The Fund’s positive portfolio performance was primarily attributed to its top performing stock picks of Edwards Lifesciences Corp. (24.84%), Target Corp. (24.25%), and Whirlpool Corp. (22.28%). The Fund’s portfolio performance was most negatively affected by Transocean LTD. (-44.45%), Diamond Offshore Drilling, Inc. (-31.78%) and Abercrombie & Fitch Co. (-30.63%). During the quarter, five disposals were made in order to remove securities that achieved their target price and make room for new securities with more appreciation potential. Four purchases were made in November, purchasing three new names and averaging into one existing security. The elevated cash balance at the end of the quarter ended November 30, 2014 was to allow for payment of the large capital distribution in December. As of the end of the second quarter, cash represented 13.3% of the assets.
MONTEAGLE SELECT VALUE FUND
A DISCUSSION OF FUND PERFORMANCE (Unaudited) (Continued) |
For the second quarter ended February 28, 2015, the portfolio holdings of the Fund outperformed the Index. The investments of the Fund experienced a 5.42% return versus a return for the Index of 2.31%. For the trailing 12-month period ended February 28, 2015, the portfolio holdings of the Fund outperformed the Index with the investments of the Fund experiencing a 17.90% return versus a 15.50% return for the Index. The portfolio held a cash balance of 10.68% invested in cash and money funds while the equities represented 89.32% of the assets.
The broad sectors of the Index that improved the most on average during the second quarter were the Consumer Discretionary (8.24%), Health Care (6.10%), and Materials (4.43%) sectors while the Energy (-5.72%), Telecommunication Services (-0.25%), and Utilities (0.56%) sectors were the lowest performing within the Index. The portfolio performance was led by its holdings in the Consumer Discretionary, Consumer Staple and Telecommunication Services sectors during this quarter. The lower performing sectors in the portfolio were Basic Materials, Utilities and Industrial. The Index again closed near record highs, ending the second quarter at 2,104.50 approximately eleven points off the all-time high close a few days before. This followed a run-up of approximately 6.04% in the Index in February.
As of the end of the second quarter, the portfolio holdings continued to be diversified across many sectors of the Index with less exposure to the Utility, Materials and Technology sectors. The largest sector allocations were Consumer Discretionary, Financial and Energy. The Fund’s positive portfolio performance was primarily attributed to its top performing stock picks of Kohl’s Corp. (24.58%), Tesoro Petroleum Corp. (20.34%), and Humana, Inc. (19.37%). The Fund’s portfolio performance was most negatively affected by United States Steel Corp. (-28.07%), Transocean LTD (-20.22%) and Freeport-McMoran (-17.95%). During the quarter, five disposals were made in order to remove securities that achieved their target price in order to make room for securities with more appreciation potential. Four purchases were made in February, purchasing three new names and averaging into one existing security. As of the end of the third quarter, cash represented 10.68% of the assets.
For the third quarter ended May 31, 2015, the portfolio holdings of the Fund outperformed the Index. The investments of the Fund experienced a 0.75% return versus a return for the Index of 0.64%. For the trailing 12-month period ended May 31, 2015, the portfolio holdings of the Fund outperformed the Index with the investments of the Fund experiencing a 13.07% return versus an 11.80% return for the Index. The portfolio held an elevated cash balance of 16.28% invested in cash and money funds while the equities represented 83.72% of the assets.
The broad sectors of the Index that improved the most on average during the third quarter were the Health Care (4.95%), Financials (2.50%), and Consumer Discretionary (2.31%) sectors while the Consumer Staples (-1.13%), Industrials (-0.59%), and the Utilities (-0.54%) sectors were the lowest performing within the Index. The Index again closed near record highs, ending the quarter at 2,107.39 approximately twenty-three points (1.1%) off the all-time high close about a week before. This followed a run-up of almost 2.5% in the Index in earlier May.
As of the end of the third quarter, the portfolio holdings continued to be diversified across many sectors of the Index with less exposure to the Utility, Materials and Consumer Staple sectors. The largest sector allocations are Financial, Energy and Consumer Discretionary. The Fund’s positive
MONTEAGLE SELECT VALUE FUND
A DISCUSSION OF FUND PERFORMANCE (Unaudited) (Continued) |
portfolio performance was primarily attributed to its top performing stock picks of Humana (30.80%), Transocean LTD (22.72%), and Noble Corp. (9.58%). The Fund’s portfolio performance was most negatively affected by Abercrombie & Fitch Co. (-16.56%), C.H. Robinson Worldwide, Inc. (-16.49%) and Xerox Corp. (-15.83%). During the quarter, three disposals were made in order to remove securities that achieved their target price in order to make room for securities with more appreciation potential. One of these disposals, CVS Health Corp., was sold after achieving a return of approximately 250%. Five purchases were made in April, purchasing four new names and averaging into one existing security. As of the end of the quarter, cash represented 16.3% of the assets.
For the fourth quarter ended August 31, 2015, the portfolio holdings of the Fund underperformed the Index. The investments of the Fund experienced a -10.54% return versus a return for the Index of -5.92%. For the trailing 3-year period ended August 31, 2015, the portfolio holdings of the Fund significantly outperformed the Index with the investments of the Fund experiencing a 19.35% annualized return versus a 14.31% annualized return for the Index. The cash balance of the portfolio at the end of the fourth quarter, which is also the Fund’s year-end, was 2.72%, invested in cash and money funds while the equities represented 97.28% of the assets.
The broad sectors of the Index that improved the most/fell the least on average during the fourth quarter were the Consumer Discretionary (0.42%), Utilities (-2.10%), and Information Technology (-2.11%) sectors while the Energy (-14.63%), Materials (-12.67%), and Industrials (-6.91%) sectors were the lowest performing within the Index. The Index experienced one of the largest all-time intra-day declines on record near the close of the quarter, falling approximately 9.55% in only four trading days. The last couple days of August ended with positive movement, yet the Index still closed over 11.6% off of highs earlier this calendar year. Perhaps a correction was in order as the first four months of the calendar quarter produced a run up of over 17.5%. Moreover, since this time the Index fell approximately 6.9% from the beginning of May until the end of August.
As of the end of the fourth quarter, the portfolio holdings continued to be diversified across many sectors of the Index with less exposure to the Consumer Staple and Materials sectors. The largest sector allocations are Energy, Consumer Discretionary and Financial. The Fund’s positive portfolio performance was primarily attributed to its top performing stock picks of Google, Inc. (18.80%), C.H. Robinson Worldwide (9.90%), and National Oilwell Varco, Inc. (8.51%). The Fund’s portfolio performance was most negatively affected by Denbury Resources, Inc. (-54.64%), Freeport-McMoRan, Inc. (-45.63%) and Allegheny Technology, Inc. (-40.24%). During the fourth quarter, seven disposals were made. Some of these were sold in order to remove securities that achieved their target price and make room for securities with more appreciation potential. Others were sold in order to realize losses to offset a portion of the large capital gains distribution for the Fund. These securities were sold under the procedural “out process” as determined by the holding period for the strategy. Subsequent to these disposals, thirteen securities were either averaged into or purchased for the first time to reinvest cash. As of the end of the fourth quarter, cash represented 2.7% of the assets.
MONTEAGLE SELECT VALUE FUND
A DISCUSSION OF FUND PERFORMANCE (Unaudited) (Continued) |
What is the Fund’s strategy?
The Fund will continue to concentrate on equities contained in the S&P 500 which generally consists of large name brand corporations with good fundamentals and broad product diversification. The Fund’s adviser will continue to be disciplined in the use of its predominate strategy of reversion-to-the-mean by applying its “value investing” approach valuation model; thereby, allowing the market’s volatility to identify those securities that become under-valued and are poised to be the next performers in the market. Sector allocation in the Fund’s portfolio will primarily be determined by which companies are available for purchase pursuant to the Fund’s strategy. It is anticipated that the Fund may hold higher levels of cash during extended periods of market uncertainty and will selectively invest the cash into equities identified by the primary investment strategy as opportunities present themselves or for dollar-cost-averaging into currently held positions. This strategy is executed with a long-term outlook and will have periods of under-performance and out-performance versus its Index. Therefore, the Fund’s daily performance can and will vary dependant upon current market conditions.
Fund performance shown represents the performance of the Fund’s Class I shares. For complete performance information, please refer to the Average Annual Total Return table in the following performance report. Past performance is not predictive of future performance. Investment results and principal value will fluctuate so that shares, when redeemed, may be worth more or less than their original cost. Current performance may be higher or lower than the performance data quoted. Performance data current to the most recent month-end, are available by calling 1-888-263-5593.
An investor should consider the investment objectives, risks, charges and expenses of the Fund carefully before investing. The Fund’s prospectus contains this and other important information. To obtain a copy of the Fund’s prospectus please call 1-888-263-5593 and a copy will be sent to you free of charge. Please read the prospectus carefully before you invest. The Fund is distributed by Matrix Capital Group, Inc.
Management’s Discussion of Fund Performance seeks to describe some of the Sub-Adviser’s current opinions and views of the financial markets. Although the Sub-Adviser believes it has a reasonable basis for any opinions or views expressed, actual results may differ, sometimes significantly so, from those expected or expressed.
MONTEAGLE SELECT VALUE FUND
PERFORMANCE — August 31, 2015 (Unaudited) |
Comparison of the Change in Value of a $10,000 Investment
in Monteagle Select Value Fund and the S&P 500 Index
Average Annual Total Return
(for the periods ended August 31, 2015) |
| | One Year | Five Years | Ten Years | |
Monteagle Select Value Fund | (4.10%) | 16.54% | 5.75% | |
S&P 500 Index | 0.48% | 15.86% | 8.38% | |
The performance information quoted in this annual report assumes the reinvestment of all dividend and capital gain distributions, if any, and represents past performance, which is not a guarantee of future results. The returns shown do not reflect taxes that a shareholder would pay on Fund distributions or on the redemption of Fund shares. The investment return and principal value of an investment will fluctuate and, therefore, an investor’s shares, when redeemed, may be worth more or less than their original cost.
The above graph depicts the performance of the Monteagle Select Value Fund versus the S&P 500 Index. The S&P 500 Index by Standard and Poor’s Corp. is a capitalization-weighted index comprising 500 issues listed on various exchanges, representing the performance of the stock market generally. Please note that indices do not take into account any fees and expenses of investing in the individual securities that they track, and individuals cannot invest directly in any index.
As with any fund, save an index fund, that commonly compares its performance to the S&P 500 Index, such a comparison may be said to be inappropriate because of the dissimilarity between the Fund’s investments and the securities comprising the index; so too with the Monteagle Select Value Fund, which will not invest in certain securities comprising this index.
MONTEAGLE VALUE FUND
A DISCUSSION OF FUND PERFORMANCE (Unaudited) |
How did the Fund Perform?
For the year ended August 31, 2015, the Monteagle Value Fund (the “Fund”) reported a total return of -14.33%. The S&P 500 Index (“S&P 500”) had a total return of 0.48% for the same time period. The Fund’s net asset value per share as of August 31, 2015 was $13.36 versus $18.60 at August 31, 2014. The Fund paid capital gains distributions of $2.53 per share in December 2014.
What is the Fund’s investment approach?
The Fund’s investment goal is to achieve maximum returns through investing in undervalued companies. The Fund determines value usually based on price-to-earnings ratios, but also reviews historical price to book value ratios, dividend yield and balance sheet quality in determining whether prospective investments are truly undervalued. The Fund adviser will hold 40 to 50 equities. The Fund seeks to maintain a minimum average market capitalization of $5 billion. The current average market capitalization exceeds $49 billion. The current price earnings ratio is 14.3 times 2016 earnings and currently yields 3.2%. The S&P 500 currently trades at 15.5 times 2016 earnings and yields 2.1 percent.
The Fund also makes industry determinations based upon interest rate cycles. Historical relationships between short-term and long-term U.S. Treasury securities impact industry weightings as easier money promotes growth in inflation while tight money favors disinflation.
As a general rule, new investments are made based on historical quantitative valuation measures that the Fund deems as undervalued. Conversely, the positions which are sold usually reach quantitative valuation measures that the Fund deems fully or overvalued. Decisions to reduce or sell partial holdings are based on industry overweightings.
The Fund also makes investments for the long-term, holding the positions for three to five years unless there are extraordinary events such as mergers, acquisitions or deterioration of the industry or company.
What influenced the Fund’s performance?
During the year ended August 31, 2015, the Fund incurred its underperformance versus the S&P 500 as the overall economic activity posted anemic worldwide growth weakening the U.S. equity markets. The major indices including the S&P 500 and the Dow Jones Industrial Averages were dominated by the top five market capitalization companies that command higher price earnings ratios and little or no dividend yield. Value companies that have lower price earnings ratios and higher dividend yields underachieved for the twelve months as economic activity slowed. More recent corporations have projected lower or flat earnings growth for the immediate six months dampening overall equity prices. During the past twelve months, the Federal Reserve has inserted debate in the FOMC statements to the criteria being used to raise short-term interest rates. At the current juncture, the economy has not achieved its targeted 2% inflation rate. The government is reporting 5.1% unemployment although over 10 million workers have given up looking for jobs. The Great Inflation has certainly been put on hold as disinflationary forces have quelled any hopes of a robust economy anytime soon. The recent decline in U.S. Treasury yields continues to keep a lid on any rise in short-term interest rates.
MONTEAGLE VALUE FUND
A DISCUSSION OF FUND PERFORMANCE (Unaudited) (Continued) |
During the first quarter ending November 30, 2014 the Fund underperformed the S&P 500 returning -2.94% versus 3.72% for the S&P 500. The much promoted “FANG portfolio” of Facebook, Amazon, NetFlix and Google dominated the Indices during the quarter while the industrial based companies underperformed. The commodity price declines continued to dominate overall stock prices causing energy companies to weaken in price. Top line revenue growth for economically sensitive industries including chemicals, paper and forest products, steel, automobiles, and housing stocks have contributed to the Fund’s underperformance.
During the first quarter, the Fund added to its positions in Transocean, Stepan Co., Exxon Mobil, Commercial Metals, Coach, Inc., Cliffs Natural Resources, Schneider Electric ADR, Wolseley PLC ADR, Sonoco Products, and Ford Motor. The Fund initiated a new position in Tidewater, Inc.
During the second quarter ending February 28, 2015, the Fund underperformed the S&P 500 returning 1.29% versus 2.31% for the S&P 500. Federal Reserve policy continued to maintain low short-term interest rates and money is growing at an 8% rate during the quarter.
The Fund continued to favor economically sensitive issues and believed that the economic recovery will bid commodity prices higher. The Fund favors industrials, energy and materials industries.
During the quarter, the Fund sold Bristol Myers Squibb, Duke Energy, International Paper, and Cliff Natural Resources. During the quarter, the Fund initiated positions in Yamana Gold and Barrick Resources.
During the third quarter ending May 31, 2015, the Fund slightly outperformed the S&P 500 returning -0.75% versus 0.64%. The overall market reached an intermediate high with the Dow Jones Industrial Average hitting 18,353 in late May. Federal Reserve policy continues to be dominated by debate on when it will raise interest rates. Yet, no change during the quarter.
The Fund continues to favor economically sensitive issues. Economic activity experienced improvement during the quarter and points to improving revenue and earnings growth for U.S. corporations.
During the quarter, the Fund did not make any changes in holdings.
During the fourth quarter ending August 31, 2015, the Fund underperformed versus the S&P 500, returning -12.20% versus -5.92% for the S&P 500. Over the past twelve months, the Fund underperformed the S&P 500 returning -14.33% versus 0.48%. The Fund’s quarterly performance was affected by declines in energy prices impacting the oil positions in the Fund. Fed policy continues to keep interest rates near zero as inflation rates are significantly lower than 2%.
During the quarter, the Fund sold its position in Cooper Tire and Rubber. The Fund made new purchases of General Electric, Fluor Corp., Rayonier, Inc., and Greif, Inc.
What is the Fund’s current strategy?
The Fund continues to focus on consistency in earnings in its holdings. The Fund remains committed to economically sensitive issues including energy, materials, and industrials. The Fund is overweight in materials, energy, telecommunications, and industrials as the economic recovery continues to sputter and recent Fed policy statements indicated they were concerned that it would
MONTEAGLE VALUE FUND
A DISCUSSION OF FUND PERFORMANCE (Unaudited) (Continued) |
be willing to accept higher inflation as it fends off deflationary forces. The Fund is underweight financials, health, technology, consumer discretion, and consumer staples. The fund has increased its holdings into international ADR’s believing the worldwide recovery has begun.
Fund performance shown represents the performance of the Fund’s Class I shares. For complete performance information, please refer to the Average Annual Total Return table in the following performance report. Past performance is not predictive of future performance. Investment results and principal value will fluctuate so that shares, when redeemed, may be worth more or less than their original cost. Current performance may be higher or lower than the performance data quoted. Performance data current to the most recent month-end are available by calling 1-888-263-5593.
An investor should consider the investment objectives, risks, charges and expenses of the Fund carefully before investing. The Fund’s prospectus contains this and other important information. To obtain a copy of the Fund’s prospectus please call 1-888-263-5593 and a copy will be sent to you free of charge. Please read the prospectus carefully before you invest. The Fund is distributed by Matrix Capital Group, Inc.
Management’s Discussion of Fund Performance seeks to describe some of the Sub-Adviser’s current opinions and views of the financial markets. Although the Sub-Adviser believes it has a reasonable basis for any opinions or views expressed, actual results may differ, sometimes significantly so, from those expected or expressed.
MONTEAGLE VALUE FUND
PERFORMANCE — August 31, 2015 (Unaudited) |
Comparison of the Change in Value of a $10,000 Investment
in Monteagle Value Fund, the S&P 500 Index and the Russell 2000 Value Index

Average Annual Total Return
(for the periods ended August 31, 2015) |
| | One Year | Five Years | Ten Years | |
Monteagle Value Fund | (14.33%) | 9.80% | 4.85% | |
S&P 500 Index | 0.48% | 15.86% | 7.15% | |
Russell 2000 Value Index | (4.95%) | 13.23% | 5.70% | |
The performance information quoted in this annual report assumes the reinvestment of all dividend and capital gain distributions, if any, and represents past performance, which is not a guarantee of future results. The returns shown do not reflect taxes that a shareholder would pay on Fund distributions or on the redemption of Fund shares. The investment return and principal value of an investment will fluctuate and, therefore, an investor’s shares, when redeemed, may be worth more or less than their original cost.
The above graph depicts the performance of the Monteagle Value Fund versus the S&P 500 Index and the Russell 2000 Value Index. The S&P 500 Index by Standard and Poor’s Corp. is a capitalization-weighted index comprising 500 issues listed on various exchanges, representing the performance of the stock market generally. The Russell 2000 Value Index measures the performance of small-cap value segment of the U.S. equity universe. It includes those Russell 2000 companies with lower price-to-book ratios and lower forecasted growth values. Please note that indices do not take into account any fees and expenses of investing in the individual securities that they track, and individuals cannot invest directly in any index.
As with any fund, save an index fund, that commonly compares its performance to the S&P 500 Index and the Russell 2000 Value Index, such a comparison may be said to be inappropriate because of the dissimilarity between the Fund’s investments and the securities comprising the indices; so too with the Monteagle Value Fund, which will not invest in certain securities comprising these indices.
THE TEXAS FUND
A DISCUSSION OF FUND PERFORMANCE (Unaudited) |
How did the Fund perform?
The period from August 31, 2014 to August 31, 2015 proved to be a difficult market for Texas stocks when compared to the S&P 500 Index (“S&P 500”). The Texas Fund (the “Fund”) lost 15.53% over that time period while the S&P 500 was flat at 0.48%. The contributing factors were led by an extreme downturn in energy prices as well as a rising dollar. This market proved difficult for all investments with ties to commodity based economies. This effect on a geogrzaphic area like Texas is not only in energy stocks, but also sectors like banking and industrials as they are seen as strongly tied to energy. Energy investments particularly had very poor performance over this time period. As a point of reference, the Energy Select Sector SPDR®ETF, a popular large cap energy investment, lost 31.05% over the same time period. Another interesting comparison is how other commodity based economies like Australia and Canada performed over the same time period. The iShares MSCI Canada ETF lost 24.54% and the iShares MSCI Australia ETF lost 27.28%.
The Fund managed some of these risks due to continued underperformance of the energy, industrials, banking and other sectors through this time period in Texas. This was done through security selection, sector rebalances, and options strategies. These approaches allowed the Fund to reduce risk while maintaining the overall long-term investment strategy.
What is the Fund’s investment approach?
The Fund’s investment goal is long-term capital appreciation. The Fund invests in a broad market capitalization across the various sectors and sizes of the Texas economy keeping 80% or more of the Fund invested in: 1) companies headquartered in Texas, 2) organized under Texas state laws, or 3) derive 50% of revenues or profits or have 50% of their assets in Texas. The adviser limits the pool of stocks considered for purchase to only those equities with market capitalization greater than $1 billion. The adviser also limits the amount in any one sector to less than 25% of the overall portfolio of companies.
In selecting stocks, the Fund’s adviser ranks stocks in each sector with an A, B or C. An equal weighting is applied across the A ranking and B rankings for each sector with A’s weighted more heavily than B’s. C rankings are considered sells. Company rankings are determined by the Fund’s adviser after analyzing the financials, valuation, and growth prospects in comparison with their peers in the sector. The overall objective is to hold companies for a long-term period to allow the capture of their growth within the Texas economy.
Since there are a number of small and mid-cap companies in Texas and the fund advisers do not give specific preference large caps, the Fund tends to have an average market capitalization between $4 billion to $6 billion. The Fund also maintains investments across the spectrum of Texas companies from those considered to be value companies to those considered growth companies.
What influenced the Fund’s performance?
As previously mentioned, the collapse of energy prices and the strength of the dollar is what we see that led to underperformance of the Fund over the past year. Contributors to outperformance of other commodity based economies were the ability of the Fund to adjust to sectors that benefitted
THE TEXAS FUND
A DISCUSSION OF FUND PERFORMANCE (Unaudited) (Continued) |
from lower energy prices like consumer cyclicals and the increasing diversity with the Texas economy allowing for higher allocations to areas like technology and healthcare than have been available in Texas in the past.
First Quarter
The first quarter began with energy prices diving and energy stocks taking it on the chin. In August, the Fund’s portfolio was repositioned to reduce energy names, focusing on holdings that were more fundamentally sound financially. This proved beneficial as many holdings that were previously sold had steep losses of 40-60% within a few months. However, even the more sound energy names still had a very difficult quarter. The S&P 500 gained 3.72% over this quarter while the Fund lost -6.14%. The financial sector was also a big contributor to underperformance in this quarter.
Second Quarter
For the second quarter, the Fund experienced a little less volatility but lost -0.72% compared to the S&P 500 which returned 2.31%. The Fund took the opportunity in this quarter to rebalance names that had outperformed in the technology sector of the portfolio to financials which had been beaten up in the previous quarter.
Third Quarter
For the third quarter, the Fund returned 0.61% compared to the S&P 500 which returned 0.64%. This quarter seemed to have low volatility and was not very eventful. During this quarter, the Fund was able to pick up a few names that met the $1 billion minimum criteria that benefitted from the local population growth in Texas.
Fourth Quarter
For the fourth quarter, the Texas Fund lost 9.90% compared to the S&P 500 which lost 5.92%. Energy prices took another dip in this quarter which affected performance as well as the overall market. In this time period, the Fund attempted to prevent downside risks for the coming quarter as, in its view, the potential for a larger pullback in broad equity markets and capitulation of the energy market grew. To try and maintain exposure to energy but limit downside potential, the Fund replaced about 50% of the energy sector of the portfolio with call options to replicate the positions. This allowed for similar upside in those names while limiting potential downside through the end of 2015. As risks grew, the Fund decided to defensively move almost 50% of the Fund’s holdings to cash in mid-August.
As the year came to a close, management saw more future opportunity in companies that will benefit from population growth in Texas. As opportunities arise, management is looking to increase exposure to this area of the Texas economy.
THE TEXAS FUND
A DISCUSSION OF FUND PERFORMANCE (Unaudited) (Continued) |
What is the Fund’s strategy?
The Fund will continue to concentrate on Texas based equities in order to take advantage of the Texas business climate and prospects for growth. The Fund will continue to evaluate and monitor the investments of the Fund to capture the growth in equities in the growing Texas economy.
It is anticipated that the Fund may hold higher levels of cash during extended periods of market uncertainty and will selectively increase options positions where the adviser sees a need for additional downside protection.
Fund performance shown represents the performance of the Fund’s Class I shares. For complete performance information, please refer to the Average Annual Total Return table in the following performance report. Past performance is not predictive of future performance. Investment results and principal value will fluctuate so that shares, when redeemed, may be worth more or less than their original cost. Current performance may be higher or lower than the performance data quoted. Performance data current to the most recent month-end, are available by calling 1-888-263-5593.
An investor should consider the investment objectives, risks, charges and expenses of the Fund carefully before investing. The Fund’s prospectus contains this and other important information. To obtain a copy of the Fund’s prospectus please call 1-888-263-5593 and a copy will be sent to you free of charge. Please read the prospectus carefully before you invest. The Fund is distributed by Matrix Capital Group, Inc.
Management’s Discussion of Fund Performance seeks to describe some of the Sub-Adviser’s current opinions and views of the financial markets. Although the Sub-Adviser believes it has a reasonable basis for any opinions or views expressed, actual results may differ, sometimes significantly so, from those expected or expressed.
THE TEXAS FUND
PERFORMANCE — August 31, 2015 (Unaudited) |
Comparision of the Change in Value of a $10,000 Investment
in The Texas Fund Class I shares and the S&P 500 Index
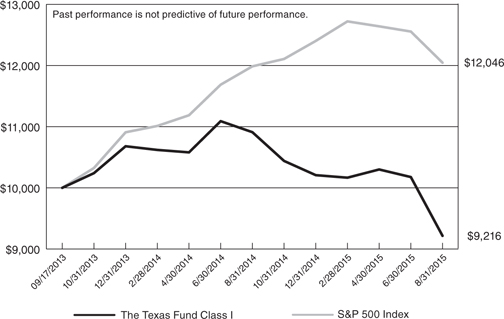
Average Annual Total Return
(for the periods ended August 31, 2015) |
| | One Year | Since
Inception(a) | |
The Texas Fund Class I | (15.53%) | (4.10%) | |
The Texas Fund Class C with redemption fee | (16.34%) | (5.02%) | |
The Texas Fund Class C without redemption fee | (16.34%) | (5.02%) | |
S&P 500 Index | 0.48% | 9.98% | |
(a) | Represents the period from the commencement of operations (September 17, 2013) through August 31, 2015. |
The performance information quoted in this annual report assumes the reinvestment of all dividend and capital gain distributions, if any, and represents past performance, which is not a guarantee of future results. The returns shown do not reflect taxes that a shareholder would pay on Fund distributions or on the redemption of Fund shares. The investment return and principal value of an investment will fluctuate and, therefore, an investor’s shares, when redeemed, may be worth more or less than their original cost.
The above graph depicts the performance of The Texas Fund versus the S&P 500 Index. The S&P 500 Index by Standard and Poor’s Corp. is a capitalization-weighted index comprising 500 issues listed on various exchanges, representing the performance of the stock market generally. Please note that indices do not take into account any fees and expenses of investing in the individual securities that they track, and individuals cannot invest directly in any index.
As with any fund, save an index fund, that commonly compares its performance to the S&P 500 Index, such a comparison may be said to be inappropriate because of the dissimilarity between the Fund’s investments and the securities comprising the index; so too with The Texas Fund, which will not invest in certain securities comprising this index.
MONTEAGLE FIXED INCOME FUND
SUPPLEMENTARY PORTFOLIO INFORMATION — August 31, 2015 |
FUND PROFILE:
Top Ten Long-Term Portfolio Holdings | (% of Net Assets) |
U.S. Treasury Note, 2.00%, due 11/15/2021 | 4.05% |
U.S. Treasury Note, 1.75%, due 05/15/2022 | 3.97% |
U.S. Treasury Note, 1.625%, due 08/15/2022 | 3.93% |
FNMA Pool AB3690, 4.00%, due 10/01/2041 | 3.59% |
U.S. Treasury Note, 2.125%, due 08/15/2021 | 2.55% |
FHLMC, 4.875%, due 06/13/2018 | 2.21% |
U.S. Treasury Note, 3.125%, due 05/15/2021 | 2.16% |
U.S. Treasury Note, 2.25%, due 11/15/2024 | 2.02% |
Apple, Inc., 3.20%, 05/13/2025 | 2.00% |
FNMA Pool AU3763, 3.50%, due 08/01/2043 | 1.97% |
Sector Allocation | (% of Net Assets) |
Corporate Bonds | 50.77% |
U.S. Government and Agency Obligations | 31.19% |
Mortgage-Backed Securities | 12.57% |
Money Market Funds | 4.82% |
Other Assets in Excess of Liabilities | 0.65% |
| | 100.00% |
MONTEAGLE INFORMED INVESTOR GROWTH FUND
SUPPLEMENTARY PORTFOLIO INFORMATION — August 31, 2015 |
FUND PROFILE:
Top Ten Long-Term Portfolio Holdings | (% of Net Assets) |
NIKE, Inc. - Class B | 4.67% |
Allergan PLC | 4.36% |
Skechers U.S.A., Inc. - Class A | 4.35% |
Amazon.com, Inc. | 4.28% |
Universal Health Services, Inc. - Class B | 4.24% |
Acadia Healthcare Co., Inc. | 4.02% |
Electronic Arts, Inc. | 3.98% |
ABIOMED, Inc. | 3.76% |
Alaska Air Group, Inc. | 3.19% |
Lennar Corp. - Class A | 3.02% |
Top Ten Portfolio Industries | (% of Net Assets) |
Healthcare - Services | 9.91% |
Apparel | 9.01% |
Pharmaceuticals | 7.85% |
Internet | 6.93% |
Retail | 5.97% |
Home Builders | 5.86% |
Software | 3.98% |
Healthcare - Products | 3.76% |
Airlines | 3.19% |
Computers | 2.44% |
| | 58.90% |
Economic Sectors with Cash and Other Assets | (% of Net Assets) |
Consumer, Non-cyclical | 24.47% |
Consumer, Cyclical | 24.03% |
Money Market Funds | 22.76% |
Communications | 7.89% |
Technology | 6.42% |
Financial | 4.30% |
Other Assets in Excess of Liabilities | 10.13% |
| | 100.00% |
MONTEAGLE QUALITY GROWTH FUND
SUPPLEMENTARY PORTFOLIO INFORMATION — August 31, 2015 |
FUND PROFILE:
Top Ten Long-Term Portfolio Holdings | (% of Net Assets) |
Apple, Inc. | 5.38% |
Walt Disney Co. | 4.76% |
CVS Health Corp. | 3.13% |
Home Depot, Inc. | 3.07% |
Goldman Sachs Group, Inc. | 2.80% |
Express Scripts Holding Co. | 2.74% |
Coca-Cola Co. | 2.69% |
Visa, Inc. - Class A | 2.60% |
BlackRock, Inc. | 2.59% |
Johnson & Johnson | 2.37% |
Top Ten Portfolio Industries | (% of Net Assets) |
Retail | 11.41% |
Internet | 7.49% |
Media | 6.98% |
Pharmaceuticals | 6.87% |
Computers | 5.92% |
Diversified Financial Services | 5.20% |
Biotechnology | 4.97% |
Cosmetics & Personal Care | 4.16% |
Food | 4.09% |
Banks | 3.78% |
| | 60.87% |
Economic Sectors with Cash and Other Assets | (% of Net Assets) |
Consumer, Non-cyclical | 26.28% |
Consumer, Cyclical | 17.43% |
Communications | 17.01% |
Industrial | 11.33% |
Financial | 10.42% |
Technology | 8.64% |
Money Market Funds | 3.55% |
Basic Materials | 3.07% |
Energy | 2.21% |
Other Assets in Excess of Liabilities | 0.06% |
| | 100.00% |
MONTEAGLE SELECT VALUE FUND
SUPPLEMENTARY PORTFOLIO INFORMATION — August 31, 2015 |
FUND PROFILE:
Top Ten Long-Term Portfolio Holdings | (% of Net Assets) |
Darden Restaurants, Inc. | 4.18% |
Google, Inc. - Class A | 3.72% |
Priceline Group, Inc. | 3.67% |
Apple, Inc. | 3.40% |
Tesoro Corp. | 3.27% |
Michael Kors Holdings Ltd. | 3.24% |
Jacobs Engineering Group, Inc. | 3.19% |
Fossil Group, Inc. | 3.10% |
Target Corp. | 3.07% |
Diamond Offshore Drilling, Inc. | 3.03% |
Top Ten Portfolio Industries | (% of Net Assets) |
Oil & Gas | 14.04% |
Retail | 8.50% |
Internet | 7.39% |
Banks | 6.14% |
Computers | 6.14% |
Machinery - Construction & Mining | 5.62% |
Insurance | 5.61% |
Oil & Gas Services | 5.20% |
Iron & Steel | 3.76% |
Apparel | 3.24% |
| | 65.64% |
Economic Sectors with Cash and Other Assets | (% of Net Assets) |
Energy | 19.24% |
Consumer, Cyclical | 17.00% |
Financial | 16.32% |
Industrial | 14.32% |
Communications | 11.07% |
Money Market Funds | 9.71% |
Technology | 9.33% |
Basic Materials | 5.88% |
Utilities | 2.04% |
Consumer, Non-cyclical | 1.92% |
Liabilities in Excess of Other Assets | (6.83%) |
| | 100.00% |
MONTEAGLE VALUE FUND
SUPPLEMENTARY PORTFOLIO INFORMATION — August 31, 2015 |
FUND PROFILE:
Top Ten Long-Term Portfolio Holdings | (% of Net Assets) |
AT&T, Inc. | 3.69% |
Cirrus Logic, Inc. | 3.18% |
EI du Pont de Nemours & Co. | 3.08% |
Verizon Communications, Inc. | 3.07% |
DR Horton, Inc. | 3.04% |
Boston Scientific Corp. | 2.98% |
Wolseley PLC | 2.86% |
Merck & Co., Inc. | 2.74% |
Medtronic PLC | 2.73% |
Intel Corp. | 2.70% |
Top Ten Portfolio Industries | (% of Net Assets) |
Telecommunications | 10.13% |
Chemicals | 9.62% |
Oil & Gas | 8.28% |
Semiconductors | 7.64% |
Healthcare - Products | 5.71% |
Iron & Steel | 5.52% |
Miscellaneous Manufacturing | 4.16% |
Pharmaceuticals | 4.10% |
Packaging & Containers | 4.00% |
Retail | 3.53% |
| | 62.69% |
Economic Sectors with Cash and Other Assets | (% of Net Assets) |
Industrial | 18.96% |
Basic Materials | 18.00% |
Consumer, Non-cyclical | 12.36% |
Consumer, Cyclical | 11.94% |
Communications | 10.13% |
Money Market Funds | 9.50% |
Energy | 9.26% |
Technology | 7.64% |
Financial | 4.21% |
Utilities | 1.22% |
Liabilities in Excess of Other Assets | (3.22%) |
| | 100.00% |
THE TEXAS FUND
SUPPLEMENTARY PORTFOLIO INFORMATION — August 31, 2015 |
FUND PROFILE:
Top Ten Long-Term Portfolio Holdings | (% of Net Assets) |
DR Horton, Inc. | 1.07% |
Eagle Materials, Inc. | 1.05% |
Builders FirstSource, Inc. | 1.03% |
Adeptus Health, Inc. - Class A | 1.02% |
Fiesta Restaurant Group, Inc. | 0.99% |
El Paso Electric Co. | 0.99% |
Waste Connections, Inc. | 0.97% |
First Cash Financial Services, Inc. | 0.97% |
Six Flags Entertainment Corp. | 0.96% |
AZZ, Inc. | 0.95% |
Top Ten Portfolio Industries | (% of Net Assets) |
Retail | 7.13% |
Banks | 5.10% |
Oil & Gas | 3.62% |
Building Materials | 2.53% |
Software | 2.19% |
Oil & Gas Services | 1.98% |
Miscellaneous Manufacturing | 1.88% |
Entertainment | 1.81% |
Food | 1.55% |
Semiconductors | 1.49% |
| | 29.28% |
Economic Sectors with Cash and Other Assets | (% of Net Assets) |
Money Market Funds | 50.30% |
Consumer, Cyclical | 13.02% |
Industrial | 8.46% |
Financial | 7.86% |
Consumer, Non-cyclical | 6.41% |
Energy | 5.88% |
Technology | 4.05% |
Communications | 2.39% |
Utilities | 1.88% |
Basic Materials | 1.41% |
Call Options | 0.52% |
Liabilities in Excess of Other Assets | (2.18%) |
| | 100.00% |
MONTEAGLE FIXED INCOME FUND
SCHEDULE OF INVESTMENTS — August 31, 2015 |
Par Value | | U.S. GOVERNMENT AND AGENCY OBLIGATIONS (b) - 31.19% | | Fair Value | |
| | U.S. Treasury Notes - 26.55% | | | |
$ | 250,000 | | 1.50%, due 02/28/2019 | | $ | 252,136 | |
| | 250,000 | | 1.50%, due 08/31/2018 | | | 253,004 | |
| | 2,000,000 | | 1.625%, due 08/15/2022 | | | 1,958,580 | |
| | 2,000,000 | | 1.75%, due 05/15/2022 | | | 1,980,144 | |
| | 250,000 | | 1.75%, due 09/30/2019 | | | 253,457 | |
| | 250,000 | | 2.00%, due 02/15/2022 | | | 252,129 | |
| | 2,000,000 | | 2.00%, due 11/15/2021 | | | 2,017,434 | |
| | 250,000 | | 2.125%, due 06/30/2022 | | | 253,428 | |
| | 1,250,000 | | 2.125%, due 08/15/2021 | | | 1,272,884 | |
| | 250,000 | | 2.25%, due 03/31/2021 | | | 256,930 | |
| | 1,000,000 | | 2.25, due 11/15/2024 | | | 1,005,260 | |
| | 250,000 | | 2.50%, due 08/15/2023 | | | 258,140 | |
| | 750,000 | | 2.625%, due 08/15/2020 | | | 787,046 | |
| | 1,000,000 | | 3.125%, due 05/15/2021 | | | 1,074,427 | |
| | 250,000 | | 3.50%, due 02/15/2018 | | | 265,587 | |
| | 250,000 | | 3.625%, due 02/15/2020 | | | 273,032 | |
| | 500,000 | | 3.625%, due 02/15/2021 | | | 550,342 | |
| | 250,000 | | 4.75%, due 08/15/2017 | | | 269,318 | |
| | | | | | | 13,233,278 | |
| | | | Federal Home Loan Mortgage Corporation - 3.62% | | | | |
| | 500,000 | | 1.75%, due 05/30/2019 | | | 506,563 | |
| | 1,000,000 | | 4.875%, due 06/13/2018 | | | 1,103,217 | |
| | 175,000 | | 5.00%, due 12/14/2018 | | | 195,209 | |
| | | | | | | 1,804,989 | |
| | | | Federal National Mortgage Association - 1.02% | | | | |
| | 500,000 | | 1.875%, due 09/18/2018 | | | 510,389 | |
| | | | | | | | |
| | | | Total U.S. Government and Agency Obligations (Cost $15,567,118) | | | 15,548,656 | |
Par Value | | CORPORATE BONDS (b) - 50.77% | | Fair Value | |
| | Agriculture - 0.97% | | | |
$ | 500,000 | | Philip Morris International, Inc., 2.50%, due 08/22/2022 | | | 482,268 | |
| | | | | | | | |
| | | | Banks - 11.36% | | | | |
| | 500,000 | | Goldman Sachs Group, Inc., 5.95%, due 01/18/2018 | | | 545,129 | |
| | 500,000 | | JPMorgan Chase & Co., 4.35%, due 08/15/2021 | | | 534,474 | |
| | 500,000 | | JPMorgan Chase & Co., 6.00%, due 01/15/2018 | | | 546,716 | |
| | 500,000 | | Manufacturers & Traders Trust Co., 1.45%, due 03/07/2018 | | | 496,724 | |
| | 500,000 | | Morgan Stanley, 3.45%, due 11/02/2015 | | | 502,308 | |
| | 500,000 | | Northern Trust Corp., 2.375%, due 08/02/2022 | | | 485,862 | |
| | 500,000 | | PNC Funding Corp., 4.375%, due 08/11/2020 | | | 540,690 | |
The accompanying notes are an integral part of the financial statements.
MONTEAGLE FIXED INCOME FUND
SCHEDULE OF INVESTMENTS — August 31, 2015 (Continued) |
Par Value | | CORPORATE BONDS (b) - 50.77% (Continued) | | Fair Value | |
| | Banks - 11.36% (Continued) | | | |
$ | 500,000 | | U.S. Bancorp, 2.20%, due 11/15/2016 | | $ | 506,934 | |
| | 500,000 | | Wells Fargo & Co., 1.15%, 06/02/2017 | | | 498,848 | |
| | 500,000 | | Wells Fargo & Co., 3.45%, 02/13/2023 | | | 498,578 | |
| | 500,000 | | Westpac Banking Corp., 2.00%, due 08/14/2017 | | | 505,934 | |
| | | | | | | 5,662,197 | |
| | | | Beverages - 1.69% | | | | |
| | 750,000 | | Anheuser-Busch InBev Worldwide, Inc., 5.375%, due 01/15/2020 | | | 841,859 | |
| | | | | | | | |
| | | | Computers - 3.20% | | | | |
| | 1,000,000 | | Apple, Inc., 3.20%, 05/13/2025 | | | 996,401 | |
| | 600,000 | | International Business Machines Corp., 1.25%, 02/08/2018 | | | 597,594 | |
| | | | | | | 1,593,995 | |
| | | | Diversified Financial Services - 2.65% | | | | |
| | 250,000 | | CME Group, Inc., 3.00%, due 09/15/2022 | | | 248,902 | |
| | 500,000 | | General Electric Capital Corp., 3.15%, due 09/07/2022 | | | 503,238 | |
| | 500,000 | | General Electric Capital Corp., 5.55%, due 05/04/2020 | | | 568,037 | |
| | | | | | | 1,320,177 | |
| | | | Electric - 2.79% | | | | |
| | 500,000 | | Duke Energy Florida, LLC, 4.55%, due 04/01/2020 | | | 550,242 | |
| | 770,000 | | Georgia Power Co., 4.25%, due 12/01/2019 | | | 839,316 | |
| | | | | | | 1,389,558 | |
| | | | Electrical Components & Equipment - 0.53% | | | | |
| | 250,000 | | Emerson Electric Co., 5.125%, due 12/01/2016 | | | 262,930 | |
| | | | | | | | |
| | | | Engineering & Construction - 0.71% | | | | |
| | 350,000 | | Fluor Corp., 3.50% due 12/15/2024 | | | 355,215 | |
| | | | | | | | |
| | | | Healthcare - Products - 1.99% | | | | |
| | 750,000 | | Becton Dickinson and Co., 3.125%, due 11/08/2021 | | | 742,128 | |
| | 250,000 | | Medtronic, Inc., 3.125%, 03/15/2022 | | | 252,817 | |
| | | | | | | 994,945 | |
| | | | Insurance - 2.69% | | | | |
| | 500,000 | | Berkshire Hathaway Finance Corp., 3.00%, due 05/15/2022 | | | 508,108 | |
| | 750,000 | | Chubb Corp., 5.75%, due 05/15/2018 | | | 832,829 | |
| | | | | | | 1,340,937 | |
| | | | Machinery - Diversified - 1.63% | | | | |
| | 750,000 | | Deere & Co., 4.375%, due 10/16/2019 | | | 812,050 | |
| | | | | | | | |
| | | | Metal Fabricate & Hardware - 0.95% | | | | |
| | 500,000 | | Precision Castparts Corp., 2.50%, due 01/15/2023 | | | 475,753 | |
The accompanying notes are an integral part of the financial statements.
MONTEAGLE FIXED INCOME FUND
SCHEDULE OF INVESTMENTS — August 31, 2015 (Continued) |
Par Value | | CORPORATE BONDS (b) - 50.77% (Continued) | | Fair Value | |
| | Miscellaneous Manufacturing - 0.99% | | | |
$ | 250,000 | | 3M Co., 1.00%, due 06/26/2017 | | $ | 250,829 | |
| | 250,000 | | 3M Co., 2.00%, due 06/26/2022 | | | 241,756 | |
| | | | | | | 492,585 | |
| | | | Oil & Gas - 2.48% | | | | |
| | 500,000 | | BP Capital Markets PLC, 2.50%, due 11/06/2022 | | | 473,639 | |
| | 250,000 | | BP Capital Markets PLC, 4.75%, due 03/10/2019 | | | 272,567 | |
| | 250,000 | | Shell International Finance BV, 1.125%, due 08/21/2017 | | | 249,711 | |
| | 250,000 | | Shell International Finance BV, 2.375%, due 08/21/2022 | | | 239,092 | |
| | | | | | | 1,235,009 | |
| | | | Oil & Gas Services - 1.51% | | | | |
| | 750,000 | | Halliburton Co., 2.00%, due 08/01/2018 | | | 753,143 | |
| | | | | | | | |
| | | | Pharmaceuticals - 3.65% | | | | |
| | 750,000 | | Allergan, Inc., 5.75%, due 04/01/2016 | | | 768,709 | |
| | 500,000 | | AstraZeneca PLC, 1.95%, due 09/18/2019 | | | 496,800 | |
| | 500,000 | | GlaxoSmithKline Capital, Inc., 5.65%, due 05/15/2018 | | | 553,631 | |
| | | | | | | 1,819,140 | |
| | | | Real Estate Investment Trusts - 1.52% | | | | |
| | 750,000 | | Simon Property Group LP, 2.20%, due 02/01/2019 | | | 756,703 | |
| | | | | | | | |
| | | | Retail - 0.99% | | | | |
| | 250,000 | | Costco Wholesale Corp., 1.125%, due 12/15/2017 | | | 248,869 | |
| | 250,000 | | Costco Wholesale Corp., 1.70%, due 12/15/2019 | | | 246,916 | |
| | | | | | | 495,785 | |
| | | | Semiconductors - 4.18% | | | | |
| | 750,000 | | Broadcom Corp., 2.70%, 11/01/2018 | | | 763,379 | |
| | 350,000 | | Intel Corp., 1.35%, 12/15/2017 | | | 349,608 | |
| | 1,000,000 | | Qualcomm, Inc., 3.00%, 05/20/2022 | | | 972,278 | |
| | | | | | | 2,085,265 | |
| | | | Software - 0.97% | | | | |
| | 500,000 | | Oracle Corp., 2.50%, due 10/15/2022 | | | 482,245 | |
| | | | | | | | |
| | | | Telecommunications - 3.32% | | | | |
| | 750,000 | | AT&T, Inc., 5.80%, due 02/15/2019 | | | 830,629 | |
| | 750,000 | | Cisco Systems, Inc., 4.95%, due 02/15/2019 | | | 823,648 | |
| | | | | | | 1,654,277 | |
| | | | | | | | |
| | | | Total Corporate Bonds (Cost $25,196,640) | | | 25,306,036 | |
The accompanying notes are an integral part of the financial statements.
MONTEAGLE FIXED INCOME FUND
SCHEDULE OF INVESTMENTS — August 31, 2015 (Continued) |
Par Value | | MORTGAGE-BACKED SECURITIES (b) - 12.57% | | Fair Value | |
| | Federal Home Loan Mortgage Corporation - 3.39% | | | |
$ | 908,132 | | Pool G08618, 4.00%, due 12/01/2044 | | $ | 964,949 | |
| | 475,101 | | Pool J19285, 2.50%, due 06/01/2027 | | | 487,134 | |
| | 57,421 | | Series 15L, 7.00%, due 07/25/2023 | | | 65,373 | |
| | 164,791 | | Series 2841 BY, 5.00%, due 08/15/2019 | | | 172,123 | |
| | | | | | | 1,689,579 | |
| | | | Federal National Mortgage Association - 8.34% | | | | |
| | 68,879 | | Pool 545759, 6.50%, due 07/01/2032 | | | 80,340 | |
| | 8,479 | | Pool 725421, 7.00%, due 09/01/2017 | | | 8,676 | |
| | 33,311 | | Pool 754289, 6.00%, due 11/01/2033 | | | 37,623 | |
| | 68,471 | | Pool 882684, 6.00%, due 06/01/2036 | | | 78,357 | |
| | 1,675,171 | | Pool AB3690, 4.00%, due 10/01/2041 | | | 1,789,954 | |
| | 436,694 | | Pool AL1869, 3.00%, due 06/01/2027 | | | 454,603 | |
| | 942,147 | | Pool AU3763, 3.50%, due 08/01/2043 | | | 979,719 | |
| | 76,439 | | Series 2007-40-PT, 5.50%, due 05/25/2037 | | | 85,184 | |
| | 323,997 | | Pool AL5097, 4.50%, due 09/01/2043 | | | 351,977 | |
| | 279,924 | | Pool AU1619, 3.50%, due 07/01/2043 | | | 291,051 | |
| | | | | | | 4,157,484 | |
| | | | Government National Mortgage Association - 0.84% | | | | |
| | 74,171 | | Pool 476998, 6.50%, due 07/15/2029 | | | 84,823 | |
| | 36,995 | | Pool 648337, 5.00%, due 10/15/2020 | | | 39,373 | |
| | 25,757 | | Pool 676516, 6.00%, due 02/15/2038 | | | 29,178 | |
| | 78,234 | | Series 2012-52-PM, 3.50%, due 12/20/2039 | | | 82,773 | |
| | 188,410 | | Series 2012-91-HQ, 2.00%, due 09/20/2041 | | | 183,383 | |
| | | | | | | 419,530 | |
| | | | | | | | |
| | | | Total Mortgage-Backed Securities (Cost $6,224,590) | | | 6,266,593 | |
Shares | | MONEY MARKET FUNDS - 4.82% | | Fair Value | |
| | 2,403,274 | | Fidelity Institutional Money Market Fund Class I, 0.17% (a) (Cost $2,403,274) | | $ | 2,403,274 | |
| | | | | | | | |
| | | | Total Investments at Fair Value - 99.35% (Cost $49,391,622) | | $ | 49,524,559 | |
| | | | | | | | |
| | | | Other Assets in Excess of Liabilities, Net - 0.65% | | | 326,388 | |
| | | | | | | | |
| | | | Net Assets - 100.00% | | $ | 49,850,947 | |
(a) | Rate shown represents the 7-day yield at August 31, 2015, is subject to change and resets daily. |
(b) | Categorized in level 2 of the fair value hierarchy; for additional information and description of the levels, refer to the table included in Note 2 of the accompanying notes to the financial statements. |
The accompanying notes are an integral part of the financial statements.
MONTEAGLE INFORMED INVESTOR GROWTH FUND
SCHEDULE OF INVESTMENTS — August 31, 2015 |
Shares | | COMMON STOCKS - 67.11% | | Fair Value | |
| | Airlines - 3.19% | | | |
| | 5,100 | | Alaska Air Group, Inc. | | $ | 381,786 | |
| | | | | | | | |
| | | | Apparel - 9.01% | | | | |
| | 5,000 | | NIKE, Inc. - Class B | | | 558,750 | |
| | 3,700 | | Skechers U.S.A., Inc. - Class A (a) | | | 520,738 | |
| | | | | | | 1,079,488 | |
| | | | Beverages - 1.97% | | | | |
| | 1,700 | | Monster Beverage Corp. (a) | | | 235,382 | |
| | | | | | | | |
| | | | Biotechnology - 0.99% | | | | |
| | 1,000 | | Celgene Corp. (a) | | | 118,080 | |
| | | | | | | | |
| | | | Computers - 2.44% | | | | |
| | 5,000 | | Manhattan Associates, Inc. (a) | | | 292,400 | |
| | | | | | | | |
| | | | Healthcare - Products - 3.76% | | | | |
| | 4,700 | | ABIOMED, Inc. (a) | | | 450,730 | |
| | | | | | | | |
| | | | Healthcare - Services - 9.91% | | | | |
| | 6,600 | | Acadia Healthcare Co., Inc. (a) | | | 481,998 | |
| | 1,700 | | UnitedHealth Group, Inc. | | | 196,690 | |
| | 3,700 | | Universal Health Services, Inc. - Class B | | | 507,418 | |
| | | | | | | 1,186,106 | |
| | | | Home Builders - 5.86% | | | | |
| | 11,200 | | DR Horton, Inc. | | | 340,144 | |
| | 7,100 | | Lennar Corp. - Class A | | | 361,390 | |
| | | | | | | 701,534 | |
| | | | Insurance - 2.04% | | | | |
| | 6,300 | | First American Financial Corp. | | | 244,818 | |
| | | | | | | | |
| | | | Internet - 6.93% | | | | |
| | 1,000 | | Amazon.com, Inc. (a) | | | 512,890 | |
| | 1,200 | | Netflix, Inc. (a) | | | 138,036 | |
| | 2,000 | | Facebook, Inc. - Class A (a) | | | 178,860 | |
| | | | | | | 829,786 | |
| | | | Pharmaceuticals - 7.85% | | | | |
| | 1,895 | | AbbVie, Inc. | | | 118,267 | |
| | 1,720 | | Allergan PLC (a) | | | 522,433 | |
| | 1,300 | | Valeant Pharmaceuticals International, Inc. (a) | | | 299,780 | |
| | | | | | | 940,480 | |
| | | | Real Estate Investment Trusts - 2.25% | | | | |
| | 1,000 | | Equinix, Inc. | | | 269,770 | |
The accompanying notes are an integral part of the financial statements.
MONTEAGLE INFORMED INVESTOR GROWTH FUND
SCHEDULE OF INVESTMENTS — August 31, 2015 (Continued) |
Shares | | COMMON STOCKS - 67.11% (Continued) | | Fair Value | |
| | Retail - 5.97% | | | |
| | 200 | | Chipotle Mexican Grill, Inc. (a) | | $ | 142,002 | |
| | 2,000 | | Domino's Pizza, Inc. | | | 211,880 | |
| | 6,600 | | Starbucks Corp. | | | 361,086 | |
| | | | | | | 714,968 | |
| | | | Software - 3.98% | | | | |
| | 7,200 | | Electronic Arts, Inc. (a) | | | 476,280 | |
| | | | | | | | |
| | | | Telecommunications - 0.96% | | | | |
| | 700 | | Palo Alto Networks, Inc. (a) | | | 114,954 | |
| | | | | | | | |
| | | | Total Common Stocks (Cost $7,796,445) | | | 8,036,562 | |
Shares | | MONEY MARKET FUND - 22.76% | | Fair Value | |
| | 2,726,201 | | Fidelity Institutional Money Market Fund Class I, 0.17% (b) (Cost $2,726,201) | | $ | 2,726,201 | |
| | | | | | | | |
| | | | Total Investments at Fair Value - 89.87% (Cost $10,522,646) | | $ | 10,762,763 | |
| | | | | | | | |
| | | | Other Assets in Excess of Liabilities, Net - 10.13% | | | 1,212,590 | |
| | | | | | | | |
| | | | Net Assets - 100.00% | | $ | 11,975,353 | |
(a) | Non-income producing security. |
(b) | Rate shown represents the 7-day yield at August 31, 2015, is subject to change and resets daily. |
The accompanying notes are an integral part of the financial statements.
MONTEAGLE QUALITY GROWTH FUND
SCHEDULE OF INVESTMENTS — August 31, 2015 |
Shares | | COMMON STOCKS - 96.39% | | Fair Value | |
| | Apparel - 1.64% | | | |
| | 1,381 | | Deckers Outdoor Corp. (a) | | $ | 88,923 | |
| | 2,836 | | NIKE, Inc. - Class B | | | 316,923 | |
| | | | | | | 405,846 | |
| | | | Banks - 3.78% | | | | |
| | 3,680 | | Goldman Sachs Group, Inc. | | | 694,048 | |
| | 4,555 | | Wells Fargo & Co. | | | 242,918 | |
| | | | | | | 936,966 | |
| | | | Beverages - 2.69% | | | | |
| | 16,910 | | Coca-Cola Co. | | | 664,901 | |
| | | | | | | | |
| | | | Biotechnology - 4.97% | | | | |
| | 1,054 | | Amgen, Inc. | | | 159,976 | |
| | 651 | | Biogen, Inc. (a) | | | 193,542 | |
| | 4,129 | | Celgene Corp. (a) | | | 487,552 | |
| | 3,715 | | Gilead Sciences, Inc. | | | 390,335 | |
| | | | | | | 1,231,405 | |
| | | | Chemicals - 3.07% | | | | |
| | 1,225 | | Albemarle Corp. | | | 55,382 | |
| | 6,900 | | CF Industries Holdings, Inc. | | | 395,922 | |
| | 2,926 | | Praxair, Inc. | | | 309,425 | |
| | | | | | | 760,729 | |
| | | | Commercial Services - 1.63% | | | | |
| | 11,511 | | PayPal Holdings, Inc. (a) | | | 402,885 | |
| | | | | | | | |
| | | | Computers - 5.92% | | | | |
| | 11,811 | | Apple, Inc. | | | 1,331,808 | |
| | 900 | | International Business Machines Corp. | | | 133,101 | |
| | | | | | | 1,464,909 | |
| | | | Cosmetics & Personal Care - 4.16% | | | | |
| | 7,799 | | Colgate-Palmolive Co. | | | 489,855 | |
| | 3,453 | | Estee Lauder Cos., Inc. | | | 275,446 | |
| | 3,739 | | Procter & Gamble Co. | | | 264,235 | |
| | | | | | | 1,029,536 | |
| | | | Distribution & Wholesale - 1.97% | | | | |
| | 2,178 | | WW Grainger, Inc. | | | 486,652 | |
| | | | | | | | |
| | | | Diversified Financial Services - 5.20% | | | | |
| | 2,122 | | BlackRock, Inc. | | | 641,841 | |
| | 9,040 | | Visa, Inc. - Class A | | | 644,552 | |
| | | | | | | 1,286,393 | |
| | | | Electrical Components & Equipment - 2.13% | | | | |
| | 7,388 | | AMETEK, Inc. | | | 397,622 | |
| | 4,555 | | FLIR Systems, Inc. | | | 130,410 | |
| | | | | | | 528,032 | |
The accompanying notes are an integral part of the financial statements.
MONTEAGLE QUALITY GROWTH FUND
SCHEDULE OF INVESTMENTS — August 31, 2015 (Continued) |
Shares | | COMMON STOCKS - 96.39% (Continued) | | Fair Value | |
| | Electronics - 2.38% | | | |
| | 8,640 | | Amphenol Corp. - Class A | | $ | 452,390 | |
| | 7,254 | | Trimble Navigation Ltd. (a) | | | 137,101 | |
| | | | | | | 589,491 | |
| | | | Entertainment - 1.05% | | | | |
| | 7,285 | | Cinemark Holdings, Inc. | | | 258,982 | |
| | | | | | | | |
| | | | Food - 4.09% | | | | |
| | 4,418 | | Hershey Co. | | | 395,499 | |
| | 2,475 | | J.M. Smucker Co. | | | 291,357 | |
| | 3,185 | | McCormick & Co., Inc. | | | 252,507 | |
| | 2,250 | | Whole Foods Market, Inc. | | | 73,710 | |
| | | | | | | 1,013,073 | |
| | | | Healthcare - Products - 0.87% | | | | |
| | 5,592 | | Baxter International, Inc. | | | 215,012 | |
| | | | | | | | |
| | | | Healthcare - Services - 1.00% | | | | |
| | 2,143 | | UnitedHealth Group, Inc. | | | 247,945 | |
| | | | | | | | |
| | | | Internet - 7.49% | | | | |
| | 900 | | Amazon.com, Inc. (a) | | | 461,601 | |
| | 8,670 | | eBay, Inc. (a) | | | 235,044 | |
| | 2,772 | | Facebook, Inc. - Class A (a) | | | 247,900 | |
| | 774 | | Google, Inc. - Class A (a) | | | 501,413 | |
| | 661 | | Google, Inc. - Class C (a) | | | 408,663 | |
| | | | | | | 1,854,621 | |
| | | | Leisure Time - 1.37% | | | | |
| | 2,618 | | Polaris Industries, Inc. | | | 340,000 | |
| | | | | | | | |
| | | | Machinery - Construction & Mining - 1.12% | | | | |
| | 3,616 | | Caterpillar, Inc. | | | 276,407 | |
| | | | | | | | |
| | | | Machinery - Diversified - 1.55% | | | | |
| | 2,374 | | Roper Industries, Inc. | | | 384,802 | |
| | | | | | | | |
| | | | Media - 6.98% | | | | |
| | 7,695 | | Comcast Corp. - Class A | | | 433,459 | |
| | 11,564 | | Walt Disney Co. | | | 1,178,140 | |
| | 5,589 | | Time, Inc. | | | 116,084 | |
| | | | | | | 1,727,683 | |
| | | | Miscellaneous Manufacturing - 1.38% | | | | |
| | 2,410 | | 3M Co. | | | 342,555 | |
The accompanying notes are an integral part of the financial statements.
MONTEAGLE QUALITY GROWTH FUND
SCHEDULE OF INVESTMENTS — August 31, 2015 (Continued) |
Shares | | COMMON STOCKS - 96.39% (Continued) | | Fair Value | |
| | Oil & Gas - 2.21% | | | |
| | 1,409 | | Concho Resources, Inc. (a) | | $ | 152,398 | |
| | 5,254 | | Exxon Mobil Corp. | | | 395,311 | |
| | | | | | | 547,709 | |
| | | | Pharmaceuticals - 6.87% | | | | |
| | 4,102 | | Bristol-Myers Squibb Co. | | | 243,946 | |
| | 8,125 | | Express Scripts Holding Co. (a) | | | 679,250 | |
| | 6,243 | | Johnson & Johnson | | | 586,717 | |
| | 5,947 | | Pfizer, Inc. | | | 191,612 | |
| | | | | | | 1,701,525 | |
| | | | Real Estate Investment Trusts - 1.44% | | | | |
| | 3,873 | | American Tower Corp. | | | 357,052 | |
| | | | | | | | |
| | | | Retail - 11.41% | | | | |
| | 2,027 | | Costco Wholesale Corp. | | | 283,881 | |
| | 7,579 | | CVS Health Corp. | | | 776,090 | |
| | 5,379 | | Dunkin' Brands Group, Inc. | | | 269,811 | |
| | 6,527 | | Home Depot, Inc. | | | 760,135 | |
| | 3,852 | | Wal-Mart Stores, Inc. | | | 249,340 | |
| | 6,088 | | Yum! Brands, Inc. | | | 485,640 | |
| | | | | | | 2,824,897 | |
| | | | Semiconductors - 2.07% | | | | |
| | 9,060 | | QUALCOMM, Inc. | | | 512,615 | |
| | | | | | | | |
| | | | Software - 0.65% | | | | |
| | 4,352 | | Oracle Corp. | | | 161,416 | |
| | | | | | | | |
| | | | Telecommunications - 2.54% | | | | |
| | 6,733 | | Cisco Systems, Inc. | | | 174,250 | |
| | 9,905 | | Verizon Communications, Inc. | | | 455,730 | |
| | | | | | | 629,980 | |
| | | | Transportation - 2.76% | | | | |
| | 3,380 | | FedEx Corp. | | | 509,062 | |
| | 2,037 | | Union Pacific Corp. | | | 174,652 | |
| | | | | | | 683,714 | |
| | | | | | | | |
| | | | Total Common Stocks (Cost $18,403,814) | | | 23,867,733 | |
The accompanying notes are an integral part of the financial statements.
MONTEAGLE QUALITY GROWTH FUND
SCHEDULE OF INVESTMENTS — August 31, 2015 (Continued) |
Shares | | MONEY MARKET FUND - 3.55% | | Fair Value | |
| | 879,901 | | Fidelity Institutional Money Market Fund Class I, 0.17% (b) (Cost $879,901) | | $ | 879,901 | |
| | | | | | | | |
| | | | Total Investments at Fair Value - 99.94% (Cost $19,283,715) | | $ | 24,747,634 | |
| | | | | | | | |
| | | | Other Assets in Excess of Liabilities, Net - 0.06% | | | 15,191 | |
| | | | | | | | |
| | | | Net Assets - 100.00% | | $ | 24,762,825 | |
(a) | Non-income producing security. |
(b) | Rate shown represents the 7-day yield at August 31, 2015, is subject to change and resets daily. |
The accompanying notes are an integral part of the financial statements.
MONTEAGLE SELECT VALUE FUND
SCHEDULE OF INVESTMENTS — August 31, 2015 |
Shares | | COMMON STOCKS - 97.13% | | Fair Value | |
| | Apparel - 3.24% | | | |
| | 10,200 | | Michael Kors Holdings Ltd. (a) | | $ | 443,292 | |
| | | | | | | | |
| | | | Banks - 6.14% | | | | |
| | 7,400 | | Bank of America Corp. | | | 120,916 | |
| | 15,650 | | Fifth Third Bancorp | | | 311,748 | |
| | 11,849 | | Morgan Stanley | | | 408,198 | |
| | | | | | | 840,862 | |
| | | | Commercial Services - 1.93% | | | | |
| | 3,800 | | United Rentals, Inc. (a) | | | 263,454 | |
| | | | | | | | |
| | | | Computers - 6.14% | | | | |
| | 4,123 | | Apple, Inc. | | | 464,909 | |
| | 2,537 | | International Business Machines Corp. | | | 375,197 | |
| | | | | | | 840,106 | |
| | | | Distribution & Wholesale - 3.10% | | | | |
| | 6,884 | | Fossil Group, Inc. (a) | | | 423,917 | |
| | | | | | | | |
| | | | Diversified Financial Services - 1.50% | | | | |
| | 2,180 | | CME Group, Inc. | | | 205,879 | |
| | | | | | | | |
| | | | Electric - 2.04% | | | | |
| | 9,085 | | Exelon Corp. | | | 279,455 | |
| | | | | | | | |
| | | | Engineering & Construction - 3.19% | | | | |
| | 10,809 | | Jacobs Engineering Group, Inc. (a) | | | 436,792 | |
| | | | | | | | |
| | | | Insurance - 5.61% | | | | |
| | 6,760 | | Aflac, Inc. | | | 396,136 | |
| | 6,388 | | Allstate Corp. | | | 372,293 | |
| | | | | | | 768,429 | |
| | | | Internet - 7.39% | | | | |
| | 786 | | Google, Inc. - Class A (a) | | | 509,187 | |
| | 402 | | Priceline Group, Inc. (a) | | | 501,953 | |
| | | | | | | 1,011,140 | |
| | | | Iron & Steel - 3.76% | | | | |
| | 10,872 | | Allegheny Technologies, Inc. | | | 209,938 | |
| | 7,053 | | Nucor Corp. | | | 305,324 | |
| | | | | | | 515,262 | |
| | | | Machinery - Construction & Mining - 5.62% | | | | |
| | 4,653 | | Caterpillar, Inc. | | | 355,675 | |
| | 17,061 | | Joy Global, Inc. | | | 413,217 | |
| | | | | | | 768,892 | |
| | | | Machinery - Diversified - 2.05% | | | | |
| | 2,305 | | Cummins, Inc. | | | 280,634 | |
The accompanying notes are an integral part of the financial statements.
MONTEAGLE SELECT VALUE FUND
SCHEDULE OF INVESTMENTS — August 31, 2015 (Continued) |
Shares | | COMMON STOCKS - 97.13% (Continued) | | Fair Value | |
| | Media - 2.72% | | | |
| | 13,971 | | Discovery Communications, Inc. (a) | | $ | 371,628 | |
| | | | | | | | |
| | | | Mining - 2.11% | | | | |
| | 27,163 | | Freeport-McMoRan, Inc. | | | 289,014 | |
| | | | | | | | |
| | | | Miscellaneous Manufacturing - 1.32% | | | | |
| | 7,300 | | General Electric Co. | | | 181,186 | |
| | | | | | | | |
| | | | Office & Business Equipment - 3.19% | | | | |
| | 14,528 | | Pitney Bowes, Inc. | | | 287,800 | |
| | 14,634 | | Xerox Corp. | | | 148,828 | |
| | | | | | | 436,628 | |
| | | | Oil & Gas - 14.04% | | | | |
| | 2,200 | | ConocoPhillips | | | 108,130 | |
| | 17,520 | | Diamond Offshore Drilling, Inc. (d) | | | 415,399 | |
| | 22,863 | | Ensco PLC - Class A | | | 414,049 | |
| | 19,300 | | Noble Corp. PLC (d) | | | 251,286 | |
| | 4,860 | | Tesoro Corp. | | | 447,169 | |
| | 20,100 | | Transocean Ltd. (d) | | | 286,023 | |
| | | | | | | 1,922,056 | |
| | | | Oil & Gas Services - 5.20% | | | | |
| | 6,513 | | Baker Hughes, Inc. | | | 364,728 | |
| | 8,200 | | National Oilwell Varco, Inc. | | | 347,106 | |
| | | | | | | 711,834 | |
| | | | Real Estate Investment Trusts - 1.77% | | | | |
| | 6,520 | | HCP, Inc. | | | 241,631 | |
| | | | | | | | |
| | | | Retail - 8.50% | | | | |
| | 8,406 | | Darden Restaurants, Inc. | | | 571,692 | |
| | 3,385 | | Kohl's Corp. | | | 172,737 | |
| | 5,400 | | Target Corp. | | | 419,634 | |
| | | | | | | 1,164,063 | |
| | | | Savings & Loans - 1.30% | | | | |
| | 19,082 | | Hudson City Bancorp, Inc. | | | 177,463 | |
| | | | | | | | |
| | | | Telecommunications - 0.97% | | | | |
| | 4,000 | | AT & T, Inc. | | | 132,800 | |
| | | | | | | | |
| | | | Toys, Games & Hobbies - 2.16% | | | | |
| | 12,640 | | Mattel, Inc. | | | 296,155 | |
| | | | | | | | |
| | | | Transportation - 2.14% | | | | |
| | 4,351 | | CH Robinson Worldwide, Inc. | | | 293,388 | |
| | | | | | | | |
| | | | Total Common Stocks (Cost $13,539,285) | | | 13,295,960 | |
The accompanying notes are an integral part of the financial statements.
MONTEAGLE SELECT VALUE FUND
SCHEDULE OF INVESTMENTS — August 31, 2015 (Continued) |
Shares | | MONEY MARKET FUND - 9.70% | | Fair Value | |
| | 1,328,617 | | Fidelity Institutional Money Market Fund Class I, 0.17% (b) (c) (Cost $1,328,617) | | $ | 1,328,617 | |
| | | | | | | | |
| | | | Total Investments at Fair Value - 106.83% (Cost $14,867,902) | | $ | 14,624,577 | |
| | | | | | | | |
| | | | Liabilities in Excess of Other Assets, Net - (6.83%) | | | (935,198 | ) |
| | | | | | | | |
| | | | Net Assets - 100.00% | | $ | 13,689,379 | |
(a) | Non-income producing security. |
(b) | Rate shown represents the 7-day yield at August 31, 2015, is subject to change and resets daily. |
(c) | A portion of this security is segregated as collateral for securities on loan at August 31, 2015. Total collateral had a fair value of $956,708 at August 31, 2015. |
(d) | Security, or a portion of the security, is out on loan at August 31, 2015. Total loaned securities had a fair value of $944,413 at August 31, 2015. |
The accompanying notes are an integral part of the financial statements.
MONTEAGLE VALUE FUND
SCHEDULE OF INVESTMENTS — August 31, 2015 |
Shares | | COMMON STOCKS - 93.72% | | Fair Value | |
| | Aerospace & Defense - 1.76% | | | |
| | 6,400 | | Triumph Group, Inc. | | $ | 316,096 | |
| | | | | | | | |
| | | | Auto Manufacturers - 2.50% | | | | |
| | 32,500 | | Ford Motor Co. | | | 450,775 | |
| | | | | | | | |
| | | | Chemicals - 9.62% | | | | |
| | 2,150 | | Chemours Co. | | | 20,790 | |
| | 10,750 | | EI Du Pont de Nemour & Co. | | | 553,625 | |
| | 18,800 | | Huntsman Corp. | | | 310,764 | |
| | 10,800 | | Mosaic Co. | | | 440,964 | |
| | 9,000 | | Stepan Co. | | | 405,270 | |
| | | | | | | 1,731,413 | |
| | | | Distribution & Wholesale - 2.86% | | | | |
| | 79,558 | | Wolseley PLC - ADR | | | 515,536 | |
| | | | | | | | |
| | | | Diversified Financial Services - 2.48% | | | | |
| | 4,813 | | Macquarie Group Ltd. - ADR | | | 259,180 | |
| | 30,000 | | Nomura Holdings, Inc. - ADR | | | 188,100 | |
| | | | | | | 447,280 | |
| | | | Electric - 1.22% | | | | |
| | 11,000 | | NRG Energy, Inc. | | | 219,120 | |
| | | | | | | | |
| | | | Electrical Components & Equipment - 2.10% | | | | |
| | 30,000 | | Schneider Electric SA - ADR | | | 377,850 | |
| | | | | | | | |
| | | | Engineering & Components - 1.57% | | | | |
| | 6,200 | | Fluor Corp. | | | 282,844 | |
| | | | | | | | |
| | | | Environmental Control - 2.50% | | | | |
| | 11,000 | | Republic Services, Inc. | | | 450,780 | |
| | | | | | | | |
| | | | Food - 2.56% | | | | |
| | 28,000 | | Dean Foods Co. | | | 460,880 | |
| | | | | | | | |
| | | | Healthcare - Products - 5.71% | | | | |
| | 32,000 | | Boston Scientific Corp. (a) | | | 535,680 | |
| | 6,800 | | Medtronic, PLC | | | 491,572 | |
| | | | | | | 1,027,252 | |
| | | | Home Builders - 3.04% | | | | |
| | 18,000 | | DR Horton, Inc. | | | 546,660 | |
The accompanying notes are an integral part of the financial statements.
MONTEAGLE VALUE FUND
SCHEDULE OF INVESTMENTS — August 31, 2015 (Continued) |
Shares | | COMMON STOCKS - 93.72% (Continued) | | Fair Value | |
| | Iron & Steel - 5.52% | | | |
| | 23,000 | | Commercial Metals Co. | | $ | 361,100 | |
| | 7,500 | | Nucor Corp. | | | 324,675 | |
| | 12,000 | | Worthington Industries, Inc. | | | 307,080 | |
| | | | | | | 992,855 | |
| | | | Mining - 2.87% | | | | |
| | 33,000 | | Barrick Gold Corp. | | | 229,350 | |
| | 12,000 | | Freeport-McMoRan, Inc. | | | 127,680 | |
| | 85,000 | | Yamana Gold, Inc. | | | 159,800 | |
| | | | | | | 516,830 | |
| | | | Miscellaneous Manufacturing - 4.16% | | | | |
| | 13,000 | | General Electric Co. | | | 322,660 | |
| | 11,000 | | Textron, Inc. | | | 426,800 | |
| | | | | | | 749,460 | |
| | | | Oil & Gas - 8.28% | | | | |
| | 10,000 | | CVR Energy, Inc. | | | 402,100 | |
| | 5,000 | | Exxon Mobil Corp. | | | 376,200 | |
| | 7,600 | | HollyFrontier Corp. | | | 356,136 | |
| | 12,000 | | Marathon Oil Corp. | | | 207,480 | |
| | 10,494 | | Transocean Ltd. (d) | | | 149,330 | |
| | | | | | | 1,491,246 | |
| | | | Oil & Gas Services - 0.98% | | | | |
| | 9,000 | | Steel Excel, Inc. (a) | | | 175,500 | |
| | | | | | | | |
| | | | Packaging & Containers - 4.00% | | | | |
| | 9,300 | | Greif, Inc. - Class A | | | 272,304 | |
| | 11,400 | | Sonoco Products Co. | | | 448,248 | |
| | | | | | | 720,552 | |
| | | | Pharmaceuticals - 4.10% | | | | |
| | 9,147 | | Merck & Co., Inc. | | | 492,566 | |
| | 10,000 | | Takeda Pharmaceutical Co. Ltd. - ADR | | | 245,350 | |
| | | | | | | 737,916 | |
| | | | Real Estate Investment Trusts - 1.72% | | | | |
| | 13,500 | | Rayonier, Inc. | | | 310,500 | |
| | | | | | | | |
| | | | Retail - 3.53% | | | | |
| | 13,000 | | Abercrombie & Fitch Co. - Class A (d) | | | 258,180 | |
| | 12,500 | | Coach, Inc. | | | 378,125 | |
| | | | | | | 636,305 | |
| | | | Semiconductors - 7.64% | | | | |
| | 19,000 | | Cirrus Logic, Inc. (a) | | | 573,040 | |
| | 17,000 | | Intel Corp. | | | 485,180 | |
| | 30,000 | | Kulicke & Soffa Industries, Inc. (a) | | | 316,800 | |
| | | | | | | 1,375,020 | |
The accompanying notes are an integral part of the financial statements.
MONTEAGLE VALUE FUND
SCHEDULE OF INVESTMENTS — August 31, 2015 (Continued) |
Shares | | COMMON STOCKS - 93.72% (Continued) | | Fair Value | |
| | Telecommunications - 10.13% | | | |
| | 20,000 | | AT & T, Inc. | | $ | 664,000 | |
| | 31,000 | | FIH Mobile Ltd. - ADR (e) | | | 275,999 | |
| | 9,700 | | Rogers Communications, Inc. - Class B | | | 330,964 | |
| | 12,000 | | Verizon Communications, Inc. | | | 552,120 | |
| | | | | | | 1,823,083 | |
| | | | Transportation - 2.87% | | | | |
| | 11,000 | | CSX Corp. | | | 301,180 | |
| | 12,000 | | Tidewater, Inc. (d) | | | 215,160 | |
| | | | | | | 516,340 | |
| | | | | | | | |
| | | | Total Common Stocks (Cost $16,510,587) | | | 16,872,093 | |
Shares | | MONEY MARKET FUND - 9.50% | | Fair Value | |
| | 1,710,593 | | Fidelity Institutional Money Market Fund Class I, 0.17% (b) (c) (Cost $1,710,593) | | $ | 1,710,593 | |
| | | | | | | | |
| | | | Total Investments at Fair Value - 103.22% (Cost $18,221,180) | | $ | 18,582,686 | |
| | | | | | | | |
| | | | Liabilities in Excess of Other Assets, Net - (3.22%) | | | (580,044 | ) |
| | | | | | | | |
| | | | Net Assets - 100.00% | | $ | 18,002,642 | |
(a) | Non-income producing security. |
(b) | Rate shown represents the 7-day yield at August 31, 2015, is subject to change and resets daily. |
(c) | A portion of this security is segregated as collateral for securities on loan at August 31, 2015. Total collateral had a fair value of $599,537 at August 31, 2015. |
(d) | Security, or a portion of the security is out on loan at August 31, 2015. Total loaned securities had a fair value of $614,144 at August 31, 2015. |
(e) | Categorized in level 2 of the fair value hierarchy; for additional information and description of the levels, refer to the table included in Note 2 of the accompanying notes to the financial statements. |
ADR - American Depositary Receipt.
The accompanying notes are an integral part of the financial statements.
THE TEXAS FUND
SCHEDULE OF INVESTMENTS — August 31, 2015 |
Shares | | COMMON STOCKS - 51.35% | | Fair Value | |
| | Airlines - 0.93% | | | |
| | 1,208 | | American Airlines Group, Inc. | | $ | 47,088 | |
| | 1,518 | | Southwest Airlines Co. | | | 55,711 | |
| | | | | | | 102,799 | |
| | | | Auto Manufacturers - 0.16% | | | | |
| | 152 | | Toyota Motor Corp. - ADR | | | 17,994 | |
| | | | | | | | |
| | | | Banks - 5.10% | | | | |
| | 469 | | Comerica, Inc. | | | 20,636 | |
| | 1,048 | | Cullen & Frost Bankers, Inc. | | | 67,764 | |
| | 2,987 | | First Financial Bankshares, Inc. (d) | | | 93,015 | |
| | 4,545 | | Hilltop Holdings, Inc. (a) | | | 93,854 | |
| | 851 | | International Bancshares Corp. | | | 21,828 | |
| | 3,449 | | LegacyTexas Financial Group, Inc. | | | 97,676 | |
| | 1,392 | | Prosperity Bancshares, Inc. | | | 71,925 | |
| | 1,778 | | Texas Capital Bancshares, Inc. (a) | | | 95,763 | |
| | | | | | | 562,461 | |
| | | | Beverages - 0.16% | | | | |
| | 227 | | Dr Pepper Snapple Group, Inc. | | | 17,418 | |
| | | | | | | | |
| | | | Building Materials - 2.53% | | | | |
| | 7,693 | | Builders FirstSource, Inc. (a) | | | 113,933 | |
| | 1,418 | | Eagle Materials, Inc. | | | 116,035 | |
| | 416 | | Lennox International, Inc. | | | 49,105 | |
| | | | | | | 279,073 | |
| | | | Chemicals - 0.99% | | | | |
| | 1,043 | | Celanese Corp. - Series A | | | 63,248 | |
| | 839 | | Westlake Chemical Co. | | | 46,338 | |
| | | | | | | 109,586 | |
| | | | Commercial Services - 1.27% | | | | |
| | 906 | | Cardtronics, Inc. (a) | | | 31,257 | |
| | 1,008 | | Quanta Services, Inc. (a) | | | 24,434 | |
| | 1,650 | | Rent-A-Center, Inc. | | | 44,368 | |
| | 1,469 | | Sabre Corp. | | | 39,986 | |
| | | | | | | 140,045 | |
| | | | Computers - 0.38% | | | | |
| | 661 | | Cognizant Technology Solutions Corp. (a) | | | 41,603 | |
| | | | | | | | |
| | | | Distribution & Wholesale - 0.23% | | | | |
| | 417 | | Fossil Group, Inc. (a) | | | 25,679 | |
| | | | | | | | |
| | | | Diversified Financial Services - 0.89% | | | | |
| | 153 | | Alliance Data Systems Corp. (a) | | | 39,350 | |
| | 2,612 | | Santander Consumer USA Holdings, Inc. (a) | | | 58,666 | |
| | | | | | | 98,016 | |
The accompanying notes are an integral part of the financial statements.
THE TEXAS FUND
SCHEDULE OF INVESTMENTS — August 31, 2015 (Continued) |
Shares | | COMMON STOCKS - 51.35% (Continued) | | Fair Value | |
| | Electric - 1.23% | | | |
| | 1,031 | | Dynegy, Inc. (a) | | $ | 26,548 | |
| | 3,098 | | El Paso Electric Co. | | | 109,669 | |
| | | | | | | 136,217 | |
| | | | Electrical Equipment & Components - 0.38% | | | | |
| | 1,305 | | Encore Wire Corp. | | | 42,373 | |
| | | | | | | | |
| | | | Electronics - 1.06% | | | | |
| | 2,738 | | Benchmark Electronics, Inc. (a) | | | 58,511 | |
| | 2,004 | | National Instruments Corp. | | | 58,537 | |
| | | | | | | 117,048 | |
| | | | Engineering & Construction - 0.67% | | | | |
| | 475 | | Fluor Corp. | | | 21,670 | |
| | 2,988 | | KBR, Inc. | | | 52,111 | |
| | | | | | | 73,781 | |
| | | | Entertainment - 1.81% | | | | |
| | 2,632 | | Cinemark Holdings, Inc. | | | 93,568 | |
| | 2,351 | | Six Flags Entertainment Corp. | | | 105,724 | |
| | | | | | | 199,292 | |
| | | | Environmental Control - 1.32% | | | | |
| | 2,251 | | Waste Connections, Inc. | | | 107,058 | |
| | 770 | | Waste Management, Inc. | | | 38,546 | |
| | | | | | | 145,604 | |
| | | | Food - 1.55% | | | | |
| | 2,415 | | Darling Ingredients, Inc. (a) | | | 31,008 | |
| | 2,957 | | Dean Foods Co. | | | 48,672 | |
| | 1,708 | | Sysco Corp. | | | 68,098 | |
| | 719 | | Whole Foods Market, Inc. | | | 23,554 | |
| | | | | | | 171,332 | |
| | | | Gas - 0.64% | | | | |
| | 674 | | Atmos Energy Corp. | | | 36,928 | |
| | 1,823 | | CenterPoint Energy, Inc. | | | 33,944 | |
| | | | | | | 70,872 | |
| | | | Healthcare - Products - 1.18% | | | | |
| | 970 | | Cyberonics, Inc. (a) | | | 63,380 | |
| | 1,157 | | Greatbatch, Inc. (a) | | | 65,741 | |
| | 33 | | Halyard Health, Inc. (a) | | | 1,038 | |
| | | | | | | 130,159 | |
| | | | Healthcare - Services - 1.40% | | | | |
| | 1,133 | | Adeptus Health, Inc. - Class A (a) | | | 112,892 | |
| | 842 | | Tenet Healthcare Corp. (a) | | | 41,452 | |
| | | | | | | 154,344 | |
| | | | Home Builders - 1.07% | | | | |
| | 3,894 | | DR Horton, Inc. | | | 118,261 | |
| | | | | | | | |
The accompanying notes are an integral part of the financial statements.
THE TEXAS FUND
SCHEDULE OF INVESTMENTS — August 31, 2015 (Continued) |
Shares | | COMMON STOCKS - 51.35% (Continued) | | Fair Value | |
| | Household Products & Wares - 0.28% | | | |
| | 293 | | Kimberly-Clark Corp. | | $ | 31,213 | |
| | | | | | | | |
| | | | Insurance - 0.62% | | | | |
| | 444 | | American National Insurance Co. | | | 44,085 | |
| | 414 | | Torchmark Corp. | | | 24,202 | |
| | | | | | | 68,287 | |
| | | | Internet - 1.04% | | | | |
| | 756 | | HomeAway, Inc. (a) | | | 21,690 | |
| | 3,563 | | Q2 Holdings, Inc. (a) | | | 93,208 | |
| | | | | | | 114,898 | |
| | | | Investment Companies - 0.87% | | | | |
| | 3,406 | | Main Street Capital Corp. (d) | | | 95,675 | |
| | | | | | | | |
| | | | Iron & Steel - 0.41% | | | | |
| | 2,897 | | Commercial Metals Co. | | | 45,483 | |
| | | | | | | | |
| | | | Leisure Time - 0.92% | | | | |
| | 4,490 | | ClubCorp Holdings, Inc. | | | 101,070 | |
| | | | | | | | |
| | | | Lodging - 0.77% | | | | |
| | 4,518 | | La Quinta Holdings, Inc. (a) | | | 85,164 | |
| | | | | | | | |
| | | | Machinery - Diversified - 0.19% | | | | |
| | 473 | | Flowserve Corp. | | | 21,346 | |
| | | | | | | | |
| | | | Media - 0.79% | | | | |
| | 1,883 | | Nexstar Broadcasting Group, Inc. | | | 87,522 | |
| | | | | | | | |
| | | | Miscellaneous Manufacturing - 1.88% | | | | |
| | 2,062 | | AZZ, Inc. | | | 104,337 | |
| | 3,835 | | Trinity Industries, Inc. | | | 103,507 | |
| | | | | | | 207,844 | |
| | | | Oil & Gas - 3.62% | | | | |
| | 1,327 | | Cabot Oil & Gas Corp. | | | 31,410 | |
| | 602 | | Cheniere Energy, Inc. (a) | | | 37,414 | |
| | 390 | | Concho Resources, Inc. (a) | | | 42,182 | |
| | 4,880 | | Denbury Resources, Inc. | | | 21,179 | |
| | 418 | | Diamonback Energy, Inc. (a) | | | 28,545 | |
| | 885 | | HollyFrontier Corp. | | | 41,471 | |
| | 1,528 | | Marathon Oil Corp. | | | 26,419 | |
| | 1,800 | | Matador Resources Co. (a) | | | 41,238 | |
| | 894 | | Noble Energy, Inc. | | | 29,869 | |
| | 2,049 | | Patterson-UTI Energy, Inc. | | | 33,358 | |
| | 273 | | Pioneer Natural Resources Co. | | | 33,595 | |
The accompanying notes are an integral part of the financial statements.
THE TEXAS FUND
SCHEDULE OF INVESTMENTS — August 31, 2015 (Continued) |
Shares | | COMMON STOCKS - 51.35% (Continued) | | Fair Value | |
| | Oil & Gas - 3.62% (Continued) | | | |
| | 1,815 | | Rowan Cos. PLC - Class A | | $ | 32,616 | |
| | | | | | | 399,296 | |
| | | | Oil & Gas Services - 1.98% | | | | |
| | 5 | | Baker Hughes, Inc. | | | 280 | |
| | 737 | | Bristow Group, Inc. | | | 27,313 | |
| | 584 | | Dril-Quip, Inc. (a) | | | 40,261 | |
| | 969 | | Flotek Industries, Inc. (a) | | | 18,954 | |
| | 1,054 | | FMC Technologies, Inc. (a) | | | 36,658 | |
| | 1,458 | | Forum Energy Technologies, Inc. (a) | | | 22,920 | |
| | 889 | | National Oilwell Varco, Inc. | | | 37,631 | |
| | 780 | | Oceaneering International, Inc. | | | 34,180 | |
| | | | | | | 218,197 | |
| | | | Pharmaceuticals - 0.57% | | | | |
| | 1,233 | | ZS Pharma, Inc. (a) | | | 63,080 | |
| | | | | | | | |
| | | | Pipelines - 0.28% | | | | |
| | 1,311 | | EnLink Midstream LLC | | | 31,280 | |
| | | | | | | | |
| | | | Real Estate - 0.39% | | | | |
| | 338 | | Howard Hughes Corp. (a) | | | 42,449 | |
| | | | | | | | |
| | | | Retail - 7.13% | | | | |
| | 387 | | Brinker International, Inc. | | | 20,561 | |
| | 1,640 | | Cash America International, Inc. | | | 45,264 | |
| | 2,791 | | Conn's, Inc. (a) (d) | | | 83,311 | |
| | 661 | | Copart, Inc. (a) | | | 23,148 | |
| | 2,125 | | Fiesta Restaurant Group, Inc. (a) | | | 109,735 | |
| | 2,591 | | First Cash Financial Services, Inc. (a) | | | 106,931 | |
| | 496 | | GameStop Corp. - Class A (d) | | | 21,070 | |
| | 1,164 | | Group 1 Automotive, Inc. | | | 101,734 | |
| | 408 | | Mattress Firm Holdings Corp. (a) (d) | | | 24,517 | |
| | 335 | | Men's Wearhouse, Inc. | | | 18,911 | |
| | 547 | | Michaels Cos., Inc. (a) | | | 14,337 | |
| | 2,039 | | Pier 1 Imports, Inc. | | | 20,757 | |
| | 3,164 | | Rush Enterprises, Inc. - Class A (a) | | | 80,745 | |
| | 776 | | Sally Beauty Holdings, Inc. (a) | | | 20,285 | |
| | 2,762 | | Dave & Buster's Entertainment, Inc. (a) | | | 95,123 | |
| | | | | | | 786,429 | |
| | | | Semiconductors - 1.49% | | | | |
| | 1,579 | | Cirrus Logic, Inc. (a) | | | 47,623 | |
| | 1,147 | | Diodes, Inc. (a) | | | 22,584 | |
| | 911 | | Silicon Laboratories, Inc. (a) | | | 39,610 | |
| | 1,131 | | Texas Instruments, Inc. | | | 54,107 | |
| | | | | | | 163,924 | |
The accompanying notes are an integral part of the financial statements.
THE TEXAS FUND
SCHEDULE OF INVESTMENTS — August 31, 2015 (Continued) |
Shares | | COMMON STOCKS - 51.35% (Continued) | | Fair Value | |
| | Software - 2.19% | | | |
| | 168 | | athenahealth, Inc. (a) (d) | | $ | 22,339 | |
| | 1,267 | | Rackspace Hosting, Inc. (a) | | | 38,529 | |
| | 1,244 | | SolarWinds, Inc. (a) | | | 49,449 | |
| | 1,170 | | Solera Holdings, Inc. | | | 56,359 | |
| | 542 | | Tyler Technologies, Inc. (a) | | | 74,818 | |
| | | | | | | 241,494 | |
| | | | Telecommunications - 0.56% | | | | |
| | 1,863 | | AT&T, Inc. | | | 61,852 | |
| | | | | | | | |
| | | | Transportation - 0.42% | | | | |
| | 651 | | Kirby Corp. (a) | | | 45,915 | |
| | | | | | | | |
| | | | Total Common Stocks (Cost $6,158,478) | | | 5,666,375 | |
Contracts (e) | | CALL OPTIONS (a) - 0.52% | Expiration Date/ Exercise Price | | Fair Value | |
| | 13 | | Apache Corp. | 01/15/2016, $47.50 | | $ | 5,304 | |
| | 10 | | EOG Resources, Inc. | 01/15/2016, $80.00 | | | 6,350 | |
| | 12 | | Valero Energy Corp. | 1/15/2016, $70.00 | | | 2,160 | |
| | 10 | | Exxon Mobil Corp. | 1/15/2016, $77.50 | | | 3,100 | |
| | 20 | | Halliburton Co. | 1/15/2016, $42.00 | | | 5,600 | |
| | 500 | | ISHS Barclays 20+ Treasury | 10/16/2015, $130.00 | | | 20,000 | |
| | 10 | | Schlumberger Ltd. | 1/15/2016, $85.00 | | | 2,400 | |
| | 21 | | Kinder Morgan, Inc. | 1/15/2016, $35.00 | | | 2,625 | |
| | 15 | | Spectra Energy Corp. (f) | 1/15/2016, $30.00 | | | 2,513 | |
| | 110 | | JC Penney Co., Inc. | 1/15/2016, $10.00 | | | 7,700 | |
| | | | Total Call Options (Cost $120,708) | | | $ | 57,752 | |
The accompanying notes are an integral part of the financial statements.
THE TEXAS FUND
SCHEDULE OF INVESTMENTS — August 31, 2015 (Continued) |
Shares | | MONEY MARKET FUND - 50.31% | | Fair Value | |
| | 5,550,707 | | Fidelity Institutional Money Market Fund Class I, 0.17% (b) (c) (Cost $5,550,707) | | $ | 5,550,707 | |
| | | | | | | | |
| | | | Total Investments at Fair Value - 102.18% (Cost $11,829,893) | | $ | 11,274,834 | |
| | | | | | | | |
| | | | Liabilities in Excess of Other Assets, Net - (2.18%) | | | (240,721 | ) |
| | | | | | | | |
| | | | Net Assets - 100.00% | | $ | 11,034,113 | |
(a) | Non-income producing security. |
(b) | Rate shown represents the 7-day yield at August 31, 2015, is subject to change and resets daily. |
(c) | A portion of this security is segregated as collateral for securities on loan at August 31, 2015. Total collateral had a fair value of $281,968 at August 31, 2015. |
(d) | Security, or a portion of the security is out on loan at August 31, 2015. Total loaned securities had a fair value of $276,255 at August 31, 2015. |
(e) | Each contract is equal to 100 shares of common stock. |
(f) | Categorized in level 2 of the fair value hierarchy; for additional information and description of the levels, refer to the table included in Note 2 of the accompanying notes to the financial statements. |
ADR - American Depositary Receipt.
The accompanying notes are an integral part of the financial statements.
MONTEAGLE FUNDS
STATEMENTS OF ASSETS AND LIABILITIES — August 31, 2015 |
| | Fixed
Income
Fund | | | Informed
Investor
Growth
Fund | | | Quality
Growth
Fund | |
ASSETS | | | | | | | | | |
Investment securities | | | | | | | | | |
At cost | | $ | 49,391,622 | | | $ | 10,522,646 | | | $ | 19,283,715 | |
At fair value (Note 2) - including $0, $0 and $0 of securities loaned (Note 2), respectively | | $ | 49,524,559 | | | $ | 10,762,763 | | | $ | 24,747,634 | |
Receivables: | | | | | | | | | | | | |
Dividends and interest | | | 285,184 | | | | 4,557 | | | | 46,311 | |
Capital shares sold | | | 90,000 | | | | — | | | | — | |
Investment securities sold | | | — | | | | 1,222,867 | | | | 67,576 | |
Other assets | | | 313 | | | | 313 | | | | 313 | |
Total assets | | | 49,900,056 | | | | 11,990,500 | | | | 24,861,834 | |
| | | | | | | | | | | | | |
LIABILITIES | | | | | | | | | | | | |
Payables: | | | | | | | | | | | | |
Capital shares redeemed | | | 3,177 | | | | — | | | | — | |
Distributions | | | 1,047 | | | | — | | | | — | |
Investment securities purchased | | | — | | | | — | | | | 70,039 | |
Due to Adviser (Note 3) | | | 40,987 | | | | 12,899 | | | | 26,145 | |
Accrued compliance service fees (Note 3) | | | 2,631 | | | | 982 | | | | 1,558 | |
Accrued trustee fees | | | 1,267 | | | | 1,266 | | | | 1,267 | |
Total liabilities | | | 49,109 | | | | 15,147 | | | | 99,009 | |
| | | | | | | | | | | | | |
NET ASSETS | | $ | 49,850,947 | | | $ | 11,975,353 | | | $ | 24,762,825 | |
| | | | | | | | | | | | | |
NET ASSETS CONSIST OF: | | | | | | | | | | | | |
Paid-in capital | | $ | 50,003,468 | | | $ | 10,935,154 | | | $ | 17,976,226 | |
Undistributed (Accumulated) net investment income (loss) | | | 5,782 | | | | (85,957 | ) | | | 54,573 | |
Undistributed (accumulated) net realized gain (loss) on investments | | | (291,240 | ) | | | 886,039 | | | | 1,268,107 | |
Net unrealized appreciation on investments | | | 132,937 | | | | 240,117 | | | | 5,463,919 | |
NET ASSETS | | $ | 49,850,947 | | | $ | 11,975,353 | | | $ | 24,762,825 | |
| | | | | | | | | | | | | |
Shares of beneficial interest outstanding (1) | | | 4,803,759 | | | | 1,114,575 | | | | 1,882,008 | |
Net Asset Value, offering and redemption price per share | | $ | 10.38 | | | $ | 10.74 | | | $ | 13.16 | |
(1) | Unlimited number of shares of beneficial interest with no par value, authorized. |
The accompanying notes are an integral part of the financial statements.
MONTEAGLE FUNDS
STATEMENTS OF ASSETS AND LIABILITIES — August 31, 2015 |
| | Select
Value
Fund | | | Value
Fund | | | The
Texas
Fund | |
ASSETS | | | | | | | | | |
Investment securities | | | | | | | | | |
At cost | | $ | 14,867,902 | | | $ | 18,221,180 | | | $ | 11,829,893 | |
At fair value (Note 2) - including $944,413, $614,144 and $276,255 of securities loaned (Note 2), respectively | | $ | 14,624,577 | | | $ | 18,582,686 | | | $ | 11,274,834 | |
Receivables: | | | | | | | | | | | | |
Dividends and interest | | | 37,692 | | | | 40,536 | | | | 9,132 | |
Investment securities sold | | | — | | | | — | | | | 49,019 | |
Other assets | | | 313 | | | | 313 | | | | 313 | |
Total assets | | | 14,662,582 | | | | 18,623,535 | | | | 11,333,298 | |
| | | | | | | | | | | | | |
LIABILITIES | | | | | | | | | | | | |
Payables: | | | | | | | | | | | | |
Distribution Fees | | | — | | | | — | | | | 279 | |
Collateral on securities Loaned (Note 2) | | | 956,708 | | | | 599,537 | | | | 281,968 | |
Due to Adviser (Note 3) | | | 14,190 | | | | 18,849 | | | | 14,713 | |
Accrued compliance service fees (Note 3) | | | 1,038 | | | | 1,240 | | | | 958 | |
Accrued trustee fees | | | 1,267 | | | | 1,267 | | | | 1,267 | |
Total liabilities | | | 973,203 | | | | 620,893 | | | | 299,185 | |
| | | | | | | | | | | | | |
NET ASSETS | | $ | 13,689,379 | | | $ | 18,002,642 | | | $ | 11,034,113 | |
| | | | | | | | | | | | | |
NET ASSETS CONSIST OF: | | | | | | | | | | | | |
Paid-in capital | | $ | 10,587,503 | | | $ | 16,462,758 | | | $ | 12,732,760 | |
Undistributed (accumulated) net investment income (loss) | | | 35,622 | | | | 39,971 | | | | (24,303 | ) |
Undistributed (accumulated) net realized gain (loss) on investments | | | 3,309,579 | | | | 1,138,407 | | | | (1,119,285 | ) |
Net unrealized appreciation (depreciation) on investments | | | (243,325 | ) | | | 361,506 | | | | (555,059 | ) |
NET ASSETS | | $ | 13,689,379 | | | $ | 18,002,642 | | | $ | 11,034,113 | |
| | | | | | | | | | | | | |
CLASS I Shares: | | | | | | | | | | | | |
Net Assets | | $ | 13,689,379 | | | $ | 18,002,642 | | | $ | 11,014,342 | |
Shares of beneficial interest outstanding (1) | | | 863,072 | | | | 1,347,335 | | | | 1,234,561 | |
Net Asset Value, offering and redemption price per share | | $ | 15.86 | | | $ | 13.36 | | | $ | 8.92 | |
| | | | | | | | | | | | | |
CLASS C Shares: | | | | | | | | | | | | |
Net Assets | | | | | | | | | | $ | 19,771 | |
Shares of beneficial interest outstanding (1) | | | | | | | | | | | 2,260 | |
Net Asset Value and offering price per share | | | | | | | | | | $ | 8.75 | |
Minimum redemption price per share (2) | | | | | | | | | | $ | 8.66 | |
(1) | Unlimited number of shares of beneficial interest with no par value, authorized. |
(2) | Class C shares purchased, that are redeemed within one year, will be assessed a 1.00% redemption fee. |
The accompanying notes are an integral part of the financial statements.
MONTEAGLE FUNDS
STATEMENTS OF OPERATIONS — For the Year Ended August 31, 2015 |
| | Fixed
Income
Fund | | | Informed
Investor
Growth
Fund | | | Quality
Growth
Fund | |
INVESTMENT INCOME | | | | | | | | | |
| | | | | | | | | | |
Income: | | | | | | | | | |
Interest | | $ | 1,071,636 | | | $ | 2,210 | | | $ | 951 | |
Securities lending | | | — | | | | 1,514 | | | | 346 | |
Dividends | | | — | | | | 44,596 | | | | 424,719 | |
Foreign withholding tax | | | — | | | | — | | | | — | |
| | | | | | | | | | | | | |
Total Investment Income | | | 1,071,636 | | | | 48,320 | | | | 426,016 | |
| | | | | | | | | | | | | |
Expenses: | | | | | | | | | | | | |
Investment advisory fees (Note 3) | | | 454,349 | | | | 152,954 | | | | 305,539 | |
Compliance service fees (Note 3) | | | 30,504 | | | | 11,900 | | | | 18,812 | |
Trustees' fees | | | 7,875 | | | | 7,875 | | | | 7,875 | |
ICI membership fees | | | 1,534 | | | | 1,534 | | | | 1,534 | |
| | | | | | | | | | | | | |
Total expenses | | | 494,262 | | | | 174,263 | | | | 333,760 | |
| | | | | | | | | | | | | |
Net investment income (loss) | | | 577,374 | | | | (125,943 | ) | | | 92,256 | |
| | | | | | | | | | | | | |
REALIZED AND UNREALIZED GAIN (LOSS) ON INVESTMENTS | | | | | | | | | | | | |
| | | | | | | | | | | | | |
Net realized gain from investments | | | 188,564 | | | | 1,375,824 | | | | 1,587,058 | |
Net change in unrealized depreciation on investments | | | (446,345 | ) | | | (1,351,246 | ) | | | (1,085,678 | ) |
| | | | | | | | | | | | | |
Net realized and unrealized gain (loss) on investments | | | (257,781 | ) | | | 24,578 | | | | 501,380 | |
| | | | | | | | | | | | | |
Net increase (decrease) in net assets resulting from operations | | $ | 319,593 | | | $ | (101,365 | ) | | $ | 593,636 | |
The accompanying notes are an integral part of the financial statements.
MONTEAGLE FUNDS
STATEMENTS OF OPERATIONS — For the Year Ended August 31, 2015 |
| | Select
Value
Fund | | | Value
Fund | | | The
Texas
Fund | |
INVESTMENT INCOME | | | | | | | | | |
| | | | | | | | | | |
Income: | | | | | | | | | |
Interest | | $ | 1,992 | | | $ | 1,272 | | | $ | 516 | |
Securities lending | | | 19,622 | | | | 17,548 | | | | 4,037 | |
Dividends | | | 306,618 | | | | 495,869 | | | | 152,912 | |
Foreign withholding tax | | | (466 | ) | | | (4,290 | ) | | | (359 | ) |
| | | | | | | | | | | | | |
Total Investment Income | | | 327,766 | | | | 510,399 | | | | 157,106 | |
| | | | | | | | | | | | | |
Expenses: | | | | | | | | | | | | |
Investment advisory fees (Note 3) | | | 177,097 | | | | 236,300 | | | | 176,618 | |
Distribution (12b-1) fees - Class C (Note 3) | | | — | | | | — | | | | 169 | |
Compliance service fees (Note 3) | | | 12,972 | | | | 15,636 | | | | 11,678 | |
Trustees' fees | | | 7,875 | | | | 7,875 | | | | 7,875 | |
ICI membership fees | | | 1,534 | | | | 1,534 | | | | 1,534 | |
Interest expense | | | 5 | | | | — | | | | 26 | |
| | | | | | | | | | | | | |
Total expenses | | | 199,483 | | | | 261,345 | | | | 197,900 | |
| | | | | | | | | | | | | |
Net investment income (loss) | | | 128,283 | | | | 249,054 | | | | (40,794 | ) |
| | | | | | | | | | | | | |
REALIZED AND UNREALIZED GAIN (LOSS) ON INVESTMENTS | | | | | | | | | | | | |
| | | | | | | | | | | | | |
Net realized gain (loss) from: | | | | | | | | | | | | |
Investments | | | 3,312,954 | | | | 1,138,406 | | | | (651,174 | ) |
Call options purchased | | | — | | | | — | | | | (112,497 | ) |
Put options purchased | | | — | | | | — | | | | (230,261 | ) |
Net realized gain (loss) | | | 3,312,954 | | | | 1,138,406 | | | | (993,932 | ) |
| | | | | | | | | | | | | |
Net change in unrealized appreciation (depreciation) on: | | | | | | | | | | | | |
Investments | | | (4,119,836 | ) | | | (4,497,915 | ) | | | (1,127,809 | ) |
Call options purchased | | | — | | | | — | | | | (69,332 | ) |
Put options purchased | | | — | | | | — | | | | 183,124 | |
Net change in unrealized depreciation | | | (4,119,836 | ) | | | (4,497,915 | ) | | | (1,014,017 | ) |
| | | | | | | | | | | | | |
Net realized and unrealized loss on investments | | | (806,882 | ) | | | (3,359,509 | ) | | | (2,007,949 | ) |
| | | | | | | | | | | | | |
Net decrease in net assets resulting from operations | | $ | (678,599 | ) | | $ | (3,110,455 | ) | | $ | (2,048,743 | ) |
The accompanying notes are an integral part of the financial statements.
MONTEAGLE FIXED INCOME FUND
STATEMENTS OF CHANGES IN NET ASSETS |
| | Year
Ended
August 31,
2015 | | | Year
Ended
August 31,
2014 | |
INCREASE (DECREASE) IN NET ASSETS | | | | | | |
FROM OPERATIONS | | | | | | |
Net investment income | | $ | 577,374 | | | $ | 540,887 | |
Net realized gain on investment transactions | | | 188,564 | | | | 22,820 | |
Net change in unrealized appreciation (depreciation) on investments | | | (446,345 | ) | | | 744,611 | |
Net increase in net assets resulting from operations | | $ | 319,593 | | | $ | 1,308,318 | |
| | | | | | | | | |
FROM DISTRIBUTIONS TO SHAREHOLDERS | | | | | | | | |
From net investment income - Class I | | | (610,868 | ) | | | (553,797 | ) |
Net decrease in net assets from distributions to shareholders | | | (610,868 | ) | | | (553,797 | ) |
| | | | | | | | | |
FROM CAPITAL SHARE TRANSACTIONS | | | | | | | | |
Net increase in net assets from capital share transactions (Note 7) | | | 7,541,547 | | | | 2,459,212 | |
| | | | | | | | | |
Total increase in net assets | | | 7,250,272 | | | | 3,213,733 | |
| | | | | | | | | |
NET ASSETS | | | | | | | | |
Beginning of period | | | 42,600,675 | | | | 39,386,942 | |
End of period | | $ | 49,850,947 | | | $ | 42,600,675 | |
ACCUMULATED UNDISTRIBUTED NET INVESTMENT INCOME | | $ | 5,782 | | | $ | 565 | |
The accompanying notes are an integral part of the financial statements.
MONTEAGLE INFORMED INVESTOR GROWTH FUND
STATEMENTS OF CHANGES IN NET ASSETS |
| | Year
Ended
August 31,
2015 | | | Year
Ended
August 31,
2014 | |
INCREASE (DECREASE) IN NET ASSETS | | | | | | |
FROM OPERATIONS | | | | | | |
Net investment loss | | $ | (125,943 | ) | | $ | (92,262 | ) |
Net realized gain on investment transactions | | | 1,375,824 | | | | 2,210,207 | |
Net change in unrealized appreciation (depreciation) on investments | | | (1,351,246 | ) | | | 264,325 | |
Net increase (decrease) in net assets resulting from operations | | $ | (101,365 | ) | | $ | 2,382,270 | |
| | | | | | | | | |
FROM DISTRIBUTIONS TO SHAREHOLDERS | | | | | | | | |
From net realized capital gains - Class I | | | (2,217,503 | ) | | | (1,094,029 | ) |
Net decrease in net assets from distributions to shareholders | | | (2,217,503 | ) | | | (1,094,029 | ) |
| | | | | | | | | |
FROM CAPITAL SHARE TRANSACTIONS | | | | | | | | |
Net increase (decrease) in net assets from capital share transactions (Note 7) | | | 32,533 | | | | (331,757 | ) |
| | | | | | | | | |
Total increase (decrease) in net assets | | | (2,286,335 | ) | | | 956,484 | |
| | | | | | | | | |
NET ASSETS | | | | | | | | |
Beginning of period | | | 14,261,688 | | | | 13,305,204 | |
End of period | | $ | 11,975,353 | | | $ | 14,261,688 | |
UNDISTRIBUTED (ACCUMULATED) NET INVESTMENT INCOME (LOSS) | | $ | (85,957 | ) | | $ | — | |
The accompanying notes are an integral part of the financial statements.
MONTEAGLE QUALITY GROWTH FUND
STATEMENTS OF CHANGES IN NET ASSETS |
| | Year
Ended
August 31,
2015 | | | Year
Ended
August 31,
2014 | |
INCREASE (DECREASE) IN NET ASSETS | | | | | | |
FROM OPERATIONS | | | | | | |
Net investment income | | $ | 92,256 | | | $ | 6,879 | |
Net realized gain on investment transactions | | | 1,587,058 | | | | 3,878,131 | |
Net change in unrealized appreciation (depreciation) on investments | | | (1,085,678 | ) | | | 1,010,814 | |
Net increase in net assets resulting from operations | | $ | 593,636 | | | $ | 4,895,824 | |
| | | | | | | | | |
FROM DISTRIBUTIONS TO SHAREHOLDERS | | | | | | | | |
From net investment income - Class I | | | (44,563 | ) | | | (15,198 | ) |
From net realized capital gains - Class I | | | (228,609 | ) | | | — | |
Net decrease in net assets from distributions to shareholders | | | (273,172 | ) | | | (15,198 | ) |
| | | | | | | | | |
FROM CAPITAL SHARE TRANSACTIONS | | | | | | | | |
Net increase (decrease) in net assets from capital share transactions (Note 7) | | | 385,105 | | | | (6,376,135 | ) |
| | | | | | | | | |
Total increase (decrease) in net assets | | | 705,569 | | | | (1,495,509 | ) |
| | | | | | | | | |
NET ASSETS | | | | | | | | |
Beginning of period | | | 24,057,256 | | | | 25,552,765 | |
End of period | | $ | 24,762,825 | | | $ | 24,057,256 | |
ACCUMULATED UNDISTRIBUTED NET INVESTMENT INCOME | | $ | 54,573 | | | $ | 6,880 | |
The accompanying notes are an integral part of the financial statements.
MONTEAGLE SELECT VALUE FUND
STATEMENTS OF CHANGES IN NET ASSETS |
| | Year
Ended
August 31,
2015 | | | Year
Ended
August 31,
2014 | |
INCREASE (DECREASE) IN NET ASSETS | | | | | | |
FROM OPERATIONS | | | | | | |
Net investment income | | $ | 128,283 | | | $ | 127,633 | |
Net realized gain on investment transactions | | | 3,312,954 | | | | 2,071,243 | |
Net change in unrealized appreciation (depreciation) on investments | | | (4,119,836 | ) | | | 1,446,960 | |
Net increase (decrease) in net assets resulting from operations | | $ | (678,599 | ) | | $ | 3,645,836 | |
| | | | | | | | | |
FROM DISTRIBUTIONS TO SHAREHOLDERS | | | | | | | | |
From net investment income - Class I | | | (127,352 | ) | | | (111,674 | ) |
From net realized capital gains - Class I | | | (1,602,773 | ) | | | (286,386 | ) |
Net decrease in net assets from distributions to shareholders | | | (1,730,125 | ) | | | (398,060 | ) |
| | | | | | | | | |
FROM CAPITAL SHARE TRANSACTIONS | | | | | | | | |
Net decrease in net assets from capital share transactions (Note 7) | | | (216,280 | ) | | | (1,272,675 | ) |
| | | | | | | | | |
Total increase (decrease) in net assets | | | (2,625,004 | ) | | | 1,975,101 | |
| | | | | | | | | |
NET ASSETS | | | | | | | | |
Beginning of period | | | 16,314,383 | | | | 14,339,282 | |
End of period | | $ | 13,689,379 | | | $ | 16,314,383 | |
ACCUMULATED UNDISTRIBUTED NET INVESTMENT INCOME | | $ | 35,622 | | | $ | 34,691 | |
The accompanying notes are an integral part of the financial statements.
MONTEAGLE VALUE FUND
STATEMENTS OF CHANGES IN NET ASSETS |
| | Year
Ended
August 31,
2015 | | | Year
Ended
August 31,
2014 | |
INCREASE (DECREASE) IN NET ASSETS | | | | | | |
FROM OPERATIONS | | | | | | |
Net investment income | | $ | 249,054 | | | $ | 240,606 | |
Net realized gain on investment transactions | | | 1,138,406 | | | | 3,015,510 | |
Net change in unrealized appreciation (depreciation) on investments | | | (4,497,915 | ) | | | 604,504 | |
Net increase (decrease) in net assets resulting from operations | | $ | (3,110,455 | ) | | $ | 3,860,620 | |
| | | | | | | | | |
FROM DISTRIBUTIONS TO SHAREHOLDERS | | | | | | | | |
From net investment income - Class I | | | (277,911 | ) | | | (197,855 | ) |
From net realized capital gains - Class I | | | (3,014,259 | ) | | | — | |
Decrease in net assets from distributions to shareholders | | | (3,292,170 | ) | | | (197,855 | ) |
| | | | | | | | | |
FROM CAPITAL SHARE TRANSACTIONS | | | | | | | | |
Net increase in net assets from capital share transactions (Note 7) | | | 3,541,369 | | | | 990,754 | |
| | | | | | | | | |
Total increase (decrease) in net assets | | | (2,861,256 | ) | | | 4,653,519 | |
| | | | | | | | | |
NET ASSETS | | | | | | | | |
Beginning of period | | | 20,863,898 | | | | 16,210,379 | |
End of period | | $ | 18,002,642 | | | $ | 20,863,898 | |
ACCUMULATED UNDISTRIBUTED NET INVESTMENT INCOME | | $ | 39,971 | | | $ | 68,828 | |
The accompanying notes are an integral part of the financial statements.
THE TEXAS FUND
STATEMENTS OF CHANGES IN NET ASSETS |
| | Year
Ended
August 31,
2015 | | | Period
Ended
August 31,
2014(a) | |
INCREASE (DECREASE) IN NET ASSETS | | | | | | |
FROM OPERATIONS | | | | | | |
Net investment loss | | $ | (40,794 | ) | | $ | (36,301 | ) |
Net realized gain (loss) on investment transactions | | | (993,932 | ) | | | 300,830 | |
Net change in unrealized appreciation (depreciation) on investments | | | (1,014,017 | ) | | | 458,958 | |
Net increase (decrease) in net assets resulting from operations | | $ | (2,048,743 | ) | | $ | 723,487 | |
| | | | | | | | | |
FROM DISTRIBUTIONS TO SHAREHOLDERS | | | | | | | | |
From net realized capital gains - Class I | | | (373,020 | ) | | | — | |
From net realized capital gains - Class C | | | (371 | ) | | | — | |
Net decrease in net assets from distributions to shareholders | | | (373,391 | ) | | | — | |
| | | | | | | | | |
FROM CAPITAL SHARE TRANSACTIONS | | | | | | | | |
Net increase in net assets from capital share transactions (Note 7) | | | 1,448,198 | | | | 11,284,562 | |
| | | | | | | | | |
Total increase (decrease) in net assets | | | (973,936 | ) | | | 12,008,049 | |
| | | | | | | | | |
NET ASSETS | | | | | | | | |
Beginning of period | | | 12,008,049 | | | | — | |
End of period | | $ | 11,034,113 | | | $ | 12,008,049 | |
UNDISTRIBUTED (ACCUMULATED) NET INVESTMENT INCOME (LOSS) | | $ | (24,303 | ) | | $ | — | |
(a) | Represents the period from the initial public offering (September 17, 2013) through August 31, 2014. |
The accompanying notes are an integral part of the financial statements.
MONTEAGLE FIXED INCOME FUND
FINANCIAL HIGHLIGHTS |
(For a Share Outstanding Throughout each Year) | |
Class I Shares | | Year
Ended
August 31,
2015 | | | Year
Ended
August 31,
2014 | | | Year
Ended
August 31,
2013 | | | Year
Ended
August 31,
2012 | | | Year
Ended
August 31,
2011 | |
Net asset value, beginning of year | | $ | 10.44 | | | $ | 10.25 | | | $ | 10.80 | | | $ | 10.70 | | | $ | 10.71 | |
Income (loss) from investment operations: | | | | | | | | | | | | | | | | | | | | |
Net investment income | | | 0.14 | | | | 0.14 | | | | 0.19 | | | | 0.27 | | | | 0.32 | |
Net realized and unrealized gain (loss) on investments | | | (0.06 | ) | | | 0.19 | | | | (0.55 | ) | | | 0.10 | | | | (0.01 | ) |
Total from investment operations | | | 0.08 | | | | 0.33 | | | | (0.36 | ) | | | 0.37 | | | | 0.31 | |
| | | | | | | | | | | | | | | | | | | | | |
Less distributions: | | | | | | | | | | | | | | | | | | | | |
From net investment income | | | (0.14 | ) | | | (0.14 | ) | | | (0.19 | ) | | | (0.27 | ) | | | (0.32 | ) |
Total distributions | | | (0.14 | ) | | | (0.14 | ) | | | (0.19 | ) | | | (0.27 | ) | | | (0.32 | ) |
| | | | | | | | | | | | | | | | | | | | | |
Net asset value, end of year | | $ | 10.38 | | | $ | 10.44 | | | $ | 10.25 | | | $ | 10.80 | | | $ | 10.70 | |
| | | | | | | | | | | | | | | | | | | | | |
Total Return (a) | | | 0.72 | % | | | 3.23 | % | | | (3.41 | %) | | | 3.48 | % | | | 2.97 | % |
| | | | | | | | | | | | | | | | | | | | | |
Net assets, end of year (000's omitted) | | $ | 49,851 | | | $ | 42,601 | | | $ | 39,387 | | | $ | 35,896 | | | $ | 31,892 | |
| | | | | | | | | | | | | | | | | | | | | |
Ratio of operating expenses to average net assets: | | | 1.05 | % | | | 1.05 | % | | | 1.06 | % | | | 1.09 | % | | | 1.07 | % |
| | | | | | | | | | | | | | | | | | | | | |
Ratio of net investment income to average net assets: | | | 1.23 | % | | | 1.32 | % | | | 1.68 | % | | | 2.46 | % | | | 2.93 | % |
| | | | | | | | | | | | | | | | | | | | | |
Portfolio turnover rate | | | 15 | % | | | 13 | % | | | 22 | % | | | 23 | % | | | 14 | % |
(a) | Total return is a measure of the change in value of an investment in the Fund over the periods covered, which assumes any dividends or capital gains distributions are reinvested in shares of the Fund. Returns do not reflect the deduction of taxes a shareholder would pay on Fund distributions or the redemption of Fund shares. |
The accompanying notes are an integral part of the financial statements.
MONTEAGLE INFORMED INVESTOR GROWTH FUND
FINANCIAL HIGHLIGHTS |
(For a Share Outstanding Throughout each Year) | |
Class I Shares | | Year
Ended
August 31,
2015 | | | Year
Ended
August 31,
2014 | | | Year
Ended
August 31,
2013 | | | Year
Ended
August 31,
2012 | | | Year
Ended
August 31,
2011 | |
Net asset value, beginning of year | | $ | 12.90 | | | $ | 11.75 | | | $ | 11.71 | | | $ | 10.62 | | | $ | 10.48 | |
Income (loss) from investment operations: | | | | | | | | | | | | | | | | | | | | |
Net investment loss (a) | | | (0.11 | ) | | | (0.08 | ) | | | (0.07 | ) | | | (0.06 | ) | | | (0.06 | ) |
Net realized and unrealized gain on investments | | | 0.02 | | | | 2.20 | | | | 1.00 | | | | 1.55 | | | | 1.90 | |
Total from investment operations | | | (0.09 | ) | | | 2.12 | | | | 0.93 | | | | 1.49 | | | | 1.84 | |
| | | | | | | | | | | | | | | | | | | | | |
Less distributions: | | | | | | | | | | | | | | | | | | | | |
From net realized capital gains | | | (2.07 | ) | | | (0.97 | ) | | | (0.89 | ) | | | (0.40 | ) | | | (1.70 | ) |
Total distributions | | | (2.07 | ) | | | (0.97 | ) | | | (0.89 | ) | | | (0.40 | ) | | | (1.70 | ) |
| | | | | | | | | | | | | | | | | | | | | |
Net asset value, end of year | | $ | 10.74 | | | $ | 12.90 | | | $ | 11.75 | | | $ | 11.71 | | | $ | 10.62 | |
| | | | | | | | | | | | | | | | | | | | | |
Total Return (b) | | | 0.24 | % | | | 18.65 | % | | | 9.03 | % | | | 14.81 | % | | | 15.35 | % |
| | | | | | | | | | | | | | | | | | | | | |
Net assets, end of year (000's omitted) | | $ | 11,975 | | | $ | 14,262 | | | $ | 13,305 | | | $ | 13,741 | | | $ | 17,784 | |
| | | | | | | | | | | | | | | | | | | | | |
Ratio of operating expenses to average net assets: (c) | | | 1.37 | % | | | 1.35 | % | | | 1.37 | % | | | 1.34 | % | | | 1.33 | % |
| | | | | | | | | | | | | | | | | | | | | |
Ratio of net investment loss to average net assets: (a) | | | (0.99 | %) | | | (0.66 | %) | | | (0.59 | %) | | | (0.94 | %) | | | (0.53 | %) |
| | | | | | | | | | | | | | | | | | | | | |
Portfolio turnover rate | | | 428 | % | | | 290 | % | | | 641 | % | | | 795 | % | | | 755 | % |
(a) | Recognition of net investment income (loss) by the Fund is affected by the declaration of dividends by the underlying investment companies in which the Fund invests. |
(b) | Total return is a measure of the change in value of an investment in the Fund over the periods covered, which assumes any dividends or capital gains distributions are reinvested in shares of the Fund. Returns do not reflect the deduction of taxes a shareholder would pay on Fund distributions or the redemption of Fund shares. |
(c) | The ratios of expenses to average net assets do not reflect the Fund’s proportionate share of income and expenses of underlying investment companies in which the Fund invests. |
The accompanying notes are an integral part of the financial statements.
MONTEAGLE QUALITY GROWTH FUND
FINANCIAL HIGHLIGHTS |
(For a Share Outstanding Throughout each Year) | |
Class I Shares | | Year
Ended
August 31,
2015 | | | Year
Ended
August 31,
2014 | | | Year
Ended
August 31,
2013 | | | Year
Ended
August 31,
2012 | | | Year
Ended
August 31,
2011 | |
Net asset value, beginning of year | | $ | 12.99 | | | $ | 10.65 | | | $ | 9.95 | | | $ | 8.71 | | | $ | 7.14 | |
Income from investment operations: | | | | | | | | | | | | | | | | | | | | |
Net investment income | | | 0.05 | | | | — | (a) | | | 0.04 | | | | 0.02 | | | | — | (a) |
Net realized and unrealized gain on investments | | | 0.26 | | | | 2.35 | | | | 0.72 | | | | 1.22 | | | | 1.57 | |
Total from investment operations | | | 0.31 | | | | 2.35 | | | | 0.76 | | | | 1.24 | | | | 1.57 | |
| | | | | | | | | | | | | | | | | | | | | |
Less distributions: | | | | | | | | | | | | | | | | | | | | |
From net investment income | | | (0.02 | ) | | | (0.01 | ) | | | (0.06 | ) | | | — | (b) | | | — | (b) |
From net realized gains on investments | | | (0.12 | ) | | | — | | | | — | | | | — | | | | — | |
Total distributions | | | (0.14 | ) | | | (0.01 | ) | | | (0.06 | ) | | | — | | | | — | |
| | | | | | | | | | | | | | | | | | | | | |
Net asset value, end of year | | $ | 13.16 | | | $ | 12.99 | | | $ | 10.65 | | | $ | 9.95 | | | $ | 8.71 | |
| | | | | | | | | | | | | | | | | | | | | |
Total Return (c) | | | 2.43 | % | | | 22.05 | % | | | 7.62 | % | | | 14.26 | % | | | 22.02 | % |
| | | | | | | | | | | | | | | | | | | | | |
Net assets, end of year (000's omitted) | | $ | 24,763 | | | $ | 24,057 | | | $ | 25,553 | | | $ | 28,225 | | | $ | 22,765 | |
| | | | | | | | | | | | | | | | | | | | | |
Ratio of operating expenses to average net assets: | | | 1.31 | % | | | 1.31 | % | | | 1.30 | % | | | 1.33 | % | | | 1.32 | % |
| | | | | | | | | | | | | | | | | | | | | |
Ratio of net investment income to average net assets: | | | 0.36 | % | | | 0.03 | % | | | 0.34 | % | | | 0.26 | % | | | 0.02 | % |
| | | | | | | | | | | | | | | | | | | | | |
Portfolio turnover rate | | | 25 | % | | | 27 | % | | | 50 | % | | | 54 | % | | | 62 | % |
(a) | Net investment income (loss) per share resulted in less than $0.01 per share. |
(b) | Distributions per share were $(0.0016) for the year ended August 31, 2012 and $(0.0025) for the year ended August 31, 2011. |
(c) | Total return is a measure of the change in value of an investment in the Fund over the periods covered, which assumes any dividends or capital gains distributions are reinvested in shares of the Fund. Returns do not reflect the deduction of taxes a shareholder would pay on Fund distributions or the redemption of Fund shares. |
The accompanying notes are an integral part of the financial statements.
MONTEAGLE SELECT VALUE FUND
FINANCIAL HIGHLIGHTS |
(For a Share Outstanding Throughout each Year) | |
Class I Shares | | Year
Ended
August 31,
2015 | | | Year
Ended
August 31,
2014 | | | Year
Ended
August 31,
2013 | | | Year
Ended
August 31,
2012 | | | Year
Ended
August 31,
2011 | |
Net asset value, beginning of year | | $ | 18.66 | | | $ | 15.07 | | | $ | 10.95 | | | $ | 10.16 | | | $ | 8.78 | |
Income (loss) from investment operations: | | | | | | | | | | | | | | | | | | | | |
Net investment income | | | 0.15 | | | | 0.15 | | | | 0.14 | | | | 0.13 | | | | 0.04 | |
Net realized and unrealized gain (loss) on investments | | | (0.87 | ) | | | 3.90 | | | | 4.13 | | | | 0.78 | | | | 1.37 | |
Total from investment operations | | | (0.72 | ) | | | 4.05 | | | | 4.27 | | | | 0.91 | | | | 1.41 | |
| | | | | | | | | | | | | | | | | | | | | |
Less distributions: | | | | | | | | | | | | | | | | | | | | |
From net investment income | | | (0.15 | ) | | | (0.13 | ) | | | (0.15 | ) | | | (0.12 | ) | | | (0.03 | ) |
From net realized capital gains | | | (1.93 | ) | | | (0.33 | ) | | | — | | | | — | | | | — | |
Total distributions | | | (2.08 | ) | | | (0.46 | ) | | | (0.15 | ) | | | (0.12 | ) | | | (0.03 | ) |
| | | | | | | | | | | | | | | | | | | | | |
Net asset value, end of year | | $ | 15.86 | | | $ | 18.66 | | | $ | 15.07 | | | $ | 10.95 | | | $ | 10.16 | |
| | | | | | | | | | | | | | | | | | | | | |
Total Return (a) | | | (4.10 | %) | | | 27.29 | % | | | 39.26 | % | | | 9.01 | % | | | 15.99 | % |
| | | | | | | | | | | | | | | | | | | | | |
Net assets, end of year (000's omitted) | | $ | 13,689 | | | $ | 16,314 | | | $ | 14,339 | | | $ | 10,177 | | | $ | 9,793 | |
| | | | | | | | | | | | | | | | | | | | | |
Ratio of operating expenses to average net assets: | | | 1.35 | % | | | 1.35 | % | | | 1.37 | % | | | 1.43 | % | | | 1.40 | % |
| | | | | | | | | | | | | | | | | | | | | |
Ratio of net investment income to average net assets: | | | 0.87 | % | | | 0.86 | % | | | 1.06 | % | | | 1.23 | % | | | 0.35 | % |
| | | | | | | | | | | | | | | | | | | | | |
Portfolio turnover rate | | | 62 | % | | | 29 | % | | | 36 | % | | | 8 | % | | | 87 | % |
(a) | Total return is a measure of the change in value of an investment in the Fund over the periods covered, which assumes any dividends or capital gains distributions are reinvested in shares of the Fund. Returns do not reflect the deduction of taxes a shareholder would pay on Fund distributions or the redemption of Fund shares. |
The accompanying notes are an integral part of the financial statements.
MONTEAGLE VALUE FUND
FINANCIAL HIGHLIGHTS |
(For a Share Outstanding Throughout each Year) | |
Class I Shares | | Year
Ended
August 31,
2015 | | | Year
Ended
August 31,
2014 | | | Year
Ended
August 31,
2013 | | | Year
Ended
August 31,
2012 | | | Year
Ended
August 31,
2011 | |
Net asset value, beginning of year | | $ | 18.60 | | | $ | 15.17 | | | $ | 13.31 | | | $ | 15.55 | | | $ | 13.41 | |
Income (loss) from investment operations: | | | | | | | | | | | | | | | | | | | | |
Net investment income | | | 0.20 | | | | 0.22 | | | | 0.17 | | | | 0.18 | | | | 0.14 | |
Net realized and unrealized gain (loss) on investments | | | (2.68 | ) | | | 3.40 | | | | 2.20 | | | | 0.78 | | | | 2.13 | |
Total from investment operations | | | (2.48 | ) | | | 3.62 | | | | 2.37 | | | | 0.96 | | | | 2.27 | |
| | | | | | | | | | | | | | | | | | | | | |
Less distributions: | | | | | | | | | | | | | | | | | | | | |
From net investment income | | | (0.23 | ) | | | (0.19 | ) | | | (0.18 | ) | | | (0.18 | ) | | | (0.13 | ) |
From net realized gains on investments | | | (2.53 | ) | | | — | | | | (0.33 | ) | | | (3.02 | ) | | | — | |
Total distributions | | | (2.76 | ) | | | (0.19 | ) | | | (0.51 | ) | | | (3.20 | ) | | | (0.13 | ) |
| | | | | | | | | | | | | | | | | | | | | |
Net asset value, end of year | | $ | 13.36 | | | $ | 18.60 | | | $ | 15.17 | | | $ | 13.31 | | | $ | 15.55 | |
| | | | | | | | | | | | | | | | | | | | | |
Total Return (a) | | | (14.33 | %) | | | 23.94 | % | | | 18.32 | % | | | 8.64 | % | | | 16.95 | % |
| | | | | | | | | | | | | | | | | | | | | |
Net assets, end of year (000's omitted) | | $ | 18,003 | | | $ | 20,864 | | | $ | 16,210 | | | $ | 14,346 | | | $ | 14,216 | |
| | | | | | | | | | | | | | | | | | | | | |
Ratio of operating expenses to average net assets: | | | 1.33 | % | | | 1.34 | % | | | 1.36 | % | | | 1.43 | % | | | 1.40 | % |
| | | | | | | | | | | | | | | | | | | | | |
Ratio of net investment income to average net assets: | | | 1.26 | % | | | 1.30 | % | | | 1.22 | % | | | 1.31 | % | | | 0.84 | % |
| | | | | | | | | | | | | | | | | | | | | |
Portfolio turnover rate | | | 15 | % | | | 37 | % | | | 13 | % | | | 27 | % | | | 18 | % |
(a) | Total return is a measure of the change in value of an investment in the Fund over the periods covered, which assumes any dividends or capital gains distributions are reinvested in shares of the Fund. Returns do not reflect the deduction of taxes a shareholder would pay on Fund distributions or the redemption of Fund shares. |
The accompanying notes are an integral part of the financial statements.
THE TEXAS FUND
FINANCIAL HIGHLIGHTS |
(For a Share Outstanding Throughout the Period) | |
Class I Shares | | Year
Ended
August 31,
2015 | | | Period Ended August 31,
2014 (a) | |
Net asset value, beginning of period | | $ | 10.91 | | | $ | 10.00 | |
Income (loss) from investment operations: | | | | | | | | |
Net investment loss | | | (0.03 | ) | | | (0.03 | ) |
Net realized and unrealized gain (loss) on investments | | | (1.65 | ) | | | 0.94 | |
Total from investment operations | | | (1.68 | ) | | | 0.91 | |
| | | | | | | | | |
Less distributions: | | | | | | | | |
From net realized gains on investments | | | (0.31 | ) | | | — | |
Total distributions | | | (0.31 | ) | | | — | |
| | | | | | | | | |
Net asset value, end of period | | $ | 8.92 | | | $ | 10.91 | |
| | | | | | | | | |
Total Return (b) | | | (15.53 | %) | | | 9.10 | %(c) |
| | | | | | | | | |
Net assets, end of period (000's omitted) | | $ | 11,014 | | | $ | 11,995 | |
| | | | | | | | | |
Ratio of operating expenses to average net assets: | | | 1.60 | % | | | 1.64 | %(d) |
| | | | | | | | | |
Ratio of net investment loss to average net assets: | | | (0.33 | %) | | | (0.41% | )(d) |
| | | | | | | | | |
Portfolio turnover rate (e) | | | 59 | % | | | 38 | %(c) |
(a) | Represents the period from the initial public offering (September 17, 2013) through August 31, 2014. |
(b) | Total return is a measure of the change in value of an investment in the Fund over the periods covered, which assumes any dividends or capital gains distributions are reinvested in shares of the Fund. Returns do not reflect the deduction of taxes a shareholder would pay on Fund distributions or the redemption of Fund shares. |
(e) | Portfolio turnover is calculated on the basis of the Fund as a whole without distinguishing between the classes. |
The accompanying notes are an integral part of the financial statements.
THE TEXAS FUND
FINANCIAL HIGHLIGHTS |
(For a Share Outstanding Throughout the Period) | |
Class C Shares | | Year
Ended
August 31,
2015 | | | Period Ended August 31,
2014 (a) | |
Net asset value, beginning of period | | $ | 10.81 | | | $ | 10.00 | |
Income (loss) from investment operations: | | | | | | | | |
Net investment loss | | | (0.10 | ) | | | (0.13 | ) |
Net realized and unrealized gain (loss) on investments | | | (1.65 | ) | | | 0.94 | |
Total from investment operations | | | (1.75 | ) | | | 0.81 | |
| | | | | | | | | |
Less distributions: | | | | | | | | |
From net realized gains on investments | | | (0.31 | ) | | | — | |
Total distributions | | | (0.31 | ) | | | — | |
| | | | | | | | | |
Net asset value, end of period | | $ | 8.75 | | | $ | 10.81 | |
| | | | | | | | | |
Total Return (b) | | | (16.34 | %) | | | 8.10 | %(c) |
| | | | | | | | | |
Net assets, end of period (000's omitted) | | $ | 20 | | | $ | 13 | |
| | | | | | | | | |
Ratio of operating expenses to average net assets: | | | 2.60 | % | | | 2.64 | %(d) |
| | | | | | | | | |
Ratio of net investment loss to average net assets: | | | (1.33 | %) | | | (1.41% | )(d) |
| | | | | | | | | |
Portfolio turnover rate (e) | | | 59 | % | | | 38 | %(c) |
(a) | Represents the period from the initial public offering (September 17, 2013) through August 31, 2014. |
(b) | Total return is a measure of the change in value of an investment in the Fund over the periods covered, which assumes any dividends or capital gains distributions are reinvested in shares of the Fund. Returns do not reflect the deduction of taxes a shareholder would pay on Fund distributions or the redemption of Fund shares. |
(e) | Portfolio turnover is calculated on the basis of the Fund as a whole without distinguishing between the classes. |
The accompanying notes are an integral part of the financial statements.
MONTEAGLE FUNDS
NOTES TO FINANCIAL STATEMENTS — August 31, 2015 |
1. ORGANIZATION
Monteagle Funds (“the Trust”) was organized as a business trust under the laws of the State of Delaware on November 26, 1997 as Memorial Funds. The Trust changed its name to Monteagle Funds in July, 2006.
The Trust is registered with the Securities and Exchange Commission (“SEC”) as an open-end, management investment company under the Investment Company Act of 1940. The Trust is authorized by its Declaration of Trust to issue an unlimited number of shares of beneficial interest in each series. The Trust currently consists of the following series (each a “Fund” and collectively the “Funds”):
Monteagle Fixed Income Fund
Monteagle Informed Investor Growth Fund
Monteagle Quality Growth Fund
Monteagle Select Value Fund
Monteagle Value Fund
The Texas Fund
The Monteagle Fixed Income Fund (“Fixed Income Fund”), Monteagle Quality Growth Fund (“Quality Growth Fund”), Monteagle Select Value Fund (“Select Value Fund”), Monteagle Value Fund (“Value Fund”) and The Texas Fund (“Texas Fund”) are diversified series of Monteagle Funds. The Monteagle Informed Investor Growth Fund (“Informed Investor Growth Fund”) is a non-diversified series of Monteagle Funds. The principal investment objective of the Fixed Income Fund is total return. The principal investment objective of each of Informed Investor Growth Fund, Quality Growth Fund, Select Value Fund, Value Fund and Texas Fund (collectively the “Equity Funds”) is long-term capital appreciation.
The Fixed Income Fund, Informed Investor Growth Fund, Quality Growth Fund, Select Value Fund and Value Fund are authorized to offer one class of shares, Class I. The Texas Fund is authorized to offer two classes of shares, Class I and Class C. Each class differs as to sales and redemption charges and ongoing fees.
2. SIGNIFICANT ACCOUNTING POLICIES
The following is a summary of the Funds’ significant accounting policies:
Securities Valuation — Equity securities, including common stocks and exchange-traded funds, held by the Funds for which market quotations are readily available are valued using the last reported sales price or the official closing price provided by independent pricing services as of the close of trading on the New York Stock Exchange (normally 4:00 p.m. Eastern time) on each Fund’s business day. If no sales are reported, the average of the last bid and ask price is used. If no average price is available, the last bid price is used. To the extent these securities are actively traded and valuation adjustments are not applied, they are categorized in level 1 of the fair value hierarchy described below. When an equity security is valued by the independent pricing service using factors other than market quotations or the market is considered inactive, they will be categorized in level 2.
MONTEAGLE FUNDS
NOTES TO FINANCIAL STATEMENTS (Continued) |
Fixed income securities such as corporate bonds, municipal bonds, and U.S. government and agency obligations, are valued using an independent pricing service that considers market observable data such as reported sales of similar securities, broker quotes, yields, bids, offers, and other reference data. These securities are categorized as level 2 securities. The fair value of mortgage-backed securities is estimated by an independent pricing service which uses models that consider interest rate movements, new issue information and other security pertinent data. Evaluations of tranches (non-volatile, volatile, or credit sensitive) are based on interpretations of accepted Wall Street modeling and pricing conventions. Mortgage-backed securities are categorized in level 2 of the fair value hierarchy described below to the extent the inputs are observable and timely. In the absence of readily available market quotations, or other observable inputs, securities are valued at fair value pursuant to procedures adopted by the Board of Trustees and would be categorized as level 3.
Options contracts that are actively traded are valued based on quoted prices from the exchange and categorized in level 1 of the fair value hierarchy. Options held by the Funds for which no current quotations are readily available and which are not traded on the valuation date are valued at the average of the last bid and ask price and are categorized within level 2 of the fair value hierarchy. Depending on the product and terms of the transaction, the fair value of options can be modeled taking into account the counterparties’ creditworthiness and using a series of techniques, including simulation models. Many pricing models do not entail material subjectivity because the methodologies employed do not necessitate significant judgments, and the pricing inputs are observed from actively quoted markets, as is the case of options contracts. Options contracts valued using pricing models are categorized within level 2 of the fair value hierarchy.
Money market funds are valued at their net asset value of $1.00 per share and are categorized as level 1. Securities with maturities of 60 days or less may be valued at amortized cost, which approximates fair value and would be categorized as level 2.
Various inputs are used in determining the value of each of the Fund’s investments. These inputs are summarized in the three broad levels listed below:
| | ● | Level 1 – quoted prices in active markets for identical securities |
| | ● | Level 2 – other significant observable inputs |
| | ● | Level 3 – significant unobservable inputs |
The inputs or methodology used for valuing securities are not necessarily an indication of the risk associated with investing in those securities.
MONTEAGLE FUNDS
NOTES TO FINANCIAL STATEMENTS (Continued) |
The following is a summary of the inputs used to value the Funds’ investments at fair value as of August 31, 2015:
Fixed Income Fund |
Security Classification (a) | | Level 1
(Quoted Prices) | | | Level 2
(Other Significant Observable Inputs) | | | Totals | |
U.S. Government and Agency Obligations | | $ | — | | | $ | 15,548,656 | | | $ | 15,548,656 | |
Corporate Bonds | | | — | | | | 25,306,036 | | | | 25,306,036 | |
Mortgage-Backed Securities | | | — | | | | 6,266,593 | | | | 6,266,593 | |
Money Market Funds | | | 2,403,274 | | | | — | | | | 2,403,274 | |
Totals | | $ | 2,403,274 | | | $ | 47,121,285 | | | $ | 49,524,559 | |
Informed Investor Growth Fund |
Security Classification (a) | | Level 1
(Quoted Prices) | | | Level 2
(Other Significant Observable Inputs) | | | Totals | |
Common Stocks (b) | | $ | 8,036,562 | | | $ | — | | | $ | 8,036,562 | |
Money Market Funds | | | 2,726,201 | | | | — | | | | 2,726,201 | |
Totals | | $ | 10,762,763 | | | $ | — | | | $ | 10,762,763 | |
Quality Growth Fund |
Security Classification (a) | | Level 1
(Quoted Prices) | | | Level 2
(Other Significant Observable Inputs) | | | Totals | |
Common Stocks (b) | | $ | 23,867,733 | | | $ | — | | | $ | 23,867,733 | |
Money Market Funds | | | 879,901 | | | | — | | | | 879,901 | |
Totals | | $ | 24,747,634 | | | $ | — | | | $ | 24,747,634 | |
Select Value Fund |
Security Classification (a) | | Level 1
(Quoted Prices) | | | Level 2
(Other Significant Observable Inputs) | | | Totals | |
Common Stocks (b) | | $ | 13,295,960 | | | $ | — | | | $ | 13,295,960 | |
Money Market Funds | | | 1,328,617 | | | | — | | | | 1,328,617 | |
Totals | | $ | 14,624,577 | | | $ | — | | | $ | 14,624,577 | |
MONTEAGLE FUNDS
NOTES TO FINANCIAL STATEMENTS (Continued) |
Value Fund |
Security Classification (a) | | Level 1
(Quoted Prices) | | | Level 2
(Other Significant Observable Inputs) | | | Totals | |
Common Stocks (b) | | $ | 16,596,094 | | | $ | 275,999 | | | $ | 16,872,093 | |
Money Market Funds | | | 1,710,593 | | | | — | | | | 1,710,593 | |
Totals | | $ | 18,306,687 | | | $ | 275,999 | | | $ | 18,582,686 | |
Texas Fund |
Security Classification (a) | | Level 1
(Quoted Prices) | | | Level 2
(Other Significant Observable Inputs) | | | Totals | |
Common Stocks (b) | | $ | 5,666,375 | | | $ | — | | | $ | 5,666,375 | |
Call Options | | | 55,239 | | | | 2,513 | | | | 57,752 | |
Money Market Funds | | | 5,550,707 | | | | — | | | | 5,550,707 | |
Totals | | $ | 11,272,321 | | | $ | 2,513 | | | $ | 11,274,834 | |
(a) | As of and during the year ended August 31, 2015, the Funds held no securities that were considered to be “Level 3” securities (those valued using significant unobservable inputs). Therefore, a reconciliation of assets in which significant unobservable inputs (Level 3) were used in determining fair value is not applicable. |
(b) | All common stocks held in the Funds, except those noted in the Value Fund’s Schedule of Investments, are Level 1 securities. For a detailed break-out of common stocks by major industry classification, please refer to the Schedules of Investments. |
It is the Funds’ policy to recognize transfers between Levels at the end of the reporting period. There were no transfers into and out of any Level during the year ended August 31, 2015 for the Fixed Income Fund, Informed Investor Growth Fund, Quality Growth Fund, Select Value Fund and Texas Fund. Transfers of assets between Levels during the year ended August 31, 2015 for the Value Fund were as follows:
Value Fund | | | |
Transfers into Level 2: | | | |
Common Stocks | | $ | 275,999 | |
Net Transfers into Level 2: | | $ | 275,999 | |
| | | | | |
Transfers out of Level 1: | | | | |
Common Stocks | | $ | (275,999 | ) |
Net Transfers out of Level 1: | | $ | (275,999 | ) |
MONTEAGLE FUNDS
NOTES TO FINANCIAL STATEMENTS (Continued) |
Transfers of assets between Level 1 and Level 2 as of August 31, 2015 for the Value Fund were due to common stocks being priced previously based on the last trade price (Level 1) on previous valuation date but now priced using an evaluated price from the pricing service (Level 2) on current valuation date.
During the year ended August 31, 2015, no securities were fair valued.
Options transactions — The Texas Fund (the “Fund”) may purchase put and call options written by others and sell put and call options covering specified individual securities, securities or financial indices or currencies. A put option (sometimes called a “standby commitment”) gives the buyer of the option, upon payment of a premium, the right to deliver a specified amount of a security, index or currency to the writer of the option on or before a fixed date at a predetermined price. A call option (sometimes called a “reverse standby commitment”) gives the purchaser of the option, upon payment of a premium, the right to call upon the writer to deliver a specified amount of a security, index or currency on or before a fixed date, at a predetermined price. The predetermined prices may be higher or lower than the market value of the underlying security, index or currency. The Fund may buy or sell both exchange-traded and over-the-counter (“OTC”) options. The Fund will purchase or write an option only if that option is traded on a recognized U.S. options exchange or if the Adviser or Sub-adviser believes that a liquid secondary market for the option exists. When the Fund purchases an OTC option, it relies on the dealer from whom it has purchased the OTC option to make or take delivery of the security, index or currency underlying the option. Failure by the dealer to do so would result in the loss of the premium paid by the Fund as well as the loss of the expected benefit of the transaction. OTC options and the securities underlying these options currently are treated as illiquid securities by the Fund.
Upon selling an option, the Fund receives a premium from the purchaser of the option. Upon purchasing an option, the Fund pays a premium to the seller of the option. The amount of premium received or paid by the Fund is based upon certain factors, including the market price of the underlying securities, index or currency, the relationship of the exercise price to the market price, the historical price volatility of the underlying assets, the option period, supply and demand and interest rates.
The Fund may purchase call options on debt securities that the Fund’s Adviser or Sub-adviser intends to include in the Fund’s portfolio in order to fix the cost of a future purchase. Call options may also be purchased to participate in an anticipated price increase of a security on a more limited risk basis than would be possible if the security itself were purchased. If the price of the underlying security declines, this strategy would serve to limit the potential loss to the Fund to the option premium paid. Conversely, if the market price of the underlying security increases above the exercise price and the Fund either sells or exercises the option, any profit eventually realized will be reduced by the premium paid. The Fund may similarly purchase put options in order to hedge against a decline in market value of securities held in its portfolio. The put enables the Fund to sell the underlying security at the predetermined exercise price; thus the potential for loss to the Fund is limited to the option premium paid. If the market price of the underlying security is lower than the exercise price of the put, any profit the Fund realizes on the sale of the security would be reduced by the premium paid for the put option less any amount for which the put may be sold.
MONTEAGLE FUNDS
NOTES TO FINANCIAL STATEMENTS (Continued) |
The Adviser or Sub-adviser may write call options when it believes that the market value of the underlying security will not rise to a value greater than the exercise price plus the premium received. Call options may also be written to provide limited protection against a decrease in the market price of a security, in an amount equal to the call premium received less any transaction costs.
The Fund may purchase and write put and call options on fixed income or equity security indexes in much the same manner as the options discussed above, except that index options may serve as a hedge against overall fluctuations in the fixed income or equity securities markets (or market sectors) or as a means of participating in an anticipated price increase in those markets. The effectiveness of hedging techniques using index options will depend on the extent to which price movements in the index selected correlate with price movements of the securities, which are being hedged. Index options are settled exclusively in cash. See note 10 for additional risks associated with options transactions.
All options purchased by the Texas Fund are on equity securities including exchange traded funds. The derivatives are not accounted for as hedging instruments under GAAP. The effect of derivative instruments on the Statements of Assets and Liabilities at August 31, 2015 were as follows:
Fund | Derivatives not accounted for as hedging instruments under GAAP | Location of Derivatives on
Statements of Assets and Liabilities | | Fair Value of Asset Derivatives | |
Texas Fund | Call options purchased | Investment securities at fair value | | $ | 57,752 | |
| | Total | | | $ | 57,752 | |
The effect of derivative instruments on the Statements of Operations during the year ended August 31, 2015 were as follows:
Fund | Derivatives not accounted for as hedging instruments under GAAP | Location of gain (loss) on Derivatives recognized in income | | Realized and unrealized gain (loss) on Derivatives recognized in income | |
Texas Fund | Call options purchased | Net realized loss from call options purchased | | $ | (112,497 | ) |
Texas Fund | Put options purchased | Net realized loss from put options purchased | | | (230,261 | ) |
Texas Fund | Call options purchased | Net change in unrealized depreciation on call options purchased | | | (69,332 | ) |
Texas Fund | Put options purchased | Net change in unrealized appreciation on put options purchased | | | 183,124 | |
| Total | | | $ | (228,966 | ) |
MONTEAGLE FUNDS
NOTES TO FINANCIAL STATEMENTS (Continued) |
For the year ended August 31, 2015, the total amount of all purchased call and put options, as presented in the Texas Fund’s Schedule of Investments, is representative of the volume of activity for these derivative types during the period.
Security Loans — The Funds have entered into securities lending agreements with Morgan Stanley & Co., Inc. and MS Securities Services, Inc. The Funds receive compensation in the form of fees, or retain a portion of interest on the investment of any cash received as collateral. The Funds also continue to receive interest or dividends on the securities loaned. The loans are secured by collateral at least equal, at all times, to 102% of the prior day’s fair value of loaned securities. The cash collateral is invested in short-term instruments as noted in the Funds’ Schedules of Investments. Securities lending income is disclosed in the Funds’ Statements of Operations. Gain or loss in the fair value of the securities loaned that may occur during the term of the loan will be for the account of the Funds. The Funds have the right under the lending agreement to recover the securities from the borrower on demand. If the fair value of the collateral falls below 102% plus accrued interest of the loaned securities, the lender’s agent shall request additional collateral from the borrowers to bring the collateralization back to 102%. Under the terms of the securities lending agreement, the Funds are indemnified for losses incurred due to a borrower’s failure to comply with the terms of the securities lending agreement.
Should the borrower of the securities fail financially, the Funds have the right to repurchase the securities using the collateral in the open market. Although risk is mitigated by the collateral, the Funds could experience a delay in recovering their securities and possible loss of income or value if the borrower fails to return the borrowed securities. In addition, the Funds bear the risk of loss associated with the investment of the cash collateral received.
The following table presents financial instruments that are subject to enforceable netting arrangements as of August 31, 2015:
Assets:
| | | | | | | | | | | | | Gross Amounts Not Offset in the Statement of Assets and Liabilities | | | | |
Fund | Description | | Gross Amounts of Recognized Assets | | | Gross Amounts Offset in the Statement of Assets and Liabilities | | | Net Amount of Assets Presented in the Statement of Assets and Liabilities | | | Financial Instruments Pledged | | | Cash Collateral Pledged | | | Net
Amount | |
Select Value Fund | Securities Loaned | | $ | 944,413 | | | $ | — | | | $ | 944,413 | | | $ | — | | | $ | 944,413 | | | $ | — | |
Value Fund | Securities Loaned | | | 614,144 | | | | — | | | | 614,144 | | | | — | | | | 599,537 | | | | (14,607 | ) |
Texas Fund | Securities Loaned | | | 276,255 | | | | — | | | | 276,255 | | | | — | | | | 276,255 | | | | — | |
The Fixed Income Fund, Informed Investor Growth Fund and Quality Growth Fund did not have any securities loaned at August 31, 2015.
MONTEAGLE FUNDS
NOTES TO FINANCIAL STATEMENTS (Continued) |
Security Transactions — Security transactions are accounted for on trade date and realized gains and losses on investments sold are determined on a specific identification basis.
Interest and Dividend Income — Interest income is accrued as earned. Dividends on securities held by the Funds are recorded on the ex-dividend date. Discounts and premiums on securities purchased are amortized over the lives of the respective securities. Withholding taxes on foreign dividends have been provided for in accordance with the Funds’ understanding of the applicable country’s tax rules and rates. The ability of issuers of debt securities held by the Funds to meet their obligations may be affected by economic and political developments in a specific country or region.
Dividends and Distributions to Shareholders — Distributions of net investment income to shareholders are declared daily and paid monthly by the Fixed Income Fund. Net investment income distributions, if any, for Informed Investor Growth Fund, Quality Growth Fund, Select Value Fund, and Value Fund are declared and paid quarterly at the discretion of each Fund’s adviser. Net capital gains for the Funds, if any, are distributed to shareholders at least annually. Distributions to shareholders, which are determined in accordance with income tax regulations, are recorded on the ex-dividend date.
The tax character of distributions paid during the year ended August 31, 2015 and for the year/period ended August 31, 2014 were as follows:
Fund | | Ordinary Income | | | Long-Term Capital Gain | |
| | | 2015 | | | 2014 | | | 2015 | | | 2014 | |
Fixed Income Fund | | $ | 610,868 | | | $ | 553,797 | | | $ | — | | | $ | — | |
Informed Investor Growth Fund | | | 1,286,938 | | | | 948,210 | | | | 930,565 | | | | 145,819 | |
Quality Growth Fund | | | 44,563 | | | | 15,199 | | | | 228,609 | | | | — | |
Select Value Fund | | | 156,714 | | | | 111,674 | | | | 1,573,411 | | | | 286,386 | |
Value Fund | | | 528,443 | | | | 197,855 | | | | 2,763,727 | | | | — | |
Texas Fund | | | 291,146 | | | | — | | | | 82,245 | | | | — | |
Estimates — These financial statements are prepared in accordance with accounting principles generally accepted in the United States of America (“GAAP”), which requires management to make certain estimates and assumptions that affect the reported amounts of assets and liabilities, disclosure of contingent assets and liabilities at the date of the financial statements and the reported amounts of increases and decreases in net assets from operations during the reporting period. Actual results could differ from those estimates.
Common Expenses — Common expenses of the Trust are allocated among the Funds within the Trust based on relative net assets of each Fund or the nature of the services performed and the relative applicability to each Fund. Other allocations may also be approved from time to time by the Trustees.
MONTEAGLE FUNDS
NOTES TO FINANCIAL STATEMENTS (Continued) |
Multiple Class Allocations — Income, expenses and realized/unrealized gains or losses are allocated to each class based on relative share balances. Distribution fees are charged to each respective share class in accordance with the distribution plan.
Redemption Fees — A redemption fee of 1.00% is imposed on Texas Fund Class C shares in the event of certain redemption transactions within one year following such investments. The respective shareholders pay such redemption fees, which are not an expense of the Texas Fund. During the year ended August 31, 2015, no redemption fees were paid to the Texas Fund.
3. ADVISORY, SERVICING FEES AND OTHER TRANSACTIONS WITH AFFILIATES
Investment Advisory Agreement
Nashville Capital Corporation (“Nashville Capital” or the “Adviser”) serves as the investment adviser to the Funds. Subject to the general oversight of the Board of Trustees, the Adviser is responsible for, among other things, developing a continuing investment program for the Funds in accordance with their investment objectives, reviewing the investment strategies and policies of the Funds and advising the Board of Trustees on the selection of sub-advisers. Each Fund is authorized to pay the Adviser a fee based on average daily net assets at the following annual rates:
Assets | Fixed Income Fund | Informed Investor Growth Fund | Quality Growth Fund | Select Value Fund | Value Fund | Texas Fund |
Up to and including $10 millon | 0.965% | 1.200% | 1.200% | 1.200% | 1.200% | 1.450% |
From $10 million up to and including $25 million | 0.965% | 1.200% | 1.200% | 1.200% | 1.200% | 1.350% |
From $25 up to and including $50 million | 0.965% | 1.115% | 1.115% | 1.115% | 1.115% | 1.250% |
From $50 up to and including $100 million | 0.845% | 0.975% | 0.975% | 0.975% | 0.975% | 1.100% |
Over $100 million | 0.775% | 0.875% | 0.875% | 0.875% | 0.875% | 0.95% |
Under the terms of the Funds’ advisory agreement, the Adviser oversees the management of each Fund’s investments and pays all of the operating expenses of each Fund except: (i) costs of membership in trade associations; (ii) any expenses recouped by the Adviser; (iii) SEC registration fees and related expenses; (iv) any non-interested Trustee fees; (v) costs of travel for non-interested Trustees; (vi) costs associated with seminars, conventions or trade education for non-interested Trustees; (vii) 50% of the compensation amount approved by Trustees specifically for the Chief Compliance Officer’s services for the Trust attributable to the Funds managed by the Adviser; and (viii) any extraordinary Trust expenses, including legal expenses relating to lawsuits.
MONTEAGLE FUNDS
NOTES TO FINANCIAL STATEMENTS (Continued) |
For the year ended August 31, 2015, the amounts earned by and payable to the Adviser were as follows:
| | Advisory Fees Earned | | | Advisory Fees Payable as of August 31, 2015 | |
Fixed Income Fund | | $ | 454,349 | | | $ | 40,987 | |
Informed Investor Growth Fund | | | 152,954 | | | | 12,899 | |
Quality Growth Fund | | | 305,539 | | | | 26,145 | |
Select Value Fund | | | 177,097 | | | | 14,190 | |
Value Fund | | | 236,300 | | | | 18,849 | |
Texas Fund | | | 176,618 | | | | 14,713 | |
An officer of Nashville Capital is also an officer of the Trust.
Fixed Income Fund — Nashville Capital has retained Howe & Rusling Inc. (“H&R”) to serve as the sub-adviser to Fixed Income Fund. Nashville Capital has agreed to pay H&R an annual advisory fee of 0.30% of average daily net assets up to $25 million, 0.25% of such assets from $25 million up to $50 million, and 0.20% of such assets over $50 million.
Informed Investor Growth Fund — Nashville Capital has retained T.H. Fitzgerald & Co. (“T.H. Fitzgerald”) to serve as the sub-adviser to Informed Investor Growth Fund. Nashville Capital has agreed to pay T.H. Fitzgerald an annual advisory fee of 0.50% of average daily net assets up to $25 million, 0.60% of such assets from $25 million up to $50 million, 0.50% of such assets from $50 million up to $100 million, and 0.40% of such assets over $100 million.
Quality Growth Fund — Nashville Capital has retained Garcia Hamilton & Associates (“GHA”) to serve as the sub-adviser to Quality Growth Fund. Nashville Capital has agreed to pay GHA an annual advisory fee of 0.30% of average daily net assets.
Select Value Fund — Nashville Capital has retained Parkway Advisors, L.P. (“Parkway”) to serve as the sub-adviser to Select Value Fund. Nashville Capital has agreed to pay Parkway an annual advisory fee of 0.50% of average daily net assets.
Value Fund — Nashville Capital has retained Robinson Investment Group, Inc. (“Robinson”) to serve as the sub-adviser to Value Fund. Nashville Capital has agreed to pay Robinson an annual advisory fee of 0.50% of average daily net assets up to $25 million, 0.45% of such assets from $25 million up to $50 million, 0.35% of such assets from $50 million up to $100 million, and 0.30% of such assets over $100 million.
Texas Fund — Nashville Capital has retained J. Team Financial, Inc. d/b/a Team Financial Strategies (“Team”), to serve as the sub-adviser to Texas Fund. Nashville Capital has agreed to pay Team an annual advisory fee of 0.25% of average daily net assets up to $10 million and 0.60% of such assets over $10 million.
MONTEAGLE FUNDS
NOTES TO FINANCIAL STATEMENTS (Continued) |
Investment Company Services Agreement
Pursuant to an Investment Company Services Agreement between the Trust and M3Sixty Administration, LLC (formerly, Matrix 360 Administration, LLC) (“M3Sixty”) provides administrative, fund accounting and pricing, and transfer agent and shareholder services to the Funds. M3Sixty receives fees for these services, which are paid by the Adviser (not the Funds). Officers of M3Sixty are also officers of the Trust.
Distribution Agreement
Pursuant to the terms of a Distribution Agreement with the Trust, Matrix Capital Group, Inc. (the “Distributor”) serves as the Funds’ principal underwriter. Matrix Capital Group, Inc. does not receive compensation for such services.
The Texas Fund has adopted a Distribution Plan (“Plan”) pursuant to Rule 12b-1 of the 1940 Act. Under the Plan, the Fund may use 12b-1 fees to compensate broker-dealers (including, without limitation, the Distributor) for sales of the Texas Fund’s Class C shares, or for other expenses associated with distributing the Texas Fund’s Class C shares. The Texas Fund may expense up to 1.00% for Class C shares of the Texas Fund’s average daily net assets annually to pay for any activity primarily intended to result in the sale of shares of the Texas Fund and the servicing of shareholder accounts, provided that the Trustees have approved the category of expenses for which payment is being made. During the year ended August 31, 2015, the Texas Fund incurred $169 of 12b-1 fees.
Compliance Services
An affiliated Contractor (the “Contractor”) serves as the CCO of the Trust. The Funds pay $99,000 annually to the Contractor for providing CCO services. Each Fund pays $5,000 with the remaining $69,000 allocated to the Funds based on aggregate average daily net assets. The Contractor also received a special bonus of $2,500 from the Funds in August 2015. The payment was allocated among the Funds based on their respective net assets on payment date.
4. SECURITIES TRANSACTIONS
During the year ended August 31, 2015, cost of purchases and proceeds from sales and maturities of investment securities, excluding short-term investments and U.S. government securities, were as follows:
Fund | | Purchases | | | Sales | |
Fixed Income Fund | | $ | 10,454,862 | | | $ | 6,479,241 | |
Informed Investor Growth Fund | | | 47,661,909 | | | | 52,501,086 | |
Quality Growth Fund | | | 6,061,116 | | | | 6,319,094 | |
Select Value Fund | | | 8,370,440 | | | | 8,091,149 | |
Value Fund | | | 3,901,579 | | | | 2,796,691 | |
Texas Fund | | | 6,728,285 | | | | 11,186,283 | |
MONTEAGLE FUNDS
NOTES TO FINANCIAL STATEMENTS (Continued) |
The cost of purchases and proceeds from sales of U.S. government securities by the Fixed Income Fund were $4,702,794 and $0, respectively. There were no purchases or sales of U.S. government securities made by the Informed Investor Growth Fund, Quality Growth Fund, Select Value Fund, Value Fund or Texas Fund.
5. TAX MATTERS
It is each Fund’s policy to comply with the special provisions of Subchapter M of the Internal Revenue Code applicable to regulated investment companies. As provided therein, in any fiscal year in which a Fund so qualifies and distributes at least 90% of its taxable income, such Fund (but not the shareholders) will be relieved of federal income tax on the income distributed. Accordingly, no provision for income taxes has been made.
In order to avoid imposition of the excise tax applicable to regulated investment companies, it is also each Fund’s intention to declare as dividends in each calendar year at least 98% of its net investment income and 98.2% of its net realized capital gains plus undistributed amounts from prior years.
The Funds’ tax basis distributable earnings are determined only at the end of each fiscal year. The tax character of distributable earnings (deficit) at August 31, 2015, the Funds’ most recent fiscal year end, was as follows:
Fund | | Unrealized Appreciation (Depreciation) | | Undistributed Ordinary Income | | Undistributed Capital
Gains | | Capital
Loss Carryforward | | | Post-December Ordinary
Loss | | Post-
October Capital
Loss | | Total Distributable Earnings | |
Fixed Income Fund | | $ | 132,937 | | $ | 5,782 | | $ | — | | $ | (291,240 | ) | | $ | — | | $ | — | | $ | (152,521 | ) |
Informed Investor Growth Fund | | | 150,791 | | | 826,557 | | | 148,808 | | | — | | | | (85,957 | ) | | — | | | 1,040,199 | |
Quality Growth Fund | | | 5,454,981 | | | 54,573 | | | 1,277,045 | | | — | | | | — | | | — | | | 6,786,599 | |
Select Value Fund | | | (246,725 | ) | | 35,647 | | | 3,312,954 | | | — | | | | — | | | — | | | 3,101,876 | |
Value Fund | | | 361,506 | | | 39,971 | | | 1,138,407 | | | — | | | | — | | | — | | | 1,539,884 | |
Texas Fund | | | (635,032 | ) | | — | | | (14,713 | ) | | — | | | | (24,303 | ) | | (1,024,599 | ) | | (1,698,647 | ) |
The undistributed ordinary income, capital gains, carryforward losses and post-October losses shown above differ from corresponding accumulated net investment income and accumulated net realized gain (loss) figures reported in the statements of assets and liabilities due to differing book/tax treatment of short-term capital gains, and certain temporary book/tax differences due to the tax deferral of losses on wash sales.
MONTEAGLE FUNDS
NOTES TO FINANCIAL STATEMENTS (Continued) |
Under current tax law, net capital losses realized after October 31st and net ordinary losses incurred after December 31st may be deferred and treated as occurring on the first day of the following fiscal year. The Funds’ carryforward losses, post-October losses and post-December losses are determined only at the end of each fiscal year. As of August 31, 2015, the Funds’ most recent fiscal year end, the Funds elected to defer net capital losses as indicated in the chart below.
| | | Post-October Losses | | | Post-December Losses | |
Fund | | Deferred | | | Utilized | | | Deferred | | | Utilized | |
Fixed Income Fund | | $ | — | | | $ | — | | | $ | — | | | $ | — | |
Informed Investor Growth Fund | | | — | | | | — | | | | 85,957 | | | | — | |
Quality Growth Fund | | | — | | | | — | | | | — | | | | — | |
Select Value Fund | | | — | | | | — | | | | — | | | | — | |
Value Fund | | | — | | | | — | | | | — | | | | — | |
Texas Fund | | | 1,024,599 | | | | — | | | | 24,303 | | | | — | |
As of August 31, 2015, the following Funds had the following capital loss carryforwards for federal income tax purposes. These capital loss carryforwards may be utilized in future years to offset net realized capital gains, if any, prior to distributing such gains to shareholders.
Fund | | 2016 | | | 2017 | | | 2018 | | | Non-Expiring Long-Term | | | Total | | | Utilized | |
Fixed Income Fund | | $ | 48,295 | | | $ | 220,424 | | | $ | 22,521 | | | $ | — | | | $ | 291,240 | | | $ | 149,853 | |
Informed Investor Growth Fund | | | — | | | | — | | | | — | | | | — | | | | — | | | | — | |
Quality Growth Fund | | | — | | | | — | | | | — | | | | — | | | | — | | | | 81,404 | |
Select Value Fund | | | — | | | | — | | | | — | | | | — | | | | — | | | | — | |
Value Fund | | | — | | | | — | | | | — | | | | — | | | | — | | | | — | |
Texas Fund | | | — | | | | — | | | | — | | | | — | | | | — | | | | — | |
Under the Regulated Investment Company Modernization Act of 2010 (the Act), net capital losses recognized after December 31, 2010, may be carried forward indefinitely, and their character is retained as short-term and/or long-term. Under the law in effect prior to the Act, pre-enactment net capital losses were carried forward for eight years and treated as short-term losses. As a transition rule, the Act requires that post-enactment net capital losses be utilized before pre-enactment net capital losses. There were no post-enactment capital losses incurred by the Fixed Income Fund, Informed Investor Growth Fund, Quality Growth Fund, Select Value Fund or Texas Fund during the year ended August 31, 2015.
MONTEAGLE FUNDS
NOTES TO FINANCIAL STATEMENTS (Continued) |
The following information is based upon the federal income tax cost of the investment securities as of August 31, 2015:
Fund | | Cost | | | Gross Unrealized Appreciation | | | Gross Unrealized Depreciation | | | Net Unrealized Appreciation (Depreciation) | |
Fixed Income Fund | | $ | 49,391,622 | | | $ | 518,844 | | | $ | (385,907 | ) | | $ | 132,937 | |
Informed Investor Growth Fund | | | 10,611,972 | | | | 536,226 | | | | (385,435 | ) | | | 150,791 | |
Quality Growth Fund | | | 19,292,653 | | | | 6,268,541 | | | | (813,560 | ) | | | 5,454,981 | |
Select Value Fund | | | 14,871,302 | | | | 1,540,453 | | | | (1,787,178 | ) | | | (246,725 | ) |
Value Fund | | | 18,221,180 | | | | 2,731,533 | | | | (2,370,027 | ) | | | 361,506 | |
Texas Fund | | | 11,909,866 | | | | 229,393 | | | | (864,425 | ) | | | (635,032 | ) |
The difference between the federal income tax cost of portfolio investments and the financial statement cost for Informed Investor Growth Fund, Quality Growth Fund, Select Value Fund and Texas Fund is due to certain timing differences in the recognition of capital losses under income tax regulations and GAAP. These “book/tax” differences are temporary in nature and are due to the tax deferral of losses on wash sales and tax basis adjustments on corporate actions..
For the year ended August 31, 2015, Fixed Income Fund reclassified $38,711 of capital losses on paydowns of mortgage-backed and asset-backed securities from net investment income to accumulated net realized loss on the Statements of Assets and Liabilities. For the year ended August 31, 2015, Informed Investor Growth Fund reclassified $39,986 of net investment loss to accumulated net capital gains on the Statement of Assets and Liabilities. For the year ended August 31, 2015 the Texas Fund reclassified $16,491 of net investment loss to accumulated net capital gains on the Statement of Assets and Liabilities. Such reclassifications, the result of permanent differences between the financial statement and income tax reporting requirements, have no effect on the Funds’ net assets or net asset values per share.
The Funds recognize the tax benefits of uncertain tax positions only when the position is “more likely than not” to be sustained assuming examination by tax authorities. Management has reviewed the tax positions in the open tax years of 2012, 2013, 2014 and for the year ended August 31, 2015 and has concluded that no liability for unrecognized tax benefits should be recorded related to uncertain tax positions taken in the above open tax years. The Funds identify their major tax jurisdictions as U.S. Federal and Delaware. The Funds recognize interest and penalties, if any, related to unrecognized tax benefits as income tax expense in the Statements of Operations. During the year ended August 31, 2015, the Funds did not incur any interest or penalties. The Funds are not subject to examination by U.S. Federal tax authorities for tax years before 2012.
6. CONTROL OWNERSHIP
The beneficial ownership, either directly or indirectly, of more than 25% of the voting securities of a fund creates presumption of control of the fund under Section 2(a)(9) of the Investment Company Act of 1940. As of August 31, 2015, the shareholders listed in the table immediately below held, for the benefit of their customers, the following percentages of the outstanding shares
MONTEAGLE FUNDS
NOTES TO FINANCIAL STATEMENTS (Continued) |
of each Fund. The Trust does not know whether Charles Schwab & Co., Maril & Co., Mitra & Co., or any of the underlying beneficial owners owned or controlled 25% or more of the voting securities of the noted Funds.
Fund | Shareholder | Percent Owned as of
August 31, 2015 |
Fixed Income Fund | Mitra & Co. | 91% |
Informed Investor Growth Fund | Maril & Co. | 92% |
Quality Growth Fund | Maril & Co. | 94% |
Select Value Fund | Charles Schwab & Co. | 90% |
Value Fund | Maril & Co. | 99% |
7. CAPITAL SHARE TRANSACTIONS
| | | Fixed Income Fund | |
| | | Sold | | | Redeemed | | | Reinvested | | | Ending Shares | |
For the Fiscal Year ended: | | | | | | | | | | | | |
August 31, 2015 | | | | | | | | | | | | |
Class I | | | | | | | | | | | | |
Shares | | | 751,208 | | | | (83,445 | ) | | | 54,066 | | | | 4,803,759 | |
Value | | | 7,846,193 | | | $ | (869,328 | ) | | $ | 564,682 | | | | | |
| | | | | | | | | | | | | | | | | |
For the Fiscal Year ended: | | | | | | | | | | | | | | | | |
August 31, 2014 | | | | | | | | | | | | | | | | |
Class I | | | | | | | | | | | | | | | | |
Shares | | | 272,366 | | | | (82,260 | ) | | | 47,966 | | | | 4,081,930 | |
Value | | | 2,813,350 | | | $ | (851,208 | ) | | $ | 497,070 | | | | | |
| | | Informed Investor Growth Fund | |
| | | Sold | | | Redeemed | | | Reinvested | | | Ending Shares | |
For the Fiscal Year ended: | | | | | | | | | | | | |
August 31, 2015 | | | | | | | | | | | | |
Class I | | | | | | | | | | | | |
Shares | | | 118,225 | | | | (121,617 | ) | | | 12,124 | | | | 1,114,575 | |
Value | | $ | 1,348,069 | | | $ | (1,438,349 | ) | | $ | 122,813 | | | | | |
| | | | | | | | | | | | | | | | | |
For the Fiscal Year ended: | | | | | | | | | | | | | | | | |
August 31, 2014 | | | | | | | | | | | | | | | | |
Class I | | | | | | | | | | | | | | | | |
Shares | | | 22,858 | | | | (56,793 | ) | | | 7,742 | | | | 1,105,843 | |
Value | | $ | 281,144 | | | $ | (706,347 | ) | | $ | 93,446 | | | | | |
MONTEAGLE FUNDS
NOTES TO FINANCIAL STATEMENTS (Continued) |
| | | Quality Growth Fund | |
| | | Sold | | | Redeemed | | | Reinvested | | | Ending Shares | |
For the Fiscal Year ended: | | | | | | | | | | | | |
August 31, 2015 | | | | | | | | | | | | |
Class I | | | | | | | | | | | | |
Shares | | | 54,620 | | | | (25,870 | ) | | | 1,269 | | | | 1,882,008 | |
Value | | $ | 706,849 | | | $ | (338,433 | ) | | $ | 16,689 | | | | | |
| | | | | | | | | | | | | | | | | |
For the Fiscal Year ended: | | | | | | | | | | | | | | | | |
August 31, 2014 | | | | | | | | | | | | | | | | |
Class I | | | | | | | | | | | | | | | | |
Shares | | | 38,681 | | | | (586,453 | ) | | | 162 | | | | 1,851,989 | |
Value | | $ | 463,874 | | | $ | (6,841,937 | ) | | $ | 1,928 | | | | | |
| | | Select Value Fund | |
| | | Sold | | | Redeemed | | | Reinvested | | | Ending Shares | |
For the Fiscal Year ended: | | | | | | | | | | | | |
August 31, 2015 | | | | | | | | | | | | |
Class I | | | | | | | | | | | | |
Shares | | | 102,685 | | | | (124,538 | ) | | | 10,728 | | | | 863,072 | |
Value | | $ | 1,786,668 | | | $ | (2,179,261 | ) | | $ | 176,313 | | | | | |
| | | | | | | | | | | | | | | | | |
For the Fiscal Year ended: | | | | | | | | | | | | | | | | |
August 31, 2014 | | | | | | | | | | | | | | | | |
Class I | | | | | | | | | | | | | | | | |
Shares | | | 213,826 | | | | (293,896 | ) | | | 2,859 | | | | 874,197 | |
Value | | $ | 3,626,370 | | | $ | (4,945,828 | ) | | $ | 46,783 | | | | | |
| | | Value Fund | |
| | | Sold | | | Redeemed | | | Reinvested | | | Ending Shares | |
For the Fiscal Year ended: | | | | | | | | | | | | |
August 31, 2015 | | | | | | | | | | | | |
Class I | | | | | | | | | | | | |
Shares | | | 234,394 | | | | (11,692 | ) | | | 2,978 | | | | 1,347,335 | |
Value | | $ | 3,671,816 | | | $ | (173,429 | ) | | $ | 42,982 | | | | | |
| | | | | | | | | | | | | | | | | |
For the Fiscal Year ended: | | | | | | | | | | | | | | | | |
August 31, 2014 | | | | | | | | | | | | | | | | |
Class I | | | | | | | | | | | | | | | | |
Shares | | | 73,575 | | | | (20,821 | ) | | | 167 | | | | 1,121,655 | |
Value | | $ | 1,357,355 | | | $ | (369,477 | ) | | $ | 2,876 | | | | | |
MONTEAGLE FUNDS
NOTES TO FINANCIAL STATEMENTS (Continued) |
| | | Texas Fund | |
| | | Sold | | | Redeemed | | | Reinvested | | | Ending Shares | |
For the Fiscal Year ended: | | | | | | | | | | | | |
August 31, 2015 | | | | | | | | | | | | |
Class I | | | | | | | | | | | | |
Shares | | | 304,096 | | | | (205,411 | ) | | | 36,150 | | | | 1,234,561 | |
Value | | $ | 3,028,749 | | | $ | (1,930,729 | ) | | $ | 339,807 | | | | | |
Class C | | | | | | | | | | | | | | | | |
Shares | | | 1,031 | | | | — | | | | 40 | | | | 2,260 | |
Value | | $ | 10,000 | | | $ | — | | | $ | 371 | | | | | |
| | | | | | | | | | | | | | | | | |
For the Period (a) ended: | | | | | | | | | | | | | | | | |
August 31, 2014 | | | | | | | | | | | | | | | | |
Class I | | | | | | | | | | | | | | | | |
Shares | | | 1,134,478 | | | | (34,752 | ) | | | — | | | | 1,099,726 | |
Value | | $ | 11,638,610 | | | $ | (366,036 | ) | | $ | — | | | | | |
Class C | | | | | | | | | | | | | | | | |
Shares | | | 1,190 | | | | (1 | ) | | | — | | | | 1,189 | |
Value | | $ | 12,000 | | | $ | (12 | ) | | $ | — | | | | | |
(a) | Represents the period from the initial public offering (September 17, 2013) through February 28, 2014. |
8. CONTINGENCIES AND COMMITMENTS
The Funds indemnify the Trust’s officers and Trustees for certain liabilities that might arise from the performance of their duties to the Funds. Additionally, in the normal course of business the Funds enter into contracts that contain a variety of representations and warranties and which provide general indemnifications. Each Fund’s maximum exposure under these arrangements is unknown, as this would involve future claims that may be made against the Funds that have not yet occurred. However, based on experience, the Funds expect the risk of loss to be remote.
9. SECTOR RISK
When the Funds emphasize one or more economic sectors, it may be more susceptible to the financial, market, or economic events affecting the particular issuers and industries in which they invest than funds that do not emphasize particular sectors. The more a fund diversifies, the more it spreads risk and potentially reduces the risks of loss and volatility.
MONTEAGLE FUNDS
NOTES TO FINANCIAL STATEMENTS (Continued) |
10. OPTIONS RISK
The Texas Fund’s use of options subjects the Fund to certain investment risks and transaction costs to which it might not otherwise be subject. These risks include: (i) dependence on the Adviser or Sub-adviser’s ability to predict movements in the prices of individual securities and fluctuations in the general securities markets; (ii) imperfect correlations between movements in the prices of options and movements in the price of the securities (or indices) hedged or used for cover, which may cause a given hedge not to achieve its objective; (iii) the fact that the skills and techniques needed to trade these instruments are different from those needed to select the securities in which the Texas Fund invests; (iv) lack of assurance that a liquid secondary market will exist for any particular instrument at any particular time, which, among other things, may hinder the Texas Fund’s ability to limit exposures by closing its positions; and, (v) the possible need to defer closing out of certain options to avoid adverse tax consequences. Other risks include the inability of the Texas Fund, as the writer of covered call options, to benefit from any appreciation of the underlying securities above the exercise price, and the possible loss of the entire premium paid for options purchased by the Texas Fund. See note 2 for additional disclosures related to options transactions.
11. RECENT ACCOUNTING PRONOUNCEMENTS
In June 2014, the Financial Accounting Standards Board (“FASB”) issued Accounting Standards Update (“ASU”) No. 2014-11 Repurchase-to-Maturity Transactions, Repurchase Financings, and Disclosures. The amendments in this ASU require an entity to modify accounting for repurchase-to-maturity transactions and repurchase financing arrangements, as well as modify required disclosures for repurchase agreements, securities lending transactions, and repurchase-to-maturity transactions that are accounted for as secured borrowings. The guidance is effective for fiscal years beginning on or after December 15, 2014, and for interim periods within those fiscal years. Management is currently evaluating the impact these changes will have on the Fund’s financial statement disclosures.
12. SUBSEQUENT EVENTS
On September 15, 2015, the Quality Growth Fund declared a dividend from net investment income of $60,088, which was payable on September 15, 2015. On September 15, 2015, the Select Value Fund declared a dividend from net investment income of $43,359, which was payable on September 15, 2015. On September 15, 2015, the Value Fund declared a dividend from net investment income of $55,832, which was payable on September 15, 2015. On September 30, 2015, the Fixed Income Fund declared a dividend from net investment income of $53,366, which was payable on September 30, 2015.
On October 23, 2015, at a regularly scheduled meeting of the Trust’s Board of Trustees (the “Board”), David J. Gruber and Jeffrey W. Wallace were appointed by the Board as Trustees. On January 21, 2016, a Special Meeting of Shareholders will be held, at which time all four of the Trust’s trustees, including Messrs. Gruber and Wallace, but also Larry Anderson and Charles Kinard, will be considered for election by shareholders.
MONTEAGLE FUNDS
NOTES TO FINANCIAL STATEMENTS (Continued) |
Management has evaluated subsequent events through the issuance of the financial statements and has noted no other such events that would require disclosure.
13. LEGAL PROCEEDINGS
On December 7, 2010, an amended complaint was filed in the United States Bankruptcy Court for the District of Delaware (Adversary Proceeding No. 10-54010) by The Official Committee of Unsecured Creditors of Tribune Company (“Committee”) on behalf of Tribune Company (“Tribune”), a U.S. news and media organization. Among the thousands of defendants in the Amended Complaint is the Monteagle Funds with respect to holdings by the Monteagle Value Fund (the “Fund”). The Fund, along with numerous other mutual funds, institutional investors and others, owned shares of Tribune in 2007 when it went private in a leveraged buyout transaction (“LBO”). In the LBO, shareholders such as the Fund sold their shares back to Tribune for $34/share. The lawsuit alleges, among other things, that the payment for the shares by Tribune was a fraudulent transfer and seeks to have the cash paid to shareholders returned to the Tribune bankruptcy estate. The Amended Complaint seeks to create a class of Defendants - the former shareholders of Tribune - and seeks return of over $8 billion in proceeds from the LBO. The Committee has not served the Fund with the Amended Complaint, and the Fund was not named as a Defendant in the original complaint. Although the Fund has not yet been served, the Fund is monitoring the litigation.
On April 5, 2012, the Committee’s lawsuit was transferred by the Judicial Panel on Multidistrict Litigation to the United States District Court for the Southern District of New York for discovery and pretrial motions with numerous other related actions. (In re Tribune Company Fraudulent Conveyance Litigation, 1:12-mc-02296-WHP). It is unclear if the Fund is named as a Defendant, or is a member of any proposed class, in any of these other actions.
On July 23, 2012, the Delaware Bankruptcy Judge confirmed a plan of reorganization that, among other things, replaced the Committee as Plaintiff with a Litigation Trustee.
On September 7, 2012, Judge Pauley of the Southern District of New York entered a Master Case Order. Among other things, the Master Case Order creates liaison counsel and an Executive Committee for the defendants in the Litigation Trustee’s lawsuit, including those defendants, like the Fund, that were only shareholders of Tribune. The Executive Committee Members for mutual funds are Michael S. Doluisio, an attorney with Dechert LLP in Philadelphia, and Steven R. Schoenfeld, an attorney with Dorsey & Whitney LLP in New York. The Executive Committee is directed to take reasonable steps to streamline case management and to eliminate duplication of efforts and redundant filings. However, the Master Case Order does not certify a class of Defendants, and does not prevent any individual Defendant from retaining its own counsel or being heard by the Court. Discovery in the Litigation Trustee’s lawsuit is stayed pending resolution of certain motions to dismiss in the related litigation.
MONTEAGLE FUNDS
NOTES TO FINANCIAL STATEMENTS (Continued) |
On September 23, 2013, the Court rejected the defendants’ arguments under section 546(e) of the Bankruptcy Code (the so-called public-securities-market exemption), but still dismissed the so-called Individual Creditors Actions (the individual creditor, constructive fraudulent-conveyance actions) on the ground that the Individual Creditors lack standing to seek avoidance of the same transactions that the Litigation Trustee is simultaneously suing to avoid.
On May 23, 2014, the Executive Committee, on behalf of all Exhibit A shareholder defendants, including the Fund, filed a motion to dismiss Count One of the Litigation Trustee’s Fifth Amended Complaint on grounds, among other things, that complaint fails to allege facts from which a strong inference can be drawn that the Tribune Board acted with the actual intent to hinder, delay or defraud creditors when it approved the LBO. The Litigation Trustee has responded and the motion is fully briefed and pending before Judge Pauley. The Individual Creditors have appealed the dismissal for lack of standing to the Second Circuit, and the Executive Committee has cross-appealed the failure to dismiss under 546(e). Oral argument on appeal was heard on November 6, 2014. A timetable for a decision from the Second Circuit is unknown.
It is not expected that the cases discussed above will have a material adverse impact on the Fund’s financial position, results of operation, or cash flows; however, these litigation matters are subject to inherent uncertainties and the views of these matters with respect to any impact to the Fund may change in the future.
MONTEAGLE FUNDS
REPORT OF INDEPENDENT REGISTERED PUBLIC ACCOUNTING FIRM |
To the Shareholders and Board of Trustees of
Monteagle Funds
We have audited the accompanying statements of assets and liabilities, including the schedules of investments, of Monteagle Funds, comprising Monteagle Fixed Income Fund, Monteagle Informed Investor Growth Fund, Monteagle Quality Growth Fund, Monteagle Select Value Fund, Monteagle Value Fund, and The Texas Fund (the “Funds”), as of August 31, 2015, and the related statements of operations for the year then ended, the statements of changes in net assets for each of the two periods in the period then ended, and the financial highlights for each of the periods indicated. These financial statements and financial highlights are the responsibility of the Funds’ management. Our responsibility is to express an opinion on these financial statements and financial highlights based on our audits.
We conducted our audits in accordance with the standards of the Public Company Accounting Oversight Board (United States). Those standards require that we plan and perform the audit to obtain reasonable assurance about whether the financial statements and financial highlights are free of material misstatement. An audit includes examining, on a test basis, evidence supporting the amounts and disclosures in the financial statements. Our procedures included confirmation of securities owned as of August 31, 2015, by correspondence with the custodian and brokers, or by other appropriate auditing procedures where replies from brokers were not received. An audit also includes assessing the accounting principles used and significant estimates made by management, as well as evaluating the overall financial statement presentation. We believe that our audits provide a reasonable basis for our opinion.
In our opinion, the financial statements and financial highlights referred to above present fairly, in all material respects, the financial position of each of the Funds constituting Monteagle Funds as of August 31, 2015, the results of their operations, the changes in their net assets, and the financial highlights for the periods indicated above, in conformity with accounting principles generally accepted in the United States of America.
COHEN FUND AUDIT SERVICES, LTD.
Cleveland, Ohio
October 29, 2015
MONTEAGLE FUNDS
OTHER INFORMATION (Unaudited) |
Proxy Policies — The Trust has adopted Proxy Voting Policies and Procedures under which the Funds vote proxies related to securities held by the Funds. A description of the Funds’ policies and procedures is available without charge, upon request, by calling the Funds toll free at 1-888-263-5593, on the Funds’ website at http://www.monteaglefunds.com or on the SEC website at http://www.sec.gov.
In addition, the Funds are required to file Form N-PX, with their complete voting record for the 12 months ended June 30th, no later than August 31st of each year. The Funds’ Form N-PX is available without charge, upon request, by calling the Funds toll free at 1-888-263-5593, on the Funds’ website at http://www.monteaglefunds.com or on the SEC’s website at http://www.sec.gov.
N-Q Filing — The SEC has adopted the requirement that all mutual funds file a complete schedule of investments with the SEC for their first and third fiscal quarters on Form N-Q. For the Monteagle Funds, this would be for the fiscal quarters ending November 30 and May 31. The Form N-Q filing must be made within 60 days of the end of the quarter. The Funds’ Forms N-Q are available on the SEC’s website at http://www.sec.gov., or they may be reviewed and copied at the SEC’s Public Reference Room in Washington, DC (call 1-800-732-0330 for information on the operation of the Public Reference Room).
FEDERAL TAX INFORMATION (Unaudited)
For the fiscal year ended August 31, 2015, certain distributions paid by the Funds may be subject to a maximum tax rate of 20%. The Fixed Income Fund, Informed Investor Growth Fund, Quality Growth Fund, Select Value Fund, Value Fund and Texas Fund intend to designate up to a maximum amount of $610,868, $2,217,503, $273,172, $1,730,125, 3,292,170 and $373,391, respectively, as taxed at a maximum rate of 20%. Complete information will be computed and reported in conjunction with your 2015 Form 1099-DIV.
MONTEAGLE FUNDS
ABOUT YOUR FUNDS’ EXPENSES (Unaudited) |
We believe it is important for you to understand the impact of costs on your investment. As a shareholder of the Funds, you incur two types of costs: (1) transaction costs, including redemption fees; and (2) ongoing costs, including management fees, distribution and service (12b-1) fees; and other Fund expenses. The following examples are intended to help you understand your ongoing costs (in dollars) of investing in the Funds and to compare these costs with the ongoing costs of investing in other mutual funds.
A mutual fund’s ongoing costs are expressed as a percentage of its average net assets. This figure is known as the expense ratio. The expenses in the tables below are based on an investment of $1,000 made at the beginning of the most recent semi-annual period (March 1, 2015) and held until the end of the period (August 31, 2015).
The tables that follow illustrate each Fund’s costs in two ways:
Actual fund return – This section helps you to estimate the actual expenses that you paid over the period. The “Ending Account Value” shown is derived from each Fund’s actual return, and the third column shows the dollar amount of operating expenses that would have been paid by an investor who started with $1,000 in the Funds. You may use the information here, together with the amount you invested, to estimate the expenses that you paid over the period.
To do so, simply divide your account value by $1,000 (for example, an $8,600 account value divided by $1,000 = 8.6), then multiply the result by the number given for the Funds under the heading “Expenses Paid During Period.”
Hypothetical 5% return – This section is intended to help you compare the Funds’ costs with those of other mutual funds. It assumes that each Fund had an annual return of 5% before expenses during the period shown, but that the expense ratio is unchanged. In this case, because the return used is not the Funds’ actual returns, the results do not apply to your investment. The example is useful in making comparisons because the Securities and Exchange Commission requires all mutual funds to calculate expenses based on a 5% return. You can assess each Fund’s costs by comparing this hypothetical example with the hypothetical examples that appear in shareholder reports of other funds.
Note that expenses shown in the table are meant to highlight and help you compare ongoing costs only.
The calculations assume no shares were bought or sold during the period. Your actual costs may have been higher or lower, depending on the amount of your investment and the timing of any purchases or redemptions.
More information about the Funds’ expenses, including historical annual expense ratios, can be found in this report. For additional information on operating expenses and other shareholder costs, please refer to each Fund’s Prospectus.
MONTEAGLE FUNDS
ABOUT YOUR FUNDS’ EXPENSES (Unaudited) (Continued) |
Fixed Income Fund |
| | | Beginning Account Value 3/01/15 | Annualized Expense Ratio For the Period | Ending Account Value 8/31/15 | Expenses Paid During the Period (1) |
Actual Example Based on actual return of: |
Class I | -0.42% | $1,000.00 | 1.04% | $ 995.80 | $ 5.23 |
Hypethetical Example Based on assumed 5% return |
Class I | | $1,000.00 | 1.04% | $ 1,020.00 | $ 5.30 |
Informed Investor Growth Fund |
| | | Beginning Account Value 3/01/15 | Annualized Expense Ratio For the Period | Ending Account Value 8/31/15 | Expenses Paid During the Period (1) |
Actual Example Based on actual return of: |
Class I | -3.76% | $1,000.00 | 1.34% | $ 962.40 | $ 6.63 |
Hypethetical Example Based on assumed 5% return |
Class I | | $1,000.00 | 1.34% | $ 1,018.50 | $ 6.82 |
Quality Growth Fund |
| | | Beginning Account Value 3/01/15 | Annualized Expense Ratio For the Period | Ending Account Value 8/31/15 | Expenses Paid During the Period (1) |
Actual Example Based on actual return of: |
Class I | -5.86% | $1,000.00 | 1.29% | $ 941.40 | $ 6.31 |
Hypethetical Example Based on assumed 5% return |
Class I | | $1,000.00 | 1.29% | $ 1,018.70 | $ 6.56 |
MONTEAGLE FUNDS
ABOUT YOUR FUNDS’ EXPENSES (Unaudited) (Continued) |
Select Value Fund |
| | | Beginning Account Value 3/01/15 | Annualized Expense Ratio For the Period | Ending Account Value 8/31/15 | Expenses Paid During the Period (1) |
Actual Example Based on actual return of: |
Class I | -9.86% | $1,000.00 | 1.33% | $ 901.40 | $ 6.37 |
Hypethetical Example Based on assumed 5% return |
Class I | | $1,000.00 | 1.33% | $ 1,018.50 | $ 6.77 |
Value Fund |
| | | Beginning Account Value 3/01/15 | Annualized Expense Ratio For the Period | Ending Account Value 8/31/15 | Expenses Paid During the Period (1) |
Actual Example Based on actual return of: |
Class I | -12.86% | $1,000.00 | 1.31% | $ 871.40 | $ 6.18 |
Hypethetical Example Based on assumed 5% return |
Class I | | $1,000.00 | 1.31% | $ 1,018.60 | $ 6.67 |
Texas Fund |
| | | Beginning Account Value 3/01/15 | Annualized Expense Ratio For the Period | Ending Account Value 8/31/15 | Expenses Paid During the Period (1) |
Actual Example Based on actual return of: |
Class I | -9.35% | $1,000.00 | 1.57% | $ 906.50 | $ 7.54 |
Class C | -9.79% | $1,000.00 | 2.57% | $ 902.10 | $ 12.32 |
Hypethetical Example Based on assumed 5% return |
Class I | | $1,000.00 | 1.57% | $ 1,017.30 | $ 7.98 |
Class C | | $1,000.00 | 2.57% | $ 1,012.20 | $ 13.03 |
(1) | Expenses are equal to the Funds’ annualized expense ratios for the period, multiplied by the average account value over the period, multiplied by 184/365 (to reflect the one-half year period). |
MONTEAGLE FUNDS
TRUSTEES AND OFFICERS OF THE TRUST (Unaudited) |
The business and affairs of the Funds are managed under the direction of the Board of Trustees in compliance with the laws of the state of Delaware. The names of the Trustees and executive officers of the Trust, their position with the Trust, address, age and principal occupations during the past five years are set forth below. Trustees have no official term of office and generally serve until they resign, or are not reelected. The address of each trustee and officer is 4520 Main Street, Suite 1425, Kansas City, Missouri 64111.
DISINTERESTED TRUSTEES |
NAME, ADDRESS AND YEAR OF BIRTH | POSITION(S) HELD WITH TRUST | LENGTH OF TIME SERVED | PRINCIPAL OCCUPATION(S) DURING THE PAST 5 YEARS | NUMBER OF TRUST PORTFOLIOS OVERSEEN BY TRUSTEE | OTHER DIRECTORSHIPS OF PUBLIC COMPANIES |
Larry J. Anderson 1948 | Trustee | Since
11-29-02 | Certified Public Accountant, Anderson & West, P.C. January 1985 to present | 6 | None |
Charles M. Kinard 1943 | Trustee | Since
11-29-02 | Retired; Senior Vice President and Trust Officer, First National Bank of Abilene until December 1998. | 6 | None |
David J. Gruber * 1963 | Trustee | Since
10-23-15 | President, DJG Financial Consulting, 2007 to present | 6 | Trustee, Asset Management Fund, 2015 to present (3 portfolios); Trustee, Cross Shore Discovery Fund, 2014 to present; Trustee, Fifth Third Funds 2003 to 2012 (20 portfolios) |
Jeffrey W. Wallace * 1964 | Trustee | Since
10-23-15 | Senior Director of Investment Operations, Baylor University, 2009 to present | 6 | None |
MONTEAGLE FUNDS
TRUSTEES AND OFFICERS OF THE TRUST (Unaudited) (Continued) |
EXECUTIVE OFFICERS |
NAME, ADDRESS AND YEAR OF BIRTH | POSITION(S) HELD WITH THE TRUST | PRINCIPAL OCCUPATION(S) DURING THE PAST 5 YEARS |
Paul B. Ordonio, JD 1967 | President, CCO | Monteagle Funds, President/CCO from 11/02 to present; Nashville Capital Corporation, VP of Development, 05/09 to present; Matrix Capital Group, Representative 05/09 to present; P.O. Properties, Inc., Vice President from 06/99 to present; WordWise Document Services, LLC, President from 08/97 to present; Ordonio & Assoc., President from 11/97 to present; Blue Horse Financial Advisors, Secretary from 07/15 to present; PJO Holdings, LLC from 07/15 to present. |
Robert S. Driessen 1947 | Secretary, AML Compliance Officer | M3Sixty Administration, LLC, Chief Compliance Officer 7/13 to present; 360 Funds Trust, Chief Compliance Officer and Secretary, 7/13 to present; Aquila Distributors, Senior Vice President and Chief Compliance Officer, 11/09 to 12/12; Aquila Investment Management, LLC, Vice President and Chief Compliance Officer, 11/09 to 12/12; Curian Capital, LLC, Vice President, Chief Compliance Officer, 4/04 to 12/08. |
Larry E. Beaver, Jr. 1969 | Treasurer, CFO | M3Sixty Administration, LLC, Director of Accounting and Administration 1/05 to present; Capital Management Investment Trust, Treasurer 5/08 to present; Congressional Effect Fund, Treasurer 5/08 to 8/14; AMIDEX Funds, Inc. Chief Accounting Officer 5/03 to present; 360 Funds, Treasurer, 8/13 to present. |
* | David J. Gruber and Jeffrey Wallace were appointed as Independent Trustees by the Trust’s Board of Trustees (the “Board”) at a regularly scheduled meeting of the Board held on October 23, 2015. See note 12. |
MONTEAGLE FUNDS
COMPENSATION OF TRUSTEES AND OFFICERS (Unaudited) |
Each Trustee receives an annual fee of $2,500 and a fee of $1,000 per Fund, and is also paid a $1,000 for each quarterly meeting attended and $500 for each special meeting attended. A portion of the fees paid to the Trustees are paid in Fund shares and allocated pro rata among the Funds in the complex. Trustees and officers are also reimbursed for travel and related expenses incurred in attending meetings of the Board.
Trustees that are affiliated with the Adviser or Sub-adviser receive no compensation from the Funds for their services or reimbursement for their associated expenses. Officers of the Trust receive no compensation from the Funds for their services, except that the Funds pay 50% of the compensation of the Trust’s Chief Compliance Officer.
The following table sets forth the fees paid by the Funds to each Trustee of the Trust for the year ended August 31, 2015:
Name of Person | Aggregate Compensation From Funds | Pension or Retirement Benefits Accrued as Part of Fund Expenses | Estimated Annual Benefits Upon Retirement | Total Compensation From Funds and Fund Complex Paid to Trustees |
Larry J. Anderson | $13,400 | $0 | $0 | $13,400 |
Brian J. Green | $11,400 | $0 | $0 | $11,400 |
Charles M. Kinard | $13,400 | $0 | $0 | $13,400 |
[This page intentionally left blank]

THE MONTEAGLE FUNDS
Investment Adviser
Nashville Capital Corporation
2506 Winford Ave.
Nashville, TN 37211
Distributor
Matrix Capital Group, Inc.
419 Lafayette Street
New York, NY 10003
Transfer Agent, Administrator
& Shareholder Servicing Agent
M3Sixty Administration, LLC
4520 Main Street
Suite 1425
Kansas City, MO 64111
(888) 263-5593
www.monteaglefunds.com
This report is submitted for the general information of the shareholders of the Funds. It is not authorized for distribution to prospective investors in the Funds unless preceded or accompanied by a current prospectus, which includes information regarding the Fund’s objectives and policies, experience of its management, marketability of shares, and other information.
Included in annual report to shareholders filed under item 1 of this form.
Not applicable at this time. There were no matters submitted to a vote of security holders during the reporting period.
Pursuant to the requirements of the Securities Exchange Act of 1934 and the Investment Company Act of 1940, the registrant has duly caused this report to be signed on its behalf by the undersigned, thereunto duly authorized.
Pursuant to the requirements of the Securities Exchange Act of 1934 and the Investment Company Act of 1940, this report has been signed below by the following person on behalf of the registrant and in the capacities and on the date indicated.
Pursuant to the requirements of the Securities Exchange Act of 1934 and the Investment Company Act of 1940, this report has been signed below by the following person on behalf of the registrant and in the capacities and on the date indicated.