Letter from the President | 1 |
A Discussion of Fund Performance | 2 |
Supplementary Portfolio Information | 30 |
| Financial Statements of the Monteagle Funds | |
| Schedule of Investments: | |
Fixed Income Fund | 35 |
Informed Investor Growth Fund | 39 |
Quality Growth Fund | 41 |
Select Value Fund | 44 |
Value Fund | 47 |
Statements of Assets and Liabilities | 50 |
Statements of Operations | 52 |
Statements of Changes in Net Assets | 54 |
Financial Highlights | 59 |
Notes to Financial Statements | 64 |
Report of Independent Registered Public Accounting Firm | 79 |
Other Information | 80 |
About Your Funds’ Expenses | 81 |
Trustees and Officers of the Trust | 84 |
LETTER FROM THE PRESIDENT (Unaudited) |
Dear Shareholders:
Enclosed is the Annual Report for the Monteagle Funds. I encourage you to carefully review the information presented in this Annual Report as it contains valuable information about your investment.
As you will notice in reviewing the Annual Report, despite the recovery headwinds and market fluctuations, we continue to uncover opportunities in high quality, solid credit and attractive valuation areas.
As we reflect on this past fiscal year, we continue to see several headlines during the period, such as continued slow economic recovery, civil unrest, an uncertain domestic political environment and arguments over federal monetary policy, that all had a dramatic effect on the markets in which the Monteagle Funds invest. Despite the volatility that these headlines have created in the day-to-day stock markets, we have often said that we view investing as a marathon, not a sprint. As a result, we remain optimistic as we expect that the effect of some of these events will be short-lived although others may take longer to work their way through the system. We believe that remaining disciplined with a longer-term focus will benefit patient investors.
In closing, we would like to thank you for your continued confidence and support of the Monteagle Funds.
Sincerely,
MONTEAGLE FUNDS
Paul B. Ordonio, JD
President
MONTEAGLE SELECT VALUE FUND A DISCUSSION OF FUND PERFORMANCE (Unaudited) |
How did the Fund perform?
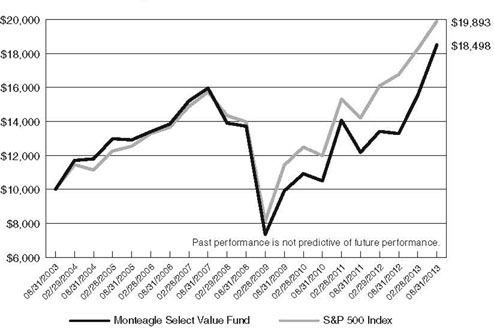
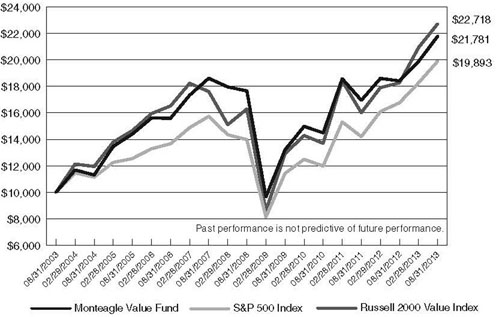
For the year ended August 31, 2013, the Monteagle Select Value Fund (the “Fund”) had a total return of 39.26%. The S&P 500 Index (“S&P 500” or “Index”) had a total return of 18.70% for the same period. The Fund’s net asset value per share as of August 31, 2013 was $15.07 versus $10.95 on August 31, 2012.
What is the Fund’s investment approach?
The Fund’s investment goal is long-term capital appreciation. The Fund uses a “value investing” style by investing under normal circumstances at least 80 percent of its assets in common stock of domestic companies believed to be under-priced relative to comparable securities determined by price-to-earnings ratios, cash flows or other measures. The Fund’s adviser predominately utilizes a reversion-to-the-mean strategy on stock selection in order to achieve its results rather than trying to time market fluctuations. The adviser limits the pool of stocks to consider for purchase to only those equities in the S&P 500. In selecting stocks, the Fund’s adviser establishes valuation parameters by using relative ratios or target prices to evaluate companies on several levels. Additionally, the adviser will generally have the Fund hold between 40 and 60 equities and diversify its holdings across numerous industries, generally limiting issues in any one industry to five securities unless more securities are needed for limiting specific dollar amounts per security or to over-weight a particular sector. The Fund seeks to maintain a minimum average weighted market capitalization of $5 billion.
Value stocks are broadly defined as equities which have a price-to-earnings ratio and a price-to-book ratio less than the relative market average with dividends tending to be higher than the relative market average. Also, value stocks tend to have a beta (a measure of the stocks’ price volatility relative to the overall market, i.e. the S&P 500) less than 1.0.
What influenced the Fund’s performance?
During the twelve months ended August 31, 2013, the Fund’s performance was affected by various economic concerns, primarily domestically. Continued budgetary concerns and fears of a rising deficit have plagued the U.S. and even led to sequestration by Congress. Additionally, the Federal Reserve’s quantitative easing and the next Fed Chairman have been hot topics over the last twelve months. These and other issues have continued to affect the markets throughout the year, adding to uncertain stabilization of the domestic environment. During the period, the equity markets reached all-time market highs that exceeded even the pre-financial crisis levels. The S&P 500 yielded attractive returns during the first five months of the year only to subsequently pull back in June. Another two month rally led the Index to new highs before again pulling back before closing August. The Dow Jones Industrial Average (the “Dow”) began the period slightly above 13,000 on August 31, 2012 then fell to almost 12,500 in November. The Dow then trended higher to reach new highs in early August before falling to about 14,800. The Dow concluded on August 31, 2013 at 14,810.31. During the last twelve months, the Federal Open Markets Committee of the Federal Reserve continued to maintain the Fed Funds rate at the range of 0% to 0.25%, where it has remained since December 2008. With an improving market, the Fund’s focus on a “value style, reversion-to-the-mean” performed very favorably. In fact, Morningstar ranked the Fund atop
MONTEAGLE SELECT VALUE FUND A DISCUSSION OF FUND PERFORMANCE (Unaudited) (Continued) |
its large cap value peers on a one year total return basis. The Fund compares its performance to the S&P 500 Index. The Fund is affected by its asset allocation weighting to the ten sectors of the Index.
For the first quarter ended November 30, 2012, the portfolio holdings of the Fund outperformed the Index. The investments of the Fund experienced a 5.70% return versus a return for the Index of 1.27%. For the trailing 12-month period ended November 30, 2012, the portfolio holdings of the Fund underperformed the Index with the investments of the Fund experiencing a 15.62% return versus a 16.13% return for the Index.
The broad sectors of the Index that improved the most on average during the first quarter were the Consumer Discretionary (5.12%), Financials (4.26%), and Materials (4.26%) sectors while the Information Technology (-3.34%), Utilities (-2.13%) and the Telecommunication Services (-1.68%) sectors were the lowest performing within the Index. The portfolio performance was led by its holdings in the Consumer Discretionary, Healthcare and the Telecommunication Services sectors during this quarter; the lower performing sectors in the portfolio were Energy and Utilities. The first quarter experienced positive appreciation in the equity market, with the S&P ending just above 1,400.
As of the end of the first quarter, the portfolio holdings continued to be diversified across many sectors of the Index with less exposure to the Utility, Telecommunication Services and Consumer Staples sectors. The largest sector allocations were Financials (18.9%), Information Technology (15.2%), and Consumer Discretionary (12.3%). The Fund’s positive portfolio performance was primarily attributed to its top performing stock picks of GameStop Corp (+37.58%), Titanium Metals Corp (+35.78%), and First Solar, Inc. (+35.02%). The Fund’s portfolio performance was most negatively affected by BestBuy (-26.1%), Hewlett Packard (-23.05%) and Cliffs Natural Resources (-21.69%). During the first quarter, three disposals were made in order to remove securities that achieved their target price and make room for new securities with more appreciation potential. Two securities were purchased in order to reinvest the cash. Cash represented 7.8% of the assets as of November 30, 2012.
For the second quarter ended February 28, 2013, the portfolio holdings of the Fund outperformed the Index. The investments of the Fund experienced a 10.70% return versus a return for the Index of 7.58%. For the trailing 12-month period ended February 28, 2013, the portfolio holdings of the Fund outperformed the Index with the investments of the Fund experiencing a 15.87% return versus a 13.46% return for the Index.
The broad sectors of the Index that improved the most on average during the second quarter were the Financials (14.16%), Industrials (13.00%), and Information Technology (11.01%) sectors while the Telecommunication Services (6.89%), Materials (8.11%) and the Consumer Staples (8.57%) sectors were the lowest performing within the Index. The portfolio performance was led by its holdings in the Financials, Information Technology and the Healthcare sectors during this quarter; the lower performing sectors in the portfolio were Utilities and Materials. The second quarter experienced very positive appreciation in the equity market, closing in February only approximately twelve points off all-time highs.
MONTEAGLE SELECT VALUE FUND A DISCUSSION OF FUND PERFORMANCE (Unaudited) (Continued) |
As of the end of the second quarter, the portfolio holdings continued to be diversified across many sectors of the Index with less exposure to the Utility, Telecommunication Services and Materials sectors. The largest sector allocations are Financials (19.9%), Information Technology (18.1%), and Consumer Discretionary (15.0%). The Fund’s positive portfolio performance was primarily attributed to its top performing stock picks of MEMC Electronic Materials (+68.94%), Hewlett Packard Co. (+55.04%), and RadioShack Corporation (+47.78%). The Fund’s portfolio performance was most negatively affected by Apollo Group (-16.51%), Cliffs Natural Resources (-11.20%) and FirstEnergy Corp. (-6.93%). During the second quarter, six disposals were made in order to remove securities that achieved their target price and make room for new securities with more appreciation potential. Six securities were purchased in order to reinvest the cash. As of the February 28, 2013, cash represented 10.2% of the assets.
For the third quarter ended May 31, 2013, the portfolio holdings of the Fund significantly outperformed the Index. The investments of the Fund experienced a 16.42% return versus a return for the Index of 8.22%. For the trailing 12-month period ended May 31, 2013, the portfolio holdings of the Fund outperformed the Index with the investments of the Fund experiencing a 48.58% return versus a 27.28% return for the Index.
The broad sectors of the Index that improved the most on average during the quarter were the Financials (15.39%), Health Care (14.71%), and Consumer Discretionary (12.22%) sectors while the Utilities (2.05%), Telecommunication Services (4.21%) and the Energy (5.78%) sectors were the lowest performing within the Index. The portfolio performance was led by its holdings in the Information Technology, Consumer Discretionary and the Healthcare sectors during this quarter; the lower performing sectors in the portfolio were Materials, Telecommunication Services and Utilities.
As of the end of the third quarter, the portfolio holdings continued to be diversified across many sectors of the Index with less exposure to the Utility, Telecommunication Services and Materials sectors. The largest sector allocations are Financials (20.7%), Information Technology (19.1%), and Consumer Discretionary (13.9%). The Fund’s positive portfolio performance was primarily attributed to its top performing stock picks of First Solar, Inc. (110.504%), Best Buy Co. (67.89%), and MEMC Electronic Materials (63.03%). The Fund’s portfolio performance was most negatively affected by Cliffs Natural Resources, Inc. (-29.14%), United States Steel Corp. (-15.12%) and Dell Computer (-4.27%). During the quarter, four disposals were made in order to remove securities that achieved their target price and make room for new securities with more appreciation potential. Four securities were purchased in order to reinvest the cash. As of the end of the third quarter, cash represented 12.0% of the assets.
For the fourth quarter ended August 31, 2013, the portfolio holdings of the Fund significantly outperformed the Index. The investments of the Fund experienced a 2.23% return versus a return for the Index of 0.67%. For the trailing 12-month period ended August 31, 2013, the portfolio holdings of the Fund outperformed the Index with the investments of the Fund experiencing a 39.26% return versus an 18.70% return for the Index.
MONTEAGLE SELECT VALUE FUND A DISCUSSION OF FUND PERFORMANCE (Unaudited) (Continued) |
The broad sectors of the Index that improved the most on average during the fourth quarter were the Consumer Discretionary (3.46%), Industrials (2.24%), and Health Care (2.19%) sectors while the Telecommunication Services (-3.89%), Consumer Staples (-3.26%) and the Financials (-1.36%) sectors were the lowest performing within the Index. The portfolio performance was led by its holdings in the Healthcare, Industrials and Consumer Discretionary sectors during this quarter; the lower performing sectors in the portfolio were Information Technology, Telecommunication Services and Utilities. This year has marked a return to the pre-financial crisis levels, with the Index reaching an all-time record high in the quarter.
As of the end of the fourth quarter, the portfolio holdings continued to be diversified across many sectors of the Index with less exposure to the Telecommunication Services, Utility and Consumer Staples sectors. The largest sector allocations are Financials (20.2%), Information Technology (17.6%), and Consumer Discretionary (14.3%). The Fund’s positive portfolio performance was primarily attributed to its top performing stock picks of GameStop Corp. (51.42%), R.R. Donnelley & Sons Co. (25.70%), and The Washington Post Co. (20.71%). The Fund’s portfolio performance was most negatively affected by First Solar, Inc. (-32.49%), RadioShack Corp. (-11.62%) and Intel Corp. (-9.47%). During the fourth quarter, four disposals were made in order to remove securities that achieved their target price and make room for new securities with more appreciation potential. Five new securities were purchased and one security was averaged into in order to reinvest the cash. The cash balance continues to remain slightly elevated in order to allow cash to average into the equity market and/or find additional securities with positive appreciation potential. Cash represented 7.0% of the assets as of August 31, 2013.
For the year ended August 31, 2013, the Fund significantly outperformed the Index. The investments of the Fund experienced a 39.26% return versus an 18.70% return for the Index. The broad sectors of the Fund that contributed the most on average to the performance were the Health Care (+67.11%), Consumer Discretionary (+46.00%), and Financials (+42.56%) sectors while the Telecommunications Services (-7.67%), Materials (-6.40%) and the Utilities (-4.11%) sectors were the lowest performing on average within the Fund.
What is the Fund’s strategy?
The Fund will continue to concentrate on equities contained in the S&P 500 which generally consists of large name brand corporations with good fundamentals and broad product diversification. The Fund will continue to be disciplined in the use of its predominate strategy of reversion-to-the-mean by applying its “value investing” approach valuation model; thereby, allowing the market’s volatility to identify those securities that become under-valued and are poised to be the next performers in the market. Sector allocation in the Fund’s portfolio will primarily be determined by which companies are available for purchase pursuant to the Fund’s strategy. It is anticipated that the Fund may hold higher levels of cash during extended periods of market uncertainty and will selectively invest the cash into equities identified by the primary investment strategy as opportunities present themselves or for dollar-cost-averaging into currently held positions. This strategy is executed with a long-term outlook and will have periods of under-performance and out-performance versus its Index. Therefore, the Fund’s daily performance can and will vary dependent upon current market conditions.
MONTEAGLE SELECT VALUE FUND A DISCUSSION OF FUND PERFORMANCE (Unaudited) (Continued) |
Fund performance shown represents the performance of the Fund’s Class I shares. For complete performance information, please refer to the Average Annual Total Return table in the following performance report. Past performance is not predictive of future performance. Investment results and principal value will fluctuate so that shares, when redeemed, may be worth more or less than their original cost. Current performance may be higher or lower than the performance data quoted. Performance data current to the most recent month-end, are available by calling 1-888-263-5593.
An investor should consider the investment objectives, risks, charges and expenses of the Fund carefully before investing. The Fund’s prospectus contains this and other important information. To obtain a copy of the Fund’s prospectus please call 1-888-263-5593 and a copy will be sent to you free of charge. Please read the prospectus carefully before you invest. The Fund is distributed by Matrix Capital Group, Inc.
Management’s Discussion of Fund Performance seeks to describe some of the Sub-Adviser’s current opinions and views of the financial markets. Although the Sub-Adviser believes it has a reasonable basis for any opinions or views expressed, actual results may differ, sometimes significantly so, from those expected or expressed.
MONTEAGLE SELECT VALUE FUND PERFORMANCE — August 31, 2013 (Unaudited) |
Comparison of the Change in Value of a $10,000 Investment
in Monteagle Select Value Fund and the S&P 500 Index
Average Annual Total Return (for the periods ended August 31, 2013) |
| | | | |
| Monteagle Select Value Fund | 39.26% | 6.16% | 6.34% |
| S&P 500 Index | 18.70% | 7.31% | 7.11% |
The performance information quoted in this annual report assumes the reinvestment of all dividend and capital gain distributions, if any, and represents past performance, which is not a guarantee of future results. The returns shown do not reflect taxes that a shareholder would pay on Fund distributions or on the redemption of Fund shares. The investment return and principal value of an investment will fluctuate and, therefore, an investor’s shares, when redeemed, may be worth more or less than their original cost.
The above graph depicts the performance of the Monteagle Select Value Fund versus the S&P 500 Index. The S&P 500 Index by Standard and Poor’s Corp. is a capitalization-weighted index comprising 500 issues listed on various exchanges, representing the performance of the stock market generally. Please note that indices do not take into account any fees and expenses of investing in the individual securities that they track, and individuals cannot invest directly in any index.
As with any fund, save an index fund, that commonly compares its performance to the S&P 500 Index, such a comparison may be said to be inappropriate because of the dissimilarity between the Fund’s investments and the securities comprising the index; so too with the Monteagle Select Value Fund, which will not invest in certain securities comprising this index.
MONTEAGLE FIXED INCOME FUND A DISCUSSION OF FUND PERFORMANCE (Unaudited) |
How did the Fund Perform?
The Monteagle Fixed Income Fund (the “Fund”) had a challenging year in terms of performance. For the year ended August 31, 2013, the Fund had a total return of (3.41)%. For the three, and six month periods ended August 31, 2013, the Fund had total returns of (2.29)% and (3.32)% respectively. The returns were primarily driven by market conditions over the last half of the year.
The Fund’s benchmark index, the Barclays Capital Intermediate Government/Credit Bond Index (“Barclays Index”) had relative returns of (1.06)%, (1.39)%, and (1.75)% for the twelve, three, and six month periods ended August 31, 2013, respectively.
What Influenced Fund Performance?
This past fiscal year was a challenging one for most bond funds, as interest rates increased to reflect expected changes in the Federal Reserve Bank’s (U.S. Central Bank – “the Fed”) monetary policy, as well as marginal improvement in economic conditions. Increasing interest rates did have a negative impact on Fund performance. The chart below illustrates how interest rates on U.S. Treasury securities have increased over the fiscal year. The chart shows the progression of rates on a quarterly basis throughout the year.
| | | | | |
| 2 Year | 0.22 | 0.25 | 0.25 | 0.30 | 0.39 |
| 3 Year | 0.30 | 0.35 | 0.36 | 0.52 | 0.79 |
| 5 Year | 0.59 | 0.63 | 0.77 | 1.05 | 1.62 |
| 7 Year | 1.01 | 1.04 | 1.26 | 1.55 | 2.24 |
| 10 Year | 1.57 | 1.62 | 1.89 | 2.16 | 2.78 |
| 30 Year | 2.68 | 2.79 | 3.10 | 3.30 | 3.70 |
The movement in interest rates is usually an indication of the market’s expectation for growth, and with growth, we can also expect a certain amount of inflation. Additionally, since the financial crisis of 2008 and the end of the recession in June of 2009, the Fed has pursued a very easy monetary policy. Actually, the Federal Reserve has been in an easing monetary policy position since August, 2007 when it first lowered the Fed funds rate from 5.25% to 4.75%. So, it stands to reason that interest rates over the past year are responding to any one or more of the variables listed above.
The economic growth rate as measured by the Real Gross Domestic Product (GDP) over the last year has actually declined. The 3rd quarter 2012 annualized rate of growth was 3.1%, and was followed by weaker estimates of growth. For the 4th quarter of 2012 it was 0.4%, 1st quarter of 2013, 1.8%, and the latest estimate of 2nd quarter 2013 growth, 2.5%. The average annual growth rate over the last four quarters has been approximately 2%. These lagging indicators may explain why interest rates were less volatile in the first six months of the year. While the last couple of quarterly estimates have improved, market interest rates would reflect expectations of future
MONTEAGLE FIXED INCOME FUND A DISCUSSION OF FUND PERFORMANCE (Unaudited) (Continued) |
growth. So, rates may be rising in anticipation of higher growth rates that have yet to materialize. The latest Economic projections released by the Federal Reserve Board members and Federal Reserve Bank Presidents show modest growth rates for the balance of 2013 of between 2.0% and 2.3 % and between 2.9% and 3.1% in 2014, improving to between 3.0% and 3.5% in 2015. Higher expectations for growth did have a negative impact on the Fund’s performance.
Along with economic growth, the market has paid close attention to the health of the labor market. Improvement in labor statistics has positive implications for economic growth and direct implications for Federal Reserve monetary policy. During the course of this past fiscal year, the economy created approximately 180,000 jobs per month. The unemployment rate has declined from 8.1% to 7.3% and the under-employment rate1 from 14.7% to 13.7%. However, while improvements in some statistics have provided some impetus for economic growth, there are other measurements that are not necessarily as strong and give an uncertain picture of future economic growth expectations. Average Weekly hours worked remained steady at 34.5. This does not support the case for an expanding economy. Average hourly earnings have only increased 1.9% since last year. This also does not suggest strong growth for consumer consumption. In an economy that is driven by 70% consumer spending, earnings and disposable income are very important for growth. Lastly, the number of people that are no longer in the labor force (but who could participate) has grown significantly. Over the year, this number has grown to 90.5 million, an increase of approximately 1.6 million. So, much of the decrease in the unemployment rates is due to fewer participants. While the employment picture has improved it has negatively affected the Fund’s performance. It is uncertain whether this growth is sustainable or can continue to improve.
Inflation measurements over the last year have been below the Fed’s implicit long-range target for price stability of 2%. For the 12 month period ending August 31, 2013 the CPI increased by 1.5%, while the CPI less food and energy increased 1.8%. Annualized CPI measurement for the last quarter of fiscal 2013 was 3.2% and the CPI less food and energy was 2.0%. While the trend for inflation has increased over the last quarter, much of the increase to CPI is from volatile increases in energy prices which are seasonal and also affected by geopolitical events surrounding the Middle East. The core inflation is relatively stable at 2.0%. Inflation expectations as measured by the difference in yields between U.S. Treasury Notes and U.S. Inflation Protected Treasury Securities (TIPS) are also in line with the 2% long-range Fed target. For the 5-year Notes the difference is 1.85% and for 10-year Notes, the difference is 2.19%. We don’t believe that inflation had a material impact on Fund’s performance over the year.
There is little doubt in our mind that the biggest contributing factor for rising interest rates was due to the market’s anticipation of a change in Fed monetary policy. The beginning of the fiscal year brought about even further changes to the asset purchase program known as “Quantitative Easing” (QE). The latest program is the third attempt by the Fed to stimulate economic growth and consequently create demand for labor thereby reducing the unemployment rate. The Federal Open Market Committee (FOMC) announced QE3 on September 13, 2012. Under this program
| 1 | (Total unemployed, plus all persons marginally attached to the labor force, plus total employed part time for economic reasons, as a percent of the civilian labor force plus all persons marginally attached to the labor force) |
MONTEAGLE FIXED INCOME FUND A DISCUSSION OF FUND PERFORMANCE (Unaudited) (Continued) |
the Federal Reserve would purchase an additional $40 billion of Agency (Fannie-Mae and Freddie Mac) Mortgage-backed securities per month until there was substantial improvement in the labor market. QE3 was further modified and expanded on December 12, 2012 by continuing the purchase of $45 billion of longer dated Treasury Notes. Unlike “Operation Twist”, this expanded program did not contemplate selling an equal amount of shorter term assets. The significant change from previous programs is that there was no explicit end date. This program was “open-ended” and would continue until the labor market demonstrated improvement. Furthermore, the FOMC established “trigger points” for future monetary policy actions. For the first time, the committee established explicit targets for the unemployment rate and an upper limit to acceptable inflation goals to help determine how long to keep the Fed Funds rate at 0.00% to 0.25%. In December’s post-meeting statement, the FOMC established a 6.5% unemployment rate and an inflation outlook not to exceed 2.5% as “triggers” of when the committee would be discussing the possibility of increasing the Fed funds rate and moving away from the “zero interest rate policy” that had been in effect since December of 2008.
With the market intent on measuring the pace of labor improvements along with inflation expectations, the market was somewhat surprised in May 2013 when Federal Reserve Chairman, Ben Bernanke, made some unexpected statements during his congressional testimony. In his testimony, the Chairman emphasized the need to not end the $85 billion/month asset purchase program too soon as it would have a negative impact on the economic recovery. However, he later admitted that if the trends were to continue at the expected pace, he could see a cut back in the bond buying program over the next few meetings. This was interpreted by the markets that the asset purchase program could be cut back much sooner than expected. Interest rates have been adjusting higher ever since as we illustrated above and the Fund’s performance, along with the performance of most bond funds, has been negatively impacted as a result.
Our responses to these events have primarily been a disciplined approach to a high quality portfolio profile. We remain committed to the Fund’s strategy of holding a well diversified portfolio of high quality bonds. We believe that the markets have rewarded our patience and prudence. However, we have made some changes over the last year.
The principal variables affecting bond portfolio performance are overall duration and maturity structure of the portfolio, as well as, Market Sector allocation and credit quality. The first two charts below illustrate the Market sector composition of the Fund’s Portfolio at the beginning and end of this past fiscal year.
MONTEAGLE FIXED INCOME FUND A DISCUSSION OF FUND PERFORMANCE (Unaudited) (Continued) |
Comparative Market Sector Weights
Monteagle Fixed Income Fund
| August 31, 2012 | August 31, 2013 |
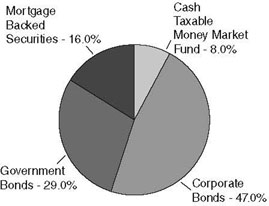 | 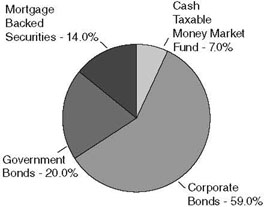 |
| | • | During the course of the year we significantly increased the Fund’s market allocation to corporate bonds while decreasing the allocation to Government Agency securities. The Fund’s decision to increase the allocation to corporate bonds relative to government bonds in general contributed positively to relative performance as the corporate sector outperformed the Barclays Index and government bonds over the last year. |
| |
| U.S. Treasury: Intermediate | -1.62% |
| U.S. Agency Intermediate | -0.97% |
| Intermediate Corporate | 0.19% |
| Invest. Grade: Industrial — Intermediate | -1.13% |
| Invest. Grade: Financial Institutions — Intermediate | 2.17% |
| Fixed Rate Mortgage Backed Securities | -2.43% |
| | • | Duration slightly increased over last year. As of August 31, 2013 the Fund’s portfolio duration was 4.6 years compared to 4.3 years at 2012 fiscal year end. Maturity also increased slightly from 4.8 at 2012 year end to 5.1 years at 2013 fiscal year end. When compared to the duration and weighted average maturity of 3.9 and 4.2, of the Barclay’s Index, the Fund’s portfolio is longer in both measures. This negatively impacted Fund performance in the 2nd half of the year as longer term rates increased over that period of time. The portfolio’s securities mature in less than 10 years with the highest percentage maturing in the 3 to 7 year range. 23.2% of the Fund’s assets mature in less than 3 years, 41.8% in 3 to 7 years, and 35.0% in 7 to 10 years. |
MONTEAGLE FIXED INCOME FUND A DISCUSSION OF FUND PERFORMANCE (Unaudited) (Continued) |
Comparative Credit Quality
Monteagle Fixed Income Fund
Moody’s Ratings August 31, 2012 | Moody’s Ratings August 31, 2013 |
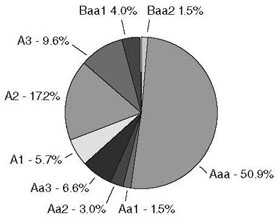 |  |
| | • | The preceding charts represent the credit quality distribution of the Fund’s securities holdings (not including cash or money market securities) at the beginning and end of this past fiscal year. For consistency of the relative analysis, in our distribution comparison above, we have only included the ratings provided by Moody’s (and not S&P, which rates U.S. Government obligations AA+). The Barclays Index still maintains ratings of AAA on U.S. Government obligations. |
| | • | The overall credit quality of the portfolio marginally decreased over the course of the year. Our overweighting of corporate bonds and underweighting of Government bonds has lowered quality slightly, but credit quality remains excellent with overall ratings of AA-/A+ or Aa3/A1. |
| | • | We would also note that at the end of this fiscal year, the Fund’s portfolio contained investment grade securities rated below A3/A-. While we are restricted from investing in securities rated below A3/A- at time of purchase, we do have the discretion of holding securities rated Baa/BBB should the rating be the result of a downgrade. It is our opinion that the securities in question do not materially affect the overall credit quality of the Fund’s portfolio and do not represent significant credit risk to portfolio value. The following table specifically identifies the securities in question. |
MONTEAGLE FIXED INCOME FUND A DISCUSSION OF FUND PERFORMANCE (Unaudited) (Continued) |
| | | |
| Amgen, Inc., 4.50%, due 03/15/2020 | Baa1 | A | 0.68% |
| Amgen, Inc., 4.85%, due 11/18/14 | Baa1 | A | 0.70% |
| Hewlett-Packard Co., 6.125%, due 03/01/2014 | Baa1 | BBB+ | 0.93% |
| Morgan Stanley & Co., 3.45% due 11/02/2015 | Baa1 | A- | 1.32% |
| Pitney Bowes, Inc., 5.75%, due 09/15/17 | Baa2 | BBB | 0.70% |
| Total | | | 4.32% |
| | • | The following table provides a summary illustration of how investment grade bonds of varying credit quality have performed over the past year. These are returns of bonds in the Barclays Index. The relative performance of credit is indicative of the risk/reward nature of these bonds. We can see that for the full year lesser quality bonds had a performance advantage over higher quality. However, during the last half of the fiscal year, higher quality bonds had the better returns. As such, the performance of the Fund did not benefit from the higher returns associated with Baa rated bonds, but the higher quality of the Fund’s bonds did provide an advantage in the latter part of the year. |
| | | |
| Aaa | -1.53% | -1.57% | -1.12% |
| Aa | -1.12% | -1.79% | -1.35% |
| A | 0.10% | -2.07% | -1.72% |
| Baa | 0.49% | -2.31% | -2.37% |
| Total | -1.06% | -1.75% | -1.39% |
| | • | For the year, trading was primarily driven by the replacement of maturing bonds with the purchase of corporate bonds and to a lesser extent, Government Agency bonds. The Fund purchased limited U.S. Treasury securities and there were no additional purchases of Mortgage-backed securities. |
MONTEAGLE FIXED INCOME FUND A DISCUSSION OF FUND PERFORMANCE (Unaudited) (Continued) |
What is the Fund’s Strategy?
The Fund will continue to invest in high quality intermediate term fixed income securities generally between 3 and 8 years in maturity. The Fund will continue to monitor economic conditions through the use of a proprietary model in an attempt to anticipate interest rate changes and lengthen or shorten the duration of the Fund’s portfolio of securities to maximize total return with minimal risk. The Fund will also actively manage portfolio holdings across market sectors in order to maximize total return within the scope of permitted investments defined by the Fund’s prospectus. While we have taken prudent steps to diversify the Fund’s assets by limiting exposure to the credit and interest rate risk associated with any one specific issuer, market sector, or maturity range, those risks cannot be completely eliminated without affecting long-term Fund performance. We remain vigilant and will act in your best interest to preserve the Fund’s asset values.
Fund performance shown represents the performance of the Fund’s Class I shares. For completeperformance information, please refer to the Average Annual Total Return table in the following performance report. Past performance is not predictive of future performance. Investment resultsand principal value will fluctuate so that shares, when redeemed, may be worth more or less than their original cost. Current performance may be higher or lower than the performance data quoted.Performance data current to the most recent month-end, are available by calling 1-888-263-5593.
An investor should consider the investment objectives, risks, charges and expenses of the Fundcarefully before investing. The Fund’s prospectus contains this and other important information. To obtain a copy of the Fund’s prospectus please call 1-888-263-5593 and a copy will be sent toyou free of charge. Please read the prospectus carefully before you invest. The Fund is distributedby Matrix Capital Group, Inc.
Management’s Discussion of Fund Performance seeks to describe some of the Sub-Adviser’scurrent opinions and views of the financial markets. Although the Sub-Adviser believes it hasa reasonable basis for any opinions or views expressed, actual results may differ, sometimes significantly so, from those expected or expressed.
MONTEAGLE FIXED INCOME FUND PERFORMANCE — August 31, 2013 (Unaudited) |
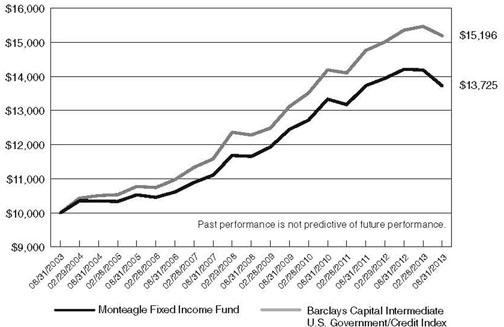
Comparision of the Change in Value of a $10,000 Investment in Monteagle Fixed Income Fund
and the Barclays Capital Intermediate U.S. Government/Credit Index
Average Annual Total Return (for the periods ended August 31, 2013) |
| | | | |
| Monteagle Fixed Income Fund | (3.41)% | 3.32% | 3.22% |
| Barclays Capital Intermediate U.S. Government/Credit Index | (1.06)% | 4.35% | 4.27% |
The performance information quoted in this annual report assumes the reinvestment of all dividend and capital gain distributions, if any, and represents past performance, which is not a guarantee of future results. The returns shown do not reflect taxes that a shareholder would pay on Fund distributions or on the redemption of Fund shares. The investment return and principal value of an investment will fluctuate and, therefore, an investor’s shares, when redeemed, may be worth more or less than their original cost.
The above graph depicts the performance of the Monteagle Fixed Income Fund versus the Barclays Capital Intermediate U.S. Government/Credit Index (formerly Lehman Brothers U.S. Intermediate Government/Credit Index). The Barclays Capital Intermediate U.S. Government/Credit Index measures the performance of dollar denominated U.S. Treasuries, government-related (i.e. U.S. and foreign agencies, sovereign, supranational and local authority debt), and investment grade credit structures that have a remaining maturity of greater than or equal to one year and less than ten years. Please note that indices do not take into account any fees and expenses of investing in the individual securities that they track, and individuals cannot invest directly in any index.
As with any fund, save an index fund, that commonly compares its performance to the Barclays Capital Intermediate U.S. Government/Credit Bond Index, such a comparison may be said to be inappropriate because of the dissimilarity between the Fund’s investments and the securities comprising the index; so too with the Monteagle Fixed Income Fund, which will not invest in certain securities comprising this index.
MONTEAGLE INFORMED INVESTOR GROWTH FUND A DISCUSSION OF FUND PERFORMANCE (Unaudited) |
How did the Fund Perform?
The Monteagle Informed Investor Growth Fund (Fund) returned a positive 9.0% for the fiscal year ended August 31, 2013. The S&P 500 Index (S&P), the Fund’s benchmark, rose 18.7% for the same period. For the calendar year-to-date ended August 31, 2013, the Fund appreciated 14.1% versus a 16.1% return for the S&P 500.
What is the Fund’s Investment Approach?
The Fund invests primarily in medium capitalization stocks of well-managed, financially sound companies, offering under-valued earnings and cash flow growth opportunities. These are companies, in which, management or large outside investors are significant common stock owners or buyers, or where the company itself is repurchasing its own shares on the open market. This investment discipline is now recognized as The Informed Investor Growth Strategy.
Quite simply, these companies qualify for research analysis only if they meet at least one of these four first-screen tests:
| | 1. | The company’s officers and directors are buying its common stock on the open market. |
| | 2. | A major outside investor (minimum 5% shares outstanding owned) has filed a Form 13-D purchase disclosure on the company’s stock. |
| | 3. | The company has announced its intent to repurchase its common stock on the open market. |
| | 4. | A significant percentage of the company’s stock is owned by family/management. |
The buy disciplines are matched by a series of five sell disciplines. They are:
| | 1. | Begin selling if a stock drops a minimum of 8% from an average cost basis. |
| | 2. | Begin selling when a holding-high loss-limit is triggered (stock falls a minimum of 14% from its portfolio holding-high price). |
| | 3. | Begin selling on preliminary indications of a stock breakdown in a company’s financials. |
| | 4. | Begin selling when informed investors’ stock transaction signals turn bearish. |
| | 5. | Sell partial positions of a portfolio stock after sharp price run-ups. |
What Influenced the Fund’s Performance?
The three key factors that had the most pronounced impact on Fund performance during the past fiscal year were:
| | 1. | A heavily weighted portfolio cash position for the Fund’s first fiscal quarter (September–November 2012) - - 55.5% - - and for the opening weeks of the Fund’s second fiscal quarter (December, 2012- February, 2013). This was not a result of a market related management decision but occurred because of a relentless series of portfolio stop-loss orders triggered by sharp market sell-offs that occurred primarily during the fourth |
MONTEAGLE INFORMED INVESTOR GROWTH FUND A DISCUSSION OF FUND PERFORMANCE (Unaudited) (Continued) |
| | quarter of the Fund’s previous fiscal year. The cash-heavy Fund portfolio predictably lagged the market during the sharp run-up which occurred at the end of 2012 and throughout much of the fiscal year 2013. |
| | 2. | The management decision to hedge the portfolio against further market volatility compounded the portfolio’s under-performance, coming as this decision did at a time of market resurgence beginning at the end of the first fiscal quarter. |
| | 3. | An over-all market “environment” that clearly favored “yield” and “defensive” stocks for virtually the entire first three fiscal quarters of the Fund’s year, whereas the Fund’s Informed Investor Growth Strategy portfolio was weighted in stocks with above-average growth potential. |
At the August 31, 2013 fiscal year end, the Fund was virtually fully invested, holding a modest 9.9% in cash. The ETFs now in the Fund are non-leveraged long instruments, and account for 16% of portfolio assets.
Favorably for the Fund’s strategy results, market sentiment turned more growth-orientated in the fiscal fourth quarter, producing a gain of 5.0%, versus a return of 0.7% for the S&P 500. This performance advantage was highlighted by stellar growth stock returns of holdings Fleetcor (+76%), Green Mountain Coffee (+60%) Regeneron (+39%) among several others.
The Fund’s fiscal year ended with several economic bright spots: re-bounding housing and auto sectors, stable energy prices, an improving employment picture, low interest rates and non-threating inflation.
The Fund profited from its three dominating sector allocations: Information Technology, Consumer Discretionary and Financials. At year-end these sectors accounted for approximately 64% of the Fund’s equity portfolio weightings.
Major new securities bought and their performances during the quarter in the first fiscal quarter were Lumber Liquidators (LL) +15.0% and EBay (EBAY) +11.2%.
In the second quarter, major equity positions added to the Fund along with their performance during the quarter included Fleetcor (FLT) +33.2%, Comcast (CMCSA) +12.6% and Green Mountain Coffee Roasters (GMCR) +12.6%. Of these three Fleetcor and Green Mountain Roasters still remained in the portfolio as of August 31, 2013. Comcast was sold in response to stop-loss sell triggers.
In the third quarter, the following had the best performance: Regeneron Pharmaceutical (REGN) +44.8%, Green Mountain (GMCR) +42.1%, Ryland Group (RYL) +26.7% and Fleetcor (FLT) +24.7%. Regeneron and Ryland have since been sold.
Beginning in the fourth quarter, positions purchased and/or added to were Jazz Pharmaceuticals (JAZZ) +23.6%, Michael Kors (KORS) +19.5%, Fleetcor (FLT) +18.4% and Electronic Arts (EA) +15.8%. All of these securities remained in the portfolio at August 31, 2013.
MONTEAGLE INFORMED INVESTOR GROWTH FUND A DISCUSSION OF FUND PERFORMANCE (Unaudited) (Continued) |
On a full fiscal-year time basis, the portfolio performance was positively impacted most by these three largest-weighted sectors: Financials, Information Technology and Consumer Discretionary. It was negatively impacted, on a relative performance basis, by the three largest-weighted lagging sectors: Healthcare, Energy and Utilities.
Measured on a total return basis, for the full fiscal year, the top-ten portfolio equity holdings contributing most to the Fund’s performance were: FLT (Fleetcor), EBAY (EBay), CMCSA (Comcast), GMCR (Green Mountain), RYL (Ryland), REGN (Regeneron), TMO (Thermo Fisher), JAZZ (Jazz Pharmaceuticals), EA (Electronic Arts) and KORS (Michael Kors).
The ten portfolio equity holdings contributing the least to the Fund’s performance for the full fiscal-year were: WNR (Western Refining), ALGN (Align Technology), QCOR (Questcor), PHM (Pulte), VLO (Valero), AMGN (Amgen), ALXN (Alexion), MLNX (Mellanox) SODA (Soda Stream) and HFC (Holly Frontier).
Five of the top-performing portfolio stocks, Electronic Arts, Fleetcor, Green Mountain Coffee, Jazz Pharmaceuticals and Michael Kors, continued to be held at fiscal year-end. None of the top-ten poorest performing stocks were held at fiscal-year end.
What is the Fund’s Current Strategy?
At fiscal year-end, the Monteagle Informed Investors Growth Fund was 90.1% invested and the remaining 9.9% was in cash. Management believes that the Fund’s portfolio seemed, at that time, best situated relative to the then-current market outlook.
Also, significant sector weightings in the Fund that differed from the sector weightings of the S&P 500 were as follows:
| First Quarter: | Sector | Fund | S&P 500 |
| | Financials | 14.4% | 14.9% |
| | Consumer Discretionary | 18.2% | 11.4% |
| | Information Technology | 7.7% | 10.1% |
| | | | |
| Second Quarter: | Sector | Fund | S&P 500 |
| | Information Technology | 17.6% | 15.8% |
| | Consumer Discretionary | 11.8% | 11.4% |
| | Industrials | 22.6% | 18.2% |
| | | | |
| Third Quarter: | Sector | Fund | S&P 500 |
| | Information Technology | 14.8% | 18.1% |
| | Consumer Discretionary | 11.49% | 12.6% |
| | Healthcare | 22.6% | 16.7% |
| | | | |
| Fourth Quarter: | Sector | Fund | S&P 500 |
| | Financials | 18.1% | 16.3% |
| | Information Technology | 22.4% | 18.0% |
| | Consumer Discretionary | 23.4% | 12.20% |
MONTEAGLE INFORMED INVESTOR GROWTH FUND A DISCUSSION OF FUND PERFORMANCE (Unaudited) (Continued) |
Fund performance shown represents the performance of the Fund’s Class I shares. For complete performance information, please refer to the Average Annual Total Return table in the following performance report. Past performance is not predictive of future performance. Investment results and principal value will fluctuate so that shares, when redeemed, may be worth more or less than their original cost. Current performance may be higher or lower than the performance data quoted. Performance data current to the most recent month-end are available by calling 1-888-263-5593.
An investor should consider the investment objectives, risks, charges and expenses of the Fund carefully before investing. The Fund’s prospectus contains this and other important information. To obtain a copy of the Fund’s prospectus please call 1-888-263-5593 and a copy will be sent to you free of charge. Please read the prospectus carefully before you invest. The Fund is distributed by Matrix Capital Group, Inc.
Management’s Discussion of Fund Performance seeks to describe some of the Sub-Adviser’s current opinions and views of the financial markets. Although the Sub-Adviser believes it has a reasonable basis for any opinions or views expressed, actual results may differ, sometimes significantly so, from those expected or expressed.
MONTEAGLE INFORMED INVESTOR GROWTH FUND PERFORMANCE — August 31, 2013 (Unaudited) |
Comparison of the Change in Value of a $10,000 Investment
in Monteagle Informed Investor Growth Fund and the S&P 500 Index
Average Annual Total Return (for the periods ended August 31, 2013) | |
| | | | | | | | | | |
| Monteagle Informed Investor Growth Fund | | | 9.03% | | | | 15.06% | | | | 11.24% | |
| S&P 500 Index | | | 18.70% | | | | 7.31% | | | | 5.63% | |
| (a) | Represents the period from the commencement of operations (April 3, 2008) through August 31, 2013. |
The performance information quoted in this annual report assumes the reinvestment of all dividend and capital gain distributions, if any, and represents past performance, which is not a guarantee of future results. The returns shown do not reflect taxes that a shareholder would pay on Fund distributions or on the redemption of Fund shares. The investment return and principal value of an investment will fluctuate and, therefore, an investor’s shares, when redeemed, may be worth more or less than their original cost.
The above graph depicts the performance of the Monteagle Informed Investor Growth Fund versus the S&P 500 Index. The S&P 500 Index by Standard and Poor’s Corp. is a capitalization-weighted index comprising 500 issues listed on various exchanges, representing the performance of the stock market generally. Please note that indices do not take into account any fees and expenses of investing in the individual securities that they track, and individuals cannot invest directly in any index.
As with any fund, save an index fund, that commonly compares its performance to the S&P 500 Index, such a comparison may be said to be inappropriate because of the dissimilarity between the Fund’s investments and the securities comprising the index; so too with the Monteagle Informed Investor Growth Fund, which will not invest in certain securities comprising this index.
MONTEAGLE QUALITY GROWTH FUND A DISCUSSION OF FUND PERFORMANCE (Unaudited) |
How did the Fund perform?
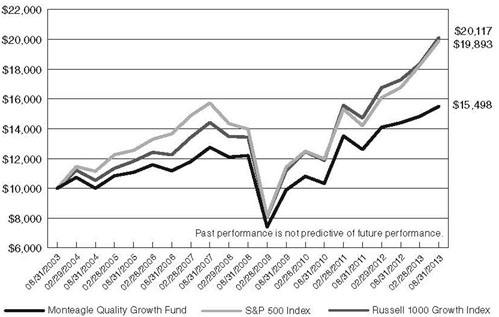
For the twelve months ended August 31, 2013, the Monteagle Quality Growth Fund (the “Fund”) reported a total return of 7.62%. The S&P 500 Index (“S&P 500”) and the Russell 1000 Growth Index (“Russell 1000”), the Fund’s two benchmarks, had total returns of 18.70% and 16.43%, respectively, for the same period. The Fund’s net asset value per share as of August 31, 2013 was $10.65 versus $9.95 as of August 31, 2012.
What is the Fund’s investment approach?
The Fund utilizes a growth style, investing in primarily domestic companies believed by the investment manager to be of high quality and to have above-average sustainable and/or accelerating growth with an ability to exceed earnings expectations over time. The underlying belief is that high quality companies outperform over time with less risk. Various quality rankings and other metrics which demonstrate quality, including earnings consistency, are evaluated carefully before a stock is added to the portfolio. The Fund employs a proprietary screening process and bottom-up work to construct portfolios. However, portfolio constraints are established to ensure sufficient diversification by sector as well as by market capitalization. The underlying belief is that diversification provides for greater control of risk in the portfolio, while allowing freedom in individual stock selection. The screening process is designed to identify stocks with rising expectations, as the Fund looks to invest in securities whose growth potential is, in the manager’s eyes, generally underestimated by the market. Holdings generally have a market capitalization of at least $2 billion, with about 65% to 75% of the portfolio in stocks of over $15 billion.
Compared to the S & P 500, the portfolio will typically have a lower dividend yield, a higher price/earnings ratio and a higher expected earnings growth rate.
What influenced the Fund’s performance?
For the fiscal year ended August 31, 2013, equity investors were rewarded with strong mid-teens returns from the broad domestic equity market. Since bottoming back in early 2009, advances in the U.S. stock market have been driven by Federal Reserve actions aimed at increasing liquidity, driving down interest rates, and triggering investor rotation into “riskier” asset categories. The just-completed fiscal year was no exception, as central bank activity dominated the financial headlines not just domestically, but across the globe as central banks in nearly every developed country joined our own Federal Reserve in a policy of extreme monetary accommodation. On the economic front, the recovery remained sluggish though employment and housing measures did show improvement over the past twelve months. As a result of a still-challenged global economy, corporate earnings growth came in below the expectations established at the outset of the fiscal year. The majority of the equity market’s return was instead driven by expansion in price-to-earnings (P/E) multiples as investors were willing to pay higher prices for stocks given the subpar return prospects from bonds and other “less risky” asset classes in an extremely low interest rate environment. In this environment, individual company fundamentals continued to take a backseat as a driver of stock returns. Lower quality securities continued to exhibit market leadership relative to high quality as investors embraced higher risk exposures and short-sellers were forced to cover bets against many heavily-shorted “riskier” stocks.
MONTEAGLE QUALITY GROWTH FUND A DISCUSSION OF FUND PERFORMANCE (Unaudited) (Continued) |
Given the Fund’s focus on high quality portfolio holdings, this recent environment proved challenging and while the Fund delivered a respectable absolute return for the twelve month period, we were disappointed that the strong fundamentals and attractive valuations of portfolio holdings were not more fully rewarded. Underperformance compared to the benchmark over the past year was not a function of any major “blow ups” in the portfolio. Detraction instead came from the lesser portfolio exposure to higher beta, lower quality stocks that dominated benchmark performance. On a dollar-weighted basis, low quality stocks within the Russell 1000 (stocks rated B or below based on S&P Earning and Dividend Quality Rankings) delivered returns for the twelve months more than double that of high quality stocks (rated B+ or above based on S&P Earning and Dividend Quality Rankings). Fundamentally, portfolio holdings continued to exhibit greater success at meeting or exceeding consensus earnings expectations relative to both the style benchmark and the broad market. Positive earnings surprise has historically been a very favorable factor in driving relative stock performance. However, the artificial monetary liquidity supplied by the Federal Reserve has been the primary factor in what has been very much a “risk-on” environment over the past several quarters. We remain confident that positive earnings surprise and positive estimate revision trends will become more of a differentiating factor in stock performance as the Fed eventually scales back the level of accommodation and this current abnormal market environment normalizes. Likewise, we remain confident in the prospects for high quality stocks at this point in the market cycle. Because of greater consistency in earnings delivery, strong balance sheets, and diversified business operations, large cap high quality growth companies tend to act particularly well on a relative basis in periods of slowing profit growth as a market cycle matures. Based on historical valuations, large cap high quality stocks remain substantially undervalued relative to smaller cap and lower quality stocks and we would expect to see this valuation discrepancy close.
During the first six months of the fiscal year just ended, the market advanced in a steady fashion with particular strength in the latter half of the period. The catalysts for the market’s continued march higher were the announcement of a new open-ended round of asset purchases by the U.S. Federal Reserve as well as favorable resolution of “fiscal cliff” issues related to domestic income tax rates and government debt ceiling levels. While corporate earnings estimates trended lower and the economy remained sluggish, “Don’t fight the Fed” was the message of the market. As a result, “risky” high-beta low-quality stocks continued to lead relative to “safer” high quality stocks. Seven of the ten economic sectors delivered double-digit returns. Industrials (up 15.7%), Health Care (up 14.0%) and Energy (up 13.3%) were the top performing sectors in the Russell 1000. Information Technology (down 5.0%) was the worst performing sector and the only sector to deliver a negative return for the period. Apple (down 33%) was the standout laggard and weighed heavily on the sector’s performance given its large weighting in the index. However, the stock was not alone with many technology stocks declining for the period as the global demand for new software, computers, and networking equipment has been slow to recover.
For the period, the Fund delivered a positive absolute return that came in below the benchmarks on a relative basis. Sector allocation was a slight negative due to a portfolio overweight in the Information Technology sector and an underweight in Health Care. Overall, stock selection was broadly a negative factor as the Fund’s preference for high quality stocks was a headwind across
MONTEAGLE QUALITY GROWTH FUND A DISCUSSION OF FUND PERFORMANCE (Unaudited) (Continued) |
sectors in a period of significant outperformance by “riskier” low quality stocks. Stock selection was notably favorable within the Industrials sector of the portfolio while notably negative within the Consumer Discretionary, Energy, and Materials sectors.
During this period, stocks that contributed most positively to relative returns were Celgene (biotech focused on cancer therapies, up 43%), Roper Industries (industrial supplier of tracking and measurement products, up 22%), and Ametek (industrial producer of electrical products, up 22%). Significant detractors from relative performance included National Oilwell Varco (provider of oilfield drilling equipment and services, down 13%), Express Scripts (health care provider of pharmacy benefit management services, down 9%), and Nordstrom (retail department stores, down 6%).
For the six month period ended August 31, 2013, both the S&P 500 and Russell 1000 indices once again experienced high single digit returns. One distinction in this period relative to the first half was that returns were a bit more front-end loaded, with the months of March, April, and May particularly strong. Mid-summer, the Federal Reserve began floating the idea of “tapering” asset purchases (reducing the dollar amount of bonds the Fed buys in the open market each month) as the economy showed signs of improvement. While the reaction was much stronger in the credit markets where bonds sold off and the yield on the ten-year U.S. Treasury bond increased by nearly one percentage-point, stocks experienced only a mild decline in the month of August to close out a very strong fiscal year and “riskier” low quality stocks continued to outpace higher quality peers. Sector returns followed no single theme as defensive and cyclical sectors were represented among both the winners and the losers. Health Care (up 16.2%), Consumer Discretionary (up 15.4%), and Energy (up 10.6%) were the best performing sectors in the Russell 1000. Telecommunications (up 4.0%), Financials (up 4.1%), and Consumer Staples (up 4.4%) were the laggard sectors.
For the six month period ended August 31, 2013, the Fund’s portfolio again delivered a solid absolute return that nevertheless lagged compared to the Russell 1000 and S&P 500 benchmarks. Relative performance from portfolio stock holdings in the Financials and Consumer Staples sectors of the portfolio was notably positive. Elsewhere, the continued broad headwind presented by low quality leadership within the benchmark Russell 1000 resulted in an overall negative contribution from stock selection, particularly in the Information Technology, Consumer Discretionary, and Materials sectors. Sector allocation was a negative factor. While our constructive outlook on the market was reflected in an overweight position in economically-sensitive sectors most notably Financials, market leadership in this period’s continued advance favored Health Care and Consumer Discretionary stocks, two specific sectors underweighted in the portfolio.
During this period, stocks that contributed most positively to returns were Celgene (biotech, up 36%), Polaris Industries (off-road recreational vehicles, up 26%), and Wells Fargo (consumer banking, up 19%). Significant negative contributors included D.R. Horton (homebuilder, down 20%), American Tower (cellular communication towers, down 10%), and C F Industries (producer of nitrogen-based fertilizers, down 5%).
MONTEAGLE QUALITY GROWTH FUND A DISCUSSION OF FUND PERFORMANCE (Unaudited) (Continued) |
What is the Fund’s Strategy?
The Fund will continue to focus on maintaining a diversified portfolio of high quality companies delivering sustainable above-market earnings growth as well as companies poised to experience meaningful acceleration in earnings growth relative to expectations. The Fund’s adviser believes the companies that can exceed expectations in the form of positive earnings surprises will be well rewarded over coming quarters.
Fund performance shown represents the performance of the Fund’s Class I shares. For complete performance information, please refer to the Average Annual Total Return table in the following performance report. Past performance is not predictive of future performance. Investment results and principal value will fluctuate so that shares, when redeemed, may be worth more or less than their original cost. Current performance may be higher or lower than the performance data quoted. Performance data current to the most recent month-end, are available by calling 1-888-263-5593.
An investor should consider the investment objectives, risks, charges and expenses of the Fund carefully before investing. The Fund’s prospectus contains this and other important information. To obtain a copy of the Fund’s prospectus please call 1-888-263-5593 and a copy will be sent to you free of charge. Please read the prospectus carefully before you invest. The Fund is distributed by Matrix Capital Group, Inc.
Management’s Discussion of Fund Performance seeks to describe some of the Sub-Adviser’s current opinions and views of the financial markets. Although the Sub-Adviser believes it has a reasonable basis for any opinions or views expressed, actual results may differ, sometimes significantly so, from those expected or expressed.
MONTEAGLE QUALITY GROWTH FUND PERFORMANCE — August 31, 2013 (Unaudited) |
Comparison of the Change in Value of a $10,000 Investment in Monteagle Quality Growth Fund,
the S&P 500 Index and the Russell 1000 Growth Index
Average Annual Total Return (for the periods ended August 31, 2013) |
| | | | |
| Monteagle Quality Growth Fund | 7.62% | 4.90% | 4.48% |
| S&P 500 Index | 18.70% | 7.31% | 7.11% |
| Russell 1000 Growth Index | 16.43% | 8.39% | 7.23% |
The performance information quoted in this annual report assumes the reinvestment of all dividend and capital gain distributions, if any, and represents past performance, which is not a guarantee of future results. The returns shown do not reflect taxes that a shareholder would pay on Fund distributions or on the redemption of Fund shares. The investment return and principal value of an investment will fluctuate and, therefore, an investor’s shares, when redeemed, may be worth more or less than their original cost.
The above graph depicts the performance of the Monteagle Quality Growth Fund versus the S&P 500 Index and the Russell 1000 Growth Index. The S&P 500 Index by Standard and Poor’s Corp. is a capitalization-weighted index comprising 500 issues listed on various exchanges, representing the performance of the stock market generally. The Russell 1000 Growth Index measures the performance of the large-cap growth segment of the U.S. equity universe. It includes those Russell 1000 companies with higher price-to-book ratios and higher forecasted growth values. Please note that indices do not take into account any fees and expenses of investing in the individual securities that they track, and individuals cannot invest directly in any index.
As with any fund, save an index fund, that commonly compares its performance to the S&P 500 Index and the Russell 1000 Growth Index, such a comparison may be said to be inappropriate because of the dissimilarity between the Fund’s investments and the securities comprising the indices; so too with the Monteagle Quality Growth Fund, which will not invest in certain securities comprising these indices.
MONTEAGLE VALUE FUND A DISCUSSION OF FUND PERFORMANCE (Unaudited) |
How did the Fund Perform?
For the year ended August 31, 2013, the Fund reported a total return of 18.32%. The S&P 500 Index (“S&P 500”) had a total return of 18.70% for the same time period. The Fund’s net asset value per share as of August 31, 2013 was $15.17 versus $13.31 at August 31, 2012.
What is the Fund’s investment approach?
The Fund’s investment goal is to achieve long-term growth of capital. We attempt to maximize returns through investing in what we believe to be undervalued companies. The Fund usually determines value based on price-to-earnings ratios, but also reviews historical price to book value ratios, dividend yield and balance sheet quality in determining whether prospective investments are truly undervalued. The adviser will generally hold 35 to 45 equities. The Fund generally invests in companies with a market capitalization of $1 billion or more. The current average market capitalization in the Fund exceeds $40 billion. The current price earnings ratio is 13.2 times 2014 earnings and currently yields 2.4 percent. The S&P 500 currently trades at 14.6 times 2014 earnings and yields 2.0 percent.
The Fund’s manager also makes industry determinations based upon interest rate cycles. Historical relationships between short-term and long-term U.S. Treasury securities impact industry weightings as easier money promotes growth in inflation while tight money favors disinflation.
The Fund also makes investments for the long-term; holding the positions for three to five years unless extraordinary events occur, such as mergers, acquisitions or deterioration of the industry or company.
What influenced the Fund’s performance?
During the year ended August 31, 2013, the Fund achieved its performance as a result of renewed economic activity and the overall strength in the U.S. equity markets, and more recently European markets. The stabilization of the financial markets contributed greatly to the positive improvement in the Fund. Interest rates began to rise since May 2013, which is a new market wrinkle that rattled the market during the summer quarter. In theory, economic growth must accelerate producing a targeted inflation rate of 2.5% before the Federal Reserve (“Fed”) will “taper” its bond buying. The Fed, through its Quantitative Easing III program (“QE III”), has stated it will buy $85 billion per month until unemployment reaches 6.5% and inflation rate rises above 2.5%.
During the first quarter ending November 30, 2012, the Monteagle Value Fund underperformed the S&P 500 returning -0.39% versus 1.27% for the S&P 500. Economically sensitive issues, including energy, commodities, and industrials, remained stagnant during the quarter. The Fed’s QE III began during this period with the Fed purchasing $85 billion in Treasury and mortgage bonds per month in hopes of stimulating the economy. Federal Reserve policy continued to maintain low short-term interest rates and accommodation at the Discount window allowing banks and investment banks the ability to borrow.
During the quarter, the Fund made no changes to its holdings.
MONTEAGLE VALUE FUND A DISCUSSION OF FUND PERFORMANCE (Unaudited) (Continued) |
During the second quarter ending February 28, 2013 the Fund slightly outperformed the S&P 500. During the quarter ended February 28, 2013 the Fund returned 8.37% versus 7.58% for the S&P 500. Federal Reserve policy continued to maintain low short-term interest rates and money was growing at an 8% rate during the quarter. The Fed continued purchasing $85 billion in bonds in the open market during this period. The Fund continued to favor economically sensitive issues and believes that the economic recovery will bid commodity prices higher. The Fund favored industrials, energy and materials industries.
During the quarter, the Fund made no changes to its holdings.
During the third quarter ended May 31, 2013, the Fund experienced underperformance versus the S&P 500. During the quarter ended May 31, 2013, the Fund returned 6.7% versus 8.22% for the S&P 500.
Recent Federal Reserve policy continued to keep its foot on the accelerator with continued QE III bond purchases. During May, interest rates actually bottomed and started rising. The Great Rotation from bonds to stocks finally started as outflows in bonds and inflows to stocks occurred.
The Fund continued to favor economically sensitive issues. Worldwide economic weakness has resulted in market declines in most major commodities except oil during the quarter. The Fund believes that the world economy remains poised for a recovery and that economically sensitivity issues remain the sweet spot for its holdings.
During the quarter, the Fund made no changes to its holdings.
During the fourth quarter ended August 31, 2013, the Fund had a modest outperformance versus the S&P 500. During the quarter ended August 31, 2013, the Fund returned 2.73% versus 0.67% for the S&P 500. During the quarter, the Federal Reserve maintained its bond buying in the Open Market. However, the possibility that the Fed would “taper” its bond buying after its September meeting entered the market and caused market weakness. The reality that the President is going to appoint a new Fed Chairman has also contributed to market weakness since July. We believe the Fed will continue to purchase $85 billion a month until its employment and inflation goals have been reached.
During the quarter the Fund sold SAI Corp, Sanmina/SCI, Wendys Co., Sears Holdings, Kronos Worldwide, Spreadtrum Communications, Amkor Technology, Frontier Communications, Sears Canada, and half its position in Worthington Industries. Additionally, the fund made new investments in American Railcar Industries, Holly Frontier Corp., Huntsman Corp., Wolseley PLC, Schneider Electric SA, MacQuarie Bank LTD ADR, and FIH Mobile LTD ADR.
What is the Fund’s current strategy?
The Fund continues to focus on consistency in earnings in its holdings. The Fund remains committed to economically sensitive issues including energy, materials, and industrials. The Fund has a modest overweight in materials, telecommunications, energy and industrials as the economic recovery continues to sputter and recent Fed policy statements indicated they were concerned that it would be willing to accept higher inflation as it fends off deflationary forces. The Fund is underweight industrials, financials, technology, consumer discretion, and consumer staples. The Fund has increased its holdings into international ADR’s believing the worldwide recovery has begun.
MONTEAGLE VALUE FUND A DISCUSSION OF FUND PERFORMANCE (Unaudited) (Continued) |
The Fund’s sector weightings as of August 31, 2013 were as follows:
| | |
| Industrials | 10.7% | 13.5% |
| Energy | 9.6% | 7.4% |
| Materials | 29.1% | 6.1% |
| Financials | 1.4% | 13.3% |
| Health | 14.9% | 12.8% |
| Technology | 6.3% | 14.3% |
| Telecom | 10.1% | 0.6% |
| Utilities | 7.4% | 3.8% |
| Consumer Discretion | 0.0% | 21.6% |
| Consumer Staples | 2.9% | 6.6% |
| Other Holdings | 7.6% | 0.0% |
Fund performance shown represents the performance of the Fund’s Class I shares. For complete performance information, please refer to the Average Annual Total Return table in the following performance report. Past performance is not predictive of future performance. Investment results and principal value will fluctuate so that shares, when redeemed, may be worth more or less than their original cost. Current performance may be higher or lower than the performance data quoted. Performance data current to the most recent month-end, are available by calling 1-888-263-5593.
An investor should consider the investment objectives, risks, charges and expenses of the Fund carefully before investing. The Fund’s prospectus contains this and other important information. To obtain a copy of the Fund’s prospectus please call 1-888-263-5593 and a copy will be sent to you free of charge. Please read the prospectus carefully before you invest. The Fund is distributed by Matrix Capital Group, Inc.
Management’s Discussion of Fund Performance seeks to describe some of the Sub-Adviser’s current opinions and views of the financial markets. Although the Sub-Adviser believes it has a reasonable basis for any opinions or views expressed, actual results may differ, sometimes significantly so, from those expected or expressed.
MONTEAGLE VALUE FUND PERFORMANCE — August 31, 2013 (Unaudited) |
Comparison of the Change in Value of a $10,000 Investment
in Monteagle Value Fund, the S&P 500 Index and the Russell 2000 Value Index
Average Annual Total Return (for the periods ended August 31, 2013) |
| | | | |
| Monteagle Value Fund | 18.32% | 4.29% | 8.10% |
| S&P 500 Index | 18.70% | 7.31% | 7.11% |
| Russell 2000 Value Index | 24.38% | 6.88% | 8.54% |
The performance information quoted in this annual report assumes the reinvestment of all dividend and capital gain distributions, if any, and represents past performance, which is not a guarantee of future results. The returns shown do not reflect taxes that a shareholder would pay on Fund distributions or on the redemption of Fund shares. The investment return and principal value of an investment will fluctuate and, therefore, an investor’s shares, when redeemed, may be worth more or less than their original cost.
The above graph depicts the performance of the Monteagle Value Fund versus the S&P 500 Index and the Russell 2000 Value Index. The S&P 500 Index by Standard and Poor’s Corp. is a capitalization-weighted index comprising 500 issues listed on various exchanges, representing the performance of the stock market generally. The Russell 2000 Value Index measures the performance of small-cap value segment of the U.S. equity universe. It includes those Russell 2000 companies with lower price-to-book ratios and lower forecasted growth values. Please note that indices do not take into account any fees and expenses of investing in the individual securities that they track, and individuals cannot invest directly in any index.
As with any fund, save an index fund, that commonly compares its performance to the S&P 500 Index and the Russell 2000 Value Index, such a comparison may be said to be inappropriate because of the dissimilarity between the Fund’s investments and the securities comprising the indices; so too with the Monteagle Value Fund, which will not invest in certain securities comprising these indices.
MONTEAGLE FIXED INCOME FUND SUPPLEMENTARY PORTFOLIO INFORMATION — August 31, 2013 (Unaudited) |
Top Ten Long-Term Portfolio Holdings | |
| U.S. Treasury Note, 2.00%, due 11/15/2021 | 4.89% |
| U.S. Treasury Note, 1.75%, due 05/15/2022 | 4.74% |
| U.S. Treasury Note, 1.625%, due 08/15/2022 | 4.66% |
| FHLMC, 4.875%, due 06/13/2018 | 2.91% |
| U.S. Treasury Note, 3.125%, due 05/15/2021 | 2.68% |
| U.S. Treasury Note, 2.125%, due 08/15/2021 | 2.48% |
| Chubb Corp., 5.75%, due 05/15/2018 | 2.20% |
| AT&T, Inc., 5.800%, due 02/15/2019 | 2.19% |
| Cisco Systems, Inc., 4.95%, due 02/15/2019 | 2.15% |
| Allergan, Inc., 5.75%, due 04/01/2016 | 2.13% |
| |
| Corporate Bonds | 58.98% |
| U.S. Government and Agency Obligations | 28.25% |
| Mortgage-Backed Securities | 6.46% |
| Money Market Funds | 11.08% |
| Liabilities in Excess of Other Assets | |
| | |
MONTEAGLE INFORMED INVESTOR GROWTH FUND SUPPLEMENTARY PORTFOLIO INFORMATION — August 31, 2013 (Unaudited) |
Top Ten Long-Term Portfolio Holdings | |
| FleetCor Technologies, Inc. | 8.45% |
| Powershares QQQ Trust Series 1 | 8.00% |
| SPDR S&P 500 ETF Trust | 7.99% |
| B/E Aerospace, Inc. | 4.77% |
| Jazz Pharmaceuticals PLC | 4.55% |
| priceline.com, Inc. | 4.23% |
| Electronic Arts, Inc. | 4.06% |
| Netflix, Inc. | 4.05% |
| Facebook, Inc. | 3.97% |
| Tyson Foods, Inc. | 3.92% |
Top Ten Portfolio Industries | |
| Internet | 14.24% |
| Commercial Services | 8.45% |
| Retail | 8.14% |
| Auto Parts & Equipment | 7.38% |
| Aerospace & Defense | 6.76% |
| Electronics | 5.98% |
| Pharmaceuticals | 5.55% |
| Software | 4.07% |
| Food | 3.92% |
| Apparel | |
| | |
Economic Sectors with Cash and Other Assets | |
| Consumer, Non-cyclical | 20.83% |
| Consumer, Cyclical | 18.98% |
| Exchange-Traded Funds | 15.99% |
| Communications | 14.24% |
| Industrial | 12.73% |
| Money Market Funds | 11.43% |
| Technology | 4.07% |
| Financial | 3.16% |
| Liabilities in Excess of Other Assets | |
| | |
MONTEAGLE QUALITY GROWTH FUND SUPPLEMENTARY PORTFOLIO INFORMATION — August 31, 2013 (Unaudited) |
Top Ten Long-Term Portfolio Holdings | |
| Apple, Inc. | 5.11% |
| Affiliated Managers Group, Inc. | 3.64% |
| Walt Disney Co. | 3.08% |
| QUALCOMM, Inc. | 3.02% |
| Goldman Sachs Group, Inc. | 2.85% |
| Home Depot, Inc. | 2.81% |
| Baxter International, Inc. | 2.81% |
| Roper Industries, Inc. | 2.81% |
| Google, Inc. | 2.77% |
| WW Grainger, Inc. | 2.74% |
Top Ten Portfolio Industries | |
| Retail | 10.04% |
| Diversified Financial Services | 7.78% |
| Banks | 6.80% |
| Computers | 6.68% |
| Internet | 6.10% |
| Food | 4.83% |
| Chemicals | 3.94% |
| Electronics | 3.91% |
| Media | 3.08% |
| Semiconductors | |
| | |
Economic Sectors with Cash and Other Assets | |
| Consumer, Cyclical | 19.63% |
| Financial | 17.17% |
| Consumer, Non-cyclical | 16.52% |
| Industrial | 15.36% |
| Communications | 11.89% |
| Technology | 11.17% |
| Basic Materials | 3.94% |
| Energy | 2.51% |
| Money Market Funds | 1.79% |
| Other Assets in Excess of Liabilities | |
| | |
MONTEAGLE SELECT VALUE FUND SUPPLEMENTARY PORTFOLIO INFORMATION — August 31, 2013 (Unaudited) |
Top Ten Long-Term Portfolio Holdings | |
| Gilead Sciences, Inc. | 3.99% |
| First Solar, Inc. | 3.87% |
| Humana, Inc. | 3.27% |
| WellPoint, Inc. | 2.98% |
| GameStop Corp. | 2.95% |
| Microsoft Corp. | 2.82% |
| Whirlpool Corp. | 2.77% |
| Genworth Financial, Inc. | 2.66% |
| Raytheon Co. | 2.60% |
| Intel Corp. | 2.58% |
Top Ten Portfolio Industries | |
| Retail | 10.15% |
| Semiconductors | 8.80% |
| Insurance | 8.35% |
| Healthcare - Services | 6.25% |
| Commercial Services | 6.18% |
| Oil & Gas | 4.57% |
| Computers | 4.02% |
| Banks | 4.01% |
| Biotechnology | 3.99% |
| Chemicals | |
| | |
Economic Sectors with Cash and Other Assets | |
| Financial | 19.09% |
| Money Market Funds | 16.65% |
| Technology | 14.67% |
| Consumer, Non-cyclical | 12.92% |
| Consumer, Cyclical | 10.09% |
| Industrial | 9.04% |
| Energy | 8.04% |
| Communications | 6.68% |
| Basic Materials | 3.68% |
| Utilities | 2.09% |
| Liabilities in Excess of Other Assets | |
| | |
MONTEAGLE VALUE FUND SUPPLEMENTARY PORTFOLIO INFORMATION — August 31, 2013 (Unaudited) |
Top Ten Long-Term Portfolio Holdings | |
| Merck & Co., Inc. | 4.71% |
| AT&T, Inc. | 4.17% |
| Eastman Chemical Co. | 4.16% |
| International Paper Co. | 4.08% |
| EI du Pont de Nemours & Co. | 3.75% |
| Textron, Inc. | 3.66% |
| Verizon Communications, Inc. | 3.51% |
| Duke Energy Corp. | 3.45% |
| Chemtura Corp. | 3.11% |
| Halliburton Co. | 2.96% |
Top Ten Portfolio Industries | |
| Chemicals | 13.06% |
| Telecommunications | 12.51% |
| Pharmaceuticals | 7.29% |
| Healthcare - Products | 7.16% |
| Oil & Gas | 6.72% |
| Miscellaneous Manufacturing | 5.68% |
| Electric | 5.23% |
| Oil & Gas Services | 4.56% |
| Forest Products & Paper | 4.08% |
| Aerospace & Defense | |
| | |
Economic Sectors with Cash and Other Assets | |
| Basic Materials | 22.10% |
| Industrial | 21.82% |
| Consumer, Non-cyclical | 18.67% |
| Communications | 13.53% |
| Energy | 12.20% |
| Money Market Funds | 11.66% |
| Utilities | 5.66% |
| Technology | 4.15% |
| Financial | 1.33% |
| Consumer, Cyclical | 0.20% |
| Liabilities in Excess of Other Assets | |
| | |
MONTEAGLE FIXED INCOME FUND SCHEDULE OF INVESTMENTS — August 31, 2013 |
| | U.S. GOVERNMENT AND AGENCY OBLIGATIONS (b) - 28.25% | | | |
| | | U.S. Treasury Notes - 20.77% | | | |
| $ | 2,000,000 | | 1.625%, due 08/15/2022 | | $ | 1,837,032 | |
| | 2,000,000 | | 1.75%, due 05/15/2022 | | | 1,867,968 | |
| | 2,000,000 | | 2.00%, due 11/15/2021 | | | 1,927,188 | |
| | 1,000,000 | | 2.125%, due 08/15/2021 | | | 977,617 | |
| | 500,000 | | 2.625%, due 08/15/2020 | | | 514,864 | |
| | 1,000,000 | | 3.125%, due 05/15/2021 | | | 1,054,727 | |
| | | | | | | 8,179,396 | |
| | | | Federal Home Loan Bank - 1.32% | | | | |
| | 500,000 | | 5.25%, due 06/18/2014 | | | 520,367 | |
| | | | | | | | |
| | | | Federal Home Loan Mortgage Corporation - 4.81% | | | | |
| | 500,000 | | 3.75%, due 03/27/2019 | | | 544,514 | |
| | 1,000,000 | | 4.875%, due 06/13/2018 | | | 1,145,540 | |
| | 175,000 | | 5.00%, due 12/14/2018 | | | 203,715 | |
| | | | | | | 1,893,769 | |
| | | | Federal National Mortgage Association - 1.35% | | | | |
| | 500,000 | | 5.00%, due 03/02/2015 | | | 534,957 | |
| | | | | | | | |
| | | | Total U.S. Government and Agency Obligations (Cost $11,466,670) | | | 11,128,489 | |
| | CORPORATE BONDS - 58.98% (b) | | | |
| | | Aerospace & Defense - 1.45% | | | |
| $ | 500,000 | | United Technologies Corp., 5.375%, due 12/15/2017 | | $ | 571,655 | |
| | | | | | | | |
| | | | Agriculture - 1.16% | | | | |
| | 500,000 | | Philip Morris International, Inc., 2.50%, due 08/22/2022 | | | 456,224 | |
| | | | | | | | |
| | | | Banks - 13.63% | | | | |
| | 500,000 | | Goldman Sachs Group, Inc., 5.95%, due 01/18/2018 | | | 559,908 | |
| | 500,000 | | JPMorgan Chase & Co., 2.05%, due 01/24/2014 | | | 503,434 | |
| | 500,000 | | JPMorgan Chase & Co., 6.00%, due 01/15/2018 | | | 572,697 | |
| | 500,000 | | Manufacturers & Traders Trust Co., 1.45%, due 03/07/2018 | | | 486,045 | |
| | 500,000 | | Morgan Stanley, 3.45%, due 11/02/2015 | | | 518,475 | |
| | 500,000 | | Northern Trust Corp., 2.375%, due 08/02/2022 | | | 454,234 | |
| | 500,000 | | PNC Funding Corp., 4.375%, due 08/11/2020 | | | 534,846 | |
| | 250,000 | | State Street Corp., 4.30%, due 05/30/2014 | | | 257,397 | |
| | 500,000 | | U.S. Bankcorp, 2.20%, due 11/15/2016 | | | 514,412 | |
| | 500,000 | | Wells Fargo & Co., 3.45%, 02/13/2023 | | | 467,150 | |
| | 500,000 | | Westpac Banking Corp., 2.00%, due 08/14/2017 | | | 500,328 | |
| | | | | | | 5,368,926 | |
The accompanying notes are an integral part of the financial statements.
MONTEAGLE FIXED INCOME FUND SCHEDULE OF INVESTMENTS — August 31, 2013 (Continued) |
| | CORPORATE BONDS - 58.98% (b) (Continued) | | | |
| | | Biotechnology - 1.34% | | | |
| $ | 250,000 | | Amgen, Inc., 4.50%, due 03/15/2020 | | $ | 266,668 | |
| | 250,000 | | Amgen, Inc., 4.85%, due 11/18/2014 | | | 262,717 | |
| | | | | | | 529,385 | |
| | | | Computers - 2.40% | | | | |
| | 350,000 | | Hewlett-Packard Co., 6.125%, due 03/01/2014 | | | 358,693 | |
| | 600,000 | | International Business Machines Corp., 1.25%, 02/08/2018 | | | 584,707 | |
| | | | | | | 943,400 | |
| | | | Diversified Financial Services - 3.81% | | | | |
| | 250,000 | | CME Group, Inc., 3.00%, due 09/15/2022 | | | 234,942 | |
| | 500,000 | | CME Group, Inc., 5.75%, due 02/15/2014 | | | 511,299 | |
| | 250,000 | | General Electric Capital Corp., 3.15%, due 09/07/2022 | | | 232,729 | |
| | 500,000 | | Toyota Motor Credit Corp., 3.20%, due 06/17/2015 | | | 522,764 | |
| | | | | | | 1,501,734 | |
| | | | Electric - 2.77% | | | | |
| | 500,000 | | Duke Energy Florida, Inc., 4.55%, due 04/01/2020 | | | 546,714 | |
| | 500,000 | | Georgia Power Co., 4.25%, due 12/01/2019 | | | 544,132 | |
| | | | | | | 1,090,846 | |
| | | | Electrical Components - 0.71% | | | | |
| | 250,000 | | Emerson Electric Co., 5.125%, due 12/01/2016 | | | 279,961 | |
| | | | | | | | |
| | | | Food - 1.02% | | | | |
| | 400,000 | | McCormick & Co., Inc., 5.25%, due 09/01/2013 | | | 400,000 | |
| | | | | | | | |
| | | | Healthcare - Services - 0.04% | | | | |
| | 15,000 | | UnitedHealth Group, Inc., 5.00%, due 08/15/2014 | | | 15,626 | |
| | | | | | | | |
| | | | Insurance - 3.43% | | | | |
| | 500,000 | | Berkshire Hathaway Finance Corp., 3.00%, due 05/15/2022 | | | 481,597 | |
| | 750,000 | | Chubb Corp., 5.75%, due 05/15/2018 | | | 866,929 | |
| | | | | | | 1,348,526 | |
| | | | Metal Fabricate & Hardware - 1.16% | | | | |
| | 500,000 | | Precision Castparts Corp., 2.50%, due 01/15/2023 | | | 457,954 | |
| | | | | | | | |
| | | | Miscellaneous Manufacturing - 2.64% | | | | |
| | 250,000 | | 3M Co., 1.00%, due 06/26/2017 | | | 243,549 | |
| | 250,000 | | 3M Co., 2.00%, due 06/26/2022 | | | 231,615 | |
| | 500,000 | | General Electric Co., 5.25%, due 12/06/2017 | | | 566,082 | |
| | | | | | | 1,041,246 | |
| | | | Office & Business Equipment - 0.69% | | | | |
| | 250,000 | | Pitney Bowes, Inc., 5.75%, due 09/15/2017 | | | 271,032 | |
The accompanying notes are an integral part of the financial statements.
MONTEAGLE FIXED INCOME FUND SCHEDULE OF INVESTMENTS — August 31, 2013 (Continued) |
| | CORPORATE BONDS - 58.98% (b) (Continued) | | | |
| | | Oil & Gas - 3.04% | | | |
| $ | 500,000 | | BP Capital Markets, PLC, 2.50%, due 11/06/2022 | | $ | 448,464 | |
| | 250,000 | | BP Capital Markets, PLC, 4.75%, due 03/10/2019 | | | 275,116 | |
| | 250,000 | | Shell International Finance BV, 1.125%, due 08/21/2017 | | | 246,099 | |
| | 250,000 | | Shell International Finance BV, 2.375%, due 08/21/2022 | | | 228,994 | |
| | | | | | | 1,198,673 | |
| | | | Oil & Gas Services - 1.89% | | | | |
| | 750,000 | | Halliburton Co., 2.00%, due 08/01/2018 | | | 743,315 | |
| | | | | | | | |
| | | | Pharmaceuticals - 5.11% | | | | |
| | 750,000 | | Allergan, Inc., 5.75%, due 04/01/2016 | | | 837,157 | |
| | 500,000 | | AstraZeneca PLC, 1.95%, due 09/18/2019 | | | 484,336 | |
| | 500,000 | | GlaxoSmithKline Capital, Inc., 5.65%, due 05/15/2018 | | | 576,943 | |
| | 100,000 | | Johnson & Johnson, 5.15%, due 07/15/2018 | | | 115,008 | |
| | | | | | | 2,013,444 | |
| | | | Retail - 1.23% | | | | |
| | 250,000 | | Costco Wholesale Corp., 1.125%, due 12/15/2017 | | | 242,854 | |
| | 250,000 | | Costco Wholesale Corp., 1.70%, due 12/15/2019 | | | 240,102 | |
| | | | | | | 482,956 | |
| | | | Semiconductors - 2.80% | | | | |
| | 750,000 | | Broadcom Corp., 2.70%, 11/01/2018 | | | 760,745 | |
| | 350,000 | | Intel Corp., 1.35%, 12/15/2017 | | | 343,080 | |
| | | | | | | 1,103,825 | |
| | | | Software - 1.17% | | | | |
| | 500,000 | | Oracle Corp., 2.50%, due 10/15/2022 | | | 458,906 | |
| | | | | | | | |
| | | | Telecommunications - 7.49% | | | | |
| | 750,000 | | AT&T, Inc., 5.80%, due 02/15/2019 | | | 861,139 | |
| | 200,000 | | AT&T, Inc., SBC Comm, 5.625%, due 06/15/2016 | | | 223,045 | |
| | 750,000 | | Cisco Systems, Inc., 4.95%, due 02/15/2019 | | | 847,769 | |
| | 500,000 | | Verizon Communications, Inc., 3.00%, due 04/01/2016 | | | 521,024 | |
| | 500,000 | | Vodafone Group PLC, 0.90%, due 02/19/2016 | | | 498,447 | |
| | | | | | | 2,951,424 | |
| | | | | | | | |
| | | | Total Corporate Bonds (Cost $23,091,331) | | | 23,229,058 | |
| | MORTGAGE-BACKED SECURITIES (b) - 6.46% | | | |
| | | Federal Home Loan Mortgage Corporation - 3.22% | | | |
| $ | 632,343 | | Pool J19285, 2.50%, due 06/01/2027 | | $ | 628,758 | |
| | 86,064 | | Series 15L, 7.00%, due 07/25/2023 | | | 97,062 | |
| | 388,907 | | Series 2841 BY, 5.00%, due 08/15/2019 | | | 417,556 | |
| | 123,866 | | Series 3290 PD, 5.50%, due 03/15/2035 | | | 124,674 | |
| | | | | | | 1,268,050 | |
The accompanying notes are an integral part of the financial statements.
MONTEAGLE FIXED INCOME FUND SCHEDULE OF INVESTMENTS — August 31, 2013 (Continued) |
| | MORTGAGE-BACKED SECURITIES (b) - 6.46% (Continued) | | | |
| | | Federal National Mortgage Association - 1.47% | | | |
| $ | 109,838 | | Pool 545759, 6.50%, due 07/01/2032 | | $ | 121,279 | |
| | 42,175 | | Pool 725421, 7.00%, due 09/01/2017 | | | 45,002 | |
| | 57,912 | | Pool 754289, 6.00%, due 11/01/2033 | | | 64,239 | |
| | 128,025 | | Pool 882684, 6.00%, due 06/01/2036 | | | 141,698 | |
| | 32,665 | | Series 2003-54-PG, 5.50%, due 09/25/2032 | | | 33,165 | |
| | 155,641 | | Series 2007-40-PT, 5.50%, due 05/25/2037 | | | 171,876 | |
| | | | | | | 577,259 | |
| | | | Government National Mortgage Association - 1.77% | | | | |
| | 113,629 | | Pool 476998, 6.50%, due 07/15/2029 | | | 129,815 | |
| | 108,359 | | Pool 648337, 5.00%, due 10/15/2020 | | | 115,642 | |
| | 58,530 | | Pool 676516, 6.00%, due 02/15/2038 | | | 64,403 | |
| | 122,515 | | Series 2012-52-PM, 3.50%, due 12/20/2039 | | | 125,688 | |
| | 297,974 | | Series 2012-91-HQ, 2.00%, due 09/20/2041 | | | 261,890 | |
| | | | | | | 697,438 | |
| | | | | | | | |
| | | | Total Mortgage-Backed Securities (Cost $2,507,622) | | | 2,542,747 | |
| | MONEY MARKET FUNDS - 11.08% | | | |
| | 4,365,464 | | Fidelity Institutional Money Market Fund Class I, 0.09% (a) (Cost $4,365,464) | | $ | 4,365,464 | |
| | | | | | | | |
| | | | Total Investments at Fair Value - 104.77% (Cost $41,431,087) | | $ | 41,265,758 | |
| | | | | | | | |
| | | | Liabilities in Excess of Other Assets, Net - (4.77%) | | | (1,878,816 | ) |
| | | | | | | | |
| | | | Net Assets - 100.00% | | $ | 39,386,942 | |
| (a) | Rate shown represents the 7-day yield at August 31, 2013, is subject to change and resets daily. |
| (b) | Categorized in level 2 of the fair value hierarchy; for additional information and description of the levels, refer to the table included in Note 2 of the accompanying notes to the financial statements. |
The accompanying notes are an integral part of the financial statements.
MONTEAGLE INFORMED INVESTOR GROWTH FUND SCHEDULE OF INVESTMENTS — August 31, 2013 |
| | | | | |
| | | Aerospace & Defense - 6.75% | | | |
| | 9,300 | | B/E Aerospace, Inc. (a) | | $ | 634,167 | |
| | 3,500 | | Raytheon Co. | | | 263,935 | |
| | | | | | | 898,102 | |
| | | | Apparel - 3.45% | | | | |
| | 6,200 | | Michael Kors Holdings Ltd. (a) | | | 459,358 | |
| | | | | | | | |
| | | | Autoparts & Equipment - 7.38% | | | | |
| | 9,300 | | Delphi Automotive PLC | | | 511,686 | |
| | 6,100 | | Magna International, Inc. | | | 470,859 | |
| | | | | | | 982,545 | |
| | | | Beverages - 2.92% | | | | |
| | 4,500 | | Green Mountain Coffee Roasters, Inc. (a) | | | 388,395 | |
| | | | | | | | |
| | | | Commercial Services - 8.45% | | | | |
| | 10,900 | | FleetCor Technologies, Inc. (a) | | | 1,123,899 | |
| | | | | | | | |
| | | | Diversified Financial Services - 3.16% | | | | |
| | 800 | | Visa, Inc. - Class A | | | 139,536 | |
| | 5,900 | | Waddell & Reed Financial, Inc. - Class A | | | 280,958 | |
| | | | | | | 420,494 | |
| | | | Electronics - 5.98% | | | | |
| | 12,100 | | FLIR Systems, Inc. | | | 378,488 | |
| | 4,700 | | Thermo Fisher Scientific, Inc. | | | 417,501 | |
| | | | | | | 795,989 | |
| | | | Food - 3.92% | | | | |
| | 18,000 | | Tyson Foods, Inc. - Class A | | | 521,100 | |
| | | | | | | | |
| | | | Internet - 14.24% | | | | |
| | 12,800 | | Facebook, Inc. - Class A (a) | | | 528,384 | |
| | 1,100 | | LinkedIn Corp. - Class A (a) | | | 264,044 | |
| | 1,900 | | Netflix, Inc. (a) | | | 539,429 | |
| | 600 | | Priceline.com, Inc. (a) | | | 563,118 | |
| | | | | | | 1,894,975 | |
| | | | Pharmaceuticals - 5.55% | | | | |
| | 6,900 | | Jazz Pharmaceuticals Plc (a) | | | 605,061 | |
| | 5,900 | | Santarus, Inc. (a) | | | 132,868 | |
| | | | | | | 737,929 | |
| | | | Retail - 8.14% | | | | |
| | 2,700 | | Cabela's, Inc. - Class A (a) | | | 176,931 | |
| | 6,300 | | Domino's Pizza, Inc. | | | 387,072 | |
| | 6,200 | | Nu Skin Enterprises, Inc. - Class A | | | 519,002 | |
| | | | | | | 1,083,005 | |
The accompanying notes are an integral part of the financial statements.
MONTEAGLE INFORMED INVESTOR GROWTH FUND SCHEDULE OF INVESTMENTS — August 31, 2013 (Continued) |
| | COMMON STOCKS - 74.01% (Continued) | | | |
| | | Software - 4.07% | | | |
| | 20,300 | | Electronic Arts, Inc. (a) | | $ | 540,792 | |
| | | | | | | | |
| | | | Total Common Stocks (Cost $8,615,361) | | | 9,846,583 | |
| | EXCHANGE-TRADED FUNDS - 15.99% | | | |
| | 14,100 | | Powershares QQQ Trust Series 1 | | $ | 1,063,986 | |
| | 6,500 | | SPDR S&P 500 ETF Trust | | | 1,063,725 | |
| | | | Total Exchange-Traded Funds (Cost $2,031,895) | | | 2,127,711 | |
| | MONEY MARKET FUND - 11.43% | | | |
| | 1,521,105 | | Fidelity Institutional Money Market Fund Class I, 0.09% (b) (Cost $1,521,105) | | $ | 1,521,105 | |
| | | | | | | | |
| | | | Total Investments at Fair Value - 101.43% (Cost $12,168,361) | | $ | 13,495,399 | |
| | | | | | | | |
| | | | Liabilities in Excess of Other Assets, Net - (1.43%) | | | (190,195 | ) |
| | | | | | | | |
| | | | Net Assets - 100.00% | | $ | 13,305,204 | |
| (a) | Non-income producing security. |
| (b) | Rate shown represents the 7-day yield at August 31, 2013, is subject to change and resets daily. |
The accompanying notes are an integral part of the financial statements.
MONTEAGLE QUALITY GROWTH FUND SCHEDULE OF INVESTMENTS — August 31, 2013 |
| | | | | |
| | | Apparel - 1.95% | | | |
| | 7,950 | | NIKE, Inc. - Class B | | $ | 499,419 | |
| | | | | | | | |
| | | | Banks - 6.80% | | | | |
| | 14,145 | | East West Bancorp, Inc. | | | 413,458 | |
| | 4,780 | | Goldman Sachs Group, Inc. | | | 727,181 | |
| | 14,550 | | Wells Fargo & Co. | | | 597,714 | |
| | | | | | | 1,738,353 | |
| | | | Beverages - 2.53% | | | | |
| | 16,910 | | Coca-Cola Co. | | | 645,624 | |
| | | | | | | | |
| | | | Biotechnology - 2.68% | | | | |
| | 4,897 | | Celgene Corp. (a) | | | 685,482 | |
| | | | | | | | |
| | | | Chemicals - 3.94% | | | | |
| | 2,933 | | CF Industries Holdings, Inc. | | | 558,267 | |
| | 4,580 | | Monsanto Co. | | | 448,336 | |
| | | | | | | 1,006,603 | |
| | | | Computers - 6.68% | | | | |
| | 2,680 | | Apple, Inc. | | | 1,305,294 | |
| | 2,196 | | International Business Machines Corp. | | | 400,265 | |
| | | | | | | 1,705,559 | |
| | | | Cosmetics & Personal Care - 1.76% | | | | |
| | 6,680 | | Estee Lauder Cos., Inc. | | | 449,677 | |
| | | | | | | | |
| | | | Distribution & Wholesale - 2.74% | | | | |
| | 2,828 | | WW Grainger, Inc. | | | 699,506 | |
| | | | | | | | |
| | | | Diversified Financial Services - 7.78% | | | | |
| | 5,338 | | Affiliated Managers Group, Inc. (a) | | | 930,520 | |
| | 2,150 | | BlackRock, Inc. | | | 559,688 | |
| | 2,860 | | Visa, Inc. - Class A | | | 498,841 | |
| | | | | | | 1,989,049 | |
| | | | Electrical Components & Equipment - 2.59% | | | | |
| | 15,402 | | AMETEK, Inc. | | | 661,054 | |
| | | | | | | | |
| | | | Electronics - 3.91% | | | | |
| | 7,404 | | Amphenol Corp. - Class A | | | 561,001 | |
| | 17,299 | | Trimble Navigation Ltd. (a) | | | 436,800 | |
| | | | | | | 997,801 | |
| | | | Entertainment - 1.31% | | | | |
| | 11,360 | | Cinemark Holdings, Inc. | | | 334,779 | |
The accompanying notes are an integral part of the financial statements.
MONTEAGLE QUALITY GROWTH FUND SCHEDULE OF INVESTMENTS — August 31, 2013 (Continued) |
| | COMMON STOCKS - 98.12% (Continued) | | | |
| | | Food - 4.83% | | | |
| | 5,791 | | Kellogg Co. | | $ | 351,572 | |
| | 4,460 | | McCormick & Co., Inc. | | | 301,719 | |
| | 10,988 | | Whole Foods Market, Inc. | | | 579,617 | |
| | | | | | | 1,232,908 | |
| | | | Healthcare - Products - 2.81% | | | | |
| | 10,331 | | Baxter International, Inc. | | | 718,624 | |
| | | | | | | | |
| | | | Home Builders - 1.39% | | | | |
| | 19,860 | | D.R. Horton, Inc. | | | 354,501 | |
| | | | | | | | |
| | | | Internet - 6.10% | | | | |
| | 1,150 | | Amazon.com, Inc. (a) | | | 323,127 | |
| | 10,570 | | eBay, Inc. (a) | | | 528,394 | |
| | 835 | | Google, Inc. - Class A (a) | | | 707,162 | |
| | | | | | | 1,558,683 | |
| | | | Leisure Time - 2.20% | | | | |
| | 5,143 | | Polaris Industries, Inc. | | | 561,667 | |
| | | | | | | | |
| | | | Machinery - Diversified - 2.81% | | | | |
| | 5,804 | | Roper Industries, Inc. | | | 717,955 | |
| | | | | | | | |
| | | | Media - 3.08% | | | | |
| | 12,950 | | Walt Disney Co. | | | 787,749 | |
| | | | | | | | |
| | | | Metal Fabricate & Hardware - 1.55% | | | | |
| | 1,877 | | Precision Castparts Corp. | | | 396,497 | |
| | | | | | | | |
| | | | Miscellaneous Manufacturing - 2.04% | | | | |
| | 7,968 | | Danaher Corp. | | | 522,063 | |
| | | | | | | | |
| | | | Oil & Gas - 1.22% | | | | |
| | 3,235 | | Concho Resources, Inc. (a) | | | 312,210 | |
| | | | | | | | |
| | | | Oil & Gas Services - 1.29% | | | | |
| | 4,420 | | National Oilwell Varco, Inc. | | | 328,406 | |
| | | | | | | | |
| | | | Pharmaceuticals - 1.92% | | | | |
| | 7,675 | | Express Scripts Holding Co. (a) | | | 490,279 | |
| | | | | | | | |
| | | | Real Estate Investment Trusts - 2.58% | | | | |
| | 9,497 | | American Tower Corp. | | | 659,947 | |
The accompanying notes are an integral part of the financial statements.
MONTEAGLE QUALITY GROWTH FUND SCHEDULE OF INVESTMENTS — August 31, 2013 (Continued) |
| | COMMON STOCKS - 98.12% (Continued) | | | |
| | | Retail - 10.04% | | | |
| | 3,135 | | Bed Bath & Beyond, Inc. (a) | | $ | 231,175 | |
| | 11,055 | | CVS Caremark Corp. | | | 641,743 | |
| | 1,694 | | DSW, Inc. | | | 145,836 | |
| | 10,240 | | Dunkin' Brands Group, Inc. | | | 441,242 | |
| | 9,655 | | Home Depot, Inc. | | | 719,201 | |
| | 5,735 | | Ross Stores, Inc. | | | 385,736 | |
| | | | | | | 2,564,933 | |
| | | | Semiconductors - 3.02% | | | | |
| | 11,660 | | QUALCOMM, Inc. | | | 772,825 | |
| | | | | | | | |
| | | | Software - 1.47% | | | | |
| | 11,825 | | Oracle Corp. | | | 376,745 | |
| | | | | | | | |
| | | | Telecommunications - 2.71% | | | | |
| | 29,695 | | Cisco Systems, Inc. | | | 692,190 | |
| | | | | | | | |
| | | | Transportation - 2.46% | | | | |
| | 2,973 | | FedEx Corp. | | | 319,181 | |
| | 5,750 | | Tidewater, Inc. | | | 310,270 | |
| | | | | | | 629,451 | |
| | | | | | | | |
| | | | Total Common Stocks (Cost $19,551,756) | | | 25,090,539 | |
| | MONEY MARKET FUND - 1.79% | | | |
| | 457,885 | | Fidelity Institutional Money Market Fund Class I, 0.09% (b) (Cost $457,885) | | $ | 457,885 | |
| | | | | | | | |
| | | | Total Investments at Fair Value - 99.98% (Cost $20,009,641) | | $ | 25,548,424 | |
| | | | | | | | |
| | | | Other Assets in Excess of Liabilities, Net - 0.02% | | | 4,341 | |
| | | | | | | | |
| | | | Net Assets - 100.00% | | $ | 25,552,765 | |
| (a) | Non-income producing security. |
| (b) | Rate shown represents the 7-day yield at August 31, 2013, is subject to change and resets daily. |
The accompanying notes are an integral part of the financial statements.
MONTEAGLE SELECT VALUE FUND SCHEDULE OF INVESTMENTS — August 31, 2013 |
| | | | | |
| | | Aerospace & Defense - 3.71% | | | |
| | 1,300 | | Lockheed Martin Corp. | | $ | 159,146 | |
| | 4,953 | | Raytheon Co. | | | 373,506 | |
| | | | | | | 532,652 | |
| | | | Banks -4.01% | | | | |
| | 7,400 | | Bank of America Corp. | | | 104,488 | |
| | 1,091 | | Goldman Sachs Group, Inc. | | | 165,974 | |
| | 11,849 | | Morgan Stanley | | | 305,230 | |
| | | | | | | 575,692 | |
| | | | Biotechnology - 3.99% | | | | |
| | 9,494 | | Gilead Sciences, Inc. (a) | | | 572,203 | |
| | | | | | | | |
| | | | Chemicals - 3.79% | | | | |
| | 1,696 | | CF Industries Holdings, Inc. | | | 322,817 | |
| | 5,900 | | Dow Chemical Co. | | | 220,660 | |
| | | | | | | 543,477 | |
| | | | Commercial Services - 6.17% | | | | |
| | 10,152 | | Apollo Group, Inc. - Class A (a) | | | 188,523 | |
| | 12,630 | | H&R Block, Inc. | | | 352,503 | |
| | 20,652 | | RR Donnelley & Sons Co. (d) | | | 344,475 | |
| | | | | | | 885,501 | |
| | | | Computers - 4.02% | | | | |
| | 589 | | Apple, Inc. | | | 286,872 | |
| | 11,000 | | Dell, Inc. | | | 151,470 | |
| | 6,175 | | Hewlett-Packard Co. | | | 137,949 | |
| | | | | | | 576,291 | |
| | | | Diversified Financial Services - 1.08% | | | | |
| | 2,180 | | CME Group, Inc. | | | 155,020 | |
| | | | | | | | |
| | | | Electric - 2.09% | | | | |
| | 7,991 | | FirstEnergy Corp. | | | 299,423 | |
| | | | | | | | |
| | | | Food - 1.83% | | | | |
| | 10,144 | | Safeway, Inc. | | | 262,730 | |
| | | | | | | | |
| | | | Healthcare - Products - 0.84% | | | | |
| | 1,800 | | Stryker Corp. | | | 120,402 | |
| | | | | | | | |
| | | | Healthcare - Services - 6.25% | | | | |
| | 5,097 | | Humana, Inc. | | | 469,332 | |
| | 5,016 | | WellPoint, Inc. | | | 427,062 | |
| | | | | | | 896,394 | |
| | | | Home Furnishings - 2.77% | | | | |
| | 3,087 | | Whirlpool Corp. | | | 397,143 | |
The accompanying notes are an integral part of the financial statements.
MONTEAGLE SELECT VALUE FUND SCHEDULE OF INVESTMENTS — August 31, 2013 (Continued) |
| | COMMON STOCKS - 92.85% (Continued) | | | |
| | | Insurance - 8.35% | | | |
| | 6,388 | | Allstate Corp. | | $ | 306,113 | |
| | 4,827 | | Assurant, Inc. | | | 256,024 | |
| | 32,310 | | Genworth Financial, Inc. - Class A (a) | | | 381,258 | |
| | 5,495 | | MetLife, Inc. | | | 253,814 | |
| | | | | | | 1,197,209 | |
| | | | Iron & Steel - 3.22% | | | | |
| | 10,872 | | Allegheny Technologies, Inc | | | 290,391 | |
| | 5,611 | | Cliffs Natural Resources, Inc. | | | 117,102 | |
| | 3,000 | | United States Steel Corp. (d) | | | 53,700 | |
| | | | | | | 461,193 | |
| | | | Machinery - Construction & Mining - 2.09% | | | | |
| | 6,107 | | Joy Global, Inc. | | | 299,976 | |
| | | | | | | | |
| | | | Media - 1.80% | | | | |
| | 458 | | Washington Post Co. - Class B | | | 258,312 | |
| | | | | | | | |
| | | | Mining - 2.03% | | | | |
| | 9,158 | | Newmont Mining Corp. | | | 290,950 | |
| | | | | | | | |
| | | | Miscellaneous Manufacturing - 1.18% | | | | |
| | 7,300 | | General Electric Co. | | | 168,922 | |
| | | | | | | | |
| | | | Office & Business Equipment - 1.02% | | | | |
| | 14,634 | | Xerox Corp. | | | 146,047 | |
| | | | | | | | |
| | | | Oil & Gas - 4.57% | | | | |
| | 2,200 | | ConocoPhillips | | | 145,860 | |
| | 2,683 | | Diamond Offshore Drilling, Inc. | | | 171,792 | |
| | 9,517 | | Rowan Cos., PLC (a) | | | 337,092 | |
| | | | | | | 654,744 | |
| | | | Oil & Gas Services - 2.11% | | | | |
| | 6,513 | | Baker Hughes, Inc. | | | 302,789 | |
| | | | | | | | |
| | | | Retail - 10.15% | | | | |
| | 5,607 | | CVS Caremark Corp. | | | 325,486 | |
| | 6,258 | | Darden Restaurants, Inc. | | | 289,182 | |
| | 8,423 | | GameStop Corp. - Class A | | | 422,919 | |
| | 2,000 | | Kohl's Corp. | | | 102,620 | |
| | 10,382 | | RadioShack Corp. (a) (d) | | | 33,949 | |
| | 3,848 | | Wal-Mart Stores, Inc. | | | 280,827 | |
| | | | | | | 1,454,983 | |
| | | | Savings & Loans - 1.22% | | | | |
| | 19,082 | | Hudson City Bancorp, Inc. | | | 175,364 | |
The accompanying notes are an integral part of the financial statements.
MONTEAGLE SELECT VALUE FUND SCHEDULE OF INVESTMENTS — August 31, 2013 (Continued) |
| | COMMON STOCKS - 92.85% (Continued) | | | |
| | | Semiconductors - 8.80% | | | |
| | 22,477 | | Applied Materials, Inc. | | $ | 337,380 | |
| | 15,094 | | First Solar, Inc. (a) | | | 554,252 | |
| | 16,833 | | Intel Corp. | | | 369,989 | |
| | | | | | | 1,261,621 | |
| | | | Software - 2.82% | | | | |
| | 12,103 | | Microsoft Corp. | | | 404,240 | |
| | | | | | | | |
| | | | Telecommunications - 1.88% | | | | |
| | 4,000 | | AT&T, Inc. | | | 135,320 | |
| | 9,571 | | Corning, Inc. | | | 134,377 | |
| | | | | | | 269,697 | |
| | | | Transportation - 1.06% | | | | |
| | 2,100 | | Norfolk Southern Corp. | | | 151,536 | |
| | | | | | | | |
| | | | Total Common Stocks (Cost $10,884,960) | | | 13,314,511 | |
| | MONEY MARKET FUND - 10.10% | | | |
| | 1,447,402 | | Fidelity Institutional Money Market Fund Class I, 0.09% (b) (c) (Cost $1,447,402) | | $ | 1,447,402 | |
| | | | | | | | |
| | | | Total Investments at Fair Value - 102.95% (Cost $12,332,362) | | $ | 14,761,913 | |
| | | | | | | | |
| | | | Liabilities in Excess of Other Assets, Net - (2.95%) | | | (422,631 | ) |
| | | | | | | | |
| | | | Net Assets - 100.00% | | $ | 14,339,282 | |
| (a) | Non-income producing security. |
| (b) | Rate shown represents the 7-day yield at August 31, 2013, is subject to change and resets daily. |
| (c) | A portion of this security is segregated as collateral for securities on loan August 31, 2013. Total collateral had a fair value of $444,856 at August 31, 2013. |
| (d) | Security, or a portion of the security, is out on loan at August 31, 2013. Total loaned securities had a fair value of $428,872 at August 31, 2013. |
The accompanying notes are an integral part of the financial statements.
MONTEAGLE VALUE FUND SCHEDULE OF INVESTMENTS — August 31, 2013 |
| | COMMON STOCKS - 92.10% (Continued) | | | |
| | | Aerospace & Defense - 2.93% | | | |
| | 6,300 | | Raytheon Co. | | $ | 475,083 | |
| | | | | | | | |
| | | | Chemicals - 13.06% | | | | |
| | 23,000 | | Chemtura Corp. (a) | | | 504,160 | |
| | 8,880 | | Eastman Chemical Co. | | | 674,880 | |
| | 10,750 | | EI du Pont de Nemours & Co. | | | 608,665 | |
| | 18,800 | | Huntsman Corp. | | | 329,000 | |
| | | | | | | 2,116,705 | |
| | | | Computers - 1.53% | | | | |
| | 18,000 | | Dell, Inc. | | | 247,860 | |
| | | | | | | | |
| | | | Distribution & Wholesale - 0.18% | | | | |
| | 5,877 | | Wolseley PLC | | | 29,914 | |
| | | | | | | | |
| | | | Electric - 5.23% | | | | |
| | 8,516 | | Duke Energy Corp. | | | 558,650 | |
| | 11,000 | | NRG Energy, Inc. | | | 288,750 | |
| | | | | | | 847,400 | |
| | | | Electronics - 1.98% | | | | |
| | 21,000 | | Schneider Electric SA - ADR | | | 320,355 | |
| | | | | | | | |
| | | | Environmental Control - 1.80% | | | | |
| | 17,000 | | Calgon Carbon Corp. (a) | | | 292,400 | |
| | | | | | | | |
| | | | Food - 2.81% | | | | |
| | 10,000 | | Cal-Maine Foods, Inc. | | | 456,300 | |
| | | | | | | | |
| | | | Forest Products & Paper - 4.08% | | | | |
| | 14,000 | | International Paper Co. | | | 660,940 | |
| | | | | | | | |
| | | | Healthcare - Products - 7.16% | | | | |
| | 32,000 | | Boston Scientific Corp. (a) | | | 338,560 | |
| | 6,800 | | Medtronic, Inc. | | | 351,900 | |
| | 20,000 | | NuVasive, Inc. (a) | | | 470,400 | |
| | | | | | | 1,160,860 | |
| | | | Investment Companies - 1.23% | | | | |
| | 5,100 | | Macquarie Group Ltd. - ADR | | | 198,543 | |
| | | | | | | | |
| | | | Iron & Steel - 2.10% | | | | |
| | 7,500 | | Nucor Corp. | | | 341,175 | |
| | | | | | | | |
| | | | Metal Fabricate & Hardware - 2.47% | | | | |
| | 12,000 | | Worthington Industries, Inc. | | | 399,960 | |
The accompanying notes are an integral part of the financial statements.
MONTEAGLE VALUE FUND SCHEDULE OF INVESTMENTS — August 31, 2013 (Continued) |
| | COMMON STOCKS - 92.10% (Continued) | | | |
| | | Mining - 2.66% | | | |
| | 10,000 | | Barrick Gold Corp. | | $ | 191,500 | |
| | 5,000 | | Vulcan Materials Co. | | | 239,000 | |
| | | | | | | 430,500 | |
| | | | Miscellaneous Manufacturing - 5.68% | | | | |
| | 9,300 | | American Railcar Industries, Inc. | | | 328,941 | |
| | 22,000 | | Textron, Inc. | | | 592,680 | |
| | | | | | | 921,621 | |
| | | | Oil & Gas - 6.72% | | | | |
| | 7,600 | | HollyFrontier Corp. | | | 338,048 | |
| | 12,000 | | Marathon Oil Corp. | | | 413,160 | |
| | 7,494 | | Transocean Ltd. | | | 338,204 | |
| | | | | | | 1,089,412 | |
| | | | Oil & Gas Services - 4.56% | | | | |
| | 10,000 | | Halliburton Co. (d) | | | 480,000 | |
| | 9,000 | | Steel Excel, Inc. (a) | | | 258,750 | |
| | | | | | | 738,750 | |
| | | | Packaging & Containers - 2.16% | | | | |
| | 9,400 | | Sonoco Products Co. | | | 349,962 | |
| | | | | | | | |
| | | | Pharmaceuticals - 7.28% | | | | |
| | 10,000 | | Bristol-Myers Squibb Co. | | | 416,900 | |
| | 16,147 | | Merck & Co, Inc. | | | 763,592 | |
| | | | | | | 1,180,492 | |
| | | | Retail - 0.00% | | | | |
| | 225 | | Orchard Supply Hardware Stores Corp. - Class A (a) (d) | | | 101 | |
| | | | | | | | |
| | | | Semiconductors - 2.30% | | | | |
| | 17,000 | | Intel Corp. | | | 373,660 | |
| | | | | | | | |
| | | | Telecommunications - 12.51% | | | | |
| | 20,000 | | AT&T, Inc. | | | 676,600 | |
| | 31,000 | | FIH Mobile Ltd. - ADR (a) | | | 398,350 | |
| | 9,700 | | Rogers Communications, Inc. - Class B | | | 384,120 | |
| | 12,000 | | Verizon Communications, Inc. | | | 568,560 | |
| | | | | | | 2,027,630 | |
| | | | Transportation - 1.67% | | | | |
| | 11,000 | | CSX Corp. | | | 270,710 | |
| | | | | | | | |
| | | | Total Common Stocks (Cost $10,674,446) | | | 14,930,333 | |
The accompanying notes are an integral part of the financial statements.
MONTEAGLE VALUE FUND SCHEDULE OF INVESTMENTS — August 31 2013 (Continued) |
| | | | | |
| | | Retail - 0.00% | | | |
| | 225 | | Orchard Supply Hardware Stores Corp. (a) (d) | | $ | 15 | |
| | | | | | | | |
| | | | Total Preferred Stocks (Cost $985) | | | 15 | |
| | MONEY MARKET FUND - 10.78% | | | |
| | 1,747,149 | | Fidelity Institutional Money Market Fund Class I, 0.09% (b) (c) (Cost $1,747,149) | | $ | 1,747,149 | |
| | | | | | | | |
| | | | Total Investments at Fair Value - 102.88% (Cost $12,422,580) | | $ | 16,677,497 | |
| | | | | | | | |
| | | | Liabilities in Excess of Other Assets, Net - (2.88%) | | | (467,118 | ) |
| | | | | | | | |
| | | | Net Assets - 100.00% | | $ | 16,210,379 | |
| (a) | Non-income producing security. |
| (b) | Rate shown represents the 7-day yield at August 31, 2013, is subject to change and resets daily. |
| (c) | A portion of this security is segregated as collateral for securities on loan at August 31, 2013. Total collateral had a fair value of $485,266 at August 31, 2013. |
| (d) | Security, or a portion of the security is out on loan at August 31, 2013. Total loaned securities had a fair value of $470,458 at August 31, 2013. |
ADR - American Depositary Receipt
PLC - Public Limited Company
The accompanying notes are an integral part of the financial statements.
MONTEAGLE FUNDS STATEMENTS OF ASSETS AND LIABILITIES — August 31, 2013 |
| | | | | Informed Investor Growth Fund | | | | |
| ASSETS | | | | | | | | | |
| Investment securities | | | | | | | | | |
| At cost | | $ | 41,431,087 | | | $ | 12,168,361 | | | $ | 20,009,641 | |
| At fair value (Note 2) | | $ | 41,265,758 | | | $ | 13,495,399 | | | $ | 25,548,424 | |
| Receivables: | | | | | | | | | | | | |
| Dividends and interest | | | 277,160 | | | | 7,756 | | | | 35,853 | |
| Capital shares sold | | | — | | | | 100 | | | | — | |
| Investment securities sold | | | 786,006 | | | | 309,243 | | | | — | |
| Other assets | | | 332 | | | | 332 | | | | 332 | |
| Total assets | | | 42,329,256 | | | | 13,812,830 | | | | 25,584,609 | |
| | | | | | | | | | | | | |
| LIABILITIES | | | | | | | | | | | | |
| Payables: | | | | | | | | | | | | |
| Capital shares redeemed | | | 1,500 | | | | — | | | | — | |
| Distributions | | | 5,293 | | | | — | | | | — | |
| Investment securities purchased | | | 2,900,250 | | | | 492,351 | | | | — | |
| Due to Adviser (Note 3) | | | 32,540 | | | | 13,674 | | | | 29,561 | |
| Accrued compliance service fees (Note 3) | | | 2,131 | | | | 1,001 | | | | 1,683 | |
| Payable to Trustees | | | 600 | | | | 600 | | | | 600 | |
| Total liabilities | | | 2,942,314 | | | | 507,626 | | | | 31,844 | |
| | | | | | | | | | | | | |
| NET ASSETS | | $ | 39,386,942 | | | $ | 13,305,204 | | | $ | 25,552,765 | |
| | | | | | | | | | | | | |
| NET ASSETS CONSIST OF: | | | | | | | | | | | | |
| Paid-in capital | | $ | 40,002,709 | | | $ | 11,234,378 | | | $ | 23,967,256 | |
| Accumulated undistributed net investment income | | | 1,801 | | | | — | | | | 15,199 | |
| Accumulated net realized gain (loss) on investments | | | (452,239 | ) | | | 743,788 | | | | (3,968,473 | ) |
| Net unrealized appreciation (depreciation) on investments | | | (165,329 | ) | | | 1,327,038 | | | | 5,538,783 | |
| NET ASSETS | | $ | 39,386,942 | | | $ | 13,305,204 | | | $ | 25,552,765 | |
| | | | | | | | | | | | | |
Shares of beneficial interest outstanding (1) | | | 3,843,858 | | | | 1,132,036 | | | | 2,399,599 | |
| Net Asset Value, offering and redemption price per share | | $ | 10.25 | | | $ | 11.75 | | | $ | 10.65 | |
| (1) | Unlimited number of shares of beneficial interest with no par value, authorized. |
The accompanying notes are an integral part of the financial statements.
MONTEAGLE FUNDS STATEMENTS OF ASSETS AND LIABILITIES — August 31, 2013 |
| | | | | | |
| ASSETS | | | | | | |
| Investment securities | | | | | | |
| At cost | | $ | 12,332,362 | | | $ | 12,422,580 | |
| At fair value - including $428,872 and $470,458 of securities loaned, respectively (Note 2) | | $ | 14,761,913 | | | $ | 16,677,497 | |
| Receivables: | | | | | | | | |
| Dividends and interest | | | 38,573 | | | | 36,370 | |
| Other assets | | | 332 | | | | 332 | |
| Total assets | | | 14,800,818 | | | | 16,714,199 | |
| | | | | | | | | |
| LIABILITIES | | | | | | | | |
| Payables: | | | | | | | | |
| Securities Loan Payable (Note 2) | | | 444,856 | | | | 485,266 | |
| Due to Adviser (Note 3) | | | 15,022 | | | | 16,820 | |
| Accrued compliance service fees (Note 3) | | | 1,058 | | | | 1,134 | |
| Payable to Trustees | | | 600 | | | | 600 | |
| Total liabilities | | | 461,536 | | | | 503,820 | |
| | | | | | | | | |
| NET ASSETS | | $ | 14,339,282 | | | $ | 16,210,379 | |
| | | | | | | | | |
| NET ASSETS CONSIST OF: | | | | | | | | |
| Paid-in capital | | $ | 12,076,458 | | | $ | 11,930,635 | |
| Accumulated undistributed net investment income | | | 18,732 | | | | 26,077 | |
| Accumulated net realized loss on investments | | | (185,459 | ) | | | (1,250 | ) |
| Net unrealized appreciation on investments | | | 2,429,551 | | | | 4,254,917 | |
| NET ASSETS | | $ | 14,339,282 | | | $ | 16,210,379 | |
| | | | | | | | | |
Shares of beneficial interest outstanding (1) | | | 951,408 | | | | 1,068,734 | |
| Net Asset Value, offering and redemption price per share | | $ | 15.07 | | | $ | 15.17 | |
| (1) | Unlimited number of shares of beneficial interest with no par value, authorized. |
The accompanying notes are an integral part of the financial statements.
MONTEAGLE FUNDS STATEMENTS OF OPERATIONS — For the Year Ended August 31, 2013 |
| | | | | Informed Investor Growth Fund | | | | |
| INVESTMENT INCOME | | | | | | | | | |
| | | | | | | | | | |
| Income: | | | | | | | | | |
| Interest | | $ | 1,035,940 | | | $ | 3,776 | | | $ | 459 | |
| Securities lending | | | — | | | | 11,126 | | | | — | |
| Dividends | | | — | | | | 84,725 | | | | 460,514 | |
| Foreign withholding tax | | | — | | | | (18 | ) | | | — | |
| | | | | | | | | | | | | |
| Total Investment Income | | | 1,035,940 | | | | 99,609 | | | | 460,973 | |
| | | | | | | | | | | | | |
| Expenses: | | | | | | | | | | | | |
| Investment advisory fees (Note 3) | | | 365,536 | | | | 153,956 | | | | 335,111 | |
| Compliance service fees (Note 3) | | | 25,501 | | | | 11,962 | | | | 20,242 | |
| Trustees' fees | | | 7,929 | | | | 7,929 | | | | 7,929 | |
| ICI membership fees | | | 1,449 | | | | 1,449 | | | | 1,455 | |
| | | | | | | | | | | | | |
| Total expenses | | | 400,415 | | | | 175,296 | | | | 364,737 | |
| | | | | | | | | | | | | |
| Net investment income (loss) | | | 635,525 | | | | (75,687 | ) | | | 96,236 | |
| | | | | | | | | | | | | |
| REALIZED AND UNREALIZED GAIN (LOSS) ON INVESTMENTS | | | | | | | | | | | | |
| | | | | | | | | | | | | |
| Net realized gain from investments | | | 126,947 | | | | 1,027,632 | | | | 2,858,714 | |
| Net change in unrealized appreciation (depreciation) on investments | | | (2,192,975 | ) | | | 102,561 | | | | (836,717 | ) |
| | | | | | | | | | | | | |
| Net realized and unrealized gain (loss) on investments | | | (2,066,028 | ) | | | 1,130,193 | | | | 2,021,997 | |
| | | | | | | | | | | | | |
| Net increase (decrease) in net assets resulting from operations | | $ | (1,430,503 | ) | | $ | 1,054,506 | | | $ | 2,118,233 | |
The accompanying notes are an integral part of the financial statements.
MONTEAGLE FUNDS STATEMENTS OF OPERATIONS — For the Year Ended August 31, 2013 |
| | | | | | |
| INVESTMENT INCOME | | | | | | |
| | | | | | | |
| Income: | | | | | | |
| Interest | | $ | 1,650 | | | $ | 690 | |
| Securities lending | | | 19,644 | | | | 18,692 | |
| Dividends | | | 274,459 | | | | 378,360 | |
| Foreign withholding tax | | | — | | | | (3,684 | ) |
| | | | | | | | | |
| Total Investment Income | | | 295,753 | | | | 394,058 | |
| | | | | | | | | |
| Expenses: | | | | | | | | |
| Investment advisory fees (Note 3) | | | 145,853 | | | | 182,985 | |
| Compliance service fees (Note 3) | | | 11,563 | | | | 13,258 | |
| Legal fees | | | — | | | | 2,212 | |
| Trustees' fees | | | 7,929 | | | | 7,929 | |
| ICI membership fees | | | 1,449 | | | | 1,449 | |
| | | | | | | | | |
| Total expenses | | | 166,794 | | | | 207,833 | |
| | | | | | | | | |
| Net investment income | | | 128,959 | | | | 186,225 | |
| | | | | | | | | |
| REALIZED AND UNREALIZED GAIN ON INVESTMENTS | | | | | | | | |
| | | | | | | | | |
| Net realized gain from investments | | | 1,107,026 | | | | 316,731 | |
| Net change in unrealized appreciation on investments | | | 2,691,912 | | | | 2,034,221 | |
| | | | | | | | | |
| Net realized and unrealized gain on investments | | | 3,798,938 | | | | 2,350,952 | |
| | | | | | | | | |
| Net increase in net assets resulting from operations | | $ | 3,927,897 | | | $ | 2,537,177 | |
The accompanying notes are an integral part of the financial statements.
MONTEAGLE FIXED INCOME FUND STATEMENTS OF CHANGES IN NET ASSETS |
| | | | | | |
| INCREASE (DECREASE) IN NET ASSETS | | | | | | |
| FROM OPERATIONS | | | | | | |
| Net investment income | | $ | 635,525 | | | $ | 833,906 | |
| Net realized gain on investment transactions | | | 126,947 | | | | 669,697 | |
| Net change in unrealized depreciation on investments | | | (2,192,975 | ) | | | (333,153 | ) |
| Net increase (decrease) in net assets resulting from operations | | $ | (1,430,503 | ) | | $ | 1,170,450 | |
| | | | | | | | | |
| FROM DISTRIBUTIONS TO SHAREHOLDERS | | | | | | | | |
| From net investment income - Class I | | | (661,784 | ) | | | (844,692 | ) |
| From net investment income - Class A | | | — | | | | (31 | ) |
| From net investment income - Class C | | | — | | | | (44 | ) |
| Net decrease in net assets from distributions to shareholders | | | (661,784 | ) | | | (844,767 | ) |
| | | | | | | | | |
| FROM CAPITAL SHARE TRANSACTIONS | | | | | | | | |
| Net increase in net assets from capital share transactions (Note 7) | | | 5,582,751 | | | | 3,676,210 | |
| | | | | | | | | |
| Total increase in net assets | | | 3,490,464 | | | | 4,001,893 | |
| | | | | | | | | |
| NET ASSETS | | | | | | | | |
| Beginning of period | | | 35,896,478 | | | | 31,894,585 | |
| End of period | | $ | 39,386,942 | | | $ | 35,896,478 | |
| ACCUMULATED UNDISTRIBUTED NET INVESTMENT INCOME | | $ | 1,801 | | | $ | 562 | |
The accompanying notes are an integral part of the financial statements.
MONTEAGLE INFORMED INVESTOR GROWTH FUND STATEMENTS OF CHANGES IN NET ASSETS |
| | | | | | |
| INCREASE (DECREASE) IN NET ASSETS | | | | | | |
| FROM OPERATIONS | | | | | | |
| Net investment loss | | $ | (75,687 | ) | | $ | (137,216 | ) |
| Net realized gain on investment transactions | | | 1,027,632 | | | | 1,370,176 | |
| Net change in unrealized appreciation on investments | | | 102,561 | | | | 652,581 | |
| Net increase in net assets resulting from operations | | $ | 1,054,506 | | | $ | 1,885,541 | |
| | | | | | | | | |
| FROM DISTRIBUTIONS TO SHAREHOLDERS | | | | | | | | |
| From net realized capital gains - Class I | | | (1,021,556 | ) | | | (490,854 | ) |
| From net realized capital gains - Class A | | | — | | | | (39 | ) |
| From net realized capital gains - Class C | | | — | | | | (2,847 | ) |
| Net decrease in net assets from distributions to shareholders | | | (1,021,556 | ) | | | (493,740 | ) |
| | | | | | | | | |
| FROM CAPITAL SHARE TRANSACTIONS | | | | | | | | |
| Net decrease in net assets from capital share transactions (Note 7) | | | (468,751 | ) | | | (5,690,689 | ) |
| | | | | | | | | |
| Total decrease in net assets | | | (435,801 | ) | | | (4,298,888 | ) |
| | | | | | | | | |
| NET ASSETS | | | | | | | | |
| Beginning of period | | | 13,741,005 | | | | 18,039,893 | |
| End of period | | $ | 13,305,204 | | | $ | 13,741,005 | |
| ACCUMULATED UNDISTRIBUTED NET INVESTMENT INCOME | | $ | — | | | $ | — | |
The accompanying notes are an integral part of the financial statements.
MONTEAGLE QUALITY GROWTH FUND STATEMENTS OF CHANGES IN NET ASSETS |
| | | | | | |
| INCREASE (DECREASE) IN NET ASSETS | | | | | | |
| FROM OPERATIONS | | | | | | |
| Net investment income | | $ | 96,236 | | | $ | 68,393 | |
| Net realized gain on investment transactions | | | 2,858,714 | | | | 678,424 | |
| Net change in unrealized appreciation (depreciation) on investments | | | (836,717 | ) | | | 2,938,380 | |
| Net increase in net assets resulting from operations | | $ | 2,118,233 | | | $ | 3,685,197 | |
| | | | | | | | | |
| FROM DISTRIBUTIONS TO SHAREHOLDERS | | | | | | | | |
| From net investment income - Class I | | | (149,428 | ) | | | (4,552 | ) |
| | | | | | | | | |
| FROM CAPITAL SHARE TRANSACTIONS | | | | | | | | |
| Net increase (decrease) in net assets from capital share transactions (Note 7) | | | (4,641,093 | ) | | | 1,777,005 | |
| | | | | | | | | |
| Total increase (decrease) in net assets | | | (2,672,288 | ) | | | 5,457,650 | |
| | | | | | | | | |
| NET ASSETS | | | | | | | | |
| Beginning of period | | | 28,225,053 | | | | 22,767,403 | |
| End of period | | $ | 25,552,765 | | | $ | 28,225,053 | |
| ACCUMULATED UNDISTRIBUTED NET INVESTMENT INCOME | | $ | 15,199 | | | $ | 68,391 | |
The accompanying notes are an integral part of the financial statements.
MONTEAGLE SELECT VALUE FUND STATEMENTS OF CHANGES IN NET ASSETS |
| | | | | | |
| INCREASE (DECREASE) IN NET ASSETS | | | | | | |
| FROM OPERATIONS | | | | | | |
| Net investment income | | $ | 128,959 | | | $ | 121,855 | |
| Net realized gain on investment transactions | | | 1,107,026 | | | | 329,196 | |
| Net change in unrealized appreciation on investments | | | 2,691,912 | | | | 397,830 | |
| Net increase in net assets resulting from operations | | $ | 3,927,897 | | | $ | 848,881 | |
| | | | | | | | | |
| FROM DISTRIBUTIONS TO SHAREHOLDERS | | | | | | | | |
| From net investment income - Class I | | | (136,109 | ) | | | (111,869 | ) |
| From net investment income - Class A | | | — | | | | (9 | ) |
| From net investment income - Class C | | | — | | | | (2 | ) |
| Net decrease in net assets from distributions to shareholders | | | (136,109 | ) | | | (111,880 | ) |
| | | | | | | | | |
| FROM CAPITAL SHARE TRANSACTIONS | | | | | | | | |
| Net increase (decrease) in net assets from capital share transactions (Note 7) | | | 370,567 | | | | (355,655 | ) |
| | | | | | | | | |
| Total increase in net assets | | | 4,162,355 | | | | 381,346 | |
| | | | | | | | | |
| NET ASSETS | | | | | | | | |
| Beginning of period | | | 10,176,927 | | | | 9,795,581 | |
| End of period | | $ | 14,339,282 | | | $ | 10,176,927 | |
| ACCUMULATED UNDISTRIBUTED NET INVESTMENT INCOME | | $ | 18,732 | | | $ | 25,882 | |
The accompanying notes are an integral part of the financial statements.
MONTEAGLE VALUE FUND STATEMENTS OF CHANGES IN NET ASSETS |
| | | | | | |
| INCREASE (DECREASE) IN NET ASSETS | | | | | | |
| FROM OPERATIONS | | | | | | |
| Net investment income | | $ | 186,225 | | | $ | 183,389 | |
| Net realized gain on investment transactions | | | 316,731 | | | | 37,827 | |
| Net change in unrealized appreciation on investments | | | 2,034,221 | | | | 914,936 | |
| Net increase in net assets resulting from operations | | $ | 2,537,177 | | | $ | 1,136,152 | |
| | | | | | | | | |
| FROM DISTRIBUTIONS TO SHAREHOLDERS | | | | | | | | |
| From net investment income - Class I | | | (191,952 | ) | | | (174,916 | ) |
| From net investment income - Class A | | | — | | | | (11 | ) |
| From net investment income - Class C | | | — | | | | (4 | ) |
| From net realized capital gains - Class I | | | (355,557 | ) | | | (2,749,677 | ) |
| From net realized capital gains - Class A | | | — | | | | (226 | ) |
| From net realized capital gains - Class C | | | — | | | | (223 | ) |
| Decrease in net assets from distributions to shareholders | | | (547,509 | ) | | | (2,925,057 | ) |
| | | | | | | | | |
| FROM CAPITAL SHARE TRANSACTIONS | | | | | | | | |
| Net increase (decrease) in net assets from capital share transactions (Note 7) | | | (124,917 | ) | | | 1,915,758 | |
| | | | | | | | | |
| Total increase in net assets | | | 1,864,751 | | | | 126,853 | |
| | | | | | | | | |
| NET ASSETS | | | | | | | | |
| Beginning of period | | | 14,345,628 | | | | 14,218,775 | |
| End of period | | $ | 16,210,379 | | | $ | 14,345,628 | |
| ACCUMULATED UNDISTRIBUTED NET INVESTMENT INCOME | | $ | 26,077 | | | $ | 31,804 | |
The accompanying notes are an integral part of the financial statements.
MONTEAGLE FIXED INCOME FUND FINANCIAL HIGHLIGHTS |
| For a Share Outstanding Throughout each Year | |
| | | | | | | | | | | | | | | |
| Net asset value, beginning of year/period | | $ | 10.80 | | | $ | 10.70 | | | $ | 10.71 | | | $ | 10.34 | | | $ | 10.05 | |
| Income (loss) from investment operations: | | | | | | | | | | | | | | | | | | | | |
| Net investment income | | | 0.19 | | | | 0.27 | | | | 0.32 | | | | 0.35 | | | | 0.38 | |
| Net realized and unrealized gain (loss) on investments | | | (0.55 | ) | | | 0.10 | | | | (0.01 | ) | | | 0.37 | | | | 0.29 | |
| Total from investment operations | | | (0.36 | ) | | | 0.37 | | | | 0.31 | | | | 0.72 | | | | 0.67 | |
| | | | | | | | | | | | | | | | | | | | | |
| Less distributions: | | | | | | | | | | | | | | | | | | | | |
| From net investment income | | | (0.19 | ) | | | (0.27 | ) | | | (0.32 | ) | | | (0.35 | ) | | | (0.38 | ) |
| Total distributions | | | (0.19 | ) | | | (0.27 | ) | | | (0.32 | ) | | | (0.35 | ) | | | (0.38 | ) |
| | | | | | | | | | | | | | | | | | | | | |
| Net asset value, end of year/period | | $ | 10.25 | | | $ | 10.80 | | | $ | 10.70 | | | $ | 10.71 | | | $ | 10.34 | |
| | | | | | | | | | | | | | | | | | | | | |
Total Return (a) | | | (3.41 | %) | | | 3.48 | % | | | 2.97 | % | | | 7.11 | % | | | 6.80 | % |
| | | | | | | | | | | | | | | | | | | | | |
| Net assets, end of year/period (000's omitted) | | $ | 39,387 | | | $ | 35,896 | | | $ | 31,892 | | | $ | 34,911 | | | $ | 32,125 | |
| | | | | | | | | | | | | | | | | | | | | |
| Ratio of operating expenses to average net assets: | | | 1.06 | % | | | 1.09 | % | | | 1.07 | % | | | 1.04 | % | | | 1.04 | % |
| | | | | | | | | | | | | | | | | | | | | |
| Ratio of net investment income to average net assets: | | | 1.68 | % | | | 2.46 | % | | | 2.93 | % | | | 3.37 | % | | | 3.74 | % |
| | | | | | | | | | | | | | | | | | | | | |
| Portfolio turnover rate | | | 22 | % | | | 23 | % | | | 14 | % | | | 18 | % | | | 39 | % |
| (a) | Total return is a measure of the change in value of an investment in the Fund over the periods covered, which assumes any dividends or capital gains distributions are reinvested in shares of the Fund. Returns do not reflect the deduction of taxes a shareholder would pay on Fund distributions or the redemption of Fund shares. |
The accompanying notes are an integral part of the financial statements.
MONTEAGLE INFORMED INVESTOR GROWTH FUND FINANCIAL HIGHLIGHTS |
| For a Share Outstanding Throughout each Year | |
| | | | | | | | | | | | | | | |
| Net asset value, beginning of year/period | | $ | 11.71 | | | $ | 10.62 | | | $ | 10.48 | | | $ | 12.89 | | | $ | 8.82 | |
| Income (loss) from investment operations: | | | | | | | | | | | | | | | | | | | | |
Net investment loss (a) | | | (0.07 | ) | | | (0.06 | ) | | | (0.06 | ) | | | (0.10 | ) | | | (0.05 | ) |
| Net realized and unrealized gain (loss) on investments | | | 1.00 | | | | 1.55 | | | | 1.90 | | | | (0.18 | ) | | | 4.12 | |
| Total from investment operations | | | 0.93 | | | | 1.49 | | | | 1.84 | | | | (0.28 | ) | | | 4.07 | |
| | | | | | | | | | | | | | | | | | | | | |
| Less distributions: | | | | | | | | | | | | | | | | | | | | |
| From net realized capital gains | | | (0.89 | ) | | | (0.40 | ) | | | (1.70 | ) | | | (2.13 | ) | | | — | |
| | | | | | | | | | | | | | | | | | | | | |
| Net asset value, end of year/period | | $ | 11.75 | | | $ | 11.71 | | | $ | 10.62 | | | $ | 10.48 | | | $ | 12.89 | |
| | | | | | | | | | | | | | | | | | | | | |
Total Return (b) | | | 9.03 | % | | | 14.81 | % | | | 15.35 | % | | | (4.43 | %) | | | 46.15 | % |
| | | | | | | | | | | | | | | | | | | | | |
| Net assets, end of year/period (000's omitted) | | $ | 13,305 | | | $ | 13,741 | | | $ | 17,784 | | | $ | 17,717 | | | $ | 27,680 | |
| | | | | | | | | | | | | | | | | | | | | |
Ratio of operating expenses to average net assets: (c) | | | 1.37 | % | | | 1.34 | % | | | 1.33 | % | | | 1.28 | % | | | 1.27 | % |
| | | | | | | | | | | | | | | | | | | | | |
Ratio of net investment loss to average net assets: (a) | | | (0.59 | %) | | | (0.94 | %) | | | (0.53 | %) | | | (0.96 | %) | | | (0.77 | %) |
| | | | | | | | | | | | | | | | | | | | | |
| Portfolio turnover rate | | | 641 | % | | | 795 | % | | | 755 | % | | | 819 | % | | | 1592 | % |
| (a) | Recognition of net investment income (loss) by the Fund is affected by the declaration of dividends by the underlying investment companies in which the Fund invests. |
| (b) | Total return is a measure of the change in value of an investment in the Fund over the periods covered, which assumes any dividends or capital gains distributions are reinvested in shares of the Fund. Returns do not reflect the deduction of taxes a shareholder would pay on Fund distributions or the redemption of Fund shares. |
| (c) | The ratios of expenses to average net assets do not reflect the Fund’s proportionate share of income and expenses of underlying investment companies in which the Fund invests. |
The accompanying notes are an integral part of the financial statements.
MONTEAGLE QUALITY GROWTH FUND FINANCIAL HIGHLIGHTS |
| For a Share Outstanding Throughout each Year | |
| | | | | | | | | | | | | | | |
| Net asset value, beginning of period | | $ | 9.95 | | | $ | 8.71 | | | $ | 7.14 | | | $ | 6.85 | | | $ | 8.46 | |
| Income (loss) from investment operations: | | | | | | | | | | | | | | | | | | | | |
| Net investment income (loss) | | | 0.04 | | | | 0.02 | | | | — | (a) | | | — | (a) | | | 0.02 | |
| Net realized and unrealized gain (loss) on investments | | | 0.72 | | | | 1.22 | | | | 1.57 | | | | 0.30 | | | | (1.62 | ) |
| Total from investment operations | | | 0.76 | | | | 1.24 | | | | 1.57 | | | | 0.30 | | | | (1.60 | ) |
| | | | | | | | | | | | | | | | | | | | | |
| Less distributions: | | | | | | | | | | | | | | | | | | | | |
| From net investment income | | | (0.06 | ) | | | — | (b) | | | — | (b) | | | (0.01 | ) | | | (0.01 | ) |
| | | | | | | | | | | | | | | | | | | | | |
| Net asset value, end of period | | $ | 10.65 | | | $ | 9.95 | | | $ | 8.71 | | | $ | 7.14 | | | $ | 6.85 | |
| | | | | | | | | | | | | | | | | | | | | |
Total Return (c) | | | 7.62 | % | | | 14.26 | % | | | 22.02 | % | | | 4.41 | % | | | (18.92 | %) |
| | | | | | | | | | | | | | | | | | | | | |
| Net assets, end of period (000's omitted) | | $ | 25,553 | | | $ | 28,225 | | | $ | 22,765 | | | $ | 22,449 | | | $ | 11,196 | |
| | | | | | | | | | | | | | | | | | | | | |
| Ratio of operating expenses to average net assets: | | | 1.30 | % | | | 1.33 | % | | | 1.32 | % | | | 1.29 | % | | | 1.32 | % |
| | | | | | | | | | | | | | | | | | | | | |
| Ratio of net investment income (loss) to average net assets: | | | 0.34 | % | | | 0.26 | % | | | 0.02 | % | | | 0.05 | % | | | 0.31 | % |
| | | | | | | | | | | | | | | | | | | | | |
| Portfolio turnover rate | | | 50 | % | | | 54 | % | | | 62 | % | | | 69 | % | | | 39 | % |
| (a) | Net investment income (loss) per share resulted in less than $0.01 per share. |
| (b) | Distributions per share were $(0.0016) for the year ended August 31, 2012 and $(0.0025) for the year ended August 31, 2011. |
| (c) | Total return is a measure of the change in value of an investment in the Fund over the periods covered, which assumes any dividends or capital gains distributions are reinvested in shares of the Fund. Returns do not reflect the deduction of taxes a shareholder would pay on Fund distributions or the redemption of Fund shares. |
The accompanying notes are an integral part of the financial statements.
MONTEAGLE SELECT VALUE FUND FINANCIAL HIGHLIGHTS |
| For a Share Outstanding Throughout each Year | |
| | | | | | | | | | | | | | | |
| Net asset value, beginning of period | | $ | 10.95 | | | $ | 10.16 | | | $ | 8.78 | | | $ | 8.30 | | | $ | 11.63 | |
| Income (loss) from investment operations: | | | | | | | | | | | | | | | | | | | | |
| Net investment income | | | 0.14 | | | | 0.13 | | | | 0.04 | | | | 0.01 | | | | 0.07 | |
| Net realized and unrealized gain (loss) on investments | | | 4.13 | | | | 0.78 | | | | 1.37 | | | | 0.48 | | | | (3.30 | ) |
| Total from investment operations | | | 4.27 | | | | 0.91 | | | | 1.41 | | | | 0.49 | | | | (3.23 | ) |
| | | | | | | | | | | | | | | | | | | | | |
| Less distributions: | | | | | | | | | | | | | | | | | | | | |
| From net investment income | | | (0.15 | ) | | | (0.12 | ) | | | (0.03 | ) | | | (0.01 | ) | | | (0.10 | ) |
| Total distributions | | | (0.15 | ) | | | (0.12 | ) | | | (0.03 | ) | | | (0.01 | ) | | | (0.10 | ) |
| | | | | | | | | | | | | | | | | | | | | |
| Net asset value, end of period | | $ | 15.07 | | | $ | 10.95 | | | $ | 10.16 | | | $ | 8.78 | | | $ | 8.30 | |
| | | | | | | | | | | | | | | | | | | | | |
Total Return (a) | | | 39.26 | % | | | 9.01 | % | | | 15.99 | % | | | 5.99 | % | | | (27.76 | %) |
| | | | | | | | | | | | | | | | | | | | | |
| Net assets, end of period (000's omitted) | | $ | 14,339 | | | $ | 10,177 | | | $ | 9,793 | | | $ | 8,265 | | | $ | 8,312 | |
| | | | | | | | | | | | | | | | | | | | | |
| Ratio of operating expenses to average net assets: | | | 1.37 | % | | | 1.43 | % | | | 1.40 | % | | | 1.37 | % | | | 1.33 | % |
| | | | | | | | | | | | | | | | | | | | | |
| Ratio of net investment income to average net assets: | | | 1.06 | % | | | 1.23 | % | | | 0.35 | % | | | 0.18 | % | | | 0.96 | % |
| | | | | | | | | | | | | | | | | | | | | |
| Portfolio turnover rate | | | 36 | % | | | 8 | % | | | 87 | % | | | 2 | % | | | 108 | % |
| (a) | Total return is a measure of the change in value of an investment in the Fund over the periods covered, which assumes any dividends or capital gains distributions are reinvested in shares of the Fund. Returns do not reflect the deduction of taxes a shareholder would pay on Fund distributions or the redemption of Fund shares. |
The accompanying notes are an integral part of the financial statements.
MONTEAGLE VALUE FUND FINANCIAL HIGHLIGHTS |
| For a Share Outstanding Throughout each Year | |
| | | | | | | | | | | | | | | |
| Net asset value, beginning of period | | $ | 13.31 | | | $ | 15.55 | | | $ | 13.41 | | | $ | 12.34 | | | $ | 16.67 | |
| Income (loss) from investment operations: | | | | | | | | | | | | | | | | | | | | |
| Net investment income | | | 0.17 | | | | 0.18 | | | | 0.14 | | | | 0.11 | | | | 0.13 | |
| Net realized and unrealized gain (loss) on investments | | | 2.20 | | | | 0.78 | | | | 2.13 | | | | 1.09 | | | | (4.35 | ) |
| Total from investment operations | | | 2.37 | | | | 0.96 | | | | 2.27 | | | | 1.20 | | | | (4.22 | ) |
| | | | | | | | | | | | | | | | | | | | | |
| Less distributions: | | | | | | | | | | | | | | | | | | | | |
| From net investment income | | | (0.18 | ) | | | (0.18 | ) | | | (0.13 | ) | | | (0.13 | ) | | | (0.11 | ) |
| From net realized gains on investments | | | (0.33 | ) | | | (3.02 | ) | | | — | | | | — | | | | — | |
| Total distributions | | | (0.51 | ) | | | (3.20 | ) | | | (0.13 | ) | | | (0.13 | ) | | | (0.11 | ) |
| | | | | | | | | | | | | | | | | | | | | |
| Net asset value, end of period | | $ | 15.17 | | | $ | 13.31 | | | $ | 15.55 | | | $ | 13.41 | | | $ | 12.34 | |
| | | | | | | | | | | | | | | | | | | | | |
Total Return (a) | | | 18.32 | % | | | 8.64 | % | | | 16.95 | % | | | 9.72 | % | | | (25.19 | %) |
| | | | | | | | | | | | | | | | | | | | | |
| Net assets, end of period (000's omitted) | | $ | 16,210 | | | $ | 14,346 | | | $ | 14,216 | | | $ | 14,263 | | | $ | 13,645 | |
| | | | | | | | | | | | | | | | | | | | | |
| Ratio of operating expenses to average net assets: | | | 1.36 | % | | | 1.43 | % | | | 1.40 | % | | | 1.32 | % | | | 1.31 | % |
| | | | | | | | | | | | | | | | | | | | | |
| Ratio of net investment income to average net assets: | | | 1.22 | % | | | 1.31 | % | | | 0.84 | % | | | 0.83 | % | | | 1.17 | % |
| | | | | | | | | | | | | | | | | | | | | |
| Portfolio turnover rate | | | 13 | % | | | 27 | % | | | 18 | % | | | 30 | % | | | 6 | % |
| (a) | Total return is a measure of the change in value of an investment in the Fund over the periods covered, which assumes any dividends or capital gains distributions are reinvested in shares of the Fund. Returns do not reflect the deduction of taxes a shareholder would pay on Fund distributions or the redemption of Fund shares. |
The accompanying notes are an integral part of the financial statements.
MONTEAGLE FUNDS NOTES TO FINANCIAL STATEMENTS — August 31, 2013 |
Monteagle Funds (“the Trust”) was organized as a business trust under the laws of the State of Delaware on November 26, 1997 as Memorial Funds. The Trust changed its name to Monteagle Funds in July, 2006.
The Trust is registered with the Securities and Exchange Commission (“SEC”) as an open-end, management investment company under the Investment Company Act of 1940. The Trust is authorized by its Declaration of Trust to issue an unlimited number of shares of beneficial interest in each series. The Trust currently consists of the following series (each a “Fund” and collectively the “Funds”):
| | Monteagle Fixed Income Fund |
| | Monteagle Informed Investor Growth Fund |
| | Monteagle Quality Growth Fund |
| | Monteagle Select Value Fund |
The Monteagle Fixed Income Fund (“Fixed Income Fund”), Monteagle Quality Growth Fund (“Quality Growth Fund”), Monteagle Select Value Fund (“Select Value Fund”) and Monteagle Value Fund (“Value Fund”) are diversified series of Monteagle Funds. The Monteagle Informed Investor Growth Fund (“Informed Investor Growth Fund”) is a non-diversified series of Monteagle Funds. The principal investment objective of the Fixed Income Fund is total return. The principal investment objective of each of Informed Investor Growth Fund, Quality Growth Fund, Select Value Fund and Value Fund (collectively the “Equity Funds”) is long-term capital appreciation.
Prior to July 20, 2012, the Funds were authorized to offer three classes of shares, Class I, Class A and Class C. Each class differed as to sales and redemption charges and ongoing fees. Only the Class I shares are currently being offered for sale.
2. SIGNIFICANT ACCOUNTING POLICIES
The following is a summary of the Funds’ significant accounting policies:
Securities Valuation — Equity securities, including common stocks and exchange-traded funds, held by the Funds for which market quotations are readily available are valued using the last reported sales price or the official closing price provided by independent pricing services as of the close of trading on the New York Stock Exchange (normally 4:00 p.m. Eastern time) on each Fund’s business day. If no sales are reported, the average of the last bid and ask price is used. If no average price is available, the last bid price is used. To the extent these securities are actively traded and valuation adjustments are not applied, they are categorized in level 1 of the fair value hierarchy described below. When an equity security is valued by the independent pricing service using factors other than market quotations or the market is considered inactive, they will be categorized in level 2.
Fixed income securities such as corporate bonds, municipal bonds, and U.S. government and agency obligations, are valued using an independent pricing service that considers market observable data such as reported sales of similar securities, broker quotes, yields, bids, offers, and other reference data. These securities are categorized as level 2 securities. The fair value of mortgage-backed securities is estimated by an independent pricing service which uses models that consider interest
MONTEAGLE FUNDS NOTES TO FINANCIAL STATEMENTS (Continued) |
rate movements, new issue information and other security pertinent data. Evaluations of tranches (non-volatile, volatile, or credit sensitive) are based on interpretations of accepted Wall Street modeling and pricing conventions. Mortgage-backed securities are categorized in level 2 of the fair value hierarchy described below to the extent the inputs are observable and timely. In the absence of readily available market quotations, or other observable inputs, securities are valued at fair value pursuant to procedures adopted by the Board of Trustees and would be categorized as level 3.
Money market funds are valued at their net asset value of $1.00 per share and are categorized as level 1. Securities with maturities of 60 days or less may be valued at amortized cost, which approximates fair value and would be categorized as level 2.
Various inputs are used in determining the value of each of the Fund’s investments. These inputs are summarized in the three broad levels listed below.
| | • | Level 1 – quoted prices in active markets for identical securities |
| | • | Level 2 – other significant observable inputs |
| | • | Level 3 – significant unobservable inputs |
The inputs or methodology used for valuing securities are not necessarily an indication of the risk associated with investing in those securities.
The following is a summary of the inputs used to value the Funds’ investments at fair value as of August 31, 2013:
| Fixed Income Fund | | | | | | | | | |
Security Classification (a) | | | | | Level 2 (Other Significant Observable Inputs) | | | | |
| U.S. Government and Agency Obligations | | $ | — | | | $ | 11,128,489 | | | $ | 11,128,489 | |
| Corporate Bonds | | | — | | | | 23,229,058 | | | | 23,229,058 | |
| Mortgage-Backed Securities | | | — | | | | 2,542,747 | | | | 2,542,747 | |
| Money Market Funds | | | 4,365,464 | | | | — | | | | 4,365,464 | |
| Totals | | $ | 4,365,464 | | | $ | 36,900,294 | | | $ | 41,265,758 | |
| Informed Investor Growth Fund | | | | | | | | | |
Security Classification (a) | | | | | Level 2 (Other Significant Observable Inputs) | | | | |
Common Stocks (b) | | $ | 9,846,583 | | | $ | — | | | $ | 9,846,583 | |
| Exchange-Traded Funds | | | 2,127,711 | | | | — | | | | 2,127,711 | |
| Money Market Funds | | | 1,521,105 | | | | — | | | | 1,521,105 | |
| Totals | | $ | 13,495,399 | | | $ | — | | | $ | 13,495,399 | |
MONTEAGLE FUNDS NOTES TO FINANCIAL STATEMENTS (Continued) |
| Quality Growth Fund | | | | | | | | | |
Security Classification (a) | | | | | Level 2 (Other Significant Observable Inputs) | | | | |
Common Stocks (b) | | $ | 25,090,539 | | | $ | — | | | $ | 25,090,539 | |
| Money Market Funds | | | 457,885 | | | | — | | | | 457,885 | |
| Totals | | $ | 25,548,424 | | | $ | — | | | $ | 25,548,424 | |
| Select Value Fund | | | | | | | | | |
Security Classification (a) | | | | | Level 2 (Other Significant Observable Inputs) | | | | |
Common Stocks (b) | | $ | 13,314,511 | | | $ | — | | | $ | 13,314,511 | |
| Money Market Funds | | | 1,447,402 | | | | — | | | | 1,447,402 | |
| Totals | | $ | 14,761,913 | | | $ | — | | | $ | 14,761,913 | |
| Value Fund | | | | | | | | | |
Security Classification (a) | | | | | Level 2 (Other Significant Observable Inputs) | | | | |
Common Stocks (b) | | $ | 14,930,333 | | | $ | — | | | $ | 14,930,333 | |
| Preferred Stocks | | | 15 | | | | — | | | | 15 | |
| Money Market Funds | | | 1,747,149 | | | | — | | | | 1,747,149 | |
| Totals | | $ | 16,677,497 | | | $ | — | | | $ | 16,677,497 | |
| (a) | As of and during the year ended August 31, 2013, the Funds held no securities that were considered to be “Level 3” securities (those valued using significant unobservable inputs). Therefore, a reconciliation of assets in which significant unobservable inputs (Level 3) were used in determining fair value is not applicable. |
| (b) | All common stocks held in the Funds are Level 1 securities. For a detailed break-out of common stocks by major industry classification, please refer to the Schedules of Investments. |
MONTEAGLE FUNDS NOTES TO FINANCIAL STATEMENTS (Continued) |
The following amounts were transferred in/(out) of Level 1 and Level 2 assets for the Fixed Income Fund:
| | | | | | |
| Transfers into Level 2 from Level 1 | | $ | 6,154,470 | | | $ | 6,154,470 | |
| Transfers into Level 1 from Level 2 | | | — | | | | — | |
| Net Transfers in/(out) of Level 2 | | $ | 6,154,470 | | | $ | 6,154,470 | |
Transfers that were made into Level 2 represent securities being valued using other market observable data in lieu of using market quotations in an active market.
There were no transfers into and out of any Level for the Informed Investor Growth Fund, Quality Growth Fund, Select Value Fund or Value Fund during the year ended August 31, 2013. It is the Funds’ policy to recognize transfers between Levels at the end of the reporting period.
During the year ended August 31, 2013, no securities were fair valued.
Security Loans — The Funds have entered into securities lending agreements with Morgan Stanley & Co., Inc. and MS Securities Services, Inc. The Funds receive compensation in the form of fees, or retain a portion of interest on the investment of any cash received as collateral. The Funds also continue to receive interest or dividends on the securities loaned. The loans are secured by collateral at least equal, at all times, to 102% of the market value of loaned securities. Gain or loss in the fair value of the securities loaned that may occur during the term of the loan will be for the account of the Funds. The Funds have the right under the lending agreement to recover the securities from the borrower on demand. If the fair value of the collateral falls below 102% plus accrued interest of the loaned securities, the lender’s agent shall request additional collateral from the borrowers to bring the collateralization back to 102%.
Security Transactions — Security transactions are accounted for on trade date and realized gains and losses on investments sold are determined on a specific identification basis.
Interest and Dividend Income — Interest income is accrued as earned. Dividends on securities held by the Funds are recorded on the ex-dividend date. Discounts and premiums on securities purchased are amortized over the lives of the respective securities. Withholding taxes on foreign dividends have been provided for in accordance with the Funds’ understanding of the applicable country’s tax rules and rates. The ability of issuers of debt securities held by the Funds to meet their obligations may be affected by economic and political developments in a specific country or region.
Dividends and Distributions to Shareholders — Distributions of net investment income to shareholders are declared daily and paid monthly by the Fixed Income Fund. Net investment income distributions, if any, for Informed Investor Growth Fund, Quality Growth Fund, Select Value Fund, and Value Fund are declared and paid quarterly at the discretion of each Fund’s adviser. Net capital gains for the Funds, if any, are distributed to shareholders at least annually. Distributions to shareholders, which are determined in accordance with income tax regulations, are recorded on the ex-dividend date.
MONTEAGLE FUNDS NOTES TO FINANCIAL STATEMENTS (Continued) |
The tax character of distributions paid during the year ended August 31, 2013 and the year ended August 31, 2012 were as follows:
| | | | | | |
| | | | | | | | | | | | | |
| Fixed Income Fund | | $ | 661,784 | | | $ | 844,767 | | | $ | — | | | $ | — | |
| Informed Investor Growth Fund | | | 1,021,556 | | | | 493,740 | | | | — | | | | — | |
| Quality Growth Fund | | | 149,428 | | | | 4,552 | | | | — | | | | — | |
| Select Value Fund | | | 136,109 | | | | 111,880 | | | | — | | | | — | |
| Value Fund | | | 547,509 | | | | 174,931 | | | | — | | | | 2,750,126 | |
Estimates — These financial statements are prepared in accordance with accounting principles generally accepted in the United States of America (“GAAP”), which requires management to make certain estimates and assumptions that affect the reported amounts of assets and liabilities, disclosure of contingent assets and liabilities at the date of the financial statements and the reported amounts of increases and decreases in net assets from operations during the reporting period. Actual results could differ from those estimates.
Common Expenses — Common expenses of the Trust are allocated among the Funds within the Trust based on relative net assets of each Fund or the nature of the services performed and the relative applicability to each Fund. Other allocations may also be approved from time to time by the Trustees.
3. ADVISORY, SERVICING FEES AND OTHER TRANSACTIONS WITH AFFILIATES
Investment Advisory Agreement
Nashville Capital Corporation (“Nashville Capital” or the “Adviser”) serves as the investment adviser to the Funds. Subject to the general oversight of the Board of Trustees, the Adviser is responsible for, among other things, developing a continuing investment program for the Funds in accordance with their investment objectives, reviewing the investment strategies and policies of the Funds and advising the Board of Trustees on the selection of sub-advisers. Each Fund is authorized to pay the Adviser a fee based on average daily net assets at the following annual rates:
| | Informed Investor Growth Fund | | | |
| Up to and including $25 millon | 0.965% | 1.200% | 1.200% | 1.200% | 1.200% |
| From $25 up to and including $50 million | 0.965% | 1.115% | 1.115% | 1.115% | 1.115% |
| From $50 up to and including $100 million | 0.845% | 0.975% | 0.975% | 0.975% | 0.975% |
| Over $100 million | 0.775% | 0.875% | 0.875% | 0.875% | 0.875% |
MONTEAGLE FUNDS NOTES TO FINANCIAL STATEMENTS (Continued) |
Under the terms of the Funds’ advisory agreement, the Adviser oversees the management of each Fund’s investments and pays all of the operating expenses of each Fund except: (i) costs of membership in trade associations; (ii) any expenses recouped by the Adviser; (iii) SEC registration fees and related expenses; (iv) any non-interested Trustee fees; (v) costs of travel for non-interested Trustees; (vi) costs associated with seminars, conventions or trade education for non-interested Trustees; (vii) 50% of the compensation amount approved by Trustees specifically for the Chief Compliance Officer’s services for the Trust attributable to the Funds managed by the Adviser; and (viii) any extraordinary Trust expenses, including legal expenses relating to lawsuits.
For the year ended August 31, 2013, the amounts earned by and payable to the Adviser were as follows:
| | | | | Advisory Fees Payable as of August 31, 2013 | |
| Fixed Income Fund | | $ | 365,536 | | | $ | 32,540 | |
| Informed Investor Growth Fund | | | 153,956 | | | | 13,674 | |
| Quality Growth Fund | | | 335,111 | | | | 29,561 | |
| Select Value Fund | | | 145,853 | | | | 15,022 | |
| Value Fund | | | 182,985 | | | | 16,820 | |
An officer of Nashville Capital is also an officer of the Trust.
Fixed Income Fund — Nashville Capital has retained Howe & Rusling Inc. (“H&R”) to serve as the sub-adviser to Fixed Income Fund. Nashville Capital has agreed to pay H&R an annual advisory fee of 0.30% of average daily net assets up to $25 million, 0.25% of such assets from $25 million up to $50 million, and 0.20% of such assets over $50 million.
Informed Investor Growth Fund — Nashville Capital has retained T.H. Fitzgerald & Co. (“T.H. Fitzgerald”) to serve as the sub-adviser to Informed Investor Growth Fund. Nashville Capital has agreed to pay T.H. Fitzgerald an annual advisory fee of 0.50% of average daily net assets up to $25 million, 0.60% of such assets from $25 million up to $50 million, 0.50% of such assets from $50 million up to $100 million, and 0.40% of such assets over $100 million.
Quality Growth Fund — Nashville Capital has retained Garcia Hamilton & Associates (“GHA”) to serve as the sub-adviser to Quality Growth Fund. Nashville Capital has agreed to pay GHA an annual advisory fee of 0.30% of average daily net assets.
Select Value Fund — Nashville Capital has retained Parkway Advisors, L.P. (“Parkway”) to serve as the sub-adviser to Select Value Fund. Nashville Capital has agreed to pay Parkway an annual advisory fee of 0.50% of average daily net assets.
Value Fund — Nashville Capital has retained Robinson Investment Group, Inc. (“Robinson”) to serve as the sub-adviser to Value Fund. Nashville Capital has agreed to pay Robinson an annual advisory fee of 0.50% of average daily net assets up to $25 million, 0.45% of such assets from $25 million up to $50 million, 0.35% of such assets from $50 million up to $100 million, and 0.30% of such assets over $100 million.
MONTEAGLE FUNDS NOTES TO FINANCIAL STATEMENTS (Continued) |
Investment Company Services Agreement
Pursuant to an Investment Company Services Agreement between the Trust and Matrix 360 Administration, LLC (“Matrix”), Matrix provides administrative, fund accounting and pricing, and transfer agent and shareholder services to the Funds. For these services, Matrix receives the greater of an annual base fee of $30,000 per Fund or 0.075% of the Trust’s Equity Funds’ aggregate average daily net assets to $400 million with lower fees at higher asset levels and 0.04% of the Trust’s Fixed Income Fund aggregate average net assets to $400 million with lower fees at higher assets levels. The fees payable to Matrix are paid by the Adviser (not the Funds). Officers of Matrix are also officers of the Trust.
Distribution Agreement
Pursuant to the terms of a Distribution Agreement with the Trust, Matrix Capital Group, Inc. (the “Distributor”) serves as the Funds’ principal underwriter. Matrix Capital Group, Inc. does not receive compensation for such services.
Compliance Services
An affiliated Contractor (the “Contractor”) serves as the CCO of the Trust. The Funds pay $82,500 annually to the Contractor for providing CCO services. Each Fund pays $5,000 with the remaining $57,500 allocated to the Funds based on aggregate average daily net assets.
The Contractor is also an officer of the Adviser.
4. SECURITIES TRANSACTIONS
During the year ended August 31, 2013, cost of purchases and proceeds from sales and maturities of investment securities, excluding short-term investments and U.S. government securities, were as follows:
| | | | | | |
| Fixed Income Fund | | $ | 12,945,151 | | | $ | 7,574,558 | |
| Informed Investor Growth Fund | | | 68,020,880 | | | | 69,347,753 | |
| Quality Growth Fund | | | 13,644,912 | | | | 18,631,525 | |
| Select Value Fund | | | 3,913,309 | | | | 3,907,342 | |
| Value Fund | | | 1,945,025 | | | | 3,049,576 | |
The cost of purchases and proceeds from sales of U.S. government securities by the Fixed Income Fund were $565,000 and $0, respectively. There were no purchases or sales of U.S. government securities made by the Informed Investor Growth Fund, Quality Growth Fund, Select Value Fund or Value Fund.
5. TAX MATTERS
It is each Fund’s policy to comply with the special provisions of Subchapter M of the Internal Revenue Code applicable to regulated investment companies. As provided therein, in any fiscal year in which a Fund so qualifies and distributes at least 90% of its taxable income, such Fund (but not the shareholders) will be relieved of federal income tax on the income distributed. Accordingly, no provision for income taxes has been made.
MONTEAGLE FUNDS NOTES TO FINANCIAL STATEMENTS (Continued) |
In order to avoid imposition of the excise tax applicable to regulated investment companies, it is also each Fund’s intention to declare as dividends in each calendar year at least 98% of its net investment income and 98.2% of its net realized capital gains plus undistributed amounts from prior years.
The Funds’ tax basis distributable earnings are determined only at the end of each fiscal year. The tax character of distributable earnings (deficit) at August 31, 2013, the Funds’ most recent fiscal year end, was as follows:
| Fund | | | Unrealized Appreciation (Depreciation) | | | | Undistributed Ordinary Income | | | | Undistributed Capital Gains | | | | | | | | Post-December Ordinary Loss | | | | | | | | Total Distributable Earnings | |
| Fixed Income Fund | | $ | (165,329 | ) | | $ | 1,801 | | | $ | — | | | $ | (452,239 | ) | | $ | — | | | $ | — | | | $ | (615,767 | ) |
| Informed Investor Growth Fund | | | 1,314,545 | | | | 610,462 | | | | 145,819 | | | | — | | | | — | | | | — | | | | 2,070,826 | |
| Quality Growth Fund | | | 5,536,714 | | | | 15,199 | | | | — | | | | (3,966,404 | ) | | | — | | | | — | | | | 1,585,509 | |
| Select Value Fund | | | 2,426,151 | | | | 18,758 | | | | — | | | | (182,085 | ) | | | — | | | | — | | | | 2,262,824 | |
| Value Fund | | | 4,254,917 | | | | 26,077 | | | | — | | | | (1,250 | ) | | | — | | | | — | | | | 4,279,744 | |
The undistributed ordinary income, capital gains, carryforward losses and post-October losses shown above differ from corresponding accumulated net investment income and accumulated net realized gain (loss) figures reported in the statements of assets and liabilities due to differing book/tax treatment of short-term capital gains, and certain temporary book/tax differences due to the tax deferral of losses on wash sales. Following the January 22, 2010 acquisition by the Quality Growth Fund of the Monteagle Large Cap Growth Fund, the Quality Growth Fund acquired all capital loss carryforwards available to the Large Cap Growth Fund. In accordance with Section 382 of the Internal Revenue Code, loss limitations were appropriately applied to the available capital loss carryforwards. Of the capital losses subject to Section 382, the Quality Growth Fund may only utilize $499,665 in a given year through August 31, 2017.
Under current tax law, net capital losses realized after October 31st and net ordinary losses incurred after December 31st may be deferred and treated as occurring on the first day of the following fiscal year. The Funds’ carryforward losses, post-October losses and post-December losses are determined only at the end of each fiscal year. As of August 31, 2013, the Funds elected to defer net capital losses as indicated in the chart below.
| | | | | | | |
| | | | | | | | | | | | |
| Fixed Income Fund | | $ | — | | | $ | — | | | $ | — | | | $ | — | |
| Informed Investor Growth Fund | | | — | | | | — | | | | — | | | | — | |
| Quality Growth Fund | | | — | | | | 404,988 | | | | — | | | | — | |
| Select Value Fund | | | — | | | | — | | | | — | | | | — | |
| Value Fund | | | — | | | | 317,982 | | | | — | | | | — | |
MONTEAGLE FUNDS NOTES TO FINANCIAL STATEMENTS (Continued) |
As of August 31, 2013, the following Funds had the following capital loss carryforwards for federal income tax purposes. These capital loss carryforwards may be utilized in future years to offset net realized capital gains, if any, prior to distributing such gains to shareholders.
| | | | | | | | | | | | | | | | | | | | | |
| Fixed Income Fund | | $ | 148,066 | | | $ | 61,228 | | | $ | 220,424 | | | $ | 22,521 | | | $ | — | | | $ | 452,239 | | | $ | 99,449 | |
| Informed Investor Growth Fund | | | — | | | | — | | | | — | | | | — | | | | — | | | | — | | | | — | |
| Quality Growth Fund | | | — | | | | — | | | | 3,966,404 | | | | — | | | | — | | | | 3,966,404 | | | | 2,451,293 | |
| Select Value Fund | | | — | | | | — | | | | — | | | | 182,085 | | | | — | | | | 182,085 | | | | 1,107,026 | |
| Value Fund | | | — | | | | — | | | | — | | | | — | | | | 1,250 | | | | 1,250 | | | | — | |
Under the Regulated Investment Company Modernization Act of 2010 (the Act), net capital losses recognized after December 31, 2010, may be carried forward indefinitely, and their character is retained as short-term and/or long-term. Under the law in effect prior to the Act, pre-enactment net capital losses were carried forward for eight years and treated as short-term losses. As a transition rule, the Act requires that post-enactment net capital losses be utilized before pre-enactment net capital losses. There were no post-enactment capital losses incurred by the Funds during the year ended August 31, 2013.
The following information is based upon the federal income tax cost of the investment securities as of August 31, 2013:
| | | | | Gross Unrealized Appreciation | | | Gross Unrealized Depreciation | | | Net Unrealized Appreciation (Depreciation) | |
| Fixed Income Fund | | $ | 41,431,087 | | | $ | 918,898 | | | $ | (1,084,227 | ) | | $ | (165,329 | ) |
| Informed Investor Growth Fund | | | 12,180,854 | | | | 1,392,672 | | | | (78,127 | ) | | | 1,314,545 | |
| Quality Growth Fund | | | 20,011,710 | | | | 5,801,049 | | | | (264,335 | ) | | | 5,536,714 | |
| Select Value Fund | | | 12,335,762 | | | | 3,192,226 | | | | (766,075 | ) | | | 2,426,151 | |
| Value Fund | | | 12,422,580 | | | | 4,367,984 | | | | (113,067 | ) | | | 4,254,917 | |
The difference between the federal income tax cost of portfolio investments and the financial statement cost for Informed Investor Growth Fund, Quality Growth Fund and Select Value Fund is due to certain timing differences in the recognition of capital losses under income tax regulations and GAAP. These “book/tax” differences are temporary in nature and are due to the tax deferral of losses on wash sales.
MONTEAGLE FUNDS NOTES TO FINANCIAL STATEMENTS (Continued) |
For the year ended August 31, 2013, Fixed Income Fund reclassified $27,498 of capital losses on paydowns of mortgage-backed and asset-backed securities from net investment income to accumulated net realized loss on the Statements of Assets and Liabilities. For the year ended August 31, 2013, Informed Investor Growth Fund reclassified $75,687 of net investment loss to accumulated net capital gains on the Statement of Assets and Liabilities. Such reclassifications, the result of permanent differences between the financial statement and income tax reporting requirements, have no effect on the Funds’ net assets or net asset values per share.
The Funds recognize the tax benefits of uncertain tax positions only when the position is “more likely than not” to be sustained assuming examination by tax authorities. Management has reviewed the tax positions in the open tax years of 2010, 2011 and 2012 and for the year ended August 31, 2013 and has concluded that no liability for unrecognized tax benefits should be recorded related to uncertain tax positions taken in the above open tax years. The Funds identify their major tax jurisdictions as U.S. Federal and Delaware. The Funds recognize interest and penalties, if any, related to unrecognized tax benefits as income tax expense in the Statements of Operations. During the year ended August 31, 2013, the Funds did not incur any interest or penalties. The Funds are not subject to examination by U.S. Federal tax authorities for tax years before 2010.
6. CONTROL OWNERSHIP
The beneficial ownership, either directly or indirectly, of more than 25% of the voting securities of a fund creates presumption of control of the fund under Section 2(a)(9) of the Investment Company Act of 1940. As of August 31, 2013, the shareholders listed in the table immediately below held, for the benefit of their customers, the following percentages of the outstanding shares of each Fund. The Trust does not know whether Maril & Co., Mitra & Co., Stifel Nicolaus & Co. or any of the underlying beneficial owners owned or controlled 25% or more of the voting securities of the noted Funds.
| | Percent Owned as of August 31, 2013 |
| Fixed Income Fund | Mitra & Co. | 89% |
| Informed Investor Growth Fund | Maril & Co. | 91% |
| Quality Growth Fund | Maril & Co. | 74% |
| Select Value Fund | Stifel Nicolaus & Co. | 82% |
| Value Fund | Maril & Co. | 99% |
MONTEAGLE FUNDS NOTES TO FINANCIAL STATEMENTS (Continued) |
7. CAPITAL SHARE TRANSACTIONS
| | | | |
| | | | | | | | | | | | | |
| For the Fiscal Year ended: | | | | | | | | | | | | |
| August 31, 2013 | | | | | | | | | | | | |
| Class I | | | | | | | | | | | | |
Shares | | | 761,509 | | | | (293,457 | ) | | | 53,166 | | | | 3,843,858 | |
Value | | | 8,124,893 | | | $ | (3,106,086 | ) | | $ | 563,944 | | | | | |
| | | | | | | | | | | | | | | | | |
| For the Fiscal Year ended: | | | | | | | | | | | | | | | | |
| August 31, 2012 | | | | | | | | | | | | | | | | |
| Class I | | | | | | | | | | | | | | | | |
Shares | | | 465,582 | | | | (184,307 | ) | | | 61,246 | | | | 3,322,640 | |
Value | | | 4,990,184 | | | $ | (1,968,113 | ) | | $ | 656,322 | | | | | |
| Class A | | | | | | | | | | | | | | | | |
Shares | | | — | | | | (105 | ) | | | 3 | | | | — | |
Value | | | — | | | $ | (1,129 | ) | | $ | 31 | | | | | |
| Class C | | | | | | | | | | | | | | | | |
Shares | | | — | | | | (104 | ) | | | 4 | | | | — | |
Value | | | — | | | $ | (1,129 | ) | | $ | 44 | | | | | |
| | | Informed Investor Growth Fund | |
| | | | | | | | | | | | | |
| For the Fiscal Year ended: | | | | | | | | | | | | |
| August 31, 2013 | | | | | | | | | | | | |
| Class I | | | | | | | | | | | | |
Shares | | | 22,894 | | | | (74,521 | ) | | | 10,299 | | | | 1,132,036 | |
Value | | $ | 244,201 | | | $ | (819,035 | ) | | $ | 106,083 | | | | | |
| | | | | | | | | | | | | | | | | |
| For the Fiscal Year ended: | | | | | | | | | | | | | | | | |
| August 31, 2012 | | | | | | | | | | | | | | | | |
| Class I | | | | | | | | | | | | | | | | |
Shares | | | 115,026 | | | | (623,805 | ) | | | 7,110 | | | | 1,173,364 | |
Value | | $ | 1,210,567 | | | $ | (6,704,025 | ) | | $ | 69,748 | | | | | |
| Class A | | | | | | | | | | | | | | | | |
Shares | | | — | | | | (102 | ) | | | 4 | | | | — | |
Value | | $ | — | | | $ | (1,119 | ) | | $ | 39 | | | | | |
| Class C | | | | | | | | | | | | | | | | |
Shares | | | — | | | | (24,783 | ) | | | 297 | | | | — | |
Value | | $ | — | | | $ | (268,746 | ) | | $ | 2,847 | | | | | |
MONTEAGLE FUNDS NOTES TO FINANCIAL STATEMENTS (Continued) |
| | | | |
| | | | | | | | | | | | | |
| For the Fiscal Year ended: | | | | | | | | | | | | |
| August 31, 2013 | | | | | | | | | | | | |
| Class I | | | | | | | | | | | | |
Shares | | | 157,043 | | | | (597,802 | ) | | | 4,831 | | | | 2,399,599 | |
Value | | $ | 1,624,206 | | | $ | (6,314,125 | ) | | $ | 48,826 | | | | | |
| | | | | | | | | | | | | | | | | |
| For the Fiscal Year ended: | | | | | | | | | | | | | | | | |
| August 31, 2012 | | | | | | | | | | | | | | | | |
| Class I | | | | | | | | | | | | | | | | |
Shares | | | 419,181 | | | | (197,924 | ) | | | 166 | | | | 2,835,527 | |
Value | | $ | 3,585,430 | | | $ | (1,807,206 | ) | | $ | 1,416 | | | | | |
| Class A | | | | | | | | | | | | | | | | |
Shares | | | 196 | | | | (334 | ) | | | — | | | | — | |
Value | | $ | 1,750 | | | $ | (3,071 | ) | | $ | — | | | | | |
| Class C | | | | | | | | | | | | | | | | |
Shares | | | — | | | | (138 | ) | | | — | | | | — | |
Value | | $ | — | | | $ | (1,314 | ) | | $ | — | | | | | |
| | | | |
| | | | | | | | | | | | | |
| For the Fiscal Year ended: | | | | | | | | | | | | |
| August 31, 2013 | | | | | | | | | | | | |
| Class I | | | | | | | | | | | | |
Shares | | | 124,441 | | | | (103,016 | ) | | | 173 | | | | 951,408 | |
Value | | $ | 1,886,865 | | | $ | (1,518,514 | ) | | $ | 2,216 | | | | | |
| | | | | | | | | | | | | | | | | |
| For the Fiscal Year ended: | | | | | | | | | | | | | | | | |
| August 31, 2012 | | | | | | | | | | | | | | | | |
| Class I | | | | | | | | | | | | | | | | |
Shares | | | 1,263 | | | | (35,481 | ) | | | 257 | | | | 929,810 | |
Value | | $ | 12,429 | | | $ | (368,308 | ) | | $ | 2,642 | | | | | |
| Class A | | | | | | | | | | | | | | | | |
Shares | | | — | | | | (116 | ) | | | 1 | | | | — | |
Value | | $ | — | | | $ | (1,215 | ) | | $ | 9 | | | | | |
| Class C | | | | | | | | | | | | | | | | |
Shares | | | — | | | | (115 | ) | | | — | (a) | | | — | |
Value | | $ | — | | | $ | (1,214 | ) | | $ | 2 | | | | | |
| (a) | Class C shares reinvested were 0.232 shares. |
MONTEAGLE FUNDS NOTES TO FINANCIAL STATEMENTS (Continued) |
| | | | |
| | | | | | | | | | | | | |
| For the Fiscal Year ended: | | | | | | | | | | | | |
| August 31, 2013 | | | | | | | | | | | | |
| Class I | | | | | | | | | | | | |
Shares | | | 10,634 | | | | (20,044 | ) | | | 707 | | | | 1,068,734 | |
Value | | $ | 146,285 | | | $ | (280,626 | ) | | $ | 9,424 | | | | | |
| | | | | | | | | | | | | | | | | |
| For the Fiscal Year ended: | | | | | | | | | | | | | | | | |
| August 31, 2012 | | | | | | | | | | | | | | | | |
| Class I | | | | | | | | | | | | | | | | |
Shares | | | 185,760 | | | | (25,003 | ) | | | 2,293 | | | | 1,077,437 | |
Value | | $ | 2,222,035 | | | $ | (331,716 | ) | | $ | 27,447 | | | | | |
| Class A | | | | | | | | | | | | | | | | |
Shares | | | — | | | | (94 | ) | | | 20 | | | | — | |
Value | | $ | — | | | $ | (1,237 | ) | | $ | 237 | | | | | |
| Class C | | | | | | | | | | | | | | | | |
Shares | | | — | | | | (93 | ) | | | 19 | | | | — | |
Value | | $ | — | | | $ | (1,235 | ) | | $ | 227 | | | | | |
8. CONTINGENCIES AND COMMITMENTS
The Funds indemnify the Trust’s officers and Trustees for certain liabilities that might arise from the performance of their duties to the Funds. Additionally, in the normal course of business the Funds enter into contracts that contain a variety of representations and warranties and which provide general indemnifications. Each Fund’s maximum exposure under these arrangements is unknown, as this would involve future claims that may be made against the Funds that have not yet occurred. However, based on experience, the Funds expect the risk of loss to be remote.
9. SECTOR RISK
When the Funds emphasize one or more economic sectors, it may be more susceptible to the financial, market, or economic events affecting the particular issuers and industries in which they invest than funds that do not emphasize particular sectors. The more a fund diversifies, the more it spreads risk and potentially reduces the risks of loss and volatility.
10. RECENT ACCOUNTING PRONOUNCEMENTS
In December 2011, FASB issued ASU No. 2011-11 related to disclosures about offsetting assets and liabilities. The amendments in this ASU require an entity to disclose information about offsetting and related arrangements to enable users of its financial statements to understand the effect of those arrangements on its financial position.
In January 2013, the FASB issued ASU 2013-01, Clarifying the Scope of Disclosures about Offsetting Assets and Liabilities, which replaced ASU 2011-11. ASU 2011-11 was intended to enhance disclosure requirements on the offsetting of financial assets and liabilities. ASU 2013-01
MONTEAGLE FUNDS NOTES TO FINANCIAL STATEMENTS (Continued) |
limits the scope of the new statement of assets and liabilities offsetting disclosures to derivatives, repurchase agreements and securities lending transactions to the extent that they are (1) offset in the financial statements or (2) subject to an enforceable master netting arrangement or similar agreement. Both ASU 2011-11 and ASU 2013-01 are effective for interim or annual periods beginning on or after January 1, 2013. Management is currently evaluating the impact that these pronouncements may have on the Fund’s financial statements.
In June 2013, the FASB issued ASU 2013-08, Financial Services Investment Companies, which updates the scope, measurement, and disclosure requirements for U.S. GAAP including identifying characteristics of an investment company, measurement of ownership in other investment companies and requires additional disclosures regarding investment company status and following guidance in Topic 946 of the FASB Accounting Standards Codification (“FASC”). The ASU is effective for interim and annual reporting periods that begin after December 15, 2013. Management is currently evaluating the impact that these pronouncements may have on the Fund’s financial statements.
11. SUBSEQUENT EVENTS
On September 16, 2013, the Select Value Fund declared a dividend of $20,063, which was payable on September 16, 2013. On September 16, 2013, the Value Fund declared a dividend of $34,351, which was payable on September 16, 2013. On September 30, 2013, the Fixed Income Fund declared a dividend of $49,655, which was payable on September 30, 2013.
Management has evaluated subsequent events through the issuance of the financial statements and has noted no other such events that would require disclosure.
12. LEGAL PROCEEDINGS
On December 7, 2010, an amended complaint was filed in the United States Bankruptcy Court for the District of Delaware (Adversary Proceeding No. 10-54010) by The Official Committee of Unsecured Creditors of Tribune Company (“Committee”) on behalf of Tribune Company (“Tribune”), a U.S. news and media organization. Among the thousands of defendants in the Amended Complaint is the Monteagle Funds with respect to holdings by the Monteagle Value Fund (the “Fund”). The Fund, along with numerous other mutual funds, institutional investors and others, owned shares of Tribune in 2007 when it went private in a leveraged buyout transaction (“LBO”). In the LBO, shareholders such as the Fund sold their shares back to Tribune for $34/share. The lawsuit alleges, among other things, that the payment for the shares by Tribune was a fraudulent transfer and seeks to have the cash paid to shareholders returned to the Tribune bankruptcy estate. The Amended Complaint seeks to create a class of Defendants -the former shareholders of Tribune - and seeks return of over $8 billion in proceeds from the LBO. The Committee has not served the Fund with the Amended Complaint, and the Fund was not named as a Defendant in the original complaint. Although the Fund has not yet been served, the Fund is monitoring the litigation.
On April 5, 2012, the Committee’s lawsuit was transferred by the Judicial Panel on Multidistrict Litigation to the United States District Court for the Southern District of New York for discovery and pretrial motions with numerous other related actions. (In re Tribune Company Fraudulent Conveyance Litigation, 1:12-mc-02296-WHP). It is unclear if the Fund is named as a Defendant, or is a member of any proposed class, in any of these other actions.
MONTEAGLE FUNDS NOTES TO FINANCIAL STATEMENTS (Continued) |
On July 23, 2012, the Delaware Bankruptcy Judge confirmed a plan of reorganization that, among other things, replaced the Committee as Plaintiff with a Litigation Trustee.
On September 7, 2012, Judge Pauley of the Southern District of New York entered a Master Case Order. Among other things, the Master Case Order creates liaison counsel and an Executive Committee for the defendants in the Litigation Trustee’s lawsuit, including those defendants, like the Fund, that were only shareholders of Tribune. The Executive Committee Members for mutual funds are Michael S. Doluisio, an attorney with Dechert LLP in Philadelphia, and Steven R. Schoenfeld, an attorney with Dorsey & Whitney LLP in New York. The Executive Committee is directed to take reasonable steps to streamline case management and to eliminate duplication of efforts and redundant filings. However, the Master Case Order does not certify a class of Defendants, and does not prevent any individual Defendant from retaining its own counsel or being heard by the Court. Discovery in the Litigation Trustee’s lawsuit is stayed pending resolution of certain motions to dismiss in the related litigation.
On September 23, 2013, the Court rejected the defendants’ arguments under section 546(e) of the Bankruptcy Code (the so-called public-securities-market exemption), but still dismissed the so-called Individual Creditors Actions (the individual creditor, constructive fraudulent-conveyance actions) on the ground that the Individual Creditors lack standing to seek avoidance of the same transactions that the Litigation Trustee is simultaneously suing to avoid. The Executive Committee is evaluating the next steps in light of this decision.
It is not expected that the cases discussed above will have a material adverse impact on the Fund’s financial position, results of operation, or cash flows; however, these litigation matters are subject to inherent uncertainties and the views of these matters with respect to any impact to the Fund may change in the future.
MONTEAGLE FUNDS REPORT OF INDEPENDENT REGISTERED PUBLIC ACCOUNTING FIRM |
To the Shareholders and Board of Trustees of
Monteagle Funds
We have audited the accompanying statements of assets and liabilities, including the schedules of investments, of Monteagle Funds, comprising Monteagle Fixed Income Fund, Monteagle Informed Investor Growth Fund, Monteagle Quality Growth Fund, Monteagle Select Value Fund, and Monteagle Value Fund (the “Funds”) as of August 31, 2013, and the related statements of operations for the year then ended, the statements of changes in net assets for each of the two years in the period then ended, and the financial highlights for each of the five years in the period then ended. These financial statements and financial highlights are the responsibility of the Funds’ management. Our responsibility is to express an opinion on these financial statements and financial highlights based on our audits.
We conducted our audits in accordance with the standards of the Public Company Accounting Oversight Board (United States). Those standards require that we plan and perform the audit to obtain reasonable assurance about whether the financial statements and financial highlights are free of material misstatement. An audit includes examining, on a test basis, evidence supporting the amounts and disclosures in the financial statements. Our procedures included confirmation of securities owned as of August 31, 2013, by correspondence with the custodian and brokers, or by other appropriate auditing procedures where replies from brokers were not received. An audit also includes assessing the accounting principles used and significant estimates made by management, as well as evaluating the overall financial statement presentation. We believe that our audits provide a reasonable basis for our opinion.
In our opinion, the financial statements and financial highlights referred to above present fairly, in all material respects, the financial position of each of the Funds constituting Monteagle Funds as of August 31, 2013, the results of their operations for the year then ended, the changes in their net assets for each of the two years in the period then ended, and the financial highlights for each of the five years in the period then ended, in conformity with accounting principles generally accepted in the United States of America.
COHEN FUND AUDIT SERVICES, LTD.
Cleveland, OhioOctober 29, 2013
MONTEAGLE FUNDS OTHER INFORMATION (Unaudited) |
Proxy Policies — The Trust has adopted Proxy Voting Policies and Procedures under which the Funds vote proxies related to securities held by the Funds. A description of the Funds’ policies and procedures is available without charge, upon request, by calling the Funds toll free at 1-888-263-5593, on the Funds’ website at http://www.monteaglefunds.com or on the SEC website at http://www.sec.gov.
In addition, the Funds are required to file Form N-PX, with their complete voting record for the 12 months ended June 30th, no later than August 31st of each year. The Funds’ Form N-PX is available without charge, upon request, by calling the Funds toll free at 1-888-263-5593, on the Funds’ website at http://www.monteaglefunds.com or on the SEC’s website at http://www.sec.gov.
N-Q Filing — The SEC has adopted the requirement that all mutual funds file a complete schedule of investments with the SEC for their first and third fiscal quarters on Form N-Q. For the Monteagle Funds, this would be for the fiscal quarters ending November 30 and May 31. The Form N-Q filing must be made within 60 days of the end of the quarter. The Funds’ Forms N-Q are available on the SEC’s website at http://www.sec.gov., or they may be reviewed and copied at the SEC’s Public Reference Room in Washington, DC (call 1-8i00-732-0330 for information on the operation of the Public Reference Room).
FEDERAL TAX INFORMATION (Unaudited)
For the fiscal year ended August 31, 2013, certain dividends paid by Fixed Income Fund, Informed Investor Growth Fund, Quality Growth Fund, Select Value Fund and Value Fund may be subject to a maximum tax rate of 15%, as provided for by the Jobs and Growth Tax Relief Reconciliation Act of 2003. The Funds intend to designate up to a maximum amount of $661,784, $1,021,556, $149,428, $136,109, and $547,509, respectively, as taxed at a maximum rate of 15%. Complete information will be computed and reported in conjunction with your 2013 Form 1099-DIV.
MONTEAGLE FUNDS ABOUT YOUR FUNDS’ EXPENSES (Unaudited) |
We believe it is important for you to understand the impact of costs on your investment. As a shareholder of the Funds, you incur ongoing costs, including management fees and other Fund expenses. The following examples are intended to help you understand your ongoing costs (in dollars) of investing in the Funds and to compare these costs with the ongoing costs of investing in other mutual funds.
A mutual fund’s ongoing costs are expressed as a percentage of its average net assets. This figure is known as the expense ratio. The expenses in the tables below are based on an investment of $1,000 made at the beginning of the most recent semi-annual period (March 1, 2013) and held until the end of the period (August 31, 2013).
The tables that follow illustrate each Fund’s costs in two ways:
Actual fund return – This section helps you to estimate the actual expenses that you paid over the period. The “Ending Account Value” shown is derived from each Fund’s actual return, and the third column shows the dollar amount of operating expenses that would have been paid by an investor who started with $1,000 in the Funds. You may use the information here, together with the amount you invested, to estimate the expenses that you paid over the period.
To do so, simply divide your account value by $1,000 (for example, an $8,600 account value divided by $1,000 = 8.6), then multiply the result by the number given for the Funds under the heading “Expenses Paid During Period.”
Hypothetical 5% return – This section is intended to help you compare the Funds’ costs with those of other mutual funds. It assumes that each Fund had an annual return of 5% before expenses during the period shown, but that the expense ratio is unchanged. In this case, because the return used is not the Funds’ actual returns, the results do not apply to your investment. The example is useful in making comparisons because the Securities and Exchange Commission requires all mutual funds to calculate expenses based on a 5% return. You can assess each Fund’s costs by comparing this hypothetical example with the hypothetical examples that appear in shareholder reports of other funds.
Note that expenses shown in the table are meant to highlight and help you compare ongoing costs only.
The calculations assume no shares were bought or sold during the period. Your actual costs may have been higher or lower, depending on the amount of your investment and the timing of any purchases or redemptions.
More information about the Funds’ expenses, including historical annual expense ratios, can be found in this report. For additional information on operating expenses and other shareholder costs, please refer to each Fund’s Prospectus.
MONTEAGLE FUNDS ABOUT YOUR FUNDS’ EXPENSES (Unaudited) (Continued) |
| Fixed Income Fund |
| | | Beginning Account Value 3/01/13 | Annualized Expense Ratio For the Period | Ending Account Value 8/31/13 | Expenses Paid During the Period(1) |
| Actual Example Based on actual return of: |
| Class I | -3.28% | $1,000.00 | 1.05% | $967.20 | $5.21 |
| Hypethetical Example Based on assumed 5% return |
| Class I | | $1,000.00 | 1.05% | $1,019.90 | $5.35 |
| Informed Investor Growth Fund |
| | | Beginning Account Value 3/01/13 | Annualized Expense Ratio For the Period | Ending Account Value 8/31/13 | Expenses Paid During the Period(1) |
| Actual Example Based on actual return of: |
| Class I | 11.27% | $1,000.00 | 1.36% | $1,112.70 | $7.24 |
| Hypethetical Example Based on assumed 5% return |
| Class I | | $1,000.00 | 1.36% | $1,018.30 | $6.92 |
| Quality Growth Fund |
| | | Beginning Account Value 3/01/13 | Annualized Expense Ratio For the Period | Ending Account Value 8/31/13 | Expenses Paid During the Period(1) |
| Actual Example Based on actual return of: |
| Class I | 4.51% | $1,000.00 | 1.29% | $1,045.10 | $6.65 |
| Hypethetical Example Based on assumed 5% return |
| Class I | | $1,000.00 | 1.29% | $1,018.70 | $6.56 |
MONTEAGLE FUNDS ABOUT YOUR FUNDS’ EXPENSES (Unaudited) (Continued) |
| Select Value Fund |
| | | Beginning Account Value 3/01/13 | Annualized Expense Ratio For the Period | Ending Account Value 8/31/13 | Expenses Paid During the Period(1) |
| Actual Example Based on actual return of: |
| Class I | 19.02% | $1,000.00 | 1.35% | $1,190.20 | $7.45 |
| Hypethetical Example Based on assumed 5% return |
| Class I | | $1,000.00 | 1.35% | $1,018.40 | $6.87 |
| Value Fund |
| | | Beginning Account Value 3/01/13 | Annualized Expense Ratio For the Period | Ending Account Value 8/31/13 | Expenses Paid During the Period(1) |
| Actual Example Based on actual return of: |
| Class I | 9.61% | $1,000.00 | 1.36% | $1,096.10 | $7.19 |
| Hypethetical Example Based on assumed 5% return |
| Class I | | $1,000.00 | 1.36% | $1,018.30 | $6.92 |
| (1) | Expenses are equal to the Funds’ annualized expense ratios for the period, multiplied by the average account value over the period, multiplied by 184/365 (to reflect the one-half year period). |
MONTEAGLE FUNDS TRUSTEES AND OFFICERS OF THE TRUST (Unaudited) |
The business and affairs of the Funds are managed under the direction of the Board of Trustees in compliance with the laws of the state of Delaware. The names of the Trustees and executive officers of the Trust, their position with the Trust, address, age and principal occupations during the past five years are set forth below. Trustees have no official term of office and generally serve until they resign, or are not reelected.
| DISINTERESTED TRUSTEES |
| NAME, ADDRESS AND AGE | POSITION(S) HELD WITH TRUST | LENGTH OF TIME SERVED | PRINCIPAL OCCUPATION(S) DURING THE PAST 5 YEARS | NUMBER OF TRUST PORTFOLIOS OVERSEEN BY TRUSTEE | OTHER DIRECTORSHIPS OF PUBLIC COMPANIES |
Larry J. Anderson 4208 College Avenue Snyder, Texas 79549 Age 65 | Trustee | Since 11-29-02 | Certified Public Accountant, Anderson & West, P.C. January 1985 to present | 5 | None |
Brian J. Green 158 Cypress Abilene, Texas 79601 Age 55 | Trustee | Since 11-29-02 | Restaurateur, Cypress Street Station, February 1993 to present | 5 | None |
Charles M. Kinard 1725 Richland Drive Abilene, Texas 79603 Age 70 | Trustee | Since 11-29-02 | Retired; Senior Vice President and Trust Officer, First National Bank of Abilene until December 1998 | 5 | None |
MONTEAGLE FUNDS TRUSTEES AND OFFICERS OF THE TRUST (Unaudited) (Continued) |
| EXECUTIVE OFFICERS |
| NAME, ADDRESS AND AGE | POSITION(S) HELD WITH THE TRUST | PRINCIPAL OCCUPATION(S) DURING THE PAST 5 YEARS |
Paul B. Ordonio, JD Age 45 | President, CCO | Nashville Capital Corporation, VP of Development, 05/09 to present, and Chief Compliance Officer, 12/11 to present; Matrix Capital Group, Representative 05/09 to present; P.O. Properties, Inc., Vice President from 06/99 to present; WordWise Document Services, LLC, President from 08/97 to present; Ordonio & Assoc., President from 11/97 to present; Parkway Advisors, L.P., VP & Counsel from 08/02 to 05/09; Parkway Advisors Group, Inc., VP and Counsel from 08/02 to 05/09. Parkway Holdings, VP from 08/02 to 05/09; Ultimus Fund Distributors, Representative 02/07 to 05/09. |
Robert S. Driessen Age 65 | Secretary, AML Compliance Officer | Matrix 360 Administration, LLC, Chief Compliance Officer 7/13 to present; 360 Funds Trust, Chief Compliance Officer and Secretary, 7/13 to present; Aquila Distributors, Senior Vice President and Chief Compliance Officer, 11/09 to 12/12; Aquila Investment Management, LLC, Vice President and Chief Compliance Officer, 11/09 to 12/12; Curian Capital, LLC, Vice President, Chief Compliance Officer, 4/04 to 12/08. |
Larry E. Beaver, Jr. Age 44 | Treasurer, CFO | Matrix 360 Administration, LLC, Director of Accounting and Administration 1/05 to present; Capital Management Investment Trust, Treasurer 5/08 to present; Congressional Effect Fund, Treasurer 5/08 to present; AMIDEX Funds, Inc. Chief Accounting Officer 5/03 to present; 360 Funds, Treasurer, 8/13 to present. |
MONTEAGLE FUNDS COMPENSATION OF TRUSTEES AND OFFICERS (Unaudited) |
Each Trustee receives an annual fee of $2,500 and a fee of $1,000 per Fund, and is also paid a $1,000 for each quarterly meeting attended and $500 for each special meeting attended. Trustees and officers are also reimbursed for travel and related expenses incurred in attending meetings of the Board.
Trustees that are affiliated with the Adviser or Sub-adviser receive no compensation from the Funds for their services or reimbursement for their associated expenses. Officers of the Trust receive no compensation from the Funds for their services, except that the Funds pay 50% of the compensation of the Trust’s Chief Compliance Officer.
The following table sets forth the fees paid by the Funds to each Trustee of the Trust for the year ended August 31, 2013:
| Aggregate Compensation From Funds | Pension or Retirement Benefits Accrued as Part of Fund Expenses | Estimated Annual Benefits Upon Retirement | Total Compensation From Funds and Fund Complex Paid to Trustees |
| Larry J. Anderson | $12,500 | $0 | $0 | $12,500 |
| Brian J. Green | $12,500 | $0 | $0 | $12,500 |
| Charles M. Kinard | $12,500 | $0 | $0 | $12,500 |
[This page intentionally left blank]
[This page intentionally left blank]
[This page intentionally left blank]
THE MONTEAGLE FUNDS
Investment Adviser Nashville Capital Corporation 2506 Winford Ave. Nashville, TN 37211
Distributor Matrix Capital Group, Inc. 242 East 72nd Street New York, NY 10021 Transfer Agent, Administrator & Shareholder Servicing Agent Matrix 360 Administration, LLC 4520 Main Street Suite 1425 Kansas City, MO 64111
(888) 263-5593 www.monteaglefunds.com This report is submitted for the general information of the shareholders of the Funds. It is not authorized for distribution to prospective investors in the Funds unless preceded or accompanied by a current prospectus, which includes information regarding the Fund’s objectives and policies, experience of its management, marketability of shares, and other information. |