Washington, D.C. 20549
Matthew A. Swendiman, Attorney
The Annual report to Shareholders for the period ended August 31, 2016 pursuant to Rule 30e-1 under the Investment Company Act of 1940 (the “1940 Act”), as amended (17 CFR 270.30e-1) is filed herewith.
Letter from the President | 3 |
A Discussion of Fund Performance | 4 |
Supplementary Portfolio Information | 35 |
Financial Statements of the Monteagle Funds | |
Schedules of Investments: | |
Fixed Income Fund | 41 |
Informed Investor Growth Fund | 46 |
Quality Growth Fund | 48 |
Select Value Fund | 52 |
Value Fund | 55 |
The Texas Fund | 58 |
Statements of Assets and Liabilities | 62 |
Statements of Operations | 64 |
Statements of Changes in Net Assets | 66 |
Financial Highlights | 72 |
Notes to Financial Statements | 78 |
Report of Independent Registered Public Accounting Firm | 98 |
Other Information | 99 |
About Your Funds’ Expenses | 100 |
Trustees and Officers of the Trust | 103 |
LETTER FROM THE PRESIDENT (Unaudited) |
Dear Shareholders:
Enclosed is the Annual Report for the Monteagle Funds. I encourage you to carefully review the information presented in this Annual Report as it contains valuable information about your investment.
As you will notice in reviewing the Annual Report, we continue to uncover opportunities in high quality, solid credit and attractive valuation areas.
As we reflect on this past fiscal year, we continue to see several headlines during the period, such as continued slow economic recovery, civil unrest, an uncertain domestic political environment, and arguments over federal monetary policy, that all had a dramatic effect on the markets in which the Monteagle Funds invest. Despite the volatility that these headlines have created in the day-to-day stock markets, we have often said that we view investing as a marathon, not a sprint. As a result, we remain optimistic as we expect that the effect of some of these events will be short-lived although others may take longer to work their way through the system. We believe that remaining disciplined with a longer-term focus will benefit patient investors.
In closing, we would like to thank you for your continued confidence and support of the Monteagle Funds.
Sincerely,
MONTEAGLE FUNDS

Paul B. Ordonio, JD
President
3
MONTEAGLE FIXED INCOME FUND
A DISCUSSION OF FUND PERFORMANCE (Unaudited) |
How did the Fund Perform?
The Monteagle Fixed Income Fund (the “Fund”) had positive performance during the year. For the year ended August 31, 2016, the Fund had a total return of 3.51%. For the three and six month periods ended August 31, 2016, the Fund had total returns of 1.17% and 1.68% respectively. The returns were primarily influenced by declining longer term interest rates, both in the United States, and abroad. A great deal of influence on U.S. interest rates can be attributed to monetary policy activities particularly tied to the Bank of Japan and the European Central Bank. Both of the aforementioned central banks have been aggressively pursuing asset purchase programs (quantitative easing), in an effort to stimulate economic growth and rekindle inflation. As such, these programs have made U.S. dollar denominated assets more attractive and have increased the demand for U.S. fixed income securities. As demand for these securities has increased, so have prices. Because of the inverse relationship between price and yields (interest rates), increased prices have led to lower interest rates during this fiscal year.
The Fund’s benchmark index, the Barclays Capital Intermediate U.S. Government/Credit Index, had relative returns of 4.07%, 1.46%, and 2.34% for the twelve, three, and six month periods, ended August 31, 2016, respectively.
What Influenced Fund Performance?
This past fiscal year ended August 31, 2016 was one in which we’ve seen aggressive central bank monetary policies adopted in global markets and deflationary pressures abroad. Additionally, we have seen increased uncertainty as a result of the British referendum vote as to whether or not to remain in the European Union. The vote to abandon the union did have a negative impact on global markets, but has yet to be implemented. The significance of the vote goes beyond the economic consequences to the United Kingdom and Europe, but rather calls into question the political viability of a unified Europe comprised of 17 sovereign nations. The potential breakup of the European Union (the contagion effect), and the common currency, did play a role in decreasing growth expectations globally.
While here in the United States, our central bank (the Federal Reserve Bank – i.e. the Fed) modestly tightened monetary policy by increasing the Fed funds overnight lending rate by 0.25% in December 2015, central banks in Europe, Japan, and the United Kingdom have embarked on further easing. The action by the Bank of England (BOE) is in direct response to the market disruption caused by the referendum vote and the increased uncertainty of an economic downturn. On August 4, the BOE reduced its overnight lending rate by 0.25% (to a target rate of 0.25%) and pledged further support to provide liquidity to the banking system through asset purchases of corporate bonds and government bonds.
The Bank of Japan (BOJ) and the European Central Bank (ECB) both deemed it necessary to expand the easing of monetary policy through asset purchase programs and negative overnight lending rates on excess bank reserves. The intent of the ECB and BOJ is to offset deflationary pressures in their respective economies by discouraging saving and increase bank lending, capital investment, and consumer spending.
4
MONTEAGLE FIXED INCOME FUND
A DISCUSSION OF FUND PERFORMANCE (Unaudited) (Continued) |
The movement in interest rates is usually an indication of the market’s expectation for growth, and with growth, we can also expect a certain amount of inflation. Additionally, monetary policy affected by the Federal Reserve Board (through the Fed funds overnight lending rate) does have an impact on the market structure of interest rates. The illusive robust economic growth that has been anticipated since the financial crisis in 2008 and recession end in 2009 has been disappointing given previous post-recession cycles. The growth has been less than expected, not just for us in the United States, but around the world. While we in the United States are doing relatively better than most other economies, there are concerns. The biggest uncertainty we have here in the United States is whether the troubles in other major economies might be a precursor to U.S. weakness, maybe even recessionary conditions at home.
U.S. Treasury Note | August
2015
Rates | November
2015
Rates | February
2016
Rates | May
2016
Rates | August
2016
Rates |
2 Year | 0.74 | 0.93 | 0.78 | 0.88 | 0.81 |
3 Year | 1.05 | 1.22 | 0.90 | 1.03 | 0.93 |
5 Year | 1.55 | 1.65 | 1.21 | 1.37 | 1.20 |
7 Year | 1.95 | 1.99 | 1.52 | 1.67 | 1.46 |
10 Year | 2.22 | 2.21 | 1.74 | 1.85 | 1.58 |
30 Year | 2.96 | 2.97 | 2.62 | 2.65 | 2.23 |
In addition to monetary policy, Fund performance has also been affected by the prospects for economic growth. The above chart illustrates how the bond market has responded to the anemic growth and decreased outlook for inflation in the developed economies, as well as slowing growth in China. The negative interest rates in Europe and Japan have also increased demand for positive yielding U.S. dollar denominated assets. The increased demand for U.S. assets has increased the value (price) of fixed income assets. As a result, interest rates in the United States have remained low. We can see that interest rates for the 2-year Treasury note have barely increased over the year, while rates beyond two years have all decreased. Overall, portfolio performance has benefitted from the movement of interest rates over the last fiscal year.
It has become more apparent that interest rates in the major developed economies are affected by global economic growth prospects and are not limited to just the U.S. economy. As mentioned above, anemic global growth has kept interest rates relatively low and has had a positive influence on Fund performance throughout fiscal 2016. The U.S. economic growth rate as measured by the Real Gross Domestic Product (GDP) over the last year has been steadily declining. Actual 2nd quarter 2015 annualized GDP showed a healthy 3.9% measure of real growth, but has subsequently declined over the following quarters. Readings for the 3rd and 4th quarters of 2015 were 2.0% and 1.4%, respectively. Final GDP for the 1st quarter of 2016 measured 1.1% and preliminary estimates for the latest GDP figures for the 2nd quarter of 2016 are also showing our economy growing at a 1.1% rate. The Eurozone’s last reading showed GDP year-over-year growth as of the 2nd quarter of 2016 at just 1.6%. Eurozone member nations such as Italy, France, Spain, and Germany had year-over-year growth rates of 0.7%, 1.4%, 3.2%, and 3.1% respectively. While
5
MONTEAGLE FIXED INCOME FUND
A DISCUSSION OF FUND PERFORMANCE (Unaudited) (Continued) |
Spain and Germany have shown relatively stronger growth, uncertainties remain regarding the sustainability of this improvement. Emerging market economies such as the so called BRICS (Brazil, Russia, India, China, and South Africa), are also struggling overall. Brazil and Russia are in recession with GDP year-over-year readings (as of 2nd quarter 2016) of -3.8% and -0.6%, respectively. South Africa has also contracted over the past year with the latest reading at -0.2%. India and China are still showing significant growth. Both economies are still expanding at rates of approximately 7%, but at a slowing pace. As the market contemplates whether potential economic growth will accelerate or not, longer-term interest rates will adjust higher or lower depending on what impact growth would have on labor markets, capital investment, consumption, and inflation.
Our central bank’s dual mandate of full employment and stable prices (job creation and moderate inflation targeted at 2% on average) are factors to which the market also pays close attention. Improvement in labor statistics has positive implications for economic growth and direct implications for Federal Reserve monetary policy. During the course of this past fiscal year the economy created approximately 200,000 jobs per month. The unemployment rate has declined from 5.1% to 4.9% and the underemployment rate1 from 10.3% to 9.7%. These improvements have led many to believe that our economy is very close to meeting the definition of full employment, and the focus should now shift to inflation.
Undoubtedly, improvement in the unemployment rates has provided some impetus for economic growth. However, there are other measurements that are not necessarily as strong and therefore give an uncertain picture of future growth expectations. We still have a sizeable number of people that are working part-time, but wish to be fully employed. The underemployment rate is still 9.7%. Our economy is also impacted negatively by historically low labor participation rates. As of the end of August we had 62.8% of the available worker population in the labor force.2 Wage growth has also been unimpressive at 2.4% year-over-year. The average number of weekly hours worked is also less than one would expect from an expanding economy at 34.3. So, while the pace of new jobs has been good, they do not appear to be high paying jobs. So, fewer labor market participants, modest wage growth, and fewer hours worked are contributing factors to slower consumer growth and less wage inflation. Both outcomes justify a lower interest rate environment. Overall, labor market conditions have not had a significant impact on Fund performance. To the extent that current unemployment rates are approaching what many consider to be full employment, the outlook for future increases in short-term rates would have a slightly negative impact on the Fund’s performance.
Another important variable that has impacted, and will continue to impact, portfolio performance is expected inflation, not just in the U.S., but globally as well. Inflation measurements for much of the year have been increasing, but are still at or below the Fed’s implicit long-range target for price stability of 2%. The last reading of the CPI (Consumer Price Index) during the fiscal year measured 1.1% year-over-year, while the core CPI (less food and energy) increased 2.3%. Much of
1 | (Total unemployed, plus all persons marginally attached to the labor force, plus total employed part time for economic reasons, as a percent of the civilian labor force plus all persons marginally attached to the labor force). |
2 | (The labor force participation rate is the labor force divided by the total working-age population which is typically defined as those aged 15 (or 16) and older). |
6
MONTEAGLE FIXED INCOME FUND
A DISCUSSION OF FUND PERFORMANCE (Unaudited) (Continued) |
the impact on keeping the CPI fairly low has been the price of oil. As the price of oil has stabilized over the last 12 months, the downward pressure of oil on consumer prices has abated. That is precisely why measurements of CPI that discount the volatile oil prices are clearly very close to target inflation readings of 2% year-over-year. Another measure of price inflation is also tracked by the PCE index (Personal Consumption Expenditure). This has been the preferred measurement gauge of inflation used by the Federal Reserve. The year-over-year change in this index as of the last reading was 1.6%; also below the desired 2% average target for inflation. Furthermore, inflation expectations as measured by the difference in yields between U.S. Treasury notes and U.S. Inflation Protected Treasury Securities (TIPS) are also well below the 2% long-range Fed target. For the 5-year notes, the difference is 1.29%, and for 10-year notes, the difference is 1.47%. Declining inflation expectations over the year would favor bonds with longer maturities. We don’t believe that inflation had a material impact on the Fund’s performance over the year.
Credit conditions in the corporate bond market for the first half of the year were uncertain and did not support the low risk premiums associated with corporate credit conditions. During good economic times, the risk premium over safer U.S. Treasury notes diminishes. During more uncertain economic periods, the market requires more compensation in the form of higher yields (greater risk premiums) in order to hold riskier assets. However, the second half did show improving credit market conditions primarily driven by rising prices for oil. Oil prices had fallen below $30/barrel in January and then again in February of this past year. Considering that just 18 months earlier, oil prices were over $100/barrel, the credit markets did increase the odds of defaults occurring for companies in the energy sector. These uncertainties spread across most sectors of the corporate bond market. However, the reversal of oil prices back to the $45 - $50 range did alleviate some of the concerns associated with the energy sector of the corporate bond market. Additionally, more central bank activity in Europe and Japan was also a contributing factor to credit market outperformance. The table that follows (Table 7) shows that corporate bonds of lower credit quality did outperform during the year, particularly in the final six months.
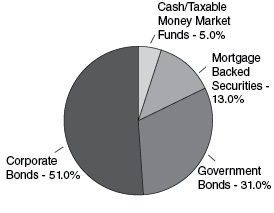
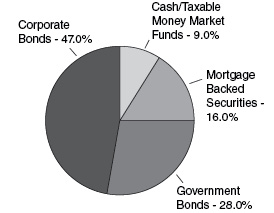
TABLE 2
Comparative Market Sector Weights
Monteagle Fixed Income Fund
August 31, 2015 | August 31, 2016 |
| 
|
7
MONTEAGLE FIXED INCOME FUND
A DISCUSSION OF FUND PERFORMANCE (Unaudited) (Continued) |
Our responses to these events have primarily been a disciplined approach to a high quality portfolio profile. We remain committed to the Fund’s strategy of holding a well-diversified portfolio of high quality bonds. We believe that the markets have rewarded our patience and prudence. However, we have made some changes over the last year.
| | ● | During the course of the year we increased the Fund’s market allocation to mortgage-backed securities from 13% to 16% while modestly decreasing the Fund’s allocation to government securities from 31% to 28%. The reallocation from government securities went directly to cash in the last month of the fiscal year. At our discretion, we took some capital gains in August 2016, to offset capital loss credits that were due to expire at the end of the fiscal year. As a result, end of year cash balances were relatively higher than normal. We also decreased the Fund’s allocation to investment grade intermediate corporate bonds to 47% from 51% of the portfolio. As can be seen from the following table, the Fund’s decision to increase the allocation to mortgage-backed securities, while decreasing exposure to corporate bonds, had a less than optimal effect on relative performance. Performance was still positive for the MBS sector, but less than it would have been had the allocation been skewed more toward corporate bonds. |
TABLE 3
Index | Return for Period |
U.S. Treasury: Intermediate | 3.11% |
U.S. Agency Intermediate | 2.03% |
Intermediate Corporate | 6.25% |
Invest. Grade: Industrial — Intermediate | 6.58% |
Invest. Grade: Financial Institutions — Intermediate | 5.70% |
Fixed Rate Mortgage Backed Securities | 3.93% |
| | ● | Portfolio duration decreased slightly over last year. As of August 31, 2016, the Fund’s portfolio duration was 3.6 years (including cash) compared to the portfolio duration of 4.2 years at 2015 fiscal year end. Maturity decreased slightly from 4.8 years at 2015 fiscal year end to 4.3. When compared to the duration and weighted average maturity of 4.1 and 4.4, of the Barclays Intermediate U.S. Government/Credit Index, the Fund’s portfolio is slightly shorter in both measures. We do believe that the maturity structure of the Fund’s portfolio relative to the benchmark index had a slightly negative effect on relative performance. The following chart illustrates the performance of various maturity ranges within the Barclays Intermediate U.S. Government/Credit Index. As we can see, bonds in the 7-10 year maturity range outperformed those having shorter maturities. The portfolio’s securities (not including cash) mature in less than 10 years with the highest percentage maturing in the 3 to 5 year range (30.9%). 26.1% of the Fund’s assets mature in less than 3 years, 55.9%% in 3 to 7 years, and 9.2% in 7 to 10 years. |
8
MONTEAGLE FIXED INCOME FUND
A DISCUSSION OF FUND PERFORMANCE (Unaudited) (Continued) |
TABLE 4
Intermediate U.S. Government/Credit (Returns, Unhedged) Maturity Sectors | 1 yr.
Total
Return | 6 month
Total
Return | 3 month
Total
Return |
All Maturities | 4.07% | 2.34% | 1.46% |
1 - 3 yrs. | 1.49% | 0.94% | 0.51% |
3 - 5 yrs. | 3.60% | 1.99% | 1.25% |
5 - 7 yrs. | 6.01% | 3.28% | 2.14% |
7 - 10 yrs. | 8.80% | 5.06% | 3.16% |
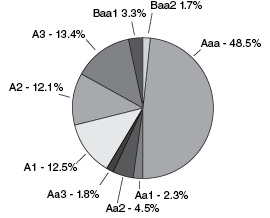
TABLE 5
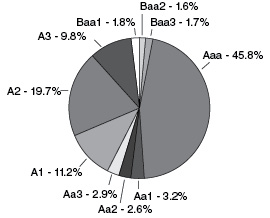
Comparative Credit Quality
Monteagle Fixed Income Fund
Moody’s Ratings August 31, 2015 | Moody’s Ratings August 31, 2016 |
| 
|
| | ● | The preceding charts represent the credit quality distribution of the Fund’s securities holdings (not including cash or money market securities) at the beginning and end of this past fiscal year. For consistency of the relative analysis, in our distribution comparison above, we have only included the ratings provided by Moody’s (and not S&P, which rates U.S. government obligations AA+). The Barclays benchmark index still maintains ratings of AAA on U.S. government obligations. |
| | ● | The overall credit quality of the portfolio remained the same over the course of the year. Overall credit quality remains excellent with ratings of AA-/Aa3. |
| | ● | We would also note that at the end of this fiscal year the Fund’s portfolio contained investment grade securities rated below A3/A-. While we are restricted from investing in securities rated below A3/A- at time of purchase, we do have the discretion of holding securities rated Baa/BBB should the rating be the result of a downgrade. It |
9
MONTEAGLE FIXED INCOME FUND
A DISCUSSION OF FUND PERFORMANCE (Unaudited) (Continued) |
| | | is our opinion that the securities in question do not materially affect the overall credit quality of the Fund’s portfolio and do not represent significant credit risk to portfolio value. The following table specifically identifies the securities in question. |
TABLE 6
| MOODY
RTG | S&P
RTG | % of
Portfolio
Market Value |
Halliburton Co, 2%, due 8/1/18 | Baa1 | BBB+ | 1.59% |
AT&T Inc, 5.8%, due 2/15/19 | Baa1 | BBB+ | 1.74% |
Becton Dickinson & Co, 3.125%, due 11/08/21 | Baa2 | BBB+ | 1.68% |
Total | | | 5.01% |
| | ● | The following table provides a summary illustration of how investment grade bonds of varying credit quality have performed over the past year. These are returns of bonds in the Barclay’s Intermediate U.S. Government/Credit Index. The relative performance of credit is indicative of the risk/reward nature of these bonds. We can see that for the full year lower quality bonds had a performance advantage over those of higher quality. As such, the performance of the Monteagle Fixed Income Fund did not fully benefit from the higher returns associated with Baa and A rated bonds. |
TABLE 7
| 1 yr.
Total Return | 6 month
Total Return | 3 month
Total Return |
Aaa | 3.05% | 1.04% | 1.00% |
Aa | 4.13% | 2.27% | 1.30% |
A | 5.86% | 3.63% | 1.87% |
Baa | 6.50% | 6.50% | 2.92% |
Total | 4.07% | 2.34% | 1.46% |
| | ● | For the year, trading was primarily driven by repositioning the Fund’s portfolio to further reduce credit exposure and increase allocations to higher quality mortgage-backed securities. We did realize longer-term gains by selling some of our more seasoned government bonds. In capturing some of the portfolio gains, we did sell bonds having higher coupons. As a result, the overall portfolio’s average coupon was slightly lower at the end of 2016 fiscal year at 2.90% versus 3.03%. |
What is the Fund’s Strategy?
The Fund will continue to invest in high quality intermediate term fixed income securities generally between 2 and 10 years in maturity. The Fund will continue to monitor economic conditions through the use of a proprietary model in an attempt to anticipate interest rate changes and lengthen or shorten the duration of the Fund’s portfolio of securities to maximize total return
10
MONTEAGLE FIXED INCOME FUND
A DISCUSSION OF FUND PERFORMANCE (Unaudited) (Continued) |
with minimal risk. The Fund will also actively manage portfolio holdings across market sectors in order to maximize total return within the scope of permitted investments defined by the Fund’s prospectus. While we have taken prudent steps to diversify the Fund’s assets by limiting exposure to the credit and interest rate risk associated with any one specific issuer, market sector, or maturity range, those risks cannot be completely eliminated without affecting long-term Fund performance. We remain vigilant and will act in your best interest to preserve the Fund’s asset values.
Fund performance shown represents the performance of the Fund’s Class I shares. For complete performance information, please refer to the Average Annual Total Return table in the following performance report. Past performance is not predictive of future performance. Investment results and principal value will fluctuate so that shares, when redeemed, may be worth more or less than their original cost. Current performance may be higher or lower than the performance data quoted. Performance data current to the most recent month-end, are available by calling 1-888-263-5593.
An investor should consider the investment objectives, risks, charges and expenses of the Fund carefully before investing. The Fund’s prospectus contains this and other important information. To obtain a copy of the Fund’s prospectus please call 1-888-263-5593 and a copy will be sent to you free of charge. Please read the prospectus carefully before you invest. The Fund is distributed by Matrix Capital Group, Inc.
Management’s Discussion of Fund Performance seeks to describe some of the Sub-Adviser’s current opinions and views of the financial markets. Although the Sub-Adviser believes it has a reasonable basis for any opinions or views expressed, actual results may differ, sometimes significantly so, from those expected or expressed.
11
MONTEAGLE FIXED INCOME FUND
PERFORMANCE — August 31, 2016 (Unaudited) |
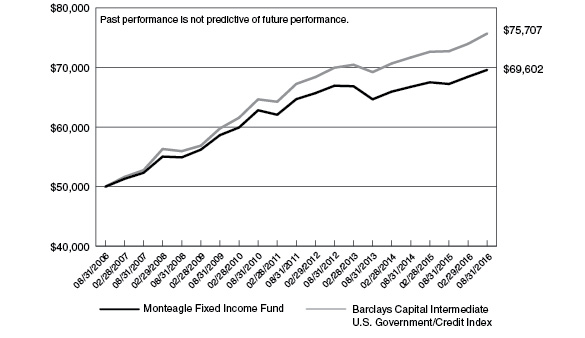
Comparison of the Change in Value of a $50,000 Investment in Monteagle Fixed Income Fund
and the Barclays Capital Intermediate U.S. Government/Credit Index
Average Annual Total Return
(for the periods ended August 31, 2016) |
| | One Year | Five Years | Ten Years | |
Monteagle Fixed Income Fund | 3.51% | 1.47% | 3.39% | |
Barclays Capital Intermediate
U.S. Government/Credit Index | 4.07% | 2.39% | 4.23% | |
The performance information quoted in this annual report assumes the reinvestment of all dividend and capital gain distributions, if any, and represents past performance, which is not a guarantee of future results. The returns shown do not reflect taxes that a shareholder would pay on Fund distributions or on the redemption of Fund shares. The investment return and principal value of an investment will fluctuate and, therefore, an investor’s shares, when redeemed, may be worth more or less than their original cost.
The above graph depicts the performance of the Monteagle Fixed Income Fund versus the Barclays Capital Intermediate U.S. Government/Credit Index (formerly Lehman Brothers U.S. Intermediate Government/Credit Index). The Barclays Capital Intermediate U.S. Government/Credit Index measures the performance of dollar denominated U.S. Treasuries, government-related (i.e. U.S. and foreign agencies, sovereign, supranational and local authority debt), and investment grade credit structures that have a remaining maturity of greater than or equal to one year and less than ten years. Please note that indices do not take into account any fees and expenses of investing in the individual securities that they track, and individuals cannot invest directly in any index.
As with any fund, save an index fund, that commonly compares its performance to the Barclays Capital Intermediate U.S. Government/Credit Bond Index, such a comparison may be said to be inappropriate because of the dissimilarity between the Fund’s investments and the securities comprising the index; so too with the Monteagle Fixed Income Fund, which will not invest in certain securities comprising this index.
12
MONTEAGLE INFORMED INVESTOR GROWTH FUND
A DISCUSSION OF FUND PERFORMANCE (Unaudited) |
How did the Fund Perform?
The Monteagle Informed Investor Growth Fund (the “Fund”) returned a positive 7.1% for the fiscal year ended August 31, 2016. The S&P 500 Index (“S&P 500”), the Fund’s benchmark, returned a positive 12.6%.
What is the Fund’s Investment Approach?
The Fund invests primarily in medium capitalization stocks (median, generally around $15 billion) of well-managed, financially sound companies, offering under-valued earnings growth rate, earnings yield and earnings surprise momentum, superior return on investment capital and cash flow growth opportunities. These are companies in which management or large and informed investors — individuals and/or funds — are significant common stock owners or buyers, or where the company itself is repurchasing its own shares on the open market. This investment discipline is widely recognized as The Informed Investor Strategy — now marking its 60th year of institutional portfolio management success.
Summarizing, these companies qualify for intensive research analysis only if they meet at least one of these five first-screen qualifying selection tests:
| | 1. | The company’s officers and directors are buying its common stock on the open market. |
| | 2. | A major outside investor (minimum 5% shares outstanding owned) has filed a Form 13-D purchase disclosure on the company’s stock. |
| | 3. | The company has announced its intent to repurchase its common stock on the open market. |
| | 4. | A significant percentage of the company’s stock is owned by family/management. |
| | 5. | The current top performing equity mutual funds and/or equity-orientated hedge funds are accumulating the company’s common stock on the open market. |
The buy disciplines are matched by a series of five sell disciplines. They are:
| | 1. | Begin selling if a stock drops a minimum of 8% from an average-cost basis. |
| | 2. | Begin selling when a holding-high loss-limit is triggered. (Stock falls a minimum of 14% from its portfolio holding-high price.) |
| | 3. | Begin selling on preliminary, but confirmed, indications of a breakdown in a company’s financials. |
| | 4. | Possibly selling when informed investors stock transaction signals turn bearish. |
| | 5. | Sell partial positions of a portfolio stock after an unusually day-to-day sharp price run-up. |
13
MONTEAGLE INFORMED INVESTOR GROWTH FUND
A DISCUSSION OF FUND PERFORMANCE (Unaudited) (Continued) |
What Influenced the Fund’s Performance?
The Fund returned a positive 4.5% for the first fiscal quarter ended November 30, 2015 while the S&P 500 posted a return of +6.1%. The Fund’s investment return was influenced during its fiscal quarter, by positive performance in two sectors: Information Technology and Consumer Discretionary.
| | o | The Information Technology sector returned a positive 7.6% for the quarter. Advancing stocks in the sector included: Activsion (AVTI) +21.4%, Verisign (VRSN) +19.8%, Facebook (FB) +16.6%, Manhattan Associates (MANH) +11.4% and Alphabet (GOOGL) +8.0% |
| | o | The Consumer Discretionary sector returned a positive 6.1% for the quarter. Securities in this sector included: Amazon (AMZN) +29.6%, Nike (NKE) +18.4%, Starbucks (SBUX) +12.2%, DR Horton (DHI) +6.4% and O’Reilly Automotive (ORLY) +4.1% |
The Fund returned a -4.8% for the second fiscal quarter ended February 29, 2016 while the S&P 500 posted a return of -6.6%. The Fund’s investment return was influenced during its second fiscal quarter in two sectors: ETFs (Exchange Traded Funds) and Consumer Staples.
| | o | The ETF sector returned a -19.2% for the second quarter. The Powershares QQQ (QQQ) Trust had a -18.7% return and the SPDR S&P 500 Trust (SPY) had a -19.7% return. |
| | o | The Consumer Staples sector returned a flat 0.82% for the quarter. Declining stocks were Clorox (CLX) with a -1.3% return, Constellation Brands (STZ) with a -17.8% return and Hormel Foods (HRL) with a -4.7% return. |
The Fund returned a positive 3.5% for the third fiscal quarter ended May 31, 2016 while the S&P 500 Index posted a return of +9.1%. The Fund’s investment return was influenced during its third fiscal quarter by positive performance in three sectors: Consumer Discretionary, Materials and ETFs (Exchange Traded Funds).
| | o | The Consumer Discretionary sector returned a +10.1% for the quarter. Ulta Salon Cosmetics (ULTA) had a significant return of +28.7%, Dollar General (DG) had a return of -7.8%. |
| | o | The Materials sector returned a +9.2% for the quarter. Agnico Eagle Mines (AEM) had a +23.7% return and Franco Nevada (FNV) had a +11.2% for the period ended May 31, 2016. |
| | o | Finally, the ETFs (Exchanged Traded Funds) sector had a +7.5% return for the period ended May 31, 2016. The Powershares QQQ Trust (QQQ) returned +8.6% and the Spider S&P 500 Trust (SPY) returned +7.9% for the period ended May 31, 2016. |
The Fund returned a +4.1% for the fourth fiscal quarter ended August 31, 2016 while the S&P 500 had the same return of +4.1%. The Fund’s positive investment return was influenced during the fourth quarter by two sectors: Information Technology and Utilities.
| | o | The Information Technology sector had a +12.3% return. NVidia (NVDA) with a +30.2% return, Netease (NTES) returned a +14.6% and EBay (EBAY) with a +10.5% return. |
14
MONTEAGLE INFORMED INVESTOR GROWTH FUND
A DISCUSSION OF FUND PERFORMANCE (Unaudited) (Continued) |
| | o | The Utilities Sector returned a +9.0%. Leading this sector was DTE Energy with a +19.1% return, followed by Pinnacle West (PNW) with a +12.8% return and American Water Works (AWK) with a +9.5% return. |
The five equity holdings that influenced the Fund’s performance positively for the full fiscal-year were Agnico Eaglemines (AEM) +53.6%, Silver Wheaton (SLW) +61.3%, Broadridge Financial (BR) +42.8%, Altria Group (MO) +21.21% and Amazon (AMZN) +60.9%.
The five equity holdings contributing the least to the Fund’s performance for the full fiscal-year were: Abiomed (ABMD) -54.4%, Alliant Energy (LNT) -34.9%, Celgene (CELG) -40.3%, Hormel Foods (HRL) -41.4% and Universal Health Services (UHS) -50.7%.
The total performance return for the portfolio, fiscal year ended August 31, 2016, was aided by the results of IShares 20+ Year Treasury Bond (TLT), up 27.8. Please note that ETFs are used when stock picks are limited due to market variations.
Also, as of the August 31, 2016 fiscal year-end, the Fund held 33.1% in cash. This holding was viewed as a neutral influence on performance during the fiscal year.
Finally, the Fund’s fiscal year ended with the continuation of the Federal Reserve maintaining its low interest rate policy.
What is the Fund’s Strategy?
The current strategy of the Monteagle Informed Investors Growth Fund is bullish in outlook and the intention is to remain virtually fully invested in a select list of uniquely attractive growth stocks that fulfill the rigid Informed Investors growth stock criteria. Positions in cash and ETFs remain a secondary consideration, and are quite subordinate to stock selection priorities.
Fund performance shown represents the performance of the Fund’s Class I shares. For complete performance information, please refer to the Average Annual Total Return table in the following performance report. Past performance is not predictive of future performance. Investment results and principal value will fluctuate so that shares, when redeemed, may be worth more or less than their original cost. Current performance may be higher or lower than the performance data quoted. Performance data current to the most recent month-end are available by calling 1-888-263-5593.
An investor should consider the investment objectives, risks, charges and expenses of the Fund carefully before investing. The Fund’s prospectus contains this and other important information. To obtain a copy of the Fund’s prospectus please call 1-888-263-5593 and a copy will be sent to you free of charge. Please read the prospectus carefully before you invest. The Fund is distributed by Matrix Capital Group, Inc.
Management’s Discussion of Fund Performance seeks to describe some of the Sub-Adviser’s current opinions and views of the financial markets. Although the Sub-Adviser believes it has a reasonable basis for any opinions or views expressed, actual results may differ, sometimes significantly so, from those expected or expressed.
15
MONTEAGLE INFORMED INVESTOR GROWTH FUND
PERFORMANCE — August 31, 2016 (Unaudited) |
Comparison of the Change in Value of a $50,000 Investment
in Monteagle Informed Investor Growth Fund and the S&P 500 Index

Average Annual Total Return
(for the periods ended August 31, 2016) |
| | One Year | Five Years | Since
Inception(a) | |
Monteagle Informed Investor Growth Fund | 7.11% | 9.78% | 10.22% | |
S&P 500 Index | 12.55% | 14.67% | 7.96% | |
(a) | Represents the period from the commencement of operations (April 3, 2008) through August 31, 2016. |
The performance information quoted in this annual report assumes the reinvestment of all dividend and capital gain distributions, if any, and represents past performance, which is not a guarantee of future results. The returns shown do not reflect taxes that a shareholder would pay on Fund distributions or on the redemption of Fund shares. The investment return and principal value of an investment will fluctuate and, therefore, an investor’s shares, when redeemed, may be worth more or less than their original cost.
The above graph depicts the performance of the Monteagle Informed Investor Growth Fund versus the S&P 500 Index. The S&P 500 Index by Standard and Poor’s Corp. is a capitalization-weighted index comprising 500 issues listed on various exchanges, representing the performance of the stock market generally. Please note that indices do not take into account any fees and expenses of investing in the individual securities that they track, and individuals cannot invest directly in any index.
As with any fund, save an index fund, that commonly compares its performance to the S&P 500 Index, such a comparison may be said to be inappropriate because of the dissimilarity between the Fund’s investments and the securities comprising the index; so too with the Monteagle Informed Investor Growth Fund, which will not invest in certain securities comprising this index.
16
MONTEAGLE QUALITY GROWTH FUND
A DISCUSSION OF FUND PERFORMANCE (Unaudited) |
How did the Fund perform?
For the fiscal year ended August 31, 2016, domestic equity markets posted attractive returns despite a number of headwinds: decelerating economic growth, declining earnings, and political turmoil in many parts of the world. Global central banks continued to provide additional liquidity to financial markets, hoping to stimulate economic activity. The incremental liquidity boosted asset prices more than real economic activity, resulting in rising equity valuations and, for many countries, negative nominal interest rates.
The fund’s strategy, to invest in high-quality companies capable of generating sustainable earnings growth and positive earnings surprises, would be expected to lag during periods when investors seek higher-risk stocks with little regard to valuation. Such has been the case in the seven-plus years subsequent to the financial crisis of 2008-2009, including the most recent fiscal year. Investors have been trained to react to central bank actions and commentary, counting on continued liquidity injections to push markets higher.
For the fiscal year, the Monteagle Quality Growth Fund (the “Fund”) increased 7.5% compared with a gain of 12.6% for the S&P 500 Index (“S&P 500”). Cash holdings reduced performance by 101 basis points as it became increasingly difficult through the year to identify stocks meeting the Fund’s investment discipline in an environment of declining earnings and rising valuations. Most of the remaining underperformance came from long-term portfolio holdings that posted disappointing earnings. Many of these, including CVS Health, Express Scripts, Walt Disney and Celgene were top 10 performers in the prior year and remain portfolio holdings. Sector allocation had a negligible impact for the year.
Relative to the Russell 1000 Growth Index (“Russell 1000”) benchmark, the Fund underperformed by 302 basis points for the fiscal year. Cash holdings reduced performance by 84 basis points. Underweight positions in Microsoft and Facebook accounted for a sizable portion of the disappointing performance. Sector allocation had a negligible impact for the year.
During the fiscal year, individual holdings contributing most positively to relative returns were Johnson & Johnson (pharmaceuticals, up 30.6%), Albemarle (specialty chemicals, up 80.1%), J.M. Smucker (foods, up 31.0%), Edwards Lifesciences (medical devices, up 48.1%), and Trimble Navigation (technology devices, up 45.0%). Individual stocks reducing performance the most were CF Industries (agricultural chemicals, down 52.8%), Polaris Industries (leisure products, down 37.8%), and Goldman Sachs (investment banking, down 8.7%).
Viewing each quarter of 2016 individually provides evidence of the portfolio’s strategy: providing protection during market downturns while capturing much of the gains during market rallies. Specifically, the portfolio meaningfully outperformed in the down quarter (second quarter of fiscal 2016) while lagging in the quarters posting positive returns. Capital preservation in downturns is an important element in the portfolio’s conservative strategy.
For the first quarter ending November 30, 2015, the portfolio returned 3.8% compared with 6.1% for the S&P 500 and 6.2% for the Russell 1000. Stock selection was particularly challenged during the period, with many long-time, high-quality holdings reporting disappointing results including Qualcomm, CF Industries, Polaris Industries, CVS Health, and W.W. Grainger.
17
MONTEAGLE QUALITY GROWTH FUND
A DISCUSSION OF FUND PERFORMANCE (Unaudited) (Continued) |
For the second quarter ending February 29, 2016, the portfolio declined just 5.9% compared with a 6.6% decline for the S&P 500 and a 7.0% decline for the Russell 1000. Investors reacted negatively to the U.S. Federal Reserve’s decision to hike interest rates for the first time since 2006, assuming a continual series of interest rate increases was forthcoming and an end to the Federal Reserve’s support of financial markets. Most of the Fund’s outperformance resulted from its quality bias, emphasizing companies with strong balance sheets and cash flows. From a sector perspective, this was most evident in an overweight in Consumer Staples and positive stock selection in Healthcare.
For the third quarter ending May 31, 2016, the portfolio gained 6.7% compared with a 9.1% gain for the S&P 500 and a 7.8% gain for the Russell 1000. Investors shifted to an aggressive ‘risk-on’ strategy once Federal Reserve reversed its intention to normalize interest rates. Much of the Fund’s underperformance resulted from its modest cash holdings as positive stock selection offset the negative impacts of the Fund’s high quality stance.
For the fourth quarter ending August 31, 2016, the portfolio returned 3.1% compared with a 4.1% gain for the S&P 500 and a 3.8% gain for the Russell 1000. Again, the Fund’s underperformance can be attributed to modest cash holdings and a high-quality stance, particularly in Consumer Staples. An underweight in the outperforming Information Technology sector was more than offset by positive selection in the sector.
Changes to the portfolio during the year reflect an effort to eliminate holdings reaching the upper end of our valuation expectations while retaining an emphasis on quality in newly added holdings. All stock selection results from a bottom-up process, yet the aerospace industry is one area expected to experience organic growth and is well-represented in new purchases. A common theme among positions sold is reduced exposure to the consumer.
New holdings added over the past year include Allergan (pharmaceuticals), Alexion (biotechnology), Altria (tobacco), Cigna (managed care), Community Health (hospitals), Dollar General (general merchandise), Dish Networks (cable & satellite), Edwards Lifesciences (medical devices), Generac (industrial machinery), Hanesbrands (apparel), Honeywell (aerospace), Ralph Lauren (apparel), Eli Lilly (pharmaceuticals), Lockheed Martin (aerospace), McDonalds (restaurants), Northrop Grumman (aerospace), Orbital ATK (aerospace), Synchrony Financial (consumer finance), TJX (retail), and Welltower (healthcare REIT).
Purchases were funded by the elimination of positions in Allergan (pharmaceuticals), Blackrock (asset management), Chevron (integrated energy), Cinemark (entertainment), Cisco Systems (communications equipment), Community Health (hospitals), Deckers (footwear), Dunkin Brands (restaurants), W.W. Grainger (industrial distribution), Hershey Foods (foods), Honeywell (aerospace), Pfizer (pharmaceuticals), Polaris Industries (leisure products), J.M. Smucker (food), and Walmart (general merchandise).
What is the Fund’s Strategy?
The Fund will continue to focus on maintaining a diversified portfolio of high-quality companies delivering sustainable above-average growth and positive earnings surprises relative to expectations. Investors are currently fixated on global central banker statements and potential actions. High frequency trading organizations have essentially developed investment strategies
18
MONTEAGLE QUALITY GROWTH FUND
A DISCUSSION OF FUND PERFORMANCE (Unaudited) (Continued) |
to merely front-run central banker activity. At some point, markets will normalize and underlying fundamentals will determine stock prices. The Fund’s advisor believes the companies with strong balance sheets and cash flows will weather the normalization process well and provide rewarding investments in the aftermath.
Fund performance shown represents the performance of the Fund’s Class I shares. For complete performance information, please refer to the Average Annual Total Return table in the following performance report. Past performance is not predictive of future performance. Investment results and principal value will fluctuate so that shares, when redeemed, may be worth more or less than their original cost. Current performance may be higher or lower than the performance data quoted. Performance data current to the most recent month-end, are available by calling 1-888-263-5593.
An investor should consider the investment objectives, risks, charges and expenses of the Fund carefully before investing. The Fund’s prospectus contains this and other important information. To obtain a copy of the Fund’s prospectus please call 1-888-263-5593 and a copy will be sent to you free of charge. Please read the prospectus carefully before you invest. The Fund is distributed by Matrix Capital Group, Inc.
Management’s Discussion of Fund Performance seeks to describe some of the Sub-Adviser’s current opinions and views of the financial markets. Although the Sub-Adviser believes it has a reasonable basis for any opinions or views expressed, actual results may differ, sometimes significantly so, from those expected or expressed.
19
MONTEAGLE QUALITY GROWTH FUND
PERFORMANCE — August 31, 2016 (Unaudited) |
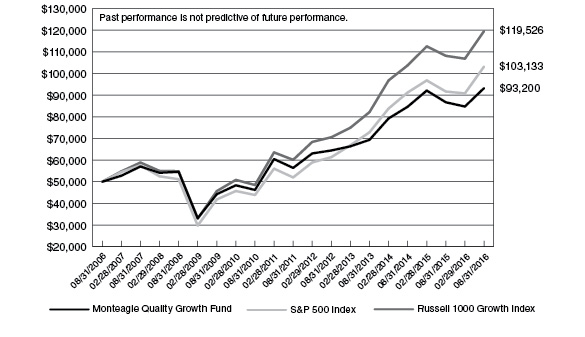
Comparison of the Change in Value of a $50,000 Investment in Monteagle Quality Growth Fund,
the S&P 500 Index and the Russell 1000 Growth Index
Average Annual Total Return
(for the periods ended August 31, 2016) |
| | One Year | Five Years | Ten Years | |
Monteagle Quality Growth Fund | 7.52% | 10.57% | 6.43% | |
S&P 500 Index | 12.55% | 14.67% | 7.50% | |
Russell 1000 Growth Index | 10.54% | 14.72% | 9.10% | |
The performance information quoted in this annual report assumes the reinvestment of all dividend and capital gain distributions, if any, and represents past performance, which is not a guarantee of future results. The returns shown do not reflect taxes that a shareholder would pay on Fund distributions or on the redemption of Fund shares. The investment return and principal value of an investment will fluctuate and, therefore, an investor’s shares, when redeemed, may be worth more or less than their original cost.
The above graph depicts the performance of the Monteagle Quality Growth Fund versus the S&P 500 Index and the Russell 1000 Growth Index. The S&P 500 Index by Standard and Poor’s Corp. is a capitalization-weighted index comprising 500 issues listed on various exchanges, representing the performance of the stock market generally. The Russell 1000 Growth Index measures the performance of the large-cap growth segment of the U.S. equity universe. It includes those Russell 1000 companies with higher price-to-book ratios and higher forecasted growth values. Please note that indices do not take into account any fees and expenses of investing in the individual securities that they track, and individuals cannot invest directly in any index.
As with any fund, save an index fund, that commonly compares its performance to the S&P 500 Index and the Russell 1000 Growth Index, such a comparison may be said to be inappropriate because of the dissimilarity between the Fund’s investments and the securities comprising the indices; so too with the Monteagle Quality Growth Fund, which will not invest in certain securities comprising these indices.
20
MONTEAGLE SELECT VALUE FUND
A DISCUSSION OF FUND PERFORMANCE (Unaudited) |
How did the Fund perform?
For the year ended August 31, 2016, the Monteagle Select Value Fund (the “Fund”) had a return of 4.75%. The S&P 500 Index (“S&P 500” or “Index”) had a return of 12.55% for the same period. Despite the underperformance of this rolling one year, the Fund has outperformed the Index year-to-date. The Fund’s net asset value per share as of August 31, 2016 was $11.83 versus $15.86 on August 31, 2015. Despite the negative return, another capital gain distribution will be occurring as a result of continued realized gains over the last year.
What is the Fund’s investment approach?
The Fund’s investment goal is long-term capital appreciation. The Fund uses a “value investing” style by investing under normal circumstances at least 80 percent of its assets in common stock of domestic companies believed to be under-priced relative to comparable securities determined by price-to-earnings ratios, cash flows or other measures. The Fund’s adviser predominately utilizes a reversion-to-the-mean strategy on stock selection in order to achieve its results rather than trying to time market fluctuations. The adviser limits the pool of stocks to consider for purchase to only those equities in the S&P 500. In selecting stocks, the Fund’s adviser establishes valuation parameters by using relative ratios or target prices to evaluate companies on several levels. Additionally, the adviser will generally have the Fund hold between 40 and 60 equities and diversify its holdings across numerous industries. The Fund seeks to maintain a minimum average weighted market capitalization of $5 billion.
Value stocks are broadly defined as equities which have a price-to-earnings ratio and a price-to-book ratio less than the relative market average with dividends tending to be higher than the relative market average. Also, value stocks tend to have a beta (a measure of the stocks price volatility relative to the overall market, i.e. the S&P 500) less than 1.0.
What influenced the Fund’s performance?
During the twelve months ended August 31, 2016, the Fund’s performance was affected by continued volatility in the U.S. equity market. This included “Brexit” (Britain leaving the European Union) as well as the general concern of rising interest rates and its effect on the markets. Calendar year 2016 began with a fall of over 10% in the first 45 days (total fall from most recent high was approximately 13.3%). The day Brexit occurred the domestic equity market fell 3% on the open and volatility swelled. The overall movement as a result of Brexit was over 5%. Over the last twelve months, there have been several equity market corrections of 5% or greater. Janet Yellen and the Federal Reserve continue to keep the market guessing regarding the timing of rising interest rates. This time last year about 90% of major economists believed rates would be higher by September 2016. However, the Fed has been reluctant to further raise rates after its first move in December. At the time of this writing, traders in the futures market are putting about 18% odds on an October increase and 43% on December with the vast majority of the remainder being further into 2017. The Fed has indicated a rate hike in 2016 should be coming but have given enough doubt for investors to be divergent on the timing. With the Index ending approximately twenty-five points off all-time highs, this calendar year has delivered decent returns thus far. The Fund’s
21
MONTEAGLE SELECT VALUE FUND
A DISCUSSION OF FUND PERFORMANCE (Unaudited) (Continued) |
focus on a “value style, reversion-to-the-mean” strategy has led to lagging performance with the high levels of volatility in the general market over the last year. However, longer term the Fund has performed attractively overall compared to the S&P 500 Index.
For the first quarter ended November 30, 2015, the portfolio holdings of the Fund underperformed the Index. The investments of the Fund experienced a -1.56% return versus a return for the Index of 6.07%. The cash balance of the portfolio at the end of the first was 15.02%, invested in cash and money funds while the equities represent 84.98% of the assets. The cash balance remained high in order to hold cash for the large capital gains distribution that occurred at the end of the calendar year.
The broad sectors of the Index that improved the most on average during the first quarter were the Information Technology (11.82%), Consumer Discretionary (10.01%), and Industrials (8.91%) sectors while the Utilities (0.28%), Health Care (0.55%), and the Telecommunication Services (1.20%) sectors were the lowest performing within the Index. After the Index experienced one of the largest all-time intra-day declines on record in late August, the Index returned to near highs for the year in early November. As of the end of November, the Index finished higher than it began the year by approximately 1.04%.
As of the end of the first quarter, the portfolio holdings continued to be diversified across many sectors of the Index with less exposure to the Utilities, Consumer Staple and Materials sectors. The largest sector allocations are Energy, Consumer Discretionary and Financial. The Fund’s positive portfolio performance was primarily attributed to its top performing stock picks of Tesoro Petroleum (25.83%), General Electric Co. (21.66%), and Discovery Communications (17.07%). The Fund’s portfolio performance was most negatively affected by Fossil Group, Inc. (-37.53%), Joy Global (-36.68%) and Allegheny Technology Inc. (-30.47%). During the first quarter, eleven disposals were made. Some of these were sold in order to remove securities that achieved their target price and make room for securities with more appreciation potential. Others were sold in order to realize losses to offset a portion of the large capital gains distribution for the Fund. These securities were sold under the procedural “out process” as determined by the holding period for the strategy. Subsequent to these disposals, no purchases were made in order to hold cash for the large capital gains distribution that will occur in December. As of the end of the first quarter, cash represented 15.02% of the assets.
For the second quarter ended February 29, 2016, the portfolio holdings of the Fund outperformed the Index. The investments of the Fund experienced a -5.76% return versus a return for the Index of -6.59%. The cash balance of the portfolio at second quarter-end was 6.86%, invested in cash and money funds while the equities represent 93.14% of the assets.
The broad sectors of the Index that improved the most on average during the second quarter were the Telecommunication Services (13.01%), Utilities (9.68%), and Consumer Staples (4.56%) sectors while the Financials (-10.98%), Energy (-10.97%), and the Consumer Discretionary (-7.40%) sectors were the lowest performing within the Index. The Index fell (to the lowest level since April 2014) after falling approximately 13.3% from its recent high. The subsequent bounce in the Index was almost 7%, while the Index closed the quarter slightly off that “bounce” level.
22
MONTEAGLE SELECT VALUE FUND
A DISCUSSION OF FUND PERFORMANCE (Unaudited) (Continued) |
As of the end of the second quarter, the portfolio holdings continued to be diversified across many sectors of the Index with less exposure to the Consumer Staple, Utilities and Communications sectors. The largest sector allocations are Consumer Discretionary, Industrial and Energy. The Fund’s positive portfolio performance was primarily attributed to its top performing stock picks of Mattel, Inc. (32.74%), Michael Kors Holdings (31.68%), and Fossil Group, Inc. (21.94%). The Fund’s portfolio performance was most negatively affected by Transocean LTD. (-39.76%), Conoco Philips (-36.48%) and United Rentals, Inc. (-34.45%). During the second quarter, five disposals were made. Some of these were sold in order to remove securities that achieved their target price and make room for securities with more appreciation potential. Others were sold in order to remove securities with large losses and little appreciation potential to achieve their target price. Moreover, these securities were sold under the procedural “out process” as determined by the holding period for the strategy. Subsequent to these disposals, three securities were purchased in securities with good appreciation potential according to the overriding investment strategy for the Fund. As of the end of the second quarter, cash represented 6.86% of the assets.
For the third quarter ended May 31, 2016, the portfolio holdings of the Fund underperformed the Index. The investments of the Fund experienced an 8.94% return versus a return for the Index of 9.12%. The cash balance of the portfolio at the third quarter-end was 0.59%, invested in cash and money funds while the equities represent 99.41% of the assets.
The broad sectors of the Index that improved the most on average during the third quarter were the Energy, Financials and the Materials sectors while the Telecommunication Services, Consumer Staples and Utilities sectors were the lowest performing within the Index. After the huge fall in the first two months of the year, the Index generally rose from the end of February through the end of May, ending the third quarter just off highs.
As of the end of the third quarter, the portfolio holdings continued to be diversified across many sectors of the Index with less exposure to the Utilities, Consumer Staple and Communications sectors. The largest sector allocations are Financial, Industrial and Consumer Discretionary. The Fund’s positive portfolio performance was primarily attributed to its top performing stock picks of Jacobs Engineering Group, Diamond Offshore Drilling and Freeport-McMoRan, Inc. The Fund’s portfolio performance was most negatively affected by Michael Kors Holdings, Fossil Group, Inc. and The Mosaic Co. During the third quarter, four disposals were made in order to remove securities that achieved their target price and make room for securities with more appreciation potential. These securities were sold under the procedural “out process” as determined by the holding period for the strategy. Subsequent to these disposals, twelve purchases were made during the remainder of the quarter. Some of these were “averaging into” existing securities while the majority were new securities. All of these exhibited good appreciation potential according to the overriding investment strategy for the Fund. As of the end of the third quarter, the Fund was fully invested with cash less than one percent of the assets.
For the fourth quarter ended August 31, 2016, the portfolio holdings of the Fund underperformed the Index. The investments of the Fund experienced a 3.65% return versus a return for the Index of 4.10%. For the year-to-date period ended August 31, 2016, the portfolio holdings of the Fund outperformed the Index with the investments of the Fund experiencing a 9.99% annualized return
23
MONTEAGLE SELECT VALUE FUND
A DISCUSSION OF FUND PERFORMANCE (Unaudited) (Continued) |
versus a 7.82% return for the Index. The rolling one-year return resulted in underperformance by the Fund, with a return of 4.75% versus 12.55% for the Index. The cash balance of the portfolio at quarter-end was 8.5%, invested in cash and money funds while the equities represent 91.5% of the assets.
The broad sectors of the Index that improved the most on average during the fourth quarter were the Information Technology, Real Estate (which is now separated from financials) and the Industrials sectors while the Utilities, Consumer Staples and Financials sectors were the lowest performing within the Index. The Index experienced another small correction of over 5% in June subsequent to the “Brexit” announcement but then fairly quickly returned back to “pre-Brexit” levels. The S&P 500 ended August near all-time highs.
As of the end of the fourth quarter and Fund year, the portfolio holdings continued to be diversified across many sectors of the Index with less exposure to the Real Estate (again, now separated from financials), Consumer Staples and Communications sectors. The largest sector allocations are Financial, Consumer Discretionary and Industrial. The Fund’s positive portfolio performance was primarily attributed to its top performing stock picks of Morgan Stanley, Michael Kors Holdings and The Mosaic Co. The Fund’s portfolio performance was most negatively affected by Darden Restaurants, Inc., Discovery Communications and Freeport-McMoRan, Inc. During the fourth quarter, three disposals were transacted in order to make room for securities with more appreciation potential. One of which, C.H. Robinson Worldwide, was sold after it achieved its target price. The other two disposals, Diamond Offshore Drilling and Xerox Corp., were sold after being non-performing securities that reached a maximum holding period. While sold to realize a loss, this will reduce the overall capital gains distribution that will occur later this year. All of these securities were sold under the procedural “out process” as determined by the holding period for the strategy. Subsequent to these disposals, no purchases were made in order to hold a slightly elevated level of cash with the market remaining near all-time highs. Moreover, as of the end of the fourth quarter and Fund year-end the cash balance was higher than typical.
What is the Fund’s strategy?
The Fund will continue to concentrate on equities contained in the S&P 500 which generally consists of large name brand corporations with good fundamentals and broad product diversification. The Fund’s adviser will continue to be disciplined in the use of its predominate strategy of reversion-to-the-mean by applying its “value investing” approach valuation model; thereby, allowing the market’s volatility to identify those securities that become under-valued and are poised to be the next performers in the market. Sector allocation in the Fund’s portfolio will primarily be determined by which companies are available for purchase pursuant to the Fund’s strategy. It is anticipated that the Fund may hold higher levels of cash during extended periods of market uncertainty and will selectively invest the cash into equities identified by the primary investment strategy as opportunities present themselves or for dollar-cost-averaging into currently held positions. This strategy is executed with a long-term outlook and will have periods of under-performance and out-performance versus its Index. Therefore, the Fund’s daily performance can and will vary dependant upon current market conditions.
24
MONTEAGLE SELECT VALUE FUND
A DISCUSSION OF FUND PERFORMANCE (Unaudited) (Continued) |
Fund performance shown represents the performance of the Fund’s Class I shares. For complete performance information, please refer to the Average Annual Total Return table in the following performance report. Past performance is not predictive of future performance. Investment results and principal value will fluctuate so that shares, when redeemed, may be worth more or less than their original cost. Current performance may be higher or lower than the performance data quoted. Performance data current to the most recent month-end, are available by calling 1-888-263-5593.
An investor should consider the investment objectives, risks, charges and expenses of the Fund carefully before investing. The Fund’s prospectus contains this and other important information. To obtain a copy of the Fund’s prospectus please call 1-888-263-5593 and a copy will be sent to you free of charge. Please read the prospectus carefully before you invest. The Fund is distributed by Matrix Capital Group, Inc.
Management’s Discussion of Fund Performance seeks to describe some of the Sub-Adviser’s current opinions and views of the financial markets. Although the Sub-Adviser believes it has a reasonable basis for any opinions or views expressed, actual results may differ, sometimes significantly so, from those expected or expressed.
25
MONTEAGLE SELECT VALUE FUND
PERFORMANCE — August 31, 2016 (Unaudited) |
Comparison of the Change in Value of a $50,000 Investment
in Monteagle Select Value Fund and the S&P 500 Index

Average Annual Total Return
(for the periods ended August 31, 2016) |
| | One Year | Five Years | Ten Years | |
Monteagle Select Value Fund | 4.75% | 14.18% | 5.50% | |
S&P 500 Index | 12.55% | 14.67% | 7.50% | |
The performance information quoted in this annual report assumes the reinvestment of all dividend and capital gain distributions, if any, and represents past performance, which is not a guarantee of future results. The returns shown do not reflect taxes that a shareholder would pay on Fund distributions or on the redemption of Fund shares. The investment return and principal value of an investment will fluctuate and, therefore, an investor’s shares, when redeemed, may be worth more or less than their original cost.
The above graph depicts the performance of the Monteagle Select Value Fund versus the S&P 500 Index. The S&P 500 Index by Standard and Poor’s Corp. is a capitalization-weighted index comprising 500 issues listed on various exchanges, representing the performance of the stock market generally. Please note that indices do not take into account any fees and expenses of investing in the individual securities that they track, and individuals cannot invest directly in any index.
As with any fund, save an index fund, that commonly compares its performance to the S&P 500 Index, such a comparison may be said to be inappropriate because of the dissimilarity between the Fund’s investments and the securities comprising the index; so too with the Monteagle Select Value Fund, which will not invest in certain securities comprising this index.
26
MONTEAGLE VALUE FUND
A DISCUSSION OF FUND PERFORMANCE (Unaudited) |
How did the Fund Perform?
For the year ended August 31, 2016, the Monteagle Value Fund (the “Fund”) reported a total return of positive 17.05%. The S&P 500 Index (“S&P 500”) had total returns of 12.55% for the same time period. The Fund’s net asset value per share as of August 31, 2016 was $14.41 versus $13.36 at August 31, 2015. The Fund paid a capital gains distribution of $0.85 per share in December, 2015.
What is the Fund’s investment approach?
The Fund’s investment goal is to achieve maximum returns through investing in undervalued companies. The Fund determines value usually based on price-to-earnings ratios, but also reviews historical price to book value ratios, dividend yield and balance sheet quality in determining whether prospective investments are truly undervalued. The adviser will hold 40 to 50 equities. The Fund seeks to maintain a minimum average market capitalization of $5 billion. The current average market capitalization exceeds $67 billion. The current price earnings ratio is 13.7 times 2017 earnings and currently yields 3.2 percent. The S&P 500 currently trades at 16.9 times 2017 earnings and yields 2.1 percent.
Fund’s adviser also makes industry determinations based upon interest rate cycles. Historical relationships between short-term and long-term U.S. Treasury securities impact industry weightings as easier money promotes growth in inflation while tight money favors disinflation.
As a general rule, new investments are made based on historical quantitative valuation measures that the Fund deems as undervalued. Conversely, the positions which are sold usually reach quantitative valuation measures that the Fund deems fully or overvalued. Decisions to reduce or sell partial holdings are based on industry overweightings.
The Fund also makes investments for the long-term holding the positions for three to five years unless extraordinary events such as mergers, acquisitions or deterioration of the industry or company.
What influenced the Fund’s performance?
During the year ended August 31, 2016, the Fund outperformed the S&P 500 as economically sensitive companies exhibited market strength in response to modest economic activity since February 2016. Many of the Fund’s holdings pay higher dividends than the S&P 500. The major market indices have more recently added growth companies into the respective index which pay lower or no dividend. Record low interest rates has market participants scrambling for yield.
The market responded to improving corporate earnings in 2016 with modest gains. The Federal Reserve has not raised interest rates since December 2015 primarily because corporate revenues have not grown in a meaningful way over the past twelve months. Targeted inflation rates of 2% have not been achieved. In fact, the fear is growing that the real prices in wages and finished goods are dropping, not rising. The unemployment rate has dropped below 4.9% in the past twelve months although an estimated 10 million workers have given up on looking for work. The very fact that three levels of aggressive monetary policy by the Federal Reserve has not produced the
27
MONTEAGLE VALUE FUND
A DISCUSSION OF FUND PERFORMANCE (Unaudited) (Continued) |
desired 2% inflation rate means that interest rate policy will not be changed in a meaningful way anytime soon. The Great Inflation has certainly been put on hold as disinflationary forces have quelled any hopes of a robust economy anytime soon.
During the first quarter ended November 30, 2015 the Fund underperformed the S&P 500 returning 4.22% versus 6.07% for the S&P 500. Generally speaking, most stocks reached intermediate lows at the very end of September. Commodity prices dropped to fifteen year lows during the quarter. Subsequently, energy stocks, mining stocks and their related industrials all declined during the period.
During the quarter the Fund made no changes in its holdings.
During the second quarter ended February 29, 2016 the Fund outperformed the S&P 500. During the quarter ended February 29, 2016 the Fund returned -4.61% versus -6.59% for the S&P 500. The Federal Reserve raised interest rates 0.25% during December 2015. Any future interest rate increases would be data dependent going forward.
During the quarter, the U.S. dollar continued to strengthen based on the increase in interest rates. Consequently, any commodity based industries saw prices capitulate at the end of 2015.
During the quarter the Fund sold Dupont, Chemours Company, D.R. Horton, NRG Energy, Holly Frontier, Barrick Gold, Freeport McMoran, Yamana Gold, and Medtronics PLC. Additionally, the Fund added positions in IBM, Archer Daniels-Midland, Ryder Systems, Qualcomm, International Paper, Eastman Chemical, Seagate Technology and Olin Corporation. The Fund increased its positions in Triumph Group and Greif Inc.
During the third quarter ended May 31, 2016 the Fund slightly outperformed the S&P 500 returning 9.79% versus 9.12%. The overall market appears to reach a bottom during early February as significant price appreciation in all industrial sectors occurred during the quarter. Money supply growth rose to 8% during the quarter supporting rising stock prices.
The Fund outperformed the S&P 500 during the quarter as prospects improved for the industrial companies the Fund has in its holdings. During the quarter, the Fund sold its positions in Ford Motor Co., Rogers Communications, Boston Scientific, Nomura Securities, and Tidewater, Inc. The Fund made new investments in Astra Zeneca, Pfizer, Inc., Cal-Maine Foods, Inc., and MDC Holdings.
During the August 31, 2016 quarter, the Fund outperformed the S&P 500 returning 7.24% versus 4.10%. Over the past twelve months, the Fund outperformed the S&P 500 returning 17.05% versus 12.55%. The overall stock market continues to be volatile yet exhibiting positive returns since February 2016. Since December 2015, interest rates set by the Federal Reserve have not changed as the overall economic data suggests that the economy is anemic at best.
We still believe the reasons for positive stock market returns for the next five years include historical low interest rates, improving housing market, and rising employment.
The Fund outperformed the S&P 500 because of the strength in the industrial sectors that the Fund holds. During the quarter, the Fund sold its positions in Republic Service Group, Worthington Industries, Sonoco, Abercrombie and Fitch, Triumph Group, Mosaic Co., and Transocean LTD.
28
MONTEAGLE VALUE FUND
A DISCUSSION OF FUND PERFORMANCE (Unaudited) (Continued) |
The Fund made new investments into Trinity Industries, Cooper Tire and Rubber, Pilgrim’s Pride, Schlumberger LTD, Macy’s, Inc., and American Railcar. The Fund increased its positions in Rayonier, Inc., and General Electric Co.
What is the Fund’s current strategy?
The Fund continues to focus on consistency in earnings in its holdings. The Fund remains committed to economically sensitive issues including telecommunications, pharmaceuticals, materials, and industrials. The Fund has a modest overweight in materials, telecommunications, and industrials as the economic recovery continues to sputter and recent Fed policy statements indicated they were concerned that it would be willing to accept higher inflation as it fends off deflationary forces. The Fund is underweight financials, health, technology, consumer discretion, and consumer staples. The Fund has increased its holdings into international ADR’s believing the worldwide recovery has begun.
Fund performance shown represents the performance of the Fund’s Class I shares. For complete performance information, please refer to the Average Annual Total Return table in the following performance report. Past performance is not predictive of future performance. Investment results and principal value will fluctuate so that shares, when redeemed, may be worth more or less than their original cost. Current performance may be higher or lower than the performance data quoted. Performance data current to the most recent month-end are available by calling 1-888-263-5593.
An investor should consider the investment objectives, risks, charges and expenses of the Fund carefully before investing. The Fund’s prospectus contains this and other important information. To obtain a copy of the Fund’s prospectus please call 1-888-263-5593 and a copy will be sent to you free of charge. Please read the prospectus carefully before you invest. The Fund is distributed by Matrix Capital Group, Inc.
Management’s Discussion of Fund Performance seeks to describe some of the Sub-Adviser’s current opinions and views of the financial markets. Although the Sub-Adviser believes it has a reasonable basis for any opinions or views expressed, actual results may differ, sometimes significantly so, from those expected or expressed.
29
MONTEAGLE VALUE FUND
PERFORMANCE — August 31, 2016 (Unaudited) |
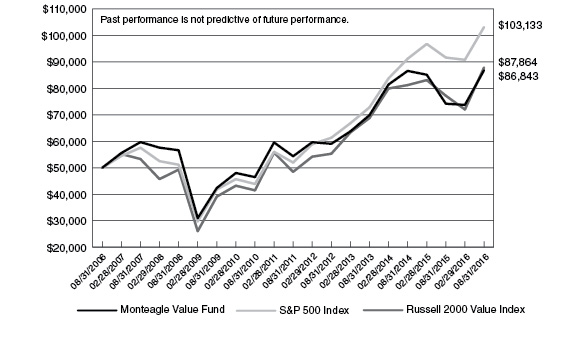
Comparison of the Change in Value of a $50,000 Investment
in Monteagle Value Fund, the S&P 500 Index and the Russell 2000 Value Index
Average Annual Total Return
(for the periods ended August 31, 2016) |
| | One Year | Five Years | Ten Years | |
Monteagle Value Fund | 17.05% | 9.82% | 5.68% | |
S&P 500 Index | 12.55% | 14.67% | 7.50% | |
Russell 2000 Value Index | 13.80% | 12.62% | 5.80% | |
The performance information quoted in this annual report assumes the reinvestment of all dividend and capital gain distributions, if any, and represents past performance, which is not a guarantee of future results. The returns shown do not reflect taxes that a shareholder would pay on Fund distributions or on the redemption of Fund shares. The investment return and principal value of an investment will fluctuate and, therefore, an investor’s shares, when redeemed, may be worth more or less than their original cost.
The above graph depicts the performance of the Monteagle Value Fund versus the S&P 500 Index and the Russell 2000 Value Index. The S&P 500 Index by Standard and Poor’s Corp. is a capitalization-weighted index comprising 500 issues listed on various exchanges, representing the performance of the stock market generally. The Russell 2000 Value Index measures the performance of small-cap value segment of the U.S. equity universe. It includes those Russell 2000 companies with lower price-to-book ratios and lower forecasted growth values. Please note that indices do not take into account any fees and expenses of investing in the individual securities that they track, and individuals cannot invest directly in any index.
As with any fund, save an index fund, that commonly compares its performance to the S&P 500 Index and the Russell 2000 Value Index, such a comparison may be said to be inappropriate because of the dissimilarity between the Fund’s investments and the securities comprising the indices; so too with the Monteagle Value Fund, which will not invest in certain securities comprising these indices.
30
THE TEXAS FUND
A DISCUSSION OF FUND PERFORMANCE (Unaudited) |
How did the Fund perform?
For the year ended August 31, 2016 The Texas Fund (the “Fund”) was down -0.45% for the one year trailing period while the S&P 500 Index (“S&P 500”) was up 12.55%. This period saw a continuation of lower energy prices as well as a more volatile market in the S&P 500. The worst period over the course of the past year was from November 5, 2015 to February 11, 2016 in both the Texas Fund (-17.80%) and the S&P 500 (-12.35%). From February 11, 2016 through August 31, 2016 the Texas Fund matched the S&P 500’s performance as it was up 20.16% with the S&P 500 also up 20.16%. The Fund’s net asset value per share as of August 31, 2016 was $8.88 versus $8.92 as of August 31, 2015.
What is the Fund’s investment approach?
The Fund’s investment goal is long-term capital appreciation. The Fund invests in a broad market capitalization across the various sectors and sizes of the Texas economy keeping 80% or more of the Fund invested in: 1) companies headquartered in Texas, 2) organized under Texas state laws, or 3) derive 50% of revenues or profits or have 50% of their assets in Texas. The adviser limits the pool of stocks considered for purchase to only those equities with market capitalization greater than $500 million. The adviser also limits the amount in any one sector to less than 25% of the overall portfolio of companies.
In selecting stocks, the Fund’s adviser ranks stocks in each sector with an A, B or C. An equal weighting is applied across the A ranking and B rankings for each sector with A’s weighted more heavily than B’s. C rankings are considered sells. Company rankings are determined by the Fund’s adviser after analyzing the financials, valuation, and growth prospects in comparison with their peers in the sector. The overall objective is to hold companies for a long term period to allow the capture of their growth within the Texas economy.
Since there are a number of small and mid-cap companies in Texas and the Fund advisers do not give specific preference to large caps, the Fund tends to have an average market capitalization between $4 billion to $6 billion. The Fund also maintains investments across the spectrum of Texas companies from those considered to be value companies to those considered growth companies.
What influenced the Fund’s performance?
The steep declines in energy prices going into the year that continued into 2016 made it difficult for management to outperform in the first and second quarter of the fiscal year. However, those quarters did provide some opportunities where management was able to add to companies at lower prices which began to help performance towards the end of the fiscal year.
First Quarter (8/31/2015-11/30/15)
The first quarter began after the broad markets had sold off nearly 10% in a couple of weeks near the end of August. This was a steady period for the Fund as it gained 0.22%. However, the S&P 500 gained 6.07%. Retail names (i.e. La Quinta, Mattress Firm, Fossil, etc) as well as energy
31
THE TEXAS FUND
A DISCUSSION OF FUND PERFORMANCE (Unaudited) (Continued) |
services struggled through this period. Technology firms (Texas Instruments, Solarwinds, Tyler Technologies, HomeAway) had a solid quarter along with Texas banks (Texas Capital Bancshares, Prosperity Bancshares, Legacy Texas Financial, Main Street Capital Corp).
Second Quarter (12/1/15-2/29/16)
This was the worst time period for the past year in overall markets as well as The Texas Fund. The S&P 500 lost 6.59% in this time period while the Texas Fund lost 13.42%. This quarter brought about broad selling in retail, energy and financials. Some defensive names (i.e. Waste Management, Waste Connections, Sysco) held on to positive returns but this was a broad and deep selloff. Management also had picked up a few natural gas focused names in December that performed well through this cycle.
Third Quarter (3/1/16-5/31/16)
For the third quarter, The Texas Fund returned 9.56% compared to the S&P 500’s 9.12%. Markets saw a reversal in this quarter as the market surged higher after the February bottom. Exploration and Production companies finally bottomed and had an outstanding quarter. Some retail names and refiners still struggled through this period but most sectors bounced back very well.
Fourth Quarter (6/1/16-8/31/16)
For the fourth quarter, the Texas Fund returned 4.72% beating the S&P 500’s 4.10% for the 2nd quarter in a row. Returns were mixed even within sectors for this quarter. The Fund saw a nice return on the Mattress Firm sale during the quarter and continued solid returns from areas related to energy. Management took the opportunity to add to some names that it rated highly that it felt had previously been oversold.
As the year came to a close, management felt that the Texas economy was picking back up on its growth path that was in place before the huge dip in energy prices hit the economy starting in July of 2015. It appears that energy prices and the U.S. dollar have entered a more stable period taking away a large headwind for Texas companies.
What is the Fund’s strategy?
The Fund will continue to concentrate on Texas based equities in order to take advantage of the Texas business climate and prospects for growth. The Fund’s Adviser will continue to evaluate and monitor the investments of the Fund to capture the growth in equities in the growing Texas economy. At the current point in time, the Adviser believes the growth of Texas businesses will outpace the overall U.S. and that difference will be passed on to investors. Therefore, the adviser seeks to maintain long term equity positions that grow in market cap with the Texas economy. The Fund has underperformed recently yet the sub-advisor expects that Texas companies are a long term growth area. The sub-advisor is compelled that investors are currently getting a very good value for average future earnings growth estimates when compared to the S&P 500 and sees no reason to change the investment approach.
32
THE TEXAS FUND
A DISCUSSION OF FUND PERFORMANCE (Unaudited) (Continued) |
It is anticipated that the Fund may hold higher levels of cash during extended periods of market uncertainty and will selectively increase options positions where the adviser sees a need for additional downside protection.
Fund performance shown represents the performance of the Fund’s Class I shares. For complete performance information, please refer to the Average Annual Total Return table in the following performance report. Past performance is not predictive of future performance. Investment results and principal value will fluctuate so that shares, when redeemed, may be worth more or less than their original cost. Current performance may be higher or lower than the performance data quoted. Performance data current to the most recent month-end, are available by calling 1-888-263-5593.
An investor should consider the investment objectives, risks, charges and expenses of the Fund carefully before investing. The Fund’s prospectus contains this and other important information. To obtain a copy of the Fund’s prospectus please call 1-888-263-5593 and a copy will be sent to you free of charge. Please read the prospectus carefully before you invest. The Fund is distributed by Matrix Capital Group, Inc.
Management’s Discussion of Fund Performance seeks to describe some of the Sub-Adviser’s current opinions and views of the financial markets. Although the Sub-Adviser believes it has a reasonable basis for any opinions or views expressed, actual results may differ, sometimes significantly so, from those expected or expressed.
33
THE TEXAS FUND
PERFORMANCE — August 31, 2016 (Unaudited) |
Comparision of the Change in Value of a $50,000 Investment
in The Texas Fund Class I shares and the S&P 500 Index

Average Annual Total Return
(for the periods ended August 31, 2016) |
| | One Year | Since
Inception(a) | |
The Texas Fund Class I | (0.45)% | (2.88)% | |
S&P 500 Index | 12.55% | 10.84% | |
(a) | Represents the period from the commencement of operations (September 17, 2013) through August 31, 2016. |
The performance information quoted in this annual report assumes the reinvestment of all dividend and capital gain distributions, if any, and represents past performance, which is not a guarantee of future results. The returns shown do not reflect taxes that a shareholder would pay on Fund distributions or on the redemption of Fund shares. The investment return and principal value of an investment will fluctuate and, therefore, an investor’s shares, when redeemed, may be worth more or less than their original cost.
The above graph depicts the performance of The Texas Fund versus the S&P 500 Index. The S&P 500 Index by Standard and Poor’s Corp. is a capitalization-weighted index comprising 500 issues listed on various exchanges, representing the performance of the stock market generally. Please note that indices do not take into account any fees and expenses of investing in the individual securities that they track, and individuals cannot invest directly in any index.
As with any fund, save an index fund, that commonly compares its performance to the S&P 500 Index, such a comparison may be said to be inappropriate because of the dissimilarity between the Fund’s investments and the securities comprising the index; so too with The Texas Fund, which will not invest in certain securities comprising this index.
34
MONTEAGLE FIXED INCOME FUND
SUPPLEMENTARY PORTFOLIO INFORMATION — August 31, 2016 (Unaudited) |
FUND PROFILE:
Top Ten Long-Term Portfolio Holdings | (% of Net Assets) |
U.S. Treasury Note, 1.75%, due 05/15/2022 | 3.92% |
U.S. Treasury Note, 1.625%, due 08/15/2022 | 3.89% |
FNMA Pool AB3690, 4.00%, due 10/01/2041 | 2.75% |
U.S. Treasury Note, 2.125%, due 08/15/2021 | 2.50% |
FHLMC, 4.875%, due 06/13/2018 | 2.05% |
Apple, Inc., 3.20%, 05/13/2025 | 2.05% |
U.S. Treasury Note, 2.25%, due 11/15/2024 | 2.02% |
QUALCOMM, Inc., 3.00%, 05/20/2022 | 2.02% |
FNMA, 2.125%%, 04/24/2026 | 1.96% |
FNMA Pool AU3763, 3.50%, due 08/01/2043 | 1.66% |
Sector Allocation | (% of Net Assets) |
Corporate Bonds | 46.29% |
U.S. Government and Agency Obligations | 28.19% |
Mortgage-Backed Securities | 16.21% |
Money Market Funds | 8.96% |
Other Assets in Excess of Liabilities | 0.35% |
| | 100.00% |
35
MONTEAGLE INFORMED INVESTOR GROWTH FUND
SUPPLEMENTARY PORTFOLIO INFORMATION — August 31, 2016 (Unaudited) |
FUND PROFILE:
Top Ten Long-Term Portfolio Holdings | (% of Net Assets) |
NVIDIA Corp. | 4.84% |
Amazon.com, Inc. | 4.67% |
NetEase, Inc. | 4.59% |
Facebook, Inc. - Class A | 4.59% |
SPDR S&P500 ETF Trust | 4.05% |
Powershares QQQ Trust Series 1 | 3.99% |
Align Technology, Inc. | 3.46% |
ABIOMED, Inc. | 3.37% |
Ulta Salon Cosmetics & Fragrance, Inc. | 3.00% |
Constellation Brands, Inc. - Class A | 2.98% |
Top Ten Portfolio Industries | (% of Net Assets) |
Internet | 12.13% |
Healthcare - Products | 8.83% |
Exchange Traded Funds | 8.03% |
Software | 7.47% |
Retail | 5.07% |
Semiconductors | 4.84% |
Beverages | 2.99% |
Commercial Services | 2.51% |
Telecommunications | 1.93% |
Insurance | 1.54% |
| | 55.34% |
Economic Sectors with Cash and Other Assets | (% of Net Assets) |
Money Market Funds | 33.13% |
Consumer, Non-cyclical | 15.27% |
Communications | 14.06% |
Technology | 12.31% |
Exchange Traded Funds | 8.03% |
Consumer, Cyclical | 5.07% |
Financial | 1.54% |
Industrial | 1.10% |
Basic Materials | 0.99% |
Other Assets in Excess of Liabilities | 8.50% |
| | 100.00% |
36
MONTEAGLE QUALITY GROWTH FUND
SUPPLEMENTARY PORTFOLIO INFORMATION — August 31, 2016 (Unaudited) |
FUND PROFILE:
Top Ten Long-Term Portfolio Holdings | (% of Net Assets) |
Apple, Inc. | 3.89% |
Home Depot, Inc. | 3.85% |
Walt Disney Co. | 3.59% |
Microsoft Corp. | 3.27% |
Visa, Inc. - Class A | 2.66% |
Amazon.com, Inc. | 2.64% |
CVS Health Corp. | 2.63% |
Coca-Cola Co. | 2.55% |
Johnson & Johnson | 2.55% |
Alphabet, Inc. - Class A | 2.54% |
Top Ten Portfolio Industries | (% of Net Assets) |
Retail | 11.88% |
Internet | 9.10% |
Media | 7.29% |
Biotechnology | 5.77% |
Pharmaceuticals | 5.62% |
Aerospace & Defense | 4.74% |
Computers | 4.47% |
Cosmetics & Personal Care | 4.14% |
Software | 3.99% |
Diversified Financial Services | 3.31% |
| | 60.31% |
Economic Sectors with Cash and Other Assets | (% of Net Assets) |
Consumer, Non-cyclical | 27.75% |
Communications | 17.57% |
Industrial | 14.99% |
Consumer, Cyclical | 13.63% |
Technology | 10.64% |
Financial | 6.96% |
Money Market Funds | 4.69% |
Basic Materials | 3.26% |
Energy | 0.29% |
Other Assets in Excess of Liabilities | 0.22% |
| | 100.00% |
37
MONTEAGLE SELECT VALUE FUND
SUPPLEMENTARY PORTFOLIO INFORMATION — August 31, 2016 (Unaudited) |
FUND PROFILE:
Top Ten Long-Term Portfolio Holdings | (% of Net Assets) |
Jacobs Engineering Group, Inc. | 5.52% |
Darden Restaurants, Inc. | 5.02% |
Morgan Stanley | 4.86% |
Michael Kors Holdings Ltd. | 4.84% |
Western Digital Corp. | 4.41% |
Apple, Inc. | 4.24% |
Caterpillar, Inc. | 3.70% |
Discovery Communications, Inc. - Class A | 3.45% |
Ameriprise Financial, Inc. | 3.23% |
Baker Hughes, Inc. | 3.10% |
Top Ten Portfolio Industries | (% of Net Assets) |
Retail | 9.69% |
Banks | 9.08% |
Computers | 8.65% |
Diversified Financial Services | 8.62% |
Oil & Gas Services | 5.77% |
Engineering & Construction | 5.52% |
Media | 5.41% |
Apparel | 4.84% |
Machinery - Construction & Mining | 3.70% |
Commercial Services | 3.03% |
| | 64.31% |
Economic Sectors with Cash and Other Assets | (% of Net Assets) |
Financial | 22.55% |
Consumer, Cyclical | 18.40% |
Industrial | 15.37% |
Technology | 11.29% |
Money Market Funds | 10.49% |
Energy | 8.53% |
Basic Materials | 6.94% |
Communications | 5.41% |
Consumer, Non-cyclical | 3.03% |
Liabilities in Excess of Other Assets | (2.01)% |
| | 100.00% |
38
MONTEAGLE VALUE FUND
SUPPLEMENTARY PORTFOLIO INFORMATION — August 31, 2016 (Unaudited) |
FUND PROFILE:
Top Ten Long-Term Portfolio Holdings | (% of Net Assets) |
Cirrus Logic, Inc. | 4.87% |
AT & T, Inc. | 4.13% |
Stepan Co. | 3.19% |
Verizon Communications, Inc. | 3.17% |
Intel Corp. | 3.08% |
Merck & Co., Inc. | 2.90% |
Greif, Inc. - Class A | 2.86% |
Pfizer, Inc. | 2.63% |
QUALCOMM, Inc. | 2.61% |
General Electric Co. | 2.55% |
Top Ten Portfolio Industries | (% of Net Assets) |
Semiconductors | 12.41% |
Pharmaceuticals | 9.13% |
Chemicals | 8.93% |
Miscellaneous Manufacturing | 8.76% |
Telecommunications | 8.34% |
Food | 5.71% |
Retail | 4.01% |
Transportation | 3.82% |
Computers | 3.76% |
Iron & Steel | 3.64% |
| | 68.51% |
Economic Sectors with Cash and Other Assets | (% of Net Assets) |
Industrial | 19.19% |
Consumer, Non-cyclical | 17.38% |
Technology | 16.17% |
Basic Materials | 15.11% |
Consumer, Cyclical | 10.34% |
Communications | 8.34% |
Money Market Funds | 7.60% |
Energy | 5.20% |
Financial | 3.84% |
Liabilities in Excess of Other Assets | (3.17)% |
| | 100.00% |
39
THE TEXAS FUND
SUPPLEMENTARY PORTFOLIO INFORMATION — August 31, 2016 (Unaudited) |
FUND PROFILE:
Top Ten Long-Term Portfolio Holdings | (% of Net Assets) |
Rackspace Hosting, Inc. | 2.01% |
Dave & Buster's Entertainment, Inc. | 1.82% |
Cardtronics PLC - Class A | 1.82% |
AZZ, Inc. | 1.81% |
Benchmark Electronics, Inc. | 1.81% |
Texas Instruments, Inc. | 1.80% |
First Financial Bankshares, Inc. | 1.79% |
Lennox International, Inc. | 1.79% |
Cullen/Frost Bankers, Inc. | 1.77% |
Diodes, Inc. | 1.74% |
Top Ten Portfolio Industries | (% of Net Assets) |
Oil & Gas | 13.79% |
Banks | 9.96% |
Retail | 9.26% |
Building Materials | 5.90% |
Semiconductors | 4.93% |
Food | 4.54% |
Software | 3.73% |
Electronics | 3.41% |
Miscellaneous Manufacturing | 3.40% |
Environmental Control | 3.25% |
| | 62.17% |
Economic Sectors with Cash and Other Assets | (% of Net Assets) |
Industrial | 18.68% |
Energy | 18.62% |
Consumer, Cyclical | 18.60% |
Consumer, Non-cyclical | 14.12% |
Financial | 12.80% |
Technology | 10.05% |
Money Market Funds | 7.14% |
Basic Materials | 3.82% |
Communications | 1.84% |
Liabilities in Excess of Other Assets | (5.67)% |
| | 100.00% |
40
MONTEAGLE FIXED INCOME FUND
SCHEDULE OF INVESTMENTS — August 31, 2016 |
Par Value | | U.S. GOVERNMENT AND AGENCY OBLIGATIONS (b) - 28.19% | | Fair Value | |
| | | U.S. Treasury Notes - 19.91% | | | |
$ | 250,000 | | 1.50%, due 02/28/2019 | | $ | 253,974 | |
| | 250,000 | | 1.50%, due 08/31/2018 | | | 253,408 | |
| | 2,000,000 | | 1.625%, due 08/15/2022 | | | 2,033,984 | |
| | 2,000,000 | | 1.75%, due 05/15/2022 | | | 2,049,102 | |
| | 250,000 | | 1.75%, due 09/30/2019 | | | 256,118 | |
| | 250,000 | | 2.00%, due 02/15/2022 | | | 259,590 | |
| | 250,000 | | 2.125%, due 06/30/2022 | | | 261,186 | |
| | 1,250,000 | | 2.125%, due 08/15/2021 | | | 1,304,370 | |
| | 250,000 | | 2.25%, due 03/31/2021 | | | 261,973 | |
| | 1,000,000 | | 2.25, due 11/15/2024 | | | 1,056,738 | |
| | 250,000 | | 2.50%, due 08/15/2023 | | | 267,798 | |
| | 750,000 | | 2.625%, due 08/15/2020 | | | 794,078 | |
| | 250,000 | | 3.50%, due 02/15/2018 | | | 259,878 | |
| | 250,000 | | 3.625%, due 02/15/2020 | | | 272,110 | |
| | 500,000 | | 3.625%, due 02/15/2021 | | | 553,183 | |
| | 250,000 | | 4.75%, due 08/15/2017 | | | 259,686 | |
| | | | | | | 10,397,176 | |
| | | | Federal Home Loan Mortgage Corporation - 3.81% | | | | |
| | 500,000 | | 1.75%, due 05/30/2019 | | | 510,821 | |
| | 210,000 | | 2.375%, due 03/13/2026 | | | 219,336 | |
| | 1,000,000 | | 4.875%, due 06/13/2018 | | | 1,070,743 | |
| | 175,000 | | 5.00%, due 12/14/2018 | | | 190,888 | |
| | | | | | | 1,991,788 | |
| | | | Federal National Mortgage Association - 4.47% | | | | |
| | 500,000 | | 1.875%, due 09/18/2018 | | | 509,650 | |
| | 1,000,000 | | 2.125%, due 04/24/2026 | | | 1,022,890 | |
| | 750,000 | | 2.625%, due 09/06/2024 | | | 803,694 | |
| | | | | | | 2,336,234 | |
| | | | | | | | |
| | | | Total U.S. Government and Agency Obligations (Cost $14,428,647) | | | 14,725,198 | |
Par Value | | CORPORATE BONDS (b) - 46.29% | | Fair Value | |
| | | Agriculture - 0.99% | | | |
$ | 500,000 | | Philip Morris International, Inc., 2.50%, due 08/22/2022 | | $ | 515,082 | |
| | | | | | | | |
| | | | Banks - 9.96% | | | | |
| | 500,000 | | Goldman Sachs Group, Inc., 5.95%, due 01/18/2018 | | | 530,120 | |
| | 500,000 | | JPMorgan Chase & Co., 4.35%, due 08/15/2021 | | | 551,642 | |
| | 500,000 | | JPMorgan Chase & Co., 6.00%, due 01/15/2018 | | | 530,828 | |
| | 500,000 | | Manufacturers & Traders Trust Co., 1.45%, due 03/07/2018 | | | 500,942 | |
| | 500,000 | | Northern Trust Corp., 2.375%, due 08/02/2022 | | | 511,922 | |
| | 500,000 | | PNC Funding Corp., 4.375%, due 08/11/2020 | | | 548,406 | |
The accompanying notes are an integral part of the financial statements.
41
MONTEAGLE FIXED INCOME FUND
SCHEDULE OF INVESTMENTS — August 31, 2016 (Continued) |
Par Value | | CORPORATE BONDS (b) - 46.29% (Continued) | | Fair Value | |
| | | Banks - 9.96% (Continued) | | | |
$ | 500,000 | | U.S. Bancorp, 2.20%, due 11/15/2016 | | $ | 500,817 | |
| | 500,000 | | Wells Fargo & Co., 1.15%, 06/02/2017 | | | 500,119 | |
| | 500,000 | | Wells Fargo & Co., 3.45%, 02/13/2023 | | | 524,908 | |
| | 500,000 | | Westpac Banking Corp., 2.00%, due 08/14/2017 | | | 503,596 | |
| | | | | | | 5,203,300 | |
| | | | Beverages - 1.61% | | | | |
| | 750,000 | | Anheuser-Busch, Inc., 5.375%, due 01/15/2020 | | | 840,272 | |
| | | | | | | | |
| | | | Computers - 3.20% | | | | |
| | 1,000,000 | | Apple, Inc., 3.20%, 05/13/2025 | | | 1,069,129 | |
| | 600,000 | | International Business Machines Corp., 1.25%, 02/08/2018 | | | 602,848 | |
| | | | | | | 1,671,977 | |
| | | | Diversified Financial Services - 0.51% | | | | |
| | 250,000 | | CME Group, Inc., 3.00%, due 09/15/2022 | | | 264,933 | |
| | | | | | | | |
| | | | Electric - 2.65% | | | | |
| | 500,000 | | Duke Energy Florida LLC, 4.55%, due 04/01/2020 | | | 550,211 | |
| | 770,000 | | Georgia Power Co., 4.25%, due 12/01/2019 | | | 834,287 | |
| | | | | | | 1,384,498 | |
| | | | Electrical Components & Equipment - 0.48% | | | | |
| | 250,000 | | Emerson Electric Co., 5.125%, due 12/01/2016 | | | 252,559 | |
| | | | | | | | |
| | | | Engineering & Construction - 0.72% | | | | |
| | 350,000 | | Fluor Corp., 3.50% due 12/15/2024 | | | 374,851 | |
| | | | | | | | |
| | | | Healthcare - Products - 2.02% | | | | |
| | 750,000 | | Becton Dickinson and Co., 3.125%, due 11/08/2021 | | | 791,894 | |
| | 250,000 | | Medtronic, Inc., 3.125%, 03/15/2022 | | | 264,884 | |
| | | | | | | 1,056,778 | |
| | | | Insurance - 2.56% | | | | |
| | 500,000 | | Berkshire Hathaway Finance Corp., 3.00%, due 05/15/2022 | | | 529,618 | |
| | 750,000 | | Chubb Corp., 5.75%, due 05/15/2018 | | | 806,604 | |
| | | | | | | 1,336,222 | |
| | | | Machinery - Diversified - 1.57% | | | | |
| | 750,000 | | Deere & Co., 4.375%, due 10/16/2019 | | | 820,931 | |
| | | | | | | | |
| | | | Metal Fabricate & Hardware - 0.99% | | | | |
| | 500,000 | | Precision Castparts Corp., 2.50%, due 01/15/2023 | | | 518,975 | |
| | | | | | | | |
| | | | Miscellaneous Manufacturing - 3.08% | | | | |
| | 250,000 | | 3M Co., 1.00%, due 06/26/2017 | | | 250,181 | |
| | 250,000 | | 3M Co., 2.00%, due 06/26/2022 | | | 255,020 | |
| | 500,000 | | General Electric Capital Corp., 3.15%, due 09/07/2022 | | | 534,639 | |
| | 500,000 | | General Electric Capital Corp., 5.55%, due 05/04/2020 | | | 570,322 | |
| | | | | | | 1,610,162 | |
The accompanying notes are an integral part of the financial statements.
42
MONTEAGLE FIXED INCOME FUND
SCHEDULE OF INVESTMENTS — August 31, 2016 (Continued) |
Par Value | | CORPORATE BONDS (b) - 46.29% (Continued) | | Fair Value | |
| | | Oil & Gas - 3.25% | | | |
$ | 500,000 | | BP Capital Markets PLC, 2.50%, due 11/06/2022 | | $ | 507,340 | |
| | 250,000 | | BP Capital Markets PLC, 4.75%, due 03/10/2019 | | | 270,430 | |
| | 200,000 | | Chevron Corp., 2.566%, due 05/16/2023 | | | 204,685 | |
| | 200,000 | | Chevron Corp., 2.954%, due 05/16/2026 | | | 208,846 | |
| | 250,000 | | Shell International Finance BV, 1.125%, due 08/21/2017 | | | 250,131 | |
| | 250,000 | | Shell International Finance BV, 2.375%, due 08/21/2022 | | | 255,294 | |
| | | | | | | 1,696,726 | |
| | | | Oil & Gas Services - 1.45% | | | | |
| | 750,000 | | Halliburton Co., 2.00%, due 08/01/2018 | | | 754,954 | |
| | | | | | | | |
| | | | Pharmaceuticals - 2.00% | | | | |
| | 500,000 | | AstraZeneca PLC, 1.95%, due 09/18/2019 | | | 508,423 | |
| | 500,000 | | GlaxoSmithKline Capital, Inc., 5.65%, due 05/15/2018 | | | 537,145 | |
| | | | | | | 1,045,568 | |
| | | | Real Estate Investment Trusts - 1.46% | | | | |
| | 750,000 | | Simon Property Group LP, 2.20%, due 02/01/2019 | | | 764,913 | |
| | | | | | | | |
| | | | Retail - 0.97% | | | | |
| | 250,000 | | Costco Wholesale Corp., 1.125%, due 12/15/2017 | | | 250,678 | |
| | 250,000 | | Costco Wholesale Corp., 1.70%, due 12/15/2019 | | | 253,939 | |
| | | | | | | 504,617 | |
| | | | Semiconductors - 2.69% | | | | |
| | 350,000 | | Intel Corp., 1.35%, 12/15/2017 | | | 351,635 | |
| | 1,000,000 | | Qualcomm, Inc., 3.00%, 05/20/2022 | | | 1,053,524 | |
| | | | | | | 1,405,159 | |
| | | | Software - 0.98% | | | | |
| | 500,000 | | Oracle Corp., 2.50%, due 10/15/2022 | | | 514,420 | |
| | | | | | | | |
| | | | Telecommunications - 3.15% | | | | |
| | 750,000 | | AT&T, Inc., 5.80%, due 02/15/2019 | | | 826,498 | |
| | 750,000 | | Cisco Systems, Inc., 4.95%, due 02/15/2019 | | | 817,205 | |
| | | | | | | 1,643,703 | |
| | | | | | | | |
| | | | Total Corporate Bonds (Cost $23,414,008) | | | 24,180,600 | |
Par Value | | MORTGAGE-BACKED SECURITIES (b) - 16.21% | | Fair Value | |
| | | Federal Home Loan Mortgage Corporation - 6.00% | | | |
$ | 251,848 | | Pool A94289, 4.00%, due 10/01/2040 | | $ | 270,672 | |
| | 169,903 | | Pool A947184, 4.50%, due 02/01/2041 | | | 187,047 | |
| | 289,423 | | Pool G07163, 3.50%, due 10/01/2042 | | | 307,574 | |
| | 709,057 | | Pool G07961, 3.50%, due 03/01/2045 | | | 753,435 | |
| | 716,756 | | Pool G08618, 4.00%, due 12/01/2044 | | | 767,032 | |
The accompanying notes are an integral part of the financial statements.
43
MONTEAGLE FIXED INCOME FUND
SCHEDULE OF INVESTMENTS — August 31, 2016 (Continued) |
Par Value | | MORTGAGE-BACKED SECURITIES (b) - 16.21% (Continued) | | Fair Value | |
| | | Federal Home Loan Mortgage Corporation - 6.00% (Continued) | | | |
$ | 378,962 | | Pool J19285, 2.50%, due 06/01/2027 | | $ | 392,276 | |
| | 302,775 | | Pool Q15767, 3.00%, due 02/01/2043 | | | 316,990 | |
| | 43,607 | | Series 15L, 7.00%, due 07/25/2023 | | | 49,247 | |
| | 89,694 | | Series 2841 BY, 5.00%, due 08/15/2019 | | | 92,808 | |
| | | | | | | 3,137,081 | |
| | | | Federal National Mortgage Association - 9.48% | | | | |
| | 55,847 | | Pool 545759, 6.50%, due 07/01/2032 | | | 65,880 | |
| | 1,129 | | Pool 725421, 7.00%, due 09/01/2017 | | | 1,140 | |
| | 31,063 | | Pool 754289, 6.00%, due 11/01/2033 | | | 35,959 | |
| | 52,726 | | Pool 882684, 6.00%, due 06/01/2036 | | | 60,327 | |
| | 1,335,419 | | Pool AB3690, 4.00%, due 10/01/2041 | | | 1,437,930 | |
| | 196,810 | | Pool AB8898, 3.00%, due 04/01/2043 | | | 204,760 | |
| | 372,351 | | Pool AB9238, 3.00%, due 05/01/2043 | | | 388,931 | |
| | 354,313 | | Pool AK3402, 4.00%, due 02/01/2042 | | | 381,156 | |
| | 358,298 | | Pool AL1869, 3.00%, due 06/01/2027 | | | 377,054 | |
| | 258,538 | | Pool AL5097, 4.50%, due 09/01/2043 | | | 283,456 | |
| | 250,905 | | Pool AL7729, 4.00%, due 06/01/2043 | | | 269,459 | |
| | 222,941 | | Pool AO0763, 4.00%, due 04/01/2042 | | | 241,320 | |
| | 252,244 | | Pool AU1619, 3.50%, due 07/01/2043 | | | 266,960 | |
| | 820,238 | | Pool AU3763, 3.50%, due 08/01/2043 | | | 868,953 | |
| | 59,946 | | Series 2007-40-PT, 5.50%, due 05/25/2037 | | | 67,377 | |
| | | | | | | 4,950,662 | |
| | | | Government National Mortgage Association - 0.73% | | | | |
| | 68,213 | | Pool 476998, 6.50%, due 07/15/2029 | | | 78,592 | |
| | 24,592 | | Pool 648337, 5.00%, due 10/15/2020 | | | 26,068 | |
| | 20,890 | | Pool 676516, 6.00%, due 02/15/2038 | | | 23,888 | |
| | 57,527 | | Series 2012-52-PM, 3.50%, due 12/20/2039 | | | 60,288 | |
| | 188,407 | | Series 2012-91-HQ, 2.00%, due 09/20/2041 | | | 192,177 | |
| | | | | | | 381,013 | |
| | | | | | | | |
| | | | Total Mortgage-Backed Securities (Cost $8,312,624) | | | 8,468,756 | |
The accompanying notes are an integral part of the financial statements.
44
MONTEAGLE FIXED INCOME FUND
SCHEDULE OF INVESTMENTS — August 31, 2016 (Continued) |
Shares | | MONEY MARKET FUND - 8.96% | | Fair Value | |
| | 4,680,528 | | Fidelity Prime Money Market Portfolio Class I, 0.42% (a) (Cost $4,680,528) | | $ | 4,680,528 | |
| | | | | | | | |
| | | | Total Investments at Fair Value - 99.65% (Cost $50,835,807) | | $ | 52,055,082 | |
| | | | | | | | |
| | | | Other Assets in Excess of Liabilities, Net - 0.35% | | | 181,945 | |
| | | | | | | | |
| | | | Net Assets - 100.00% | | $ | 52,237,027 | |
(a) | Rate shown represents the 7-day yield at August 31, 2016, is subject to change and resets daily. |
(b) | Categorized in level 2 of the fair value hierarchy; for additional information and description of the levels, refer to the table included in Note 2 of the accompanying notes to the financial statements. |
The accompanying notes are an integral part of the financial statements.
45
MONTEAGLE INFORMED INVESTOR GROWTH FUND
SCHEDULE OF INVESTMENTS — August 31, 2016 |
Shares | | COMMON STOCKS - 50.34% | | Fair Value | |
| | | Beverages - 2.99% | | | |
| | 2,100 | | Constellation Brands, Inc. - Class A | | $ | 344,505 | |
| | | | | | | | |
| | | | Building Materials - 1.10% | | | | |
| | 2,000 | | Fortune Brands Home & Security, Inc. | | | 127,120 | |
| | | | | | | | |
| | | | Commercial Services - 2.51% | | | | |
| | 2,200 | | Equifax, Inc. | | | 290,180 | |
| | | | | | | | |
| | | | Healthcare - Products - 8.83% | | | | |
| | 3,300 | | ABIOMED, Inc. (a) | | | 389,202 | |
| | 4,300 | | Align Technology, Inc. (a) | | | 399,470 | |
| | 2,000 | | Edwards Lifesciences Corp. (a) | | | 230,320 | |
| | | | | | | 1,018,992 | |
| | | | Healthcare - Services - 0.94% | | | | |
| | 800 | | UnitedHealth Group, Inc. | | | 108,840 | |
| | | | | | | | |
| | | | Insurance - 1.54% | | | | |
| | 2,300 | | Cincinnati Financial Corp. | | | 177,353 | |
| | | | | | | | |
| | | | Internet - 12.13% | | | | |
| | 700 | | Amazon.com, Inc. (a) | | | 538,412 | |
| | 10,300 | | eBay, Inc. (a) | | | 331,248 | |
| | 4,200 | | Facebook, Inc. - Class A (a) | | | 529,704 | |
| | | | | | | 1,399,364 | |
| | | | Mining - 0.99% | | | | |
| | 4,500 | | Silver Wheaton Corp. | | | 113,985 | |
| | | | | | | | |
| | | | Retail - 5.07% | | | | |
| | 1,600 | | Domino's Pizza, Inc. | | | 239,312 | |
| | 1,400 | | Ulta Salon Cosmetics & Fragrance, Inc. (a) | | | 346,094 | |
| | | | | | | 585,406 | |
| | | | Semiconductors - 4.84% | | | | |
| | 9,100 | | NVIDIA Corp. | | | 558,194 | |
| | | | | | | | |
| | | | Software - 7.47% | | | | |
| | 4,800 | | Broadridge Financial Solutions, Inc. | | | 332,640 | |
| | 2,500 | | NetEase, Inc. | | | 529,925 | |
| | | | | | | 862,565 | |
| | | | Telecommunications - 1.93% | | | | |
| | 2,000 | | Acacia Communications, Inc. (a) | | | 223,300 | |
| | | | | | | | |
| | | | Total Common Stocks (Cost $5,409,459) | | | 5,809,804 | |
The accompanying notes are an integral part of the financial statements.
46
MONTEAGLE INFORMED INVESTOR GROWTH FUND
SCHEDULE OF INVESTMENTS — August 31, 2016 (Continued) |
Shares | | EXCHANGE-TRADED FUNDS - 8.03% | | Fair Value | |
| | | Equity Fund - 8.03% | | | |
| | 3,950 | | Powershares QQQ Trust Series 1 | | $ | 459,938 | |
| | 2,150 | | SPDR S&P 500 ETF Trust | | | 467,496 | |
| | | | | | | 927,434 | |
| | | | | | | | |
| | | | Total Exchange-Traded Funds (Cost $874,495) | | | 927,434 | |
Shares | | MONEY MARKET FUND - 33.13% | | Fair Value | |
| | 3,823,440 | | Fidelity Prime Money Market Portfolio Class I, 0.42% (b)(c) (Cost $3,823,440) | | $ | 3,823,440 | |
| | | | | | | | |
| | | | Total Investments at Fair Value - 91.50% (Cost $10,107,394) | | $ | 10,560,678 | |
| | | | | | | | |
| | | | Other Assets in Excess of Liabilities, Net - 8.50% | | | 980,544 | |
| | | | | | | | |
| | | | Net Assets - 100.00% | | $ | 11,541,222 | |
(a) | Non-income producing security. |
(b) | Rate shown represents the 7-day yield at August 31, 2016, is subject to change and resets daily. |
(c) | A copy of the Fidelity Prime Money Market Portfolio Institutional Class annual report can be found at https://www.sec.gov/Archives/edgar/data/356173/000137949116004375/filing700.htm. |
The accompanying notes are an integral part of the financial statements.
47
MONTEAGLE QUALITY GROWTH FUND
SCHEDULE OF INVESTMENTS — August 31, 2016 |
Shares | | COMMON STOCKS - 95.09% | | Fair Value | |
| | | Aerospace & Defense - 4.74% | | | |
| | 966 | | Boeing Co. | | $ | 125,049 | |
| | 2,593 | | Lockheed Martin Corp. | | | 630,021 | |
| | 1,249 | | Northrop Grumman Corp. | | | 264,875 | |
| | 2,067 | | Orbital ATK, Inc. | | | 155,914 | |
| | | | | | | 1,175,859 | |
| | | | Agriculture - 1.00% | | | | |
| | 3,741 | | Altria Group, Inc. | | | 247,243 | |
| | | | | | | | |
| | | | Apparel - 1.75% | | | | |
| | 3,245 | | Hanesbrands, Inc. | | | 86,122 | |
| | 2,925 | | NIKE, Inc. - Class B | | | 168,597 | |
| | 1,733 | | Ralph Lauren Corp. | | | 179,573 | |
| | | | | | | 434,292 | |
| | | | Banks - 1.89% | | | | |
| | 1,463 | | Goldman Sachs Group, Inc. | | | 247,920 | |
| | 4,322 | | Wells Fargo & Co. | | | 219,558 | |
| | | | | | | 467,478 | |
| | | | Beverages - 2.55% | | | | |
| | 14,528 | | Coca-Cola Co. | | | 630,951 | |
| | | | | | | | |
| | | | Biotechnology - 5.77% | | | | |
| | 492 | | Alexion Pharmaceuticals, Inc. (a) | | | 61,923 | |
| | 1,054 | | Amgen, Inc. | | | 179,243 | |
| | 651 | | Biogen, Inc. (a) | | | 198,965 | |
| | 4,406 | | Celgene Corp. (a) | | | 470,296 | |
| | 6,626 | | Gilead Sciences, Inc. | | | 519,346 | |
| | | | | | | 1,429,773 | |
| | | | Chemicals - 3.26% | | | | |
| | 4,650 | | Albemarle Corp. | | | 371,860 | |
| | 3,002 | | CF Industries Holdings, Inc. | | | 78,052 | |
| | 2,926 | | Praxair, Inc. | | | 357,089 | |
| | | | | | | 807,001 | |
| | | | Commercial Services - 1.44% | | | | |
| | 9,619 | | PayPal Holdings, Inc. (a) | | | 357,346 | |
| | | | | | | | |
| | | | Computers - 4.47% | | | | |
| | 9,081 | | Apple, Inc. | | | 963,494 | |
| | 900 | | International Business Machines Corp. | | | 142,992 | |
| | | | | | | 1,106,486 | |
| | | | Cosmetics & Personal Care - 4.14% | | | | |
| | 6,999 | | Colgate-Palmolive Co. | | | 520,306 | |
| | 2,953 | | Estee Lauder Cos., Inc. | | | 263,496 | |
| | 2,770 | | Procter & Gamble Co. | | | 241,849 | |
| | | | | | | 1,025,651 | |
The accompanying notes are an integral part of the financial statements.
48
MONTEAGLE QUALITY GROWTH FUND
SCHEDULE OF INVESTMENTS — August 31, 2016 (Continued) |
Shares | | COMMON STOCKS - 95.09% (Continued) | | Fair Value | |
| | | Diversified Financial Services - 3.31% | | | |
| | 5,851 | | Synchrony Financial | | $ | 162,833 | |
| | 8,140 | | Visa, Inc. - Class A | | | 658,526 | |
| | | | | | | 821,359 | |
| | | | Electrical Components & Equipment - 1.55% | | | | |
| | 5,288 | | AMETEK, Inc. | | | 257,790 | |
| | 3,381 | | Generac Holdings, Inc. (a) | | | 126,111 | |
| | | | | | | 383,901 | |
| | | | Electronics - 2.83% | | | | |
| | 4,290 | | Amphenol Corp. - Class A | | | 267,310 | |
| | 8,150 | | FLIR Systems, Inc. | | | 251,264 | |
| | 6,669 | | Trimble Navigation Ltd. (a) | | | 182,731 | |
| | | | | | | 701,305 | |
| | | | Food - 1.67% | | | | |
| | 2,585 | | McCormick & Co., Inc. | | | 263,567 | |
| | 4,933 | | Whole Foods Market, Inc. | | | 149,865 | |
| | | | | | | 413,432 | |
| | | | Healthcare - Products - 5.57% | | | | |
| | 5,592 | | Baxter International, Inc. | | | 261,314 | |
| | 1,872 | | Cigna Corp. | | | 240,103 | |
| | 2,840 | | Edwards Lifesciences Corp. (a) | | | 327,054 | |
| | 4,066 | | UnitedHealth Group, Inc. | | | 553,179 | |
| | | | | | | 1,381,650 | |
| | | | Internet - 9.10% | | | | |
| | 798 | | Alphabet, Inc. - Class A (a) | | | 630,300 | |
| | 511 | | Alphabet, Inc. - Class C (a) | | | 391,963 | |
| | 850 | | Amazon.com, Inc. (a) | | | 653,786 | |
| | 5,738 | | eBay, Inc. (a) | | | 184,534 | |
| | 3,133 | | Facebook, Inc. - Class A (a) | | | 395,134 | |
| | | | | | | 2,255,717 | |
| | | | Machinery - Construction & Mining - 1.89% | | | | |
| | 1,604 | | Caterpillar, Inc. | | | 131,448 | |
| | 1,895 | | Roper Technologies, Inc. | | | 336,457 | |
| | | | | | | 467,905 | |
| | | | Media - 7.29% | | | | |
| | 9,057 | | Comcast Corp. - Class A | | | 591,060 | |
| | 4,306 | | DISH Network Corp. - Class A (a) | | | 216,290 | |
| | 7,762 | | Time, Inc. | | | 109,444 | |
| | 9,410 | | Walt Disney Co. | | | 888,869 | |
| | | | | | | 1,805,663 | |
| | | | Miscellaneous Manufacturing - 2.10% | | | | |
| | 2,910 | | 3M Co. | | | 521,588 | |
The accompanying notes are an integral part of the financial statements.
49
MONTEAGLE QUALITY GROWTH FUND
SCHEDULE OF INVESTMENTS — August 31, 2016 (Continued) |
Shares | | COMMON STOCKS - 95.09% (Continued) | | Fair Value | |
| | | Oil & Gas - 0.29% | | | |
| | 203 | | Concho Resources, Inc. (a) | | $ | 26,228 | |
| | 522 | | Exxon Mobil Corp. | | | 45,487 | |
| | | | | | | 71,715 | |
| | | | Pharmaceuticals - 5.62% | | | | |
| | 5,085 | | Bristol-Myers Squibb Co. | | | 291,828 | |
| | 2,294 | | Eli Lilly & Co. | | | 178,358 | |
| | 4,001 | | Express Scripts Holding Co. (a) | | | 290,873 | |
| | 5,285 | | Johnson & Johnson | | | 630,712 | |
| | | | | | | 1,391,771 | |
| | | | Real Estate Investment Trusts - 1.76% | | | | |
| | 854 | | American Tower Corp. | | | 96,827 | |
| | 4,430 | | Welltower, Inc. | | | 340,002 | |
| | | | | | | 436,829 | |
| | | | Retail - 11.88% | | | | |
| | 1,106 | | Costco Wholesale Corp. | | | 179,272 | |
| | 6,979 | | CVS Health Corp. | | | 651,839 | |
| | 822 | | Dollar General Corp. | | | 60,343 | |
| | 7,110 | | Home Depot, Inc. | | | 953,593 | |
| | 1,983 | | McDonald's Corp. | | | 229,354 | |
| | 4,240 | | TJX Cos., Inc. | | | 328,346 | |
| | 5,960 | | Yum! Brands, Inc. | | | 540,632 | |
| | | | | | | 2,943,379 | |
| | | | Semiconductors - 2.18% | | | | |
| | 8,560 | | QUALCOMM, Inc. | | | 539,879 | |
| | | | | | | | |
| | | | Software - 3.99% | | | | |
| | 14,094 | | Microsoft Corp. | | | 809,841 | |
| | 4,352 | | Oracle Corp. | | | 179,389 | |
| | | | | | | 989,230 | |
| | | | Telecommunications - 1.18% | | | | |
| | 5,589 | | Verizon Communications, Inc. | | | 292,472 | |
| | | | | | | | |
| | | | Transportation - 1.87% | | | | |
| | 1,633 | | FedEx Corp. | | | 269,331 | |
| | 2,037 | | Union Pacific Corp. | | | 194,595 | |
| | | | | | | 463,926 | |
| | | | | | | | |
| | | | Total Common Stocks (Cost $18,377,712) | | | 23,563,801 | |
The accompanying notes are an integral part of the financial statements.
50
MONTEAGLE QUALITY GROWTH FUND
SCHEDULE OF INVESTMENTS — August 31, 2016 (Continued) |
Shares | | MONEY MARKET FUND - 4.69% | | Fair Value | |
| | 1,161,812 | | Fidelity Prime Money Market Portfolio Class I, 0.42% (b) (Cost $1,161,812) | | $ | 1,161,812 | |
| | | | | | | | |
| | | | Total Investments at Fair Value - 99.78% (Cost $19,539,524) | | $ | 24,725,613 | |
| | | | | | | | |
| | | | Other Assets in Excess of Liabilities, Net - 0.22% | | | 55,612 | |
| | | | | | | | |
| | | | Net Assets - 100.00% | | $ | 24,781,225 | |
(a) | Non-income producing security. |
(b) | Rate shown represents the 7-day yield at August 31, 2016, is subject to change and resets daily. |
The accompanying notes are an integral part of the financial statements.
51
MONTEAGLE SELECT VALUE FUND
SCHEDULE OF INVESTMENTS — August 31, 2016 |
Shares | | COMMON STOCKS - 91.52% | | Fair Value | |
| | | Apparel - 4.84% | | | |
| | 10,200 | | Michael Kors Holdings Ltd. (a) | | $ | 499,290 | |
| | | | | | | | |
| | | | Banks - 9.08% | | | | |
| | 7,400 | | Bank of America Corp. | | | 119,436 | |
| | 15,650 | | Fifth Third Bancorp | | | 315,504 | |
| | 15,649 | | Morgan Stanley | | | 501,707 | |
| | | | | | | 936,647 | |
| | | | Chemicals - 2.96% | | | | |
| | 10,160 | | Mosaic Co. | | | 305,511 | |
| | | | | | | | |
| | | | Commercial Services - 3.03% | | | | |
| | 3,800 | | United Rentals, Inc. (a) | | | 312,778 | |
| | | | | | | | |
| | | | Computers - 8.65% | | | | |
| | 4,123 | | Apple, Inc. | | | 437,450 | |
| | 9,750 | | Western Digital Corp. | | | 455,033 | |
| | | | | | | 892,483 | |
| | | | Distribution & Wholesale - 1.91% | | | | |
| | 6,884 | | Fossil Group, Inc. (a) | | | 196,607 | |
| | | | | | | | |
| | | | Diversified Financial Services - 8.62% | | | | |
| | 3,300 | | Ameriprise Financial, Inc. | | | 333,564 | |
| | 2,180 | | CME Group, Inc. | | | 236,203 | |
| | 9,250 | | Legg Mason, Inc. | | | 319,958 | |
| | | | | | | 889,725 | |
| | | | Engineering & Construction - 5.52% | | | | |
| | 10,809 | | Jacobs Engineering Group, Inc. (a) | | | 569,526 | |
| | | | | | | | |
| | | | Forest Products & Paper - 1.27% | | | | |
| | 2,700 | | International Paper Co. | | | 130,923 | |
| | | | | | | | |
| | | | Home Furnishings - 1.96% | | | | |
| | 2,388 | | Harman International Industries, Inc. | | | 202,240 | |
| | | | | | | | |
| | | | Insurance - 2.36% | | | | |
| | 5,075 | | Lincoln National Corp. | | | 243,752 | |
| | | | | | | | |
| | | | Machinery - Construction & Mining - 3.70% | | | | |
| | 4,653 | | Caterpillar, Inc. | | | 381,313 | |
| | | | | | | | |
| | | | Machinery - Diversified - 2.81% | | | | |
| | 2,305 | | Cummins, Inc. | | | 289,531 | |
The accompanying notes are an integral part of the financial statements.
52
MONTEAGLE SELECT VALUE FUND
SCHEDULE OF INVESTMENTS — August 31, 2016 (Continued) |
Shares | | COMMON STOCKS - 91.52% (Continued) | | Fair Value | |
| | | Media - 5.41% | | | |
| | 13,971 | | Discovery Communications, Inc. - Class A (a) | | $ | 356,400 | |
| | 5,000 | | Viacom, Inc. - Class B | | | 201,700 | |
| | | | | | | 558,100 | |
| | | | Mining - 2.71% | | | | |
| | 27,163 | | Freeport-McMoRan, Inc. | | | 279,507 | |
| | | | | | | | |
| | | | Miscellaneous Manufacturing - 2.21% | | | | |
| | 7,300 | | General Electric Co. | | | 228,052 | |
| | | | | | | | |
| | | | Office & Business Equipment - 2.64% | | | | |
| | 14,528 | | Pitney Bowes, Inc. | | | 272,545 | |
| | | | | | | | |
| | | | Oil & Gas - 2.76% | | | | |
| | 2,200 | | ConocoPhillips | | | 90,310 | |
| | 20,100 | | Transocean Ltd. (a)(d) | | | 194,970 | |
| | | | | | | 285,280 | |
| | | | Oil & Gas Services - 5.77% | | | | |
| | 6,513 | | Baker Hughes, Inc. | | | 319,984 | |
| | 8,200 | | National Oilwell Varco, Inc. | | | 275,028 | |
| | | | | | | 595,012 | |
| | | | Real Estate Investment Trusts - 2.48% | | | | |
| | 6,520 | | HCP, Inc. | | | 256,432 | |
| | | | | | | | |
| | | | Retail - 9.69% | | | | |
| | 4,275 | | AutoNation, Inc. (a) | | | 202,421 | |
| | 8,406 | | Darden Restaurants, Inc. | | | 518,146 | |
| | 5,200 | | Gap, Inc. | | | 129,324 | |
| | 3,385 | | Kohl's Corp. | | | 150,226 | |
| | | | | | | 1,000,117 | |
| | | | Transportation - 1.14% | | | | |
| | 1,800 | | Ryder System, Inc. | | | 117,936 | |
| | | | | | | | |
| | | | Total Common Stocks (Cost $9,557,524) | | | 9,443,307 | |
The accompanying notes are an integral part of the financial statements.
53
MONTEAGLE SELECT VALUE FUND
SCHEDULE OF INVESTMENTS — August 31, 2016 (Continued) |
Shares | | MONEY MARKET FUND - 4.69% | | Fair Value | |
| | 1,082,220 | | Fidelity Prime Money Market Portfolio Class I, 0.42% (b)(c) (Cost $1,082,220) | | $ | 1,082,220 | |
| | | | | | | | |
| | | | Total Investments at Fair Value - 102.01% (Cost $10,639,744) | | $ | 10,525,527 | |
| | | | | | | | |
| | | | Liabilities in Excess of Other Assets, Net - (2.01%) | | | (207,214 | ) |
| | | | | | | | |
| | | | Net Assets - 100.00% | | $ | 10,318,313 | |
(a) | Non-income producing security. |
(b) | Rate shown represents the 7-day yield at August 31, 2016, is subject to change and resets daily. |
(c) | A portion of this security is segregated as collateral for securities on loan at August 31, 2016. Total collateral had a fair value of $203,388 at August 31, 2016. |
(d) | Security, or a portion of the security is out on loan at August 31, 2016. Total loaned securities had a fair value of $194,000 at August 31, 2016. |
The accompanying notes are an integral part of the financial statements.
54
MONTEAGLE VALUE FUND
SCHEDULE OF INVESTMENTS — August 31, 2016 |
Shares | | COMMON STOCKS - 95.57% | | Fair Value | |
| | | Aerospace & Defense - 0.06% | | | |
| | 400 | | Triumph Group, Inc. | | $ | 12,744 | |
| | | | | | | | |
| | | | Agriculture - 2.54% | | | | |
| | 11,500 | | Archer-Daniels-Midland Co. | | | 503,240 | |
| | | | | | | | |
| | | | Auto Parts - 2.06% | | | | |
| | 12,000 | | Cooper Tire & Rubber Co. | | | 407,880 | |
| | | | | | | | |
| | | | Chemicals - 8.93% | | | | |
| | 5,900 | | Eastman Chemical Co. | | | 400,551 | |
| | 18,800 | | Huntsman Corp. | | | 325,052 | |
| | 19,000 | | Olin Corp. | | | 411,160 | |
| | 9,000 | | Stepan Co. | | | 632,340 | |
| | | | | | | 1,769,103 | |
| | | | Computers - 3.76% | | | | |
| | 2,900 | | International Business Machines Corp. | | | 460,752 | |
| | 8,400 | | Seagate Technology PLC | | | 283,416 | |
| | | | | | | 744,168 | |
| | | | Distribution & Wholesale - 2.30% | | | | |
| | 79,558 | | Wolseley PLC - ADR | | | 455,072 | |
| | | | | | | | |
| | | | Diversified Financial Services - 1.46% | | | | |
| | 4,813 | | Macquarie Group Ltd. - ADR | | | 290,224 | |
| | | | | | | | |
| | | | Electrical Components & Equipment - 2.06% | | | | |
| | 30,000 | | Schneider Electric SE - ADR | | | 407,550 | |
| | | | | | | | |
| | | | Engineering & Construction - 1.62% | | | | |
| | 6,200 | | Fluor Corp. | | | 321,780 | |
| | | | | | | | |
| | | | Food - 5.71% | | | | |
| | 7,600 | | Cal-Maine Foods, Inc. (d) | | | 349,144 | |
| | 28,000 | | Dean Foods Co. | | | 481,880 | |
| | 13,000 | | Pilgrim's Pride Corp. (d) | | | 300,040 | |
| | | | | | | 1,131,064 | |
| | | | Forest & Paper Products - 2.54% | | | | |
| | 10,400 | | International Paper Co. | | | 504,296 | |
| | | | | | | | |
| | | | Home Builders - 1.98% | | | | |
| | 15,000 | | MDC Holdings, Inc. | | | 391,650 | |
| | | | | | | | |
| | | | Iron & Steel - 3.64% | | | | |
| | 23,000 | | Commercial Metals Co. | | | 356,960 | |
| | 7,500 | | Nucor Corp. | | | 363,825 | |
| | | | | | | 720,785 | |
The accompanying notes are an integral part of the financial statements.
55
MONTEAGLE VALUE FUND
SCHEDULE OF INVESTMENTS — August 31, 2016 (Continued) |
Shares | | COMMON STOCKS - 95.57% (Continued) | | Fair Value | |
| | | Miscellaneous Manufacturing - 8.76% | | | |
| | 7,050 | | American Railcar Industries, Inc. | | $ | 292,293 | |
| | 16,200 | | General Electric Co. | | | 506,088 | |
| | 11,000 | | Textron, Inc. | | | 449,350 | |
| | 20,000 | | Trinity Industries, Inc. | | | 488,400 | |
| | | | | | | 1,736,131 | |
| | | | Oil & Gas - 3.11% | | | | |
| | 5,000 | | Exxon Mobil Corp. | | | 435,700 | |
| | 12,000 | | Marathon Oil Corp. | | | 180,240 | |
| | | | | | | 615,940 | |
| | | | Oil & Gas Services - 2.09% | | | | |
| | 4,000 | | Schlumberger Ltd. | | | 316,000 | |
| | 9,000 | | Steel Excel, Inc. (a) | | | 99,000 | |
| | | | | | | 415,000 | |
| | | | Packaging & Containers - 2.86% | | | | |
| | 13,300 | | Greif, Inc. - Class A | | | 566,979 | |
| | | | | | | | |
| | | | Pharmaceuticals - 9.13% | | | | |
| | 15,000 | | AstraZeneca PLC - ADR | | | 492,150 | |
| | 9,147 | | Merck & Co., Inc. | | | 574,340 | |
| | 15,000 | | Pfizer, Inc. | | | 522,000 | |
| | 10,000 | | Takeda Pharmaceutical Co. Ltd. - ADR | | | 220,700 | |
| | | | | | | 1,809,190 | |
| | | | Real Estate Investment Trusts - 2.38% | | | | |
| | 17,100 | | Rayonier, Inc. | | | 470,763 | |
| | | | | | | | |
| | | | Retail - 4.01% | | | | |
| | 12,500 | | Coach, Inc. | | | 477,250 | |
| | 8,750 | | Macy's, Inc. | | | 316,575 | |
| | | | | | | 793,825 | |
| | | | Semiconductors - 12.41% | | | | |
| | 19,000 | | Cirrus Logic, Inc. (a) | | | 964,250 | |
| | 17,000 | | Intel Corp. | | | 610,130 | |
| | 30,000 | | Kulicke & Soffa Industries, Inc. (a) | | | 366,900 | |
| | 8,200 | | QUALCOMM, Inc. | | | 517,174 | |
| | | | | | | 2,458,454 | |
| | | | Telecommunications - 8.34% | | | | |
| | 20,000 | | AT & T, Inc. | | | 817,600 | |
| | 31,000 | | FIH Mobile Ltd. - ADR (e) | | | 207,545 | |
| | 12,000 | | Verizon Communications, Inc. | | | 627,960 | |
| | | | | | | 1,653,105 | |
The accompanying notes are an integral part of the financial statements.
56
MONTEAGLE VALUE FUND
SCHEDULE OF INVESTMENTS — August 31, 2016 (Continued) |
Shares | | COMMON STOCKS - 95.57% (Continued) | | Fair Value | |
| | | Transportation - 3.82% | | | |
| | 11,000 | | CSX Corp. | | $ | 311,080 | |
| | 6,800 | | Ryder System, Inc. | | | 445,536 | |
| | | | | | | 756,616 | |
| | | | | | | | |
| | | | Total Common Stocks (Cost $15,903,389) | | | 18,935,559 | |
Shares | | MONEY MARKET FUND - 7.60% | | Fair Value | |
| | 1,505,811 | | Fidelity Prime Money Market Portfolio Class I, 0.42% (b)(c) (Cost $1,505,811) | | $ | 1,505,811 | |
| | | | | | | | |
| | | | Total Investments at Fair Value - 103.17% (Cost $17,409,200) | | $ | 20,441,370 | |
| | | | | | | | |
| | | | Liabilities in Excess of Other Assets, Net - (3.17%) | | | (628,755 | ) |
| | | | | | | | |
| | | | Net Assets - 100.00% | | $ | 19,812,615 | |
(a) | Non-income producing security. |
(b) | Rate shown represents the 7-day yield at August 31, 2016, is subject to change and resets daily. |
(c) | A portion of this security is segregated as collateral for securities on loan at August 31, 2016. Total collateral had a fair value of $657,129 at August 31, 2016. |
(d) | Security, or a portion of the security is out on loan at August 31, 2016. Total loaned securities had a fair value of $642,282 at August 31, 2016. |
(e) | Categorized in level 2 of the fair value hierarchy; for additional information and description of the levels, refer to the table included in Note 2 of the accompanying notes to the financial statements. |
ADR - American Depositary Receipt.
The accompanying notes are an integral part of the financial statements.
57
THE TEXAS FUND
SCHEDULE OF INVESTMENTS — August 31, 2016 |
Shares | | COMMON STOCKS - 98.53% | | Fair Value | |
| | | Airlines - 2.74% | | | |
| | 3,759 | | American Airlines Group, Inc. | | $ | 136,452 | |
| | 3,347 | | Southwest Airlines Co. | | | 123,437 | |
| | | | | | | 259,889 | |
| | | | Auto Manufacturers - 1.72% | | | | |
| | 1,356 | | Toyota Motor Corp. - ADR | | | 163,574 | |
| | | | | | | | |
| | | | Banks - 9.96% | | | | |
| | 2,302 | | Cullen/Frost Bankers, Inc. (d) | | | 167,816 | |
| | 4,641 | | First Financial Bankshares, Inc. (d) | | | 169,953 | |
| | 5,205 | | LegacyTexas Financial Group, Inc. | | | 157,868 | |
| | 2,843 | | Prosperity Bancshares, Inc. | | | 157,701 | |
| | 4,500 | | Southside Bancshares, Inc. | | | 147,825 | |
| | 2,749 | | Texas Capital Bancshares, Inc. (a) | | | 144,377 | |
| | | | | | | 945,540 | |
| | | | Beverages - 1.53% | | | | |
| | 1,552 | | Dr Pepper Snapple Group, Inc. | | | 145,422 | |
| | | | | | | | |
| | | | Building Materials - 5.90% | | | | |
| | 11,795 | | Builders FirstSource, Inc. (a) | | | 162,063 | |
| | 1,874 | | Eagle Materials, Inc. | | | 150,613 | |
| | 1,054 | | Lennox International, Inc. | | | 169,768 | |
| | 5,100 | | NCI Building Systems, Inc. (a) | | | 77,214 | |
| | | | | | | 559,658 | |
| | | | Chemicals - 2.91% | | | | |
| | 2,010 | | Celanese Corp. - Series A | | | 129,504 | |
| | 2,824 | | Westlake Chemical Co. | | | 146,340 | |
| | | | | | | 275,844 | |
| | | | Computers - 3.21% | | | | |
| | 3,837 | | Cardtronics PLC - Class A (a) | | | 172,320 | |
| | 2,299 | | Cognizant Technology Solutions Corp. - Class A (a) | | | 132,054 | |
| | | | | | | 304,374 | |
| | | | Distribution & Wholesale - 0.92% | | | | |
| | 3,047 | | Fossil Group, Inc. (a) | | | 87,022 | |
| | | | | | | | |
| | | | Diversified Financial Services - 1.22% | | | | |
| | 567 | | Alliance Data Systems Corp. (a) | | | 115,997 | |
| | | | | | | | |
| | | | Electronics - 3.41% | | | | |
| | 7,120 | | Benchmark Electronics, Inc. (a) | | | 171,734 | |
| | 5,458 | | National Instruments Corp. | | | 152,497 | |
| | | | | | | 324,231 | |
| | | | Entertainment - 2.34% | | | | |
| | 2,632 | | Cinemark Holdings, Inc. | | | 101,727 | |
| | 2,463 | | Six Flags Entertainment Corp. | | | 120,121 | |
| | | | | | | 221,848 | |
The accompanying notes are an integral part of the financial statements.
58
THE TEXAS FUND
SCHEDULE OF INVESTMENTS — August 31, 2016 (Continued) |
Shares | | COMMON STOCKS - 98.53% (Continued) | | Fair Value | |
| | | Environmental Control - 3.25% | | | |
| | 2,070 | | Waste Connections, Inc. | | $ | 158,210 | |
| | 2,348 | | Waste Management, Inc. | | | 150,131 | |
| | | | | | | 308,341 | |
| | | | Food - 4.54% | | | | |
| | 9,700 | | Darling Ingredients, Inc. (a) | | | 136,576 | |
| | 2,922 | | Sysco Corp. | | | 151,535 | |
| | 4,702 | | Whole Foods Market, Inc. | | | 142,847 | |
| | | | | | | 430,958 | |
| | | | Healthcare - Products - 3.23% | | | | |
| | 6,088 | | Integer Holdings Corp. (a) | | | 147,330 | |
| | 2,540 | | LivaNova PLC (a) | | | 152,451 | |
| | 1,014 | | Nuvectra Corp. (a) | | | 6,946 | |
| | | | | | | 306,727 | |
| | | | Healthcare - Services - 3.00% | | | | |
| | 3,278 | | Adeptus Health, Inc. - Class A (a) | | | 139,512 | |
| | 2,300 | | US Physical Therapy, Inc. | | | 145,015 | |
| | | | | | | 284,527 | |
| | | | Home Builders - 1.62% | | | | |
| | 4,795 | | DR Horton, Inc. | | | 153,728 | |
| | | | | | | | |
| | | | Investment Companies - 1.62% | | | | |
| | 4,479 | | Main Street Capital Corp. (d) | | | 153,898 | |
| | | | | | | | |
| | | | Iron & Steel - 0.91% | | | | |
| | 5,600 | | Commercial Metals Co. | | | 86,912 | |
| | | | | | | | |
| | | | Machinery - Diversified - 1.58% | | | | |
| | 3,108 | | Flowserve Corp. | | | 150,334 | |
| | | | | | | | |
| | | | Media - 0.89% | | | | |
| | 1,600 | | Nexstar Broadcasting Group, Inc. - Class A | | | 84,352 | |
| | | | | | | | |
| | | | Miscellaneous Manufacturing - 3.40% | | | | |
| | 2,591 | | AZZ, Inc. | | | 172,120 | |
| | 6,156 | | Trinity Industries, Inc. | | | 150,330 | |
| | | | | | | 322,450 | |
| | | | Oil & Gas - 13.79% | | | | |
| | 1,056 | | Anadarko Petroleum Corp. | | | 56,464 | |
| | 1,317 | | Apache Corp. | | | 65,455 | |
| | 3,290 | | Atwood Oceanics, Inc. (d) | | | 25,991 | |
| | 2,483 | | Cabot Oil & Gas Corp. | | | 61,156 | |
| | 1,620 | | Carrizo Oil & Gas, Inc. (a) | | | 62,030 | |
| | 602 | | Cheniere Energy, Inc. (a) | | | 25,826 | |
| | 860 | | Concho Resources, Inc. (a) | | | 111,112 | |
The accompanying notes are an integral part of the financial statements.
59
THE TEXAS FUND
SCHEDULE OF INVESTMENTS — August 31, 2016 (Continued) |
Shares | | COMMON STOCKS - 98.53% (Continued) | | Fair Value | |
| | | Oil & Gas - 13.79% (Continued) | | | |
| | 4,880 | | Denbury Resources, Inc. (a)(d) | | $ | 15,030 | |
| | 418 | | Diamondback Energy, Inc. (a) | | | 39,814 | |
| | 622 | | EOG Resources, Inc. | | | 55,041 | |
| | 673 | | Exxon Mobil Corp. | | | 58,645 | |
| | 1,770 | | HollyFrontier Corp. | | | 45,808 | |
| | 1,528 | | Marathon Oil Corp. | | | 22,951 | |
| | 2,444 | | Matador Resources Co. (a) | | | 56,090 | |
| | 5,114 | | Oasis Petroleum, Inc. (a) | | | 48,481 | |
| | 2,049 | | Patterson-UTI Energy, Inc. | | | 39,935 | |
| | 273 | | Pioneer Natural Resources Co. | | | 48,881 | |
| | 2,270 | | Range Resources Corp. | | | 87,554 | |
| | 1,499 | | RSP Permian, Inc. (a) | | | 58,536 | |
| | 11,400 | | Southwestern Energy Co. (a) | | | 158,574 | |
| | 562 | | Tesoro Corp. | | | 42,386 | |
| | 500 | | Texas Pacific Land Trust | | | 88,350 | |
| | 1,369 | | Western Refining, Inc. | | | 34,444 | |
| | | | | | | 1,308,554 | |
| | | | Oil & Gas Services - 3.19% | | | | |
| | 1,030 | | Dril-Quip, Inc. (a) | | | 57,237 | |
| | 969 | | Flotek Industries, Inc. (a)(d) | | | 15,020 | |
| | 1,846 | | FMC Technologies, Inc. (a) | | | 52,057 | |
| | 4,871 | | Forum Energy Technologies, Inc. (a) | | | 85,583 | |
| | 1,638 | | National Oilwell Varco, Inc. | | | 54,939 | |
| | 1,443 | | Oceaneering International, Inc. | | | 38,268 | |
| | | | | | | 303,104 | |
| | | | Pipelines - 1.64% | | | | |
| | 3,086 | | Kinder Morgan, Inc. | | | 67,429 | |
| | 2,484 | | Spectra Energy Corp. | | | 88,480 | |
| | | | | | | 155,909 | |
| | | | Retail - 9.26% | | | | |
| | 1,700 | | Copart, Inc. (a) | | | 86,734 | |
| | 3,713 | | Dave & Buster's Entertainment, Inc. (a) | | | 172,469 | |
| | 4,849 | | Fiesta Restaurant Group, Inc. (a) | | | 122,486 | |
| | 4,850 | | GameStop Corp. - Class A | | | 137,692 | |
| | 1,991 | | Group 1 Automotive, Inc. | | | 118,146 | |
| | 3,400 | | Michaels Cos., Inc. (a) | | | 81,464 | |
| | 6,742 | | Rush Enterprises, Inc. - Class A (a) | | | 160,325 | |
| | | | | | | 879,316 | |
| | | | Semiconductors - 4.93% | | | | |
| | 2,598 | | Cirrus Logic, Inc. (a) | | | 131,848 | |
| | 8,026 | | Diodes, Inc. (a) | | | 165,255 | |
| | 2,462 | | Texas Instruments, Inc. | | | 171,207 | |
| | | | | | | 468,310 | |
The accompanying notes are an integral part of the financial statements.
60
THE TEXAS FUND
SCHEDULE OF INVESTMENTS — August 31, 2016 (Continued) |
Shares | | COMMON STOCKS - 98.53% (Continued) | | Fair Value | |
| | | Software - 3.73% | | | |
| | 6,054 | | Rackspace Hosting, Inc. (a) | | $ | 190,398 | |
| | 997 | | Tyler Technologies, Inc. (a) | | | 163,458 | |
| | | | | | | 353,856 | |
| | | | Telecommunications - 0.95% | | | | |
| | 2,200 | | AT&T, Inc. | | | 89,936 | |
| | | | | | | | |
| | | | Transportation - 1.14% | | | | |
| | 2,074 | | Kirby Corp. (a) | | | 108,055 | |
| | | | | | | | |
| | | | Total Common Stocks (Cost $9,731,039) | | | 9,352,666 | |
Shares | | MONEY MARKET FUND - 7.14% | | Fair Value | |
| | 677,670 | | Fidelity Prime Money Market Portfolio Class I, 0.42% (b)(c) (Cost $677,670) | | $ | 677,670 | |
| | | | | | | | |
| | | | Total Investments at Fair Value - 105.67% (Cost $10,408,709) | | $ | 10,030,336 | |
| | | | | | | | |
| | | | Liabilities in Excess of Other Assets, Net - (5.67%) | | | (538,644 | ) |
| | | | | | | | |
| | | | Net Assets - 100.00% | | $ | 9,491,692 | |
(a) | Non-income producing security. |
(b) | Rate shown represents the 7-day yield at August 31, 2016, is subject to change and resets daily. |
(c) | A portion of this security is segregated as collateral for securities on loan at August 31, 2016. Total collateral had a fair value of $535,944 at August 31, 2016. |
(d) | Security, or a portion of the security is out on loan at August 31, 2016. Total loaned securities had a fair value of $523,807 at August 31, 2016. |
ADR - American Depositary Receipt.
The accompanying notes are an integral part of the financial statements.
61
MONTEAGLE FUNDS
STATEMENTS OF ASSETS AND LIABILITIES — August 31, 2016 |
| | Fixed
Income
Fund | | | Informed
Investor
Growth
Fund | | | Quality
Growth
Fund | |
ASSETS | | | | | | | | | |
Investment securities | | | | | | | | | |
At cost | | $ | 50,835,807 | | | $ | 10,107,394 | | | $ | 19,539,524 | |
At fair value (Note 2) - including $0, $0 and $0 of securities loaned (Note 2), respectively | | $ | 52,055,082 | | | $ | 10,560,678 | | | $ | 24,725,613 | |
Receivables: | | | | | | | | | | | | |
Dividends and interest | | | 263,018 | | | | 11,265 | | | | 44,918 | |
Capital shares sold | | | — | | | | — | | | | 2,568 | |
Investment securities sold | | | — | | | | 983,242 | | | | 46,143 | |
Other assets | | | 712 | | | | 197 | | | | 387 | |
Total assets | | | 52,318,812 | | | | 11,555,382 | | | | 24,819,629 | |
| | | | | | | | | | | | | |
LIABILITIES | | | | | | | | | | | | |
Payables: | | | | | | | | | | | | |
Capital shares redeemed | | | 33,403 | | | | — | | | | 10,122 | |
Distributions | | | 1,804 | | | | — | | | | — | |
Collateral on securities loaned (Note 2) | | | — | | | | — | | | | 11 | |
Due to Adviser (Note 3) | | | 42,500 | | | | 11,933 | | | | 25,437 | |
Accrued compliance service fees (Note 3) | | | 2,811 | | | | 960 | | | | 1,567 | |
Accrued trustee fees | | | 1,267 | | | | 1,267 | | | | 1,267 | |
Total liabilities | | | 81,785 | | | | 14,160 | | | | 38,404 | |
| | | | | | | | | | | | | |
NET ASSETS | | $ | 52,237,027 | | | $ | 11,541,222 | | | $ | 24,781,225 | |
| | | | | | | | | | | | |
NET ASSETS CONSIST OF: | | | | | | | | | | | | |
Paid-in capital | | $ | 51,247,078 | | | $ | 10,688,751 | | | $ | 17,908,806 | |
Undistributed (Accumulated) net investment income (loss) | | | 2,563 | | | | (6,364 | ) | | | 35,754 | |
Undistributed (accumulated) net realized gain (loss) on investments | | | (231,889 | ) | | | 405,551 | | | | 1,650,576 | |
Net unrealized appreciation on investments | | | 1,219,275 | | | | 453,284 | | | | 5,186,089 | |
NET ASSETS | | $ | 52,237,027 | | | $ | 11,541,222 | | | $ | 24,781,225 | |
| | | | | | | | | | | | | |
Shares of beneficial interest outstanding (1) | | | 4,923,324 | | | | 1,089,538 | | | | 1,876,336 | |
Net Asset Value, offering and redemption price per share | | $ | 10.61 | | | $ | 10.59 | | | $ | 13.21 | |
(1) | Unlimited number of shares of beneficial interest with no par value, authorized. |
The accompanying notes are an integral part of the financial statements.
62
MONTEAGLE FUNDS
STATEMENTS OF ASSETS AND LIABILITIES — August 31, 2016 |
| | Select
Value
Fund | | | Value
Fund | | | The
Texas
Fund | |
ASSETS | | | | | | | | | |
Investment securities | | | | | | | | | |
At cost | | $ | 10,639,744 | | | $ | 17,409,200 | | | $ | 10,408,709 | |
At fair value (Note 2) - including $194,000, $642,282 and $523,807 of securities loaned (Note 2), respectively | | $ | 10,525,527 | | | $ | 20,441,370 | | | $ | 10,030,336 | |
Receivables: | | | | | | | | | | | | |
Dividends and interest | | | 8,550 | | | | 50,763 | | | | 10,672 | |
Other assets | | | 224 | | | | 297 | | | | 189 | |
Total assets | | | 10,534,301 | | | | 20,492,430 | | | | 10,041,197 | |
| | | | | | | | | | | | |
LIABILITIES | | | | | | | | | | | | |
Payables: | | | | | | | | | | | | |
Collateral on securities loaned (Note 2) | | | 203,388 | | | | 657,129 | | | | 535,944 | |
Due to Adviser (Note 3) | | | 10,440 | | | | 20,092 | | | | 11,444 | |
Accrued compliance service fees (Note 3) | | | 893 | | | | 1,327 | | | | 850 | |
Accrued trustee fees | | | 1,267 | | | | 1,267 | | | | 1,267 | |
Total liabilities | | | 215,988 | | | | 679,815 | | | | 549,505 | |
| | | | | | | | | | | | | |
NET ASSETS | | $ | 10,318,313 | | | $ | 19,812,615 | | | $ | 9,491,692 | |
| | | | | | | | | | | | |
NET ASSETS CONSIST OF: | | | | | | | | | | | | |
Paid-in capital | | $ | 10,437,400 | | | $ | 16,785,523 | | | $ | 11,302,071 | |
Undistributed (accumulated) net investment income (loss) | | | 760 | | | | 40,429 | | | | (14,054 | ) |
Accumulated net realized loss on investments | | | (5,630 | ) | | | (45,507 | ) | | | (1,417,952 | ) |
Net unrealized appreciation (depreciation) on investments | | | (114,217 | ) | | | 3,032,170 | | | | (378,373 | ) |
NET ASSETS | | $ | 10,318,313 | | | $ | 19,812,615 | | | $ | 9,491,692 | |
| | | | | | | | | | | | | |
CLASS I SHARES: | | | | | | | | | | | | |
Net Assets | | $ | 10,318,313 | | | $ | 19,812,615 | | | $ | 9,491,692 | |
Shares of beneficial interest outstanding (1) | | | 871,870 | | | | 1,375,172 | | | | 1,069,288 | |
Net Asset Value, offering and redemption price per share | | $ | 11.83 | | | $ | 14.41 | | | $ | 8.88 | |
(1) | Unlimited number of shares of beneficial interest with no par value, authorized. |
The accompanying notes are an integral part of the financial statements.
63
MONTEAGLE FUNDS
STATEMENTS OF OPERATIONS — For the Year Ended August 31, 2016 |
| | Fixed
Income
Fund | | | Informed
Investor
Growth
Fund | | | Quality
Growth
Fund | |
INVESTMENT INCOME | | | | | | | | | |
| | | | | | | | | | |
Income: | | | | | | | | | |
Interest | | $ | 1,116,274 | | | $ | 7,029 | | | $ | 4,658 | |
Securities lending | | | — | | | | 688 | | | | 222 | |
Dividends | | | — | | | | 127,041 | | | | 405,950 | |
| | | | | | | | | | | | | |
Total Investment Income | | | 1,116,274 | | | | 134,758 | | | | 410,830 | |
| | | | | | | | | | | | | |
Expenses: | | | | | | | | | | | | |
Investment advisory fees (Note 3) | | | 492,387 | | | | 138,355 | | | | 289,715 | |
Compliance service fees (Note 3) | | | 34,382 | | | | 11,621 | | | | 18,861 | |
Trustees' fees | | | 10,405 | | | | 10,405 | | | | 10,405 | |
Proxy services fees | | | 3,756 | | | | 1,020 | | | | 1,423 | |
Legal fees | | | 1,667 | | | | 1,667 | | | | 1,667 | |
ICI membership fees | | | 2,469 | | | | 904 | | | | 1,484 | |
| | | | | | | | | | | | | |
Total expenses | | | 545,066 | | | | 163,972 | | | | 323,555 | |
| | | | | | | | | | | | | |
Net investment income (loss) | | | 571,208 | | | | (29,214 | ) | | | 87,276 | |
| | | | | | | | | | | | | |
REALIZED AND UNREALIZED GAIN (LOSS) ON INVESTMENTS | | | | | | | | | | | | |
| | | | | | | | | | | | | |
Net realized gain from investments | | | 132,483 | | | | 603,684 | | | | 1,959,572 | |
Net change in unrealized appreciation (depreciation) on investments | | | 1,086,338 | | | | 213,167 | | | | (277,830 | ) |
| | | | | | | | | | | | | |
Net realized and unrealized gain on investments | | | 1,218,821 | | | | 816,851 | | | | 1,681,742 | |
| | | | | | | | | | | | | |
Net increase in net assets resulting from operations | | $ | 1,790,029 | | | $ | 787,637 | | | $ | 1,769,018 | |
The accompanying notes are an integral part of the financial statements.
64
MONTEAGLE FUNDS
STATEMENTS OF OPERATIONS — For the Year Ended August 31, 2016 |
| | Select
Value
Fund | | | Value
Fund | | | The
Texas
Fund | |
INVESTMENT INCOME | | | | | | | | | |
| | | | | | | | | | |
Income: | | | | | | | | | |
Interest | | $ | 2,073 | | | $ | 2,225 | | | $ | 3,408 | |
Securities lending | | | 8,446 | | | | 17,952 | | | | 14,704 | |
Dividends | | | 235,117 | | | | 511,794 | | | | 108,373 | |
Foreign withholding tax | | | — | | | | (1,844 | ) | | | (27 | ) |
| | | | | | | | | | | | | |
Total Investment Income | | | 245,636 | | | | 530,127 | | | | 126,458 | |
| | | | | | | | | | | | | |
Expenses: | | | | | | | | | | | | |
Investment advisory fees (Note 3) | | | 128,147 | | | | 216,478 | | | | 137,270 | |
Distribution (12b-1) fees - Class C (Note 3) | | | — | | | | — | | | | 170 | |
Compliance service fees (Note 3) | | | 11,107 | | | | 15,374 | | | | 10,428 | |
Trustees' fees | | | 10,405 | | | | 10,405 | | | | 10,405 | |
Proxy service fees | | | 691 | | | | 1,156 | | | | 1,293 | |
Legal fees | | | 1,667 | | | | 2,451 | | | | 1,667 | |
ICI membership fees | | | 987 | | | | 1,209 | | | | 882 | |
Interest expense | | | 53 | | | | — | | | | — | |
| | | | | | | | | | | | | |
Total expenses | | | 153,057 | | | | 247,073 | | | | 162,115 | |
| | | | | | | | | | | | | |
Net investment income (loss) | | | 92,579 | | | | 283,054 | | | | (35,657 | ) |
| | | | | | | | | | | | | |
REALIZED AND UNREALIZED GAIN (LOSS) ON INVESTMENTS | | | | | | | | | | | | |
| | | | | | | | | | | | | |
Net realized gain (loss) from: | | | | | | | | | | | | |
Investments | | | 75,018 | | | | (51,614 | ) | | | 35,579 | |
Call options purchased | | | — | | | | — | | | | (127,803 | ) |
Put options purchased | | | — | | | | — | | | | (222,322 | ) |
Net realized gain (loss) | | | 75,018 | | | | (51,614 | ) | | | (314,546 | ) |
| | | | | | | | | | | | | |
Net change in unrealized appreciation (depreciation) on: | | | | | | | | | | | | |
Investments | | | 129,108 | | | | 2,670,664 | | | | 113,730 | |
Call options purchased | | | — | | | | — | | | | 62,956 | |
Net change in unrealized appreciation (depreciation) | | | 129,108 | | | | 2,670,664 | | | | 176,686 | |
| | | | | | | | | | | | | |
Net realized and unrealized gain (loss) on investments | | | 204,126 | | | | 2,619,050 | | | | (137,860 | ) |
| | | | | | | | | | | | | |
Net increase (decrease) in net assets resulting from operations | | $ | 296,705 | | | $ | 2,902,104 | | | $ | (173,517 | ) |
The accompanying notes are an integral part of the financial statements.
65
MONTEAGLE FIXED INCOME FUND
STATEMENTS OF CHANGES IN NET ASSETS |
| | Year
Ended
August 31,
2016 | | | Year
Ended
August 31,
2015 | |
INCREASE (DECREASE) IN NET ASSETS | | | | | | |
FROM OPERATIONS | | | | | | |
Net investment income | | $ | 571,208 | | | $ | 577,374 | |
Net realized gain on investment transactions | | | 132,483 | | | | 188,564 | |
Net change in unrealized appreciation (depreciation) on investments | | | 1,086,338 | | | | (446,345 | ) |
Net increase in net assets resulting from operations | | $ | 1,790,029 | | | $ | 319,593 | |
| | | | | | | | | |
FROM DISTRIBUTIONS TO SHAREHOLDERS | | | | | | | | |
From net investment income - Class I | | | (647,559 | ) | | | (610,868 | ) |
Net decrease in net assets from distributions to shareholders | | | (647,559 | ) | | | (610,868 | ) |
| | | | | | | | | |
FROM CAPITAL SHARE TRANSACTIONS | | | | | | | | |
Net increase in net assets from capital share transactions (Note 7) | | | 1,243,610 | | | | 7,541,547 | |
| | | | | | | | | |
Total increase in net assets | | | 2,386,080 | | | | 7,250,272 | |
| | | | | | | | | |
NET ASSETS | | | | | | | | |
Beginning of year | | | 49,850,947 | | | | 42,600,675 | |
End of year | | $ | 52,237,027 | | | $ | 49,850,947 | |
ACCUMULATED UNDISTRIBUTED NET INVESTMENT INCOME | | $ | 2,563 | | | $ | 5,782 | |
The accompanying notes are an integral part of the financial statements.
66
MONTEAGLE INFORMED INVESTOR GROWTH FUND
STATEMENTS OF CHANGES IN NET ASSETS |
| | Year
Ended
August 31,
2016 | | | Year
Ended
August 31,
2015 | |
INCREASE (DECREASE) IN NET ASSETS | | | | | | |
FROM OPERATIONS | | | | | | |
Net investment loss | | $ | (29,214 | ) | | $ | (125,943 | ) |
Net realized gain on investment transactions | | | 603,684 | | | | 1,375,824 | |
Net change in unrealized appreciation (depreciation) on investments | | | 213,167 | | | | (1,351,246 | ) |
Net increase (decrease) in net assets resulting from operations | | $ | 787,637 | | | $ | (101,365 | ) |
| | | | | | | | | |
FROM DISTRIBUTIONS TO SHAREHOLDERS | | | | | | | | |
From net realized capital gains - Class I | | | (975,365 | ) | | | (2,217,503 | ) |
Net decrease in net assets from distributions to shareholders | | | (975,365 | ) | | | (2,217,503 | ) |
| | | | | | | | | |
FROM CAPITAL SHARE TRANSACTIONS | | | | | | | | |
Net increase (decrease) in net assets from capital share transactions (Note 7) | | | (246,403 | ) | | | 32,533 | |
| | | | | | | | | |
Total decrease in net assets | | | (434,131 | ) | | | (2,286,335 | ) |
| | | | | | | | | |
NET ASSETS | | | | | | | | |
Beginning of year | | | 11,975,353 | | | | 14,261,688 | |
End of year | | $ | 11,541,222 | | | $ | 11,975,353 | |
ACCUMULATED NET INVESTMENT LOSS | | $ | (6,364 | ) | | $ | (85,957 | ) |
The accompanying notes are an integral part of the financial statements.
67
MONTEAGLE QUALITY GROWTH FUND
STATEMENTS OF CHANGES IN NET ASSETS |
| | Year
Ended
August 31,
2016 | | | Year
Ended
August 31,
2015 | |
INCREASE (DECREASE) IN NET ASSETS | | | | | | |
FROM OPERATIONS | | | | | | |
Net investment income | | $ | 87,276 | | | $ | 92,256 | |
Net realized gain on investment transactions | | | 1,959,572 | | | | 1,587,058 | |
Net change in unrealized appreciation on investments | | | (277,830 | ) | | | (1,085,678 | ) |
Net increase in net assets resulting from operations | | $ | 1,769,018 | | | $ | 593,636 | |
| | | | | | | | | |
FROM DISTRIBUTIONS TO SHAREHOLDERS | | | | | | | | |
From net investment income - Class I | | | (102,638 | ) | | | (44,563 | ) |
From net realized capital gains - Class I | | | (1,580,560 | ) | | | (228,609 | ) |
Net decrease in net assets from distributions to shareholders | | | (1,683,198 | ) | | | (273,172 | ) |
| | | | | | | | | |
FROM CAPITAL SHARE TRANSACTIONS | | | | | | | | |
Net increase (decrease) in net assets from capital share transactions (Note 7) | | | (67,420 | ) | | | 385,105 | |
| | | | | | | | | |
Total increase in net assets | | | 18,400 | | | | 705,569 | |
| | | | | | | | | |
NET ASSETS | | | | | | | | |
Beginning of year | | | 24,762,825 | | | | 24,057,256 | |
End of year | | $ | 24,781,225 | | | $ | 24,762,825 | |
ACCUMULATED UNDISTRIBUTED NET INVESTMENT INCOME | | $ | 35,754 | | | $ | 54,573 | |
The accompanying notes are an integral part of the financial statements.
68
MONTEAGLE SELECT VALUE FUND
STATEMENTS OF CHANGES IN NET ASSETS |
| | Year
Ended
August 31,
2016 | | | Year
Ended
August 31,
2015 | |
INCREASE (DECREASE) IN NET ASSETS | | | | | | |
FROM OPERATIONS | | | | | | |
Net investment income | | $ | 92,579 | | | $ | 128,283 | |
Net realized gain on investment transactions | | | 75,018 | | | | 3,312,954 | |
Net change in unrealized appreciation (depreciation) on investments | | | 129,108 | | | | (4,119,836 | ) |
Net increase (decrease) in net assets resulting from operations | | $ | 296,705 | | | $ | (678,599 | ) |
| | | | | | | | | |
FROM DISTRIBUTIONS TO SHAREHOLDERS | | | | | | | | |
From net investment income - Class I | | | (113,401 | ) | | | (127,352 | ) |
From net realized capital gains - Class I | | | (3,404,267 | ) | | | (1,602,773 | ) |
Net decrease in net assets from distributions to shareholders | | | (3,517,668 | ) | | | (1,730,125 | ) |
| | | | | | | | | |
FROM CAPITAL SHARE TRANSACTIONS | | | | | | | | |
Net decrease in net assets from capital share transactions (Note 7) | | | (150,103 | ) | | | (216,280 | ) |
| | | | | | | | | |
Total decrease in net assets | | | (3,371,066 | ) | | | (2,625,004 | ) |
| | | | | | | | | |
NET ASSETS | | | | | | | | |
Beginning of year | | | 13,689,379 | | | | 16,314,383 | |
End of year | | $ | 10,318,313 | | | $ | 13,689,379 | |
ACCUMULATED UNDISTRIBUTED NET INVESTMENT INCOME | | $ | 760 | | | $ | 35,622 | |
The accompanying notes are an integral part of the financial statements.
69
MONTEAGLE VALUE FUND
STATEMENTS OF CHANGES IN NET ASSETS |
| | Year
Ended
August 31,
2016 | | | Year
Ended
August 31,
2015 | |
INCREASE (DECREASE) IN NET ASSETS | | | | | | |
FROM OPERATIONS | | | | | | |
Net investment income | | $ | 283,054 | | | $ | 249,054 | |
Net realized gain (loss) on investment transactions | | | (51,614 | ) | | | 1,138,406 | |
Net change in unrealized appreciation (depreciation) on investments | | | 2,670,664 | | | | (4,497,915 | ) |
Net increase (decrease) in net assets resulting from operations | | $ | 2,902,104 | | | $ | (3,110,455 | ) |
| | | | | | | | | |
FROM DISTRIBUTIONS TO SHAREHOLDERS | | | | | | | | |
From net investment income - Class I | | | (276,102 | ) | | | (277,911 | ) |
From net realized capital gains - Class I | | | (1,138,794 | ) | | | (3,014,259 | ) |
Decrease in net assets from distributions to shareholders | | | (1,414,896 | ) | | | (3,292,170 | ) |
| | | | | | | | | |
FROM CAPITAL SHARE TRANSACTIONS | | | | | | | | |
Net increase in net assets from capital share transactions (Note 7) | | | 322,765 | | | | 3,541,369 | |
| | | | | | | | | |
Total increase (decrease) in net assets | | | 1,809,973 | | | | (2,861,256 | ) |
| | | | | | | | | |
NET ASSETS | | | | | | | | |
Beginning of year | | | 18,002,642 | | | | 20,863,898 | |
End of year | | $ | 19,812,615 | | | $ | 18,002,642 | |
ACCUMULATED UNDISTRIBUTED NET INVESTMENT INCOME | | $ | 40,429 | | | $ | 39,971 | |
The accompanying notes are an integral part of the financial statements.
70
THE TEXAS FUND
STATEMENTS OF CHANGES IN NET ASSETS |
| | Year
Ended
August 31,
2016 | | | Year
Ended
August 31,
2015 | |
INCREASE (DECREASE) IN NET ASSETS | | | | | | |
FROM OPERATIONS | | | | | | |
Net investment loss | | $ | (35,657 | ) | | $ | (40,794 | ) |
Net realized loss on investment transactions | | | (314,546 | ) | | | (993,932 | ) |
Net change in unrealized appreciation (depreciation) on investments | | | 176,686 | | | | (1,014,017 | ) |
Net decrease in net assets resulting from operations | | $ | (173,517 | ) | | $ | (2,048,743 | ) |
| | | | | | | | | |
FROM DISTRIBUTIONS TO SHAREHOLDERS | | | | | | | | |
From net realized capital gains - Class I | | | — | | | | (373,020 | ) |
From net realized capital gains - Class C | | | — | | | | (371 | ) |
Net decrease in net assets from distributions to shareholders | | | — | | | | (373,391 | ) |
| | | | | | | | | |
FROM CAPITAL SHARE TRANSACTIONS | | | | | | | | |
Net increase (decrease) in net assets from capital share transactions (Note 7) | | | (1,368,904 | ) | | | 1,448,198 | |
| | | | | | | | | |
Total decrease in net assets | | | (1,542,421 | ) | | | (973,936 | ) |
| | | | | | | | | |
NET ASSETS | | | | | | | | |
Beginning of year | | | 11,034,113 | | | | 12,008,049 | |
End of year | | $ | 9,491,692 | | | $ | 11,034,113 | |
ACCUMULATED NET INVESTMENT INCOME LOSS | | $ | (14,054 | ) | | $ | (24,303 | ) |
The accompanying notes are an integral part of the financial statements.
71
MONTEAGLE FIXED INCOME FUND
FINANCIAL HIGHLIGHTS |
(For a Share Outstanding Throughout each Year) | |
Class I Shares | | Year
Ended
August 31,
2016 | | | Year
Ended
August 31,
2015 | | | Year
Ended
August 31,
2014 | | | Year
Ended
August 31,
2013 | | | Year
Ended
August 31,
2012 | |
Net asset value, beginning of year | | $ | 10.38 | | | $ | 10.44 | | | $ | 10.25 | | | $ | 10.80 | | | $ | 10.70 | |
Income (loss) from investment operations: | | | | | | | | | | | | | | | | | | | | |
Net investment income | | | 0.13 | | | | 0.14 | | | | 0.14 | | | | 0.19 | | | | 0.27 | |
Net realized and unrealized gain (loss) on investments | | | 0.23 | | | | (0.06 | ) | | | 0.19 | | | | (0.55 | ) | | | 0.10 | |
Total from investment operations | | | 0.36 | | | | 0.08 | | | | 0.33 | | | | (0.36 | ) | | | 0.37 | |
| | | | | | | | | | | | | | | | | | | | | |
Less distributions: | | | | | | | | | | | | | | | | | | | | |
From net investment income | | | (0.13 | ) | | | (0.14 | ) | | | (0.14 | ) | | | (0.19 | ) | | | (0.27 | ) |
Total distributions | | | (0.13 | ) | | | (0.14 | ) | | | (0.14 | ) | | | (0.19 | ) | | | (0.27 | ) |
| | | | | | | | | | | | | | | | | | | | | |
Net asset value, end of year | | $ | 10.61 | | | $ | 10.38 | | | $ | 10.44 | | | $ | 10.25 | | | $ | 10.80 | |
| | | | | | | | | | | | | | | | | | | | | |
Total Return (a) | | | 3.51 | % | | | 0.72 | % | | | 3.23 | % | | | (3.41 | %) | | | 3.48 | % |
| | | | | | | | | | | | | | | | | | | | | |
Net assets, end of year (000's omitted) | | $ | 52,237 | | | $ | 49,851 | | | $ | 42,601 | | | $ | 39,387 | | | $ | 35,896 | |
| | | | | | | | | | | | | | | | | | | | | |
Ratio of operating expenses to average net assets: | | | 1.07 | % | | | 1.05 | % | | | 1.05 | % | | | 1.06 | % | | | 1.09 | % |
| | | | | | | | | | | | | | | | | | | | | |
Ratio of net investment income to average net assets: | | | 1.12 | % | | | 1.23 | % | | | 1.32 | % | | | 1.68 | % | | | 2.46 | % |
| | | | | | | | | | | | | | | | | | | | | |
Portfolio turnover rate | | | 12 | % | | | 15 | % | | | 13 | % | | | 22 | % | | | 23 | % |
(a) | Total return is a measure of the change in value of an investment in the Fund over the periods covered, which assumes any dividends or capital gains distributions are reinvested in shares of the Fund. Returns do not reflect the deduction of taxes a shareholder would pay on Fund distributions or the redemption of Fund shares. |
The accompanying notes are an integral part of the financial statements.
72
MONTEAGLE INFORMED INVESTOR GROWTH FUND
FINANCIAL HIGHLIGHTS |
(For a Share Outstanding Throughout each Year) | |
Class I Shares | | Year
Ended
August 31,
2016 | | | Year
Ended
August 31,
2015 | | | Year
Ended
August 31,
2014 | | | Year
Ended
August 31,
2013 | | | Year
Ended
August 31,
2012 | |
Net asset value, beginning of year | | $ | 10.74 | | | $ | 12.90 | | | $ | 11.75 | | | $ | 11.71 | | | $ | 10.62 | |
Income (loss) from investment operations: | | | | | | | | | | | | | | | | | | | | |
Net investment loss (a) | | | (0.03 | ) | | | (0.11 | ) | | | (0.08 | ) | | | (0.07 | ) | | | (0.06 | ) |
Net realized and unrealized gain on investments | | | 0.76 | | | | 0.02 | | | | 2.20 | | | | 1.00 | | | | 1.55 | |
Total from investment operations | | | 0.73 | | | | (0.09 | ) | | | 2.12 | | | | 0.93 | | | | 1.49 | |
| | | | | | | | | | | | | | | | | | | | | |
Less distributions: | | | | | | | | | | | | | | | | | | | | |
From net realized capital gains | | | (0.88 | ) | | | (2.07 | ) | | | (0.97 | ) | | | (0.89 | ) | | | (0.40 | ) |
Total distributions | | | (0.88 | ) | | | (2.07 | ) | | | (0.97 | ) | | | (0.89 | ) | | | (0.40 | ) |
| | | | | | | | | | | | | | | | | | | | | |
Net asset value, end of year | | $ | 10.59 | | | $ | 10.74 | | | $ | 12.90 | | | $ | 11.75 | | | $ | 11.71 | |
| | | | | | | | | | | | | | | | | | | | | |
Total Return (b) | | | 7.11 | % | | | 0.24 | % | | | 18.65 | % | | | 9.03 | % | | | 14.81 | % |
| | | | | | | | | | | | | | | | | | | | | |
Net assets, end of year (000's omitted) | | $ | 11,541 | | | $ | 11,975 | | | $ | 14,262 | | | $ | 13,305 | | | $ | 13,741 | |
| | | | | | | | | | | | | | | | | | | | | |
Ratio of operating expenses
to average net assets: (c) | | | 1.42 | % | | | 1.37 | % | | | 1.35 | % | | | 1.37 | % | | | 1.34 | % |
| | | | | | | | | | | | | | | | | | | | | |
Ratio of net investment loss
to average net assets: (a) | | | (0.25 | %) | | | (0.99 | %) | | | (0.66 | %) | | | (0.59 | %) | | | (0.94 | %) |
| | | | | | | | | | | | | | | | | | | | | |
Portfolio turnover rate | | | 601 | % | | | 428 | % | | | 290 | % | | | 641 | % | | | 795 | % |
(a) | Recognition of net investment income (loss) by the Fund is affected by the declaration of dividends by the underlying investment companies in which the Fund invests. |
(b) | Total return is a measure of the change in value of an investment in the Fund over the periods covered, which assumes any dividends or capital gains distributions are reinvested in shares of the Fund. Returns do not reflect the deduction of taxes a shareholder would pay on Fund distributions or the redemption of Fund shares. |
(c) | The ratios of expenses to average net assets do not reflect the Fund’s proportionate share of income and expenses of underlying investment companies in which the Fund invests. |
The accompanying notes are an integral part of the financial statements.
73
MONTEAGLE QUALITY GROWTH FUND
FINANCIAL HIGHLIGHTS |
(For a Share Outstanding Throughout each Year) | |
Class I Shares | | Year
Ended
August 31,
2016 | | | Year
Ended
August 31,
2015 | | | Year
Ended
August 31,
2014 | | | Year
Ended
August 31,
2013 | | | Year
Ended
August 31,
2012 | |
Net asset value, beginning of year | | $ | 13.16 | | | $ | 12.99 | | | $ | 10.65 | | | $ | 9.95 | | | $ | 8.71 | |
Income from investment operations: | | | | | | | | | | | | | | | | | | | | |
Net investment income | | | 0.04 | | | | 0.05 | | | | — | (a) | | | 0.04 | | | | 0.02 | |
Net realized and unrealized gain on investments | | | 0.90 | | | | 0.26 | | | | 2.35 | | | | 0.72 | | | | 1.22 | |
Total from investment operations | | | 0.94 | | | | 0.31 | | | | 2.35 | | | | 0.76 | | | | 1.24 | |
| | | | | | | | | | | | | | | | | | | | | |
Less distributions: | | | | | | | | | | | | | | | | | | | | |
From net investment income | | | (0.05 | ) | | | (0.02 | ) | | | (0.01 | ) | | | (0.06 | ) | | | — | (b) |
From net realized gains on investments | | | (0.84 | ) | | | (0.12 | ) | | | — | | | | — | | | | — | |
Total distributions | | | (0.89 | ) | | | (0.14 | ) | | | (0.01 | ) | | | (0.06 | ) | | | — | |
| | | | | | | | | | | | | | | | | | | | | |
Net asset value, end of year | | $ | 13.21 | | | $ | 13.16 | | | $ | 12.99 | | | $ | 10.65 | | | $ | 9.95 | |
| | | | | | | | | | | | | | | | | | | | | |
Total Return (c) | | | 7.52 | % | | | 2.43 | % | | | 22.05 | % | | | 7.62 | % | | | 14.26 | % |
| | | | | | | | | | | | | | | | | | | | | |
Net assets, end of year (000's omitted) | | $ | 24,781 | | | $ | 24,763 | | | $ | 24,057 | | | $ | 25,553 | | | $ | 28,225 | |
| | | | | | | | | | | | | | | | | | | | | |
Ratio of operating expenses to average net assets: | | | 1.34 | % | | | 1.31 | % | | | 1.31 | % | | | 1.30 | % | | | 1.33 | % |
| | | | | | | | | | | | | | | | | | | | | |
Ratio of net investment income to average net assets: | | | 0.36 | % | | | 0.36 | % | | | 0.03 | % | | | 0.34 | % | | | 0.26 | % |
| | | | | | | | | | | | | | | | | | | | | |
Portfolio turnover rate | | | 34 | % | | | 25 | % | | | 27 | % | | | 50 | % | | | 54 | % |
(a) | Net investment income (loss) per share resulted in less than $0.01 per share. |
(b) | Distributions per share were $(0.0016) for the year ended August 31, 2012. |
(c) | Total return is a measure of the change in value of an investment in the Fund over the periods covered, which assumes any dividends or capital gains distributions are reinvested in shares of the Fund. Returns do not reflect the deduction of taxes a shareholder would pay on Fund distributions or the redemption of Fund shares. |
The accompanying notes are an integral part of the financial statements.
74
MONTEAGLE SELECT VALUE FUND
FINANCIAL HIGHLIGHTS |
(For a Share Outstanding Throughout each Year) | |
Class I Shares | | Year
Ended
August 31,
2016 | | | Year
Ended
August 31,
2015 | | | Year
Ended
August 31,
2014 | | | Year
Ended
August 31,
2013 | | | Year
Ended
August 31,
2012 | |
Net asset value, beginning of year | | $ | 15.86 | | | $ | 18.66 | | | $ | 15.07 | | | $ | 10.95 | | | $ | 10.16 | |
Income (loss) from investment operations: | | | | | | | | | | | | | | | | | | | | |
Net investment income | | | 0.09 | | | | 0.15 | | | | 0.15 | | | | 0.14 | | | | 0.13 | |
Net realized and unrealized gain (loss) on investments | | | 0.22 | | | | (0.87 | ) | | | 3.90 | | | | 4.13 | | | | 0.78 | |
Total from investment operations | | | 0.31 | | | | (0.72 | ) | | | 4.05 | | | | 4.27 | | | | 0.91 | |
| | | | | | | | | | | | | | | | | | | | | |
Less distributions: | | | | | | | | | | | | | | | | | | | | |
From net investment income | | | (0.13 | ) | | | (0.15 | ) | | | (0.13 | ) | | | (0.15 | ) | | | (0.12 | ) |
From net realized capital gains | | | (4.21 | ) | | | (1.93 | ) | | | (0.33 | ) | | | — | | | | — | |
Total distributions | | | (4.34 | ) | | | (2.08 | ) | | | (0.46 | ) | | | (0.15 | ) | | | (0.12 | ) |
| | | | | | | | | | | | | | | | | | | | | |
Net asset value, end of year | | $ | 11.83 | | | $ | 15.86 | | | $ | 18.66 | | | $ | 15.07 | | | $ | 10.95 | |
| | | | | | | | | | | | | | | | | | | | | |
Total Return (a) | | | 4.75 | % | | | (4.10 | %) | | | 27.29 | % | | | 39.26 | % | | | 9.01 | % |
| | | | | | | | | | | | | | | | | | | | | |
Net assets, end of year (000's omitted) | | $ | 10,318 | | | $ | 13,689 | | | $ | 16,314 | | | $ | 14,339 | | | $ | 10,177 | |
| | | | | | | | | | | | | | | | | | | | | |
Ratio of operating expenses to average net assets: | | | 1.43 | % | | | 1.35 | % | | | 1.35 | % | | | 1.37 | % | | | 1.43 | % |
| | | | | | | | | | | | | | | | | | | | | |
Ratio of net investment income to average net assets: | | | 0.87 | % | | | 0.87 | % | | | 0.86 | % | | | 1.06 | % | | | 1.23 | % |
| | | | | | | | | | | | | | | | | | | | | |
Portfolio turnover rate | | | 25 | % | | | 62 | % | | | 29 | % | | | 36 | % | | | 8 | % |
(a) | Total return is a measure of the change in value of an investment in the Fund over the periods covered, which assumes any dividends or capital gains distributions are reinvested in shares of the Fund. Returns do not reflect the deduction of taxes a shareholder would pay on Fund distributions or the redemption of Fund shares. |
The accompanying notes are an integral part of the financial statements.
75
MONTEAGLE VALUE FUND
FINANCIAL HIGHLIGHTS |
(For a Share Outstanding Throughout each Year) | |
Class I Shares | | Year
Ended
August 31,
2016 | | | Year
Ended
August 31,
2015 | | | Year
Ended
August 31,
2014 | | | Year
Ended
August 31,
2013 | | | Year
Ended
August 31,
2012 | |
Net asset value, beginning of year | | $ | 13.36 | | | $ | 18.60 | | | $ | 15.17 | | | $ | 13.31 | | | $ | 15.55 | |
Income (loss) from investment operations: | | | | | | | | | | | | | | | | | | | | |
Net investment income | | | 0.20 | | | | 0.20 | | | | 0.22 | | | | 0.17 | | | | 0.18 | |
Net realized and unrealized gain (loss) on investments | | | 1.90 | | | | (2.68 | ) | | | 3.40 | | | | 2.20 | | | | 0.78 | |
Total from investment operations | | | 2.10 | | | | (2.48 | ) | | | 3.62 | | | | 2.37 | | | | 0.96 | |
| | | | | | | | | | | | | | | | | | | | | |
Less distributions: | | | | | | | | | | | | | | | | | | | | |
From net investment income | | | (0.20 | ) | | | (0.23 | ) | | | (0.19 | ) | | | (0.18 | ) | | | (0.18 | ) |
From net realized gains on investments | | | (0.85 | ) | | | (2.53 | ) | | | — | | | | (0.33 | ) | | | (3.02 | ) |
Total distributions | | | (1.05 | ) | | | (2.76 | ) | | | (0.19 | ) | | | (0.51 | ) | | | (3.20 | ) |
| | | | | | | | | | | | | | | | | | | | | |
Net asset value, end of year | | $ | 14.41 | | | $ | 13.36 | | | $ | 18.60 | | | $ | 15.17 | | | $ | 13.31 | |
| | | | | | | | | | | | | | | | | | | | | |
Total Return (a) | | | 17.05 | % | | | (14.33 | %) | | | 23.94 | % | | | 18.32 | % | | | 8.64 | % |
| | | | | | | | | | | | | | | | | | | | | |
Net assets, end of year (000's omitted) | | $ | 19,813 | | | $ | 18,003 | | | $ | 20,864 | | | $ | 16,210 | | | $ | 14,346 | |
| | | | | | | | | | | | | | | | | | | | | |
Ratio of operating expenses to average net assets: | | | 1.37 | % | | | 1.33 | % | | | 1.34 | % | | | 1.36 | % | | | 1.43 | % |
| | | | | | | | | | | | | | | | | | | | | |
Ratio of net investment income to average net assets: | | | 1.57 | % | | | 1.26 | % | | | 1.30 | % | | | 1.22 | % | | | 1.31 | % |
| | | | | | | | | | | | | | | | | | | | | |
Portfolio turnover rate | | | 40 | % | | | 15 | % | | | 37 | % | | | 13 | % | | | 27 | % |
(a) | Total return is a measure of the change in value of an investment in the Fund over the periods covered, which assumes any dividends or capital gains distributions are reinvested in shares of the Fund. Returns do not reflect the deduction of taxes a shareholder would pay on Fund distributions or the redemption of Fund shares. |
The accompanying notes are an integral part of the financial statements.
76
THE TEXAS FUND
FINANCIAL HIGHLIGHTS |
(For a Share Outstanding Throughout the Period) | |
Class I Shares | | Year
Ended
August 31,
2016 | | | Year
Ended
August 31,
2015 | | | Period Ended August 31,
2014 (a) | |
Net asset value, beginning of year/period | | $ | 8.92 | | | $ | 10.91 | | | $ | 10.00 | |
Income (loss) from investment operations: | | | | | | | | | | | | |
Net investment loss | | | (0.03 | ) | | | (0.03 | ) | | | (0.03 | ) |
Net realized and unrealized gain (loss) on investments (e) | | | (0.01 | ) | | | (1.65 | ) | | | 0.94 | |
Total from investment operations | | | (0.04 | ) | | | (1.68 | ) | | | 0.91 | |
| | | | | | | | | | | | | |
Less distributions: | | | | | | | | | | | | |
From net realized gains on investments | | | — | | | | (0.31 | ) | | | — | |
Total distributions | | | — | | | | (0.31 | ) | | | — | |
| | | | | | | | | | | | | |
Net asset value, end of period | | $ | 8.88 | | | $ | 8.92 | | | $ | 10.91 | |
| | | | | | | | | | | | | |
Total Return (b) | | | (0.45 | %) | | | (15.53 | %) | | | 9.10 | %(c) |
| | | | | | | | | | | | | |
Net assets, end of period (000's omitted) | | $ | 9,492 | | | $ | 11,014 | | | $ | 11,995 | |
| | | | | | | | | | | | | |
Ratio of operating expenses to average net assets: | | | 1.71 | % | | | 1.60 | % | | | 1.64 | %(d) |
| | | | | | | | | | | | | |
Ratio of net investment loss to average net assets: | | | (0.37 | %) | | | (0.33 | %) | | | (0.41% | )(d) |
| | | | | | | | | | | | | |
Portfolio turnover rate | | | 48 | % | | | 59 | % | | | 38 | %(c) |
(a) | Represents the period from the initial public offering (September 17, 2013) through August 31, 2014. |
(b) | Total return is a measure of the change in value of an investment in the Fund over the periods covered, which assumes any dividends or capital gains distributions are reinvested in shares of the Fund. Returns do not reflect the deduction of taxes a shareholder would pay on Fund distributions or the redemption of Fund shares. |
(e) | Realized and unrealized gains and losses per share in this caption are balancing amounts necessary to reconcile the change in net asset value per share for the period, and may not reconcile with the aggregate gains and losses in the Statements of Operations due to share transactions for the period. |
The accompanying notes are an integral part of the financial statements.
77
MONTEAGLE FUNDS
NOTES TO FINANCIAL STATEMENTS — August 31, 2016 |
1. ORGANIZATION
Monteagle Funds (“the Trust”) was organized as a business trust under the laws of the State of Delaware on November 26, 1997 as Memorial Funds. The Trust changed its name to Monteagle Funds in July, 2006.
The Trust is registered with the Securities and Exchange Commission (“SEC”) as an open-end, management investment company under the Investment Company Act of 1940. The Trust is authorized by its Declaration of Trust to issue an unlimited number of shares of beneficial interest in each series. The Trust currently consists of the following series (each a “Fund” and collectively the “Funds”):
Monteagle Fixed Income Fund
Monteagle Informed Investor Growth Fund
Monteagle Quality Growth Fund
Monteagle Select Value Fund
Monteagle Value Fund
The Texas Fund
The Monteagle Fixed Income Fund (“Fixed Income Fund”), Monteagle Quality Growth Fund (“Quality Growth Fund”), Monteagle Select Value Fund (“Select Value Fund”), Monteagle Value Fund (“Value Fund”) and The Texas Fund (“Texas Fund”) are diversified series of Monteagle Funds. The Monteagle Informed Investor Growth Fund (“Informed Investor Growth Fund”) is a non-diversified series of Monteagle Funds. The principal investment objective of the Fixed Income Fund is total return. The principal investment objective of each of Informed Investor Growth Fund, Quality Growth Fund, Select Value Fund, Value Fund and Texas Fund (collectively the “Equity Funds”) is long-term capital appreciation.
The Fixed Income Fund, Informed Investor Growth Fund, Quality Growth Fund, Select Value Fund and Value Fund are authorized to offer one class of shares, Class I. The Texas Fund was authorized to offer two classes of shares, Class I and Class C. Each class differed as to sales and redemption charges and ongoing fees. Effective July 29, 2016, the Texas Fund’s Class C shares were exchanged for Class I shares and are no longer being offered for sale.
The Funds follow the investment company accounting and reporting guidance of the Financial Accounting Standards Board (“FASB”) Accounting Standards Codification Topic 946 Financial Services - Investment Companies.
2. SIGNIFICANT ACCOUNTING POLICIES
The following is a summary of the Funds’ significant accounting policies:
Securities Valuation — Equity securities, including common stocks and exchange-traded funds, held by the Funds for which market quotations are readily available are valued using the last reported sales price or the official closing price provided by independent pricing services as of the close of trading on the New York Stock Exchange (normally 4:00 p.m. Eastern time) on each Fund’s business day. If no sales are reported, the average of the last bid and ask price is used. If no average price is available, the last bid price is used. To the extent these securities are actively
78
MONTEAGLE FUNDS
NOTES TO FINANCIAL STATEMENTS (Continued) |
traded and valuation adjustments are not applied, they are categorized in level 1 of the fair value hierarchy described below. When an equity security is valued by the independent pricing service using factors other than market quotations or the market is considered inactive, they will be categorized in level 2.
Fixed income securities such as corporate bonds, municipal bonds, and U.S. government and agency obligations, are valued using an independent pricing service that considers market observable data such as reported sales of similar securities, broker quotes, yields, bids, offers, and other reference data. These securities are categorized as level 2 securities. The fair value of mortgage-backed securities is estimated by an independent pricing service which uses models that consider interest rate movements, new issue information and other security pertinent data. Evaluations of tranches (non-volatile, volatile, or credit sensitive) are based on interpretations of accepted Wall Street modeling and pricing conventions. Mortgage-backed securities are categorized in level 2 of the fair value hierarchy described below to the extent the inputs are observable and timely. In the absence of readily available market quotations, or other observable inputs, securities are valued at fair value pursuant to procedures adopted by the Board of Trustees and would be categorized as level 3.
Options contracts that are actively traded are valued based on quoted prices from the exchange and categorized in level 1 of the fair value hierarchy. Options held by the Funds for which no current quotations are readily available and which are not traded on the valuation date are valued at the average of the last bid and ask price and are categorized within level 2 of the fair value hierarchy. Depending on the product and terms of the transaction, the fair value of options can be modeled taking into account the counterparties’ creditworthiness and using a series of techniques, including simulation models. Many pricing models do not entail material subjectivity because the methodologies employed do not necessitate significant judgments, and the pricing inputs are observed from actively quoted markets, as is the case of options contracts. Options contracts valued using pricing models are categorized within level 2 of the fair value hierarchy.
Money market funds are valued at their net asset value of $1.00 per share and are categorized as level 1. Securities with maturities of 60 days or less may be valued at amortized cost, which approximates fair value and would be categorized as level 2.
Various inputs are used in determining the value of each of the Fund’s investments. These inputs are summarized in the three broad levels listed below:
| | ● | Level 1 – quoted prices in active markets for identical securities |
| | ● | Level 2 – other significant observable inputs |
| | ● | Level 3 – significant unobservable inputs |
The inputs or methodology used for valuing securities are not necessarily an indication of the risk associated with investing in those securities.
79
MONTEAGLE FUNDS
NOTES TO FINANCIAL STATEMENTS (Continued) |
The following is a summary of the inputs used to value the Funds’ investments at fair value as of August 31, 2016:
Fixed Income Fund | | | | | | | | | |
Security Classification (a) | | Level 1
(Quoted Prices) | | | Level 2
(Other Significant Observable Inputs) | | | Totals | |
U.S. Government and Agency Obligations | | $ | — | | | $ | 14,725,198 | | | $ | 14,725,198 | |
Corporate Bonds | | | — | | | | 24,180,600 | | | | 24,180,600 | |
Mortgage-Backed Securities | | | — | | | | 8,468,756 | | | | 8,468,756 | |
Money Market Fund | | | 4,680,528 | | | | — | | | | 4,680,528 | |
Totals | | $ | 4,680,528 | | | $ | 47,374,554 | | | $ | 52,055,082 | |
Informed Investor Growth Fund | | | | | | | | | |
Security Classification (a) | | Level 1
(Quoted Prices) | | | Level 2
(Other Significant Observable Inputs) | | | Totals | |
Common Stocks (b) | | $ | 5,809,804 | | | $ | — | | | $ | 5,809,804 | |
Exchange-Traded Funds | | | 927,434 | | | | — | | | | 927,434 | |
Money Market Fund | | | 3,823,440 | | | | — | | | | 3,823,440 | |
Totals | | $ | 10,560,678 | | | $ | — | | | $ | 10,560,678 | |
Quality Growth Fund | | | | | | | | | |
Security Classification (a) | | Level 1
(Quoted Prices) | | | Level 2
(Other Significant Observable Inputs) | | | Totals | |
Common Stocks (b) | | $ | 23,563,801 | | | $ | — | | | $ | 23,563,801 | |
Money Market Fund | | | 1,161,812 | | | | — | | | | 1,161,812 | |
Totals | | $ | 24,725,613 | | | $ | — | | | $ | 24,725,613 | |
Select Value Fund | | | | | | | | | |
Security Classification (a) | | Level 1
(Quoted Prices) | | | Level 2
(Other Significant Observable Inputs) | | | Totals | |
Common Stocks (b) | | $ | 9,443,307 | | | $ | — | | | $ | 9,443,307 | |
Money Market Fund | | | 1,082,220 | | | | — | | | | 1,082,220 | |
Totals | | $ | 10,525,527 | | | $ | — | | | $ | 10,525,527 | |
80
MONTEAGLE FUNDS
NOTES TO FINANCIAL STATEMENTS (Continued) |
Value Fund | | | | | | | | | |
Security Classification (a) | | Level 1
(Quoted Prices) | | | Level 2
(Other Significant Observable Inputs) | | | Totals | |
Common Stocks (b) | | $ | 18,728,014 | | | $ | 207,545 | | | $ | 18,935,559 | |
Money Market Fund | | | 1,505,811 | | | | — | | | | 1,505,811 | |
Totals | | $ | 20,233,825 | | | $ | 207,545 | | | $ | 20,441,370 | |
Texas Fund | | | | | | | | | |
Security Classification (a) | | Level 1
(Quoted Prices) | | | Level 2
(Other Significant Observable Inputs) | | | Totals | |
Common Stocks (b) | | $ | 9,352,666 | | | $ | — | | | $ | 9,352,666 | |
Money Market Fund | | | 677,670 | | | | — | | | | 677,670 | |
Totals | | $ | 10,030,336 | | | $ | — | | | $ | 10,030,336 | |
(a) | As of and during the year ended August 31, 2016, the Funds held no securities that were considered to be “Level 3” securities (those valued using significant unobservable inputs). Therefore, a reconciliation of assets in which significant unobservable inputs (Level 3) were used in determining fair value is not applicable. |
(b) | All common stocks held in the Funds, except those noted in the Value Fund’s Schedule of Investments, are Level 1 securities. For a detailed break-out of common stocks by major industry classification, please refer to the Schedules of Investments. |
It is the Funds’ policy to recognize transfers between Levels at the end of the reporting period. There were no transfers into and out of any Level during the year ended August 31, 2016.
Options transactions — The Texas Fund (the “Fund”) may purchase put and call options written by others and sell put and call options covering specified individual securities, securities or financial indices or currencies. A put option (sometimes called a “standby commitment”) gives the buyer of the option, upon payment of a premium, the right to deliver a specified amount of a security, index or currency to the writer of the option on or before a fixed date at a predetermined price. A call option (sometimes called a “reverse standby commitment”) gives the purchaser of the option, upon payment of a premium, the right to call upon the writer to deliver a specified amount of a security, index or currency on or before a fixed date, at a predetermined price. The predetermined prices may be higher or lower than the market value of the underlying security, index or currency. The Fund may buy or sell both exchange-traded and over-the-counter (“OTC”) options. The Fund will purchase or write an option only if that option is traded on a recognized U.S. options exchange or if the Adviser or Sub-adviser believes that a liquid secondary market for the option exists. When the Fund purchases an OTC option, it relies on the dealer from whom it has purchased the OTC option to make or take delivery of the security, index or currency underlying the option. Failure
81
MONTEAGLE FUNDS
NOTES TO FINANCIAL STATEMENTS (Continued) |
by the dealer to do so would result in the loss of the premium paid by the Fund as well as the loss of the expected benefit of the transaction. OTC options and the securities underlying these options currently are treated as illiquid securities by the Fund.
Upon selling an option, the Fund receives a premium from the purchaser of the option. Upon purchasing an option, the Fund pays a premium to the seller of the option. The amount of premium received or paid by the Fund is based upon certain factors, including the market price of the underlying securities, index or currency, the relationship of the exercise price to the market price, the historical price volatility of the underlying assets, the option period, supply and demand and interest rates.
The Fund may purchase call options on debt securities that the Fund’s Adviser or Sub-adviser intends to include in the Fund’s portfolio in order to fix the cost of a future purchase. Call options may also be purchased to participate in an anticipated price increase of a security on a more limited risk basis than would be possible if the security itself were purchased. If the price of the underlying security declines, this strategy would serve to limit the potential loss to the Fund to the option premium paid. Conversely, if the market price of the underlying security increases above the exercise price and the Fund either sells or exercises the option, any profit eventually realized will be reduced by the premium paid. The Fund may similarly purchase put options in order to hedge against a decline in market value of securities held in its portfolio. The put enables the Fund to sell the underlying security at the predetermined exercise price; thus the potential for loss to the Fund is limited to the option premium paid. If the market price of the underlying security is lower than the exercise price of the put, any profit the Fund realizes on the sale of the security would be reduced by the premium paid for the put option less any amount for which the put may be sold.
The Adviser or Sub-adviser may write call options when it believes that the market value of the underlying security will not rise to a value greater than the exercise price plus the premium received. Call options may also be written to provide limited protection against a decrease in the market price of a security, in an amount equal to the call premium received less any transaction costs.
The Fund may purchase and write put and call options on fixed income or equity security indexes in much the same manner as the options discussed above, except that index options may serve as a hedge against overall fluctuations in the fixed income or equity securities markets (or market sectors) or as a means of participating in an anticipated price increase in those markets. The effectiveness of hedging techniques using index options will depend on the extent to which price movements in the index selected correlate with price movements of the securities, which are being hedged. Index options are settled exclusively in cash. See note 10 for additional risks associated with options transactions.
All options purchased by the Texas Fund during the year were equity securities including exchange traded funds. The derivatives are not accounted for as hedging instruments under GAAP. There were no derivatives held by the Texas Fund at August 31, 2016.
82
MONTEAGLE FUNDS
NOTES TO FINANCIAL STATEMENTS (Continued) |
The effect of derivative instruments on the Statements of Operations during the year ended August 31, 2016 were as follows:
Fund | Derivatives not accounted for as hedging instruments under GAAP | Location of gain (loss) on Derivatives recognized in income | | Realized and unrealized gain (loss) on Derivatives recognized in income | |
Texas Fund | Call options purchased | Net realized loss from call options purchased | | $ | (127,803 | ) |
Texas Fund | Put options purchased | Net realized loss from put options purchased | | | (222,322 | ) |
Texas Fund | Call options purchased | Net change in unrealized depreciation on call options purchased | | | 62,956 | |
| | Totals | | | $ | (287,169 | ) |
For the year ended August 31, 2016, the Texas Fund purchased 1,140 call option contracts and 820 put option contracts. The number of purchased contracts is representative of the volume of activity for these derivative types during the period.
Security Loans — The Funds have entered into securities lending agreements with Morgan Stanley & Co., Inc. and MS Securities Services, Inc. The Funds receive compensation in the form of fees, or retain a portion of interest on the investment of any cash received as collateral. The Funds also continue to receive interest or dividends on the securities loaned. The loans are secured by collateral at least equal, at all times, to 102% of the prior day’s fair value of loaned securities. The cash collateral is invested in short-term instruments as noted in the Funds’ Schedules of Investments. Securities lending income is disclosed in the Funds’ Statements of Operations. Gain or loss in the fair value of the securities loaned that may occur during the term of the loan will be for the account of the Funds. The Funds have the right under the lending agreement to recover the securities from the borrower on demand. If the fair value of the collateral falls below 102% plus accrued interest of the loaned securities, the lender’s agent shall request additional collateral from the borrowers to bring the collateralization back to 102%. Under the terms of the securities lending agreement, the Funds are indemnified for losses incurred due to a borrower’s failure to comply with the terms of the securities lending agreement.
Should the borrower of the securities fail financially, the Funds have the right to repurchase the securities using the collateral in the open market. Although risk is mitigated by the collateral, the Funds could experience a delay in recovering their securities and possible loss of income or value if the borrower fails to return the borrowed securities. In addition, the Funds bear the risk of loss associated with the investment of the cash collateral received.
83
MONTEAGLE FUNDS
NOTES TO FINANCIAL STATEMENTS (Continued) |
The following table presents financial instruments that are subject to enforceable netting arrangements as of August 31, 2016:
Assets:
| | | | | | | | | | | | | Gross Amounts Not Offset in the Statement of Assets and Liabilities | | | | |
Fund | Description | | Gross Amounts of Recognized Assets | | | Gross Amounts Offset in the Statement of Assets and Liabilities | | | Net Amount of Assets Presented in the Statement of Assets and Liabilities | | | Financial Instruments Pledged | | | Cash Collateral Pledged | | | Net
Amount | |
Select Value Fund | Securities Loaned | | $ | 194,000 | | | $ | — | | | $ | 194,000 | | | $ | — | | | $ | 194,000 | | | $ | — | |
Value Fund | Securities Loaned | | | 642,282 | | | | — | | | | 642,282 | | | | — | | | | 642,282 | | | | — | |
Texas Fund | Securities Loaned | | | 523,807 | | | | — | | | | 523,807 | | | | — | | | | 523,807 | | | | — | |
The Fixed Income Fund, Informed Investor Growth Fund and Quality Growth Fund did not have any securities loaned at August 31, 2016.
Security Transactions — Security transactions are accounted for on trade date and realized gains and losses on investments sold are determined on a specific identification basis.
Interest and Dividend Income — Interest income is accrued as earned. Dividends on securities held by the Funds are recorded on the ex-dividend date. Discounts and premiums on securities purchased are amortized over the lives of the respective securities. Withholding taxes on foreign dividends have been provided for in accordance with the Funds’ understanding of the applicable country’s tax rules and rates. The ability of issuers of debt securities held by the Funds to meet their obligations may be affected by economic and political developments in a specific country or region.
Dividends and Distributions to Shareholders — Distributions of net investment income to shareholders are declared daily and paid monthly by the Fixed Income Fund. Net investment income distributions, if any, for Informed Investor Growth Fund, Quality Growth Fund, Select Value Fund, and Value Fund are declared and paid quarterly at the discretion of each Fund’s adviser. Net capital gains for the Funds, if any, are distributed to shareholders at least annually. Distributions to shareholders, which are determined in accordance with income tax regulations, are recorded on the ex-dividend date.
84
MONTEAGLE FUNDS
NOTES TO FINANCIAL STATEMENTS (Continued) |
The tax character of distributions paid during the year ended August 31, 2016 and for the year ended August 31, 2015 were as follows:
Fund | | Ordinary Income | | | Long-Term Capital Gain | |
| | | 2016 | | | 2015 | | | 2016 | | | 2015 | |
Fixed Income Fund | | $ | 647,559 | | | $ | 610,868 | | | $ | — | | | $ | — | |
Informed Investor Growth Fund | | | 826,557 | | | | 1,286,938 | | | | 148,808 | | | | 930,565 | |
Quality Growth Fund | | | 102,638 | | | | 44,563 | | | | 1,580,560 | | | | 228,609 | |
Select Value Fund | | | 113,401 | | | | 156,714 | | | | 3,404,267 | | | | 1,573,411 | |
Value Fund | | | 273,437 | | | | 528,443 | | | | 1,141,459 | | | | 2,763,727 | |
Texas Fund | | | — | | | | 291,146 | | | | — | | | | 82,245 | |
Estimates — These financial statements are prepared in accordance with accounting principles generally accepted in the United States of America (“GAAP”), which requires management to make certain estimates and assumptions that affect the reported amounts of assets and liabilities, disclosure of contingent assets and liabilities at the date of the financial statements and the reported amounts of increases and decreases in net assets from operations during the reporting period. Actual results could differ from those estimates.
Common Expenses — Common expenses of the Trust are allocated among the Funds within the Trust based on relative net assets of each Fund or the nature of the services performed and the relative applicability to each Fund. Other allocations may also be approved from time to time by the Trustees.
Multiple Class Allocations — Income, expenses and realized/unrealized gains or losses are allocated to each class based on relative share balances. Distribution fees are charged to each respective share class in accordance with the distribution plan.
Redemption Fees — A redemption fee of 1.00% was imposed on Texas Fund Class C shares prior to closure in the event of certain redemption transactions within one year following such investments. The respective shareholders pay such redemption fees, which are not an expense of the Texas Fund. During the year ended August 31, 2016, no redemption fees were paid to the Texas Fund.
85
MONTEAGLE FUNDS
NOTES TO FINANCIAL STATEMENTS (Continued) |
3. ADVISORY, SERVICING FEES AND OTHER TRANSACTIONS WITH AFFILIATES
Investment Advisory Agreement
Nashville Capital Corporation (“Nashville Capital” or the “Adviser”) serves as the investment adviser to the Funds. Subject to the general oversight of the Board of Trustees, the Adviser is responsible for, among other things, developing a continuing investment program for the Funds in accordance with their investment objectives, reviewing the investment strategies and policies of the Funds and advising the Board of Trustees on the selection of sub-advisers. Each Fund is authorized to pay the Adviser a fee based on average daily net assets at the following annual rates:
Assets | Fixed Income Fund | Informed Investor Growth Fund | Quality Growth Fund | Select Value Fund | Value Fund | Texas Fund |
Up to and including $10 million | 0.965% | 1.200% | 1.200% | 1.200% | 1.200% | 1.450% |
From $10 million up to and including $25 million | 0.965% | 1.200% | 1.200% | 1.200% | 1.200% | 1.350% |
From $25 up to and including $50 million | 0.965% | 1.115% | 1.115% | 1.115% | 1.115% | 1.250% |
From $50 up to and including $100 million | 0.845% | 0.975% | 0.975% | 0.975% | 0.975% | 1.100% |
Over $100 million | 0.775% | 0.875% | 0.875% | 0.875% | 0.875% | 0.950% |
Under the terms of the Funds’ advisory agreement, the Adviser oversees the management of each Fund’s investments and pays all of the operating expenses of each Fund except: (i) costs of membership in trade associations; (ii) any expenses recouped by the Adviser; (iii) SEC registration fees and related expenses; (iv) any non-interested Trustee fees; (v) costs of travel for non-interested Trustees; (vi) costs associated with seminars, conventions or trade education for non-interested Trustees; (vii) 50% of the compensation amount approved by Trustees specifically for the Chief Compliance Officer’s services for the Trust attributable to the Funds managed by the Adviser; and (viii) any extraordinary Trust expenses, including legal expenses relating to lawsuits.
For the year ended August 31, 2016, the amounts earned by and payable to the Adviser were as follows:
| | Advisory Fees Earned | | | Advisory Fees Payable as of August 31, 2016 | |
Fixed Income Fund | | $ | 492,387 | | | $ | 42,500 | |
Informed Investor Growth Fund | | | 138,355 | | | | 11,933 | |
Quality Growth Fund | | | 289,715 | | | | 25,437 | |
Select Value Fund | | | 128,147 | | | | 10,440 | |
Value Fund | | | 216,478 | | | | 20,092 | |
Texas Fund | | | 137,270 | | | | 11,444 | |
86
MONTEAGLE FUNDS
NOTES TO FINANCIAL STATEMENTS (Continued) |
An officer of Nashville Capital is also an officer of the Trust.
Fixed Income Fund — Nashville Capital has retained Howe & Rusling Inc. (“H&R”) to serve as the sub-adviser to Fixed Income Fund. Nashville Capital has agreed to pay H&R an annual advisory fee of 0.30% of average daily net assets up to $25 million, 0.25% of such assets from $25 million up to $50 million, and 0.20% of such assets over $50 million.
Informed Investor Growth Fund — Nashville Capital has retained T.H. Fitzgerald & Co. (“T.H. Fitzgerald”) to serve as the sub-adviser to Informed Investor Growth Fund. Nashville Capital has agreed to pay T.H. Fitzgerald an annual advisory fee of 0.50% of average daily net assets up to $25 million, 0.60% of such assets from $25 million up to $50 million, 0.50% of such assets from $50 million up to $100 million, and 0.40% of such assets over $100 million.
Quality Growth Fund — Nashville Capital has retained Garcia Hamilton & Associates (“GHA”) to serve as the sub-adviser to Quality Growth Fund. Nashville Capital has agreed to pay GHA an annual advisory fee of 0.30% of average daily net assets.
Select Value Fund — Nashville Capital has retained Parkway Advisors, L.P. (“Parkway”) to serve as the sub-adviser to Select Value Fund. Nashville Capital has agreed to pay Parkway an annual advisory fee of 0.50% of average daily net assets.
Value Fund — Nashville Capital has retained Robinson Investment Group, Inc. (“Robinson”) to serve as the sub-adviser to Value Fund. Nashville Capital has agreed to pay Robinson an annual advisory fee of 0.50% of average daily net assets up to $25 million, 0.45% of such assets from $25 million up to $50 million, 0.35% of such assets from $50 million up to $100 million, and 0.30% of such assets over $100 million.
Texas Fund — Nashville Capital has retained J. Team Financial, Inc. d/b/a Team Financial Strategies (“Team”), to serve as the sub-adviser to Texas Fund. Nashville Capital has agreed to pay Team an annual advisory fee of 0.25% of average daily net assets up to $10 million and 0.60% of such assets over $10 million.
Investment Company Services Agreement
Pursuant to an Investment Company Services Agreement between the Trust and M3Sixty Administration, LLC (“M3Sixty”), M3Sixty provides administrative, fund accounting and pricing, and transfer agent and shareholder services to the Funds. M3Sixty receives fees for these services, which are paid by the Adviser (not the Funds). Officers of M3Sixty are also officers of the Trust.
Effective December, 2016, Mutual Shareholders Services, LLC (“MSS”) will provide fund accounting, administration and transfer agency services to each Fund. Pursuant to services agreements, the Adviser will pay MSS customary fees for its services from the advisory fee it receives from the Funds. MSS will also provide certain shareholder report production, and EDGAR conversion and filing services. Also effective December, 2016, employees of MSS will become officers of Funds.
87
MONTEAGLE FUNDS
NOTES TO FINANCIAL STATEMENTS (Continued) |
Distribution Agreement
Pursuant to the terms of a Distribution Agreement with the Trust, Matrix Capital Group, Inc. (the “Distributor”) serves as the Funds’ principal underwriter. Matrix Capital Group, Inc. does not receive compensation for such services.
Effective December, 2016, Arbor Court Capital will serve as each Fund’s distributor (the “New Distributor”). The New Distributor is not affiliated with the Adviser but is an affiliate of MSS. Pursuant to agreement, the Adviser will pay Arbor Court Capital customary fees for its services from the advisory fee it receives from the Funds.
The Texas Fund has adopted a Distribution Plan (“Plan”) pursuant to Rule 12b-1 of the 1940 Act. Under the Plan, the Fund may use 12b-1 fees to compensate broker-dealers (including, without limitation, the Distributor) for sales of the Texas Fund’s Class C shares, or for other expenses associated with distributing the Texas Fund’s Class C shares. The Texas Fund may expend up to 1.00% for Class C shares of the Texas Fund’s average daily net assets annually to pay for any activity primarily intended to result in the sale of shares of the Texas Fund and the servicing of shareholder accounts, provided that the Trustees have approved the category of expenses for which payment is being made. During the year ended August 31, 2016, the Texas Fund incurred $170 of 12b-1 fees. The Distribution Agreement was terminated effective July 29, 2016.
Compliance Services
An affiliated Contractor (the “Contractor”) serves as the CCO of the Trust. The Funds pay $99,000 annually to the Contractor for providing CCO services. Each Fund pays $5,000 with the remaining $69,000 allocated to the Funds based on aggregate average daily net assets. The Contractor also received a special bonus of $2,500 from the Funds in August, 2016. The payment was allocated among the Funds based on their respective net assets on payment date.
4. SECURITIES TRANSACTIONS
During the year ended August 31, 2016, cost of purchases and proceeds from sales and maturities of investment securities, excluding short-term investments and U.S. government securities, were as follows:
Fund | | Purchases | | | Sales | |
Fixed Income Fund | | $ | 3,991,129 | | | $ | 3,427,177 | |
Informed Investor Growth Fund | | | 56,728,903 | | | | 58,844,914 | |
Quality Growth Fund | | | 7,803,651 | | | | 9,789,269 | |
Select Value Fund | | | 2,540,536 | | | | 6,595,740 | |
Value Fund | | | 6,974,246 | | | | 7,528,476 | |
Texas Fund | | | 7,305,067 | | | | 3,768,084 | |
The cost of purchases and proceeds from sales of U.S. government securities by the Fixed Income Fund were $2,006,388 and $3,175,268, respectively. There were no purchases or sales of U.S. government securities made by the Informed Investor Growth Fund, Quality Growth Fund, Select Value Fund, Value Fund or Texas Fund.
88
MONTEAGLE FUNDS
NOTES TO FINANCIAL STATEMENTS (Continued) |
5. TAX MATTERS
It is each Fund’s policy to comply with the special provisions of Subchapter M of the Internal Revenue Code applicable to regulated investment companies. As provided therein, in any fiscal year in which a Fund so qualifies and distributes at least 90% of its taxable income, such Fund (but not the shareholders) will be relieved of federal income tax on the income distributed. Accordingly, no provision for income taxes has been made.
In order to avoid imposition of the excise tax applicable to regulated investment companies, it is also each Fund’s intention to declare as dividends in each calendar year at least 98% of its net investment income and 98.2% of its net realized capital gains plus undistributed amounts from prior years.
The Funds’ tax basis distributable earnings are determined only at the end of each fiscal year. The tax character of distributable earnings (deficit) at August 31, 2016, the Funds’ most recent fiscal year end, was as follows:
Fund | | Unrealized Appreciation (Depreciation) | | | Undistributed Ordinary Income | | | Undistributed Capital
Gains | | | Capital
Loss Carryforward | | | Post-December Ordinary
Loss | | | Post-
October Capital
Loss | | | Total Distributable Earnings | |
Fixed Income Fund | | $ | 1,219,275 | | | $ | 2,563 | | | $ | — | | | $ | (203,159 | ) | | $ | — | | | $ | (28,730 | ) | | $ | 989,949 | |
Informed Investor
Growth Fund | | | 413,373 | | | | 245,320 | | | | 200,142 | | | | — | | | | (6,364 | ) | | | — | | | | 852,471 | |
Quality Growth Fund | | | 5,172,552 | | | | 98,440 | | | | 1,601,427 | | | | — | | | | — | | | | — | | | | 6,872,419 | |
Select Value Fund | | | (117,617 | ) | | | 760 | | | | — | | | | — | | | | — | | | | (2,230 | ) | | | (119,087 | ) |
Value Fund | | | 3,032,170 | | | | 40,429 | | | | 3,442 | | | | — | | | | — | | | | (48,949 | ) | | | 3,027,092 | |
Texas Fund | | | (424,903 | ) | | | — | | | | — | | | | (1,082,514 | ) | | | (14,054 | ) | | | (288,908 | ) | | | (1,810,379 | ) |
The undistributed ordinary income, capital gains, carryforward losses and post-October losses shown above differ from corresponding accumulated net investment income and accumulated net realized gain (loss) figures reported in the statements of assets and liabilities due to differing book/tax treatment of short-term capital gains, and certain temporary book/tax differences due to the tax deferral of losses on wash sales, REIT adjustments and reclassifications of paydown losses.
Under current tax law, net capital losses realized after October 31st and net ordinary losses incurred after December 31st may be deferred and treated as occurring on the first day of the following fiscal year. The Funds’ carryforward losses, post-October losses and post-December
89
MONTEAGLE FUNDS
NOTES TO FINANCIAL STATEMENTS (Continued) |
losses are determined only at the end of each fiscal year. As of August 31, 2016, the Funds’ most recent fiscal year end, the Funds elected to defer net capital losses and ordinary losses as indicated in the chart below.
| | | Post-October Losses | | | Post-December Losses | |
Fund | | Deferred | | | Utilized | | | Deferred | | | Utilized | |
Fixed Income Fund | | $ | 28,730 | | | $ | — | | | $ | — | | | $ | — | |
Informed Investor Growth Fund | | | — | | | | — | | | | 6,364 | | | | 85,957 | |
Quality Growth Fund | | | — | | | | — | | | | — | | | | — | |
Select Value Fund | | | 2,230 | | | | — | | | | — | | | | — | |
Value Fund | | | 48,949 | | | | — | | | | — | | | | — | |
Texas Fund | | | 288,908 | | | | 1,024,599 | | | | 14,054 | | | | 24,303 | |
As of August 31, 2016, the following Funds had the following capital loss carryforwards for federal income tax purposes. These capital loss carryforwards may be utilized in future years to offset net realized capital gains, if any, prior to distributing such gains to shareholders.
Fund | | 2017 | | | 2018 | | | Non-Expiring Long-Term | | | Non-Expiring Short-Term | | | Total | | | Utilized | |
Fixed Income Fund | | $ | 180,638 | | | $ | 22,521 | | | $ | — | | | $ | — | | | $ | 203,159 | | | $ | 88,081 | |
Informed Investor Growth Fund | | | — | | | | — | | | | — | | | | — | | | | — | | | | — | |
Quality Growth Fund | | | — | | | | — | | | | — | | | | — | | | | — | | | | — | |
Select Value Fund | | | — | | | | — | | | | — | | | | — | | | | — | | | | — | |
Value Fund | | | — | | | | — | | | | — | | | | — | | | | — | | | | — | |
Texas Fund | | | — | | | | — | | | | 600,067 | | | | 482,447 | | | | 1,082,514 | | | | — | |
Under the Regulated Investment Company Modernization Act of 2010 (the “Act”), net capital losses recognized after December 31, 2010, may be carried forward indefinitely, and their character is retained as short-term and/or long-term. Under the law in effect prior to the Act, pre-enactment net capital losses were carried forward for eight years and treated as short-term losses. As a transition rule, the Act requires that post-enactment net capital losses be utilized before pre-enactment net capital losses. There were no post-enactment capital losses incurred by the Fixed Income Fund, Informed Investor Growth Fund, Quality Growth Fund, Select Value Fund or Value Fund during the year ended August 31, 2016.
90
MONTEAGLE FUNDS
NOTES TO FINANCIAL STATEMENTS (Continued) |
The following information is based upon the federal income tax cost of the investment securities as of August 31, 2016:
Fund | | Cost | | | Gross Unrealized Appreciation | | | Gross Unrealized Depreciation | | | Net Unrealized Appreciation (Depreciation) | |
Fixed Income Fund | | $ | 50,835,807 | | | $ | 1,220,548 | | | $ | (1,273 | ) | | $ | 1,219,275 | |
Informed Investor Growth Fund | | | 10,147,305 | | | | 461,830 | | | | (48,457 | ) | | | 413,373 | |
Quality Growth Fund | | | 19,553,061 | | | | 5,665,982 | | | | (493,430 | ) | | | 5,172,552 | |
Select Value Fund | | | 10,643,144 | | | | 1,106,156 | | | | (1,223,773 | ) | | | (117,617 | ) |
Value Fund | | | 17,409,200 | | | | 3,676,547 | | | | (644,377 | ) | | | 3,032,170 | |
Texas Fund | | | 10,455,239 | | | | 782,559 | | | | (1,207,462 | ) | | | (424,903 | ) |
The difference between the federal income tax cost of portfolio investments and the financial statement cost for Informed Investor Growth Fund, Quality Growth Fund, Select Value Fund and Texas Fund is due to certain timing differences in the recognition of capital losses under income tax regulations and GAAP. These “book/tax” differences are temporary in nature and are due to the tax deferral of losses on wash sales.
For the year ended August 31, 2016, Fixed Income Fund reclassified $73,132 of capital losses on paydowns of mortgage-backed and asset-backed securities from net investment income to accumulated net realized loss on the Statements of Assets and Liabilities. For the year ended August 31, 2016, Informed Investor Growth Fund reclassified $108,807 of net investment loss to accumulated net capital gains on the Statement of Assets and Liabilities. For the year ended August 31, 2016, the Quality Growth Fund reclassified $3,457 of net investment income to accumulated net capital gains in the Statements of Assets and Liabilities. For the year ended August 31, 2016, the Select Value Fund reclassified $14,040 of net investment income to accumulated net realized loss in the Statements of Assets and Liabilities. For the year ended August 31, 2016, the Value Fund reclassified $6,494 of net investment income to accumulated net realized loss in the Statements of Assets and Liabilities. For the year ended August 31, 2016 the Texas Fund reclassified $45,906 of net investment loss to paid-in capital and $15,879 of accumulated net realized loss to paid in capital on the Statement of Assets and Liabilities. Such reclassifications, the result of permanent differences between the financial statement and income tax reporting requirements, have no effect on the Funds’ net assets or net asset values per share.
The Funds recognize the tax benefits of uncertain tax positions only when the position is “more likely than not” to be sustained assuming examination by tax authorities. Management has reviewed the tax positions in all open tax years and has concluded that no liability for unrecognized tax benefits should be recorded related to uncertain tax positions taken in open tax years. The Funds identify their major tax jurisdictions as U.S. Federal and Delaware. The Funds recognize interest and penalties, if any, related to unrecognized tax benefits as income tax expense in the Statements of Operations. During the year ended August 31, 2016, the Funds did not incur any interest or penalties. The Funds are not subject to examination by U.S. Federal tax authorities for tax years before 2013.
91
MONTEAGLE FUNDS
NOTES TO FINANCIAL STATEMENTS (Continued) |
6. CONTROL OWNERSHIP
The beneficial ownership, either directly or indirectly, of more than 25% of the voting securities of a fund creates presumption of control of the fund under Section 2(a)(9) of the Investment Company Act of 1940. As of August 31, 2016, the shareholders listed in the table immediately below held, for the benefit of their customers, the following percentages of the outstanding shares of each Fund.
Fund | Shareholder | Percent Owned as of
August 31, 2016 |
Fixed Income Fund | Mitra & Co. | 90% |
Informed Investor Growth Fund | Maril & Co. | 94% |
Quality Growth Fund | Maril & Co. | 94% |
Select Value Fund | Charles Schwab & Co. | 81% |
Value Fund | Maril & Co. | 100% |
7. CAPITAL SHARE TRANSACTIONS
| | | Fixed Income Fund | |
| | | Sold | | | Redeemed | | | Reinvested | | | Ending Shares | |
For the Fiscal Year ended: | | | | | | | | | | | | |
August 31, 2016 | | | | | | | | | | | | |
Class I | | | | | | | | | | | | |
Shares | | | 155,135 | | | | (95,383 | ) | | | 59,813 | | | | 4,923,324 | |
Value | | $ | 1,615,881 | | | $ | (1,000,966 | ) | | $ | 628,695 | | | | | |
| | | | | | | | | | | | | | | | | |
For the Fiscal Year ended: | | | | | | | | | | | | | | | | |
August 31, 2015 | | | | | | | | | | | | | | | | |
Class I | | | | | | | | | | | | | | | | |
Shares | | | 751,208 | | | | (83,445 | ) | | | 54,066 | | | | 4,803,759 | |
Value | | $ | 7,846,193 | | | $ | (869,328 | ) | | $ | 564,682 | | | | | |
92
MONTEAGLE FUNDS
NOTES TO FINANCIAL STATEMENTS (Continued) |
| | | Informed Investor Growth Fund | |
| | | Sold | | | Redeemed | | | Reinvested | | | Ending Shares | |
For the Fiscal Year ended: | | | | | | | | | | | | |
August 31, 2016 | | | | | | | | | | | | |
Class I | | | | | | | | | | | | |
Shares | | | 17,322 | | | | (49,764 | ) | | | 7,405 | | | | 1,089,538 | |
Value | | $ | 176,893 | | | $ | (498,457 | ) | | $ | 75,161 | | | | | |
| | | | | | | | | | | | | | | | | |
For the Fiscal Year ended: | | | | | | | | | | | | | | | | |
August 31, 2015 | | | | | | | | | | | | | | | | |
Class I | | | | | | | | | | | | | | | | |
Shares | | | 118,225 | | | | (121,617 | ) | | | 12,124 | | | | 1,114,575 | |
Value | | $ | 1,348,069 | | | $ | (1,438,349 | ) | | $ | 122,813 | | | | | |
| | | Quality Growth Fund | |
| | | Sold | | | Redeemed | | | Reinvested | | | Ending Shares | |
For the Fiscal Year ended: | | | | | | | | | | | | |
August 31, 2016 | | | | | | | | | | | | |
Class I | | | | | | | | | | | | |
Shares | | | 12,929 | | | | (27,048 | ) | | | 8,447 | | | | 1,876,336 | |
Value | | $ | 163,931 | | | $ | (337,662 | ) | | $ | 106,311 | | | | | |
| | | | | | | | | | | | | | | | | |
For the Fiscal Year ended: | | | | | | | | | | | | | | | | |
August 31, 2015 | | | | | | | | | | | | | | | | |
Class I | | | | | | | | | | | | | | | | |
Shares | | | 54,620 | | | | (25,870 | ) | | | 1,269 | | | | 1,882,008 | |
Value | | $ | 706,849 | | | $ | (338,433 | ) | | $ | 16,689 | | | | | |
| | | Select Value Fund | |
| | | Sold | | | Redeemed | | | Reinvested | | | Ending Shares | |
For the Fiscal Year ended: | | | | | | | | | | | | |
August 31, 2016 | | | | | | | | | | | | |
Class I | | | | | | | | | | | | |
Shares | | | 183,156 | | | | (491,524 | ) | | | 317,166 | | | | 871,870 | |
Value | | $ | 2,027,114 | | | $ | (5,607,796 | ) | | $ | 3,430,579 | | | | | |
| | | | | | | | | | | | | | | | | |
For the Fiscal Year ended: | | | | | | | | | | | | | | | | |
August 31, 2015 | | | | | | | | | | | | | | | | |
Class I | | | | | | | | | | | | | | | | |
Shares | | | 102,685 | | | | (124,538 | ) | | | 10,728 | | | | 863,072 | |
Value | | $ | 1,786,668 | | | $ | (2,179,261 | ) | | $ | 176,313 | | | | | |
93
MONTEAGLE FUNDS
NOTES TO FINANCIAL STATEMENTS (Continued) |
| | | Value Fund | |
| | | Sold | | | Redeemed | | | Reinvested | | | Ending Shares | |
For the Fiscal Year ended: | | | | | | | | | | | | |
August 31, 2016 | | | | | | | | | | | | |
Class I | | | | | | | | | | | | |
Shares | | | 56,173 | | | | (28,815 | ) | | | 479 | | | | 1,375,172 | |
Value | | $ | 698,123 | | | $ | (381,403 | ) | | $ | 6,045 | | | | | |
| | | | | | | | | | | | | | | | | |
For the Fiscal Year ended: | | | | | | | | | | | | | | | | |
August 31, 2015 | | | | | | | | | | | | | | | | |
Class I | | | | | | | | | | | | | | | | |
Shares | | | 234,394 | | | | (11,692 | ) | | | 2,978 | | | | 1,347,335 | |
Value | | $ | 3,671,816 | | | $ | (173,429 | ) | | $ | 42,982 | | | | | |
| | | Texas Fund | |
| | | Sold | | | Redeemed | | | Reinvested | | | Ending Shares | |
For the Fiscal Year ended: | | | | | | | | | | | | |
August 31, 2016 | | | | | | | | | | | | |
Class I | | | | | | | | | | | | |
Shares | | | 121,618 | | | | (286,891 | ) | | | — | | | | 1,069,288 | |
Value | | $ | 1,035,366 | | | $ | (2,385,446 | ) | | $ | — | | | | | |
Class C* | | | | | | | | | | | | | | | | |
Shares | | | — | | | | (2,260 | ) | | | — | | | | — | |
Value | | $ | — | | | $ | (18,824 | ) | | $ | — | | | | | |
| | | | | | | | | | | | | | | | | |
For the Fiscal Year ended: | | | | | | | | | | | | | | | | |
August 31, 2015 | | | | | | | | | | | | | | | | |
Class I | | | | | | | | | | | | | | | | |
Shares | | | 304,096 | | | | (205,411 | ) | | | 36,150 | | | | 1,234,561 | |
Value | | $ | 3,028,749 | | | $ | (1,930,729 | ) | | $ | 339,807 | | | | | |
Class C | | | | | | | | | | | | | | | | |
Shares | | | 1,031 | | | | — | | | | 40 | | | | 2,260 | |
Value | | $ | 10,000 | | | $ | — | | | $ | 371 | | | | | |
* | Figures are for the period from September 1, 2015 through July 29, 2016. |
8. CONTINGENCIES AND COMMITMENTS
The Funds indemnify the Trust’s officers and Trustees for certain liabilities that might arise from the performance of their duties to the Funds. Additionally, in the normal course of business the Funds enter into contracts that contain a variety of representations and warranties and which
94
MONTEAGLE FUNDS
NOTES TO FINANCIAL STATEMENTS (Continued) |
provide general indemnifications. Each Fund’s maximum exposure under these arrangements is unknown, as this would involve future claims that may be made against the Funds that have not yet occurred. However, based on experience, the Funds expect the risk of loss to be remote.
9. SECTOR AND GEOGRAPHIC RISKS
When the Funds emphasize one or more economic sectors, it may be more susceptible to the financial, market, or economic events affecting the particular issuers and industries in which they invest than funds that do not emphasize particular sectors. The more a fund diversifies, the more it spreads risk and potentially reduces the risks of loss and volatility.
The Texas Fund’s investments are concentrated in Texas, and therefore the Fund will be susceptible to adverse market, political, regulatory, social, economic and geographic events affecting Texas. The Fund’s performance may be more volatile than the performance of more geographically diverse funds. Since one of the main industries in Texas is mining and logging, including the oil and gas sectors, Texas is particularly susceptible to economic, environmental and political activities affecting this industry.
10. OPTIONS RISK
The Texas Fund’s use of options subjects the Fund to certain investment risks and transaction costs to which it might not otherwise be subject. These risks include: (i) dependence on the Adviser or Sub-adviser’s ability to predict movements in the prices of individual securities and fluctuations in the general securities markets; (ii) imperfect correlations between movements in the prices of options and movements in the price of the securities (or indices) hedged or used for cover, which may cause a given hedge not to achieve its objective; (iii) the fact that the skills and techniques needed to trade these instruments are different from those needed to select the securities in which the Texas Fund invests; (iv) lack of assurance that a liquid secondary market will exist for any particular instrument at any particular time, which, among other things, may hinder the Texas Fund’s ability to limit exposures by closing its positions; and, (v) the possible need to defer closing out of certain options to avoid adverse tax consequences. Other risks include the inability of the Texas Fund, as the writer of covered call options, to benefit from any appreciation of the underlying securities above the exercise price, and the possible loss of the entire premium paid for options purchased by the Texas Fund. See note 2 for additional disclosures related to options transactions.
11. RECENT ACCOUNTING PRONOUNCEMENTS
In May 2015, the FASB issued ASU No. 2015-07 Disclosure for Investments in Certain Entities that Calculate Net Asset Value per Share (or Its Equivalent). The amendments in ASU No. 2015-07 remove the requirement to categorize within the fair value hierarchy investments measured using the net asset value per share (“NAV”) practical expedient. The ASU also removes certain disclosure requirements for investments that qualify, but do not utilize, the NAV practical expedient. The amendments in the ASU are effective for fiscal years beginning after December 15, 2015, and interim periods within those fiscal years. Management is currently evaluating the impact these changes will have on the Funds’ financial statements and related disclosures.
95
MONTEAGLE FUNDS
NOTES TO FINANCIAL STATEMENTS (Continued) |
12. SUBSEQUENT EVENTS
On September 15, 2016, the Quality Growth Fund declared a dividend from net investment income of $45,679, which was payable on September 15, 2016. On September 15, 2016, the Select Value Fund declared a dividend from net investment income of $17,779, which was payable on September 15, 2016. On September 15, 2016, the Value Fund declared a dividend from net investment income of $73,513, which was payable on September 15, 2016. On September 30, 2016, the Fixed Income Fund declared a dividend from net investment income of $52,785, which was payable on September 30, 2016.
Management has evaluated subsequent events through the issuance of the financial statements and, other than those already disclosed in the notes to the financial statements, has noted no other such events that would require disclosure.
13. LEGAL PROCEEDINGS
On December 7, 2010, an amended complaint was filed in the United States Bankruptcy Court for the District of Delaware (Adversary Proceeding No. 10-54010) by The Official Committee of Unsecured Creditors of Tribune Company (“Committee”) on behalf of Tribune Company (“Tribune”), a U.S. news and media organization. Among the thousands of defendants in the Amended Complaint is the Monteagle Funds with respect to holdings by the Monteagle Value Fund (the “Fund”). The Fund, along with numerous other mutual funds, institutional investors and others, owned shares of Tribune in 2007 when it went private in a leveraged buyout transaction (“LBO”). In the LBO, shareholders such as the Fund sold their shares back to Tribune for $34/share. The lawsuit alleges, among other things, that the payment for the shares by Tribune was a fraudulent transfer and seeks to have the cash paid to shareholders returned to the Tribune bankruptcy estate. The Amended Complaint seeks to create a class of Defendants - the former shareholders of Tribune - and seeks return of over $8 billion in proceeds from the LBO.
On April 5, 2012, the Committee’s lawsuit was transferred by the Judicial Panel on Multidistrict Litigation to the United States District Court for the Southern District of New York for discovery and pretrial motions with numerous other related actions. (In re Tribune Company Fraudulent Conveyance Litigation, 1:12-mc-02296-WHP).
On July 23, 2012, the Delaware Bankruptcy Judge confirmed a plan of reorganization that, among other things, replaced the Committee as Plaintiff with a Litigation Trustee.
On September 7, 2012, Judge Pauley of the Southern District of New York entered a Master Case Order. Among other things, the Master Case Order creates liaison counsel and an Executive Committee for the defendants in the Litigation Trustee’s lawsuit, including those defendants, like the Fund, that were only shareholders of Tribune. The Executive Committee Members for mutual funds are Michael S. Doluisio, an attorney with Dechert LLP in Philadelphia, and Steven R. Schoenfeld, an attorney with Dorsey & Whitney LLP in New York. The Executive Committee is directed to take reasonable steps to streamline case management and to eliminate duplication of efforts and redundant filings. However, the Master Case Order does not certify a class of
96
MONTEAGLE FUNDS
NOTES TO FINANCIAL STATEMENTS (Continued) |
Defendants, and does not prevent any individual Defendant from retaining its own counsel or being heard by the Court. Discovery in the Litigation Trustee’s lawsuit is stayed pending resolution of certain motions to dismiss in the related litigation.
On September 23, 2013, the Court rejected the defendants’ arguments under section 546(e) of the Bankruptcy Code (the so-called public-securities-market exemption), but still dismissed the so-called Individual Creditors Actions (the individual creditor, constructive fraudulent-conveyance actions) on the ground that the Individual Creditors lack standing to seek avoidance of the same transactions that the Litigation Trustee is simultaneously suing to avoid.
On May 23, 2014, the Executive Committee, on behalf of all Exhibit A shareholder defendants, including the Fund, filed a motion to dismiss Count One of the Litigation Trustee’s Fifth Amended Complaint on grounds, among other things, that complaint fails to allege facts from which a strong inference can be drawn that the Tribune Board acted with the actual intent to hinder, delay or defraud creditors when it approved the LBO. The Litigation Trustee has responded and the motion is fully briefed and pending before Judge Pauley. The Litigation Trustee has requested that the Judge rule on these motions and allow the Litigation Trustee to proceed with discovery.
The Individual Creditors appealed the dismissal for lack of standing to the Second Circuit, and the Executive Committee cross-appealed the failure to dismiss under 546(e). On March 29, 2016, the Second Circuit Court of Appeals issued its opinion. The Court ruled that the noteholder creditors had standing to sue, but that, on the merits, their claims were preempted by the safe harbor in Section 546(e) of the Bankruptcy Code. Assuming this result is not reversed by the United States Supreme Court, then this would leave only the Litigation Trustee’s claims for intentional fraudulent conveyance. On September 9, 2016, the Individual Creditors filed their petition for certiorari to the Supreme Court. The Supreme Court has not yet acted on the request to review the Second Circuit’s decision.
It is not expected that the cases discussed above will have a material adverse impact on the Fund’s financial position, results of operation, or cash flows; however, these litigation matters are subject to inherent uncertainties and the views of these matters with respect to any impact to the Fund may change in the future.
97
MONTEAGLE FUNDS
REPORT OF INDEPENDENT REGISTERED PUBLIC ACCOUNTING FIRM |
To the Shareholders and Board of Trustees of
Monteagle Funds
We have audited the accompanying statements of assets and liabilities, including the schedules of investments, of Monteagle Funds, comprising Monteagle Fixed Income Fund, Monteagle Informed Investor Growth Fund, Monteagle Quality Growth Fund, Monteagle Select Value Fund, Monteagle Value Fund, and The Texas Fund (the “Funds”), as of August 31, 2016, and the related statements of operations for the year then ended, the statements of changes in net assets for each of the two years in the period then ended, and the financial highlights for each of the periods indicated. These financial statements and financial highlights are the responsibility of the Funds’ management. Our responsibility is to express an opinion on these financial statements and financial highlights based on our audits.
We conducted our audits in accordance with the standards of the Public Company Accounting Oversight Board (United States). Those standards require that we plan and perform the audit to obtain reasonable assurance about whether the financial statements and financial highlights are free of material misstatement. An audit includes examining, on a test basis, evidence supporting the amounts and disclosures in the financial statements. Our procedures included confirmation of securities owned as of August 31, 2016, by correspondence with the custodian and brokers. An audit also includes assessing the accounting principles used and significant estimates made by management, as well as evaluating the overall financial statement presentation. We believe that our audits provide a reasonable basis for our opinion.
In our opinion, the financial statements and financial highlights referred to above present fairly, in all material respects, the financial position of each of the Funds constituting Monteagle Funds as of August 31, 2016, the results of their operations, the changes in their net assets for each of the two years in the period then ended, and the financial highlights for the periods indicated, in conformity with accounting principles generally accepted in the United States of America.
COHEN & COMPANY, LTD.
Cleveland, Ohio
October 31, 2016
98
MONTEAGLE FUNDS
OTHER INFORMATION (Unaudited) |
Proxy Policies — The Trust has adopted Proxy Voting Policies and Procedures under which the Funds vote proxies related to securities held by the Funds. A description of the Funds’ policies and procedures is available without charge, upon request, by calling the Funds toll free at 1-888-263-5593, on the Funds’ website at http://www.monteaglefunds.com or on the SEC website at http://www.sec.gov.
In addition, the Funds are required to file Form N-PX, with their complete voting record for the 12 months ended June 30th, no later than August 31st of each year. The Funds’ Form N-PX is available without charge, upon request, by calling the Funds toll free at 1-888-263-5593, on the Funds’ website at http://www.monteaglefunds.com or on the SEC’s website at http://www.sec.gov.
N-Q Filing — The SEC has adopted the requirement that all mutual funds file a complete schedule of investments with the SEC for their first and third fiscal quarters on Form N-Q. For the Monteagle Funds, this would be for the fiscal quarters ending November 30 and May 31. The Form N-Q filing must be made within 60 days of the end of the quarter. The Funds’ Forms N-Q are available on the SEC’s website at http://www.sec.gov., or they may be reviewed and copied at the SEC’s Public Reference Room in Washington, DC (call 1-800-732-0330 for information on the operation of the Public Reference Room).
FEDERAL TAX INFORMATION (Unaudited)
For the year ended August 31, 2016, certain distributions paid by the Funds may be subject to a maximum tax rate of 20%. The Fixed Income Fund, Informed Investor Growth Fund, Quality Growth Fund, Select Value Fund and Value Fund intend to designate up to a maximum amount of $647,559, $975,365, $1,683,198, $3,517,668 and $1,414,896, respectively, as taxed at a maximum rate of 20%. There were no distributions paid by the Texas Fund during the year ended August 31, 2016. Complete information will be computed and reported in conjunction with your 2016 Form 1099-DIV.
99
MONTEAGLE FUNDS
ABOUT YOUR FUNDS’ EXPENSES (Unaudited) |
We believe it is important for you to understand the impact of costs on your investment. As a shareholder of the Funds, you incur two types of costs: (1) transaction costs, including redemption fees; and (2) ongoing costs, including management fees, distribution and service (12b-1) fees; and other Fund expenses. The following examples are intended to help you understand your ongoing costs (in dollars) of investing in the Funds and to compare these costs with the ongoing costs of investing in other mutual funds.
A mutual fund’s ongoing costs are expressed as a percentage of its average net assets. This figure is known as the expense ratio. The expenses in the tables below are based on an investment of $1,000 made at the beginning of the most recent semi-annual period (March 1, 2016) and held until the end of the period (August 31, 2016).
The tables that follow illustrate each Fund’s costs in two ways:
Actual fund return – This section helps you to estimate the actual expenses that you paid over the period. The “Ending Account Value” shown is derived from each Fund’s actual return, and the third column shows the dollar amount of operating expenses that would have been paid by an investor who started with $1,000 in the Funds. You may use the information here, together with the amount you invested, to estimate the expenses that you paid over the period.
To do so, simply divide your account value by $1,000 (for example, an $8,600 account value divided by $1,000 = 8.6), then multiply the result by the number given for the Funds under the heading “Expenses Paid During Period.”
Hypothetical 5% return – This section is intended to help you compare the Funds’ costs with those of other mutual funds. It assumes that each Fund had an annual return of 5% before expenses during the period shown, but that the expense ratio is unchanged. In this case, because the return used is not the Funds’ actual returns, the results do not apply to your investment. The example is useful in making comparisons because the Securities and Exchange Commission requires all mutual funds to calculate expenses based on a 5% return. You can assess each Fund’s costs by comparing this hypothetical example with the hypothetical examples that appear in shareholder reports of other funds.
Note that expenses shown in the table are meant to highlight and help you compare ongoing costs only.
The calculations assume no shares were bought or sold during the period. Your actual costs may have been higher or lower, depending on the amount of your investment and the timing of any purchases or redemptions.
More information about the Funds’ expenses, including historical annual expense ratios, can be found in this report. For additional information on operating expenses and other shareholder costs, please refer to each Fund’s Prospectus.
100
MONTEAGLE FUNDS
ABOUT YOUR FUNDS’ EXPENSES (Unaudited) (Continued) |
Fixed Income Fund |
| | | Beginning Account Value 3/01/16 | Annualized Expense Ratio For the Period | Ending Account Value 8/31/16 | Expenses Paid During the Period (1) |
Actual Example Based on actual return of: |
Class I | 1.00% | $ 1,000.00 | 1.00% | $ 1,010.00 | $ 5.36 |
Hypethetical Example Based on assumed 5% return |
Class I | | $ 1,000.00 | 1.00% | $ 1,019.80 | $ 5.38 |
Informed Investor Growth Fund |
| | | Beginning Account Value 3/01/16 | Annualized Expense Ratio For the Period | Ending Account Value 8/31/16 | Expenses Paid During the Period (1) |
Actual Example Based on actual return of: |
Class I | 7.00% | $ 1,000.00 | 1.39% | $ 1,070.00 | $ 7.23 |
Hypethetical Example Based on assumed 5% return |
Class I | | $ 1,000.00 | 1.39% | $ 1,018.10 | $ 7.05 |
Quality Growth Fund |
| | | Beginning Account Value 3/01/16 | Annualized Expense Ratio For the Period | Ending Account Value 8/31/16 | Expenses Paid During the Period (1) |
Actual Example Based on actual return of: |
Class I | 4.61% | $ 1,000.00 | 1.33% | $ 1,046.10 | $ 6.84 |
Hypethetical Example Based on assumed 5% return |
Class I | | $ 1,000.00 | 1.33% | $ 1,018.50 | $ 6.75 |
101
MONTEAGLE FUNDS
ABOUT YOUR FUNDS’ EXPENSES (Unaudited) (Continued) |
Select Value Fund |
| | | Beginning Account Value 3/01/16 | Annualized Expense Ratio For the Period | Ending Account Value 8/31/16 | Expenses Paid During the Period (1) |
Actual Example Based on actual return of: |
Class I | 5.81% | $ 1,000.00 | 1.41% | $ 1,058.10 | $ 7.29 |
Hypethetical Example Based on assumed 5% return |
Class I | | $ 1,000.00 | 1.41% | $ 1,018.00 | $ 7.15 |
Value Fund |
| | | Beginning Account Value 3/01/16 | Annualized Expense Ratio For the Period | Ending Account Value 8/31/16 | Expenses Paid During the Period (1) |
Actual Example Based on actual return of: |
Class I | 10.35% | $ 1,000.00 | 1.35% | $ 1,103.50 | $ 7.14 |
Hypethetical Example Based on assumed 5% return |
Class I | | $ 1,000.00 | 1.35% | $ 1,018.30 | $ 6.85 |
Texas Fund |
| | | Beginning Account Value 3/01/16 | Annualized Expense Ratio For the Period | Ending Account Value 8/31/16 | Expenses Paid During the Period (1) |
Actual Example Based on actual return of: |
Class I | 9.26% | $ 1,000.00 | 1.68% | $ 1,092.60 | $ 8.84 |
Hypethetical Example Based on assumed 5% return |
Class I | | $ 1,000.00 | 1.68% | $ 1,016.70 | $ 8.52 |
(1) | Expenses are equal to the Funds’ annualized expense ratios for the period, multiplied by the average account value over the period, multiplied by 184/366 (to reflect the one-half year period). |
102
MONTEAGLE FUNDS
TRUSTEES AND OFFICERS OF THE TRUST (Unaudited) |
The business and affairs of the Funds are managed under the direction of the Board of Trustees in compliance with the laws of the state of Delaware. The names of the Trustees and executive officers of the Trust, their position with the Trust, address, age and principal occupations during the past five years are set forth below. Trustees have no official term of office and generally serve until they resign, or are not reelected. The address of each trustee and officer is 4520 Main Street, Suite 1425, Kansas City, Missouri 64111.
DISINTERESTED TRUSTEES |
NAME, ADDRESS AND YEAR OF BIRTH | POSITION(S) HELD WITH TRUST | LENGTH OF TIME SERVED | PRINCIPAL OCCUPATION(S) DURING THE PAST 5 YEARS | NUMBER OF TRUST PORTFOLIOS OVERSEEN BY TRUSTEE | OTHER DIRECTORSHIPS OF PUBLIC COMPANIES |
Larry J. Anderson 1948 | Trustee | Since
11-29-02 | Certified Public Accountant, Anderson & West, P.C. January 1985 to present | 6 | None |
Charles M. Kinard 1943 | Trustee | Since
11-29-02 | Retired; Senior Vice President and Trust Officer, First National Bank of Abilene until December 1998 | 6 | None |
David J. Gruber 1963 | Trustee | Since
10-21-15 | Director of Risk Advisory Services, Holbrook & Manter (accounting firm), 2016 to present; President, DJG Financial Consulting, 2007 to 2016 | 6 | Trustee, Asset Management Fund, 2015 to present (3 portfolios); Trustee, Cross Shore Discovery Fund, 2014 to present; Trustee, Fifth Third Funds 2003 to 2012 (20 portfolios) |
Jeffrey W. Wallace 1964 | Trustee | Since
10-21-15 | Senior Director of Investment Operations, Baylor University, 2009 to present | 6 | None |
103
MONTEAGLE FUNDS
TRUSTEES AND OFFICERS OF THE TRUST (Unaudited) (Continued) |
EXECUTIVE OFFICERS |
NAME, ADDRESS AND YEAR OF BIRTH | POSITION(S) HELD WITH THE TRUST | PRINCIPAL OCCUPATION(S) DURING THE PAST 5 YEARS |
Paul B. Ordonio, JD 1967 | President, CCO | Monteagle Funds, President/CCO from 11/02 to present; Nashville Capital Corporation, VP of Development, 05/09 to present; Matrix Capital Group, Representative 05/09 to present; P.O. Properties, Inc., Vice President from 06/99 to present; WordWise Document Services, LLC, President from 08/97 to present; Ordonio & Assoc., President from 11/97 to present; Blue Horse Financial Advisors, Secretary from 07/15 to present; PJO Holdings, LLC from 07/15 to present. |
Andras P. Teleki 1971 | Secretary, AML Compliance Officer | Chief Legal Officer, M3Sixty Administration, LLC, M3Sixty Holdings, LLC, M3Sixty Distributors, LLC, M3Sixty Advisors, LLC and Matrix Capital Group, Inc. (2015 to present); Chief Compliance Officer and Secretary, 360 Funds (2015 to present); Secretary and Assistant Treasurer, Capital Management Investment Trust (2015 to present); Secretary and Anti-Money Laundering Compliance Officer, Monteagle Funds (2015 to present); Partner, K&L Gates, (2009-2015). |
Larry E. Beaver, Jr. 1969 | Treasurer, CFO | M3Sixty Administration, LLC, Director of Accounting and Administration 1/05 to present; Capital Management Investment Trust, Treasurer 5/08 to present; Congressional Effect Fund, Treasurer 5/08 to 8/14; AMIDEX Funds, Inc. Chief Accounting Officer 5/03 to present; 360 Funds, Treasurer, 8/13 to present. |
104
MONTEAGLE FUNDS
COMPENSATION OF TRUSTEES AND OFFICERS (Unaudited) |
Each Trustee receives an annual fee of $2,500 and a fee of $1,000 per Fund, and is also paid a $1,000 for each quarterly meeting attended and $500 for each special meeting attended. A portion of the fees paid to the Trustees are paid in Fund shares and allocated pro rata among the Funds in the complex. Trustees and officers are also reimbursed for travel and related expenses incurred in attending meetings of the Board.
Trustees that are affiliated with the Adviser or Sub-adviser receive no compensation from the Funds for their services or reimbursement for their associated expenses. Officers of the Trust receive no compensation from the Funds for their services, except that the Funds pay 50% of the compensation of the Trust’s Chief Compliance Officer.
The following table sets forth the fees paid by the Funds to each Trustee of the Trust for the year ended August 31, 2016:
Name of Person | Aggregate Compensation From Funds | Pension or Retirement Benefits Accrued as Part of Fund Expenses | Estimated Annual Benefits Upon Retirement | Total Compensation From Funds and Fund Complex Paid to Trustees |
Larry J. Anderson | $13,400 | $0 | $0 | $13,400 |
Charles M. Kinard | $13,400 | $0 | $0 | $13,400 |
David J. Gruber | $13,400 | $0 | $0 | $13,400 |
Jeffrey W. Wallace | $13,400 | $0 | $0 | $13,400 |
105
[This page intentionally left blank]
[This page intentionally left blank]
Included in annual report to shareholders filed under item 1 of this form.
Not applicable. Fund is an open-end management investment company
Not applicable. Fund is an open-end management investment company
Not applicable. Fund is an open-end management investment company
Not applicable at this time. There were no matters submitted to a vote of security holders during the reporting period.
Pursuant to the requirements of the Securities Exchange Act of 1934 and the Investment Company Act of 1940, the registrant has duly caused this report to be signed on its behalf by the undersigned, thereunto duly authorized.
Pursuant to the requirements of the Securities Exchange Act of 1934 and the Investment Company Act of 1940, this report has been signed below by the following person on behalf of the registrant and in the capacities and on the date indicated.
Pursuant to the requirements of the Securities Exchange Act of 1934 and the Investment Company Act of 1940, this report has been signed below by the following person on behalf of the registrant and in the capacities and on the date indicated.