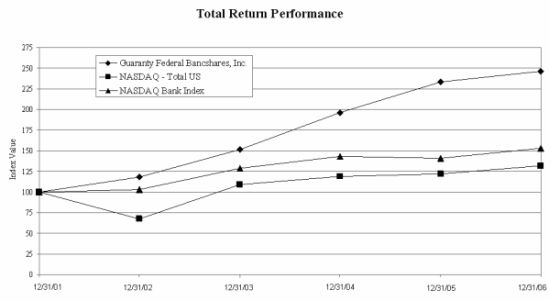
Set forth below is a stock performance graph comparing the cumulative total shareholder return on the Common Stock with (a) the cumulative total stockholder return on stocks included in The Nasdaq - Total U.S. Index and (b) the cumulative total stockholder return on stocks included in The Nasdaq Bank Index. All three investment comparisons assume the investment of $100 as of the close of business on December 31, 2001 and the hypothetical value of that investment as of the Company’s fiscal years ended December 31, 2002, 2003, 2004, 2005, and 2006, assuming that all dividends were reinvested. The graph reflects the historical performance of the Common Stock, and, as a result, may not be indicative of possible future performance of the Common Stock. The data used to compile this graph was obtained from NASDAQ.
I am very proud of the company we have become over the past few years. I am even more proud of the foundation we have built for future growth. Just four short years ago we were a thrift focused almost exclusively on retail residential lending. We have made strong progress in moving to a diversified financial institution that is delivering solid financial results and shareholder value. We are excited and optimistic about our future. I thank you, our shareholders, for your continued confidence and support, and I look forward to sharing our future progress with you.
The following tables include certain information concerning the financial position and results of operations of Guaranty Federal Bancshares, Inc. (including consolidated data from operations of subsidiaries) as of the dates indicated. Dollar amounts are expressed in thousands except per share data.
(1) In 2003, the Company determined to change its fiscal year end from June 30 to a calendar year end of December 31. As a result, the Company reported a six-month transition period ended December 31, 2003 in order to change to this new calendar year end.
Guaranty Federal Bancshares, Inc.
Selected Consolidated Financial and Other Data
Summary Statement of Income | | Years ended December 31, | |
| | | 2006 | | 2005 | | 2004 | |
| | | | | | | | |
| Interest income | | $ | 35,066 | | | 27,283 | | | 20,539 | |
| Interest expense | | | 17,386 | | | 11,860 | | | 8,446 | |
| Net interest income | | | 17,680 | | | 15,423 | | | 12,093 | |
| Provision for loan losses | | | 750 | | | 945 | | | 864 | |
| Net interest income after provision | | | | | | | | | | |
| for loan losses | | | 16,930 | | | 14,478 | | | 11,229 | |
| Noninterest income | | | 3,798 | | | 3,597 | | | 3,616 | |
| Noninterest expense | | | 10,177 | | | 8,670 | | | 8,248 | |
| Income before income taxes | | | 10,551 | | | 9,406 | | | 6,597 | |
| Provision for income taxes | | | 4,042 | | | 3,507 | | | 2,313 | |
| | | | | | | | | | | |
| Net income | | $ | 6,509 | | | 5,899 | | | 4,284 | |
| | | | | | | | | | | |
| Basic | | $ | 2.34 | | | 2.12 | | | 1.53 | |
| Diluted | | $ | 2.25 | | | 2.03 | | | 1.47 | |
| | | Six months ended | | Year ended | |
| | | December 31, | | June 30, | |
| | | 2003 | | 2002 | | 2003 | |
| | | | | (Unaudited) | | | |
| Interest income | | $ | 9,846 | | | 11,290 | | | 21,782 | |
| Interest expense | | | 4,491 | | | 6,086 | | | 11,445 | |
| Net interest income | | | 5,355 | | | 5,204 | | | 10,337 | |
| Provision for loan losses | | | 1,162 | | | 205 | | | 610 | |
| Net interest income after provision | | | | | | | | | | |
| for loan losses | | | 4,193 | | | 4,999 | | | 9,727 | |
| Noninterest income | | | 2,089 | | | 1,752 | | | 3,688 | |
| Noninterest expense | | | 3,994 | | | 4,060 | | | 8,179 | |
| Income before income taxes | | | 2,288 | | | 2,691 | | | 5,236 | |
| Provision for income taxes | | | 788 | | | 927 | | | 1,656 | |
| | | | | | | | | | | |
| Net income | | $ | 1,500 | | | 1,764 | | | 3,580 | |
| | | | | | | | | | | |
| Basic | | $ | 0.54 | | | 0.63 | | | 1.28 | |
| Diluted | | $ | 0.52 | | | 0.62 | | | 1.26 | |
Guaranty Federal Bancshares, Inc.
Management’s Discussion and Analysis of Financial Condition
And Results of Operations
GENERAL
Guaranty Federal Bancshares, Inc. (the “Company”) is a Delaware corporation organized on December 30, 1997 for the purpose of becoming the holding company of Guaranty Federal Savings Bank, a stock savings bank (the “Bank”). The Bank is a wholly-owned subsidiary of the Company.
In April 1995, Guaranty Federal Savings & Loan Association reorganized from a federally chartered mutual savings and loan association into a mutual holding company, Guaranty Federal Bancshares, M. H. C. (the “MHC”). Concurrent with the reorganization, the Bank was chartered. In December 1997, the Company completed the conversion and reorganization of the Bank and the former MHC by selling common stock to depositors of the Bank and a benefit plan of the Bank. In addition, all shares of common stock of the Bank held by public stockholders were exchanged for shares of common stock of the Company.
On June 27, 2003, the Bank converted to a state-chartered trust company with banking powers in Missouri, and the Company became a one-bank holding company. The name of the Bank was changed from Guaranty Federal Savings Bank to Guaranty Bank.
The primary activity of the Company is to oversee its investment in the Bank. The Company engages in few other activities, and the Company has no significant assets other than its investment in the Bank. For this reason, unless otherwise specified, references to the Company include the operations of the Bank. The Company’s principal business consists of attracting deposits from the general public and using such deposits to originate mortgage loans secured by one- to four-family residences, multi-family, construction and commercial real estate loans and consumer and business loans. The Company also uses these funds to purchase mortgage-backed securities, US government and agency obligations, and other permissible securities. When cash outflows exceed inflows, the Company uses borrowings and brokered deposits as additional financing sources.
The Company derives revenues principally from interest earned on loans and investments and, to a lesser extent, from fees charged for services. General economic conditions and policies of the financial institution regulatory agencies, including the Missouri Division of Finance and the Federal Deposit Insurance Corporation (“FDIC”) significantly influence the Company’s operations. Interest rates on competing investments and general market interest rates influence the Company’s cost of funds. Lending activities are affected by the interest rates at which such financing may be offered. The Company intends to focus on one- to four-family residential, consumer, and commercial real estate lending throughout southwestern Missouri.
The Company has two wholly-owned subsidiaries other than the Bank, its principal subsidiary: (i) Guaranty Statutory Trust I, a Delaware statutory trust (“Trust I”); and (ii) Guaranty Statutory Trust II, a Delaware statutory trust. These Trusts were formed in December 2005 for the exclusive purpose of issuing trust preferred securities to acquire junior subordinated debentures issued by the Company. The Company’s banking operation conducted through the Bank is the Company’s only reportable segment. See also the discussion contained in the section captioned “Segment Information” in Note 1 of the Notes to Consolidated Financial Statements in this report.
The discussion set forth below, and in any other portion of this report, may contain forward-looking statements. Such statements are based upon the information currently available to management of the Company and management’s perception thereof as of the date of this report. When used in this document, words such as “anticipates,” “estimates,” “believes,” “expects,” and similar expressions are intended to identify forward-looking statements but are not the exclusive means of identifying such statements. Such statements are subject to risks and uncertainties. Actual results of the Company’s operations could materially differ from those forward-looking comments. The differences could be caused by a number of factors or combination of factors including, but not limited to: changes in demand for banking services; changes in portfolio composition; changes in management strategy; increased competition from both bank and non-bank companies; changes in the general level of interest rates; and other factors set forth in reports and other documents filed by the Company with the Securities and Exchange Commission from time to time including the risk factors of the Company set forth in Item 1A. of the Company’s Form 10-K.
FINANCIAL CONDITION
From December 31, 2005 to December 31, 2006, the Company’s total assets increased $43,844,327 (9%) to $524,844,995, liabilities increased $41,037,233 (9%) to $479,945,752, and stockholders' equity increased $2,807,094 (7%) to $44,899,243. The ratio of stockholders’ equity to total assets decreased slightly to 8.6% during this period, compared to 8.8% as of December 31, 2005.
Guaranty Federal Bancshares, Inc.
Management’s Discussion and Analysis of Financial Condition
And Results of Operations
From December 31, 2005 to December 31, 2006, securities available-for-sale increased $1,149,174 (17%). The Company currently owns 36,600 shares of Federal Home Loan Mortgage Corporation (“FHLMC”) stock with an amortized cost of $35,847 in the securities available-for-sale category. As of December 31, 2006, the gross unrealized gain on the stock is $2,449,293, a decrease of $679,122 from the gross unrealized gain at December 31, 2005. This decrease is primarily due to the sale of 12,000 shares of the FHLMC stock in 2006. See also discussion under “Results of Operations - Comparison of Year Ended December 31, 2006 and December 31, 2005 - Non-Interest Income.”
From December 31, 2005 to December 31, 2006, securities held-to-maturity decreased $181,699 (19%) to $763,025 due to repayments received during the period. Stock of the Federal Home Loan Bank of Des Moines (“FHLB”) was increased by $403,900 (8%) to $5,382,700 due to the purchase of stock necessary to meet FHLB borrowing requirements. The Bank is required to own stock in the FHLB equal to 0.12% of assets plus 4.45% of advances.
From December 31, 2005 to December 31, 2006, net loans receivable increased by $43,829,093 (10%) to $477,264,522. During this period, permanent loans secured by both owner and non-owner occupied one to four unit residential real estate decreased $14,794,803 (15%), consumer installment loans decreased $555,769 (2%), multi-family permanent loans decreased $3,264,365 (6%), construction loans increased $13,577,073 (19%), permanent loans secured by commercial real estate increased $32,916,866 (27%) and other commercial loans increased $16,305,287 (25%). During this period the Company continued to increase its emphasis on commercial lending, while selling the majority of conforming single family loan production on the secondary market. Loans sold on the secondary market are sold servicing released, whereby the third party who purchases the loan provides the servicing. In addition, during the year ended December 31, 2006, the Bank sold its mortgage servicing rights to a third party. As a result, loans serviced for others decreased $98,158,769 (86%).
From December 31, 2005 to December 31, 2006, loans past due 90 days or more increased $1,291,937 to $2,013,477 (0.4% of net loans). As of December 31, 2006, management considers loans totaling $3,016,448 as impaired with a related allowance for loan losses of $298,311. One to four family homes collateralize the majority of the impaired loans. The Bank recognizes interest income on impaired loans as payments are received. Management believes the loss allowances recorded for these loans are sufficient to liquidate the collateral without further loss.
From December 31, 2005 to December 31, 2006, the allowance for loan losses increased $383,823 to $5,783,477. In addition to the provision for loan loss of $750,000 recorded by the Company during the year ended December 31, 2006, loan charge-offs exceeded recoveries by $366,177 for the twelve months ended December 31, 2006. The allowance for loan losses as of December 31, 2006 and December 31, 2005 was 1.2% and 1.2% of net loans outstanding, respectively. As of December 31, 2006, the allowance for loan losses was 192% of impaired loans versus 117% as of December 31, 2005.
As of December 31, 2006, foreclosed assets held for sale consisted of one single family residence and two building lots.
From December 31, 2005 to December 31, 2006, premises and equipment increased $415,011 (6%) to $7,867,809. This increase is primarily due the addition of a new branch located in Springfield, Missouri, and new equipment.
From December 31, 2005 to December 31, 2006, deposits increased $32,170,685 (10%) to $352,229,636. During this period, core deposit accounts decreased by $1,259,419 (1%) to 37% of total deposits and certificates of deposit increased by $33,430,104 (18%) to $223,236,422. Included in the certificates of deposit total is $29,146,308 in deposits placed by brokers, a decrease from $57,269,088 as of December 31, 2005.
From December 31, 2005 to December 31, 2006, the Company’s borrowings from the Federal Home Loan Bank (“FHLB”) increased $8,000,000 to $108,000,000, which satisfies the Company’s requirement to comply with the FHLB advances limitation of 35% of total assets.
Guaranty Federal Bancshares, Inc.
Management’s Discussion and Analysis of Financial Condition
And Results of Operations
As of December 31, 2006 and 2005, the Company had $15,465,000 of junior subordinated debentures that were comprised of $5,155,000 issued to Guaranty Statutory Trust I and $10,310,000 issued to Guaranty Statutory Trust II. On December 15, 2005, the Company completed an offering of $15 million of trust preferred securities (”Trust Securities”). The Company formed Guaranty Statutory Trust I and Guaranty Statutory Trust II as wholly-owned subsidiaries and Delaware statutory trusts for the purpose of issuing the Trust Securities. The proceeds of the sale of Trust Securities issued by Guaranty Statutory Trust I, together with the proceeds of the Trust’s sale of its common securities issued to the Company, were used by the Trust to purchase 30-year junior subordinated deferrable interest debentures from the Company in the principal amount of $5,155,000 (“Trust I Debentures”). The proceeds of the sale of Trust Securities issued by Guaranty Statutory Trust II, together with the proceeds of the Trust’s sale of its common securities issued to the Company, were used by the Trust to purchase 30-year junior subordinated deferrable interest debentures from the Company in the principal amount of $10,310,000 (“Trust II Debentures”, and collectively with the Trust I Debentures, the “Debentures”). Both the Trust I Debentures and the Trust II Debentures were issued pursuant to the terms of Indentures dated December 15, 2005 by and between the Company and Wilmington Trust Company, as trustee. The Trust I Debentures bear interest at a fixed rate of 6.92%, payable quarterly. The Trust II Debentures bear interest at a fixed rate of 6.47% for 5 years, payable quarterly, after issuance and thereafter at a floating rate equal to the three month LIBOR plus 1.45%. The interest payments by the Company to the Trusts will be used to pay the dividends payable by the Trusts to the holders of the Trust Securities.
The Debentures mature on February 23, 2036. Subject to prior approval by the Federal Reserve Board, the Debentures and the Trust Securities are each callable by the Company or the Trusts, respectively and as applicable, at its option after five years from issuance, and sooner in the case of a special redemption at a special redemption price ranging up to 103.2% of the principal amount thereof, and upon the occurrence of certain events, such as a change in the regulatory capital treatment of the Trust Securities, either Trust being deemed an investment company or the occurrence of certain adverse tax events. In addition, the Company and the Trusts may defer interest and dividend payments, respectively, for up to five consecutive years without resulting in a default. An event of default may occur if the Company declares bankruptcy, fails to make the required payments within 30 days or breaches certain covenants under the Debentures. The Debentures are subordinated to the prior payment of any other indebtedness of the Company.
The Company invested the proceeds of the sale of the Trust Securities in its banking subsidiary, where the funds were used primarily to restructure the investment portfolio, fund loan growth and repay FHLB advances.
Stockholders’ equity (including unrealized appreciation on securities available-for-sale, net of tax) increased $2,807,094 (7%) to $44,899,243 as of December 31, 2006. Net income for the period ended December 31, 2006 exceeded cash dividends paid or declared by $4,649,668. The Company repurchased 125,066 shares as treasury stock at a cost of $3,593,081, at an average price of $28.73 per share. As of December 31, 2006, 163,477 shares remain to be repurchased under the repurchase plan announced July 25, 2006. The decrease in unrealized appreciation on securities available-for-sale, net of tax, decreased stockholders’ equity by $437,377. Stockholders’ equity also increased as a result of exercises of stock options to purchase the Company’s Common Stock and the release of shares of the Company’s Common Stock held by the Bank sponsored Employee Stock Ownership Plan. On a per share basis, stockholders’ equity increased $1.13 (7%) from $15.17 as of December 31, 2005 to $16.30 as of December 31, 2006.
Guaranty Federal Bancshares, Inc.
Management’s Discussion and Analysis of Financial Condition
And Results of Operations
AVERAGE BALANCES, INTEREST AND AVERAGE YIELDS
The following table shows the balances as of December 31, 2006 of various categories of interest-earning assets and interest-bearing liabilities and the corresponding yields and costs, and, for the periods indicated: (1) the average balances of various categories of interest-earning assets and interest-bearing liabilities, (2) the total interest earned or paid thereon, and (3) the resulting weighted average yields and costs. In addition, the table shows the Company’s rate spreads and net yields. Average balances are based on daily balances. Tax-free income is not material; accordingly, interest income and related average yields have not been calculated on a tax equivalent basis. Average loan balances include non-accrual loans. Dollar amounts are expressed in thousands.
| | | As of | | Year Ended | | Year Ended | | Year Ended | |
| | | December 31, 2006 | | December 31, 2006 | | December 31, 2005 | | December 31, 2004 | |
| | | Balance | | Yield / Cost | | Average Balance | | Interest | | Yield / Cost | | Average Balance | | Interest | | Yield / Cost | | Average Balance | | Interest | | Yield / Cost | |
ASSETS | | | | | | | | | | | | | | | | | | | | | | | |
| Interest-earning: | | | | | | | | | | | | | | | | | | | | | | | |
| Loans | | $ | 480,269 | | | 7.78 | % | $ | 452,348 | | $ | 34,362 | | | 7.60 | % | $ | 419,552 | | $ | 26,553 | | | 6.33 | % | $ | 366,696 | | $ | 19,990 | | | 5.45 | % |
| Investment securities | | | 6,184 | | | 5.04 | % | | 7,262 | | | 451 | | | 6.21 | % | | 9,905 | | | 432 | | | 4.36 | % | | 10,076 | | | 289 | | | 2.87 | % |
| Other assets | | | 12,064 | | | 4.17 | % | | 9,843 | | | 253 | | | 2.57 | % | | 11,681 | | | 299 | | | 2.56 | % | | 14,508 | | | 260 | | | 1.79 | % |
| Total interest-earning | | | 498,517 | | | 7.66 | % | | 469,452 | | | 35,066 | | | 7.47 | % | | 441,138 | | | 27,284 | | | 6.18 | % | | 391,280 | | | 20,539 | | | 5.25 | % |
| Noninterest-earning | | | 26,328 | | | | | | 20,914 | | | | | | | | | 20,205 | | | | | | | | | 20,812 | | | | | | | |
| | | $ | 524,845 | | | | | $ | 490,366 | | | | | | | | $ | 461,343 | | | | | | | | $ | 412,092 | | | | | | | |
| | | | | | | | | | | | | | | | | | | | | | | | | | | | | | | | | | | |
LIABILITIES AND STOCKHOLDERS' EQUITY | |
| Interest-bearing: | | | | | | | | | | | | | | | | | | | | | | | | | | | | | | | | | | |
| Savings accounts | | $ | 14,316 | | | 2.67 | % | $ | 14,830 | | | 365 | | | 2.46 | % | $ | 14,931 | | | 201 | | | 1.35 | % | $ | 16,607 | | | 140 | | | 0.84 | % |
| Transaction accounts | | | 87,782 | | | 2.55 | % | | 78,238 | | | 1,710 | | | 2.19 | % | | 84,776 | | | 1,300 | | | 1.53 | % | | 80,001 | | | 793 | | | 0.99 | % |
| Certificates of deposit | | | 223,236 | | | 4.86 | % | | 195,772 | | | 8,448 | | | 4.32 | % | | 178,301 | | | 5,788 | | | 3.25 | % | | 139,264 | | | 3,986 | | | 2.86 | % |
| FHLB advances | | | 108,000 | | | 5.35 | % | | 110,810 | | | 5,722 | | | 5.16 | % | | 111,104 | | | 4,494 | | | 4.04 | % | | 111,169 | | | 3,519 | | | 3.17 | % |
| Subordinated debentures | | | 15,465 | | | 6.62 | % | | 15,465 | | | 1,028 | | | 6.65 | % | | 701 | | | 47 | | | 6.70 | % | | - | | | - | | | | |
| Other borrowed funds | | | 1,703 | | | 2.75 | % | | 3,947 | | | 114 | | | 2.89 | % | | 1,395 | | | 31 | | | 2.22 | % | | 987 | | | 7 | | | 0.71 | % |
| Total interest-bearing | | | 450,502 | | | 4.51 | % | | 419,062 | | | 17,387 | | | 4.15 | % | | 391,208 | | | 11,861 | | | 3.03 | % | | 348,029 | | | 8,446 | | | 2.43 | % |
| Noninterest-bearing | | | 29,444 | | | | | | 26,898 | | | | | | | | | 28,374 | | | | | | | | | 24,173 | | | | | | | |
| Total liabilities | | | 479,946 | | | | | | 445,960 | | | | | | | | | 419,582 | | | | | | | | | 372,202 | | | | | | | |
| Stockholders' equity | | | 44,899 | | | | | | 44,406 | | | | | | | | | 41,761 | | | | | | | | | 39,891 | | | | | | | |
| | | $ | 524,845 | | | | | $ | 490,366 | | | | | | | | $ | 461,343 | | | | | | | | $ | 412,092 | | | | | | | |
| Net earning balance | | $ | 48,015 | | | | | $ | 50,390 | | | | | | | | $ | 49,930 | | | | | | | | $ | 43,252 | | | | | | | |
| Earning yield less costing rate | | | | | | 3.15 | % | | | | | | | | 3.32 | % | | | | | | | | 3.15 | % | | | | | | | | 2.82 | % |
| Net interest income, and net yield spread on interest-earning assets | | | | | | | | | | | $ | 17,679 | | | 3.77 | % | | | | $ | 15,423 | | | 3.50 | % | | | | $ | 12,094 | | | 3.09 | % |
| Ratio of interest-earning assets to | | | | | | | | | | | | | | | | | | | | | | | | | | | | | | | | | | |
| interest-bearing liabilities | | | 111 | % | | | | | 112 | % | | | | | | | | 113 | % | | | | | | | | 112 | % | | | | | | |
Guaranty Federal Bancshares, Inc.
Management’s Discussion and Analysis of Financial Condition
And Results of Operations
The following table sets forth information regarding changes in interest income and interest expense for the periods indicated resulting from changes in average balances and average rates shown in the previous table. For each category of interest-earning assets and interest-bearing liabilities information is provided with respect to changes attributable to: (i) changes in balance (change in balance multiplied by the old rate), (ii) changes in interest rates (change in rate multiplied by the old balance); and (iii) the combined effect of changes in balance and interest rates (change in balance multiplied by change in rate). Dollar amounts are expressed in thousands.
| | | Year ended | | Year ended | |
| | | December 31, 2006 versus December 31, 2005 | | December 31, 2005 versus December 31, 2004 | |
| | | Average Balance | | Interest Rate | | Rate & Balance | | Total | | Average Balance | | Interest Rate | | Rate & Balance | | Total | |
| Interest income: | | | | | | | | | | | | | | | | | |
| Loans | | $ | 2,075 | | | 5,318 | | | 416 | | | 7,809 | | $ | 2,881 | | | 3,218 | | | 464 | | | 6,563 | |
| Investment securitites | | | (115 | ) | | 183 | | | (49 | ) | | 19 | | | (5 | ) | | 150 | | | (2 | ) | | 143 | |
| Other assets | | | (47 | ) | | 1 | | | - | | | (46 | ) | | (50 | ) | | 111 | | | (22 | ) | | 39 | |
| Net change in interest income | | | 1,913 | | | 5,502 | | | 367 | | | 7,782 | | | 2,826 | | | 3,479 | | | 440 | | | 6,745 | |
| | | | | | | | | | | | | | | | | | | | | | | | | | |
| Interest expense: | | | | | | | | | | | | | | | | | | | | | | | | | |
| Savings accounts | | | (2 | ) | | 167 | | | (1 | ) | | 164 | | | (14 | ) | | 84 | | | (9 | ) | | 61 | |
| Transaction accounts | | | (100 | ) | | 553 | | | (43 | ) | | 410 | | | 47 | | | 433 | | | 26 | | | 506 | |
| Certificates of deposit | | | 567 | | | 1,907 | | | 187 | | | 2,661 | | | 1,117 | | | 535 | | | 150 | | | 1,802 | |
| Advances | | | (12 | ) | | 1,243 | | | (3 | ) | | 1,228 | | | (2 | ) | | 977 | | | (1 | ) | | 974 | |
| Subordinated debentures | | | 990 | | | - | | | (9 | ) | | 981 | | | 47 | | | - | | | - | | | 47 | |
| Other borrowed funds | | | 57 | | | 9 | | | 17 | | | 83 | | | 3 | | | 15 | | | 6 | | | 24 | |
| Net change in interest expense | | | 1,500 | | | 3,879 | | | 148 | | | 5,527 | | | 1,198 | | | 2,044 | | | 172 | | | 3,414 | |
| Change in net interest income | | $ | 413 | | | 1,623 | | | 219 | | | 2,255 | | $ | 1,628 | | | 1,435 | | | 268 | | | 3,331 | |
RESULTS OF OPERATIONS - COMPARISON OF YEAR ENDED DECEMBER 31, 2006 AND DECEMBER 31, 2005
| | | Prime | | Ten-Year Treasury | | One-Year Treasury | |
| December 31, 2006 | | | 7.96 | % | | 4.80 | % | | 4.94 | % |
| December 31, 2005 | | | 6.19 | % | | 4.29 | % | | 3.62 | % |
| Change in rates | | | 1.77 | % | | 0.51 | % | | 1.32 | % |
Interest Rates. The Bank charges borrowers and pays depositors interest rates that are largely a function of the general level of interest rates. The above table sets forth the weekly average interest rates for the 52 weeks ending December 31, 2006 and December 31, 2005 as reported by the Federal Reserve. The Bank typically indexes its adjustable rate commercial loans to prime and its adjustable rate mortgage loans to the one-year treasury rate. The ten-year treasury rate is a proxy for 30-year fixed rate home mortgage loans.
Rates trended upward during 2005 as the Federal Reserve Open Market Committee increased the discount rates 25 basis points after eight consecutive meetings from January 2005 to December 2005. As of year-end 2005 the prime rate was 7.25%.This trend continued in 2006 as the Federal Reserve Open Market Committee increased the discount rates 25 basis points after four consecutive meetings from January 2006 to June 2006. As of year-end 2006 the prime rate was 8.25%.
Guaranty Federal Bancshares, Inc.
Management’s Discussion and Analysis of Financial Condition
And Results of Operations
Interest Income. Total interest income increased $7,782,911 (29%) as the average balance of interest-earning assets increased $28,314,000 (6%). In addition, the yield on average interest earning assets increased 129 basis points to 7.47%.
Interest on loans increased $7,809,604 (29%) and the average loan receivable balance increased $32,796,000 (8%) while the average yield increased 127 basis points to 7.60%. The increase in loan yield is the result of the combination of new loans at higher rates, a reduction in prepayments, and an increase of interest rates on adjustable rate loans.
Interest Expense. Total interest expense increased $5,526,189 (47%) as the average balance of interest-bearing liabilities increased $27,854,000 (7%). In addition, the average cost of interest-bearing liabilities increased 112 basis points to 4.15%.
Interest expense on deposits increased $3,235,130 (44%) as the average balance of interest bearing deposits increased $10,832,000 (4%) and the average interest rate paid to depositors increased 102 basis points to 3.64%. The average balance of interest bearing core deposit accounts decreased $6,639,000 (7%) and the average balance of certificates of deposit increased $17,471,000 (10%).
The Company’s borrowings from the FHLB increased to $108,000,000, which remains in compliance with the FHLB limitation of advances to 35% of assets. The average cost of those advances increased 112 basis points to 5.16%. As a result, interest expense on these advances increased $1,227,976 (27%). As of December 31, 2006 FHLB advances are 20% of total assets, compared to 21% of total assets as of December 31, 2005.
Net Interest Income. The Company’s net interest income increased $2,256,722 (15%). During the year ended December 31, 2006, the average balance of interest-earning assets exceeded the average balance of interest-bearing liabilities by $50,390,000, resulting in an increase in the average net earning balance of $460,000 (1%). In addition, the Company’s spread between the average yield on interest-earning assets and the average cost of interest-bearing liabilities increased by 17 basis points from 3.15% to 3.32%.
Provision for Loan Losses. Provisions for loan losses are charged or credited to earnings to bring the total allowance for loan losses to a level considered adequate by the Company to provide for potential loan losses in the existing loan portfolio. When making its assessment, the Company considers prior loss experience, volume and type of lending, local banking trends and past due loans in the Company’s loan portfolio. In addition, the Company considers general economic conditions and other factors related to collectibility of the Company’s loan portfolio.
During the year ended December 31, 2006, the Company experienced loan charge-offs, in excess of recoveries, of $366,177 and, based on a review as discussed above, elected to record a provision for loan loss of $750,000 to increase the allowance for loan losses to $5,783,477 as of December 31, 2006. The provision for loan losses recorded by the Company during year ended December 31, 2005 was $945,000. Management of the Company anticipates the need to continue increasing the loan loss allowance in the future through charges to provision for loan losses based on the anticipated growth in its loan portfolio and the shift in the Company’s emphasis from primarily single-family loans to a mix of single-family and commercial loans.
Non-Interest Income. Non-interest income increased $200,789 (6%). The gain on sale of loans of $692,276 for 2006, compared to $623,252 for 2005, was the result of mortgage banking activities related to the sale of single-family conforming residential loans in the secondary market. The Bank attempts to minimize its risk of price changes by committing to sell loans while the loans are in the origination process. The gain on sale of investments for the year ended December 31, 2006 was $750,869, compared to $743,335 for year ended December 31, 2005. In 2006, this gain was attributed to the sale of 12,000 shares of FHLMC stock. During 2006 the Bank sold its mortgage loan servicing rights to a third party, which resulted in a profit on the sale of $89,441. In addition the Bank had income from tax credits purchased of $191,678 during 2006. Deposit service charges decreased $241,709 (15%) due to decreases in insufficient funds and overdraft charges on the Bank’s checking accounts. In addition, late charges and other fees decreased $30,021 (11%) primarily due to a decrease in prepayment penalties collected during the year ended December 31, 2006.
Guaranty Federal Bancshares, Inc.
Management’s Discussion and Analysis of Financial Condition
And Results of Operations
Non-Interest Expense. Non-interest expense increased $1,507,193 (17%). This increase was primarily due to increases in salaries and employee benefits of $1,226,893 (25%) and occupancy expense of $155,211 (11%). The increase in compensation was due to normal salary and benefits increases for the Bank’s employees, along with an increase in the number of employees. The staff increased from 125 full-time equivalent employees as of December 31, 2005 to 146 full-time equivalent employees as of December 31, 2006. In 2006, the Company opened a new full-service branch in Springfield, Missouri. In addition advertising expense increased $173,038 (75%). This increase was primarily due to the Bank’s decision to increase its exposure through the use of several different advertising mediums. Data processing expense decreased $160,222 (36%). This decrease was primarily due to the Bank’s decision to terminate its relationship with a third-party vendor that provided data processing services. This conversion was completed in January of 2006.
Income Taxes. The increase in income tax expense is a direct result of the increase in the Company’s taxable income for the period ended December 31, 2006 as compared to the period ended December 31, 2005.
Cash Dividends Paid. The Company paid dividends of $0.165 per share on April 14, 2006, to stockholders’ of record as of March 30, 2006, and $0.165 per share on July 15, 2006 to stockholders’ of record as of July 1, 2006, and $0.17 per share on October 14, 2006, to stockholders’ of record as of October 1, 2006. The Company declared a cash dividend of $0.17 per share on December 21, 2006, which was paid on January 19, 2007, to stockholders of record on January 5, 2007.
RESULTS OF OPERATIONS - COMPARISON OF YEAR ENDED DECEMBER 31, 2005 AND DECEMBER 31, 2004
| | | Prime | | Ten-Year Treasury | | One-Year Treasury | |
| December 31, 2005 | | | 6.19 | % | | 4.29 | % | | 3.62 | % |
| December 31, 2004 | | | 4.34 | % | | 4.27 | % | | 1.88 | % |
| Change in rates | | | 1.85 | % | | 0.02 | % | | 1.74 | % |
Interest Rates. The Bank charges borrowers and pays depositors interest rates that are largely a function of the general level of interest rates. The above table sets forth the weekly average interest rates for the 52 weeks ending December 31, 2005 and December 31, 2004 as reported by the Federal Reserve. The Bank typically indexes its adjustable rate commercial loans to prime and its adjustable rate mortgage loans to the one-year treasury rate. The ten-year treasury rate is a proxy for 30-year fixed rate home mortgage loans.
Rates trended upward during 2004 as the Federal Reserve Open Market Committee increased the discount rates 25 basis points after five consecutive meetings from June to December 2004. As of year-end 2004, the prime rate was 5.25% up from 4.00% where it was quoted from June 2003 to June 2004. This trend continued in 2005 as the Federal Reserve Open Market Committee increased the discount rates 25 basis points after eight consecutive meetings from January 2005 to December 2005. As of year-end 2005 the prime rate was 7.25%.
Interest Income. Total interest income increased $6,744,135 (33%) as the average balance of interest-earning assets increased $49,858,000 (12%). In addition, the yield on average interest earning assets increased 93 basis points to 6.18%.
Interest on loans increased $6,562,743 (33%) and the average loan receivable balance increased $52,856,000 (14%) while the average yield increased 88 basis points to 6.33%. The increase in loan yield is the result of the combination of new loans at higher rates, a reduction in prepayments, and an increase of interest rates on adjustable rate loans.
Guaranty Federal Bancshares, Inc.
Management’s Discussion and Analysis of Financial Condition
And Results of Operations
Interest Expense. Total interest expense increased $3,414,774 (40%) as the average balance of interest-bearing liabilities increased $43,179,000 (12%). In addition, the average cost of interest-bearing liabilities increased 60 basis points to 3.03%.
Interest expense on deposits increased $2,368,909 (48%) as the average balance of interest bearing deposits increased $42,136,000 (18%) and the average interest rate paid to depositors increased 54 basis points to 2.62%. The average balance of interest bearing core deposit accounts increased $3,099,000 (3%) and the average balance of certificates of deposit increased $39,037,000 (28%).
In compliance with the FHLB limitation of advances to 35% of assets, the Company’s borrowings from the FHLB remained the same at $100,000,000. The average cost of those advances increased 87 basis points to 4.04%. As a result, interest expense on these advances increased $974,604 (28%). As of December 31, 2005, FHLB advances are 21% of total assets, compared to 23% of total assets as of December 31, 2004.
Net Interest Income. The Company’s net interest income increased $3,329,361 (28%). During the year ended December 31, 2005, the average balance of interest-earning assets exceeded the average balance of interest-bearing liabilities by $49,930,000, resulting in an increase in the average net earning balance of $49,858,000 (12%). In addition, the Company’s spread between the average yield on interest-earning assets and the average cost of interest-bearing liabilities increased by 33 basis points from 2.82% to 3.15%.
Provision for Loan Losses. Provisions for loan losses are charged or credited to earnings to bring the total allowance for loan losses to a level considered adequate by the Company to provide for potential loan losses in the existing loan portfolio. When making its assessment, the Company considers prior loss experience, volume and type of lending, local banking trends and past due loans in the Company’s loan portfolio. In addition, the Company considers general economic conditions and other factors related to collectibility of the Company’s loan portfolio.
During year ended December 31, 2005, the Company experienced loan charge-offs in excess of recoveries of $82,000 and, based on a review as discussed above, elected to record a provision for loan loss of $945,000 to increase the allowance for loan losses to $5,399,654 as of December 31, 2005. The provision for loan losses recorded by the Company during year ended December 31, 2004 was $863,830. Management of the Company anticipates the need to continue increasing the loan loss allowance in the future through charges to provision for loan losses based on the anticipated growth in its loan portfolio and the shift in the Company’s emphasis from primarily single-family loans to a mix of single-family and commercial loans.
Non-Interest Income. Non-interest income decreased $19,115 (1%). The gain on sale of loans of $623,252 for 2005, compared to $484,920 for 2004, was the result of mortgage banking activities related to the sale of single-family conforming residential loans in the secondary market. The Bank attempts to minimize its risk of price changes by committing to sell loans while the loans are in the origination process. The gain on sale of investments for year ended December 31, 2005 was $743,335, compared to $742,608 for year ended December 31, 2004. In 2005, this gain was primarily attributed to the gain of $1,210,672, arising from the sale of 19,400 shares of FHLMC stock, which was offset by the loss of $526,000 incurred with the sale of all of its shares of Fannie Mae preferred. Deposit service charges decreased $234,396 (12%) due to decreases in insufficient funds and overdraft charges on the Bank’s checking accounts. In addition, late charges and other fees decreased $89,239 (25%) primarily due to a decrease in prepayment penalties collected during the year ended December 31, 2005.
Non-Interest Expense. Non-interest expense increased $421,630 (5%). This increase was primarily due to increases in salaries and employee benefits of $313,328 (7%) and occupancy expense of $78,298 (6%). The increase in compensation was due to normal salary and benefits increases for the Bank’s employees, along with an increase in the number of employees. The staff increased from 115 full-time equivalent employees as of December 31, 2004 to 125 full-time equivalent employees as of December 31, 2005. In August 2005, the Company opened a new full-service branch in Nixa, Missouri. In addition, the full-service branch located on West Kearney was in operation for the entire year of 2005.
Guaranty Federal Bancshares, Inc.
Management’s Discussion and Analysis of Financial Condition
And Results of Operations
Income Taxes. The increase in income tax expense is a direct result of the increase in the Company’s taxable income for the period ended December 31, 2005 as compared to the period ended December 31, 2004.
Cash Dividends Paid. The Company paid dividends of $0.16 per share on April 14, 2005, to stockholders’ of record as of March 30, 2005, and $0.16 per share on July 15, 2005 to stockholders’ of record as of July 1, 2005, and $0.165 per share on October 14, 2005, to stockholders’ of record as of October 1, 2005. The Company declared a cash dividend of $0.165 per share on December 22, 2005, which was paid on January 20, 2006, to stockholders of record on January 6, 2006.
ASSET / LIABILITY MANAGEMENT
The goal of the Bank’s asset/liability policy is to manage interest rate risk so as to maximize net interest income over time in changing interest rate environments. Management monitors the Bank’s net interest spreads (the difference between yields received on assets and paid on liabilities) and, although constrained by market conditions, economic conditions, and prudent underwriting standards, it offers deposit rates and loan rates that maximize net interest income. Management also attempts to fund the Bank’s assets with liabilities of a comparable duration to minimize the impact of changing interest rates on the Bank’s net interest income. This matching is especially difficult because the residential mortgage loans that comprise a significant portion of the Bank’s assets give the borrower the right to prepay at any time. These borrowers act in their economic self-interest and refinance higher rate loans when rates are low. Since the relative spread between financial assets and liabilities is constantly changing, the Bank’s current net interest income may not be an indication of future net interest income.
As a part of its asset and liability management strategy, the Bank implemented an adjustable rate mortgage loan (“ARM”) program beginning in the early 1980s. Throughout the past several years, the Bank has continued to emphasize the origination of adjustable-rate, one- to four-family residential loans and adjustable-rate or relatively short-term commercial real estate, construction, commercial business, home equity and consumer loans, while originating fixed-rate, one- to four-family residential loans primarily for immediate resale in the secondary market.
The Bank is also managing interest rate risk by the origination of construction loans. As of December 31, 2006, such loans, net of loans in process, constitute 17% of the Bank’s loan portfolio. In general, these loans have higher yields, shorter maturities, and greater interest rate sensitivity than other real estate loans.
The Bank constantly monitors its deposits in an effort to decrease their interest rate sensitivity. Rates of interest paid on deposits at the Bank are priced competitively in order to meet the Bank’s asset/liability management objectives and spread requirements. As of December 31, 2006 and December 31, 2005, the Bank’s savings accounts, checking accounts, and money market deposit accounts totaled $128,993,214 or 37% of its total deposits and $130,252,633 or 41% of total deposits, respectively. The weighted average rate paid on these accounts increased 87 basis points from 1.12% on December 31, 2005 to 1.99% on December 31, 2006. The Bank believes, based on historical experience, that a substantial portion of such accounts represents non-interest rate sensitive, core deposits. During the year ending December 31, 2007, the FHLB has the option to call $9.0 million of advances with a weighted average rate of 5.55% and a remaining life of 1.7 years.
Guaranty Federal Bancshares, Inc.
Management’s Discussion and Analysis of Financial Condition
And Results of Operations
INTEREST RATE SENSITIVITY ANALYSIS
The following table sets forth as of December 31, 2006, management’s estimates of the projected changes in net portfolio value (“NPV”) in the event of 100, 200, and 300 basis point (“bp”) instantaneous and permanent increases and decreases in market interest rates. Dollar amounts are expressed in thousands.
| BP Change | | Estimated Net Portfolio Value | | NPV as % of PV of Assets | |
| in Rates | | $ Amount | | $ Change | | % Change | | NPV Ratio | | Change | |
| +300 | | | 41,364 | | | (1,646 | ) | | -3 | % | | 9.55 | % | | -3.61 | % |
| +200 | | | 42,650 | | | (360 | ) | | -1 | % | | 9.60 | % | | -3.56 | % |
| +100 | | | 43,321 | | | 311 | | | 1 | % | | 9.53 | % | | -3.63 | % |
| NC | | | 43,010 | | | | | | | | | 9.25 | % | | | |
| -100 | | | 41,982 | | | (1,028 | ) | | -2 | % | | 8.85 | % | | -4.31 | % |
| -200 | | | 40,409 | | | (2,601 | ) | | -5 | % | | 8.38 | % | | -4.78 | % |
| -300 | | | 38,284 | | | (4,726 | ) | | -8 | % | | 7.81 | % | | -5.35 | % |
Computations of prospective effects of hypothetical interest rate changes are based on an internally generated model using actual maturity and repricing schedules for the Bank’s loans and deposits, and are based on numerous assumptions, including relative levels of market interest rates, loan repayments and deposit run-offs, and should not be relied upon as indicative of actual results. Further, the computations do not contemplate any actions the Bank may undertake in response to changes in interest rates.
Management cannot predict future interest rates or their effect on the Bank’s NPV in the future. Certain shortcomings are inherent in the method of analysis presented in the computation of NPV. For example, although certain assets and liabilities may have similar maturities or periods to repricing, they may react in differing degrees to changes in market interest rates. Additionally, certain assets, such as adjustable-rate loans, which represent the Bank’s primary loan product, have an initial fixed rate period typically from one to five years and over the remaining life of the asset changes in the interest rate are restricted. In addition, the proportion of adjustable-rate loans in the Bank’s loan portfolio could decrease in future periods due to refinancing activity if market interest rates remain constant or decrease in the future. Further, in the event of a change in interest rates, prepayment and early withdrawal levels could deviate significantly from those assumed in the table. Finally, the ability of many borrowers to service their adjustable-rate debt may decrease in the event of an interest rate increase.
The Bank’s Board of Directors is responsible for reviewing the Bank’s asset and liability policies. The Bank’s management is responsible for administering the policies and determinations of the Board of Directors with respect to the Bank’s asset and liability goals and strategies. Management expects that the Bank’s asset and liability policies and strategies will continue as described above so long as competitive and regulatory conditions in the financial institution industry and market interest rates continue as they have in recent years.
LIQUIDITY AND CAPITAL RESOURCES
The Company’s principal sources of funds for investments and operations are net income from operations, deposits from its primary market area, FHLB advances, principal and interest payments on loans and mortgage-backed securities, proceeds from maturing investment securities, and the issuance of subordinated debentures. The Company considers deposits and FHLB advances as its primary sources of funds.
The Company’s most liquid assets are cash and cash equivalents, which are cash on hand, amounts due from financial institutions, and certificates of deposit with other financial institutions that have an original maturity of three months or less. The levels of such assets are dependent on the Bank’s operating, financing, and investment activities at any given time. The Company’s cash and cash equivalents totaled $14,880,601 as of December 31, 2006 and $20,506,478 as of December 31, 2005, representing a decrease of $5,625,877. The variations in levels of cash and cash equivalents are influenced by deposit flows and anticipated future deposit flows, which are subject to, and influenced by, many factors.
Guaranty Federal Bancshares, Inc.
Management’s Discussion and Analysis of Financial Condition
And Results of Operations
In addition to the capital necessary to meet the Company’s conditional commitments discussed under the caption “Off-Balance Sheet Arrangements” below, the Bank also has $173,499,700 in certificates of deposit that are scheduled to mature in one year or less. Management anticipates that the majority of these certificates will renew in the normal course of operations. Based on existing collateral as well as the FHLB’s limitation of advances to 35% of assets, the Bank has the ability to borrow an additional $40,645,000 from the FHLB, as of December 31, 2006. The Bank plans to maintain its FHLB borrowings to a level that will provide a borrowing capacity sufficient to provide for contingencies.
The Company’s regulatory capital position of $57,820,000 is 11.0% of total assets as of December 31, 2006. The Company has an excess of $38,205,000, $38,589,000, and $26,790,000 of required regulatory levels of tangible, core, and risk-based capital, respectively. Under current regulatory guidelines, the Bank is classified as well capitalized. See also additional information provided under the caption “Regulatory Matters” in Note 1 of the Notes to Consolidated Financial Statements.
During the year ended December 31, 2006, the Company declared dividends of $0.67 per share and paid dividends of $0.665 per share, compared to dividends declared of $0.65 per share and paid of $0.645 per share during the year ended December 31, 2005. The Board of Directors of the Company meets regularly to consider the level and the timing of dividend payments. Dividends declared but unpaid at December 31, 2006 ($0.17 per share), were paid to shareholders on January 19, 2007.
During the year ended December 31, 2005, the Company purchased 146,542 shares of common stock at an average price of $24.31 to place in the treasury account. During the year ended December 31, 2006, the Company purchased 125,066 shares of common stock at an average price of $28.73 to place in the treasury account. The Company intends to monitor the common stock price and, with regulatory approval, may from time to time initiate further stock repurchases in order to improve the Company’s long-term earnings per share while at the same time maintaining an adequate level of stockholders’ equity. The Company has a repurchase plan which was announced on July 25, 2006, and as of December 31, 2006, a total of 163,477 shares of the Company’s common stock may be purchased under this plan.
On December 15, 2005, the Company issued $15 million of trust preferred securities (”Trust Securities”) in a private placement. The proceeds of the sale of Trust Securities issued by Guaranty Statutory Trust I and Guaranty Statutory Trust II, together with the proceeds of the Trust’s sale of their common securities issued to the Company, were used by the Trusts to purchase 30-year junior subordinated deferrable interest debentures from the Company in the principal amount of $5,155,000 (“Trust I Debentures”) and $10,310,000 (“Trust II Debentures”), respectively. The Trust I Debentures bear interest at a fixed rate of 6.92%, payable quarterly. The Trust II Debentures bear interest at a fixed rate of 6.47% for 5 years, payable quarterly, after issuance and thereafter at a floating rate equal to the three month LIBOR plus 1.45%. The Company invested the proceeds of the sale of the Trust Securities in its banking subsidiary, where the funds were used primarily to restructure the investment portfolio, fund loan growth and repay FHLB advances.
OFF-BALANCE SHEET ARRANGEMENTS
Various commitments and contingent liabilities arise in the normal course of business, which are not required to be recorded on the balance sheet. The most significant of these are loan commitments, lines of credit and standby letters of credit. Commitments to extend credit are agreements to lend to a customer as long as there is no violation of any condition established in the contract. As of December 31, 2006 and 2005, the Bank had outstanding commitments to originate loans of approximately $3,991,000 and $2,285,000, respectively. Lines of credit are agreements to lend to a customer as long as there is no violation of any condition established in the contract. As of December 31, 2006 and 2005, unused lines of credit to borrowers aggregated approximately $64,370,000 and $77,725,000 for commercial lines and $19,790,000 and $18,180,000 for open-end consumer lines. Since a portion of the loan commitment and line of credit may expire without being drawn upon, the total unused commitments and lines do not necessarily represent future cash requirements.
Guaranty Federal Bancshares, Inc.
Management’s Discussion and Analysis of Financial Condition
And Results of Operations
Standby letters of credit are irrevocable conditional commitments issued by the Bank to guarantee the performance of a customer to a third party. The credit risk involved in issuing standby letters of credit is essentially the same as that involved in extending loans to customers. The Bank had total outstanding standby letters of credit amounting to $9,182,000 and $9,731,000 as of December 31, 2006 and 2005, respectively. Forward commitments to sell mortgage loans are obligations to deliver loans at a specified price on or before a specified date. As of December 31, 2006 and 2005, the Bank had no outstanding forward commitments.
In connection with the Company’s issuance of the Trust Securities and pursuant to two guarantee agreements by and between the Company and Wilmington Trust Company, the Company issued a limited, irrevocable guarantee of the obligations of each Trust under the Trust Securities whereby the Company has guaranteed any and all payment obligations of the Trusts related to the Trust Securities including distributions on, and the liquidation or redemption price of, the Trust Securities to the extent each Trust does not have funds available.
AGGREGATE CONTRACTUAL OBLIGATIONS
The following table summarizes the Company’s fixed and determinable contractual obligations by payment date as of December 31, 2006. Dollar amounts are expressed in thousands.
| Payments Due By Period | |
| | | | | | | | | | | | |
| | | | | One Year | | One to | | Three to | | More than | |
| Contractual Obligations | | Total | | or less | | Three Years | | Five Years | | Five Years | |
| | | | | | | | | | | | |
| Deposits without stated maturity | | $ | 128,993 | | | 128,993 | | | - | | | - | | | - | |
| Time and brokered certificates of deposit | | | 223,236 | | | 173,500 | | | 43,483 | | | 5,353 | | | 900 | |
| Short-term borrowings | | | 1,703 | | | 1,703 | | | - | | | - | | | - | |
| Federal Home Loan Bank advances | | | 108,000 | | | 85,414 | | | 14,036 | | | 3,000 | | | 5,550 | |
| Subordinated debentures | | | 15,465 | | | - | | | - | | | - | | | 15,465 | |
| Operating leases | | | 443 | | | 108 | | | 178 | | | 115 | | | 42 | |
| Purchase obligations | | | - | | | - | | | - | | | - | | | - | |
| Other long term obligations | | | 110,984 | | | 110,984 | | | - | | | - | | | - | |
| Total | | $ | 588,825 | | | 338,077 | | | 69,716 | | | 8,468 | | | 21,957 | |
IMPACT OF INFLATION AND CHANGING PRICES
The Company prepared the consolidated financial statements and related data presented herein in accordance with accounting principles generally accepted in the United States of America which require the measurement of financial position and operating results in terms of historical dollars, without considering changes in the relative purchasing power of money over time due to inflation.
Unlike most companies, the assets and liabilities of a financial institution are primarily monetary in nature. As a result, interest rates have a more significant impact on a financial institution’s performance than the effects of general levels of inflation. Interest rates do not necessarily move in the same direction or in the same magnitude as the price of goods and services, since such prices are affected by inflation. In the current interest rate environment, liquidity and the maturity structure of the Bank’s assets and liabilities are critical to the maintenance of acceptable performance levels.
Guaranty Federal Bancshares, Inc.
Management’s Discussion and Analysis of Financial Condition
And Results of Operations
CRITICAL ACCOUNTING POLICIES
Management’s Discussion and Analysis of Financial Condition and Results of Operations is based upon the Company’s consolidated financial statements and the notes thereto, which have been prepared in accordance with accounting principles generally accepted in the United States of America. The preparation of these financial statements requires management to make estimates and judgments that affect the reported amounts of assets and liabilities and the disclosure of contingent assets and liabilities at the date of the financial statements and the reported amounts of revenues and expenses during the reported periods. On an on-going basis, management evaluates its estimates and judgments.
Management bases its estimates and judgments on historical experience and on various other factors that are believed to be reasonable under the circumstances, the results of which form the basis for making judgments about the carrying values of assets and liabilities that are not readily apparent from other sources. There can be no assurance that actual results will not differ from those estimates. If actual results are different than management’s judgements and estimates, the Company’s financial results could change, and such change could be material to the Company.
Material estimates and judgments that are particularly susceptible to significant change relate to the determination of the allowance for loan losses. In connection with the determination of the allowance for loan losses, management obtains independent appraisals for significant properties.
The Company has identified the accounting policies for the allowance for loan losses and related significant estimates and judgments as critical to its business operations and the understanding of its results of operations. For a detailed discussion on the application of these significant estimates and judgments and our accounting policies, also see Note 1 of the notes to consolidated financial statements in this report.
IMPACT OF NEW ACCOUNTING PRONOUNCEMENTS
In July 2006, the Financial Accounting Standards Board (FASB) issued FASB Interpretation No. 48 (FIN 48), Accounting for Uncertainty in Income Taxes - an Interpretation of SFAS No. 109 - Accounting for Income Taxes. This interpretation addresses accounting for tax uncertainties that arise when a position that an entity takes on its tax return may be different from the position that the taxing authority may take, and provides guidance about the accounting for tax benefits associated with uncertain tax positions, classification of a liability recognized for those positions, and interim reporting considerations. This Interpretation requires that the Company recognize in its financial statements, the impact of a tax position, if that position is more likely than not of being sustained on audit. The provisions of FIN 48 are effective as of the beginning of the Company's 2007 fiscal year, with the cumulative effect of the change in accounting principle recorded as an adjustment to retained earnings. The Company is evaluating the requirements of the exposure draft to determine the impact, if any, on the financial condition or the results of operation of the Company.
In March 2006, the FASB issued Statement of Financial Accounting Standards (SFAS) No. 156, Accounting for Servicing of Financial Assets. SFAS No. 156 amends SFAS No. 140, Accounting for Transfers and Servicing of Financial Assets and Extinguishments of Liabilities, and specifies the accounting for certain servicing assets and liabilities, such as those common to mortgage servicing activities. SFAS No. 156 requires an entity to separately recognize servicing assets and servicing liabilities and to initially measure these servicing assets and servicing liabilities at fair value at inception. It also permits an entity with a separately recognized servicing asset or servicing liability to choose either the amortization method or fair value method for subsequent measurement. Adoption of SFAS No. 156 is required for transactions occurring in fiscal years beginning after September 15, 2006, with early adoption permitted. The Company does not believe the adoption of this standard will have a material impact on the consolidated financial condition or results of operations of the Company.
In September 2006, the FASB issued SFAS No. 157, Fair Value Measurements. This Statement defines fair value, establishes a framework for measuring fair value in generally accepted accounting principles and expands disclosure related to the use of fair value measures in financial statements. This Statement applies under other accounting pronouncements that require or permit fair value measurements, and does not expand the use of fair value measures in financial statements, but standardizes its definition and guidance in generally accepted accounting principles. SFAS No. 157 emphasizes that fair value is a market-based measurement based on an exchange transaction between market participants in which an entity sells an asset or transfers a liability. SFAS No. 157 also establishes a fair value hierarchy from observable market data as the highest level to fair value based on an entity's own fair value assumptions as the lowest level. The Statement is to be effective for financial statements issued for fiscal years beginning after November 15, 2007, with early adoption permitted. The Company is evaluating this Statement to determine the impact, if any, on certain of its financial assets and liabilities.
Guaranty Federal Bancshares, Inc.
Management’s Discussion and Analysis of Financial Condition
And Results of Operations
In September 2006, the Securities and Exchange Commission issued Staff Accounting Bulletin (SAB) No. 108, Considering the Effects of Prior Year Misstatements when Quantifying Misstatements in Current Year Financial Statements. SAB No. 108 was issued to provide guidance on how the effects of prior year uncorrected misstatements should be considered when quantifying misstatements in current year financial statements. SAB No. 108 requires an entity to quantify misstatements using both a balance sheet and an income statement approach and to evaluate whether either approach results in quantifying an error that is material in light of the relevant quantitative and qualitative factors. SAB No. 108 is effective for fiscal years ending after November 15, 2006. The adoption of this standard did not have a material impact on the consolidated financial condition or results of operations of the Company.
Guaranty Federal Bancshares, Inc.
Management’s Discussion and Analysis of Financial Condition
And Results of Operations
SUMMARY OF UNAUDITED QUARTERLY OPERATING RESULTS
| | | Year Ended December 31, 2006, Quarter ended | |
| | | Mar-06 | | Jun-06 | | Sep-06 | | Dec-06 | |
| Interest income | | $ | 8,077,915 | | | 8,386,269 | | | 9,054,605 | | | 9,547,529 | |
| Interest expense | | | 3,769,423 | | | 4,125,175 | | | 4,543,095 | | | 4,948,900 | |
| Net interest income | | | 4,308,492 | | | 4,261,094 | | | 4,511,510 | | | 4,598,629 | |
| Provision for loan losses | | | 225,000 | | | 225,000 | | | 150,000 | | | 150,000 | |
| Gain on sale of loans and investment securities | | | 317,997 | | | 336,889 | | | 349,425 | | | 438,834 | |
| Other noninterest income, net | | | 503,823 | | | 621,981 | | | 571,626 | | | 657,273 | |
| Noninterest expense | | | 2,367,394 | | | 2,543,500 | | | 2,630,195 | | | 2,635,605 | |
| Income before income taxes | | | 2,537,918 | | | 2,451,464 | | | 2,652,366 | | | 2,909,131 | |
| Provision for income taxes | | | 973,593 | | | 870,074 | | | 1,028,044 | | | 1,170,084 | |
| Net income | | $ | 1,564,325 | | | 1,581,390 | | | 1,624,322 | | | 1,739,047 | |
| Basic earnings per share | | $ | 0.56 | | | 0.56 | | | 0.58 | | | 0.63 | |
| Diluted earnings per share | | $ | 0.54 | | | 0.54 | | | 0.56 | | | 0.61 | |
| | | Year Ended December 31, 2005, Quarter ended | |
| | | Mar-05 | | Jun-05 | | Sep-05 | | Dec-05 | |
| Interest income | | $ | 5,900,919 | | | 6,560,914 | | | 7,091,488 | | | 7,730,086 | |
| Interest expense | | | 2,457,208 | | | 2,783,379 | | | 3,129,687 | | | 3,490,130 | |
| Net interest income | | | 3,443,711 | | | 3,777,535 | | | 3,961,801 | | | 4,239,956 | |
| Provision for loan losses | | | 225,000 | | | 240,000 | | | 240,000 | | | 240,000 | |
| Gain on sale of loans and investment securities | | | 337,736 | | | 304,288 | | | 390,684 | | | 333,879 | |
| Other noninterest income, net | | | 546,174 | | | 536,916 | | | 567,108 | | | 580,274 | |
| Noninterest expense | | | 2,180,393 | | | 2,065,697 | | | 2,157,256 | | | 2,266,155 | |
| Income before income taxes | | | 1,922,228 | | | 2,313,042 | | | 2,522,337 | | | 2,647,954 | |
| Provision for income taxes | | | 707,454 | | | 864,327 | | | 935,076 | | | 999,734 | |
| Net income | | $ | 1,214,774 | | | 1,448,715 | | | 1,587,261 | | | 1,648,220 | |
| Basic earnings per share | | $ | 0.43 | | | 0.53 | | | 0.57 | | | 0.59 | |
| Diluted earnings per share | | $ | 0.41 | | | 0.50 | | | 0.55 | | | 0.57 | |
Guaranty Federal Bancshares, Inc.
Consolidated Balance Sheets
December 31, 2006 and 2005
| | | December 31, | | December 31, | |
| | | 2006 | | 2005 | |
ASSETS | | | | | |
| Cash | | $ | 10,684,831 | | | 17,990,774 | |
| Interest-bearing deposits in other financial institutions | | | 4,195,770 | | | 2,515,704 | |
| Cash and cash equivalents | | | 14,880,601 | | | 20,506,478 | |
| Available-for-sale securities | | | 7,906,321 | | | 6,757,147 | |
| Held-to-maturity securities | | | 763,025 | | | 944,724 | |
| Stock in Federal Home Loan Bank, at cost | | | 5,382,700 | | | 4,978,800 | |
| Mortgage loans held for sale | | | 3,004,635 | | | 2,092,279 | |
| Loans receivable, net of allowance for loan losses of December 31, 2006 and 2005 - $5,783,477 and $5,399,654, respectively | | | 477,264,522 | | | 433,435,429 | |
| Accrued interest receivable: | | | | | | | |
| Loans | | | 2,830,811 | | | 2,040,872 | |
| Investments | | | 79,498 | | | 48,255 | |
| Prepaid expenses and other assets | | | 2,955,483 | | | 2,604,425 | |
| Foreclosed assets held for sale | | | 172,637 | | | 26,775 | |
| Premises and equipment | | | 7,867,809 | | | 7,452,798 | |
| Income taxes receivable | | | 774,469 | | | - | |
| Deferred income taxes | | | 962,484 | | | 112,686 | |
| | | $ | 524,844,995 | | | 481,000,668 | |
| | | | | | | | |
LIABILITIES AND STOCKHOLDERS' EQUITY | | | | | | | |
| | | | | | | | |
| LIABILITIES | | | | | | | |
| Deposits | | $ | 352,229,636 | | | 320,058,951 | |
| Federal Home Loan Bank advances | | | 108,000,000 | | | 100,000,000 | |
| Securities sold under agreements to repurchase | | | 1,703,221 | | | 1,594,258 | |
| Subordinated debentures | | | 15,465,000 | | | 15,465,000 | |
| Advances from borrowers for taxes and insurance | | | 222,869 | | | 212,320 | |
| Accrued expenses and other liabilities | | | 441,890 | | | 288,587 | |
| Accrued interest payable | | | 1,414,946 | | | 508,164 | |
| Dividend payable | | | 468,190 | | | 459,074 | |
| Income taxes payable | | | - | | | 322,165 | |
| | | | 479,945,752 | | | 438,908,519 | |
| STOCKHOLDERS' EQUITY | | | | | | | |
| Common Stock: | | | | | | | |
| $0.10 par value; authorized 10,000,000 shares; issued; December 31, 2006 and 2005 - 6,653,527 and 6,571,348 shares, respectively | | | 665,353 | | | 657,135 | |
| Additional paid-in capital | | | 55,730,352 | | | 53,778,686 | |
| Unearned ESOP shares | | | (1,344,930 | ) | | (1,572,930 | ) |
| Retained earnings, substantially restricted | | | 41,183,006 | | | 36,533,338 | |
| Accumulated other comprehensive income | | | | | | | |
| Unrealized appreciation on available-for-sale securities, net of income taxes; December 31, 2006 and 2005 - $901,243, and $1,158,114, respectively | | | 1,534,548 | | | 1,971,925 | |
| | | | 97,768,329 | | | 91,368,154 | |
| Treasury stock, at cost; | | | | | | | |
| December 31, 2006 and 2005 - 3,764,367 and 3,639,301 shares, respectively | | | (52,869,086 | ) | | (49,276,005 | ) |
| | | | 44,899,243 | | | 42,092,149 | |
| | | $ | 524,844,995 | | | 481,000,668 | |
See Notes to Consolidated Financial Statements
Guaranty Federal Bancshares, Inc.
Consolidated Statements of Income
Years Ended December 31, 2006, 2005 and 2004
| | | 2006 | | 2005 | | 2004 | |
| | | | | | | | |
INTEREST INCOME | | | | | | | |
| Loans | | $ | 34,362,199 | | | 26,552,595 | | | 19,989,852 | |
| Investment securities | | | 450,919 | | | 431,863 | | | 289,335 | |
| Other | | | 253,200 | | | 298,949 | | | 260,085 | |
| | | | 35,066,318 | | | 27,283,407 | | | 20,539,272 | |
INTEREST EXPENSE | | | | | | | | | | |
| Deposits | | | 10,523,203 | | | 7,288,073 | | | 4,919,164 | |
| Federal Home Loan Bank advances | | | 5,721,973 | | | 4,493,997 | | | 3,519,393 | |
| Subordinated debentures | | | 1,027,526 | | | 47,683 | | | - | |
| Other | | | 113,891 | | | 30,651 | | | 7,073 | |
| | | | 17,386,593 | | | 11,860,404 | | | 8,445,630 | |
NET INTEREST INCOME | | | 17,679,725 | | | 15,423,003 | | | 12,093,642 | |
PROVISION FOR LOAN LOSSES | | | 750,000 | | | 945,000 | | | 863,830 | |
NET INTEREST INCOME AFTER PROVISION FOR LOAN LOSSES | | | 16,929,725 | | | 14,478,003 | | | 11,229,812 | |
NONINTEREST INCOME | | | | | | | | | | |
| Service charges | | | 1,401,724 | | | 1,643,433 | | | 1,877,829 | |
| Late charges and other fees | | | 234,339 | | | 264,360 | | | 353,689 | |
| Gain on sale of investment securities | | | 750,869 | | | 743,335 | | | 742,608 | |
| Gain on sale of loans | | | 692,276 | | | 623,252 | | | 484,920 | |
| Loss on foreclosed assets | | | (46,833 | ) | | (1,617 | ) | | (3,157 | ) |
| Other income | | | 765,473 | | | 324,296 | | | 160,285 | |
| | | | 3,797,848 | | | 3,597,059 | | | 3,616,174 | |
NONINTERESTEXPENSE | | | | | | | | | | |
| Salaries and employee benefits | | | 6,111,762 | | | 4,884,869 | | | 4,571,541 | |
| Occupancy | | | 1,520,770 | | | 1,365,559 | | | 1,287,261 | |
| FDIC deposit insurance premiums | | | 39,661 | | | 39,796 | | | 36,038 | |
| Data processing | | | 280,189 | | | 440,411 | | | 399,891 | |
| Advertising | | | 403,292 | | | 230,254 | | | 287,594 | |
| Other expense | | | 1,821,020 | | | 1,708,612 | | | 1,665,544 | |
| | | | 10,176,694 | | | 8,669,501 | | | 8,247,871 | |
INCOME BEFORE INCOME TAXES | | | 10,550,879 | | | 9,405,561 | | | 6,598,115 | |
PROVISION FOR INCOME TAXES | | | 4,041,795 | | | 3,506,591 | | | 2,313,342 | |
NET INCOME | | $ | 6,509,084 | | | 5,898,970 | | | 4,284,773 | |
| | | | | | | | | | | |
BASIC EARNINGS PER SHARE | | $ | 2.34 | | | 2.12 | | | 1.53 | |
DILUTED EARNINGS PER SHARE | | $ | 2.25 | | | 2.03 | | | 1.47 | |
See Notes to Consolidated Financial Statements
Guaranty Federal Bancshares, Inc.
Consolidated Statements of Cash Flows
Years Ended December 31, 2006, 2005 and 2004
| | | 2006 | | 2005 | | 2004 | |
| | | | | | | | |
CASH FLOWS FROM OPERATING ACTIVITIES | | | | | | | |
| Net income | | $ | 6,509,084 | | | 5,898,970 | | | 4,284,773 | |
| Items not requiring (providing) cash: | | | | | | | | | | |
| Deferred income taxes | | | (592,927 | ) | | (249,519 | ) | | (99,952 | ) |
| Depreciation | | | 814,150 | | | 759,931 | | | 670,096 | |
| Provision for loan losses | | | 750,000 | | | 945,000 | | | 863,830 | |
| Gain on sale of loans and investment securities | | | (1,443,145 | ) | | (1,366,587 | ) | | (1,227,528 | ) |
| (Gain) loss on sale of equipment and other assets | | | (89,911 | ) | | 3,055 | | | 11,517 | |
| (Gain) loss on sale of foreclosed assets | | | 46,833 | | | (1,323 | ) | | (1,724 | ) |
| Amortization of deferred income, premiums and discounts | | | 24,106 | | | (48,305 | ) | | 78,148 | |
| Stock award plan expense | | | 83,192 | | | 45,694 | | | 63,200 | |
| Origination of loans held for sale | | | (51,685,484 | ) | | (45,528,012 | ) | | (30,561,273 | ) |
| Proceeds from sale of loans held for sale | | | 51,465,404 | | | 47,649,521 | | | 28,723,721 | |
| Release of ESOP shares | | | 651,958 | | | 564,980 | | | 461,512 | |
| Changes in: | | | | | | | | | | |
| Accrued interest receivable | | | (821,182 | ) | | (519,112 | ) | | (264,287 | ) |
| Prepaid expenses and other assets | | | 400,043 | | | (628,141 | ) | | 80,912 | |
| Accrued expenses and other liabilities | | | 1,060,085 | | | 200,417 | | | 105,421 | |
| Income taxes payable | | | (790,942 | ) | | 89,638 | | | 7,484 | |
| Net cash provided by operating activities | | | 6,381,264 | | | 7,816,207 | | | 3,195,850 | |
| | | | | | | | | | | |
CASH FLOWS FROM INVESTING ACTIVITIES | | | | | | | | | | |
| Net increase in loans | | | (45,195,742 | ) | | (45,967,115 | ) | | (59,380,244 | ) |
| Principal payments on held-to-maturity securities | | | 186,219 | | | 358,395 | | | 574,920 | |
| Principal payments on available-for-sale securities | | | 175,145 | | | - | | | - | |
| Purchase of available-for-sale securities | | | (3,780,315 | ) | | (10,516,958 | ) | | (5,971,840 | ) |
| Purchase of premises and equipment | | | (719,094 | ) | | (1,032,777 | ) | | (1,300,977 | ) |
| Purchase of tax credit investments | | | (2,195,334 | ) | | - | | | - | |
| Proceeds from sale of originated mortgage servicing rights | | | 1,023,608 | | | - | | | - | |
| Proceeds from sale of premises and equipment | | | 470 | | | 5,860 | | | 6,500 | |
| Proceeds from sales of available-for-sale securities | | | 762,617 | | | 9,345,564 | | | 754,355 | |
| Proceeds from maturities of available-for-sale securities | | | 1,750,000 | | | 9,000,000 | | | 6,000,000 | |
| (Purchase) redemption of FHLB stock | | | (403,900 | ) | | 167,700 | | | 147,700 | |
| Proceeds from sale of foreclosed assets | | | 395,327 | | | 352,341 | | | 434,161 | |
| Net cash used in investing activities | | | (48,000,999 | ) | | (38,286,990 | ) | | (58,735,425 | ) |
See Notes to Consolidated Financial Statements
Guaranty Federal Bancshares, Inc.
Consolidated Statements of Cash Flows (continued)
Years Ended December 31, 2006, 2005 and 2004
| | | 2006 | | 2005 | | 2004 | |
| | | | | | | | |
CASH FLOWS FROM FINANCING ACTIVITIES | | | | | | | |
| Stock options exercised | | | 1,147,042 | | | 1,031,400 | | | 751,274 | |
| Cash dividends paid | | | (1,850,300 | ) | | (1,794,557 | ) | | (1,767,337 | ) |
| Cash dividends received on RRP Stock | | | - | | | - | | | 217 | |
| Net increase (decrease) in demand deposits, NOW accounts and savings accounts | | | (1,259,419 | ) | | 2,901,337 | | | 10,307,199 | |
| Net increase in certificates of deposit and securities sold under agreements to repurchase | | | 33,539,067 | | | 21,100,110 | | | 49,475,420 | |
| Proceeds from FHLB advances | | | 1,901,242,000 | | | 1,322,664,000 | | | 201,614,000 | |
| Repayments of FHLB advances | | | (1,893,242,000 | ) | | (1,322,664,000 | ) | | (210,450,948 | ) |
| Proceeds from issuance of subordinated debentures | | | - | | | 15,465,000 | | | - | |
| Advances from borrowers for taxes and insurance | | | 10,549 | | | (59,476 | ) | | 12,529 | |
| Treasury stock purchased | | | (3,593,081 | ) | | (3,563,011 | ) | | (1,163,115 | ) |
| Net cash provided by financing activities | | | 35,993,858 | | | 35,080,803 | | | 48,779,239 | |
| | | | | | | | | | | |
INCREASE (DECREASE) IN CASH AND CASH EQUIVALENTS | | | (5,625,877 | ) | | 4,610,020 | | | (6,760,336 | ) |
| | | | | | | | | | | |
CASH AND CASH EQUIVALENTS, BEGINNING OF YEAR | | | 20,506,478 | | | 15,896,458 | | | 22,656,794 | |
| | | | | | | | | | | |
CASH AND CASH EQUIVALENTS, END OF YEAR | | $ | 14,880,601 | | | 20,506,478 | | | 15,896,458 | |
| | | | | | | | | | | |
Supplemental Cash Flows Information | | | | | | | | | | |
| | | | | | | | | | | |
| Real estate acquired in settlement of loans | | $ | 588,022 | | | 299,643 | | | 466,670 | |
| | | | | | | | | | | |
| Interest paid | | $ | 16,479,811 | | | 11,713,756 | | | 8,445,630 | |
| | | | | | | | | | | |
| Income taxes paid | | $ | 4,041,795 | | | 3,506,591 | | | 2,313,342 | |
| | | | | | | | | | | |
| Dividend declared and unpaid | | $ | 468,190 | | | 459,074 | | | 450,868 | |
See Notes to Consolidated Financial Statements
Guaranty Federal Bancshares, Inc.
Consolidated Statements of Stockholders’ Equity
Years Ended December 31, 2006, 2005 and 2004
| | | Common Stock | | Additional Paid-In Capital | | Unearned ESOP Shares | | Treasury Stock | | Retained Earnings | | Accumulated Other Comprehensive Income | | Total | |
Balance, January 1, 2004 | | $ | 642,890 | | | 51,330,202 | | | (2,030,930 | ) | | (44,549,879 | ) | | 29,919,695 | | | 2,666,143 | | | 37,978,121 | |
| Comprehensive income | | | | | | | | | | | | | | | | | | | | | | |
| Net income | | | - | | | - | | | - | | | - | | | 4,284,773 | | | - | | | 4,284,773 | |
| Change in unrealized appreciation on available-for-sale securitites, net of income taxes of $87,911 | | | - | | | - | | | - | | | - | | | - | | | 149,685 | | | 149,685 | |
| Total comprehensive income | | | | | | | | | | | | | | | | | | | | | 4,434,458 | |
| Dividends ($0.64 per share) | | | - | | | - | | | - | | | - | | | (1,767,337 | ) | | - | | | (1,767,337 | ) |
| Stock award plans | | | - | | | 78,350 | | | - | | | - | | | - | | | - | | | 78,350 | |
| Stock options exercised | | | 6,496 | | | 744,778 | | | - | | | - | | | - | | | - | | | 751,274 | |
| Release of ESOP shares | | | - | | | 231,512 | | | 230,000 | | | - | | | - | | | - | | | 461,512 | |
| Treasury stock purchased | | | - | | | - | | | - | | | (1,163,115 | ) | | - | | | - | | | (1,163,115 | ) |
Balance, December 31, 2004 | | | 649,386 | | | 52,384,842 | | | (1,800,930 | ) | | (45,712,994 | ) | | 32,437,131 | | | 2,815,828 | | | 40,773,263 | |
| Comprehensive income | | | | | | | | | | | | | | | | | | | | | | |
| Net income | | | - | | | - | | | - | | | - | | | 5,898,970 | | | - | | | 5,898,970 | |
| Change in unrealized appreciation on available-for-sale securitites, net of income taxes of ($495,626) | | | - | | | - | | | - | | | - | | | - | | | (843,903 | ) | | (843,903 | ) |
| Total comprehensive income | | | | | | | | | | | | | | | | | | | | | 5,055,067 | |
| Dividends ($0.65 per share) | | | - | | | - | | | - | | | - | | | (1,802,763 | ) | | - | | | (1,802,763 | ) |
| Stock award plans | | | - | | | 33,213 | | | - | | | - | | | - | | | - | | | 33,213 | |
| Stock options exercised | | | 7,749 | | | 1,023,651 | | | - | | | - | | | - | | | - | | | 1,031,400 | |
| Release of ESOP shares | | | - | | | 336,980 | | | 228,000 | | | - | | | - | | | - | | | 564,980 | |
| Treasury stock purchased | | | - | | | - | | | - | | | (3,563,011 | ) | | - | | | - | | | (3,563,011 | ) |
Balance, December 31, 2005 | | | 657,135 | | | 53,778,686 | | | (1,572,930 | ) | | (49,276,005 | ) | | 36,533,338 | | | 1,971,925 | | | 42,092,149 | |
| Comprehensive income | | | | | | | | | | | | | | | | | | | | | | |
| Net income | | | - | | | - | | | - | | | - | | | 6,509,084 | | | - | | | 6,509,084 | |
| Change in unrealized appreciation on available-for-sale securitites, net of income taxes of ($256,871) | | | - | | | - | | | - | | | - | | | - | | | (437,377 | ) | | (437,377 | ) |
| Total comprehensive income | | | | | | | | | | | | | | | | | | | | | 6,071,707 | |
| Dividends ($0.67 per share) | | | - | | | - | | | - | | | - | | | (1,859,416 | ) | | - | | | (1,859,416 | ) |
| Stock award plans | | | - | | | 388,884 | | | - | | | - | | | - | | | - | | | 388,884 | |
| Stock options exercised | | | 8,218 | | | 1,138,824 | | | - | | | - | | | - | | | - | | | 1,147,042 | |
| Release of ESOP shares | | | - | | | 423,958 | | | 228,000 | | | - | | | - | | | - | | | 651,958 | |
| Treasury stock purchased | | | - | | | - | | | - | | | (3,593,081 | ) | | - | | | - | | | (3,593,081 | ) |
Balance, December 31, 2006 | | $ | 665,353 | | | 55,730,352 | | | (1,344,930 | ) | | (52,869,086 | ) | | 41,183,006 | | | 1,534,548 | | | 44,899,243 | |
See Notes to Consolidated Financial Statements
Guaranty Federal Bancshares, Inc.
Notes to Consolidated Financial Statements
NOTE 1: | NATURE OF OPERATIONS AND SUMMARY OF SIGNIFICANT ACCOUNTING POLICIES |
Organization
In April 1995, Guaranty Federal Savings & Loan Association reorganized from a federally chartered mutual savings and loan association into a mutual holding company, Guaranty Federal Bancshares, M. H. C. (the "MHC"). Concurrent with the reorganization, Guaranty Federal Savings Bank (the "Bank"), a stock savings bank was chartered. The Bank issued 3,125,000 shares of common stock in connection with the reorganization, the majority of which were owned by the MHC.
On December 30, 1997, the MHC converted to Guaranty Federal Bancshares, Inc. (the “Company”), a Delaware-chartered stock corporation. In connection with the conversion and reorganization, the shares of the Bank held by the mutual holding company were extinguished along with the mutual holding company and the shares of the Bank held by the public were exchanged for 1,880,710 shares of the Company. Additional shares of the Company were sold to certain depositors of the Bank and to the trust of the employee stock ownership plan of the Bank as of December 30, 1997.
On June 27, 2003, the Bank converted to a state-chartered trust company with banking powers, and the Company became a one-bank holding company. The name of the Bank was changed from Guaranty Federal Savings Bank to Guaranty Bank.
Nature of Operations
The Company operates as a one-bank holding company. The Bank is primarily engaged in providing a full range of banking and mortgage services to individual and corporate customers in southwest Missouri. The Bank is subject to competition from other financial institutions. The Company and the Bank are also subject to the regulation of certain federal and state agencies and receive periodic examinations by those regulatory authorities.
Principles of Consolidation
The consolidated financial statements include the accounts of the Company and its wholly owned subsidiary, the Bank. All significant intercompany profits, transactions and balances have been eliminated in consolidation.
Use of Estimates
The preparation of financial statements in conformity with accounting principles generally accepted in the United States of America requires management to make estimates and assumptions that affect the reported amounts of assets and liabilities and disclosure of contingent assets and liabilities at the date of the financial statements and the reported amounts of revenues and expenses during the reporting period. Actual results could differ from those estimates.
Material estimates that are particularly susceptible to significant change in the near term relate to the determination of the allowance for loan losses and the valuation of real estate acquired in connection with foreclosures or in satisfaction of loans. In connection with the determination of the allowance for loan losses and the valuation of foreclosed assets held for sale, management obtains independent appraisals for significant properties.
Securities
Available-for-sale securities, which include any security for which the Company or the Bank has no immediate plan to sell but which may be sold in the future, are carried at fair value. Unrealized gains and losses are recorded, net of related income tax effects, in other comprehensive income.
Guaranty Federal Bancshares, Inc.
Notes to Consolidated Financial Statements
Held-to-maturity securities, which include any security for which the Company or the Bank has the positive intent and ability to hold until maturity, are carried at historical cost adjusted for amortization of premiums and accretion of discounts.
Amortization of premiums and accretion of discounts are recorded as interest income from securities. Realized gains and losses are recorded as interest income from securities. Realized gains and losses are recorded as net security gains (losses). Gains and losses on sales of securities are determined on the specific identification method.
Mortgage Loans Held for Sale
Mortgage loans held for sale are carried at the lower of cost or fair value, determined using an aggregate basis. Write-downs to fair value are recognized as a charge to earnings at the time the decline in value occurs. Forward commitments to sell mortgage loans are sometimes acquired to reduce market risk on mortgage loans in the process of origination and mortgage loans held for sale. Gains and losses resulting from sales of mortgage loans are recognized when the respective loans are sold to investors. Gains and losses are determined by the difference between the selling price plus the value of retained servicing rights and the carrying amount of the loans sold, net of discounts collected or paid and considering a normal servicing rate. Fees received from borrowers to guarantee the funding of mortgage loans held for sale and fees paid to investors to ensure the ultimate sale of such mortgage loans are recognized as income or expense when the loans are sold or when it becomes evident that the commitment will not be used.
Loans
Loans that management has the intent and ability to hold for the foreseeable future or until maturity or pay-offs are reported at their outstanding principal balances adjusted for any charge-offs, the allowance for loan losses, any deferred fees or costs on originated loans and unamortized premiums or discounts on purchased loans. Interest income is reported on the interest method, and includes amortization of net deferred loan fees and costs over the loan term. Generally, loans are placed on non-accrual status at ninety days past due and interest is considered a loss, unless the loan is well-secured and in the process of collection.
Loan Servicing
The cost of originated mortgage-servicing rights is amortized over the shorter of the actual or contractual loan life. Impairment of mortgage-servicing rights is assessed based on the fair value of those rights. Fair values are estimated by discounting expected cash flows. For purposes of measuring impairment, the rights are stratified based on the loan type, remaining term to maturity and interest rate. The key assumptions used in the valuation include discount rates, prepayment speeds and servicing costs. The amount of impairment recognized is the amount by which the capitalized mortgage servicing rights exceeds their fair value. During 2006, the Company sold its mortgage servicing rights to a third party.
Allowance for Loan Losses
The allowance for loan losses is established as losses are estimated to have occurred through a provision for loan losses charged to income. Loan losses are charged against the allowance when management believes the uncollectibility of a loan balance is confirmed. Subsequent recoveries, if any, are credited to the allowance.
The allowance for loan losses is evaluated on a regular basis by management and is based upon management’s periodic review of the collectibility of the loans in light of historical experience, the nature and volume of the loan portfolio, adverse situations that may affect the borrower’s ability to repay, estimated value of any underlying collateral and prevailing economic conditions. This evaluation is inherently subjective as it requires estimates that are susceptible to significant revision as more information becomes available.
Guaranty Federal Bancshares, Inc.
Notes to Consolidated Financial Statements
A loan is considered impaired when, based on current information and events, it is probable that the Bank will be unable to collect the scheduled payments of principal or interest when due according to the contractual terms of the loan agreement. Factors considered by management in determining impairment include payment status, collateral value and the probability of collecting scheduled principal and interest payments when due. Loans that experience insignificant payment delays and payment shortfalls generally are not classified as impaired. Management determines the significance of payment delays and payment shortfalls on a case-by-case basis, taking into consideration all of the circumstances surrounding the loan and the borrower, including the length of the delay, the reasons for the delay, the borrower’s prior payment record and the amount of the shortfall in relation to the principal and interest owed. Impairment is measured on a loan-by-loan basis for commercial and construction loans by either the present value of expected future cash flows discounted at the loan’s effective interest rate, the loan’s obtainable market price or the fair value of the collateral if the loan is collateral dependent.
Foreclosed Assets Held for Sale
Assets acquired through, or in lieu of, loan foreclosure are held for sale and are initially recorded at fair value at the date of foreclosure, establishing a new cost basis. Subsequent to foreclosure, valuations are periodically performed by management and the assets are carried at the lower of carrying amount or fair value less estimated cost to sell. Revenue and expenses from operations and changes in the valuation allowance are included in net expenses from foreclosed assets.
Premises and Equipment
Depreciable assets are stated at cost less accumulated depreciation. Depreciation is charged to expense using the straight-line and accelerated methods over the estimated useful lives of the assets.
Income Taxes
Deferred tax liabilities and assets are recognized for the tax effects of differences between the financial statement and tax bases of assets and liabilities. A valuation allowance is established to reduce deferred tax assets if it is more likely than not that a deferred tax asset will not be realized.
Cash Equivalents
The Company considers all highly liquid interest-bearing deposits in other financial institutions with an initial maturity of three months or less to be cash equivalents.
Regulatory Matters
The Company and the Bank are subject to various regulatory capital requirements administered by the federal banking agencies. Failure to meet minimum capital requirements can initiate certain mandatory and possibly additional discretionary actions by regulators that, if undertaken, could have a direct and material effect on the Company's financial statements. Under capital adequacy guidelines and the regulatory framework for prompt corrective action, the Company and the Bank must meet specific capital guidelines that involve quantitative measures of assets, liabilities and certain off-balance-sheet items as calculated under regulatory accounting practices. The capital amounts and classification are also subject to qualitative judgments by the regulators about components, risk weightings and other factors.
Quantitative measures established by regulation to ensure capital adequacy require the Company and the Bank to maintain minimum amounts and ratios (set forth in the table below). Management believes, as of December 31, 2006, that the Company and the Bank meet all capital adequacy requirements to which they are subject.
As of December 31, 2006, the most recent notification from the Missouri Division of Finance and the Federal Deposit Insurance Corporation categorized the Bank as well capitalized under the regulatory framework for prompt corrective action. To be categorized as well capitalized the Bank must maintain minimum total risk-based, Tier I risk-based and Tier I leverage ratios as set forth in the following table. There are no conditions or events since that notification that management believes have changed the Company’s or the Bank’s category.
Guaranty Federal Bancshares, Inc.
Notes to Consolidated Financial Statements
The Company’s and the Bank's actual capital amounts and ratios are also presented in the table. No amount was deducted from capital for interest-rate risk. Dollar amounts are expressed in thousands.
| | | | | | | | | | | To Be Well Capitalized | |
| | | | | | | For Capital | | Under Prompt Corrective | |
| | | Actual | | Adequacy Purposes | | Action Provisions | |
| | | Amount | | Ratio | | Amount | | Ratio | | Amount | | Ratio | |
| As of December 31, 2006 | | | | | | | | | | | | | |
| | | | | | | | | | | | | | |
| Tier 1 (core) capital, and ratio to adjusted total assets | | | | | | | | | | | | | |
| Company | | $ | 57,820 | | | 11.8 | % | $ | 19,615 | | | 4.0 | % | | n/a | | | n/a | |
| Bank | | $ | 57,062 | | | 11.2 | % | $ | 20,336 | | | 4.0 | % | $ | 25,420 | | | 5.0 | % |
| | | | | | | | | | | | | | | | | | | | |
| Tier 1 (core) capital, and ratio to risk-weighted assets | | | | | | | | | | | | | | | | | | | |
| Company | | $ | 57,820 | | | 12.0 | % | $ | 19,231 | | | 4.0 | % | | n/a | | | n/a | |
| Bank | | $ | 57,062 | | | 11.9 | % | $ | 19,231 | | | 4.0 | % | $ | 28,846 | | | 6.0 | % |
| | | | | | | | | | | | | | | | | | | | |
| Total risk-based capital, and ratio to risk-weighted assets | | | | | | | | | | | | | | | | | | | |
| Company | | $ | 65,251 | | | 13.6 | % | $ | 38,461 | | | 8.0 | % | | n/a | | | n/a | |
| Bank | | $ | 63,948 | | | 13.3 | % | $ | 38,461 | | | 8.0 | % | $ | 48,077 | | | 10.0 | % |
Guaranty Federal Bancshares, Inc.
Notes to Consolidated Financial Statements
| | | | | | | | | | | To Be Well Capitalized | |
| | | | | | | For Capital | | Under Prompt Corrective | |
| | | Actual | | Adequacy Purposes | | Action Provisions | |
| | | Amount | | Ratio | | Amount | | Ratio | | Amount | | Ratio | |
| As of December 31, 2005 | | | | | | | | | | | | | |
| | | | | | | | | | | | | | |
| Tier 1 (core) capital, and ratio to adjusted total assets | | | | | | | | | | | | | |
| Company | | $ | 51,040 | | | 10.7 | % | $ | 19,083 | | | 4.0 | % | | n/a | | | n/a | |
| Bank | | $ | 53,796 | | | 11.3 | % | $ | 19,010 | | | 4.0 | % | $ | 23,762 | | | 5.0 | % |
| | | | | | | | | | | | | | | | | | | | |
| Tier 1 (core) capital, and ratio to risk-weighted assets | | | | | | | | | | | | | | | | | | | |
| Company | | $ | 51,040 | | | 12.5 | % | $ | 16,296 | | | 4.0 | % | | n/a | | | n/a | |
| Bank | | $ | 53,796 | | | 13.2 | % | $ | 16,276 | | | 4.0 | % | $ | 24,414 | | | 6.0 | % |
| | | | | | | | | | | | | | | | | | | | |
| Total risk-based capital, and ratio to risk-weighted assets | | | | | | | | | | | | | | | | | | | |
| Company | | $ | 57,544 | | | 14.1 | % | $ | 32,592 | | | 8.0 | % | | n/a | | | n/a | |
| Bank | | $ | 60,294 | | | 14.8 | % | $ | 32,552 | | | 8.0 | % | $ | 40,690 | | | 10.0 | % |
The amount of dividends that the Bank may pay is subject to various regulatory limitations. As of December 31, 2006, 2005, and 2004, the Bank exceeded their minimum capital requirements. The Bank may not pay dividends which would reduce capital below the minimum requirements shown above.
Earnings Per Share
The computation for earnings per share for years ended December 31, 2006, 2005 and 2004 is as follows:
| | | Year Ended | | Year Ended | | Year Ended | |
| | | December 31, 2006 | | December 31, 2005 | | December 31, 2004 | |
| | | | | | | | |
| Net income | | $ | 6,509,084 | | | 5,898,970 | | | 4,284,773 | |
| Average common shares outstanding | | | 2,786,823 | | | 2,780,249 | | | 2,808,412 | |
| Effect of stock options outstanding | | | 109,200 | | | 126,885 | | | 113,425 | |
| Average diluted shares outstanding | | | 2,896,023 | | | 2,907,134 | | | 2,921,837 | |
| Earnings per share - basic | | $ | 2.34 | | | 2.12 | | | 1.53 | |
| Earnings per share - diluted | | $ | 2.25 | | | 2.03 | | | 1.47 | |
All outstanding options to purchase common stock were included in the computation of diluted earnings per share for the year ended December 31, 2006. Options to purchase 21,500 and 10,000 shares of common stock were outstanding during the years ended December 31, 2005 and 2004, respectively, but were not included in the computation of diluted earnings per share because the options’ exercise price was greater than the average market price of the common shares.
Guaranty Federal Bancshares, Inc.
Notes to Consolidated Financial Statements
Stock Option Plans
In December, 2004, the Financial Accounting Standards Board issued Statement of Financial Accounting Standards (SFAS) No. 123R, “Share-Based Payment” (SFAS 123R). SFAS 123R requires companies to recognize the cost of employee services received in exchange for awards of equity instruments, such as stock options and restricted stock, based on the fair value of those awards at the date of grant and eliminates the choice to account for employee stock options under Accounting Principles Board Opinion No. 25, “Accounting for Stock Issued to Employees” (APB 25), which is how the Company previously accounted for its stock options. The Company adopted SFAS 123R effective January 1, 2006 using the modified prospective method and, as such, results for prior periods have not been restated. Stock-based compensation expense will be recognized for all stock options granted or modified after January 1, 2006. In addition, unvested options existing at January 1, 2006, will be recognized in expense over the remaining vesting period. The fair value of all stock options has been estimated using the Black-Scholes option pricing model using various assumptions, some of which are highly subjective.
As a result of adopting SFAS 123R on January 1, 2006, incremental stock-based compensation expense recognized was $64,655 during the year ended December 31, 2006. As of December 31, 2006, there was $178,484 of unrecognized compensation expense related to nonvested stock options, which will be recognized over the remaining vesting period.
Prior to January 1, 2006, no compensation expense was recognized for stock option grants, as all such grants had an exercise price equal to the fair market value on the date of grant. The following illustrates the effect on net income and earnings per share if the Company had applied the fair value method of SFAS No. 123, “Accounting for Stock-Based Compensation,” prior to January 1, 2006:
| | | Year Ended | | Year Ended | |
| | | December 31, 2005 | | December 31, 2004 | |
| | | | | | |
| Net income, as reported | | $ | 5,898,970 | | | 4,284,773 | |
| Less: Total stock-based employee compensation cost determined under the fair value-based method, net of income taxes | | | (51,516 | ) | | (35,949 | ) |
| | | | | | | | |
| Pro forma net income | | $ | 5,847,454 | | | 4,248,824 | |
| | | | | | | | |
| Earnings per share: | | | | | | | |
| Basic - as reported | | $ | 2.12 | | | 1.53 | |
| Basic - pro forma | | $ | 2.10 | | | 1.51 | |
| Diluted - as reported | | $ | 2.03 | | | 1.47 | |
| Diluted - pro forma | | $ | 2.01 | | | 1.45 | |
Segment Information
The principal business of the Company is overseeing the business of the Bank. The Company has no significant assets other than its investment in the Bank. The banking operation is the Company’s only reportable segment. The banking segment is principally engaged in the business of originating mortgage loans secured by one-to-four family residences, multi-family, construction, commercial and consumer loans. These loans are funded primarily through the attraction of deposits from the general public, borrowings from the Federal Home Loan Bank and brokered deposits. Selected information is not presented separately for the Company’s reportable segment, as there is no material difference between that information and the corresponding information in the consolidated financial statements.
Guaranty Federal Bancshares, Inc.
Notes to Consolidated Financial Statements
The amortized cost and approximate fair values of securities classified as available-for-sale securities are as follows:
| | | Amortized Cost | | Gross Unrealized Gains | | Gross Unrealized (Losses) | | Approximate Fair Value | |
As of December 31, 2006 | | | | | | | | | |
| Equity Securities: | | | | | | | | | |
| FHLMC stock | | $ | 35,847 | | | 2,449,293 | | | - | | | 2,485,140 | |
| Debt Securities: | | | | | | | | | | | | | |
| U. S. government agencies | | | 4,870,979 | | | 1,346 | | | (12,074 | ) | | 4,860,251 | |
| Mortgage-backed securities | | | 563,704 | | | - | | | (2,774 | ) | | 560,930 | |
| | | $ | 5,470,530 | | | 2,450,639 | | | (14,848 | ) | | 7,906,321 | |
| | | | | | | | | | | | | | |
As of December 31, 2005 | | | | | | | | | | | | | |
| Equity Securities: | | | | | | | | | | | | | |
| FHLMC stock | | $ | 47,595 | | | 3,128,415 | | | - | | | 3,176,010 | |
| Debt Securities: | | | | | | | | | | | | | |
| U. S. government agencies | | | 3,579,513 | | | 2,021 | | | (397 | ) | | 3,581,137 | |
| | | $ | 3,627,108 | | | 3,130,436 | | | (397 | ) | | 6,757,147 | |
Maturities of available-for-sale debt securities as of December 31, 2006:
| | | Amortized Cost | | Approximate Fair Value | |
| Within one year | | $ | 996,506 | | | 994,219 | |
| 2-5 years | | | 4,438,177 | | | 4,426,962 | |
| | | $ | 5,434,683 | | | 5,421,181 | |
Guaranty Federal Bancshares, Inc.
Notes to Consolidated Financial Statements
The amortized cost and approximate fair values of securities classified as held to maturity are as follows:
Held-to-maturity
| | | Amortized Cost | | Gross Unrealized Gains | | Gross Unrealized (Losses) | | Approximate Fair Value | |
As of December 31, 2006 | | | | | | | | | |
| Debt Securities: | | | | | | | | | |
| U. S. government agencies | | $ | 158,661 | | | - | | | (481 | ) | | 158,180 | |
| Mortgage-backed securities | | | 604,364 | | | 31,920 | | | - | | | 636,284 | |
| | | $ | 763,025 | | | 31,920 | | | (481 | ) | | 794,464 | |
As of December 31, 2005 | | | | | | | | | | | | | |
| Debt Securities: | | | | | | | | | | | | | |
| U. S. government agencies | | $ | 189,974 | | | - | | | (2,478 | ) | | 187,496 | |
| Mortgage-backed securities | | | 754,750 | | | 39,550 | | | - | | | 794,300 | |
| | | $ | 944,724 | | | 39,550 | | | (2,478 | ) | | 981,796 | |
Maturities of held-to-maturity securities as of December 31, 2006:
| | | Amortized Cost | | Approximate Fair Value | |
| After ten years | | $ | 158,661 | | | 158,180 | |
| Mortgage-backed securities not due on a single maturity date | | | 604,364 | | | 636,284 | |
| | | $ | 763,025 | | | 794,464 | |
The book value of securities pledged as collateral, to secure public deposits and for other purposes, amounted to $1,803,181, $381,115 and $31,875 as of December 31, 2006, 2005 and 2004, respectively. The approximate fair value of pledged securities amounted to $1,805,148, $385,439 and $31,950 as of December 31, 2006, 2005 and 2004, respectively.
Gross gains of $750,869, $1,269,396 and $742,608 and gross losses of $0, $526,061 and $0 resulting from sale of available-for-sale securities were realized for the years ended December 31, 2006, 2005 and 2004, respectively.
Certain investments in debt and marketable equity securities are reported in the financial statements at an amount less than their historical cost. Total fair value of these investments at December 31, 2006 and 2005, was $4,836,168 and $1,186,612, respectively, which is approximately 56% and 15% of the Company’s investment portfolio, respectively. These declines primarily resulted from changes in market interest rates and failure of certain investments to meet projected earnings targets.
Based on evaluation of available evidence including recent changes in interest rates and other information obtained from regulatory filings, management believes the declines in fair value for these securities are temporary.
Guaranty Federal Bancshares, Inc.
Notes to Consolidated Financial Statements
Should the impairment of any of these securities become other than temporary, the cost basis of the investment will be reduced and the resulting loss recognized in net income in the period the other-than-temporary impairment is identified.
The following table shows gross unrealized losses and fair value, aggregated by investment category and length of time that individual securities have been in a continuous unrealized loss position at December 31, 2006 and 2005.
| | | December 31, 2006 | |
| | | Less than 12 Months | | 12 Months or More | | Total | |
| Description of Securities | | Fair Value | | Unrealized Losses | | Fair Value | | Unrealized Losses | | Fair Value | | Unrealized Losses | |
| | | | | | | | | | | | | | |
| U. S. Government Agencies | | $ | 2,869,948 | | | (9,183 | ) | | 1,405,290 | | | (3,372 | ) | | 4,275,238 | | | (12,555 | ) |
| Mortgage-backed securities | | | 560,930 | | | (2,774 | ) | | - | | | - | | | 560,930 | | | (2,774 | ) |
| | | $ | 3,430,878 | | | (11,957 | ) | | 1,405,290 | | | (3,372 | ) | | 4,836,168 | | | (15,329 | ) |
| | | December 31, 2005 | |
| | | Less than 12 Months | | 12 Months or More | | Total | |
| Description of Securities | | Fair Value | | Unrealized Losses | | Fair Value | | Unrealized Losses | | Fair Value | | Unrealized Losses | |
| | | | | | | | | | | | | | |
| U. S. Government Agencies | | $ | 1,186,612 | | | (2,875 | ) | | - | | | - | | | 1,186,612 | | | (2,875 | ) |
NOTE 3: | LOANS AND ALLOWANCE FOR LOAN LOSSES |
Categories of loans at December 31, 2006 and 2005 include:
| | | 2006 | | 2005 | |
| Real estate - residential mortgage: | | | | | |
| One to four family units | | $ | 86,645,458 | | | 101,440,261 | |
| Multi-family | | | 50,366,197 | | | 53,630,562 | |
| Real estate - construction | | | 83,966,976 | | | 70,389,903 | |
| Real estate - commercial | | | 155,800,918 | | | 122,884,052 | |
| Commercial loans | | | 82,675,514 | | | 66,370,227 | |
| Installment loans | | | 23,708,300 | | | 24,264,069 | |
| Total loans | | | 483,163,363 | | | 438,979,074 | |
| Less: | | | | | | | |
| Allowance for loan losses | | | (5,783,477 | ) | | (5,399,654 | ) |
| Unearned discounts | | | - | | | (2,512 | ) |
| Deferred loan fees/costs, net | | | (115,364 | ) | | (141,479 | ) |
| Net loans | | $ | 477,264,522 | | | 433,435,429 | |
Guaranty Federal Bancshares, Inc.
Notes to Consolidated Financial Statements
Impaired loans totaled $3,016,448 and $5,123,042 as of December 31, 2006 and 2005, respectively with a related allowance for loan losses of $298,311 and $532,810, respectively. As of December 31, 2006 and 2005, respectively, impaired loans of $991,398 and $3,404,200 had no related allowance for loan losses.
Interest of $275,143, $615,928 and $686,939 was recognized on average impaired loans of $3,250,403, $4,805,205 and $7,659,179 for the years ended December 31, 2006, 2005 and 2004, respectively. Interest of $272,600, $600,288 and $694,169, was recognized on impaired loans on a cash basis during the years ended December 31, 2006, 2005 and 2004, respectively.
At December 31, 2006 and 2005 there were no accruing loans delinquent 90 days or more. Non-accruing loans at December 31, 2006 and 2005 were $2,748,000 and $722,000, respectively.
Activity in the allowance for loan losses was as follows:
| | | Years ended | |
| | | December 31, | |
| | | 2006 | | 2005 | | 2004 | |
| | | | | | | | |
| Balance, beginning of period | | $ | 5,399,654 | | $ | 4,536,654 | | $ | 3,886,137 | |
| Provision charged to expense | | | 750,000 | | | 945,000 | | | 863,830 | |
| Losses charged off, net of recoveries of $280,854, $71,385 and $17,761 for the years ended December 31, 2006, 2005 and 2004 respectively | | | (366,177 | ) | | (82,000 | ) | | (213,313 | ) |
| Balance, end of period | | $ | 5,783,477 | | $ | 5,399,654 | | $ | 4,536,654 | |
The weighted average interest rate on loans as of December 31, 2006 and 2005, was 7.78% and 6.88%, respectively.
The Bank serviced mortgage loans for others amounting to $654,974 and $110,511,321 as of December 31, 2006 and 2005, respectively. The Bank serviced commercial loans for others amounting to $15,847,746 and $4,149,438 as of December 31, 2006 and 2005, respectively.
NOTE 4: | PREMISES AND EQUIPMENT |
Major classifications of premises and equipment, stated at cost, are as follows:
| | | December 31, | | December 31, | |
| | | 2006 | | 2005 | |
| Land | | $ | 1,250,789 | | | 1,250,789 | |
| Buildings and improvements | | | 7,387,668 | | | 7,349,536 | |
| Furniture, fixtures and equipment | | | 5,938,670 | | | 4,913,877 | |
| Leasehold improvements | | | 271,799 | | | 130,905 | |
| | | | 14,848,926 | | | 13,645,108 | |
| Less accumulated depreciation | | | (6,981,117 | ) | | (6,192,310 | ) |
| Net premises and equipment | | $ | 7,867,809 | | | 7,452,798 | |
Depreciation expense was $814,150, $759,931 and $669,479 for the years ended December 31, 2006, 2005, and 2004, respectively.
Guaranty Federal Bancshares, Inc.
Notes to Consolidated Financial Statements
NOTE 5: | OTHER COMPREHENSIVE INCOME (LOSS) |
Other comprehensive income (loss) components and related taxes were as follows:
| | | Year ended | |
| | | December 31, | |
| | | 2006 | | 2005 | | 2004 | |
| | | | | | | | |
| Unrealized gains (losses) on available-for-sale securities | | $ | 56,521 | | | (596,194 | ) | | 980,204 | |
| Less: Reclassification adjustment for realized gains included in income | | | (750,869 | ) | | (743,335 | ) | | (742,608 | ) |
| Other comprehensive income (loss), before tax effect | | | (694,248 | ) | | (1,339,529 | ) | | 237,596 | |
| Tax expense (benefit) | | | (256,871 | ) | | (495,626 | ) | | 87,911 | |
| Other comprehensive income (loss) | | $ | (437,377 | ) | | (843,903 | ) | | 149,685 | |
| | | December 31, 2006 | | December 31, 2005 | |
| | | Weighted Average Rate | | Balance | | Percentage of Deposits | | Weighted Average Rate | | Balance | | Percentage of Deposits | |
| | | | | | | | | | | | | | |
| Demand | | | 0.00 | % | $ | 26,893,997 | | | 7.6 | % | | 0.00 | % | | 36,193,467 | | | 11.3 | % |
| NOW | | | 1.18 | % | | 35,468,920 | | | 10.1 | % | | 0.33 | % | | 35,864,150 | | | 11.2 | % |
| Money market | | | 3.38 | % | | 52,313,962 | | | 13.7 | % | | 2.47 | % | | 43,896,563 | | | 13.7 | % |
| Savings | | | 2.67 | % | | 14,316,335 | | | 4.1 | % | | 1.80 | % | | 14,298,452 | | | 4.5 | % |
| | | | 1.99 | % | | 128,993,214 | | | 36.6 | % | | 1.12 | % | | 130,252,633 | | | 40.7 | % |
| Certificates: | | | | | | | | | | | | | | | | | | | |
| 0% - 3.99% | | | 3.16 | % | | 29,366,266 | | | 8.3 | % | | 3.25 | % | | 121,299,785 | | | 37.9 | % |
| 4.00% - 5.99% | | | 5.12 | % | | 193,446,432 | | | 54.9 | % | | 4.35 | % | | 67,779,251 | | | 21.2 | % |
| 6.00% - 7.99% | | | 6.06 | % | | 423,724 | | | 0.1 | % | | 6.17 | % | | 727,283 | | | 0.2 | % |
| | | | 4.86 | % | | 223,236,422 | | | 63.4 | % | | 3.66 | % | | 189,806,318 | | | 59.3 | % |
| Total Deposits | | | 3.81 | % | $ | 352,229,636 | | | 100.0 | % | | 2.62 | % | | 320,058,951 | | | 100.0 | % |
The aggregate amount of certificates of deposit with a minimum balance of $100,000 was approximately $87,796,000 and $87,271,000, as of December 31, 2006 and 2005, respectively.
A summary of certificates of deposit by maturity as of December 31, 2006, is as follows:
Guaranty Federal Bancshares, Inc.
Notes to Consolidated Financial Statements
| 2007 | | $ | 173,499,700 | |
| 2008 | | | 34,355,407 | |
| 2009 | | | 9,127,948 | |
| 2010 | | | 2,173,732 | |
| 2011 | | | 3,179,596 | |
| Thereafter | | | 900,039 | |
| | | $ | 223,236,422 | |
A summary of interest expense on deposits is as follows:
| | | Years ended | |
| | | December 31, | |
| | | 2006 | | 2005 | | 2004 | |
| | | | | | | | |
| NOW and Money Market accounts | | $ | 1,709,996 | | | 1,299,800 | | | 793,432 | |
| Savings accounts | | | 364,685 | | | 200,509 | | | 139,890 | |
| Certificate accounts | | | 8,493,705 | | | 5,814,064 | | | 4,012,780 | |
| Early withdrawal penalties | | | (45,183 | ) | | (26,300 | ) | | (26,938 | ) |
| | | $ | 10,523,203 | | | 7,288,073 | | | 4,919,164 | |
The Bank utilizes brokered deposits as an additional funding source. The aggregate amount of brokered deposits was approximately $29,146,000 and $57,629,000 as of December 31, 2006 and 2005, respectively.
NOTE 7: | FEDERAL HOME LOAN BANK ADVANCES |
Federal Home Loan Bank advances consist of the following:
| | | December 31, 2006 | | December 31, 2005 | |
| Maturity Date | | Amount | | Weighted Average Rate | | Amount | | Weighted Average Rate | |
| 2006 | | $ | - | | | - | | | 72,414,000 | | | 4.33 | % |
| 2007 | | | 85,414,000 | | | 5.32 | % | | 3,000,000 | | | 2.83 | % |
| 2008 | | | 13,650,000 | | | 5.30 | % | | 16,650,000 | | | 5.22 | % |
| 2009 | | | 386,000 | | | 7.21 | % | | 386,000 | | | 7.21 | % |
| 2010 | | | 3,000,000 | | | 6.37 | % | | 3,000,000 | | | 6.37 | % |
| 2011 | | | - | | | - | | | - | | | - | |
| Thereafter | | | 5,550,000 | | | 5.39 | % | | 4,550,000 | | | 5.39 | % |
| | | $ | 108,000,000 | | | 5.35 | % | | 100,000,000 | | | 3.58 | % |
During the year ending December 31, 2007, the Bank has advances equal to $9,000,000 with a weighted average rate of 5.55% callable during 2007 at the FHLB’s option with a maturity date between July 30, 2008 and October 20, 2008.
Guaranty Federal Bancshares, Inc.
Notes to Consolidated Financial Statements
The FHLB requires the Bank to maintain collateral equal to outstanding balances of advances. For collateral purposes, the FHLB values mortgage loans free of other pledges, liens and encumbrances at 80% of their fair value, and investment securities free of other pledges, liens and encumbrances at 95% of their fair value.
NOTE 8: | SUBORDINATED DEBENTURES |
During 2005, the Company formed two wholly owned grantor trust subsidiaries, Guaranty Statutory Trust I and Guaranty Statutory Trust II, to issue preferred securities representing undivided beneficial interests in the assets of the trusts and to invest the gross proceeds of the preferred securities in notes of the Company. Trust I issued $5,000,000 of preferred securities and Trust II issued $10,000,000 of preferred securities. The sole assets of Trust I were originally $5,155,000 aggregate principal amount of the Company’s fixed rate subordinated debenture notes due 2036, which are redeemable beginning in 2011. The sole assets of Trust II were originally $10,310,000 aggregate principal amount of the Company’s fixed/variable rate subordinated debenture notes due 2036, which are redeemable beginning in 2011. Trust II subordinated debenture notes bear interest at a fixed rate for five years and thereafter at a floating rate based on LIBOR. The preferred securities qualify as either Tier I or Tier II capital for regulatory purposes, subject to certain limitations.
As of December 31, 2006 and 2005, retained earnings included approximately $5,075,000 for which no deferred income tax liability has been recognized. This amount represents an allocation of income to bad debt deductions for tax purposes only. Reduction of amounts so allocated for purposes other than tax bad debt losses or adjustments arising from carryback of net operating losses would create income for tax purposes only, which would be subject to the then current corporate income tax rate. The unrecorded deferred income tax liability on the above amount was approximately $1,878,000 as of December 31, 2006 and 2005.
The provision for income taxes consists of:
| | | Years Ended | |
| | | December 31, | |
| | | 2006 | | 2005 | | 2004 | |
| | | | | | | | |
| Taxes currently payable | | $ | 4,634,722 | | | 3,756,110 | | | 2,413,294 | |
| Deferred income taxes | | | (592,927 | ) | | (249,519 | ) | | (99,952 | ) |
| | | $ | 4,041,795 | | | 3,506,591 | | | 2,313,342 | |
The tax effects of temporary differences related to deferred taxes shown on the December 31, 2006 and 2005 balance sheets are:
Guaranty Federal Bancshares, Inc.
Notes to Consolidated Financial Statements
| | | December 31, | | December 31, | |
| | | 2006 | | 2005 | |
| Deferred tax assets: | | | | | |
| Allowances for loan and foreclosed asset losses | | $ | 2,139,886 | | | 1,997,872 | |
| Accrued compensated absences and bonuses | | | 18,500 | | | 14,538 | |
| Unrealized loss on loans held for sale | | | - | | | 929 | |
| RRP expense | | | - | | | 18,417 | |
| Deferred loan fees/costs | | | 42,684 | | | 18,393 | |
| | | | 2,201,070 | | | 2,050,149 | |
| Deferred tax liabilities: | | | | | | | |
| FHLB stock dividends | | | (120,632 | ) | | (124,683 | ) |
| Mortgage servicing rights | | | - | | | (315,557 | ) |
| Unrealized appreciation on available-for-sale securities | | | (901,243 | ) | | (1,158,114 | ) |
| Accumulated depreciation | | | (142,323 | ) | | (253,373 | ) |
| Other | | | (74,388 | ) | | (85,736 | ) |
| | | | (1,238,586 | ) | | (1,937,463 | ) |
| Net deferred tax asset | | $ | 962,484 | | | 112,686 | |
A reconciliation of income tax expense at the statutory rate to income tax expense at the Company’s effective rate is shown below:
| | | Years ended | |
| | | December 31, | |
| | | | | | | | |
| | | 2006 | | 2005 | | 2004 | |
| Computed at statutory rate | | | 34.0 | % | | 34.0 | % | | 34.0 | % |
| Increase (reduction) in taxes resulting from: | | | | | | | | | | |
| State financial institution tax | | | 2.7 | % | | 1.8 | % | | 1.0 | % |
| ESOP | | | 2.6 | % | | 1.2 | % | | 1.2 | % |
| Other | | | -1.0 | % | | 0.3 | % | | -1.1 | % |
| Actual tax provision | | | 38.3 | % | | 37.3 | % | | 35.1 | % |
Missouri law provides that banks will be taxed based on an annual privilege tax of 7% of net income. The privilege tax is included in provision for income taxes.
NOTE 10: | DISCLOSURES ABOUT FAIR VALUE OF FINANCIAL INSTRUMENTS |
The following table presents estimated fair values of the Company’s financial instruments. The fair values of certain of these instruments were calculated by discounting expected cash flows, which involves significant judgments by management and uncertainties. Fair value is the estimated amount at which financial assets or liabilities could be exchanged in a current transaction between willing parties, other than in a forced or liquidation sale. Because no market exists for certain of these financial instruments and because management does not intend to sell these financial instruments, the Company does not know whether the fair values shown below represent values at which the respective financial instruments could be sold individually or in the aggregate.
Guaranty Federal Bancshares, Inc.
Notes to Consolidated Financial Statements
| | | December 31, 2006 | | December 31, 2005 | |
| | | Carrying Amount | | Fair Value | | Carrying Amount | | Fair Value | |
| Financial assets: | | | | | | | | | |
| Cash and cash equivalents | | $ | 14,880,601 | | | 14,880,601 | | | 20,506,478 | | | 20,506,478 | |
| Available-for-sale securities | | | 7,906,321 | | | 7,906,321 | | | 6,757,147 | | | 6,757,147 | |
| Held-to-maturity securities | | | 763,025 | | | 794,464 | | | 944,724 | | | 981,796 | |
| Mortgage loans held-for-sale | | | 3,004,635 | | | 3,004,635 | | | 2,092,279 | | | 2,092,279 | |
| Loans, net | | | 477,264,522 | | | 474,906,965 | | | 433,435,429 | | | 435,477,000 | |
| Federal Home Loan Bank stock | | | 5,382,700 | | | 5,382,700 | | | 4,978,800 | | | 4,978,800 | |
| Interest receivable | | | 2,910,309 | | | 2,910,309 | | | 2,089,127 | | | 2,089,127 | |
| Financial liabilities: | | | | | | | | | | | | | |
| Deposits | | | 352,229,636 | | | 351,887,931 | | | 320,058,951 | | | 318,829,000 | |
| Federal Home Loan Bank advances | | | 108,000,000 | | | 108,167,567 | | | 100,000,000 | | | 100,610,000 | |
| Securities sold under agreements | | | | | | | | | | | | | |
| to repurchase | | | 1,703,221 | | | 1,703,221 | | | 1,594,258 | | | 1,594,258 | |
| Subordinated debentures | | | 15,465,000 | | | 15,465,000 | | | 15,465,000 | | | 15,465,000 | |
| Interest payable | | | 1,414,946 | | | 1,414,946 | | | 508,164 | | | 508,164 | |
| Dividend payable | | | 468,190 | | | 468,190 | | | 459,074 | | | 459,074 | |
| Unrecognized financial instruments | | | | | | | | | | | | | |
| (net of contractual value): | | | | | | | | | | | | | |
| Commitments to extend credit | | | - | | | - | | | - | | | - | |
| Unused lines of credit | | | - | | | - | | | - | | | - | |
The following methods and assumptions were used to estimate the fair value of each class of financial instruments:
Cash and Cash Equivalents and Federal Home Loan Bank stock
The carrying amounts reported in the balance sheets for cash and cash equivalents approximate those assets' fair value.
Investment Securities
Fair values for investment securities equal quoted market prices, if available. If quoted market prices are not available, fair values are estimated based on quoted market prices of similar securities.
Interest Receivable
The carrying amount of interest receivable approximates its fair value.
Mortgage Loans Held for Sale
Fair value is estimated using the quoted market prices for securities backed by similar loans, adjusted for differences in loan characteristics.
Loans
The fair value of loans is estimated by discounting the future cash flows using the current rates at which similar loans would be made to borrowers with similar credit ratings and for the same remaining maturities. Loans with similar characteristics are aggregated for purposes of the calculations.
Deposits
The fair value of demand deposits and savings accounts is the amount payable on demand at the reporting date (i.e., their carrying amounts). The fair value of fixed-maturity certificates of deposit is estimated using a discounted cash flow calculation that applies the rates currently offered for deposits of similar remaining maturities.
Guaranty Federal Bancshares, Inc.
Notes to Consolidated Financial Statements
Federal Home Loan Bank Advances and Subordinated Debentures
Rates currently available to the Bank for debt with similar terms and remaining maturities are used to estimate fair value of existing advances and subordinated debentures.
Securities Sold under Agreements to Repurchase
For these short-term instruments, the carrying amount is a reasonable estimate of fair value.
Interest and Dividend Payable
The carrying amounts of interest payable and dividend payable approximates their fair value.
Commitments to Extend Credit, Letters of Credit and Lines of Credit
The fair value of commitments is estimated using the fees currently charged to enter into similar agreements, taking into account the remaining terms of the agreements and the present credit worthiness of the counterparties. For fixed-rate loan commitments, fair value also considers the difference between current levels of interest rates and the committed rates. The fair value of letters of credit is based on fees currently charged for similar agreements or on the estimated cost to terminate them or otherwise settle the obligations with the counterparties at the reporting date.
NOTE 11: | SIGNIFICANT ESTIMATES AND CONCENTRATIONS |
Accounting principles generally accepted in the United States of America require disclosure of certain significant estimates and current vulnerabilities due to certain concentrations. Estimates related to the allowance for loan losses are reflected in the footnote regarding loans. Current vulnerabilities due to certain concentrations of credit risk are discussed in the footnote on commitments and credit risk. Other significant estimates and concentrations not discussed in those footnotes include:
At December 31, 2006, approximately 13% of the Bank's total time deposits consisted of certificates of deposit which were issued through a broker and had minimum denominations in excess of $100,000.
NOTE 12: | EMPLOYEE BENEFIT PLANS |
Stock Award Plans
The Company has established four stock award plans for the benefit of certain directors, officers and employees of the Bank and its subsidiary. The plans provide a proprietary interest in the Company in a manner designed to encourage these individuals to remain with the Bank. A committee of the Bank’s Board of Directors administers the plans. The Company accounts for the cost of share purchases under the plans as a reduction of stockholders' equity. The awards vest at the rate of 20% per year over a five-year period. Compensation expense is recognized based on the Company’s stock price on the date the shares are awarded to employees.
At the annual stockholders’ meeting on October 18, 1995, the Bank’s stockholders approved the Recognition and Retention Plan (the “RRP”). Following approval of the Plan, the Bank contributed $464,643 to a separate trust to purchase the 75,106 shares of the Company’s common stock in the RRP. As of December 31, 2006 all shares in this plan have vested.
At a special stockholders’ meeting on July 22, 1998, the Company’s stockholders approved the Restricted Stock Plan (the “RSP”). Following approval of the Plan, the Company contributed $2,373,065 to a separate trust to purchase the 173,632 shares in the RSP. As of December 31, 2006 all shares in this plan have vested.
Guaranty Federal Bancshares, Inc.
Notes to Consolidated Financial Statements
During the year ended June 30, 2000, the directors of the Company established the Stock Compensation Plan (the “2000 SCP”) with both a stock award component and a stock option component. Under the stock award component of this plan, the Committee awarded 7,125 shares of the Company’s common stock. Following approval of the Plan, the Company contributed $85,945 to a separate trust to purchase the 7,125 shares in the SCP. As of December 31, 2006 all shares in this plan have vested.
During the year ended June 30, 2001, the directors of the Company established the Stock Compensation Plan (the “2001 SCP”) with both a stock award component and a stock option component. Under the stock award component of this plan, the Committee awarded 10,239 shares of the Company’s common stock. The shares for this plan were taken from forfeited shares in the RSP. As of December 31, 2006 all shares in this plan have vested.
The Bank recognized $18,537, $45,694 and $63,200 of expense under these stock award plans in the years ended December 31, 2006, 2005 and 2004, respectively.
Stock Option Plans
The Company has established four stock option plans for the benefit of certain directors, officers and employees of the Bank and its subsidiary. A committee of the Company’s Board of Directors administers the plans. The stock options under these plans may be either incentive stock options or nonqualified stock options. Incentive stock options can be granted only to participants who are employees of the Bank or its subsidiary. The option price must not be less than the market value of the Company stock on the date of grant. All options expire no later than ten years from the date of grant. The options vest at the rate of 20% per year over a five-year period.
At the annual stockholders’ meeting on October 18, 1995, the Bank’s stockholders approved the 1994 Stock Option and Incentive Plan for the benefit of certain directors, officers and employees of the Bank and its subsidiary. Under this Plan, the Committee may grant stock options for up to 187,764 shares of the Company’s common stock.
At a special stockholders’ meeting on July 22, 1998, the Company’s stockholders approved the 1998 Stock Option and Incentive Plan. Under this plan, the Committee may grant stock options for up to 434,081 shares of the Company’s common stock.
Under the stock option component of the 2000 SCP, the Committee granted nonqualified stock options for 17,875 shares of the Company’s common stock.
Under the stock option component of the 2001 SCP, the Committee granted nonqualified stock options for 13,263 shares of the Company’s common stock.
During the six months ended December 31, 2003, the directors of the Company authorized the issuance of 5,000 stock options as an employment inducement to a new officer of the Bank pursuant to a stock option agreement. Stock options awarded under this agreement are considered non-qualified for federal income tax purposes.
During the year ended December 31, 2004, the directors of the Company authorized the issuance of 25,000 stock options as an employment inducement to a new officer of the Bank pursuant to a stock option agreement. Stock options awarded under this agreement are considered non-qualified for federal income tax purposes.
On May 19, 2004, the Company’s stockholders voted to approve a 2004 Stock Option Plan (“2004 SOP”). The purpose of the plan is to attract and retain qualified personnel for positions of substantial responsibility. The aggregate number of shares with respect to options issued under this plan shall not exceed 250,000 shares. To date 40,000 stock options have been granted under this plan, with 5,000 stock options cancelled.
Guaranty Federal Bancshares, Inc.
Notes to Consolidated Financial Statements
The table below summarizes transactions under the Company’s stock option plans:
| | | Number of shares | | | |
| | | Incentive Stock Option | | Non-Incentive Stock Option | | Weighted Average Exercise Price | |
| Balance outstanding as of January 1, 2004 | | | 235,308 | | | 178,614 | | $ | 13.32 | |
| Granted | | | 12,500 | | | 25,000 | | | 19.93 | |
| Exercised | | | (32,436 | ) | | (32,523 | ) | | 11.57 | |
| Forfeited | | | (1,600 | ) | | - | | | 10.02 | |
| Balance outstanding as of December 31, 2004 | | | 213,772 | | | 171,091 | | | 14.27 | |
| Granted | | | 42,500 | | | - | | | 25.11 | |
| Exercised | | | (66,487 | ) | | (11,000 | ) | | 13.31 | |
| Forfeited | | | (10,000 | ) | | - | | | 20.88 | |
| Balance outstanding as of December 31, 2005 | | | 179,785 | | | 160,091 | | | 15.65 | |
| Granted | | | 20,000 | | | - | | | 28.06 | |
| Exercised | | | (24,294 | ) | | (57,885 | ) | | 13.96 | |
| Forfeited | | | (5,000 | ) | | (2,000 | ) | | 24.84 | |
| Balance outstanding as of December 31, 2006 | | | 170,491 | | | 100,206 | | | 17.30 | |
| Options exercisable as of December 31, 2006 | | | 102,993 | | | 75,206 | | | 14.19 | |
The total intrinsic value of outstanding options and outstanding exercisable stock options was $3,087,638 and $2,587,449 at December 31, 2006, respectively. The total intrinsic value of stock options exercised was $1,177,399 in 2006. The total fair value of share awards vested was $1,053,858 during 2006.
The fair value of each option granted is estimated on the date of the grant using the Black-Scholes pricing model with the following weighted-average assumptions:
| | | December 31, 2006 | | December 31, 2005 | | December 31, 2004 | |
| Dividends per share | | $ | 0.66 | | $ | 0.64 | | $ | 0.64 | |
| Risk-free interest rate | | | 4.52 | % | | 4.00 | % | | 3.03 | % |
| Expected life of options | | | 5 years | | | 5 years | | | 5 years | |
| Weighted-average fair value of options granted during year | | $ | 3.41 | | $ | 3.30 | | $ | 1.84 | |
The following table summarizes information about stock options under the plans outstanding as of December 31, 2006:
Guaranty Federal Bancshares, Inc.
Notes to Consolidated Financial Statements
| Exercise Price | | Number Outstanding | | Number Exercisable | | Remaining Contractual Life | |
| $ | 10.50 | | | 10,875 | | | 10,875 | | | 3.1 years | |
| | 11.05 | | | 400 | | | 400 | | | 4.5 years | |
| | 12.13 | | | 3,000 | | | 3,000 | | | 4.2 years | |
| | 12.50 | | | 3,829 | | | 3,829 | | | 4.6 years | |
| | 12.75 | | | 5,500 | | | 5,500 | | | 4.1 years | |
| | 13.44 | | | 122,593 | | | 122,593 | | | 1.6 years | |
| | 13.89 | | | 3,000 | | | - | | | 5.1 years | |
| | 15.31 | | | 4,000 | | | - | | | 6.1 years | |
| | 16.65 | | | 42,500 | | | 22,500 | | | 6.6 years | |
| | 19.27 | | | 2,500 | | | 1,000 | | | 7.7 years | |
| | 19.62 | | | 15,000 | | | - | | | 7.1 years | |
| | 23.20 | | | 10,000 | | | 2,000 | | | 8.2 years | |
| | 23.50 | | | 11,000 | | | 2,202 | | | 8.1 years | |
| | 25.59 | | | 10,000 | | | 2,000 | | | 8.6 years | |
| | 26.50 | | | 1,500 | | | 300 | | | 8.6 years | |
| | 28.00 | | | 10,000 | | | - | | | 9.5 years | |
| | 28.12 | | | 10,000 | | | 2,000 | | | 9.0 years | |
| | 28.34 | | | 5,000 | | | - | | | 9.1 years | |
| $ | 16.85 | | | 270,697 | | | 178,199 | | | | |
Employee Stock Ownership Plan
The Bank sponsors an internally-leveraged Employee Stock Ownership Plan (ESOP). All employees are eligible to participate after they attain age twenty-one and complete twelve consecutive months of service during which they work at least 1,000 hours. The ESOP borrowed $3,444,540 from the Company and purchased 344,454 shares of the common stock of the Company. The ESOP debt is secured by shares of the Company. The loan will be repaid from contributions to the ESOP as approved annually by the Bank’s Board of Directors. As the debt is repaid, shares are released from collateral and allocated to employees’ accounts. The shares pledged as collateral are reported as unearned ESOP shares in the consolidated balance sheet. When shares are committed for release, the shares become outstanding for earnings per share computations. Dividends on allocated ESOP shares are recorded as a reduction of retained earnings and may be paid directly to participants or credited to their account; dividends are not paid on unallocated ESOP shares. Compensation expense is recognized ratably based on the average fair value of shares committed to be released. Compensation expense attributed to the ESOP was $651,958, $564,980 and $461,512 for the years ended December 31, 2006, 2005 and 2004, respectively.
The following is a summary of ESOP shares as of December 31, 2006:
| | | 344,454 | |
| Released shares | | | (185,760 | ) |
| Shares committed for release | | | 24,201 | |
| Unreleased shares | | | 134,493 | |
| | | | | |
| Fair value of unreleased shares | | $ | 3,861,294 | |
Guaranty Federal Bancshares, Inc.
Notes to Consolidated Financial Statements
NOTE 13: | RELATED PARTY TRANSACTIONS |
Certain directors and executive officers of the Company and the Bank were customers of and had transactions with the Bank in the ordinary course of business. As of December 31, 2006 and 2005, loans outstanding to these directors and executive officers amounted to $3,508,387 and $3,270,812, respectively.
In management's opinion, such loans and other extensions of credit and deposits were made in the ordinary course of business and were made on substantially the same terms as those prevailing at the time for comparable transactions with other persons. Further, in management's opinion, these loans did not involve more than normal risk of collectability or present other unfavorable features.
NOTE 14: | COMMITMENTS AND CREDIT RISK |
Commitments to extend credit are agreements to lend to a customer as long as there is no violation of any condition established in the contract. Commitments generally have fixed expiration dates or other termination clauses and may require payment of a fee. Since a portion of the commitments may expire without being drawn upon, the total commitment amounts do not necessarily represent future cash requirements. The Bank evaluates each customer's credit worthiness on a case-by-case basis. The amount of collateral obtained, if deemed necessary by the Bank upon extension of credit, is based on management's credit evaluation of the counterparty. Collateral held varies but may include accounts receivable, inventory, property and equipment, commercial real estate and residential real estate.
As of December 31, 2006 and 2005, the Bank had outstanding commitments to originate mortgage loans of approximately $3,991,000 and $2,285,000, respectively. The commitments extend over varying periods of time with the majority being disbursed within a thirty-day period. As of December 31, 2006 and 2005, commitments of $3,991,000 and $2,058,000, respectively, were at fixed rates and $0 and $227,000, respectively, were at floating market rates.
Standby letters of credit are irrevocable conditional commitments issued by the Bank’s to guarantee the performance of a customer to a third party. Financial standby letters of credit are primarily issued to support public and private borrowing arrangements, including commercial paper, bond financing and similar transactions. Performance standby letters of credit are issued to guarantee performance of certain customers under non-financial contractual obligations. The credit risk involved in issuing standby letters of credit is essentially the same at that involved in extending loans to customers. Fees for letters of credit issued after December 31, 2002 are initially recorded by the Bank as deferred revenue and are included in earnings at the termination of the respective agreements. Should the Bank be obligated to perform under the standby letters of credit, the Bank may seek recourse from the customer for reimbursement of amounts paid.
The Bank had total outstanding standby letters of credit amounting to $9,182,000 and $9,731,000 as of December 31, 2006 and 2005, respectively, with terms ranging from 30 days to 2 years.
Lines of credit are agreements to lend to a customer as long as there is no violation of any condition established in the contract. Lines of credit generally have fixed expiration dates. Since a portion of the line may expire without being drawn upon, the total unused lines do not necessarily represent future cash requirements. Each customer's credit worthiness is evaluated on a case-by-case basis. The amount of collateral obtained, if deemed necessary, is based on management's credit evaluation of the counterparty. Collateral held varies but may include accounts receivable, inventory, property and equipment, commercial real estate and residential real estate. Management uses the same credit policies in granting lines of credit as it does for on balance sheet instruments.
Guaranty Federal Bancshares, Inc.
Notes to Consolidated Financial Statements
As of December 31, 2006 and 2005, unused lines of credit to borrowers aggregated approximately $64,370,000 and $77,725,000 for commercial lines and $19,790,000 and $18,180,000 for open-end consumer lines.
NOTE 15: | CONDENSED PARENT COMPANY STATEMENTS |
The condensed balance sheets as of December 31, 2006 and 2005, and statements of income and cash flows for the years ended December 31, 2006, 2005 and 2004, for the parent company, Guaranty Federal Bancshares, Inc., are as follows:
Balance Sheets | | | | | |
| | | | | | |
| | | 2006 | | 2005 | |
Assets | | | | | |
| Cash | | $ | 711,485 | | | 1,128,911 | |
| Due from subsidiary | | | 28,895 | | | - | |
| Investment in subsidiary | | | 58,597,264 | | | 55,863,320 | |
| Investment in Capital Trust I & II | | | 468,420 | | | 466,434 | |
| Prepaid expenses and other assets | | | 482,852 | | | 476,029 | |
| Refundable income taxes | | | 820,225 | | | 207,153 | |
| | | $ | 61,109,141 | | | 58,141,847 | |
Liabilities | | | | | | | |
| Subordinated debentures | | $ | 15,465,000 | | | 15,465,000 | |
| Accrued expenses and other liabilities | | | 276,708 | | | 125,624 | |
| Dividend payable | | | 468,190 | | | 459,074 | |
Stockholders' equity | | | | | | | |
| Common stock | | | 665,353 | | | 657,135 | |
| Additional paid-in capital | | | 55,730,352 | | | 53,778,686 | |
| Unearned ESOP shares | | | (1,344,930 | ) | | (1,572,930 | ) |
| Retained earnings | | | 41,183,006 | | | 36,533,338 | |
| Unrealized appreciation on available-for-sale securities, net | | | 1,534,548 | | | 1,971,925 | |
| Treasury stock | | | (52,869,086 | ) | | (49,276,005 | ) |
| | | $ | 61,109,141 | | | 58,141,847 | |
Guaranty Federal Bancshares, Inc.
Notes to Consolidated Financial Statements
Income Statements | | Years ended December 31, | |
| | | 2006 | | 2005 | | 2004 | |
| | | | | | | | |
| Income | | | | | | | |
| Dividends from subsidiary bank | | $ | 4,639,062 | | | 3,540,000 | | | 2,334,714 | |
| Interest income: | | | | | | | | | | |
| Related party | | | 150,308 | | | 127,786 | | | 100,275 | |
| Other | | | 31,125 | | | 3 | | | 21 | |
| | | | 4,820,495 | | | 3,667,789 | | | 2,435,010 | |
| Expense | | | | | | | | | | |
| Interest expense: | | | | | | | | | | |
| Other | | | 963 | | | - | | | - | |
| Related party | | | 1,027,526 | | | 47,683 | | | - | |
| Occupancy | | | 2,400 | | | 2,400 | | | 2,400 | |
| Other | | | 879,484 | | | 759,722 | | | 581,566 | |
| | | | 1,910,373 | | | 809,805 | | | 583,966 | |
| Income before income taxes and equity in undistributed earnings of subsidiaries | | | 2,910,122 | | | 2,857,984 | | | 1,851,044 | |
| Credit for income taxes | | | (427,642 | ) | | (117,312 | ) | | (129,555 | ) |
| Income before equity in undistributed earnings of subsidiaries | | | 3,337,764 | | | 2,975,296 | | | 1,980,599 | |
| Equity in undistributed earnings of subsidiaries | | | 3,171,320 | | | 2,923,674 | | | 2,304,174 | |
| Net income | | $ | 6,509,084 | | | 5,898,970 | | | 4,284,773 | |
Guaranty Federal Bancshares, Inc.
Notes to Consolidated Financial Statements
| | Years ended December 31, | |
| | | 2006 | | 2005 | | 2004 | |
| | | | | | | | |
Cash Flows From Operating Activities | | | | | | | |
| | | | | | | | |
| Net income | | $ | 6,509,084 | | | 5,898,970 | | | 4,284,773 | |
| Items not requiring (providing) cash: | | | | | | | | | | |
| Equity in undistributed earnings of subsidiaries | | | (3,171,320 | ) | | (2,923,674 | ) | | (2,304,174 | ) |
| Release of ESOP shares | | | 651,958 | | | 564,980 | | | 461,512 | |
| Stock award plan expense | | | 83,192 | | | 23,161 | | | - | |
| Changes in: | | | | | | | | | | |
| Prepaid expenses and other assets | | | (8,810 | ) | | (36,407 | ) | | 8,990 | |
| Income taxes payable/refundable | | | (307,380 | ) | | 17,707 | | | (129,957 | ) |
| Accrued expenses | | | 151,084 | | | 98,005 | | | 27,619 | |
| Net cash provided by operating activities | | | 3,907,808 | | | 3,642,742 | | | 2,348,763 | |
| | | | | | | | | | | |
Cash Flows From Investing Activities | | | | | | | | | | |
| Capital contribution to subsidiary bank | | | - | | | (13,970,000 | ) | | - | |
| Purchase of investment in capital trusts | | | - | | | (465,000 | ) | | - | |
| Net (increase) decrease in advance to subsidiary | | | (28,895 | ) | | 574,000 | | | (10,780 | ) |
| Net cash used in investing activities | | | (28,895 | ) | | (13,861,000 | ) | | (10,780 | ) |
| | | | | | | | | | | |
Cash Flows From Financing Activities | | | | | | | | | | |
| Stock options exercised | | | 1,147,042 | | | 1,031,400 | | | 751,274 | |
| Cash dividends paid | | | (1,850,300 | ) | | (1,794,557 | ) | | (1,748,982 | ) |
| Treasury stock purchased | | | (3,593,081 | ) | | (3,563,011 | ) | | (1,163,115 | ) |
| Proceeds from issuance of subordinated debentures | | | - | | | 15,465,000 | | | - | |
| Net cash provided by (used in) financing activities | | | (4,296,339 | ) | | 11,138,832 | | | (2,160,823 | ) |
| | | | | | | | | | | |
Increase (decrease) in cash | | | (417,426 | ) | | 920,574 | | | 177,160 | |
| | | | | | | | | | | |
Cash, beginning of year | | | 1,128,911 | | | 208,337 | | | 31,177 | |
| | | | | | | | | | | |
Cash, end of year | | $ | 711,485 | | | 1,128,911 | | | 208,337 | |
Report of Independent Registered Public Accounting Firm
Audit Committee, Board of Directors and Stockholders
Guaranty Federal Bancshares, Inc.
Springfield, Missouri
We have audited the accompanying consolidated balance sheets of Guaranty Federal Bancshares, Inc. as of December 31, 2006 and 2005, and the related statements of income, stockholders’ equity and cash flows for each of the three years in the period ended December 31, 2006. These financial statements are the responsibility of the Company’s management. Our responsibility is to express an opinion on these financial statements based on our audits.
We conducted our audits in accordance with the standards of the Public Company Accounting Oversight Board (United States). Those standards require that we plan and perform the audit to obtain reasonable assurance about whether the financial statements are free of material misstatement. An audit includes examining, on a test basis, evidence supporting the amounts and disclosures in the financial statements. An audit also includes assessing the accounting principles used and significant estimates made by management, as well as evaluating the overall financial statement presentation. We believe that our audits provide a reasonable basis for our opinion.
In our opinion, the consolidated financial statements referred to above present fairly, in all material respects, the financial position of Guaranty Federal Bancshares, Inc. as of December 31, 2006 and 2005, and the results of its operations and its cash flows for each of the three years in the period ended December 31, 2006, in conformity with accounting principles generally accepted in the United States of America.
/s/BKD, LLP
Springfield, Missouri
March 27, 2007
Notes
Board of Directors | | Guaranty |
Guaranty Federal Bancshares, Inc. | | Federal |
and Guaranty Bank | | Bancshares, Inc. |
| | | |
| Don M. Gibson | | Officers |
| Chairman of the Board | | |
| Guaranty Federal Bancshares and | | Shaun A. Burke |
| Guaranty Bank | | President, |
| | | Chief Executive Officer |
| Jack L. Barham | | |
| Vice Chairman of the Board | | Carter M. Peters |
| Guaranty Federal Bancshares | | Executive Vice President, |
| | | Chief Financial Officer/Chief Operations Officer |
| Shaun A. Burke | | |
| President and CEO | | H. Michael Mattson |
| Guaranty Federal Bancshares and | | Executive Vice President, |
| Guaranty Bank | | Chief Lending Officer |
| | | |
| Wayne V. Barnes | | E. Lorene Thomas |
| Retired | | Corporate Secretary |
| | | |
| James R. Batten, CPA | | |
| Investments | | |
| | | |
| Kurt D. Hellweg | | |
| President and CEO | | |
| International Dehydrated Foods, Inc. and | | |
| American Dehydrated Foods, Inc. | | |
| | | |
| Gregory V. Ostergren | | |
| Chairman, President and CEO | | |
| American National Property and Casualty | | |
| Insurance Companies | | |
| | | |
| Tim Rosenbury, AIA | | |
| Executive Vice President and Chairman | | |
| Butler, Rosenbury and Partners, Inc. | | |
| | | |
| James L. Sivils, III, JD | | |
| Partner - Morelock Ross Companies | | |
51